Embed Size (px)
Citation preview
1
Credit Cluster and Contagion Risk Related to Distressed Municipalities Richard A. Ciccarone, President& Chief Executive Officer of Merritt Research Services, LLC
Abstract:
Whenever a distressed municipal credit situation emerges, the potential for spillover risk to other municipal entities becomes a serious concern for analysts. Recent experiences in Detroit, Jefferson County (AL), Puerto Rico and Illinois have elevated these fears to levels not seen since the late 70s and early 80s, when New York City cast a negative light on the muni market, in particular, older industrial, central cities.
This presentation takes a contemporary look at what may be called municipal cluster risk; the potential for additional fiscal problems to emerge out of any common characteristics, vulnerabilities or interdependencies. The danger of contagion due to overlapping or systemic influences can be examined both from a state and local centric orientation. This discussion will take a look at traditional credit analysis measures to create a framework intended to help identify the emergence or intensity of cluster risk, including economic base contraction, overlapping debt and taxes, and newly developing risk factors.
Using selected key risk elements, the presentation will rely heavily on Merritt Research Service’s nationwide municipal bond credit database to provide a comparative assessment of higher profile cities. In addition, a list of cities and counties which ranked among the most vulnerable cluster risk candidates in the nation will be spotlighted. Rankings are based on a statistical model used by Merritt Research that analyzes financial and other credit data related to over 1800 cities.
Introduction
Serious municipal fiscal problems have a tendency to impact or to be shared by other governments.
Often, the effective implications of the crisis find their way beyond their geographic boundaries and into
the boardrooms of one or more other governments. Sensing the probability for interconnectivity, the
municipal bond market has an initial tendency to apply a broad brush discounting to any borrower that
it suspects may share common elements with a particular problem credit. Once the market has more
time to analyze the extent of the common risk, distinctions often transpire and any borrowing rate
penalties are fine-tuned, subject to market conditions.
New York City was the center of municipal finance attention in 1975 and remained under scrutiny by
municipal analysts and investors for nearly a decade after the city defaulted on its notes. At the time
New York’s fiscal problems were exposed, the market at the outset focused not only on the cash and
debt management issues that were directly related to its default, but also on the underlying reasons
that led to that crisis. The list of factors contributing to New York’s City’s fiscal crisis ranged from
2
management to economic base contractions in the region’s industrial base to the middle class
population flight to the suburbs and beyond affecting central cities generally. Similar patterns of
concern were common among many central cities, especially in the Northeast and Midwest. The fact
that the underlying issues were threats to the local economy meant that all New York City credits
sharing the same or partial economic base were immediately placed on the potential suspect list. That
list extended to the state of New York, which had not only a moral responsibility to intervene, but a legal
responsibility as well. The state was also an interested party because the foundation of its own
economy was heavily reliant on the city of New York for a substantial share of its own revenues.
Declining economic base situations in Buffalo, Yonkers and other cities in upstate New York further
stoked the anxieties of municipal bond investors nationwide by penalizing many credits related to New
York City, as well as the state’s borrowers generally. It wasn’t until the 1990s, when national economic
growth significantly bolstered New York’s economy that the city was able to rid itself of the borrowing
penalty initiated by the crisis.
The market’s broad brush generalizations about elevated cluster risks associated with older industrial
central cities in the Rustbelt was well founded. During the decades following New York City’s crisis, a
number of central cities with similar demographic or economic base commonalities, such as Detroit,
Philadelphia, Pittsburgh and Cleveland, among others, encountered serious financial challenges that
earned them downgrades and borrowing penalties. In the case of Cleveland, an actual default occurred
on a portion of its debt. These situations had more to do with a cluster risk pattern that focused on
characteristics associated with a city’s economic maturity rather than geographic integration and
proximity.
Over the past several decades, we have also seen municipal market generalities appear periodically, not
just among cities and states due to their overlapping economic composition, but also whenever the
market suspects there is evidence of common systemic causal risk factors. These issues span a diverse
list of potential sources and links, including pensions and oil based economies. The two most recent
examples of governmentally related associated risk have placed the spotlight on Puerto Rico and Illinois.
However, contagion risk concerns are not just limited to municipalities in the narrow meaning of the
word. When the Washington Public Power Supply [WPPSS] default occurred in 1983, the market took
aim at public power credit borrowers involved in major nuclear construction programs. Emanating
from that situation, any public power authority with a heavy debt load, especially if it uses nuclear
power sources, became a likely object of cluster risk, regardless of its geographic closeness to WPPSS.
Although cluster risk can apply to many segments of the municipal bond market, the primary interest of this paper is to narrow the focus to that related to municipalities in distress, including those that are interwoven with the state. Our first goal is to examine the key issues that we believe increase the chances for intergovernmental cluster risk that often leads to a contagion effect. Second, we will use those characteristics to identify candidates that are more likely to share their financial hardships to one or more overlapping or nearby governments. Although this article is intended to highlight risks and implications for municipal bond investors, governmental leaders who formulate strategies, policies and opportunities of co-operation to pro-actively stabilize the region will be rewarded in the long run. Like infectious diseases, serious governmental problems can’t always be isolated at the source.
3
The Potential for Contagion and Interdependent Relationships Predictive research, as it applies to municipals, requires a basic understanding of intergovernmental relationships and their shared taxpayer burdens. While the starting point for state and local cluster concentration is their common geographic and economic interplay, the unique characteristics of the individual governmental units can either work to compound the cluster problem or soften the blow. How local governments manage and react to the challenges that beset them can be made easier or harder by the political will and legal structures that are created at the state level. Understanding the upward and downward dynamics involving the states and cities should be useful to assess and anticipate either party’s role to spread risk. There are several key factors that are often at work in determining the potential risk that one government’s fiscal problems are likely to spread to another. The most important of which is the degree to which they share a dependency on the same economic base. Other factors that can have multi-government impacts over time include shared debt and pension overlays, tax incidence, and infrastructure condition. All of these issues have the potential to impact taxpayer burdens, influence residential choices or grow commerce. In addition, state laws and political culture can play a role in formulating policy that supports prudent practices and local co-operation. At the most basic level of negative state centric influence, weak state financial conditions normally leads to declining support to its governmental subunits. Sooner or later, heavy debt and pension obligations as well as deferred infrastructure maintenance will likely increase the burden on the similar base of taxpayers. In so doing, they are bound to have a depressing longer term effect on state or local economic vitality and its ability to affordably invest in the state’s future. State laws that limit local governmental flexibility or promote less than prudent fiscal management policies can work against a local government’s long term fiscal health (e.g. Illinois’s statutory rules concerning limited employer contributions at levels that are less than actuarial standards) . Positive political cultures that actively support good government, co-operation between governmental units and intervention when trouble emerges are better able to handle distressed situations than those in which units are completely left to fend for themselves. A couple of positive examples can be found in the state created North Carolina Local Government Commission, which assists its local governments on fiscal matters, and the Minneapolis-St. Paul Metropolitan Council, established in 1975 to provide a certain amount of tax sharing to counter the effects of taxpayers leaving older cities for the suburbs. State centric financial decisions dictate the symbiotic relationship with their local governmental units. In recent years, state decisions to cutback appropriations to local units have produced a downward spiral that forces city halls to scurry for replacement funds in order to fill budget gaps. States may also make decisions to that mandate increased spending by local units. In addition, states have been known to make structural statutory changes that affect the taxing ability of local units and even redirect funds back to the state government. In the latter case, that’s what happened in California several years ago when the state essentially closed down the local redevelopment agencies run by the cities. Instead of surplus redevelopment monies flowing to the city, the monies went to Sacramento. State rules can also

4
be used to systematically impair prudent financial management. For example, Illinois did a disservice to itself and its local units when it enacted a law for pension funding that used amortization and funding schedules that were based on a slower statutory method rather than best practice actuarial accounting. This state law has had detrimental consequences for Chicago and other local governments. On the other hand, the interplay between a state and a troubled local government can work in the other direction. Local fiscal distress problems that are pushed upward to the state level as the result of calls for assistance or mandatory intervention programs. While state involvement can often be positive in dealing with occasional trouble subunits, they can present reverse risks if multiple overlapping units of government require state assistance simultaneously and they suddenly become burdensome to the state. The state of Michigan, for instance, guarantees local school debt under its qualified program. At the end of June 30, 2015, these school debt guarantees, which amounted to $13.1 billion, require the state to issue general obligation debt of its own if its available resources are not sufficient to cover debt service on the loans. By comparison, the state had outstanding on the same date only $1.7 billion of state GO bonds. To make matters worse, any state government intervention or bailout is all the more complicated if it has serious fiscal problems of its own. Before this paper specifically addresses the key factors that we chose to identify cities that are most likely to be impacted by cluster risk, it is worthwhile to examine how states and local areas can become instigators of contagion. State Centric Perspective Since local governments are subdivisions of state sovereignty, the state grants them powers to enact laws, collect taxes, issue debt and administer responsibilities from the state. Although a state authorizes local governments to act on its behalf, it retains ultimate responsibility for maintaining the health, safety and welfare responsibilities for all its citizens, if the local government is unable or unwilling to do so. In so doing, states normally share the costs in varying degrees with local governments to provide support for issues involving socio-economic fairness and statewide growth. Public education and health care for the indigent are the most common responsibilities that states share the financial burden with local governments. The state’s own financial health can affect the amount and degree to which it is able to fund and allay the cost of local governance. A downturn in state tax revenues or rise in costs for operations or to pay its debts often spells trouble for local governments burdened by their own liabilities. Illinois as an Example Illinois is a prime example of cluster risk at work. Its chronic failure to maintain adequate appropriations to fund its public pensions on an actuarial basis has left the state with a huge budget gap to cover escalating pension costs. The state’s constitutional protection clause that prohibits the diminishment of pension payments to workers, upheld by the State Supreme Court, appears to have left the state in a highly difficult position to close the gap without dramatically raising taxes or reducing services. The severity of the burden has left state leaders with differences on the need for serious reforms and in conflict as how to solve the issue. The net impact has resulted in a deadlocked legislative and executive standoff with no state budget approved for the entire 2016 fiscal year. This unusual situation has resulted in severe de facto cutbacks to departments or programs that haven’t received protection either under a Court order, automatic appropriation protection or a legislative consent

5
decree. Throughout the standoff, public universities, state aid educational appropriations and social service funding were among the spending needs that were most affected. At the same time, an urgent request for additional support from Chicago governments, including the Chicago Public Schools, has gone unanswered. The state’s own credit distress has led to numerous credit downgrades by the rating agencies and higher borrowing costs for state agencies and local government borrowers. For these reasons, Illinois is probably the current headline epicenter of cluster and contagion risk among the fifty states. The situation is exponentially compounded by co-incident major fiscal challenges that currently exist in the City of Chicago and the Chicago Public Schools. At both the state and local levels, the root issue of the Illinois problem emanates from its failure to adequately address its underfunded public pension funds. Illinois’s economy, tax base and debt levels are so interconnected with Chicago that it is highly difficult to isolate the fiscal problems that exist for taxpayers in the Prairie State. Recent fiscal shortfalls have had an adverse waterfall effect on a number of associated state agencies and many local units. The chart below shows some of the governments and agencies either most impacted by the state’s problems Chart 1
Several units of government are looking to Springfield, the state capital, to find new money through higher state taxes to ease their own financial crunch. Chicago, the Chicago Public Schools, public higher education and the RTA are all among those whose current credit conditions are substantially linked to the state of the Illinois. At the same time, the creditworthiness of many other state authorities and local units of governments are affected in the municipal bond marketplace by their real or perceived reliance on the state for financial support or guarantees.
6
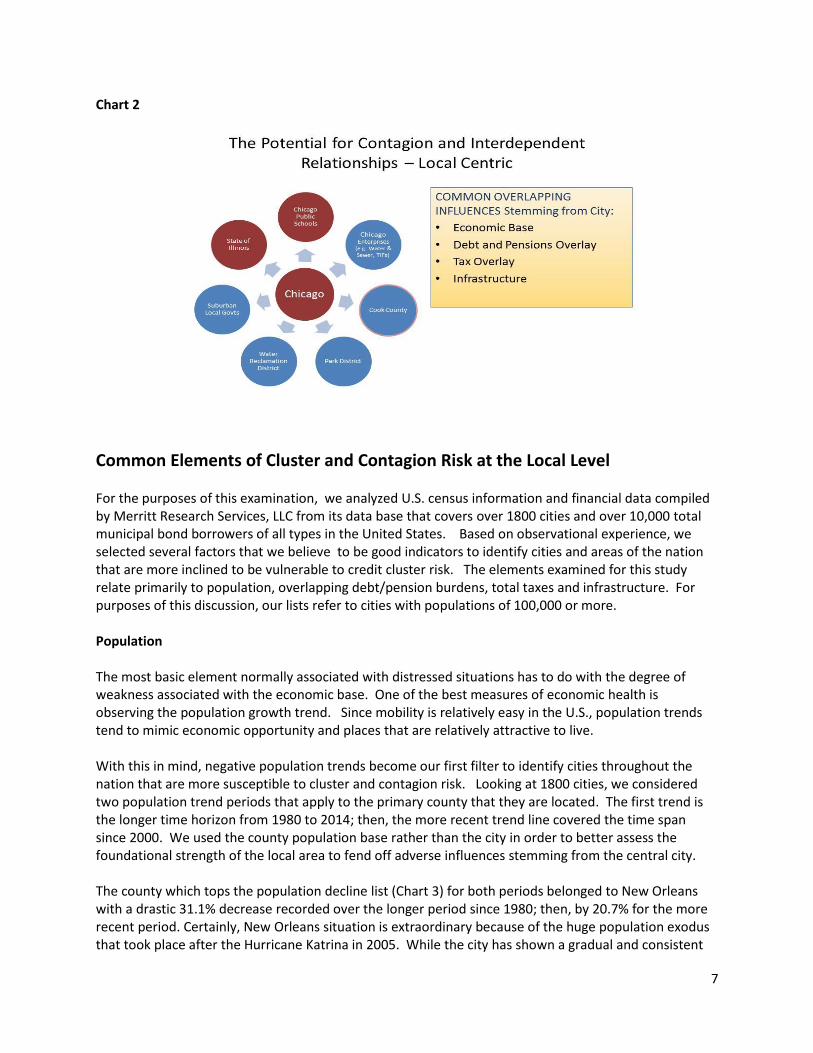
Local Centric Perspective At the local level, the potential for contagion due to intertwined and interdependent relationships threatens to spill over into overlapping and adjacent governments, apart from whatever is going on at the state level. At the core, the strength and resilience of an area’s economic base provides the foundation for an area’s penchant for local cluster risk. Growing local economies are more resistant but not immune to the spread of fiscal contagion to overlapping or nearby governmental units. Distressed situations which are triggered by factors other than local economic base weakness have the best chance of eventually working themselves out. For example, Chicago’s broad and vibrant economy provides a more buoyant base to eventually work through its debt crisis than the economic underpinnings of Detroit. Nevertheless, if fiscal problems are allowed to fester, that resilience is likely to be diminished. At the very least, eroding fundamental situations are likely to suffer stiff penalties in the form of higher taxes or borrowing rates. Dramatically higher taxes to cover an overhang of debt can affect local and regional attractiveness. Local fiscal policy that has gone awry can jeopardize the health of the metropolitan area if affordability, quality of life, adequate public facilities, and land development and transportation networks are adversely impacted. This is especially true when the main culprit triggering the negative trend emanates from the primary commercial or population centers in the area. While a fiscal crisis affecting a declining central city has the propensity to negatively affect a broader base involving the surrounding area; it is not a foregone conclusion. A contagion effect will occur if an overlapping governmental unit or a nearby community has unique resources of its own or a record of prudent and disciplined financial management. The following diagram (Chart 2) illustrates the range of multi-party interactions that one city can have with other governmental bodies in its sphere of influence. In the case of Chicago, the city is the primary driving force in the region by virtue of its dominant role as the center of jobs, capital, entrepreneurship, higher education, transportation, culture and population. The economic vitality of overlapping governmental entities as well neighboring communities are intricately tied to their association and proximity to Chicago. While economic influences may be more obvious, shared fiscal liabilities affecting a similar base of taxpayers can also contribute to a stronger or weaker outlook for credit quality and economic viability. In Chicago, the overhang of the city’s debt and pension liabilities combined with all other liabilities incurred by overlapping governmental bodies, including the state, reduce the cushion of credit protections during down times.
7
Chart 2
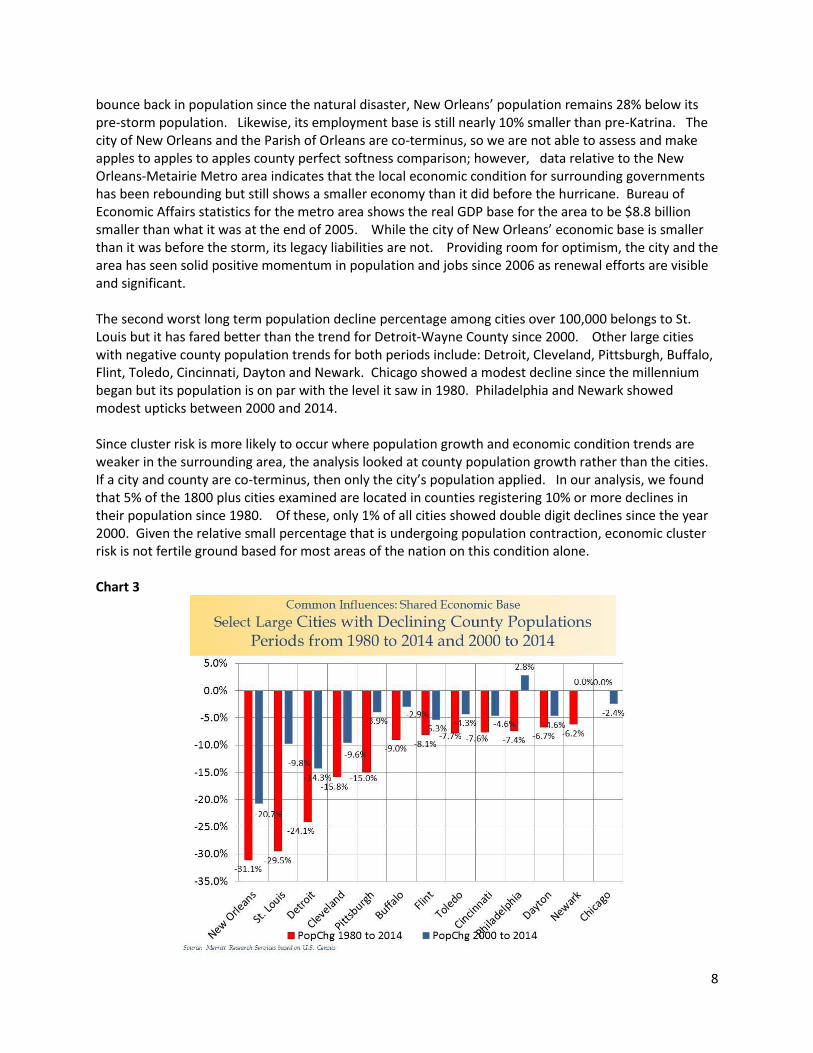
Common Elements of Cluster and Contagion Risk at the Local Level For the purposes of this examination, we analyzed U.S. census information and financial data compiled by Merritt Research Services, LLC from its data base that covers over 1800 cities and over 10,000 total municipal bond borrowers of all types in the United States. Based on observational experience, we selected several factors that we believe to be good indicators to identify cities and areas of the nation that are more inclined to be vulnerable to credit cluster risk. The elements examined for this study relate primarily to population, overlapping debt/pension burdens, total taxes and infrastructure. For purposes of this discussion, our lists refer to cities with populations of 100,000 or more. Population The most basic element normally associated with distressed situations has to do with the degree of weakness associated with the economic base. One of the best measures of economic health is observing the population growth trend. Since mobility is relatively easy in the U.S., population trends tend to mimic economic opportunity and places that are relatively attractive to live. With this in mind, negative population trends become our first filter to identify cities throughout the nation that are more susceptible to cluster and contagion risk. Looking at 1800 cities, we considered two population trend periods that apply to the primary county that they are located. The first trend is the longer time horizon from 1980 to 2014; then, the more recent trend line covered the time span since 2000. We used the county population base rather than the city in order to better assess the foundational strength of the local area to fend off adverse influences stemming from the central city. The county which tops the population decline list (Chart 3) for both periods belonged to New Orleans with a drastic 31.1% decrease recorded over the longer period since 1980; then, by 20.7% for the more recent period. Certainly, New Orleans situation is extraordinary because of the huge population exodus that took place after the Hurricane Katrina in 2005. While the city has shown a gradual and consistent
8
bounce back in population since the natural disaster, New Orleans’ population remains 28% below its pre-storm population. Likewise, its employment base is still nearly 10% smaller than pre-Katrina. The city of New Orleans and the Parish of Orleans are co-terminus, so we are not able to assess and make apples to apples to apples county perfect softness comparison; however, data relative to the New Orleans-Metairie Metro area indicates that the local economic condition for surrounding governments has been rebounding but still shows a smaller economy than it did before the hurricane. Bureau of Economic Affairs statistics for the metro area shows the real GDP base for the area to be $8.8 billion smaller than what it was at the end of 2005. While the city of New Orleans’ economic base is smaller than it was before the storm, its legacy liabilities are not. Providing room for optimism, the city and the area has seen solid positive momentum in population and jobs since 2006 as renewal efforts are visible and significant. The second worst long term population decline percentage among cities over 100,000 belongs to St. Louis but it has fared better than the trend for Detroit-Wayne County since 2000. Other large cities with negative county population trends for both periods include: Detroit, Cleveland, Pittsburgh, Buffalo, Flint, Toledo, Cincinnati, Dayton and Newark. Chicago showed a modest decline since the millennium began but its population is on par with the level it saw in 1980. Philadelphia and Newark showed modest upticks between 2000 and 2014. Since cluster risk is more likely to occur where population growth and economic condition trends are weaker in the surrounding area, the analysis looked at county population growth rather than the cities. If a city and county are co-terminus, then only the city’s population applied. In our analysis, we found that 5% of the 1800 plus cities examined are located in counties registering 10% or more declines in their population since 1980. Of these, only 1% of all cities showed double digit declines since the year 2000. Given the relative small percentage that is undergoing population contraction, economic cluster risk is not fertile ground based for most areas of the nation on this condition alone. Chart 3
9
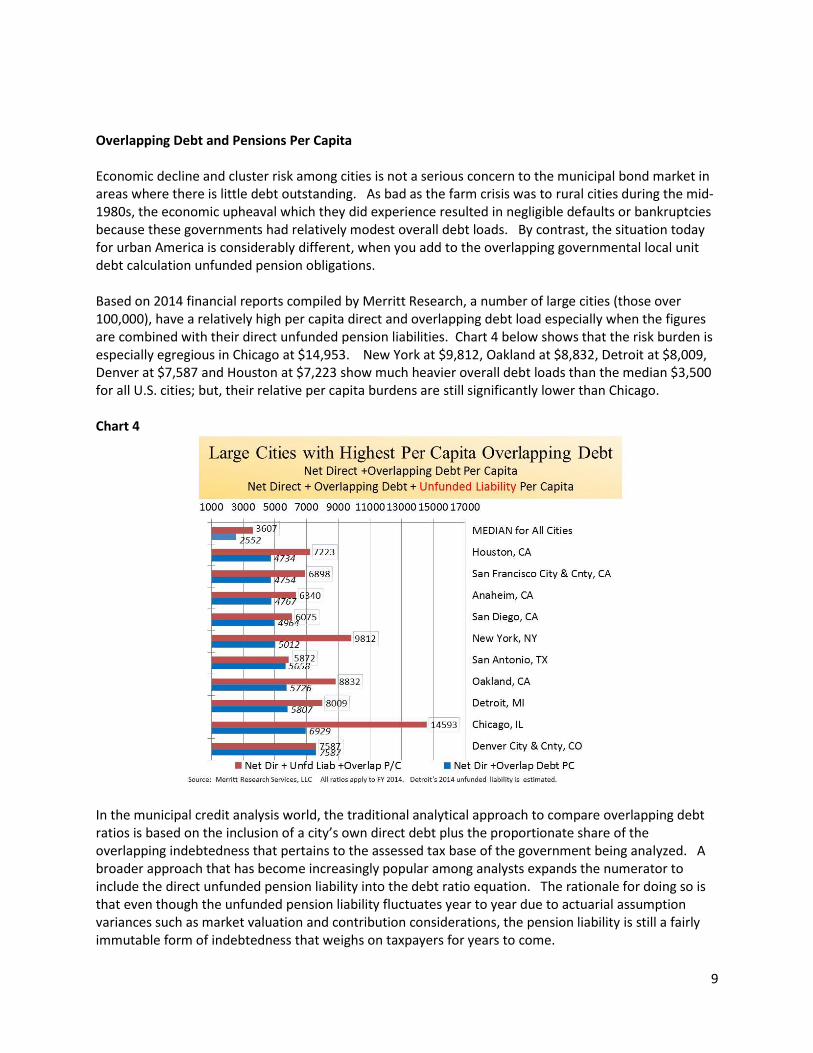
Overlapping Debt and Pensions Per Capita Economic decline and cluster risk among cities is not a serious concern to the municipal bond market in areas where there is little debt outstanding. As bad as the farm crisis was to rural cities during the mid-1980s, the economic upheaval which they did experience resulted in negligible defaults or bankruptcies because these governments had relatively modest overall debt loads. By contrast, the situation today for urban America is considerably different, when you add to the overlapping governmental local unit debt calculation unfunded pension obligations. Based on 2014 financial reports compiled by Merritt Research, a number of large cities (those over 100,000), have a relatively high per capita direct and overlapping debt load especially when the figures are combined with their direct unfunded pension liabilities. Chart 4 below shows that the risk burden is especially egregious in Chicago at $14,953. New York at $9,812, Oakland at $8,832, Detroit at $8,009, Denver at $7,587 and Houston at $7,223 show much heavier overall debt loads than the median $3,500 for all U.S. cities; but, their relative per capita burdens are still significantly lower than Chicago. Chart 4
In the municipal credit analysis world, the traditional analytical approach to compare overlapping debt ratios is based on the inclusion of a city’s own direct debt plus the proportionate share of the overlapping indebtedness that pertains to the assessed tax base of the government being analyzed. A broader approach that has become increasingly popular among analysts expands the numerator to include the direct unfunded pension liability into the debt ratio equation. The rationale for doing so is that even though the unfunded pension liability fluctuates year to year due to actuarial assumption variances such as market valuation and contribution considerations, the pension liability is still a fairly immutable form of indebtedness that weighs on taxpayers for years to come.
10
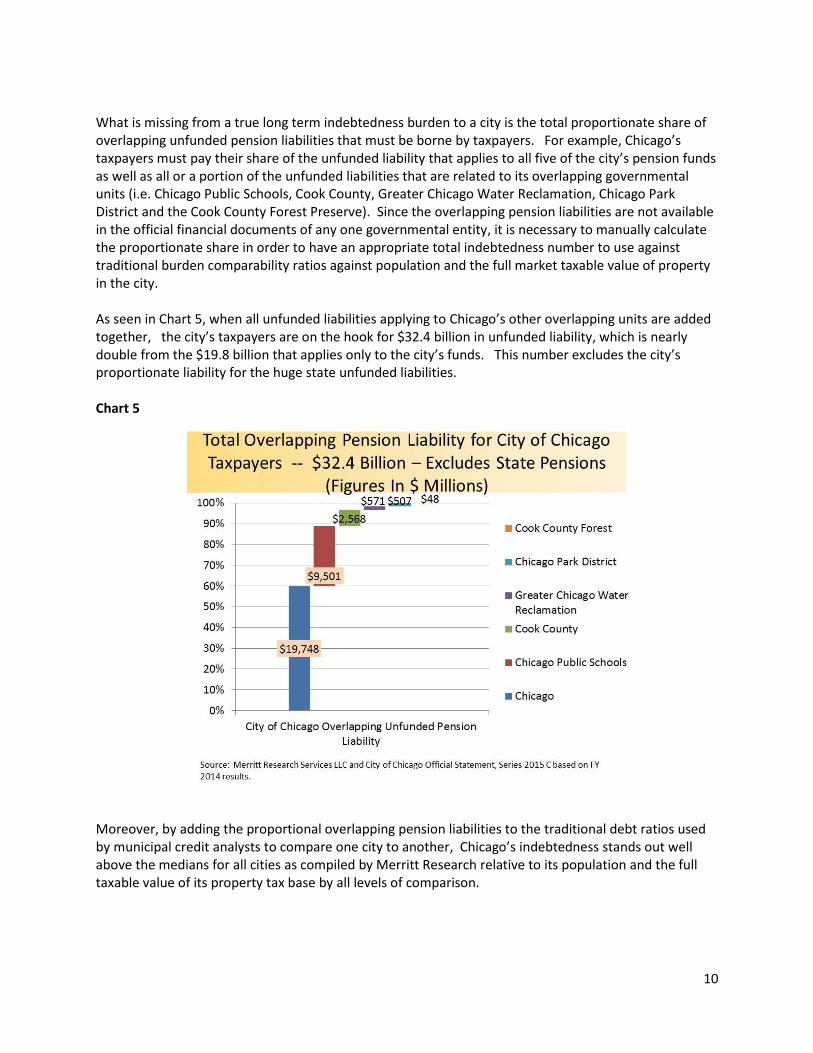
What is missing from a true long term indebtedness burden to a city is the total proportionate share of overlapping unfunded pension liabilities that must be borne by taxpayers. For example, Chicago’s taxpayers must pay their share of the unfunded liability that applies to all five of the city’s pension funds as well as all or a portion of the unfunded liabilities that are related to its overlapping governmental units (i.e. Chicago Public Schools, Cook County, Greater Chicago Water Reclamation, Chicago Park District and the Cook County Forest Preserve). Since the overlapping pension liabilities are not available in the official financial documents of any one governmental entity, it is necessary to manually calculate the proportionate share in order to have an appropriate total indebtedness number to use against traditional burden comparability ratios against population and the full market taxable value of property in the city. As seen in Chart 5, when all unfunded liabilities applying to Chicago’s other overlapping units are added together, the city’s taxpayers are on the hook for $32.4 billion in unfunded liability, which is nearly double from the $19.8 billion that applies only to the city’s funds. This number excludes the city’s proportionate liability for the huge state unfunded liabilities. Chart 5
Moreover, by adding the proportional overlapping pension liabilities to the traditional debt ratios used by municipal credit analysts to compare one city to another, Chicago’s indebtedness stands out well above the medians for all cities as compiled by Merritt Research relative to its population and the full taxable value of its property tax base by all levels of comparison.
11
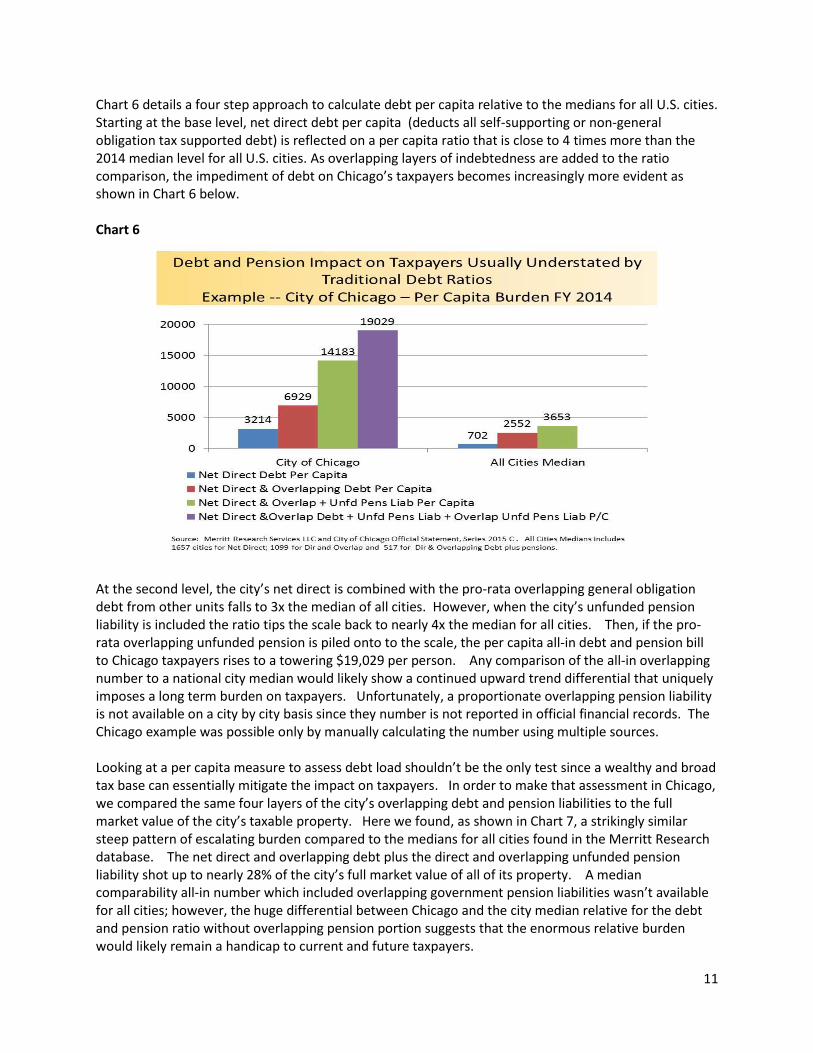
Chart 6 details a four step approach to calculate debt per capita relative to the medians for all U.S. cities. Starting at the base level, net direct debt per capita (deducts all self-supporting or non-general obligation tax supported debt) is reflected on a per capita ratio that is close to 4 times more than the 2014 median level for all U.S. cities. As overlapping layers of indebtedness are added to the ratio comparison, the impediment of debt on Chicago’s taxpayers becomes increasingly more evident as shown in Chart 6 below. Chart 6
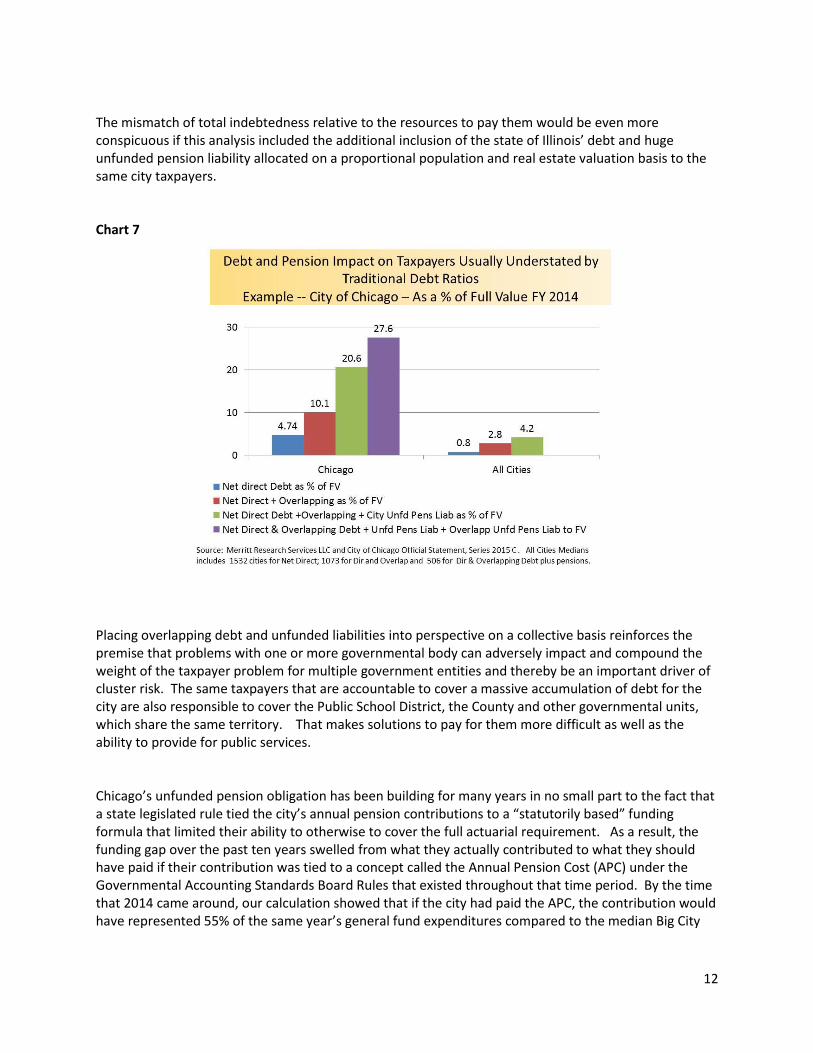
At the second level, the city’s net direct is combined with the pro-rata overlapping general obligation debt from other units falls to 3x the median of all cities. However, when the city’s unfunded pension liability is included the ratio tips the scale back to nearly 4x the median for all cities. Then, if the pro-rata overlapping unfunded pension is piled onto to the scale, the per capita all-in debt and pension bill to Chicago taxpayers rises to a towering $19,029 per person. Any comparison of the all-in overlapping number to a national city median would likely show a continued upward trend differential that uniquely imposes a long term burden on taxpayers. Unfortunately, a proportionate overlapping pension liability is not available on a city by city basis since they number is not reported in official financial records. The Chicago example was possible only by manually calculating the number using multiple sources. Looking at a per capita measure to assess debt load shouldn’t be the only test since a wealthy and broad tax base can essentially mitigate the impact on taxpayers. In order to make that assessment in Chicago, we compared the same four layers of the city’s overlapping debt and pension liabilities to the full market value of the city’s taxable property. Here we found, as shown in Chart 7, a strikingly similar steep pattern of escalating burden compared to the medians for all cities found in the Merritt Research database. The net direct and overlapping debt plus the direct and overlapping unfunded pension liability shot up to nearly 28% of the city’s full market value of all of its property. A median comparability all-in number which included overlapping government pension liabilities wasn’t available for all cities; however, the huge differential between Chicago and the city median relative for the debt and pension ratio without overlapping pension portion suggests that the enormous relative burden would likely remain a handicap to current and future taxpayers.
12
The mismatch of total indebtedness relative to the resources to pay them would be even more conspicuous if this analysis included the additional inclusion of the state of Illinois’ debt and huge unfunded pension liability allocated on a proportional population and real estate valuation basis to the same city taxpayers. Chart 7
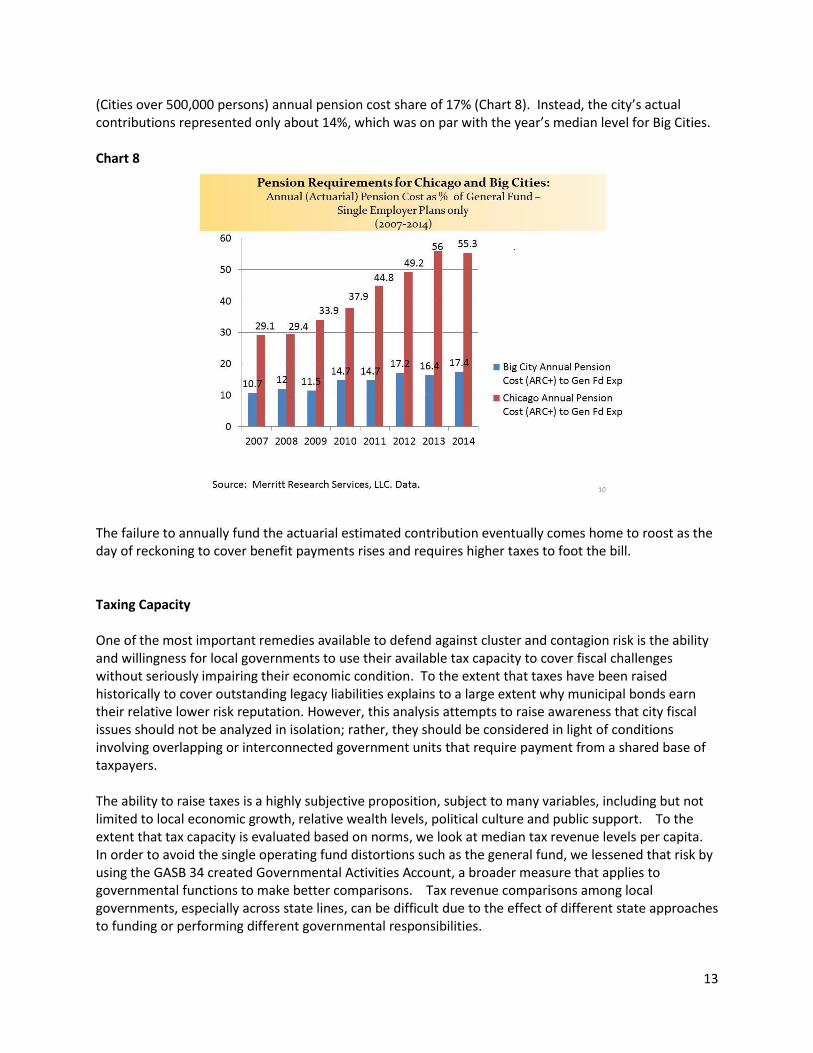
Placing overlapping debt and unfunded liabilities into perspective on a collective basis reinforces the premise that problems with one or more governmental body can adversely impact and compound the weight of the taxpayer problem for multiple government entities and thereby be an important driver of cluster risk. The same taxpayers that are accountable to cover a massive accumulation of debt for the city are also responsible to cover the Public School District, the County and other governmental units, which share the same territory. That makes solutions to pay for them more difficult as well as the ability to provide for public services. Chicago’s unfunded pension obligation has been building for many years in no small part to the fact that a state legislated rule tied the city’s annual pension contributions to a “statutorily based” funding formula that limited their ability to otherwise to cover the full actuarial requirement. As a result, the funding gap over the past ten years swelled from what they actually contributed to what they should have paid if their contribution was tied to a concept called the Annual Pension Cost (APC) under the Governmental Accounting Standards Board Rules that existed throughout that time period. By the time that 2014 came around, our calculation showed that if the city had paid the APC, the contribution would have represented 55% of the same year’s general fund expenditures compared to the median Big City
13
(Cities over 500,000 persons) annual pension cost share of 17% (Chart 8). Instead, the city’s actual contributions represented only about 14%, which was on par with the year’s median level for Big Cities. Chart 8
The failure to annually fund the actuarial estimated contribution eventually comes home to roost as the day of reckoning to cover benefit payments rises and requires higher taxes to foot the bill. Taxing Capacity One of the most important remedies available to defend against cluster and contagion risk is the ability and willingness for local governments to use their available tax capacity to cover fiscal challenges without seriously impairing their economic condition. To the extent that taxes have been raised historically to cover outstanding legacy liabilities explains to a large extent why municipal bonds earn their relative lower risk reputation. However, this analysis attempts to raise awareness that city fiscal issues should not be analyzed in isolation; rather, they should be considered in light of conditions involving overlapping or interconnected government units that require payment from a shared base of taxpayers. The ability to raise taxes is a highly subjective proposition, subject to many variables, including but not limited to local economic growth, relative wealth levels, political culture and public support. To the extent that tax capacity is evaluated based on norms, we look at median tax revenue levels per capita. In order to avoid the single operating fund distortions such as the general fund, we lessened that risk by using the GASB 34 created Governmental Activities Account, a broader measure that applies to governmental functions to make better comparisons. Tax revenue comparisons among local governments, especially across state lines, can be difficult due to the effect of different state approaches to funding or performing different governmental responsibilities.
14
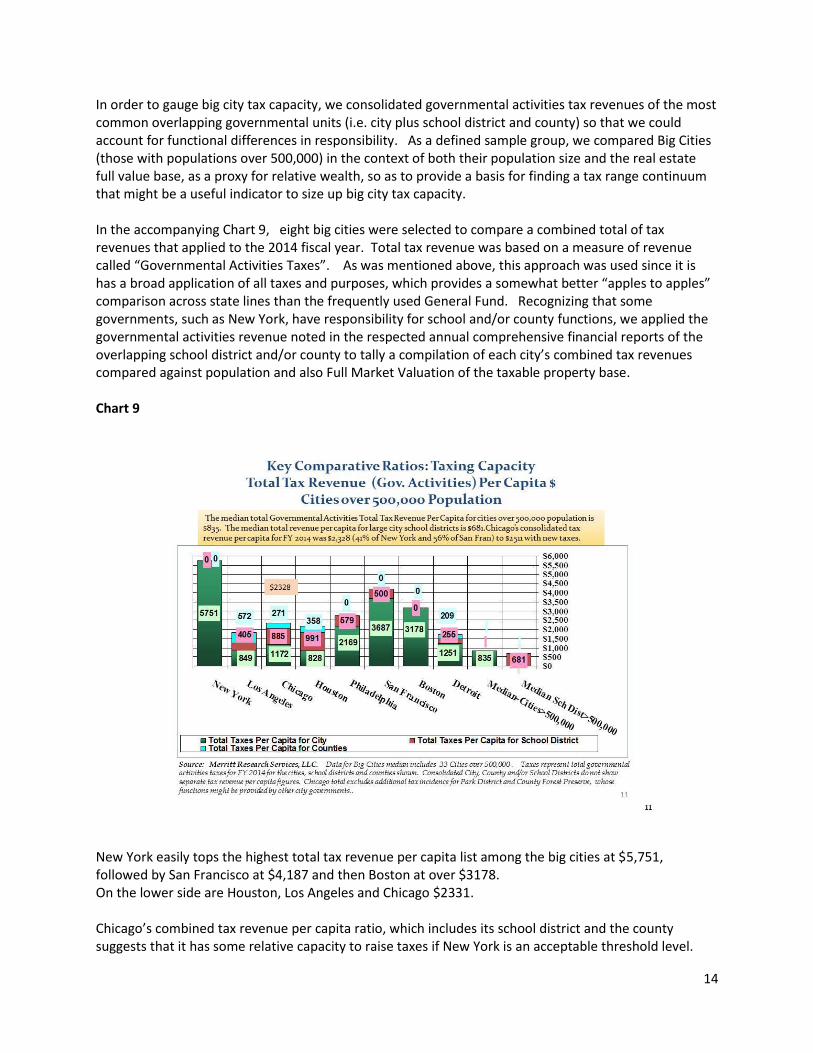
In order to gauge big city tax capacity, we consolidated governmental activities tax revenues of the most common overlapping governmental units (i.e. city plus school district and county) so that we could account for functional differences in responsibility. As a defined sample group, we compared Big Cities (those with populations over 500,000) in the context of both their population size and the real estate full value base, as a proxy for relative wealth, so as to provide a basis for finding a tax range continuum that might be a useful indicator to size up big city tax capacity. In the accompanying Chart 9, eight big cities were selected to compare a combined total of tax revenues that applied to the 2014 fiscal year. Total tax revenue was based on a measure of revenue called “Governmental Activities Taxes”. As was mentioned above, this approach was used since it is has a broad application of all taxes and purposes, which provides a somewhat better “apples to apples” comparison across state lines than the frequently used General Fund. Recognizing that some governments, such as New York, have responsibility for school and/or county functions, we applied the governmental activities revenue noted in the respected annual comprehensive financial reports of the overlapping school district and/or county to tally a compilation of each city’s combined tax revenues compared against population and also Full Market Valuation of the taxable property base. Chart 9
New York easily tops the highest total tax revenue per capita list among the big cities at $5,751, followed by San Francisco at $4,187 and then Boston at over $3178. On the lower side are Houston, Los Angeles and Chicago $2331. Chicago’s combined tax revenue per capita ratio, which includes its school district and the county suggests that it has some relative capacity to raise taxes if New York is an acceptable threshold level.
15
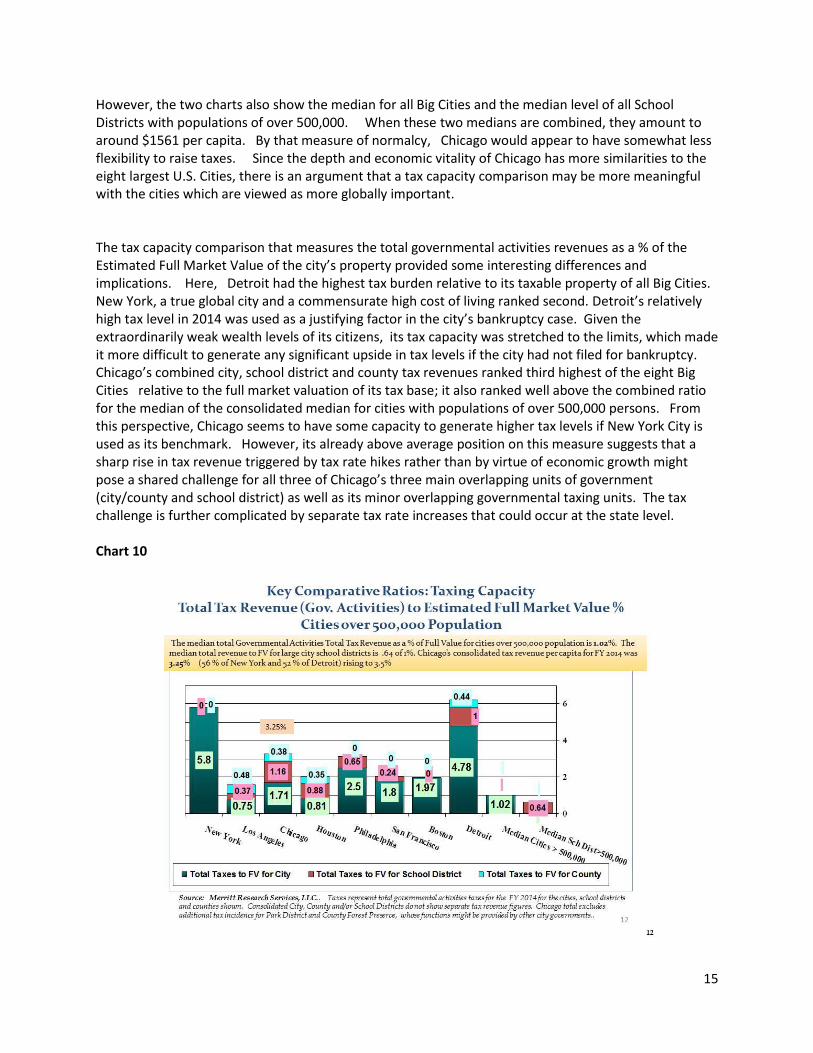
However, the two charts also show the median for all Big Cities and the median level of all School Districts with populations of over 500,000. When these two medians are combined, they amount to around $1561 per capita. By that measure of normalcy, Chicago would appear to have somewhat less flexibility to raise taxes. Since the depth and economic vitality of Chicago has more similarities to the eight largest U.S. Cities, there is an argument that a tax capacity comparison may be more meaningful with the cities which are viewed as more globally important. The tax capacity comparison that measures the total governmental activities revenues as a % of the Estimated Full Market Value of the city’s property provided some interesting differences and implications. Here, Detroit had the highest tax burden relative to its taxable property of all Big Cities. New York, a true global city and a commensurate high cost of living ranked second. Detroit’s relatively high tax level in 2014 was used as a justifying factor in the city’s bankruptcy case. Given the extraordinarily weak wealth levels of its citizens, its tax capacity was stretched to the limits, which made it more difficult to generate any significant upside in tax levels if the city had not filed for bankruptcy. Chicago’s combined city, school district and county tax revenues ranked third highest of the eight Big Cities relative to the full market valuation of its tax base; it also ranked well above the combined ratio for the median of the consolidated median for cities with populations of over 500,000 persons. From this perspective, Chicago seems to have some capacity to generate higher tax levels if New York City is used as its benchmark. However, its already above average position on this measure suggests that a sharp rise in tax revenue triggered by tax rate hikes rather than by virtue of economic growth might pose a shared challenge for all three of Chicago’s three main overlapping units of government (city/county and school district) as well as its minor overlapping governmental taxing units. The tax challenge is further complicated by separate tax rate increases that could occur at the state level. Chart 10
16
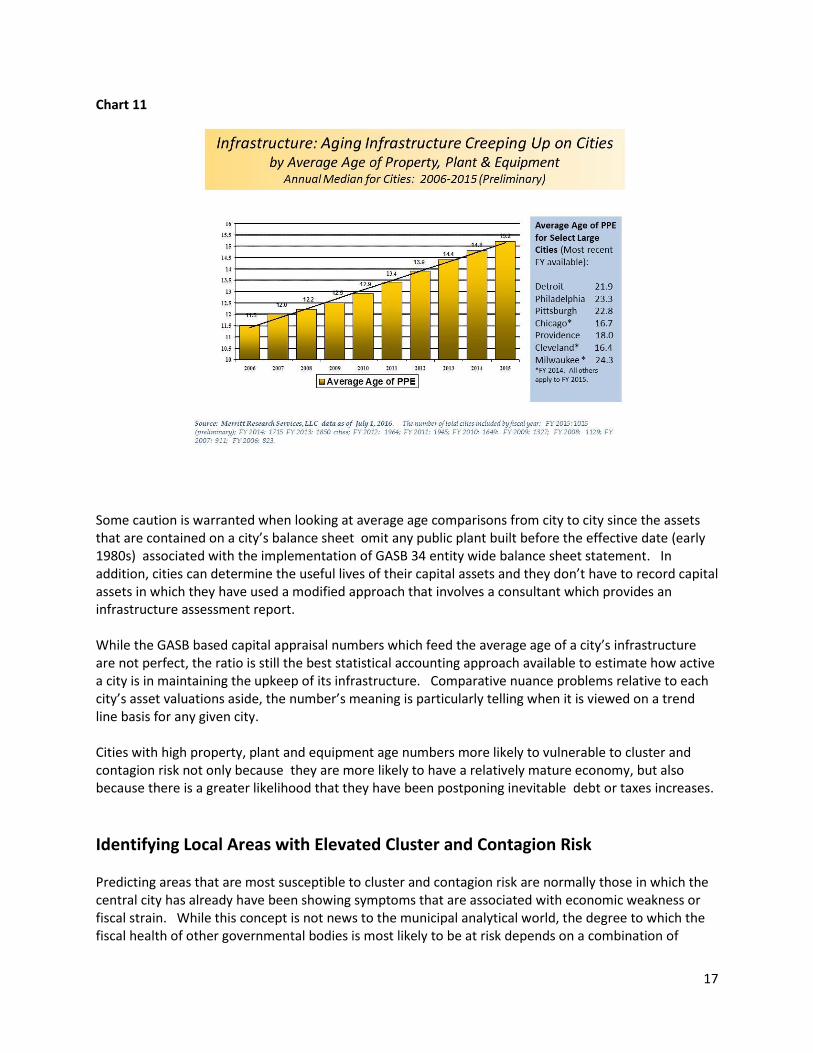
Uncertainties about the political and economic impact of tax increases when they must purposely rise sharply in a short time can, at least initially, result in outmigration of taxpayers. To some, New York lost both residents to the Sun Belt and taxpayers to adjoining states after its fiscal crisis in 1975 before the city’s global economic standing and its cosmopolitan attraction to foreign in-migrations provided it the eventual resilience to rebound, especially during the 1990s. However, New York’s continued high tax levels suggest that New York City’s upside flexibility to raise taxes should a future fiscal crisis occur might be more limited. Still, taxes alone are not the only cost of living that residents or employers might use to determine locational viability. Prominent global cities which derive their energy based on their political or economic significance can withstand higher costs of living due to the essentiality of their industry. In a recent study by GOBanking Rates, Chicago ranked 10th among big cities in the U.S. relative to total cost of living. Cities at the top of the list included San Francisco, San Jose and New York. Infrastructure Deferring infrastructure improvements and replacement has been a long standing problem in municipal finance. It is widely known that the failure to fund infrastructure projects on a timely basis is likely to lead to adverse consequences or more expensive financial obligations down the road. The relevance of this particular problem in relation to cluster risk is that overdue projects have the makings of an off balance sheet debt liability that will eventually have to be covered by taxpayers one way or another. Consequently, cities which have a disproportionate share of older infrastructure will become even less desirable to attracting and retaining businesses and residents. The burden to pay for infrastructure repair will fall on future taxpayers to cover either debt or pay as you go programs, which is especially troubling if the local economy and population base is already on a downward path. While there are no perfect ways to size up the quality of a city’s infrastructure from afar, a decent proxy for identifying deferred infrastructure is to look at the GASB Statement 34 entity wide balance sheet to calculate an average age of property plant & equipment ratio. A form of this ratio, commonly used for municipal enterprises and corporations, reflects the estimated annual depreciation expense relative to the government’s appraisal of the asset value and its full depreciation schedule, when the asset was placed on the books. When tracking Merritt Research’s the average age of infrastructure (i.e. property, plant and equipment) measure for cities since 2006, there is a straight line message that clearly reinforces the view that the situation is only worsening. As shown in Chart 11, the median average age of infrastructure in 2015 has increased from close to 11 years in 2006 to nearly 15 today. A number of major cities stand out and are even much higher than the median. Milwaukee leads the list at 24.3 years, followed by Detroit and Philadelphia at 23.3 years and Pittsburgh and Providence at 18 years.
17
Chart 11
Some caution is warranted when looking at average age comparisons from city to city since the assets that are contained on a city’s balance sheet omit any public plant built before the effective date (early 1980s) associated with the implementation of GASB 34 entity wide balance sheet statement. In addition, cities can determine the useful lives of their capital assets and they don’t have to record capital assets in which they have used a modified approach that involves a consultant which provides an infrastructure assessment report. While the GASB based capital appraisal numbers which feed the average age of a city’s infrastructure are not perfect, the ratio is still the best statistical accounting approach available to estimate how active a city is in maintaining the upkeep of its infrastructure. Comparative nuance problems relative to each city’s asset valuations aside, the number’s meaning is particularly telling when it is viewed on a trend line basis for any given city. Cities with high property, plant and equipment age numbers more likely to vulnerable to cluster and contagion risk not only because they are more likely to have a relatively mature economy, but also because there is a greater likelihood that they have been postponing inevitable debt or taxes increases.
Identifying Local Areas with Elevated Cluster and Contagion Risk Predicting areas that are most susceptible to cluster and contagion risk are normally those in which the central city has already have been showing symptoms that are associated with economic weakness or fiscal strain. While this concept is not news to the municipal analytical world, the degree to which the fiscal health of other governmental bodies is most likely to be at risk depends on a combination of
18
factors being present not only in the central city but also within the local area, normally places situated in the same county. Those characteristics that we deem of primary importance have already been discussed at length in this paper. They include those related to county population trends, total and direct debt, overlapping debt, direct city unfunded pension liabilities, tax revenue levels and infrastructure age. There are also other secondary symptomatic factors which may signal that cluster risk might be festering, such as median household income, the median age of a county’s housing stock and the overall condition of the central city’s unrestricted net position relative to the size of the city’s total governmental expenditures. The first of these factors recognizes that wealth matters; little explanation is needed for its ability to mitigate the otherwise eroding influence of a challenging fiscal environment. The median age of the housing stock serves as a proxy indicator to gauge the economic maturity of the area’s development. While there are occasions such as in Charleston, SC in which preserving housing is a positive attribute that can enrich the city, but those situations are fewer in number. With respect to the last factor, cities that manage their liabilities within their means are more likely to carry a positive or less negative overall net position balance sheet. A more negative unrestricted net position suggests that the government’s fiscal condition is vulnerable to its legacy liabilities and more susceptible to a path that lends itself to decline in the region. Situations in which multiple primary and secondary characteristics are present increase the likelihood and intensity that the economic and fiscal shortcomings of one or more governments will tip other related governments into a cluster pattern of fiscal malaise. 1 Cluster Risk Model Based on all of these factors, we formulated a simple multi-variate statistical model to incorporate our primary and secondary factors in order to rank city/county areas that appear most vulnerable to the threat that we refer to as the “cluster” risk. Cluster rankings involving the same risk factors were calculated for both the city and for the median for the cities that belong to the same county. Although cluster risk may go beyond county boundaries, we have limited this portion of the analysis to this grouping in order to keep the discussion more focused. The essence of cluster risk presumes that one government’s fiscal problems can be passed along or shared by other governments because of one or more shared root causes that impact a similar base of taxpayers who must bear the burden of its impact. The rankings based on a percentile national ranking among all cities and counties in the database with those receiving the highest rank (from 0 to 99.9%) associated with the least vulnerability to cluster risk. The economic based factors used in the city model (i.e. Population, median household
1 Factors used in the study are: Total Direct Debt, Unfunded Pension Liability & Overlapping Debt as a % of Full Value; Net
Direct Debt, Unfunded Pension Liability & Overlapping Debt as a % of Full Value; Net Direct Debt, Unfunded Pension Liability & Overlapping Debt Per Capita; Net Direct Debt & Overlapping Debt as a % of Full Value; Net Direct Debt & Overlapping Debt Per Capita; Population Change of County 1980 to 2014; Population Change of County 2000 to 2014; Total Tax Revenue – Governmental Activities Per Capita; Average Age of Property Plant & Equipment (PPE); Estimated Useful Life of PPE; Unrestricted Net Assets to Total Expenditures – Governmental Activities; County Median Household Income; and County Median Year of Housing Built. All factors are city based except those specifically mentioned as County.
19
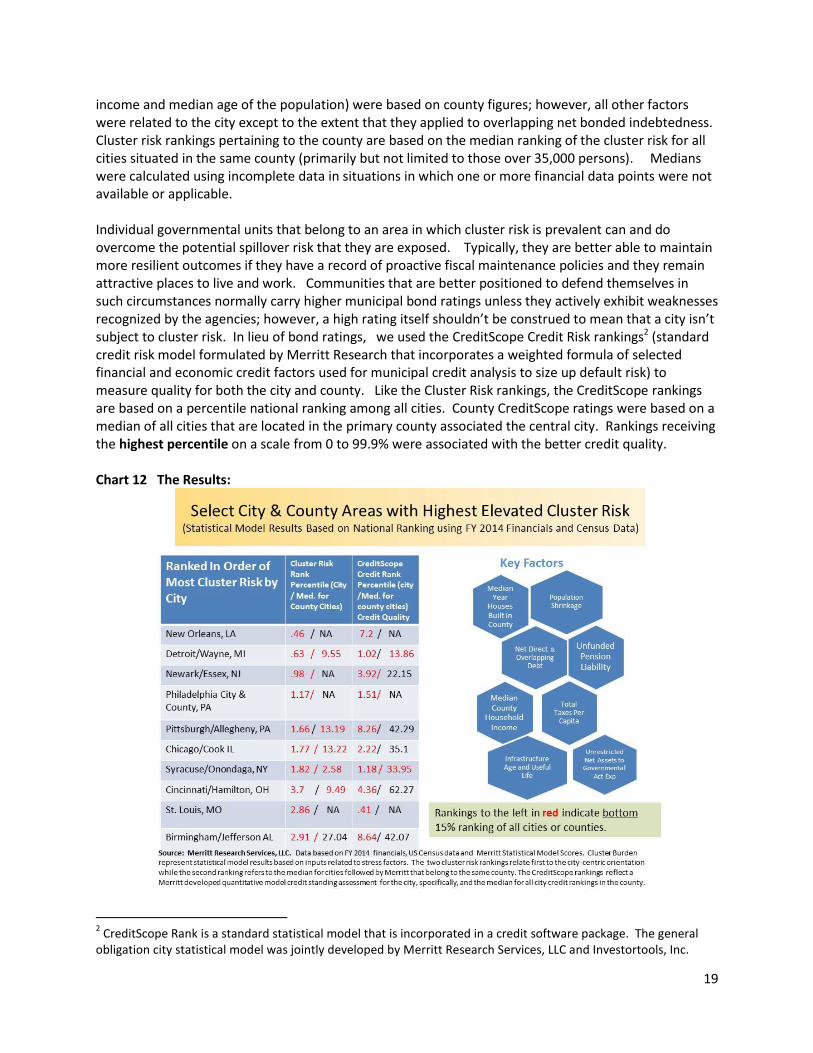
income and median age of the population) were based on county figures; however, all other factors were related to the city except to the extent that they applied to overlapping net bonded indebtedness. Cluster risk rankings pertaining to the county are based on the median ranking of the cluster risk for all cities situated in the same county (primarily but not limited to those over 35,000 persons). Medians were calculated using incomplete data in situations in which one or more financial data points were not available or applicable. Individual governmental units that belong to an area in which cluster risk is prevalent can and do overcome the potential spillover risk that they are exposed. Typically, they are better able to maintain more resilient outcomes if they have a record of proactive fiscal maintenance policies and they remain attractive places to live and work. Communities that are better positioned to defend themselves in such circumstances normally carry higher municipal bond ratings unless they actively exhibit weaknesses recognized by the agencies; however, a high rating itself shouldn’t be construed to mean that a city isn’t subject to cluster risk. In lieu of bond ratings, we used the CreditScope Credit Risk rankings2 (standard credit risk model formulated by Merritt Research that incorporates a weighted formula of selected financial and economic credit factors used for municipal credit analysis to size up default risk) to measure quality for both the city and county. Like the Cluster Risk rankings, the CreditScope rankings are based on a percentile national ranking among all cities. County CreditScope ratings were based on a median of all cities that are located in the primary county associated the central city. Rankings receiving the highest percentile on a scale from 0 to 99.9% were associated with the better credit quality. Chart 12 The Results:
2 CreditScope Rank is a standard statistical model that is incorporated in a credit software package. The general
obligation city statistical model was jointly developed by Merritt Research Services, LLC and Investortools, Inc.
20
We applied our cluster risk statistical model to 1832 U.S. cities in the nation of all population sizes. However, relative to the model in this presentation, this article focuses on those cities with populations of at least 100,000 for specific commentary. Of those, the bottom ten cities which ranked as the most vulnerable areas in the nation, where conditions appear to be most apt for spilling over into overlapping or nearby governments were as follows: New Orleans, Detroit, Philadelphia, Pittsburgh, Chicago, Syracuse, Cincinnati, St. Louis, and Birmingham. Since the statistical model used several county indicators to assess economic conditions that were intended to characterize the common exposure of the adjoining governmental bodies to contagion risk, this approach lessened the predictive potential of cluster for cities that were not part of a separate broader territorial county (e.g. New Orleans, Philadelphia, St. Louis and New York). Nevertheless, the value of the cluster risk concept is still likely to be relevant in these places, since the same dynamics of the elements used in the study would probably have an adverse reaction to those cities in close proximity to the central city. We have excluded Newark’s cluster ranking in our discussion because of statistical drawbacks due in large part to unique New Jersey local government financial and debt reporting practices that limit the model’s usefulness in this analysis. While the city’s subpar economic and demographic characteristics placed it among cities that might have tendency for cluster risk, the absence of comparable and important debt and tax issues, discounted the usefulness of its statistical score. New Orleans’ massive upheaval to the city’s population base in the aftermath of Hurricane Katrina only explains a portion of its low ranking. While many residents have returned to the area helping to fuel new energy into the area’s economy, a number of measures that we used in the study indicated that cluster risk vulnerability is still very much an issue of concern. (i.e. debt, pensions, overall balance sheet, infrastructure age and income levels). The area’s ability to stave off a worsening contagion of local financial problems has been helped by its gradual bounce back as well as federal funds and special programs to help them with their rebuilding. Applying the cluster risk model in this case has its statistical challenges. Its weak ranking is complicated by the fact that New Orleans is one of the large cities on our list that doesn’t have a separate county to provide more definitive information relative to the health of neighboring local governments in the area. However, economic base weakness in the metro area, as noted in the population section of this paper, is evident by the decline in real GDP for the New Orleans metro area since 2005, the year of Hurricane Katrina. The fact that Detroit/Wayne County, MI ranked as second only to New Orleans on the most vulnerable list seems to reaffirm the validity of the statistical model as a predictive tool. In Detroit’s case, both the city and the county’s cities ranked in the lowest one percentile. Wayne County cities fell in the bottom 4% percentile. While Detroit’s fiscal plight has long been well known, resulting in its own bankruptcy in 2014, the overlapping factors and conditions that characterized the city are shared to a large degree with the Detroit Public Schools, Wayne County as well as a number of suburbs adjacent or nearby to Detroit that have officially been placed under state emergency management or are on the brink of inclusion. Wayne County governmental units with emergency managers include: Allen Park, Ecorse, Hamtramck and Highland Park. Since cluster risk is highly correlated with fiscal stress emanating from the center point of the area, it isn’t surprising’s that Detroit’s own credit profile is emitting red distress flags of its own. As a compilation of a variety of key credit factors used the CreditScope Rank, Detroit’s overall credit ranking placed the city in the worst 1% of over 1800 cities in the U.S. based on 2014 figures. As an additional confirmation that cluster and contagion risk is already at work and adversely affecting other local cities,
21
the median CreditScope ranking for the 17 Wayne County cities included in the Merritt Research database, combined to place in the weakest 13th percentile of all counties in the nation. Like New Orleans, Philadelphia’s cluster rank, which falls in the weakest 1% of all cities, has its limitations as a comparative example of the cluster model since the city and county are one and the same. Nevertheless, as mentioned earlier, its low ranking has direct negative implications for its overlapping fiscally troubled school district as well as potentially other governmental units in the wider metropolitan area. In general, weaknesses in the central city present economic and fiscal vulnerabilities in a region that can spillover to other governmental units if debt and tax liabilities are directly or indirectly passed along to taxpayers in the surrounding area. While parts of Philadelphia have been showing signs of economic revitalization and a youthful infusion of some new residents, a turnaround is far from complete. High indebtedness levels and overall weaker residential wealth levels are still negative influences on the city’s individual CreditScope credit ranking, placing it in the bottom 4% of cities. Two other major city/county areas that ranked in the bottom decile for cluster risk are particularly interesting: Pittsburgh/Allegheny County and Chicago/Cook County. Recent trends for the city of Pittsburgh are somewhat optimistic with stabilizing signs evident in its population and employment statistics as well as reinvestment. Faced with severe issues of industrial dislocation spanning decades, the city has had it to steady itself after many years of economic erosion that displaced residents, its tax base and city finances. The pressures affecting the central city also had an adverse impact on Allegheny County and other governmental units in the area. Including Pittsburgh, four of the 17 cities that came under the state’s financial distress emergency program (Act 47) were located in the county. For that reason, Pittsburgh is a classic example of the contagion risk problems that can spread from the central city to other governments around them. Since the cluster risk model ranked the city of Pittsburgh in the bottom 2% of all cities in our study, recent signs of its recovery remain a delicate challenge for the area. By the same token, the city’s overall credit quality remains vulnerable, as measured by the CreditScope rank, placed it in the bottom 10% of all U.S. cities. Despite the fact that three other Allegheny County cities have received oversight under Act 47 and the 13 cities in the county included in our study showed a higher cluster risk as a group, these same cities suggest good fiscal management and somewhat better control over their own credit quality by registering a median CreditScope quality rank of a mid-range 42nd percentile ranking. Chicago is probably the most interesting city to watch relative to cluster risk over the next decade or two. While it’s economic base appears to be much healthier than most of the cities that are ranked low on the cluster scale and thus deemed vulnerable, the long standing deferral to pay down long term pension liabilities at both the local and state level, place Chicago as well as Illinois at the epi-center of this discussion. Relying on a plethora of positive strengths as a prominent global city, including a strong base of headquartered companies, outstanding academic institutions, vital transportation connections, trend setting architecture, tourism and a core of revitalized neighborhoods, Chicago would seem to be unlikely candidate for negative cluster risk. The breadth of its economic base and broad tax capacity present a strong argument that Chicago can muster the resources to handle its debt load. On the other hand, Chicago’s weaknesses, outside the pension exposure, are mostly related to the socioeconomic ills in the poorer sections the city. Recent population statistics have shown some slippage due to slowing in-migration to the city from foreign countries and mild exodus of less affluent residents to the suburbs or out of the state. These demographic issues are a factor but not the
22
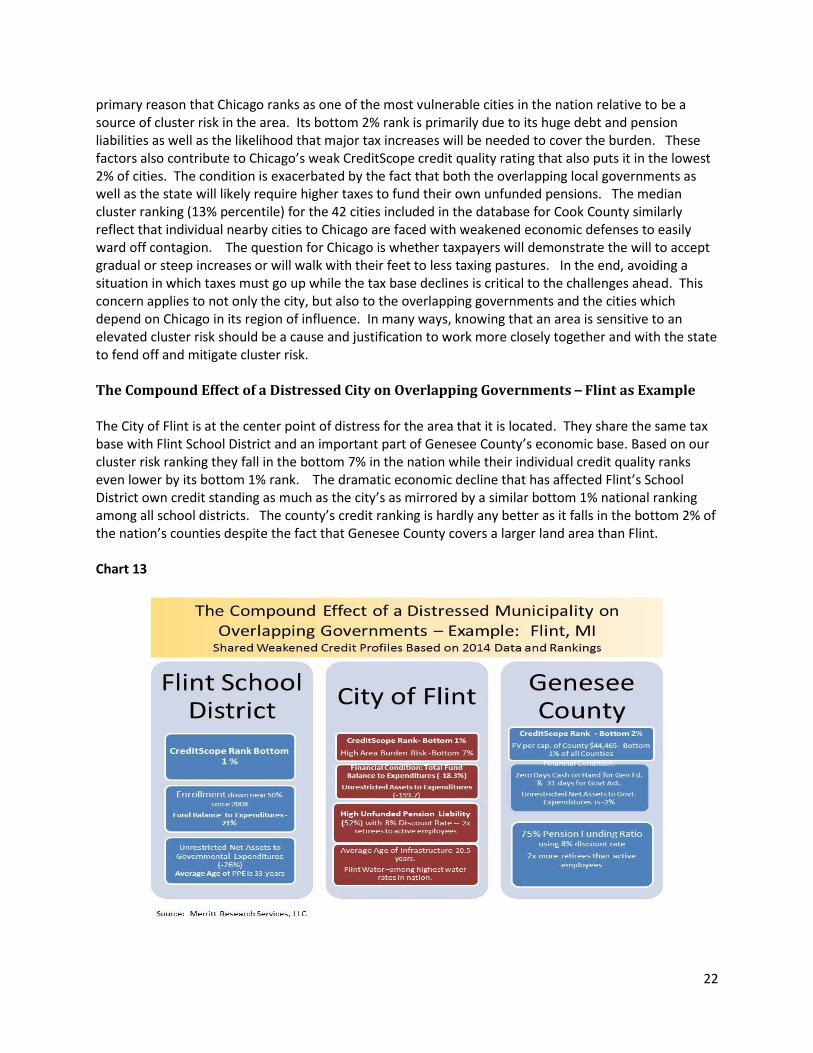
primary reason that Chicago ranks as one of the most vulnerable cities in the nation relative to be a source of cluster risk in the area. Its bottom 2% rank is primarily due to its huge debt and pension liabilities as well as the likelihood that major tax increases will be needed to cover the burden. These factors also contribute to Chicago’s weak CreditScope credit quality rating that also puts it in the lowest 2% of cities. The condition is exacerbated by the fact that both the overlapping local governments as well as the state will likely require higher taxes to fund their own unfunded pensions. The median cluster ranking (13% percentile) for the 42 cities included in the database for Cook County similarly reflect that individual nearby cities to Chicago are faced with weakened economic defenses to easily ward off contagion. The question for Chicago is whether taxpayers will demonstrate the will to accept gradual or steep increases or will walk with their feet to less taxing pastures. In the end, avoiding a situation in which taxes must go up while the tax base declines is critical to the challenges ahead. This concern applies to not only the city, but also to the overlapping governments and the cities which depend on Chicago in its region of influence. In many ways, knowing that an area is sensitive to an elevated cluster risk should be a cause and justification to work more closely together and with the state to fend off and mitigate cluster risk. The Compound Effect of a Distressed City on Overlapping Governments – Flint as Example The City of Flint is at the center point of distress for the area that it is located. They share the same tax base with Flint School District and an important part of Genesee County’s economic base. Based on our cluster risk ranking they fall in the bottom 7% in the nation while their individual credit quality ranks even lower by its bottom 1% rank. The dramatic economic decline that has affected Flint’s School District own credit standing as much as the city’s as mirrored by a similar bottom 1% national ranking among all school districts. The county’s credit ranking is hardly any better as it falls in the bottom 2% of the nation’s counties despite the fact that Genesee County covers a larger land area than Flint. Chart 13
23
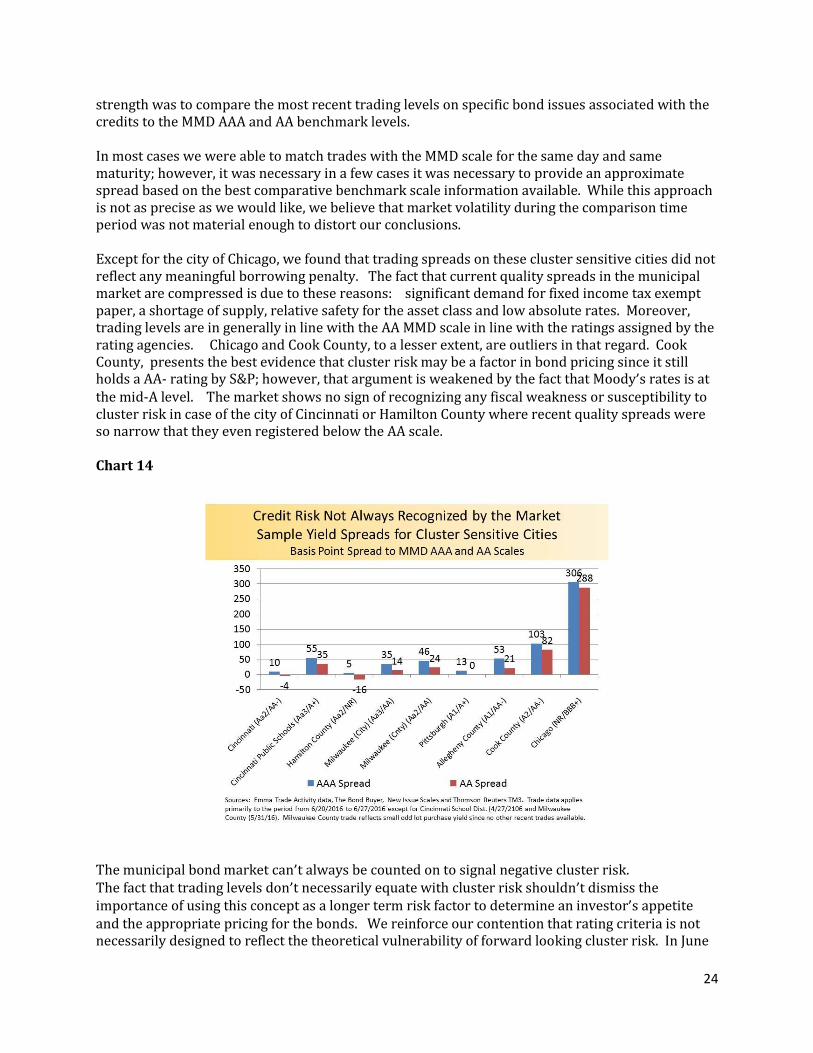
Flint is a powerful ongoing example of how difficult it is to isolate the problems of a distressed city from its overlapping units of government and the dampening effect it has on nearby governments. The city of Flint, which has been under state emergency management, faces a host of problems that are characteristic of distress. Beginning with its negative balance financial condition, to its high unfunded pension liability that covers twice as many retired and inactive members as active employees to its aging infrastructure as measured by its 21 year average age of Property, Plant and Equipment. Adding salt to the wound, the recent scandal involving Flint lead tainted water suggests significant water plant improvements but its water rates are already among the highest in the nation. Following the same depressing profile, the school district has seen a near 50% decline in its enrollment since 2008 and a relatively ancient average age of its PPE at 33 years. Flint’s problems have swept into the County too. The Full Value per capita of the County ranks it in the bottom 1% of the nation’s counties so there appears to be little offsetting taxable property wealth there. As a cluster crisis widens, it bears pressure on the state government to become increasingly involved. If a crisis is in an earlier stage, intervention boards and emergency managers can help stabilize the situation. However, cutbacks that go too far can backfire as Flint saw with its water quality problem. Sooner or later, state grants or loan guarantees entail the upward spiraling effect of cluster risk to wider base of taxpayers. The Municipal Bond Market and Early Detection of Cluster Risk Municipal bond ratings and borrowing rates are inherently linked to credit quality. However, distinctions by the rating agencies are dependent on specific criteria that may not immediately exist for developing vulnerabilities like credit cluster risk. The same can be said for municipal bond pricing. While guilt by association borrowing penalties frequently arise whenever a distressed credit becomes public knowledge, the pricing evidence suggests that negative cluster risk are not always incorporated into borrowing costs. Market factors such as bond structure, tax exemption nuances, global credit conditions, supply and demand as well as absolute interest rate levels can diminish credit quality distinctions especially related to longer term susceptibilities, like cluster risk. Since 2013, several high profile advanced stage distressed credit risk situations have gained widespread attention, such as those linked to Puerto Rico, Detroit and Flint. These cases have already revealed themselves as good examples of cluster risk situations in which related governmental units are dragged down by their relationships with the incipient distressed credit. Intensified credit scrutiny, credit ratings and borrowing rates have been lumped together to reflect their entanglement. The market is also well aware of the developing distressed cluster risk associated with Chicago Public Schools, City of Chicago and the state of Illinois. While the degree of distress has not reached the same level of severity of Puerto Rico and Detroit, they clearly epitomize the hazards of intertwined cluster as shown by their current ratings and market prices on their bonds. Ratings don’t assign a specific rating for cluster risk because the concept vaguely represents an element that more closely resembles a propensity for being affected by a causal agent rather than the realization of an actual occurrence. Generally, market prices follow the ratings unless negative headlines or characteristics of fiscal distress begin to manifest themselves. Given that cluster risk may not be evidenced in current ratings or prices on bonds, we examined the recent trading levels associated with sample of local governmental units related to four cities that showed cluster risk characteristics according to our model. The following cities and their Moody’s and S&P general obligation ratings as of June 24, 2016 were included since they are had city centric cluster risk rankings in the bottom five percent of all U.S. cities: Cincinnati (Aa2/AA-), Milwaukee (Aa3/AA), Pittsburgh (A1/A+), and Chicago (NR/BBB+). The measure used to assess trading
24
strength was to compare the most recent trading levels on specific bond issues associated with the credits to the MMD AAA and AA benchmark levels. In most cases we were able to match trades with the MMD scale for the same day and same maturity; however, it was necessary in a few cases it was necessary to provide an approximate spread based on the best comparative benchmark scale information available. While this approach is not as precise as we would like, we believe that market volatility during the comparison time period was not material enough to distort our conclusions. Except for the city of Chicago, we found that trading spreads on these cluster sensitive cities did not reflect any meaningful borrowing penalty. The fact that current quality spreads in the municipal market are compressed is due to these reasons: significant demand for fixed income tax exempt paper, a shortage of supply, relative safety for the asset class and low absolute rates. Moreover, trading levels are in generally in line with the AA MMD scale in line with the ratings assigned by the rating agencies. Chicago and Cook County, to a lesser extent, are outliers in that regard. Cook County, presents the best evidence that cluster risk may be a factor in bond pricing since it still holds a AA- rating by S&P; however, that argument is weakened by the fact that Moody’s rates is at the mid-A level. The market shows no sign of recognizing any fiscal weakness or susceptibility to cluster risk in case of the city of Cincinnati or Hamilton County where recent quality spreads were so narrow that they even registered below the AA scale. Chart 14
The municipal bond market can’t always be counted on to signal negative cluster risk. The fact that trading levels don’t necessarily equate with cluster risk shouldn’t dismiss the importance of using this concept as a longer term risk factor to determine an investor’s appetite and the appropriate pricing for the bonds. We reinforce our contention that rating criteria is not necessarily designed to reflect the theoretical vulnerability of forward looking cluster risk. In June

25
2013, Moody’s and S&P still had an Aa3/A+ rating on the city of Chicago and an Aa3/AA- on the Chicago Public Schools. Our concern is that the market doesn’t fully integrate cluster risk into ratings and pricing until the impact presents a clear and present danger. The potential for contagion due to gradual regional economic erosion and burdensome regional fiscal policy eventually has the propensity to harm overlapping governments, suburbs and the region as a whole.
Recognizing Cluster Risk as a Strategy to Promote Intergovernmental Co-Operation Acknowledging the reality and dynamics of cluster risk is a useful process for analysts, investors and the public to better identify cities and areas most in danger of credit deterioration. From the investor’s standpoint, wholesale market reactions to a superficial association with a single headline problem can result in little more than inefficient pricing phenomena unless there is knowledge and understanding of cause and effect patterns. Pricing cluster risk into the equation legitimately acknowledges incremental risk but also creates a market mechanism for incentivizing governmental officials to work together at a relatively early stage to promote co-operation and better long term fiscal planning. Recognizing that a distressed credit situation can become a harbinger for scattering distress to a wider area might trigger pricing adjustments in areas believed to be in the shadow of the source of the problem. This is not to suggest that all governmental entities that fall within the perimeter of cluster risk are doomed to distress. Pricing might be adjusted modestly or not at all to the extent that they reflect management practices, individual economic fundamentals and bond security features that are unique to individual credits. Serious cluster risk situations are not tied to one negative factor. Our research suggests that threat of serious cluster risk is more likely to be activated if there is a confluence of negative factors rather any one single cause. The negative effect of economic base erosion has to be assessed within the context of a variety of fiscal factors that are in line with degree of decline. Among the most important factors to watch for when assessing the potential for contagion are: overlapping debt and pensions, tax levels, active infrastructure management and the unique economic capacity of an individual governmental unit. These elements can inhibit or encourage cluster risk. The capability and political will of the state are also critical when sizing up the potential for contagion as well as treatment. Proactive strategies to identify cluster risk situations before they become acute can lead to the advocacy and enactment of laws, policies and pacts that encourage better intergovernmental co-operation. Political leaders and citizens at all levels and governments throughout a region must recognize that it is in everyone’s best interest to prevent and address fiscal distress before it spreads to other units of government and weighs down taxpayers, public services and local economic growth. Waiting too long can compound the enormity of fiscal consolidated cluster problems and require taxpayers to accept more extreme remedies. Awareness and agreement that fiscal malaise has the propensity to cluster and spread is a good first step to encourage governments to think long term, match debt and pension outstanding obligations to useful service lives, co-ordinate fiscal and economic planning, consolidate when appropriate, and formulate state policies that benefit the common good. Over the past 50 years,
26
those inner ring suburbs that failed to prepare the days in which their metropolitan area was no longer the driving economic force that it once was are finding their own fiscal challenges to be harder to overcome. Municipal bond investors, taxpayers and governmental officials are better off when they identify at an early stage the potential risk that state or locally derived fiscal malaise can become the catalyst of contagion impacting interrelated units of government, especially when weakened by economic or fiscal weaknesses of their own. Cautious investors might want to either avoid or seek risk premium penalties to compensate them for the potential threats. This treatise is intended to provide an overview of the potential threat posed by cluster risk which is often overlooked until problems become advanced and obvious. The quantitative ranking model that was used in this study produced results that appear consistent with observable geographical concentrations of fiscal weakness. Nonetheless, it is intended to be a starting point for further analysis to fine tune risk assessment as well as a catalyst to promote discussion that contributes to common sense approaches for governmental entities to work together to solve their shared problems and challenges. June 30, 2016