Embed Size (px)
Citation preview

CREDIT, CAPITAL AND COMMUNITIES: THE IMPLICATIONS OF THE CHANGING MORTGAGE BANKING
INDUSTRY FOR COMMUNITY BASED ORGANIZATIONS
JOINT CENTER FOR HOUSING STUDIES
HARVARD UNIVERSITY
March 9, 2004

Credit, Capital and Communities: The Implications of the Changing Mortgage Banking Industry for Community Based Organizations Prepared for The Ford Foundation by William Apgar, Allegra Calder, Gary Fauth and the staff of the Joint Center for Housing Studies of Harvard University. Special thanks to Dawn Patric for managing the enhanced HMDA database. © 2004 President and Fellows of Harvard College. All rights reserved. Short sections of text, not to exceed two paragraphs, may be quoted without explicit permission provided that full credit, including © notice, is given to the source. Any opinions expressed do not necessarily represent the views of Harvard University, the Ford Foundation, or of any of the persons or organizations providing support to the Joint Center for Housing Studies. ACKNOWLEDGEMENTS This study was funded by a Ford Foundation grant to Harvard’s Joint Center for Housing Studies. The Joint Center and Center Director, Nicolas Retsinas, gratefully acknowledge the guidance and support of Frank DeGiovanni and George McCarthy of the Ford Foundation, and thank them for their continuing efforts on behalf of lower-income people and communities. In the spring and summer of 2003, the authors spoke with key individuals at community based development and advocacy organizations, as well as individuals involved in banking, mortgage finance, real estate and capital markets. These interviews examined the role of community based organizations (CBOs) in the context of the changing organization of the mortgage industry, the rise of subprime lending, and the resulting changes in the provision of credit to lower-income borrowers, and were invaluable to the success of the project. We would also like to acknowledge the study Advisory Committee established by the Joint Center that provided helpful comments at each stage of the project. The Advisory Committee included senior officials from bank regulatory agencies, as well as nationally recognized experts drawn from the housing and mortgage finance industries, and national and local non-profit community development and advocacy organizations. A list of Advisory Committee members is included in the Appendix. Joint Center for Housing Studies of Harvard University 1033 Massachusetts Avenue 5th Floor Cambridge, MA 02138 617.495.7908 617.496.9957 F www.jchs.harvard.edu

TABLE OF CONTENTS
INTRODUCTION AND SUMMARY .............................................................................................1 Principal Findings.......................................................................................................................................... 3 SECTION 1: NEW TECHNOLOGY DRIVES MORTGAGE INDUSTRY RESTRUCTURING .....9 Structural Shifts Have Occurred Over the Last Two Decades...................................................................... 9 Consolidation Reshapes the Mortgage Banking Industry........................................................................... 11 New Origination System Facilitates Industry Consolidation and Growth.................................................... 15 New Industry Structure Fosters Intense Competition ................................................................................. 18 Changing Industry Promotes Dramatic Growth in Lending......................................................................... 20 The Dual Market in Mortgage Lending........................................................................................................ 22 A Prime Lending Gap Exists in Minority Neighborhoods ............................................................................ 24 SECTION 2: INDUSTRY STRUCTURE PERPETUATES DUAL MARKET .............................27 Misaligned Incentives Inefficiently Allocate Credit ...................................................................................... 28 Many Borrowers Have Limited Capacity to Shop ....................................................................................... 32 Racial Disparities in Mortgage Lending Persist .......................................................................................... 36 Racial Disparities are Particularly Pronounced in the Subprime Market .................................................... 39 Detailed Studies Confirm Simple HMDA Findings...................................................................................... 41 Capital Markets Fail to Correct Pricing Disparity ........................................................................................ 42 Is There an Effective Demand Side Check?............................................................................................... 44 SECTION 3: ECONOMETRIC ANALYSIS CONFIRMS THE PERSISTENCE OF DISCRIMINATION IN MORTGAGE MARKETS ........................................................................48 The Joint Center Enhanced HMDA Data Base .......................................................................................... 48 Assessing the Prime Mortgage Gap ........................................................................................................... 50 Regression Results ..................................................................................................................................... 53 Other Factors Influence the Prime Lending Gap ........................................................................................ 58 SECTION 4: CHANGES IN THE MORTGAGE INDUSTRY CHALLENGE THE ACTIVITIES OF COMMUNITY BASED ORGANIZATIONS ................................................................................61 The Historical Role of Community Based Organizations............................................................................ 61 Adverse Consequences of the Dual Market Structure................................................................................ 63 Growth of Mortgage Giants Blunts CBO Advocacy .................................................................................... 70 Conclusion .................................................................................................................................................. 76 SECTION 5: CBOs MUST WORK TO IMPROVE THEIR COMMUNITY LOAN PROGRAMS......77 NHSC Adapts to a Changing Market Environment..................................................................................... 78 Retooling Community Loan Programs ........................................................................................................ 80 Creating New Sources of Fee Income........................................................................................................ 85 Conclusion .................................................................................................................................................. 87 SECTION 6: NEW ROLES PRESENT CBOs WITH NEW OPPORTUNITIES .........................88 Helping Homebuyers Get the Best Mortgage Available ............................................................................. 88 New Focus on Foreclosure Avoidance ....................................................................................................... 94 New Approaches to CBO Advocacy ........................................................................................................... 98 Conclusion ................................................................................................................................................ 103 BIBLIOGRAPHY ......................................................................................................................104 SECTION 6: APPENDIX ......................................................................................................... 109 ADVISORY COMMITTEE MEMBERS .....................................................................................114 ORGANIZATIONS AND INDIVIDUALS INTERVIEWED .........................................................115

INTRODUCTION AND SUMMARY
Today’s mortgage market bears little resemblance to the one that existed just a decade ago. Key
changes include the increasing use of automated underwriting, credit scoring, and risk based
pricing, as well as the development of a mortgage delivery system dominated by mortgage
brokers, secondary market activities and national mortgage banking and mortgage servicing
operations. With new low downpayment products and a highly automated mortgage delivery
system, the mortgage industry -- often operating through a network of mortgage brokers -- has
dramatically expanded lending in the same low-income, low-wealth and minority neighborhoods
that were once victimized by mortgage “redlining.”
Yet despite the expansion of lending to previously underserved communities, the changing
structure of the mortgage industry poses a set of challenging public policy problems. In most
instances the new mortgage delivery system has expanded access to prime mortgages on
favorable terms, yet all too often lower-income and minority communities are served by a
distinctly different set of organizations offering a distinctively different mix of products. As a
result of this dual market structure, many lower-income consumers suffer the consequences of a
broker-led “push marketing” system that encourages unsuspecting borrowers to take on
mortgage debt that they cannot afford and may not even need. In addition, some borrowers are
“pushed” into accepting a ‘higher-cost” subprime mortgage, even though they have a credit
history, income, or other factors that would enable them to qualify them for a “lower- cost”
prime loan.
These disturbing trends raise questions about the ability of current consumer protection
legislation to actually protect consumers from abusive lending. Consumer protection regulations
generally focus on ensuring that the loan information provided by the mortgage broker to the
borrower was “fair and accurate,” that the appraised value of the home was a fair representation
of current market value, and that the terms and cost of the loan were provided in advance of
closing for the borrower to review. Under the doctrine of “let the buyer beware,” however, there
are no requirements that a mortgage broker offer the best price available in the marketplace.
Credit, Capital and Communities: The Implications of the Changing Mortgage Banking Industry for Community Based Organizations
2
Potential borrowers are often not up to the challenge of protecting their own interests in the
mortgage marketplace. Available survey research suggests that many consumers do not shop
around for mortgages, and instead rely on brokers to provide them with information. Moreover,
given the complexity of current mortgage products, even the most sophisticated borrower will
find it difficult to evaluate the details of the mortgage. In short, despite all the technological
innovation, today’s mortgage market falls short of the competitive ideal where buyers and sellers
have ready access to information about product terms and pricing. The result is a misallocation
and mispricing of mortgage capital. And in extreme cases, the current mortgage structure fosters
elevated levels of mortgage foreclosures that threaten the stability of the already weak
neighborhoods.
Clearly, these shifts pose new challenges to community based organizations (CBOs)1 as they
seek to promote home homeownership opportunities and revitalize communities. In particular,
some CBOs have refocused their advocacy efforts to increase access to prime conventional home
loans for lower-income people and communities. Others have restructured their community
lending programs and partnered with private sector mortgage companies to establish new
automated mortgage lending, brokerage, or loan servicing operations, or created their own state
of the art mortgage lending, brokerage and servicing systems. Still other nascent approaches,
such as efforts to combat abusive lending practices, increase the effectiveness of homeownership
counseling or expand foreclosure avoidance initiatives, are also promising.
Unfortunately, most community groups have not fully digested the enormity of the changes that
have occurred in the mortgage banking industry and have failed to make the necessary
adjustments. Many CBOs understand the significance of the changing market environment, but
lack the resources and organizational capacity to respond effectively.
Recognizing the fact that many CBOs continue to do business as they have for decades, this
report examines factors that limit the willingness and ability of CBOs to adapt to the changing 1 In this paper community based organizations (CBOs) are broadly defined as non-profit providers of housing services, homebuyer counseling, and mortgage finance, as well as non-profit housing advocacy organizations. As used here, CBOs range from relatively small Neighborhood Housing Services organizations operating in a single neighborhood, to larger Community Development Financial Institutions (CDFIs) that may operate on a regional or even national basis.
Introduction and Summary
3
market environment. The challenge faced by CBOs -- along with their public, private and
philanthropic partners -- is to identify how best to build on the considerable strength that comes
from their historical standing in some the nation’s most disadvantaged communities. But local
knowledge is not enough. It will take a concerted effort to enable a larger number of CBOs to
reposition their efforts to promote and preserve homeownership in the constantly evolving world
of mortgage banking.
Principal Findings This report builds on the Joint Center’s previous work on the Community Reinvestment Act.2 It
considers the implications of the transformed world of mortgage and financial services provision
and proposes strategies for CBOs and others with an interest in revitalizing underserved
communities. Analysis of Home Mortgage Disclosure Data for the 1993 to 2001 period helped
untangle some of the implications, particularly for borrowers and neighborhoods, of the changed
landscape. In addition to the quantitative analysis, interviews with key individuals at community
based development and advocacy organizations, as well as individuals involved in banking,
mortgage finance, real estate and capital markets were conducted to test our findings, expand our
knowledge and explore solutions. Principal findings include:
New Technology Drives Mortgage Industry Restructuring. The advent of automated
underwriting, credit scoring and risk based pricing, as well as the growing importance of
mortgage brokers, national scale mortgage banking organization, and expanded secondary
mortgage markets produced what some have labeled a “revolution in mortgage finance.”
Moreover, by increasing the capacity of the newly automated mortgage origination system to
reach out to diverse segments of the market, mortgage brokers have enabled wholesale lenders to
grow in scale. The result is a dramatically altered mortgage banking landscape dominated by a
handful of financial services giants.
• In 2002, the top 25 mortgage originators accounted for 78 percent of the $2.5 trillion in
loans originated that year. As recently as the 1990s, the top 25 accounted for only 28
percent of originations. And, consolidation has also been an important feature of the
2 Joint Center for Housing Studies, 2002.

Credit, Capital and Communities: The Implications of the Changing Mortgage Banking Industry for Community Based Organizations
4
subprime market. In 2002, the top 25 subprime lenders, along with their affiliated brokers
and correspondents, accounted for over 88 percent of the $213 billion in total subprime
volume.
• In 2002, there were 44,000 mortgage brokerage firms -- almost double the number of
firms that were operating in 1995 and up markedly from the estimated 7,000 firms that
operated in 1987. Brokers are most prevalent in the subprime market, accounting for
44.7 percent of originations in 2002. This compares to a 29.5 percent share in the prime
market.
• Aided by a strong economy and favorable interest rates, the new mortgage origination
system facilitated a surge of lending to previously hard to serve segments of the market.
The number of home purchase loans to low-income borrowers and/or low-income
communities increased by 80.4 percent from 742 thousand in 1993 to 1.3 million in 2001.
This far exceeded the 48 percent growth in home purchase lending overall.3 By enabling
thousands of credit impaired and often lower-income families to purchase a home of their
own, these trends pushed the homeownership rate to record levels.
Industry Structure Perpetuates a Dual Market System. Despite substantial competition
on the “supply-side” of the marketplace, today’s mortgage market fails to achieve what
economists term “allocational efficiency,” in that similarly situated borrowers pay different
prices to obtain a mortgage of given characteristics and terms. Central to this inefficiency is a
market failure linked to “principal agent risk”4 that results from the fact that brokers and
correspondent lenders have different incentives than the wholesale lenders that fund the
mortgage. Having no long term interest in the performance of the loan, a broker’s incentive is to
close the loan while charging the highest combination of fees and mortgage interest rates the
market will bear. Unless checked by applicable regulations and/or the ability of the consumers
3 These figures are based on Home Mortgage Disclosure Act data that define lower-income borrowers as having incomes below 80 percent of area median income (AMI) in 1990. Lower-income neighborhoods have an income of less than 80 percent AMI as of 1990. 4 Principal agent risk is the risk that the agent will not act in the best interest of the principal, who must ultimately live with the consequences of the agent’s decision.

Introduction and Summary
5
to shop for the best mortgage available in the market place, the mispricing of loans, along with
other abusive practices, go unchecked in the market. The results are problematic.
• Many borrowers do not seek out loans, but rather are sold loans after extensive outreach
or marketing by brokers. Available survey data suggest5 that these “push marketing”
techniques often leave borrowers with mortgage loans that are overpriced and/or contain
abusive features. In the extreme case, “push marketing” can saddle borrowers with debt
that they are unable to repay; a situation which will lead to foreclosure and a loss of
whatever equity the borrower may have had in the home.
• The bewildering array of mortgage products combined with the various available
combinations of points and fees and aggressive marketing tactics with “too good to be
true” offers can make shopping for a mortgage an overwhelming process for even the
most sophisticated borrower. Indeed, the lack of readily available data on the price of
alternative mortgage products puts the consumer at a distinct disadvantage in negotiating
with a mortgage broker who has ready access to this information.
• The growing use of mortgage brokers, the lack of effective regulatory oversight the lack
of readily available mortgage pricing data have combined to reinforce a dual market
where some borrowers pay more for mortgage credit and/or receive less favorable
treatment (or even abusive treatment) than other similarly situated and equally
creditworthy borrowers.
A Prime Lending Gap Exists in Minority Neighborhoods. Despite the overall increase
in access to mortgage capital, a racial gap persists in the ability of minorities to secure prime
loans, even after controlling for income. It is disturbing that more than three decades after the
enactment of fair lending legislation, fundamental disparities in minority access to mortgage
capital remain. Many products targeted to lower-income and/or credit impaired borrowers
typically have higher interest rates and less favorable terms than the conventional prime loans
that serve the mainstream market.
5 See Kim Sung and Hermanson, 2003.
Credit, Capital and Communities: The Implications of the Changing Mortgage Banking Industry for Community Based Organizations
6
• For African Americans with incomes in excess of 120 percent of area median income
living in predominately African American and high-income neighborhoods, prime loans
accounted for only 70.8 percent of home refinance borrowing in 2001. In contrast, the
figure was 83.1 percent for lower-income white borrowers living in largely white, lower-
income communities.
• Both simple descriptive statistics and more complex econometric analysis completed for
this report confirm that while many legitimate risk factors contribute to the relatively low
share of prime conventional loans going to African American and Hispanic borrowers
and neighborhoods, race and ethnicity continue to be an important factor in determining
the allocation of prime mortgage credit.
Changes in the Mortgage Industry Challenge CBO Activities. CBOs have long worked
to expand access mortgage capital, but growth of the dual market and the associated rise in
subprime lending undermines the effectiveness of many community based loan programs, as
well as CBO homeowner education and counseling efforts. Moreover, abusive subprime lending
has contributed to a rapid rise in mortgage foreclosures, particularly in the low-income and low-
wealth communities where these loans tend to be concentrated.
• Once the “only game in town,” community loan programs now face stiff competition
from aggressively marketed, higher-cost subprime loans originated with the latest
technology to quickly respond to a customer’s request for a home loan. Perhaps most
telling, by continuing to deploy antiquated manual systems and lacking the economies to
scale needed to reduce programmatic costs, subsidies that could go to reduce the
mortgage rates or otherwise benefit needy borrowers instead are being diverted to cover
the costs of inefficiently run, small-scale community loan programs.
• The current mortgage market, specifically the growth of broker-led push marketing and
the limited capacity of borrowers to shop for a mortgage, presents new challenges to
CBO education and counseling efforts. Program graduates often gain valuable
information concerning the mortgage lending process, but too often lack the detailed
Introduction and Summary
7
information needed to evaluate which mortgage product best serves their needs.
Managers of CBO educational and counseling programs interviewed for this study
lamented that program graduates were frequently won over by the marketing pitches of
“high cost” subprime lenders.
• The growth of higher risk subprime lending has spawned a substantial increase in
foreclosures in lower-income communities. Best available data suggest that in 2002,
subprime loans had a serious delinquency rate6 of 10.44 percent, nearly 20 times higher
than the rate for prime conventional loans.
CBOs Must Work To Improve Their Mortgage Lending Activities. In this dual market,
some borrowers pay more for mortgage credit and/or receive less favorable treatment (or even
abusive treatment) than other similarly situated and equally creditworthy borrowers. As a result,
borrowers that lack the information, willingness or capacity to shop for mortgage credit,
particularly those with lower credit quality and/or those attempting to purchase homes in riskier
neighborhoods, remain vulnerable to overpaying for mortgages or not receiving the best terms
for which they could qualify.
• Although total CBO direct lending each year numbers in the tens of thousands of loans in
a mortgage industry that counts loans in the millions, CBOs can continue to play an
important role as mortgage market innovators. Mirroring the activities of the best run
small mortgage companies, some community loan programs are adapting new technology
– including automated underwriting software – to improve the overall efficiency of their
mortgage origination and mortgage servicing operations. Recognizing that many of the
borrowers they seek to reach pose unique underwriting challenges, expanded use of
technology can help CBOs save money on the routine aspects of their business operations
and enable them to focus even greater attention on hard to serve customers.
• In deciding how best to utilize new technology, CBOs face what public management
experts term the “make or buy” decision. In particular, CBOs must determine which
6 A serious delinquency is defined as a loan that is in foreclosure and/or with a payment 90 days or more late.
Credit, Capital and Communities: The Implications of the Changing Mortgage Banking Industry for Community Based Organizations
8
elements of their mortgage origination business they will conduct “in house,” (make) and
which they will contract out to others (buy). Increasingly CBOs are contracting out
servicing and other portions of their operations, and in doing so gain both efficiency of
operations and increased capacity to focus their managerial talent in areas where they
have significant comparative advantage.
• Some CBOs are attempting to generate fee income by selling mortgage originations and
servicing services to others. This is part of a larger effort to examine the extent that
CBOs can supplement their income by operating a range of mortgage and real estate
related businesses from construction finance, real estate and mortgage brokerage to
selling off some of their excess capacity to originate and service mortgage loans.
New Roles Present CBOs with New Opportunities. CBOs have long been central to
efforts to expand access to mortgage capital, but the dual market structure poses serious
challenges and threatens to undermine over three decades of community revitalization efforts.
CBOs must consider new roles to help preserve the gains achieved.
• To improve the ability of borrowers to protect themselves from the excessive fees and
abusive practices of “push marketers,” CBOs could produce a “home mortgage pricing
guide” that would educate borrowers about the range of rates they should expect based on
their credit and past payment characteristics.
• The creation of a system of “buyer’s brokers” would help potential borrowers identify the
best loans for them and would begin to address the current asymmetry of information
through the provision of information on terms and pricing. Unlike a mortgage broker,
these “buyer’s brokers” would work on behalf of the borrower.
• CBOs must also rethink their approach to advocacy. As a result of the changing
mortgage market, CBOs must form new partnerships and identify new points of leverage
if they are to continue effectively pressure government and industry officials alike to
better address the problems that exist in today’s mortgage market.

SECTION 1: NEW TECHNOLOGY DRIVES MORTGAGE INDUSTRY RESTRUCTURING
The advent of automated underwriting, credit scoring and risk based pricing, as well as the
growing importance of mortgage brokers, national scale mortgage banking organizations, and
expanded secondary mortgage markets produced what some have labeled a “revolution in
mortgage finance.” Aided by steady economic growth in the 1990s, and more recently by record
low mortgage interest rates, the changing structure of the mortgage industry has fostered
dramatic increases in lending to low-income people and communities. Yet these same forces
have also solidified the operations of what appears to be a dual mortgage market in mortgage
finance in which low-income and often minority borrowers are served by different lending
organizations using a different mix of loan products than is found in the mainstream market.7
This section summarizes these trends and assesses their implications for the evolution of
mortgage markets.
Structural Shifts Have Occurred Over the Last Two Decades Structural shifts within the industry have largely been driven by the declining importance of bank
deposits as a funding source for mortgages. Historically, deposit-taking institutions, such as
thrifts and commercial banks, originated the bulk of mortgages. In 1980, nearly half of all
mortgages were originated by thousands of thrifts, while commercial banks originated another 22
percent.8
During the 1980s, many deposit-taking institutions held the loans they originated. Although
mortgage insurance was an important element for Federal Housing Authority (FHA) and other
government backed loans, the private mortgage insurance industry was still in its infancy.
Moreover, underwriting standards and mortgage documents varied considerably from one
institution to another. As a result, third party investors were reluctant to purchase mortgages that
lacked standardized features and adequate credit enhancements to reduce risk.
7 For a more complete discussion of the factors influencing the growth of mortgage lending in the 1990s see Joint Center for Housing Studies, 2002. 8 U.S. Department of Housing and Urban Development, 1997.
Credit, Capital and Communities: The Implications of the Changing Mortgage Banking Industry for Community Based Organizations
10
Over the past two decades this system has changed. The availability of first FHA insurance and
then private market insurance helped to extend the reach of the mortgage market to low-income
and low wealth borrowers. The Community Reinvestment Act (CRA), passed by Congress in
1977, also encouraged banks and their affiliates to turn their attention to previously underserved
markets. Though these efforts substantially expanded access to capital, they also served to
segment the market into distinct mortgage delivery channels—with one set of channels offering a
set of products targeted to low-income and largely minority borrowers, while others were
targeted to the mainstream market.
The secondary market has also developed and matured over the last twenty years. Even as late
as 1990, less than half of all mortgages were securitized and sold into the secondary market – a
figure that was bolstered by the fact that at that point Ginnie Mae was securitizing virtually 100
percent of all FHA loans. 9 Today, nearly 70 percent of all home mortgages are securitized and
sold into the secondary market, due largely to the growing presence of Fannie Mae and Freddie
Mac in the marketplace. The ability to package and sell loans to the secondary market reduced
the need to hold deposits (or other sources of cash) to fund mortgage loans. The government
sponsored enterprises, Fannie Mae and Freddie Mac, along with private mortgage conduits
mandated standardization of loan contracts and thus streamlined and rationalized mortgage
markets -- helping to foster an increasingly efficient mortgage delivery system.10
The growth of subprime lending11 was also supported in large measure by funds generated in the
secondary market. Prior to the 1990s, subprime mortgages were primarily offered by large
finance companies and funded with secured and unsecured debt. As recently as 1994, less than
one third of subprime volume ($11 billion) was securitized. As subprime lending grew, so too
9 Inside Mortgage Finance, 2003. 10See Kendall and Fishman, 1996 especially the chapter by Lewis S. Renieri, “The Origins of Securitization, Sources of Its Growth, and Its Future Potential,” pp 17-30. 11 This report uses two primary sources of data on subprime lending. The first source, Inside Mortgage Finance, 2003 gathers data from a large representative sample of mortgage companies. Later portions of this report present loan-level Home Mortgage Disclosure Act (HMDA) data on subprime loans. While HMDA does not label the loan type directly, The U.S. Department of Housing and Urban Development (HUD) supplies a list of each lender’s ‘specialization’ in prime, subprime, or manufactured home lending. Government-backed loans are reported in HMDA, and are defined here as loans made by prime lending specialists that are insured or guaranteed by the Federal Housing Administration (FHA), the USDA’s Rural Housing Service, or the Veterans Administration. For a brief description of the HUD methodology see Scheessele, 2002.
Section 1: New Technology Drives Mortgage Industry Restructuring
11
did the securitization of subprime loans. By 2002, 62.2 percent ($133 billion) of total subprime
originations were securitized.12 The growing issuance of subprime mortgage-backed securities
was primarily accomplished by a handful of large mortgage banking operations and Wall Street
firms. Recently, Fannie Mae and Freddie Mac have extended the reach of their secondary
market purchases to include a growing share of ‘Alt A’ and ‘A-’ loans.
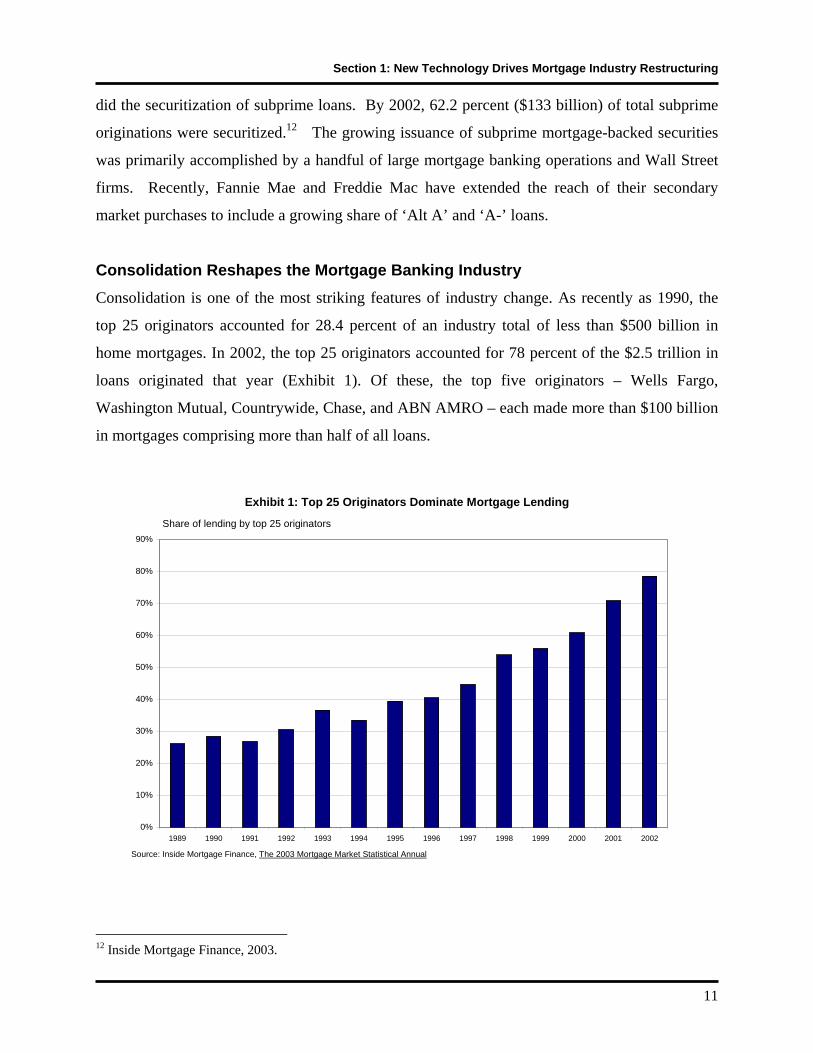
Consolidation Reshapes the Mortgage Banking Industry Consolidation is one of the most striking features of industry change. As recently as 1990, the
top 25 originators accounted for 28.4 percent of an industry total of less than $500 billion in
home mortgages. In 2002, the top 25 originators accounted for 78 percent of the $2.5 trillion in
loans originated that year (Exhibit 1). Of these, the top five originators – Wells Fargo,
Washington Mutual, Countrywide, Chase, and ABN AMRO – each made more than $100 billion
in mortgages comprising more than half of all loans.
Exhibit 1: Top 25 Originators Dominate Mortgage Lending
0%
10%
20%
30%
40%
50%
60%
70%
80%
90%
1989 1990 1991 1992 1993 1994 1995 1996 1997 1998 1999 2000 2001 2002
Share of lending by top 25 originators
Source: Inside Mortgage Finance, The 2003 Mortgage Market Statistical Annual
12 Inside Mortgage Finance, 2003.
Credit, Capital and Communities: The Implications of the Changing Mortgage Banking Industry for Community Based Organizations
12
Regulatory changes supported the consolidation of the financial services industry as the 1980s
saw most state-level restrictions on intrastate banking relaxed or removed. 13 At the federal
level, interstate banking became a reality in the 1990s. Banks could now expand beyond
boundaries that had been in place since the Depression, and larger organizations increased the
scale and scope of their operations through mergers and acquisitions. Many large banks took
advantage of regulatory changes and consolidated retail banking operations within and across
individual metropolitan areas. Growth of both regional and national banking operations reflected
a desire of the larger banks to capitalize on potential economies to scale and name recognition, as
well as to reduce risk by diversifying across spatially distinct markets. 14
Lacking the economies to scale to compete in an increasingly automated business, many smaller
banks and thrifts abandoned their mortgage origination activities entirely. At the same time,
several large independent mortgage and finance companies continued to compete head to head
with banking organizations in mortgage markets across the country. The largest, Countrywide
Financial, made more than $250 billion in home purchase loans in 2002. But many other
independent mortgage banking operations have either failed to grow over the past decade, or
merged with or were acquired by a large banking operation. This latter category includes North
American Mortgage that was acquired by Dime Savings Bank and Norwest Mortgage that
merged with Wells Fargo.
As is true for the broader mortgage industry, consolidation has been a particularly important
feature of the subprime lending industry. Though variation in the definition of what constitutes a
“subprime mortgage” hinders precise measurement, according to one widely utilized mortgage
industry source, subprime loan originations increased from $35 billion in 1994 to $213 billion in
2002. In 2002, the top 25 subprime lenders, along with their affiliated brokers and
correspondents, accounted for over 88 percent of total subprime volume while the top five
accounted for nearly 40 percent of total volume. Compare this to 1996 when the top 25
subprime lenders claimed only a 47 percent share and the top 5 only 20 percent.15 Top ten
13 For a more complete discussion of trends in federal regulation of the banking and mortgage banking industries see Joint Center for Housing Studies, 2002, particularly Section 2. 14 Avery et. al., 1999. 15 Inside Mortgage Finance, 2003.
Section 1: New Technology Drives Mortgage Industry Restructuring
13
players now include major prime lenders such as Washington Mutual, CitiFinancial,
Countrywide and Wells Fargo.
While readily available mortgage industry statistics present a global overview on industry
consolidation, Home Mortgage Disclosure Act (HMDA) data permit a more detailed analysis of
the trends in size distribution of mortgage lenders. Before proceeding, it is important to note
important differences between HMDA data and the industry data presented earlier. For example,
HMDA data distinguish between correspondent lenders and brokers when identifying the
originator of a mortgage loan. Correspondent lenders initially fund loans under their own name
before selling the loan to a larger mortgage banking operation, while brokers typically identify
customers and collect the underwriting information, which is then forwarded on to a mortgage
banker who directly funds the loan. The industry statistics presented earlier combine lending
activity of correspondent lenders and brokers under the name of the mortgage bank that
coordinates the transactions. By focusing on the initial funder of the loan, HMDA data
separately identify correspondent lenders, thus giving the appearance that the industry is
somewhat less concentrated than is suggested by industry statistics.
HMDA data do permit the disaggregation of mortgage lending activity by detailed lender, loan,
and borrower characteristics. For example, Exhibit 2 divides organizations involved in home
purchase lending into two categories: banking organizations (commercial banks and savings
associations with their mortgage and their finance company affiliates)16 and other organizations
(independent mortgage and finance companies and credit unions). Exhibit 2 indicates that
banking organizations led the growth of large organizations. By 2001, home purchase lending
for the nine largest banking organizations totaled over 1.1 million loans, and 17 banking
organizations made at least 25,000 home purchase loans. Overall, these 17 accounted for some
1.2 million of the nearly 1.4 million increase in home purchase loans that occurred from 1993 to
2001.
16 Note that because of the ability of banking organizations to shift loans from one affiliate to the next, depositories and their mortgage company affiliates are combined in this analysis.

Credit, Capital and Communities: The Implications of the Changing Mortgage Banking Industry for Community Based Organizations
14
Exhibit 2: Large Banking Organizations Dominate Recent Growth of Mortgage Lending
Banking Organizations Non CRA Regulated Organizations
Lenders Loans Lenders Loans Number of Home Purchase Loans
1993 2001 1993 2001 1993 2001 1993 2001 More than 50,000
2 9 154,607 1,170,870 2 3 150,676 362,286
25,000 to 49,999 5 8 148,371 300,397 5 1 153,290 42,860
10,000 to 24,999 20 19 290,205 341,208 10 15 150,836 217,492
1,000 to 9,999 174 123 516,206 379,336 128 172 331,762 480,636
Less than 1,000
3,807 3,408 350,434 284,502 1,606 1,975 204,742 227,334
Total 4,008 3,567 1,459,823 2,476,313 1,751 2,166 946,306 1,330,608
Source: Joint Center for Housing Studies Enhanced HMDA database.
At the other end of the spectrum, the data confirm that the number of banking organizations
originating less than 10,000 loans shrank by 11 percent between 1993 and 2001, and the number
of home purchase loans originated by this group declined by more than 23 percent. There was,
however, a noticeable increase in the number of smaller independent mortgage companies that
largely serve as correspondents to larger companies. Over the period, the number of independent
mortgage companies and credit unions making less than 10,000 home purchase loans rose 24
percent and the number of home loans made by these organizations rose 32 percent, from
537,000 to 708,000.
Consolidation has also had a significant impact on the home refinance lending market. For
example, HMDA data suggest that the 38 institutions making more than 25,000 refinance loans
in 2001 accounted for 62.3 percent of all home refinance loans, up from only 33 percent in 1993.
Again, much of the growth was concentrated among large banking institutions, and was
enhanced by the emergence of a new mortgage origination system featuring a growing network
Section 1: New Technology Drives Mortgage Industry Restructuring
15
of smaller mortgage brokers that specialize in outreach, marketing, and loan origination
activities.
New Origination System Facilitates Industry Consolidation and Growth
The growth and consolidation of the mortgage industry was aided by the creation of a highly
automated origination system. This new system was anchored by the introduction and expansion
of credit scores in mortgage lending, as well as the creation of automated underwriting systems.
New technology and marketing approaches enabled lenders to reach customers through mass
media and to interact with them via phone, fax, and internet. Lenders merged the “back office”
functions needed to originate, underwrite, and service loans and created automated regional
processing centers, leaving them less dependent on the physical location of their branches to
reach customers.
Today, loans are originated through one of three channels: retail, correspondent, or broker.
Retail activity is most akin to traditional lending where employees of a banking or mortgage
banking organization reach out to potential customers, complete a mortgage application,
underwrite and fund loans for those who meet the underwriting standards. Many retail mortgage
lending operations conduct business from branch operations, though increasingly the marketing
and even closing of loans is done by telephone or over the internet. Once funded, a retail loan
may be held in portfolio by the lender, sold to another lender, or packaged and sold to the
secondary market.
Just as technology has fostered consolidation among mortgage banking operations, it has also
enabled dramatic growth in the number of smaller mortgage brokerage and correspondent
lending firms. Correspondent lenders, for example, are typically smaller mortgage brokers,
thrifts or community banks who operate much like retail lenders in that they take applications,
underwrite and fund mortgages. While loans are funded in the name of the correspondent, they
are then sold to a larger wholesale lender under prearranged pricing and loan delivery terms, and
in compliance with established underwriting standards. Brokers, in contrast, do not fund loans,
but simply identify potential customers, process the paper work, and submit the loan application
to a wholesale lender who underwrites and funds the mortgage.

Credit, Capital and Communities: The Implications of the Changing Mortgage Banking Industry for Community Based Organizations
16
Two decades ago, retail lending dominated the business. Since then, particularly over the past
ten years, wholesale activity, which includes both correspondent and broker channels, has grown
rapidly. Concurrent with this trend has been a rise in the number of firms engaged in these
activities. In 2002, there were 44,000 mortgage brokerage firms (with some 240,000 employees)
engaged in mortgage brokerage and correspondent lending activities, almost double the number
of firms operating in 1995 and up markedly from the estimated 7,000 firms operating in 1987.17
In 2002, retail lending accounted for 40.2 percent of total origination volume, while brokers
(30.8 percent) and correspondent lenders (29 percent) accounted for the rest.18
Of course industry averages mask the enormous variation that exists across individual firms. For
example, over two-thirds of Bank of America’s $88 billion of home mortgage lending flows
through their retail channel. In contrast the retail channel accounts for less than 10 percent of
total lending for GMAC-RFC, Flagstar Bank and Greenpoint Financial. Even among large
wholesale lending operations, there is considerable variation in channel mix. For example,
brokers constitute the largest component of ABN AMRO’s wholesale activity, while Principal
Residential Mortgage operates primarily through correspondent lenders (Exhibit 3).
17 Wholesale Access Mortgage Research and Consulting. 2003. “Mortgage Brokers 2002,” Press Release, August 13. Available at http://www.wholesaleaccess.com/8.6.03.mb.shtml. 18 Estimates from Inside Mortgage Finance, 2003. These figures closely approximate data presented in 2002 Mortgage Industry Directory, a publication of the National Mortgage News. They estimated that in the first quarter of 2002, the retail channel accounted for only 39.7 percent of all lending, with the broker and correspondent share totaling 29.9 and 30.4 percent respectively.

Section 1: New Technology Drives Mortgage Industry Restructuring
17
Exhibit 3: Channel Mix Varies by Lender
Total 2002 Originations
(Billions)
Retail Share
(%) Wholesale Share (%)
Broker (%)
Correspondent (%)
Wells Fargo Home Mortgage $333.0 48.6 51.4 22.5 28.9
Washington Mutual $312.0 37.5 62.5 27.5 35
Countrywide Financial $251.9 26.4 73.6 26.7 46.9
Chase Home Finance $155.7 36.2 63.8 23.3 40.5
ABN AMRO Mortgage Group $119.4 16.7 83.3 76.1 7.2
Bank Of America Mortgage $88.0 68.1 31.9 31.9 0.0
National City Mortgage Corporation $79.5 45.7 54.3 50.0 4.3
GMAC Mortgage Corporation $71.6 55.4 44.6 3.7 40.9
Cendant Mortgage Corporation $59.3 85.1 14.9 na na
GMAC-RFC $52.8 3.5 96.5 26.7 69.8
CitiMortgage Inc $52.5 42.5 57.5 23.0 34.5
Principal Residential Mortgage $46.7 12.6 87.4 20.5 66.9
Flagstar Bank $43.2 9.5 90.5 57.7 32.8
First Horizon Home Loans $34.4 54.9 45.1 33.3 11.8
GreenPoint Mortgage Funding Inc. $32.8 5.2 94.8 84.1 10.7
All Lenders $2,510.0 40.2 59.8 30.8 29.0
Source: Inside Mortgage Finance, The 2003 Mortgage Market Statistical Annual
New technology fostered the consolidation of other segments of the mortgage industry as well.
Nowhere is this trend more evident than in mortgage servicing and securitization. Having
originated a mortgage, a mortgage lender can either do in house or contract with any one of a
number Wall Street investment houses to sell their loans to Fannie Mae or Freddie Mac, and or
to securitize and sell mortgage backed securities to other investors. In addition, at the time
individual loans or mortgage backed securities are sold to third party investors, the initial funder
of the mortgage may choose to retain some portion of these securities as a long-term investment.
For example, a bank lender may originate loans, securitize them, and then immediately
repurchase some share of the resulting securities to hold in portfolio. As a result, the bank

Credit, Capital and Communities: The Implications of the Changing Mortgage Banking Industry for Community Based Organizations
18
continues to invest in mortgage assets, but is able to invest in more liquid mortgage backed
securities rather than individual loans.
Similarly at the time that the loans are securitized, the initial funder of the mortgage must also
decide whether to sell some or all of the rights to service the mortgages in question. Recognizing
that the ultimate investor in the mortgage pays a fee for mortgage servicing, this step in the
overall mortgage delivery system has emerged as a distinct line of business. Some companies,
including several large firms that specialize in subprime or other hard to service loans, prefer to
retain servicing rights. Yet third party servicing is quite common – especially for basic prime
mortgages. And, as is the case with mortgage originations in general, mortgage servicing is a
highly repetitive activity characterized by substantial economies to scale linked to the effective
application of the latest advances computer and telecommunications technology. As a result, the
mortgage servicing business is highly concentrated; the top 25 servicers held a collective market
share of nearly 62 percent in 2002, while the largest – Washington Mutual –captured over 11
percent alone.19
Although many large scale servicers are affiliates of some of the same financial services giants
that dominate mortgage originations, typically servicers operate as distinct business units within
the overall corporate structure. Interestingly, it is not necessarily the case that a servicer owned
by one corporation will service all of the loans they originate. Rather servicing rights are bought
and sold regularly depending on the going price to purchase these rights in the marketplace, the
relative efficiency of alternative servicing entities, and the applicable business strategies of the
companies involved.
New Industry Structure Fosters Intense Competition Continued technological change should further enhance the competitive advantage of larger,
national scale players leading them to dominate various segments of the new mortgage delivery
system. New automated systems require substantial upfront investments and smaller companies,
unable to afford such investments, are finding it increasingly difficult to remain competitive in
the mortgage market. At the same time, because these technologies operate at low marginal or
19 Inside Mortgage Finance, 2003.
Section 1: New Technology Drives Mortgage Industry Restructuring
19
incremental costs, there is fierce competition among the firms that remain in the market as they
seek to offer a different mix of mortgage products and delivery methods across the country.
The growth of large national scale lenders, along with their network of brokers and
correspondents and their affiliated set of mortgage servicers and investment bankers, has also
fundamentally altered the nature of competition in communities across the country. Where once
local banking institutions and a handful of larger regional players competed for market share,
today the 25 largest national lenders typically account for over half of all lending in each of the
nation’s 43,000 census tracts. As will be further explained later in this report, the growing
geographic reach of these mortgage giants results in the fact that there are more firms active in
most neighborhoods, including low-income and minority neighborhoods, than was the case as
recently as 1993.
Consider, for example, the mortgage operations of the retail banking giant Bank of America (B
of A). Two decades ago, B of A was a large regional player – active in California and selected
other, largely western, market areas. Through a combination of mergers and acquisitions –
culminating in the recent proposed merger with Fleet Financial, B of A has assembled a national
branch banking network that supports their mortgage lending operations in metropolitan areas
across the country. For example, in 2001, B of A and its affiliated organizations made mortgage
loans in over 200 of the nation’s 301 metropolitan areas examined for this report. Other national
lenders, such as Countrywide, Chase, CitiFinancial, Washington Mutual, and Wells Fargo, have
a similar nationwide reach, though each uses its own combination of delivery channels.
Finally, it should be noted that the new highly automated and segmented structure of the
mortgage delivery system poses challenges to the mortgage industry itself, particularly as
mortgage companies have come to rely on third party mortgage brokers and servicers to extend
their reach into new markets. Just as available computer and telecommunications technology has
enabled large mortgage companies to consolidate their operations into centralized processing
centers, new technology has also enabled them to more effectively manage their retail,
correspondent, and broker networks. This is especially important to quality control, as most of
the best managed companies in the business have created sophisticated software systems to
Credit, Capital and Communities: The Implications of the Changing Mortgage Banking Industry for Community Based Organizations
20
monitor the performance of their brokers and retail employees operating in distant market areas
across the country to root out potentially fraudulent behavior.
Based on an expectation of continued technological advances, the outlook is for continued
consolidation of mortgage lending activities and a growing reliance on mortgage brokers to take
loan applications. In addition, technology should encourage evolution of a wider range of
products, services and pricing, as large firms seek to identify and exploit competitive advantage
in pursuit of customers in an increasingly competitive marketplace. Today, the challenge for
regulators and community groups alike is not the absence of mortgage lending or lenders in their
communities, but to make certain that the many entities that are present behave in a responsible
manner. Providing consumers with the information and assistance needed to ensure that they get
the best mortgage for which they can qualify is a related challenge.
Changing Industry Promotes Dramatic Growth in Lending The improved ability of mortgage lenders to tap into national and international capital markets
enabled borrowers to take advantage of periods of favorable economic growth and equally
favorable mortgage interest rates. In addition, the surge in mortgage lending was the product of
supportive government policy. Even as CRA’s regulatory reach was on the decline, CRA and
expanded enforcement of fair lending regulations continued to encourage lenders to serve low-
income and minority markets. At the same time, growth in government-backed lending, and
particularly FHA insured lending, helped the mortgage industry reach emerging low-income and
minority markets. And finally, the creation of new affordable housing goals for the GSEs in the
early 1990s, along with the significant expansion of these goals later in the decade, helped
augment outreach and lending activity by Fannie Mae and Freddie Mac over the period.
In combination, these trends prompted dramatic growth in mortgage lending throughout the
1990s and into this century. HMDA data indicate that the number of loans for the purchase of
one to four family properties in metropolitan areas increased from 2.4 million in 1993 to 3.8
million in 2001, a gain of 58.2 percent. Home refinance lending, which is more sensitive to
interest rate changes, exhibited a boom/bust pattern over the same period. After reaching a
record 4.5 million refinance loans in 1993, the number declined through the mid-1990s before

Section 1: New Technology Drives Mortgage Industry Restructuring
21
hitting 4.7 million in 1998, falling back again in 1999 and 2000, only to set a new record of 5.7
million in 2001.
The recent surge in home lending was led by loans to low-income borrowers and communities.20
HMDA data show that home purchase loans to low-income borrowers and/or low-income
communities increased by 80.4 percent from 742 thousand in 1993 to 1.3 million in 2001. This
far exceeded the 48 percent growth in home purchase lending overall (Exhibit 4). As a result,
loans to low-income people and communities accounted for 35 percent of all home purchase
lending, up from 31 percent in 1993. Further, loans to these borrowers accounted for 57.4
percent of the 1.4 million-loan increase in home purchase lending between 1993 and 2001.
Exhibit 4: Loans to Low-Income People and Communities are Increasing (Thousands of Loans)
Home Purchase Refinance
Total
High-Income Markets
Low-Income Markets Total
High-Income Markets
Low-Income Markets
1993 2406 1663 743 4452 3566 886
1994 2588 1768 820 1676 1204 472
1995 2510 1704 807 1086 761 324
1996 2893 1939 954 1781 1225 555
1997 3020 2011 1009 1953 1314 639
1998 3468 2288 1179 4689 3382 1307
1999 3703 2377 1326 3039 1973 1066
2000 3669 2372 1297 1683 1011 672
2001 3807 2467 1340 5685 3996 1689
(Note: High Income Markets are defined as containing loans or borrowers that are not eligible for CRA credit. Low-Income Markets include all loans made in low-income neighborhoods (<80%AMI) and loans made to low-income borrowers living in high-income neighborhoods (>=80%AMI).
Source: Joint Center for Housing Studies Enhanced HMDA database.
20 Throughout this report low-income (or lower-income) borrowers are defined as having incomes less than 80 percent of metropolitan area median income, and low-income (or lower-income) communities are census tracts where 1990 median family income was less than 80 percent of the metropolitan area median.

Credit, Capital and Communities: The Implications of the Changing Mortgage Banking Industry for Community Based Organizations
22
Lending to low-income people and communities also rose sharply from 1993 to 1997 in the more
volatile home refinance market. In 1998, the number of loans in the low-income segment soared
to 1.3 million, only to fall back to 672 thousand by 2000. Refinancing surged once again for
low-income people and communities in 2001, reaching an all time record of 1.7 million. Yet
even this spectacular growth failed to match the nearly 3 fold increase in home mortgage
refinancing of higher-income homeowners living in higher-income communities, as record low
interest rates and a general awareness of the benefits prompted higher income borrowers to
refinance.
Strong gains in lending to minorities were made over the 1990s, although increases in the
number of HMDA loan records not reporting the race of the borrower makes precise tracking of
these trends difficult.21 From 1993 to 2001, HMDA data indicate that the number of home
purchase loans made to African American borrowers increased by 93 percent, while for Hispanic
borrowers it increased by 159 percent. In contrast, home purchase lending to white borrowers
increased by just 29 percent. Minorities also posted strong gains in home refinancing with their
share of overall refinance loans climbing from 13 percent in 1993 to 19 percent in 2001.
The Dual Market in Mortgage Lending The steady growth in lending to lower-income people and communities, and especially
minorities, was one of the most significant accomplishments of the 1990s. Over this period new
technologies, such as automated underwriting and credit scoring systems, enabled lenders to
better evaluate risk. This produced mortgages with lower downpayment requirements for
creditworthy but low-income or low-wealth borrowers and higher priced loans for borrowers
with less than perfect credit histories.22 In addition, subprime, government-backed, and
manufactured home loans were increasingly offered. Though these alternatives tend to be more
expensive and less flexible than prime loans, they are often the best choice available for
borrowers with less than perfect credit histories.
21 Over the period 1993 to 2001, the number of home purchase loans with race missing increased by nearly 400,000 to 459,000. For home refinance loans, the increase was from 189 thousand to 1.06 million. In 2001, no information on borrower race was present in the HMDA files for some 12.1 percent of all home purchase loans, and 18.6 percent of all home refinance loans. 22 For a more complete discussion of the factors influencing the growth of mortgage lending in the 1990s see Joint Center for Housing Studies, 2002.

Section 1: New Technology Drives Mortgage Industry Restructuring
23
While the prime conventional mortgage market continues to be the dominant source of mortgage
capital for most market segments, an increasing share of low-income and minority borrowers
now obtain mortgages through the aforementioned alternative channels. By 2001, subprime
lenders accounted for over 6 percent of all home purchase lending, up from just 1 percent in
1993. For lower-income households living in lower-income communities, the subprime share
topped 10 percent. For the same population, subprime refinance loans accounted for a striking 27
percent of home refinance loans, a more than four fold increase in market share over the period
from 1993 to 2001.
Manufactured home loans also grew notably during the 1990s, as did sales of manufactured
homes. Almost half of all manufactured homes are placed on rented land and financed with
personal – as opposed to real estate – loans. As a result, many manufactured home loans feature
rates that are from two to five percentage points higher than those on conventional prime real
estate loans.23 Government-backed loans, particularly those insured by the FHA, also have
somewhat higher interest rates. Over the 1993 to 2001 period, government-backed loans
accounted for between 10 and 14 percent of all home purchase loans.24
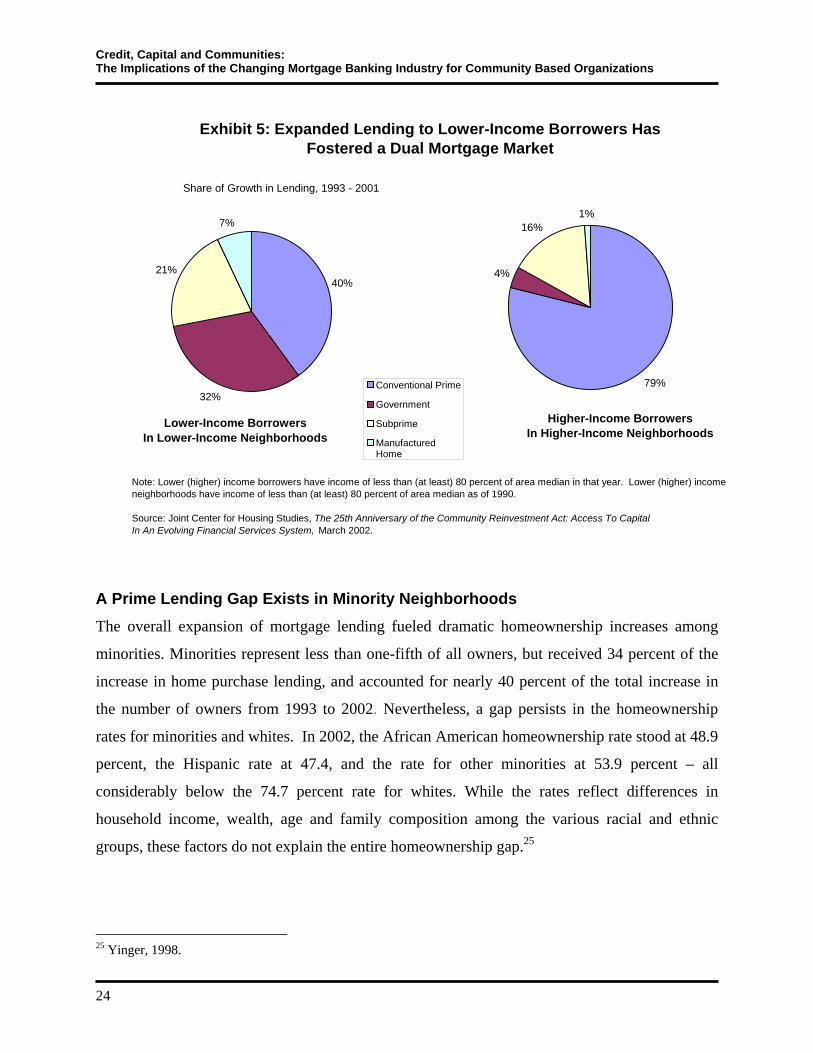
Collectively, these alternative loan types were a major contributor to the overall growth of home
lending. Over the 1993 to 2001 period, government-backed, subprime, and manufactured home
lending accounted for nearly one third of the 1.4 million overall increase in the number of home
purchase loans. Prime loans to lower-income borrowers in lower-income communities
accounted for only about 40 percent of all growth in home purchase lending (Exhibit 5). This
contrasts significantly with higher-income borrowers in higher-income communities where
prime loans accounted for almost 80 percent of all home purchase lending growth over the
period.
23 Vermeer and Louie, 1996. See also Collins, Carliner, and Crowe, 2002. 24 Government-backed loans may also be guaranteed by the US Department of Agriculture’s Rural Housing Service or the Veteran’s Administration.
Credit, Capital and Communities: The Implications of the Changing Mortgage Banking Industry for Community Based Organizations
24
Exhibit 5: Expanded Lending to Lower-Income Borrowers Has Fostered a Dual Mortgage Market
40%
32%
21%
7%
Conventional Prime
Government
Subprime
ManufacturedHome
79%
4%
16%1%
Lower-Income BorrowersIn Lower-Income Neighborhoods
Higher-Income BorrowersIn Higher-Income Neighborhoods
Note: Lower (higher) income borrowers have income of less than (at least) 80 percent of area median in that year. Lower (higher) income neighborhoods have income of less than (at least) 80 percent of area median as of 1990.
Source: Joint Center for Housing Studies, The 25th Anniversary of the Community Reinvestment Act: Access To Capital In An Evolving Financial Services System, March 2002.
Share of Growth in Lending, 1993 - 2001
A Prime Lending Gap Exists in Minority Neighborhoods The overall expansion of mortgage lending fueled dramatic homeownership increases among
minorities. Minorities represent less than one-fifth of all owners, but received 34 percent of the
increase in home purchase lending, and accounted for nearly 40 percent of the total increase in
the number of owners from 1993 to 2002. Nevertheless, a gap persists in the homeownership
rates for minorities and whites. In 2002, the African American homeownership rate stood at 48.9
percent, the Hispanic rate at 47.4, and the rate for other minorities at 53.9 percent – all
considerably below the 74.7 percent rate for whites. While the rates reflect differences in
household income, wealth, age and family composition among the various racial and ethnic
groups, these factors do not explain the entire homeownership gap.25
25 Yinger, 1998.
Section 1: New Technology Drives Mortgage Industry Restructuring
25
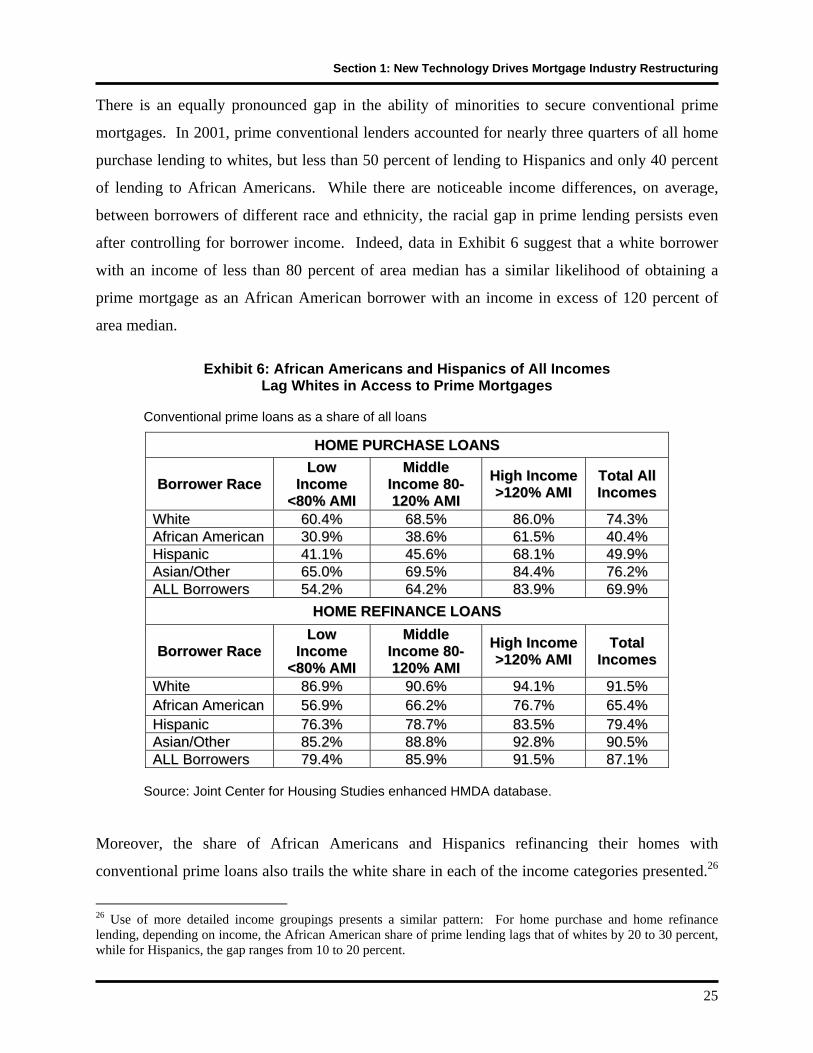
There is an equally pronounced gap in the ability of minorities to secure conventional prime
mortgages. In 2001, prime conventional lenders accounted for nearly three quarters of all home
purchase lending to whites, but less than 50 percent of lending to Hispanics and only 40 percent
of lending to African Americans. While there are noticeable income differences, on average,
between borrowers of different race and ethnicity, the racial gap in prime lending persists even
after controlling for borrower income. Indeed, data in Exhibit 6 suggest that a white borrower
with an income of less than 80 percent of area median has a similar likelihood of obtaining a
prime mortgage as an African American borrower with an income in excess of 120 percent of
area median.
Exhibit 6: African Americans and Hispanics of All Incomes
Lag Whites in Access to Prime Mortgages Conventional prime loans as a share of all loans
HHOOMMEE PPUURRCCHHAASSEE LLOOAANNSS
BBoorrrroowweerr RRaaccee LLooww
IInnccoommee <<8800%% AAMMII
MMiiddddllee IInnccoommee 8800--112200%% AAMMII
HHiigghh IInnccoommee >>112200%% AAMMII
TToottaall AAllll IInnccoommeess
WWhhiittee 6600..44%% 6688..55%% 8866..00%% 7744..33%% AAffrriiccaann AAmmeerriiccaann 3300..99%% 3388..66%% 6611..55%% 4400..44%% HHiissppaanniicc 4411..11%% 4455..66%% 6688..11%% 4499..99%% AAssiiaann//OOtthheerr 6655..00%% 6699..55%% 8844..44%% 7766..22%% AALLLL BBoorrrroowweerrss 5544..22%% 6644..22%% 8833..99%% 6699..99%%
HHOOMMEE RREEFFIINNAANNCCEE LLOOAANNSS
BBoorrrroowweerr RRaaccee LLooww
IInnccoommee <<8800%% AAMMII
MMiiddddllee IInnccoommee 8800--112200%% AAMMII
HHiigghh IInnccoommee >>112200%% AAMMII
TToottaall IInnccoommeess
WWhhiittee 8866..99%% 9900..66%% 9944..11%% 9911..55%% AAffrriiccaann AAmmeerriiccaann 5566..99%% 6666..22%% 7766..77%% 6655..44%% HHiissppaanniicc 7766..33%% 7788..77%% 8833..55%% 7799..44%% AAssiiaann//OOtthheerr 8855..22%% 8888..88%% 9922..88%% 9900..55%% AALLLL BBoorrrroowweerrss 7799..44%% 8855..99%% 9911..55%% 8877..11%%
Source: Joint Center for Housing Studies enhanced HMDA database.
Moreover, the share of African Americans and Hispanics refinancing their homes with
conventional prime loans also trails the white share in each of the income categories presented.26
26 Use of more detailed income groupings presents a similar pattern: For home purchase and home refinance lending, depending on income, the African American share of prime lending lags that of whites by 20 to 30 percent, while for Hispanics, the gap ranges from 10 to 20 percent.

Credit, Capital and Communities: The Implications of the Changing Mortgage Banking Industry for Community Based Organizations
26
This is despite the fact that refinance lending is generally considered to be less risky than home
purchase lending because loan to value ratios tend to be lower and lenders can review the
payment history on the current loan to determine whether to extend new financing.
Observed differences in the prime loan share of total lending by race and income cannot be taken
as proof of discriminatory practices in mortgage markets. At a minimum, the simple results
presented here do not control for many of the objective factors (excluding race) that lenders use
to determine whether a particular individual qualifies for a particular type of loan. Such
discrepancies, however, do prompt some housing advocates to claim that the rise of alternative
mortgage products has resulted in a new, and subtler, form of discrimination based on race and
ethnicity in mortgage markets that nevertheless has a disparate, and largely unfavorable, impact
on minority borrowers and communities.
SECTION 2: INDUSTRY STRUCTURE PERPETUATES DUAL MARKET
Today thousands of mortgage banking operations compete to offer products to millions of
potential borrowers. Indeed, by several measures the market is more competitive today than two
decades ago, at least as measured by the number of firms originating loans in any given market
area or community. While many smaller thrifts and savings institutions have shut down their
mortgage lending operations, they have been replaced by well-capitalized financial services
giants with access to low-cost mortgage funds through an increasingly sophisticated secondary
mortgage market. Aided by the outreach efforts of thousands of mortgage brokers and
correspondent lenders, these giants have reached every corner of the market, including lower-
income and minority communities. Yet despite substantial competition on the “supply-side” of
the marketplace, a dual market persists.
Today, some borrowers pay more for mortgage credit and/or receive less favorable treatment (or
even abusive treatment) than other similarly situated and equally creditworthy borrowers. As a
result, borrowers with the ability to understand and shop the mortgage marketplace benefit from
a range of product choices and the speed and efficiency of the current mortgage delivery system.
At the same time, borrowers that lack the information, capacity, or willingness to shop for
mortgage credit, particularly those with real or perceived lower credit quality or those attempting
to purchase homes in neighborhoods with less stable and/or lower property values, remain
vulnerable to overpaying for mortgages, or not receiving the best terms for which they could
qualify.
Racial and ethnic minorities appear to be particularly vulnerable to the mispricing and “push
marketing” that all too frequently occurs outside the mainstream market. Survey data suggest
that for a variety of reasons – including historical mistrust of banking institutions – these
individuals are least likely to comparison shop for mortgage credit. Moreover, lacking basic
information about mortgage terms and rates, they are more likely to succumb to “push
marketing” tactics. Whatever the case may be, it is disturbing that more than three decades after
the enactment of fair lending legislation, fundamental disparities in minority access to mortgage
capital remain.
Credit, Capital and Communities: The Implications of the Changing Mortgage Banking Industry for Community Based Organizations
28
Misaligned Incentives Inefficiently Allocate Credit An efficient mortgage market allocates capital according to the risk profile of the loan and the
ability and willingness of the potential borrower to pay for mortgage credit. Though efficient in
many ways, today’s dual mortgage market fails to achieve what economists term “allocational
efficiency” because similarly situated borrowers pay different prices to obtain a mortgage of
given characteristics and terms. Central to the emergence and the persistence of this allocational
inefficiency is a market failure linked to “principal agent risk” that arises from the growing
importance and presence of mortgage brokers and correspondent lenders in the market.
Brokers and loan correspondents, also called third party originators, have different incentives in
the market than retail lenders. Third party originators work neither on behalf of the borrower nor
the wholesale lender or investor who funds the loan. Instead they are compensated by the
borrower in the form of origination fees and points and are frequently compensated by the
wholesale lender in the form of an origination fee at the time the loan application is funded. If
borrowers are aware of prevailing mortgage rates and terms, competitive pressures will force
individual brokers and correspondents to offer the best product available or lose out on the
business. Yet to the extent that mortgages are complex and consumers lack basic information,
this competitive market check may be missing. In addition, regulation of brokers and
correspondent lenders generally occurs at the state level, and consequently involves a patchwork
of laws and regulations.27 Subject to whatever regulatory constraints are effectively operating in
their market, a broker’s incentive is to close the loan while charging the highest combination of
fees and mortgage interest rates the market will bear.
A mortgage delivery system where third party originators are compensated for making loans, but
have no long term interest in loan performance is subject to the aforementioned “principal agent
risk.” The interests of the lender/investor (principal) and the broker (agent) are misaligned in the
case of broker originated loans. The broker has little incentive to worry about whether the
information presented in the mortgage application is accurate, so long as it is sufficient to cause
the lender to fund the loan and trigger the payment of the broker’s fees. Lacking a long-term
27 According to Kim-Sung and Hermanson (2003) four states (Alaska, Colorado, Montana, and Wyoming) do not require licensure while more than two thirds do not have examination requirements.

Section 2: Industry Structure Perpetuates Dual Market
29
interest in the performance of the loan, the broker is immune from many of the adverse
consequences of failing to match the borrower with the best available mortgage or not providing
accurate data needed to underwrite and assess the probability that the loan will default or
otherwise prepay faster than anticipated.
At the same time, the broker has substantial incentive to provide less than accurate information,
even though it is often not in the best interest of the borrower, and may not reflect the interests of
the investor. This could result in the broker neglecting to check the accuracy of information
presented on the borrower’s loan application or falsifying income or other measures of credit
worthiness or the value of the mortgaged property. Armed with inaccurate information, the
lender (and the ultimate investor) may not fully understand the default risk associated with a
particular loan. A prime quality borrower inappropriately placed into a subprime loan may
eventually add to investor risk since borrowers saddled with an “excessive” monthly mortgage
payment may be more likely to prepay than otherwise similarly situated borrowers with lower
payments.
Because of these risks, the lender/investor (principal) does have a long term interest in the loan
performance and has every incentive to monitor their third party originators as best they can.
Typically, lenders establish clear guidelines for third party originators concerning acceptable
underwriting standards and reject broker loans that fail to meet these standards. They may also
require correspondents to buy back loans should a post-purchase loan review identify a problem.
In addition, some wholesale lenders base broker compensation on the actual loan performance,
rather than compensating on a simple “fee for service” basis. Of course these actions are time
consuming and legally complex, and hence can be difficult to implement in practice.
Lenders/investors, however, do have one powerful tool to hold brokers accountable; they can
always terminate affiliation with any third party originator that consistently fails to meet
underwriting guidelines.
While in theory these efforts should work to bring broker’s actions back into alignment with
those of the lender/investor, in practice they often fall short of the mark. As noted earlier, the
broker has much more knowledge about the borrower’s financial situation than the
Credit, Capital and Communities: The Implications of the Changing Mortgage Banking Industry for Community Based Organizations
30
investor/lender, and hence has ample opportunity to “cheat” without getting caught. In addition,
brokers work with various lenders and can therefore send their best customers to one lender and
divert marginal clients to lenders with looser underwriting standards and/or less capacity to hold
the broker accountable.
Clearly all brokers are not out to “cheat” the system at the expense of borrowers, lenders and
investors. Like wholesale lenders, brokers have incentive to protect their reputation in the
market. Moreover, brokers frequently play the role of a trusted advisor and in doing so can
provide useful guidance to customers concerning the loan process. Even so, with a growing
number of originations coming brokers, and with mounting evidence of both the potential for and
reality of broker abuse mounting, the broker segment of the mortgage market clearly merits
further scrutiny.
Unfortunately the current regulatory structure is not well suited to monitor and hold mortgage
brokers and other third party originators accountable for their actions. Federal regulations of
mortgage lending, so called “regulation from above” focus most intensely on depository
institutions subject to detailed regulation under the Community Reinvestment Act and Fair
Lending Act reviews.28 At the same time, the routine activities of mortgage brokers are largely
regulated, if at all, by a patchwork of often ineffective state regulations. With the number of
mortgage brokers numbering in the hundreds of thousands, state regulators often lack the
resources to conduct simple licensing reviews, let alone engage in detailed monitoring of broker
behavior.
What advocates term “regulation from below” is equally hard-pressed to identify abusive broker
behavior. Back when local retail banks dominated mortgage lending, community based
organizations played a key role in advocating for expanded lending to low- and moderate-income
communities. Unlike many mortgage brokers, retail banks have both a visible institutional
presence and concerns about their reputation in the community. While larger mortgage banking
and mortgage brokerage operations share these concerns, many smaller firms and individual
brokers can “fly beneath the radar screen.” Operating with a phone, fax, and computer, brokers
28 For further discussion of the concepts “regulation from above” and “regulation from below,” see Fishbein, 1992.

Section 2: Industry Structure Perpetuates Dual Market
31
can enter a market undetected, yet still capture significant market share if they are skilled at
working with national scale wholesale lenders or at selling their product directly into the
secondary market. While this ease of entry represents a significant business advantage of the
new mortgage origination system, it can be abused by brokers who “push” over-priced products
into low-income and low-wealth communities, leaving behind problems associated with these
mispriced or even abusive mortgages.
The behavior of mortgage brokers holds special significance for subprime markets. Both prime
and subprime mortgages are originated by each of three channels: retail, broker, and
correspondent, but the broker channel plays a dominant role in subprime lending. In 2002, some
44.7 percent of all subprime originations flowed through a mortgage broker channel, compared
with only 29.5 percent for prime mortgages (Exhibit 7). In contrast, both the retail and
correspondent lending channels account for a relatively smaller share of subprime loans than is
true for prime loans.
Exhibit 7: Brokers Dominate Subprime Lending
Source: Inside Mortgage Finance, The 2003 Mortgage Market Statistical Annual
Retail40.8%
Broker29.5%
Correspondent29.7%
Prime Subprime
Retail34.2%
Correspondent21.1%
Broker44.7%

Credit, Capital and Communities: The Implications of the Changing Mortgage Banking Industry for Community Based Organizations
32
Many Borrowers Have Limited Capacity to Shop The fact that the allocational inefficiency and potential for abuse is not easily monitored by
government regulators, community based watchdogs, or even supportive private sector lenders
and investors, places a substantial burden on individual consumers to fend for themselves in the
marketplace. As envisioned in simple economic theory, the ability of consumers to shop for the
best available price and terms can provide a high degree of consumer protection. For example,
in a market where people have the ability to comparison shop, a broker may lose business if he
or she pushes costs too high.
Unfortunately, given the bewildering array of mortgage products available, even the most
sophisticated borrower will find it difficult to evaluate the details of a mortgage since the essence
of mortgage pricing reflects decisions concerning repayment of debt over time. And there is a
growing body of “behavioral economics” literature that suggests that consumers have differing
and often inconsistent time preferences depending on how the choices regarding payment over
time are framed.29 For example in a recent paper, Shu (2002) argued that the complexity of
discounting mathematics and an inability to estimate this function in their head leads people to
turn to alternative “Short Cut Methods,” such as heuristics or simplified linear models. For
example, one short cut method might be for the consumer to estimate the total loan payments
(number of payments times the payment size) and look for a loan that minimizes this total. If the
loan terms being compared were held constant, this heuristic would be equivalent to finding the
loan with the lowest interest rate. Yet over loans of various terms, the loan with the lowest total
payments may not be the loan with the lowest annual percentage rate (APR).30 Aside from APR,
others focused on minimizing the length of the loan term, while for others, minimizing monthly
payments was given priority.
Given that consumers utilize short cut methods, some brokers may actively promote mortgages
that exploit the tendency of some borrowers to focus on monthly payments and not the APR or
29 For good summary of this strand of literature see Thaler and Sunstein, 2003. 30 Shu (2002) presented evidence that the problems associated with deciding what is the best way to borrow money and repay over time is not limited to “unsophisticated borrowers.” Using a panel of students enrolled in the MBA program at the University of Chicago, she found that even financially sophisticated individuals have trouble determining cost minimizing alternatives for a stream of future payments.
Section 2: Industry Structure Perpetuates Dual Market
33
some other more useful measure to evaluate the costs of various mortgage products. For
example, a recent AARP study (Kim Sung and Hermanson 2003) examined subprime lending
patterns using a random sample of 1008 individuals aged 65 and older who refinanced their
home between January 1999 and December 2000. Kim-Sung and Hermanson noted that broker-
originated refinance loans were nearly twice as likely to be subprime as lender-originated loans
(33 versus 17 percent). They also showed that nearly half (49 percent) of the surveyed borrowers
obtained a retail lender originated loan, 39 percent a broker originated loan, while some 12
percent reported receiving their loan from a home improvement contractor or some other source.
A higher share of broker-originated loans went to African American borrowers (64 percent) than
white borrowers (38 percent) and broker-originated loans were also more common among
borrowers who were divorced or female.
What is perhaps most striking is the way homeowners in the sample searched (or in many
instances did not search) for the best loan available. The AARP study supports the notion that in
many instances subprime refinance loans are “sold, not sought” in that they result from the
extensive and often unsolicited outreach by brokers. Kim-Sung and Hermanson found that some
56 percent of borrowers with broker-originated loans reported that brokers initiated contact with
them, compared with only 24 percent of borrowers with lender originated loans. Since they did
not initiate the search activity, it is not surprising that a larger share of borrowers with broker-
originated loans (70 versus 52 percent) “counted on lenders or brokers to find them the best
mortgage.” Unfortunately, this confidence was often misplaced.
Borrowers with broker-originated loans were more likely to pay points (25 versus 15 percent)
and more likely to have a loan with a prepayment penalty (26 versus 12 percent) A greater share
of borrowers with broker originated loans also believed that they did not get a loan that was “best
for them” (21 versus 9 percent), received a loan with mortgage rates and terms that were “not
fair” (23 versus 8 percent) and did not receive “accurate and honest information” (19 versus 7
percent). Many borrowers, especially elderly borrowers, and borrowers in lower-income and/or
minority areas, succumb to the marketing tactics of aggressive brokers, in effect becoming
unwitting accomplices in the dual mortgage market.

Credit, Capital and Communities: The Implications of the Changing Mortgage Banking Industry for Community Based Organizations
34
These findings are echoed in a number of other studies. Survey data presented in a study by
Courchane, Surrette and Zorn (2004) painted a similar picture. This study suggested that
subprime borrowers are less knowledgeable about the mortgage process, are less likely to search
for the best mortgage rates, and are less likely to be offered a choice among alternative mortgage
terms and instruments. Similarly, another AARP survey conducted in 2003 examined consumer
knowledge of the mortgage lending process.31 While AARP reported that most survey
respondents aged 45 and older understood the basic loan application process, including Truth in
Lending Act (TILA) disclosure requirements, many did not. For example, more than 10 percent
of all respondents were unaware that the lender is required to disclose fees before loan closing,
while more than 20 percent were unaware that the lender is required to disclose the annual
percentage rate (APR) of the loan prior to closing. Moreover, AARP noted that African
Americans were slightly less likely than the general population to correctly answer the TILA
related questions included in the survey.
The AARP survey also asked respondents about the steps they took to shop for a home equity
lender. Most respondents made multiple inquiries concerning alternative home equity loan
products; however, there were notable exceptions. For example, African Americans were
significantly less likely than the general population (36 versus 77 percent) to shop for a home
equity loan at their bank, savings and loan or credit union. AARP posited that this might be
related to the fact that the African Americans surveyed were significantly less likely (72 versus
88 percent) than the general population to have a savings or checking account at one of these
same institutions. Lacking access to banking services, African Americans were more likely (29
versus 10 percent) than the general population to go to a lender recommended by their
contractors and more likely (21 versus 9 percent) to respond to advertisements received in the
mail or over the phone.
While the studies by Courchane, Surette and Zorn and the AARP showed that many subprime
borrowers do not shop, Guttentag (2001) went further to claim that because of the complexity of
mortgage products, consumers are, in many ways, incapable of being effective shoppers.
According to Guttentag, “the core reason for market failure is that effective shopping for a
31 AARP, 2003.

Section 2: Industry Structure Perpetuates Dual Market
35
mortgage is extraordinarily difficult for even sophisticated borrowers (2001: 3).” To support this
claim, Guttentag documented substantial variation in broker compensation, a situation that
should not exist if consumers have the capacity to shop for the best available terms. He
examined a sample of conventional prime loans and found that broker profits ranged from
$1,077 to $2,748 and had no apparent relationship to the level of the effort required to process
the loan application.32
Guttentag emphasized the fact that pricing variability is not a prime or subprime issue but rather
a product of the way mortgage markets function. This was followed by a detailed discussion of
the characteristics of the current mortgage market, such as product complexity and the tendency
for loan terms to change daily, that undermine the ability of borrowers to effectively comparison
shop. For example, the difference between a thirty year fixed rate mortgage with an interest rate
of 6.5 percent and 3 points and one at 7.25 percent with no points, while substantial if the loan is
held to term, is negligible over a five-year time horizon. Most borrowers, however, are unaware
that the length of time the loan is actually held has a tremendous influence on the effective
interest rate generated by the point and rate combination.
‘Rebate pricing’ in which lenders compensate brokers by allowing them to keep some portion of
the margin above the wholesale mortgage price, also serves to obscure the best price available
from prospective borrowers. A borrower can tell from the settlement statement how much he or
she will pay the broker but not how much the broker will receive from the lender for completing
the deal (widely referred to as the yield spread premium or YSP). In theory some of this fee
could offset the borrower’s payment to the broker and the borrower’s bargaining position would
be greatly enhanced if this information were known to him or her. Guttentag observed that these
and other structural features of the current mortgage market make it difficult to imagine that
simple consumer education will correct the tendency for some brokers to overcharge
unsuspecting borrowers.
Shopping for the best price is made even more difficult by the fact that mortgage borrowing
involves many participants including loan officers, underwriters and processors, property
32 In a recent paper, Susan Woodward (2003) came to similar conclusion.
Credit, Capital and Communities: The Implications of the Changing Mortgage Banking Industry for Community Based Organizations
36
appraisers and insurers, title insurers, credit reporting agencies, mortgage insurers, abstract
companies, pest inspectors, and flood insurers to name a few. In addition to the complexity of the
product, the complexity of the process provides an opportunity for brokers to collude with some
of these participants to skim extra cash from the borrower. Moreover, the sheer number of
documents associated with a mortgage loan provides ample opportunity for a broker to introduce
unfavorable provisions into the loan without the borrower’s knowledge.
The above discussion is a reminder that the potential for abuse associated with “push marketing”
and the surprising tendency for many borrowers not to shop for mortgages is reinforced by a
mortgage delivery system that actually provides incentives for brokers and other third party
originators to exploit the situation. This suggests that rooting out “push marketing” or other
abusive practices requires not simply borrower education, but efforts to expand the dissemination
of mortgage pricing information to facilitate comparison shopping and provides hands on
assistance to help consumers select the mortgage product that is best for them. Moreover,
mortgage lenders who rely on brokers to reach out to borrowers and market their products have a
special responsibility to monitor the actions of their agents, and to work with federal and local
authorities to craft legislative and regulatory reform to end the abusive practices that continue to
mar the mortgage industry.
Racial Disparities in Mortgage Lending Persist Numerous studies document the low shares of conventional prime lending to minority borrowers
and/or neighborhoods with high concentrations of minority households. In addition to the
variation by race/ethnicity of individual borrowers, there also appears to be a gap between the
share of conventional prime loans made in neighborhoods of differing income, racial and ethnic
makeup. For example, Joint Center assessment of HMDA data suggest that overall conventional
prime lending in 2001 accounted for 89.4 percent of all home purchase lending to higher-income
white borrowers living in higher-income and largely white neighborhoods. In contrast, the prime
loan share for higher-income African Americans living in these same areas was only 73.5
percent. For Hispanics, the share was a higher 81.6 percent (Exhibit 8). In lower-income and
largely (more than 50 percent) African American and Hispanic communities the prime loan gap
was even greater still. For example, the prime loan share for lower-income African American
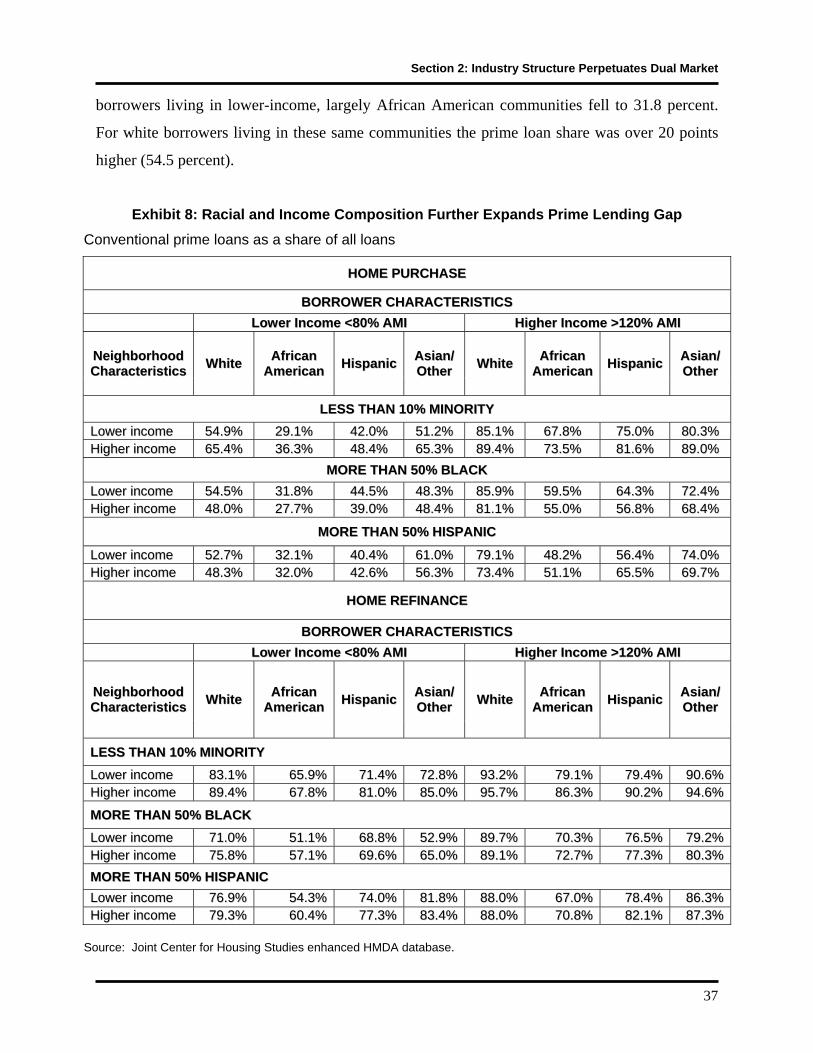
Section 2: Industry Structure Perpetuates Dual Market
37
borrowers living in lower-income, largely African American communities fell to 31.8 percent.
For white borrowers living in these same communities the prime loan share was over 20 points
higher (54.5 percent).
Exhibit 8: Racial and Income Composition Further Expands Prime Lending Gap Conventional prime loans as a share of all loans
HHOOMMEE PPUURRCCHHAASSEE
BBOORRRROOWWEERR CCHHAARRAACCTTEERRIISSTTIICCSS LLoowweerr IInnccoommee <<8800%% AAMMII HHiigghheerr IInnccoommee >>112200%% AAMMII
NNeeiigghhbboorrhhoooodd CChhaarraacctteerriissttiiccss WWhhiittee AAffrriiccaann
AAmmeerriiccaann HHiissppaanniicc AAssiiaann// OOtthheerr WWhhiittee AAffrriiccaann
AAmmeerriiccaann HHiissppaanniicc AAssiiaann// OOtthheerr
LLEESSSS TTHHAANN 1100%% MMIINNOORRIITTYY LLoowweerr iinnccoommee 5544..99%% 2299..11%% 4422..00%% 5511..22%% 8855..11%% 6677..88%% 7755..00%% 8800..33%% HHiigghheerr iinnccoommee 6655..44%% 3366..33%% 4488..44%% 6655..33%% 8899..44%% 7733..55%% 8811..66%% 8899..00%%
MMOORREE TTHHAANN 5500%% BBLLAACCKK LLoowweerr iinnccoommee 5544..55%% 3311..88%% 4444..55%% 4488..33%% 8855..99%% 5599..55%% 6644..33%% 7722..44%% HHiigghheerr iinnccoommee 4488..00%% 2277..77%% 3399..00%% 4488..44%% 8811..11%% 5555..00%% 5566..88%% 6688..44%%
MMOORREE TTHHAANN 5500%% HHIISSPPAANNIICC
LLoowweerr iinnccoommee 5522..77%% 3322..11%% 4400..44%% 6611..00%% 7799..11%% 4488..22%% 5566..44%% 7744..00%% HHiigghheerr iinnccoommee 4488..33%% 3322..00%% 4422..66%% 5566..33%% 7733..44%% 5511..11%% 6655..55%% 6699..77%%
HHOOMMEE RREEFFIINNAANNCCEE
BBOORRRROOWWEERR CCHHAARRAACCTTEERRIISSTTIICCSS LLoowweerr IInnccoommee <<8800%% AAMMII HHiigghheerr IInnccoommee >>112200%% AAMMII
NNeeiigghhbboorrhhoooodd CChhaarraacctteerriissttiiccss WWhhiittee AAffrriiccaann
AAmmeerriiccaann HHiissppaanniicc AAssiiaann// OOtthheerr WWhhiittee AAffrriiccaann
AAmmeerriiccaann HHiissppaanniicc AAssiiaann// OOtthheerr
LLEESSSS TTHHAANN 1100%% MMIINNOORRIITTYY LLoowweerr iinnccoommee 8833..11%% 6655..99%% 7711..44%% 7722..88%% 9933..22%% 7799..11%% 7799..44%% 9900..66%% HHiigghheerr iinnccoommee 8899..44%% 6677..88%% 8811..00%% 8855..00%% 9955..77%% 8866..33%% 9900..22%% 9944..66%%
MMOORREE TTHHAANN 5500%% BBLLAACCKK LLoowweerr iinnccoommee 7711..00%% 5511..11%% 6688..88%% 5522..99%% 8899..77%% 7700..33%% 7766..55%% 7799..22%% HHiigghheerr iinnccoommee 7755..88%% 5577..11%% 6699..66%% 6655..00%% 8899..11%% 7722..77%% 7777..33%% 8800..33%%
MMOORREE TTHHAANN 5500%% HHIISSPPAANNIICC LLoowweerr iinnccoommee 7766..99%% 5544..33%% 7744..00%% 8811..88%% 8888..00%% 6677..00%% 7788..44%% 8866..33%% HHiigghheerr iinnccoommee 7799..33%% 6600..44%% 7777..33%% 8833..44%% 8888..00%% 7700..88%% 8822..11%% 8877..33%%
Source: Joint Center for Housing Studies enhanced HMDA database.
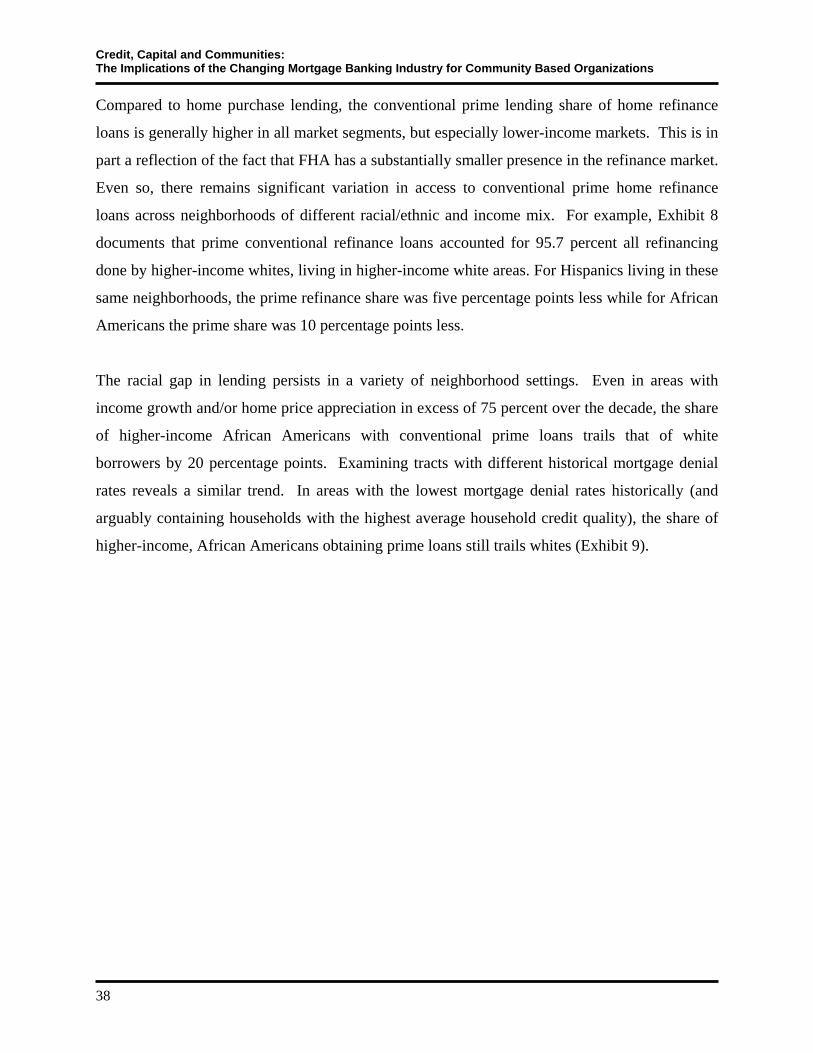
Credit, Capital and Communities: The Implications of the Changing Mortgage Banking Industry for Community Based Organizations
38
Compared to home purchase lending, the conventional prime lending share of home refinance
loans is generally higher in all market segments, but especially lower-income markets. This is in
part a reflection of the fact that FHA has a substantially smaller presence in the refinance market.
Even so, there remains significant variation in access to conventional prime home refinance
loans across neighborhoods of different racial/ethnic and income mix. For example, Exhibit 8
documents that prime conventional refinance loans accounted for 95.7 percent all refinancing
done by higher-income whites, living in higher-income white areas. For Hispanics living in these
same neighborhoods, the prime refinance share was five percentage points less while for African
Americans the prime share was 10 percentage points less.
The racial gap in lending persists in a variety of neighborhood settings. Even in areas with
income growth and/or home price appreciation in excess of 75 percent over the decade, the share
of higher-income African Americans with conventional prime loans trails that of white
borrowers by 20 percentage points. Examining tracts with different historical mortgage denial
rates reveals a similar trend. In areas with the lowest mortgage denial rates historically (and
arguably containing households with the highest average household credit quality), the share of
higher-income, African Americans obtaining prime loans still trails whites (Exhibit 9).
Section 2: Industry Structure Perpetuates Dual Market
39
Exhibit 9: Racial Gap in Prime Lending Persists in a Variety of Neighborhood
BBOORRRROOWWEERR CCHHAARRAACCTTEERRIISSTTIICCSS
IInnccoommee << 8800%% AAMMII IInnccoommee 8800--112200 AAMMII IInnccoommee >> 112200%% AAMMII NNeeiigghhbboorrhhoooodd CChhaarraacctteerriissttiiccss
WWhhiittee AAffrriiccaann AAmmeerriiccaann WWhhiittee AAffrriiccaann
AAmmeerriiccaann WWhhiittee AAffrriiccaann AAmmeerriiccaann
CChhaannggee iinn ttrraacctt mmeeddiiaann hhoouussiinngg vvaalluuee <<1100%% 6644..22 3355..88 6699..77 4422..33 8844..22 6611..55 1100 ttoo 2255%% 6600..11 2299..00 6688..88 3377..33 8855..77 5599..99 2255 ttoo 5500%% 5588..22 2288..99 6666..33 3366..00 8855..33 5599..88 5500 ttoo 7755%% 6600..99 3322..11 6699..00 3388..55 8866..99 6633..22 >>7755%% 6600..77 3322..66 6699..55 4422..44 8877..44 6655..99 CChhaannggee iinn ttrraacctt mmeeddiiaann hhoouusseehhoolldd iinnccoommee <<1100%% 5588..66 3333..11 6655..99 4411..55 8822..77 5577..77 1100 ttoo 2255%% 5588..55 2299..66 6655..44 3366..99 8833..66 5577..22 2255 ttoo 5500%% 6600..44 3300..55 6688..33 3388..00 8855..66 6611..55 5500 ttoo 7755%% 6611..22 3311..44 6699..88 3399..00 8877..33 6644..88 >>7755%% 6644..33 3366..77 7722..11 4466..55 8888..77 6699..88 TTrraacctt lleevveell mmoorrttggaaggee ddeenniiaall rraatteess <<55%% 7777..66 4444..55 8811..66 5522..11 9922..66 7799..11 55 ttoo 1144%% 6655..22 3333..66 7711..88 4411..77 8877..99 6677..99 1155 ttoo 2255%% 5544..11 3311..11 6611..99 3377..77 8811..33 5588..22 2266 ttoo 3300%% 4488..66 2288..55 5566..33 3333..88 7777..55 5511..77 >>3300%% 4433..66 2288..99 5522..88 3366..88 7755..44 5522..77
Source: Joint Center for Housing Studies enhanced HMDA database.
Racial Disparities are Particularly Pronounced in the Subprime Market Though there are undoubtedly different risks associated with lending to individuals with varied
income and credit histories or living in different neighborhood settings, the difference across race
and ethnicity with respect to the share of lending that is conventional prime, subprime,
government backed or manufactured home lending can be substantial. For example, review of
HMDA data on the spatial variation of prime lending has led many advocates to focus on what
they call the “risk or race question” arguing that it is “race” not “risk” that explains the persistent
Credit, Capital and Communities: The Implications of the Changing Mortgage Banking Industry for Community Based Organizations
40
prime lending gap. 33 For example, in a comprehensive review of neighborhood lending patterns
in Chicago in the late 1990s, Immergluck and Wiles (1999) observed that conventional prime
lenders served higher-income white areas, while FHA and subprime lending was concentrated in
lower-income and minority communities. Characterizing this as a “dual mortgage market,” they
noted that the racial disparities were too great to be explained by differences in the credit quality
of the borrowers. Instead, they argued that the observed patterns resulted from the failure of
“mainstream lenders” to seek out credit worthy borrowers in lower-income and minority
communities.
Researchers at the U.S Department of Housing and Urban Development (HUD) similarly
concluded that a lack of competition from prime lenders has enabled subprime lenders to gain a
growing share of mortgage lending activity in lower-income and minority communities. In
addition, they noted that racial discrepancies in lending patterns existed at the borrower level and
that upper-income African American borrowers were twice as likely as lower-income, white
borrowers to hold subprime refinance loans.34 Combining HMDA data with data from the 2000
Census, Bradford (2002) found that African Americans and Hispanics were also
disproportionately represented in the subprime refinance market. Moreover, he pointed out that
racial disparities in lending exist in all regions and in cities of all sizes. Indeed, the study
suggested that among the 331 metropolitan areas examined, some of the biggest disparities exist
in the nation’s smallest metropolitan areas.
Finally, based on their summary of several HUD-funded studies, Fishbein and Bunce (2000)
concluded that a portion of borrowers whose credit would allow them to qualify for lower cost
conventional prime loans were nonetheless receiving subprime loans. They also found that the
higher interest rates charged by subprime lenders could not be fully explained by neighborhood
and/or borrower risk factors.
33 The phrase “risk or race” was suggested by a compressive study of subprime lending patterns prepared for the Center for Community Change. See Bradford, 2002. 34U.S. Department of Treasury and U.S. Department of Housing and Urban Development. 2000. Hearings for this report were held in Baltimore, Chicago, Los Angeles and New York.
Section 2: Industry Structure Perpetuates Dual Market
41
Detailed Studies Confirm Simple HMDA Findings Each of the studies discussed in the previous sub-section acknowledged that part of the disparity
in lending patterns undoubtedly resulted from differences in borrower and property related risk
factors. To address this, several studies have gone to considerable lengths to develop data that
more fully evaluate the “risk or race” question. Pennington-Cross, Yezer and Nichols (2000)
examined issues related to credit risk and mortgage lending and estimated the probability that an
individual borrower selected a conventional prime, subprime, or FHA insured mortgage. The
study analyzed a database of home purchase loans that combined HMDA data with data from
FHA administrative files, a sample of real estate transactions, and a measure of borrower credit
quality. While the study confirmed that borrower income, debt, credit history and neighborhood
factors significantly influence the pattern of mortgage lending, race and ethnicity still appeared
to be key determinants in explaining why African Americans, Native Americans, and Hispanics
are less likely to have access to lower-cost, prime home purchase loans than whites.
Similarly, Calem, Gillen and Wachter (2002) examined spatial variation in subprime lending
across census tracts in Chicago and Philadelphia. In addition to detailed borrower data, this
study incorporated a variety of tract-level measures drawn from the 2000 Census.35 Of note was
their use of tract-level risk measures, including the share of properties in foreclosure, as well as
the share of individuals within the tract with low (or no) credit scores (obtained from a major
national credit bureau).
While the authors conceded that more could be done to control for individual borrower risk, they
asserted that race, both at the neighborhood and borrower levels, remains a strong factor in
explaining the distribution of subprime lending. In particular, they found that “even after
inclusion of the full set of explanatory variables, in both cities we find a strong geographic
concentration of subprime lending in neighborhoods where there is a large population of African
American homeowners” (2002: 14). In addition, they noted that African American borrowers,
regardless of their neighborhood location, have a high likelihood of obtaining a subprime loan
compared to a prime loan, concluding that both borrower race and neighborhood race matter.
35Census variables provided detail on income, education, and race/ethnicity.

Credit, Capital and Communities: The Implications of the Changing Mortgage Banking Industry for Community Based Organizations
42
In a recent paper, Courchane, Surette and Zorn (2004) examined whether borrowers were
“inappropriately” channeled into the subprime segment. The study explored mortgage lending
patterns using FICO scores and other traditional measures of risk as well as what the authors
described as “borrower self-assessed credit risk factors”36 gathered from a survey of mortgage
borrowers. The paper confirmed that whether borrowers obtain subprime or prime mortgages
depends in large measure on risk-related mortgage underwriting variables (including FICO
score, Loan To Value, Front End Ratio) and other factors including mortgage type, market
channel, shopping behaviors, opportunity to make choice, age and ethnicity.
The addition of measures of market knowledge, search behavior, and choices available
contributed significantly to explaining borrower outcomes. The authors concluded that the
superior performance of the “full” model in explaining whether a borrower obtained a prime or
subprime loan implies that credit risk alone may not fully explain why borrowers end up in the
subprime market. Rather, their paper supported the alternative view that the current mortgage
delivery system produces an allocational inefficiency wherein households of similar economic,
demographic, and credit risk characteristics do not pay the same price for mortgage credit.
Capital Markets Fail to Correct Pricing Disparity The finding that an allocational inefficiency exists in the mortgage market is reinforced by a
series of econometric studies that demonstrate how “principal agent risk” associated with third
party originations can result in borrowers with similar characteristics obtaining different pricing
depending on the process or channel through which they received their loan.37 Building on an
earlier study by Lacour-Little and Chun (1999) that demonstrated that broker-originated loans
are likely to prepay faster, Alexander et. al. (2003) showed that they are also more likely to
default than loans originated through a retail channel, even after controlling for credit and
ability-to-pay factors. Alexander et. al. further demonstrated that prior to 1997 the different
36 For example the survey gathers data on whether the borrower believes that they “have good credit,” “pay bills on time,” and are “in control of their finances,” as well as information on search behavior and adverse life events such as loss of job. 37 For example, Passmore and Sparks (1996) showed how asymmetric information and adverse selection can negate the benefits of government sponsored mortgage securitization programs; Shiller and Weiss (2000) examined moral hazard in home-equity conversions; Brickman and Hendershott (2000) investigated adverse selection in the refinancing of FHA loans; Brueckner (2000) studied the impact of asymmetric information on mortgage default, and Lacour-Little and Chun (1999) assessed prepayment risk of mortgages originated by third parties.
Section 2: Industry Structure Perpetuates Dual Market
43
default characteristics of broker originated loans were not recognized in the market place and
were consequently not priced accordingly. They argued due to growing capital market awareness
of the “principal agent risk” associated with broker-originated loans, borrowers who receive
funding via the broker channel are charged a premium over apparently similar borrowers who
receive their loans through retail channels. This is a result of the need to compensate investors
for the higher default and prepayment risk associated with these loans.
This discussion is a reminder that investors care primarily about being compensated for the risks
they bear. The fact that a pool of mortgages includes individual mortgages with “excessive” fees
or rates, or contains inaccurate information is not of interest so long as the investor is able to
assess prepayment rates and/or foreclosure rates associated with these transactions. Recognizing
that misrepresentation and mispricing exists, some lenders/investors simply protect their interests
by buying loans from less reliable brokers at a discount rather than working to weed out “bad
loans.”
Of course, some lenders and investors are deeply concerned about receiving misleading
information from brokers, particularly related to the appraised value of the mortgage property or
the capacity of the borrower to repay the loan. As result, there is aggressive and now
technologically sophisticated monitoring on the part of lenders and investors, as well as the Wall
Street rating agencies that is designed to root out fraud.38 However, these systems are costly to
acquire and not universally implemented.
Given the fact that investment returns depend on the accuracy of the assumptions concerning the
underlying mortgage assets and the performance of the mortgage pool, mortgage investors must
decide how to manage that risk. In an extreme example, an investor could present relatively
strict rules governing the process of loan originations and through a system of “representations
and warranties” hold the mortgage banker accountable for any deviation from these rules.
Mortgage bankers in turn could seek to hold their brokers accountable to these standards, and in
effect push this risk back downstream. Since there are reputational risk considerations associated
38 See July 2003 issue of Inside Mortgage Technology for a discussion of the growth of automated fraud detection systems.

Credit, Capital and Communities: The Implications of the Changing Mortgage Banking Industry for Community Based Organizations
44
with loans that go into foreclosure, such actions could pressure brokers to more closely align
their practices with general industry standards.
Undoubtedly some of this is happening, but Alexander et. al. (2003) demonstrated that in the
current subprime market, the tendency of brokers to charge excessive fees or present misleading
information is not “corrected,” but rather priced in the market. Indeed, such practices are no
secret, as the details concerning the expected performance of a pool of loans are carefully
disclosed for prospective investors to review. A recent assessment of financial disclosure
documents for a large sample of subprime mortgage-back securities confirmed that investors
focus less on whether specific loans are likely to default or prepay, and more on whether the risk-
adjusted rate of return is sufficient to cover any expected losses.39 This review demonstrated that
it is standard practice for disclosure documents to first predict that a given pool of subprime
loans has a very high likelihood of experiencing significant losses due to default and foreclosure
– in many instances ten times as high as prime quality loans – only to then demonstrate that the
mortgages have sufficiently high interest rates to protect individual investors from realizing these
losses.
In a world in which the broker is detached from the lender and the lender is detached from the
investor, market feedback loops are broken, or at best are slow to operate. Rather than work to
root out abuse, under the current industry structure, some buyers pay more, brokers earn a
premium return, and investors are compensated. Yet despite the fact that such high foreclosure
rates, if realized, would have potentially devastating consequences for individual borrowers and
communities, the disclosure documents simply state that the pools were priced to compensate
investors for bearing the risks. The result is that the impact of foreclosures to borrowers and
communities is ignored by the capital markets.
Is There an Effective Demand Side Check? As long as the mortgage-backed securities market prices the tendency of brokers to overcharge
borrowers or present misleading information into its securities, the task of ensuring
nondiscriminatory pricing in the marketplace falls to regulators and to consumers themselves.
39 See Mansfield, 2003.
Section 2: Industry Structure Perpetuates Dual Market
45
Unfortunately, the current regulatory setup is not well structured to address the problems
associated with mispriced mortgage credit. Indeed, while there could and should be more
aggressive enforcement of laws and regulations governing deceptive marketing practices or
failure to accurately disclose the terms of the borrower prior to the closing, there is limited
recourse for a borrower who simply overpays. Consumer protection regulations generally focus
on ensuring that the loan information provided by the mortgage broker to the borrower was “fair
and accurate,” that the appraised value of the home was a fair representation of current market
value, and that the terms and cost of the loan were provided in advance of closing for the
borrower to review. Under the doctrine of “let the buyer beware,” apart from Federal Trade
Commission regulations that prohibit false advertising by brokers, there are no requirements that
a broker offer the best price available in the marketplace.
Nor are potential borrowers necessarily up to the challenge of protecting their own interests. A
previously discussed, many consumers do not shop around for mortgages, and instead rely on
brokers to provide them with information. Indeed, many consumers falsely believe that approval
of their mortgage application is somehow a validation that they can handle the mortgage
payments. Nothing could be further from the truth. At the time of closing, each of the parties in
the transaction (other than the borrower) is fully aware of the probability that the loan will move
to default and foreclosure. Lacking this knowledge, many borrowers willingly enter into a
transaction that may impose serious financial and emotional costs on themselves and their
neighbors.
Moreover, given the complexity of current mortgage products, even the most sophisticated
borrower will find it difficult to evaluate the details of the mortgage. Yet to the extent that these
more sophisticated borrowers have financial or legal advisors to guide them, they may have
access to better mortgage information. At a minimum, higher-income and higher-wealth
borrowers have more extensive financial resources to draw upon and hence have greater capacity
to bear any excessive costs and avoid mortgage default.
The mortgage market often falls short of the competitive ideal where buyers and sellers have
ready access to information about product terms and pricing. Simple economics suggests that
Credit, Capital and Communities: The Implications of the Changing Mortgage Banking Industry for Community Based Organizations
46
markets work best when consumers make informed choices concerning the goods and services
they consume. Recognizing the complexity of the mortgage product, and the inherent difficulty
many consumers have in shopping for the ‘best mortgage product,’ all too often the ideals of the
competitive market are not realized. In the language of economics, there exists an “asymmetry of
information” between buyers and sellers, particularly with respect to the price of mortgage
credit. Mortgage industry professionals participate in numerous transactions over the course of
weeks and months and have ready access to information on the set of fees, rates, and terms that
comprise the overall “pricing of mortgage credit” in the marketplace. In contrast, consumers
only occasionally search for a loan to purchase or refinance a home, and hence begin loan
shopping with limited prior experience and equally limited access to the information needed to
make an educated choice.
Consumers could spend more time and money to better educate themselves about the price and
terms of alternative mortgage products, but from the perspective of the efficient use of societal
resources, it makes little sense for individual consumers to devote considerable resources to
ferret out information that could be readily provided by mortgage brokers and originators. Yet as
previously noted mortgage brokers and originators have limited incentive to provide detailed
pricing information, particularly information that would enable a consumer to compare prices of
alternative products to determine whether or given the details of their income and credit history,
they were getting a loan at the best price available in the marketplace.
These comments suggest that mortgage pricing information is in effect a “public good,” and
there is a role for government in providing the pricing information needed to support the efficient
operation of the mortgage market. While improved disclosure of the terms of a particular loan
offered to a consumer would help, as would continued consumer education efforts, these steps
are not sufficient to achieve desired results due to the complexity of the mortgage lending
process. Federal regulators operating under applicable Fair Lending and Fair Trade authorities
must expand their efforts to ensure that consumers obtain the pricing information needed to make
informed choices. This could take the form of a national registry of best available mortgage
products, or other efforts to assist local government and community based organizations help
families to better understand the pricing of mortgage products as they relate to borrower income,

Section 2: Industry Structure Perpetuates Dual Market
47
credit score, and ability to meet downpayment and closing cost requirements. Such readily
available information – equivalent to the “blue books” or consumer reports that have
successfully guided shoppers for automobiles and other consumer durables – would help
consumers find the best available deal and help better protect them from the adverse
consequences of aggressive and often deceptive marketing practices. Working to enable
borrowers or their trusted advisors to be better shoppers and resist such marketing practices
would go a long way to not only reduce the incidence of predatory lending, but also stem the
growth of foreclosures that inevitably follow in the wake of these same predatory lending
practices.
SECTION 3: ECONOMETRIC ANALYSIS CONFIRMS THE PERSISTENCE OF DISCRIMINATION IN MORTGAGE MARKETS
This section summarizes the recently completed Joint Center for Housing Studies econometric
analysis of the “risk or race” question. Due to the difficulty of assessing the spatial and racial
patterns in mortgage lending with simple descriptive statistics, the Joint Center estimated a series
of multivariate equations of the odds that a borrower will obtain a prime conventional mortgage,
as opposed to a subprime mortgage. Using a logistic transformation, this odds ratio is assumed to
be a function of borrower and neighborhood characteristics, as well as the lender variables that
are included in the Joint Center Enhanced HMDA data base.
The econometric analysis confirmed that many factors contribute to the relatively low share of
prime conventional loans going to African American and Hispanic borrowers, and to all
borrowers living in predominantly African American and Hispanic neighborhoods. As is true of
most previous studies on the topic, the analysis also confirmed that race remains a factor, even
after controlling for a wide range of neighborhood and borrower characteristics, including
several measures of risk.
The Joint Center Enhanced HMDA Data Base The econometric analysis presented in this report utilized loan level data submitted by financial
institutions under the Home Mortgage Disclosure Act (HMDA) of 1975. As currently amended,
HMDA requires mortgage lenders to report the race and income of the applicant, the state,
county, and census tract of the property included in the application, the type of loan applied for
and the disposition of the application for all loan applications. There are approximately 146
million records of home mortgage loan applications and transactions included in the HMDA data
files for the period 1993 to 2001, HMDA data include information on both ‘originated loans’ and
‘purchased loans.’ The latter are originated by one HMDA reporting entity and sold to another,
either to hold in portfolio or to be sold again into the secondary market. To avoid double
counting of any particular loan, all ‘purchased loans’ are eliminated from the sample, a step that
reduces the initial count of HMDA data records by half.40
40 Details of the impact of these various data filters are presented in the Appendix to this report.
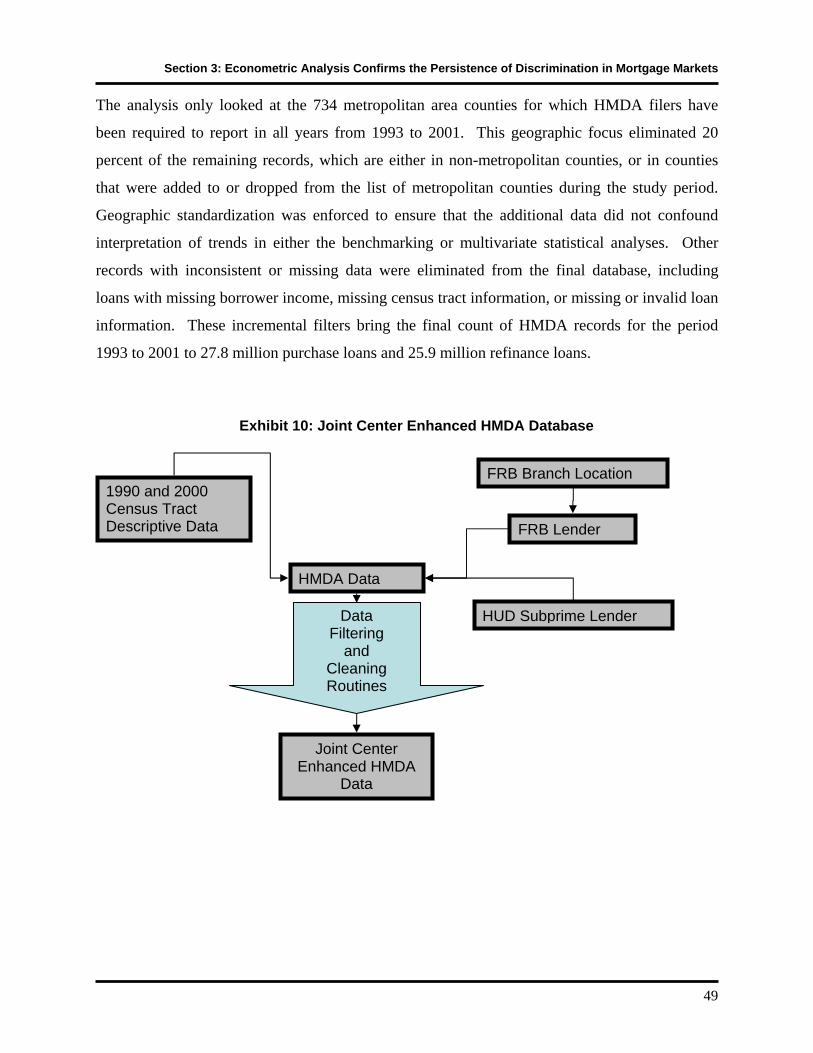
Section 3: Econometric Analysis Confirms the Persistence of Discrimination in Mortgage Markets
49
The analysis only looked at the 734 metropolitan area counties for which HMDA filers have
been required to report in all years from 1993 to 2001. This geographic focus eliminated 20
percent of the remaining records, which are either in non-metropolitan counties, or in counties
that were added to or dropped from the list of metropolitan counties during the study period.
Geographic standardization was enforced to ensure that the additional data did not confound
interpretation of trends in either the benchmarking or multivariate statistical analyses. Other
records with inconsistent or missing data were eliminated from the final database, including
loans with missing borrower income, missing census tract information, or missing or invalid loan
information. These incremental filters bring the final count of HMDA records for the period
1993 to 2001 to 27.8 million purchase loans and 25.9 million refinance loans.
Exhibit 10: Joint Center Enhanced HMDA Database
HMDA Data
FRB Lender
FRB Branch Location
HUD Subprime Lender
1990 and 2000 Census Tract Descriptive Data
Joint Center Enhanced HMDA
Data
Data Filtering
and Cleaning Routines
Credit, Capital and Communities: The Implications of the Changing Mortgage Banking Industry for Community Based Organizations
50
As shown in Exhibit 10, the Joint Center Enhanced HMDA data base combines HMDA data
with data from three other sources. These sources include:
Federal Reserve Board Lender and Branch Location Files: The Federal
Reserve Board (FRB) maintains two research databases that were used in this study. The
FRB Lender file permits aggregation of individual HMDA reporters into larger
organizations linked by common ownership. FRB data also identify whether a banking
institution is subject to Community Reinvestment Act (CRA) regulations, as well as the
location of their primary assessment area, defined as those counties within which a
regulated entity has deposit-taking branches.
U.S Department of Housing and Urban Development (HUD) Data on Metropolitan Statistical Area (MSA) Median Household Incomes and Lender Specializations: This report classifies loans relative to the overall median income for
the MSA for both the income of the loan applicant and the income of the census tract
where the property is located. HUD prepares annual estimates of MSA median household
income, which were appended to the HMDA database. HUD also prepares an annual
listing of those HMDA reporters that specialize in subprime or manufactured home
lending which was also appended to the database.
Census Tract Characteristics: The statistical analysis in this report incorporated
tract data from the 2000 Census as control variables for each of the 45,000 metropolitan
area census tracts. Census data for 1990 and 2000 were also linked to create several
indicators of neighborhood change, including estimated change in tract income and home
values over the decade.
Assessing the Prime Mortgage Gap Simple descriptive statistics confirm the existence of a conventional prime lending gap where
minorities, most notably African Americans, are less likely to obtain prime conventional
mortgages, even after controlling for neighborhood and borrower income. In an effort to account
for the potential impacts of other variables on the spatial distribution of conventional prime

Section 3: Econometric Analysis Confirms the Persistence of Discrimination in Mortgage Markets
51
lending, the Joint Center used the Enhanced HMDA database to estimate a multivariate equation
of the odds that an individual will receive a conventional prime loan, as opposed to a subprime
loan. Using a logistic transformation, the model assumed that the log of the odds of the prime
conventional versus the subprime mortgage is a linear function of the borrower and
neighborhood characteristics, as well as measures of neighborhood credit quality, the degree of
industry competition, and the mortgage origination channel, which indicates whether or not the
loan was initially sold into the secondary market or held in portfolio. Separate equations were
estimated for home purchase and refinance loans.
The data used to estimate these equations were grouped according to six categories or data
blocks.41 Exhibit 11 displays the variables included in five of the six blocks. Not shown is a
series of 301 dummy variables for each metropolitan area represented in the model. Variables in
the other five blocks include:
Borrower: This block includes a series of dummy variables, such as race/ethnicity,
income as a percent of area median income, and gender, derived from basic HMDA data.
The race/ethnicity dummies use “white borrowers” as the reference category, while “male
borrowers” serve as the reference category for the gender dummies. For income, the
reference category is borrowers with incomes that fall between 80 and 120 percent of
metropolitan area median income. Given the rise in the number of borrowers that fail to
report key demographic data, this study diverged from others and included a dummy
variable for “missing borrower race” and “missing gender” to examine the extent to
which the growth of missing data appears to be linked to the rise in subprime lending.
Neighborhood Block: HMDA data report the 1990 census tract of the home being
financed and whether or not it is located in a central city, along with the tract income as a
percentage of area median income. By linking 1990 and 2000 census tract identifiers, the
analysis expanded the list of neighborhood variables to include descriptions of the
detailed racial composition of the neighborhood, data on the share of college educated
41 A table of means and standard deviations of the variables used in these equations is presented in the Appendix to this report.

Credit, Capital and Communities: The Implications of the Changing Mortgage Banking Industry for Community Based Organizations
52
adults, share of household heads receiving public assistance, share of owner occupied
units, and the share of all owners with a household head aged 65 or older. Finally, the
variable list also included information about the housing stock in each neighborhood,
including the number of single family homes as a share of the total number of housing
units in the tract, the share of housing units built before 1950, and the median value of
owner occupied homes.
Neighborhood Credit Quality: Building on the work of Calem, Gillen, and Wachter
(2002),42 the analysis included a series of variables to measure variation in the risk
associated with making a loan in a particular census tract. Specific measures included
housing turnover (or homes sales as a share of owner occupied homes), income and
house value growth, historical loan denial rates, and rent to value ratio. High housing
turnover signals the presence of an active resale market that should enhance the quality of
available property appraisal data. Faster growth in household incomes and home values
imply increasing housing demand, while lower rent to value ratio is a rough indicator of
the lower market capitalization rates for a given area. Finally, a measure of the
probability that an applicant for a prime conventional loan was denied over the period
1995 to 1999 was included. This last variable provided a measure of the average credit
quality of residents living in and/or seeking to move into a specific neighborhood.
Competition: Some advocates have argued that the lack of prime conventional lending
in an area results from an absence of mainstream lenders. And lack of competition, the
argument continues, has enabled the subprime sector to gain market share, independent of
other objective characteristics of the area. To assess these claims, the analysis included a
block of variables designed to measure the degree of market competition in a particular
neighborhood. The Herfindahl-Hirschman Index (HHI) is a measure of market
competition that ranges from 1 to 10,000 where a higher number indicates that a few
lenders control a significant share of loans. In addition to the HHI, two simpler and
somewhat more intuitively understandable measures of competition – the total number of
42 Note that this study focused on two metropolitan areas – Chicago and Philadelphia. In contrast, the Joint Center analysis reported here examined data for all metropolitan areas.
Section 3: Econometric Analysis Confirms the Persistence of Discrimination in Mortgage Markets
53
prime lenders operating in a neighborhood, and the number of top 25 lenders in the same
area – were included. To account for the variation in size of census tracts, both of these
measures were expressed relative to the number of owner occupied housing units in the
tract.
Loan Supply: This report has argued that lending to low-income people and
communities is characterized by a dual mortgage market, in that these areas are
differentially served by third party mortgage originators offering a distinctly different
mix of mortgage products. To examine potential supply side impacts on mortgage
lending patterns, this block included information on the size of the lender, and whether or
not the lender is a CRA regulated entity operating in their assessment area, a CRA
regulated entity operating outside their assessment area, or a non-CRA regulated entity.
In addition, the block included a series of variables that describe the source of funding for
the loans. In particular, relative to a loan that was not sold (held in portfolio), the block
contained a series of dummy variables that indicated whether or not the loan was sold to
Fannie Mae or Freddie Mac or sold to another entity including non-bank issuers of
primarily non-conforming securities.
Regression Results Exhibit 11 presents estimates of the complete model including each of the five blocks of data for
both home purchase and home refinance lending. Not shown in the exhibit, but included in the
estimation process are the 301 metropolitan area dummy variables discussed early. In addition
to the coefficient estimates, Exhibit 11 presents the ChiSq measure of the statistical significance
of individual coefficients.
In general, the model performed quite well. All coefficients are statistically significant as
measured by the probability of Chi-square, and most have the anticipated sign. Note that even
after controlling for a relatively detailed list of variables, African Americans are shown to be less
likely to receive a prime conventional loan. While Hispanic borrowers are also less likely to
receive a prime conventional loan, even after controlling for the range of other variables included
in the model, the magnitude of this impact is smaller than it was for African Americans. Further
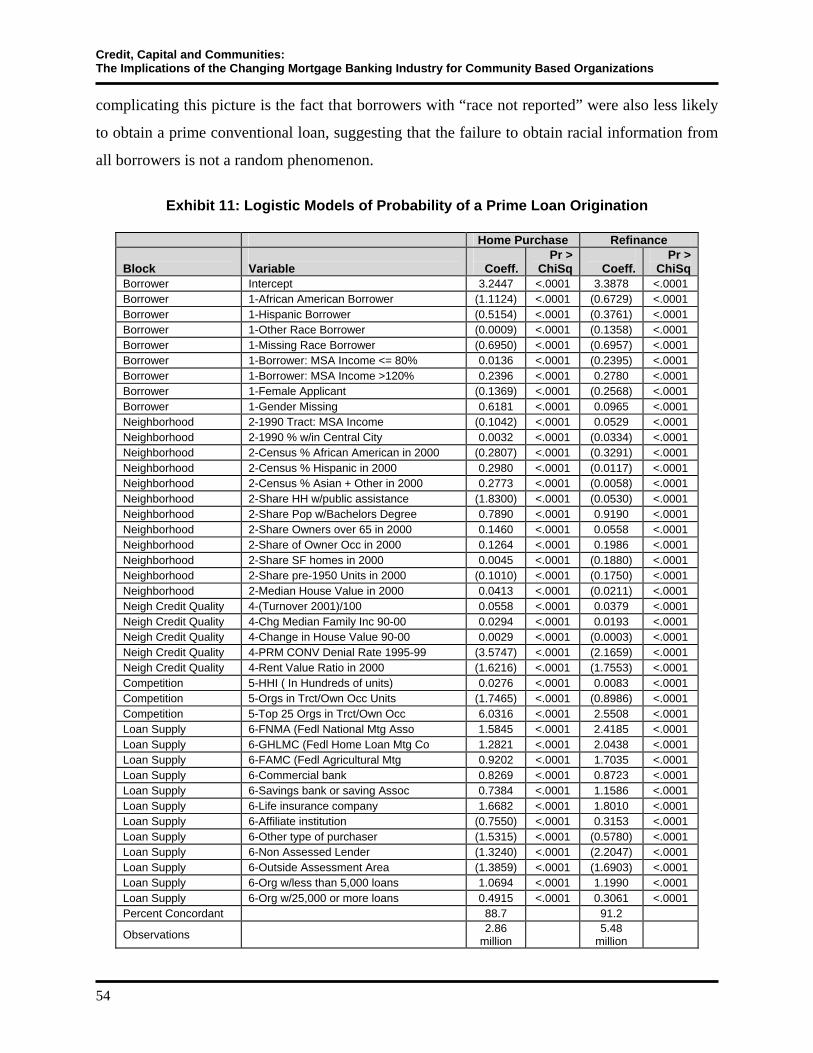
Credit, Capital and Communities: The Implications of the Changing Mortgage Banking Industry for Community Based Organizations
54
complicating this picture is the fact that borrowers with “race not reported” were also less likely
to obtain a prime conventional loan, suggesting that the failure to obtain racial information from
all borrowers is not a random phenomenon.
Exhibit 11: Logistic Models of Probability of a Prime Loan Origination
Home Purchase Refinance Block
Variable
Coeff.
Pr > ChiSq
Coeff.
Pr > ChiSq
Borrower Intercept 3.2447 <.0001 3.3878 <.0001 Borrower 1-African American Borrower (1.1124) <.0001 (0.6729) <.0001 Borrower 1-Hispanic Borrower (0.5154) <.0001 (0.3761) <.0001 Borrower 1-Other Race Borrower (0.0009) <.0001 (0.1358) <.0001 Borrower 1-Missing Race Borrower (0.6950) <.0001 (0.6957) <.0001 Borrower 1-Borrower: MSA Income <= 80% 0.0136 <.0001 (0.2395) <.0001 Borrower 1-Borrower: MSA Income >120% 0.2396 <.0001 0.2780 <.0001 Borrower 1-Female Applicant (0.1369) <.0001 (0.2568) <.0001 Borrower 1-Gender Missing 0.6181 <.0001 0.0965 <.0001 Neighborhood 2-1990 Tract: MSA Income (0.1042) <.0001 0.0529 <.0001 Neighborhood 2-1990 % w/in Central City 0.0032 <.0001 (0.0334) <.0001 Neighborhood 2-Census % African American in 2000 (0.2807) <.0001 (0.3291) <.0001 Neighborhood 2-Census % Hispanic in 2000 0.2980 <.0001 (0.0117) <.0001 Neighborhood 2-Census % Asian + Other in 2000 0.2773 <.0001 (0.0058) <.0001 Neighborhood 2-Share HH w/public assistance (1.8300) <.0001 (0.0530) <.0001 Neighborhood 2-Share Pop w/Bachelors Degree 0.7890 <.0001 0.9190 <.0001 Neighborhood 2-Share Owners over 65 in 2000 0.1460 <.0001 0.0558 <.0001 Neighborhood 2-Share of Owner Occ in 2000 0.1264 <.0001 0.1986 <.0001 Neighborhood 2-Share SF homes in 2000 0.0045 <.0001 (0.1880) <.0001 Neighborhood 2-Share pre-1950 Units in 2000 (0.1010) <.0001 (0.1750) <.0001 Neighborhood 2-Median House Value in 2000 0.0413 <.0001 (0.0211) <.0001 Neigh Credit Quality 4-(Turnover 2001)/100 0.0558 <.0001 0.0379 <.0001 Neigh Credit Quality 4-Chg Median Family Inc 90-00 0.0294 <.0001 0.0193 <.0001 Neigh Credit Quality 4-Change in House Value 90-00 0.0029 <.0001 (0.0003) <.0001 Neigh Credit Quality 4-PRM CONV Denial Rate 1995-99 (3.5747) <.0001 (2.1659) <.0001 Neigh Credit Quality 4-Rent Value Ratio in 2000 (1.6216) <.0001 (1.7553) <.0001 Competition 5-HHI ( In Hundreds of units) 0.0276 <.0001 0.0083 <.0001 Competition 5-Orgs in Trct/Own Occ Units (1.7465) <.0001 (0.8986) <.0001 Competition 5-Top 25 Orgs in Trct/Own Occ 6.0316 <.0001 2.5508 <.0001 Loan Supply 6-FNMA (Fedl National Mtg Asso 1.5845 <.0001 2.4185 <.0001 Loan Supply 6-GHLMC (Fedl Home Loan Mtg Co 1.2821 <.0001 2.0438 <.0001 Loan Supply 6-FAMC (Fedl Agricultural Mtg 0.9202 <.0001 1.7035 <.0001 Loan Supply 6-Commercial bank 0.8269 <.0001 0.8723 <.0001 Loan Supply 6-Savings bank or saving Assoc 0.7384 <.0001 1.1586 <.0001 Loan Supply 6-Life insurance company 1.6682 <.0001 1.8010 <.0001 Loan Supply 6-Affiliate institution (0.7550) <.0001 0.3153 <.0001 Loan Supply 6-Other type of purchaser (1.5315) <.0001 (0.5780) <.0001 Loan Supply 6-Non Assessed Lender (1.3240) <.0001 (2.2047) <.0001 Loan Supply 6-Outside Assessment Area (1.3859) <.0001 (1.6903) <.0001 Loan Supply 6-Org w/less than 5,000 loans 1.0694 <.0001 1.1990 <.0001 Loan Supply 6-Org w/25,000 or more loans 0.4915 <.0001 0.3061 <.0001 Percent Concordant 88.7 91.2
Observations 2.86 million 5.48
million
Section 3: Econometric Analysis Confirms the Persistence of Discrimination in Mortgage Markets
55
The model also generated interesting insights as to how the log of the odds of obtaining a prime
loan varies according to the racial composition of the neighborhood. For example the equation
confirmed that the higher the share of African Americans living in a neighborhood, the lower the
odds that a borrower of any race or ethnicity will receive a prime loan. The results for Hispanics
display a more complex pattern. In particular, borrowers living in a predominantly Hispanic
neighborhood appear to be less likely to receive a prime conventional refinance loan. Somewhat
surprisingly, borrowers living in a predominantly Hispanic neighborhood appear to be somewhat
more likely to receive a prime conventional home purchase loan.
To further explore the impact of neighborhood and borrower race on the odds of obtaining a
prime loan, Exhibit 12 presents the race/ethnicity variables for two alternate specifications. The
first specification, described as the “simple model,” included only the borrower and
neighborhood blocks and the metropolitan area dummy variables. In contrast, the “full model”
discussed earlier, included the metropolitan area dummy variables plus information from each of
the five data blocks. Note that the “simple model” included many of the variables presented in
earlier studies of the “risk or race question.” Because HMDA data contain information on
borrower and neighborhood characteristics, for example, the census tract and metropolitan area
of the loan, many studies have limited themselves to these variables. These studies typically
found that there are significant variation in lending patterns by the racial and ethnic
characteristics of the borrower and the neighborhood.

Credit, Capital and Communities: The Implications of the Changing Mortgage Banking Industry for Community Based Organizations
56
Exhibit 12: Race Coefficients for Alternative Logistic Model Specifications
Model Specification Simple Model
Full Model
Home Purchase Loans African American Borrower Coefficient (1.08) (1.11) PR > ChiSq <.0001 <.0001 Hispanic Borrower Coefficient (0.53) (0.52) PR > ChiSq <.0001 <.0001 % African American in Neighborhood Coefficient (0.93) (0.28) PR > ChiSq <.0001 <.0001 % Hispanic in Neighborhood Coefficient 0.25 0.30 PR > ChiSq <.0001 <.0001 Refinance Loans African American Borrower Coefficient (0.92) (0.67) PR > ChiSq <.0001 <.0001 Hispanic Borrower Coefficient (0.46) (0.38) PR > ChiSq <.0001 <.0001 % African American in Neighborhood Coefficient (1.02) (0.33) PR > ChiSq <.0001 <.0001 % Hispanic in Neighborhood Coefficient (0.10) (0.01) PR > ChiSq <.0001 <.0001
Note: Simple Model includes explanatory variables from Borrower, Neighborhood and MSA specific effects blocks. Full model includes all explanatory variables.
Critics have suggested that these simple studies are flawed, in that they failed to account for
other important variables – not included in basic HMDA data – that also influence lending
patterns. According to this view, the “left out variable problem” can bias the coefficients on
race/ethnicity to the extent that the omitted variables are correlated with race. Comparison of the
coefficients on race and ethnicity in the “simple” and the “full” models demonstrated that
concern over left out variables is warranted. In general, the addition of supplementary
information, including other lender characteristics, as well as information on neighborhood level
credit quality, served to reduce the extent that observed disparities can be directly attributed to
racial factors alone. For example, the coefficients of both the home purchase and refinance
equations for “percent of African Americans in the neighborhood” become noticeably less
negative (suggesting a smaller prime lending gap). A similar shift was observed for the “African
American borrower” coefficient, but this occurred only in the refinance equation.
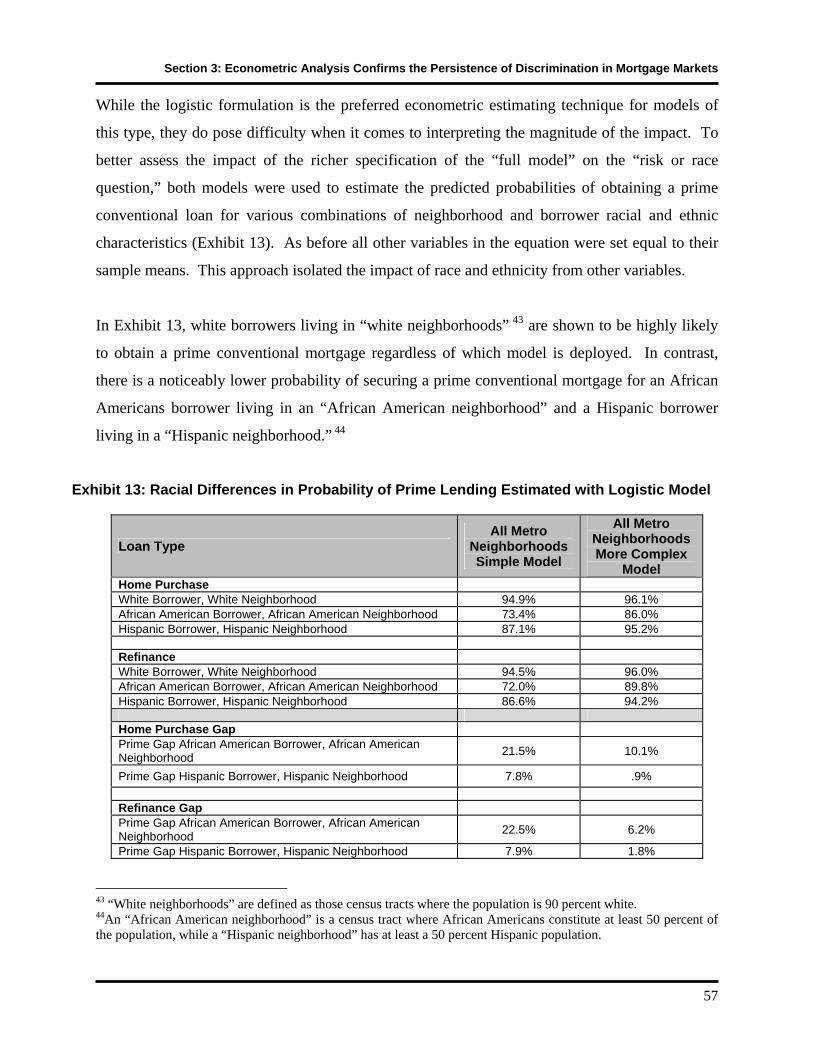
Section 3: Econometric Analysis Confirms the Persistence of Discrimination in Mortgage Markets
57
While the logistic formulation is the preferred econometric estimating technique for models of
this type, they do pose difficulty when it comes to interpreting the magnitude of the impact. To
better assess the impact of the richer specification of the “full model” on the “risk or race
question,” both models were used to estimate the predicted probabilities of obtaining a prime
conventional loan for various combinations of neighborhood and borrower racial and ethnic
characteristics (Exhibit 13). As before all other variables in the equation were set equal to their
sample means. This approach isolated the impact of race and ethnicity from other variables.
In Exhibit 13, white borrowers living in “white neighborhoods” 43 are shown to be highly likely
to obtain a prime conventional mortgage regardless of which model is deployed. In contrast,
there is a noticeably lower probability of securing a prime conventional mortgage for an African
Americans borrower living in an “African American neighborhood” and a Hispanic borrower
living in a “Hispanic neighborhood.” 44
Exhibit 13: Racial Differences in Probability of Prime Lending Estimated with Logistic Model
Loan Type All Metro
Neighborhoods Simple Model
All Metro Neighborhoods More Complex
Model Home Purchase White Borrower, White Neighborhood 94.9% 96.1% African American Borrower, African American Neighborhood 73.4% 86.0% Hispanic Borrower, Hispanic Neighborhood 87.1% 95.2% Refinance White Borrower, White Neighborhood 94.5% 96.0% African American Borrower, African American Neighborhood 72.0% 89.8% Hispanic Borrower, Hispanic Neighborhood 86.6% 94.2% Home Purchase Gap Prime Gap African American Borrower, African American Neighborhood 21.5% 10.1%
Prime Gap Hispanic Borrower, Hispanic Neighborhood 7.8% .9% Refinance Gap Prime Gap African American Borrower, African American Neighborhood 22.5% 6.2%
Prime Gap Hispanic Borrower, Hispanic Neighborhood 7.9% 1.8% 43 “White neighborhoods” are defined as those census tracts where the population is 90 percent white. 44An “African American neighborhood” is a census tract where African Americans constitute at least 50 percent of the population, while a “Hispanic neighborhood” has at least a 50 percent Hispanic population.
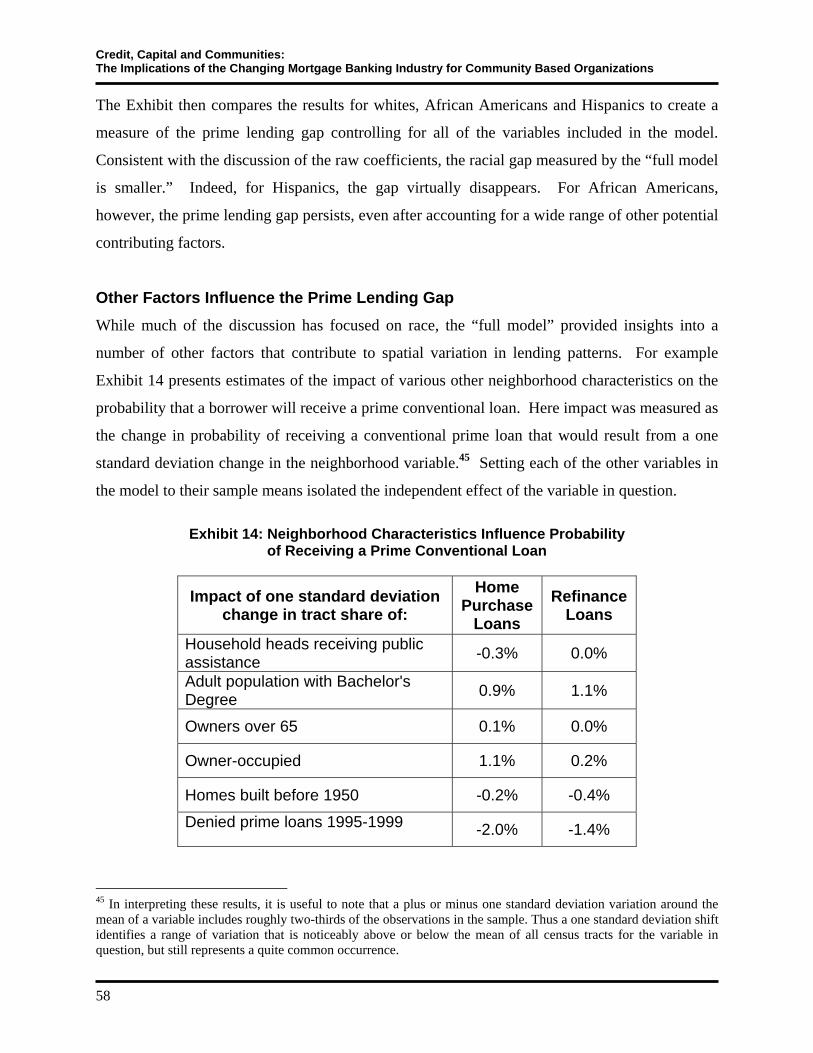
Credit, Capital and Communities: The Implications of the Changing Mortgage Banking Industry for Community Based Organizations
58
The Exhibit then compares the results for whites, African Americans and Hispanics to create a
measure of the prime lending gap controlling for all of the variables included in the model.
Consistent with the discussion of the raw coefficients, the racial gap measured by the “full model
is smaller.” Indeed, for Hispanics, the gap virtually disappears. For African Americans,
however, the prime lending gap persists, even after accounting for a wide range of other potential
contributing factors.
Other Factors Influence the Prime Lending Gap While much of the discussion has focused on race, the “full model” provided insights into a
number of other factors that contribute to spatial variation in lending patterns. For example
Exhibit 14 presents estimates of the impact of various other neighborhood characteristics on the
probability that a borrower will receive a prime conventional loan. Here impact was measured as
the change in probability of receiving a conventional prime loan that would result from a one
standard deviation change in the neighborhood variable.45 Setting each of the other variables in
the model to their sample means isolated the independent effect of the variable in question.
Exhibit 14: Neighborhood Characteristics Influence Probability
of Receiving a Prime Conventional Loan
Impact of one standard deviation change in tract share of:
Home Purchase
Loans Refinance
Loans
Household heads receiving public assistance -0.3% 0.0%
Adult population with Bachelor's Degree 0.9% 1.1%
Owners over 65 0.1% 0.0%
Owner-occupied 1.1% 0.2%
Homes built before 1950 -0.2% -0.4%
Denied prime loans 1995-1999 -2.0% -1.4%
45 In interpreting these results, it is useful to note that a plus or minus one standard deviation variation around the mean of a variable includes roughly two-thirds of the observations in the sample. Thus a one standard deviation shift identifies a range of variation that is noticeably above or below the mean of all census tracts for the variable in question, but still represents a quite common occurrence.
Section 3: Econometric Analysis Confirms the Persistence of Discrimination in Mortgage Markets
59
While decidedly smaller than the race/ethnicity impacts, Exhibit 14 does demonstrate that other
neighborhood characteristics contribute to the observed spatial pattern of prime lending. The
measure of neighborhood credit quality appears to have the biggest impact in that higher denial
rates in the past are linked to noticeably lower prime conventional lending. Alternatively, areas
with relatively high shares of college educated individuals appear more likely to secure prime
conventional loans. Note that this finding holds even though the model has already controlled
for neighborhood and family income. These findings are consistent with the earlier discussions
suggesting that subprime lenders may target neighborhoods with borrowers with limited capacity
or willingness to shop for mortgages.
With the “full model” it was also possible to isolate the impact of lender characteristics and
secondary market treatment of loans. In these calculations, the base case was a “portfolio loan,”
made by a CRA-regulated entity, operating in their CRA designated assessment area, and not
sold to a secondary market entity or other institution. Two general points emerge from the impact
estimates presented in Exhibit 15. Even controlling for detailed borrower and neighborhood
characteristics, the way in which a loan is made, or the lending channel matters. For example,
there is a more significant prime lending gap for loans made by entities not subject to CRA
oversight. A similar finding holds for CRA regulated banking institutions operating outside of
their assessment areas. This tendency is especially pronounced for home refinance loans.
Unlike traditional assessment area lenders, other mortgage entities and their growing mortgage
broker network are the principal contributors to the observed prime mortgage lending gap.
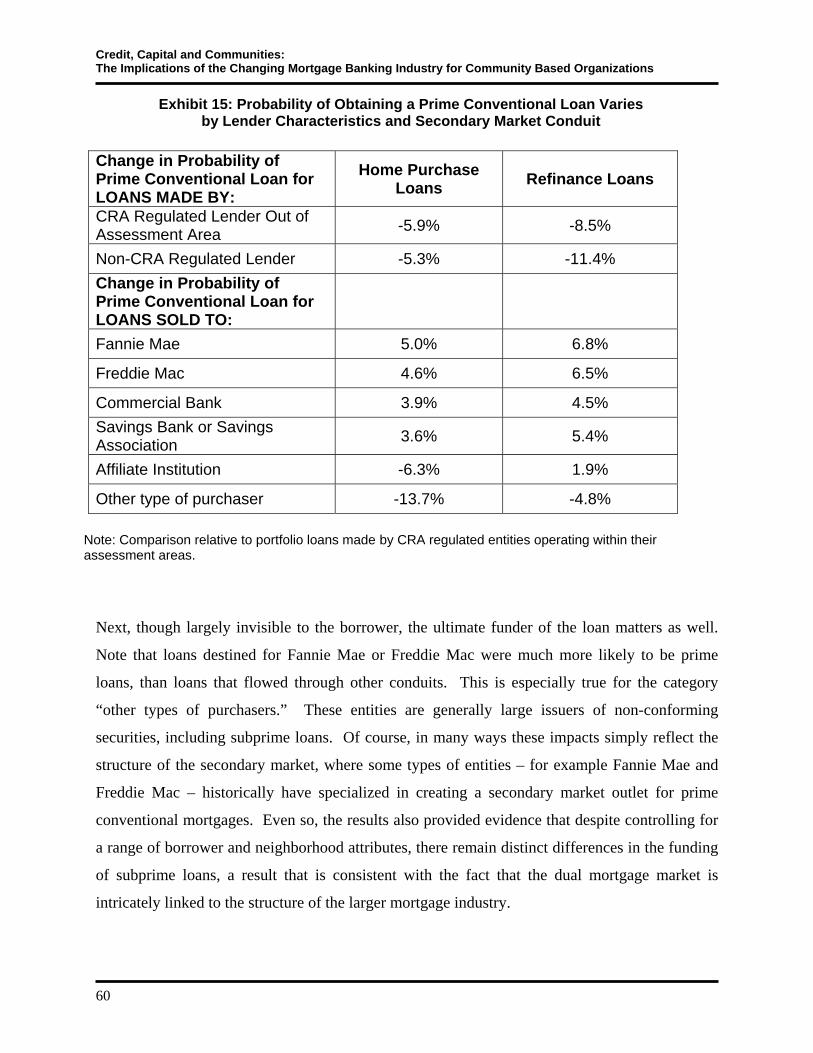
Credit, Capital and Communities: The Implications of the Changing Mortgage Banking Industry for Community Based Organizations
60
Exhibit 15: Probability of Obtaining a Prime Conventional Loan Varies by Lender Characteristics and Secondary Market Conduit
Change in Probability of Prime Conventional Loan for LOANS MADE BY:
Home Purchase Loans Refinance Loans
CRA Regulated Lender Out of Assessment Area -5.9% -8.5%
Non-CRA Regulated Lender -5.3% -11.4% Change in Probability of Prime Conventional Loan for LOANS SOLD TO:
Fannie Mae 5.0% 6.8%
Freddie Mac 4.6% 6.5%
Commercial Bank 3.9% 4.5% Savings Bank or Savings Association 3.6% 5.4%
Affiliate Institution -6.3% 1.9%
Other type of purchaser -13.7% -4.8%
Note: Comparison relative to portfolio loans made by CRA regulated entities operating within their assessment areas.
Next, though largely invisible to the borrower, the ultimate funder of the loan matters as well.
Note that loans destined for Fannie Mae or Freddie Mac were much more likely to be prime
loans, than loans that flowed through other conduits. This is especially true for the category
“other types of purchasers.” These entities are generally large issuers of non-conforming
securities, including subprime loans. Of course, in many ways these impacts simply reflect the
structure of the secondary market, where some types of entities – for example Fannie Mae and
Freddie Mac – historically have specialized in creating a secondary market outlet for prime
conventional mortgages. Even so, the results also provided evidence that despite controlling for
a range of borrower and neighborhood attributes, there remain distinct differences in the funding
of subprime loans, a result that is consistent with the fact that the dual mortgage market is
intricately linked to the structure of the larger mortgage industry.

SECTION 4: CHANGES IN THE MORTGAGE INDUSTRY CHALLENGE THE ACTIVITIES OF COMMUNITY BASED ORGANIZATIONS
The mortgage market in the United States has evolved into one of the most efficient capital
markets in the world. Even so, many lower-income and minority borrowers still do not gain
access to the best mortgages for which they could qualify, and defaults and foreclosures,
particularly on subprime loans, are on the rise in many lower-income communities across the
country. This section begins with a brief review of the historical role played by community based
organizations in expanding access to capital in disadvantaged communities, and continues on to
discuss how the dual mortgage market structure threatens to undermine over three decades of
community revitalization efforts. The section concludes with an assessment of the implications
of these trends for CBO direct loan programs, as well as their homebuyer education and
counseling and political advocacy.
The Historical Role of Community-Based Organizations CBOs have long been central to efforts to expand access to mortgage capital to low-income
people and communities. Seeking to rally public support against redlining - the systematic
denial of mortgage credit to neighborhoods and groups in less prosperous sections of US
metropolitan areas - grass roots organizations began in the 1960s and 1970s to mobilize residents
of economically distressed neighborhoods. Banks were one logical target of this activism.
Indeed, much of the effort that led to the passage of the Community Reinvestment Act (CRA) in
1977 was built on the simple proposition that federally insured and regulated commercial banks
and thrift institutions had an affirmative obligation to lend in areas where they maintained
deposit taking operations or were otherwise chartered to serve.
What emerged from the combination of community-based activism and legislative efforts was a
period in the 1980s and early 1990s described by one community leader in Chicago as the
“Golden Age of Community Activism;” a period when CBOs put significant pressure on banks
to expand the reach of their lending and banking activities. Dubbed “regulation from below,”
community groups armed with Home Mortgage Disclosure Act (HMDA) data and backed by the
Credit, Capital and Communities: The Implications of the Changing Mortgage Banking Industry for Community Based Organizations
62
legislative mandate of CRA pressured federally regulated banking organizations to increase the
number of loans made to minority and/or low-income borrowers.46
These local lending initiatives got a shot in the arm in the mid-1970s when. Congress chartered
two national non-profit organizations: the Neighborhood Reinvestment Corporation (NRC) and
Neighborhood Housing Services of America (NHSA). NRC provides financial support,
technical assistance, and training for community based revitalization efforts to what has emerged
as a national network of local NeighborWorks Organizations. NHSA pioneered the creation of a
secondary market outlet for local mortgage lending efforts aimed at traditionally underserved
markets.47 In addition, major foundations such as the Enterprise, Fannie Mae, Ford and
MacArthur, along with national non profit organizations such as the Center for Community
Change, the Housing Assistance Council, the Local Initiatives Support Coalition, the National
Community Reinvestment Coalition, and the National Low Income Housing Coalition also
provided crucial support to local CBOs in their advocacy and organizing and economic and
housing development efforts.
The relationship that evolved between community groups and banks involved both
‘collaboration’ and ‘confrontation.’48 Negotiations between community groups and local banks
focused on mortgage or small business lending, provision of banking services in particular low-
income areas, and the weak record of particular institutions in serving minority communities.
The result was an expanded array of new products with more flexible underwriting standards that
made it possible to qualify many borrowers that had previously been rejected.
Of course, many CRA-eligible customers presented additional lending risks that banks were
reluctant to tackle. One common approach employed by CBOs was to “restore the market” by
developing new lending programs that relied on both public and foundation monies, as well as
grants and below market rate capital from the banking industry to write down mortgage interest
rates, help borrowers make the required downpayment, or otherwise assist borrowers unable to
qualify for a market rate loan. These loan programs not only expanded access to capital in
46 Fishbein, 1992. 47 For more complete description of these organizations see Neighborhood Reinvestment website at www.nw.org 48 Schwartz, 1999.
Section 4: Changes in the Mortgage Industry Challenge the Activities of Community Based Organizations
63
underserved communities, they also became a significant revenue source for selected CBOs.
Reflecting the views of many CBOs engaged in direct lending activities, Bruce Gottschall, the
Executive Director of the Neighborhood Housing Services of Chicago (NHSC), observed that
you have to “figure out how you actually get paid for what you’re doing,” (Husock 2002: 5,6)
and use the funds to help subsidize other organizational activities.
Though hailed by many as representing the best of innovative lending programs, many lenders
predictably described these new CBO/bank partnerships as “CRA-led extortion.” Even so, faced
with activism that could delay planned mergers and/or damage their reputation in the market,
many bankers reluctantly entered into negotiations with community groups and began to
aggressively expand their outreach to low-income and/or minority neighborhoods. And with the
emergence of inter-state banking, the number and scale of CRA commitments to make loans,
investments and services to minority and low-income households increased dramatically.
Indeed, one analyst estimated that there has been almost $1 trillion dollars committed by banks
for CRA activities since 1992, a figure that includes several multi-billion dollar commitments
made by national scale lenders.49
In addition to the creation of local lending programs and new product choices, community
groups and banks joined forces to promote homebuyer education. Over time the efforts of
counseling and financial literacy networks operated by the Neighborhood Reinvestment
Corporation, the National Community Reinvestment Coalition, ACORN, the Urban League and
others have helped thousands of families to realize their dreams of homeownership. Homebuyer
education and counseling programs have also emerged as an important revenue source for CBOs.
What started out as an opportunity for lenders and community groups to work together, has
grown to a nationwide network of community-based homebuying counseling and education
programs, and has become good business for both banks and community groups.
Adverse Consequences of the Dual Market Structure Despite over 25 years of successful efforts to expand access to capital in lower-income
communities, the growth of subprime lending and the dual market pose a serious threat to the
49 NCRC, 2001.

Credit, Capital and Communities: The Implications of the Changing Mortgage Banking Industry for Community Based Organizations
64
stability and vitality of lower-income communities. The relatively low share of conventional
prime loans in the lower-income and minority segments of the market raises questions about
whether all borrowers receive credit at the most favorable pricing and terms for which they could
qualify. Since even small increases in the interest rate of a loan can impact a borrower’s ability to
meet monthly payments and cover basic living expenses, this question merits investigation.
Moreover, default and foreclosure rates are higher for subprime, government backed, and
manufactured home loans, which can destabilize the already weak neighborhoods where these
loans tend to be concentrated. Finally, the incidence of abusive lending practices appears to be
more prevalent in the subprime market.
1. The Growth of Alternative Mortgages and Abusive Practices While the growth of mortgage lending to credit-impaired borrowers has expanded access to
capital, it has also exposed borrowers to numerous abuses, such as predatory lending, that exist
in today’s mortgage marketplace. The HUD/Treasury Task Force Report observed that while
mortgage lending is regulated by both state and federal authorities, none of the existing statutes
and regulations governing mortgage transactions clearly defines predatory lending. As
commonly described in existing literature, predatory lending may involve mortgage bankers and
brokers, realtors, appraisers, home improvement contractors, or others involved directly or
indirectly in mortgage lending. Predatory practices not only include outright deception and fraud,
but also efforts to manipulate the borrower through aggressive sales tactics or to exploit their
lack of understanding about loan terms.50
In an extensive review of the policy issues, Engel and McCoy (2002) noted that while predatory
lending practices can and do occur in all market segments, such practices are concentrated in the
subprime segment. Engel and McCoy described three distinct mortgage markets: the prime
market, the “legitimate” subprime market, and the predatory market. They argued that predatory
lenders target vulnerable borrowers who are typically disconnected from credit markets and
therefore lack information about best available products or are subject to lingering mortgage
market discrimination and other social and demographic forces.
50 U.S. Department of the Treasury and U.S. Department of Housing and Urban Development, 2000.
Section 4: Changes in the Mortgage Industry Challenge the Activities of Community Based Organizations
65
Engel and McCoy documented numerous predatory practices that strip the borrower’s home
equity, burden the borrower with higher interest rates and fees, or disregard the borrower’s
ability to repay thereby setting them up for foreclosure. In the most egregious examples,
unscrupulous real estate agents, mortgage brokers, appraisers, and lenders dupe unsuspecting
borrowers into purchasing a home at inflated prices or with significant undisclosed repairs. These
practices harm borrowers and their communities, and they also impose costs on mortgage
investors and insurers.
Mortgage loans are priced in the secondary market based on assumptions concerning the
underlying market value of the asset. By reducing true equity in the home (the true market value
less the amount of the mortgage), an inflated appraisal makes it difficult for a borrower to sell
their home and repay the mortgage in a time of distress. This, in turn, increases the likelihood
that the mortgage will go into default and increases the magnitude of losses incurred by the
mortgage insurers and investors during the foreclosure process.
2. Alternative Mortgage Products Have Higher Costs In theory, prime loans are available to the “best” borrowers on the “best” terms and rates in the
marketplace. In practice, however, the mortgage market does not live up to that standard. Many
borrowers are offered a subprime loan even if they could have qualified for a prime conventional
loan at a prime mortgage interest rate.
The extent of the harm done to a particular borrower, who could qualify yet fails to secure a
prime loan, depends on the credit characteristics of the individual borrower and the loan type that
is secured. The HUD/Treasury Task Force (2000) estimated that more than half of all subprime
loans originated from July through September 1999 had interest rates in excess of 10.5 percent,
well above rates for prime loans over the same period, which ranged from 7 to 8 percent. Clearly,
the cost of not obtaining a prime loan can be substantial. Indeed, Mortgage Information
Corporation (1999) (now LoanPerformance) data for 1999 suggested that 17 percent of subprime
borrowers paid more than 4 percentage points above prime rates.
Credit, Capital and Communities: The Implications of the Changing Mortgage Banking Industry for Community Based Organizations
66
These higher cost loans can add substantially to the housing cost burdens of lower-income
families. For example, Joint Center estimates show that a 30-year fixed rate loan of $100,000 at
7 percent produces a monthly payment of $665. The monthly payment for a 10 percent loan of
the same size and type would be $213 higher. Not obtaining the best mortgage rate available in
the market is not only unfair, it also substantially increases the mortgage burden of for low-
income, owner families, and may be the first step to eventual default and foreclosure. 51
In addition to higher interest rates, subprime loans typically include higher fees to compensate
the lender for the higher default and prepayment risk. Through hearings in five cities, the
HUD/Treasury Task Force Report found many instances “… of fees that far exceeded what
would be expected or justified based on economic grounds, and fees that were ‘packed’ into the
loan amount without the borrower’s understanding” (2000:2) The report also noted the all-too-
common practice of making loans irrespective of the borrower’s ability to repay. In these
instances, high front-end fees – often rolled into the mortgage and paid out of the equity claimed
by the lender during the foreclosure process – are sufficient to compensate the lender even when
the probability is very high that the borrower will default on the loan.
3. Rising Foreclosures Threaten Neighborhood Stability Whatever factors sustain the high levels of subprime or other alternatives to prime lending in
lower-income and/or minority neighborhoods, foreclosures are on the rise in many
neighborhoods across the country. The National Training and Information Center estimated that
the foreclosure rate in Chicago stood at 4.7 percent in 2001 - over ten times the national average
foreclosure rate for prime conventional loans. In the nine low-income neighborhoods served by
Chicago Neighborhood Housing Services, the foreclosure rate reached 7.7 percent. Overall,
some 40 percent of all completed foreclosures in Chicago were in these nine target
neighborhoods. Yet, these communities represented only 5 percent of all mortgage originations
in 2001 and accounted for just 18 percent of the city’s population.52
51 Joint Center for Housing Studies, 2002. 52 Collins, 2003.
Section 4: Changes in the Mortgage Industry Challenge the Activities of Community Based Organizations
67
The recent surge in foreclosures in many low-income and minority communities appears to stem
from the growing presence of subprime lending, and in particular the extension of loans to
borrowers with limited capacity to repay, or at rates that are well above market. Employing the
best available data on loan performance, Cutts and Van Order (2003) estimated that, as of June
2002, the serious delinquency rate for conventional prime loans was 0.55 percent (serious
delinquency is defined as loans that are already in foreclosure and/or with payments that are 90
days or more late). In contrast, subprime loans had a serious delinquency rate of 10.44 percent,
nearly 20 times higher. Further, the more risky subprime loan examined by Cutts and Van Order
(labeled in the study as ‘C’ or ‘CC’ loans) had rates as high as 21 percent. Subprime serious
delinquency rates were more than twice those of FHA insured mortgages (4.45 percent), the
traditional source of many foreclosure problems. Though hardly in evidence a decade ago,
subprime loans are now the most default-prone mortgage segment of the home loan market.
Increasing default and foreclosure rates have led many analysts to question whether the recent
increase in low-income homeownership – built in part on the rapid growth of subprime lending –
is sustainable or even desirable. A HUD study of Baltimore noted that the number of
foreclosures increased from 1,900 in 1995 to over 5,000 in 1999 and that the growth was
particularly pronounced in African American areas.53 The study further documented that over a
quarter of the subprime loans in foreclosure in the first quarter of 2000 were less than a year old
and over half were less than two years old. The high shares of loans in foreclosure less than two
years after origination suggests that many borrowers may have lacked the capacity to repay the
loan at the time it was made.
To date there have been over ten studies of foreclosure activity in individual metropolitan areas.
Though economic factors obviously play a role, these studies paint a remarkably consistent
picture of the rising incidence of foreclosure in a period of strong economic growth, led in large
measure by the relatively high incidence of foreclosure among subprime loans in lower-income
and minority neighborhoods.54 One notable exception is Rochester, New York. Although
historically many Rochester home buyers were victimized by abusive lending practices in the
53 U.S Department of Housing and Urban Development, 2000. 54 See for example, Gruenstein and Herbert, 2000a and 2000b.
Credit, Capital and Communities: The Implications of the Changing Mortgage Banking Industry for Community Based Organizations
68
FHA segment of the mortgage market, more recently the rise in foreclosures appears to be the
result of the persistent decline in property values in central city neighborhoods.55
Foreclosures can have a devastating impact on the families who lose their home and are left with
a damaged credit record. Not only is their ability to secure a home loan in the future
undermined, but the cost of borrowing for other purposes, such as purchasing a car to get to
work, will be higher. Foreclosures have equally severe impacts at the neighborhood level. In
distressed neighborhoods, foreclosed properties may remain vacant for a prolonged period of
time, depressing property values and becoming a magnet for crime. By discouraging families or
new businesses from moving into a neighborhood, high foreclosure rates contribute to
neighborhood instability and stigma.
4. Regulations Fail to Keep Pace Despite the adverse consequences of the dual market, mortgage lending regulations have not kept
pace with the changing marketplace, especially in the lower-income and minority segments.
When Congress passed the Community Reinvestment Act (CRA) in 1977, depository institutions
– including many locally based banks and thrifts – dominated mortgage lending. CRA responded
to the claims that savings and loan associations and banks were ‘redlining’ low-income areas, in
effect denying credit based on racial characteristics of the neighborhood rather than the
creditworthiness of individual loan applicants.
The decoupling of mortgage lending from branch-based deposit-gathering institutions has
challenged a basic premise on which CRA was based. Consequently, CRA mandated intensive
review of lending in ‘assessment areas’ (defined as areas where banks maintain deposit-taking
branches) has been seriously undermined. Indeed, banking organizations operating outside of
their CRA assessment areas today constitute the fastest growing segment of the residential
mortgage market. Between 1993 and 2001, the number of home purchase loans made by CRA-
regulated institutions in their assessment areas as a share of all home purchase loans fell from
36.0 percent to 28.4 percent (Exhibit 16). Even as Congress, through the Gramm-Leach-Bliley
Act of 1999, focused on financial services modernization, CRA, while protected, was not made
55 The Housing Council, 2000.

Section 4: Changes in the Mortgage Industry Challenge the Activities of Community Based Organizations
69
to conform with the rapidly evolving world of mortgage banking and financial services—let
alone anticipate and limit the most predatory practices.56
Exhibit 16: Assessment Area Lending Has Fallen Steadily
0%
5%
10%
15%
20%
25%
30%
35%
40%
45%
50%
1993 1994 1995 1996 1997 1998 1999 2000 2001
refinance home purchase
Source: Joint Center Enhanced HMDA Database
Finally, HMDA data collection efforts have also failed to keep pace with the changing mortgage
market. Over the years, HMDA data have been the primary tool used to complement street-level
activism by community advocates. These groups have used HMDA to evaluate, and in some
instances register complaints with regulators about, the performance of specific lenders in their
communities. Despite its earlier importance, HMDA’s usefulness waned as reporting
requirements failed to adequately track the growth of subprime lending, particularly high-cost
lending done by consumer lending organizations, and other non-depository lenders. The failure
of Congress and the federal regulators to adapt HMDA collection activities to reflect market
trends, not only limited the capacity of CBOs to accurately track lending patterns in their
56 For further discussion see Apgar and Duda, 2003.
Credit, Capital and Communities: The Implications of the Changing Mortgage Banking Industry for Community Based Organizations
70
neighborhoods, it also hindered their ability to evaluate the competitive threat that subprime
lending presented to their own direct lending initiatives.
To better understand the implications of the rapid expansion of mortgage product offerings,
particularly as related to lower-income households and communities, the Federal Reserve Board
issued a rule in January of 2002 to expand the number of non-depository institutions subject to
HMDA reporting to disclose pricing data on higher cost loans, and to specifically identify loans
on manufactured housing.57 Though the new regulations were modest in scope, and the
implementation of the rule governing the reporting of the APR on “high-cost” loans was delayed
until January 2004, for the first time, CBOs will be able to identify the presence of particular
subprime lenders operating in their communities and assess if and how these lenders work to
undermine the effectiveness of their direct lending programs. Unfortunately, regulators have
been reluctant to require lenders to include data on credit scores or other factors required to
assess whether the rate is appropriate given the creditworthiness of the borrower, data that are
generally accessible to large financial services companies operating in the marketplace, but
difficult, if not impossible for CBOs to attain.
Growth of Mortgage Giants Blunts CBO Advocacy The changing structure of the mortgage industry also challenges the ability of CBOs to ensure
that the residents they serve are treated fairly in the mortgage market. Due to the rapid growth of
mortgage lending to lower-income and minority borrowers and neighborhoods, advocates today
must focus less on whether any lending takes place, and more on whether the lending that does
take place is done at the best rates and terms for which borrowers would qualify. Unfortunately,
HMDA data do not provide detail on the characteristics of new mortgage products and CBOs are
increasingly challenged to hold large financial services giants accountable for their actions.
57 In particular, the new rule extended HMDA coverage to non-depository institutions making more than $25 million mortgage loans, and to report whether a loan is “high cost” as defined by the Home Ownership Protection Act as well as to report the spread between the annual percentage rate (APR) and the yield on the comparable Treasury security when the spread exceeds 3 percent for first-lien loans and exceeds 5 percentage points for subordinate-lien loans.
Section 4: Changes in the Mortgage Industry Challenge the Activities of Community Based Organizations
71
1. Changing Industry Structure Impacts CBO Negotiating Leverage Changes in the regulatory and market environment have noticeably impacted the ability of CBOs
to enlist lenders to support their mission. One manifestation of this phenomenon is the decline of
locally-specific lending agreements negotiated between banking institutions and CBOs. Once
the “bread and butter” of community organizing efforts, these “bilateral agreements” are
increasingly being replaced by highly visible unilateral commitments made by larger regional
and national scale lenders. Several bankers conceded that as they have grown in scale and their
lending operations have become more sophisticated, the need to work with community groups
has lessened. And as institutions become regional and national in scope, they not surprisingly
feel less accountable to particular local markets.
In the past, CBOs helped banks identify ‘good borrowers’ with limited or no credit history living
in distressed neighborhoods. Now, advocates and lenders alike acknowledge that due to
automated systems, banks now possess so much data about potential borrowers that their need
for assistance in marketing and outreach has eroded, allowing banks and community-based
organizations an opportunity to partner in new ways.
For many community leaders, the growing number of unilateral commitments represents what
they fear is a shift in the balance of power toward large lending institutions. This is not to say
that banks ignore CBOs or that CBOs no longer advocate for expanded lending. However,
Chicago area advocates asserted that even banks with a long history of partnering with local
community groups are pulling back. “Chicago is a special case, and banks have more reason to
deal with us, given the high visibility role that Chicago area advocates play in the national arena.
But even the same banks that are renewing CRA commitments here in Chicago are refusing to
sign comparable agreements in other cities.”
The decline of “bilateral agreements” also has implications for the ability of community groups
to secure funding and technical assistance from this new breed of larger, more sophisticated
mortgage banking organizations. Historically, locally-based institutions were a major source of
both funding and guidance for CBOs, which is why they lament their decline. The executive
director of a Baltimore CBO watched financial support for his organization dwindle when their
Credit, Capital and Communities: The Implications of the Changing Mortgage Banking Industry for Community Based Organizations
72
local bank was acquired by a national mortgage banking operation. For the twenty years prior to
this acquisition, the local bank was not only a major financial supporter of the CBO, but also
“walked the neighborhood with us and helped us craft some innovative programs.”
While funding, albeit at reduced levels, from the new national mortgage bank continued, this
executive director felt that his organization lost the close personal relationships and the various
forms of technical assistance, support and guidance that had been shared between the local bank
and the CBO. However, many lenders maintain that they are willing to fund programs so long as
they have some assurance that they are of a high standard and are meeting the stated goals.
Many CBOs continue to work with the locally-based, CRA-regulated entities that remain in their
cities and demonstrate surprisingly little knowledge about the new participants in the mortgage
market. CBOs are not alone in this respect as many public officials, researchers and foundation
officers demonstrate a similar lack of knowledge about the new players in the mortgage market.
This is, in part, due to the invisibility of mortgage brokers and other lenders who may not have a
physical presence in a city, yet do a substantial business. CBOs and their supporters need to
better understand the new players and begin to forge new relationships. Clearly, the lack of a
physical branch makes this task more challenging than in the past, but to continue to succeed in
their advocacy efforts, CBO leaders must continuously update their knowledge of the changing
mortgage industry structure and the new generation of mortgage industry leaders.
2. Impact on Community Loan Programs As discussed earlier, in an effort to expand access to capital, many CBOs developed what
appeared to be highly successful programs to originate loans to underserved neighborhoods
either directly or in partnership with a CRA-regulated lending institutions. For a time, limited
competition from the private sector meant that even the smallest and most inefficiently operated
program could succeed simply by being ‘the only game in town.’ However, many communities
that once lacked mortgage lenders are now awash in capital.
Data in Exhibit 17 depict the number of loans, and the number of lenders, as well as the number
and share of the largest national lending organizations (top 25 lenders) operating in census tracts
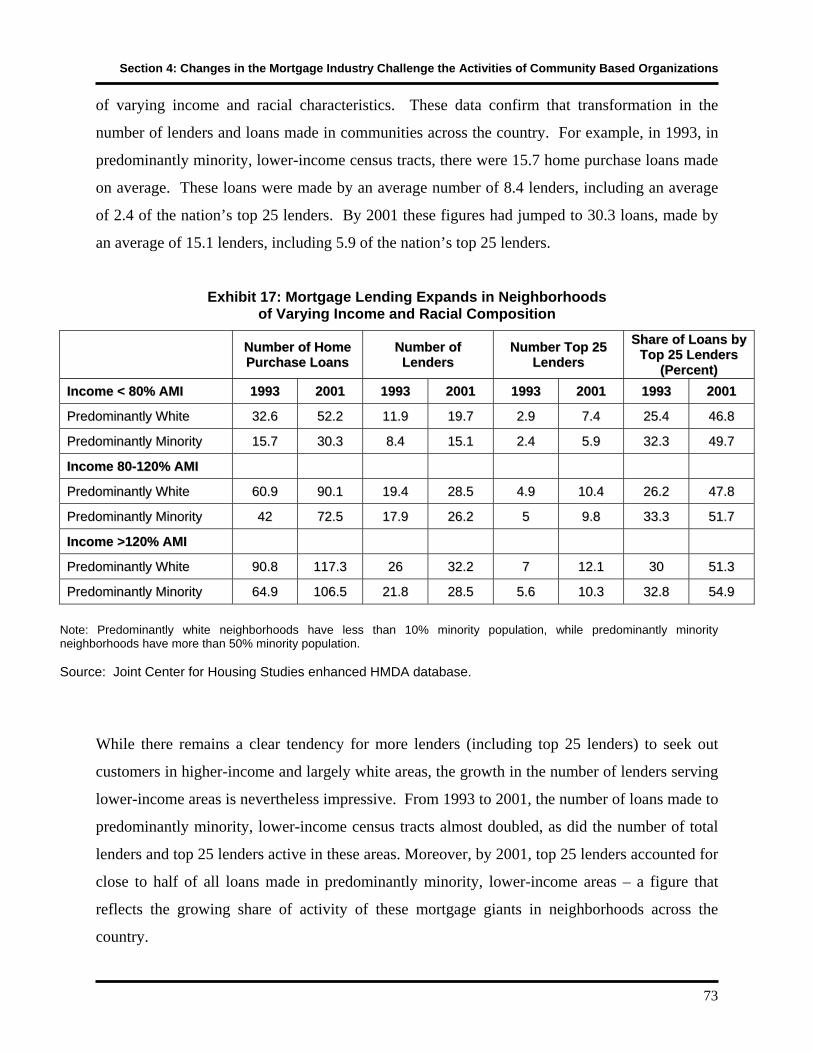
Section 4: Changes in the Mortgage Industry Challenge the Activities of Community Based Organizations
73
of varying income and racial characteristics. These data confirm that transformation in the
number of lenders and loans made in communities across the country. For example, in 1993, in
predominantly minority, lower-income census tracts, there were 15.7 home purchase loans made
on average. These loans were made by an average number of 8.4 lenders, including an average
of 2.4 of the nation’s top 25 lenders. By 2001 these figures had jumped to 30.3 loans, made by
an average of 15.1 lenders, including 5.9 of the nation’s top 25 lenders.
Exhibit 17: Mortgage Lending Expands in Neighborhoods of Varying Income and Racial Composition
NNuummbbeerr ooff HHoommee PPuurrcchhaassee LLooaannss
NNuummbbeerr ooff LLeennddeerrss
NNuummbbeerr TToopp 2255 LLeennddeerrss
SShhaarree ooff LLooaannss bbyy TToopp 2255 LLeennddeerrss
((PPeerrcceenntt)) IInnccoommee << 8800%% AAMMII 11999933 22000011 11999933 22000011 11999933 22000011 11999933 22000011
PPrreeddoommiinnaannttllyy WWhhiittee 3322..66 5522..22 1111..99 1199..77 22..99 77..44 2255..44 4466..88
PPrreeddoommiinnaannttllyy MMiinnoorriittyy 1155..77 3300..33 88..44 1155..11 22..44 55..99 3322..33 4499..77
IInnccoommee 8800--112200%% AAMMII
PPrreeddoommiinnaannttllyy WWhhiittee 6600..99 9900..11 1199..44 2288..55 44..99 1100..44 2266..22 4477..88
PPrreeddoommiinnaannttllyy MMiinnoorriittyy 4422 7722..55 1177..99 2266..22 55 99..88 3333..33 5511..77
IInnccoommee >>112200%% AAMMII
PPrreeddoommiinnaannttllyy WWhhiittee 9900..88 111177..33 2266 3322..22 77 1122..11 3300 5511..33
PPrreeddoommiinnaannttllyy MMiinnoorriittyy 6644..99 110066..55 2211..88 2288..55 55..66 1100..33 3322..88 5544..99
Note: Predominantly white neighborhoods have less than 10% minority population, while predominantly minority neighborhoods have more than 50% minority population. Source: Joint Center for Housing Studies enhanced HMDA database.
While there remains a clear tendency for more lenders (including top 25 lenders) to seek out
customers in higher-income and largely white areas, the growth in the number of lenders serving
lower-income areas is nevertheless impressive. From 1993 to 2001, the number of loans made to
predominantly minority, lower-income census tracts almost doubled, as did the number of total
lenders and top 25 lenders active in these areas. Moreover, by 2001, top 25 lenders accounted for
close to half of all loans made in predominantly minority, lower-income areas – a figure that
reflects the growing share of activity of these mortgage giants in neighborhoods across the
country.

Credit, Capital and Communities: The Implications of the Changing Mortgage Banking Industry for Community Based Organizations
74
Entry of large scale lending organizations into low-income markets has fundamentally altered
neighborhood scale lending activities. Faced with competition by highly efficient top 25 lenders,
smaller regional and local banks that were once active partners in locally crafted lending
initiatives have either abandoned their mortgage lending operations entirely, or now serve as loan
correspondents to larger national lenders. Even banks with a strong commitment to CRA
activities confirmed that increasing competition among banks for CRA-eligible loans has made it
difficult to deal with ‘special cases.’ One banker said, “We continue to work with local groups
to identify potential borrowers and work on individual case files, but we lose money on this part
of our business. Today, you have to be an automated, high-volume lender to make money in the
residential mortgage business.”
While automated systems make it easy to process applications for prospective buyers with credit
characteristics that fall within the norms of standard programs, the entry of large, well-
capitalized players into the lower-income market segment, does not mean that the new mortgage
delivery system necessarily provides “competitive pricing” to all market participants. Even as
automation has lowered the cost of reaching borrowers with well established credit, it remains a
more complicated – and more expensive – proposition to identify programs that fit the needs of
families with little or no credit history. As the head of one major banking organization observed,
“my retail guys don’t have the patience to serve those borrowers who don’t conform to standard
underwriting guidelines, and we are hard pressed to pay them enough to have the incentive to do
so.” As a result, an increasingly large segment of the subprime market is now left to smaller
scale brokers and others who develop the local knowledge and contacts to engage in the “high
touch” lending needed to reach out to the traditionally underserved. Once again, the broker
dominated mortgage system has done a good job at expanding access to credit, but in doing so
has exposed some of the nation’s most vulnerable citizens to mispricing and abusive lending
practices.
3. Impact on CBO Homebuyer Education and Counseling The growing complexity of mortgage products, combined with the rise of broker originated loans
and well capitalized and aggressive push marketing campaigns present new challenges to home
buyer education programs. The national focus on home buyer education builds on the
Section 4: Changes in the Mortgage Industry Challenge the Activities of Community Based Organizations
75
fundamental proposition that consumer education enhances the fairness and effectiveness of the
mortgage market. A recent study on home buyer counseling determined that its impact depends,
as might be expected, on the type of counseling offered (Hirad and Zorn 2002). The study found
that less expensive forms of counseling – including telephone and shorter one-day group
counseling sessions -- had little to no impact, at least when compared with more extensive (and
expensive) one-on-one counseling efforts.
This finding raises serious questions about the effectiveness of current counseling operations.
While greater product selection is generally good for consumers, the myriad of mortgage options
present in today’s market can easily overwhelm even the most sophisticated borrowers. CBOs
interviewed for this report described how all too often borrowers who had completed home buyer
education programs were won over by the marketing pitches of subprime lenders. The head of a
Boston based counseling group noted that in the past, most of their counseled borrowers were
able to obtain “good loans” through one of the area’s community loan programs, but today that
was often not the case. “It breaks our heart,” he observed, “that people graduate from our
program, only to end up in a high cost mortgage that could bankrupt them.”
This then is the challenge that an expanded array of mortgage products produces. In the past,
limited choices often meant that there were only a few choices – most typically a CRA-induced
bank loan program. As the market expands, communicating the advantages and disadvantages of
the various available mortgage products becomes even more important. Lower-income
borrowers must have access to the type of loan specific and trusted advice currently available to
higher-income borrowers; information to evaluate any current loan offer against the best terms
available in the market. While in principal, the ‘let the buyer beware’ approach could limit
abusive pricing in the market, the complexity of current mortgage products suggests that
consumer education alone will not address the problem. Today, counseling programs must not
only arm potential borrowers with basic information about mortgage loans, but also provide them
with the capacity to select the best loan available from a bewildering array of products marketed
by brokers with strong incentives to place the borrower in the most expensive mortgage possible.
Credit, Capital and Communities: The Implications of the Changing Mortgage Banking Industry for Community Based Organizations
76
Conclusion After decades of success in expanding access to capital to historically underserved communities,
CBOs and their funding partners face new challenges. Traditional approaches to direct lending
are less effective in today’s environment. Moreover, CBOs must recognize that the leverage
they once held over CRA-regulated local banks is slipping away. Over the last decade, larger
banking organizations have learned much about how to expand lending operations into
previously underserved market areas. Moreover, they are now better equipped to fulfill – if not
totally embrace – their CRA obligations. To continue to work effectively today, CBOs must not
only retool their mortgage lending operations, but also strengthen their capacity to assist
borrowers to protect themselves from abusive lending, to mitigate the serious consequences of
the rise in foreclosures that threatens to undo decades of community revitalization efforts.

SECTION 5: CBOS MUST WORK TO IMPROVE THEIR COMMUNITY LOAN PROGRAMS
Filling a void left by the redlining of low-income and minority neighborhoods, for over thirty
years, CBOs across the country initiated new programs to “restore the market” for home
mortgage lending. With the advent on the 1990s of new and highly automated mortgage delivery
systems, and benefiting from the knowledge gained from previous CBO loan programs,
subprime lending grew rapidly into previously underserved communities. Despite having access
to subsidized money and better pricing, many CBOs found it difficult to compete with the
extensive marketing campaigns and fast turn around times of these more sophisticated and
technologically proficient subprime lenders. This is unfortunate. Even though many subprime
lenders seek to extend mortgage credit to higher risk, low-income, low-wealth and/or minority
borrowers at fair prices and favorable terms, all too frequently subprime lending saddles
borrowers with excessively high costs, fees, and abusive practices that can turn the American
dream of homeownership into a nightmare of mortgage delinquency and default.
Even though CBO direct lending activity each year numbers in the tens of thousands of loans in
a mortgage industry where activity is measured in the millions of loans, CBOs have the potential
to regain their historical role as mortgage market innovator and advocate for enhanced access to
credit in historically underserved communities. To do so, however, will require CBOs to
fundamentally rethink and in many instances to dramatically restructure their direct lending
operation. This section examines the potential for CBOs and national non-profit financial
intermediaries – supported by their private, public, and philanthropic partners – to make better
use of emerging technologies to enhance their lending operations. It begins with a discussion of
how one of nation’s most prominent CBOs, Neighborhood Housing Services of Chicago
(NHSC), built a successful community loan program only to later witness their success
undermined by the advent of subprime lending. Following a brief review of how NHSC is now
responding to this challenge, the section then turns to a more general discussion of innovative
ways CBOs can expand the reach of their mortgage banking operations. Finally, this section
discusses how CBOs are supplementing their income by expanding into the real estate and
Credit, Capital and Communities: The Implications of the Changing Mortgage Banking Industry for Community Based Organizations
78
mortgage brokerage business, as well as selling mortgage servicing services to local government
and other small loan programs.
NHSC Adapts to a Changing Market Environment A recent case study of the Neighborhood Housing Services of Chicago (NHSC), documented the
forces that prompted the early growth and more recent restructuring of one of the nation’s
leading community based loan program (Husock 2002). Like other Neighborhood Housing
Services organizations, in the early 1980s, NHSC introduced a revolving loan fund to make
small home improvement loans to borrowers unable to secure a bank loan. The effort was
initially supported by foundation grants and funds from the Illinois Housing and Development
Agency, and later by federal Community Development Block Grant funds. In 1995, a pledge of
$41 million in below market rate loan capital from Continental Bank (later part of Bank of
America) shifted the program into high gear, and enabled NHSC to expand its loan operations to
include home purchase loans, as well as second mortgages to help meet closing costs and
downpayment requirements, or to fund needed home rehabilitation.
Yet by the end of the 1990s, NHSC’s highly successful loan program was in trouble. Despite
lower interest rates – as much as 900 basis points lower than prominent subprime lenders such as
Household Finance Corporation – NHSC had lost business to aggressive subprime lenders and
their network of highly motivated brokers. In part, NHSC’s inability to compete reflected their
commitment to quality lending. NHSC’s lending program requires that borrowers complete
rigorous, and often time consuming, home buyer education. In contrast, most subprime lenders
have no such requirement, and instead offer fast decisions and turnaround times that appeal to
families anxious to purchase a home of their own.
Subprime lenders, and their network of brokers and correspondents, also used their marketing
savvy and state of the art origination technology to reach a broad segment of NHSC’s target
market in a cost effective manner. Although well known in Chicago, NHSC could not compete
with the dollars spent by the subprime lenders on direct mail, billboard, radio and television
advertising. Nor could they match the speed (and low cost) at which these well capitalized
lenders originated loans. As a result, many potential home buyers in Chicago neighborhoods
Section 5: CBOs Must Work to Improve Their Community Loan Programs
79
who might have qualified for a less expensive NHSC loan, obtained more costly subprime loans.
Worse still, NHSC found that, in some cases, its counselors had spent weeks advising families on
the intricacies of home mortgage finance, only to lose these potential customers and the
associated fee income to a subprime lender.
Unfortunately, the Chicago situation is common suggesting the need for new approaches.
ACORN reported that many members of its national lending network find it difficult to place
their loans in the highly competitive market place as did participants in a roundtable discussion
held by Neighborhood Reinvestment’s Campaign for Homeownership. Indeed in establishing
their goals for 2003 to 2007, the Campaign stated that today, “almost anyone can get a
mortgage,” but often at “higher rates and more restrictive terms.” As a result, the Campaign’s
new strategy has a renewed focus on “credit pricing” and more extensive monitoring of the
“rates special populations actually receive” to better address the new competition in the market.58
Aided by a planning grant from the MacArthur Foundation, NHSC retooled its mortgage lending
operations – from front to back. It cut costs and reduced the time needed to originate a loan by
consolidating mortgage underwriting and loan origination operations in a central location. It
freed up additional resources by contracting with a major Chicago based bank to service its
loans. Similarly, working in partnership with Chicago area banks, NHSC created a $100 million
loan facility enabling them to sell loan pools to Chicago area banks. This arrangement not only
allows NHSC to replenish funds available to make new loans, it dramatically reduces the interest
rate, credit and collateral risk associated with originating and holding loans in portfolio. And
finally, it has recently partnered with a city and subprime industry representatives to develop a
comprehensive foreclosure avoidance program designed to both clean up the mess left by
abusive subprime lenders, as well as insure that future lending in their targets area adheres to the
highest industry standards.
58 For further description of the effort see the Neighborhood Reinvestment web site at www.nw.org
Credit, Capital and Communities: The Implications of the Changing Mortgage Banking Industry for Community Based Organizations
80
Retooling Community Loan Programs In addition to the newly revamped NHSC operations, there are a number of other remarkably
successful lending initiatives that employ state of the art program design and procedures to reach
credit-impaired, low wealth and low-income borrowers.
1. Using Technology to Improve Program Operations Recognizing the need for cost effective and timely mortgage delivery systems, CBOs and other
non-profit organizations are using the latest technology to support innovative lending to
historically difficult to serve borrowers. Chattanooga Neighborhood Enterprises (CNE) first
deployed automated underwriting technology nearly a decade ago. The efficiency gains of this
new technology not only enhanced the quality and speed of their underwriting decisions, it also
lowered the cost of loan origination, making loans a stable revenue source for the organization.
To date, CNE has extended below market rate mortgages to nearly 6,000 borrowers, and is able
to earn a small “profit” to help underwrite the cost of other programmatic operations.
Self-Help Credit Union’s Community Advantage Program (CAP) is another leading example
that uses state of the art technology to support an affordable lending initiative. Under the
program, banks around the country deploy best available technology to originate loans to “high
risk” borrowers according to flexible lending guidelines developed in partnership with Self-Help.
Banks in turn sell these loans to Self-Help and Self-Help assumes the default risk. Using funds
provided by the Ford Foundation, Self-Help retains a portion of the default risk that is sufficient
to enable them to sell the loans into the secondary market through Fannie Mae. In turn, the
participating banks are required to use the proceeds of these loan sales to fund new loans to low
wealth families, and the process starts all over again.
The results of the CAP are impressive indeed. As of 2002, Self-Help has provided $1.5 billion in
financing to 22,000 low- and moderate-income buyers in 46 states and the District of Columbia.
In exchange for helping participating banks get credit toward their CRA obligations and Fannie
Mae to its federally mandated affordable lending goals. Self-Help assists thousands of families
and accesses an effective mortgage delivery system with nationwide reach.
Section 5: CBOs Must Work to Improve Their Community Loan Programs
81
Despite the success of these and other programs, many CBOs resist the use of automated
underwriting and other technologically advanced systems. One common explanation offered by
CBO leaders interviewed for this report was that automated underwriting systems would limit
their ability to tailor loan products to meet the specific needs of their customers. Fearing that
these systems place undue weight on inaccurate or incomplete credit scores, one respondent
described automated systems as “technological redlining.”
These concerns have some merit. First and foremost automated underwriting systems utilize
what many perceive to be flawed credit reporting data. Noting the significant discrepancy in
credit scores as reported by the three major credit repositories – Equifax, Experian, and Trans
Union – a recent study conducted by the Consumer Federation of America and the National
Credit Reporting Association (2002) concluded that one in five consumers is at risk of being
misclassified into the subprime market due to inaccurate information in credit reports. Common
reporting errors included the failure to report a revolving charge account that was in good
standing or a mortgage account that had never experienced a late payment.
While they acknowledge the limitations of the underlying credit reporting data, proponents of
automated underwriting systems argue that well designed systems have not only improved the
ability to correctly evaluate and price mortgage risk, they have also enabled many lenders to
reach out and extend credit to borrowers with less than perfect credit records, limited capacity to
make a down payment, or other characteristics that previously would have limited their access to
credit. Moreover, the best automated underwriting systems seek to offset the limitations of credit
reporting by combining data from all three of the major credit repositories, including aggregate
credit scores and other specific measures of consumer behavior (such as a recent bankruptcy)
likely to be more accurately estimated in their evaluations, and placing less weight on what they
know to be usually unreliable data. Even so, with the exception of the yet to be released fair
lending review of the automated underwriting systems of Fannie Mae and Freddie Mac
conducted recently by HUD, there has been only limited independent review of these systems.
Absent detailed and objective evidence to the contrary, many advocates continue to harbor
suspicions related to the fairness of these systems.
Credit, Capital and Communities: The Implications of the Changing Mortgage Banking Industry for Community Based Organizations
82
Opinions are split between those that argue that some lenders use automated underwriting
systems as an excuse to deny loans to credit worthy borrowers, and those that contend that this
need not be the case. One CNE official observed that automated underwriting enables CNE to
quickly fund the “easy cases,” allowing them to devote additional staff time and effort to serve
borrowers with more substantial credit blemishes, or those with “thin or inaccurately reported
credit histories.” In short, for CBOs with the capacity to monitor their use, automated
underwriting systems can be designed to reflect the underwriting criteria, and the values and
norms of the CBO, while at the same time substantially improving operational efficiency.
Undoubtedly, more could be done to properly evaluate the credit quality of low-income people
living in low-income communities. For example, Pay Rent, Build Credit, Inc. is a new
consumer-directed credit bureau that enables renters to demonstrate timely payments of rent and
other recurring bill payments to build a credit history.59 There will be further improvement in the
ability of lenders and others to report and credit bureaus to gather needed data and to translate
this data into meaningful mortgage evaluation tools. This will better equip lenders to tailor
automated underwriting systems to serve the needs of “so-called” nontraditional borrowers.
Indeed, many individuals interviewed for this study noted that there was already a “bewildering
array” of mortgage products available. In short, crafting mortgage programs to meet local needs
remains a challenge. Yet there is ample opportunity to fashion a diverse set of loan products that
meet community needs that tap into the efficiencies offered by automated underwriting, risk-
based pricing, and state of the art mortgage servicing.
2. Contracting Out: The Make or Buy Decision With the Community Advantage Program, Self-Help combined market rate capital with socially
motivated funds to expand access to capital. Chattanooga Neighborhood Enterprise was also
able to lend “blended capital” with favorable rates and terms. Many community loan funds have
also amassed sizable pools of “socially motivated money” tapping Community Development
Block Grant and other government funds, as well as securing below market rate funds from
foundations and charitable organizations. Yet as noted in the Chicago NHSC example, many
CBOs continue use manual underwriting and other antiquated systems. Even those that have
59 For more information see the Pay Rent, Build Credit, Inc. website at www.payrentbuildcredit.com

Section 5: CBOs Must Work to Improve Their Community Loan Programs
83
attempted to automate lack the scale of operations to realize the full benefits of what often can
prove to be costly technology. Either way, inefficiently run programs risk losing business to
private sector competitors. And more troubling, every subsidy dollar that is wasted on inefficient
operations is one less subsidy dollar available to benefit low-income and low wealth borrowers.
In deciding how best to structure their operations, CBOs face what public finance experts term a
‘make or buy’ decision. Neighborhood Housing Services of Chicago (NHSC) once again
provides a valuable example of the issues surrounding this decision. Despite being one of the
nation’s largest community-based loan programs, NHSC lacked the internal organizational
capacity to fully benefit from the latest loan origination and servicing technology, and was
consequently unable to sell loans into the secondary market in a cost effective manner. As result,
some share of the subsidy present in its below market capital pools was increasingly diverted to
cover the costs of program operations.
To help address these issues, NHSC outsourced their loan servicing operations to MB Bank,
which has improved the quality and lowered the costs. While NHSC opted to “buy” access to
technology through its partnership with MB Bank, other groups choose to “make” or create their
own mortgage lending and servicing capacity in-house. This tendency to keep functions in-
house reflects, in many ways, a legacy of conditions that prevailed when these programs first
appeared on the scene. Until recently, many CBOs were the only entities willing to lend in
distressed inner city communities. Absent the availability of potential partners with knowledge
of lending in their target area, they had little choice but to “go it alone,” and that impulse remains
today.
Yet, today CBOs have a richer set of options. As noted earlier, there has been dramatic increase
in private sector lending in most low-income and minority areas, and equally substantial growth
in the number of organizations – especially well capitalized, large financial services
organizations – making loans in these areas. The “buy approach” acknowledges the expanded
array of potential partners and enables smaller community groups to tap into state of the art loan
origination, servicing and packaging, by outsourcing these functions to an existing mortgage
lender. The advantage of outsourcing is that the larger players in the mortgage industry have up

Credit, Capital and Communities: The Implications of the Changing Mortgage Banking Industry for Community Based Organizations
84
to date technology and considerable economies to scale. For example, their counselors may
handle high volumes of loans and gain the valuable experience necessary to help with loan loss
mitigation. In addition, by outsourcing some or all aspects of mortgage lending, a CBO can focus
its attention on activities that take advantage of its presence in the neighborhood, such as pre-
and post purchase counseling, neighborhood outreach, advocacy and foreclosure avoidance.
Some CBOs interviewed for this project were apprehensive that the “buy approach” would not
be cost effective and/or would leave them with little or no control over their mortgage lending
operations. This need not be the case. One CBO in Boston is contemplating partnering with a
large mortgage lender to originate and service a loan product that the CBO would design and
fund with low-cost money obtained from foundation grants. The CBO would continue to
provide home counseling and engage, when needed, in foreclosure avoidance efforts, two areas
where they perceive their presence in the community adds value. At the same time, they
recognize that by outsourcing some mortgage origination and servicing functions to a private
sector partner, they may achieve greater efficiency in their overall lending operations.
The “buy approach” requires identification of a willing and able partner, which is not always
easy. For example, one small Midwest CBO contracted with a local bank to service their loan
portfolio only to later have to terminate the contract and return to servicing “in house.” Yet it is
important to observe that the local bank agreed to take on the servicing task as a “favor” to the
CBO. They quickly discovered, however, that the job of servicing a portfolio of community
loans was more difficult than first imagined.
Yet despite the negative experience noted above, contracting out to a capable partner should both
lower costs and improve the overall quality of the community loan programs. Certainly, many
capable potential partners exist. For example, as a result of its partnership with NHSC, MB
Bank is exploring the possibility of providing similar services to other CBOs. The Boston area
CBO discussed earlier solicited the advice of a leading financial services expert to identify a list
of qualified potential partners. Intervention by a national network of community loan programs
or a national foundation could accelerate the move to outsourcing key elements of community
loan programs through the development of a pre-screened list of qualified partners, and/or by
Section 5: CBOs Must Work to Improve Their Community Loan Programs
85
assisting local CBOs with the often difficult task of conducting the due diligence required to
select a suitable partner.
Creating New Sources of Fee Income As CBOs have lost the support from many now defunct former banking partners, they have been
forced to rely more heavily on their direct lending efforts as a source of fee income. Yet without
the scale economies of the large private market players, this is a difficult business proposition.
Even so, many small CBOs continue to originate and service a handful of mortgages. Some
claim to actually make money, but frequently these statements reflect a failure to accurately
count the costs of operations, rather than a carefully honed estimate. And in too many instances,
this situation diverts subsidy dollars to compensate for inefficient operations that should go to
reduced mortgage rates.
One way to address problems associated with small scale lending programs is to expand the scale
of operations by selling excess capacity to others. For example, the Neighborhood Housing
Services of Phoenix (NHS Phoenix) is looking to translate its success at servicing its own loan
portfolio into a new business opportunity. Having mastered the intricacies of adapting an off the
shelf loan servicing software package to meet its own mortgage servicing needs, NHS Phoenix
can service additional loans at a relatively low marginal cost, and earn a small profit in doing so.
NHS Phoenix already has contracts in place to service loans for several local government-funded
revolving loan funds, as well as the loan portfolio of a local Habitat for Humanity group.
Similarly, CNE is considering offering their services to other CBOs in the region, groups that
would benefit from contracting out for more cost effective loan origination or loan servicing
services, but may be reluctant to secure these services in the open marketplace. Many smaller
CBOs currently lack the scale and capacity to take advantage of technologically driven business
opportunities. For these organizations, it will be especially important to identify the aspects of
the community revitalization process where they do have a strong competitive advantage.
In addition to loan servicing, several CBOs identified real estate and mortgage brokerage as a
potential source of revenue. The NHS of the Inland Empire now has several real estate brokers
Credit, Capital and Communities: The Implications of the Changing Mortgage Banking Industry for Community Based Organizations
86
on staff to handle the marketing and sales of homes that it builds and rehabilitates. The NHS of
Santa Fe is planning a full service company that will provide real estate and mortgage brokerage,
as well as mortgage origination and servicing. In this way, it hopes to capture some fee income
from graduates of its home buyer counseling programs, as well as earn additional fees from the
sale and financing of homes in its single-family construction programs.
These business ventures are not for everyone, however. Recognizing the difficulty of building a
business of sufficient quality and scale to be profitable, one CBO in California decided not to sell
its services to others. Since they already had mortgage brokerage capacity, this CBO felt it could
easily ramp up to sell these services to others. Nevertheless, they worried that operating a
mortgage brokerage business would detract their attention away from working on other
important revitalization initiatives. They were also reluctant to invest the time and energy to
develop what they perceived to be a potentially cyclical activity. In particular, they were
concerned that given cyclical nature of the business, funders might see any downturn in business
as a failure.
Despite the difficulty of operating a small scale, and potentially cyclical business venture, other
CBOs interviewed for this report were nevertheless considering entering the mortgage brokerage
business. A recent survey reported that some 34 CBOs now broker just over 5,000 loans totaling
$210 million (Hornburg 2003). Though the motivations for entering the non-profit brokerage
business varied, CBOs surveyed cited providing their clients with better-priced mortgages and
expanding upon existing relationships with mortgage industry partners. The challenge, of
course, is to establish an operation of sufficient scale. Indeed, non-profits broker average just
over 150 loans each.
Clearly further expansion of these efforts will be needed to realize their full potential. Yet the
CNE and NHS Phoenix examples illustrate that by aggregating the volume from a number of
smaller community loan programs, there is potential for a non-profit entity, or a community
minded for-profit player, to create a profitable business outsourcing mortgage banking and
mortgage services to a wider market. What is needed is for a national organization – such as
Section 5: CBOs Must Work to Improve Their Community Loan Programs
87
Neighborhood Reinvestment Corporation – to step forward and support the growth of a limited
number of entities that specialize in selling services to small scale CBO loan programs.
Conclusion Though the details of these programs differ, they share a common goal of supplementing overall
CBO program operations with fee income. While this can be a worthy goal, care must be
exercised to select business ventures suitable for small scale operations that take advantage of
CBOs’ visible and trusted presence in their community. To the extent that this is the case, even
relatively small scale CBOs may be able to develop a profitable real estate brokerage business.
At the same time, name recognition and community savvy is no guarantee that a small scale
organization will ever be able to efficiently service a small loan portfolio, or package and sell
loans into the secondary market – two tasks that exhibit substantial scale economies often
lacking in all but the largest of CBO programs.
The ability of smaller CBOs to respond to the changing lending environment has important
implications not only for individual CBOs, but also the future of the organizational structure of
the non-profit housing industry. If, as seems likely, a few non-profit organizations are able
expand the size and scope of their loan origination and servicing operations, the non-profit
housing industry will face the challenge of maintaining the strong “community” ties that are a
critical element of their ability to serve diverse neighborhoods.
Finally, national organizations will need to step-up their capacity to train and provide technical
assistance to CBOs seeking to exploit these niche opportunities. Absent this assistance, many
CBOs – along with the special knowledge of neighborhood conditions – may be either rendered
ineffective, or disappear altogether from the scene. Fortunately, as will be described in the next
sections, there are other important roles that smaller CBOs can play – including providing
homebuyer education and counseling and participating in foreclosure avoidance efforts – that
benefit from their extensive knowledge of local market conditions and the trust they have
engendered after years of neighborhood service.

SECTION 6: NEW ROLES PRESENT CBOS WITH NEW OPPORTUNITIES
The growth of mortgage lending to low-income and low wealth individuals has expanded access
to homeownership for millions, yet the new mortgage delivery system has left in its wake
continuing problems associated with the mispricing of mortgage credit, not to mention the
abusive practices encountered by some borrowers in the subprime market. While historically
CBOs mounted efforts to confront these abuses, to be effective in today’s rapidly changing
world, CBOs and their allies must develop new programs and new strategies.
This section identifies roles that CBOs can play to expand access to capital in a manner that
promotes affordable and stable long-term homeownership opportunities, while at the same time
providing assistance to existing homeowners struggling to cope with high debt burden and at risk
of losing their home through foreclosure. Finally, this section discusses recent effective advocacy
campaigns to promote needed regulatory reform and to pressure current market participants to
pursue best practices in mortgage origination, servicing and foreclosure avoidance.
Helping Homebuyers Get the Best Mortgage Available The complex array of available array of mortgage products can overwhelm even the most
knowledgeable borrower. Yet the consequences of this knowledge gap vary across borrowers.
For example, many higher-income borrowers have access to financial or legal advisors to guide
them through the intricacies of the borrowing process. In communities where homeownership is
prevalent, borrowers can also obtain useful advice from family and friends. Even in situations
where such advice is not forthcoming, borrowers with more extensive financial resources have a
greater capacity to make their monthly payments, even if they overpay for their mortgage credit.
In contrast, borrowers with fewer financial resources are more likely to suffer adverse
consequences due to over priced mortgages.
In an effort to protect more vulnerable borrowers, CBOs have engaged in a wide ranging set of
homebuyer outreach, education and counseling efforts. Yet in the face of aggressive “push
marketing” by many subprime lenders, CBO efforts must be revised to ensure that low-income
consumers obtain the best mortgage credit available in the market.
Section 6: New Roles Present CBOs with New Opportunities
89
1. Enhancing Home Buyer Education and Outreach To be successful, any homebuyer education program must be visible to the intended
beneficiaries. Historically real estate brokers referred credit-impaired customers to CBOs for
counseling and to help them identify an appropriate loan product. While many real estate
brokers continue to make these referrals, as a result of increased competition, mortgage real
estate brokers can now refer clients to any one of a number or mortgage brokers operating in
their area. Indeed, several respondents noted that referrals by real estate brokers had “dried up.”
The intense competition in the marketplace makes it harder for CBOs to maintain their visibility.
Not only do shifting patterns of referrals limit the capacity for CBOs to identify potential
customers, they also pose other policy challenges. Turner (1993) suggested that referrals made
by real estate brokers may not always be in the best interest of the borrower. In the most benign
cases, these referrals may simply reflect the desire of the real estate broker to sell the property as
quickly as possible. In the more pernicious cases, a referral may reflect illegal collusion or
racially discriminatory practices on the part of real estate and mortgage brokers. Regulations in
this area do require that real estate brokers fully disclose their relationship (if any) with the
mortgage broker and behave in a non-discriminatory manner with respect to racial minorities.
Yet applicable regulations also recognize that real estate agents represent the seller of a home,
and consequently real estate agents have no particular obligation to help the borrower secure “the
best available mortgage.”
Acknowledging the need to guide borrowers through the mortgage application process, many
local CBOs are ramping up their efforts to reach out to prospective buyers. One common
approach is to host a homebuyer fair and invite a prescreened group of mortgage brokers and
lenders to participate. These homebuyer fairs seek to educate prospective buyers and help them
identify specific mortgage products and providers that are best suited to meet their needs. In
addition, they help increase the visibility of the CBO in the community and increase the
likelihood that potential homebuyers will take advantage of the more extensive homebuyer
education and counseling programs available.
Credit, Capital and Communities: The Implications of the Changing Mortgage Banking Industry for Community Based Organizations
90
To publicize their programs, some CBOs have placed ads in newspapers and distributed
informational brochures at local supermarkets. Others have launched more extensive media
campaigns. For example, one New York City CBO ran a series of commercials on a local
Chinese language radio station, which expanded their ability to provide home buyer education
and counseling services to the new immigrant population that was a growing presence in their
target neighborhood.
Yet lacking the resources needed for sophisticated market research and the funding needed to
mount a wide scale media campaign, CBO advertising often struggles to find a place in the more
expensive radio and television markets. Moreover, even when they do take the airways, CBO
ads often promote homebuyer education and counseling programs. This message may have
limited appeal, at least when compared with a competitor’s ad promising to approve a mortgage
application in a matter of hours, if not minutes, even for borrowers with “bad credit.”
Drawing attention to abusive brokers and lenders can be another way to warn potential borrowers
of truly abusive lending practices. Working in cooperation with national campaigns such as
Freddie Mac’s ‘Don’t Borrow Trouble,’ CBOs are redoubling their efforts to help low-income
families avoid predatory lenders. In a closely related effort, the Fannie Mae Foundation has
launched a series of ads to help potential borrowers better manage their credit. These ads feature
a toll free telephone hotline that enables low-income and low wealth borrowers get in touch with
experienced credit counseling agencies operating in their communities.
Even these well funded initiatives, however, must confront the fact that the airwaves and
advertising media are now saturated with the outreach efforts of mortgage brokers and lenders
targeting the low-income, low wealth market. While any advertisements are required by law to
be factually correct, they are not required to offer information concerning better products
available. As a result, many consumers are lured into taking out a loan, whether they can afford
the payments or not, while offers by CBOs to provide homebuying education and counseling or
otherwise assist them in identify the best mortgage available go unheeded.

Section 6: New Roles Present CBOs with New Opportunities
91
2. Improving Access to Loan Specific Information For most consumers, shopping for mortgage credit is a rare occurrence, and assembling the
needed information to shop the market is difficult. This information mismatch can be a serious
problem. In the language of economics, there exists an “asymmetry of information” between
buyers and sellers, particularly with respect to the price of mortgage credit. Mortgage industry
professionals participate in numerous transactions over the course of weeks and months and have
ready access to information on the set of fees, rates, and terms that comprise the overall “pricing
of mortgage credit” in the marketplace. In contrast, consumers begin shopping for a loan with
limited prior experience and equally limited access to the information needed to make an
informed choice.
To level correct this asymmetry, potential borrowers need detailed information that will enable
them to search for the “best” available mortgage and to better understand the likely consequences
of entering into any specific mortgage transaction. Here, CBOs can play an important role as a
wholesale distributor of mortgage pricing information. Borrowing from the automobile “blue
books” or consumer reports that have successfully guided those shopping for automobiles and
other consumer durables, CBOs could develop a “home mortgage pricing guide” that includes
available information on the best loan prices and terms available to a borrower of any given
credit profile, income, and ability to make a downpayment. It is important not to underestimate
the complexity of assembling such a “blue book.” Mortgage companies readily advertise their
low annual percentage rates, but full understanding of mortgage pricing requires information on
the nature and extent of fees, prepayment penalties and other charges. For example, a lump
some upfront fee may have limited impact on estimated APR when allocated over the 30 year
life of a mortgage. But since few families will hold a mortgage for 30 years, such calculations
are inherently misleading to less than knowledgeable consumers.
While daunting, the task of assembling a “home mortgage pricing guide” is not insurmountable.
Such an effort could focus on rating a variety of generic alternative mortgages stripped of all
their marketing “bells and whistles. To keep the magnitude of the task in perspective, it is
important to remember that the detailed pricing information required to construct the guide is
well known to mortgage brokers and other industry participants. For example, most major

Credit, Capital and Communities: The Implications of the Changing Mortgage Banking Industry for Community Based Organizations
92
lenders regularly post “rate sheets” that provide this information to their network of retail,
broker, and correspondent lenders. Making the information contained in these rate sheets more
readily available could help borrowers shop for the best product, determine when to refinance,
and better evaluate unsolicited offers.
While individual CBOs, or national housing networks working with foundation support, could
develop this “home mortgage pricing guide,” there exists a strong public interest in funding this
activity. This follows from the fact that mortgage pricing information is in effect a “public
good,” and there is a governmental role in providing the price information needed to support the
efficient operation of the mortgage market. Federal regulators operating under applicable Fair
Lending and Fair Trade authorities must expand their efforts to ensure that consumers obtain the
pricing information needed to make informed choices. This could take the form of a national
registry of best available mortgage products, or other efforts to assist local government and
community based organizations help families to better understand the pricing of mortgage
products as they relate to borrower income, credit score, and ability to meet downpayment and
closing cost requirements
3. Providing Buyer’s Brokers to Improve Mortgage Shopping Some industry experts suggest that even increased price transparency may be insufficient to
insure that individuals are effective shoppers, and call for efforts to expand the ability of low-
income and low-wealth homebuyers to access much needed advice on particular mortgage
products. A recent Fannie Mae survey emphasized the importance to borrowers of having access
to a trusted advisor to help guide them through the mortgage process.60 Unfortunately, many
community groups interviewed for this study seem reluctant to fill that role, feeling that such
assistance goes against the goal of empowering people to make their own decisions. Yet given
the complexity of the available mortgage products, like consumers in general, low-income and
low-wealth borrowers would benefit greatly from having assistance in assembling the
information needed to make an informed choice. Also it is important to recognize that if CBOs
hold back from assuming the role of trusted advisor, there are many less than trustworthy brokers
unfortunately all to eager to step in and fill the information void.
60 Fannie Mae, The National Housing Survey, 2001. Examining the Credit-Impaired Borrower.
Section 6: New Roles Present CBOs with New Opportunities
93
One approach is to expand the capacity of CBOs to work with buyers individually to search for
the best mortgages. Of course, for such a service to be helpful, CBOs must keep abreast of
mortgage market trends for credit, and be recognized by potential borrowers as a trusted source
of information. Indeed, some CBOs are already gearing up to develop a mortgage brokerage
business with the explicit goal of using their good standing in the neighborhood to become a
‘buyer’s broker,’ while at the same time earning a small fee for the service. Like the trusted
advisors available to many higher-income borrowers, a buyer’s broker would provide lower-
income income and/or less knowledgeable borrowers access to information on available
mortgage terms and pricing. Like mortgage brokers these buyer’s brokers would help borrowers
qualify for and procure a lone but unlike mortgage brokers, buyer’s brokers would work on
behalf of the borrower.
To do this efficiently, CBOs will need to acquire automated tools to evaluate the risk profile of
individual borrowers, and develop the capacity to identify the best products available in the
market. Again, this will be difficult, but not impossible. Today, mortgage pricing and terms are
largely determined by credit history, income, and a limited number of other factors. Using
software similar to that developed by large-scale mortgage originators or secondary market
players, CBOs could help address the current complexity that now works to the detriment of
many borrowers
CBOs, of course, would have to be mindful of the real or even perceived conflict of interests
inherent in assuming the role of buyer’s broker. For example, to the extent that a particular CBO
receives funding from a particular lending institution, they may be pressured to recommend this
institution’s products even in situations where more advantageous products exist in the
marketplace. Needless to say, a CBO’s failure to provide proper safe guards to avoid either a
real or perceived conflict of interest would quickly erode the trust that community residents have
placed in their organization.
Guttentag (2001) proposed another version of a buyer’s broker system in which for-profit
mortgage brokers agree to a fixed, up front fee which would compensate them to use their
expertise to shop on behalf of the borrower for the best mortgage. For a fee consumers could

Credit, Capital and Communities: The Implications of the Changing Mortgage Banking Industry for Community Based Organizations
94
secure the services of a market professional that would be contractually and legally accountable
for finding them information about the best terms available in the marketplace. Moreover, these
brokers would be contractually bound to work in the “best interests” of the borrower, and hence
the borrower would have legal remedies should this broker fail to make a good faith effort to
perform as expected.
New Focus on Foreclosure Avoidance Clearly, the extension of loans to borrowers with limited capacity to repay has contributed to the
rise in foreclosures. This imposes hardships on individual families and also threatens to limit
home sales, dampen home price appreciation and destabilize communities. Rising foreclosures
are also of concern to the mortgage banking industry, as foreclosure processes are slow and
expensive, and in many instances, the best option for all parties concerned is to modify the terms
of the loan in a manner that helps keep the borrower in the home.
Aware of the financial and reputation costs of foreclosures, many large lender/servicers are
partnering with (or looking to partner with) CBOs to develop more effective foreclosure
avoidance efforts. The recently announced Home Ownership Preservation Initiative (HOPI) is a
good case in point. A partnership between the City of Chicago and the Neighborhood Housing
Services of Chicago, HOPI is challenging large subprime mortgage lenders servicers to create
new foreclosure avoidance tools. Concerned about their ability to conduct business in the city,
as well as the reputational risk of being associated with Chicago’s growing foreclosure problem,
representatives of several large mortgage companies have joined HOPI to see if they can create
mutually beneficial alternatives to current foreclosure practices.
As described below, CBOs that once focused on getting people into a home – through pre-
purchase counseling and direct lending –are now pressuring lenders, particularly subprime
lenders, to fund loan products and loan loss mitigation programs that help delinquent borrowers
remain in their homes. As HOPI and other emerging CBO efforts illustrate, this requires
renewed efforts to expand outreach to financially distressed borrowers, as well as enhance the
effectiveness of credit counseling efforts and the use of existing foreclosure avoidance resources.
Section 6: New Roles Present CBOs with New Opportunities
95
1. Expanding Outreach to Distressed Borrowers Over the past five years, servicers have developed sophisticated triage models to identify which
of their various intervention strategies will minimize loan losses to investors that arise from
foreclosure related loss of mortgage principal payments. These strategies, collectively know as
loan loss mitigation activities, include programs to restructure the mortgage debt in a manner that
allows the borrower to continue to meet their monthly mortgage payments, as well as to help
distressed borrowers quickly sell their homes and avoid foreclosure procedures that can be costly
to all parties involved in the transaction.61
In many instances, these loan loss mitigation efforts could benefit both the lender/investor and
the borrower, yet servicers report that they often have trouble reaching financially distressed
borrowers. Indeed, mortgage industry experts and CBO officials repeatedly point out that many
loans fail without contact ever being established with the borrower, or occurring after problems
have become too severe to rectify. The pilot partnership between Homecomings Financial
Network62 and Neighborhood Housing Services of Chicago (NHSC) is a promising way to
address this problem. Homecomings believes that some borrowers that are unwilling to talk to
them directly will talk to NHSC instead. In another effort to limit losses by boosting contact
rates, both Countrywide and Homecomings have partnered with NHSC to hold ‘workout clinics’
at the NHSC offices during which dozens of workouts were conducted over the course of a
weekend.
Municipal resources can also be used to overcome information bottlenecks. Several cities,
including Chicago, have begun providing foreclosure avoidance information through 311
systems. Chicago supports a variety of community-based to programs to help finance workouts
for borrowers in the early stages of default. Through expansion of its public service advertising
campaign, the City hopes to encourage borrowers to call the “311” number to obtain assistance
in handling past due mortgage debt. This will include referring borrowers to a special “help
desk” to connect borrowers to available foreclosure avoidance resources.
61 For a discussion of new approaches to subprime servicing see Cutts, 2003. 62 The servicing arm of GMAC-RFC.
Credit, Capital and Communities: The Implications of the Changing Mortgage Banking Industry for Community Based Organizations
96
2. Improving on Credit Counseling Of course, expanded outreach is no better than the assistance borrowers receive when they accept
the offer of help. For borrowers in trouble on their mortgage, credit counseling offers both
promise and risks. When administered by skilled counselors with the borrower’s interests in
mind, counseling can help borrowers chart the best course to navigate their financial difficulties.
Credit counseling can literally be the difference between saving and losing a home. When done
poorly, however, counseling is a waste of time and money. When done unscrupulously, it simply
makes a bad situation worse. As the industry becomes increasingly supportive of these efforts,
the pressure for counseling to be done effectively should increase.63
HOPI contains many features that illustrate the productive role that CBOs can play in loan loss
mitigation efforts. Upon contacting NHSC, under HOPI, borrowers are offered the option of
independent credit counseling or speaking with a Homecomings representative based in the
NHSC office. The partnership allows the organizations to work together to craft appropriate
workouts and provides borrowers with a trusted advisor to guide them through what can be an
intimidating process. Since Homecomings benefits directly from foreclosures that are averted,
they have agreed to pay for the credit counseling if the borrower chooses to use it.
As CBOs move to form new partnerships with credit counseling agencies, they must first address
several issues. First, a more effective method must be devised to separate legitimate and
effective agencies from others. Many consumers currently rely on the IRS’ ‘non-profit’
designation as evidence that the agency will act in their best interests, but this is by no means the
case. Many entities currently involved in substantial telemarketing efforts to lure debt ridden
borrowers into accepting there services are under investigation by State Attorneys General across
the country.64
Next, even among those agencies that are not out to take advantage of borrowers through
excessive fees and referrals for costly ancillary services, not all credit counseling agencies have 63Ameriquest’s best practices, for example, include provisions for free credit counseling by a non-affiliated, non-profit third party. GMAC-RFC also pays for counseling and has formed an alliance with three credit counselors called the Credit Counseling Resource Center (CCRC) to “help individuals restore financial balance to their lives.” 64 See for example the discussion on abusive credit counseling offered in Mansfield, 2003.

Section 6: New Roles Present CBOs with New Opportunities
97
the skills needed to counsel borrowers facing mortgage-related problems. Indeed, to date the
effectiveness of various counseling methods has been subject to little empirical scrutiny.
Different methods and programs must be evaluated and results disseminated so that the more
effective approaches supplant the less effective methods. As a result, CBOs have an important
role to play. As a trusted community advisor, CBOs can expand the ability and willingness of
distressed borrowers to seek credit counseling assistance and direct borrowers to high quality
programs with a demonstrated track record of actually helping financially distressed borrowers.
3. Effectively Targeting Subsidies for Foreclosure Avoidance.
While the magnitude of the costs is unknown, foreclosures, especially those in underserved
areas, are widely thought to trigger enormous local, state, and federal government expenditures
on activities such as crime prevention. Consequently, efforts to reduce the number of
foreclosures or to limit the degree of financial distress suffered by the homeowner and
deterioration of the property can save money that the government would have been forced to
spend down the line. To the extent that neighboring home values and foreclosure probabilities
are impacted by foreclosure events, municipalities may also have a responsibility to help protect
neighboring owners from such ripple effects.
Identifying where and how best to introduce public funding into foreclosure avoidance efforts is
no easy task. For example, national mortgage industry leaders, including Fannie Mae and
Freddie Mac, have developed mortgage programs designed to refinance borrowers out of abusive
“high cost” loans. Selected cities (Chicago and Boston) and states (Pennsylvania) provide public
subsidies to help write down the costs of such refinance efforts. Unfortunately, these programs
are not well known. For example, one distressed asset specialist estimated that in roughly one-
third of foreclosures there is some public money available, but that it is rarely accessed because
there is no systematic method of making borrowers or servicers aware of the programs available
in their area.
Once again, there is a role for CBOs to ensure the effective utilization of available public
resources. In addition, to helping distressed borrowers refinance, CBOs could be a conduit for
funding a variety of loan loss mitigation options. As noted earlier, servicing firms have elaborate

Credit, Capital and Communities: The Implications of the Changing Mortgage Banking Industry for Community Based Organizations
98
human and software systems to manage the delinquency, default and foreclosure process. In
many instances, these evaluation tools may suggest that foreclosure is the best option for the
investor, even in situations where home retention options would become viable with the addition
of a modest public subsidy. This would essentially extend the margin of borrowers that would
be able to remain in their homes based on their financial ability and ‘desire’ alone.
Determining how government money could best be deployed is a challenge, however. One
promising option is to make funds available to enhance loss mitigation and foreclosure
avoidance efforts already employed by servicers. Since resources are likely to be limited,
localities must create clear borrower and neighborhood eligibility standards to ensure that limited
public funds target those most deserving of assistance and/or produce the greatest public benefit.
Further, avoiding a situation where government money substitutes for funds, forbearance, and
forgiveness that lenders would have offered on their own is problematic.
Some have suggested that these programs should be operated by CBOs, but it is not obvious that
CBOs have the capacity to evaluate which borrowers are likely to succeed with the infusion of a
few thousand dollars more into the loss mitigation process. Rather than directly administer the
foreclosure avoidance funds, it might be better for CBOs to help establish and monitor the use of
clear guidelines for the program. Private servicers, as part of their existing loan loss mitigation
operations could then determine whether or not a borrower meets the criteria established for
public assistance, and, if the borrower is eligible for assistance, complete the transaction.
New Approaches to CBO Advocacy CBOs working in low- and moderate-income communities must now confront a series of
complex considerations related to industry trends, the limitations of the existing regulatory
framework and the marketplace, and the preferences and choices of individual consumers.
While some organizations are expanding their efforts to assist borrowers, other organizations
have mounted campaigns to challenge what they perceive to be abusive activities of lenders
operating in their community. For example, Des Moines Citizens for Community Improvement
reviewed court house records to identify households facing foreclosure. They then identified the
lender that appeared to be responsible for making loans at inflated terms. Through skillful use of

Section 6: New Roles Present CBOs with New Opportunities
99
the media they obtained restitution for the borrowers who apparently “paid too much” for their
credit, and encouraged other borrowers to avoid this lender in the future. In addition, helped by
the involvement of the Iowa Attorney General’s office, they were able to extract a pledge from
the lender to fund more appropriately priced loans in Iowa.
The Des Moines effort is one of a growing number that demonstrate how advocacy can adapt to
changing market conditions. By identifying a set of problem loans, they focused attention on the
increasingly important issue of foreclosures. Then, working in partnership with state officials,
they were able to obtain a settlement that not only brought relief to victims of past abuse, but
also expanded the ability of future borrowers to secure appropriately priced home loans in the
future.
1. Developing New Data on Abusive Lending The rapid rise of subprime lending and associated increase in foreclosures has caught many,
from industry and policy analysts to government officials and community activists, off guard.
This is largely due to the fact that there is little data available to government agencies charged
with tracking the mortgage sector of the economy or to the general public. Although information
on individual foreclosures is generally on file at court houses or land registry offices, there has
been almost no effort to systematically harvest these records. Even where available, data from
foreclosure documents often fail to identify key characteristics of the mortgage loan or the
identity of the originator, funder, or servicer - information essential to illuminating the factors
that precipitate foreclosures.
Enhanced foreclosure data would also help local officials to better meet the challenges of
foreclosure earlier in the process. Availability of detailed data on foreclosure and loan
performance at the local level could isolate emerging foreclosure ‘hot spots.’ CBOs could work
with local officials to automate existing ‘court house’ data thereby making it more widely
available. Having a database capable of identifying areas with elevated rates of foreclosure
filings would enable local city officials – working in partnership with local community based
organizations as well as interested mortgage servicers - to take appropriate action sooner.

Credit, Capital and Communities: The Implications of the Changing Mortgage Banking Industry for Community Based Organizations
100
Due to the complexity of the mortgage foreclosure process, it would also be useful for CBOs to
work with local governments to create a ‘foreclosure hot spot protocol,’ or a plan formulated in
advance of problem detection that describes specific actions designed to minimize the adverse
consequences of pathological foreclosure levels. For example, municipal tax collection agencies
could refrain from aggressively pursuing delinquency judgments against individual owner
occupants residing in foreclosure hot spots. Such forbearance activities could help individual
owners avoid foreclosure, and to the extent that they could help stabilize a local market,
forbearance programs could actually increase the amount of taxes collected in the area over time.
2. Advocating For Improved Laws and Regulation Another promising approach refocuses CBO advocacy on finding new ways to improve the
regulatory framework for mortgage lending and providing underserved households with better
access to basic banking services. Many CBOs have allied with consumer, civil rights, labor, and
other interests to build broad based support for public policies and other efforts aimed at
preventing predatory lenders and fringe bankers from exploiting low-income consumers.
For example, despite a less than supportive federal policy environment, CBOs continue their
efforts to adapt or “modernize” CRA to cover a greater share of mortgage market and other
lending activities. These advocates hope to convince banking regulators to update the present
geographically-based assessment area definitions for CRA reviews so that examiners can take
into account the growing share of bank lending that occurs outside of these areas. They are also
looking for ways to apply CRA rules to subprime affiliates of banks to prevent these institutions
from engaging in predatory and other exploitative lending practices.
In light of recent allegations that Fairbanks Capital Corporation engaged in abusive subprime
mortgage servicing practices, advocates are encouraging federal regulators to take a hard look as
this important segment of the mortgage banking industry. While awaiting the release of new
Federal Trade Commission guidelines on what constitutes fair approaches to mortgage servicing,
Ameriquest – one of the nation’s largest subprime issuers and servicers – was the first to release
a comprehensive set of “best practices” for subprime mortgage servicing. Under the leadership
of the Mortgage Bankers Association of America, other subprime mortgage servicers are now

Section 6: New Roles Present CBOs with New Opportunities
101
hard at work creating their own set of “best practices.” To the extent that advocates can pressure
both regulators and industry participants alike to weed out predatory practices in the subprime
servicing arena, the results can only serve to enhance ongoing CBO efforts at foreclosure
avoidance.
Advocates are also working on strategies to prompt regulatory changes at the state and local
level. In Massachusetts, CBO advocates recently won passage of a ‘CRA-like’ regulation for
mortgage companies and a community reinvestment requirement for insurance companies.
CBOs and their allies have successfully endorsed the passage of tough new state anti-predatory
lending standards in a number of states including Illinois, Georgia, North Carolina, New Jersey,
New York, and New Mexico. The National Community Reinvestment Coalition is working to
create and anti-predatory lending member network to challenge discriminatory practices and
promote fair access to credit.
The experience of CBOs in negotiating CRA agreements has been adapted and successfully
applied to efforts to change the business practices of non-CRA regulated financial institutions.
For example, faced with inadequate consumer protection laws, CBOs and their national networks
have persuaded individual subprime lenders to discontinue certain abusive mortgage practices,
such as the sale of single-premium credit life insurance (SPCI). SPCI is a low-value product
which adds an up-front payment to the loan amount. Since few borrowers benefit from this form
or insurance, advocates designated the addition of SPCI as a particularly egregious example of
predatory lending. Since, CRA did not apply to most of the lenders offering SPCI, CBO
activism took other forms. Advocates convinced the two secondary market entities -- Fannie Mae
and Freddie Mac -- not to purchase loans containing this product, and encouraged the Federal
Reserve Board of Governors to amend the existing Home Ownership and Equity Protection Act
regulations. This had the effect of requiring lenders offering SPCI to abide by additional
consumer protections for high-cost mortgages. One by one the major subprime lenders agreed to
stop offering SPCI.
Others are moving beyond mortgage lending to develop a variety of community-based responses
to the two-tiered financial system that imposes unreasonably high costs for consumers without
Credit, Capital and Communities: The Implications of the Changing Mortgage Banking Industry for Community Based Organizations
102
access to mainstream banking services. For example, due to pressure from advocates, federal
bank regulators adopted policies to prevent banks from “renting their charters” to payday lenders
looking to circumvent state limits on the interest that can be charged for these short term,
extremely high priced loans. Further, one welfare rights organization challenged a major
national banking operation to offer direct deposit accounts for families participating in a welfare-
to-work program. In Birmingham, a church-based group worked in partnership with local banks
to fund a financial literacy campaign in a local housing development that included efforts to
teach young adults how to manage credit card debt and to start to save for future needs.
3. Creating New Partnerships for More Effective Advocacy The continued consolidation in the mortgage industry necessitates changes in the way CBOs
relate to these mega-institutions. Consequently, some CBOs are looking for ways to join forces
with other local, regional, and national organizations to address matters of common concern.
Working through their support organizations and networks, CBOs have joined forces with banks
and the secondary mortgage market entities to fund financial education and counseling efforts
managed by a single community partner that serves as a conduit for numerous smaller
participating groups. Such arrangements can be particularly important in areas that lack
significant community-based capacity. For example, as an outgrowth of a region-wide planning
effort, Region 2020, a Birmingham, Alabama based non-profit is working to form a Community
Development Financial Institution that could serve as a conduit for the charitable contributions
and CRA-related investments of locally based banks.
CBOs, aware that bank support for their work may be declining, have mounted campaigns to
diversify their funding bases. One executive director noted: “CRA gave community groups
access to bank resources, but times are changing. We have to convince other major corporate
players that the health of our communities is not just important to the mortgage and banking
sector – it affects all business.” Consequently, some CBOs are turning to other private sector
institutions and trying to get corporate leaders from the health care, manufacturing, service, and
other sectors to “walk the neighborhoods with us,” and learn first hand what effective CBO
approaches can accomplish.
Section 6: New Roles Present CBOs with New Opportunities
103
Conclusion Each of the examples presented in this section illustrates both the promise and complexity of the
roles that CBOs can play in today’s market. Once CBOs could work to organize neighborhood,
stand outside a local bank and protest the lack of mortgage lending in their community. In many
instances, their list of demands was simple. Some pushed banks to commit to lending in their
target neighborhoods. Others persuaded banks to fund counseling or other initiatives. Today,
however, both the growing industry concentration and the complexity of mortgage programs
make it difficult to know exactly how to put pressure on the system, much less to understand
exactly what to ask for should an advocacy campaign succeed.
CBOs must work to improve the ability of consumers to shop wisely for mortgage products, and
they must work to offset the negative consequences of abusive lending and resulting foreclosures
that threaten to undermine decades of community revitalization efforts. To do so requires CBOs
to increase their understanding of how today’s technologically sophisticated mortgage market
operates, as well as to develop new approaches to advocacy that will be effective in the rapidly
changing world of mortgage lending.

BIBLIOGRAPHY AARP. 2003. The 2003 Consumer Experience Survey: Insights on Consumer Credit Behavior,
Fraud and Financial Planning, October.
Alexander, William P., Scott D. Grimshaw, Grant R. McQueen and Barrett A. Slade. 2002.
“Some Loans Are More Equal than Others: Third-Party Originations and Defaults in the
Subprime Mortgage Industry.” Real Estate Economics 30(4):667-697.
Apgar, William C. and Mark Duda. 2003. “The 25th Anniversary of CRA” Economic Policy
Review (Federal Reserve Board of New York) June: 169-191.
Avery, Robert W., Raphael W. Bostic, Paul S. Calem, and Glen B. Canner. 1999. “Changes in
the Distribution of Banking Offices,” Federal Reserve Bulletin 85(1): 81-102.
Bradford, Calvin. 2002. Risk or Race? Racial Disparities and the Subprime Refinance Market.
Washington, DC: Center for Community Change.
Brickman, David and Patric Hendershott. 2000. “Mortgage Refinancing, Adverse Selection, and
FHA’s Streamline Program.” Journal of Real Estate Finance and Economics 21(2): 153-
174.
Brueckner, Jan. 2000. “Mortgage Default with Asymmetric Information.” Journal of Real Estate
Finance and Economics 20(3): 251-274.
Calem, Paul, Kevin Gillen, and Susan Wachter. 2002. “The Neighborhood Distribution of
Subprime Mortgage Lending.” Zell/Lurie Real Estate Center at Wharton, Working Paper
404.
Collins, Michael. 2003. “Chicago’s Homeownership Preservation Challenge: Foreclosures.”
Presentation to the Federal Reserve Bank of Chicago, February.

Bibliography
105
Collins, Michael, Michael Carliner, and David Crowe. 2002. “Examining Supply-Side
Constraints to Low-Income Homeownership,” in Nicolas P. Retsinas and Eric Belsky,
eds. Low Income Homeownership: Examining the Unexamined Goal. Washington, DC:
Brookings Institution Press.
Consumer Federation of America and National Credit Reporting Association. 2002. Credit Score
Accuracy and Implications for Consumers. Washington, DC: CFA and NCRA.
Courchane, Marsha J., Brian J. Surette, and Peter M. Zorn. 2004. “Subprime Borrowers:
Mortgage Transitions and Outcomes,” Journal of Real Estate Finance and Economics,
forthcoming.
Cutts, Amy Crews. 2003. Loss Mitigation Technology and Homeownership Sustainability. Paper
presented at the LISC 2003 Homeownership Summit.
Cutts, Amy Crews and Robert Van Order. 2003. On the Economics of Subprime Lending.
McLean, VA: Freddie Mac. Available at: http://www.freddiemac.com/corporate/reports/
Engel, Kathleen C. and Patricia A. McCoy. 2002. “A Tale of Three Markets: The Law and
Economics of Predatory Lending,” Texas Law Review 80(6):1257-1381.
Fishbein, Allen. 1992. “The Ongoing Experiment with Regulation from Below: Expanded
Reporting Requirements for HMDA and CRA.” Housing Policy Debate (3)2: 601-636.
Fishbein, Allen and Harold Bunce. 2000. “Subprime Market Growth and Predatory Lending,” in
Susan M. Wachter and R. Leo Penne, eds. Housing Policy in the New Millennium.
Washington, DC: U.S. Department of Housing and Urban Development.
Gruenstein, Debbie and Chris Herbert. 2000a. Analyzing Trends in Subprime Originations and
Foreclosures: A Case Study of the Atlanta Metro Area. Cambridge, MA: Abt Associates
Inc.

Credit, Capital and Communities: The Implications of the Changing Mortgage Banking Industry for Community Based Organizations
106
Gruenstein, Debbie and Chris Herbert. 2000b. Analyzing Trends in Subprime Originations and
Foreclosures: A Case Study of the Boston Metro Area. Cambridge, MA: Abt Associates
Inc.
Guttentag, Jack. 2001. “Another View of Predatory Lending.” Wharton Financial Institutions
Center Paper 01-23-B.
Hirad, Abdighani and Peter Zorn. 2002. “Purchase Homeownership Counseling: A Little
Knowledge Is a Good Thing,” in Nicolas Retsinas and Eric Belsky, eds. Low-Income
Homeownership: Examining the Unexamined Goal. Washington, DC: Brookings
Institution Press.
Hornburg, Steven. 2003. LISC Survey of Nonprofit Mortgage Brokers. New York: Local
Initiatives Support Corporation.
The Housing Council. 2000. Residential Foreclosure in Rochester, New York. New York: The
Housing Council.
Husock, Howard. 2002. “Seeking Sustainability: Neighborhood Housing Services of Chicago
Faces Financial Challenge,” Kennedy School of Government, Harvard University Case
C16-02-1658.0, August.
Immergluck, Daniel and Marti Wiles. 1999. Two Steps Back: The Dual Mortgage Market,
Predatory Lending, and the Undoing of Community Development. Chicago, IL: The
Woodstock Institute.
Inside Mortgage Finance. 2003. The 2003 Mortgage Market Statistical Annual. Bethesda, MD:
Inside Mortgage Finance.
Joint Center for Housing Studies. 2002. The 25th Anniversary of the Community Reinvestment
Act: Access to Capital in an Evolving Financial Services System. Report prepared for the
Ford Foundation. Cambridge, MA: Harvard University.

Bibliography
107
Kendall, Leon T. and Michael J. Fishman. 1996. A Primer on Securitization. Cambridge, MA:
MIT Press.
Kim-Sung, Kellie K. and Sharon Hermanson. 2003. “Experience of Older Refinance Mortgage
Loan Borrowers: Broker- and Lender-Originated Loans,” AARP Public Policy Institute,
Data Digest, January.
Lacour-Little, Michael and Gregory Chun. 1999. “Third Party Originators and Mortgage
Prepayment Risk: An Agency Problem?” Journal of Real Estate Research 17(1/2): 55-70.
Mansfield, Cathy Lesser. 2003. “Consumer Choice and Risk in Society.” Paper prepared for the
9th International Consumer Law Conference, Athens Greece. Available at:
http://www.law.drake.edu/faculty/mansfield.html
Mortgage Information Corporation. 1999. Market Pulse, Third Quarter.
National Community Reinvestment Coalition. 2001. CRA Commitments: 1977 – 2000.
Washington, DC: NCRC.
Passmore, Wayne and Roger Sparks. 1996. “Putting the Squeeze on a Market for Lemons:
Government-Sponsored Mortgage Securitization.” Journal of Real Estate Finance and
Economics 13(1): 27-43.
Pennington-Cross, Anthony, Anthony Yezer and Joseph Nichols. 2000. Credit Risk and
Mortgage Lending: Who Uses Subprime and Why? Arlington, VA: Research Institute for
Housing America.
Scheessele, Randall M. 2002. 1998 HMDA Highlights. Housing Finance Working Paper, No. 9.
Washington DC: Office of Policy Development and Research, HUD.
Schwartz, Alexander. 1999. “From Confrontation to Collaboration: Banks, Community Groups,
and the Implementation of Community Reinvestment Act Agreements.” Housing Policy
Debate 9(3): 631-662.
Credit, Capital and Communities: The Implications of the Changing Mortgage Banking Industry for Community Based Organizations
108
Shiller, Robert J. and Allan N. Weiss. 2000. “Moral Hazard in Home Equity Conversion.” Real
Estate Economics 28(1):1-31.
Shu, Suzanne. 2002. “Choosing for the Long Run: Making Tradeoffs in Multi-period
Borrowing.” Draft Working Paper, University of Chicago, September.
Thaler, Richard H., and Cass R Sunstein. 2003. “Behavioral Economics, Public Policy, and
Paternalism: Libertarian Paternalism.” AEA Papers and Proceedings, May: 173-179.
Turner, Margery Austin. 1993. “Limits on Neighborhood Choice: Evidence on Racial and Ethnic
Steering in Urban Housing Markets,” in Michael E. Fix and Raymond J. Struyk, eds.
Clear and Convincing Evidence. Washington, DC: Urban Institute Press.
U.S. Department of the Treasury and U.S. Department of Housing and Urban Development.
2000. Curbing Predatory Home Lending: A Joint Report. Washington, DC: U.S.
Department of Housing and Urban Development.
U.S. Department of Housing and Urban Development. 1997 Survey of Mortgage Lending
Activity. Washington DC: U.S. Department of Housing and Urban Development.
U.S. Department of Housing and Urban Development. 2000. Unequal Burden in Baltimore:
Income and Racial Disparities in Subprime Lending. Washington, DC: U.S. Department
of Housing and Urban Development.
Vermeer, Kimberly and Josephine Louie. 1996. The Future of Manufactured Housing.
Cambridge, MA: Joint Center for Housing Studies, Harvard University.
Woodward, Susan E. 2003. “Consumer Confusion in the Mortgage Market.” Paper, Sand Hill
Econometrics, July. Available at http://sandhillecon.com/consumer_confusion.pdf.
Yinger, John. 1998. “Evidence on Discrimination in Consumer Markets.” Journal of Economic
Perspectives (12): 23-40.

SECTION 6: APPENDIX
A-1: Filtering of Raw HMDA Data Creates Usable Data A-2: Means and Standard Deviations of Independent Variables A-3: Impacts of Independent Variables (Exclusive of MSA Effects) for Logistic
Model of Home Purchase Prime Conventional Loan Probability
A-4: Impacts of Independent Variables (Exclusive of MSA Effects) for Logistic
Model of Refinance Prime Conventional Loan Probability
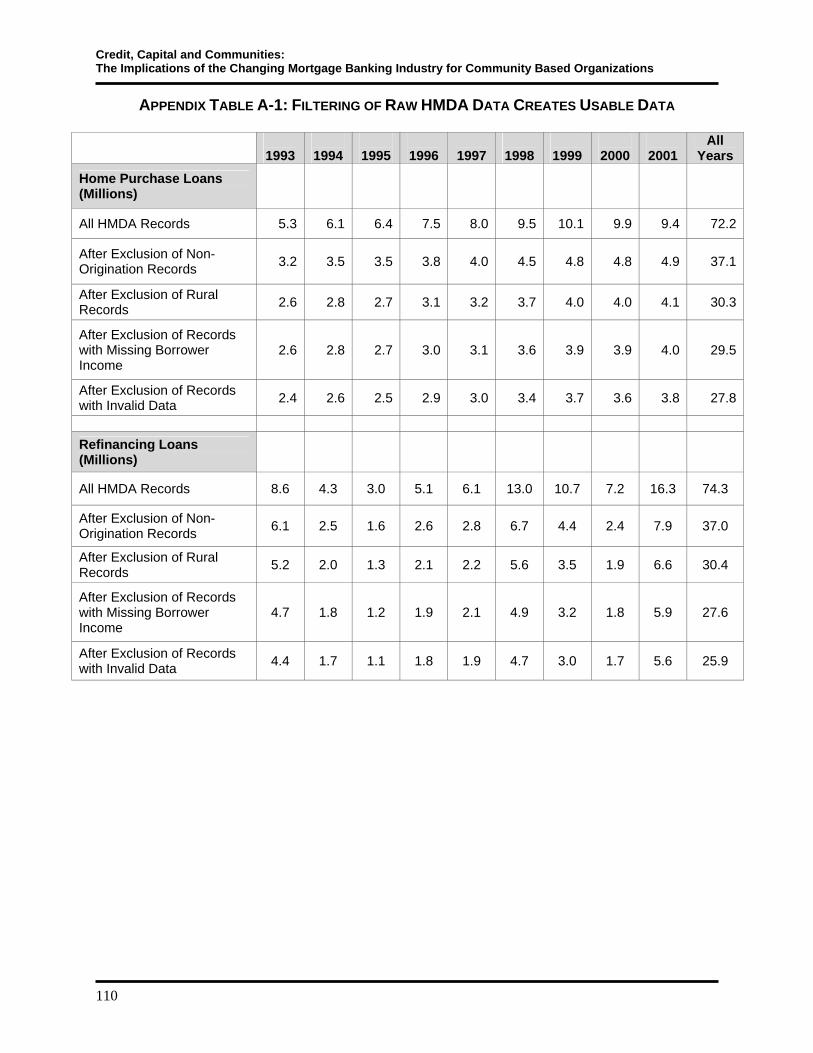
Credit, Capital and Communities: The Implications of the Changing Mortgage Banking Industry for Community Based Organizations
110
APPENDIX TABLE A-1: FILTERING OF RAW HMDA DATA CREATES USABLE DATA
1993
1994
1995
1996
1997
1998
1999
2000
2001
All Years
Home Purchase Loans (Millions)
All HMDA Records 5.3 6.1 6.4 7.5 8.0 9.5 10.1 9.9 9.4 72.2
After Exclusion of Non-Origination Records 3.2 3.5 3.5 3.8 4.0 4.5 4.8 4.8 4.9 37.1
After Exclusion of Rural Records 2.6 2.8 2.7 3.1 3.2 3.7 4.0 4.0 4.1 30.3
After Exclusion of Records with Missing Borrower Income
2.6 2.8 2.7 3.0 3.1 3.6 3.9 3.9 4.0 29.5
After Exclusion of Records with Invalid Data 2.4 2.6 2.5 2.9 3.0 3.4 3.7 3.6 3.8 27.8
Refinancing Loans (Millions)
All HMDA Records 8.6 4.3 3.0 5.1 6.1 13.0 10.7 7.2 16.3 74.3
After Exclusion of Non-Origination Records 6.1 2.5 1.6 2.6 2.8 6.7 4.4 2.4 7.9 37.0
After Exclusion of Rural Records 5.2 2.0 1.3 2.1 2.2 5.6 3.5 1.9 6.6 30.4
After Exclusion of Records with Missing Borrower Income
4.7 1.8 1.2 1.9 2.1 4.9 3.2 1.8 5.9 27.6
After Exclusion of Records with Invalid Data 4.4 1.7 1.1 1.8 1.9 4.7 3.0 1.7 5.6 25.9
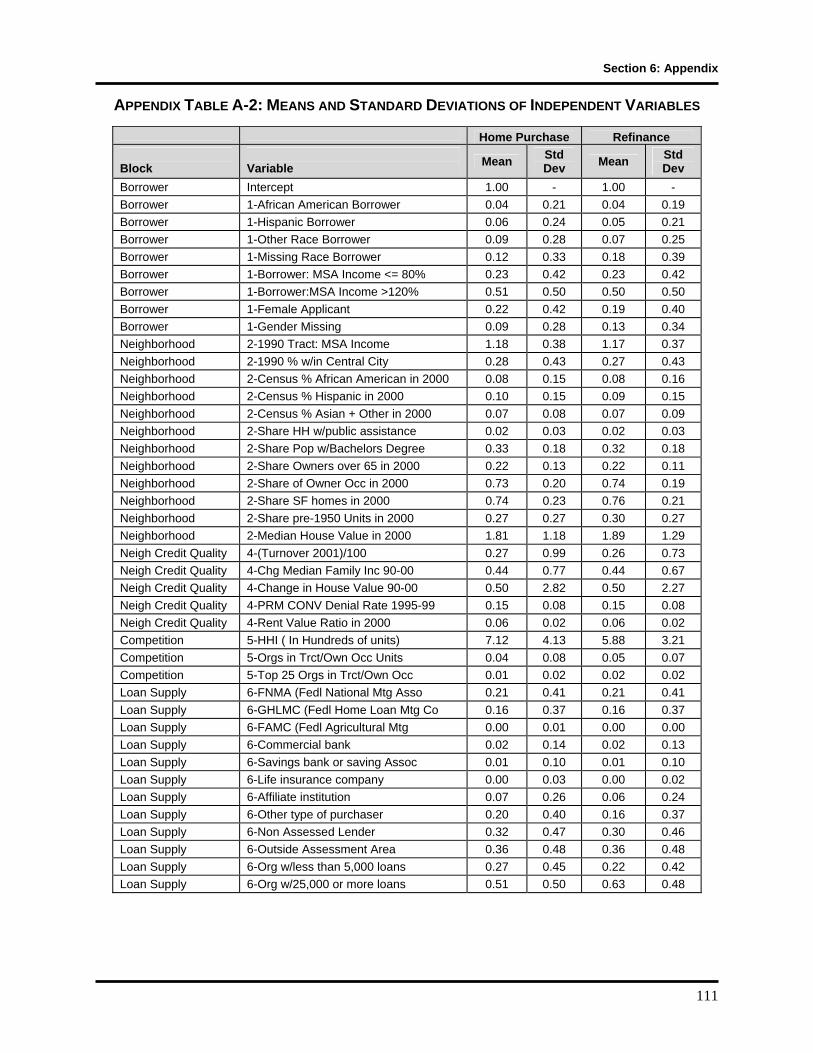
Section 6: Appendix
111
APPENDIX TABLE A-2: MEANS AND STANDARD DEVIATIONS OF INDEPENDENT VARIABLES
Home Purchase Refinance Block
Variable Mean Std
Dev Mean Std Dev
Borrower Intercept 1.00 - 1.00 - Borrower 1-African American Borrower 0.04 0.21 0.04 0.19 Borrower 1-Hispanic Borrower 0.06 0.24 0.05 0.21 Borrower 1-Other Race Borrower 0.09 0.28 0.07 0.25 Borrower 1-Missing Race Borrower 0.12 0.33 0.18 0.39 Borrower 1-Borrower: MSA Income <= 80% 0.23 0.42 0.23 0.42 Borrower 1-Borrower:MSA Income >120% 0.51 0.50 0.50 0.50 Borrower 1-Female Applicant 0.22 0.42 0.19 0.40 Borrower 1-Gender Missing 0.09 0.28 0.13 0.34 Neighborhood 2-1990 Tract: MSA Income 1.18 0.38 1.17 0.37 Neighborhood 2-1990 % w/in Central City 0.28 0.43 0.27 0.43 Neighborhood 2-Census % African American in 2000 0.08 0.15 0.08 0.16 Neighborhood 2-Census % Hispanic in 2000 0.10 0.15 0.09 0.15 Neighborhood 2-Census % Asian + Other in 2000 0.07 0.08 0.07 0.09 Neighborhood 2-Share HH w/public assistance 0.02 0.03 0.02 0.03 Neighborhood 2-Share Pop w/Bachelors Degree 0.33 0.18 0.32 0.18 Neighborhood 2-Share Owners over 65 in 2000 0.22 0.13 0.22 0.11 Neighborhood 2-Share of Owner Occ in 2000 0.73 0.20 0.74 0.19 Neighborhood 2-Share SF homes in 2000 0.74 0.23 0.76 0.21 Neighborhood 2-Share pre-1950 Units in 2000 0.27 0.27 0.30 0.27 Neighborhood 2-Median House Value in 2000 1.81 1.18 1.89 1.29 Neigh Credit Quality 4-(Turnover 2001)/100 0.27 0.99 0.26 0.73 Neigh Credit Quality 4-Chg Median Family Inc 90-00 0.44 0.77 0.44 0.67 Neigh Credit Quality 4-Change in House Value 90-00 0.50 2.82 0.50 2.27 Neigh Credit Quality 4-PRM CONV Denial Rate 1995-99 0.15 0.08 0.15 0.08 Neigh Credit Quality 4-Rent Value Ratio in 2000 0.06 0.02 0.06 0.02 Competition 5-HHI ( In Hundreds of units) 7.12 4.13 5.88 3.21 Competition 5-Orgs in Trct/Own Occ Units 0.04 0.08 0.05 0.07 Competition 5-Top 25 Orgs in Trct/Own Occ 0.01 0.02 0.02 0.02 Loan Supply 6-FNMA (Fedl National Mtg Asso 0.21 0.41 0.21 0.41 Loan Supply 6-GHLMC (Fedl Home Loan Mtg Co 0.16 0.37 0.16 0.37 Loan Supply 6-FAMC (Fedl Agricultural Mtg 0.00 0.01 0.00 0.00 Loan Supply 6-Commercial bank 0.02 0.14 0.02 0.13 Loan Supply 6-Savings bank or saving Assoc 0.01 0.10 0.01 0.10 Loan Supply 6-Life insurance company 0.00 0.03 0.00 0.02 Loan Supply 6-Affiliate institution 0.07 0.26 0.06 0.24 Loan Supply 6-Other type of purchaser 0.20 0.40 0.16 0.37 Loan Supply 6-Non Assessed Lender 0.32 0.47 0.30 0.46 Loan Supply 6-Outside Assessment Area 0.36 0.48 0.36 0.48 Loan Supply 6-Org w/less than 5,000 loans 0.27 0.45 0.22 0.42 Loan Supply 6-Org w/25,000 or more loans 0.51 0.50 0.63 0.48
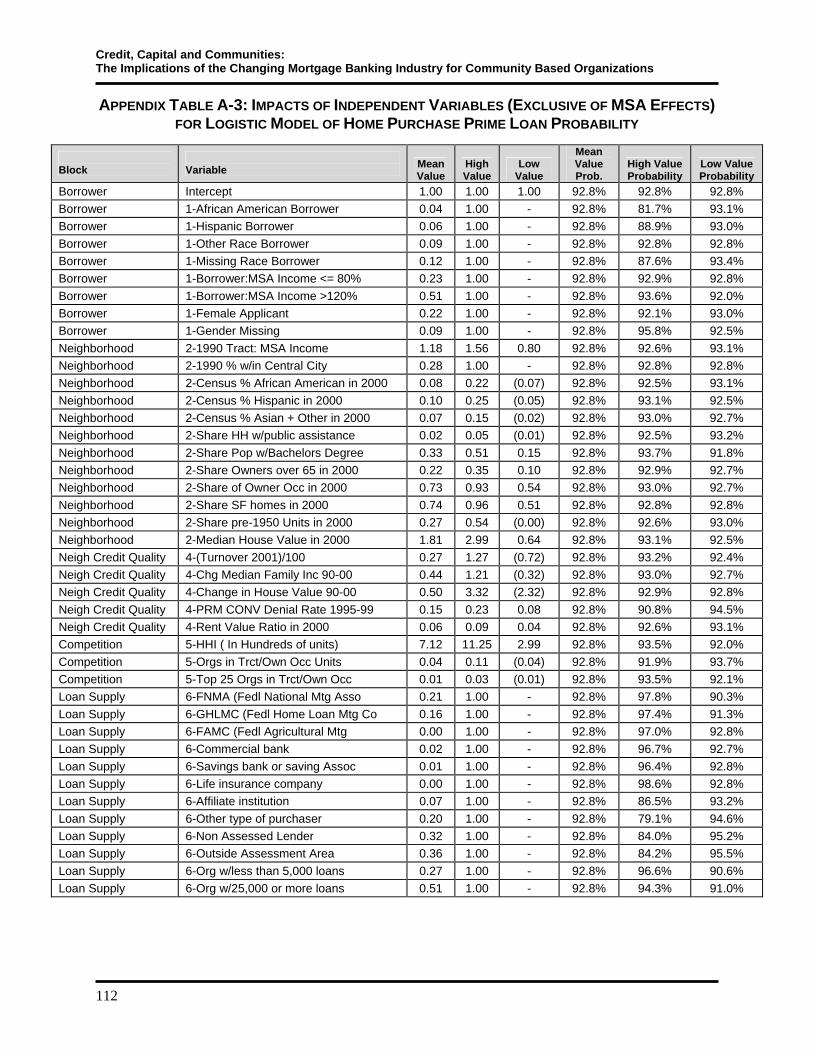
Credit, Capital and Communities: The Implications of the Changing Mortgage Banking Industry for Community Based Organizations
112
APPENDIX TABLE A-3: IMPACTS OF INDEPENDENT VARIABLES (EXCLUSIVE OF MSA EFFECTS) FOR LOGISTIC MODEL OF HOME PURCHASE PRIME LOAN PROBABILITY
Block
Variable Mean
Value High Value
Low Value
Mean Value Prob.
High Value Probability
Low Value Probability
Borrower Intercept 1.00 1.00 1.00 92.8% 92.8% 92.8% Borrower 1-African American Borrower 0.04 1.00 - 92.8% 81.7% 93.1% Borrower 1-Hispanic Borrower 0.06 1.00 - 92.8% 88.9% 93.0% Borrower 1-Other Race Borrower 0.09 1.00 - 92.8% 92.8% 92.8% Borrower 1-Missing Race Borrower 0.12 1.00 - 92.8% 87.6% 93.4% Borrower 1-Borrower:MSA Income <= 80% 0.23 1.00 - 92.8% 92.9% 92.8% Borrower 1-Borrower:MSA Income >120% 0.51 1.00 - 92.8% 93.6% 92.0% Borrower 1-Female Applicant 0.22 1.00 - 92.8% 92.1% 93.0% Borrower 1-Gender Missing 0.09 1.00 - 92.8% 95.8% 92.5% Neighborhood 2-1990 Tract: MSA Income 1.18 1.56 0.80 92.8% 92.6% 93.1% Neighborhood 2-1990 % w/in Central City 0.28 1.00 - 92.8% 92.8% 92.8% Neighborhood 2-Census % African American in 2000 0.08 0.22 (0.07) 92.8% 92.5% 93.1% Neighborhood 2-Census % Hispanic in 2000 0.10 0.25 (0.05) 92.8% 93.1% 92.5% Neighborhood 2-Census % Asian + Other in 2000 0.07 0.15 (0.02) 92.8% 93.0% 92.7% Neighborhood 2-Share HH w/public assistance 0.02 0.05 (0.01) 92.8% 92.5% 93.2% Neighborhood 2-Share Pop w/Bachelors Degree 0.33 0.51 0.15 92.8% 93.7% 91.8% Neighborhood 2-Share Owners over 65 in 2000 0.22 0.35 0.10 92.8% 92.9% 92.7% Neighborhood 2-Share of Owner Occ in 2000 0.73 0.93 0.54 92.8% 93.0% 92.7% Neighborhood 2-Share SF homes in 2000 0.74 0.96 0.51 92.8% 92.8% 92.8% Neighborhood 2-Share pre-1950 Units in 2000 0.27 0.54 (0.00) 92.8% 92.6% 93.0% Neighborhood 2-Median House Value in 2000 1.81 2.99 0.64 92.8% 93.1% 92.5% Neigh Credit Quality 4-(Turnover 2001)/100 0.27 1.27 (0.72) 92.8% 93.2% 92.4% Neigh Credit Quality 4-Chg Median Family Inc 90-00 0.44 1.21 (0.32) 92.8% 93.0% 92.7% Neigh Credit Quality 4-Change in House Value 90-00 0.50 3.32 (2.32) 92.8% 92.9% 92.8% Neigh Credit Quality 4-PRM CONV Denial Rate 1995-99 0.15 0.23 0.08 92.8% 90.8% 94.5% Neigh Credit Quality 4-Rent Value Ratio in 2000 0.06 0.09 0.04 92.8% 92.6% 93.1% Competition 5-HHI ( In Hundreds of units) 7.12 11.25 2.99 92.8% 93.5% 92.0% Competition 5-Orgs in Trct/Own Occ Units 0.04 0.11 (0.04) 92.8% 91.9% 93.7% Competition 5-Top 25 Orgs in Trct/Own Occ 0.01 0.03 (0.01) 92.8% 93.5% 92.1% Loan Supply 6-FNMA (Fedl National Mtg Asso 0.21 1.00 - 92.8% 97.8% 90.3% Loan Supply 6-GHLMC (Fedl Home Loan Mtg Co 0.16 1.00 - 92.8% 97.4% 91.3% Loan Supply 6-FAMC (Fedl Agricultural Mtg 0.00 1.00 - 92.8% 97.0% 92.8% Loan Supply 6-Commercial bank 0.02 1.00 - 92.8% 96.7% 92.7% Loan Supply 6-Savings bank or saving Assoc 0.01 1.00 - 92.8% 96.4% 92.8% Loan Supply 6-Life insurance company 0.00 1.00 - 92.8% 98.6% 92.8% Loan Supply 6-Affiliate institution 0.07 1.00 - 92.8% 86.5% 93.2% Loan Supply 6-Other type of purchaser 0.20 1.00 - 92.8% 79.1% 94.6% Loan Supply 6-Non Assessed Lender 0.32 1.00 - 92.8% 84.0% 95.2% Loan Supply 6-Outside Assessment Area 0.36 1.00 - 92.8% 84.2% 95.5% Loan Supply 6-Org w/less than 5,000 loans 0.27 1.00 - 92.8% 96.6% 90.6% Loan Supply 6-Org w/25,000 or more loans 0.51 1.00 - 92.8% 94.3% 91.0%

Section 6: Appendix
113
APPENDIX TABLE A-4: IMPACTS OF INDEPENDENT VARIABLES (EXCLUSIVE OF MSA EFFECTS) FOR LOGISTIC MODEL OF REFINANCE PRIME LOAN PROBABILITY
Block
Variable
Mean Value
High Value
Low Value
Mean Value Prob.
High Value Probability
Low Value Probability
Borrower Intercept 1.00 1.00 - 91.9% 91.9% 91.9% Borrower 1-African American Borrower 0.04 1.00 - 91.9% 85.5% 92.1% Borrower 1-Hispanic Borrower 0.05 1.00 - 91.9% 88.8% 92.0% Borrower 1-Other Race Borrower 0.07 1.00 - 91.9% 90.9% 91.9% Borrower 1-Missing Race Borrower 0.18 1.00 - 91.9% 86.5% 92.8% Borrower 1-Borrower:MSA Income <= 80% 0.23 1.00 - 91.9% 90.4% 92.3% Borrower 1-Borrower:MSA Income >120% 0.50 1.00 - 91.9% 92.9% 90.8% Borrower 1-Female Applicant 0.19 1.00 - 91.9% 90.2% 92.2% Borrower 1-Gender Missing 0.13 1.00 - 91.9% 92.5% 91.8% Neighborhood 2-1990 Tract: MSA Income 1.17 1.55 0.80 91.9% 92.0% 91.7% Neighborhood 2-1990 % w/in Central City 0.27 1.00 - 91.9% 91.7% 91.9% Neighborhood 2-Census % African American in 2000 0.08 0.24 (0.08) 91.9% 91.5% 92.3% Neighborhood 2-Census % Hispanic in 2000 0.09 0.24 (0.05) 91.9% 91.9% 91.9% Neighborhood 2-Census % Asian + Other in 2000 0.07 0.16 (0.02) 91.9% 91.9% 91.9% Neighborhood 2-Share HH w/public assistance 0.02 0.05 (0.00) 91.9% 91.9% 91.9% Neighborhood 2-Share Pop w/Bachelors Degree 0.32 0.50 0.14 91.9% 93.0% 90.5% Neighborhood 2-Share Owners over 65 in 2000 0.22 0.33 0.11 91.9% 91.9% 91.8% Neighborhood 2-Share of Owner Occ in 2000 0.74 0.93 0.55 91.9% 92.1% 91.6% Neighborhood 2-Share SF homes in 2000 0.76 0.97 0.55 91.9% 91.6% 92.2% Neighborhood 2-Share pre-1950 Units in 2000 0.30 0.58 0.03 91.9% 91.5% 92.2% Neighborhood 2-Median House Value in 2000 1.89 3.18 0.60 91.9% 91.7% 92.1% Neigh Credit Quality 4-(Turnover 2001)/100 0.26 0.99 (0.47) 91.9% 92.1% 91.7% Neigh Credit Quality 4-Chg Median Family Inc 90-00 0.44 1.11 (0.24) 91.9% 92.0% 91.8% Neigh Credit Quality 4-Change in House Value 90-00 0.50 2.77 (1.76) 91.9% 91.9% 91.9% Neigh Credit Quality 4-PRM CONV Denial Rate 1995-99 0.15 0.23 0.07 91.9% 90.5% 93.1% Neigh Credit Quality 4-Rent Value Ratio in 2000 0.06 0.08 0.04 91.9% 91.6% 92.2% Competition 5-HHI ( In Hundreds of units) 5.88 9.09 2.66 91.9% 92.1% 91.7% Competition 5-Orgs in Trct/Own Occ Units 0.05 0.12 (0.02) 91.9% 91.4% 92.3% Competition 5-Top 25 Orgs in Trct/Own Occ 0.02 1.00 - 91.9% 99.3% 91.6% Loan Supply 6-FNMA (Fedl National Mtg Asso 0.21 1.00 - 91.9% 98.7% 87.2% Loan Supply 6-GHLMC (Fedl Home Loan Mtg Co 0.16 1.00 - 91.9% 98.4% 89.0% Loan Supply 6-FAMC (Fedl Agricultural Mtg 0.00 1.00 - 91.9% 98.4% 91.9% Loan Supply 6-Commercial bank 0.02 1.00 - 91.9% 96.4% 91.8% Loan Supply 6-Savings bank or saving Assoc 0.01 1.00 - 91.9% 97.3% 91.8% Loan Supply 6-Life insurance company 0.00 1.00 - 91.9% 98.6% 91.9% Loan Supply 6-Affiliate institution 0.06 1.00 - 91.9% 93.8% 91.7% Loan Supply 6-Other type of purchaser 0.16 1.00 - 91.9% 87.4% 92.5% Loan Supply 6-Non Assessed Lender 0.30 1.00 - 91.9% 70.6% 95.6% Loan Supply 6-Outside Assessment Area 0.36 1.00 - 91.9% 79.4% 95.4% Loan Supply 6-Org w/less than 5,000 loans 0.22 1.00 - 91.9% 96.6% 89.6% Loan Supply 6-Org w/25,000 or more loans 0.63 1.00 - 91.9% 92.7% 90.3%

114
ADVISORY COMMITTEE MEMBERS David Beck Self-Help Glenn Canner Federal Reserve Board Allen Fishbein Consumer Federation of America Debby Goldberg Consultant Edward Golding Freddie Mac Edward Gramlich Federal Reserve Board of Governors Roger Haughton The PMI Group Bill Longbrake Washington Mutual Moises Loza Housing Assistance Council Chris Richardson Center for Responsible Lending Sandy Samuels Countrywide Financial Services
Ellen Seidman Shorebank Advisory Services Mike Shea ACORN Housing Corporation Josh Silver National Community Reinvestment Coalition Tom Stanton Consultant Andrea Stowers Stowers Consulting Charles Tansey Neighborhood Reinvestment Corporation John Taylor National Community Reinvestment Coalition Ken Wade Neighborhood Reinvestment Corporation Mark Willis JP Morgan Chase Barry Zigas Fannie Mae

115
ORGANIZATIONS AND INDIVIDUALS INTERVIEWED Tom Bamford Marquette National Bank Sam Brady, Ralph Collins, Jeff Jaffee, Jim Miller, Tim Paul, and Eric Pratt Citigroup Tom Callahan and Florence Hagins Massachusetts Affordable Housing Alliance Jim Campen Gaston Institute, University of Massachusetts - Boston Jim Capraro Greater Southwest Development Corporation Jeanne Charn and Tara Twomey Hale and Dorr Legal Services Center Michael Collins and Doug Dylla Neighborhood Reinvestment Corporation Bruce Dorpalen ACORN Housing Corporation Laura Dungan Sunflower Community Action Tom Fitzgibbon MB Bank Marianne Garvin CDC of Long Island Sarah Gerecke, Fran Justa and Marcia Vaccela NHS of New York City George Goehl National Training and Information Center Aaron Gornstein and Karen Wiener Citizens’ Housing and Planning Association Bruce Gottschall NHS of Chicago Ken Gross Chattanooga Neighborhood Enterprise Martina Guilfoil Inglewood NHS
Scott Hebdon NovaStar Heather Hennessy-Whelehan and Clark Ziegler Massachusetts Housing Partnership Chris Herbert Abt Associates Inc. Sharon Hermanson AARP Public Policy Institute Dawkins Hodges NHS of the Inland Empire Duncan Kennedy Harvard Law School Prue LaRocca RBS Greenwich Capital Edward Moncrief NHS Silicon Valley Norma Moseley and Robert Pulster ESAC Boston Angelo Picirillo Laredo-Webb NHS Elizabeth Renuart National Consumer Law Center Carolyn Samuels New York Mortgage Coalition Bill Slater Phoenix NHS Eric Stein Self-Help Patricia Stephenson Lafayette NHS Sharon Zanders Ackiss Des Moines Citizens for Community Improvement