Embed Size (px)
Citation preview
Global Industrials & EU Autos Conference
Creating Long Term Value for Shareholders
March 17, 2015
Joy Global

March 2015 2015 Global Industrials & EU Autos Conference2
© 2015 Joy Global Inc. All rights reserved
All statements in this presentation other than historical facts are forward looking statements within the
meaning of the Private Securities Litigation Reform Act of 1995 and involve risks and uncertainties that
may cause actual results to differ materially from those indicated by such forward looking statements.
These statements are identified by forward looking terms such as “anticipate,” “believe,” “estimate,”
“expect,” “indicate,” “may be,” “objective,” “plan,” “predict,” “will be,” and similar expressions. Such
statements are based on our current expectations and we undertake no obligation to update such
statements to reflect new information, events, or otherwise. In addition to the assumptions and other
factors referred to in this presentation, cautionary factors and other information are set forth in our
public filings with the Securities and Exchange Commission, including those set forth under “Risk
Factors” in our Annual Report on Form 10-K and Quarterly Reports on Form 10-Q.
Non-GAAP Measures: The company from time to time refers to various non-GAAP financial measures.
We believe that this information is useful to understanding the operating results and ongoing
performance of our underlying businesses. See our public filings in the investor relations section of our
website www.joyglobal.com for reconciliations of material non-GAAP financial measures to their
related GAAP measures.
Forward Looking Statements
March 2015 2015 Global Industrials & EU Autos Conference3
© 2015 Joy Global Inc. All rights reserved
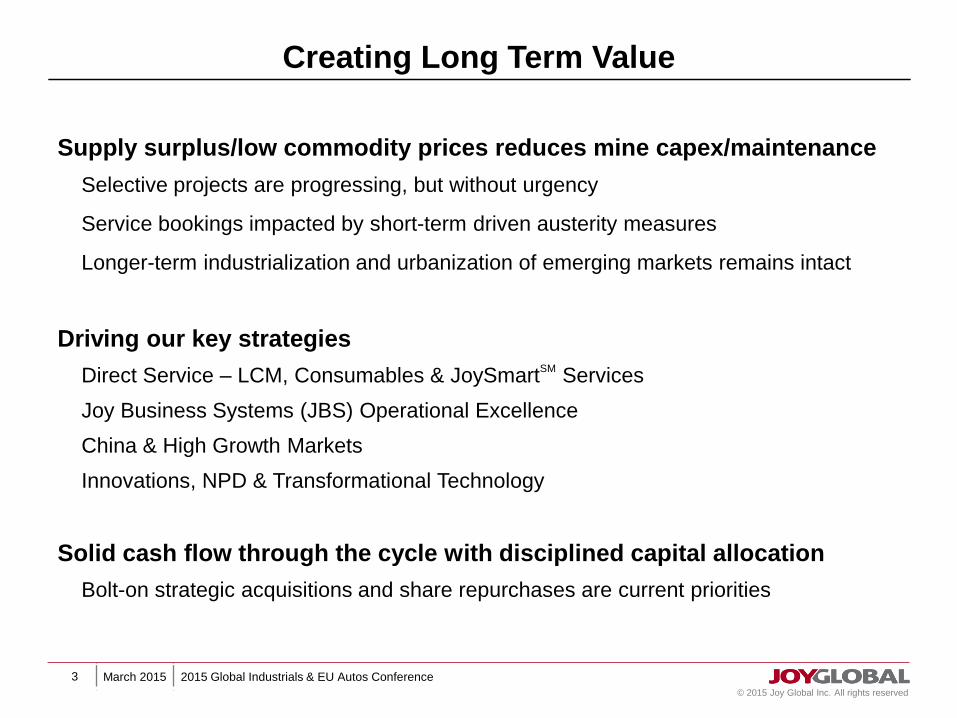
Driving our key strategies
Direct Service – LCM, Consumables & JoySmartSM
Services
Joy Business Systems (JBS) Operational Excellence
China & High Growth Markets
Innovations, NPD & Transformational Technology
Solid cash flow through the cycle with disciplined capital allocation
Bolt-on strategic acquisitions and share repurchases are current priorities
Supply surplus/low commodity prices reduces mine capex/maintenance
Selective projects are progressing, but without urgency
Service bookings impacted by short-term driven austerity measures
Longer-term industrialization and urbanization of emerging markets remains intact
Creating Long Term Value

March 2015 2015 Global Industrials & EU Autos Conference4
© 2015 Joy Global Inc. All rights reserved

March 2015 2015 Global Industrials & EU Autos Conference5
© 2015 Joy Global Inc. All rights reserved
Hard Rock
Mining Systems
Drills Draglines
Shovels
Loaders
Conveyor SystemsHybrid Shovels/Excavators
Surface CM
Systems
Joy Truckless
Mining Systems
Crushing & Conveying
Longwall Systems
Continuous
Miners
Entry Development
LHDs
Flexible
Conveyor
Trains
Joy Global’s Mine Map of the Future
Market-Leading Full-System Solutions

March 2015 2015 Global Industrials & EU Autos Conference6
© 2015 Joy Global Inc. All rights reserved
Total Joy Global Sales (last 12 months)
Global Leader in…
Americas
North: 38%
Latin America: 21%
China: 10%
Australasia: 15%
Eurasia: 7%
Africa: 9%
Original
Equipment: 30%
Consumables: 8%
Service: 62%
Coal: 59%
Other: 7%Gold: 1%Potash / Salt: 1%
Oil Sands: 3%
Iron Ore: 8%
Copper: 20%
Tunneling: 1%
Commodities We Serve
Life Cycle Management
Geographies We Service

March 2015 2015 Global Industrials & EU Autos Conference7
© 2015 Joy Global Inc. All rights reserved
Source: IEA, EIA, Energy Annual, ICSG, LME, World Bank Development Indicators, World Energy Outlook 2014
1
72768
62123
1774
8
1101
190
18
431
Half the world’s population does not have adequate access to electricity
99
71
121 Lacking adequate electricity (GW)
Have no electricity
Millions of People
Coal capacity under construction
Increasing urbanization rates will drive demand
for electricity and electrical infrastructure
'12 '20 '25 '30 '35 '40
Liquids Nuclear Renewables Nat Gas Coal
12
0
100
200
'00 '10 '25
0
100
200
'00 '10 '25
CopperThermal Coal
China Rest of WorldIndia
Coal Remains a Prominent Source
For Electricity Generation
Urbanization Populations Lead to
Higher Commodity Demand
China & India Driving
Commodity Demand (2010 = 100)
The World Needs More Energy & Minerals
March 2015 2015 Global Industrials & EU Autos Conference8
© 2015 Joy Global Inc. All rights reserved
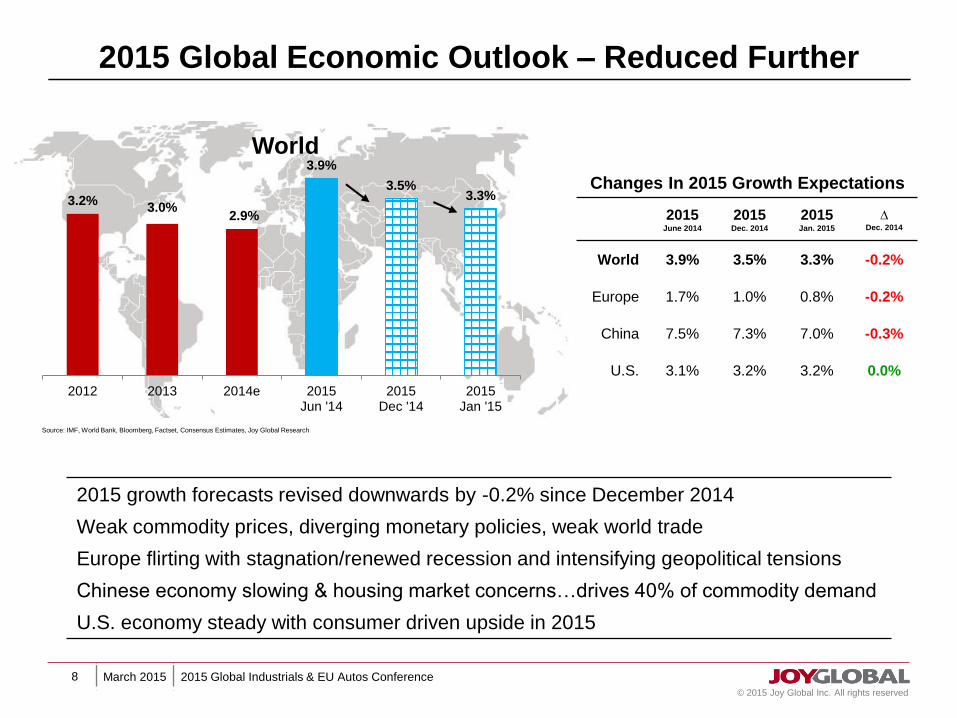
3.2%3.0%
2.9%
3.9%
3.5%3.3%
2012 2013 2014e 2015Jun '14
2015Dec '14
2015Jan '15
World
Changes In 2015 Growth Expectations
2015June 2014
2015Dec. 2014
2015Jan. 2015
∆ Dec. 2014
World 3.9% 3.5% 3.3% -0.2%
Europe 1.7% 1.0% 0.8% -0.2%
China 7.5% 7.3% 7.0% -0.3%
U.S. 3.1% 3.2% 3.2% 0.0%
2015 growth forecasts revised downwards by -0.2% since December 2014
Weak commodity prices, diverging monetary policies, weak world trade
Europe flirting with stagnation/renewed recession and intensifying geopolitical tensions
Chinese economy slowing & housing market concerns…drives 40% of commodity demand
U.S. economy steady with consumer driven upside in 2015
Source: IMF, World Bank, Bloomberg, Factset, Consensus Estimates, Joy Global Research
2015 Global Economic Outlook – Reduced Further

March 2015 2015 Global Industrials & EU Autos Conference9
© 2015 Joy Global Inc. All rights reserved
Global Copper Markets: Near-Term Price Pressure
Copper Prices ($/lb.) Near-Term Price Pressure
Reduced economic outlook pressuring prices;
hovering around $2.65/lb (-8% since Dec. 1)
Demand exposure to Chinese construction & semi-
conductors sectors remains largest threat
Near-term macro fear outweighing fundamentals:Market in deficit of ~640,000 tonnes through Nov.
Global inventories at 1.02mt ⬇38% from peak (Apr. ’13)
Global Copper Production - LTM
Long-Term Fundamentals Remain Strong
New supply growth forecast to drive market to average
surplus of ~355,000 tonnes in ‘15 & ‘16
Market returns to longer-term deficit driven by global
growth & slowing investment in new capacity
Structural headwinds; declining ore grades, labor
disputes, ore deposits going underground14
15
16
17
18
19
Jan-07 Aug-08 Mar-10 Oct-11 May-13 Dec-14
Million tonnes
Mined Copper Production Run-Rate ⬇1.1%
Global copper production LTM run-rate @ 18.43mt,
down 1.1% from 18.64mt
Mined copper production (LTM-basis) ⬇1.8% and
⬇4.0% in Chile and Peru respectively since June
$2.40
$2.50
$2.60
$2.70
$2.80
$2.90
$3.00
12/1/14 1/1/15 2/1/15 3/4/15

March 2015 2015 Global Industrials & EU Autos Conference10
© 2015 Joy Global Inc. All rights reserved
US Coal: Headwinds Persist
US Coal Production (mt)
Nat. Gas Forward Curves ($/mmBtu)
US Coal Consumption Electric Power Sector (mt)
US Coal Consumption Facing Headwinds in 2015
Power plant closures and MATS implementation
Heating-degree days ~4% above 10-year ave
Coal burn ⬇0.5% in 2014 (~4mt); declines 5% (45mt) in ‘15
Exports ⬇16% in ’14 @ 98mt; decline 8% to ~90mt in ’15
Q1 Production Down; Full-Year Expected Down ~25mt
Coal production 996mt in 2014; ⬆1.2% year-over-year
US production down ~1% through Feb
Falling natural gas prices, decreased exports, mild winter
Full-year 2015 coal production expected down ~25mt
Natural Gas Forward Curve Shifting Downward
Natural gas spot at $2.79/mmBtu March 2nd
Record gas production swells inventories, ⬆5% to 10-yr ave
Forward curve for 2015 points to $3.01/mmBtu
PRB competitive; ILB coal under additional pressures
1043 1039
932
973
931
823
861 857
816 825
650
750
850
950
1050
1150
2007 2008 2009 2010 2011 2012 2013 2014 2015e 2016e
2.00
2.50
3.00
3.50
4.00
4.50
Feb-15 Oct-15 Jun-16 Feb-17 Oct-17
Current
1-Month Ago
3-Months Ago
85.8
70.970
75
80
85
90
95
100
Jan Feb Mar Apr May Jun Jul Aug Sep Oct Nov Dec
2010 - 2014 5-Yr Ave
2014 2015

March 2015 2015 Global Industrials & EU Autos Conference11
© 2015 Joy Global Inc. All rights reserved
Seaborne Coal & Iron Ore Markets Remain Oversupplied
Thermal Coal Remains Near 5-Lows
Current prices at ~$64/t; ~30% of thermal coal @ loss
Oversupply to exist through 2015 (Aus. & Indonesia)
60% of Indian power plant’s; < than 7 days of coal
Mine closures, pricing pressure, reduce costs
Met Coal Q1 ‘15 Contract Down QoQ At $117/t
Spot prices range bound between $110 and $120
>50% of global producers underwater
Supply response slower than expected
Globally ~26mt of met coal curtailments
~15mt more needed to balance market
Cuts expected to improve pricing in 2H 2015
Seaborne Thermal Coal ($/t)
Seaborne Met Coal ($/t)
Iron Ore Prices Touch 5-Year Lows
Current prices at ~$65/t; lowest since June 2009
~65mt of Chinese iron ore being idled/closed
Iron ore prices ⬇~48% in 2014
Structural support level between $65 and $80
“Sticky” Chinese production…getting stickier as Beijing
contemplates tax cuts on domestic production
Iron Ore ($/t)
100
120
140
160
180
Jan-13 Feb-14 Mar-15
$/tonne
Spot HCC
Forecast HCC
Quarterly Contract
50
60
70
80
90
100
110
120
Mar-12 Dec-12 Sep-13 Jun-14 Mar-15
NWE marker CIF
Richards Bay FOB
Newcastle FOB
$40
$80
$120
$160
Jan-13 Jun-13 Nov-13 Apr-14 Sep-14 Feb-15

March 2015 2015 Global Industrials & EU Autos Conference12
© 2015 Joy Global Inc. All rights reserved
China Coal Market ConsolidatingChinese Electricity Consumption LTM
Chinese Coal Prices
Chinese Domestic Coal Production (mt)
Source: IHS Energy, CCM
4200
4600
5000
5400
Jan-12 Dec-12 Nov-13 Oct-14
Billion kWh
150
200
250
300
350
400
Jan Feb Mar Apr May Jun Jul Aug Sep Oct Nov Dec
2009 - 2013 2013 2014
Chinese Electricity Production Slowing…
Electricity production ⬆4.9% in ’14 vs. ⬆8.2% in ‘13
Thermal power ~77% of Chinese electricity production
down from 82% in 2011
Hydro generation and alternative sources gaining share
Coal consumption ⬇2.1% through Nov (@ 3.65bt)
Chinese Coal Market Facing Supply Controls…
Government policies curb output ~85mt (Aug – Dec)
Production ⬇~2.5% in 2014 at ~3.6bt
Further cuts expected in 2015 as oversupply remains
Stricter import restrictions began January 1st; delays at
ports as imported materials are facing higher quality
requirements and testing before transport
Chinese coal imports at 291mt in 2014 (⬇11% YoY);
headwinds into 2015 as regulations take hold
Prices likely have bottomed but marginal upside exists;
prices ⬇~16% YTD, but ⬆~6% since early-October
March 2015 2015 Global Industrials & EU Autos Conference13
© 2015 Joy Global Inc. All rights reserved
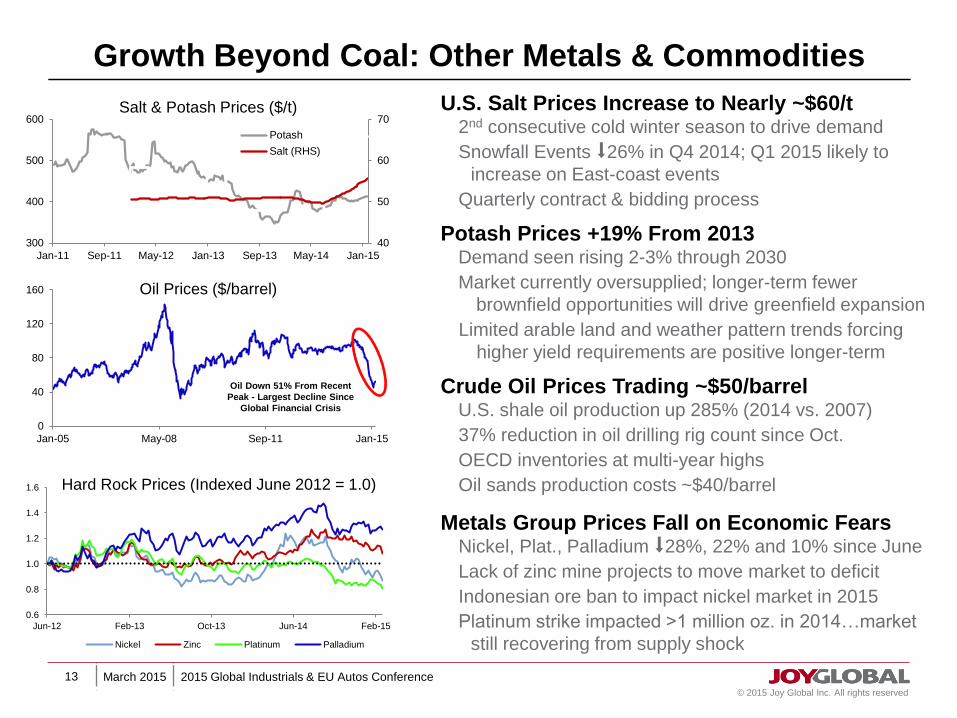
Growth Beyond Coal: Other Metals & Commodities
Salt & Potash Prices ($/t)
Hard Rock Prices (Indexed June 2012 = 1.0)
Crude Oil Prices Trading ~$50/barrelU.S. shale oil production up 285% (2014 vs. 2007)
37% reduction in oil drilling rig count since Oct.
OECD inventories at multi-year highs
Oil sands production costs ~$40/barrel
Metals Group Prices Fall on Economic FearsNickel, Plat., Palladium ⬇28%, 22% and 10% since June
Lack of zinc mine projects to move market to deficit
Indonesian ore ban to impact nickel market in 2015
Platinum strike impacted >1 million oz. in 2014…market
still recovering from supply shock
U.S. Salt Prices Increase to Nearly ~$60/t2nd consecutive cold winter season to drive demand
Snowfall Events ⬇26% in Q4 2014; Q1 2015 likely to
increase on East-coast events
Quarterly contract & bidding process
Oil Prices ($/barrel)
0.6
0.8
1.0
1.2
1.4
1.6
Jun-12 Feb-13 Oct-13 Jun-14 Feb-15
Nickel Zinc Platinum Palladium
0
40
80
120
160
Jan-05 May-08 Sep-11 Jan-15
Oil Down 51% From Recent
Peak - Largest Decline Since
Global Financial Crisis
40
50
60
70
300
400
500
600
Jan-11 Sep-11 May-12 Jan-13 Sep-13 May-14 Jan-15
Potash
Salt (RHS)
Potash Prices +19% From 2013 Demand seen rising 2-3% through 2030
Market currently oversupplied; longer-term fewer
brownfield opportunities will drive greenfield expansion
Limited arable land and weather pattern trends forcing
higher yield requirements are positive longer-term
March 2015 2015 Global Industrials & EU Autos Conference14
© 2015 Joy Global Inc. All rights reserved
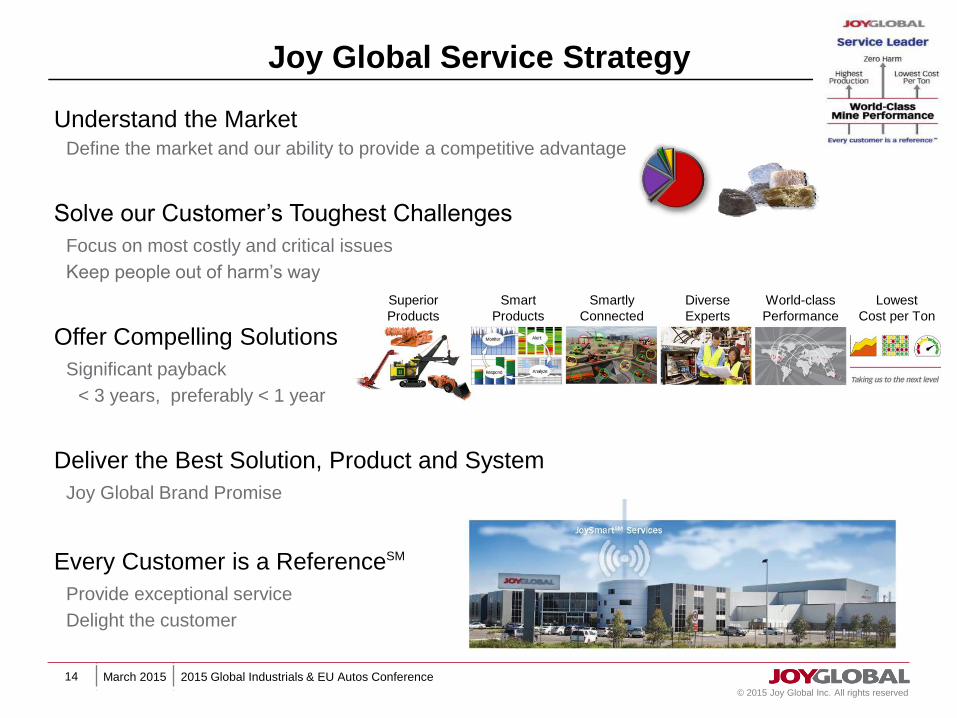
Joy Global Service Strategy
Understand the MarketDefine the market and our ability to provide a competitive advantage
Solve our Customer’s Toughest Challenges
Focus on most costly and critical issues
Keep people out of harm’s way
Offer Compelling Solutions
Significant payback
< 3 years, preferably < 1 year
Deliver the Best Solution, Product and System
Joy Global Brand Promise
Every Customer is a ReferenceSM
Provide exceptional service
Delight the customer
Superior
Products
Smartly
Connected
Diverse
Experts
Smart
Products
World-class
Performance
Lowest
Cost per Ton
March 2015 2015 Global Industrials & EU Autos Conference15
© 2015 Joy Global Inc. All rights reserved
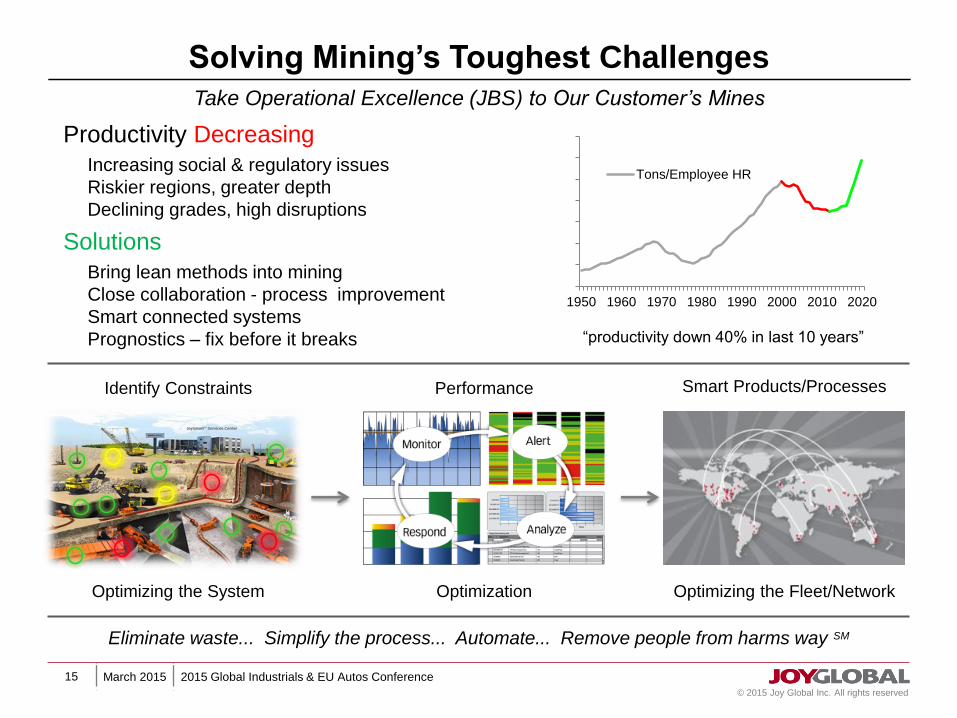
Solving Mining’s Toughest Challenges
Identify Constraints
Optimizing the System Optimizing the Fleet/Network
Smart Products/ProcessesPerformance
Take Operational Excellence (JBS) to Our Customer’s Mines
Productivity Decreasing
Increasing social & regulatory issues
Riskier regions, greater depth
Declining grades, high disruptions
Solutions
Bring lean methods into mining
Close collaboration - process improvement
Smart connected systems
Prognostics – fix before it breaks “productivity down 40% in last 10 years”
-
1.00
2.00
3.00
4.00
5.00
6.00
7.00
1950 1960 1970 1980 1990 2000 2010 2020
Tons/Employee HR
Eliminate waste... Simplify the process... Automate... Remove people from harms way SM
Optimization
March 2015 2015 Global Industrials & EU Autos Conference16
© 2015 Joy Global Inc. All rights reserved
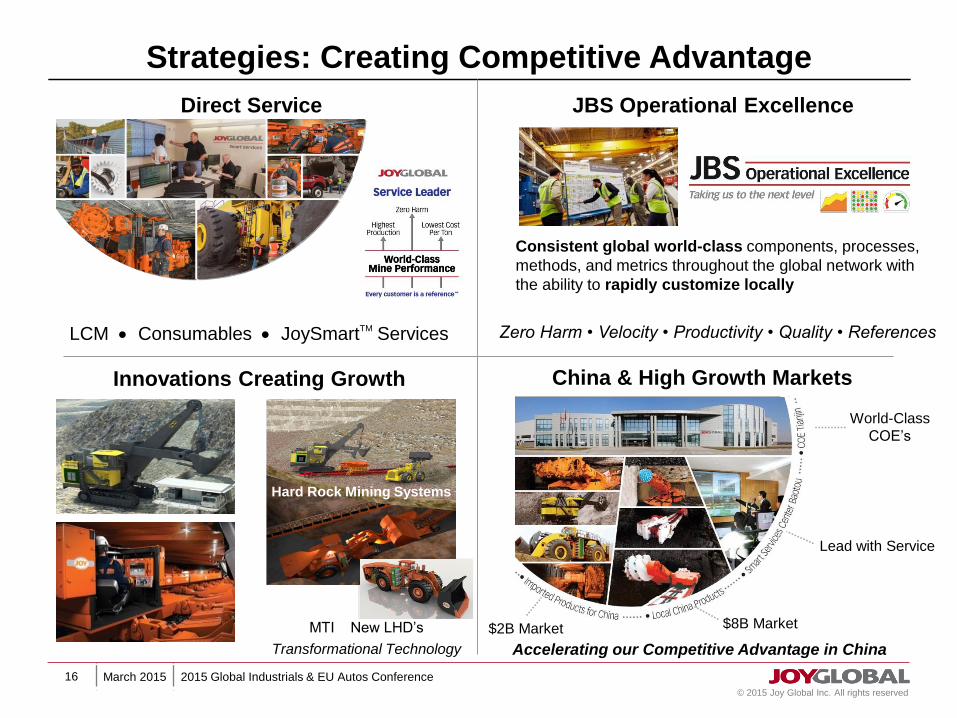
Strategies: Creating Competitive Advantage
Safety • Time • Cost • Quality • Customer Satisfaction
World-Class
COE’s
JBS Operational Excellence
Consistent global world-class components, processes,
methods, and metrics throughout the global network with
the ability to rapidly customize locally
Direct Service
Hard Rock Mining Systems
Innovations Creating Growth
MTI New LHD’s
Transformational Technology
China & High Growth Markets
Accelerating our Competitive Advantage in China
LCM Consumables JoySmartTM Services Zero Harm • Velocity • Productivity • Quality • References
Lead with Service
$8B Market$2B Market

March 2015 2015 Global Industrials & EU Autos Conference17
© 2015 Joy Global Inc. All rights reserved
Technologies: Creating New Revenue Streams
Hardrock Mining Systems
Innovations creating growth
Hybrid Shovel / Excavator
Electric Rope Shovel competitive advantage
• Long-life, reliable, lowest TCO
Diesel/Electric Hybrid
• Smaller, fuel efficient, flexible
• ~3% increase in availability
• ~15% lower total cost of ownership
Hard Rock
MTI Acquisition
New LHD’s and transformational technology
High Performance Low Seam Longwall
Unique solutions for low seams
• Highest productivity/lowest TCO
• 40% increase production
• 70% reduction in manpower

March 2015 2015 Global Industrials & EU Autos Conference18
© 2015 Joy Global Inc. All rights reserved
One Joy Global: Focused on the Customer
Direct to customers & markets
World class Products, Service,
Processes, People and Financials
Accelerating cost reduction programs
Savings exceeding targets
-$29-$22
-$10 - $20
$40
$75
$50$52
$81
-40
-20
0
20
40
60
80
100
FY13 FY14 FY15
$ MillionsAnnounced Cost
Announced Savings
Actual Savings

March 2015 2015 Global Industrials & EU Autos Conference19
© 2015 Joy Global Inc. All rights reserved
Joy Global Direct Service NetworkEvery Customer is a ReferenceSM
Consistent global world-class
components, processes, methods and
metrics throughout the global network with
the ability to rapidly customize locally
Surface
Hard Rock
Underground
Flawless from the Start
JBS Operational ExcellenceProducts/Process/People
Life Cycle Management
Prognostics & Health
Management
Performance
Life Cycle Management
March 2015 2015 Global Industrials & EU Autos Conference20
© 2015 Joy Global Inc. All rights reserved
0%
10%
20%
30%
40%
FY05 FY08 FY11 FY14
Trade Working Capital Velocity(TWC % Sales)
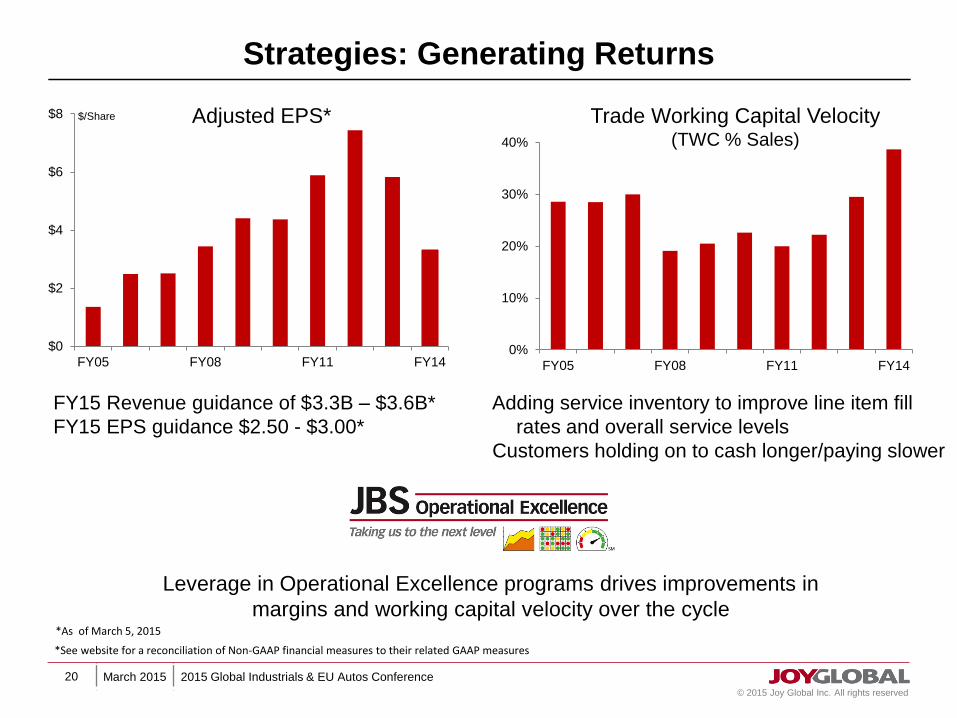
Strategies: Generating Returns
Adding service inventory to improve line item fill
rates and overall service levels
Customers holding on to cash longer/paying slower
$0
$2
$4
$6
$8
FY05 FY08 FY11 FY14
$/Share Adjusted EPS*
Leverage in Operational Excellence programs drives improvements in
margins and working capital velocity over the cycle
FY15 Revenue guidance of $3.3B – $3.6B*
FY15 EPS guidance $2.50 - $3.00*
*See website for a reconciliation of Non-GAAP financial measures to their related GAAP measures
*As of March 5, 2015

March 2015 2015 Global Industrials & EU Autos Conference21
© 2015 Joy Global Inc. All rights reserved
$0
$200
$400
$600
$800
$1,000
2007 2008 2009 2010 2011 2012 2013 2014
$ Millions
$0
$100
$200
$300
2008 2010 2012 2014 2016e
$ Millions
Cash Flow: Solid Throughout the Cycle
Adjusted Cash from Ops Before Pension Contribution
$0
$200
$400
$600
2007 2009 2011 2013 2015 2017
$ Millions Unfunded
Pension Liability
CAPEX
Strategies coupled with profitability & asset
efficiency deliver solid cash flow
Cash from operations before pension
contributions FY15: 10-15% of revenues
Dividend raised to $0.20 in June 2014; 14%
increase
~$50M per year cash contribution
OpEx, NPD, Service Footprint
March 2015 2015 Global Industrials & EU Autos Conference22
© 2015 Joy Global Inc. All rights reserved
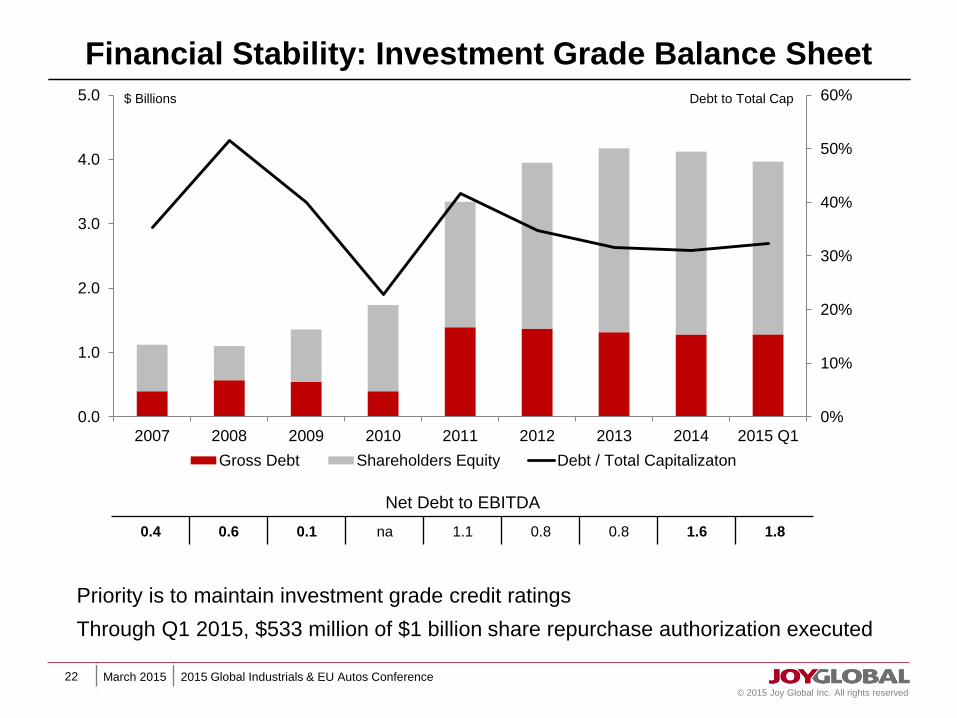
Financial Stability: Investment Grade Balance Sheet
0%
10%
20%
30%
40%
50%
60%
0.0
1.0
2.0
3.0
4.0
5.0
2007 2008 2009 2010 2011 2012 2013 2014 2015 Q1
Debt to Total Cap$ Billions
Gross Debt Shareholders Equity Debt / Total Capitalizaton
Priority is to maintain investment grade credit ratings
Through Q1 2015, $533 million of $1 billion share repurchase authorization executed
Net Debt to EBITDA
0.4 0.6 0.1 na 1.1 0.8 0.8 1.6 1.8

March 2015 2015 Global Industrials & EU Autos Conference23
© 2015 Joy Global Inc. All rights reserved
Creating Long Term Value
23
Industry-leading product positions
R&D and acquisitions enhance product range and leveraging systems
Investments expand position in underground hard rock & high growth markets
Industry-leading service infrastructure
Based on Life Cycle Management
Direct service network extended by JoySmartTM
Services
Financial strength
Strong balance sheet and solid margins/cash flow
Managing long-term performance
Operational efficiency
High growth market strategies
Investing in technologies that unlock value for customers and create growth
JOY:NYSE
100 E. Wisconsin Ave.Suite 2780
Milwaukee, WI 53202 USA
www.joyglobal.com