Embed Size (px)
Citation preview
Creating Action Sequences

This document is copyright © 2009 Pentaho Corporation. No part may be reprinted without writtenpermission from Pentaho Corporation. All trademarks are the property of their respective owners.
About This DocumentIf you have questions that are not covered in this guide, or if you find errors in theinstructions or language, please contact the Pentaho Technical Publications team [email protected]. The Publications team cannot help you resolve technical issues withproducts.
Support-related questions should be submitted through the Pentaho Customer Support Portal athttp://support.pentaho.com.
For information about how to purchase support or enable an additional named support contact,please contact your sales representative, or send an email to [email protected].
For information about instructor-led training on the topics covered in this guide, visithttp://www.pentaho.com/training.
Limits of Liability and Disclaimer of WarrantyThe author(s) of this document have used their best efforts in preparing the content and theprograms contained in it. These efforts include the development, research, and testing of thetheories and programs to determine their effectiveness. The author and publisher make no warrantyof any kind, express or implied, with regard to these programs or the documentation contained inthis book.
The author(s) and Pentaho shall not be liable in the event of incidental or consequential damagesin connection with, or arising out of, the furnishing, performance, or use of the programs, associatedinstructions, and/or claims.
TrademarksPentaho (TM) and the Pentaho logo are registered trademarks of Pentaho Corporation. Allother trademarks are the property of their respective owners. Trademarked names may appearthroughout this document. Rather than list the names and entities that own the trademarks or inserta trademark symbol with each mention of the trademarked name, Pentaho states that it is using thenames for editorial purposes only and to the benefit of the trademark owner, with no intention ofinfringing upon that trademark.
Company InformationPentaho CorporationCitadel International, Suite 3405950 Hazeltine National DriveOrlando, FL 32822Phone: +1 407 812-OPEN (6736)Fax: +1 407 517-4575http://www.pentaho.com
E-mail: [email protected]
Sales Inquiries: [email protected]
Documentation Suggestions: [email protected]
Sign-up for our newsletter:http://community.pentaho.com/newsletter/
| TOC | 3
Contents
Introduction...............................................................................................................5What is an Action Sequence?.................................................................................................. 5
What is a Solution?.................................................................................................................. 5
Requirements and Recommendations..................................................................................... 5
Using Design Studio................................................................................................. 7Initial Design Studio Configuration........................................................................................... 7
The Design Studio Interface.....................................................................................................8
Creating Design Studio Templates...........................................................................................9
Creating a Solution Directory..................................................................................10Your First Action Sequence....................................................................................11Anatomy of an Action Sequence............................................................................ 13
Output Types..........................................................................................................................14
Input Types.............................................................................................................................16
Resources.............................................................................................................................. 16
Parameter Data Types........................................................................................................... 17
Action Definition Reference.................................................................................... 18ContentRepositoryCleaner..................................................................................................... 18
EmailComponent....................................................................................................................19
PrintComponent..................................................................................................................... 21
SecureFilterComponent......................................................................................................... 23
SubActionComponent............................................................................................................ 26
TemplateComponent (Message Template)............................................................................28
JavascriptRule........................................................................................................................28
SimpleReportingComponent.................................................................................................. 29
JFreeReportComponent.........................................................................................................33
Charting..................................................................................................................................36
JFreeChart (ChartComponent)....................................................................................36
Pentaho ChartBeans (ChartBeansComponent).......................................................... 36
OpenFlashChart (OpenFlashChartComponent)..........................................................36
Editing Existing Action Sequences......................................................................... 57Internationalization Guidelines................................................................................58Advanced Action Sequence Tips and Tricks.......................................................... 60
Using Java Virtual Machine Input Parameters....................................................................... 60
Using Action Sequence Variables in Kettle/PDI..................................................................... 60
Sharing Result Sets in Action Sequences..............................................................................63
Creating Custom Action Sequence Error Messages..............................................................64
Action Sequence Tutorials......................................................................................66Creating a Bar Chart Using the Flash Chart Component....................................................... 66
Configuring Design Studio...........................................................................................66
Creating the Chart Definition....................................................................................... 67
Creating the Action Sequence.....................................................................................69
4 | | TOC
Viewing your Chart in the BI Platform..........................................................................73
Finding More Information.............................................................................................73
Using the Result Set Burst Component..................................................................................74
How the Burst Component Works............................................................................... 74
Input and Output..........................................................................................................76
Prerequisites................................................................................................................76
Implementing the Burst Component............................................................................ 76
Troubleshooting...........................................................................................................78
| Introduction | 5
Introduction
Action sequences are a unique and powerful feature of the Pentaho BI Platform; they enable BI developersand business users to perform advanced tasks that cannot easily be accomplished through Pentaho'sdesign tools and user interface functions, including interaction with third-party software frameworks. Thisguide is designed to help experienced BI Platform users learn to create and edit action sequences usingthe Action Sequence Editor built into Pentaho Design Studio.
Note: This guide is not yet finished. It is being published early because it contains a great deal ofuseful information, and the extended delay caused by completing the component reference andaction sequence examples would unreasonably prevent it from reaching BI Suite Enterprise Editioncustomers in an acceptable timeframe.
What is an Action Sequence?
An action sequence is an XML document that defines an ordered set of action definitions that togetherperform a single task; it is the smallest complete task that the Pentaho BI Platform's solution enginecan perform. It is useful for sequencing small, linear, success-oriented tasks like reporting and bursting,and has the ability to loop through a result set, call other action sequences, and conditionally executecomponents.
Action sequences can be created through raw XML (though the DOM for each component can be unique),or through the graphical interface built into Design Studio (though not every function in every component issupported).
What is a Solution?
A collection of action sequences that fit a common theme or purpose is called a solution, and eachsolution is typically in its own directory. By default, all solutions are in subdirectories in the /pentaho/server/biserver-ee/pentaho-solutions/ directory, which is mirrored in the solution repositorydatabase. Mirroring the solutions directory allows the BI Platform to have fine-grained control of user androle access to each file and subdirectory.
Requirements and Recommendations
At its core, an action sequence is an XML file with a .xaction extension. Because each componentand plugin has its own unique inputs, outputs, and action definitions, it's best not to try to create anaction sequence by hand with an XML editor -- you'll quickly get lost. Instead, you should use the ActionSequence Editor built into Pentaho Design Studio.
Design Studio is a standalone tool that facilitates the creation and management of action sequencesusing a graphical interface, and should be your tool of choice when creating, editing, and publishing actionsequences. It doesn't require knowledge or manipulation of the underlying XML, but does offer an XMLeditor so that you can hand-edit action sequences that you create through the standard user interface.While you do not necessarily need to understand how to code the bare XML for each component in orderto create simple action sequences, more complex operations require hand-editing.
Note: Some BI Platform components -- especially very new ones -- may not be fully or correctlyimplemented in Design Studio, and will require hand-editing.
Design Studio is included with a standard BI Suite Enterprise Edition workstation deployment. If it is notinstalled on your system, you can either re-run the BI Suite installation utility, or you can download an

6 | | Introduction
individual Design Studio package from the Pentaho Enterprise Edition FTP site, or the Knowledge Base. Ifyou are on a supported 64-bit operating system, you will have to install the Eclipse integrated developmentenvironment for your platform, then download and install the Pentaho Action Sequence Editor plugins.Instructions for this process are included in the Pentaho BI Suite 3.5.2 Archive-Based Installation Guide,which is available in the Pentaho Knowledge Base.
In order to test and publish your action sequences, you will have to either install Design Studio onthe same machine as your BI Server, or you will have to install a standalone BI Server instance foraction sequence development on your workstation. Once you've developed and tested your new actionsequence, you can copy it over to your production server to deploy it.
| Using Design Studio | 7
Using Design Studio
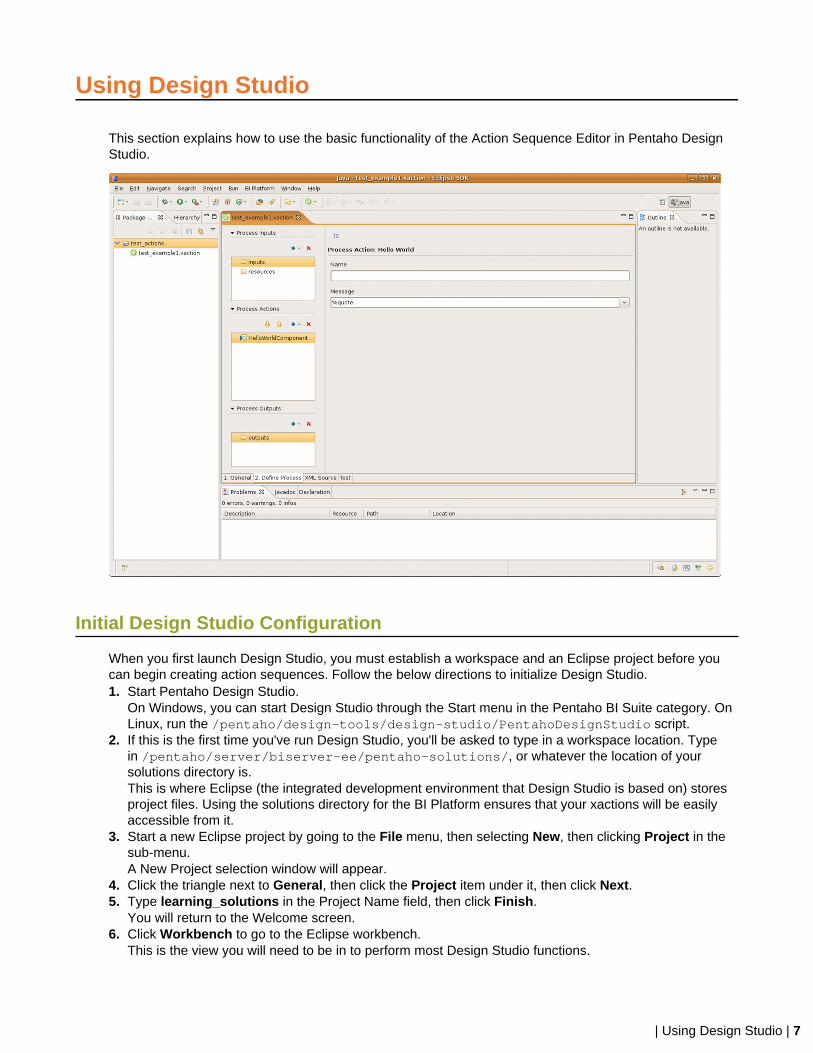
This section explains how to use the basic functionality of the Action Sequence Editor in Pentaho DesignStudio.
Initial Design Studio Configuration
When you first launch Design Studio, you must establish a workspace and an Eclipse project before youcan begin creating action sequences. Follow the below directions to initialize Design Studio.1. Start Pentaho Design Studio.
On Windows, you can start Design Studio through the Start menu in the Pentaho BI Suite category. OnLinux, run the /pentaho/design-tools/design-studio/PentahoDesignStudio script.
2. If this is the first time you've run Design Studio, you'll be asked to type in a workspace location. Typein /pentaho/server/biserver-ee/pentaho-solutions/, or whatever the location of yoursolutions directory is.This is where Eclipse (the integrated development environment that Design Studio is based on) storesproject files. Using the solutions directory for the BI Platform ensures that your xactions will be easilyaccessible from it.
3. Start a new Eclipse project by going to the File menu, then selecting New, then clicking Project in thesub-menu.A New Project selection window will appear.
4. Click the triangle next to General, then click the Project item under it, then click Next.5. Type learning_solutions in the Project Name field, then click Finish.
You will return to the Welcome screen.6. Click Workbench to go to the Eclipse workbench.
This is the view you will need to be in to perform most Design Studio functions.
8 | | Using Design Studio
Design Studio is now configured with a Pentaho workspace and a project directory for creating andmanaging new action sequences.
When you are ready to create production-quality action sequences, you should start a new Eclipse projectfor each new solution.
The Design Studio Interface
Design Studio features a modular interface with the following tabs:
• General This tab enables you to define and modify basic values including the logging level, result type,and icon for the action sequence.
• Define Process This tab is where you define the process inputs, process actions, and process outputsthat go together to make up an action sequence.
• XML Source This tab enables you to view the bare action sequence XML.• Test This tab allows you to test the action sequence inside of Design Studio.
Note: The Test tab does not work on Linux or Solaris. To test an action sequence, publish it to yourtest server
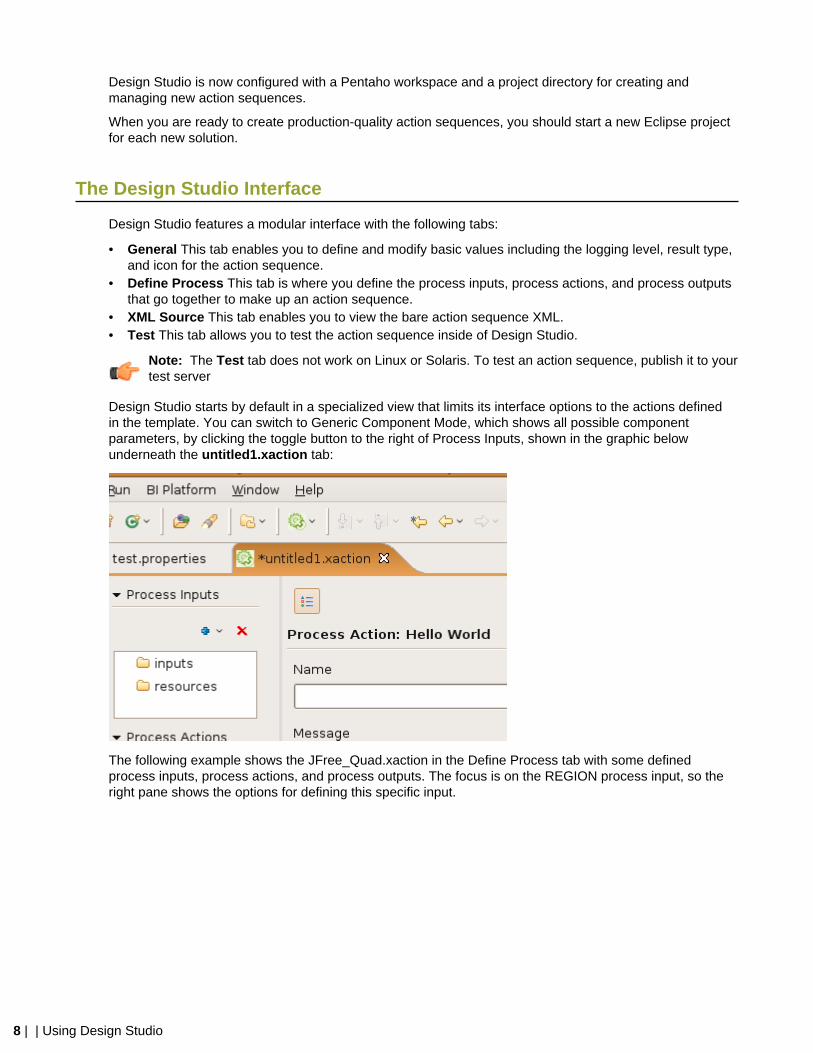
Design Studio starts by default in a specialized view that limits its interface options to the actions definedin the template. You can switch to Generic Component Mode, which shows all possible componentparameters, by clicking the toggle button to the right of Process Inputs, shown in the graphic belowunderneath the untitled1.xaction tab:
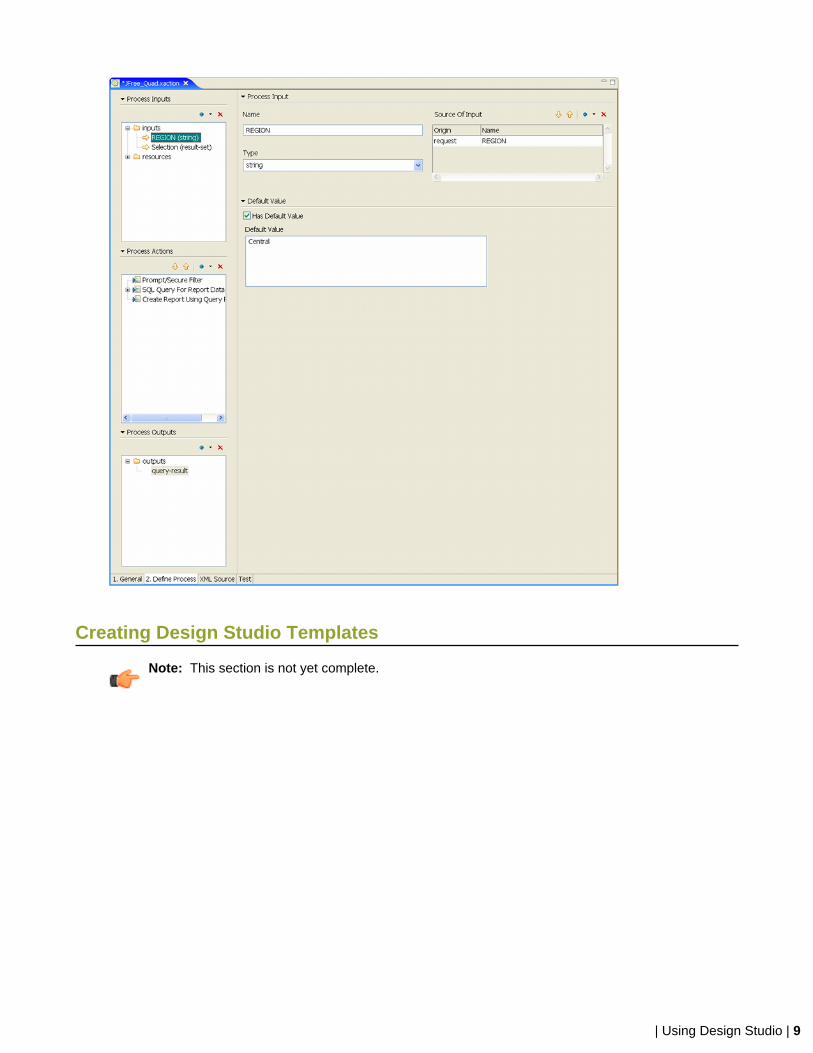
The following example shows the JFree_Quad.xaction in the Define Process tab with some definedprocess inputs, process actions, and process outputs. The focus is on the REGION process input, so theright pane shows the options for defining this specific input.
| Using Design Studio | 9
Creating Design Studio Templates
Note: This section is not yet complete.
10 | | Creating a Solution Directory
Creating a Solution Directory
Before you begin creating action sequences, it makes sense to create a directory to store them in. Intheory, this directory will contain a collection of action sequences that fit a common purpose or theme-- a solution, which would make this a solution directory. You should create a new directory for everysolution you develop.
1. Create a new directory in /pentaho/server/biserver-ee/pentaho-solutions/.
Use underscores instead of spaces in the solution directory name. Ensure that the directory has theappropriate user and group ownership to be writable from the BI Platform.
2. Using an XML-aware text editor (or Design Studio), create a file named index.xml in your new solutiondirectory.
3. Copy the following text into the index.xml file, changing the content accordingly:
<index> <name>Example Solution</name> <description>This solution contains examples I created while learning to work with action sequences.</description> <icon></icon> <visible>true</visible> <display-type>icons</display-type></index>
4. Save the file and close the text editor.
5. Log into the Pentaho User Console as an administrator.
6. Refresh the solution repository cache by going to the Tools menu, then selecting the Refreshsubmenu, then clicking on Repository Cache.
You now have a new solution directory. It will show up in all file dialogues in the Pentaho User Console aswell as the Solution Browser in the left pane.
Every time you add or edit an action sequence to your solution directory, you must refresh the repositorycache as explained above. Each user currently logged into the Pentaho User Console must also refreshtheir session cache; this is best done by re-logging into the Pentaho User Console.
| Your First Action Sequence | 11
Your First Action Sequence
Follow the directions below to create the simplest kind of functional action sequence with Design Studio.
1. In Design Studio, go to the File menu, then select New, and click on Other... in the sub-menu.The New window will appear.
2. In the New window, click the triangle next to Pentaho, select New Action Sequence Wizard, then clickNext.
3. In the File name field, type hello_world.xaction.4. Select Hello World from the Template drop-down box, then click Finish.
The wizard will generate the new file and bring you back to the workbench.5. Click on HelloWorldComponent in the Process Actions section on the left.
The right side of the screen will change to show the options available for this action: Name andMessage. The Name field controls the name of the component in the Process Actions list on the left;it doesn't do anything else of note. The Message field contains the text that will appear on the screenwhen the action sequence is run. It is pre-populated with %quote, which is a token that representsa quote message in a nonexistent properties file. Pentaho used to provide properties files for eachexample, but they have been removed from the standard BI Suite distribution.
6. Replace the %quote with a sufficiently inspiring message.Alternatively, you could create a hello_world.properties file and populate it with the appropriatemessages and tokens, but that has no advantage unless you intend to internationalize this actionsequence.
7. Save the file.
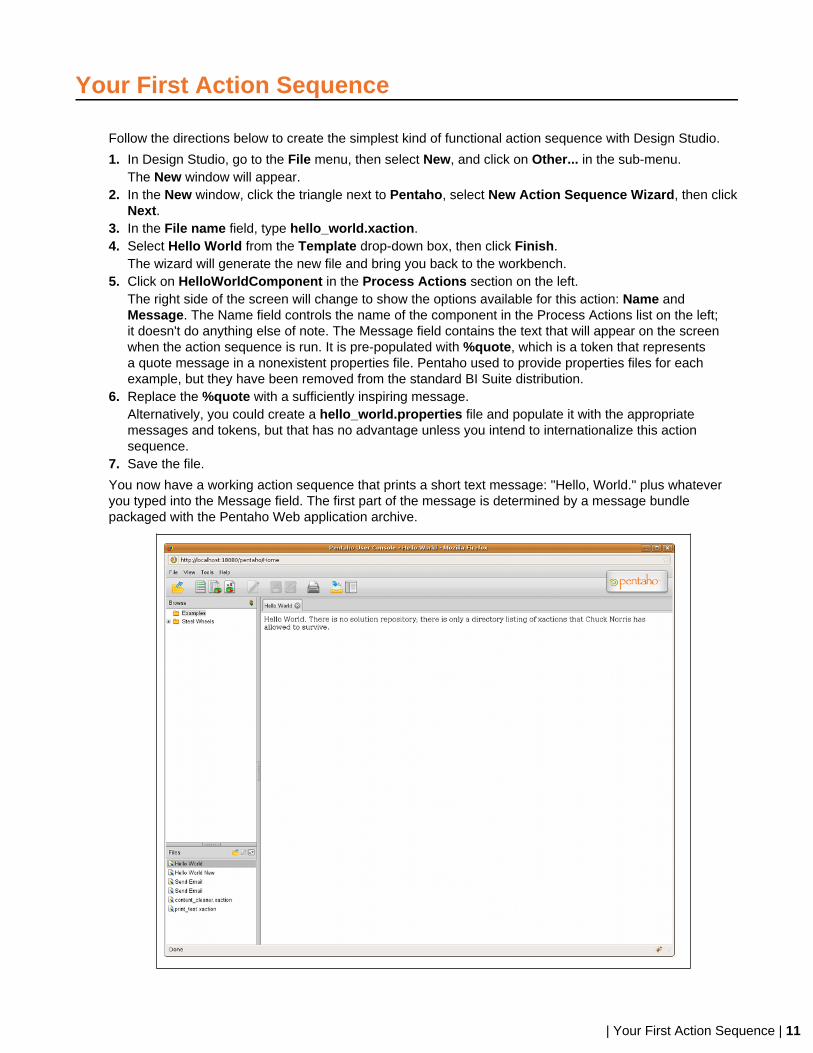
You now have a working action sequence that prints a short text message: "Hello, World." plus whateveryou typed into the Message field. The first part of the message is determined by a message bundlepackaged with the Pentaho Web application archive.

12 | | Your First Action Sequence
To test the action sequence, use the Test tab if you are on Windows or OS X, or log into the Pentaho UserConsole and run it from the Solution Browser.
| Anatomy of an Action Sequence | 13
Anatomy of an Action Sequence
In the below example action sequence, an email is generated and sent to either Joe or Suzy, dependingon which region the user selects. There are four inputs: region, from, subject, and message-plain. Theregion input type is defined as a string, and it has a default value of Central. Region may come from oneof two sources: request or session. When the RuntimeContext resolves the region input at runtime, itwill first look in the request (most likely an HTTP request). If it doesn't find it in the request, it will look in thesession (most likely the HTTP session). If it is not available in the session, the default value will be used.The order that the sources are specified in the XML document is the order that they will be searched. Thedefault is always used as a last resort.
The other three inputs only specify a default value. This is analogous to hard-coding the parameters to aconstant value. Since the output of this action sequence is an email message, no output parameters will beset.
There are two action-definition nodes for this sequence. The first invokes the JavascriptRule componentand takes a region parameter as input; it will create a new parameter called rule_result as output. Thisnew parameter will be made available to other action-definition nodes in the sequence.
The Javascript defined in the component-definition will be executed and will set the value of rule_resultto the appropriate email address, based on the value of region.
When the first action-definition completes, the second, which defines an interaction withEmailComponent, will execute. EmailComponent requires four action-inputs: to, from, subject, andmessage-plain.
You may have noticed that some of the action-inputs (from, subject and message-plain) are also specifiedin the inputs section of the action sequence header. The RuntimeContext will take the values from thereand pass them to EmailComponent just as it passed region to the JavascriptRule. The source of the action-input is indirectly defined with the mapping attribute, which tells the RuntimeContext to use the value fromrule_result that was generated by the JavascriptRule action and use it as the component's to input.
<action-sequence> <name>Example1.xaction</name>
<documentation> <author>Chuck Norris</author> <description>Email to selected user</description> <help>There is no help when Chuck Norris emails you</help> </documentation>
<inputs> <region type="string"> <default-value>Central</default-value> <sources> <request>REGION</request> <session>aRegion</session> </sources> </region>
<from type="string"> <default-value>[email protected]</default-value> </from>
<subject type="string"> <default-value>Pentaho Example1</default-value> </subject>
<message-plain type="string"> <default-value> This is an email from the Pentaho BI Platform - Example1
14 | | Anatomy of an Action Sequence
</default-value> </message-plain> </inputs>
<outputs/>
<resources/>
<actions> <action-definition> <action-inputs> <region type="string"/> </action-inputs>
<action-outputs> <rule_result type="string"/> </action-outputs>
<component-name>JavascriptRule</component-name> <component-definition> <script> <![CDATA[ if ( "Central".equals( region ) ) { rule_result = "[email protected]"; } else { rule_result = "[email protected]"; } ]]> </script> </component-definition> </action-definition>
<action-definition> <action-inputs> <to type="string" mapping="rule_result"/> <from type="string"/> <subject type="string"/> <message-plain type="string"/> </action-inputs> <component-name>EmailComponent</component-name> <component-definition/> </action-definition>
</actions></action-sequence>
Output Types
Component-specific action-outputs are defined on an individual basis and can vary; however, global outputhandlers are static.
The output variable data types are defined in Design Studio, and are reasonably self-explanatory. For themajority of action sequences, you will only be using string and content (binary file) data types. All outputtypes can be parameterized by using {curly braces}.
response
This directs previously generated content to whatever agent made the request (usually a Web browser).If you want to save the content for later use, you should use the file output handler (explained below)instead.
| Anatomy of an Action Sequence | 15
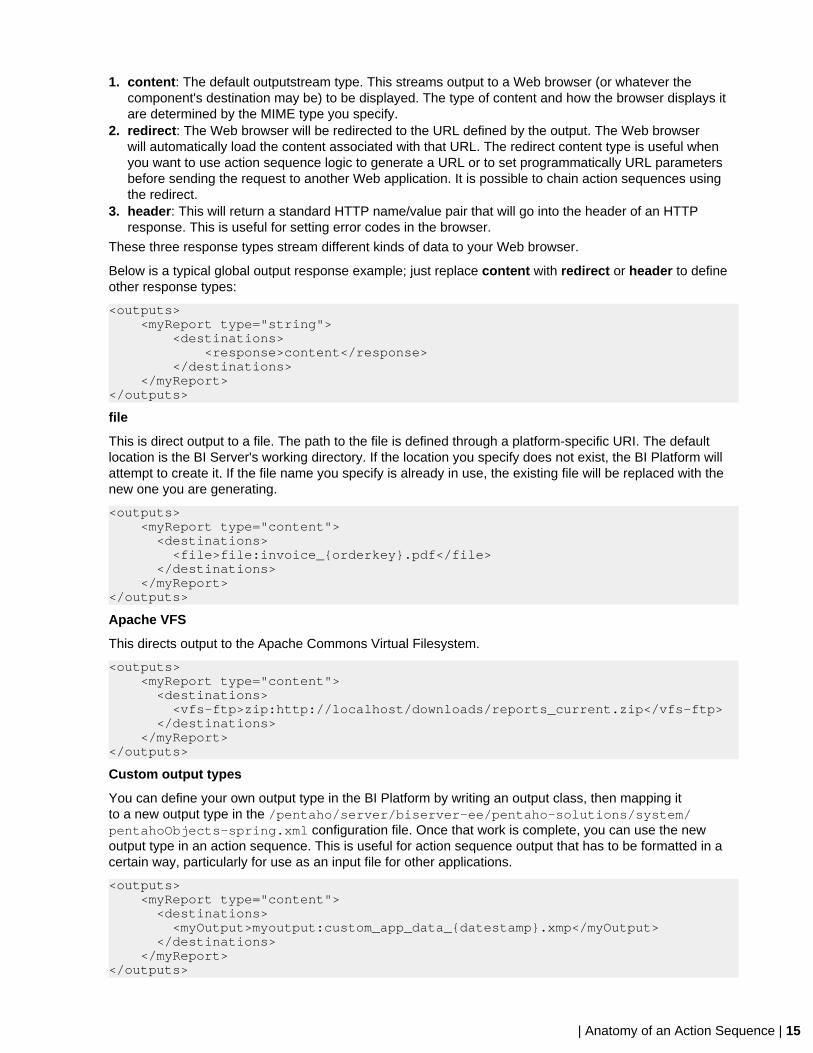
1. content: The default outputstream type. This streams output to a Web browser (or whatever thecomponent's destination may be) to be displayed. The type of content and how the browser displays itare determined by the MIME type you specify.
2. redirect: The Web browser will be redirected to the URL defined by the output. The Web browserwill automatically load the content associated with that URL. The redirect content type is useful whenyou want to use action sequence logic to generate a URL or to set programmatically URL parametersbefore sending the request to another Web application. It is possible to chain action sequences usingthe redirect.
3. header: This will return a standard HTTP name/value pair that will go into the header of an HTTPresponse. This is useful for setting error codes in the browser.
These three response types stream different kinds of data to your Web browser.
Below is a typical global output response example; just replace content with redirect or header to defineother response types:
<outputs> <myReport type="string"> <destinations> <response>content</response> </destinations> </myReport> </outputs>
file
This is direct output to a file. The path to the file is defined through a platform-specific URI. The defaultlocation is the BI Server's working directory. If the location you specify does not exist, the BI Platform willattempt to create it. If the file name you specify is already in use, the existing file will be replaced with thenew one you are generating.
<outputs> <myReport type="content"> <destinations> <file>file:invoice_{orderkey}.pdf</file> </destinations> </myReport> </outputs>
Apache VFS
This directs output to the Apache Commons Virtual Filesystem.
<outputs> <myReport type="content"> <destinations> <vfs-ftp>zip:http://localhost/downloads/reports_current.zip</vfs-ftp> </destinations> </myReport> </outputs>
Custom output types
You can define your own output type in the BI Platform by writing an output class, then mapping itto a new output type in the /pentaho/server/biserver-ee/pentaho-solutions/system/pentahoObjects-spring.xml configuration file. Once that work is complete, you can use the newoutput type in an action sequence. This is useful for action sequence output that has to be formatted in acertain way, particularly for use as an input file for other applications.
<outputs> <myReport type="content"> <destinations> <myOutput>myoutput:custom_app_data_{datestamp}.xmp</myOutput> </destinations> </myReport> </outputs>
16 | | Anatomy of an Action Sequence
Input Types
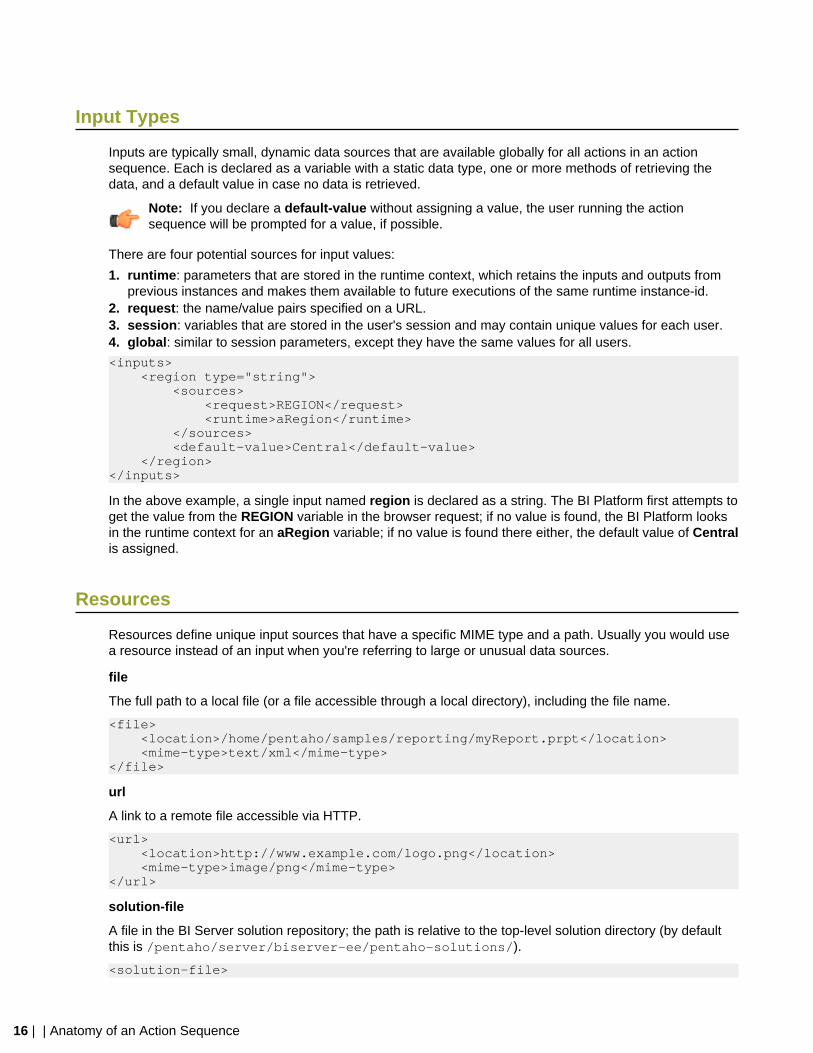
Inputs are typically small, dynamic data sources that are available globally for all actions in an actionsequence. Each is declared as a variable with a static data type, one or more methods of retrieving thedata, and a default value in case no data is retrieved.
Note: If you declare a default-value without assigning a value, the user running the actionsequence will be prompted for a value, if possible.
There are four potential sources for input values:
1. runtime: parameters that are stored in the runtime context, which retains the inputs and outputs fromprevious instances and makes them available to future executions of the same runtime instance-id.
2. request: the name/value pairs specified on a URL.3. session: variables that are stored in the user's session and may contain unique values for each user.4. global: similar to session parameters, except they have the same values for all users.
<inputs> <region type="string"> <sources> <request>REGION</request> <runtime>aRegion</runtime> </sources> <default-value>Central</default-value> </region></inputs>
In the above example, a single input named region is declared as a string. The BI Platform first attempts toget the value from the REGION variable in the browser request; if no value is found, the BI Platform looksin the runtime context for an aRegion variable; if no value is found there either, the default value of Centralis assigned.
Resources
Resources define unique input sources that have a specific MIME type and a path. Usually you would usea resource instead of an input when you're referring to large or unusual data sources.
file
The full path to a local file (or a file accessible through a local directory), including the file name.
<file> <location>/home/pentaho/samples/reporting/myReport.prpt</location> <mime-type>text/xml</mime-type></file>
url
A link to a remote file accessible via HTTP.
<url> <location>http://www.example.com/logo.png</location> <mime-type>image/png</mime-type></url>
solution-file
A file in the BI Server solution repository; the path is relative to the top-level solution directory (by defaultthis is /pentaho/server/biserver-ee/pentaho-solutions/).
<solution-file>
| Anatomy of an Action Sequence | 17
<location>myReport.prpt</location> <mime-type>application/zip</mime-type></solution-file>
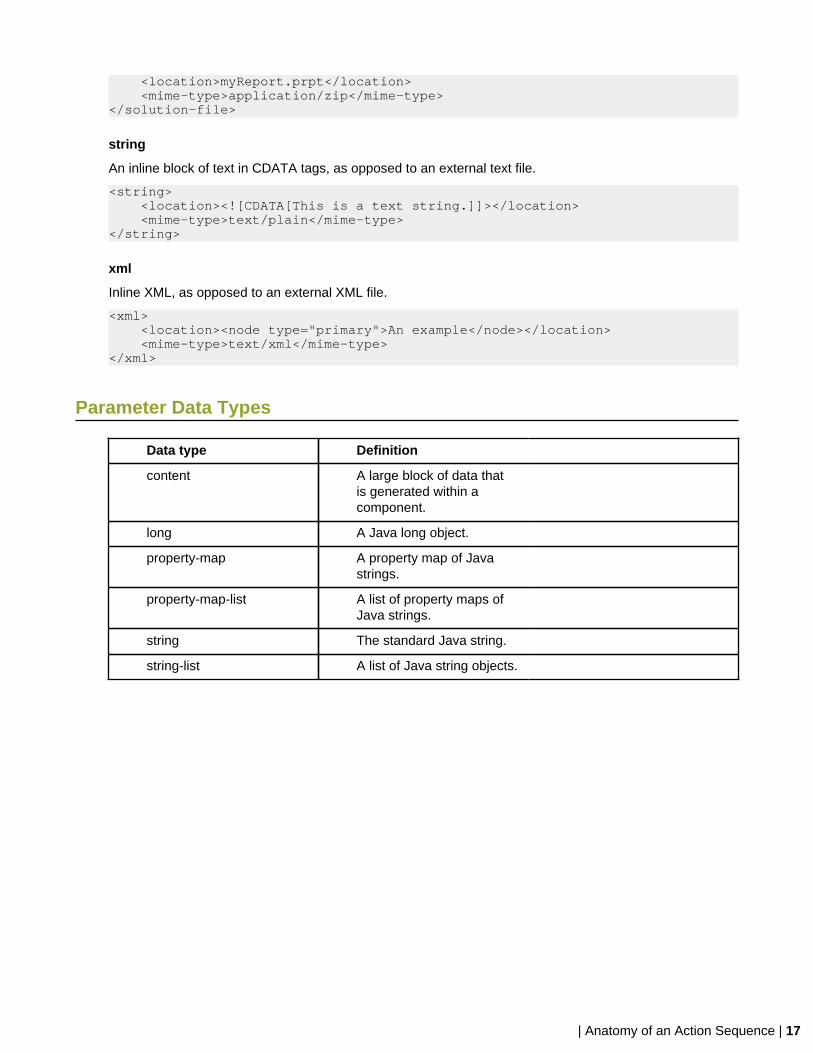
string
An inline block of text in CDATA tags, as opposed to an external text file.
<string> <location><![CDATA[This is a text string.]]></location> <mime-type>text/plain</mime-type></string>
xml
Inline XML, as opposed to an external XML file.
<xml> <location><node type="primary">An example</node></location> <mime-type>text/xml</mime-type></xml>
Parameter Data Types
Data type Definition
content A large block of data thatis generated within acomponent.
long A Java long object.
property-map A property map of Javastrings.
property-map-list A list of property maps ofJava strings.
string The standard Java string.
string-list A list of Java string objects.
18 | | Action Definition Reference
Action Definition Reference
All of the possible BI Platform action definitions -- the entirety of what you can do with an action sequence-- are defined in sufficient detail below. Some components have templates in Design Studio, and some donot. When you can't use a template, you will have to switch to Generic Component Mode, or create theaction sequence with raw XML.
Note: All XML tags are case-sensitive. Some are all lowercase, some are all uppercase, and someare camel-cased. Pay close attention to case-sensitivity when working in Generic Component Modeand with raw XML.
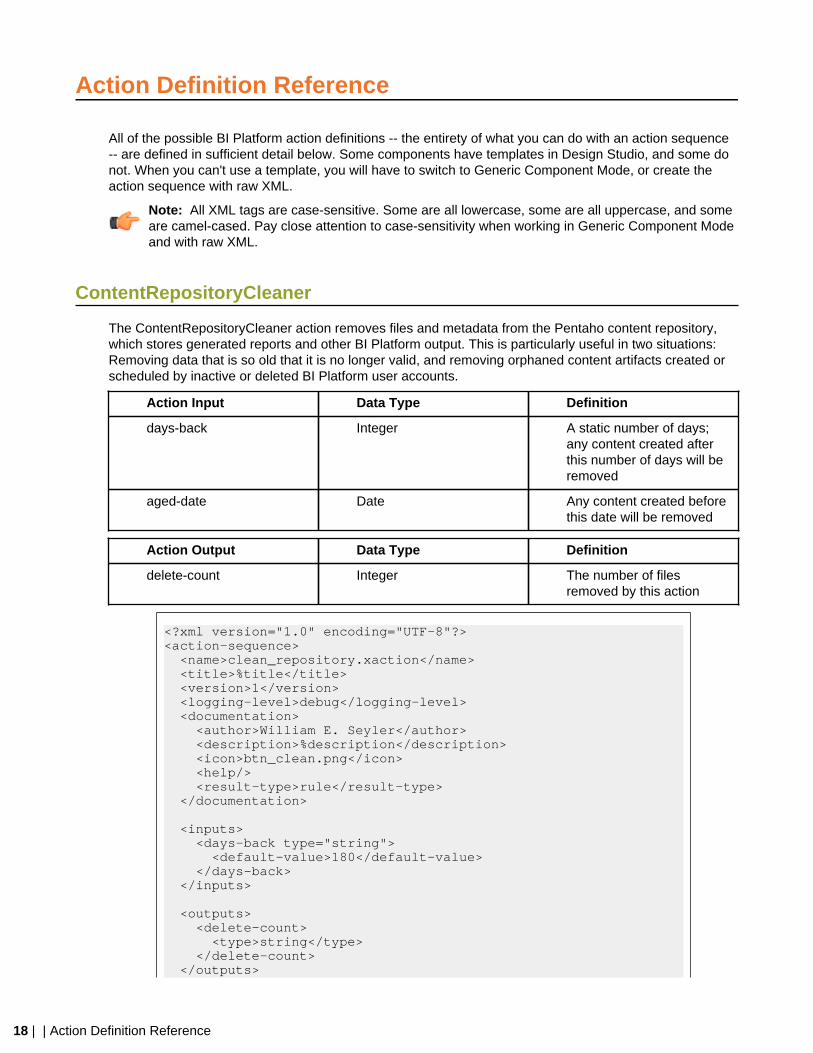
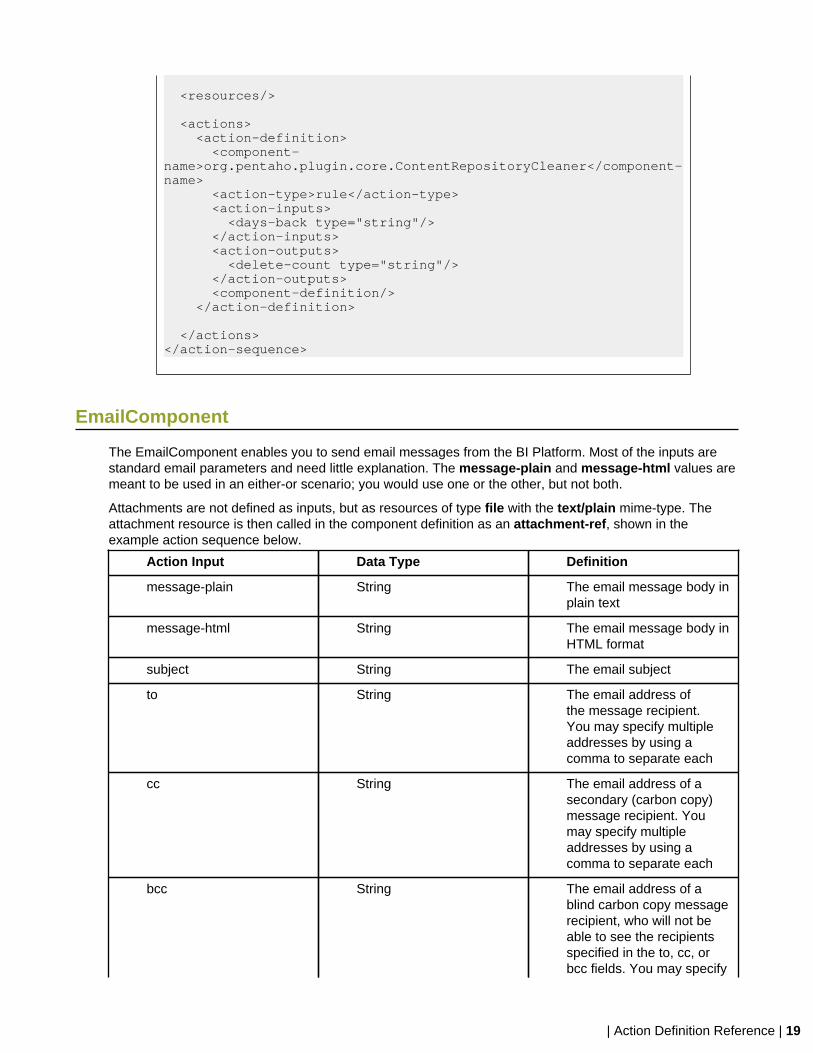
ContentRepositoryCleaner
The ContentRepositoryCleaner action removes files and metadata from the Pentaho content repository,which stores generated reports and other BI Platform output. This is particularly useful in two situations:Removing data that is so old that it is no longer valid, and removing orphaned content artifacts created orscheduled by inactive or deleted BI Platform user accounts.
Action Input Data Type Definition
days-back Integer A static number of days;any content created afterthis number of days will beremoved
aged-date Date Any content created beforethis date will be removed
Action Output Data Type Definition
delete-count Integer The number of filesremoved by this action
<?xml version="1.0" encoding="UTF-8"?><action-sequence> <name>clean_repository.xaction</name> <title>%title</title> <version>1</version> <logging-level>debug</logging-level> <documentation> <author>William E. Seyler</author> <description>%description</description> <icon>btn_clean.png</icon> <help/> <result-type>rule</result-type> </documentation>
<inputs> <days-back type="string"> <default-value>180</default-value> </days-back> </inputs>
<outputs> <delete-count> <type>string</type> </delete-count> </outputs>
| Action Definition Reference | 19
<resources/> <actions> <action-definition> <component-name>org.pentaho.plugin.core.ContentRepositoryCleaner</component-name> <action-type>rule</action-type> <action-inputs> <days-back type="string"/> </action-inputs> <action-outputs> <delete-count type="string"/> </action-outputs> <component-definition/> </action-definition> </actions> </action-sequence>
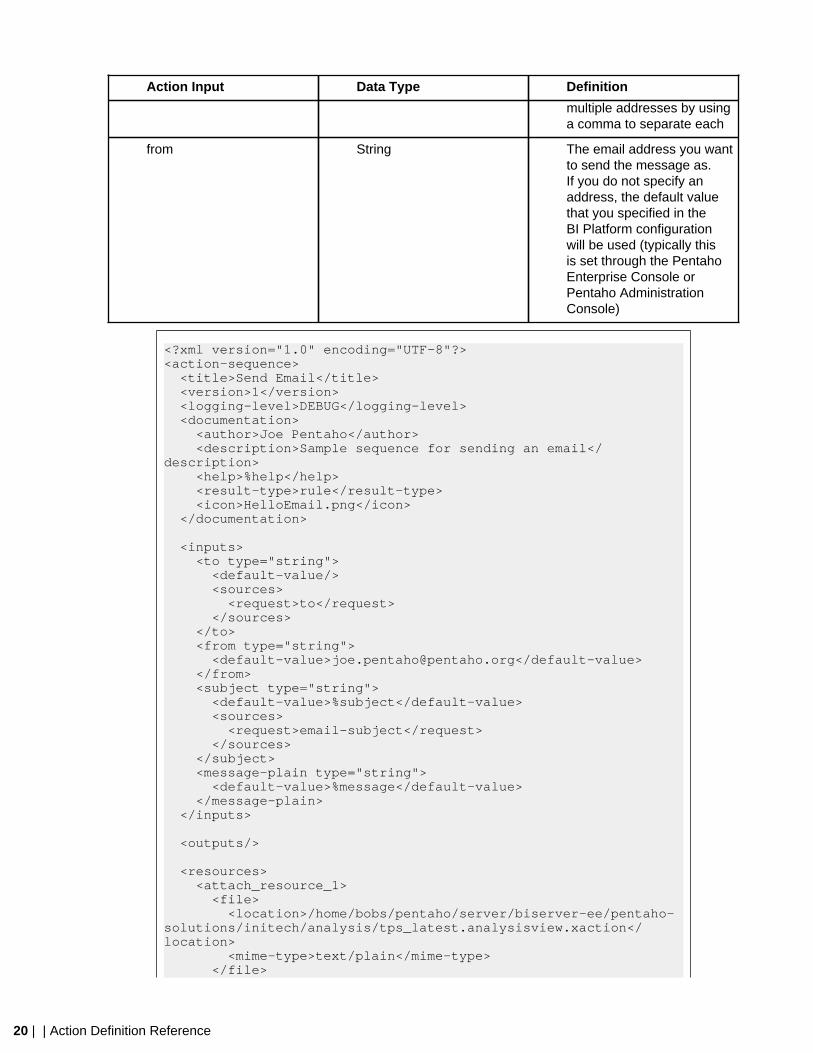
EmailComponent
The EmailComponent enables you to send email messages from the BI Platform. Most of the inputs arestandard email parameters and need little explanation. The message-plain and message-html values aremeant to be used in an either-or scenario; you would use one or the other, but not both.
Attachments are not defined as inputs, but as resources of type file with the text/plain mime-type. Theattachment resource is then called in the component definition as an attachment-ref, shown in theexample action sequence below.
Action Input Data Type Definition
message-plain String The email message body inplain text
message-html String The email message body inHTML format
subject String The email subject
to String The email address ofthe message recipient.You may specify multipleaddresses by using acomma to separate each
cc String The email address of asecondary (carbon copy)message recipient. Youmay specify multipleaddresses by using acomma to separate each
bcc String The email address of ablind carbon copy messagerecipient, who will not beable to see the recipientsspecified in the to, cc, orbcc fields. You may specify
20 | | Action Definition Reference
Action Input Data Type Definition
multiple addresses by usinga comma to separate each
from String The email address you wantto send the message as.If you do not specify anaddress, the default valuethat you specified in theBI Platform configurationwill be used (typically thisis set through the PentahoEnterprise Console orPentaho AdministrationConsole)
<?xml version="1.0" encoding="UTF-8"?><action-sequence> <title>Send Email</title> <version>1</version> <logging-level>DEBUG</logging-level> <documentation> <author>Joe Pentaho</author> <description>Sample sequence for sending an email</description> <help>%help</help> <result-type>rule</result-type> <icon>HelloEmail.png</icon> </documentation>
<inputs> <to type="string"> <default-value/> <sources> <request>to</request> </sources> </to> <from type="string"> <default-value>[email protected]</default-value> </from> <subject type="string"> <default-value>%subject</default-value> <sources> <request>email-subject</request> </sources> </subject> <message-plain type="string"> <default-value>%message</default-value> </message-plain> </inputs>
<outputs/>
<resources> <attach_resource_1> <file> <location>/home/bobs/pentaho/server/biserver-ee/pentaho-solutions/initech/analysis/tps_latest.analysisview.xaction</location> <mime-type>text/plain</mime-type> </file>
| Action Definition Reference | 21
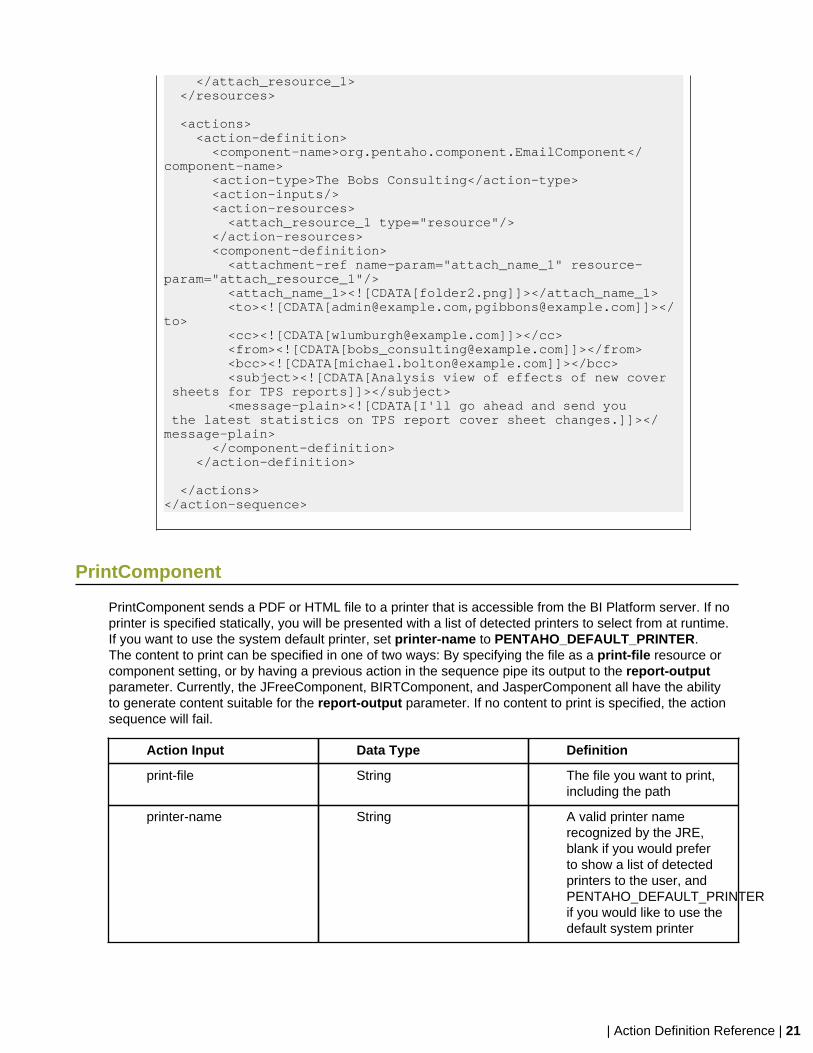
</attach_resource_1> </resources> <actions> <action-definition> <component-name>org.pentaho.component.EmailComponent</component-name> <action-type>The Bobs Consulting</action-type> <action-inputs/> <action-resources> <attach_resource_1 type="resource"/> </action-resources> <component-definition> <attachment-ref name-param="attach_name_1" resource-param="attach_resource_1"/> <attach_name_1><![CDATA[folder2.png]]></attach_name_1> <to><![CDATA[[email protected],[email protected]]]></to> <cc><![CDATA[[email protected]]]></cc> <from><![CDATA[[email protected]]]></from> <bcc><![CDATA[[email protected]]]></bcc> <subject><![CDATA[Analysis view of effects of new cover sheets for TPS reports]]></subject> <message-plain><![CDATA[I'll go ahead and send you the latest statistics on TPS report cover sheet changes.]]></message-plain> </component-definition> </action-definition> </actions> </action-sequence>
PrintComponent
PrintComponent sends a PDF or HTML file to a printer that is accessible from the BI Platform server. If noprinter is specified statically, you will be presented with a list of detected printers to select from at runtime.If you want to use the system default printer, set printer-name to PENTAHO_DEFAULT_PRINTER.The content to print can be specified in one of two ways: By specifying the file as a print-file resource orcomponent setting, or by having a previous action in the sequence pipe its output to the report-outputparameter. Currently, the JFreeComponent, BIRTComponent, and JasperComponent all have the abilityto generate content suitable for the report-output parameter. If no content to print is specified, the actionsequence will fail.
Action Input Data Type Definition
print-file String The file you want to print,including the path
printer-name String A valid printer namerecognized by the JRE,blank if you would preferto show a list of detectedprinters to the user, andPENTAHO_DEFAULT_PRINTERif you would like to use thedefault system printer
22 | | Action Definition Reference
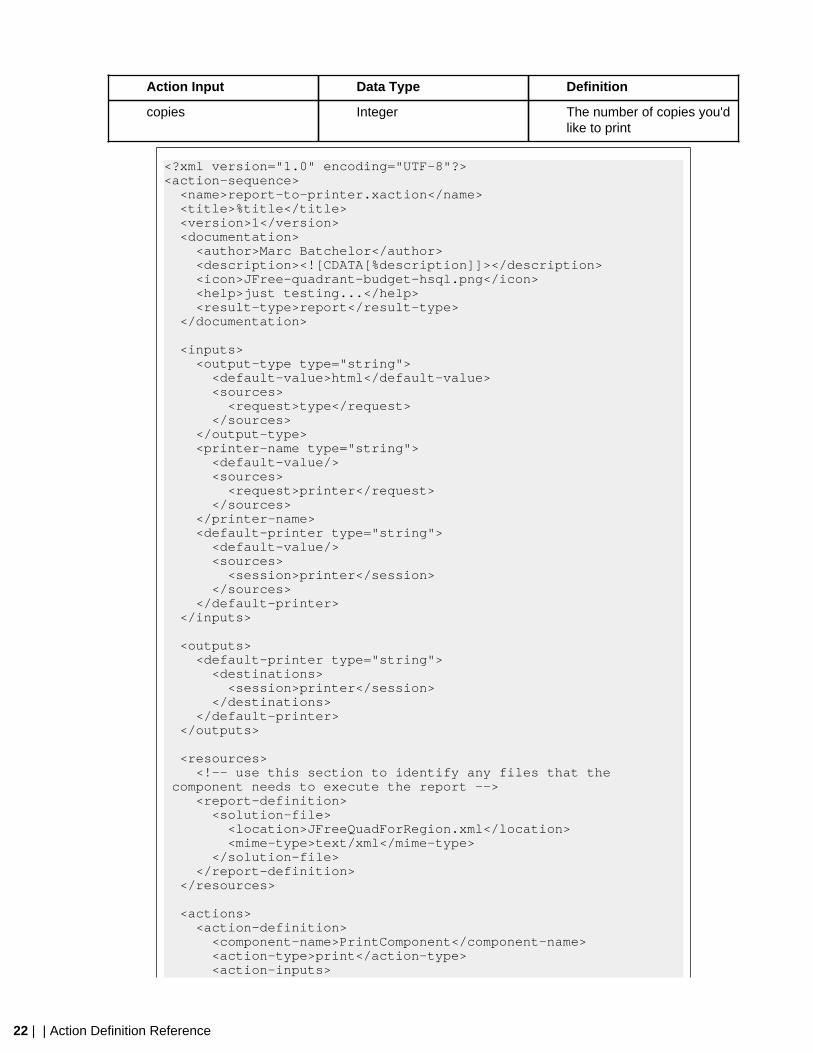
Action Input Data Type Definition
copies Integer The number of copies you'dlike to print
<?xml version="1.0" encoding="UTF-8"?><action-sequence> <name>report-to-printer.xaction</name> <title>%title</title> <version>1</version> <documentation> <author>Marc Batchelor</author> <description><![CDATA[%description]]></description> <icon>JFree-quadrant-budget-hsql.png</icon> <help>just testing...</help> <result-type>report</result-type> </documentation>
<inputs> <output-type type="string"> <default-value>html</default-value> <sources> <request>type</request> </sources> </output-type> <printer-name type="string"> <default-value/> <sources> <request>printer</request> </sources> </printer-name> <default-printer type="string"> <default-value/> <sources> <session>printer</session> </sources> </default-printer> </inputs>
<outputs> <default-printer type="string"> <destinations> <session>printer</session> </destinations> </default-printer> </outputs>
<resources> <!-- use this section to identify any files that the component needs to execute the report --> <report-definition> <solution-file> <location>JFreeQuadForRegion.xml</location> <mime-type>text/xml</mime-type> </solution-file> </report-definition> </resources> <actions> <action-definition> <component-name>PrintComponent</component-name> <action-type>print</action-type> <action-inputs>
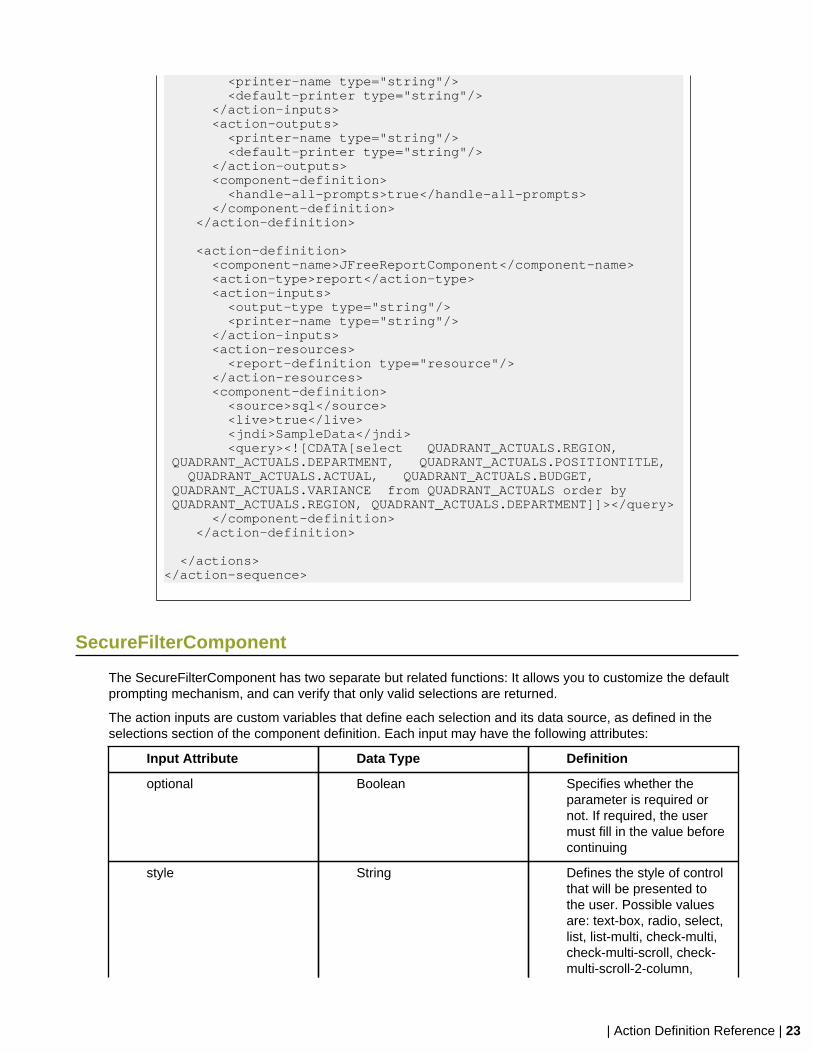
| Action Definition Reference | 23
<printer-name type="string"/> <default-printer type="string"/> </action-inputs> <action-outputs> <printer-name type="string"/> <default-printer type="string"/> </action-outputs> <component-definition> <handle-all-prompts>true</handle-all-prompts> </component-definition> </action-definition> <action-definition> <component-name>JFreeReportComponent</component-name> <action-type>report</action-type> <action-inputs> <output-type type="string"/> <printer-name type="string"/> </action-inputs> <action-resources> <report-definition type="resource"/> </action-resources> <component-definition> <source>sql</source> <live>true</live> <jndi>SampleData</jndi> <query><![CDATA[select QUADRANT_ACTUALS.REGION, QUADRANT_ACTUALS.DEPARTMENT, QUADRANT_ACTUALS.POSITIONTITLE, QUADRANT_ACTUALS.ACTUAL, QUADRANT_ACTUALS.BUDGET, QUADRANT_ACTUALS.VARIANCE from QUADRANT_ACTUALS order by QUADRANT_ACTUALS.REGION, QUADRANT_ACTUALS.DEPARTMENT]]></query> </component-definition> </action-definition> </actions> </action-sequence>
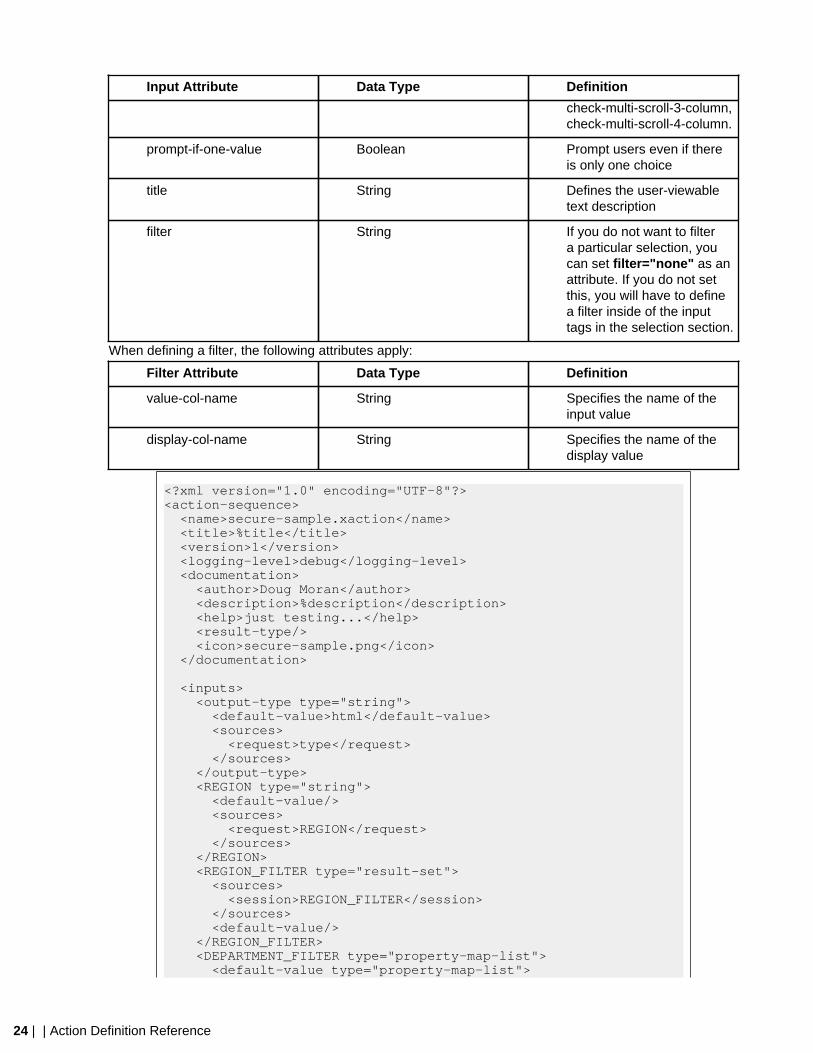
SecureFilterComponent
The SecureFilterComponent has two separate but related functions: It allows you to customize the defaultprompting mechanism, and can verify that only valid selections are returned.
The action inputs are custom variables that define each selection and its data source, as defined in theselections section of the component definition. Each input may have the following attributes:
Input Attribute Data Type Definition
optional Boolean Specifies whether theparameter is required ornot. If required, the usermust fill in the value beforecontinuing
style String Defines the style of controlthat will be presented tothe user. Possible valuesare: text-box, radio, select,list, list-multi, check-multi,check-multi-scroll, check-multi-scroll-2-column,
24 | | Action Definition Reference
Input Attribute Data Type Definition
check-multi-scroll-3-column,check-multi-scroll-4-column.
prompt-if-one-value Boolean Prompt users even if thereis only one choice
title String Defines the user-viewabletext description
filter String If you do not want to filtera particular selection, youcan set filter="none" as anattribute. If you do not setthis, you will have to definea filter inside of the inputtags in the selection section.
When defining a filter, the following attributes apply:
Filter Attribute Data Type Definition
value-col-name String Specifies the name of theinput value
display-col-name String Specifies the name of thedisplay value
<?xml version="1.0" encoding="UTF-8"?><action-sequence> <name>secure-sample.xaction</name> <title>%title</title> <version>1</version> <logging-level>debug</logging-level> <documentation> <author>Doug Moran</author> <description>%description</description> <help>just testing...</help> <result-type/> <icon>secure-sample.png</icon> </documentation>
<inputs> <output-type type="string"> <default-value>html</default-value> <sources> <request>type</request> </sources> </output-type> <REGION type="string"> <default-value/> <sources> <request>REGION</request> </sources> </REGION> <REGION_FILTER type="result-set"> <sources> <session>REGION_FILTER</session> </sources> <default-value/> </REGION_FILTER> <DEPARTMENT_FILTER type="property-map-list"> <default-value type="property-map-list">
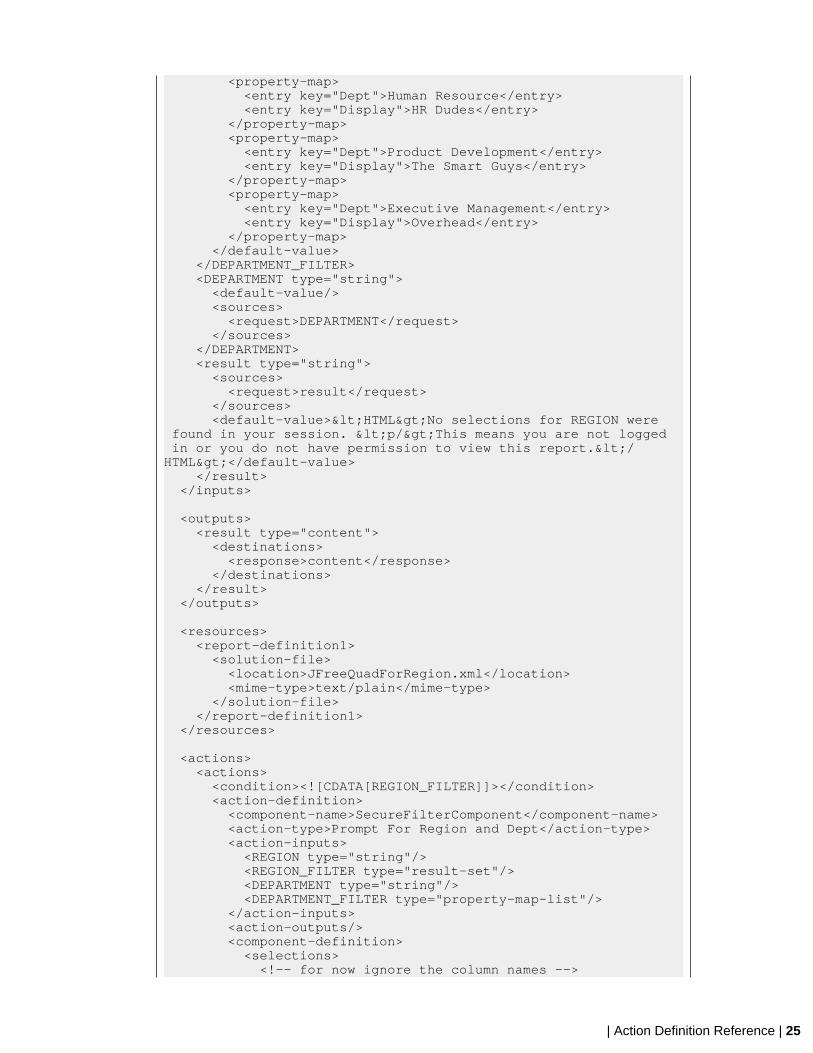
| Action Definition Reference | 25
<property-map> <entry key="Dept">Human Resource</entry> <entry key="Display">HR Dudes</entry> </property-map> <property-map> <entry key="Dept">Product Development</entry> <entry key="Display">The Smart Guys</entry> </property-map> <property-map> <entry key="Dept">Executive Management</entry> <entry key="Display">Overhead</entry> </property-map> </default-value> </DEPARTMENT_FILTER> <DEPARTMENT type="string"> <default-value/> <sources> <request>DEPARTMENT</request> </sources> </DEPARTMENT> <result type="string"> <sources> <request>result</request> </sources> <default-value><HTML>No selections for REGION were found in your session. <p/>This means you are not logged in or you do not have permission to view this report.</HTML></default-value> </result> </inputs>
<outputs> <result type="content"> <destinations> <response>content</response> </destinations> </result> </outputs>
<resources> <report-definition1> <solution-file> <location>JFreeQuadForRegion.xml</location> <mime-type>text/plain</mime-type> </solution-file> </report-definition1> </resources> <actions> <actions> <condition><![CDATA[REGION_FILTER]]></condition> <action-definition> <component-name>SecureFilterComponent</component-name> <action-type>Prompt For Region and Dept</action-type> <action-inputs> <REGION type="string"/> <REGION_FILTER type="result-set"/> <DEPARTMENT type="string"/> <DEPARTMENT_FILTER type="property-map-list"/> </action-inputs> <action-outputs/> <component-definition> <selections> <!-- for now ignore the column names -->
26 | | Action Definition Reference
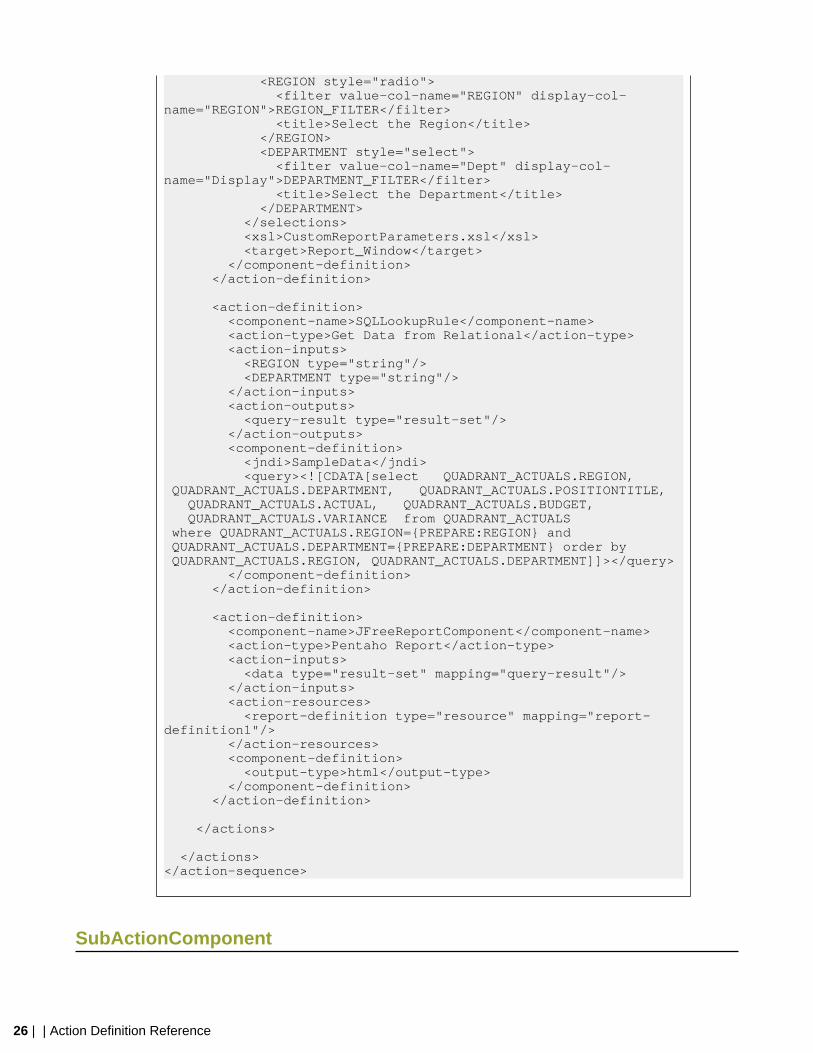
<REGION style="radio"> <filter value-col-name="REGION" display-col-name="REGION">REGION_FILTER</filter> <title>Select the Region</title> </REGION> <DEPARTMENT style="select"> <filter value-col-name="Dept" display-col-name="Display">DEPARTMENT_FILTER</filter> <title>Select the Department</title> </DEPARTMENT> </selections> <xsl>CustomReportParameters.xsl</xsl> <target>Report_Window</target> </component-definition> </action-definition> <action-definition> <component-name>SQLLookupRule</component-name> <action-type>Get Data from Relational</action-type> <action-inputs> <REGION type="string"/> <DEPARTMENT type="string"/> </action-inputs> <action-outputs> <query-result type="result-set"/> </action-outputs> <component-definition> <jndi>SampleData</jndi> <query><![CDATA[select QUADRANT_ACTUALS.REGION, QUADRANT_ACTUALS.DEPARTMENT, QUADRANT_ACTUALS.POSITIONTITLE, QUADRANT_ACTUALS.ACTUAL, QUADRANT_ACTUALS.BUDGET, QUADRANT_ACTUALS.VARIANCE from QUADRANT_ACTUALS where QUADRANT_ACTUALS.REGION={PREPARE:REGION} and QUADRANT_ACTUALS.DEPARTMENT={PREPARE:DEPARTMENT} order by QUADRANT_ACTUALS.REGION, QUADRANT_ACTUALS.DEPARTMENT]]></query> </component-definition> </action-definition>
<action-definition> <component-name>JFreeReportComponent</component-name> <action-type>Pentaho Report</action-type> <action-inputs> <data type="result-set" mapping="query-result"/> </action-inputs> <action-resources> <report-definition type="resource" mapping="report-definition1"/> </action-resources> <component-definition> <output-type>html</output-type> </component-definition> </action-definition> </actions> </actions> </action-sequence>
SubActionComponent
| Action Definition Reference | 27
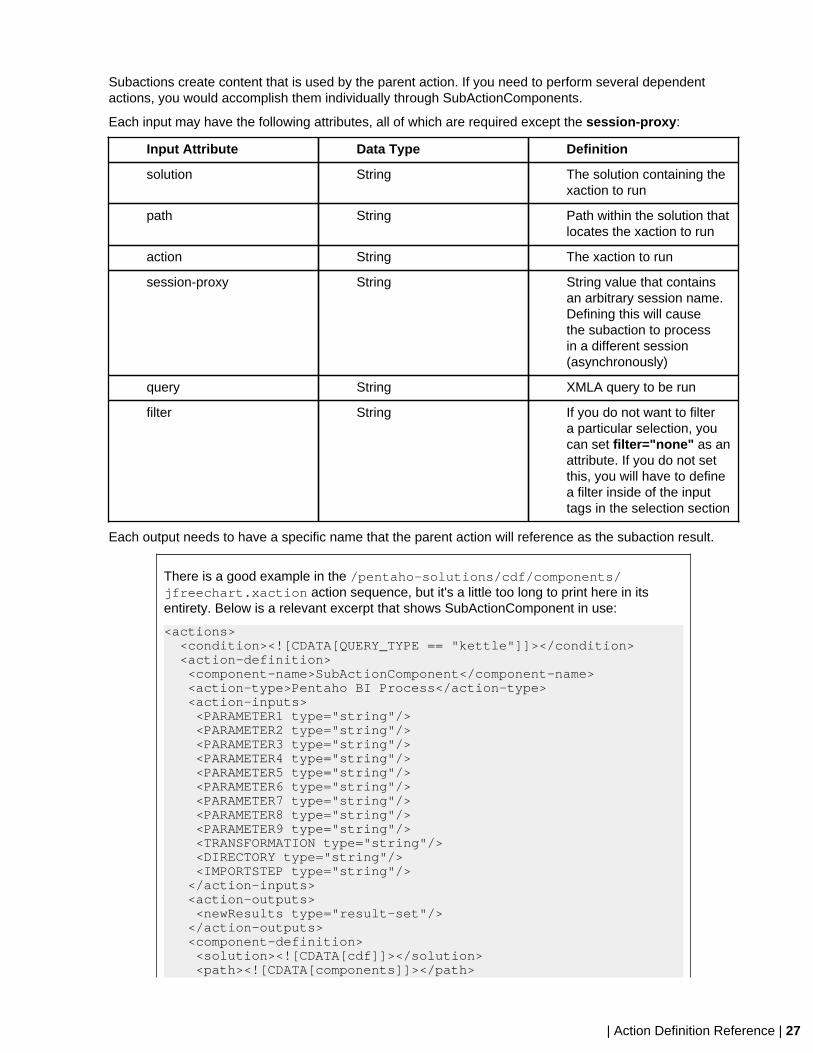
Subactions create content that is used by the parent action. If you need to perform several dependentactions, you would accomplish them individually through SubActionComponents.
Each input may have the following attributes, all of which are required except the session-proxy:
Input Attribute Data Type Definition
solution String The solution containing thexaction to run
path String Path within the solution thatlocates the xaction to run
action String The xaction to run
session-proxy String String value that containsan arbitrary session name.Defining this will causethe subaction to processin a different session(asynchronously)
query String XMLA query to be run
filter String If you do not want to filtera particular selection, youcan set filter="none" as anattribute. If you do not setthis, you will have to definea filter inside of the inputtags in the selection section
Each output needs to have a specific name that the parent action will reference as the subaction result.
There is a good example in the /pentaho-solutions/cdf/components/jfreechart.xaction action sequence, but it's a little too long to print here in itsentirety. Below is a relevant excerpt that shows SubActionComponent in use:
<actions> <condition><![CDATA[QUERY_TYPE == "kettle"]]></condition> <action-definition> <component-name>SubActionComponent</component-name> <action-type>Pentaho BI Process</action-type> <action-inputs> <PARAMETER1 type="string"/> <PARAMETER2 type="string"/> <PARAMETER3 type="string"/> <PARAMETER4 type="string"/> <PARAMETER5 type="string"/> <PARAMETER6 type="string"/> <PARAMETER7 type="string"/> <PARAMETER8 type="string"/> <PARAMETER9 type="string"/> <TRANSFORMATION type="string"/> <DIRECTORY type="string"/> <IMPORTSTEP type="string"/> </action-inputs> <action-outputs> <newResults type="result-set"/> </action-outputs> <component-definition> <solution><![CDATA[cdf]]></solution> <path><![CDATA[components]]></path>
28 | | Action Definition Reference
<action><![CDATA[kettletransformation.xaction]]></action> </component-definition> </action-definition> </actions>
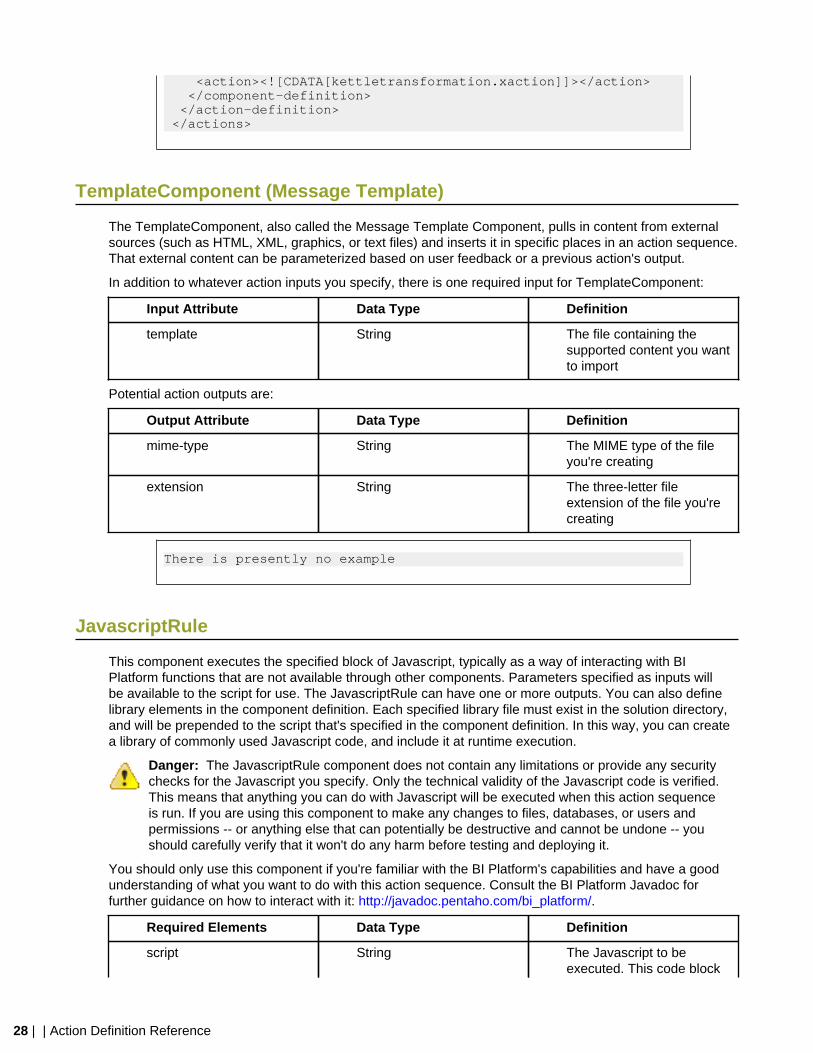
TemplateComponent (Message Template)
The TemplateComponent, also called the Message Template Component, pulls in content from externalsources (such as HTML, XML, graphics, or text files) and inserts it in specific places in an action sequence.That external content can be parameterized based on user feedback or a previous action's output.
In addition to whatever action inputs you specify, there is one required input for TemplateComponent:
Input Attribute Data Type Definition
template String The file containing thesupported content you wantto import
Potential action outputs are:
Output Attribute Data Type Definition
mime-type String The MIME type of the fileyou're creating
extension String The three-letter fileextension of the file you'recreating
There is presently no example
JavascriptRule
This component executes the specified block of Javascript, typically as a way of interacting with BIPlatform functions that are not available through other components. Parameters specified as inputs willbe available to the script for use. The JavascriptRule can have one or more outputs. You can also definelibrary elements in the component definition. Each specified library file must exist in the solution directory,and will be prepended to the script that's specified in the component definition. In this way, you can createa library of commonly used Javascript code, and include it at runtime execution.
Danger: The JavascriptRule component does not contain any limitations or provide any securitychecks for the Javascript you specify. Only the technical validity of the Javascript code is verified.This means that anything you can do with Javascript will be executed when this action sequenceis run. If you are using this component to make any changes to files, databases, or users andpermissions -- or anything else that can potentially be destructive and cannot be undone -- youshould carefully verify that it won't do any harm before testing and deploying it.
You should only use this component if you're familiar with the BI Platform's capabilities and have a goodunderstanding of what you want to do with this action sequence. Consult the BI Platform Javadoc forfurther guidance on how to interact with it: http://javadoc.pentaho.com/bi_platform/.
Required Elements Data Type Definition
script String The Javascript to beexecuted. This code block
| Action Definition Reference | 29
Required Elements Data Type Definition
must be enclosed in a <![CDATA[ ]]> tag.
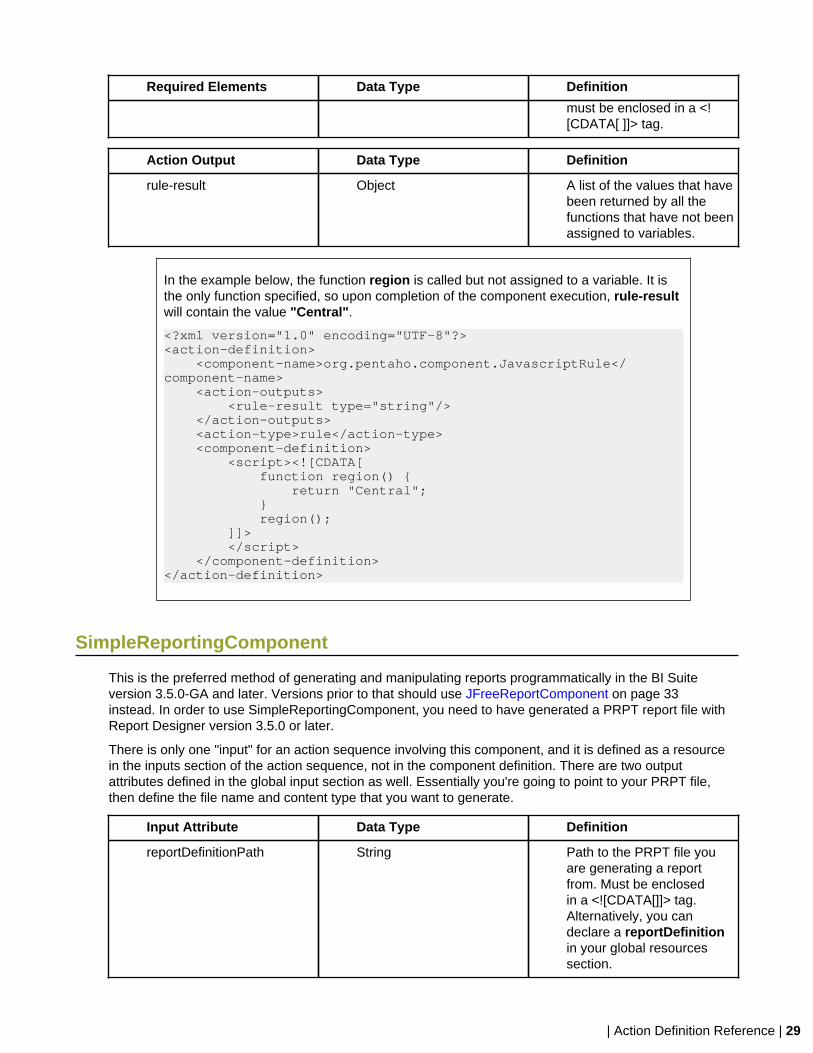
Action Output Data Type Definition
rule-result Object A list of the values that havebeen returned by all thefunctions that have not beenassigned to variables.
In the example below, the function region is called but not assigned to a variable. It isthe only function specified, so upon completion of the component execution, rule-resultwill contain the value "Central".
<?xml version="1.0" encoding="UTF-8"?><action-definition> <component-name>org.pentaho.component.JavascriptRule</component-name> <action-outputs> <rule-result type="string"/> </action-outputs> <action-type>rule</action-type> <component-definition> <script><![CDATA[ function region() { return "Central"; } region(); ]]> </script> </component-definition></action-definition>
SimpleReportingComponent
This is the preferred method of generating and manipulating reports programmatically in the BI Suiteversion 3.5.0-GA and later. Versions prior to that should use JFreeReportComponent on page 33instead. In order to use SimpleReportingComponent, you need to have generated a PRPT report file withReport Designer version 3.5.0 or later.
There is only one "input" for an action sequence involving this component, and it is defined as a resourcein the inputs section of the action sequence, not in the component definition. There are two outputattributes defined in the global input section as well. Essentially you're going to point to your PRPT file,then define the file name and content type that you want to generate.
Input Attribute Data Type Definition
reportDefinitionPath String Path to the PRPT file youare generating a reportfrom. Must be enclosedin a <![CDATA[]]> tag.Alternatively, you candeclare a reportDefinitionin your global resourcessection.
30 | | Action Definition Reference
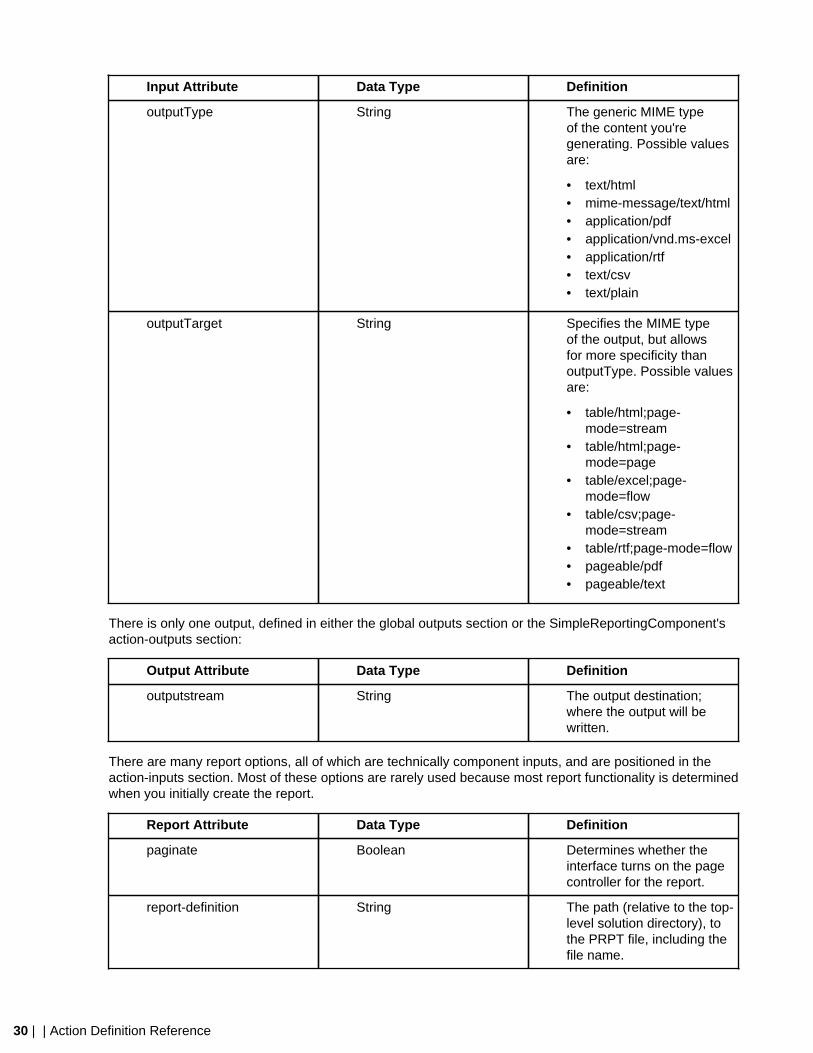
Input Attribute Data Type Definition
outputType String The generic MIME typeof the content you'regenerating. Possible valuesare:
• text/html• mime-message/text/html• application/pdf• application/vnd.ms-excel• application/rtf• text/csv• text/plain
outputTarget String Specifies the MIME typeof the output, but allowsfor more specificity thanoutputType. Possible valuesare:
• table/html;page-mode=stream
• table/html;page-mode=page
• table/excel;page-mode=flow
• table/csv;page-mode=stream
• table/rtf;page-mode=flow• pageable/pdf• pageable/text
There is only one output, defined in either the global outputs section or the SimpleReportingComponent'saction-outputs section:
Output Attribute Data Type Definition
outputstream String The output destination;where the output will bewritten.
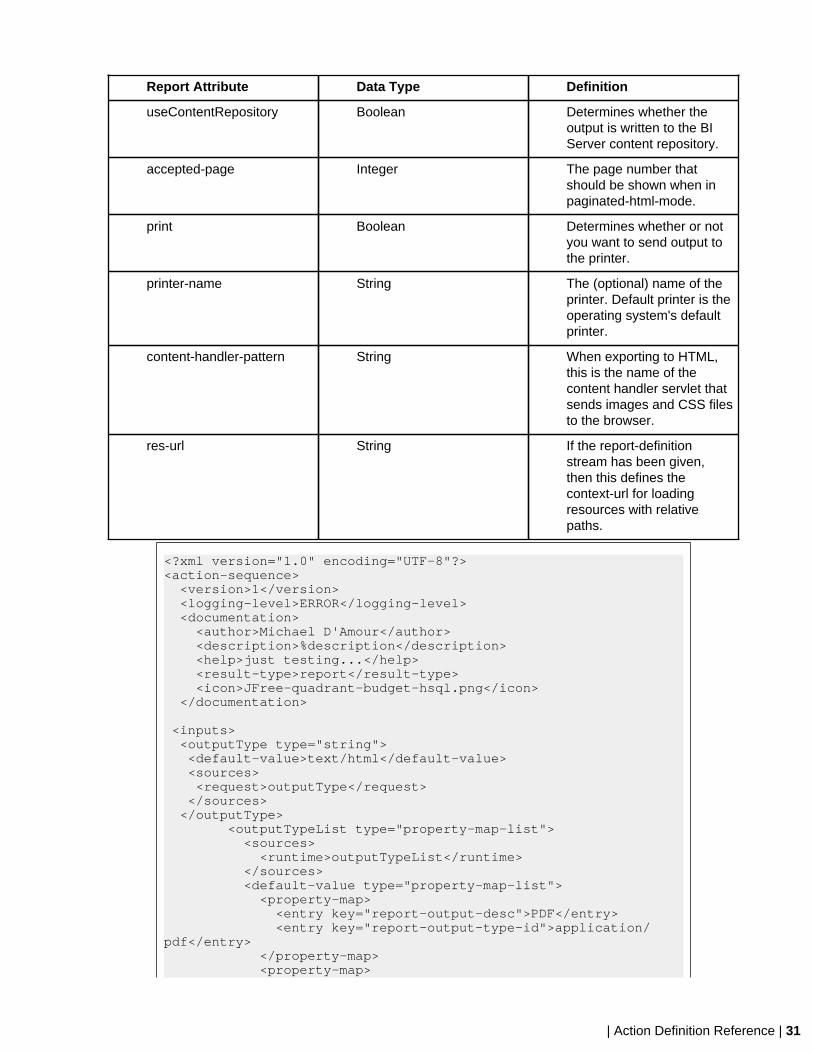
There are many report options, all of which are technically component inputs, and are positioned in theaction-inputs section. Most of these options are rarely used because most report functionality is determinedwhen you initially create the report.
Report Attribute Data Type Definition
paginate Boolean Determines whether theinterface turns on the pagecontroller for the report.
report-definition String The path (relative to the top-level solution directory), tothe PRPT file, including thefile name.
| Action Definition Reference | 31
Report Attribute Data Type Definition
useContentRepository Boolean Determines whether theoutput is written to the BIServer content repository.
accepted-page Integer The page number thatshould be shown when inpaginated-html-mode.
print Boolean Determines whether or notyou want to send output tothe printer.
printer-name String The (optional) name of theprinter. Default printer is theoperating system's defaultprinter.
content-handler-pattern String When exporting to HTML,this is the name of thecontent handler servlet thatsends images and CSS filesto the browser.
res-url String If the report-definitionstream has been given,then this defines thecontext-url for loadingresources with relativepaths.
<?xml version="1.0" encoding="UTF-8"?><action-sequence> <version>1</version> <logging-level>ERROR</logging-level> <documentation> <author>Michael D'Amour</author> <description>%description</description> <help>just testing...</help> <result-type>report</result-type> <icon>JFree-quadrant-budget-hsql.png</icon> </documentation>
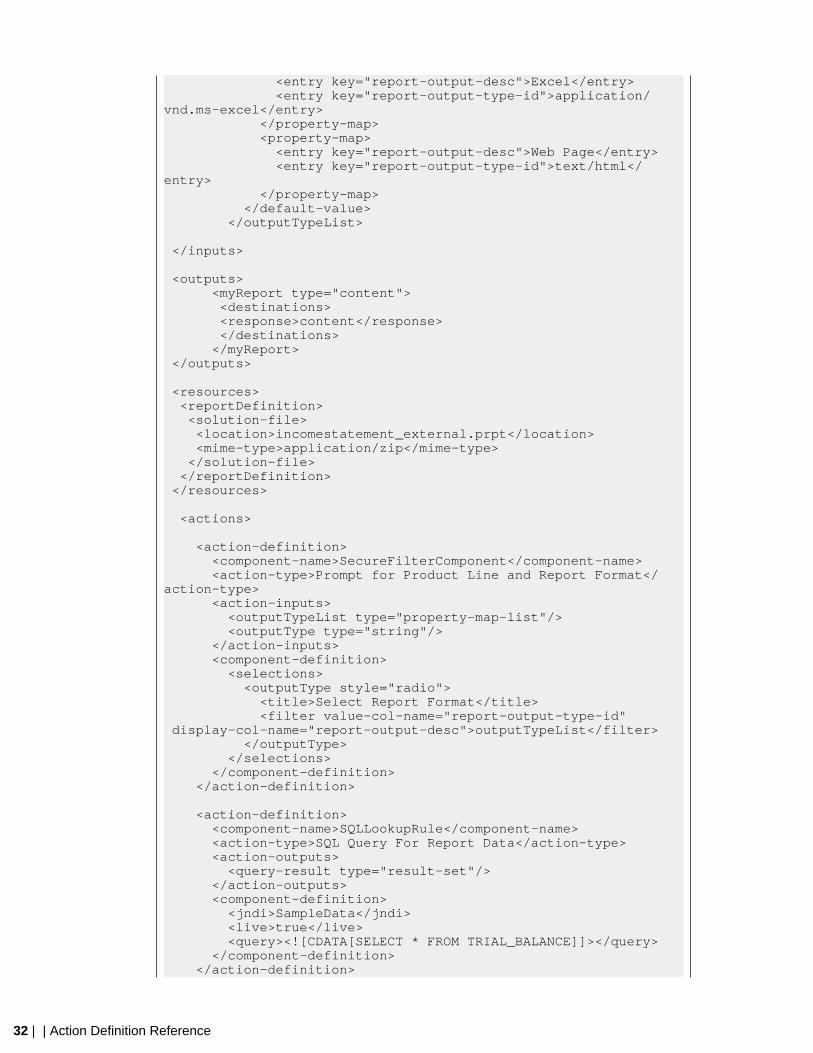
<inputs> <outputType type="string"> <default-value>text/html</default-value> <sources> <request>outputType</request> </sources> </outputType> <outputTypeList type="property-map-list"> <sources> <runtime>outputTypeList</runtime> </sources> <default-value type="property-map-list"> <property-map> <entry key="report-output-desc">PDF</entry> <entry key="report-output-type-id">application/pdf</entry> </property-map> <property-map>
32 | | Action Definition Reference
<entry key="report-output-desc">Excel</entry> <entry key="report-output-type-id">application/vnd.ms-excel</entry> </property-map> <property-map> <entry key="report-output-desc">Web Page</entry> <entry key="report-output-type-id">text/html</entry> </property-map> </default-value> </outputTypeList>
</inputs>
<outputs> <myReport type="content"> <destinations> <response>content</response> </destinations> </myReport> </outputs>
<resources> <reportDefinition> <solution-file> <location>incomestatement_external.prpt</location> <mime-type>application/zip</mime-type> </solution-file> </reportDefinition> </resources> <actions>
<action-definition> <component-name>SecureFilterComponent</component-name> <action-type>Prompt for Product Line and Report Format</action-type> <action-inputs> <outputTypeList type="property-map-list"/> <outputType type="string"/> </action-inputs> <component-definition> <selections> <outputType style="radio"> <title>Select Report Format</title> <filter value-col-name="report-output-type-id" display-col-name="report-output-desc">outputTypeList</filter> </outputType> </selections> </component-definition> </action-definition>
<action-definition> <component-name>SQLLookupRule</component-name> <action-type>SQL Query For Report Data</action-type> <action-outputs> <query-result type="result-set"/> </action-outputs> <component-definition> <jndi>SampleData</jndi> <live>true</live> <query><![CDATA[SELECT * FROM TRIAL_BALANCE]]></query> </component-definition> </action-definition>
| Action Definition Reference | 33
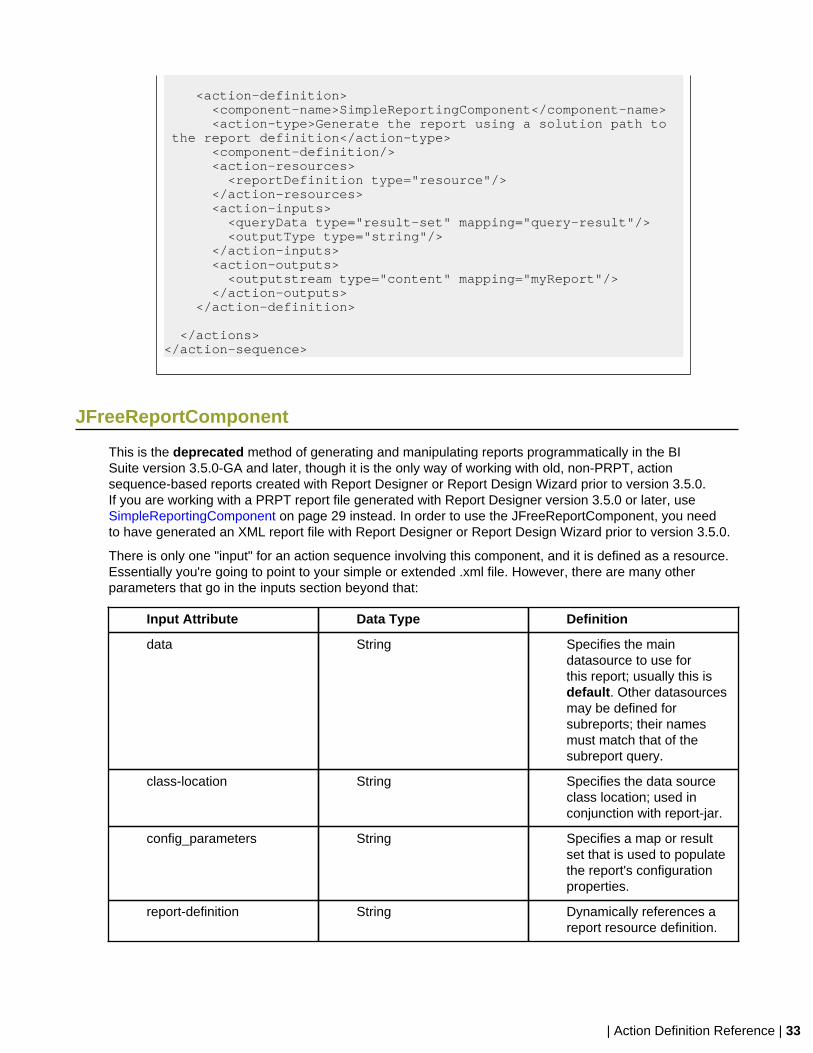
<action-definition> <component-name>SimpleReportingComponent</component-name> <action-type>Generate the report using a solution path to the report definition</action-type> <component-definition/> <action-resources> <reportDefinition type="resource"/> </action-resources> <action-inputs> <queryData type="result-set" mapping="query-result"/> <outputType type="string"/> </action-inputs> <action-outputs> <outputstream type="content" mapping="myReport"/> </action-outputs> </action-definition> </actions> </action-sequence>
JFreeReportComponent
This is the deprecated method of generating and manipulating reports programmatically in the BISuite version 3.5.0-GA and later, though it is the only way of working with old, non-PRPT, actionsequence-based reports created with Report Designer or Report Design Wizard prior to version 3.5.0.If you are working with a PRPT report file generated with Report Designer version 3.5.0 or later, useSimpleReportingComponent on page 29 instead. In order to use the JFreeReportComponent, you needto have generated an XML report file with Report Designer or Report Design Wizard prior to version 3.5.0.
There is only one "input" for an action sequence involving this component, and it is defined as a resource.Essentially you're going to point to your simple or extended .xml file. However, there are many otherparameters that go in the inputs section beyond that:
Input Attribute Data Type Definition
data String Specifies the maindatasource to use forthis report; usually this isdefault. Other datasourcesmay be defined forsubreports; their namesmust match that of thesubreport query.
class-location String Specifies the data sourceclass location; used inconjunction with report-jar.
config_parameters String Specifies a map or resultset that is used to populatethe report's configurationproperties.
report-definition String Dynamically references areport resource definition.
34 | | Action Definition Reference
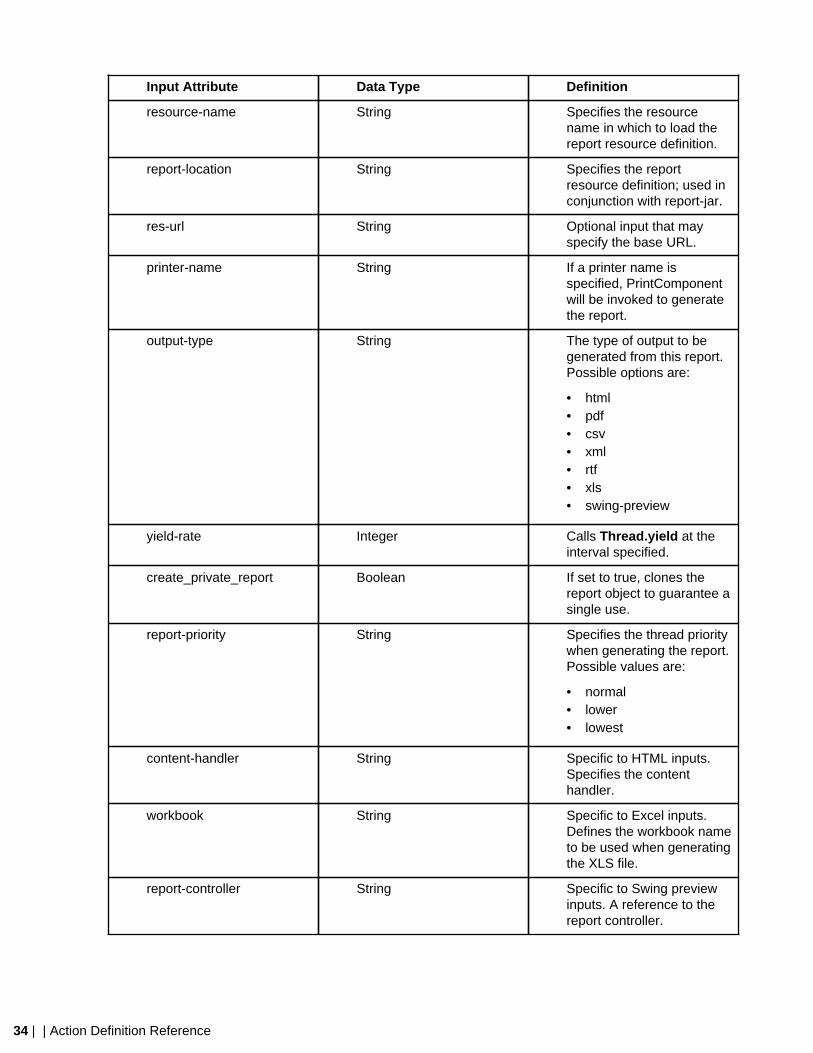
Input Attribute Data Type Definition
resource-name String Specifies the resourcename in which to load thereport resource definition.
report-location String Specifies the reportresource definition; used inconjunction with report-jar.
res-url String Optional input that mayspecify the base URL.
printer-name String If a printer name isspecified, PrintComponentwill be invoked to generatethe report.
output-type String The type of output to begenerated from this report.Possible options are:
• html• pdf• csv• xml• rtf• xls• swing-preview
yield-rate Integer Calls Thread.yield at theinterval specified.
create_private_report Boolean If set to true, clones thereport object to guarantee asingle use.
report-priority String Specifies the thread prioritywhen generating the report.Possible values are:
• normal• lower• lowest
content-handler String Specific to HTML inputs.Specifies the contenthandler.
workbook String Specific to Excel inputs.Defines the workbook nameto be used when generatingthe XLS file.
report-controller String Specific to Swing previewinputs. A reference to thereport controller.
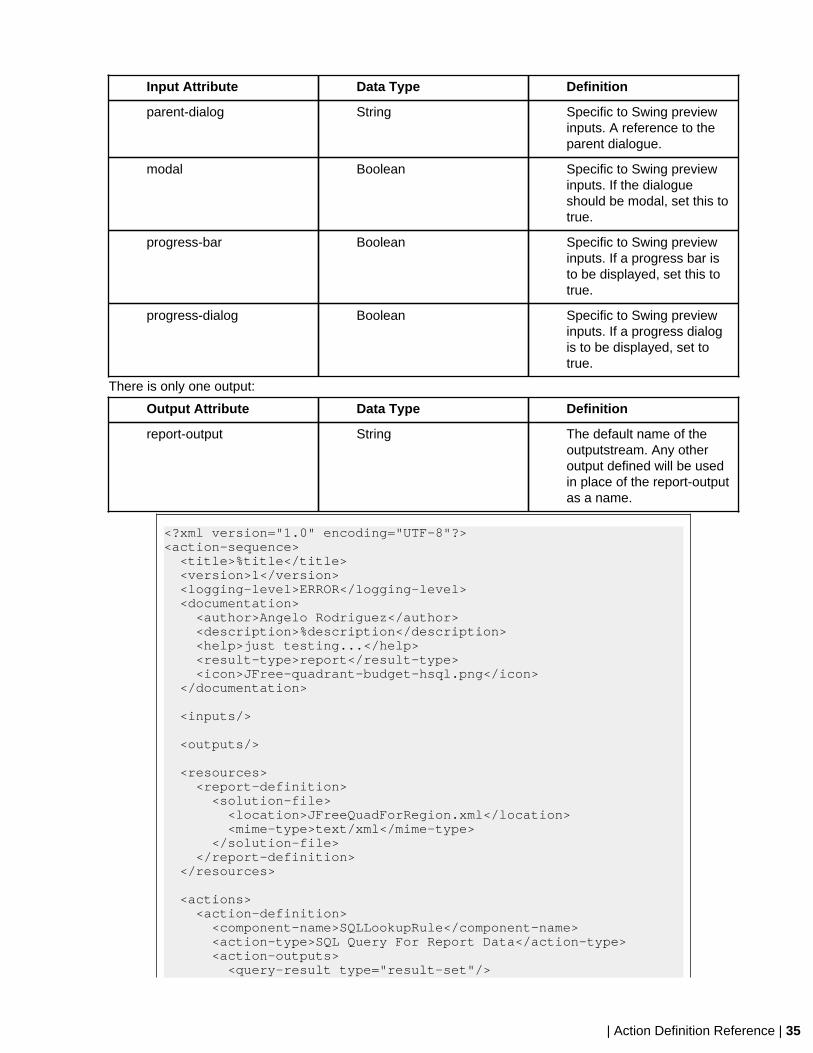
| Action Definition Reference | 35
Input Attribute Data Type Definition
parent-dialog String Specific to Swing previewinputs. A reference to theparent dialogue.
modal Boolean Specific to Swing previewinputs. If the dialogueshould be modal, set this totrue.
progress-bar Boolean Specific to Swing previewinputs. If a progress bar isto be displayed, set this totrue.
progress-dialog Boolean Specific to Swing previewinputs. If a progress dialogis to be displayed, set totrue.
There is only one output:
Output Attribute Data Type Definition
report-output String The default name of theoutputstream. Any otheroutput defined will be usedin place of the report-outputas a name.
<?xml version="1.0" encoding="UTF-8"?><action-sequence> <title>%title</title> <version>1</version> <logging-level>ERROR</logging-level> <documentation> <author>Angelo Rodriguez</author> <description>%description</description> <help>just testing...</help> <result-type>report</result-type> <icon>JFree-quadrant-budget-hsql.png</icon> </documentation>
<inputs/>
<outputs/>
<resources> <report-definition> <solution-file> <location>JFreeQuadForRegion.xml</location> <mime-type>text/xml</mime-type> </solution-file> </report-definition> </resources> <actions> <action-definition> <component-name>SQLLookupRule</component-name> <action-type>SQL Query For Report Data</action-type> <action-outputs> <query-result type="result-set"/>
36 | | Action Definition Reference
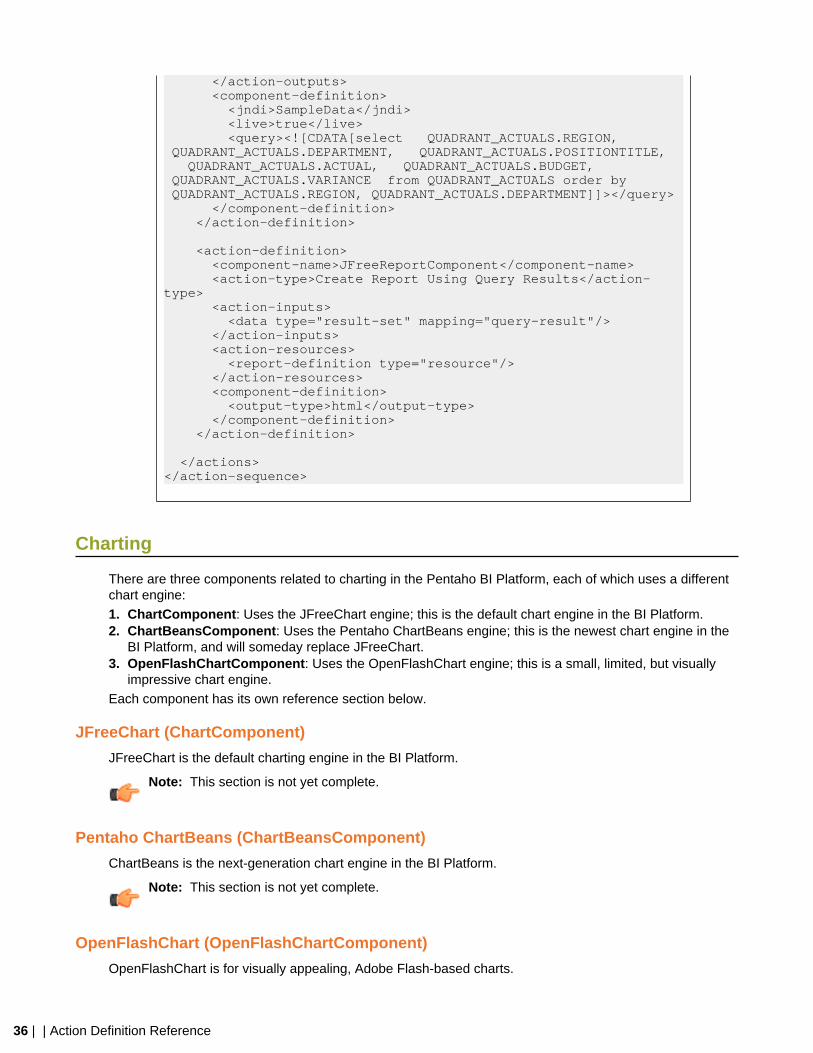
</action-outputs> <component-definition> <jndi>SampleData</jndi> <live>true</live> <query><![CDATA[select QUADRANT_ACTUALS.REGION, QUADRANT_ACTUALS.DEPARTMENT, QUADRANT_ACTUALS.POSITIONTITLE, QUADRANT_ACTUALS.ACTUAL, QUADRANT_ACTUALS.BUDGET, QUADRANT_ACTUALS.VARIANCE from QUADRANT_ACTUALS order by QUADRANT_ACTUALS.REGION, QUADRANT_ACTUALS.DEPARTMENT]]></query> </component-definition> </action-definition> <action-definition> <component-name>JFreeReportComponent</component-name> <action-type>Create Report Using Query Results</action-type> <action-inputs> <data type="result-set" mapping="query-result"/> </action-inputs> <action-resources> <report-definition type="resource"/> </action-resources> <component-definition> <output-type>html</output-type> </component-definition> </action-definition> </actions> </action-sequence>
Charting
There are three components related to charting in the Pentaho BI Platform, each of which uses a differentchart engine:
1. ChartComponent: Uses the JFreeChart engine; this is the default chart engine in the BI Platform.2. ChartBeansComponent: Uses the Pentaho ChartBeans engine; this is the newest chart engine in the
BI Platform, and will someday replace JFreeChart.3. OpenFlashChartComponent: Uses the OpenFlashChart engine; this is a small, limited, but visually
impressive chart engine.
Each component has its own reference section below.
JFreeChart (ChartComponent)
JFreeChart is the default charting engine in the BI Platform.
Note: This section is not yet complete.
Pentaho ChartBeans (ChartBeansComponent)
ChartBeans is the next-generation chart engine in the BI Platform.
Note: This section is not yet complete.
OpenFlashChart (OpenFlashChartComponent)
OpenFlashChart is for visually appealing, Adobe Flash-based charts.
| Action Definition Reference | 37
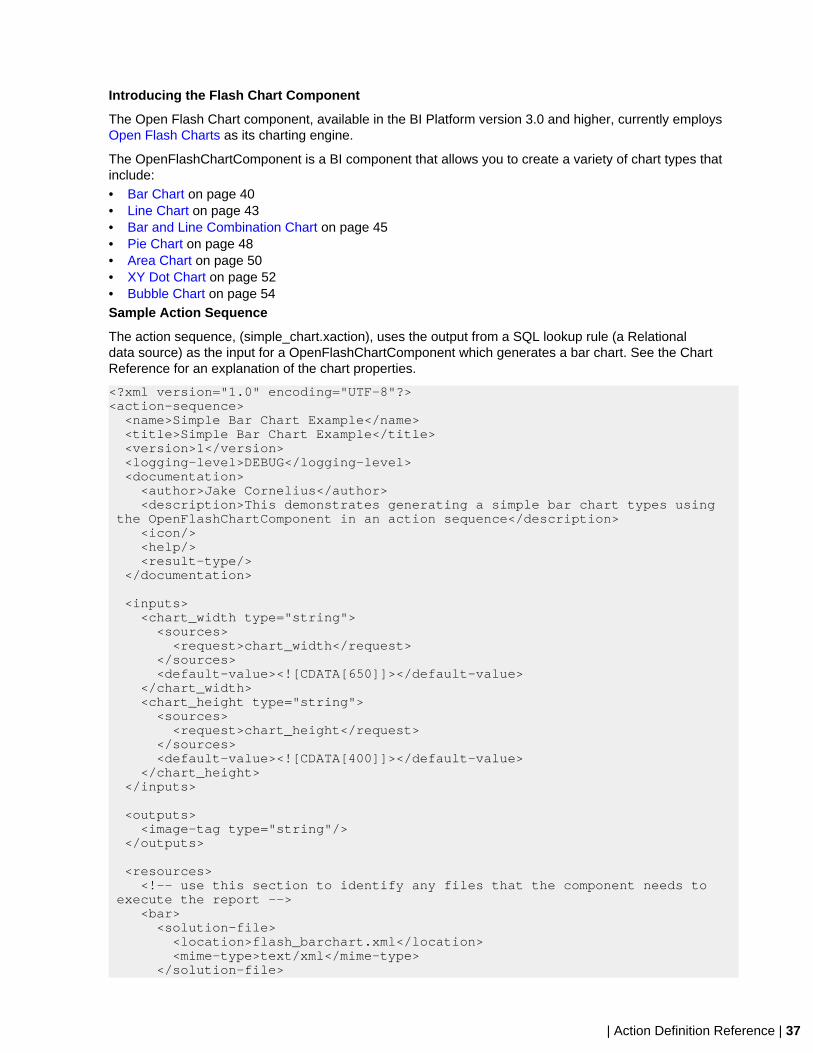
Introducing the Flash Chart Component
The Open Flash Chart component, available in the BI Platform version 3.0 and higher, currently employsOpen Flash Charts as its charting engine.
The OpenFlashChartComponent is a BI component that allows you to create a variety of chart types thatinclude:• Bar Chart on page 40• Line Chart on page 43• Bar and Line Combination Chart on page 45• Pie Chart on page 48• Area Chart on page 50• XY Dot Chart on page 52• Bubble Chart on page 54Sample Action Sequence
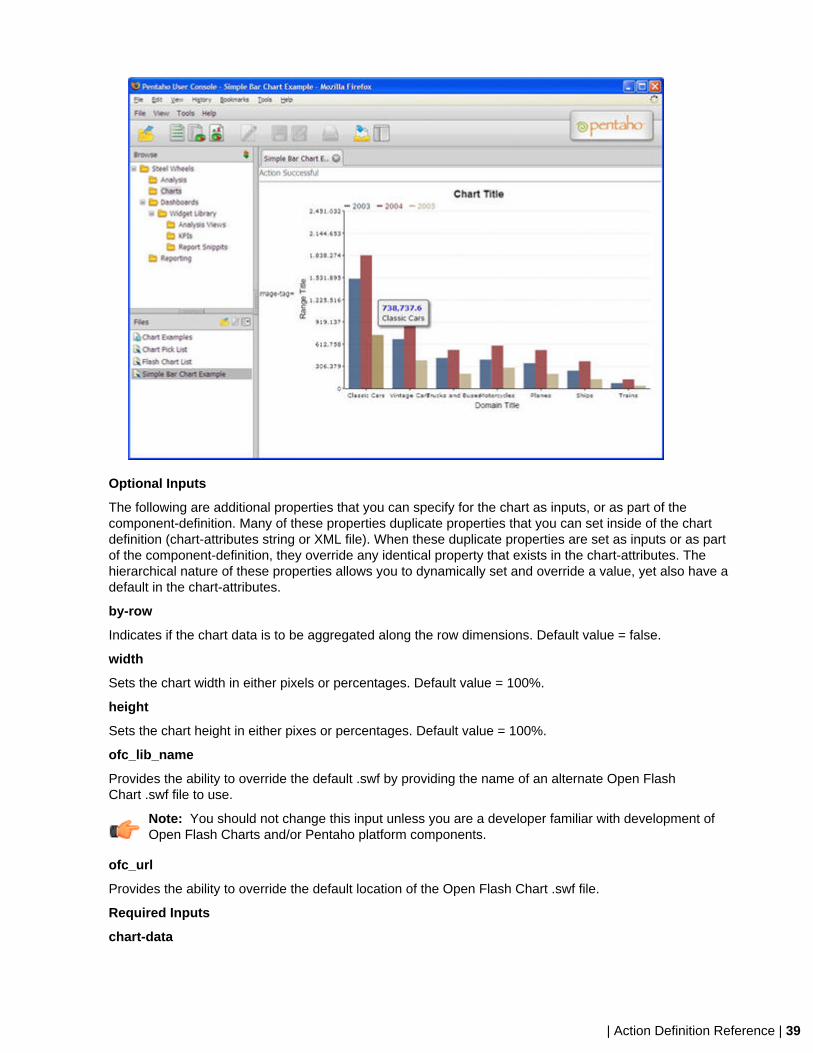
The action sequence, (simple_chart.xaction), uses the output from a SQL lookup rule (a Relationaldata source) as the input for a OpenFlashChartComponent which generates a bar chart. See the ChartReference for an explanation of the chart properties.
<?xml version="1.0" encoding="UTF-8"?><action-sequence> <name>Simple Bar Chart Example</name> <title>Simple Bar Chart Example</title> <version>1</version> <logging-level>DEBUG</logging-level> <documentation> <author>Jake Cornelius</author> <description>This demonstrates generating a simple bar chart types using the OpenFlashChartComponent in an action sequence</description> <icon/> <help/> <result-type/> </documentation>
<inputs> <chart_width type="string"> <sources> <request>chart_width</request> </sources> <default-value><![CDATA[650]]></default-value> </chart_width> <chart_height type="string"> <sources> <request>chart_height</request> </sources> <default-value><![CDATA[400]]></default-value> </chart_height> </inputs>
<outputs> <image-tag type="string"/> </outputs>
<resources> <!-- use this section to identify any files that the component needs to execute the report --> <bar> <solution-file> <location>flash_barchart.xml</location> <mime-type>text/xml</mime-type> </solution-file>
38 | | Action Definition Reference
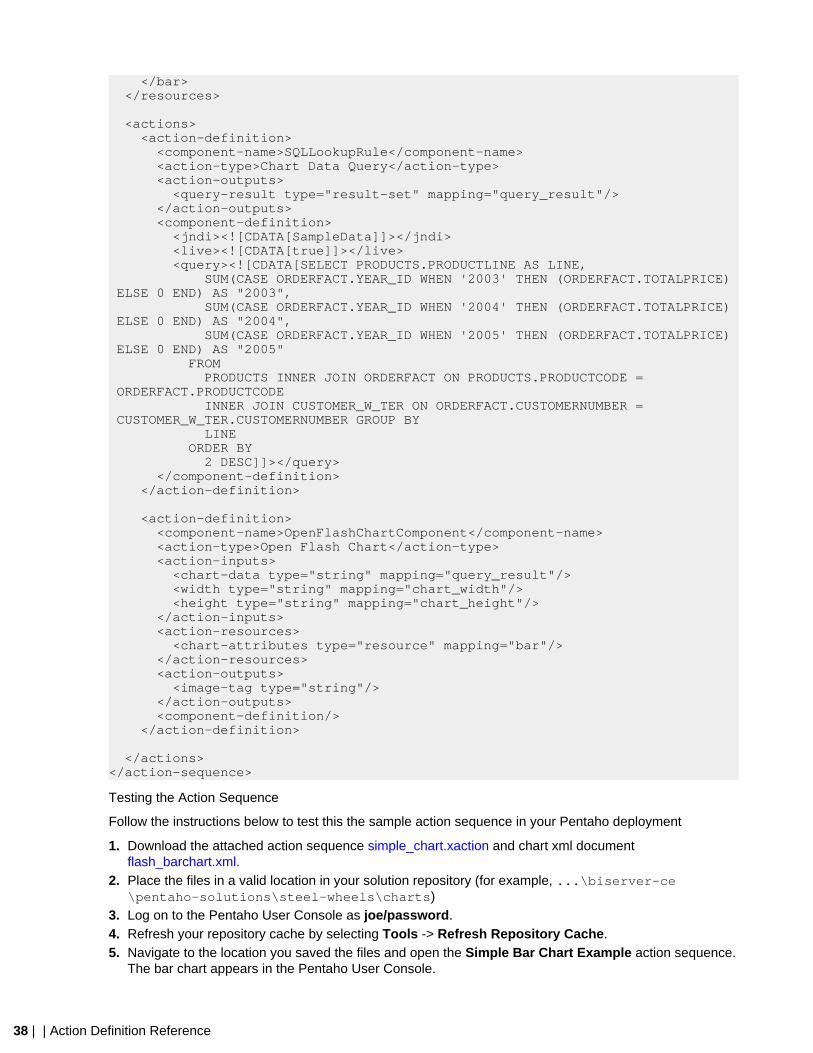
</bar> </resources>
<actions> <action-definition> <component-name>SQLLookupRule</component-name> <action-type>Chart Data Query</action-type> <action-outputs> <query-result type="result-set" mapping="query_result"/> </action-outputs> <component-definition> <jndi><![CDATA[SampleData]]></jndi> <live><![CDATA[true]]></live> <query><![CDATA[SELECT PRODUCTS.PRODUCTLINE AS LINE, SUM(CASE ORDERFACT.YEAR_ID WHEN '2003' THEN (ORDERFACT.TOTALPRICE) ELSE 0 END) AS "2003", SUM(CASE ORDERFACT.YEAR_ID WHEN '2004' THEN (ORDERFACT.TOTALPRICE) ELSE 0 END) AS "2004", SUM(CASE ORDERFACT.YEAR_ID WHEN '2005' THEN (ORDERFACT.TOTALPRICE) ELSE 0 END) AS "2005" FROM PRODUCTS INNER JOIN ORDERFACT ON PRODUCTS.PRODUCTCODE = ORDERFACT.PRODUCTCODE INNER JOIN CUSTOMER_W_TER ON ORDERFACT.CUSTOMERNUMBER = CUSTOMER_W_TER.CUSTOMERNUMBER GROUP BY LINE ORDER BY 2 DESC]]></query> </component-definition> </action-definition>
<action-definition> <component-name>OpenFlashChartComponent</component-name> <action-type>Open Flash Chart</action-type> <action-inputs> <chart-data type="string" mapping="query_result"/> <width type="string" mapping="chart_width"/> <height type="string" mapping="chart_height"/> </action-inputs> <action-resources> <chart-attributes type="resource" mapping="bar"/> </action-resources> <action-outputs> <image-tag type="string"/> </action-outputs> <component-definition/> </action-definition>
</actions></action-sequence>
Testing the Action Sequence
Follow the instructions below to test this the sample action sequence in your Pentaho deployment
1. Download the attached action sequence simple_chart.xaction and chart xml documentflash_barchart.xml.
2. Place the files in a valid location in your solution repository (for example, ...\biserver-ce\pentaho-solutions\steel-wheels\charts)
3. Log on to the Pentaho User Console as joe/password.4. Refresh your repository cache by selecting Tools -> Refresh Repository Cache.5. Navigate to the location you saved the files and open the Simple Bar Chart Example action sequence.
The bar chart appears in the Pentaho User Console.
| Action Definition Reference | 39
Optional Inputs
The following are additional properties that you can specify for the chart as inputs, or as part of thecomponent-definition. Many of these properties duplicate properties that you can set inside of the chartdefinition (chart-attributes string or XML file). When these duplicate properties are set as inputs or as partof the component-definition, they override any identical property that exists in the chart-attributes. Thehierarchical nature of these properties allows you to dynamically set and override a value, yet also have adefault in the chart-attributes.
by-row
Indicates if the chart data is to be aggregated along the row dimensions. Default value = false.
width
Sets the chart width in either pixels or percentages. Default value = 100%.
height
Sets the chart height in either pixes or percentages. Default value = 100%.
ofc_lib_name
Provides the ability to override the default .swf by providing the name of an alternate Open FlashChart .swf file to use.
Note: You should not change this input unless you are a developer familiar with development ofOpen Flash Charts and/or Pentaho platform components.
ofc_url
Provides the ability to override the default location of the Open Flash Chart .swf file.
Required Inputs
chart-data
40 | | Action Definition Reference
The dataset that you want the chart to render. Often, this is the output of a SQLLookupRule action, butcan come from a number of source actions.
chart-attributes
This defines where the XML chart definition will be resourced from. It could come from componentdefinition, action sequence input, or action sequence resource.
Note: The XML chart definition specified in chart attributes also supports parameterization ofelements. This is accomplished by inserting parameter strings (for example, {INPUT PARAM})values in the chart XML or input.
Bar Chart
The bar chart plots a set of values as bars for each series in the given dataset.Dataset Guidelines
This chart expects its data as a categorical dataset.Required Properties
The only property a bar chart requires is the appropriate chart-type
<chart-type>BarChart</chart-type>
Example
The example below contains the full set of additional supported properties with comments on its purposeand valid values. It is recommended that new users start with this example as a starting place for buildingtheir first flash chart. The following chart definition will produce the chart shown directly below it.
<chart> <!-- Define the chart type --> <chart-type>BarChart</chart-type> <!-- Specify the title of the chart --> <title>Chart Title</title> <title-font> <font-family>Arial</font-family> <size>18</size> <is-bold>true</is-bold> </title-font>
<!-- General Chart Attributes --> <orientation>vertical</orientation> <!-- valid values: vertical, horizontal --> <is-stacked>false</is-stacked> <!-- set to true for a stacked bar --> <is-3D>false</is-3D> <is-glass>false</is-glass> <!-- set to true to apply the 'glass' style to bars --> <is-sketch>false</is-sketch> <!-- set to true to apply the 'sketch' style to bars --> <!-- additional properties specific to sketch charts --> <fun-factor>10</fun-factor> <!-- defines the messiness of bars, 0-2 tame, 3-6 pretty fun, 7+ lots of fun --> <outline-color-palette> <!-- defines the colors to use for outlines of bars --> <color>#FF0000</color> <color>#00ff00</color> </outline-color-palette>
<!-- General Chart Formatting Properties --> <chart-background type="color">#FFffff</chart-background> <plot-background type="color">#ffffff</plot-background> <alpha>.70</alpha> <!-- sets the transparency level of bars -->
| Action Definition Reference | 41
<!-- Define what to display in hover tips --> <tooltip> #top# #bottom# #val# #x_label# #key# </tooltip>
<!-- X-Axis properties (domain)--> <domain-title>Domain Title</domain-title> <domain-title-font> <font-family>Arial</font-family> <size>14</size> <is-bold>false</is-bold> </domain-title-font> <domain-color>#000000</domain-color> <!-- color of x-axis --> <domain-grid-color>#ffffff</domain-grid-color> <!-- color of vertical grid lines --> <domain-stroke>1</domain-stroke> <!-- thickness of the x-axis -->
<!-- Y-Axis properties (range) --> <range-title>Range Title</range-title> <range-title-font> <font-family>Arial</font-family> <size>14</size> <is-bold>false</is-bold> </range-title-font> <range-minimum></range-minimum> <!-- defines minimum starting point for y-axis --> <range-maximum></range-maximum> <!-- defines maximum ending point for y-axis --> <range-color>#000000</range-color> <!-- color of y-axis --> <range-grid-color>#eaeaea</range-grid-color> <!-- color of horizontal grid lines --> <range-stroke>1</range-stroke> <!-- thickness of y-axis --> <range-steps>6</range-steps> <!-- specify number of ticks, defaults to auto-calculated number -->
<!-- Specify the color palette for the chart --> <color-palette> <color>#0f3765</color> <color>#880a0f</color> <color>#B09A6B</color> <color>#772200</color> <color>#C52F0D</color> <color>#123D82</color> <color>#4A0866</color> <color>#445500</color> <color>#FFAA00</color> <color>#1E8AD3</color> <color>#AA6611</color> <color>#772200</color> <color>#8b2834</color> </color-palette>
</chart>
Simple Chart
42 | | Action Definition Reference
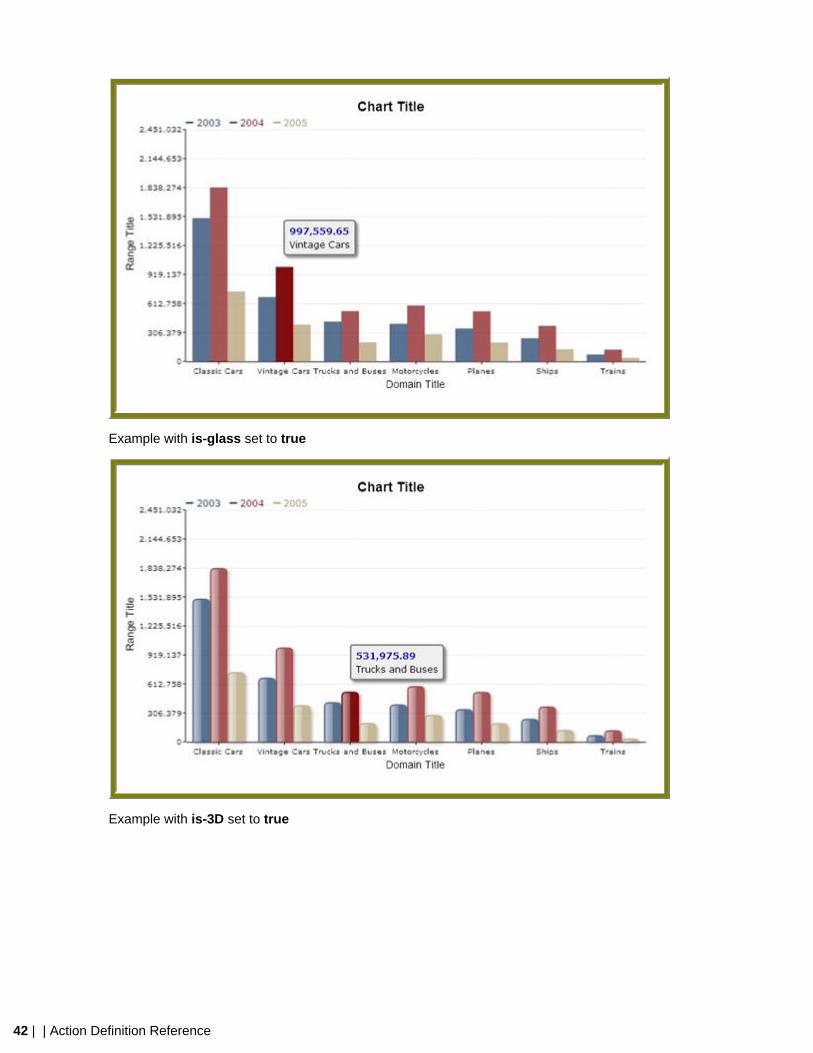
Example with is-glass set to true
Example with is-3D set to true
| Action Definition Reference | 43
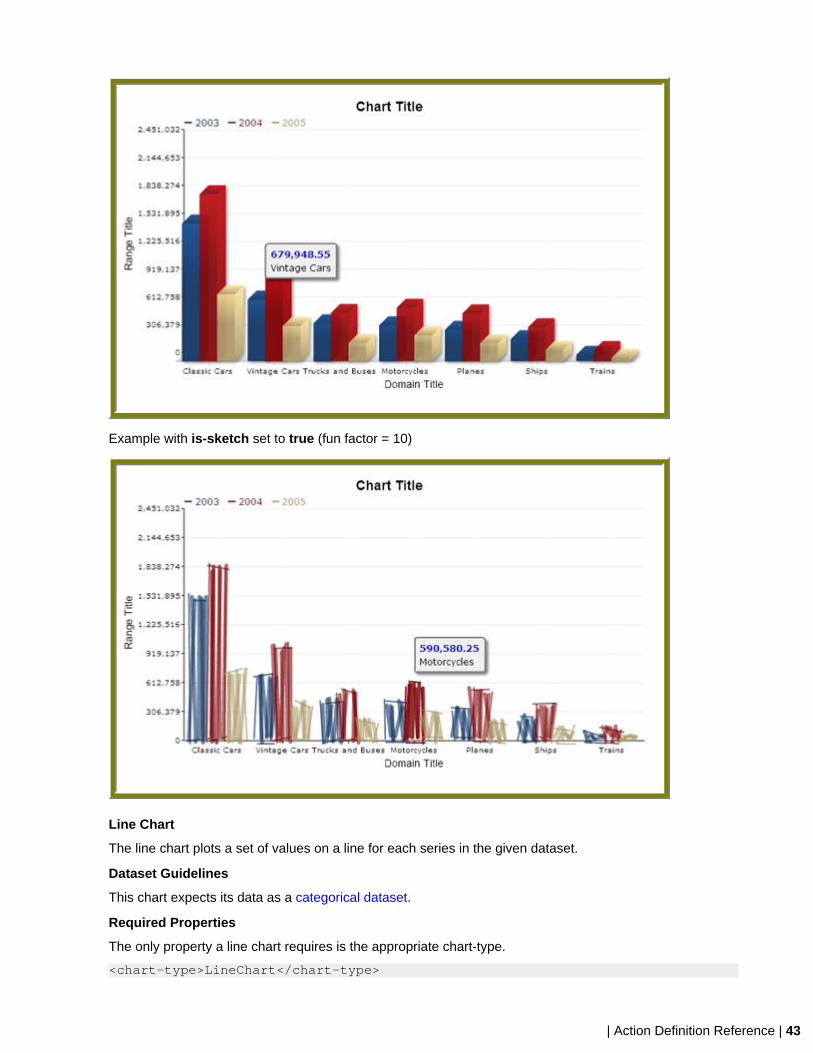
Example with is-sketch set to true (fun factor = 10)
Line Chart
The line chart plots a set of values on a line for each series in the given dataset.
Dataset Guidelines
This chart expects its data as a categorical dataset.
Required Properties
The only property a line chart requires is the appropriate chart-type.
<chart-type>LineChart</chart-type>
44 | | Action Definition Reference
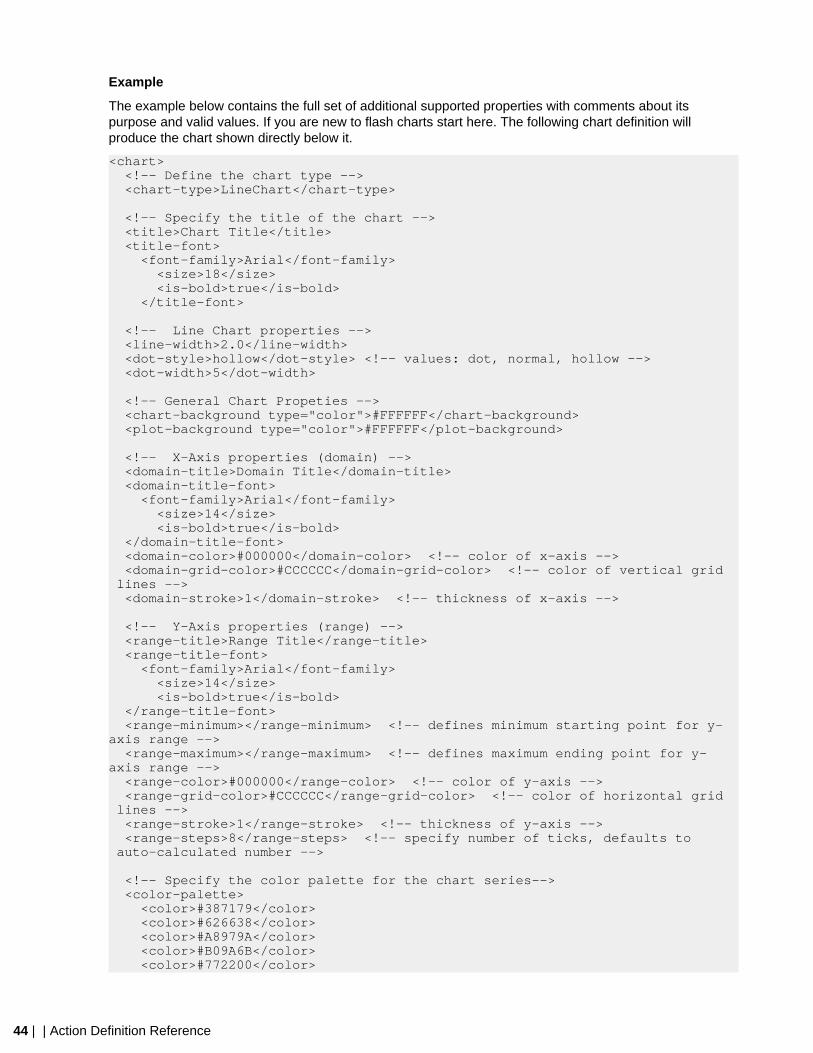
Example
The example below contains the full set of additional supported properties with comments about itspurpose and valid values. If you are new to flash charts start here. The following chart definition willproduce the chart shown directly below it.
<chart> <!-- Define the chart type --> <chart-type>LineChart</chart-type>
<!-- Specify the title of the chart --> <title>Chart Title</title> <title-font> <font-family>Arial</font-family> <size>18</size> <is-bold>true</is-bold> </title-font>
<!-- Line Chart properties --> <line-width>2.0</line-width> <dot-style>hollow</dot-style> <!-- values: dot, normal, hollow --> <dot-width>5</dot-width>
<!-- General Chart Propeties --> <chart-background type="color">#FFFFFF</chart-background> <plot-background type="color">#FFFFFF</plot-background>
<!-- X-Axis properties (domain) --> <domain-title>Domain Title</domain-title> <domain-title-font> <font-family>Arial</font-family> <size>14</size> <is-bold>true</is-bold> </domain-title-font> <domain-color>#000000</domain-color> <!-- color of x-axis --> <domain-grid-color>#CCCCCC</domain-grid-color> <!-- color of vertical grid lines --> <domain-stroke>1</domain-stroke> <!-- thickness of x-axis -->
<!-- Y-Axis properties (range) --> <range-title>Range Title</range-title> <range-title-font> <font-family>Arial</font-family> <size>14</size> <is-bold>true</is-bold> </range-title-font> <range-minimum></range-minimum> <!-- defines minimum starting point for y-axis range --> <range-maximum></range-maximum> <!-- defines maximum ending point for y-axis range --> <range-color>#000000</range-color> <!-- color of y-axis --> <range-grid-color>#CCCCCC</range-grid-color> <!-- color of horizontal grid lines --> <range-stroke>1</range-stroke> <!-- thickness of y-axis --> <range-steps>8</range-steps> <!-- specify number of ticks, defaults to auto-calculated number -->
<!-- Specify the color palette for the chart series--> <color-palette> <color>#387179</color> <color>#626638</color> <color>#A8979A</color> <color>#B09A6B</color> <color>#772200</color>
| Action Definition Reference | 45
<color>#C52F0D</color> <color>#123D82</color> <color>#4A0866</color> <color>#445500</color> <color>#FFAA00</color> <color>#1E8AD3</color> <color>#AA6611</color> <color>#772200</color> </color-palette>
</chart>
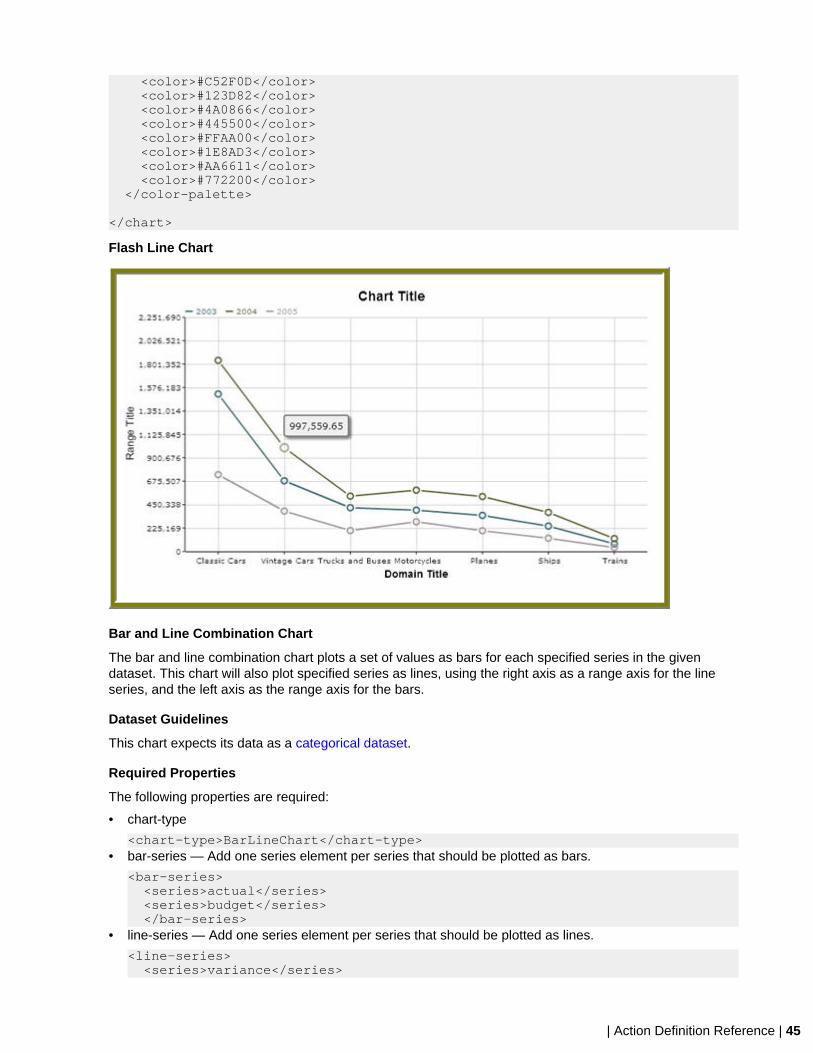
Flash Line Chart
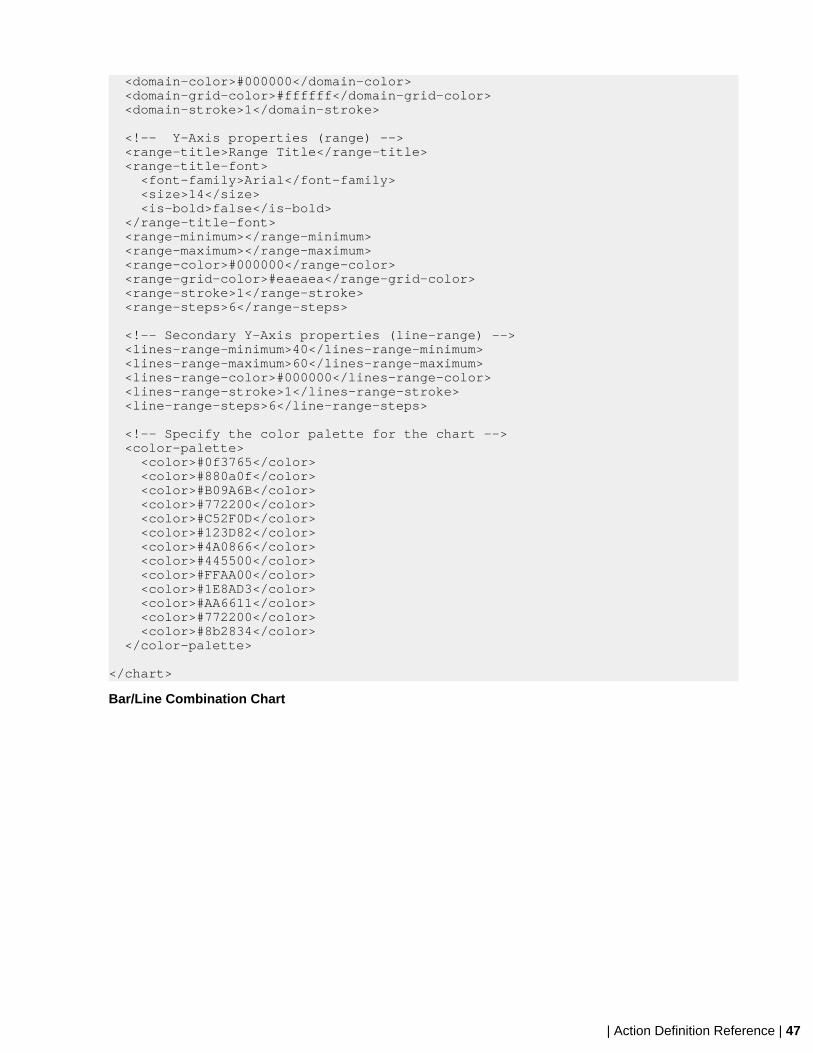
Bar and Line Combination Chart
The bar and line combination chart plots a set of values as bars for each specified series in the givendataset. This chart will also plot specified series as lines, using the right axis as a range axis for the lineseries, and the left axis as the range axis for the bars.
Dataset Guidelines
This chart expects its data as a categorical dataset.
Required Properties
The following properties are required:
• chart-type
<chart-type>BarLineChart</chart-type>• bar-series — Add one series element per series that should be plotted as bars.
<bar-series> <series>actual</series> <series>budget</series> </bar-series>
• line-series — Add one series element per series that should be plotted as lines.
<line-series> <series>variance</series>
46 | | Action Definition Reference
</line-series>
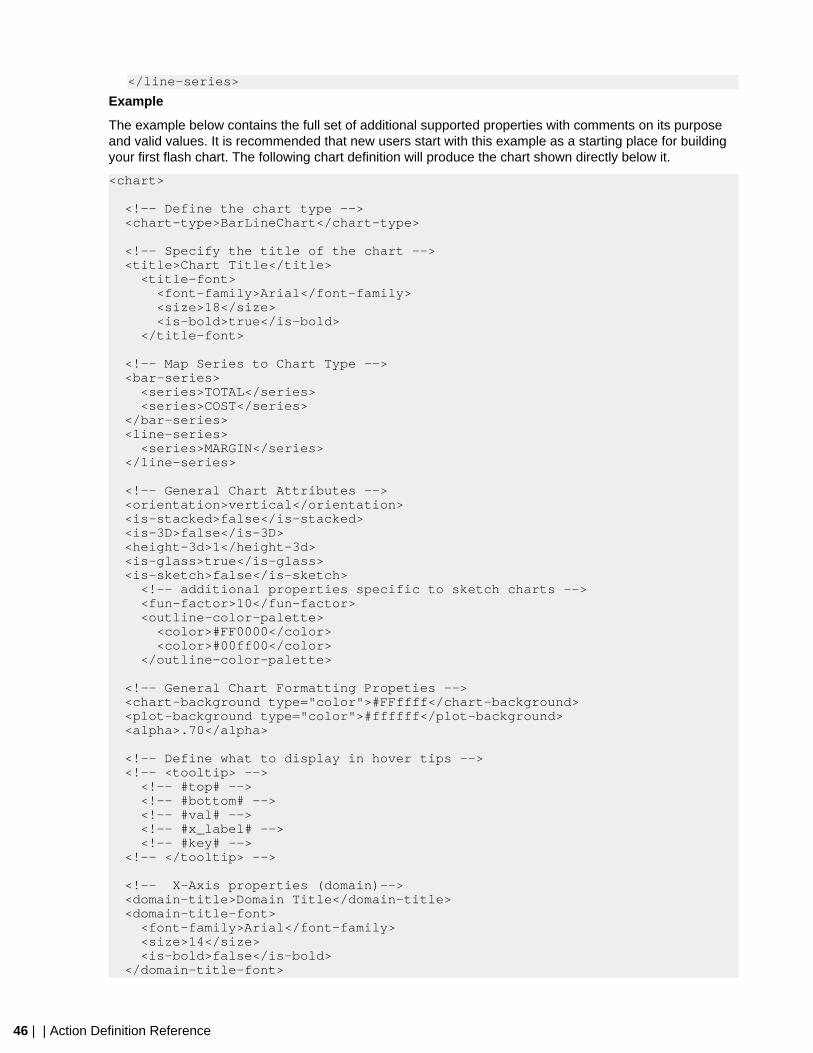
Example
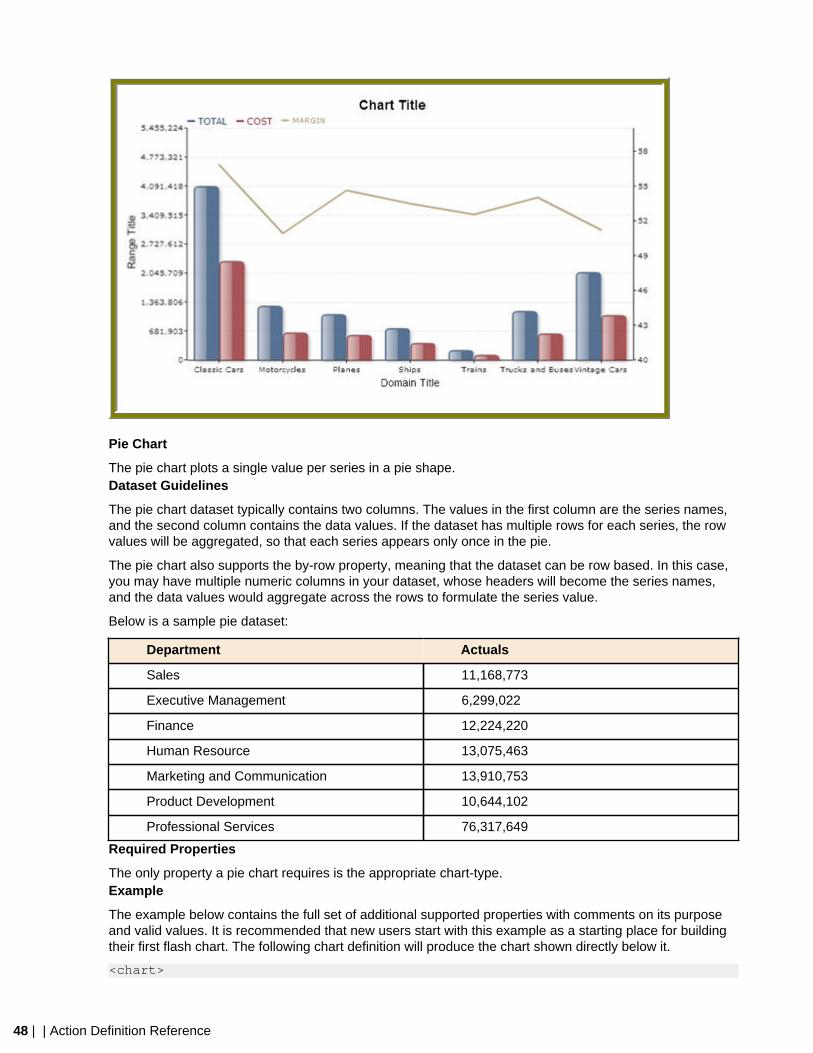
The example below contains the full set of additional supported properties with comments on its purposeand valid values. It is recommended that new users start with this example as a starting place for buildingyour first flash chart. The following chart definition will produce the chart shown directly below it.
<chart>
<!-- Define the chart type --> <chart-type>BarLineChart</chart-type>
<!-- Specify the title of the chart --> <title>Chart Title</title> <title-font> <font-family>Arial</font-family> <size>18</size> <is-bold>true</is-bold> </title-font>
<!-- Map Series to Chart Type --> <bar-series> <series>TOTAL</series> <series>COST</series> </bar-series> <line-series> <series>MARGIN</series> </line-series>
<!-- General Chart Attributes --> <orientation>vertical</orientation> <is-stacked>false</is-stacked> <is-3D>false</is-3D> <height-3d>1</height-3d> <is-glass>true</is-glass> <is-sketch>false</is-sketch> <!-- additional properties specific to sketch charts --> <fun-factor>10</fun-factor> <outline-color-palette> <color>#FF0000</color> <color>#00ff00</color> </outline-color-palette>
<!-- General Chart Formatting Propeties --> <chart-background type="color">#FFffff</chart-background> <plot-background type="color">#ffffff</plot-background> <alpha>.70</alpha>
<!-- Define what to display in hover tips --> <!-- <tooltip> --> <!-- #top# --> <!-- #bottom# --> <!-- #val# --> <!-- #x_label# --> <!-- #key# --> <!-- </tooltip> -->
<!-- X-Axis properties (domain)--> <domain-title>Domain Title</domain-title> <domain-title-font> <font-family>Arial</font-family> <size>14</size> <is-bold>false</is-bold> </domain-title-font>
| Action Definition Reference | 47
<domain-color>#000000</domain-color> <domain-grid-color>#ffffff</domain-grid-color> <domain-stroke>1</domain-stroke>
<!-- Y-Axis properties (range) --> <range-title>Range Title</range-title> <range-title-font> <font-family>Arial</font-family> <size>14</size> <is-bold>false</is-bold> </range-title-font> <range-minimum></range-minimum> <range-maximum></range-maximum> <range-color>#000000</range-color> <range-grid-color>#eaeaea</range-grid-color> <range-stroke>1</range-stroke> <range-steps>6</range-steps>
<!-- Secondary Y-Axis properties (line-range) --> <lines-range-minimum>40</lines-range-minimum> <lines-range-maximum>60</lines-range-maximum> <lines-range-color>#000000</lines-range-color> <lines-range-stroke>1</lines-range-stroke> <line-range-steps>6</line-range-steps>
<!-- Specify the color palette for the chart --> <color-palette> <color>#0f3765</color> <color>#880a0f</color> <color>#B09A6B</color> <color>#772200</color> <color>#C52F0D</color> <color>#123D82</color> <color>#4A0866</color> <color>#445500</color> <color>#FFAA00</color> <color>#1E8AD3</color> <color>#AA6611</color> <color>#772200</color> <color>#8b2834</color> </color-palette>
</chart>
Bar/Line Combination Chart
48 | | Action Definition Reference
Pie Chart
The pie chart plots a single value per series in a pie shape.Dataset Guidelines
The pie chart dataset typically contains two columns. The values in the first column are the series names,and the second column contains the data values. If the dataset has multiple rows for each series, the rowvalues will be aggregated, so that each series appears only once in the pie.
The pie chart also supports the by-row property, meaning that the dataset can be row based. In this case,you may have multiple numeric columns in your dataset, whose headers will become the series names,and the data values would aggregate across the rows to formulate the series value.
Below is a sample pie dataset:
Department Actuals
Sales 11,168,773
Executive Management 6,299,022
Finance 12,224,220
Human Resource 13,075,463
Marketing and Communication 13,910,753
Product Development 10,644,102
Professional Services 76,317,649
Required Properties
The only property a pie chart requires is the appropriate chart-type.Example
The example below contains the full set of additional supported properties with comments on its purposeand valid values. It is recommended that new users start with this example as a starting place for buildingtheir first flash chart. The following chart definition will produce the chart shown directly below it.
<chart>
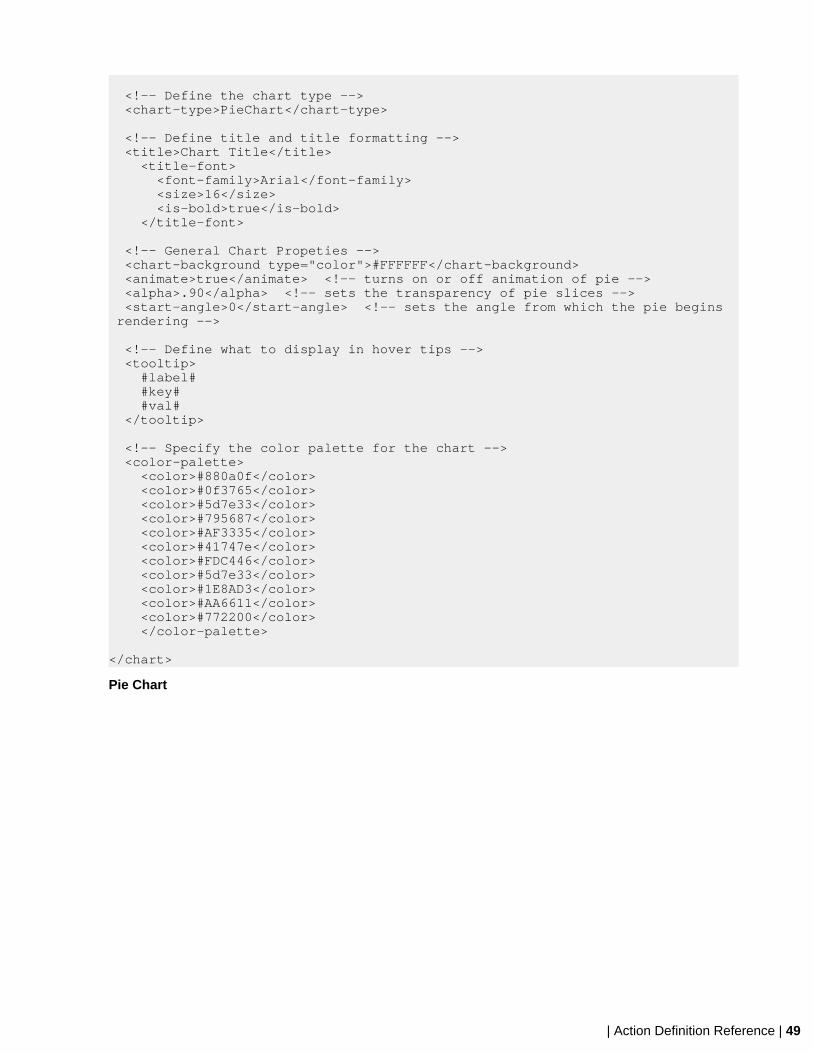
| Action Definition Reference | 49
<!-- Define the chart type --> <chart-type>PieChart</chart-type>
<!-- Define title and title formatting --> <title>Chart Title</title> <title-font> <font-family>Arial</font-family> <size>16</size> <is-bold>true</is-bold> </title-font>
<!-- General Chart Propeties --> <chart-background type="color">#FFFFFF</chart-background> <animate>true</animate> <!-- turns on or off animation of pie --> <alpha>.90</alpha> <!-- sets the transparency of pie slices --> <start-angle>0</start-angle> <!-- sets the angle from which the pie begins rendering -->
<!-- Define what to display in hover tips --> <tooltip> #label# #key# #val# </tooltip>
<!-- Specify the color palette for the chart --> <color-palette> <color>#880a0f</color> <color>#0f3765</color> <color>#5d7e33</color> <color>#795687</color> <color>#AF3335</color> <color>#41747e</color> <color>#FDC446</color> <color>#5d7e33</color> <color>#1E8AD3</color> <color>#AA6611</color> <color>#772200</color> </color-palette>
</chart>
Pie Chart
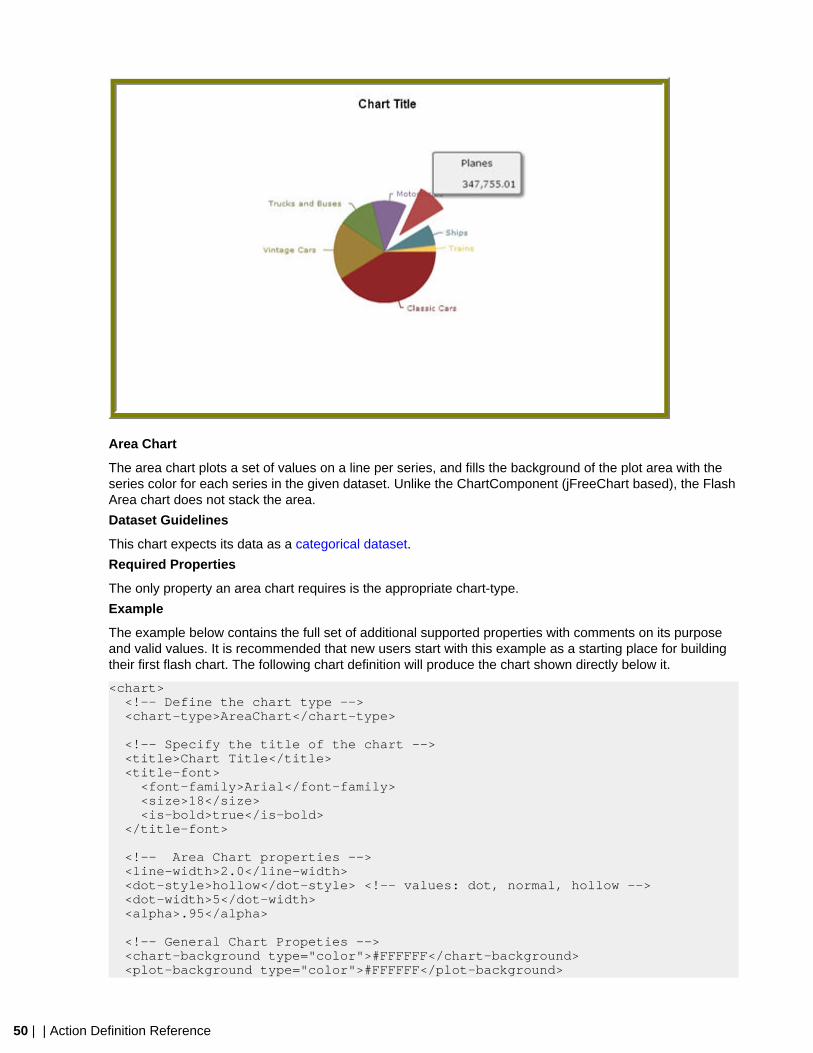
50 | | Action Definition Reference
Area Chart
The area chart plots a set of values on a line per series, and fills the background of the plot area with theseries color for each series in the given dataset. Unlike the ChartComponent (jFreeChart based), the FlashArea chart does not stack the area.
Dataset Guidelines
This chart expects its data as a categorical dataset.
Required Properties
The only property an area chart requires is the appropriate chart-type.
Example
The example below contains the full set of additional supported properties with comments on its purposeand valid values. It is recommended that new users start with this example as a starting place for buildingtheir first flash chart. The following chart definition will produce the chart shown directly below it.
<chart> <!-- Define the chart type --> <chart-type>AreaChart</chart-type>
<!-- Specify the title of the chart --> <title>Chart Title</title> <title-font> <font-family>Arial</font-family> <size>18</size> <is-bold>true</is-bold> </title-font>
<!-- Area Chart properties --> <line-width>2.0</line-width> <dot-style>hollow</dot-style> <!-- values: dot, normal, hollow --> <dot-width>5</dot-width> <alpha>.95</alpha>
<!-- General Chart Propeties --> <chart-background type="color">#FFFFFF</chart-background> <plot-background type="color">#FFFFFF</plot-background>
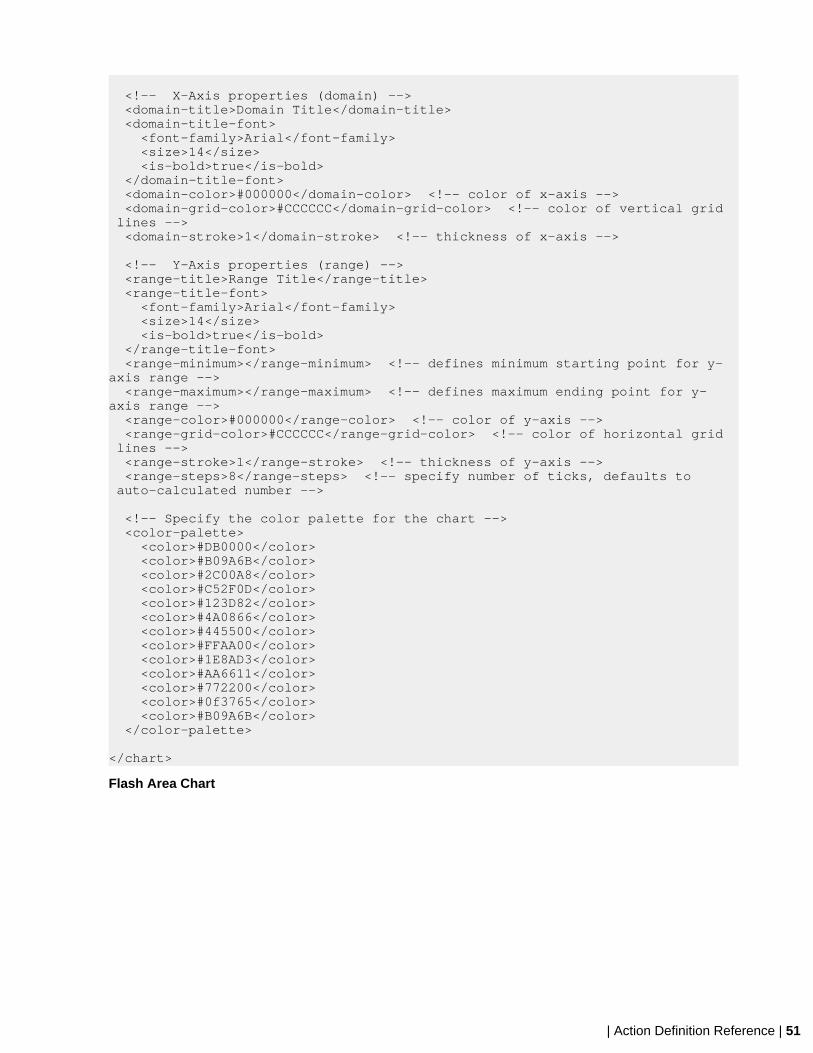
| Action Definition Reference | 51
<!-- X-Axis properties (domain) --> <domain-title>Domain Title</domain-title> <domain-title-font> <font-family>Arial</font-family> <size>14</size> <is-bold>true</is-bold> </domain-title-font> <domain-color>#000000</domain-color> <!-- color of x-axis --> <domain-grid-color>#CCCCCC</domain-grid-color> <!-- color of vertical grid lines --> <domain-stroke>1</domain-stroke> <!-- thickness of x-axis -->
<!-- Y-Axis properties (range) --> <range-title>Range Title</range-title> <range-title-font> <font-family>Arial</font-family> <size>14</size> <is-bold>true</is-bold> </range-title-font> <range-minimum></range-minimum> <!-- defines minimum starting point for y-axis range --> <range-maximum></range-maximum> <!-- defines maximum ending point for y-axis range --> <range-color>#000000</range-color> <!-- color of y-axis --> <range-grid-color>#CCCCCC</range-grid-color> <!-- color of horizontal grid lines --> <range-stroke>1</range-stroke> <!-- thickness of y-axis --> <range-steps>8</range-steps> <!-- specify number of ticks, defaults to auto-calculated number -->
<!-- Specify the color palette for the chart --> <color-palette> <color>#DB0000</color> <color>#B09A6B</color> <color>#2C00A8</color> <color>#C52F0D</color> <color>#123D82</color> <color>#4A0866</color> <color>#445500</color> <color>#FFAA00</color> <color>#1E8AD3</color> <color>#AA6611</color> <color>#772200</color> <color>#0f3765</color> <color>#B09A6B</color> </color-palette>
</chart>
Flash Area Chart
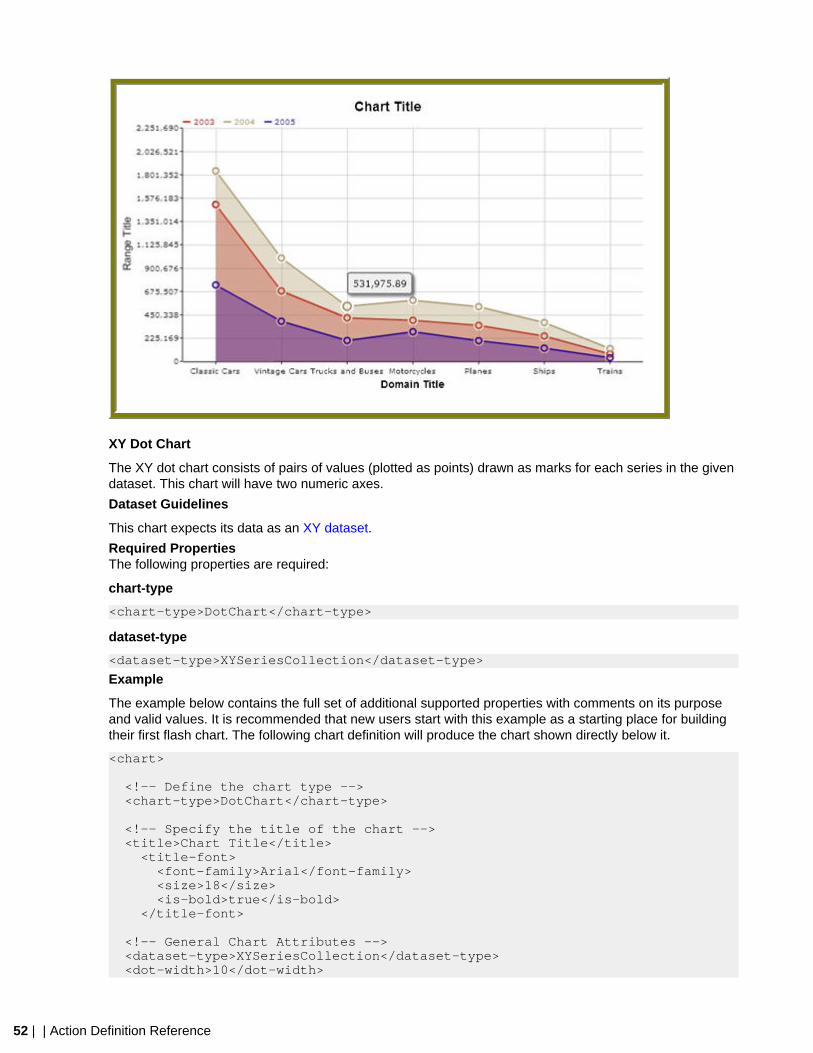
52 | | Action Definition Reference
XY Dot Chart
The XY dot chart consists of pairs of values (plotted as points) drawn as marks for each series in the givendataset. This chart will have two numeric axes.
Dataset Guidelines
This chart expects its data as an XY dataset.
Required PropertiesThe following properties are required:
chart-type
<chart-type>DotChart</chart-type>
dataset-type
<dataset-type>XYSeriesCollection</dataset-type>
Example
The example below contains the full set of additional supported properties with comments on its purposeand valid values. It is recommended that new users start with this example as a starting place for buildingtheir first flash chart. The following chart definition will produce the chart shown directly below it.
<chart>
<!-- Define the chart type --> <chart-type>DotChart</chart-type>
<!-- Specify the title of the chart --> <title>Chart Title</title> <title-font> <font-family>Arial</font-family> <size>18</size> <is-bold>true</is-bold> </title-font>
<!-- General Chart Attributes --> <dataset-type>XYSeriesCollection</dataset-type> <dot-width>10</dot-width>
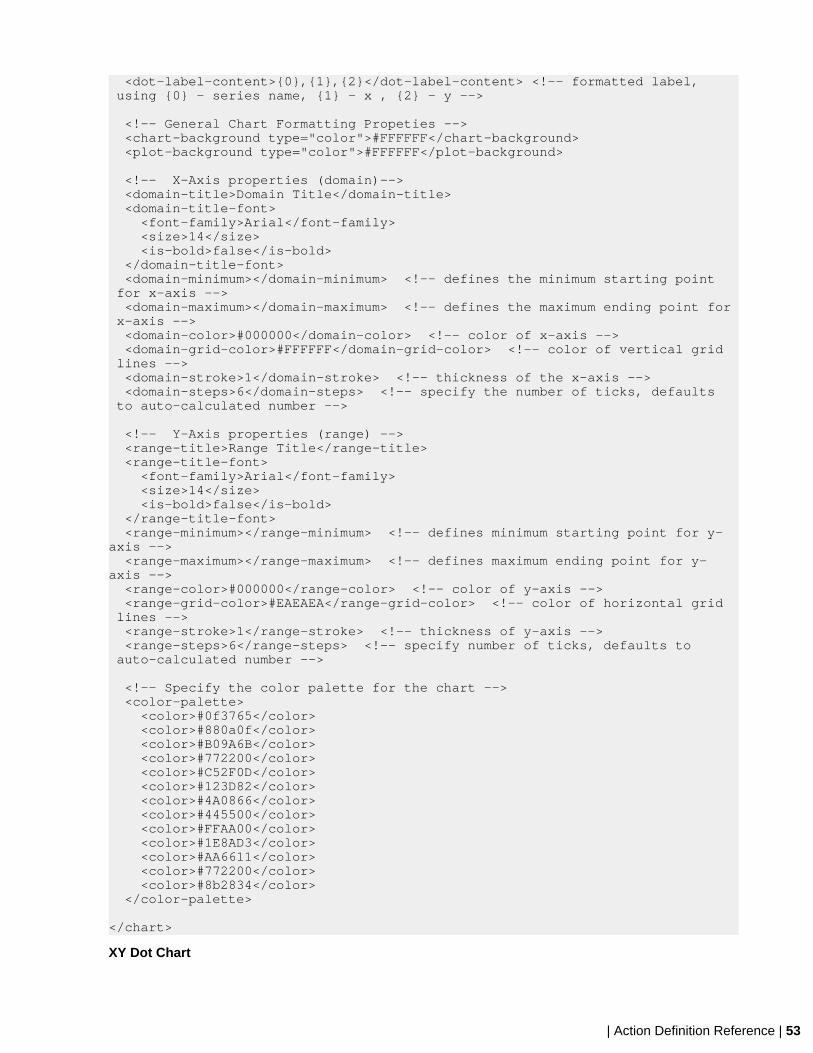
| Action Definition Reference | 53
<dot-label-content>{0},{1},{2}</dot-label-content> <!-- formatted label, using {0} - series name, {1} - x , {2} - y -->
<!-- General Chart Formatting Propeties --> <chart-background type="color">#FFFFFF</chart-background> <plot-background type="color">#FFFFFF</plot-background>
<!-- X-Axis properties (domain)--> <domain-title>Domain Title</domain-title> <domain-title-font> <font-family>Arial</font-family> <size>14</size> <is-bold>false</is-bold> </domain-title-font> <domain-minimum></domain-minimum> <!-- defines the minimum starting point for x-axis --> <domain-maximum></domain-maximum> <!-- defines the maximum ending point for x-axis --> <domain-color>#000000</domain-color> <!-- color of x-axis --> <domain-grid-color>#FFFFFF</domain-grid-color> <!-- color of vertical grid lines --> <domain-stroke>1</domain-stroke> <!-- thickness of the x-axis --> <domain-steps>6</domain-steps> <!-- specify the number of ticks, defaults to auto-calculated number -->
<!-- Y-Axis properties (range) --> <range-title>Range Title</range-title> <range-title-font> <font-family>Arial</font-family> <size>14</size> <is-bold>false</is-bold> </range-title-font> <range-minimum></range-minimum> <!-- defines minimum starting point for y-axis --> <range-maximum></range-maximum> <!-- defines maximum ending point for y-axis --> <range-color>#000000</range-color> <!-- color of y-axis --> <range-grid-color>#EAEAEA</range-grid-color> <!-- color of horizontal grid lines --> <range-stroke>1</range-stroke> <!-- thickness of y-axis --> <range-steps>6</range-steps> <!-- specify number of ticks, defaults to auto-calculated number -->
<!-- Specify the color palette for the chart --> <color-palette> <color>#0f3765</color> <color>#880a0f</color> <color>#B09A6B</color> <color>#772200</color> <color>#C52F0D</color> <color>#123D82</color> <color>#4A0866</color> <color>#445500</color> <color>#FFAA00</color> <color>#1E8AD3</color> <color>#AA6611</color> <color>#772200</color> <color>#8b2834</color> </color-palette>
</chart>
XY Dot Chart
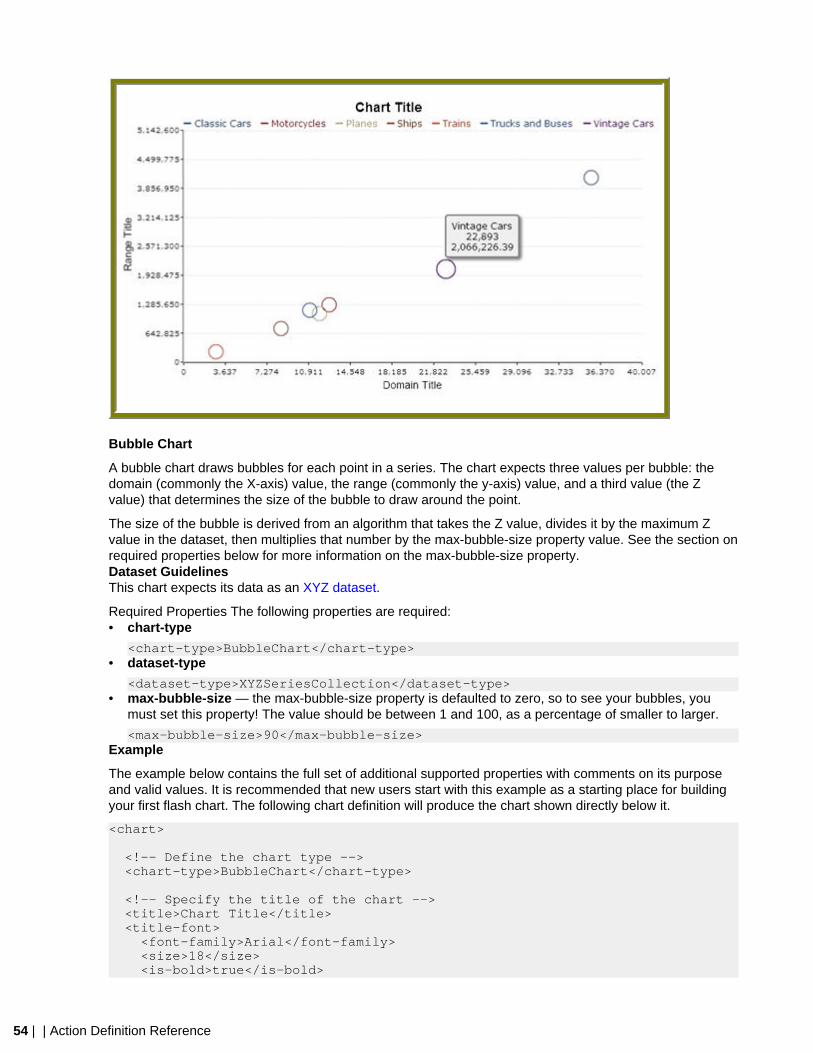
54 | | Action Definition Reference
Bubble Chart
A bubble chart draws bubbles for each point in a series. The chart expects three values per bubble: thedomain (commonly the X-axis) value, the range (commonly the y-axis) value, and a third value (the Zvalue) that determines the size of the bubble to draw around the point.
The size of the bubble is derived from an algorithm that takes the Z value, divides it by the maximum Zvalue in the dataset, then multiplies that number by the max-bubble-size property value. See the section onrequired properties below for more information on the max-bubble-size property.Dataset GuidelinesThis chart expects its data as an XYZ dataset.
Required Properties The following properties are required:• chart-type
<chart-type>BubbleChart</chart-type>• dataset-type
<dataset-type>XYZSeriesCollection</dataset-type>• max-bubble-size — the max-bubble-size property is defaulted to zero, so to see your bubbles, you
must set this property! The value should be between 1 and 100, as a percentage of smaller to larger.
<max-bubble-size>90</max-bubble-size>Example
The example below contains the full set of additional supported properties with comments on its purposeand valid values. It is recommended that new users start with this example as a starting place for buildingyour first flash chart. The following chart definition will produce the chart shown directly below it.
<chart>
<!-- Define the chart type --> <chart-type>BubbleChart</chart-type>
<!-- Specify the title of the chart --> <title>Chart Title</title> <title-font> <font-family>Arial</font-family> <size>18</size> <is-bold>true</is-bold>
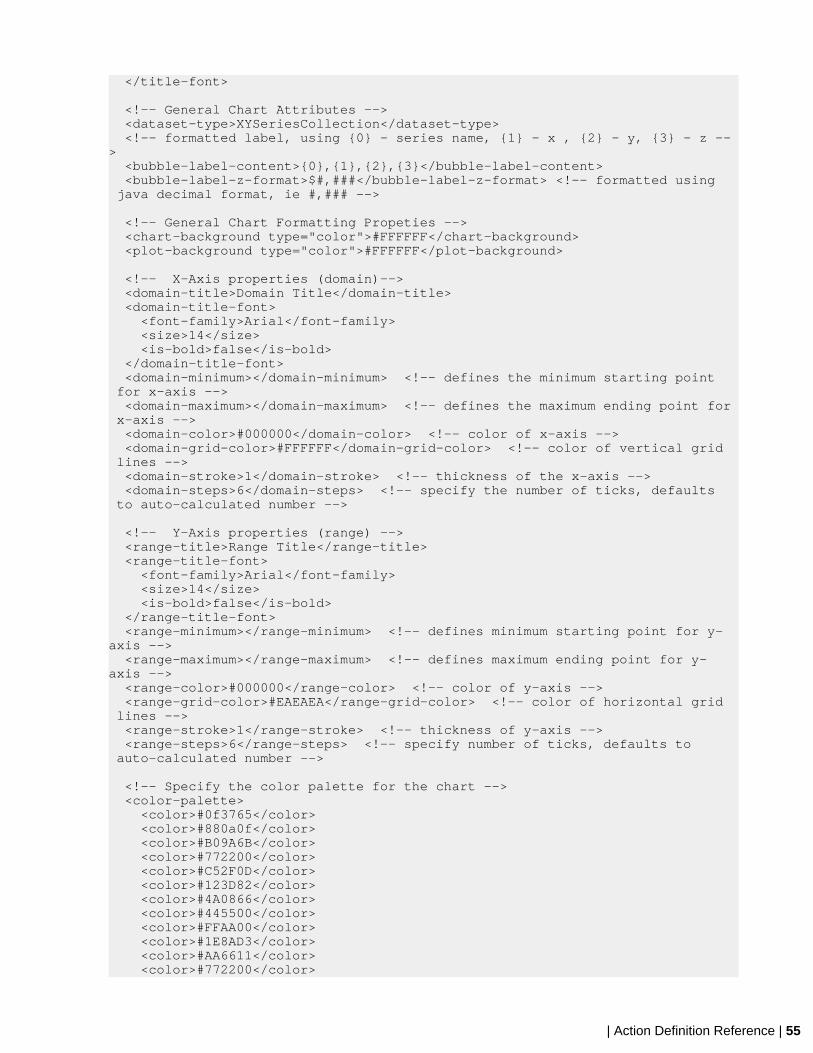
| Action Definition Reference | 55
</title-font>
<!-- General Chart Attributes --> <dataset-type>XYSeriesCollection</dataset-type> <!-- formatted label, using {0} - series name, {1} - x , {2} - y, {3} - z --> <bubble-label-content>{0},{1},{2},{3}</bubble-label-content> <bubble-label-z-format>$#,###</bubble-label-z-format> <!-- formatted using java decimal format, ie #,### -->
<!-- General Chart Formatting Propeties --> <chart-background type="color">#FFFFFF</chart-background> <plot-background type="color">#FFFFFF</plot-background>
<!-- X-Axis properties (domain)--> <domain-title>Domain Title</domain-title> <domain-title-font> <font-family>Arial</font-family> <size>14</size> <is-bold>false</is-bold> </domain-title-font> <domain-minimum></domain-minimum> <!-- defines the minimum starting point for x-axis --> <domain-maximum></domain-maximum> <!-- defines the maximum ending point for x-axis --> <domain-color>#000000</domain-color> <!-- color of x-axis --> <domain-grid-color>#FFFFFF</domain-grid-color> <!-- color of vertical grid lines --> <domain-stroke>1</domain-stroke> <!-- thickness of the x-axis --> <domain-steps>6</domain-steps> <!-- specify the number of ticks, defaults to auto-calculated number -->
<!-- Y-Axis properties (range) --> <range-title>Range Title</range-title> <range-title-font> <font-family>Arial</font-family> <size>14</size> <is-bold>false</is-bold> </range-title-font> <range-minimum></range-minimum> <!-- defines minimum starting point for y-axis --> <range-maximum></range-maximum> <!-- defines maximum ending point for y-axis --> <range-color>#000000</range-color> <!-- color of y-axis --> <range-grid-color>#EAEAEA</range-grid-color> <!-- color of horizontal grid lines --> <range-stroke>1</range-stroke> <!-- thickness of y-axis --> <range-steps>6</range-steps> <!-- specify number of ticks, defaults to auto-calculated number -->
<!-- Specify the color palette for the chart --> <color-palette> <color>#0f3765</color> <color>#880a0f</color> <color>#B09A6B</color> <color>#772200</color> <color>#C52F0D</color> <color>#123D82</color> <color>#4A0866</color> <color>#445500</color> <color>#FFAA00</color> <color>#1E8AD3</color> <color>#AA6611</color> <color>#772200</color>
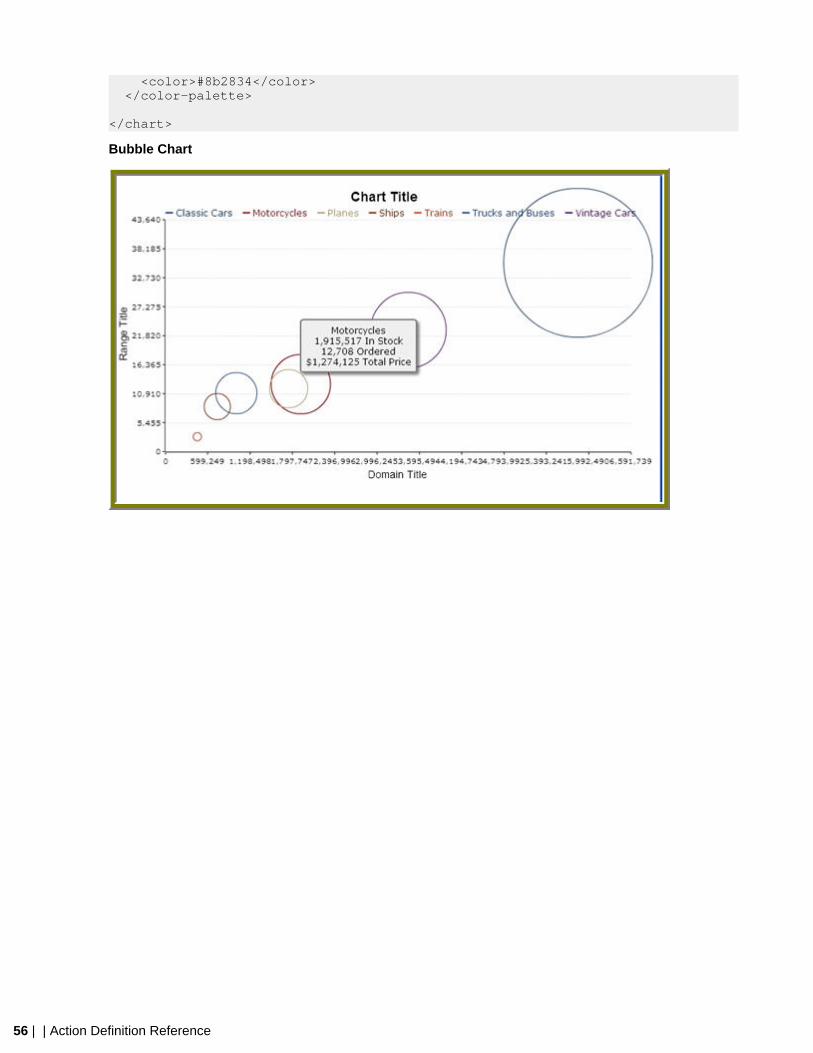
56 | | Action Definition Reference
<color>#8b2834</color> </color-palette>
</chart>
Bubble Chart
| Editing Existing Action Sequences | 57
Editing Existing Action Sequences
If you used Design Studio to create an action sequence in a previous version of the Pentaho BI Suite, thesame basic rules and practices apply to later releases. While very little has changed with the core set ofcomponents, there are some new plugins available to you like the PojoComponent, the result set burstcomponent, and the Flash chart component.
Reports published by Pentaho Report Designer prior to version 3.5 were in fact machine-generated actionsequences. This has changed as of Report Designer 3.5; published reports are now in the PRPT format,which is an OpenDocument-compliant file archive. Report Designer has been entirely overhauled in anattempt to eliminate the need to hand-edit reports with Design Studio, but in previous versions, there weresome functions (such as adding user-interactive parameters) that required hand-editing.
If you have already used Design Studio to customize a published report, it is likely that you will continueto have to follow that process if you want to make changes to the report. Alternatively you could re-createthe report in the new Report Designer and republish it to the BI Platform as a PRPT, or you could open theold Report Designer .report file with the new Report Designer, use its new and more powerful feature set toadd in the custom changes that you formerly used Design Studio for, and publish it to the BI Platform.
Report Designer 3.6 does not yet have equivalent functionality to the SecureFilterComponent, so if youneed to put strict limits on user parameters, you will have to generate the report by hand with DesignStudio.
58 | | Internationalization Guidelines
Internationalization Guidelines
If you need to internationalize your action sequence, you can abstract all of your text content to language-specific message bundles. For each language you want to translate to, create a properties file with thesame name as the action sequence, plus the two-letter ISO language code. Optionally, you can alsoappend a two-letter ISO country code if you want to discriminate among different dialects. For instance,using the previously created hello_world.xaction example, you would internationalize it by creatingproperties files like these:
• hello_world.properties: The default version of the message bundle• hello_world_fr.properties: French language version• hello_world_de.properties: German language version• hello_world_fr_CA.properties: French Canadian version of the messages file
It does not matter what the original xaction filename is when it comes to specifying the language andcountry code. For instance if the original file were called hello_world_fr_CA.xaction, the resultingproperties file hello_world_fr_CA.properties would be the default browser language (usually English), notFrench Canadian. To specify a French Canadian message bundle, you would create a second file calledhello_world_fr_CA_fr_CA.properties.
Each string is replaced by a token (indicated by a percent symbol) in the action sequence, and matches upwith content in the properties file. Considering this, the original, unmodified hello_world example createdfrom the Design Studio template should make more sense now:
<?xml version="1.0" encoding="UTF-8"?><action-sequence> <title>Hello World</title> <version>1</version> <logging-level>DEBUG</logging-level>
<documentation> <author>Joe Pentaho</author> <description>The most simple Action Sequence</description> <help>%help</help> <result-type>rule</result-type> <icon>HelloWorld.png</icon> </documentation>
<inputs/>
<outputs/>
<resources/>
<actions> <action-definition> <action-name>Hello World Action</action-name> <action-inputs/> <action-outputs/> <logging-level>DEBUG</logging-level> <component-name>org.pentaho.component.HelloWorldComponent</component-name> <component-definition> <quote>%quote</quote> </component-definition> </action-definition> </actions></action-sequence>
The help and quote tags are, by default, abstracted to a properties file. As previously mentioned, Pentahono longer ships the BI Suite with properties files for the sample action sequences. So if you want to see
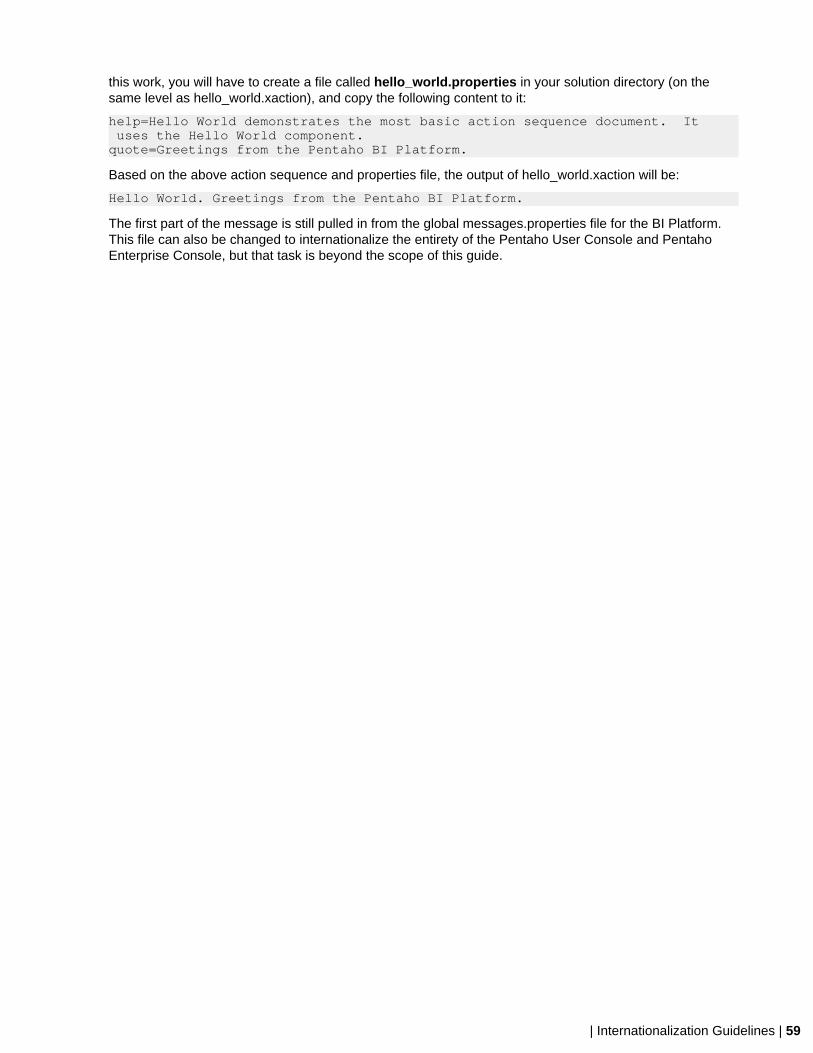
| Internationalization Guidelines | 59
this work, you will have to create a file called hello_world.properties in your solution directory (on thesame level as hello_world.xaction), and copy the following content to it:
help=Hello World demonstrates the most basic action sequence document. It uses the Hello World component.quote=Greetings from the Pentaho BI Platform.
Based on the above action sequence and properties file, the output of hello_world.xaction will be:
Hello World. Greetings from the Pentaho BI Platform.
The first part of the message is still pulled in from the global messages.properties file for the BI Platform.This file can also be changed to internationalize the entirety of the Pentaho User Console and PentahoEnterprise Console, but that task is beyond the scope of this guide.
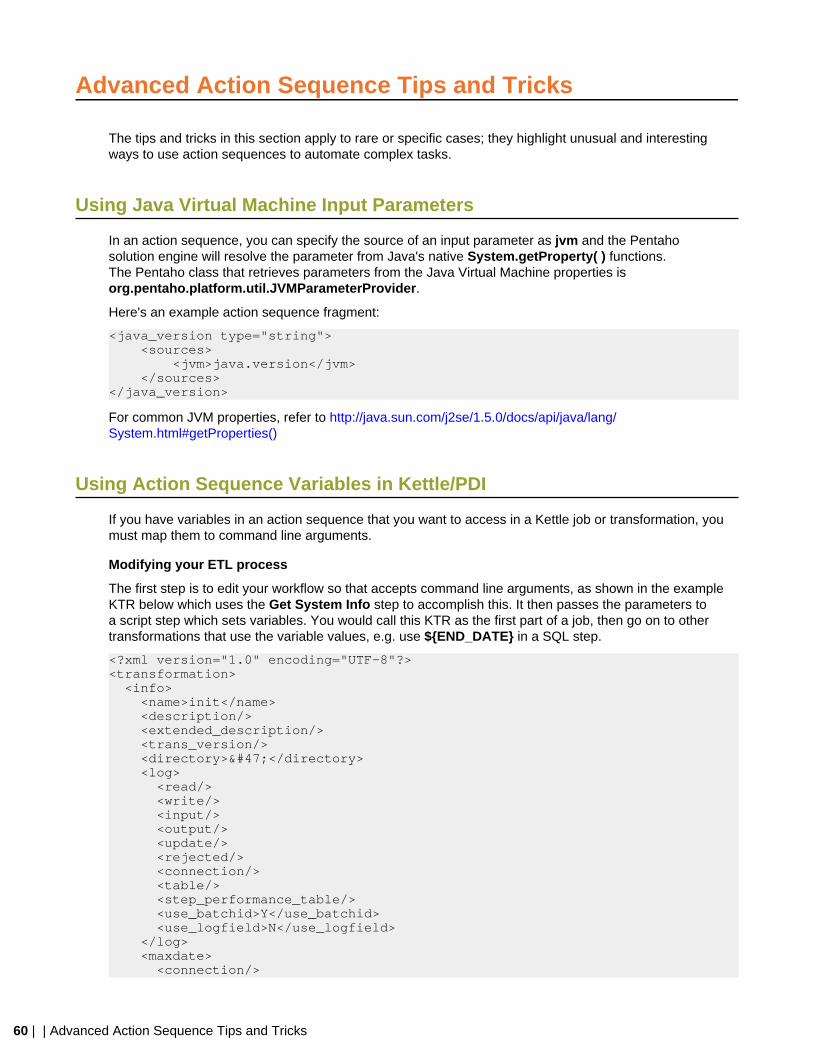
60 | | Advanced Action Sequence Tips and Tricks
Advanced Action Sequence Tips and Tricks
The tips and tricks in this section apply to rare or specific cases; they highlight unusual and interestingways to use action sequences to automate complex tasks.
Using Java Virtual Machine Input Parameters
In an action sequence, you can specify the source of an input parameter as jvm and the Pentahosolution engine will resolve the parameter from Java's native System.getProperty( ) functions.The Pentaho class that retrieves parameters from the Java Virtual Machine properties isorg.pentaho.platform.util.JVMParameterProvider.
Here's an example action sequence fragment:
<java_version type="string"> <sources> <jvm>java.version</jvm> </sources></java_version>
For common JVM properties, refer to http://java.sun.com/j2se/1.5.0/docs/api/java/lang/System.html#getProperties()
Using Action Sequence Variables in Kettle/PDI
If you have variables in an action sequence that you want to access in a Kettle job or transformation, youmust map them to command line arguments.
Modifying your ETL process
The first step is to edit your workflow so that accepts command line arguments, as shown in the exampleKTR below which uses the Get System Info step to accomplish this. It then passes the parameters toa script step which sets variables. You would call this KTR as the first part of a job, then go on to othertransformations that use the variable values, e.g. use ${END_DATE} in a SQL step.
<?xml version="1.0" encoding="UTF-8"?><transformation> <info> <name>init</name> <description/> <extended_description/> <trans_version/> <directory>/</directory> <log> <read/> <write/> <input/> <output/> <update/> <rejected/> <connection/> <table/> <step_performance_table/> <use_batchid>Y</use_batchid> <use_logfield>N</use_logfield> </log> <maxdate> <connection/>
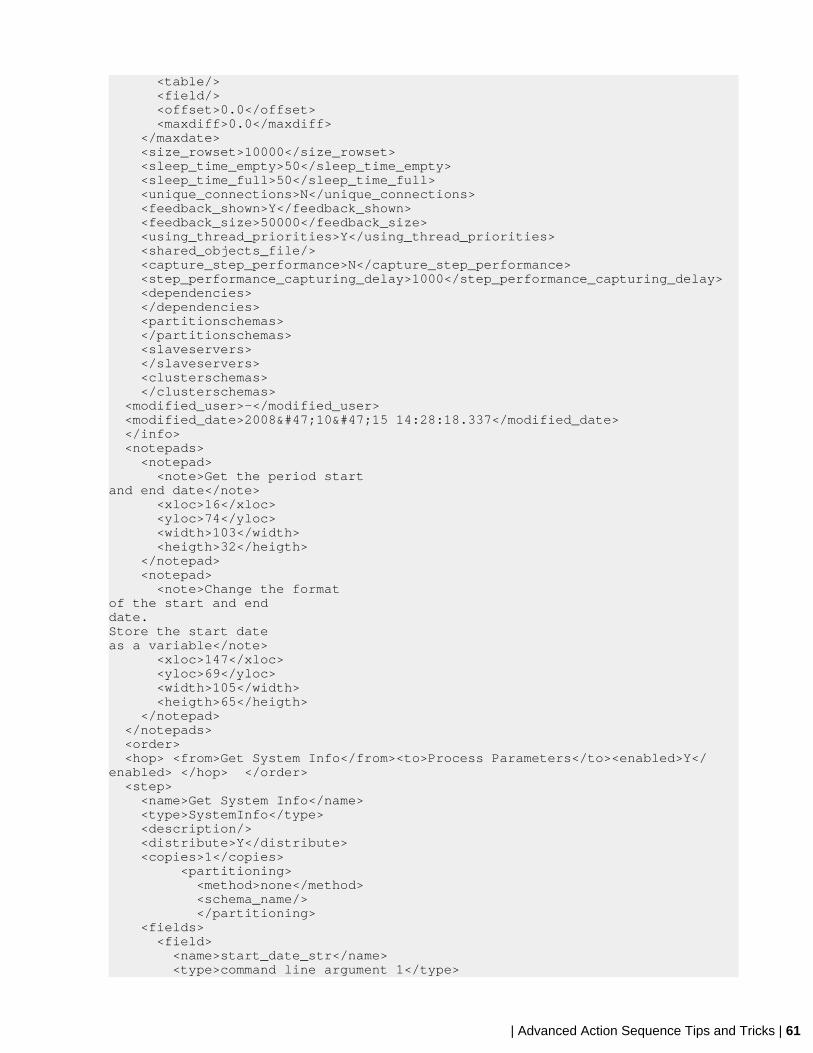
| Advanced Action Sequence Tips and Tricks | 61
<table/> <field/> <offset>0.0</offset> <maxdiff>0.0</maxdiff> </maxdate> <size_rowset>10000</size_rowset> <sleep_time_empty>50</sleep_time_empty> <sleep_time_full>50</sleep_time_full> <unique_connections>N</unique_connections> <feedback_shown>Y</feedback_shown> <feedback_size>50000</feedback_size> <using_thread_priorities>Y</using_thread_priorities> <shared_objects_file/> <capture_step_performance>N</capture_step_performance> <step_performance_capturing_delay>1000</step_performance_capturing_delay> <dependencies> </dependencies> <partitionschemas> </partitionschemas> <slaveservers> </slaveservers> <clusterschemas> </clusterschemas> <modified_user>-</modified_user> <modified_date>2008/10/15 14:28:18.337</modified_date> </info> <notepads> <notepad> <note>Get the period start and end date</note> <xloc>16</xloc> <yloc>74</yloc> <width>103</width> <heigth>32</heigth> </notepad> <notepad> <note>Change the format of the start and end date.Store the start dateas a variable</note> <xloc>147</xloc> <yloc>69</yloc> <width>105</width> <heigth>65</heigth> </notepad> </notepads> <order> <hop> <from>Get System Info</from><to>Process Parameters</to><enabled>Y</enabled> </hop> </order> <step> <name>Get System Info</name> <type>SystemInfo</type> <description/> <distribute>Y</distribute> <copies>1</copies> <partitioning> <method>none</method> <schema_name/> </partitioning> <fields> <field> <name>start_date_str</name> <type>command line argument 1</type>
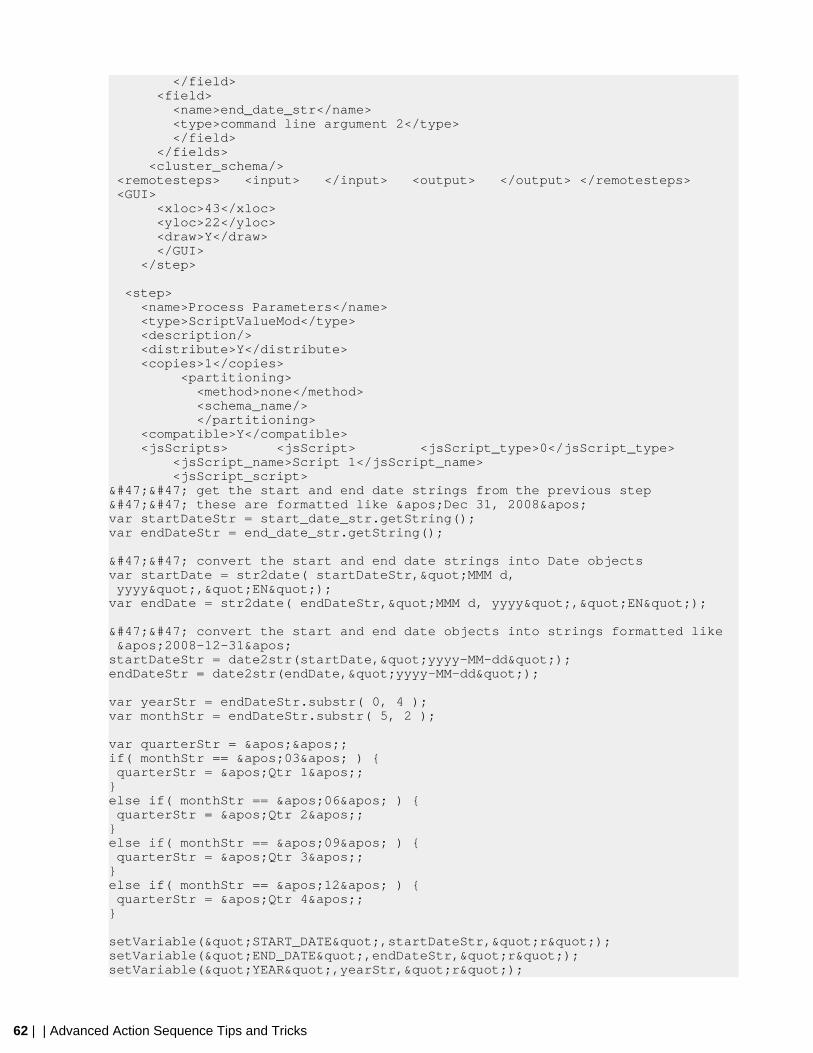
62 | | Advanced Action Sequence Tips and Tricks
</field> <field> <name>end_date_str</name> <type>command line argument 2</type> </field> </fields> <cluster_schema/> <remotesteps> <input> </input> <output> </output> </remotesteps> <GUI> <xloc>43</xloc> <yloc>22</yloc> <draw>Y</draw> </GUI> </step>
<step> <name>Process Parameters</name> <type>ScriptValueMod</type> <description/> <distribute>Y</distribute> <copies>1</copies> <partitioning> <method>none</method> <schema_name/> </partitioning> <compatible>Y</compatible> <jsScripts> <jsScript> <jsScript_type>0</jsScript_type> <jsScript_name>Script 1</jsScript_name> <jsScript_script>// get the start and end date strings from the previous step// these are formatted like 'Dec 31, 2008'var startDateStr = start_date_str.getString();var endDateStr = end_date_str.getString();
// convert the start and end date strings into Date objectsvar startDate = str2date( startDateStr,"MMM d, yyyy","EN");var endDate = str2date( endDateStr,"MMM d, yyyy","EN");
// convert the start and end date objects into strings formatted like '2008-12-31'startDateStr = date2str(startDate,"yyyy-MM-dd");endDateStr = date2str(endDate,"yyyy-MM-dd");
var yearStr = endDateStr.substr( 0, 4 );var monthStr = endDateStr.substr( 5, 2 );
var quarterStr = '';if( monthStr == '03' ) { quarterStr = 'Qtr 1';}else if( monthStr == '06' ) { quarterStr = 'Qtr 2';}else if( monthStr == '09' ) { quarterStr = 'Qtr 3';}else if( monthStr == '12' ) { quarterStr = 'Qtr 4';}
setVariable("START_DATE",startDateStr,"r");setVariable("END_DATE",endDateStr,"r");setVariable("YEAR",yearStr,"r");
| Advanced Action Sequence Tips and Tricks | 63
setVariable("QUARTER",quarterStr,"r");setVariable("DATABASE_NAME","amrs_demo","r");</jsScript_script> </jsScript> </jsScripts> <fields> <field> <name>endDateStr</name> <rename>endDateStr</rename> <type>String</type> <length>10</length> <precision>-1</precision> </field> <field> <name>startDateStr</name> <rename>startDateStr</rename> <type>String</type> <length>10</length> <precision>-1</precision> </field> </fields> <cluster_schema/> <remotesteps> <input> </input> <output> </output> </remotesteps> <GUI> <xloc>170</xloc> <yloc>22</yloc> <draw>Y</draw> </GUI> </step>
<step_error_handling> </step_error_handling> <slave-step-copy-partition-distribution></slave-step-copy-partition-distribution> <slave_transformation>N</slave_transformation></transformation>
Modifying your action sequence
In the action sequence, you must map the action-inputs to numbered parameters that match what thecommand line arguments would be, as shown in the snippet below:
<action-inputs> <start_date/> <end_date/></action-inputs><component-definition> <parameter1>start_date</parameter1> <parameter2>end_date</parameter2></component-definition>
Sharing Result Sets in Action Sequences
In an action sequence, it is possible to use an SQLLookupRule to produce a result-set, which can in turnbe used as an input for SecureFilterComponenent. That action-input can have a filter that can be sharedamong multiple action-inputs in SecureFilterComponent. If the action-inputs of a SecureFilterComponentshare the same filter, and that filter is a result-set, you will receive a nullPointerException when running theaction sequence.
To solve this, modify the SQLLookupRule's component-definition by setting the value of the <live> elementto false, as in this example:
<action-definition> <component-name>SQLLookupRule</component-name> <action-type>Relational</action-type> <action-outputs> <query-result type="result-set" mapping="paymentMethodList"/> </action-outputs> <component-definition> <jndi><![CDATA[SampleData]]></jndi>
64 | | Advanced Action Sequence Tips and Tricks
<query><![CDATA[select method from paymentMethod]]></query>
<!-- MAKE SURE THIS IS SET TO FALSE OR YOU WILL RECIEVE A NULLPOINTEREXCEPTION -->
<live><![CDATA[false]]></live>
</component-definition> </action-definition>
<action-definition> <component-name>SecureFilterComponent</component-name> <action-type>Prompt/Secure Filter</action-type> <action-inputs> <PaymentMethodList type="result-set"/> </action-inputs> <component-definition> <selections> <CarSales style="list-multi"> <title>Select payment method for car sales:</title> <filter value-col-name="paymentMethod_id" display-col-name="method">paymentMethodList</filter> </CarSales> <BikeSales style="list-multi"> <title>Select payment method for bike sales:</title> <filter value-col-name="paymentMethod_id" display-col-name="method">paymentMethodList</filter> </BikeSales> </selections> </component-definition> </action-definition>
Essentially, if you are using a live result set (live = true), then once you use the result-set, and iteratethrough it, the result-set has been used, and it is no longer available. Hence, the NPE. If you use an in-memory result-set (live = false), the result-set is stored in memory for later use.
Creating Custom Action Sequence Error Messages
An action sequence can fail for multiple reasons, but the BI Platform typically doesn't offer more than ageneric error message to explain what's gone wrong. Action sequences could fail because it they containinvalid XML, because of a BI Platform component failure, or because a required database is offline.
You can create descriptive error messages by writing custom Java code. Action sequence error handlingis managed by the org.pentaho.platform.engine.services.MessageFormatter class. You can seethe code directly in Pentaho's Subversion repository at this address: http://source.pentaho.org/svnroot/bi-platform-v2/branches/3.5/bi-platform-engine-services/src/org/pentaho/platform/engine/services/MessageFormatter.java.
Take a look at the formatErrorMessage method, where Pentaho builds the HTML that gets displayed tothe user, including the error message.
If you would like to change the format of the page, you could subclass MessageFormatter and overridethe formatErrorMessage method.
If you would like to add error message functionality, such as displaying the message in the browser andsending an email, you would subclass MessageFormatter and add your new code to the constructor oranother method, then call super.formatErrorMessage to let the BI Server do what it normally does.

| Advanced Action Sequence Tips and Tricks | 65
If you create your own subclass, you will have to configure the BI Platform to use your class for messageformatting. This is configured in the /pentaho/server/biserver-ee/pentaho-solutions/system/pentahoObjects.spring.xml file. The default setting is:
<bean id="IMessageFormatter" class="org.pentaho.platform.engine.services.MessageFormatter" scope="singleton" />
You must indicate your class instead of the default, and be sure to add your JAR to the WEB-INF/lib/directory inside the deployed Pentaho WAR (you will have to stop your application server to do this).
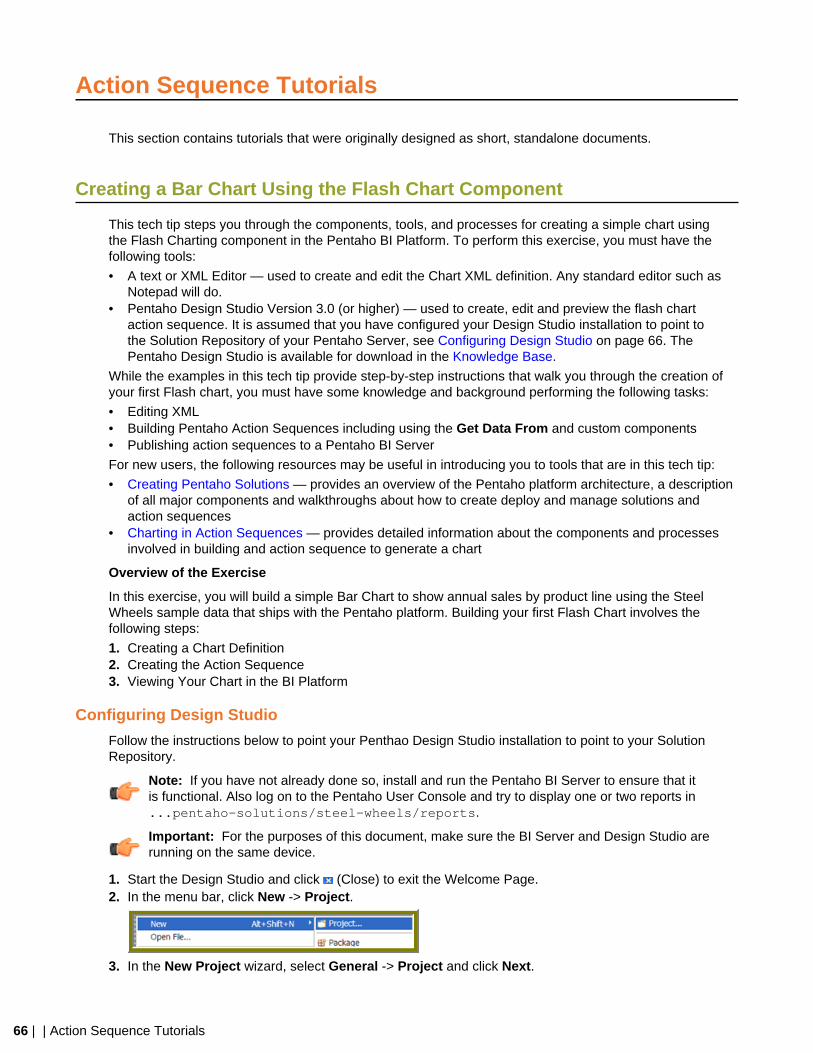
66 | | Action Sequence Tutorials
Action Sequence Tutorials
This section contains tutorials that were originally designed as short, standalone documents.
Creating a Bar Chart Using the Flash Chart Component
This tech tip steps you through the components, tools, and processes for creating a simple chart usingthe Flash Charting component in the Pentaho BI Platform. To perform this exercise, you must have thefollowing tools:
• A text or XML Editor — used to create and edit the Chart XML definition. Any standard editor such asNotepad will do.
• Pentaho Design Studio Version 3.0 (or higher) — used to create, edit and preview the flash chartaction sequence. It is assumed that you have configured your Design Studio installation to point tothe Solution Repository of your Pentaho Server, see Configuring Design Studio on page 66. ThePentaho Design Studio is available for download in the Knowledge Base.
While the examples in this tech tip provide step-by-step instructions that walk you through the creation ofyour first Flash chart, you must have some knowledge and background performing the following tasks:
• Editing XML• Building Pentaho Action Sequences including using the Get Data From and custom components• Publishing action sequences to a Pentaho BI Server
For new users, the following resources may be useful in introducing you to tools that are in this tech tip:
• Creating Pentaho Solutions — provides an overview of the Pentaho platform architecture, a descriptionof all major components and walkthroughs about how to create deploy and manage solutions andaction sequences
• Charting in Action Sequences — provides detailed information about the components and processesinvolved in building and action sequence to generate a chart
Overview of the Exercise
In this exercise, you will build a simple Bar Chart to show annual sales by product line using the SteelWheels sample data that ships with the Pentaho platform. Building your first Flash Chart involves thefollowing steps:
1. Creating a Chart Definition2. Creating the Action Sequence3. Viewing Your Chart in the BI Platform
Configuring Design Studio
Follow the instructions below to point your Penthao Design Studio installation to point to your SolutionRepository.
Note: If you have not already done so, install and run the Pentaho BI Server to ensure that itis functional. Also log on to the Pentaho User Console and try to display one or two reports in...pentaho-solutions/steel-wheels/reports.
Important: For the purposes of this document, make sure the BI Server and Design Studio arerunning on the same device.
1. Start the Design Studio and click (Close) to exit the Welcome Page.2. In the menu bar, click New -> Project.
3. In the New Project wizard, select General -> Project and click Next.
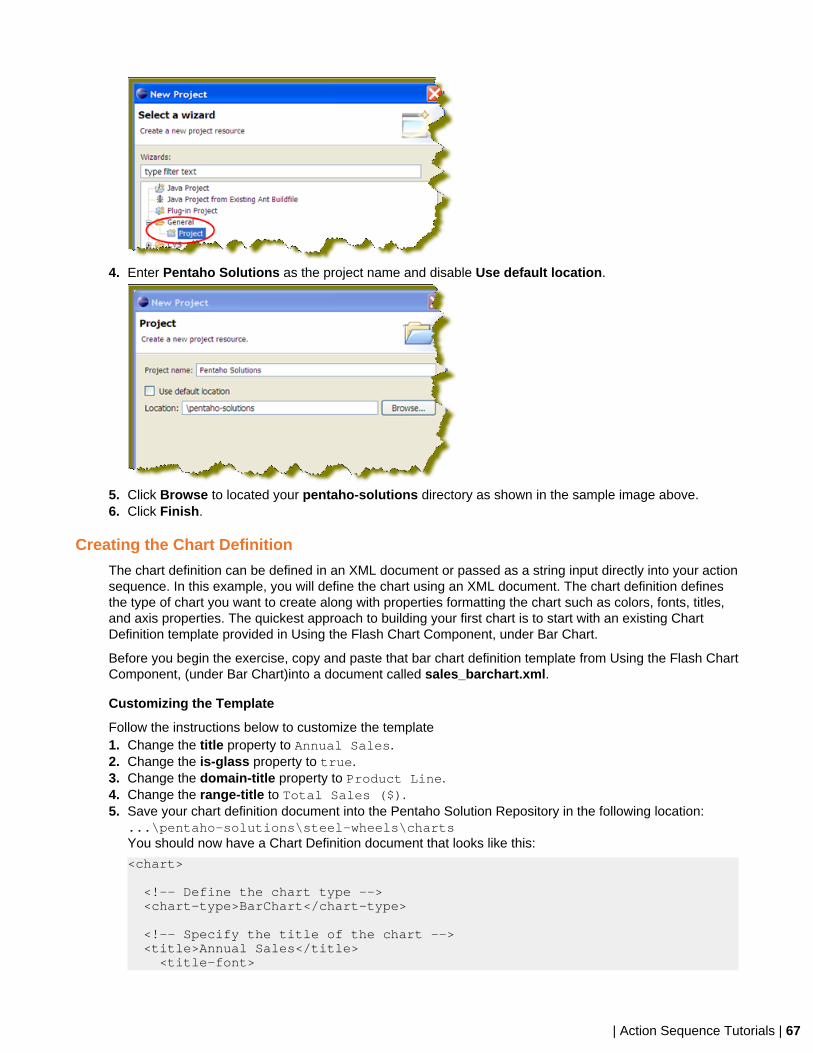
| Action Sequence Tutorials | 67
4. Enter Pentaho Solutions as the project name and disable Use default location.
5. Click Browse to located your pentaho-solutions directory as shown in the sample image above.6. Click Finish.
Creating the Chart Definition
The chart definition can be defined in an XML document or passed as a string input directly into your actionsequence. In this example, you will define the chart using an XML document. The chart definition definesthe type of chart you want to create along with properties formatting the chart such as colors, fonts, titles,and axis properties. The quickest approach to building your first chart is to start with an existing ChartDefinition template provided in Using the Flash Chart Component, under Bar Chart.
Before you begin the exercise, copy and paste that bar chart definition template from Using the Flash ChartComponent, (under Bar Chart)into a document called sales_barchart.xml.
Customizing the Template
Follow the instructions below to customize the template1. Change the title property to Annual Sales.2. Change the is-glass property to true.3. Change the domain-title property to Product Line.4. Change the range-title to Total Sales ($).5. Save your chart definition document into the Pentaho Solution Repository in the following location:
...\pentaho-solutions\steel-wheels\chartsYou should now have a Chart Definition document that looks like this:
<chart>
<!-- Define the chart type --> <chart-type>BarChart</chart-type>
<!-- Specify the title of the chart --> <title>Annual Sales</title> <title-font>
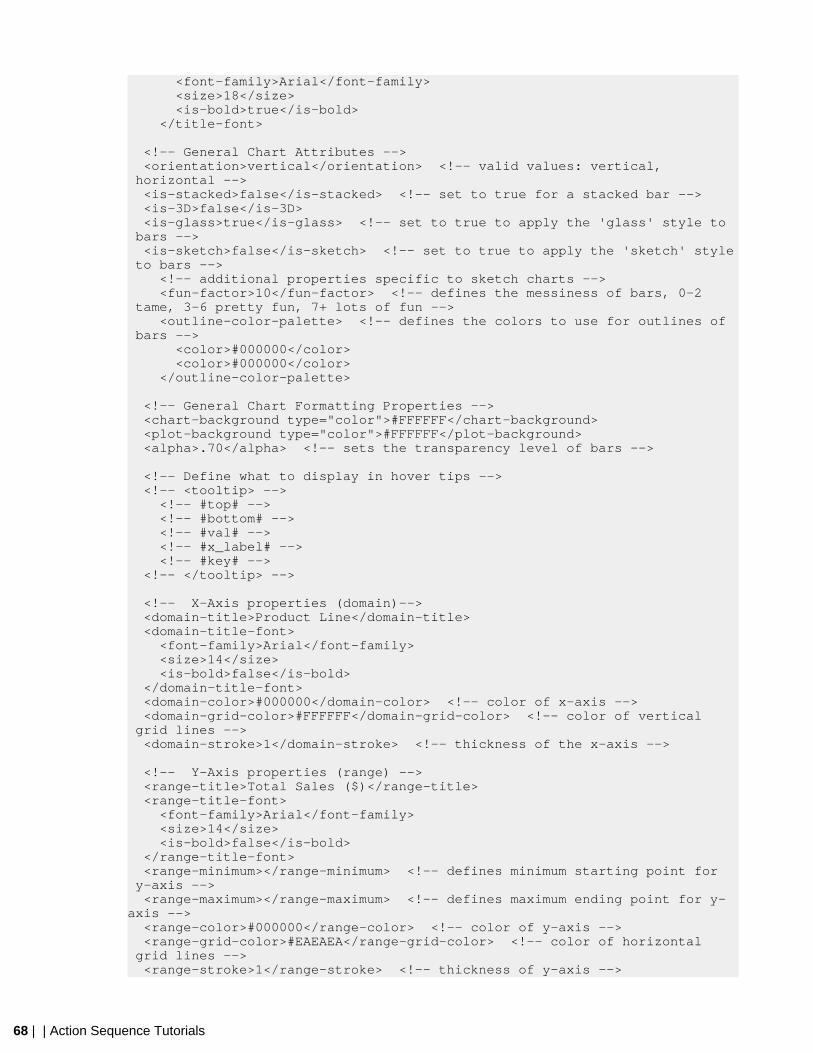
68 | | Action Sequence Tutorials
<font-family>Arial</font-family> <size>18</size> <is-bold>true</is-bold> </title-font>
<!-- General Chart Attributes --> <orientation>vertical</orientation> <!-- valid values: vertical, horizontal --> <is-stacked>false</is-stacked> <!-- set to true for a stacked bar --> <is-3D>false</is-3D> <is-glass>true</is-glass> <!-- set to true to apply the 'glass' style to bars --> <is-sketch>false</is-sketch> <!-- set to true to apply the 'sketch' style to bars --> <!-- additional properties specific to sketch charts --> <fun-factor>10</fun-factor> <!-- defines the messiness of bars, 0-2 tame, 3-6 pretty fun, 7+ lots of fun --> <outline-color-palette> <!-- defines the colors to use for outlines of bars --> <color>#000000</color> <color>#000000</color> </outline-color-palette>
<!-- General Chart Formatting Properties --> <chart-background type="color">#FFFFFF</chart-background> <plot-background type="color">#FFFFFF</plot-background> <alpha>.70</alpha> <!-- sets the transparency level of bars -->
<!-- Define what to display in hover tips --> <!-- <tooltip> --> <!-- #top# --> <!-- #bottom# --> <!-- #val# --> <!-- #x_label# --> <!-- #key# --> <!-- </tooltip> -->
<!-- X-Axis properties (domain)--> <domain-title>Product Line</domain-title> <domain-title-font> <font-family>Arial</font-family> <size>14</size> <is-bold>false</is-bold> </domain-title-font> <domain-color>#000000</domain-color> <!-- color of x-axis --> <domain-grid-color>#FFFFFF</domain-grid-color> <!-- color of vertical grid lines --> <domain-stroke>1</domain-stroke> <!-- thickness of the x-axis -->
<!-- Y-Axis properties (range) --> <range-title>Total Sales ($)</range-title> <range-title-font> <font-family>Arial</font-family> <size>14</size> <is-bold>false</is-bold> </range-title-font> <range-minimum></range-minimum> <!-- defines minimum starting point for y-axis --> <range-maximum></range-maximum> <!-- defines maximum ending point for y-axis --> <range-color>#000000</range-color> <!-- color of y-axis --> <range-grid-color>#EAEAEA</range-grid-color> <!-- color of horizontal grid lines --> <range-stroke>1</range-stroke> <!-- thickness of y-axis -->
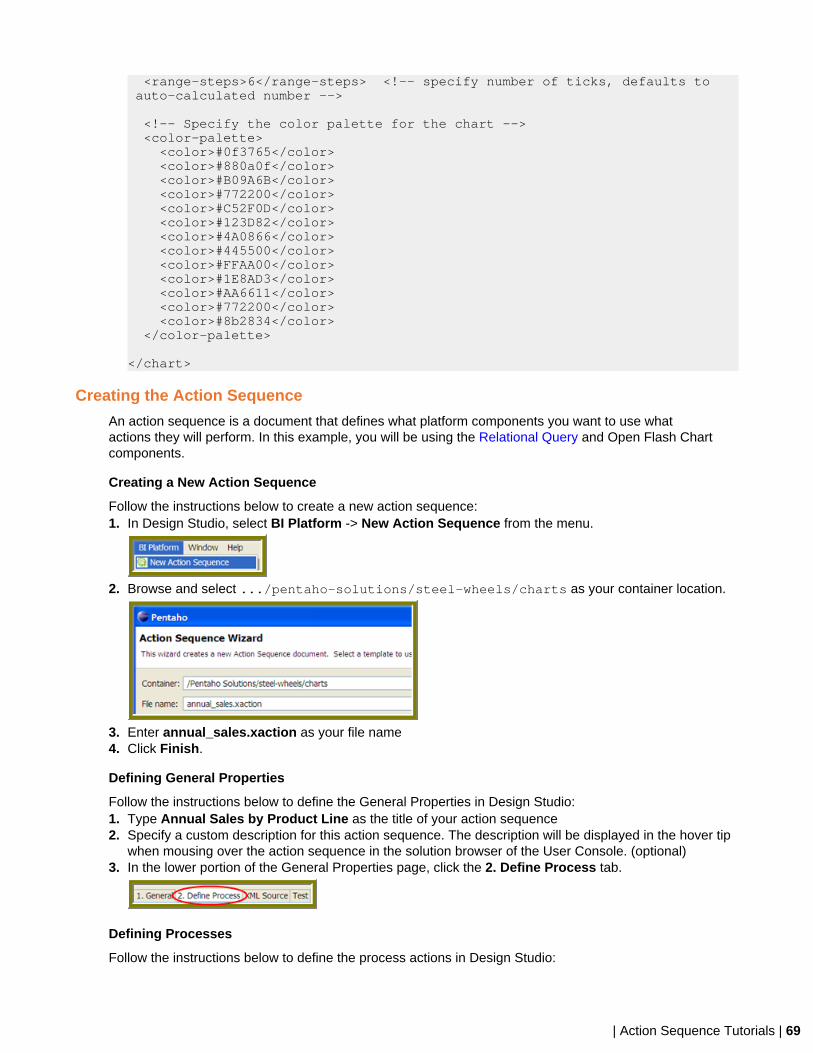
| Action Sequence Tutorials | 69
<range-steps>6</range-steps> <!-- specify number of ticks, defaults to auto-calculated number -->
<!-- Specify the color palette for the chart --> <color-palette> <color>#0f3765</color> <color>#880a0f</color> <color>#B09A6B</color> <color>#772200</color> <color>#C52F0D</color> <color>#123D82</color> <color>#4A0866</color> <color>#445500</color> <color>#FFAA00</color> <color>#1E8AD3</color> <color>#AA6611</color> <color>#772200</color> <color>#8b2834</color> </color-palette>
</chart>
Creating the Action Sequence
An action sequence is a document that defines what platform components you want to use whatactions they will perform. In this example, you will be using the Relational Query and Open Flash Chartcomponents.
Creating a New Action Sequence
Follow the instructions below to create a new action sequence:1. In Design Studio, select BI Platform -> New Action Sequence from the menu.
2. Browse and select .../pentaho-solutions/steel-wheels/charts as your container location.
3. Enter annual_sales.xaction as your file name4. Click Finish.
Defining General Properties
Follow the instructions below to define the General Properties in Design Studio:1. Type Annual Sales by Product Line as the title of your action sequence2. Specify a custom description for this action sequence. The description will be displayed in the hover tip
when mousing over the action sequence in the solution browser of the User Console. (optional)3. In the lower portion of the General Properties page, click the 2. Define Process tab.
Defining Processes
Follow the instructions below to define the process actions in Design Studio:
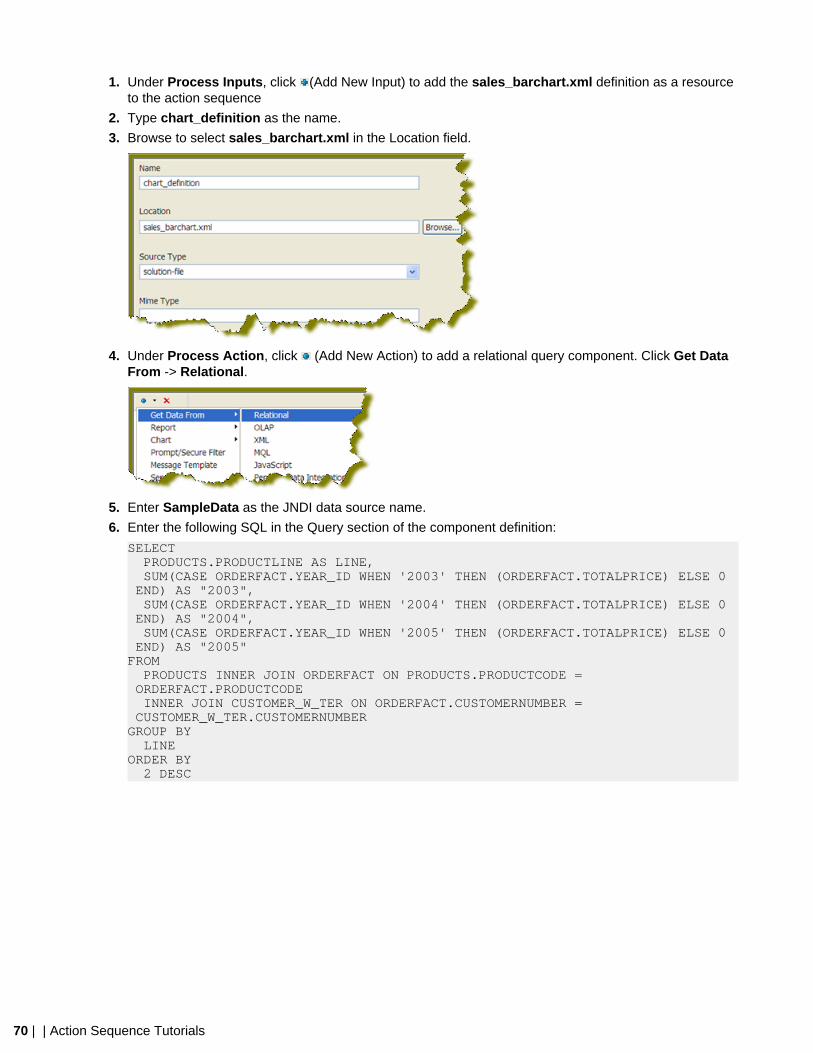
70 | | Action Sequence Tutorials
1. Under Process Inputs, click (Add New Input) to add the sales_barchart.xml definition as a resourceto the action sequence
2. Type chart_definition as the name.
3. Browse to select sales_barchart.xml in the Location field.
4. Under Process Action, click (Add New Action) to add a relational query component. Click Get DataFrom -> Relational.
5. Enter SampleData as the JNDI data source name.
6. Enter the following SQL in the Query section of the component definition:
SELECT PRODUCTS.PRODUCTLINE AS LINE, SUM(CASE ORDERFACT.YEAR_ID WHEN '2003' THEN (ORDERFACT.TOTALPRICE) ELSE 0 END) AS "2003", SUM(CASE ORDERFACT.YEAR_ID WHEN '2004' THEN (ORDERFACT.TOTALPRICE) ELSE 0 END) AS "2004", SUM(CASE ORDERFACT.YEAR_ID WHEN '2005' THEN (ORDERFACT.TOTALPRICE) ELSE 0 END) AS "2005"FROM PRODUCTS INNER JOIN ORDERFACT ON PRODUCTS.PRODUCTCODE = ORDERFACT.PRODUCTCODE INNER JOIN CUSTOMER_W_TER ON ORDERFACT.CUSTOMERNUMBER = CUSTOMER_W_TER.CUSTOMERNUMBERGROUP BY LINEORDER BY 2 DESC
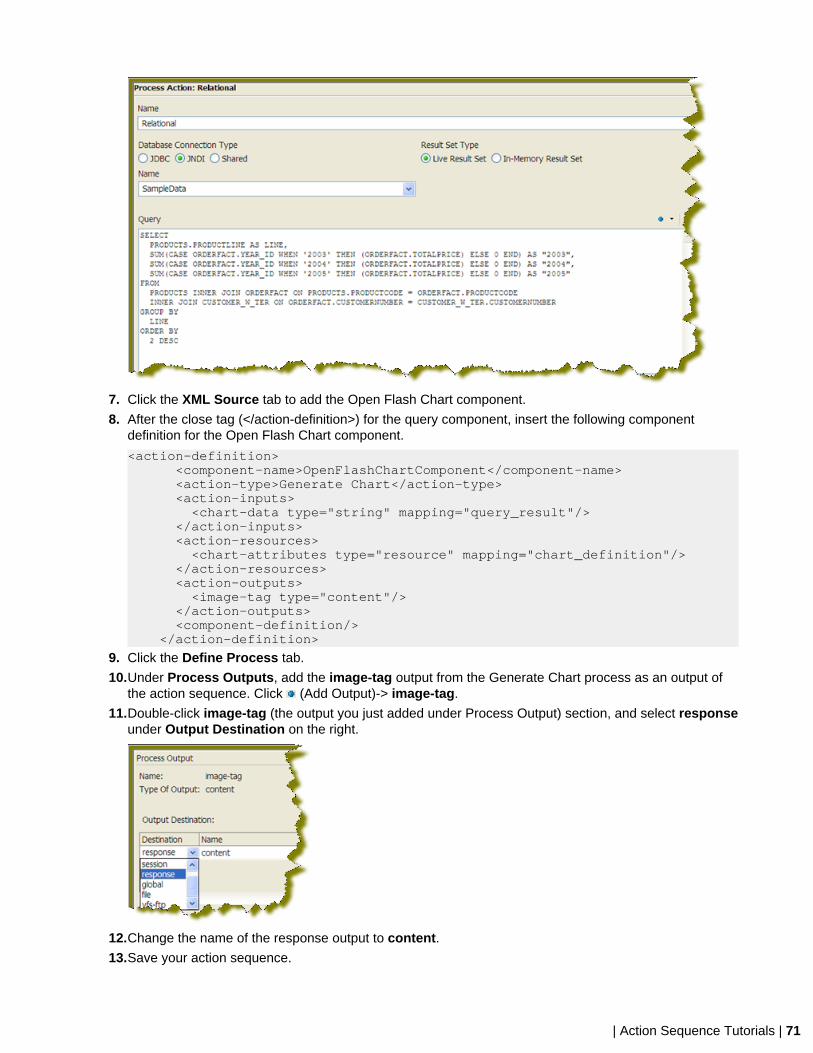
| Action Sequence Tutorials | 71
7. Click the XML Source tab to add the Open Flash Chart component.
8. After the close tag (</action-definition>) for the query component, insert the following componentdefinition for the Open Flash Chart component.
<action-definition> <component-name>OpenFlashChartComponent</component-name> <action-type>Generate Chart</action-type> <action-inputs> <chart-data type="string" mapping="query_result"/> </action-inputs> <action-resources> <chart-attributes type="resource" mapping="chart_definition"/> </action-resources> <action-outputs> <image-tag type="content"/> </action-outputs> <component-definition/> </action-definition>
9. Click the Define Process tab.
10.Under Process Outputs, add the image-tag output from the Generate Chart process as an output ofthe action sequence. Click (Add Output)-> image-tag.
11.Double-click image-tag (the output you just added under Process Output) section, and select responseunder Output Destination on the right.
12.Change the name of the response output to content.
13.Save your action sequence.
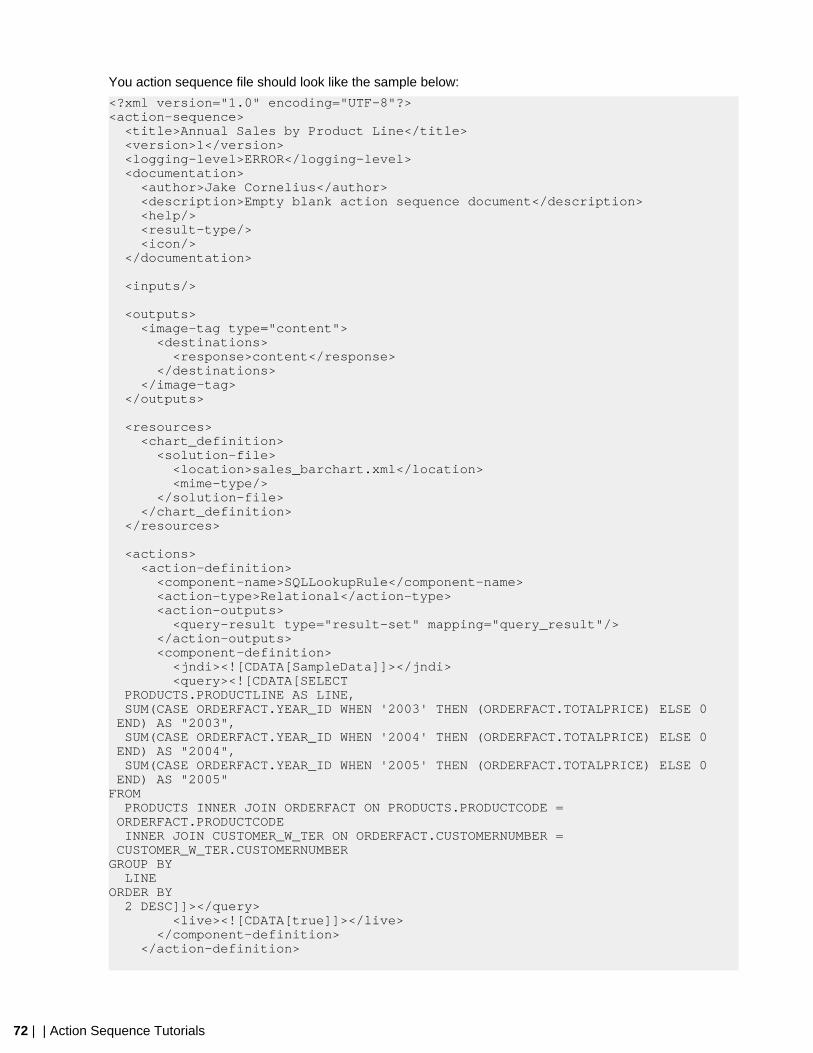
72 | | Action Sequence Tutorials
You action sequence file should look like the sample below:
<?xml version="1.0" encoding="UTF-8"?><action-sequence> <title>Annual Sales by Product Line</title> <version>1</version> <logging-level>ERROR</logging-level> <documentation> <author>Jake Cornelius</author> <description>Empty blank action sequence document</description> <help/> <result-type/> <icon/> </documentation>
<inputs/>
<outputs> <image-tag type="content"> <destinations> <response>content</response> </destinations> </image-tag> </outputs>
<resources> <chart_definition> <solution-file> <location>sales_barchart.xml</location> <mime-type/> </solution-file> </chart_definition> </resources> <actions> <action-definition> <component-name>SQLLookupRule</component-name> <action-type>Relational</action-type> <action-outputs> <query-result type="result-set" mapping="query_result"/> </action-outputs> <component-definition> <jndi><![CDATA[SampleData]]></jndi> <query><![CDATA[SELECT PRODUCTS.PRODUCTLINE AS LINE, SUM(CASE ORDERFACT.YEAR_ID WHEN '2003' THEN (ORDERFACT.TOTALPRICE) ELSE 0 END) AS "2003", SUM(CASE ORDERFACT.YEAR_ID WHEN '2004' THEN (ORDERFACT.TOTALPRICE) ELSE 0 END) AS "2004", SUM(CASE ORDERFACT.YEAR_ID WHEN '2005' THEN (ORDERFACT.TOTALPRICE) ELSE 0 END) AS "2005"FROM PRODUCTS INNER JOIN ORDERFACT ON PRODUCTS.PRODUCTCODE = ORDERFACT.PRODUCTCODE INNER JOIN CUSTOMER_W_TER ON ORDERFACT.CUSTOMERNUMBER = CUSTOMER_W_TER.CUSTOMERNUMBERGROUP BY LINEORDER BY 2 DESC]]></query> <live><![CDATA[true]]></live> </component-definition> </action-definition>
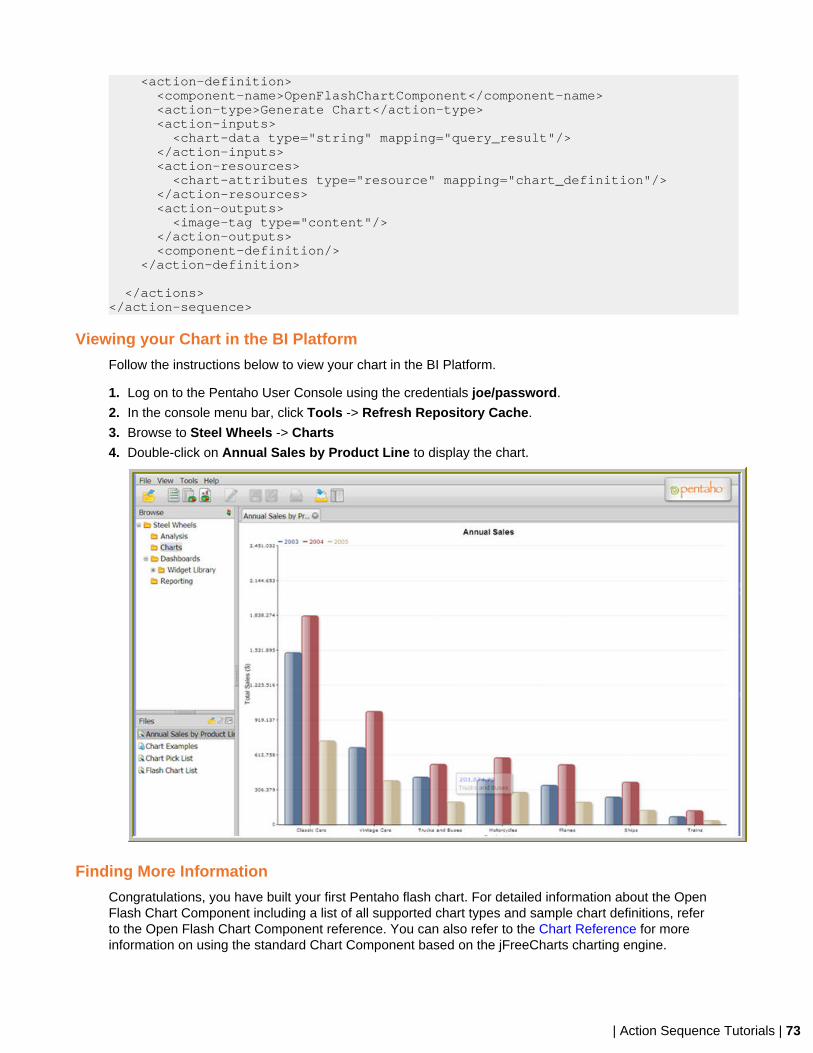
| Action Sequence Tutorials | 73
<action-definition> <component-name>OpenFlashChartComponent</component-name> <action-type>Generate Chart</action-type> <action-inputs> <chart-data type="string" mapping="query_result"/> </action-inputs> <action-resources> <chart-attributes type="resource" mapping="chart_definition"/> </action-resources> <action-outputs> <image-tag type="content"/> </action-outputs> <component-definition/> </action-definition> </actions> </action-sequence>
Viewing your Chart in the BI Platform
Follow the instructions below to view your chart in the BI Platform.
1. Log on to the Pentaho User Console using the credentials joe/password.
2. In the console menu bar, click Tools -> Refresh Repository Cache.
3. Browse to Steel Wheels -> Charts
4. Double-click on Annual Sales by Product Line to display the chart.
Finding More Information
Congratulations, you have built your first Pentaho flash chart. For detailed information about the OpenFlash Chart Component including a list of all supported chart types and sample chart definitions, referto the Open Flash Chart Component reference. You can also refer to the Chart Reference for moreinformation on using the standard Chart Component based on the jFreeCharts charting engine.
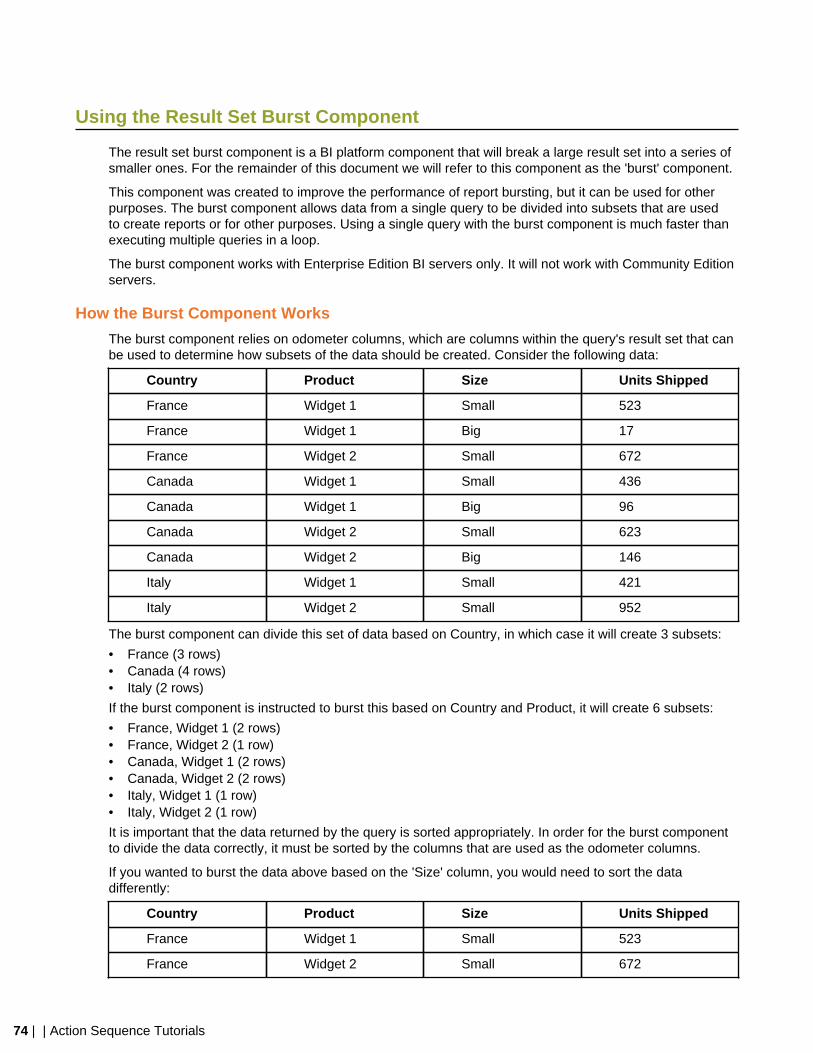
74 | | Action Sequence Tutorials
Using the Result Set Burst Component
The result set burst component is a BI platform component that will break a large result set into a series ofsmaller ones. For the remainder of this document we will refer to this component as the 'burst' component.
This component was created to improve the performance of report bursting, but it can be used for otherpurposes. The burst component allows data from a single query to be divided into subsets that are usedto create reports or for other purposes. Using a single query with the burst component is much faster thanexecuting multiple queries in a loop.
The burst component works with Enterprise Edition BI servers only. It will not work with Community Editionservers.
How the Burst Component Works
The burst component relies on odometer columns, which are columns within the query's result set that canbe used to determine how subsets of the data should be created. Consider the following data:
Country Product Size Units Shipped
France Widget 1 Small 523
France Widget 1 Big 17
France Widget 2 Small 672
Canada Widget 1 Small 436
Canada Widget 1 Big 96
Canada Widget 2 Small 623
Canada Widget 2 Big 146
Italy Widget 1 Small 421
Italy Widget 2 Small 952
The burst component can divide this set of data based on Country, in which case it will create 3 subsets:
• France (3 rows)• Canada (4 rows)• Italy (2 rows)
If the burst component is instructed to burst this based on Country and Product, it will create 6 subsets:
• France, Widget 1 (2 rows)• France, Widget 2 (1 row)• Canada, Widget 1 (2 rows)• Canada, Widget 2 (2 rows)• Italy, Widget 1 (1 row)• Italy, Widget 2 (1 row)
It is important that the data returned by the query is sorted appropriately. In order for the burst componentto divide the data correctly, it must be sorted by the columns that are used as the odometer columns.
If you wanted to burst the data above based on the 'Size' column, you would need to sort the datadifferently:
Country Product Size Units Shipped
France Widget 1 Small 523
France Widget 2 Small 672
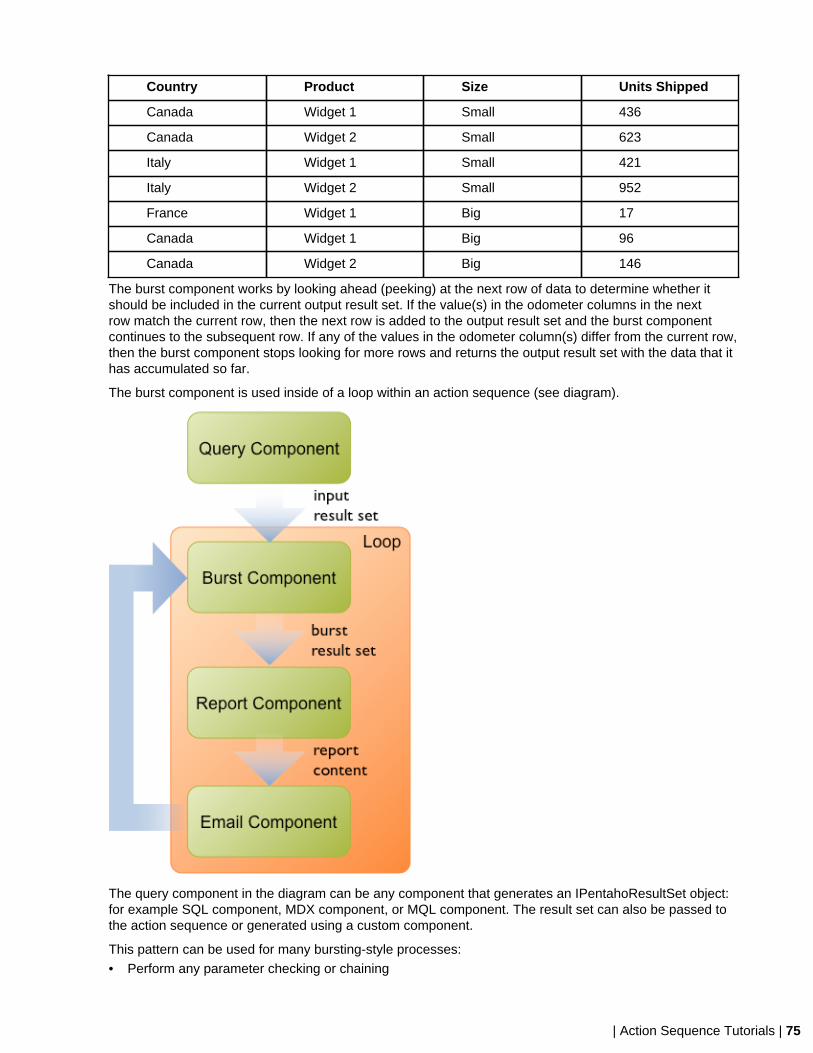
| Action Sequence Tutorials | 75
Country Product Size Units Shipped
Canada Widget 1 Small 436
Canada Widget 2 Small 623
Italy Widget 1 Small 421
Italy Widget 2 Small 952
France Widget 1 Big 17
Canada Widget 1 Big 96
Canada Widget 2 Big 146
The burst component works by looking ahead (peeking) at the next row of data to determine whether itshould be included in the current output result set. If the value(s) in the odometer columns in the nextrow match the current row, then the next row is added to the output result set and the burst componentcontinues to the subsequent row. If any of the values in the odometer column(s) differ from the current row,then the burst component stops looking for more rows and returns the output result set with the data that ithas accumulated so far.
The burst component is used inside of a loop within an action sequence (see diagram).
The query component in the diagram can be any component that generates an IPentahoResultSet object:for example SQL component, MDX component, or MQL component. The result set can also be passed tothe action sequence or generated using a custom component.
This pattern can be used for many bursting-style processes:
• Perform any parameter checking or chaining
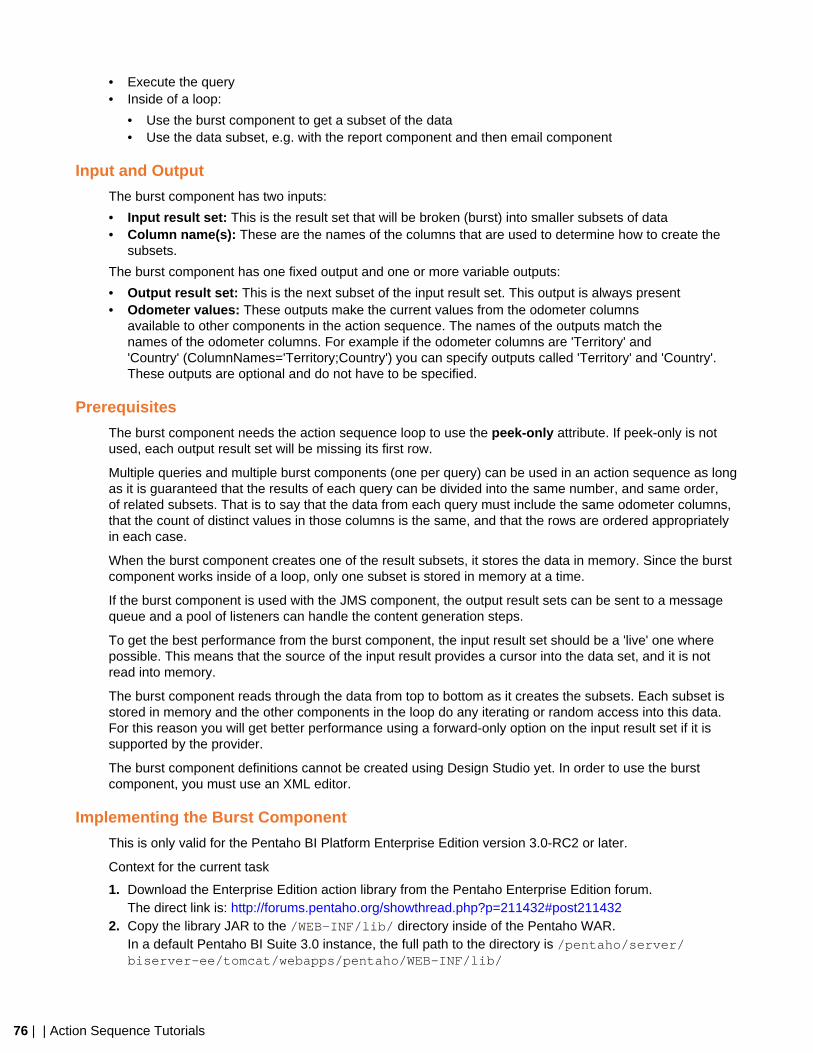
76 | | Action Sequence Tutorials
• Execute the query• Inside of a loop:
• Use the burst component to get a subset of the data• Use the data subset, e.g. with the report component and then email component
Input and Output
The burst component has two inputs:
• Input result set: This is the result set that will be broken (burst) into smaller subsets of data• Column name(s): These are the names of the columns that are used to determine how to create the
subsets.
The burst component has one fixed output and one or more variable outputs:
• Output result set: This is the next subset of the input result set. This output is always present• Odometer values: These outputs make the current values from the odometer columns
available to other components in the action sequence. The names of the outputs match thenames of the odometer columns. For example if the odometer columns are 'Territory' and'Country' (ColumnNames='Territory;Country') you can specify outputs called 'Territory' and 'Country'.These outputs are optional and do not have to be specified.
Prerequisites
The burst component needs the action sequence loop to use the peek-only attribute. If peek-only is notused, each output result set will be missing its first row.
Multiple queries and multiple burst components (one per query) can be used in an action sequence as longas it is guaranteed that the results of each query can be divided into the same number, and same order,of related subsets. That is to say that the data from each query must include the same odometer columns,that the count of distinct values in those columns is the same, and that the rows are ordered appropriatelyin each case.
When the burst component creates one of the result subsets, it stores the data in memory. Since the burstcomponent works inside of a loop, only one subset is stored in memory at a time.
If the burst component is used with the JMS component, the output result sets can be sent to a messagequeue and a pool of listeners can handle the content generation steps.
To get the best performance from the burst component, the input result set should be a 'live' one wherepossible. This means that the source of the input result provides a cursor into the data set, and it is notread into memory.
The burst component reads through the data from top to bottom as it creates the subsets. Each subset isstored in memory and the other components in the loop do any iterating or random access into this data.For this reason you will get better performance using a forward-only option on the input result set if it issupported by the provider.
The burst component definitions cannot be created using Design Studio yet. In order to use the burstcomponent, you must use an XML editor.
Implementing the Burst Component
This is only valid for the Pentaho BI Platform Enterprise Edition version 3.0-RC2 or later.
Context for the current task
1. Download the Enterprise Edition action library from the Pentaho Enterprise Edition forum.The direct link is: http://forums.pentaho.org/showthread.php?p=211432#post211432
2. Copy the library JAR to the /WEB-INF/lib/ directory inside of the Pentaho WAR.In a default Pentaho BI Suite 3.0 instance, the full path to the directory is /pentaho/server/biserver-ee/tomcat/webapps/pentaho/WEB-INF/lib/
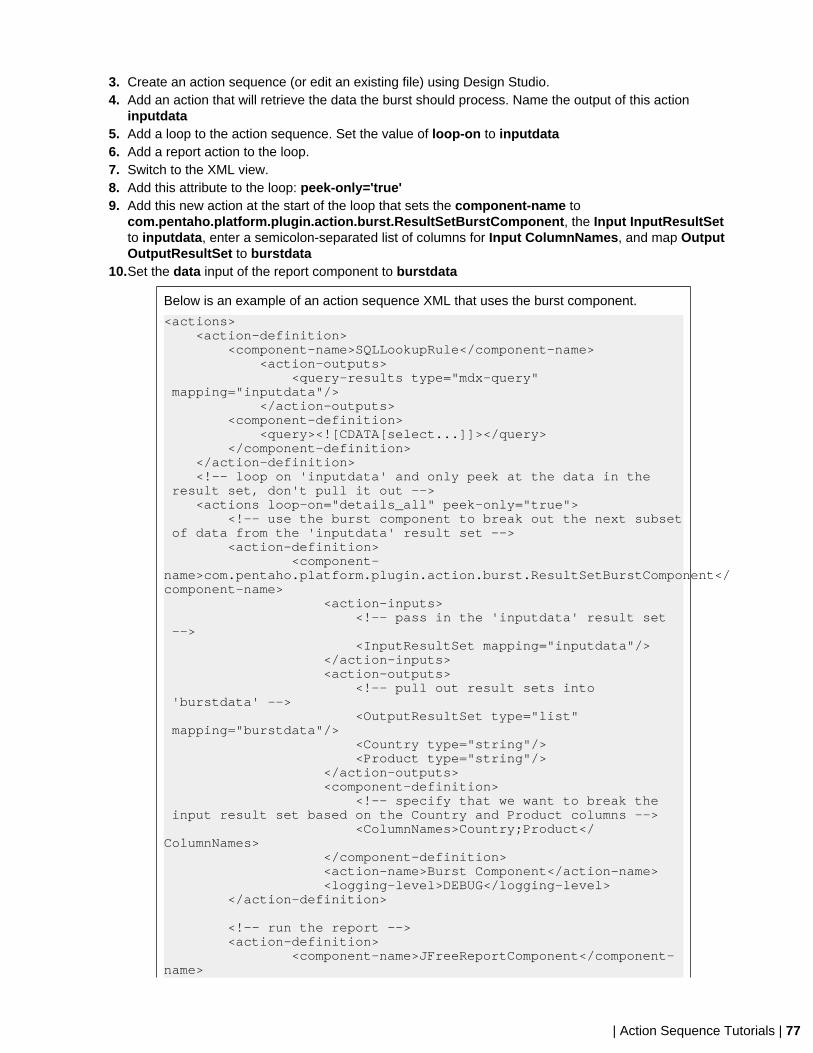
| Action Sequence Tutorials | 77
3. Create an action sequence (or edit an existing file) using Design Studio.4. Add an action that will retrieve the data the burst should process. Name the output of this action
inputdata5. Add a loop to the action sequence. Set the value of loop-on to inputdata6. Add a report action to the loop.7. Switch to the XML view.8. Add this attribute to the loop: peek-only='true'9. Add this new action at the start of the loop that sets the component-name to
com.pentaho.platform.plugin.action.burst.ResultSetBurstComponent, the Input InputResultSetto inputdata, enter a semicolon-separated list of columns for Input ColumnNames, and map OutputOutputResultSet to burstdata
10.Set the data input of the report component to burstdata
Below is an example of an action sequence XML that uses the burst component.
<actions> <action-definition> <component-name>SQLLookupRule</component-name> <action-outputs> <query-results type="mdx-query" mapping="inputdata"/> </action-outputs> <component-definition> <query><![CDATA[select...]]></query> </component-definition> </action-definition> <!-- loop on 'inputdata' and only peek at the data in the result set, don't pull it out --> <actions loop-on="details_all" peek-only="true"> <!-- use the burst component to break out the next subset of data from the 'inputdata' result set --> <action-definition> <component-name>com.pentaho.platform.plugin.action.burst.ResultSetBurstComponent</component-name> <action-inputs> <!-- pass in the 'inputdata' result set --> <InputResultSet mapping="inputdata"/> </action-inputs> <action-outputs> <!-- pull out result sets into 'burstdata' --> <OutputResultSet type="list" mapping="burstdata"/> <Country type="string"/> <Product type="string"/> </action-outputs> <component-definition> <!-- specify that we want to break the input result set based on the Country and Product columns --> <ColumnNames>Country;Product</ColumnNames> </component-definition> <action-name>Burst Component</action-name> <logging-level>DEBUG</logging-level> </action-definition> <!-- run the report --> <action-definition> <component-name>JFreeReportComponent</component-name>
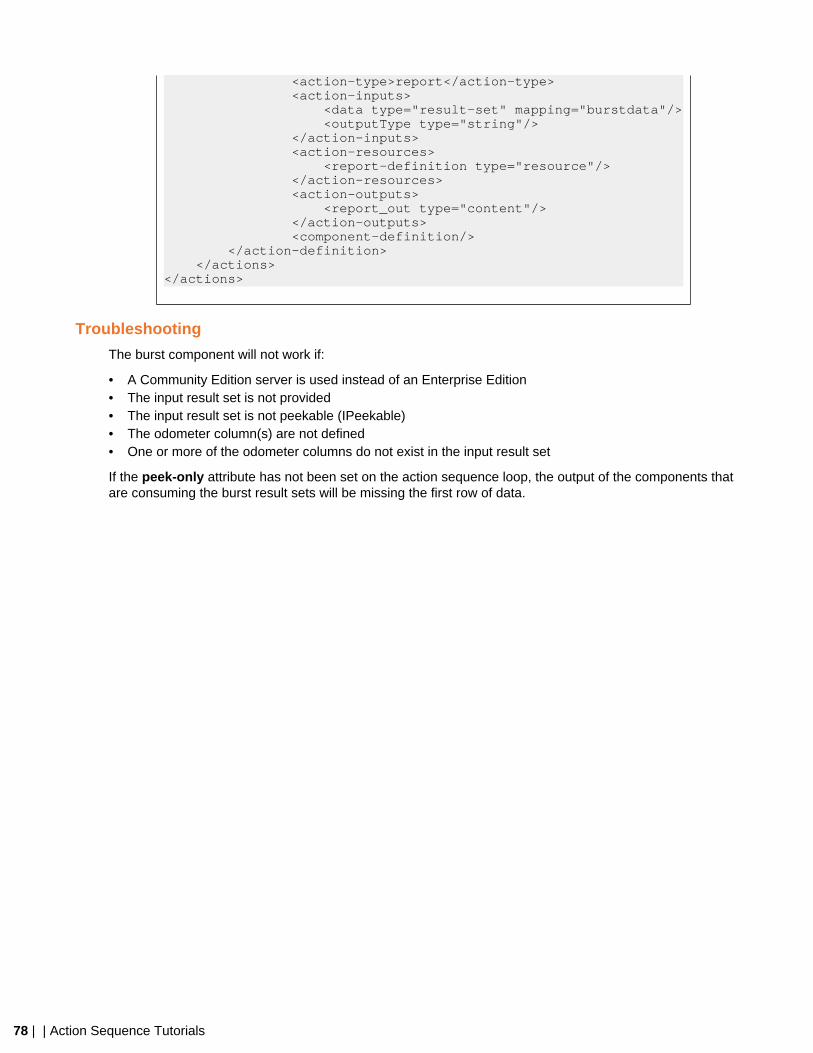
78 | | Action Sequence Tutorials
<action-type>report</action-type> <action-inputs> <data type="result-set" mapping="burstdata"/> <outputType type="string"/> </action-inputs> <action-resources> <report-definition type="resource"/> </action-resources> <action-outputs> <report_out type="content"/> </action-outputs> <component-definition/> </action-definition> </actions></actions>
Troubleshooting
The burst component will not work if:
• A Community Edition server is used instead of an Enterprise Edition• The input result set is not provided• The input result set is not peekable (IPeekable)• The odometer column(s) are not defined• One or more of the odometer columns do not exist in the input result set
If the peek-only attribute has not been set on the action sequence loop, the output of the components thatare consuming the burst result sets will be missing the first row of data.