Embed Size (px)
Citation preview
Page | 1
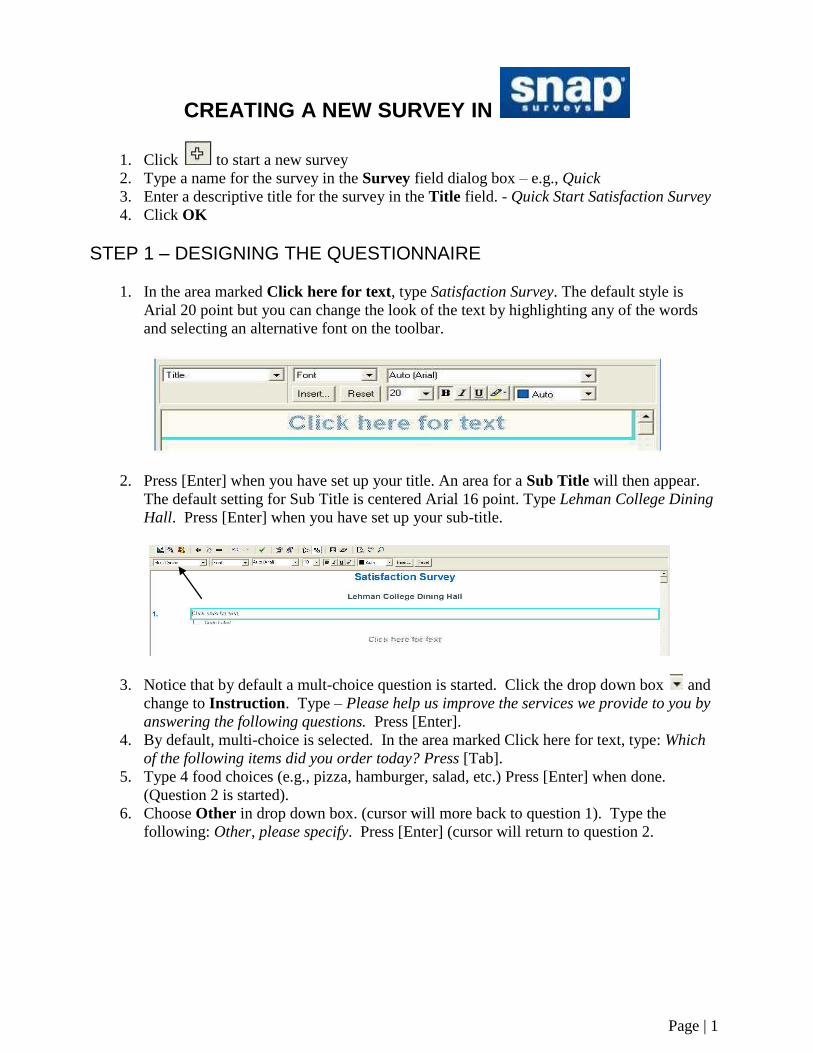
CREATING A NEW SURVEY IN
1. Click to start a new survey
2. Type a name for the survey in the Survey field dialog box – e.g., Quick
3. Enter a descriptive title for the survey in the Title field. - Quick Start Satisfaction Survey
4. Click OK
STEP 1 – DESIGNING THE QUESTIONNAIRE
1. In the area marked Click here for text, type Satisfaction Survey. The default style is
Arial 20 point but you can change the look of the text by highlighting any of the words
and selecting an alternative font on the toolbar.
2. Press [Enter] when you have set up your title. An area for a Sub Title will then appear.
The default setting for Sub Title is centered Arial 16 point. Type Lehman College Dining
Hall. Press [Enter] when you have set up your sub-title.
3. Notice that by default a mult-choice question is started. Click the drop down box and
change to Instruction. Type – Please help us improve the services we provide to you by
answering the following questions. Press [Enter].
4. By default, multi-choice is selected. In the area marked Click here for text, type: Which
of the following items did you order today? Press [Tab].
5. Type 4 food choices (e.g., pizza, hamburger, salad, etc.) Press [Enter] when done.
(Question 2 is started).
6. Choose Other in drop down box. (cursor will more back to question 1). Type the
following: Other, please specify. Press [Enter] (cursor will return to question 2.
Page | 2
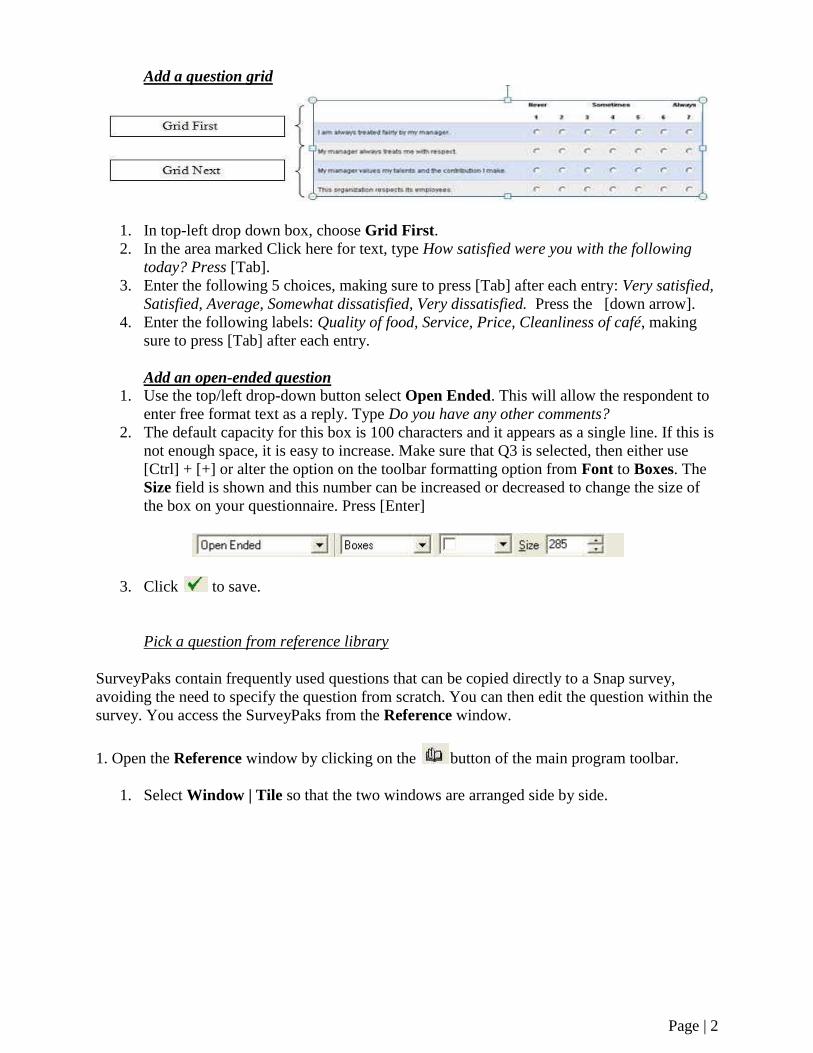
Add a question grid
1. In top-left drop down box, choose Grid First.
2. In the area marked Click here for text, type How satisfied were you with the following
today? Press [Tab].
3. Enter the following 5 choices, making sure to press [Tab] after each entry: Very satisfied,
Satisfied, Average, Somewhat dissatisfied, Very dissatisfied. Press the [down arrow].
4. Enter the following labels: Quality of food, Service, Price, Cleanliness of café, making
sure to press [Tab] after each entry.
Add an open-ended question
1. Use the top/left drop-down button select Open Ended. This will allow the respondent to
enter free format text as a reply. Type Do you have any other comments?
2. The default capacity for this box is 100 characters and it appears as a single line. If this is
not enough space, it is easy to increase. Make sure that Q3 is selected, then either use
[Ctrl] + [+] or alter the option on the toolbar formatting option from Font to Boxes. The
Size field is shown and this number can be increased or decreased to change the size of
the box on your questionnaire. Press [Enter]
3. Click to save.
Pick a question from reference library
SurveyPaks contain frequently used questions that can be copied directly to a Snap survey,
avoiding the need to specify the question from scratch. You can then edit the question within the
survey. You access the SurveyPaks from the Reference window.
1. Open the Reference window by clicking on the button of the main program toolbar.
1. Select Window | Tile so that the two windows are arranged side by side.
Page | 3
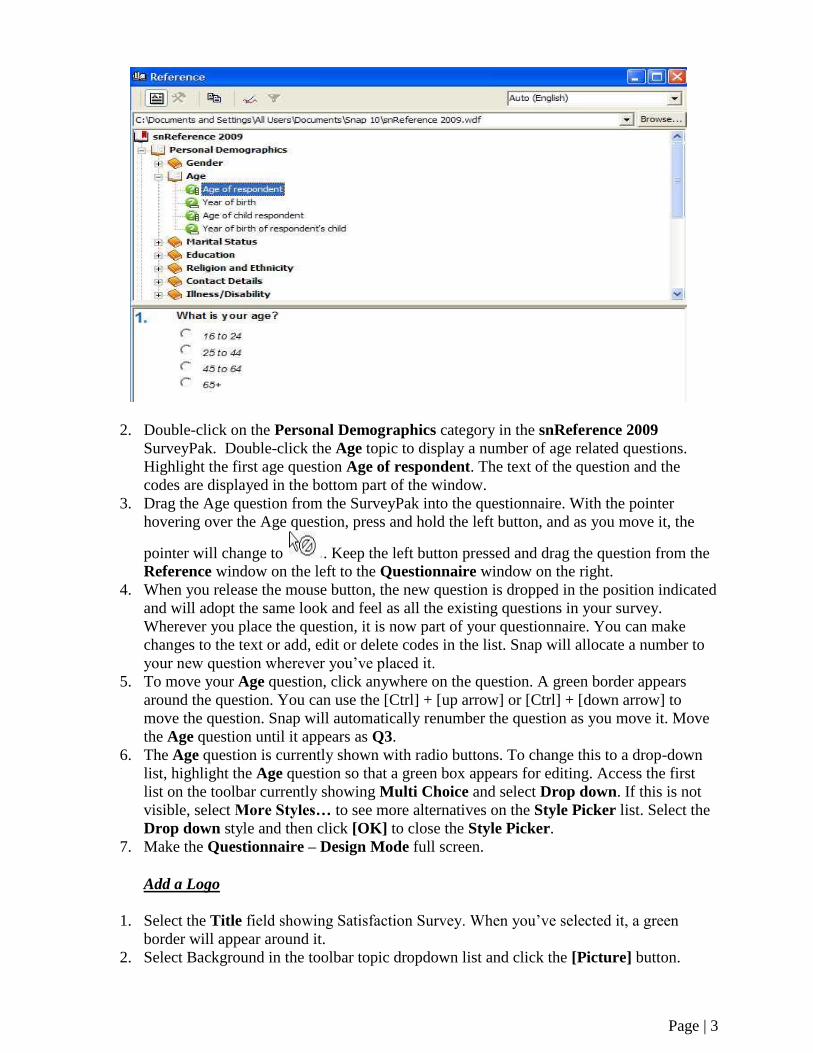
2. Double-click on the Personal Demographics category in the snReference 2009
SurveyPak. Double-click the Age topic to display a number of age related questions.
Highlight the first age question Age of respondent. The text of the question and the
codes are displayed in the bottom part of the window.
3. Drag the Age question from the SurveyPak into the questionnaire. With the pointer
hovering over the Age question, press and hold the left button, and as you move it, the
pointer will change to . Keep the left button pressed and drag the question from the
Reference window on the left to the Questionnaire window on the right.
4. When you release the mouse button, the new question is dropped in the position indicated
and will adopt the same look and feel as all the existing questions in your survey.
Wherever you place the question, it is now part of your questionnaire. You can make
changes to the text or add, edit or delete codes in the list. Snap will allocate a number to
your new question wherever you’ve placed it.
5. To move your Age question, click anywhere on the question. A green border appears
around the question. You can use the [Ctrl] + [up arrow] or [Ctrl] + [down arrow] to
move the question. Snap will automatically renumber the question as you move it. Move
the Age question until it appears as Q3.
6. The Age question is currently shown with radio buttons. To change this to a drop-down
list, highlight the Age question so that a green box appears for editing. Access the first
list on the toolbar currently showing Multi Choice and select Drop down. If this is not
visible, select More Styles… to see more alternatives on the Style Picker list. Select the
Drop down style and then click [OK] to close the Style Picker.
7. Make the Questionnaire – Design Mode full screen.
Add a Logo
1. Select the Title field showing Satisfaction Survey. When you’ve selected it, a green
border will appear around it.
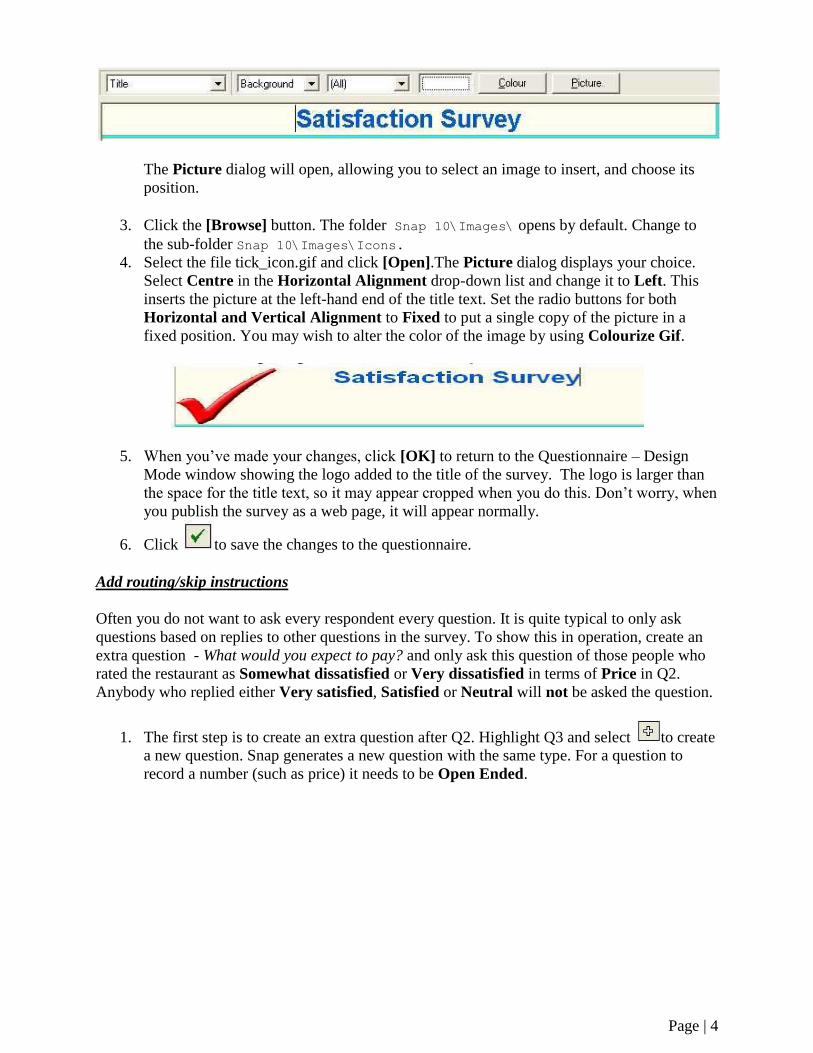
2. Select Background in the toolbar topic dropdown list and click the [Picture] button.
Page | 4
The Picture dialog will open, allowing you to select an image to insert, and choose its
position.
3. Click the [Browse] button. The folder Snap 10\Images\ opens by default. Change to
the sub-folder Snap 10\Images\Icons.
4. Select the file tick_icon.gif and click [Open].The Picture dialog displays your choice.
Select Centre in the Horizontal Alignment drop-down list and change it to Left. This
inserts the picture at the left-hand end of the title text. Set the radio buttons for both
Horizontal and Vertical Alignment to Fixed to put a single copy of the picture in a
fixed position. You may wish to alter the color of the image by using Colourize Gif.
5. When you’ve made your changes, click [OK] to return to the Questionnaire – Design
Mode window showing the logo added to the title of the survey. The logo is larger than
the space for the title text, so it may appear cropped when you do this. Don’t worry, when
you publish the survey as a web page, it will appear normally.
6. Click to save the changes to the questionnaire.
Add routing/skip instructions
Often you do not want to ask every respondent every question. It is quite typical to only ask
questions based on replies to other questions in the survey. To show this in operation, create an
extra question - What would you expect to pay? and only ask this question of those people who
rated the restaurant as Somewhat dissatisfied or Very dissatisfied in terms of Price in Q2.
Anybody who replied either Very satisfied, Satisfied or Neutral will not be asked the question.
1. The first step is to create an extra question after Q2. Highlight Q3 and select to create
a new question. Snap generates a new question with the same type. For a question to
record a number (such as price) it needs to be Open Ended.
Page | 5
2. On the Toolbar options, alter the style from Drop down to Open Ended to allow any
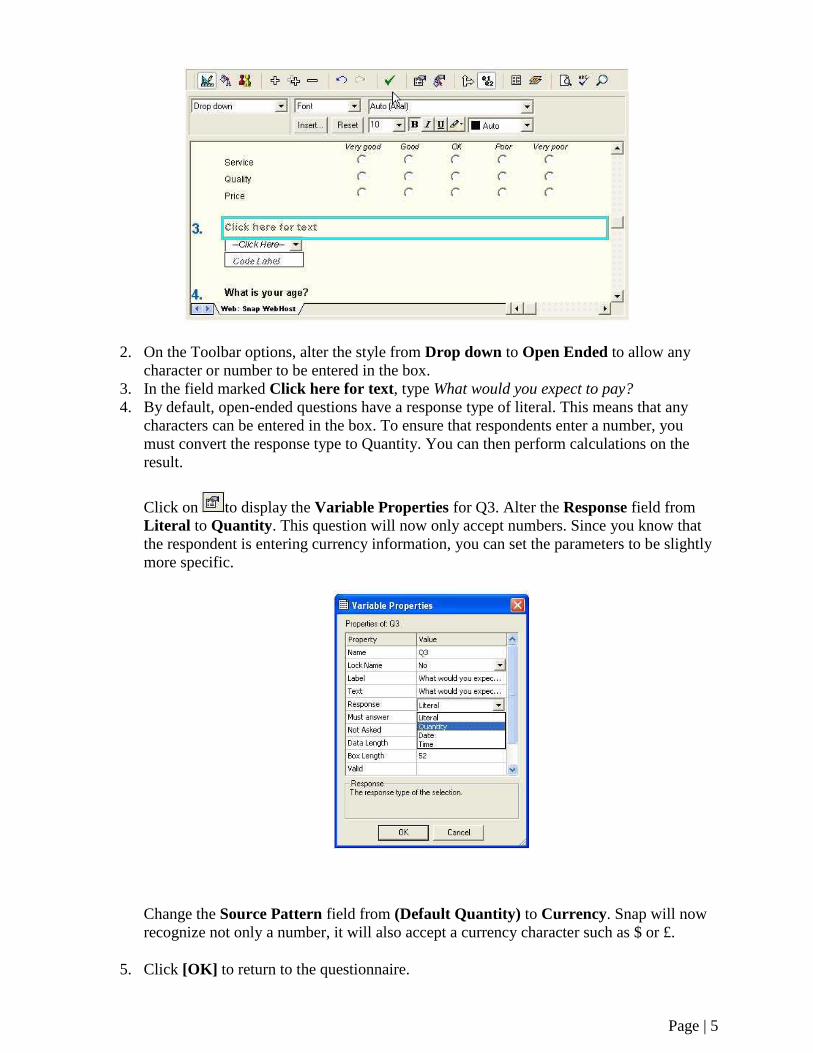
character or number to be entered in the box.
3. In the field marked Click here for text, type What would you expect to pay?
4. By default, open-ended questions have a response type of literal. This means that any
characters can be entered in the box. To ensure that respondents enter a number, you
must convert the response type to Quantity. You can then perform calculations on the
result.
Click on to display the Variable Properties for Q3. Alter the Response field from
Literal to Quantity. This question will now only accept numbers. Since you know that
the respondent is entering currency information, you can set the parameters to be slightly
more specific.
Change the Source Pattern field from (Default Quantity) to Currency. Snap will now
recognize not only a number, it will also accept a currency character such as $ or £.
5. Click [OK] to return to the questionnaire.
Page | 6
Now to create the routing rules…
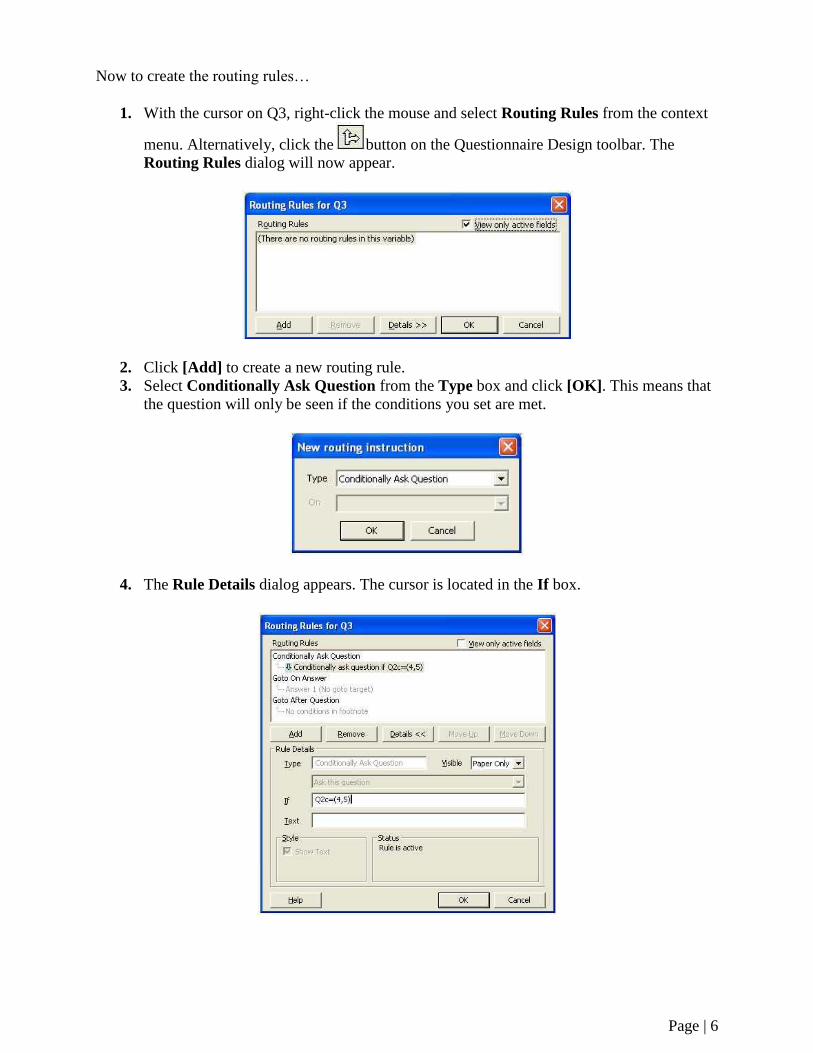
1. With the cursor on Q3, right-click the mouse and select Routing Rules from the context
menu. Alternatively, click the button on the Questionnaire Design toolbar. The
Routing Rules dialog will now appear.
2. Click [Add] to create a new routing rule.
3. Select Conditionally Ask Question from the Type box and click [OK]. This means that
the question will only be seen if the conditions you set are met.
4. The Rule Details dialog appears. The cursor is located in the If box.

Page | 7
5. Type Q2c=(4,5). This means that the question will be shown if the answer to Q2c (price
rating, the third part of Q2) is code 4 or 5 (Somewhat dissatisfied or Very dissatisfied).
Click [OK].
6. A small arrow appears to the left of the question. You can double-click it to see the Rule
Details dialog.
7. Press [Ctrl] + [S] to insert a page break above this question. Alternatively, you can
choose Break in the second drop-down box at the top of the screen and check the Page
break box. Repeat the process to add a page break to Q4. Save the changes to your
questionnaire.
Page | 8
STEP 2 – PUBLISHING THE QUESTIONAIRE
Three Step process:
1. Publish
2. Upload
3. Make available
Step 1 – Publish Survey
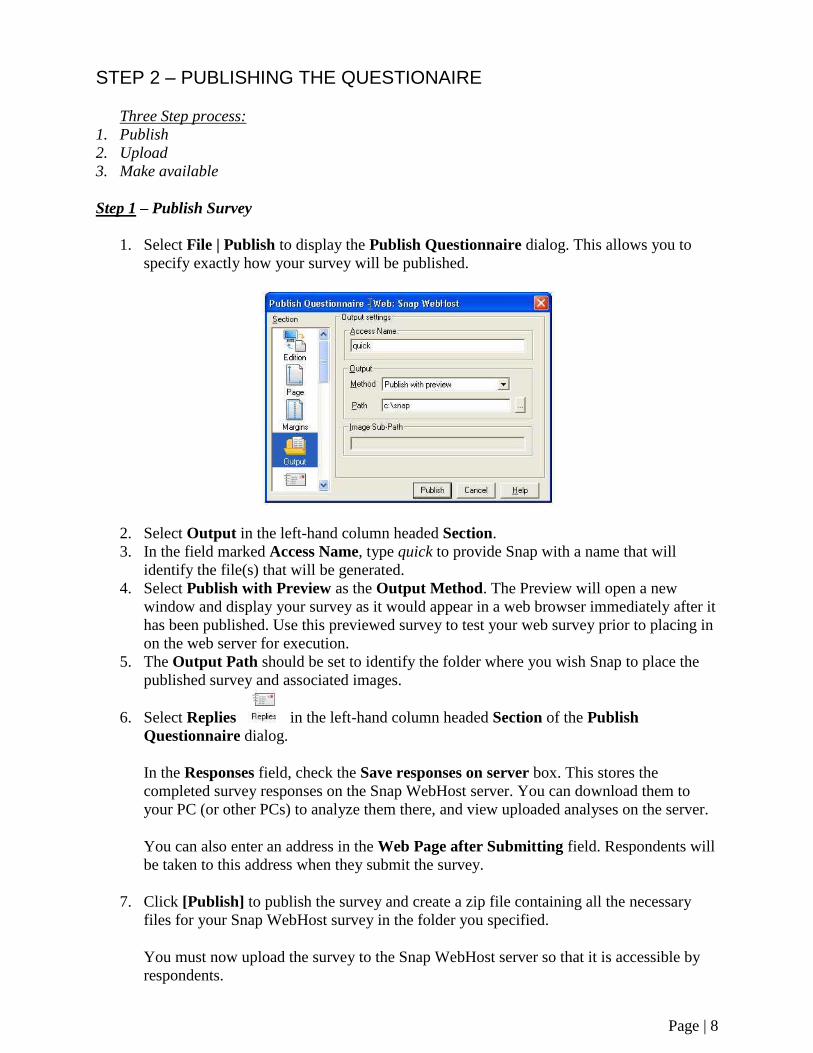
1. Select File | Publish to display the Publish Questionnaire dialog. This allows you to
specify exactly how your survey will be published.
2. Select Output in the left-hand column headed Section.
3. In the field marked Access Name, type quick to provide Snap with a name that will
identify the file(s) that will be generated.
4. Select Publish with Preview as the Output Method. The Preview will open a new
window and display your survey as it would appear in a web browser immediately after it
has been published. Use this previewed survey to test your web survey prior to placing in
on the web server for execution.
5. The Output Path should be set to identify the folder where you wish Snap to place the
published survey and associated images.
6. Select Replies in the left-hand column headed Section of the Publish
Questionnaire dialog.
In the Responses field, check the Save responses on server box. This stores the
completed survey responses on the Snap WebHost server. You can download them to
your PC (or other PCs) to analyze them there, and view uploaded analyses on the server.
You can also enter an address in the Web Page after Submitting field. Respondents will
be taken to this address when they submit the survey.
7. Click [Publish] to publish the survey and create a zip file containing all the necessary
files for your Snap WebHost survey in the folder you specified.
You must now upload the survey to the Snap WebHost server so that it is accessible by
respondents.
Page | 9
Step 2 - Upload the published survey to server
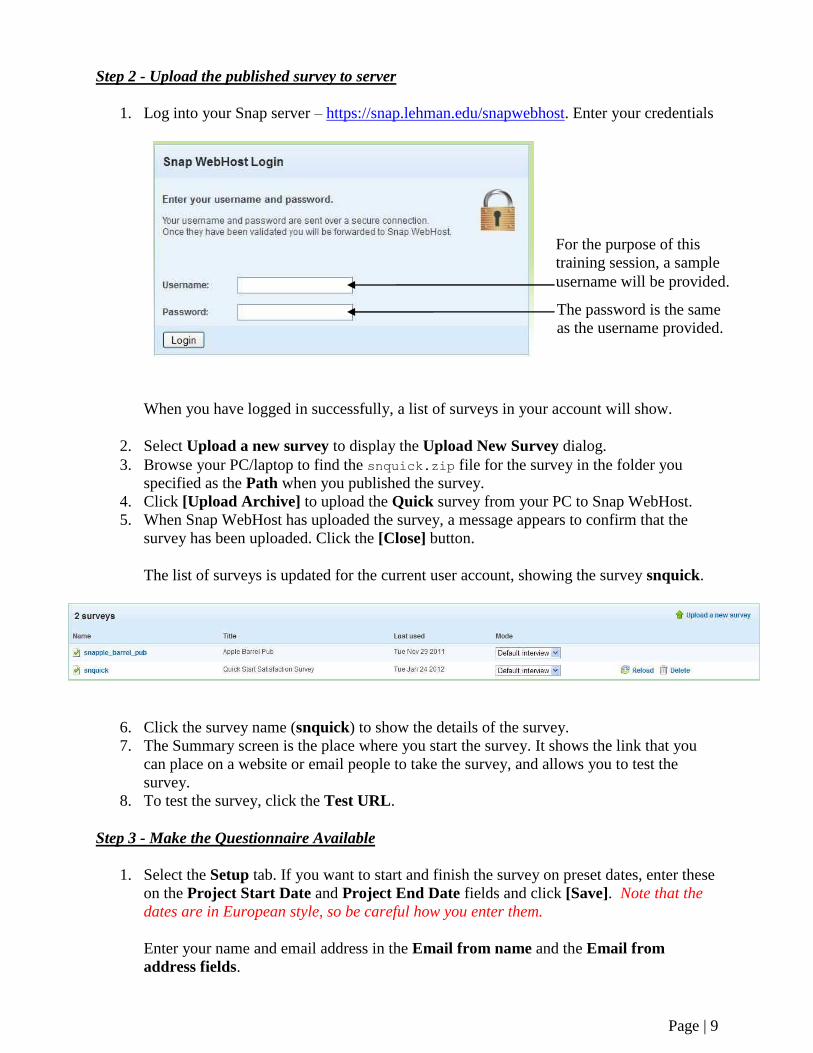
1. Log into your Snap server – https://snap.lehman.edu/snapwebhost. Enter your credentials
When you have logged in successfully, a list of surveys in your account will show.
2. Select Upload a new survey to display the Upload New Survey dialog.
3. Browse your PC/laptop to find the snquick.zip file for the survey in the folder you
specified as the Path when you published the survey.
4. Click [Upload Archive] to upload the Quick survey from your PC to Snap WebHost.
5. When Snap WebHost has uploaded the survey, a message appears to confirm that the
survey has been uploaded. Click the [Close] button.
The list of surveys is updated for the current user account, showing the survey snquick.
6. Click the survey name (snquick) to show the details of the survey.
7. The Summary screen is the place where you start the survey. It shows the link that you
can place on a website or email people to take the survey, and allows you to test the
survey.
8. To test the survey, click the Test URL.
Step 3 - Make the Questionnaire Available
1. Select the Setup tab. If you want to start and finish the survey on preset dates, enter these
on the Project Start Date and Project End Date fields and click [Save]. Note that the
dates are in European style, so be careful how you enter them.
Enter your name and email address in the Email from name and the Email from
address fields.
For the purpose of this
training session, a sample
username will be provided.
The password is the same
as the username provided.
Page | 10
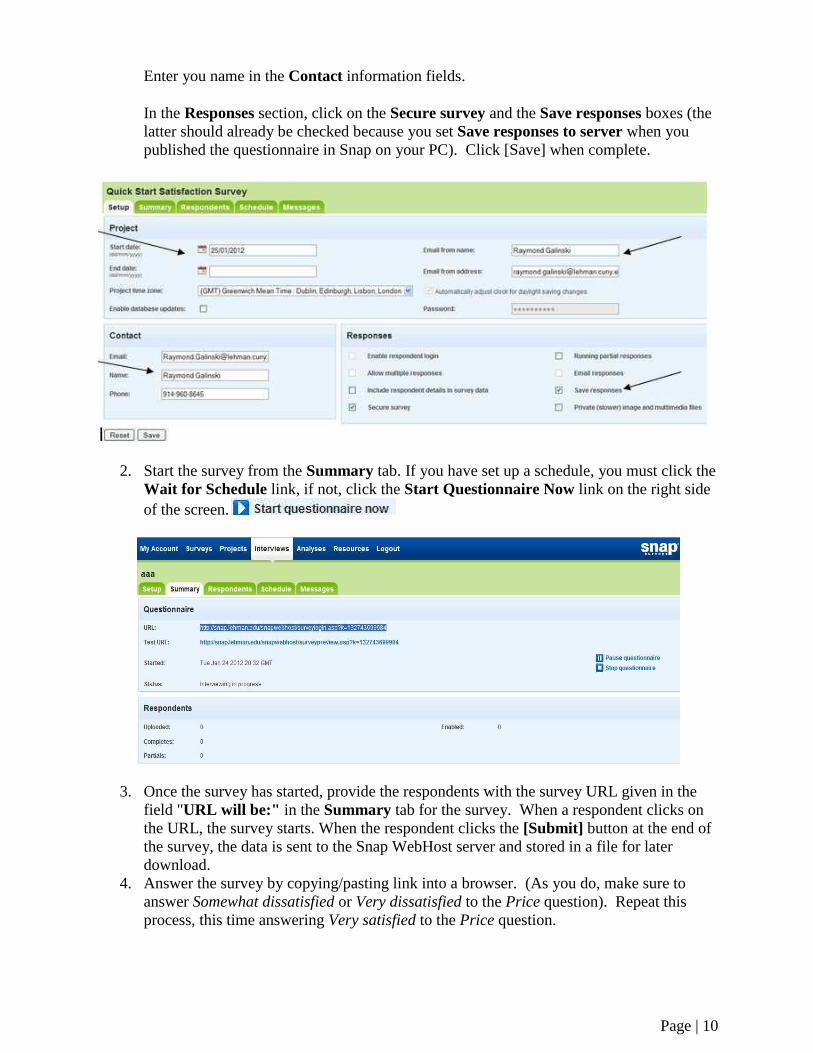
Enter you name in the Contact information fields.
In the Responses section, click on the Secure survey and the Save responses boxes (the
latter should already be checked because you set Save responses to server when you
published the questionnaire in Snap on your PC). Click [Save] when complete.
2. Start the survey from the Summary tab. If you have set up a schedule, you must click the
Wait for Schedule link, if not, click the Start Questionnaire Now link on the right side
of the screen.
3. Once the survey has started, provide the respondents with the survey URL given in the
field "URL will be:" in the Summary tab for the survey. When a respondent clicks on
the URL, the survey starts. When the respondent clicks the [Submit] button at the end of
the survey, the data is sent to the Snap WebHost server and stored in a file for later
download.
4. Answer the survey by copying/pasting link into a browser. (As you do, make sure to
answer Somewhat dissatisfied or Very dissatisfied to the Price question). Repeat this
process, this time answering Very satisfied to the Price question.
Page | 11
STEP 3 – COLLECTING AND ANALYZING RESULTS
Collecting Results
Once you've created your questionnaire, published it, and made it available you're ready to
analyze the replies. The responses have been stored on the Snap WebHost server. You can either
download them to your PC for analysis or view analyses on Snap WebHost.
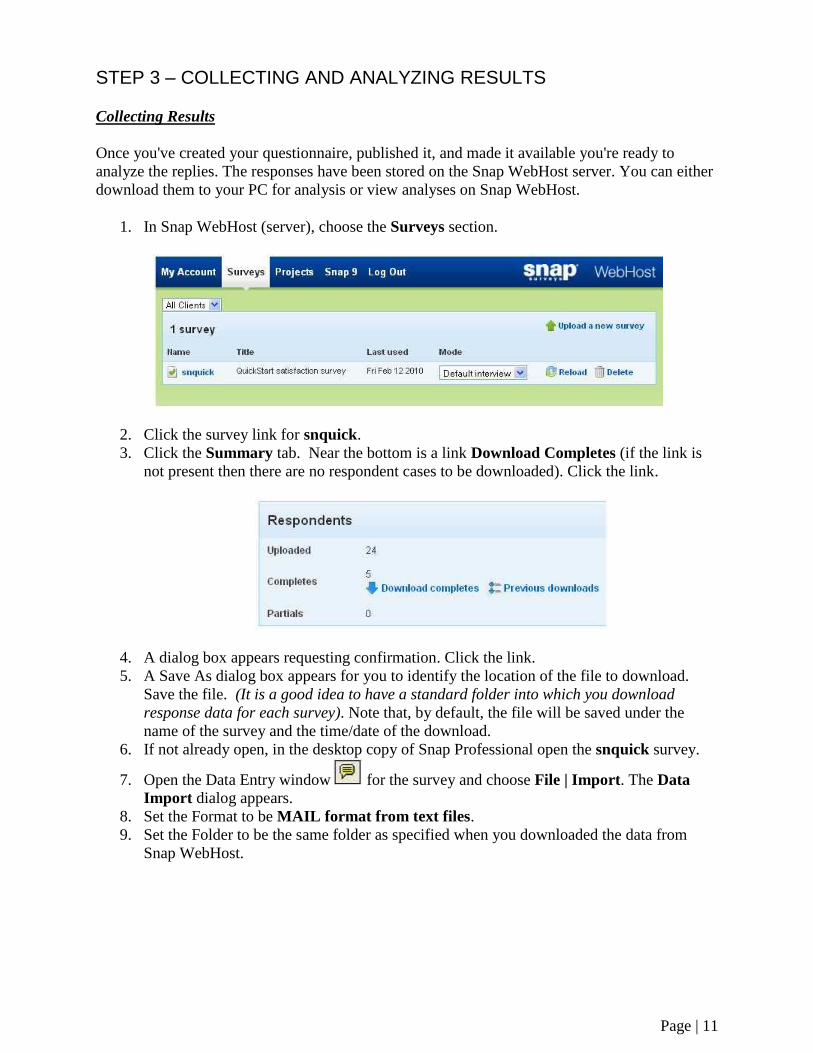
1. In Snap WebHost (server), choose the Surveys section.
2. Click the survey link for snquick.
3. Click the Summary tab. Near the bottom is a link Download Completes (if the link is
not present then there are no respondent cases to be downloaded). Click the link.
4. A dialog box appears requesting confirmation. Click the link.
5. A Save As dialog box appears for you to identify the location of the file to download.
Save the file. (It is a good idea to have a standard folder into which you download
response data for each survey). Note that, by default, the file will be saved under the
name of the survey and the time/date of the download.
6. If not already open, in the desktop copy of Snap Professional open the snquick survey.
7. Open the Data Entry window for the survey and choose File | Import. The Data
Import dialog appears.
8. Set the Format to be MAIL format from text files.
9. Set the Folder to be the same folder as specified when you downloaded the data from
Snap WebHost.
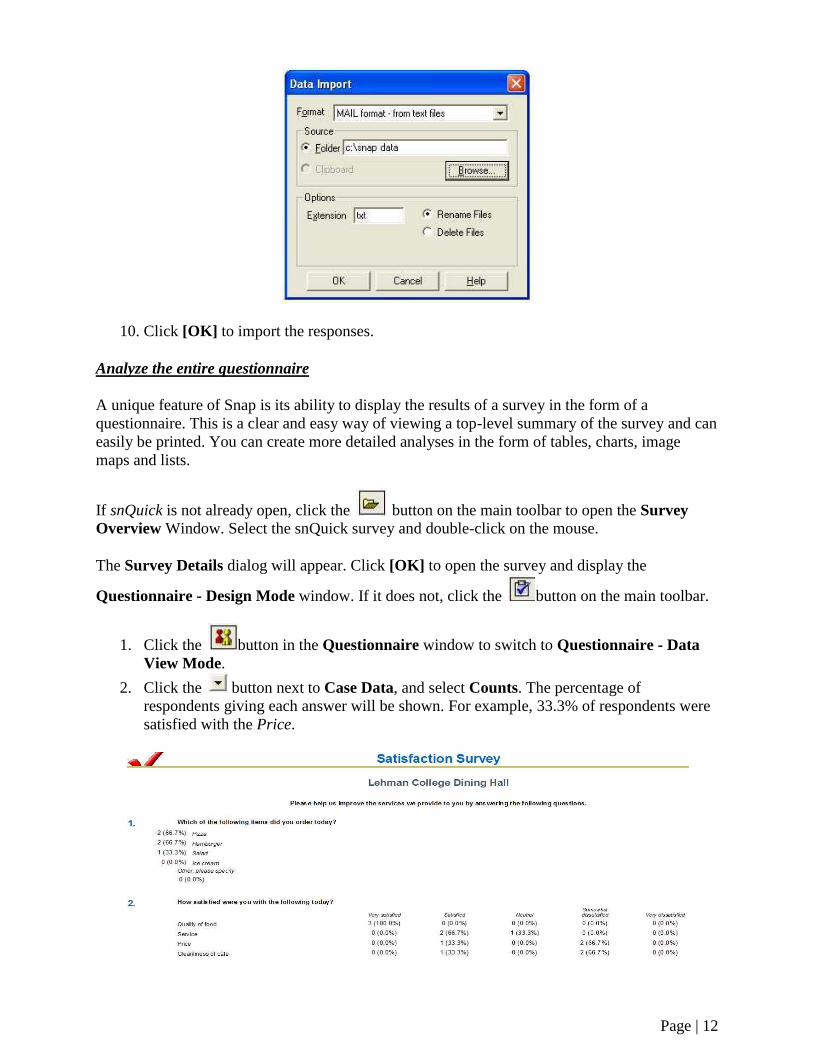
Page | 12
10. Click [OK] to import the responses.
Analyze the entire questionnaire
A unique feature of Snap is its ability to display the results of a survey in the form of a
questionnaire. This is a clear and easy way of viewing a top-level summary of the survey and can
easily be printed. You can create more detailed analyses in the form of tables, charts, image
maps and lists.
If snQuick is not already open, click the button on the main toolbar to open the Survey
Overview Window. Select the snQuick survey and double-click on the mouse.
The Survey Details dialog will appear. Click [OK] to open the survey and display the
Questionnaire - Design Mode window. If it does not, click the button on the main toolbar.
1. Click the button in the Questionnaire window to switch to Questionnaire - Data
View Mode.
2. Click the button next to Case Data, and select Counts. The percentage of
respondents giving each answer will be shown. For example, 33.3% of respondents were
satisfied with the Price.
Page | 13
Select the Absolute check box. The questionnaire will now be presented with the number of
respondents giving each answer. You’ll now see that Pizza was ordered by 2 people.
Analyze a single question
Frequency tables are the quickest and easiest method of tabulating single questions. You can
produce them in Snap just by specifying the name of the question or questions.
You can then use Snap to calculate percentages in tables, filter results to look at subsets of data
and apply scores to results.
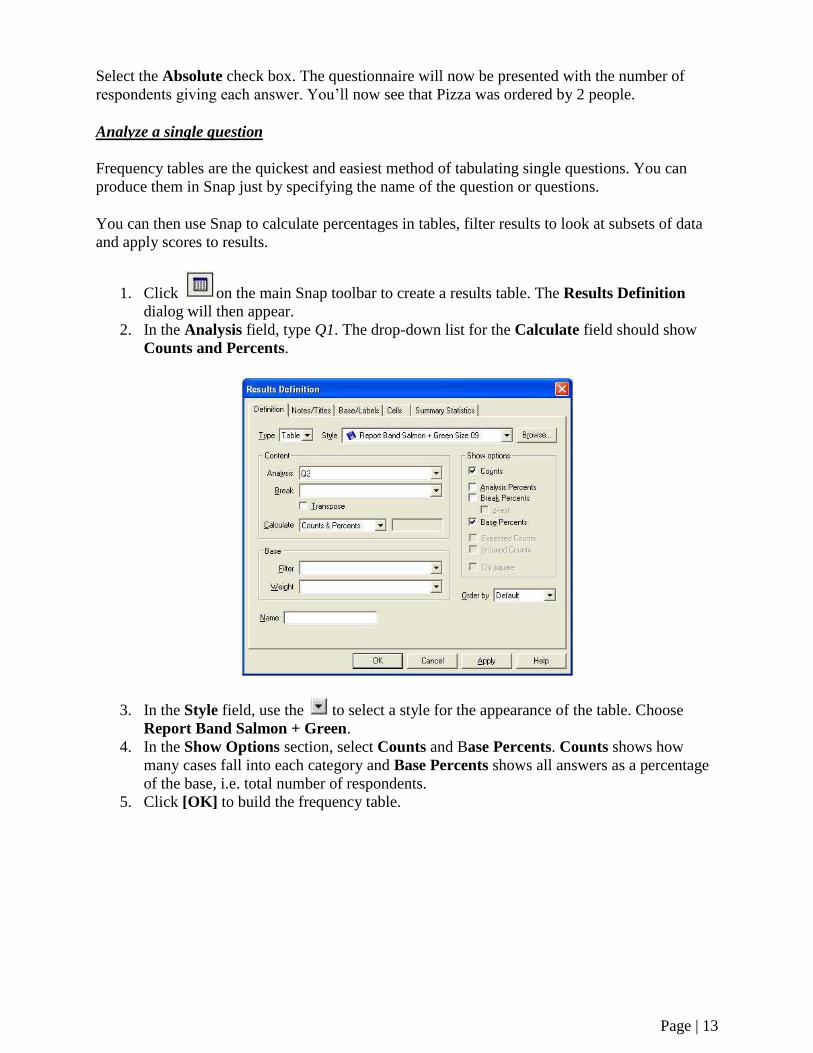
1. Click on the main Snap toolbar to create a results table. The Results Definition
dialog will then appear.
2. In the Analysis field, type Q1. The drop-down list for the Calculate field should show
Counts and Percents.
3. In the Style field, use the to select a style for the appearance of the table. Choose
Report Band Salmon + Green.
4. In the Show Options section, select Counts and Base Percents. Counts shows how
many cases fall into each category and Base Percents shows all answers as a percentage
of the base, i.e. total number of respondents.
5. Click [OK] to build the frequency table.
Page | 14
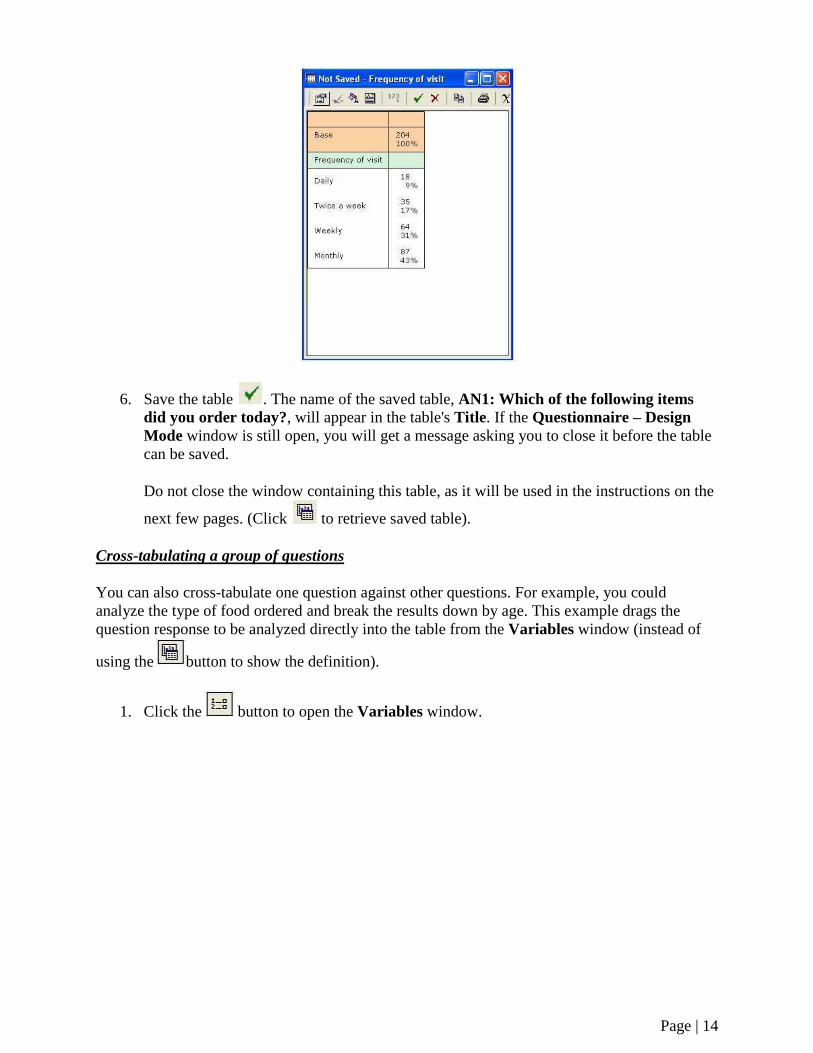
6. Save the table . The name of the saved table, AN1: Which of the following items
did you order today?, will appear in the table's Title. If the Questionnaire – Design
Mode window is still open, you will get a message asking you to close it before the table
can be saved.
Do not close the window containing this table, as it will be used in the instructions on the
next few pages. (Click to retrieve saved table).
Cross-tabulating a group of questions
You can also cross-tabulate one question against other questions. For example, you could
analyze the type of food ordered and break the results down by age. This example drags the
question response to be analyzed directly into the table from the Variables window (instead of
using the button to show the definition).
1. Click the button to open the Variables window.
Page | 15
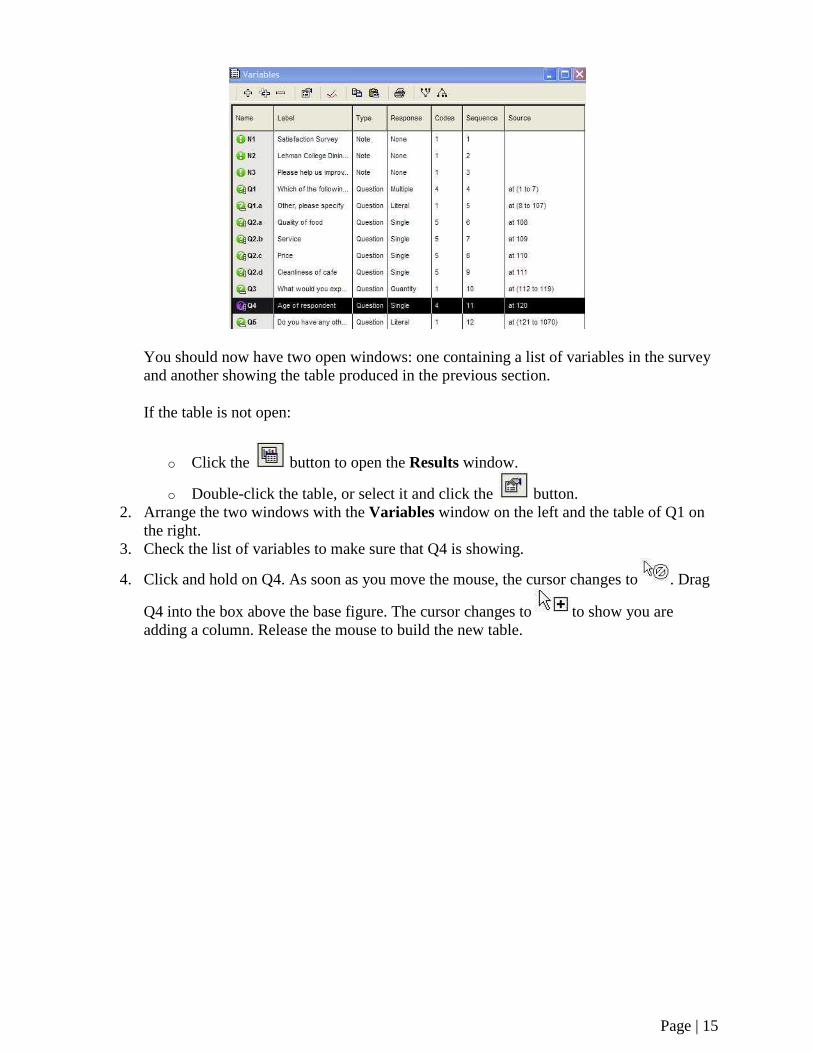
You should now have two open windows: one containing a list of variables in the survey
and another showing the table produced in the previous section.
If the table is not open:
o Click the button to open the Results window.
o Double-click the table, or select it and click the button.
2. Arrange the two windows with the Variables window on the left and the table of Q1 on
the right.
3. Check the list of variables to make sure that Q4 is showing.
4. Click and hold on Q4. As soon as you move the mouse, the cursor changes to . Drag
Q4 into the box above the base figure. The cursor changes to to show you are
adding a column. Release the mouse to build the new table.
Page | 16
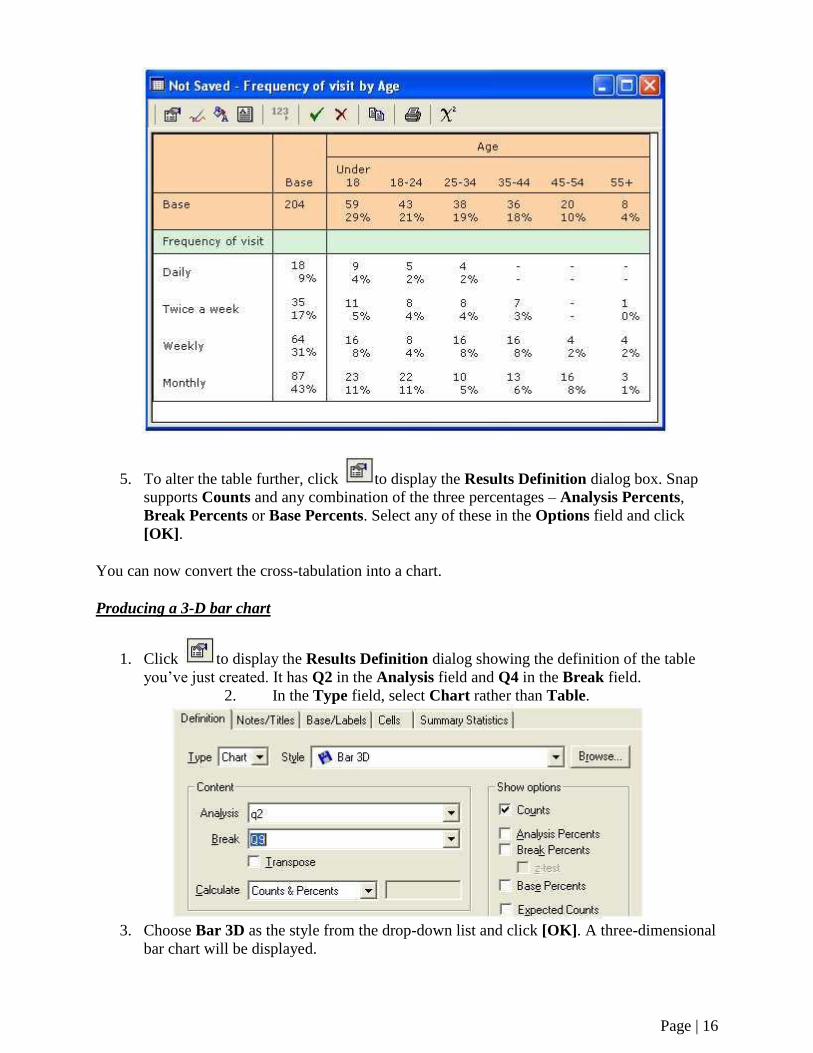
5. To alter the table further, click to display the Results Definition dialog box. Snap
supports Counts and any combination of the three percentages – Analysis Percents,
Break Percents or Base Percents. Select any of these in the Options field and click
[OK].
You can now convert the cross-tabulation into a chart.
Producing a 3-D bar chart
1. Click to display the Results Definition dialog showing the definition of the table
you’ve just created. It has Q2 in the Analysis field and Q4 in the Break field.
2. In the Type field, select Chart rather than Table.
3. Choose Bar 3D as the style from the drop-down list and click [OK]. A three-dimensional
bar chart will be displayed.

Page | 17
4. To rotate the chart, hold the [Ctrl] key down and press the left mouse button.
5. The cursor changes to . Keep the left button pressed or it will disappear again. Drag
the chart round to look at it from different angles. Release the mouse and the chart will
remain in the new position.
Page | 18
LINKING A SURVEY WITH A DATABASE
Often we would like to link a survey with a database containing information that might be
relevant to the survey, for example, a panel of students who’ve signed up to take part in regular
surveys or we may want to survey students who we already know.
This database might hold a unique login code for each member of the panel, together with
information about the panel member such as gender, age, address etc. You can avoid asking
demographic questions by holding such information in an external database, as Snap can use the
information directly.
You will:
Create a simple database using Excel.
Modify the questionnaire created earlier, to include a login code.
Link the survey to the database and create email invitations for your panel
Publish the questionnaire and upload it to Snap WebHost.
Carry out the survey from Snap WebHost
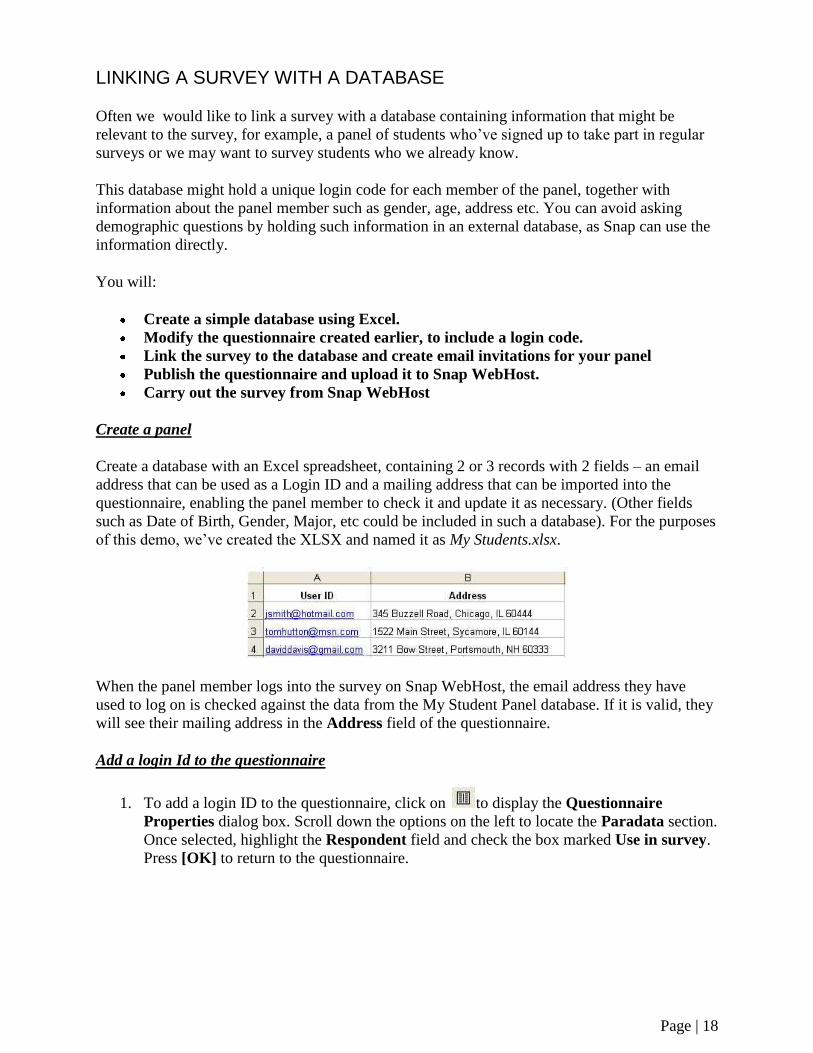
Create a panel
Create a database with an Excel spreadsheet, containing 2 or 3 records with 2 fields – an email
address that can be used as a Login ID and a mailing address that can be imported into the
questionnaire, enabling the panel member to check it and update it as necessary. (Other fields
such as Date of Birth, Gender, Major, etc could be included in such a database). For the purposes
of this demo, we’ve created the XLSX and named it as My Students.xlsx.
When the panel member logs into the survey on Snap WebHost, the email address they have
used to log on is checked against the data from the My Student Panel database. If it is valid, they
will see their mailing address in the Address field of the questionnaire.
Add a login Id to the questionnaire
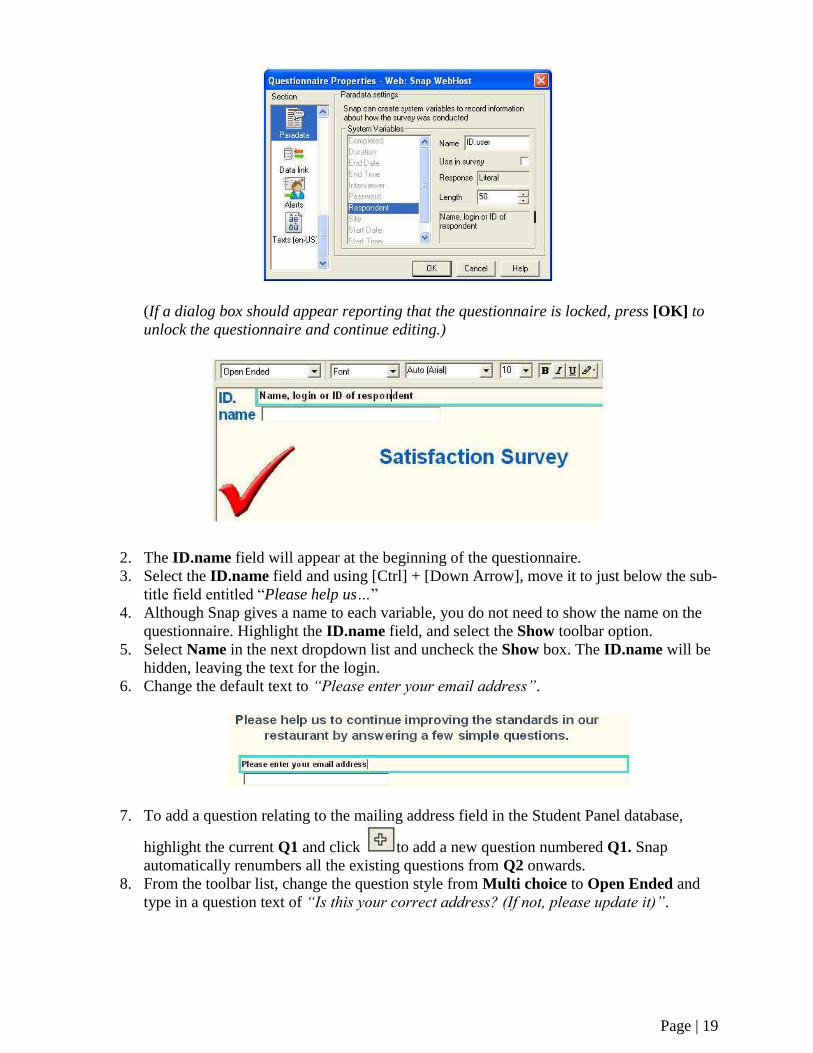
1. To add a login ID to the questionnaire, click on to display the Questionnaire
Properties dialog box. Scroll down the options on the left to locate the Paradata section.
Once selected, highlight the Respondent field and check the box marked Use in survey.
Press [OK] to return to the questionnaire.
Page | 19
(If a dialog box should appear reporting that the questionnaire is locked, press [OK] to
unlock the questionnaire and continue editing.)
2. The ID.name field will appear at the beginning of the questionnaire.
3. Select the ID.name field and using [Ctrl] + [Down Arrow], move it to just below the sub-
title field entitled “Please help us…”
4. Although Snap gives a name to each variable, you do not need to show the name on the
questionnaire. Highlight the ID.name field, and select the Show toolbar option.
5. Select Name in the next dropdown list and uncheck the Show box. The ID.name will be
hidden, leaving the text for the login.
6. Change the default text to “Please enter your email address”.
7. To add a question relating to the mailing address field in the Student Panel database,
highlight the current Q1 and click to add a new question numbered Q1. Snap
automatically renumbers all the existing questions from Q2 onwards.
8. From the toolbar list, change the question style from Multi choice to Open Ended and
type in a question text of “Is this your correct address? (If not, please update it)”.
Page | 20
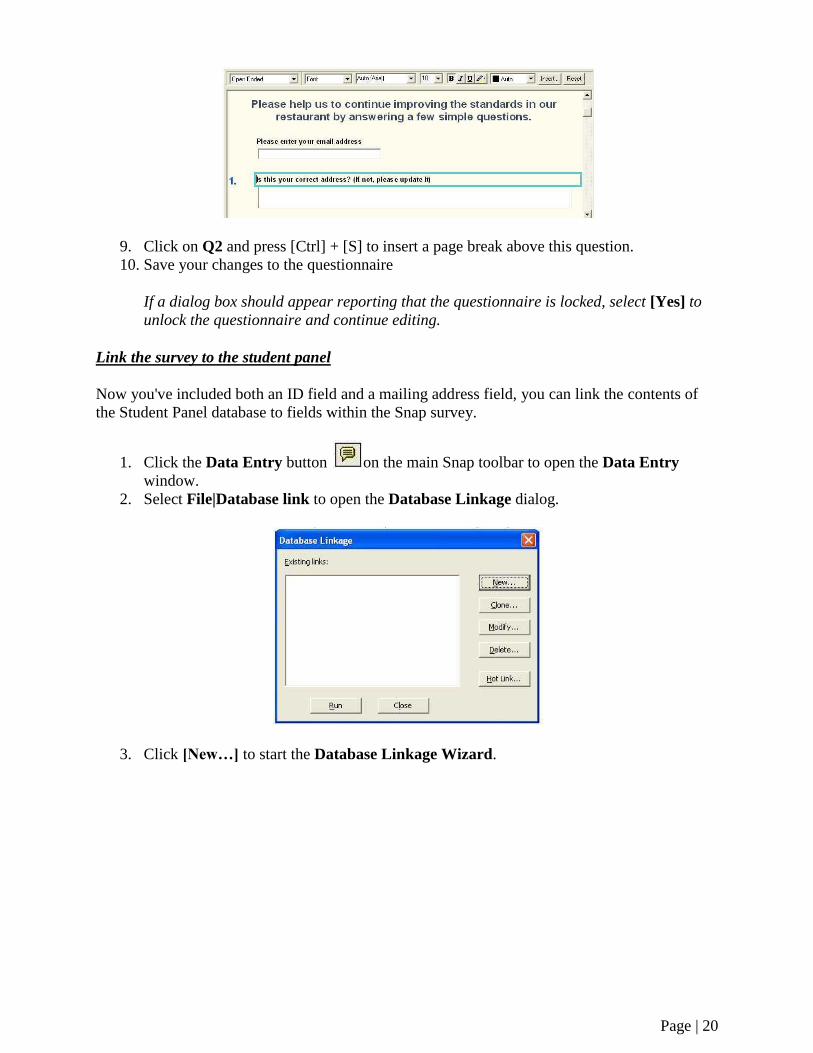
9. Click on Q2 and press [Ctrl] + [S] to insert a page break above this question.
10. Save your changes to the questionnaire
If a dialog box should appear reporting that the questionnaire is locked, select [Yes] to
unlock the questionnaire and continue editing.
Link the survey to the student panel
Now you've included both an ID field and a mailing address field, you can link the contents of
the Student Panel database to fields within the Snap survey.
1. Click the Data Entry button on the main Snap toolbar to open the Data Entry
window.
2. Select File|Database link to open the Database Linkage dialog.
3. Click [New…] to start the Database Linkage Wizard.
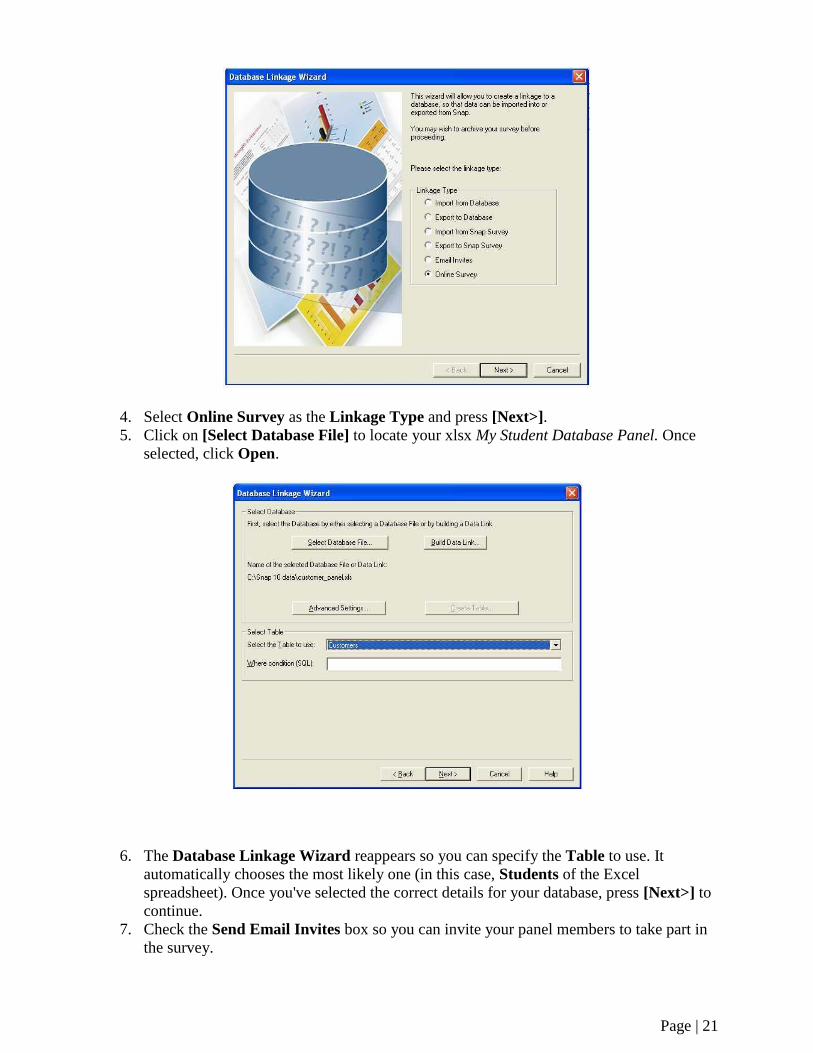
Page | 21
4. Select Online Survey as the Linkage Type and press [Next>].
5. Click on [Select Database File] to locate your xlsx My Student Database Panel. Once
selected, click Open.
6. The Database Linkage Wizard reappears so you can specify the Table to use. It
automatically chooses the most likely one (in this case, Students of the Excel
spreadsheet). Once you've selected the correct details for your database, press [Next>] to
continue.
7. Check the Send Email Invites box so you can invite your panel members to take part in
the survey.
Page | 22
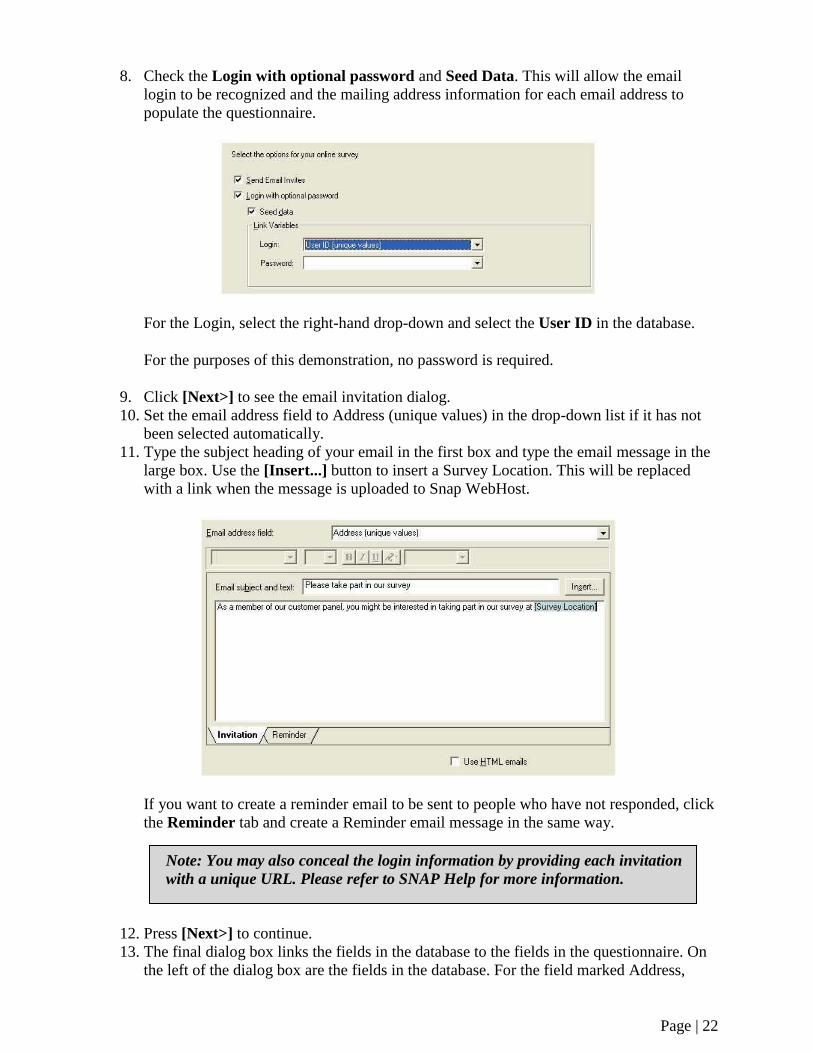
8. Check the Login with optional password and Seed Data. This will allow the email
login to be recognized and the mailing address information for each email address to
populate the questionnaire.
For the Login, select the right-hand drop-down and select the User ID in the database.
For the purposes of this demonstration, no password is required.
9. Click [Next>] to see the email invitation dialog.
10. Set the email address field to Address (unique values) in the drop-down list if it has not
been selected automatically.
11. Type the subject heading of your email in the first box and type the email message in the
large box. Use the [Insert...] button to insert a Survey Location. This will be replaced
with a link when the message is uploaded to Snap WebHost.
If you want to create a reminder email to be sent to people who have not responded, click
the Reminder tab and create a Reminder email message in the same way.
12. Press [Next>] to continue.
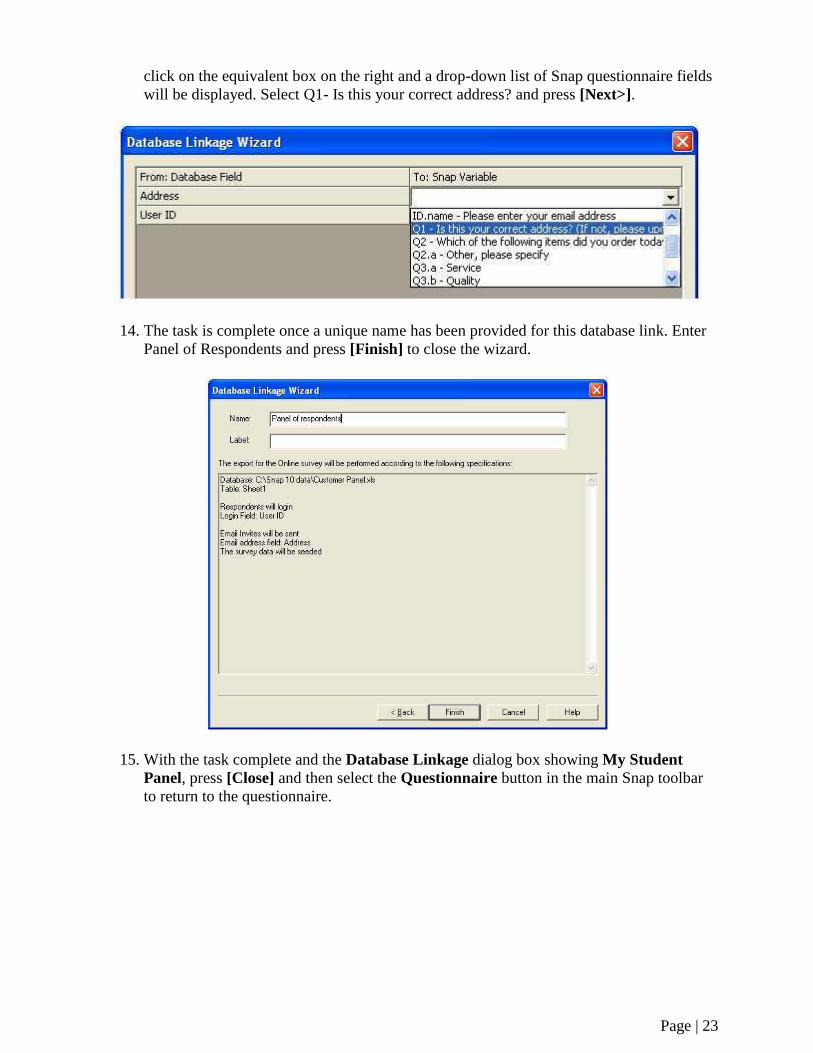
13. The final dialog box links the fields in the database to the fields in the questionnaire. On
the left of the dialog box are the fields in the database. For the field marked Address,
Note: You may also conceal the login information by providing each invitation
with a unique URL. Please refer to SNAP Help for more information.
Page | 23
click on the equivalent box on the right and a drop-down list of Snap questionnaire fields
will be displayed. Select Q1- Is this your correct address? and press [Next>].
14. The task is complete once a unique name has been provided for this database link. Enter
Panel of Respondents and press [Finish] to close the wizard.
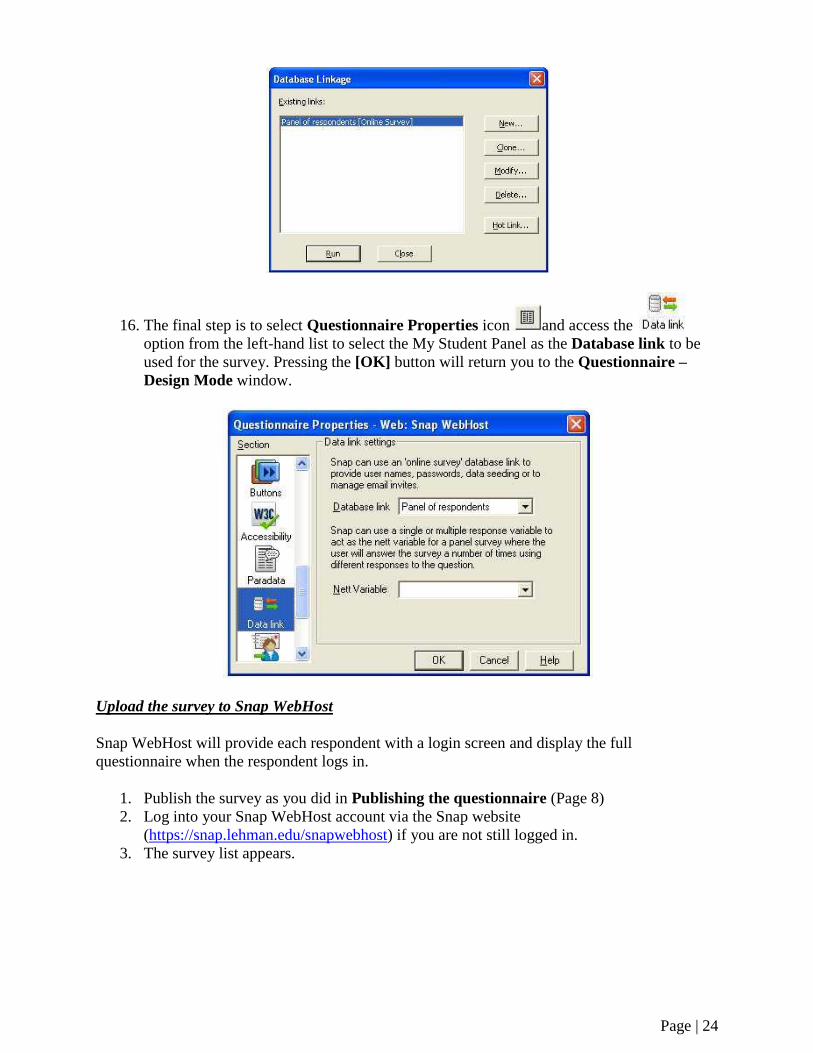
15. With the task complete and the Database Linkage dialog box showing My Student
Panel, press [Close] and then select the Questionnaire button in the main Snap toolbar
to return to the questionnaire.
Page | 24
16. The final step is to select Questionnaire Properties icon and access the
option from the left-hand list to select the My Student Panel as the Database link to be
used for the survey. Pressing the [OK] button will return you to the Questionnaire –
Design Mode window.
Upload the survey to Snap WebHost
Snap WebHost will provide each respondent with a login screen and display the full
questionnaire when the respondent logs in.
1. Publish the survey as you did in Publishing the questionnaire (Page 8)
2. Log into your Snap WebHost account via the Snap website
(https://snap.lehman.edu/snapwebhost) if you are not still logged in.
3. The survey list appears.
Page | 25
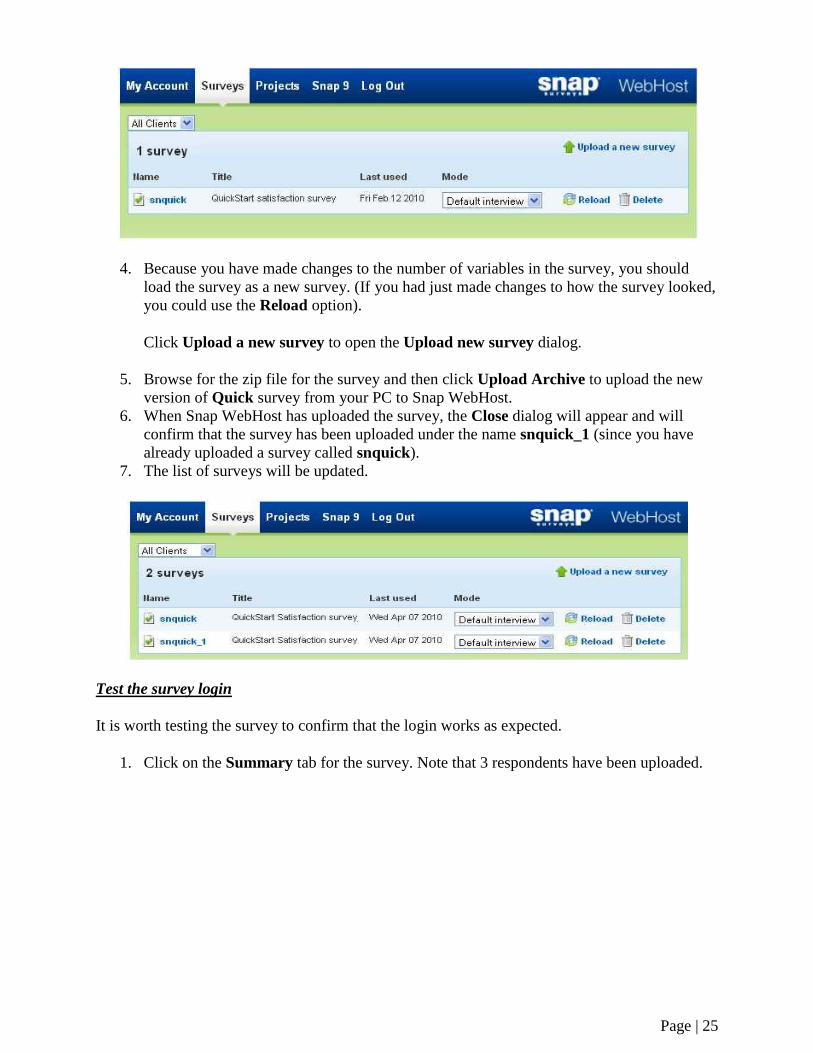
4. Because you have made changes to the number of variables in the survey, you should
load the survey as a new survey. (If you had just made changes to how the survey looked,
you could use the Reload option).
Click Upload a new survey to open the Upload new survey dialog.
5. Browse for the zip file for the survey and then click Upload Archive to upload the new
version of Quick survey from your PC to Snap WebHost.
6. When Snap WebHost has uploaded the survey, the Close dialog will appear and will
confirm that the survey has been uploaded under the name snquick_1 (since you have
already uploaded a survey called snquick).
7. The list of surveys will be updated.
Test the survey login
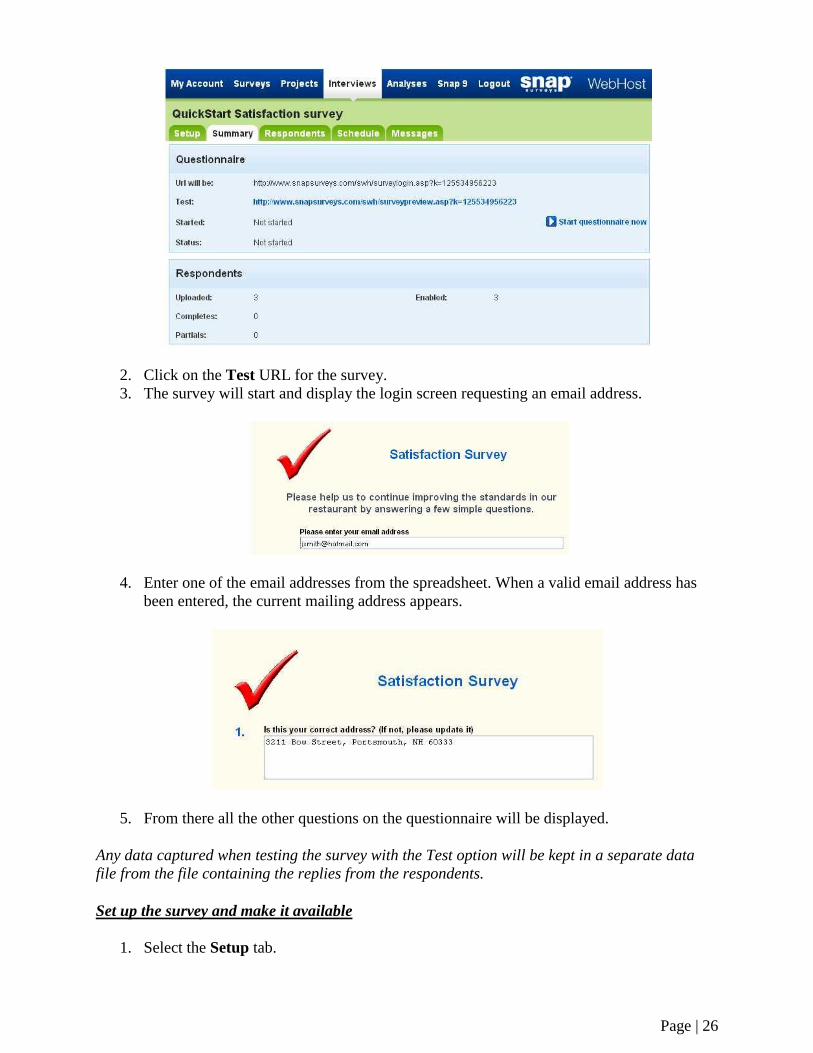
It is worth testing the survey to confirm that the login works as expected.
1. Click on the Summary tab for the survey. Note that 3 respondents have been uploaded.
Page | 26
2. Click on the Test URL for the survey.
3. The survey will start and display the login screen requesting an email address.
4. Enter one of the email addresses from the spreadsheet. When a valid email address has
been entered, the current mailing address appears.
5. From there all the other questions on the questionnaire will be displayed.
Any data captured when testing the survey with the Test option will be kept in a separate data
file from the file containing the replies from the respondents.
Set up the survey and make it available
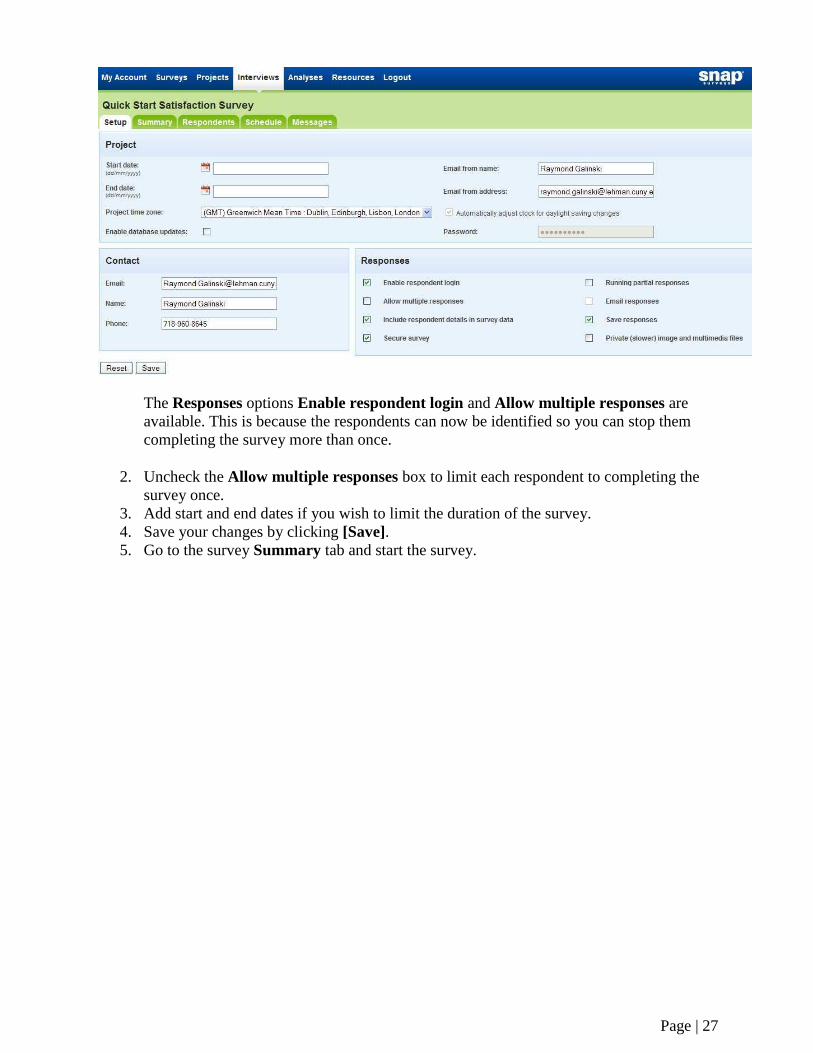
1. Select the Setup tab.
Page | 27
The Responses options Enable respondent login and Allow multiple responses are
available. This is because the respondents can now be identified so you can stop them
completing the survey more than once.
2. Uncheck the Allow multiple responses box to limit each respondent to completing the
survey once.
3. Add start and end dates if you wish to limit the duration of the survey.
4. Save your changes by clicking [Save].
5. Go to the survey Summary tab and start the survey.
Page | 28
OTHER NEAT FEATURES
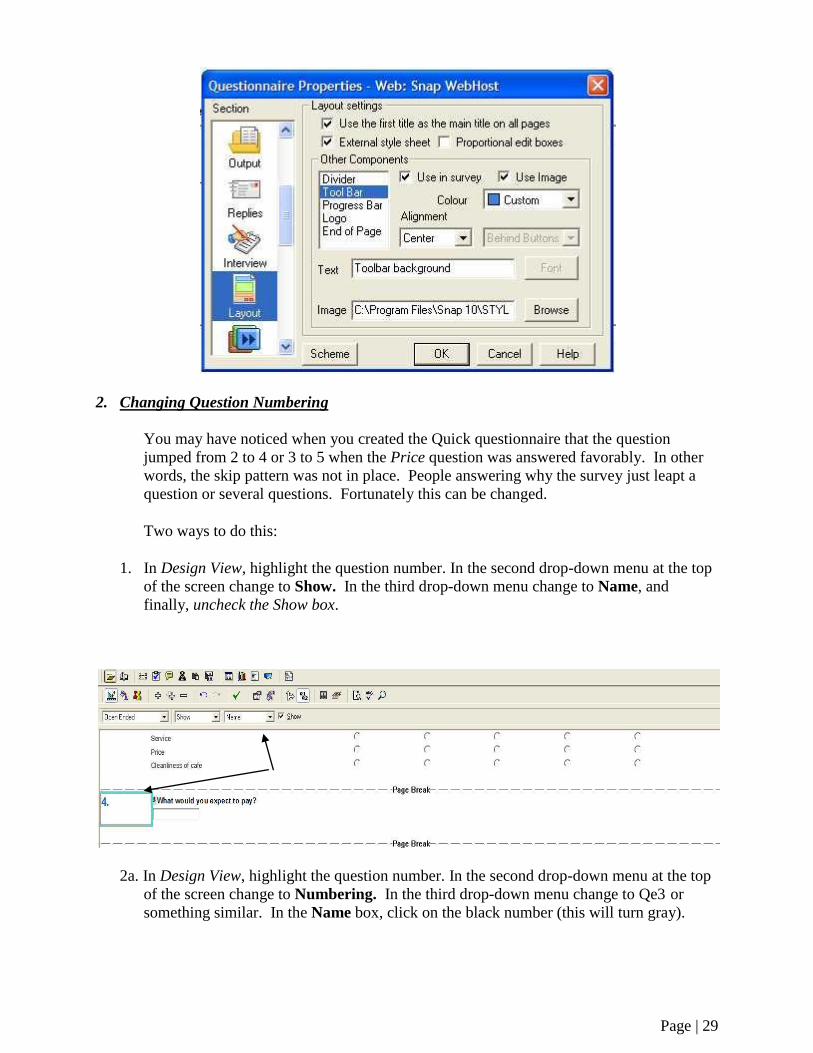
1. Changing Buttons and Adding a Progress Bar
The type and style of the buttons of your pages are defined in the Questionnaire Properties
dialog. You can set them to be a default button (with or without text) or a graphic you have
added yourself.
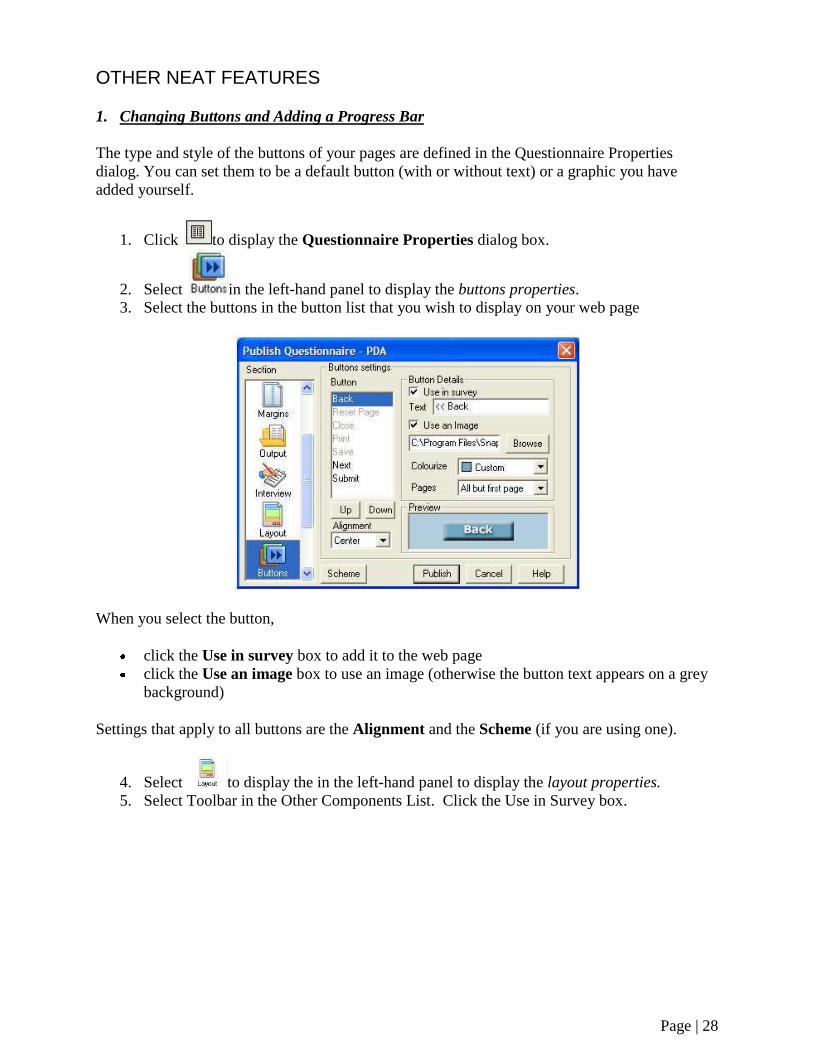
1. Click to display the Questionnaire Properties dialog box.
2. Select in the left-hand panel to display the buttons properties.
3. Select the buttons in the button list that you wish to display on your web page
When you select the button,
click the Use in survey box to add it to the web page
click the Use an image box to use an image (otherwise the button text appears on a grey
background)
Settings that apply to all buttons are the Alignment and the Scheme (if you are using one).
4. Select to display the in the left-hand panel to display the layout properties.
5. Select Toolbar in the Other Components List. Click the Use in Survey box.
Page | 29
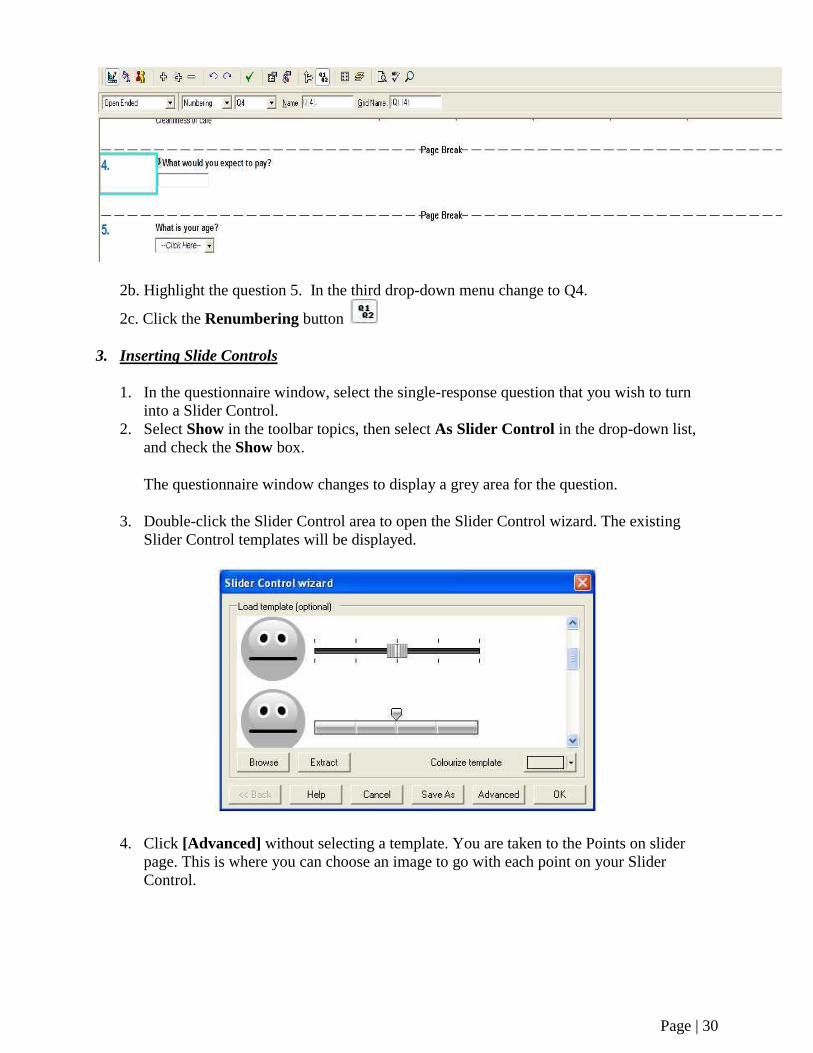
2. Changing Question Numbering
You may have noticed when you created the Quick questionnaire that the question
jumped from 2 to 4 or 3 to 5 when the Price question was answered favorably. In other
words, the skip pattern was not in place. People answering why the survey just leapt a
question or several questions. Fortunately this can be changed.
Two ways to do this:
1. In Design View, highlight the question number. In the second drop-down menu at the top
of the screen change to Show. In the third drop-down menu change to Name, and
finally, uncheck the Show box.
2a. In Design View, highlight the question number. In the second drop-down menu at the top
of the screen change to Numbering. In the third drop-down menu change to Qe3 or
something similar. In the Name box, click on the black number (this will turn gray).
Page | 30
2b. Highlight the question 5. In the third drop-down menu change to Q4.
2c. Click the Renumbering button
3. Inserting Slide Controls
1. In the questionnaire window, select the single-response question that you wish to turn
into a Slider Control.
2. Select Show in the toolbar topics, then select As Slider Control in the drop-down list,
and check the Show box.
The questionnaire window changes to display a grey area for the question.
3. Double-click the Slider Control area to open the Slider Control wizard. The existing
Slider Control templates will be displayed.
4. Click [Advanced] without selecting a template. You are taken to the Points on slider
page. This is where you can choose an image to go with each point on your Slider
Control.
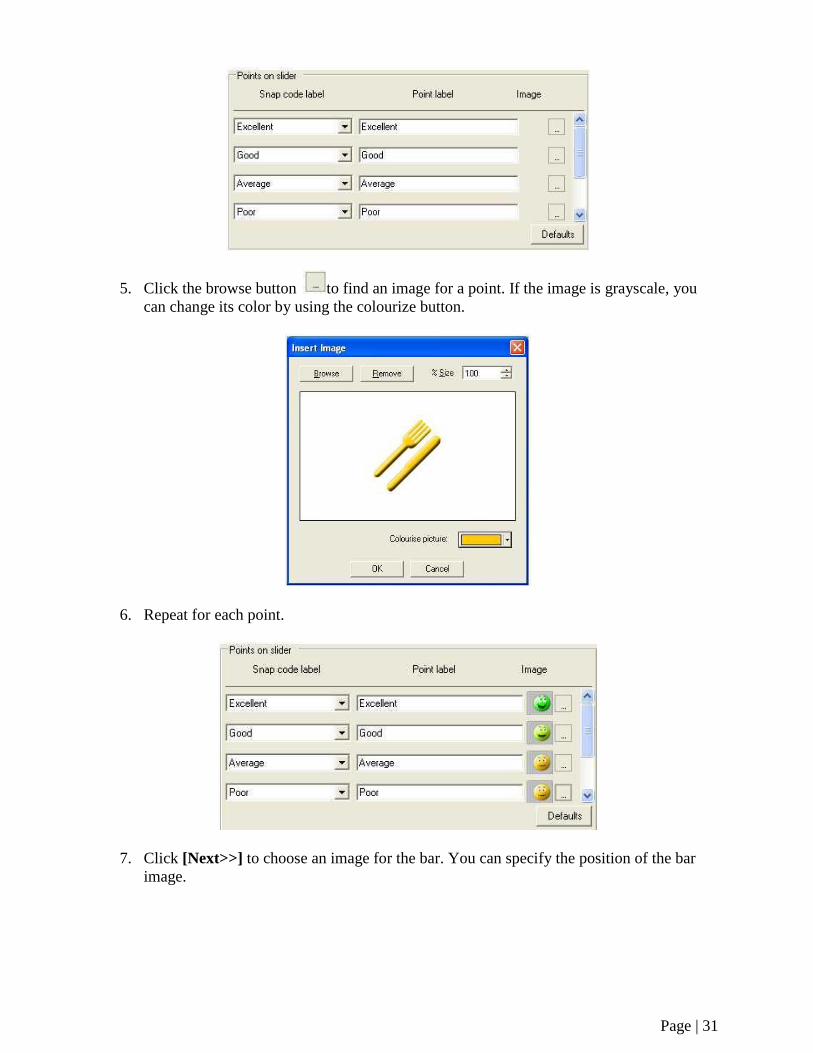
Page | 31
5. Click the browse button to find an image for a point. If the image is grayscale, you
can change its color by using the colourize button.
6. Repeat for each point.
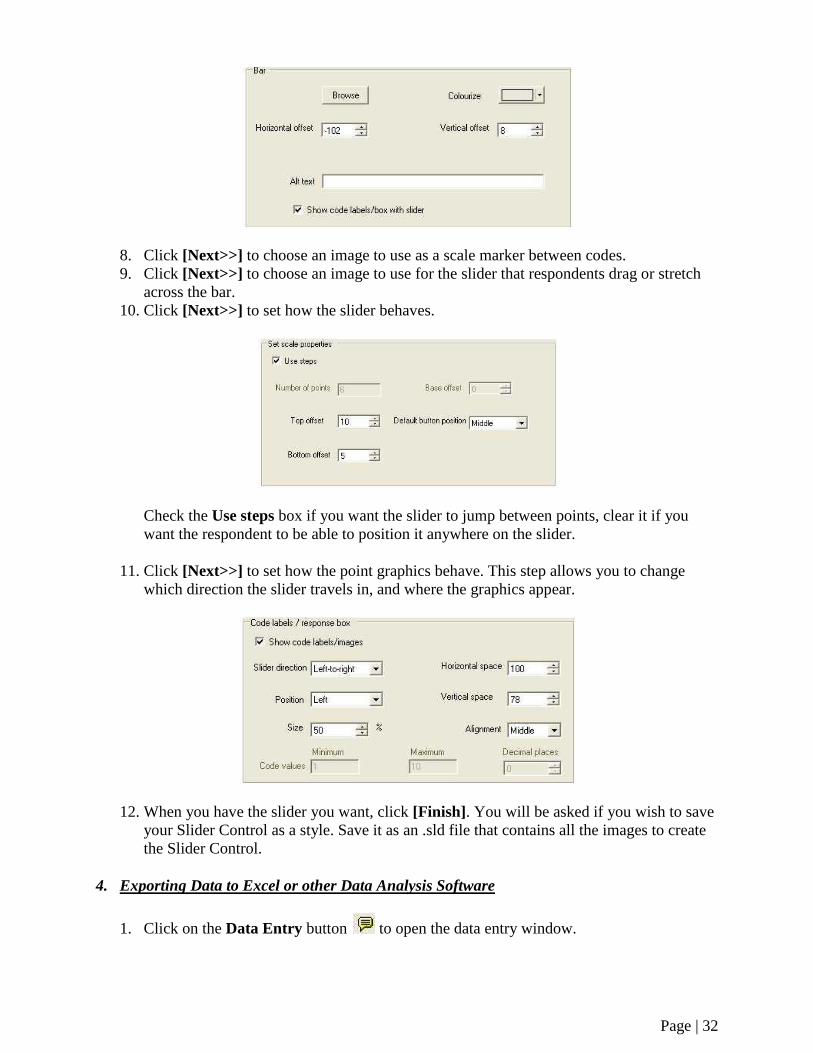
7. Click [Next>>] to choose an image for the bar. You can specify the position of the bar
image.
Page | 32
8. Click [Next>>] to choose an image to use as a scale marker between codes.
9. Click [Next>>] to choose an image to use for the slider that respondents drag or stretch
across the bar.
10. Click [Next>>] to set how the slider behaves.
Check the Use steps box if you want the slider to jump between points, clear it if you
want the respondent to be able to position it anywhere on the slider.
11. Click [Next>>] to set how the point graphics behave. This step allows you to change
which direction the slider travels in, and where the graphics appear.
12. When you have the slider you want, click [Finish]. You will be asked if you wish to save
your Slider Control as a style. Save it as an .sld file that contains all the images to create
the Slider Control.
4. Exporting Data to Excel or other Data Analysis Software
1. Click on the Data Entry button to open the data entry window.
Page | 33
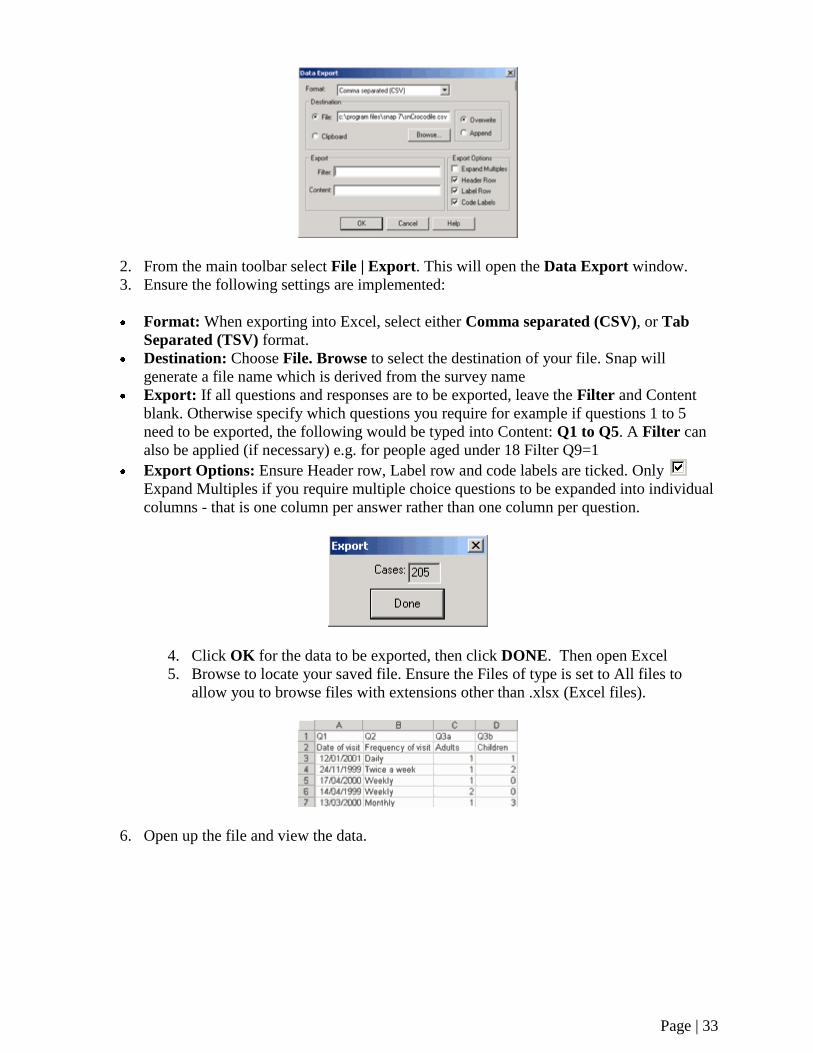
2. From the main toolbar select File | Export. This will open the Data Export window.
3. Ensure the following settings are implemented:
Format: When exporting into Excel, select either Comma separated (CSV), or Tab
Separated (TSV) format.
Destination: Choose File. Browse to select the destination of your file. Snap will
generate a file name which is derived from the survey name
Export: If all questions and responses are to be exported, leave the Filter and Content
blank. Otherwise specify which questions you require for example if questions 1 to 5
need to be exported, the following would be typed into Content: Q1 to Q5. A Filter can
also be applied (if necessary) e.g. for people aged under 18 Filter Q9=1
Export Options: Ensure Header row, Label row and code labels are ticked. Only
Expand Multiples if you require multiple choice questions to be expanded into individual
columns - that is one column per answer rather than one column per question.
4. Click OK for the data to be exported, then click DONE. Then open Excel
5. Browse to locate your saved file. Ensure the Files of type is set to All files to
allow you to browse files with extensions other than .xlsx (Excel files).
6. Open up the file and view the data.


![New [SVY] Survey Datapublic.econ.duke.edu/stata/Stata-13-Documentation/svy.pdf · 2013. 6. 12. · Title intro — Introduction to survey data manual DescriptionRemarks and examplesAlso](https://img.pdfslide.us/doc/110x75/6045626b0da2e0044548e6b7/new-svy-survey-2013-6-12-title-intro-a-introduction-to-survey-data-manual.jpg)