Embed Size (px)
Citation preview
Creating a Lean Culture
Visual Management
Daily Accountability &
Tiered Metric Boards Tom Groth Thermo Fisher Scientific [email protected]
Tedd Snyder Snyder Consulting & Associates [email protected]
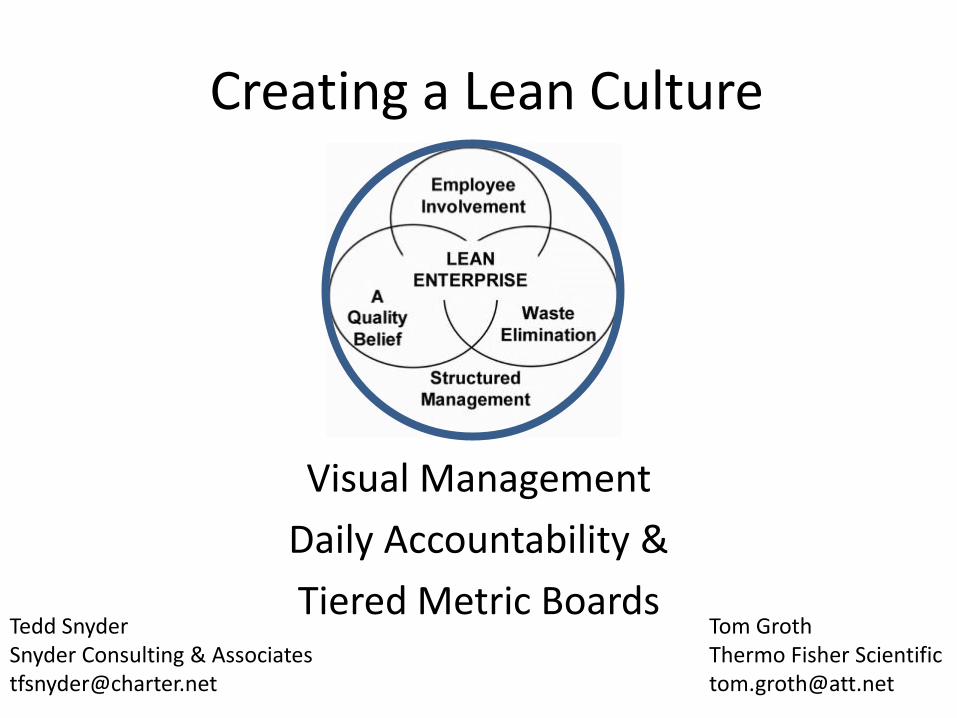
Continuous Improvement
• Cost Reduction
– Reduce year on year expenses
• Capacity Increase
– Do more with the same number of people
• Customer Satisfaction
– Focus on what matters most to customers (internal and external)
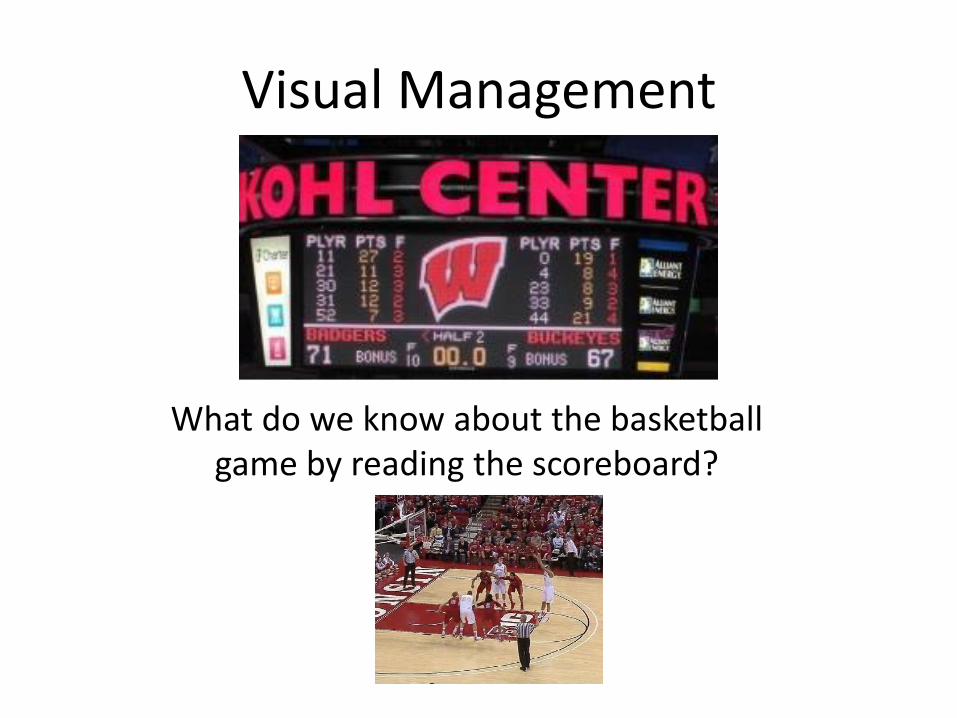
Visual Management
What do we know about the basketball game by reading the scoreboard?
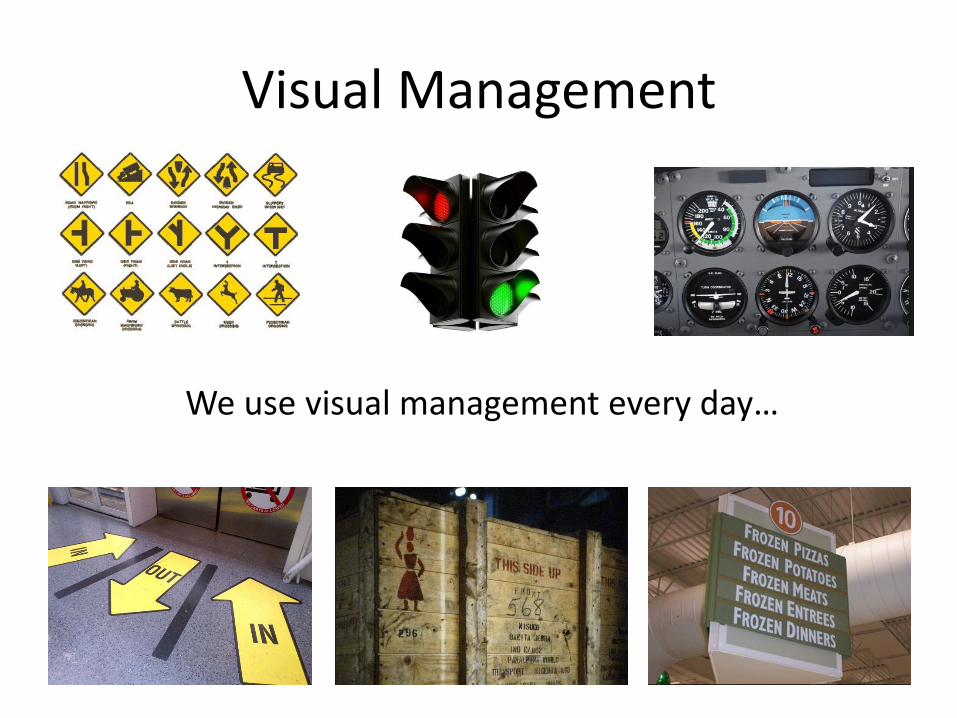
Visual Management
We use visual management every day…
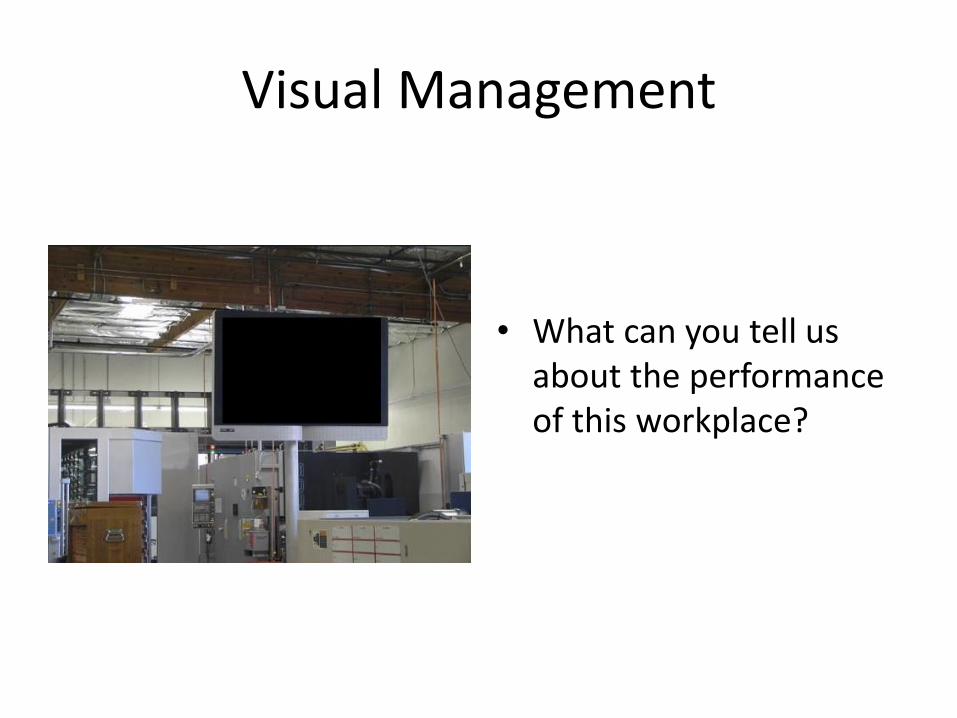
Visual Management
• What can you tell us about the performance of this workplace?
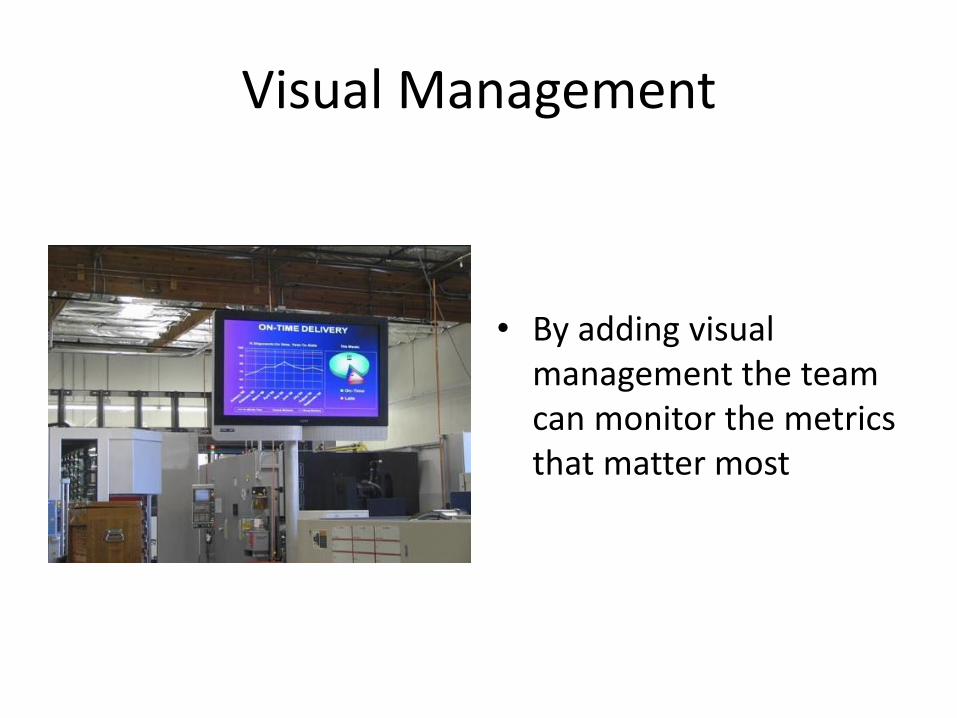
Visual Management
• By adding visual management the team can monitor the metrics that matter most
Visual Management
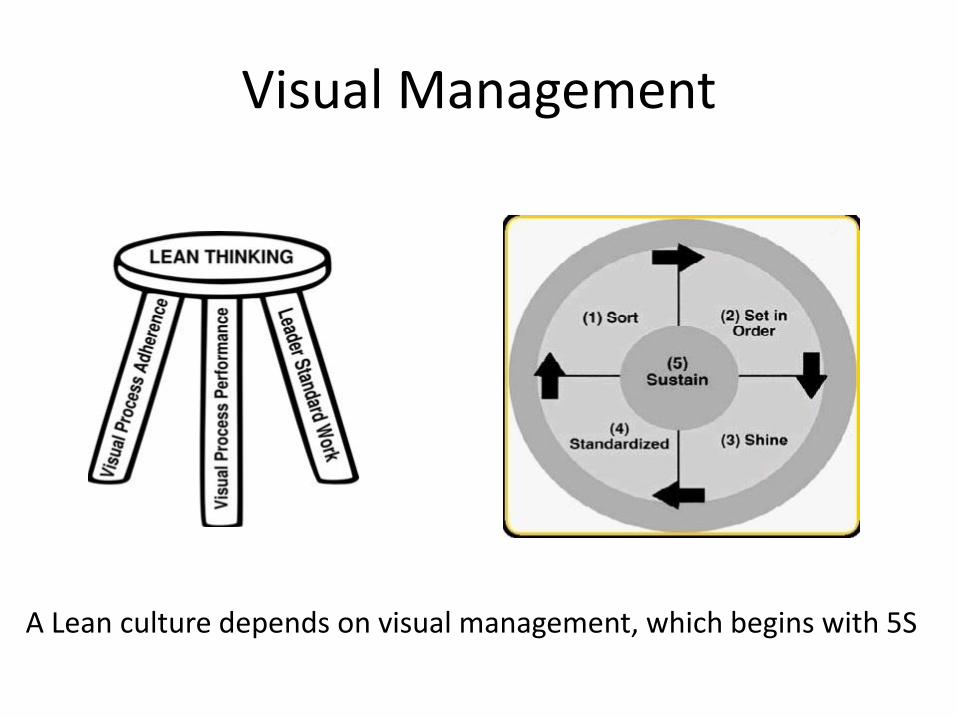
A Lean culture depends on visual management, which begins with 5S
Visual Management – 5S
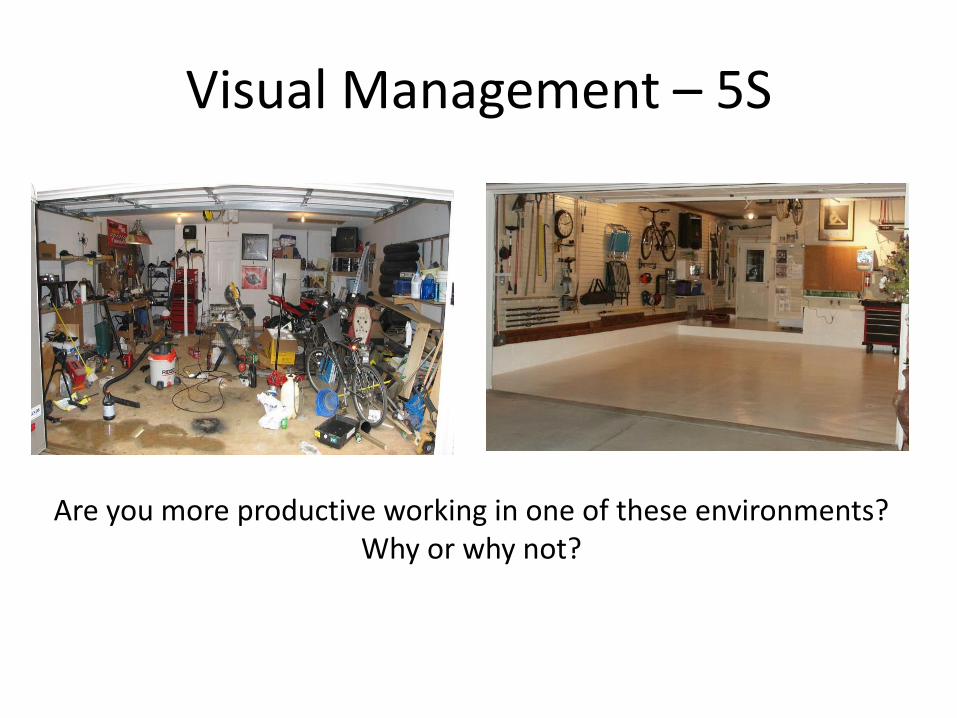
Are you more productive working in one of these environments? Why or why not?
Visual Management – 5S
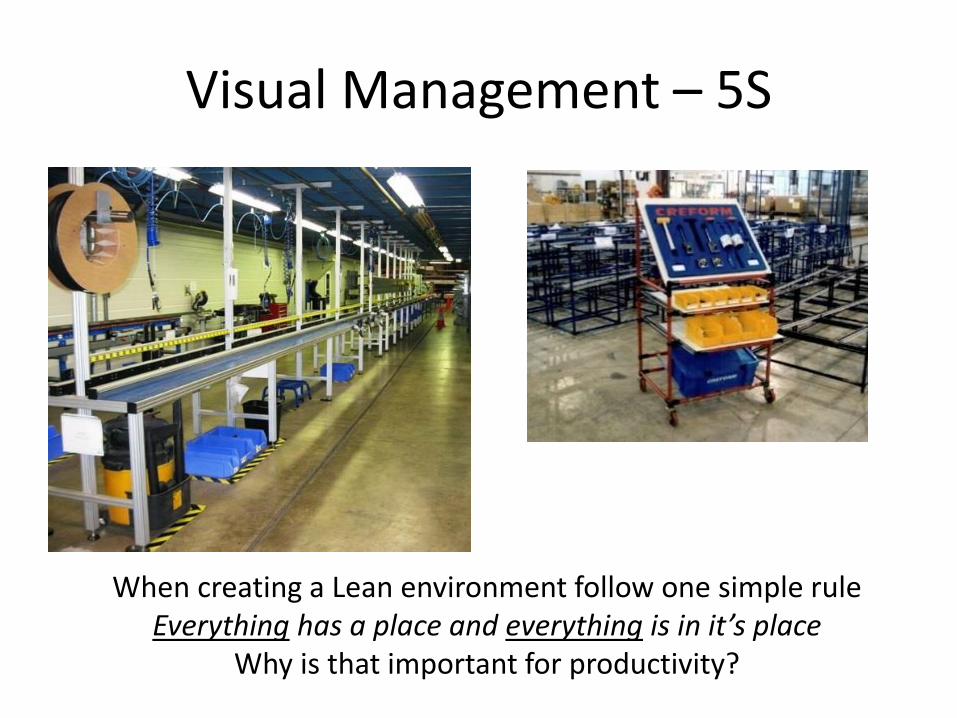
When creating a Lean environment follow one simple rule Everything has a place and everything is in it’s place
Why is that important for productivity?
Visual Management
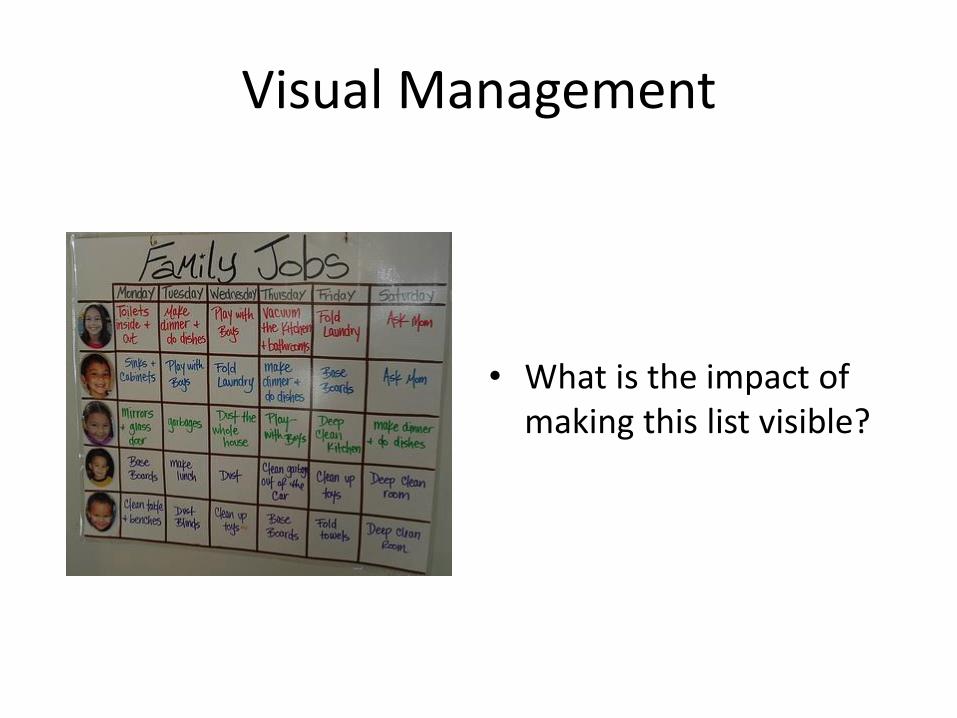
• What is the impact of making this list visible?
Visual Management
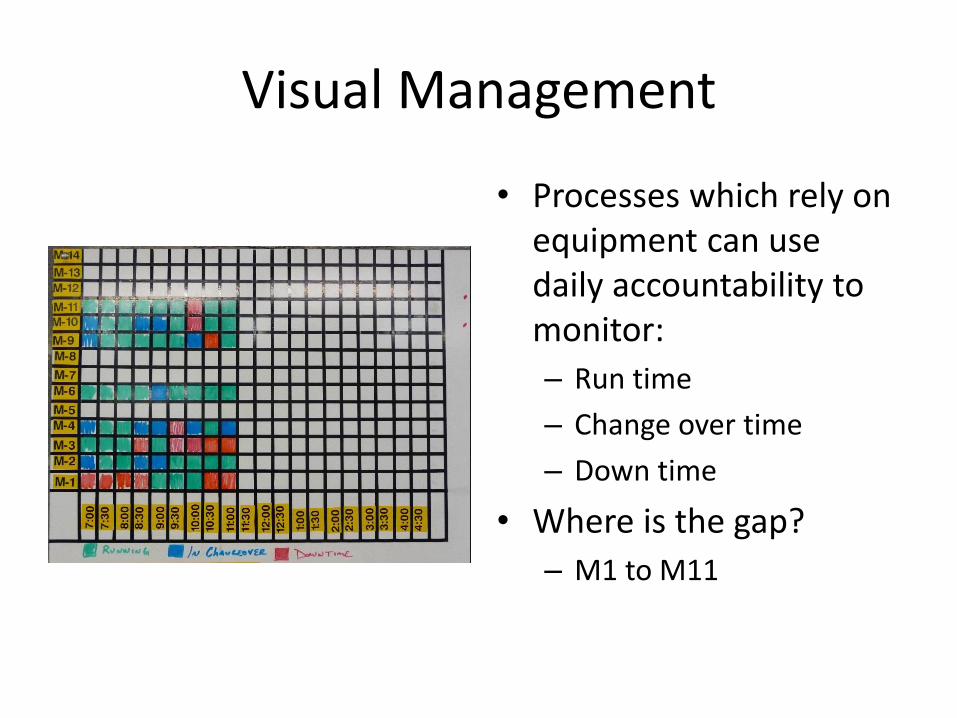
• Processes which rely on equipment can use daily accountability to monitor:
– Run time
– Change over time
– Down time
• Where is the gap?
– M1 to M11
Visual Management
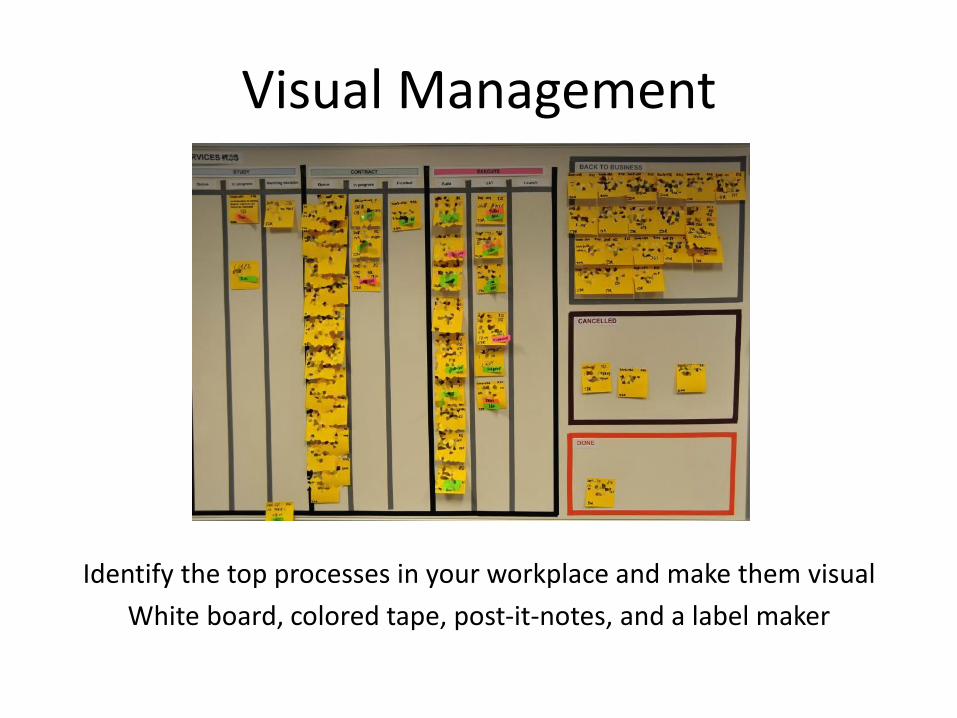
Identify the top processes in your workplace and make them visual
White board, colored tape, post-it-notes, and a label maker
Visual Management
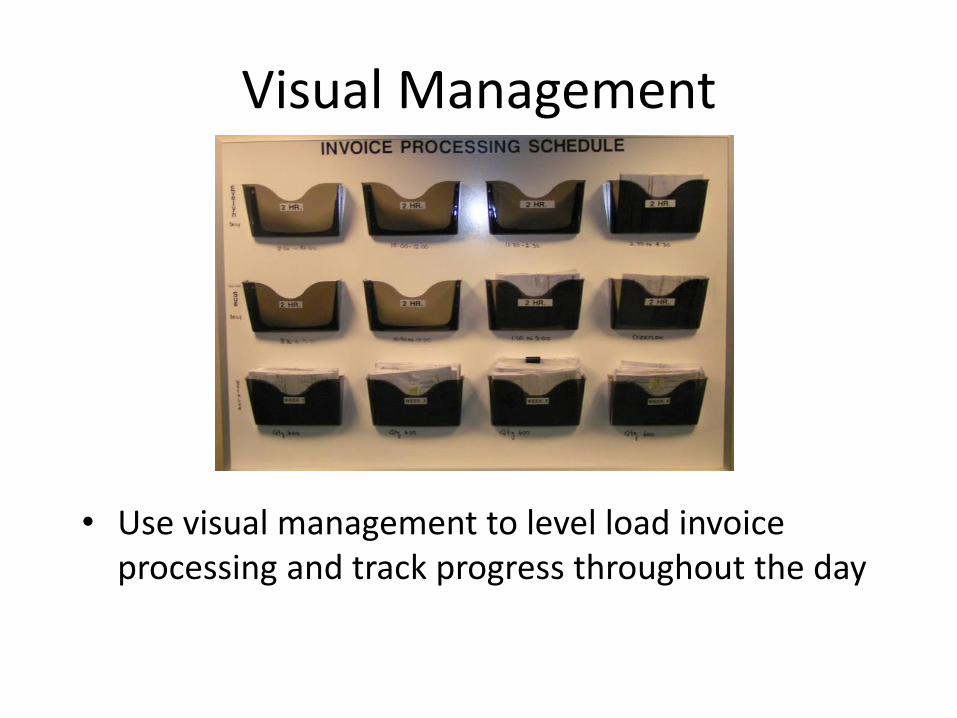
• Use visual management to level load invoice processing and track progress throughout the day
Visual Management
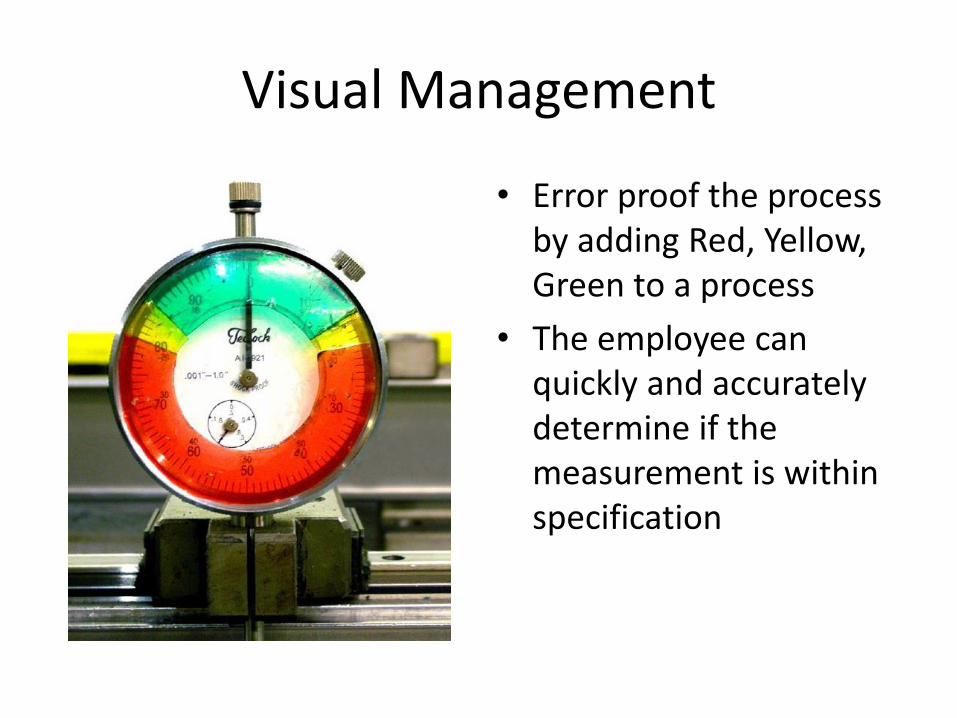
• Error proof the process by adding Red, Yellow, Green to a process
• The employee can quickly and accurately determine if the measurement is within specification
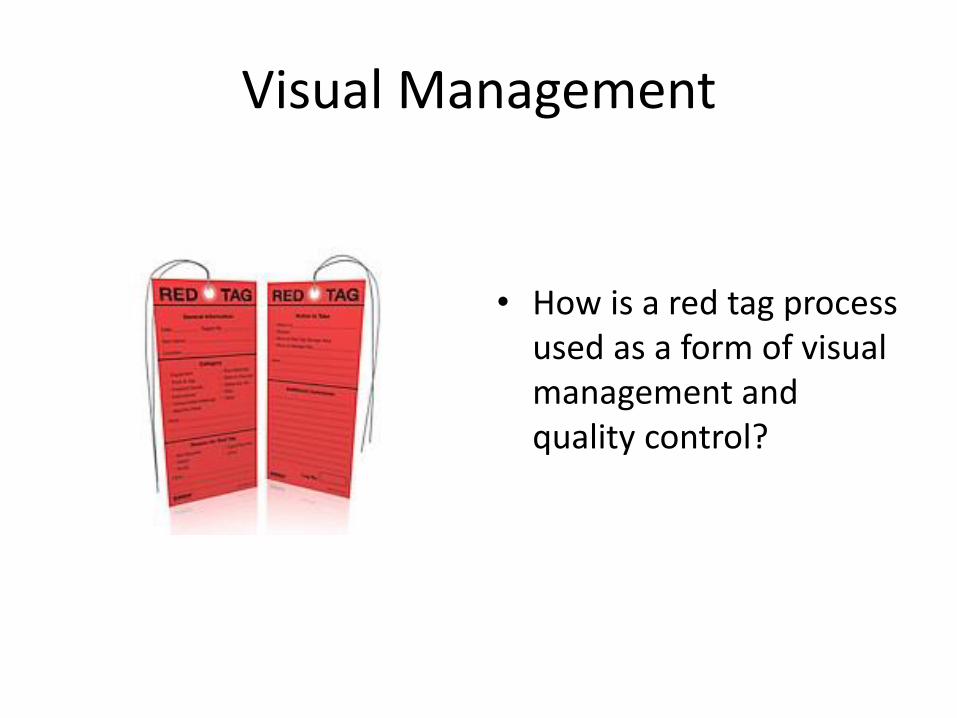
Visual Management
• How is a red tag process used as a form of visual management and quality control?
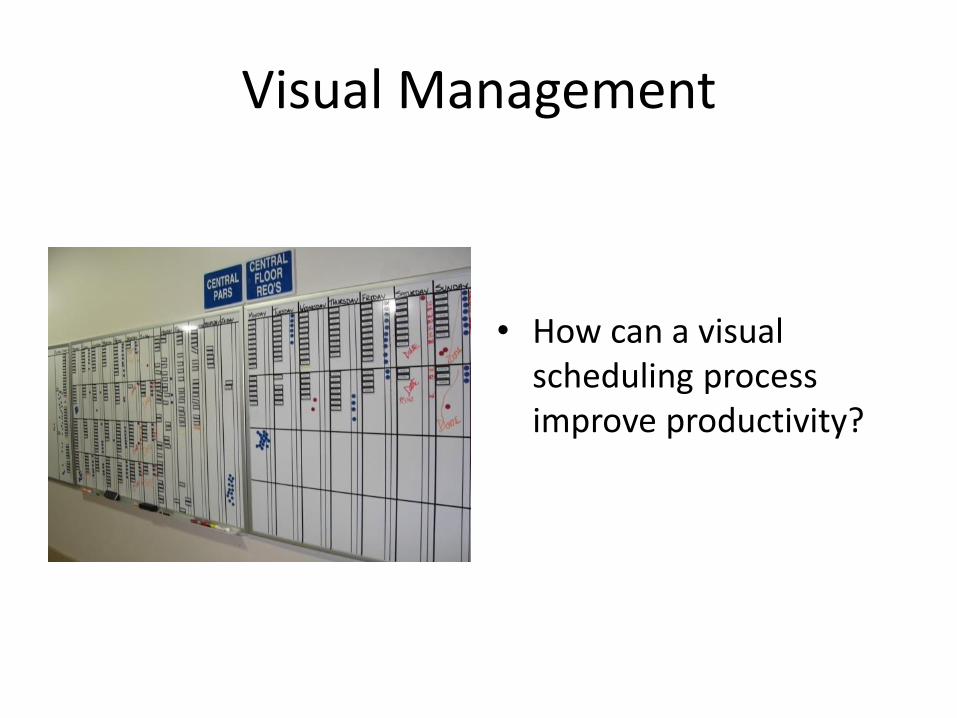
Visual Management
• How can a visual scheduling process improve productivity?
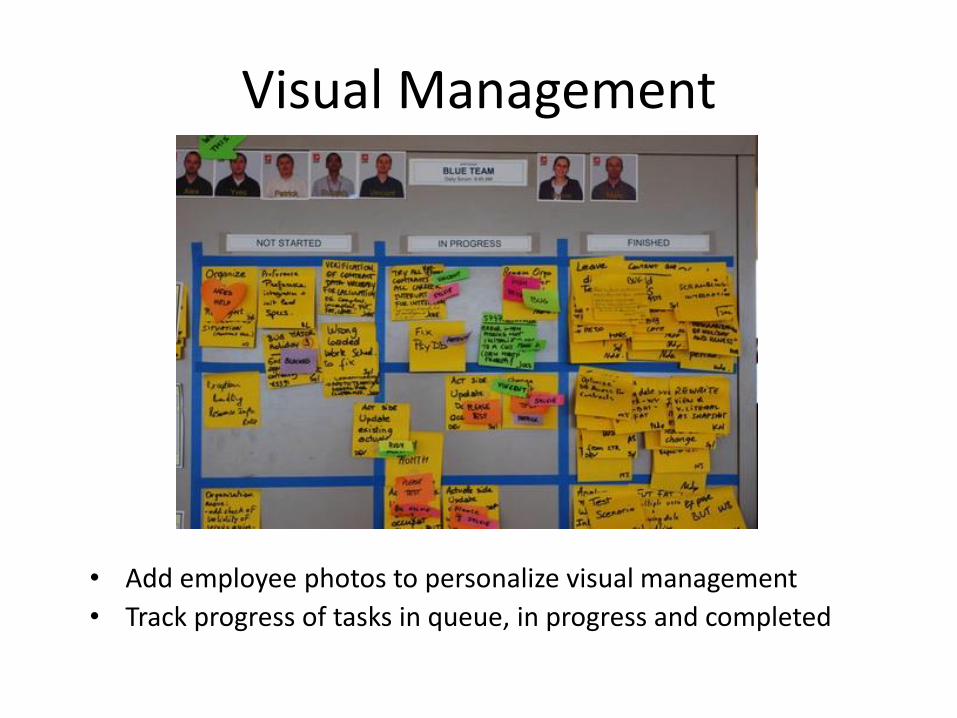
Visual Management
• Add employee photos to personalize visual management
• Track progress of tasks in queue, in progress and completed
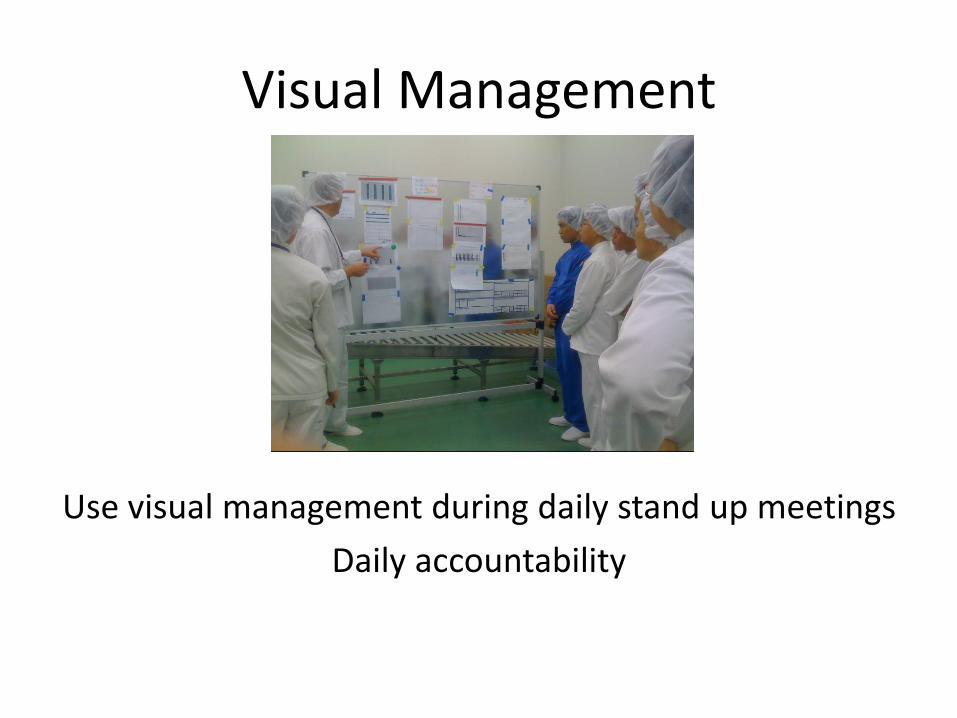
Visual Management
Use visual management during daily stand up meetings
Daily accountability
Daily Accountability
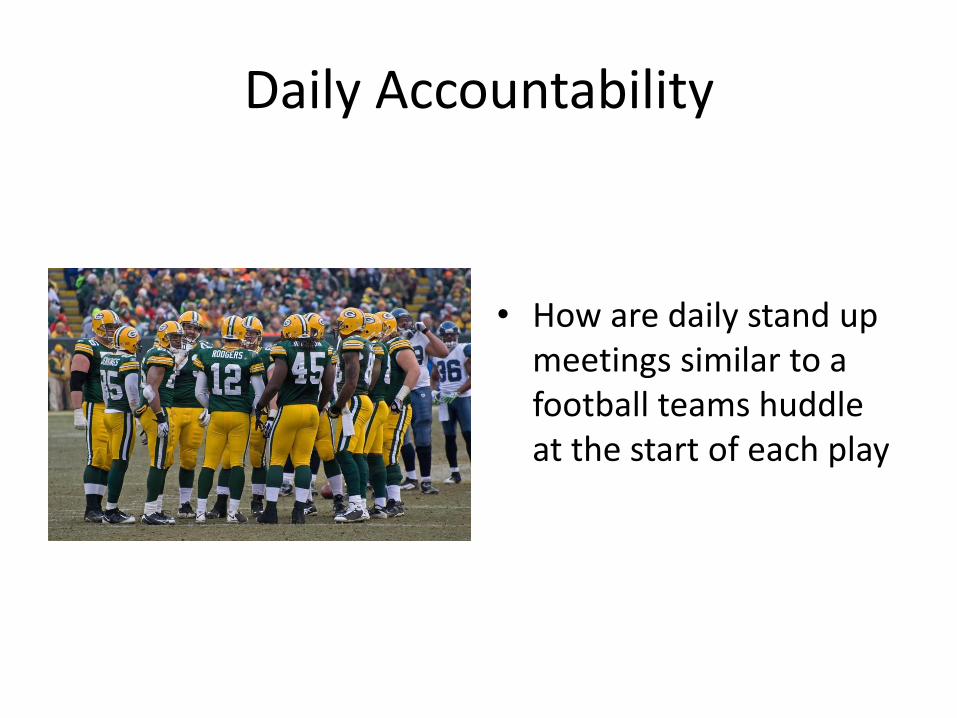
• How are daily stand up meetings similar to a football teams huddle at the start of each play
Daily Accountability
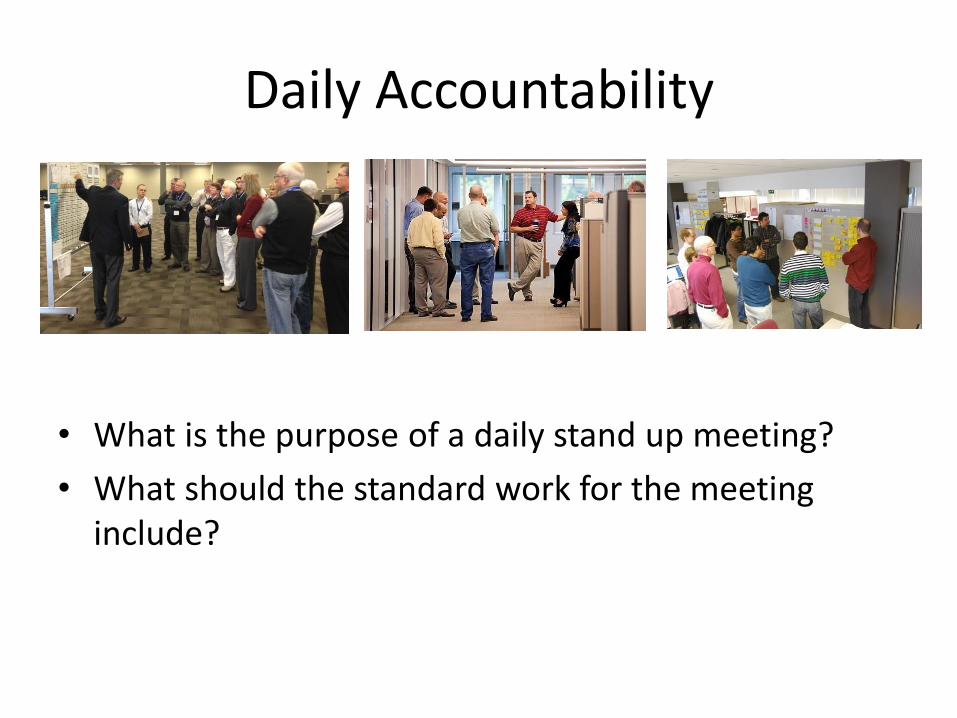
• What is the purpose of a daily stand up meeting?
• What should the standard work for the meeting include?
Daily Accountability
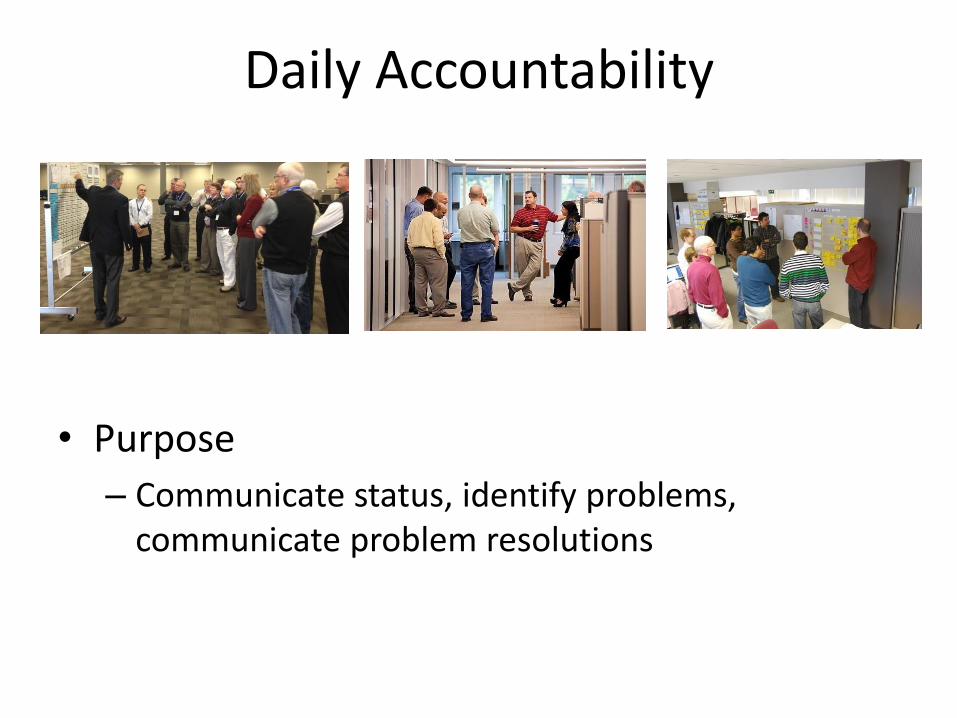
• Purpose
– Communicate status, identify problems, communicate problem resolutions
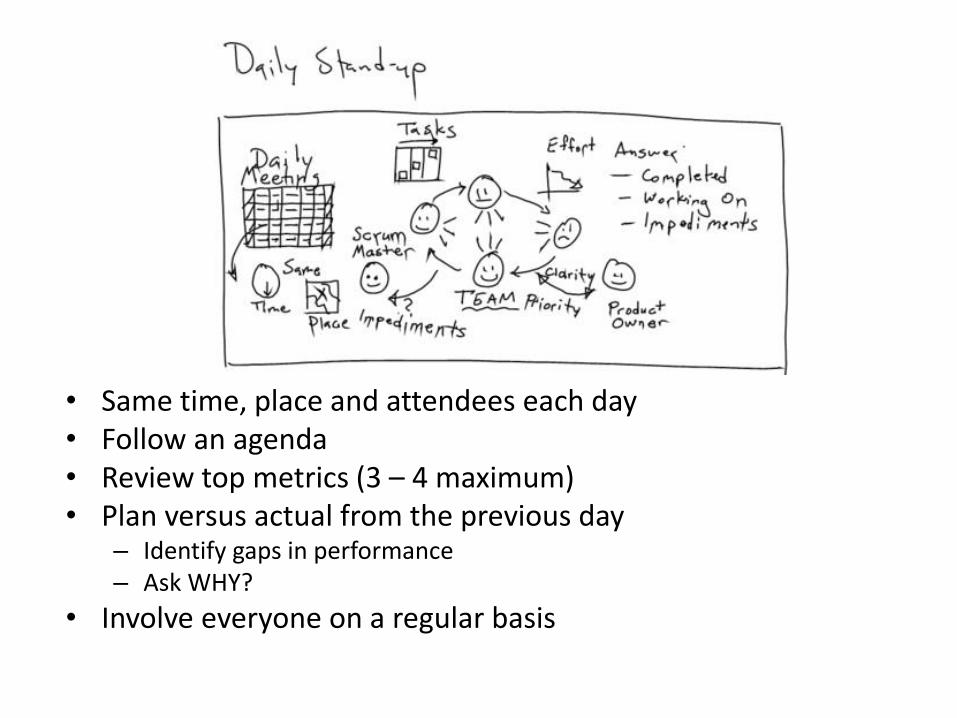
• Same time, place and attendees each day • Follow an agenda • Review top metrics (3 – 4 maximum) • Plan versus actual from the previous day
– Identify gaps in performance – Ask WHY?
• Involve everyone on a regular basis
Daily Accountability
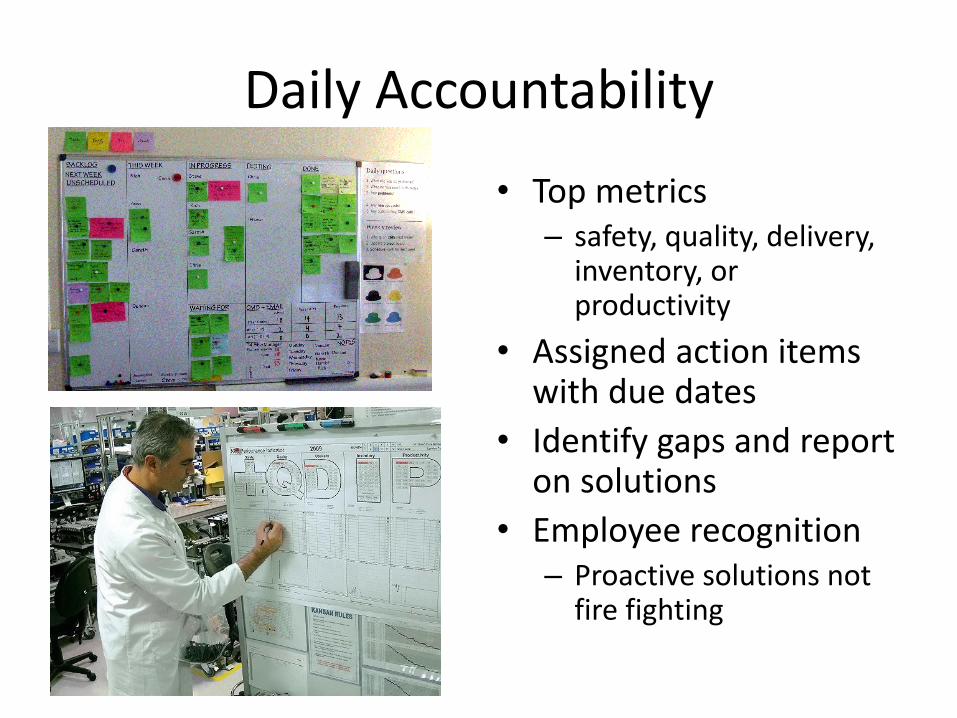
• Top metrics – safety, quality, delivery,
inventory, or productivity
• Assigned action items with due dates
• Identify gaps and report on solutions
• Employee recognition – Proactive solutions not
fire fighting
Daily Accountability
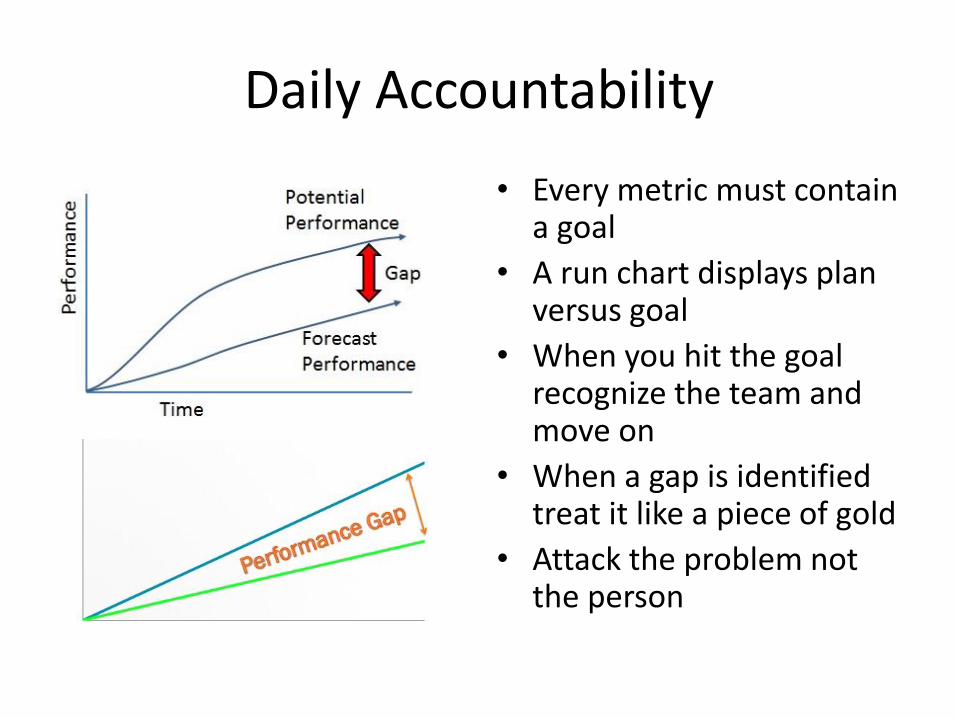
• Every metric must contain a goal
• A run chart displays plan versus goal
• When you hit the goal recognize the team and move on
• When a gap is identified treat it like a piece of gold
• Attack the problem not the person
Daily Accountability
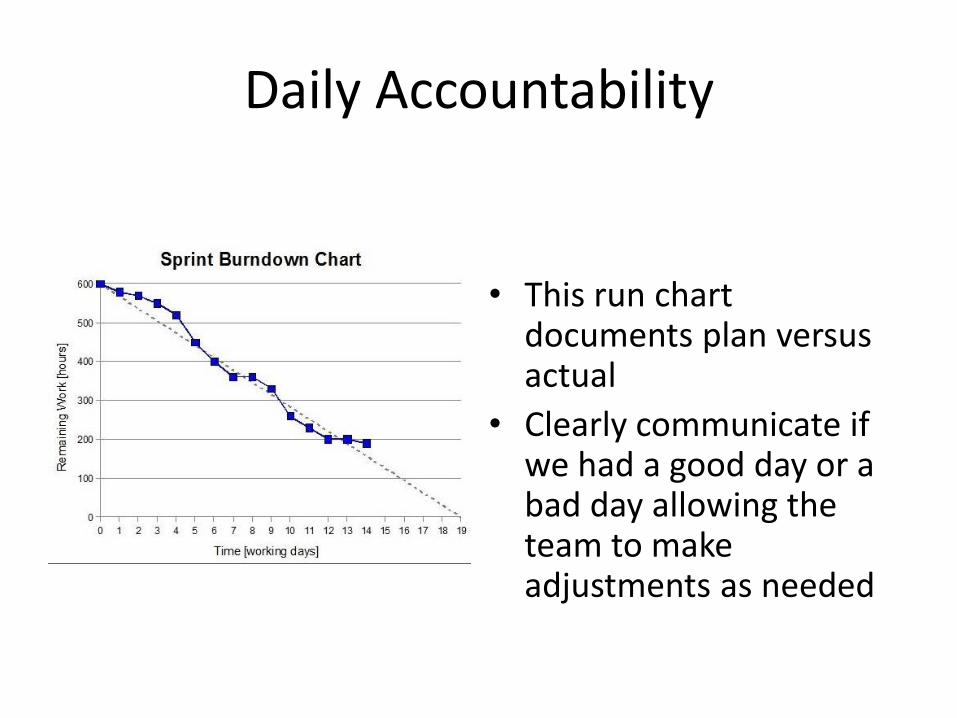
• This run chart documents plan versus actual
• Clearly communicate if we had a good day or a bad day allowing the team to make adjustments as needed
Daily Accountability
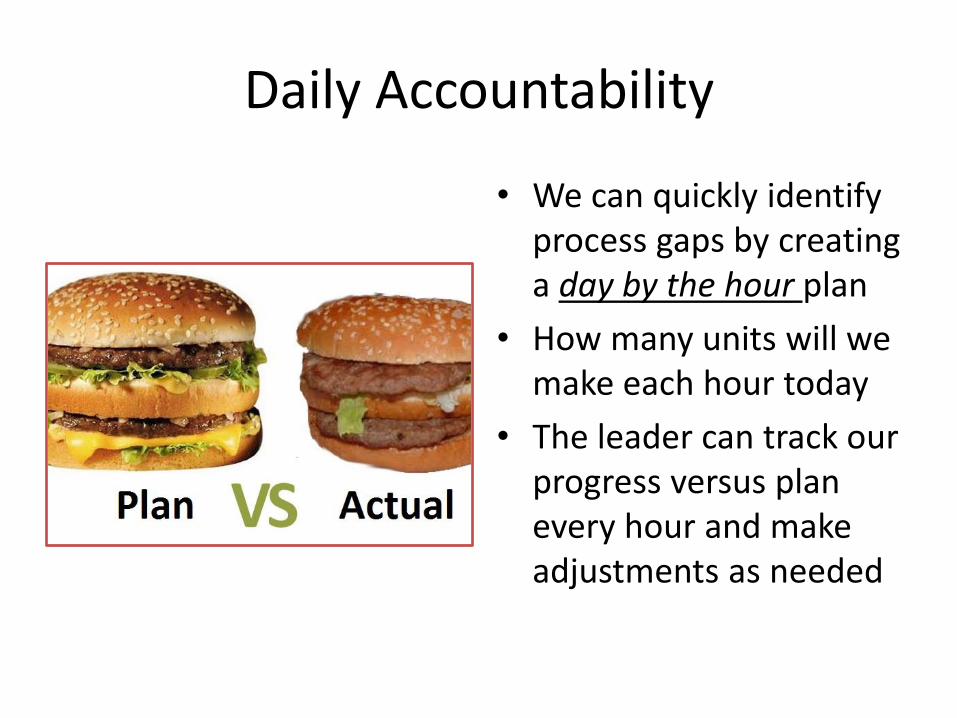
• We can quickly identify process gaps by creating a day by the hour plan
• How many units will we make each hour today
• The leader can track our progress versus plan every hour and make adjustments as needed
Daily Accountability
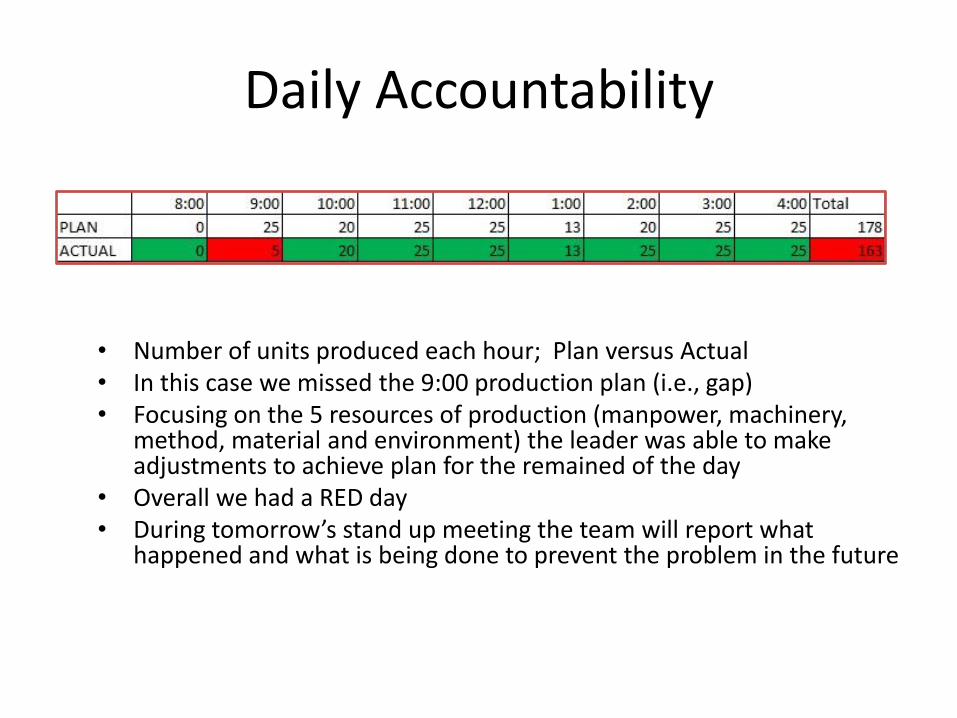
• Number of units produced each hour; Plan versus Actual • In this case we missed the 9:00 production plan (i.e., gap) • Focusing on the 5 resources of production (manpower, machinery,
method, material and environment) the leader was able to make adjustments to achieve plan for the remained of the day
• Overall we had a RED day • During tomorrow’s stand up meeting the team will report what
happened and what is being done to prevent the problem in the future
Daily Accountability
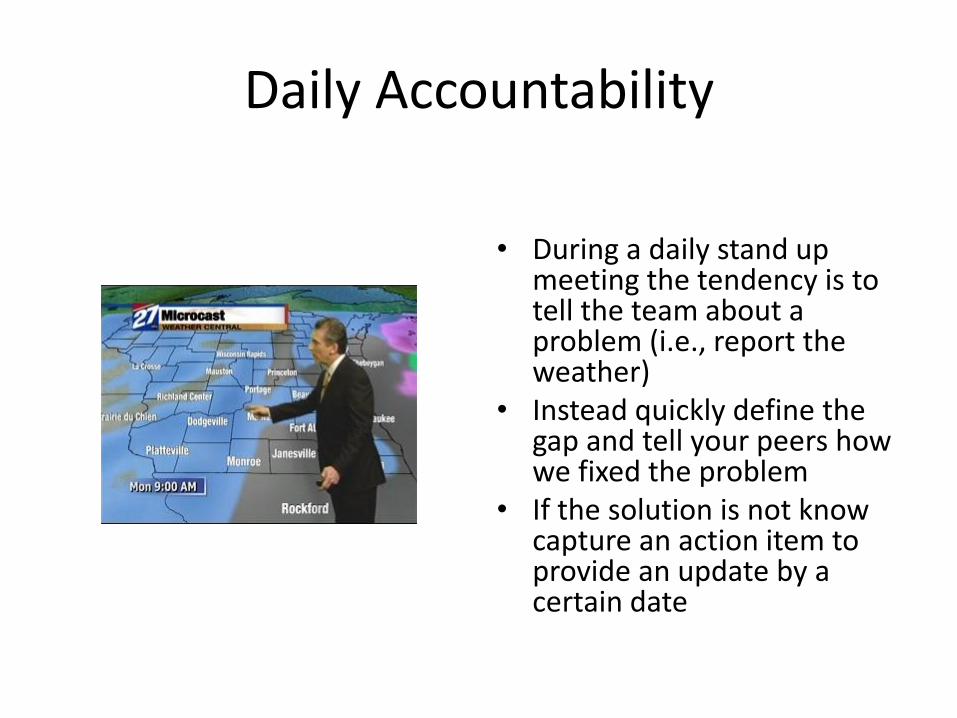
• During a daily stand up meeting the tendency is to tell the team about a problem (i.e., report the weather)
• Instead quickly define the gap and tell your peers how we fixed the problem
• If the solution is not know capture an action item to provide an update by a certain date
Traceability Matrix
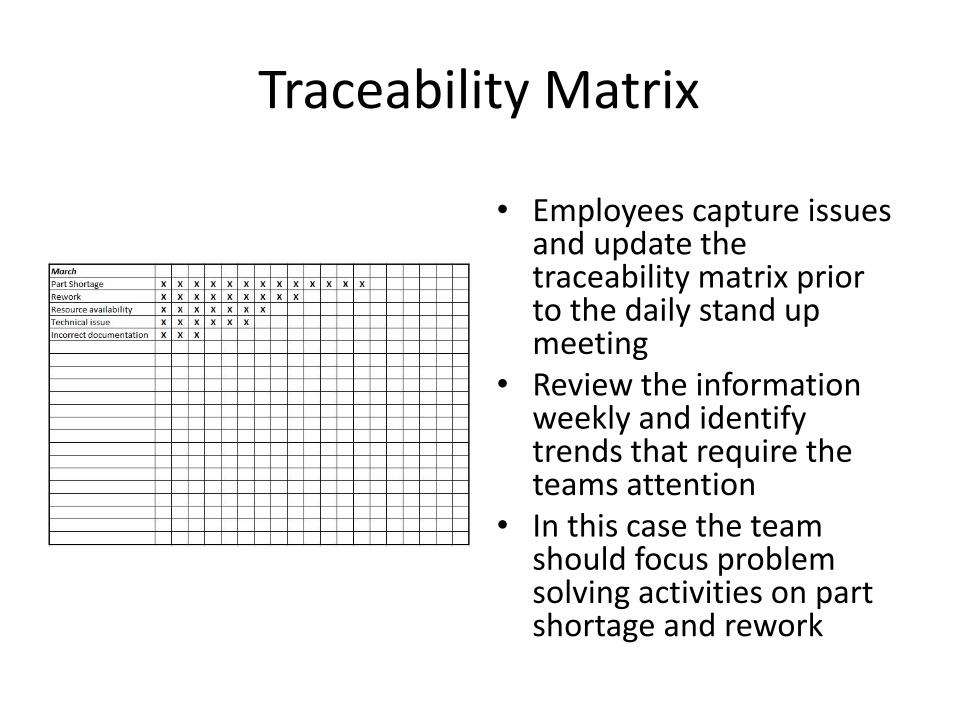
• Employees capture issues and update the traceability matrix prior to the daily stand up meeting
• Review the information weekly and identify trends that require the teams attention
• In this case the team should focus problem solving activities on part shortage and rework
Tiered Metric Boards
• An organization is made up of several teams and departments working together for a common goal
• Linking daily accountability meetings is a powerful method to improve communication & solve problems
Tiered Metric Boards
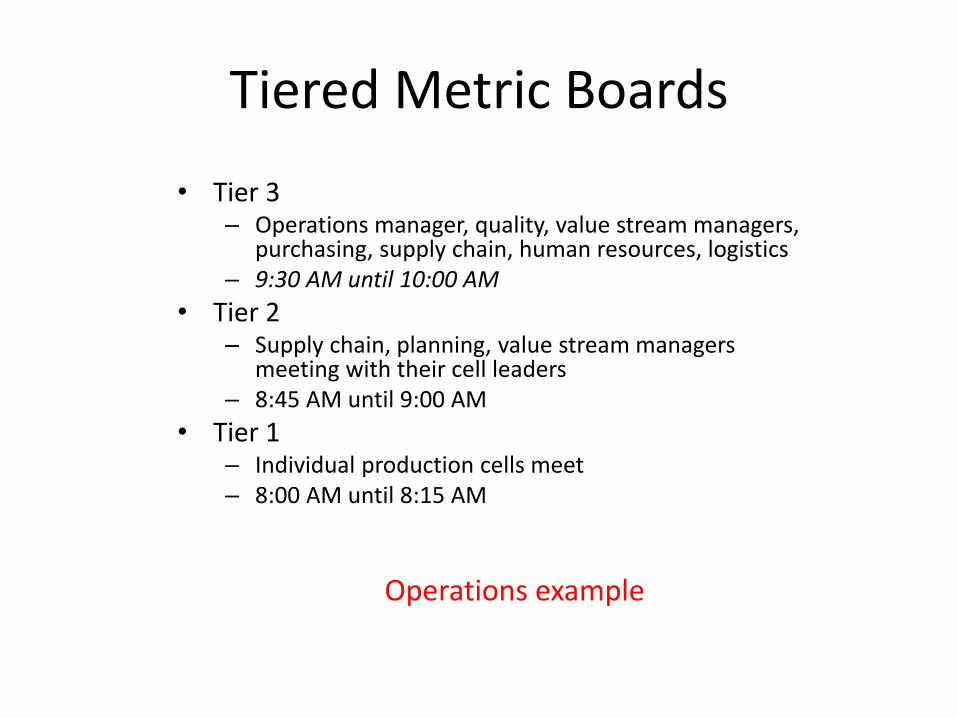
• Tier 3 – Operations manager, quality, value stream managers,
purchasing, supply chain, human resources, logistics – 9:30 AM until 10:00 AM
• Tier 2 – Supply chain, planning, value stream managers
meeting with their cell leaders – 8:45 AM until 9:00 AM
• Tier 1 – Individual production cells meet – 8:00 AM until 8:15 AM
Operations example