Embed Size (px)
Citation preview
Creating a Digital Food Price Index from Web Scraped Data
Paper submitted for the Ottawa Group conference meeting
Rio de Janeiro – Brazil
May 2019
Donal Lynch
Matthew Stansfield
Sam Olivecrona
Statistical Analysts, Prices, Accommodation, and Construction, Stats NZ
PO Box 2922
Wellington, New Zealand
www.stats.govt.nz
Disclaimer Conference papers represent the views of the authors, and do not imply commitment by Stats NZ to adopt any findings, methodologies, or recommendations. Any data analysis was carried out under the security and confidentiality provisions of the Statistics Act 1975.
Liability statement Stats NZ give no warranty that the information or data supplied in this paper is error free. All care and diligence has been used, however, in processing While all care and diligence has been used in processing, analysing, and extracting data and information. Statistics New Zealand will not be liable for any loss or damage suffered by customers consequent upon the use directly, or indirectly, or the information in this paper.
Reproduction of material Any table or other material published in this paper may be reproduced and published without further licence, provided that it does not purport to be published under government authority and that acknowledgement is made of this source.
Citation Lynch, D, Stansfield, M, & Olivecrona, S (2019). Creating a digital food price index from web-scraped data. Paper presented at the Ottawa Group Meeting, Rio de Janeiro, Brazil 2019.
Creating a Digital Food Price Index from Web Scraped Data
Abstract As part of Stats NZ’s initiative to explore alternative methods of collecting data for price indexes we have been investigating web scraped supermarket prices and transforming them into a monthly ‘Digital Food Price Index’. Stats NZ has recently purchased daily web-scraped online price data from PriceStats, the commercial counterpart of MIT’s Billion Prices Project. Preliminary research on measuring food price change from this data is used to illustrate our approach to using ‘big data’. This paper gives an overview of Stats NZ’s progress into web scraping for price collection and highlights the opportunities and obstacles of coverage, timing, and quality adjustment associated with using ‘big data’.
Introduction Many national statistical agencies have gained access to retailer transaction data. This data consists of a time series of all items purchased in store and the amount paid by the customer. One key feature of this data is that it contains the volume of sales in addition to the prices. This data is commonly referred to as scanner data. According to Chessa et al. (2017) there are currently 7 European countries incorporating scanner data into published Consumer Price Index (CPI), as well as Australia. Many other countries have access to the data and are actively developing methods to implement the data into their CPI calculations.
In addition to scanner data, web scraping has been brought to the attention of government statistical agencies for some time. The rise of online shopping has led to a rise in the potential for price collection via web scraping. As such, research in the area of online price collection and analysis through automated scrapers is very active amongst Ottawa group members.
As noted above, the primary difference between scanner data and web scraped data is that scanner data has prices and quantities of purchases, whereas web scraped data only contains the price information. Although Stats NZ does have scanner data from some retailers, the agency does not have any scanner data from supermarkets or for any food price data. Progress has been made in implementing some scanner and administrative data into published indexes. Krsinich (2015) uses the ITRYGEKS1 model to calculate consumer electronic price indexes and Krsinich (2011) uses administrative data and a THD2 model to produce an index for used cars. Bentley and Krsinich (2017) present case studies on all current applications of “big data” in published Stats NZ statistics. As an extension of this, Stats NZ has been investigating the viability of implementing web scraped data into the compilation of the monthly Food Price Index (FPI).
1 Imputation Törnqvist rolling year GEKS
2 Time Hedonic Dummy. More information on both of these methods in section 2
Creating a Digital Food Price Index from Web Scraped Data
Background Stats NZ produces a quarterly CPI and a monthly FPI. The food group makes up 19 percent of the quarterly CPI and the FPI therefore acts as a leading indicator for the quarterly data. A fixed basket of goods is used in our current production method for the FPI. This basket currently contains 162 items. Field officers visit supermarkets to collect prices for these items. Fresh fruit and vegetable prices are collected weekly, otherwise prices are collected monthly. If an item is not available, prices are imputed from the previous period. If the item is not available for a second consecutive period, the item is replaced with one of equivalent quality.
The reality is that the replacement item is chosen based on the officer’s best judgement, and so there is a subjective element to the replacement. The collected prices are then checked before being passed through a multiple stage quality assurance process. Because the sample of items is relatively small and the frequency of collection is relatively low, this data is easy to maintain and post-collection tasks are manageable for analysts.
One drawback with this bilateral approach is that it cannot easily adapt to the introduction of new or removal of old items, hence the fixed basket of goods for the FPI.
Motivation for exploring web scraped data • Current field collection uses a small selection of products which are judged to be
representative of all products purchased by consumers. However, consumers’ preferences and needs constantly change, and the fixed basket concept cannot easily accommodate this (The fixed basket is reviewed roughly every three years to account for changes in spending patterns).
• Emerging international best practise is to move away from a fixed basket. • Using a richer data source, such as web scraped data, would offer more ability to draw out
the drivers of change in the FPI and generate new insights. • Web scraped prices offer increased efficiencies in producing an index, with fewer field
collections and less post collection analysis.
The use of web scraped data offers the opportunity for real-time updating and the potential to do away with the concept of a fixed basket. However, there are also challenges with fixing quality and dealing with the fact that we do not know the quantities sold. Bilateral methods are not well suited to web scraped data where products may frequently drop out, and new products come in. Multilateral methods are the alternative to bilateral methods. Multilateral methods compare the current time period to recent time periods, and so accommodate new and disappearing products. Table 1 summarises the suitability of multilateral methods for calculating indexes based on two criteria:
• Are the characteristics available for each item? For example, in the case of used cars the available characteristics include features such as the age of the vehicle, the engine capacity, the number of kilometres on the odometer etc. Characteristics are not available for the web scraped supermarket data.
• Does the method control for new and disappearing prices? For the supermarket web scraped data we would ideally use a method which does account for changing products.
• Is the expenditure information available? Web scraped data does not contain this information.
Creating a Digital Food Price Index from Web Scraped Data
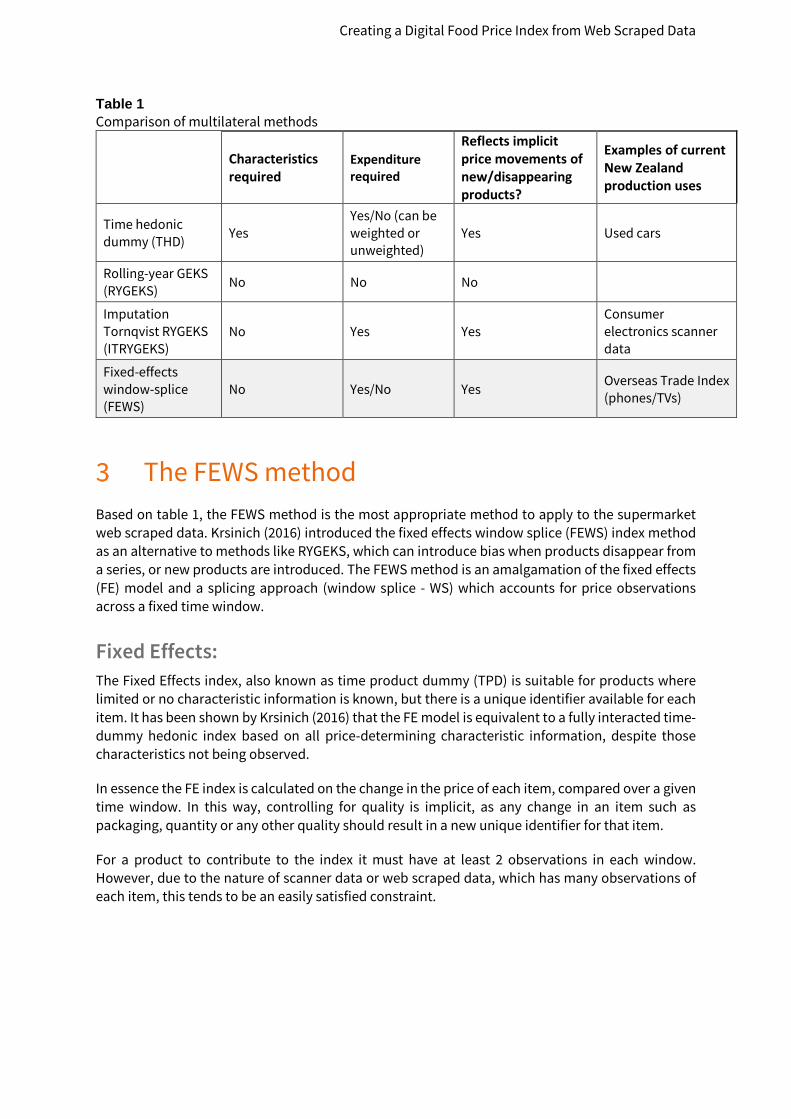
Table 1 Comparison of multilateral methods
Characteristics required
Expenditure required
Reflects implicit price movements of new/disappearing products?
Examples of current New Zealand production uses
Time hedonic dummy (THD) Yes
Yes/No (can be weighted or unweighted)
Yes Used cars
Rolling-year GEKS (RYGEKS) No No No
Imputation Tornqvist RYGEKS (ITRYGEKS)
No Yes Yes Consumer electronics scanner data
Fixed-effects window-splice (FEWS)
No Yes/No Yes Overseas Trade Index (phones/TVs)
The FEWS method Based on table 1, the FEWS method is the most appropriate method to apply to the supermarket web scraped data. Krsinich (2016) introduced the fixed effects window splice (FEWS) index method as an alternative to methods like RYGEKS, which can introduce bias when products disappear from a series, or new products are introduced. The FEWS method is an amalgamation of the fixed effects (FE) model and a splicing approach (window splice - WS) which accounts for price observations across a fixed time window.
Fixed Effects: The Fixed Effects index, also known as time product dummy (TPD) is suitable for products where limited or no characteristic information is known, but there is a unique identifier available for each item. It has been shown by Krsinich (2016) that the FE model is equivalent to a fully interacted time-dummy hedonic index based on all price-determining characteristic information, despite those characteristics not being observed.
In essence the FE index is calculated on the change in the price of each item, compared over a given time window. In this way, controlling for quality is implicit, as any change in an item such as packaging, quantity or any other quality should result in a new unique identifier for that item.
For a product to contribute to the index it must have at least 2 observations in each window. However, due to the nature of scanner data or web scraped data, which has many observations of each item, this tends to be an easily satisfied constraint.
Creating a Digital Food Price Index from Web Scraped Data
Splicing: In the TPD method a fixed window length is chosen. The choice of window length can be non-trivial. Bentley (2018) found that the choice of window length significantly influenced an index for home rental prices, whereas Chessa et al. (2017) found that window length choice had a small effect on scanner data. Our findings for the effect of window length on web scraped data are shown in section 5. An FE index is then calculated over that window. The window is shifted forward by one time period, and the index is recalculated. Thus there is an overlap between the windows of window length - 1 time periods. In order to form a continuous time series index, these windows must be chained together, while maintaining the no revision constraint which applies to most national consumer price indexes.
Ivancic, Diewert and Fox (2009) suggest splicing the windows together based on the final time period as the best approach. This became known as the movement splice. Krsinich (2016) suggests a better approach is to use the second time period in the window to splice the windows together, and calls this a window splice. De Haan (2015) suggests that the time position for splicing should be the middle of the window, which became known as the half splice. Diewert and Fox (2017) point out that an argument can be made for any time period in a window to be a suitable splice position, and the “best” approach is to take the geometric mean of all possible splice positions. This is known as a mean splice.
Web scraping and the PriceStats data Statistics New Zealand currently purchases web scraped price data from PriceStats, the commercial counterpart of MIT’s Billion Prices Project. The dataset consists of daily web scraped data from 14 New Zealand online retailers, each of which also have physical stores. In our work developing a digital food price index we have focused on the data from two supermarkets1. The supermarket data dates back to early 2014 for one of the retailer and mid 2016 for the other. The data is collated into daily tables with one row per price observation and the following columns:
1 New Zealand has two major supermarket enterprises – each with retail outlets under three different banners. Only one banner from each enterprise offers online shopping.
Creating a Digital Food Price Index from Web Scraped Data
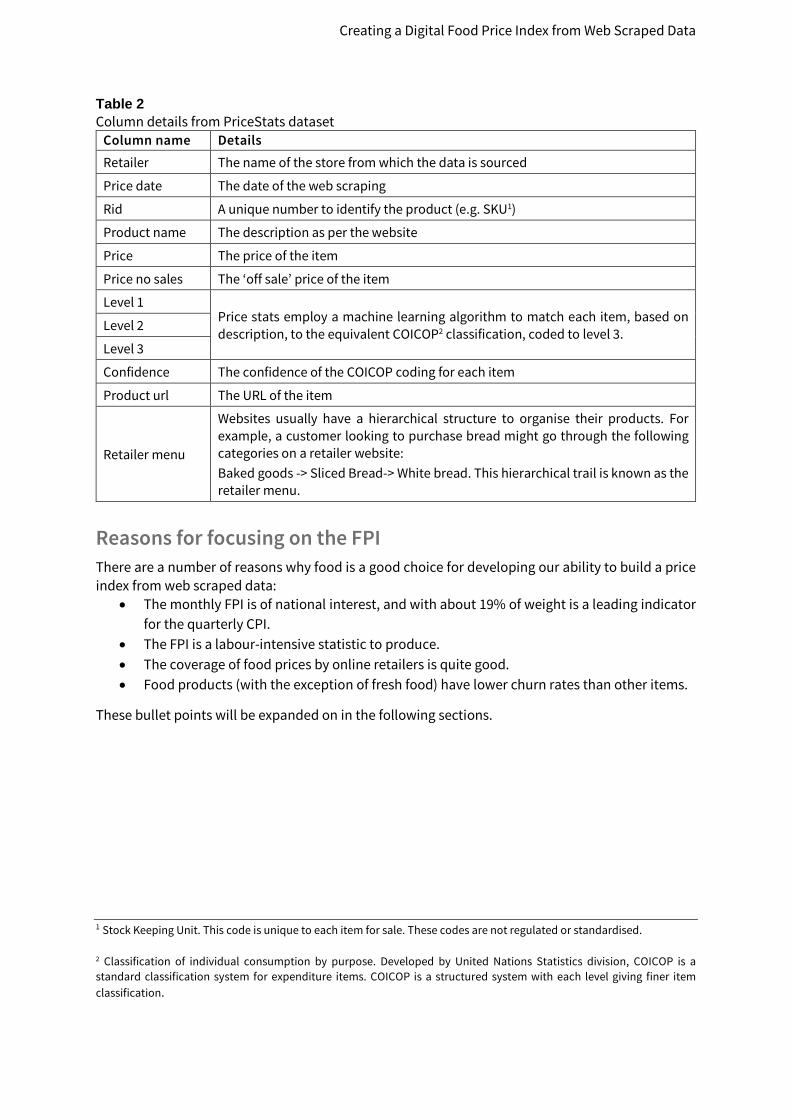
Table 2 Column details from PriceStats dataset
Column name Details Retailer The name of the store from which the data is sourced
Price date The date of the web scraping
Rid A unique number to identify the product (e.g. SKU1)
Product name The description as per the website
Price The price of the item
Price no sales The ‘off sale’ price of the item
Level 1 Price stats employ a machine learning algorithm to match each item, based on description, to the equivalent COICOP2 classification, coded to level 3. Level 2
Level 3
Confidence The confidence of the COICOP coding for each item
Product url The URL of the item
Retailer menu
Websites usually have a hierarchical structure to organise their products. For example, a customer looking to purchase bread might go through the following categories on a retailer website: Baked goods -> Sliced Bread-> White bread. This hierarchical trail is known as the retailer menu.
Reasons for focusing on the FPI There are a number of reasons why food is a good choice for developing our ability to build a price index from web scraped data:
• The monthly FPI is of national interest, and with about 19% of weight is a leading indicator for the quarterly CPI.
• The FPI is a labour-intensive statistic to produce. • The coverage of food prices by online retailers is quite good. • Food products (with the exception of fresh food) have lower churn rates than other items.
These bullet points will be expanded on in the following sections.
1 Stock Keeping Unit. This code is unique to each item for sale. These codes are not regulated or standardised.
2 Classification of individual consumption by purpose. Developed by United Nations Statistics division, COICOP is a standard classification system for expenditure items. COICOP is a structured system with each level giving finer item classification.
Creating a Digital Food Price Index from Web Scraped Data
National Interest Food is one of only two components of the CPI which is published on a monthly basis, the other being rent. The reasons for this are:
• A quarterly index does not carry enough resolution for the seasonality of food prices and their fluctuations.
• The price of food is important to many government agencies and New Zealand residents alike.
• The FPI has a weight of about 19% of the CPI, and is a leading indicator for the quarterly CPI.
Potential efficiencies In using web scraped data to produce an FPI there would be fewer visits to stores and less post collection analysis required. As part of our examination of the data we have also considered the possibility of directly substituting web scraped data into the current FPI methodology. This alternative mode of collection could only be used in those banners with online shopping available. Field officers would still be required for banners with no online shopping option. In order for this option to be viable the following conditions must be met:
• Supermarket prices do not vary significantly by region, • Online prices are the same as instore prices.
Research carried out in Australia by Waschka, Milne et al. (2003) shows that online supermarket prices have very little variation-neither regionally nor between online stores and physical locations. Cavallo (2017) conducted a large-scale review of online prices versus in store prices in 10 countries. He found that “Price levels are identical 72% of the time” and that price changes are not synchronized but have similar frequencies and average amounts. At Stats NZ we have also undertaken our own assessment of the price differences between field-collected supermarket prices and web scraped prices. Our findings match those of ABS. The majority of price discrepancies between online and field collected prices can be accounted for by the uncertainty in the date of field collection. Sally Copland, head of online at Countdown (one of the major banner brands), stated that prices are the same online as in store (NZ Herald 2017).
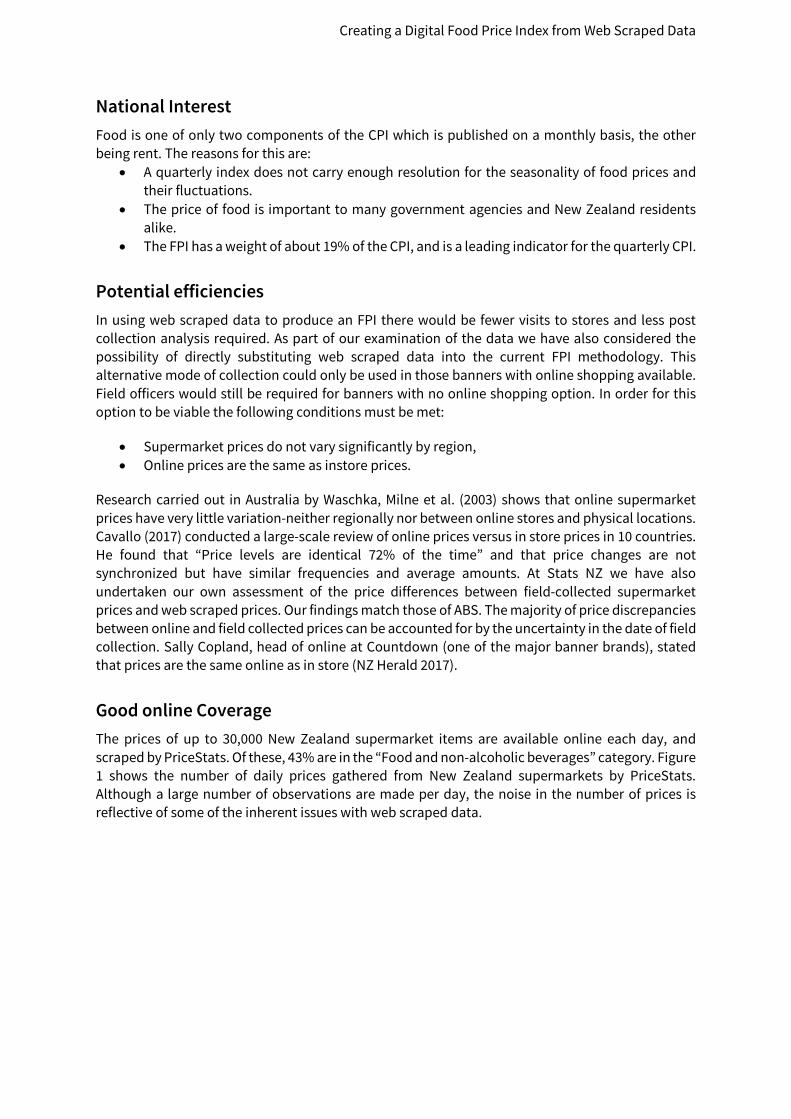
Good online Coverage The prices of up to 30,000 New Zealand supermarket items are available online each day, and scraped by PriceStats. Of these, 43% are in the “Food and non-alcoholic beverages” category. Figure 1 shows the number of daily prices gathered from New Zealand supermarkets by PriceStats. Although a large number of observations are made per day, the noise in the number of prices is reflective of some of the inherent issues with web scraped data.
Creating a Digital Food Price Index from Web Scraped Data
Figure 1 Number of supermarket prices web scraped per day
There are several step changes in the graph. The details of these are outlined below: • 2014 Q3: PriceStats refining their web scraping method. Data only collected from one
retailer • 2015 Q1: Further improvements to the PriceStats web scraping routine • 2016 Q1: More prices introduced by one retailer/banner • 2016 Q2: A second supermarket enterprise makes prices available online • 2017 Q3: One retailer/banner removes their website sales and moves to app-based system
which neither Stats NZ nor PriceStats currently have the capability to scrape.
In addition to the step changes due to observable events, there is a large day to day variability. Some potential reasons for discontinuous data may be:
• The website changing its layout in some way and the web scraper will have to be modified to reflect that change
• The retailer adding or removing items from its online offerings • An issue with the scraping code or server • The website going offline • The retailer discontinuing their online shopping service.
This graph shows some of the inherent risks of using web scraped data. As a national statistics agency we must be confident of data being available for published indexes. Whether this threshold of confidence can be met by supermarket website data remains to be seen – particularly given the small market in New Zealand.
Creating a Digital Food Price Index from Web Scraped Data
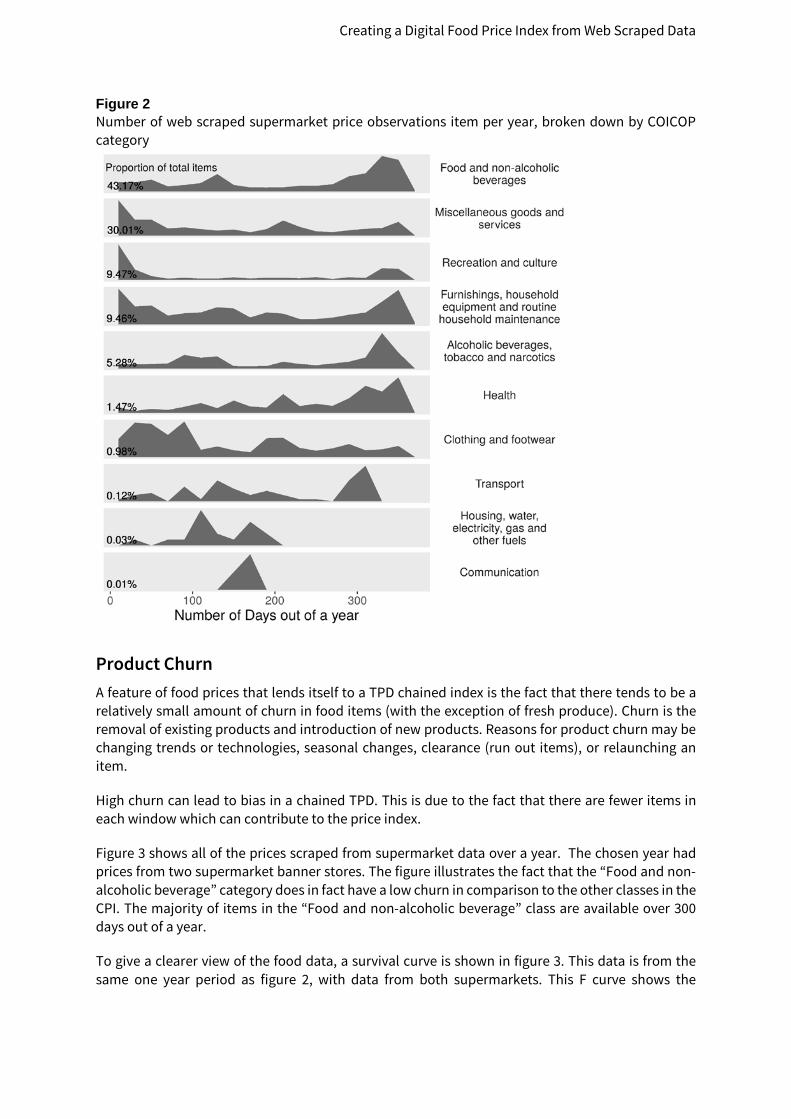
Figure 2 Number of web scraped supermarket price observations item per year, broken down by COICOP category
Product Churn A feature of food prices that lends itself to a TPD chained index is the fact that there tends to be a relatively small amount of churn in food items (with the exception of fresh produce). Churn is the removal of existing products and introduction of new products. Reasons for product churn may be changing trends or technologies, seasonal changes, clearance (run out items), or relaunching an item.
High churn can lead to bias in a chained TPD. This is due to the fact that there are fewer items in each window which can contribute to the price index.
Figure 3 shows all of the prices scraped from supermarket data over a year. The chosen year had prices from two supermarket banner stores. The figure illustrates the fact that the “Food and non-alcoholic beverage” category does in fact have a low churn in comparison to the other classes in the CPI. The majority of items in the “Food and non-alcoholic beverage” class are available over 300 days out of a year.
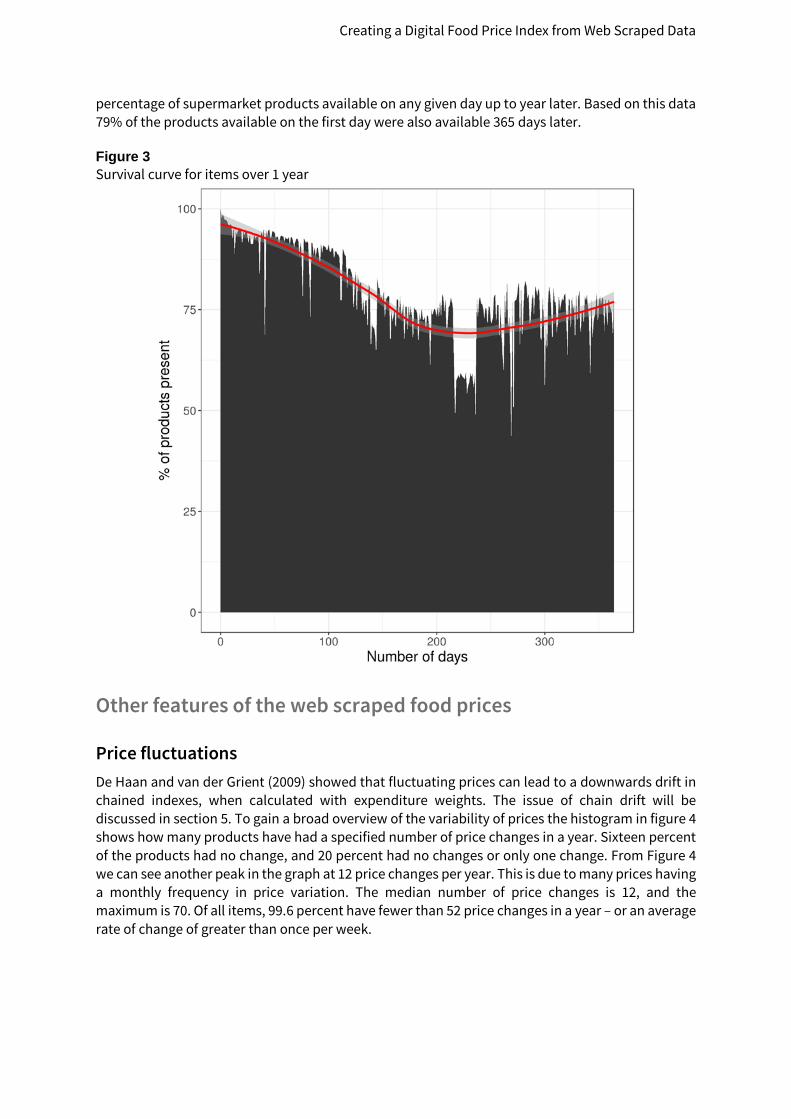
To give a clearer view of the food data, a survival curve is shown in figure 3. This data is from the same one year period as figure 2, with data from both supermarkets. This F curve shows the
Creating a Digital Food Price Index from Web Scraped Data
percentage of supermarket products available on any given day up to year later. Based on this data 79% of the products available on the first day were also available 365 days later.
Figure 3 Survival curve for items over 1 year
Other features of the web scraped food prices
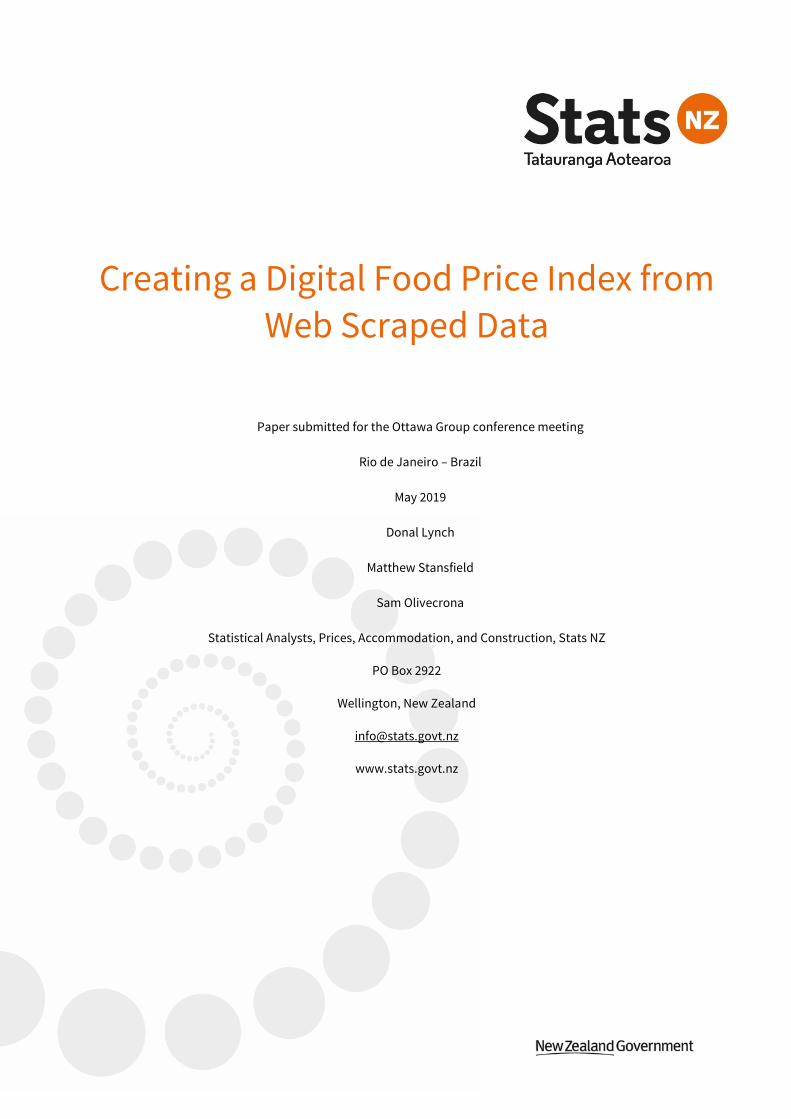
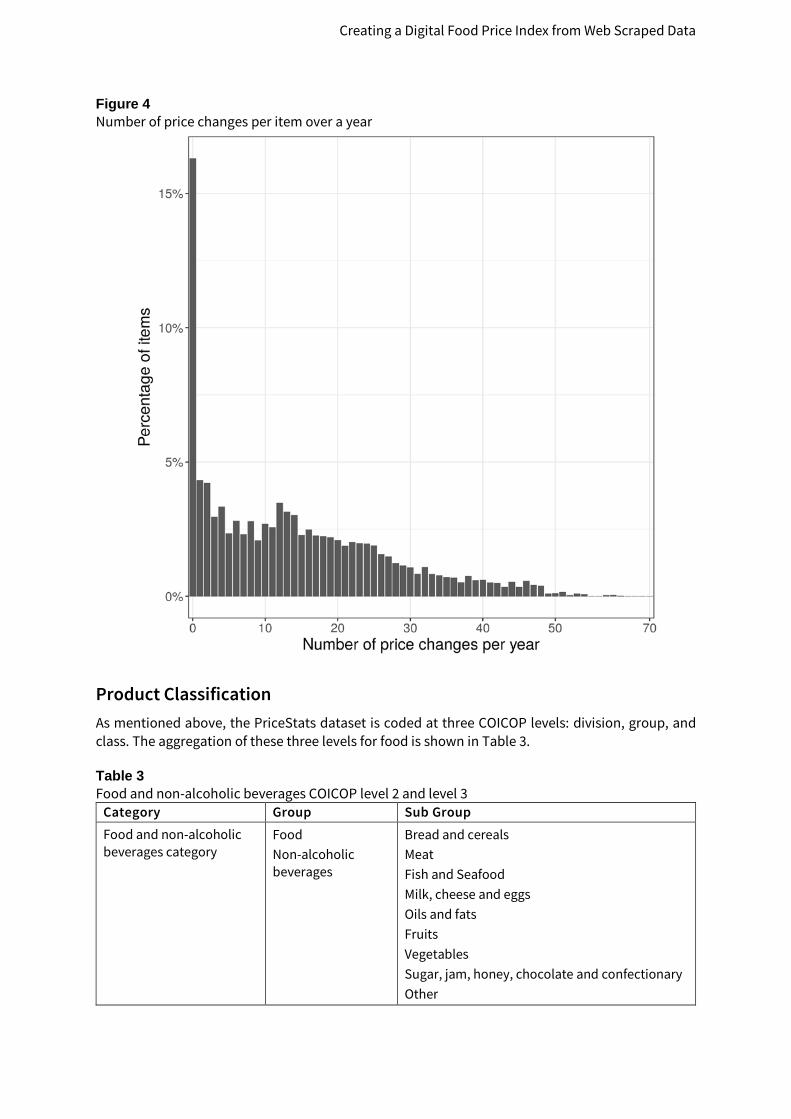
Price fluctuations De Haan and van der Grient (2009) showed that fluctuating prices can lead to a downwards drift in chained indexes, when calculated with expenditure weights. The issue of chain drift will be discussed in section 5. To gain a broad overview of the variability of prices the histogram in figure 4 shows how many products have had a specified number of price changes in a year. Sixteen percent of the products had no change, and 20 percent had no changes or only one change. From Figure 4 we can see another peak in the graph at 12 price changes per year. This is due to many prices having a monthly frequency in price variation. The median number of price changes is 12, and the maximum is 70. Of all items, 99.6 percent have fewer than 52 price changes in a year – or an average rate of change of greater than once per week.
Creating a Digital Food Price Index from Web Scraped Data
Figure 4 Number of price changes per item over a year
Product Classification As mentioned above, the PriceStats dataset is coded at three COICOP levels: division, group, and class. The aggregation of these three levels for food is shown in Table 3.
Table 3 Food and non-alcoholic beverages COICOP level 2 and level 3
Category Group Sub Group Food and non-alcoholic beverages category
Food Non-alcoholic beverages
Bread and cereals Meat Fish and Seafood Milk, cheese and eggs Oils and fats Fruits Vegetables Sugar, jam, honey, chocolate and confectionary Other
Creating a Digital Food Price Index from Web Scraped Data
To provide a rudimentary look into the accuracy of the coding, a random sample of 100 items was chosen from all data in the supermarket dataset, and coded manually. Table 4 shows the accuracy rates which were found.
Table 4
Accuracies of COICOP labelling Accuracies of labels across entire supermarkets data set level Category Group Sub Group Accuracy 82% 78% 67% Accuracies of labels across ‘Food and non-alcoholic beverages’ category level Category Group Sub Group Accuracy 100% 100% 88%
While the sample is relatively small the above results indicate the coding accuracies are quite good among the food and non-alcoholic beverages group (although it is worth noting that the level of aggregation is still quite high). An element of future work will be to build a classification algorithm to classify products down to a lower level. Lower level classification would be useful for drawing out meaning insights from changes in the FPI.
Practical considerations Although the chained TPD does show great promise in calculating an index from web scraped data, there are some issues which must be considered.
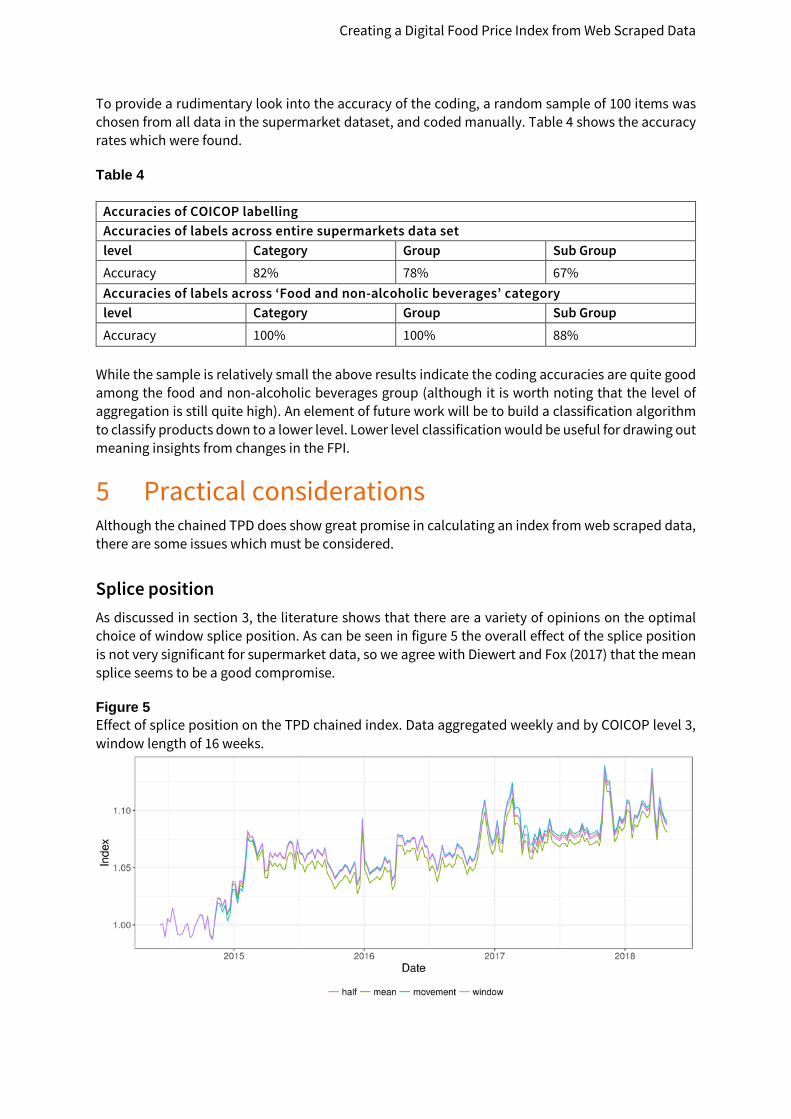
Splice position As discussed in section 3, the literature shows that there are a variety of opinions on the optimal choice of window splice position. As can be seen in figure 5 the overall effect of the splice position is not very significant for supermarket data, so we agree with Diewert and Fox (2017) that the mean splice seems to be a good compromise.
Figure 5 Effect of splice position on the TPD chained index. Data aggregated weekly and by COICOP level 3, window length of 16 weeks.
Creating a Digital Food Price Index from Web Scraped Data
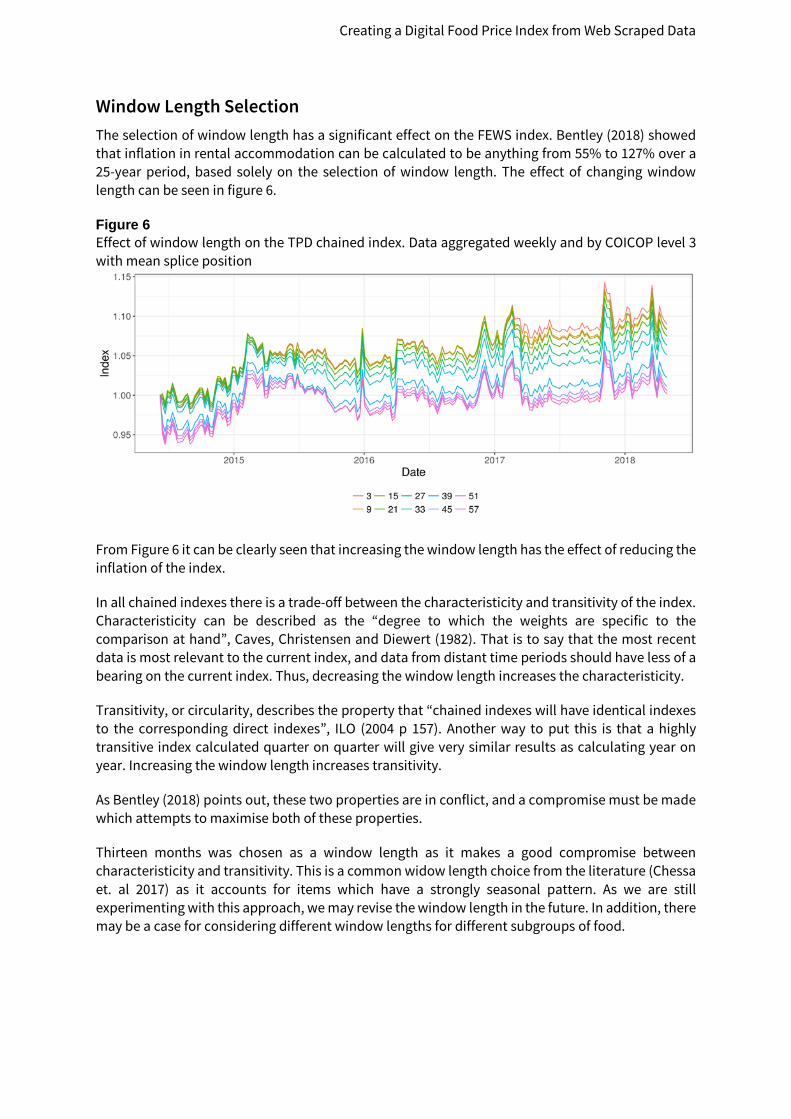
Window Length Selection The selection of window length has a significant effect on the FEWS index. Bentley (2018) showed that inflation in rental accommodation can be calculated to be anything from 55% to 127% over a 25-year period, based solely on the selection of window length. The effect of changing window length can be seen in figure 6.
Figure 6 Effect of window length on the TPD chained index. Data aggregated weekly and by COICOP level 3 with mean splice position
From Figure 6 it can be clearly seen that increasing the window length has the effect of reducing the inflation of the index.
In all chained indexes there is a trade-off between the characteristicity and transitivity of the index. Characteristicity can be described as the “degree to which the weights are specific to the comparison at hand”, Caves, Christensen and Diewert (1982). That is to say that the most recent data is most relevant to the current index, and data from distant time periods should have less of a bearing on the current index. Thus, decreasing the window length increases the characteristicity.
Transitivity, or circularity, describes the property that “chained indexes will have identical indexes to the corresponding direct indexes”, ILO (2004 p 157). Another way to put this is that a highly transitive index calculated quarter on quarter will give very similar results as calculating year on year. Increasing the window length increases transitivity.
As Bentley (2018) points out, these two properties are in conflict, and a compromise must be made which attempts to maximise both of these properties.
Thirteen months was chosen as a window length as it makes a good compromise between characteristicity and transitivity. This is a common widow length choice from the literature (Chessa et. al 2017) as it accounts for items which have a strongly seasonal pattern. As we are still experimenting with this approach, we may revise the window length in the future. In addition, there may be a case for considering different window lengths for different subgroups of food.
Creating a Digital Food Price Index from Web Scraped Data
Price imputation The approach to dealing with missing data from entire time periods (days, weeks, or months) is another consideration related to the chained TPD index. As discussed earlier there is always the chance that there will be discontinuities in web scraped data. Price imputation is only required where there are time periods with no available data at all. There are several options for dealing with this issue. One such method is carrying the last day forward until new data becomes available.
Another method for dealing with missing values is to aggregate the prices over some time period, e.g. a week or a month for prices collected daily. This will have the benefit of imputing any number of missing time periods, so long as the missing period is shorter than the aggregation time period. An additional consequence of this approach is that time aggregation will decrease the volatility of the index at the expense of losing resolution on the time scale.
At Stats NZ we have not yet had to deal with entire time periods with no data. However, we would have aggregated by the month to account for missing time periods had this issue arisen.
Chain drift Chain drift occurs if a chained index “does not return to unity when prices in the current period return to their levels in the base period” ILO (2004, p. 445). Chain drift is an issue commonly observed in chained indexes. The most pronounced cause of chain drift is clearance items. Clearance items are items that are sharply discounted and then removed from stores. They should not be currently used in the CPI as stated by ILO (2004, p. 487).
Clearance items cause chain drift through the following mechanism: • As the price drops the index value is reduced. • When the clearance item drops out, there is no effect to reverse the decrease and the
chained index remains supressed. • Although each clearance item may only have a slight effect on overall index, the fact that
this effect is cumulative causes the chain drift.
Many statistical agencies remove clearance items with the aid of expenditure information from scanner data. Loon and Roels (2018) apply filters such as excluding products with a sharp decrease in sales and in price, and excluding products with a sharp decrease in sales with a constant price to remove clearance items from their calculations.
It is worth noting that Loon and Roels (2018) tested the effect of expenditure weights on their CPI calculations from scanner data. They found that after removing clearance items, the calculation with weights gave very similar results to that without weights, at a high level. The same result was found by van der Grient and de Haan (2011). These are encouraging results for a web scraped FPI which must be calculated without expenditure weights.
When using web scraped data the options of filtering out clearance items are not available due to the absence of expenditure information. Another approach to combat chain drift is to aggregate the products into groups of items of similar quality. If a group contains an item which does go on clearance, the average price of the group will decrease as the price drops. However, once the clearance item has been removed from the store the group average should return to the pre-clearance price, thus eliminating chain drift.
Creating a Digital Food Price Index from Web Scraped Data
One important point is that by aggregating items, there is an implicit assumption that all items in each group are items are of equal quality. By aggregating at too coarse a level, items of differing qualities may be included in the same group. This would violate the constant quality property of the FPI.
Coverage and data reliability In early 2018 one of the supermarket banners in our investigation ceased offering online shopping and moved to an app based service, which neither Stats NZ nor PriceStats are currently able to scrape. More recently, they have resurrected their on-line offering, and another of the enterprise’s banners will also be offering on-line shopping in the near future. However, this highlights the high degree of vulnerability in relying on web scraped data where there is no security of supply. With supermarkets in New Zealand we are particularly vulnerable to some stores/banners going offline due to lack of operators in this sector. By contrast, with electronic goods there are numerous retailers, so the addition or removal of one store would not constitute a significant change to the overall landscape.
As discussed in section 4, the FPI is of national importance and so the continuity of the index is imperative. If, for any reason, Stats NZ was unable to gather web scraped data in a time period it would represent a major failure for the agency. Assurances or contingencies for the absence of web scraped data are required before we could commit to only using web scraped data. Examples of contingency plans include:
• Continuing to field collect prices, but only at a limited number of stores. • Engaging with retailers to see if they can provide some assurances that they plan to
continue offering web-based shopping, or at least that we will be given advanced warning should they plan to desist.
Creating a Digital Food Price Index from Web Scraped Data
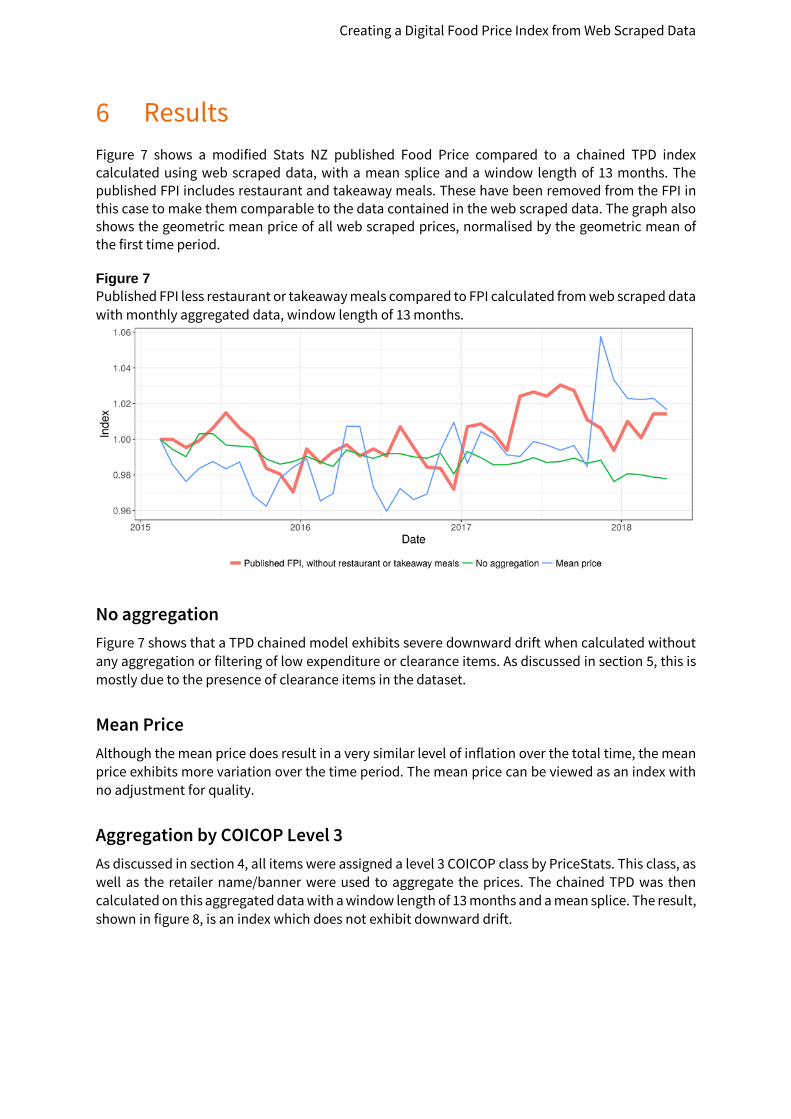
Results Figure 7 shows a modified Stats NZ published Food Price compared to a chained TPD index calculated using web scraped data, with a mean splice and a window length of 13 months. The published FPI includes restaurant and takeaway meals. These have been removed from the FPI in this case to make them comparable to the data contained in the web scraped data. The graph also shows the geometric mean price of all web scraped prices, normalised by the geometric mean of the first time period.
Figure 7 Published FPI less restaurant or takeaway meals compared to FPI calculated from web scraped data with monthly aggregated data, window length of 13 months.
No aggregation Figure 7 shows that a TPD chained model exhibits severe downward drift when calculated without any aggregation or filtering of low expenditure or clearance items. As discussed in section 5, this is mostly due to the presence of clearance items in the dataset.
Mean Price Although the mean price does result in a very similar level of inflation over the total time, the mean price exhibits more variation over the time period. The mean price can be viewed as an index with no adjustment for quality.
Aggregation by COICOP Level 3 As discussed in section 4, all items were assigned a level 3 COICOP class by PriceStats. This class, as well as the retailer name/banner were used to aggregate the prices. The chained TPD was then calculated on this aggregated data with a window length of 13 months and a mean splice. The result, shown in figure 8, is an index which does not exhibit downward drift.
Creating a Digital Food Price Index from Web Scraped Data
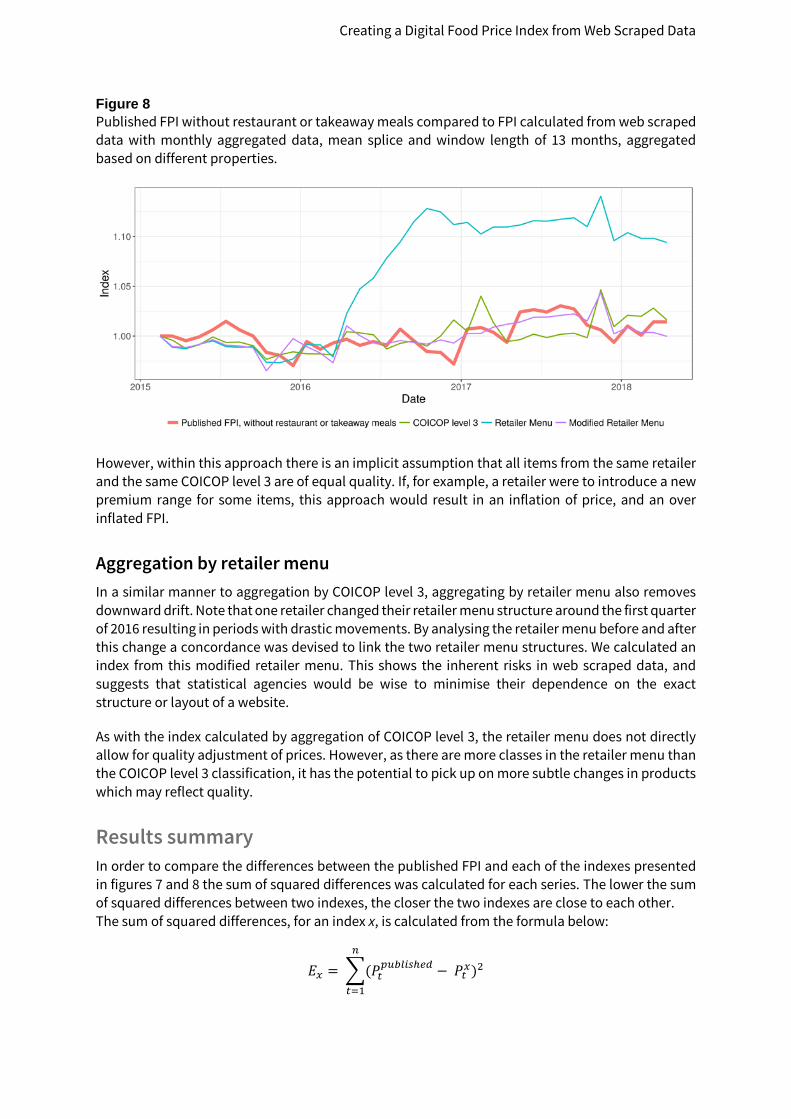
Figure 8 Published FPI without restaurant or takeaway meals compared to FPI calculated from web scraped data with monthly aggregated data, mean splice and window length of 13 months, aggregated based on different properties.
However, within this approach there is an implicit assumption that all items from the same retailer and the same COICOP level 3 are of equal quality. If, for example, a retailer were to introduce a new premium range for some items, this approach would result in an inflation of price, and an over inflated FPI.
Aggregation by retailer menu In a similar manner to aggregation by COICOP level 3, aggregating by retailer menu also removes downward drift. Note that one retailer changed their retailer menu structure around the first quarter of 2016 resulting in periods with drastic movements. By analysing the retailer menu before and after this change a concordance was devised to link the two retailer menu structures. We calculated an index from this modified retailer menu. This shows the inherent risks in web scraped data, and suggests that statistical agencies would be wise to minimise their dependence on the exact structure or layout of a website.
As with the index calculated by aggregation of COICOP level 3, the retailer menu does not directly allow for quality adjustment of prices. However, as there are more classes in the retailer menu than the COICOP level 3 classification, it has the potential to pick up on more subtle changes in products which may reflect quality.
Results summary In order to compare the differences between the published FPI and each of the indexes presented in figures 7 and 8 the sum of squared differences was calculated for each series. The lower the sum of squared differences between two indexes, the closer the two indexes are close to each other. The sum of squared differences, for an index x, is calculated from the formula below:
𝐸𝐸𝑥𝑥 = �(𝑃𝑃𝑡𝑡𝑝𝑝𝑝𝑝𝑝𝑝𝑝𝑝𝑝𝑝𝑝𝑝ℎ𝑒𝑒𝑒𝑒 − 𝑃𝑃𝑡𝑡𝑥𝑥)2
𝑛𝑛
𝑡𝑡=1
Creating a Digital Food Price Index from Web Scraped Data
Where: Ex = Sum of squared differences for index x n = Number of available time periods P published = The Stats NZ published FPI P x = The index for which the squared difference is being calcaulted
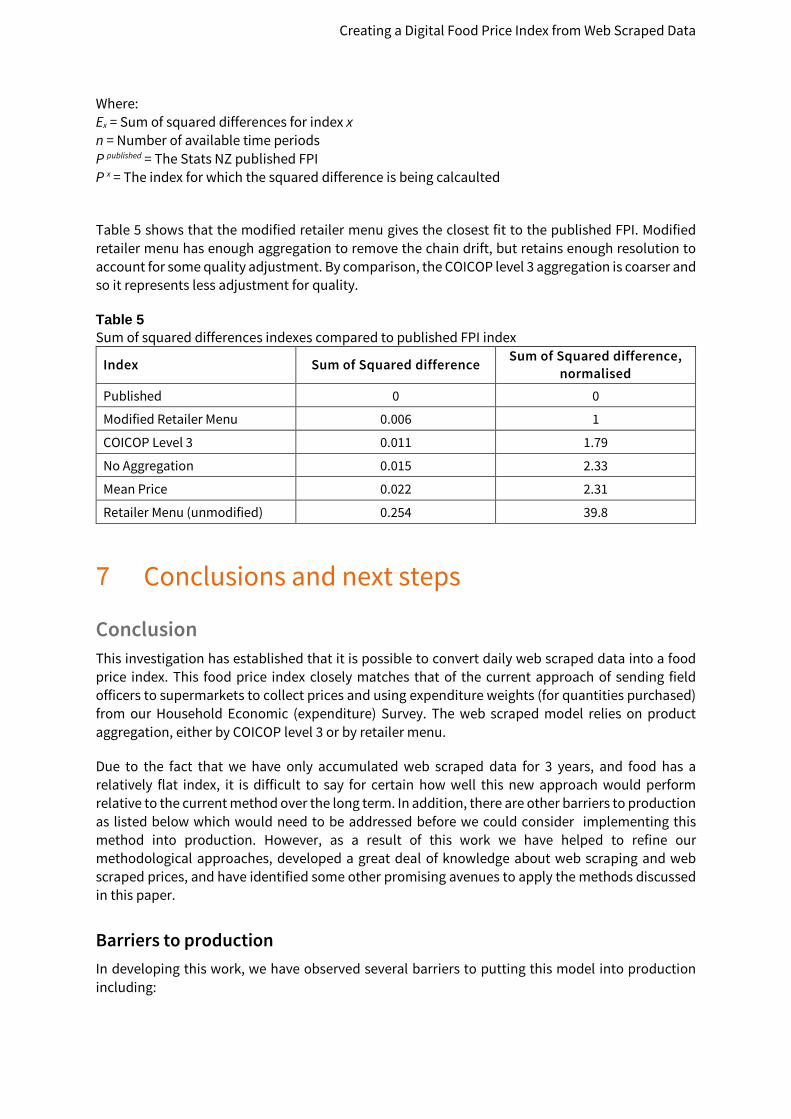
Table 5 shows that the modified retailer menu gives the closest fit to the published FPI. Modified retailer menu has enough aggregation to remove the chain drift, but retains enough resolution to account for some quality adjustment. By comparison, the COICOP level 3 aggregation is coarser and so it represents less adjustment for quality.
Table 5 Sum of squared differences indexes compared to published FPI index
Index Sum of Squared difference Sum of Squared difference, normalised
Published 0 0
Modified Retailer Menu 0.006 1
COICOP Level 3 0.011 1.79
No Aggregation 0.015 2.33
Mean Price 0.022 2.31
Retailer Menu (unmodified) 0.254 39.8
Conclusions and next steps
Conclusion This investigation has established that it is possible to convert daily web scraped data into a food price index. This food price index closely matches that of the current approach of sending field officers to supermarkets to collect prices and using expenditure weights (for quantities purchased) from our Household Economic (expenditure) Survey. The web scraped model relies on product aggregation, either by COICOP level 3 or by retailer menu.
Due to the fact that we have only accumulated web scraped data for 3 years, and food has a relatively flat index, it is difficult to say for certain how well this new approach would perform relative to the current method over the long term. In addition, there are other barriers to production as listed below which would need to be addressed before we could consider implementing this method into production. However, as a result of this work we have helped to refine our methodological approaches, developed a great deal of knowledge about web scraping and web scraped prices, and have identified some other promising avenues to apply the methods discussed in this paper.
Barriers to production In developing this work, we have observed several barriers to putting this model into production including:
Creating a Digital Food Price Index from Web Scraped Data
• Exposing Stats NZ and the FPI and CPI to reliance on a small number of on-line providers. Assurances or contingencies for the absence of web-scraped data are required before we could commit to only using web scraped data.
• The inherent risks of dependence on a particular on-line layout or structure. • The on-going costs of purchasing web-scraped data in an environment of tightening fiscal
constraint. • Continued reliance on the three yearly Household Economic Survey for expenditure
weights. This is in an environment where it’s getting harder and harder to achieve viable response rates.
• By introducing broad aggregation to COICOP level 3, quality adjustment has largely been removed. Flower (2017) showed the ONS has developed the CLIP (Clustering Large datasets Into Price Indices) method which clusters like products together based on web scraped features and aggregates them to calculate an index. A similar approach to this could be developed to categorise like products together, with these groups’ categories being fine enough to have an implicit quality associated with them.
Next Steps Stats NZ intends to continue working on “big data” approaches to indexes. Some promising example areas for exploration are:
• Engaging with retailers to discuss more reliable data sources. • Investigating the potential to apply the chained TPD to the overseas trade index (OTI) (this
is showing great promise). • Exploring the potential to use web-scraped prices for household goods (where they are a
larger number of providers). • Stats NZ currently purchases some scanner data for other non-food products. We intend to
explore using web scraped data and the chained TPD with a view to replace the purchased data.
References Bentley, A (2018), “Rentals for Housing: A model-based estimator of inflation from administrative data”, Paper presented at the UNECE Meeting of the Group of Experts on Consumer Price Indices 7-9 May 2018, Geneva
Bentley, A. Krsinich, F (2017) “Towards a big data CPI for New Zealand”, Paper presented at the fifteenth meeting of the Ottawa Group, 9-12 May 2017, Eltville, Germany
Bhardwaj, H. Flower, T. Lee, P. and Mayhew, M (2017) “Research indices using web scraped price data: A summary of the ongoing research into using web scraped price data in the production and development of consumer price statistics”, ONS Research Article, assessed on 11 June 2018 from https://www.ons.gov.uk/economy/inflationandpriceindices/articles/researchindicesusingwebscrapedpricedata/august2017update
Cavallo, A (2017) “Are Online and Offline Prices Similar? Evidence from Large Multi-channel Retailers” American Economic Review, 107 (1): 283-303.
Creating a Digital Food Price Index from Web Scraped Data
Caves, DW. Laurits RC and Diewert WE (1982) “The Economic Theory of Index Numbers and the Measurement of Input, Output, and Productivity”,Econometrica, 50, issue 6, p. 1393-1414.The Economic Theory of Index Numbers and the Measurement of Input, Output, and Productivity
Chessa, AG. Verburg, J. Wllenborg, L (2017) “A comparison of price index methods for scanner data” Paper presented at the fifteenth meeting of the Ottawa Group, 9-12 May 2017, Eltville.
de Haan, J. (2015) “A Framework for Large Scale Use of Scanner Data in the Dutch CPI”, Paper presented at the 14th meeting of the Ottawa Group, May 22, Tokyo. http://www.stat.go.jp/english/info/meetings/og2015/pdf/t6s11p33_pap.pdf
de Haan, J. van der Grient, HA. (2009) “Eliminating Chain Drift in Price Indexes Based on Scanner Data”, Paper presented at the eleventh meeting of the Ottawa Group, 27-29 May 2009, Neuchâtel.
Diewert, WE. Fox, KJ. (2017) “Substitution Bias in Multilateral Methods for CPI Construction using Scanner Data”, Microeconomics.ca working papers erwin_diewert-2017-3, Vancouver School of Economics, revised 23 Mar 2017.
van der Grient, HA. de Haan, J (2011) “Scanner Data Price Indexes: The Dutch Method” versus Rolling Year GEKS” Paper presented at the Ottawa Group, 2011
ILO, IMF, OECD, Eurostat, United Nations, World Bank (2004), Consumer Price Index Manual: Theory and Practice, Geneva: ILO Publications
Ivancic, L. Diewert, WE. Fox, KJ (2009) “Scanner Data, Time Aggregation and the Construction of Price Indexes”, Mimeo, School of Economics and Centre for Applied Economic Research, University of New South Wales, Sydney.
Krsinich, F (2011) “Measuring the Price Movements of Used Cars and Residential Rents in the New Zealand Consumers Price Index” Paper presented at the Ottawa Group, Wellington, New Zealand. Retrieved from www.stats.govt.nz
Krsinich, F (2016) “The FEWS Index: Fixed Effects with a Window Splice”, Journal of Official Statistics 32, 375-404.
Krsinich, F (2015) “Implementation of consumer electronics scanner data in the New Zealand CPI”, Paper presented at the New Zealand Association of Economists conference, Wellington, New Zealand 3 July 2015
Loon, KV. Roels, D (2009) “Integrating big data into the Belgian CPI”, Paper presented at the UNECE Meeting of the Group of Experts on Consumer Price Indices 7-9 May 2018, Geneva.
NZ Herald 2017, “First glimpse of New World online shopping”, 18 July 2017, available at: https://www.nzherald.co.nz/business/news/article.cfm?c_id=3&objectid=11892106, accessed on 7 June 2018.
Waschka A, Milne W, Khoo J, Quirey T and Zhao Q (2003), “Comparing Living Costs in Australian Capital Cities” 32nd Australian Conference of Economists, 29 September – 1 October 2003, Canberra, Australia