Embed Size (px)
Citation preview

Author: M. B. K. Dewi, Saxion Hogescholen Edited by: E. A. de Vries, Alterra
Creating a Design Tool for the City of Arnhem
Research Report: Short version
Urban Heat Island - Creating a Design Tool for the City of Arnhem Maria B.K. Dewi (2010)
2
READING GUIDE
This abstract is a short version of the report Urban Heat Islands, creating a design tool for the city of Arnhem, written by Maria B.K. Dewi. Alterra gave her this assignment in order to support the municipality of Arnhem in the Future Cities project. This was here thesis for Saxion University of Applied Sciences, so it is a student report, and it should be seen as so. As it is a tool for designers, only the building scale, the street scale and the neighbourhood scale were explored. Nevertheless the information in these scales often can be brought to a higher level. So it will be also interesting for the city scale and sometimes even a regional scale. As said this is an abstract, the complete report will be available soon. This abstract only contains a short introduction on urban heat islands, a short introduction on the city of Arnhem and the design tool. All the other parts, for example a case-study and the conclusions, are left out. We hope this abstract will bring you bright and new ideas! Your sincerely (and also on behalf of Maria B.K. Dewi), E.A. (Barry) de Vries
TABLE OF CONTENTS
READING GUIDE 2
1. Introduction 3 1.1 Main research question 3 1.2 About Urban Heat Island 3 1.3 Situation review – Arnhem 4
2. Creating a Design Tool 4
2.1 Framework 4 2.2 Explanation of methodology 5 2.3 The design tool needed by Arnhem municipality 5 2.4 The categorization of the design tool 6 2.5 Overview of the design tool 7 2.6 The design tool 8

Urban Heat Island - Creating a Design Tool for the City of Arnhem Maria B.K. Dewi (2010)
3
1. INTRODUCTION The Introduction Chapter contains the main research question which is answered through the whole report, the introduction of urban heat island. It is continued with an introduction of Arnhem situation review related with urban heat, as the location of future users of this tool. 1.1 Main research question This research answers the question: What is the best design tool for Arnhem to adapt urban heat island phenomenon?
1.2 About Urban Heat Island
Urban heat island is a phenomenon where cities accumulate heat and are consequently warmer than their surroundings (Oke, 1982). Urban heat island is a phenomenon of the warming atmosphere and surface in cities (urban areas) compared to the surroundings (Voogt, 2004). From the Fig. 1, there is different curve stated the difference of temperature in urban and rural or urbanized area. The city morphology, wind, density, shadow, various human activities cause the temperature rising, especially in urban area. The climate change brings impact to the urban heat island’s temperature. The rising temperature by climate change can make the urban heat worse. But the urban heat island does not influence the global warming (Voogt, 2004). Temperature increase in the built environment has great impact on the cities living conditions (Kleerekoper, 2009). It can be the less human comfort, health problems, and consumption of more energy and needs more air-conditioning.
Fig. 1. Sketch of an Urban Heat-Island Profile (NASA, 2010)
There are lots of ways to combat the urban heat, for example, green structures which have ability to tackle this and balance the rising temperature in urban space. In the future, summers will be hotter and drier, reduces amount of water that formerly available during the drought. This will result in less cooling effects.
City structures also have important roles to tackle the urban heat. As the city is growing larger, the temperature difference between urban and rural becomes higher. The relation between temperature gap and city size is consistent that composition of buildings is taken into consideration in cooling both sun and wind orientation (Kleerekoper, 2009). Based on the United Nations report, in 2009 the world population reached 6.8 billion with over half live in the cities. By the 2050, the estimated population of the world will be 9 billion, with 70 per cent will live in urban (United Nations, 2009). As the cities growing, the challenge of urban heat island will increase.

Urban Heat Island - Creating a Design Tool for the City of Arnhem Maria B.K. Dewi (2010)
4
1.3 Situation Review – Arnhem The project is located in the city of Arnhem (Fig. 2). Arnhem is a municipality which is situated in the Eastern part of the Netherlands. Its municipality is a part of the city region Arnhem-Nijmegen, and the capital city of Gelderland Province. The city region of Arnhem-Nijmegen has more than 700.000 inhabitants (Arnhem Municipality, 2010), with 145,000 in Arnhem (Stadsregio Arnhem Nijmegen, 2010). Arnhem is surrounded by De Hoge Veluwe National Park, washlands of Rhine, and Betuwe area, supported by some parks such as Sonsbeek, Zijpendaal, and Gulden Bodem (Arnhem Municipality, 2010). It is passed by River Nederrijn and Ijssel. In Arnhem, Future Cities has focus on Urban Heat Island (UHI). The study of Future Cities towards urban heat island adaptation has four components: the green structure, the water/humidity balance, heat/energy balance, and landscape or morphology (Future Cities, 2010).
Fig 2. Map of Arnhem (Google earth, 2010)
2. CREATING A DESIGN TOOL
This chapter mainly explains about the design tool. Firstly it describes the tool that is needed by Arnhem municipality for the designers, and followed by category of the tool. And the final is the design tool with the pictures and explanation. This design tool is approximately 20 pages, so an overview about the tool is provided at the concise table before the complete table of the tool. 2.1 Framework Regarding to the urban heat island phenomenon, a tool is needed for designing buildings, streets, and neighbourhoods. A tool in this case means an instrument that functions as a tool for adapting urban heat, which can be applied for easy use by the designers in Arnhem to improve the quality of living environment. The tool for design will be used by designers, such as architects and urban designer in Arnhem to develop a built area for adapting the urban heat. Even, this tool should be able to be implemented and adopted for other cities in the same climatic area or with adaptation for different climatic area.
The effort is divided into some parts, which are: the green structure, the water/humidity balance, the heat/energy balance, and the landscape morphology (Future Cities, 2010). The green structure has good effects for the city’s temperature, air quality, and rainwater storage. Then, the water/humidity

Urban Heat Island - Creating a Design Tool for the City of Arnhem Maria B.K. Dewi (2010)
5
balance is related with water structures, such as ponds, water courses, rivers, and storage water on green roofs. They give the less temperature rising. The third one, heat/energy balance, gives the balance of heating up of city. Thus, landscape and morphology as the orientation and location of buildings give influence on temperature of an area.
2.2 Explanation of methodology
Firstly, the preliminary research was done to define the urban heat island, the cause of it, and how to tackle this problem. A study of Arnhem and its climate were studied also here. These were done through studies from previous researches, books, reports, and internet. After that, interviews with the stakeholders were held to get the information about the needed tool by Arnhem. Then, the choice for categorization of the tool was made. Thus, the tool was created. After the tool was created, this study was continued to site selection for the implementation of the tool into design. After a site analysis, the design was made. The design was made to proof that the tool was works for designing. 2.3 The design tool needed by Arnhem municipality
Regarding to the interview with municipality of Arnhem, by the view of urban planner and policy maker from Arnhem municipality, Arnhem has problem about urban heat island. There are some areas which has higher temperature than surroundings, as shown in the Fig. 6 below which has red and orange colour. The most problematic area is shown in the red part.
Fig. 6. Urban Climatic Analysis Map (UCAM) of Arnhem City (Arnhem Municipality, 2010)
Previously, Arnhem did not have any design tool related with urban heat island phenomenon. Arnhem uses juridical law to rule the design and development of the city. Coming with the adaptive solution to urban heat island, the design tool will be used for designer; who are urban designers and architects. An interview with Arnhem municipality’s designer results in some criteria for the design tool as listed in the

Urban Heat Island - Creating a Design Tool for the City of Arnhem Maria B.K. Dewi (2010)
6
following paragraph. There has not been any design tool for urban heat island that is used in other place. So, this tool will be the first. The design tool in this project is a design guidance. It should help the designers, as a guidance, not a dogma. The design guidance should give stimulation, option, and widen the view of designers towards a specific theme, in this case is about urban heat island. The design tool should contain many pictures and sketches to explain the content, preferably with dimension. It should also give more exact explanation about the standard measurement. In the implementation, there are lots of factors which are needed to be considered, such as the building characteristic, about how people feel, economic side, and many more. This design tool will be containing the effective and less effective ways to adapt urban heat island, performed in words explanation and pictures. 2.4 The categorization of the design tool
Measure to enhance and sustain an appreciated and attractive urban climate can be taken on building level, street level, neighbourhood level, and ultimately on regional level (Kuypers and de Vries, 2009). In the neighbourhood and regional level, urban morphology have important role in heat emission and cooling opportunities. The design tool in this research contains 3 scales, which are: 1. Building scale; 2. Street scale; and 3. Neighbourhood scale. The regional or city scale is not used because it is a large scale. Designers usually work in the scale of building, street, and neighbourhood scale, but not with the regional scale. The regional scale is more related with planner. And this tool will be design guidance for designers for practical solution to adapt the problem of urban heat island. Combining Kuypers’s scale and the scale from Murakami, et al., (Murakami, et al., 2000; Murakami, 2004; Mochida, et al., 2008) the scale of area is defined as: 1. The building scale, is defined as each building, at the zone of approximately 30m-50m, 2. The street scale, is defined as one row of the street which might contains buildings or not. 3. The neighbourhood scale, is defined as one neighbourhood (up to 1 km x 1 km). Regarding to the scale of this tool, which involves the street and neighborhood scale, the tool will also possible to be used by planners. The categorization of each scale will be based on the solution that future cities has for adapting urban heat, which are: green structure, water/humidity balance, heat/energy balance, and urban morphology (Future Cities, 2010). The effort which has been done by future cities is divided into some parts, which are: 1. The green structure, which has good effects for the city’s temperature, air quality, and rainwater
storage. 2. The water/humidity balance, which is related with water structures, such as ponds, water courses,
rivers, and storage water on green roofs. 3. The heat/energy balance, which gives the balance of heating up of city; it can be consist of the
choice of colour and materials. 4. The urban morphology, which is related with orientation and location of buildings give influence on
temperature of an area (Future Cities, 2010). Each scale contains 4 categories, while the morphology will be used only in neighborhood scale, as mentioned by Kuypers (2009) that urban morphology has important role in neighborhood level. The action for each category will be based from previous researches and the analyses of them. So, in the building scale, there will be building morphology, which includes the shape of building for the fluent wind flux which is affected by the location of the buildings with street. And in the street scale, there will be street morphology, which explains about street configuration. To fill in the actions for each scale and category, the writer use some previous researches about the adaptation of urban heat island. Here is the table to show the overview of the tool:
Urban Heat Island - Creating a Design Tool for the City of Arnhem Maria B.K. Dewi (2010)
7
The level of effectiveness is decided based on the researches related with each action. The measurements are based on the temperature decreasing, by the role of green, water, wind, shading and albedo increasing in each action.
2.5 Overview of the design tool The design tool as a guidance will be formed in 3 tables. Each table represents each scale, so there are 3 tables: in building scale, in street scale, and in neighborhood scale. Each scale will be categorized into 4 categories: the green structure, water/humidity balance, heat/energy balance, and morphology. Each category includes some actions as written below. And the action will be defined in effective and less effective way. The actions from each category were got from researches. All of them were grouped in the suitable categories that are most related with.
1. Building scale, contains:
a. The green structure : green roof and green façade/wall, garden for building b. The water/humidity balance : water close to green façade c. The heat/energy balance : roof and wall materials and colours d. The building morphology : building shape and its openings
2. Street scale, contains a. The green structure : street trees b. The water/humidity balance : none c. The heat/energy balance : materials for street, pavement materials for sidewalks,
pavements, parking lots d. The street morphology : street dimension and direction, building shape which
influence the street level 3. Neighbourhood scale, contains
a. The green structure : urban forest/park b. The water/humidity balance : water, dispersed and flowing water c. The heat/energy balance : materials for outdoor urban space d. The urban morphology : size and density of neighborhood, building configuration,
square
The procedure to use this design guidance tool is: designers (also planners) should take a look of the scale, which scale is going to be developed. After that, it comes into the category of green structure, water/humidity balance, heat/energy balance, and urban morphology. After they choose one of them, they will go to the actions and explanation on the two columns on the right side. Then the solution will be applied into the design.
Urban Heat Island - Creating a Design Tool for the City of Arnhem Maria B.K. Dewi (2010)
8
2.6 The design tool
BUILDING SCALE
EFFORTS ELEMENTS EXPLANATION EFFECTIVE ACTIONS LESS EFFECTIVE ACTIONS A. Green structure
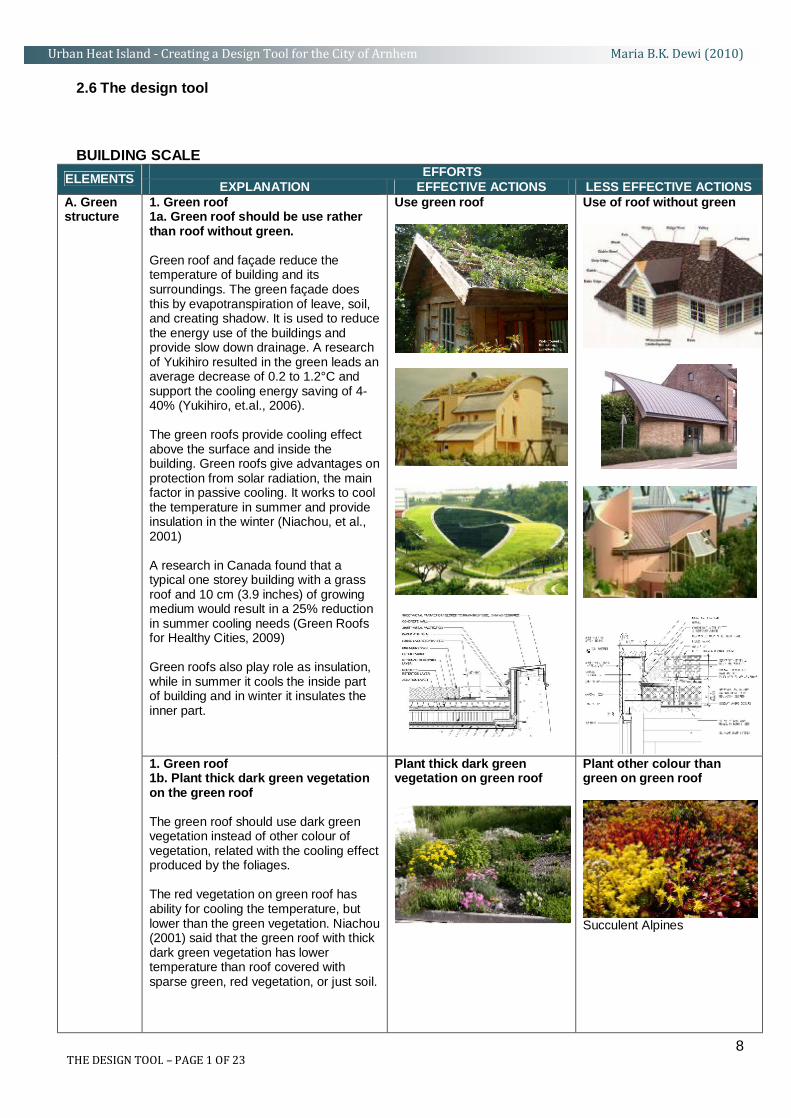
1. Green roof 1a. Green roof should be use rather than roof without green. Green roof and façade reduce the temperature of building and its surroundings. The green façade does this by evapotranspiration of leave, soil, and creating shadow. It is used to reduce the energy use of the buildings and provide slow down drainage. A research of Yukihiro resulted in the green leads an average decrease of 0.2 to 1.2°C and support the cooling energy saving of 4-40% (Yukihiro, et.al., 2006). The green roofs provide cooling effect above the surface and inside the building. Green roofs give advantages on protection from solar radiation, the main factor in passive cooling. It works to cool the temperature in summer and provide insulation in the winter (Niachou, et al., 2001) A research in Canada found that a typical one storey building with a grass roof and 10 cm (3.9 inches) of growing medium would result in a 25% reduction in summer cooling needs (Green Roofs for Healthy Cities, 2009) Green roofs also play role as insulation, while in summer it cools the inside part of building and in winter it insulates the inner part.
Use green roof
Use of roof without green
1. Green roof
1b. Plant thick dark green vegetation on the green roof The green roof should use dark green vegetation instead of other colour of vegetation, related with the cooling effect produced by the foliages. The red vegetation on green roof has ability for cooling the temperature, but lower than the green vegetation. Niachou (2001) said that the green roof with thick dark green vegetation has lower temperature than roof covered with sparse green, red vegetation, or just soil.
Plant thick dark green vegetation on green roof
Plant other colour than green on green roof
Succulent Alpines
THE DESIGN TOOL – PAGE 1 OF 23
Urban Heat Island - Creating a Design Tool for the City of Arnhem Maria B.K. Dewi (2010)
9
EFFORTS ELEMENTS EXPLANATION EFFECTIVE ACTIONS LESS EFFECTIVE ACTIONS … A. Green structure
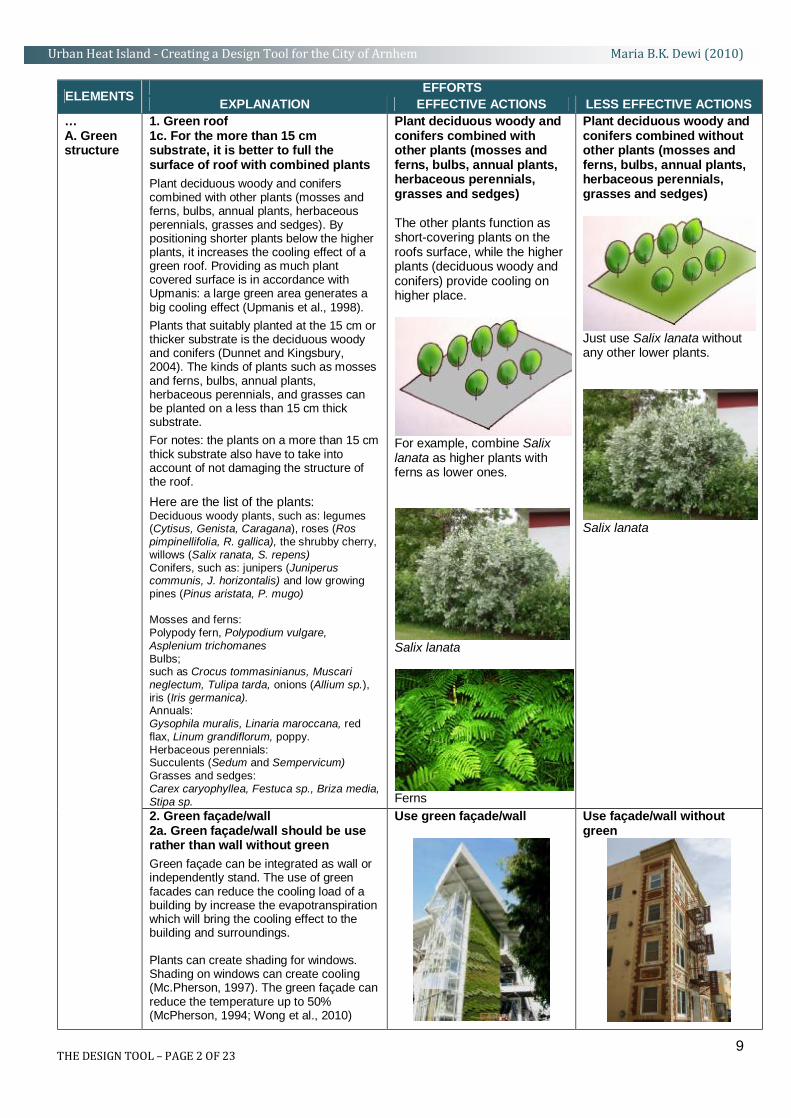
1. Green roof 1c. For the more than 15 cm substrate, it is better to full the surface of roof with combined plants
Plant deciduous woody and conifers combined with other plants (mosses and ferns, bulbs, annual plants, herbaceous perennials, grasses and sedges). By positioning shorter plants below the higher plants, it increases the cooling effect of a green roof. Providing as much plant covered surface is in accordance with Upmanis: a large green area generates a big cooling effect (Upmanis et al., 1998).
Plants that suitably planted at the 15 cm or thicker substrate is the deciduous woody and conifers (Dunnet and Kingsbury, 2004). The kinds of plants such as mosses and ferns, bulbs, annual plants, herbaceous perennials, and grasses can be planted on a less than 15 cm thick substrate.
For notes: the plants on a more than 15 cm thick substrate also have to take into account of not damaging the structure of the roof.
Here are the list of the plants: Deciduous woody plants, such as: legumes (Cytisus, Genista, Caragana), roses (Ros pimpinellifolia, R. gallica), the shrubby cherry, willows (Salix ranata, S. repens) Conifers, such as: junipers (Juniperus communis, J. horizontalis) and low growing pines (Pinus aristata, P. mugo) Mosses and ferns: Polypody fern, Polypodium vulgare, Asplenium trichomanes Bulbs; such as Crocus tommasinianus, Muscari neglectum, Tulipa tarda, onions (Allium sp.), iris (Iris germanica). Annuals: Gysophila muralis, Linaria maroccana, red flax, Linum grandiflorum, poppy. Herbaceous perennials: Succulents (Sedum and Sempervicum) Grasses and sedges: Carex caryophyllea, Festuca sp., Briza media, Stipa sp.
Plant deciduous woody and conifers combined with other plants (mosses and ferns, bulbs, annual plants, herbaceous perennials, grasses and sedges) The other plants function as short-covering plants on the roofs surface, while the higher plants (deciduous woody and conifers) provide cooling on higher place.
For example, combine Salix lanata as higher plants with ferns as lower ones.
Salix lanata
Ferns
Plant deciduous woody and conifers combined without other plants (mosses and ferns, bulbs, annual plants, herbaceous perennials, grasses and sedges)
Just use Salix lanata without any other lower plants.
Salix lanata
2. Green façade/wall 2a. Green façade/wall should be use rather than wall without green
Green façade can be integrated as wall or independently stand. The use of green facades can reduce the cooling load of a building by increase the evapotranspiration which will bring the cooling effect to the building and surroundings. Plants can create shading for windows. Shading on windows can create cooling (Mc.Pherson, 1997). The green façade can reduce the temperature up to 50% (McPherson, 1994; Wong et al., 2010)
Use green façade/wall
Use façade/wall without green
THE DESIGN TOOL – PAGE 2 OF 23

Urban Heat Island - Creating a Design Tool for the City of Arnhem Maria B.K. Dewi (2010)
10
EFFORTS ELEMENTS EXPLANATION EFFECTIVE ACTIONS LESS EFFECTIVE ACTIONS … A. Green structure
… continuation of 2. Green façade/wall 2a. Green façade/wall should be use rather than wall without green.
....
....
2. Green façade/wall 2b. Green wall and west facades The green façade should be positioned towards the west to give best result of cooling, and east as the second best, regarding the most solar radiation received. The solar radiation received mostly on west and east side. Positioning of west-facing green wall can create shading to the window will improve the application of green wall. It provides most savings and cooling energy (McPherson, 1994). Kontoleon, et al. (2010) studied that the most significant effect of green wall is the west-facing one, and the second is the east-facing wall. NOTE EDITOR: IN THE DUTCH SITUATION IT MIGHT BE A LITTLE DIFFERENT BECAUSE IT IS MORE TO THE NORTH THAN THE USED CASE-STUDIES. IN THAT CASE COVERING THE SOUTH WALL MIGHT BE MORE EFFICIENT.
Place the green wall towards the west (1st best)
Place the green wall towards the east (2nd best)
Place the green wall towards other directions
THE DESIGN TOOL – PAGE 3 OF 23
Urban Heat Island - Creating a Design Tool for the City of Arnhem Maria B.K. Dewi (2010)
11
EFFORTS ELEMENTS EXPLANATION EFFECTIVE ACTIONS LESS EFFECTIVE ACTIONS ... A. Green structure
2. Green façade/wall 2c. Percentage of green façade/wall The more green covering percentage of the plant foliage can rise positive effect of cooling.
Use large amount of covered wall with foliage
Use half amount of covered wall with foliage
2. Green façade/wall
2d. Based on the kinds of the green façade/wall The first best cooling effect is given by the living wall with grid and modular panels than living wall with inorganic substrate. And the smallest cooling effect is provided by green façade with modular trellis. From the research of Wong, et.al. (2010), there was stated that the best cooling effect or thermal performance is provided by
1. Living wall – grid and modular, vertical interface with mixed substrate
2. Living wall – modular panel, vertical interface, with inorganic substrate.
Use of living wall - grid and modular, vertical interface with mixed substrate (1st best)
(1) (2)
The use of living wall – modular panel, vertical interface, with inorganic substrate (2nd best)
Use of green façade with modular trellis.
3. Garden Provide garden in every building The intensity of green can influence the cooling effect. Garden can gives the cooling effect to the building and surroundings. The open space for garden is needed to enhance fresh air flow.
This garden can be located in front of and behind the building, or as a courtyard inside building. Providing as much plant covered surface is in accordance with Upmanis: a large green area generates a big cooling effect (Upmanis et al., 1998).
Provide garden in every building
Not provide garden in building
THE DESIGN TOOL – PAGE 4 OF 23

Urban Heat Island - Creating a Design Tool for the City of Arnhem Maria B.K. Dewi (2010)
12
EFFORTS ELEMENTS EXPLANATION EFFECTIVE ACTIONS LESS EFFECTIVE ACTIONS B. Water/ humidity balance
Positioning water close to the green façade. Placing water surface close to the green will encourage the plants to maximize its cooling effect. There is great importance of the water for a green cooling effect, as the Institute of Physics researched. The plants of the green façade of the Berlin-Adlershof have more evaporation more in the water surplus compared with the situation in lack of water (Schmidt, 2006).
Place water close to the green façade
Not place water close to the green façade
C. Heat/ energy balance
1. Roof 1a. Materials for roof based on the reflectivity Clay roof gives higher reflectance than cement fibre sheet. This higher reflectance results in lower temperature if buildings and surrounding. Clay tile roof has lower maximum temperature than cement fibre sheet roof, which is based on Jayasinghe, et.al. (2003). Further information can be got from the Table 2 and 3 of Prado (Prado, et.al., 2005)
Use clay tiles
Use cement fibre sheet
1. Roof 1b. Use white coloured roof instead of others Albedo can be modified by the use of texture and colour. The brighter the colour of a material, the higher albedo it has, and higher ability to reflect radiation. Dark colour surface absorb solar radiation during the daytime and release the heat during the night (Santamouris, 2001; Akbari et al., 1996; Synnefa, et al., 2006). Simpson (1997) in Synnefa (2006) stated that white roof (albedo 0.75) is 20°C cooler than gray (albedo 0.30) or silver (albedo 0.50), moreover it reached 30°C by brown (albedo 0.1).
Use white coloured roof (1st best)
Use gray coloured roof (2nd best)
Use silver coloured roof (3rd best)
Use brown coloured roof (4th best)
THE DESIGN TOOL – PAGE 5 OF 23

Urban Heat Island - Creating a Design Tool for the City of Arnhem Maria B.K. Dewi (2010)
13
EFFORTS ELEMENTS EXPLANATION EFFECTIVE ACTIONS LESS EFFECTIVE ACTIONS … C. Heat/ energy balance
1. Roof 1c. Material choice for sloped roofs The high albedo of material means the high solar reflectance of it, results in cooler temperature than the lower albedo material. Based on the research of Bretz, et.al. (1998), at the table of low and high solar-reflectance options for typical roofing materials, it is found that for sloped roof, the order from the highest albedo material to lower ones. 1. Clay tile 2. Concrete tile 3. Fiber-cement shingle 4. Composite asphalt shingle, fiber-
glass asphalt shingle, organic asphalt shingle
5. Unpainted metal (steel, aluminium) All of them perform better reflectance or higher albedo in white-coloured. The unpainted metal and aluminium have low emissivity, which results in higher temperature than the albedo suggest. Then, the albedo of all white materials show higher number than the unpainted materials.
Choose the white colour of:
Clay tile (1st best)
Concrete tile (2nd best)
Fiber-cement shingle (3rd best)
White painted metal shingle (4th best)
Composite asphalt shingle, fiber-glass asphalt shingle, organic asphalt shingle (5th
best)
Choose the original colour of:
Clay tile (1st best)
Concrete tile (2nd best)
Fiber-cement shingle (3rd best)
Composite asphalt shingle, fiber-glass asphalt shingle, organic asphalt shingle (4th
best)
Unpainted metal (steel, aluminium) (5th best)
THE DESIGN TOOL – PAGE 6 OF 23

Urban Heat Island - Creating a Design Tool for the City of Arnhem Maria B.K. Dewi (2010)
14
EFFORTS ELEMENTS EXPLANATION EFFECTIVE ACTIONS LESS EFFECTIVE ACTIONS … C. Heat/ energy balance
1. Roof 1e. Materials for flat and low-sloped roofs Based on the research of Bretz, et al. (1998), at the table of low and high solar-reflectance options for typical roofing materials, it is found that for flat and low-sloped roof, the order from the highest albedo material to lower ones.
Choose the white coloured of:
White single-ply membrane (1st best)
Smooth surface roof with white
coating (2nd best)
White painted metal roof (3rd best)
Built-up roof with white gravel and cementitious coating (4th
best)
Built-up roof with white gravel (5th best)
Choose the dark colour of:
Modified bitumen roof (1st best)
Built up roof with dark gravel
(2nd best)
Built up or coal tar roof with smooth asphalt surface (3rd
best)
Built-up roof with aluminium
coating (4th best)
Unpainted metal roof (5th best)
THE DESIGN TOOL – PAGE 7 OF 23

Urban Heat Island - Creating a Design Tool for the City of Arnhem Maria B.K. Dewi (2010)
15
EFFORTS ELEMENTS EXPLANATION EFFECTIVE ACTIONS LESS EFFECTIVE ACTIONS … C. Heat/ energy balance
1. Roof 1e. Use cool and reflective coating for roof made of concrete The reflective building colours will reduce the building thermal loads. Aluminium coating keep the heat during the night. For this reason, aluminium does not perform as well as the other white coatings. Reflective coating can reduce a concrete tile’s surface temperature on a hot summer by 4°C, and in the night by 2°C (Synnefa, et.al., 2006) Cool materials for roofs and walls: Elastomeric Acrylic Cool single ply membranes Reflective tiles Metal roofs Cool coatings: Reflective building colors.
Use cool coatings for roof in white
Examples of it: -Acrylic, ceramic coating -Alkyd, chlorine rubber coating -Acryl-polymer emulsion paint -Acrylic paint -Acrylic elastomeric coating
Use coatings of aluminium and other metal in the original colour Bad white coating and aluminium (silver)
-Epoxy polyamide coating (the worst thermal performance) -Aluminium
2. Wall 2a. The material colour choice for wall Material colour choice for building envelope, light coloured building than dark one, or white coloured than painted one. White and light colour will reflects the heat, while dark colour will save the heat. By releasing heat, white and light colour will not increase the temperature of building and surroundings. From Goodman’s research, as shown in Figure C, white painted colour has albedo rate of 0.5-0.9 while coloured paint has 0.15-0.35. The white coloured has better heat reflective ability than the coloured one.
Choose the white and light colour for wall
Choose the dark colour for wall
THE DESIGN TOOL – PAGE 8 OF 23
Urban Heat Island - Creating a Design Tool for the City of Arnhem Maria B.K. Dewi (2010)
16
EFFORTS ELEMENTS EXPLANATION EFFECTIVE ACTIONS LESS EFFECTIVE ACTIONS … C. Heat/ energy balance
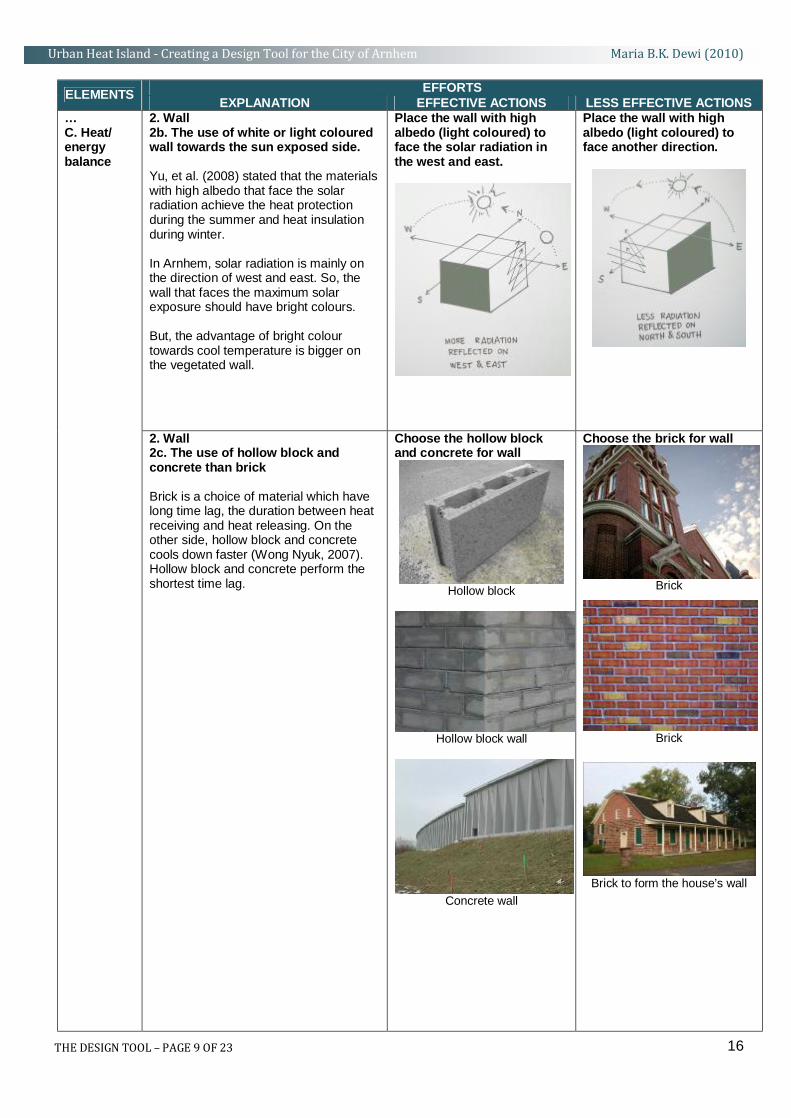
2. Wall 2b. The use of white or light coloured wall towards the sun exposed side. Yu, et al. (2008) stated that the materials with high albedo that face the solar radiation achieve the heat protection during the summer and heat insulation during winter. In Arnhem, solar radiation is mainly on the direction of west and east. So, the wall that faces the maximum solar exposure should have bright colours. But, the advantage of bright colour towards cool temperature is bigger on the vegetated wall.
Place the wall with high albedo (light coloured) to face the solar radiation in the west and east.
Place the wall with high albedo (light coloured) to face another direction.
2. Wall 2c. The use of hollow block and concrete than brick Brick is a choice of material which have long time lag, the duration between heat receiving and heat releasing. On the other side, hollow block and concrete cools down faster (Wong Nyuk, 2007). Hollow block and concrete perform the shortest time lag.
Choose the hollow block and concrete for wall
Hollow block
Hollow block wall
Concrete wall
Choose the brick for wall
Brick
Brick
Brick to form the house’s wall
THE DESIGN TOOL – PAGE 9 OF 23

Urban Heat Island - Creating a Design Tool for the City of Arnhem Maria B.K. Dewi (2010)
17
EFFORTS ELEMENTS EXPLANATION EFFECTIVE ACTIONS LESS EFFECTIVE ACTIONS D. Building morphology
1. Building shape: 1a. Openings on the building to allow wind blow More openings can let the wind enter the buildings and brings cool air. Rofail’s case study in Melbourne about a 45 storey tower shows a separated form is better to let the wind flow than a thick one (Rofail, 2008). From the Figure K of . Design features to change and/or ameliorate pedestrian wind conditions by Cochran (Stathopoulos, 2009), it is found that more openings is needed to direct the wind through the building.
More openings on the buildings
Building with fewer opening
THE DESIGN TOOL – PAGE 10 OF 23

Urban Heat Island - Creating a Design Tool for the City of Arnhem Maria B.K. Dewi (2010)
18
Table 9. The design tool, in street scale part STREET SCALE
EFFORTS ELEMENTS EXPLANATION EFFECTIVE ACTIONS LESS EFFECTIVE ACTIONS A. Green structure
1. Street trees 1a. Placed the transpiring plants on the side of the street Street trees create shadow for buildings and pedestrian ways. Trees has significant role in solar radiation penetration (Shashua-bar, et.al., 2003). It also can reduce energy use for cooling by 25 to 80% (Meier 1991). Shashua-Bar noticed that the shading trees can reconcile the effect of geometry and orientation of the street in creating thermal comfort. A research in Tel-Aviv stated that 80% of the cooling effect is regarding to tree shading (Shashua-Bar, et.al., 2000, in Shashua-Bar, et.al., 2003) The research of Gromke (2008) stated that reduced flow velocities was found in street canyons with avenue-like tree planting compared to the tree-free counterpart. Although tree can reduce the wind, it gives shadow and cool air to improve the thermal comfort. So, the stand of trees is essential. Street trees will give more aesthetic beauty and visual relief, supply benefits in the psychological and social side, including reduction in air pollution-related disease, which give improvement in human well-being and community vitality (Wetter, et al., 2001; Maco and McPherson, 2003; Dumbaugh, 2005; Wolf, 2005; Nagendra and Gopal, 2009).
Plant street trees
Not plant street trees
1. Street trees 1b. Trees planted on both sides of the street Trees planted on both side of the street can give pleasant environment in urban areas (Geerdink, 2009) Thus, the choice of planting trees on both sides of the street can give beneficial to reduce the heat. Trees might have low impact on the temperature because of its disperse location, but since there are in big amount, they do give significant impact (Kleerekoper, 2009).
Plant trees on both sides
Plant trees on one side
THE DESIGN TOOL – PAGE 11 OF 23
Urban Heat Island - Creating a Design Tool for the City of Arnhem Maria B.K. Dewi (2010)
19
EFFORTS ELEMENTS EXPLANATION EFFECTIVE ACTIONS LESS EFFECTIVE ACTIONS … A. Green structure
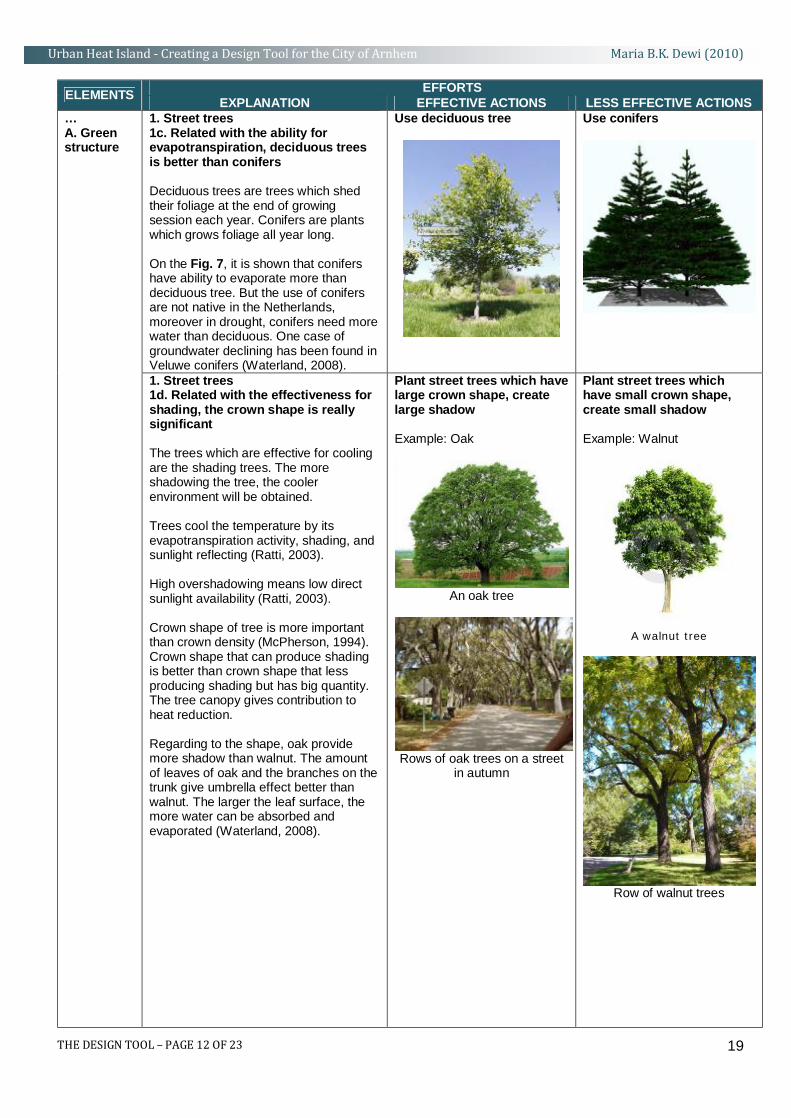
1. Street trees 1c. Related with the ability for evapotranspiration, deciduous trees is better than conifers Deciduous trees are trees which shed their foliage at the end of growing session each year. Conifers are plants which grows foliage all year long. On the Fig. 7, it is shown that conifers have ability to evaporate more than deciduous tree. But the use of conifers are not native in the Netherlands, moreover in drought, conifers need more water than deciduous. One case of groundwater declining has been found in Veluwe conifers (Waterland, 2008).
Use deciduous tree
Use conifers
1. Street trees 1d. Related with the effectiveness for shading, the crown shape is really significant The trees which are effective for cooling are the shading trees. The more shadowing the tree, the cooler environment will be obtained. Trees cool the temperature by its evapotranspiration activity, shading, and sunlight reflecting (Ratti, 2003). High overshadowing means low direct sunlight availability (Ratti, 2003). Crown shape of tree is more important than crown density (McPherson, 1994). Crown shape that can produce shading is better than crown shape that less producing shading but has big quantity. The tree canopy gives contribution to heat reduction. Regarding to the shape, oak provide more shadow than walnut. The amount of leaves of oak and the branches on the trunk give umbrella effect better than walnut. The larger the leaf surface, the more water can be absorbed and evaporated (Waterland, 2008).
Plant street trees which have large crown shape, create large shadow Example: Oak
An oak tree
Rows of oak trees on a street
in autumn
Plant street trees which have small crown shape, create small shadow Example: Walnut
A walnut tree
Row of walnut trees
THE DESIGN TOOL – PAGE 12 OF 23

Urban Heat Island - Creating a Design Tool for the City of Arnhem Maria B.K. Dewi (2010)
20
EFFORTS ELEMENTS EXPLANATION EFFECTIVE ACTIONS LESS EFFECTIVE ACTIONS ... A. Green structure
1. Street trees 1e. Related with the shape and size of the leaves 3 best trees for street: 1. Tilia tomentosa 2. Tilia platyphyllos 3. Tilia cordata Pinus sylvestris actually ranked number 2 in the lowest temperature for the street, but it is not included in deciduous tree, thus in the winter, it will blocked the solar heat. Based on Leuzinger’s (2010) research, also can be found in the Fig. 8, it is obtained that small-leaved trees remain cooler than large-leaved trees. From the Figure F about Surface Temperature of leaves, it was found the surface temperature of tree crowns in summer days at the city of Basel, Switzerland. The temperature of surface crown was checked on the park, street, and all. 3 less efficient trees for street: 1. Acer platanoides 2. Gleditsia triacanthos 3. Aesculus hippocastanum
Plant street trees: 1. Tilia tomentosa
2. Tilia platyphyllos
3. Tilia cordata
Plant street trees: 1. Acer platanoides
2. Gleditsia triacanthos
3. Aesculus hippocastanum
THE DESIGN TOOL – PAGE 13 OF 23

Urban Heat Island - Creating a Design Tool for the City of Arnhem Maria B.K. Dewi (2010)
21
EFFORTS ELEMENTS EXPLANATION EFFECTIVE ACTIONS LESS EFFECTIVE ACTIONS B. Water/ humidity balance
None
1. Materials for street 1a. Combination between concrete and asphalt From Goodman’s research, as shown in Figure C, asphalt has albedo rate of 0.05-0.2 while concrete has 0.1-0.35. It means concrete reflects heat more than asphalt. The use of concrete as street materials will give advantage of cooler temperature than asphalt.
Use concrete combined with asphalt as street components
Use only asphalt as street components
2. Paving materials for sidewalks, pavements, parking lots 2a. The colour and material The temperature of white painted roads with albedo of 0.55 is almost the same with the air temperature, while unpainted road with albedo 0.15 is 11°C warmer. (Berg, et al., 1978 in Synnefa, 2006) Combined with the research of Bretz (1998), there were 4 order of albedo of pavement materials from highest to lowest (See Table 4.) 1. White topping with white cement 2. White topping (13 cm) 3. Asphalt (18 cm) 4. Asphalt with light aggregate (18 cm)
The use of painted roads White painted roads or paving materials
White pavement
The use of unpainted roads and paving materials (remains black or dark colour) Asphalt
C. Heat/ energy balance
2. Paving materials for sidewalks, pavements, parking lots 2b. Grass-covered pavement The hard materials accumulate heat (Kleerekoper, 2009). By using grass paved stone, the heat can be reduced. Thus, it also neutralizes the pollution. The use of grass-covered parking can reduce the heat of air temperature (Takebayashi and Moriyama, 2009).
Use grass-covered pavement
Use stone pavement
THE DESIGN TOOL – PAGE 14 OF 23

Urban Heat Island - Creating a Design Tool for the City of Arnhem Maria B.K. Dewi (2010)
22
EFFORTS ELEMENTS EXPLANATION EFFECTIVE ACTIONS LESS EFFECTIVE ACTIONS Street should have less than 0.25 ratio of H/W (widening the street or shortening the buildings’ height)
H/W < 0.25 Widening the street
H/W < 0.25
Lowering the building
Street that has more than 0.25 or less than 0.25 (narrowing the street or highering the buildings’ height)
H/W > 0.25
Narrowing the street
W/H > 0.25 Highering the building
1. Street 1a. Dimension of the street The proportion of square is measured by ration between height/width (H/W). Square that have H/W ratio lower than 0.25 show typical wind flow patterns that brings flow of wind higher speed (Lenzholzer and Koh, 2010). By reducing the ratio of H/W, through widening the street or shortening the buildings’ height will increase the wind velocity to reduce the temperature. Widening the street to increase the wind velocity. Narrow street has low wind velocity (Chen, et.al., 2009) Wide streets and open spaces encourage air flow to develop the ventilation (Futcher, 2008).
D. Street Morphology
1. Street 1b. Dimension of the street with the same amount of trees With the same small amount of trees, narrow streets act better to urban heat than the wide streets. The sky view factor is a good measure to indicate the openness of urban texture to the sky, which is associated with other indicators as the cause of temperature rising in urban heat island (Ratti, et.al. 2003). From the Ratti’s research (2003), the result show that the courtyard exposed the heat gain during summer and heat loss during winter. The high overshadowing is low direct daylight exposure, which is find in the courtyard as the lowest rank (15%), and the three-storey pavilion (30), and six-storey pavilion (50%). By this, the configuration of small streets between buildings is the best to create shadow and reduce sky factors.
Create a narrow street with the same amount of trees
Create a wide street with the same amount of trees
THE DESIGN TOOL – PAGE 15 OF 23

Urban Heat Island - Creating a Design Tool for the City of Arnhem Maria B.K. Dewi (2010)
23
EFFORTS ELEMENTS EXPLANATION EFFECTIVE ACTIONS LESS EFFECTIVE ACTIONS … D. Street Morphology
1. Street 1c. Street direction
In the Arnhem, as the main direction of the wind in summer is from the South-West, placing the street in this direction will create more flowing air. But in the winter, the wind direction is come from North-East, therefore, placing a street on this direction needs special protection. The East Wind brings high summer temperatures and cold winters.
Passive cooling if the street by solar heating is primarily affected by the street orientation and geometry (Shashua-Bar, et al., 2003). This study is measured by ration of buildings height to street width. Shashua-bar also notes that geometry and orientation of trees can be resolve by the trees to provide shading.
On Fig. 9 of daily variation of the mean solar radiaton intensity on the ground (Shashua-Bar, 2003), is shown that the sun-exposure to a ground on North-South direction is higher than East-West direction.
Wind comfort for pedestrian is 5 m/s for pedestrian (Willemsen, et al. 2007). Showed by the table I of wind comfort and danger, it is implied that wind speed which is more than 5 m/s is less comfort.
The comparison of road based on Nagendra is: wide roads (24m or greater), medium sized roads (12-24 m), and narrow roads (less than 12m) (Nagendra, et al., 2009). The narrow roads are usually located in the residential area.
Direct the street to South-West
Direct the street to other direction
1. Street 1d. H/W ratio to create mixed air from urban canopy layer and boundary layer. The mix air from urban canopy layer and boundary layer can create cooling wind. The best proportion to achieve this condition is by creating the ratio of H/W in 0.5. At a more than 2 H/W, there is almost no mix of canopy and boundary layer (Xiaomin, 2006; Esch, 2007; Kleerekoper, 2009) H=height of building W=width of the street
Create the ratio of H/W 0.5 as the best
Create ratio of H/W more and less than 0.5
If H/W more than 2 à no air mix
THE DESIGN TOOL – PAGE 16 OF 23

Urban Heat Island - Creating a Design Tool for the City of Arnhem Maria B.K. Dewi (2010)
24
EFFORTS ELEMENTS EXPLANATION EFFECTIVE ACTIONS LESS EFFECTIVE ACTIONS … D. Street Morphology
2. Buildings 2a. Round shape building for the entrance and end of street canyon The street canyons work as wind tunnel that can increase the wind speed, so the entrance and end of street canyon has more speed of wind. The round building shape will encourage the wind flow. Picture of square corners in the Fig. 10 shows an entrance of street canyon The shape and height of various buildings in the urban environment combined with the street between them is called “urban canyons”, that give space for the heat to be reflected and absorbed by the building (EPA, 2008) Angular building corners, opposed to building with corners rounded off are often more gusty due to corner pressure effects (Lenzholzer and Koh, 2010)
Use round shape for building located at the entrance and end of street canyon
Use angular shape for building located at the entrance and end of street canyon
2. Buildings 2b. Tall buildings opposite tall buildings Futcher said that tall buildings opposite tall buildings in the street canyons use less energy to cool the temperature (Futcher, 2008). It is because of shading of the buildings. Though, shading of buildings by buildings can be problem during the winter, so the solution of shading buildings by building is not really recommended The maximum tall of buildings is 20m based on the Dutch building recommendation (NEN-norm 8100, 2006; Lenzholzer and Koh, 2010)
Tall buildings opposite tall buildings
Tall building ---------tall building
Tall building ---------tall building (shadowing each other)
Tall buildings opposite varied heights of buildings.
Tall building ------short building
Tall building ------short building
2. Buildings 2c. Slanted roofs to inrease the ventilation From the study by Rafailidis, it is found that altering roof shape can have a much more beneficial impact on urban wind quality than flat roof (Rafailidis, 1997). Good ventilation can results in reducing temperature of urban heat. The best ventilation is achieved at a height/weight ratio of 0.5. At the ratio of more than 2, there is no mix on the boundary layer (Ziaomin, 2006 in Esch, 2007 in Kleerekoper, 2009). Natural wind ventilation can result in the slanted roofs at the openings of urban street canyons (Rafailidis, 1997). It allows the wind flow in the street tunnel on the urban street canyons. In the street level, wind is mostly affected the
Use slanted roof
Use flat roof
THE DESIGN TOOL – PAGE 17 OF 23

Urban Heat Island - Creating a Design Tool for the City of Arnhem Maria B.K. Dewi (2010)
25
EFFORTS ELEMENTS EXPLANATION EFFECTIVE ACTIONS LESS EFFECTIVE ACTIONS … D. Street Morphology
… pedestrians. The comfort wind for walking in the summer is 48 km/h while in the winter is 32 km/h (Murakami et al, 1986; Stathopoulos, 2009). The wind comfort range is provided in Table 5 and Table 6.
2. Buildings 2d. Altering roofs shape arrangement is better than similar roof shape Altering roof shape can have a much more beneficial impact on urban air flow than increase the spacing between buildings (Rafailidis, 1997)
Use altering roofs shape arrangement
Use similar roofs shape arrangement
2. Buildings 2e. Shading building by plants, materials, and buildings Shading the building by plants and materials results best during both the summer and winter. Building form that can get lower sky-view factor. Providing a shading building form can reduce the thermal received. The shading can be form by trees and part of the building itself. Lower sun/sky view factors result in the less heat that will be reflected back at day and night (Kleerekoper, 2009) In Dutch, when a building is shaded in summer, it will be more shaded in the winter, whereas in winter solar radiation is precious. The best choice is by providing shadow by trees and vegetation, so in the winter, the leaves are fall or the shading material can be removed.
Shade the buildings by plants and materials
Shade buildings by buildings
THE DESIGN TOOL – PAGE 18 OF 23

Urban Heat Island - Creating a Design Tool for the City of Arnhem Maria B.K. Dewi (2010)
26
Table 10. The design tool, in neighborhood scale part NEIGHBOURHOOD SCALE
EFFORTS ELEMENTS EXPLANATION EFFECTIVE ACTIONS LESS EFFECTIVE ACTIONS
1. Urban forest/park 1a. Create urban forest/park and open grass field
Urban forest or park is a green area which is surrounded by urban (Kleerekoper, 2009). Creating urban forest and park can reduce the urban heat effect by the presence of evapotranspiring plants inside.
Forested area can cool the city more than open grass surface during the day. But at night, the open grass cool down faster than the forested one (Kleerekoper, 2009). Because during the day, the open field can received the solar heat quickly, and during the evening, it releases the heat soon without any obstacles.
0.15 ha park creates cooling effect of 1.5°C and at noon it reach 3°C difference (Shashua-Bar and Hoffman, 2000). Creating urban forest or park will create cooling effect to the surroundings urban with significant heat reduction.
0.1 ha small gardens can give the cooling effect to 200m distance (Shashua-Bar and Hoffman, 2000).
Create urban forest/park
Create open grass field
1. Urban forest/park 1b. Larger urban forest/park gives greater impact than the small one A large green area generates a big cooling effect. With the difference in 5.9°C maximum in summer, a green area of 156 ha was measured (Upmanis et al., 1998).
Create large urban forest/park
Create small urban forest/park
A. Green structure
1. Urban forest/park 1c. Small and spread green By providing small and spread green, in the same size with one large park, can give cooling effect to more area (Kuypers et al., 2008)
Create two small parks
Create one large park
THE DESIGN TOOL – PAGE 19 OF 23

Urban Heat Island - Creating a Design Tool for the City of Arnhem Maria B.K. Dewi (2010)
27
EFFORTS ELEMENTS EXPLANATION EFFECTIVE ACTIONS LESS EFFECTIVE ACTIONS 1. Urban forest/park
1d. Based on the size of the leaves to the cooling effect 3 the best trees for park:
1. Aesculus hippocastanum 2. Gleditsia triacanthos 3. Platanus acerifolia
3 less efficient trees for park:
1. Tilia tomentosa 2. Tilia platyphyllos 3. Acer platanoides
Based on Leuzinger’s (2010) research, it is obtained that small-leaved trees remain cooler than large-leaved trees. From the Figure F about Surface Temperature of leaves, it was found the surface temperature of tree crowns in summer days at the city of Basel, Switzerland. The temperature of surface crown was checked on the park, street, and all. Trees with lower crown temperature will cool more than warmer ones.
Plants trees: 1. Aesculus hippocastanum
2. Gleditsia triacanthos
3. Platanus acerifolia
Plants trees: 1. Tilia tomentosa
2. Tilia platyphyllos
3. Acer platanoides
THE DESIGN TOOL – PAGE 20 OF 23
Urban Heat Island - Creating a Design Tool for the City of Arnhem Maria B.K. Dewi (2010)
28
EFFORTS ELEMENTS EXPLANATION EFFECTIVE ACTIONS LESS EFFECTIVE ACTIONS B. Water/ humidity balance
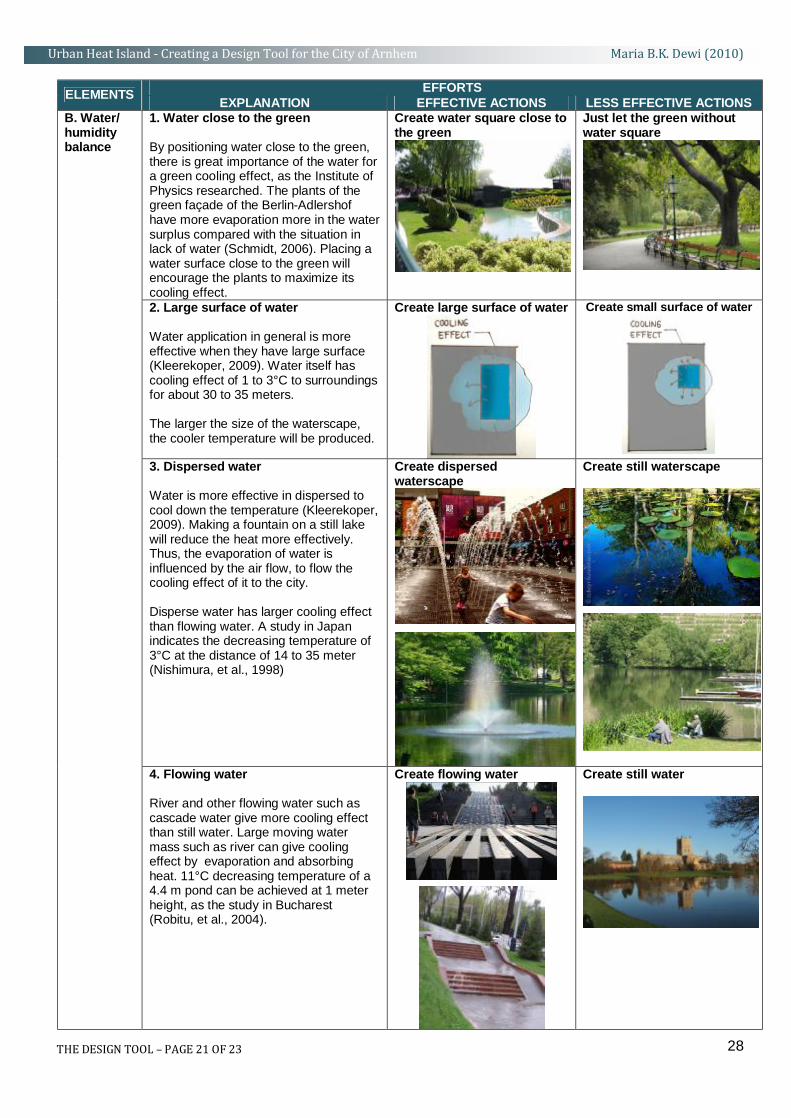
1. Water close to the green By positioning water close to the green, there is great importance of the water for a green cooling effect, as the Institute of Physics researched. The plants of the green façade of the Berlin-Adlershof have more evaporation more in the water surplus compared with the situation in lack of water (Schmidt, 2006). Placing a water surface close to the green will encourage the plants to maximize its cooling effect.
Create water square close to the green
Just let the green without water square
2. Large surface of water Water application in general is more effective when they have large surface (Kleerekoper, 2009). Water itself has cooling effect of 1 to 3°C to surroundings for about 30 to 35 meters. The larger the size of the waterscape, the cooler temperature will be produced.
Create large surface of water
Create small surface of water
3. Dispersed water Water is more effective in dispersed to cool down the temperature (Kleerekoper, 2009). Making a fountain on a still lake will reduce the heat more effectively. Thus, the evaporation of water is influenced by the air flow, to flow the cooling effect of it to the city. Disperse water has larger cooling effect than flowing water. A study in Japan indicates the decreasing temperature of 3°C at the distance of 14 to 35 meter (Nishimura, et al., 1998)
Create dispersed waterscape
Create still waterscape
4. Flowing water River and other flowing water such as cascade water give more cooling effect than still water. Large moving water mass such as river can give cooling effect by evaporation and absorbing heat. 11°C decreasing temperature of a 4.4 m pond can be achieved at 1 meter height, as the study in Bucharest (Robitu, et al., 2004).
Create flowing water
Create still water
THE DESIGN TOOL – PAGE 21 OF 23

Urban Heat Island - Creating a Design Tool for the City of Arnhem Maria B.K. Dewi (2010)
29
EFFORTS ELEMENTS EXPLANATION EFFECTIVE ACTIONS LESS EFFECTIVE ACTIONS 1. Material for outdoor urban space 1a. The use of cool materials rather than warm materials. The use of material for Pavement is the same as used in the street scale. It refers to the street scale on the heat and energy balance, in the materials part. The impact of colour and surface roughness to the passive cooling ability has been studied by Doulos (2004). The cool colour has higher albedo than dark colour, it is the reason cool colour reflect heat within higher intensity than dark colour. Various materials albedo is shown at the Fig. 11 in the Appendices.
Use light-coloured materials
Use dark-coloured materials
C. Heat/ energy balance
1. Material for outdoor urban space 1b. The use of smooth surface materials than rough surface materials The detail surface of mosaic tiles, marble, and stone reflect more radiation than asphalt, pave stone, and concrete. Based on the study by Doulos (2004), it was found that the rough surfaces tend to absorb more solar radiation than the smooth surface. Smooth surface such as stone, mosaic, and marble, while rough surface materials are asphalt, pave stone, and concrete. The material’s ability of reflect more solar radiation results in less degree of temperature.
Use smooth-surface materials
Mozaic of tiles
Marble
Stone
Use rough-surface materials
Asphalt
Pave stone
Concrete
D. Urban morphology
1. Size and density of neighbourhood Adjust the neighbourhood becomes not too large
Larger cities have larger UHI effect. In Oke’s research, we can find the difference between rural and urban temperature compared with the inhabitants. On the Fig. 12, relation between ΔT – r (max) anb log P for European settlements (Oke, 1973), it shows that...
Develop a small and not crowded neighbourhood
Develop a large and crowded neighbourhood
THE DESIGN TOOL – PAGE 22 OF 23
Urban Heat Island - Creating a Design Tool for the City of Arnhem Maria B.K. Dewi (2010)
30
EFFORTS ELEMENTS EXPLANATION EFFECTIVE ACTIONS LESS EFFECTIVE ACTIONS … D. Urban morphology
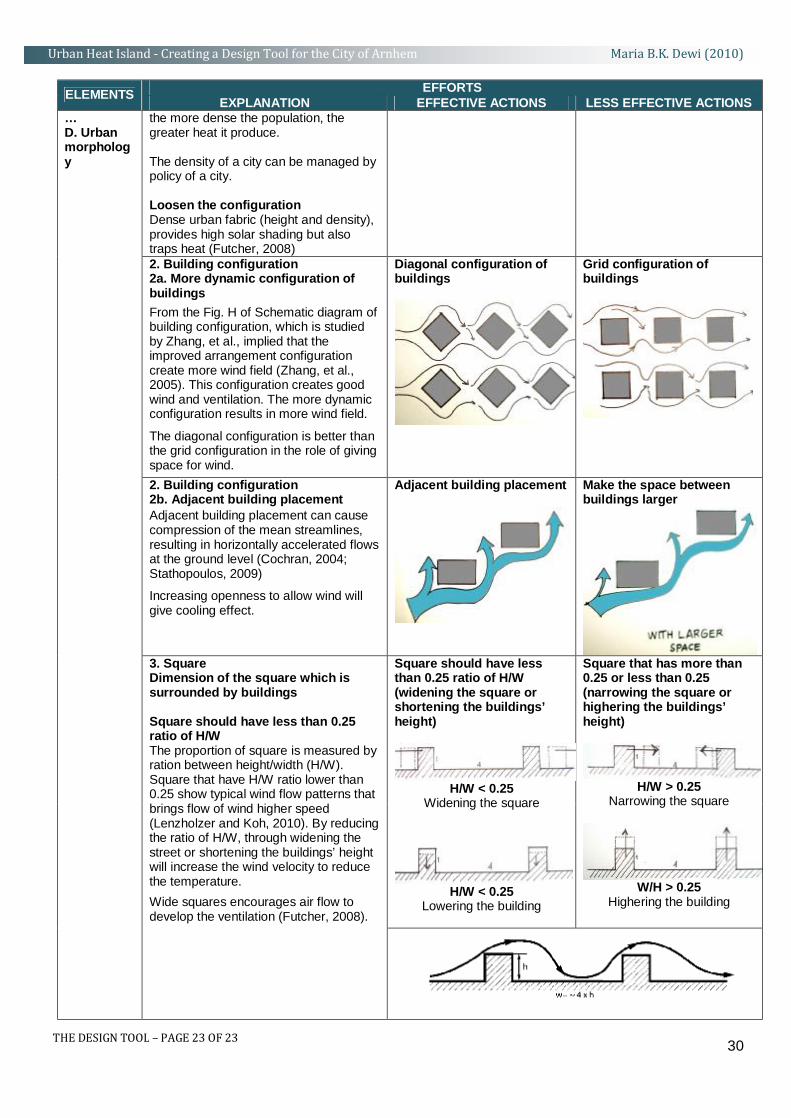
the more dense the population, the greater heat it produce.
The density of a city can be managed by policy of a city. Loosen the configuration Dense urban fabric (height and density), provides high solar shading but also traps heat (Futcher, 2008)
2. Building configuration 2a. More dynamic configuration of buildings
From the Fig. H of Schematic diagram of building configuration, which is studied by Zhang, et al., implied that the improved arrangement configuration create more wind field (Zhang, et al., 2005). This configuration creates good wind and ventilation. The more dynamic configuration results in more wind field.
The diagonal configuration is better than the grid configuration in the role of giving space for wind.
Diagonal configuration of buildings
Grid configuration of buildings
2. Building configuration 2b. Adjacent building placement
Adjacent building placement can cause compression of the mean streamlines, resulting in horizontally accelerated flows at the ground level (Cochran, 2004; Stathopoulos, 2009)
Increasing openness to allow wind will give cooling effect.
Adjacent building placement
Make the space between buildings larger
Square should have less than 0.25 ratio of H/W (widening the square or shortening the buildings’ height)
H/W < 0.25 Widening the square
H/W < 0.25
Lowering the building
Square that has more than 0.25 or less than 0.25 (narrowing the square or highering the buildings’ height)
H/W > 0.25
Narrowing the square
W/H > 0.25 Highering the building
3. Square Dimension of the square which is surrounded by buildings Square should have less than 0.25 ratio of H/W The proportion of square is measured by ration between height/width (H/W). Square that have H/W ratio lower than 0.25 show typical wind flow patterns that brings flow of wind higher speed (Lenzholzer and Koh, 2010). By reducing the ratio of H/W, through widening the street or shortening the buildings’ height will increase the wind velocity to reduce the temperature.
Wide squares encourages air flow to develop the ventilation (Futcher, 2008).
THE DESIGN TOOL – PAGE 23 OF 23

![PARTIES: YVONNE SUTHERLAND V EAST ARNHEM SHIRE … · CITATION: Sutherland v East Arnhem Shire Council [2011] NTMC 044 PARTIES: YVONNE SUTHERLAND V EAST ARNHEM SHIRE COUNCIL TITLE](https://img.pdfslide.us/doc/110x75/5b39f5f47f8b9a40428f1b0c/parties-yvonne-sutherland-v-east-arnhem-shire-citation-sutherland-v-east-arnhem.jpg)