Embed Size (px)
Citation preview

COORDINATING RESEARCH COUNCIL INC 3650 MANSELL ROAD SUITE 140 ALPHARETTA GA 30022
CRC Report No E-77-2
ENHANCED EVAPORATIVE EMISSION VEHICLES
March 2010
The Coordinating Research Council Inc (CRC) is a non-profit
corporation supported by the petroleum and automotive equipment
industries CRC operates through the committees made up of
technical experts from industry and government who voluntarily
participate The four main areas of research within CRC are air
pollution (atmospheric and engineering studies) aviation fuels
lubricants and equipment performance heavy-duty vehicle fuels
lubricants and equipment performance (eg diesel trucks) and
light-duty vehicle fuels lubricants and equipment performance
(eg passenger cars) CRCrsquos function is to provide the mechanism
for joint research conducted by the two industries that will help in
determining the optimum combination of petroleum products and
automotive equipment CRCrsquos work is limited to research that is
mutually beneficial to the two industries involved and all
information is available to the public
CRC makes no warranty expressed or implied on the application of
information contained in this report In formulating and approving
reports the appropriate committee of the Coordinating Research
Council Inc has not investigated or considered patents which may
apply to the subject matter Prospective users of the report are
responsible for protecting themselves against liability for
infringement of patents
ii
Final Report
ENHANCED EVAPORATIVE EMISSION VEHICLES
(CRC E-77-2)
Submitted to
Coordinating Research Council Inc
3650 Mansell Road Suite 140
Alpharetta GA 30022
By
Harold M Haskew PE
Thomas F Liberty
Harold Haskew amp Associates Inc
425 W Huron Suite 230
Milford MI 48381
iii
Acronyms
ATL Automotive Testing Laboratories Inc
CFR helliphelliphelliphellipCode of Federal Regulations
CRChelliphelliphelliphellipCoordinating Research Council Inc
FID Flame Ionization Detector
FTTP Fuel Tank Temperature Profile
HC Hydrocarbon
HHampA Harold Haskew amp Associates
IDhelliphelliphelliphelliphellipInternal Diameter
LA-92 Unified Driving Cycle
MTBE Methyl Tertiary Butyl Ether
NBR Nitrile Rubber or Acrylonitrile Butadiene Rubber
ORVR On-Board Refueling Vapor Recovery
PFI Port Fuel Injection
psi helliphelliphelliphellipPounds per square inch
RL SHED Running Loss Sealed Housing for Evaporative Determination
RVP Reid Vapor Pressure
SHED Sealed Housing for Evaporative Determination
TEFVO Temporary Emissions Following Vehicle Operation
THCTotal Hydrocarbon
VT SHED Variable Temperature Sealed Housing for Evaporative Determination
iv
Table of Contents
Page
Introduction
Backgroundhelliphelliphelliphelliphelliphelliphelliphelliphelliphelliphelliphelliphelliphelliphelliphelliphelliphelliphelliphelliphellip 1
Contract Historyhelliphelliphelliphelliphelliphelliphelliphelliphelliphelliphelliphelliphelliphelliphelliphelliphelliphelliphellip 2
Period of Performancehelliphelliphelliphelliphelliphelliphelliphelliphelliphelliphelliphelliphelliphelliphelliphelliphellip 2
Test Program Overview
Vehicle Selectionhelliphelliphelliphelliphelliphelliphelliphelliphelliphelliphelliphelliphelliphelliphelliphelliphelliphelliphellip 3
Vehicle Fleethelliphelliphelliphelliphelliphelliphelliphelliphelliphelliphelliphelliphelliphelliphelliphelliphelliphelliphelliphelliphellip 3
Test Fuelshelliphelliphelliphelliphelliphelliphelliphelliphelliphelliphelliphelliphelliphelliphelliphelliphelliphelliphelliphelliphelliphellip 4
Adaption Period for Test Fuel Changeshelliphelliphelliphelliphelliphelliphelliphelliphelliphellip 4
The Test Concepthelliphelliphelliphelliphelliphelliphelliphelliphelliphelliphelliphelliphelliphelliphelliphelliphelliphelliphellip 5
Test Procedureshelliphelliphelliphelliphelliphelliphelliphelliphelliphelliphelliphelliphelliphelliphelliphelliphelliphelliphelliphellip 10
Discussion of Test Results
Results
Static Permeation Ratehelliphelliphelliphelliphelliphelliphelliphelliphelliphelliphelliphelliphelliphelliphelliphelliphellip 17
Dynamic Permeation Ratehelliphelliphelliphelliphelliphelliphelliphelliphelliphelliphelliphellip 20
Hot Soak (ldquoTruerdquo) Permeation Ratehelliphelliphelliphelliphelliphelliphelliphelliphelliphelliphelliphellip 22
Diurnal Permeation Ratehelliphelliphelliphelliphelliphelliphelliphelliphelliphelliphelliphelliphelliphelliphelliphellip 24
Tank Venting (Canister Breakthrough)helliphelliphelliphelliphelliphelliphelliphelliphelliphellip 25
Overall Trend Summaryhelliphelliphelliphelliphelliphelliphelliphelliphelliphelliphelliphelliphelliphelliphellip 27
Special Case Vehicle 202 ndash 1996 Ford Taurushelliphelliphelliphelliphelliphelliphellip 28
The ldquoImplanted Leaksrdquo Test Resultshelliphelliphelliphelliphelliphelliphelliphelliphelliphelliphellip 32
Summary of Findings and Resultshelliphelliphelliphelliphelliphelliphelliphelliphelliphelliphelliphellip 36
Appendix
Acknowledgementshelliphelliphelliphelliphelliphelliphelliphelliphelliphelliphelliphelliphelliphelliphelliphelliphelliphellip37
Steering Committeehelliphelliphelliphelliphelliphelliphelliphelliphelliphelliphelliphelliphelliphelliphelliphelliphelliphellip37
Fuel Inspectionshelliphelliphelliphelliphelliphelliphelliphelliphelliphelliphelliphelliphelliphelliphelliphelliphelliphelliphellip38
Program Test Resultshelliphelliphelliphelliphelliphelliphelliphelliphelliphelliphelliphelliphelliphelliphelliphelliphellip40
Individual Vehicle Diurnal Performance on the Various Fuelshellip41
Ethanol Portion of Diurnal Emissionshelliphelliphelliphelliphelliphelliphelliphelliphelliphelliphellip 45
v
List of Figures
Figure Description Page
1 Testing Activityhelliphelliphelliphelliphelliphelliphelliphelliphelliphelliphelliphelliphelliphelliphelliphelliphelliphelliphelliphelliphellip 2
2 Sealed Housing for Evaporative Determination (SHED)helliphelliphelliphelliphelliphellip5
3 Control System Schematichelliphelliphelliphelliphelliphelliphelliphelliphelliphelliphelliphelliphelliphelliphelliphelliphellip 6
4 Trap Canisterhelliphelliphelliphelliphelliphelliphelliphelliphelliphelliphelliphelliphelliphelliphelliphelliphelliphelliphelliphelliphelliphellip 6
5 Static Test ndash Tank Pressurizationhelliphelliphelliphelliphelliphelliphelliphelliphelliphelliphelliphelliphelliphellip 7
6 Static Test ndash Fuel Pump Energizedhelliphelliphelliphelliphelliphelliphelliphelliphelliphelliphelliphelliphellip 8
7 Testing Flow Charthelliphelliphelliphelliphelliphelliphelliphelliphelliphelliphelliphelliphelliphelliphelliphelliphelliphelliphelliphellip 9
8 Leak Testhelliphelliphelliphelliphelliphelliphelliphelliphelliphelliphelliphelliphelliphelliphelliphelliphelliphelliphelliphelliphelliphelliphellip 12
9 Static Permeation Determinationhelliphelliphelliphelliphelliphelliphelliphelliphelliphelliphelliphelliphelliphellip 13
10 Running Loss SHEDhelliphelliphelliphelliphelliphelliphelliphelliphelliphelliphelliphelliphelliphelliphelliphelliphelliphelliphellip 14
11 Running Loss Driving Cyclehelliphelliphelliphelliphelliphelliphelliphelliphelliphelliphelliphelliphelliphelliphelliphellip 15
12 Running Loss Test Resultshelliphelliphelliphelliphelliphelliphelliphelliphelliphelliphelliphelliphelliphelliphelliphelliphellip 16
13 Static Permeation Rate Comparisonhelliphelliphelliphelliphelliphelliphelliphelliphelliphelliphelliphelliphellip 18
14 Running Loss Permeation Comparisonhelliphelliphelliphelliphelliphelliphelliphelliphelliphelliphelliphellip20
15 True Hot Soak Permeation Comparisonhelliphelliphelliphelliphelliphelliphelliphelliphelliphelliphelliphellip 22
16 Day 1 Diurnal Permeation Comparisonhelliphelliphelliphelliphelliphelliphelliphelliphelliphelliphelliphellip 24
17 Diurnal Canister Breakthroughhelliphelliphelliphelliphelliphelliphelliphelliphelliphelliphelliphelliphelliphelliphellip 25
18 Trend Analysis Summarieshelliphelliphelliphelliphelliphelliphelliphelliphelliphelliphelliphelliphelliphelliphelliphelliphellip27
19 Vehicle 202 Fuel Fill Pipe Leakhelliphelliphelliphelliphelliphelliphelliphelliphelliphelliphelliphelliphelliphelliphellip 28
20 Implanted Leak Impacthelliphelliphelliphelliphelliphelliphelliphelliphelliphelliphelliphelliphelliphelliphelliphelliphelliphellip 33
21 Vehicles 207 and 211 with Induced Leak ndash Statichelliphelliphelliphelliphelliphelliphelliphellip 34
22 Vehicles 207 and 211 with Induced Leak ndash Running Losshelliphelliphelliphellip 34
23 Vehicles 207 and 211 with Induced Leak ndash True Hot Soakhelliphelliphelliphellip 35
24 Vehicles 207 and 211 with Induced Leak ndash Diurnalhelliphelliphelliphelliphelliphelliphellip 35
25-31 Diurnal Performance ndash Various Fuels ndash All Vehicleshelliphelliphelliphelliphelliphellip 41-44
32-38 Diurnal Ethanol Portion - All Fuels ndash All Vehicleshelliphelliphelliphelliphelliphelliphellip46-49
vi
List of Tables
Table Description Page
1 E77-2 Vehicle Fleet 3
2 Test Fuel Target Values 4
3 Static Permeation Results 19
4 Running Loss Permeation Results 21
5 True Hot Soak Permeation Results 23
6 Diurnal Permeation Results 25
7 Carbon Canister Diurnal Breakthrough Results 26
8 Vehicle 202 Static Permeation Results 29
9 Vehicle 202 Dynamic Permeation Results 30
10 Vehicle 202 Diurnal Permeation Results 30
11 Implanted Leak Impact on Diurnal Permeation 32
12 Fuel Inspection Results 38
13 Overall Program Test Results 40
14 3 Day Diurnal Results 45
vii
Executive Summary
This report describes an on-going investigation into the evaporative emission performance of
light-duty vehicles as they exist in the United States population Evaporative emissions are in
this context the fuel-related emissions that escape from the vehicle at rest and during vehicle
operation (omitting those that come from the tailpipe) The CRC E-77-2 Evaporative Emission
Test Program the subject of this report evolved from the CRC E-77 Pilot Study (available at
wwwcrcaoorg listed under ldquoPublications Emissionsrdquo) and used test procedures and insight
borrowed from other CRC test programs including E-65 Fuel Permeation from Automotive
Systems Automotive Testing Laboratories Inc (ATL) located in Mesa AZ conducted the
tests for all these programs including those that are the subject of this report ATL has the
unique experience and facilities to perform evaporative emission programs of this nature
For the follow-up study E-77-2 the sponsor selected eight vehicles for evaluation on five
gasoline fuel blends including three levels of ethanol (zero 10 and 20 volume percent) In
addition two of the vehicles were given a limited evaluation with implanted small leaks in the
evaporative system The selected vehicles were prepared for test preconditioned for a minimum
of four weeks on the test fuel when the ethanol level was changed and then subjected to the test
sequence
The test fleet included one pre-enhanced evaporative system vehicle (1996 model year) five
ldquoEnhanced Evaporativerdquo system vehicles (model years 1999 to 2001) and two ldquoTier 2rdquo (Near
Zero) vehicles from model year 2004 or later The pre-enhanced vehicle was certified to a single
dayrsquos diurnal control The enhanced control vehicles were subjected to a much more severe
certification performance test including a three day diurnal a high temperature hot soak and a
measured running loss test The certification test requirements for Tier 2 vehicles were similar to
those for the enhanced vehicles but at a standard of about one-fourth of the level for the
enhanced vehicles With the exception of the 1996 pre-enhanced vehicle all were certified to
the On-Board Refueling Vapor Recovery (ORVR) emission requirements CRC owned all the
vehicles having previously purchased them for CRC Project E-74b (CO vs RVP)
Static permeation rate increased with an increase in ethanol level Three of the five enhanced
emission vehicles did not show an increase in permeation rate when tested with the 9 psi E0
compared to the 7 psi E0
The dynamic permeation rate (measured during vehicle operation) was higher with the E10 fuel
compared to E0 for the enhanced vehicles The E20 permeation rate was higher than E0 and the
E10 fuel The small sample size and limited data precludes us from making statements about
statistical confidence but this may indicate a trend The near zero vehicle average increased as
the ethanol level increased Trends with volatility were mixed or inconclusive
There was a large increase in the hot soak value with the E10 fuel compared to the E0 The hot
soak value with the E20 fuel was comparable to the E0 results but lower than the E10
viii
The Near Zero vehicles (2) had zero hot soak emissions when tested on the 10 psi E10 fuel
(Figure 16) With only two vehicles and the very low levels attained no statistically significant
conclusions can be drawn from the data available
The average Day 1 diurnal permeation for the five Enhanced Vehicles tended to increase as
ethanol content increased (with the exception of the E20 fuel) Again statistical conclusions are
not appropriate given the small sample size and limited data
This study included an evaluation of two vehicles with implanted vapor system leaks This
interest followed the information gathered in the Pilot Study where tests were run with a
specially modified fuel cap containing a 002rdquo diameter hole The newer vehicles evaluated in
this phase of the study were configured and certified to the Onboard Refueling Vapor
Regulations (ORVR) These are capable of containing 95 or more control of the refueling
vapors at up to 10 gallons per minute fueling rate Where the Chevrolet Cavalier had a small
(0055rdquo diameter) orifice and a long vapor tube venting the tankrsquos vapor space to the carbon
canister (and then to the atmosphere) the ORVR compliant vehicles have a large (0625rdquointernal
diameter) short vent hose to a low flow restriction carbon canister The emission results
measured with the ORVR vehicles were significantly lower than measured in previous studies
with the pre-enhanced evaporative emission control systems
Summary of Findings and Results
The E-77-2 test program was a continuation of the previously published E-77 test project and
added eight vehicles tested on five fuels to the knowledge base The permeation trends
previously shown were present for the most part The small sample size and limited number of
tests preclude making statements about trends in emissions with statistical confidence but in
general
o The newer vehicle groups had lower emission levels
o Adding ethanol to the fuel increased permeation over the non-oxygenated levels
o Increased volatility increased permeation levels on average but produced mixed
results on the individual vehicles The effect of volatility needs additional study
o SHED emission rates must be corrected for the ethanol error in the Flame
Ionization Detector (FID) and the non-fuel methanol and refrigerant in the
measurement
1
ENHANCED EVAPORATIVE EMISSION VEHICLES CRC E-77-2
INTRODUCTION
Background - The Coordinating Research Council (CRC)1 has sponsored studies on evaporative
emissions of vehicles for over two decades Whereas the exhaust (or tailpipe) emissions have
been extensively studied as a source of air pollution and through the development of advanced
control systems reduced to very low levels in properly maintained and functioning vehicles the
non-tailpipe emissions levels are not as well understood or documented
This report describes an on-going investigation into the evaporative emission performance of
light-duty vehicles as they exist in the American population Evaporative emissions are in this
context the fuel-related emissions that escape from the vehicle at rest and during vehicle
operation (omitting those that come from the tailpipe) The CRC E-77-2 Evaporative Emission
Test Program the subject of this report evolved from the CRC E-77 Pilot Study and used test
procedures and insight borrowed from other CRC test programs including E-65 Fuel
Permeation from Automotive Systems All of these programs including the subject of this
report were conducted at the Automotive Testing Laboratories Inc (ATL) in Mesa AZ2 which
provides unique experience and facilities to perform evaporative emission programs of this
nature
For the follow-up study E-77-2 the sponsor selected eight vehicles for evaluation on five
gasoline fuel blends including three levels of ethanol (zero 10 and 20 volume percent) In
addition two of the vehicles were given a limited evaluation with implanted small leaks in the
evaporative system The selected vehicles were prepared for test preconditioned for a minimum
of four weeks on the test fuel when the ethanol level was changed and then subjected to the test
sequence The evaporative emission test sequence consisted of the following four parts
1 Static Permeation Rate Measurement at 86degF (Includes leak checks)
2 Dynamic (Running Loss) Permeation and Canister Loss Measurement at 86degF
3 Hot Soak (ldquoTruerdquo or Net Value) following the Dynamic Test at 86degF
4 Two Day Diurnal (65degF to 105degF) Permeation and Canister Loss Measurement
While one objective of this project was to measure the evaporative emission performance of the
selected vehicles a second objective was to develop and refine the test procedures and analysis
methods We have included documentation of these test procedures beginning on page 10
Each vehicle started the evaluation with a 4-week preconditioning on 10 psi E10 fuel and then
ran the 10 psi E10 evaporative emission test sequence (static running loss hot soak and
1 Coordinating Research Council Inc 3650 Mansell Road Suite 140 Alpharetta GA 30022 (678) 795-0506
wwwcrcaoorg
2 ATL 263 S Mulberry Street Mesa AZ (480) 649 7906 wwwATL-AZcom Greg Barton President
2
diurnal) Based on the previous experience with CRC E-65 it was thought that the four week
period was appropriate for the permeation rate to re-stabilize following the fuel change After
validation and committee approval of the data the fuel was changed to a lower volatility (7 psi)
E10 fuel allowed to re-stabilize for up to one week and then re-evaluated on the emission test
sequence The shorter stabilization period was thought appropriate to allow the system to
respond to a volatility change of a similar ethanol content fuel
Once the test results were approved the vehicle was refueled with 9 psi E0 fuel and again
subjected to a 4-week minimum re-stabilization The evaporative performance test sequence was
then repeated and repeated again with a 7 psi E0 fuel after a one week stabilization period The
final test fuel was the 9 psi E20 mixture again after a 4-week stabilization
Contract History ndash Members of the CRC Real World Vehicle Emissions and Emissions
Modeling Group together with technical representatives from EPA and the California Air
Resources Board met at EPArsquos Ann Arbor office on December 14 2006 and outlined the scope
and content of the study A follow-on to the CRC E-77 Pilot Study it included evaporative
emission performance testing of eight recent model light duty vehicles using three ethanol levels
(E0 E10 and E20) at various RVP levels The vehicles were not the same as those used in the
Pilot Study
The original contract included eight vehicles tested on four fuels (7 psi E0 9 psi E0 7 psi E10
and 10 psi E10) A later contract modification added limited testing on two vehicles with
implanted leaks added testing on 9 psi E20 Fuel and included monies to pay for retesting and
repairs of a problem vehicle
Period of Performance ndash Vehicle preconditioning was first reported in the Volume 3 Number 1
progress report dated April 22 2007 and continued through Volume 3 Number 83 dated
November 16 2008 Figure 1 depicts the actual program testing activity The colored bars
indicate both the preconditioning and the vehicle performance testing period Analysis and
comments were contained in the progress reports through November
ID Vehicle Apr May Jun Jul Aug Sep Oct Nov Dec Jan Feb Mar Apr May Jun Jul Aug Sep Oct Nov Dec
202 1996 Ford Taurus
204 1999 Honda Accord
205 2001 Toyota Corolla
207 2005 Dodge Caravan
207L Caravan with Leak
211 2004 Toyota Camry
211L Camry with Leak
212 2006 Ford Taurus
214 2004 Ford Escape
215 2004 Toyota Highlander
2007 2008
E77-2 Project Timing
Figure 1 ndash Testing Activity
3
TEST PROGRAM OVERVIEW
Vehicle Selection
The sponsors chose to evaluate eight vehicles on five fuel blends The vehicles were defined to
be one pre-enhanced evaporative system vehicle (1996 model year) five ldquoEnhanced
Evaporativerdquo system vehicles (model years 1999 to 2001) and two ldquoTier 2rdquo (Near Zero) vehicles
that were 2004 model year vehicles or later The pre-enhanced vehicle was certified to a single
dayrsquos diurnal control The enhanced control vehicles were subject to a much more severe
performance test including a three-day diurnal a high temperature hot soak and a measured
running loss test The Tier 2 vehiclesrsquo test requirements were similar to the enhanced vehicles
but at a standard of about one-fourth of the enhanced vehicles level All but the 1996 pre-
enhanced vehicle were certified to the On-Board Refueling Vapor Recovery (ORVR) emission
requirements All the vehicles were the property of CRC having been bought along with other
vehicles for CRC Project E-74b (CO vs RVP) The vehicles were originally purchased for the
E-74b project from local retail sources in the Phoenix AZ area
Each candidate vehicle was checked at the start of the test program to make sure that there were
no system leaks to verify system purge was present and to generally establish that it was safe to
operate
Vehicle Fleet
Table 1 below lists and describes the eight vehicles studied in this program A more complete
file containing the vehicle road load coefficients and dynamometer settings is included in the ldquoE-
77-2 Companion Filesxlsrdquo (Microsoft EXCELtrade) file available on the CRC website
wwwcrcaoorg
Table 1
Vehicle
Number
Model
Year Make Model
Odometer
Miles Evap Standards Evap Family
Fuel
Tank
Plastic
Metal
202 1996 Ford Taurus 86538 Pre-Enhanced TFM1115AYMEB Metal
204 1999 Honda Accord 100418 EnhancedORVR XHNXR0130AAA Metal
205 2001 Toyota Corolla 92047 EnhancedORVR 1TYXR0115AK1 Metal
207 2001 Dodge Caravan 92740 EnhancedORVR 1CRXR0165XAA Plastic
214 2004 Ford Escape 40188 EnhancedORVR 4FMXR0110BBE Plastic
215 2004 Toyota Highlander 88000 EnhancedORVR 4TYXR0165PZ1 Plastic
211 2004 Toyota Camry 42592 Near ZeroORVR 4TYXR0130A11 Plastic
212 2006 Ford Taurus 28354 Near ZeroORVR 6FMXR0185GAK Metal
E77-2 Vehicle Fleet
4
Test Fuels
The fuel comparisons selected for this project were three levels of ethanol content with volatility
varied as listed in Table 2 below
Table 2
Test Fuel Target Values
7 psi 9 psi 10 psi
E0 X X
E10 X X
E20 X
CRC had fuels remaining from Project E-74 in quantities sufficient to conduct this program eg
7 psi E0 and E10 and 9 psi E203 Inspection records of the base fuels are repeated in the
Appendix using their E-74b identifications fuels 6 7 and 4 respectively The nominal 7 psi
fuels both E0 and E10 were locally blended with commercial butane to make the higher
volatility 9 psi E0 and the 10 psi E10 The blends were done in drum batches approximately 50
gallons at a time by adding small amounts of butane circulating for a brief period then
sampling and determining the new volatility with a ldquoGrabner4rdquo instrument using test procedures
described in ASTM D 5191 The higher (10 instead of 9) volatility of the E10 fuel was specified
because many localities permit ldquosplash blendingrdquo of ethanol to gasoline and allow a 1 psi
volatility exemption for their vapor pressure limits
Adaption Period for Test Fuel Change
Many areas of the United States were required5 to use an oxygenated fuel to improve vehicle
emissions especially during the summer season While MTBE was the most common
oxygenate ethanol was also used CRC Project E-65 demonstrated that the permeation of
vehicle fuel systems increased with the use of fuels containing ethanol compared to fuels with
MTBE or no oxygenate CRC Project E-65 also demonstrated that if ethanol had been
previously used and the fuel replaced with a non-ethanol blend it could take two to four weeks
for the ethanol increase to dissipate
The protocols adopted for this test program were to require a minimum of four weeks of vehicle
exposure to a new fuel when first introducing 10 or 20 volume percent ethanol to the vehicle and
the same period of time when moving to an ethanol-free (E0) fuel Note when changing RVP
only a one week exposure has been demonstrated as sufficient
3 While the E20 target was 9 psi the average inspection value (5 labs) was 85 psi The sponsor chose to continue
the test at this level
4 wwwgrabner-instrumentscom MINIVAP VPS VPSH Vapor Pressure Tester The portable MINIVAP VPS
and VPSH vapor pressure testers are the worldwide accepted standard instruments for determination of the vapor
pressure of gasoline according to ASTM D 5191 ASTM D 6377 ASTM D 6378 and EN 13016 1+2
5 The requirement for oxygen content in RFG fuels was removed by EPA in May of 2005 as directed by the
Energy Policy Act of 2005 The Renewable Fuels Standard requiring renewable fuels (eg ethanol) in increasing
amounts over the years replaces the mandate
5
The Test Concept Measuring Leaks Permeation and Diurnal Vapor Losses
Mass emissions are measured in a VT SHED or Variable Temperature Sealed Housing for
Evaporative Determination The SHED test method
combines all three emission mechanisms (leaks
diurnal venting and permeation) into a single test
result
The SHED technique involves placing the vehicle in
a sealed enclosure (Figure 2) and calculating the
mass in the enclosure from the volume density and
concentration in the enclosure at the start and end of
a time period The difference between the mass at
the start and end of test is the emission rate eg
grams per unit time
CRCrsquos E-77 emission test programs have
developed (and strive to continually improve)
new methodologies for understanding and quantifying vehicle evaporative emission rates The
concept partitions and assigns the vehiclersquos contribution to the evaporative emission inventory
into three mechanisms
1 Permeation
2 Tank vapor venting
3 Leaks (with two subsets - Liquid and Vapor)
Permeation is the migration of HC through the various elastomers (polymers) in a vehicle fuel
system6 Previous testing has shown that permeation rate is strongly affected by the materialrsquos
temperature doubling for each 10ordmC (18ordmF) increase in the range of normal summer
temperatures It is also strongly affected by gasoline composition especially with ethanol-
containing fuels
6 ldquoFuel Permeation from Automotive Systems Final Report CRC Project E-65rdquo Haskew Liberty and McClement
September 2004 available on the CRC and California Air Resources Board websites
Figure 2 ndash Sealed Housing for Evaporative
Determination
6
Tank vapor venting emissions are controlled by fitting a carbon canister to the atmospheric tank
vent Figure 3 is a schematic of a typical early control system During a daily heating period the
temperature of the vehiclersquos fuel tank increases forcing HC vapors from the tank Excess
emissions exceeding the carbon canisterrsquos capacity are vented to the atmosphere
Figure 3 - Control System Schematic
Leaks can be liquid or vapor Permeation and tank venting losses are strongly driven by fuel
composition ambient temperature and ambient temperature change Liquid leaks are not
strongly affected by normal summer temperatures and are thought to have two components
1 Static leaks occurring while the engine is turned off and the vehicle is stationary
2 Increase in leak rate caused by the system pressure increase during engine operation
A Test Method for Separating Permeation from Tank Venting and Leaks ndash In a previous
CRC Project (E-65) the canister loss was separated from the permeation measurement by
venting the losses from the carbon canister outside
the SHED For Project E-77 the canister vent
losses were collected and measured in a separate
ldquotrap canisterrdquo on a scale outside the SHED as
shown in Figure 4 This vent line was capped off
(ie sealed during the Static Test) but connected
as shown in the figure for the Dynamic and the
Diurnal Test The ambient temperature in the
SHED was constant during the static test and
there was no vapor created at constant
temperature
Figure 4 - Trap Canister
7
This vent was closed to pressurize the system for the leak evaluations The resulting SHED
increase in HC mass was permeation7 The last mechanism that needed to be evaluated was
leaks Leaks can be both vapor and liquid A liquid leak can have significant mass currently
undetected by the vehiclersquos on-board diagnostic system Considerable thought and effort have
gone into the creation of a simple and effective liquid leak detection methodology without
success The techniques used in this project required the use of a SHED for measurements The
techniques were not simple but they proved effective
Based on experience a vehiclersquos permeation rate is expected to be between the range of 4 to 90
mghour at the 86degF test temperature The presence of a static liquid leak is expected to
overwhelm this value such a leak would (or could) be apparent by inspection Leaks from the
vehicles were quantified in a three-step test process The first step was to measure the static
permeation rate of the vehicle at 86ordmF The vehicle was allowed to stabilize overnight at 86ordmF in
the SHED and the permeation rate was calculated from the mass increase in the SHED during a
one-hour measurement period The second part of the test looking for pressure driven leaks in
the vapor system was performed by pressurizing the vehiclersquos tank to 5rdquo H2O through a special
fuel cap and tubing from outside the SHED (Figure 5) The special fuel cap the hose and the
pressurization apparatus were installed before the start of the sequence The HC concentration in
the SHED was monitored and the increase in the mass of HC in the SHED during the 30-minute
pressurization period compared to the static permeation rate If there was no (or insignificant)
rate of increase it was deduced that no vapor leak was present
The third and final part of the test was to energize the vehiclersquos fuel pump and pressurize the
system up to and including the injectors (Figure 6) If there were a pressure leak in the liquid
system an increase in the SHED mass over the 30-minute measurement period would be seen
ie the leak would be additive to the permeation rate
6 This is a simplification There are other HC sources present that are not fuel permeation These include tire paint
adhesives and vinyl emissions and the possibility of fuel leaks from the fuel injectors We believe these to be a
minor component of the emissions measured in this study
Figure 5 - Static Test ndash Tank Pressurization
8
Figure 6 ndash Static Test ndash Fuel Pump Energized
Other Tests (Dynamic Hot Soak and Diurnal) - A similar configuration is used to isolate the
tank venting losses from the permeation measurements determined by other test procedures The
vehiclersquos canister vent is connected with a low permeation hose (Teflontrade) to a bulk-head fitting
in the SHED wall and then to a separate ldquotrap canisterrdquo on a top-loading scale Any HC
emissions that escape from the vehiclersquos canister are captured in the trap canister and measured
at a 001 g (10 milligram) precision The trap canister (a 1 Liter Ford model) is purged before
each test and maintained at a ldquodryrdquo condition so that it captures all of the vehiclersquos escaping
emissions This assumption is probably violated during the high volatility tests where there are
30 grams of daily emissions but this is not a concern at this time
Test Elements for E-77-2 - The following flow chart (Figure 7) displays the various elements
utilized during the testing of the various vehicles and fuels during this program Details of each
of the four basic tests follow the flow chart
9
Drain and 40 Fill
with 10 psi E10 Test Fuel
Road Preconditioning
Four LA-4rsquos or Equivalent
Drain and 40 Fill
with 10psi E10 Test Fuel
Overnight Park at 86degF
Move to SHED
Connect Test Instrumentation
Stabilize at 86degF
Perform Constant Temperature
Permeation Series (86degF)
1 hour Permeation Rate Test
frac12 hour Tank Pressurized Test
frac12 hour Pump Energized Test
Transfer to RL SHED
Connect Test Instrumentation
Stabilize at 86degF
Perform Dynamic Permeation Test
Two LA92 Driving Cycles amp
One Hour Hot Soak
Drain and 40 Fill
With 10 psi E10 Test Fuel
Road Preconditioning
Four LA-4rsquos or Equivalent
Move to VT-SHED
Connect Test Instrumentation
Stabilize at 65degF for 6 hrs Minimum
Perform 3-Day Diurnal Evaluation
72 hr 65deg to 105degF VT Test
Drain and 40 Fill
with 7 psi E10 Test Fuel
Condition Fuel System
By Driving for One Week
Repeat Steps 1 ndash 12
On 7 psi E10 Test Fuel
Drain and Fill with 9 psi E0 Test Fuel
Condition Fuel System by 4 weeks Driving
Repeat Steps 1 ndash 12
On 9 and 7 psi E0 and
Repeat Steps 0-12
On 9 psi E20 Test Fuels
Precondition Fuel System
With 4 Weeks Driving on
10 psi E10 Test Fuel
1
2
3
4
5
6
7
8
9
10
11
12
0
Figure 7 ndash Testing Flow Chart
10
Test Procedures ndash There are four basic tests in the E-77-2 test protocol
1 Static Permeation Rate (includes checks for vapor and liquid leaks)
2 Running Emissions (Dynamic Test)
3 Hot Soak
4 Diurnal
Each is described in detail below
1 Static Permeation Rate Testing
The constant temperature (static) permeation rate is measured in a traditional SHED (Constant
temperature) in the following manner
A The fuel tank is drained and filled to 40 tank capacity with the test fuel
B The day before testing the vehicle is driven over four road trips of 75 miles each
to precondition the canister8 (These drives are similar to the LA-4)
C Upon return from the road pre-conditioning the fuel tank is drained and filled to
40 tank capacity with the test fuel9
D Vehicle is parked for 18-22 hours in a controlled temperature environment at test
temperature (86ordmF)
E The vehicle is then moved (without starting) into the test (86ordmF) SHED
F The canister vent is connected to the SHED bulkhead fitting which routes the
vapor to the trap canister outside the SHED
G The tank system pressurization hose is connected
H The fuel pump electrical connection is connected
I The SHED is sealed the inside temperature is allowed to stabilize and the test is
started Continuous THC measurements are made using a FID Ethanol
methanol and R134a concentrations are measured using an INNOVA analyzer
All measurements are made at least every minute for one hour to determine the
stabilized permeation rate
J At the end of the static test (60 minutes) the vehiclersquos vapor system is pressurized
to 5 inches of water for thirty minutes Measurements are made to quantify vapor
leaks as determined by a change in the THC in the SHED
K The fuel pump is then energized for 30 minutes while maintaining the 5 inches of
water on the vapor system Liquid leaks are quantified as determined by a change
in the concentration of THC in the SHED
The purpose of steps J and K above is to validate that the permeation rate measurement was
made without the presence of any leak ndash either liquid or vapor A detailed discussion follows
starting at page 12
8 This conditioning can be done in the laboratory on a chassis dynamometer if proper attention is paid to underbody
cooling and unrepresentative fuel tank temperatures are avoided 9 Vehicles with ORVR systems will add the refueling vapors to the canister This is OK
11
2 Running Loss Test (Dynamic Test)
A The vehicle is placed in the RL-SHED and prepared for test (The fuel level and
condition for the dynamic test is the fuel remaining after completion of the static test ndash
40 fresh fill of the appropriate test fuel)
B Outside air source for the engine is connected
C Vehicle exhaust is connected
D Fuel tank thermocouple is connected
E Canister vent is connected to the SHED bulkhead fitting which routes the vapor to the
trap canister outside the SHED
F Vehicle is allowed to stabilize in the RL-SHED at test temperature (86degF) for a minimum
of 12 hours ndash preferably overnight
G Two cycles of the Unified Cycle (LA-92) driving schedule (48 mins) are driven while
measuring the mass emissions in the SHED Vehicle is allowed to idle (in drive) for 30
seconds between the two cycles Ambient air temperature is maintained (to the extent
possible) at 86degF Fuel tank surface temperature is monitored during vehicle operation It
should increase during the drive from 10 to 18degF to simulate expected on-road
temperature increase Measured mass emissions are corrected using the INNOVA data
for the ethanol methanol and refrigerant emissions
3 Hot Soak10
This procedure is executed immediately following the Running Loss Test procedure
described above
A Engine is turned off transmission selector is placed in park and driver exits the
enclosure using the double door air lock taking care to minimize any air exchange
between the laboratory and the SHED This starts the one hour ldquohot soakrdquo period
B Measurements of mass emissions in the SHED are continued for another 60 minutes
(until time = 108 minutes) correcting for the ethanol methanol and refrigerant mass
using the INNOVA instrument data This ends the hot soak Hot soak emissions are
calculated as the net difference for the one hour hot soak (CorrMass108 ndash CorrMass48
minus the 86degF static hourly rate all mass rates in mghour)
4 Diurnal Test
A The fuel tank is drained and filled to 40 tank capacity with the test fuel
B The day before testing the vehicle is driven over four road trips of 75 miles each to
precondition the vehicle and the canister
C Upon return from the road pre-conditioning the fuel tank is drained and filled to 40
tank capacity with the test fuel
D The vehicle is parked for 18-22 hours in a controlled temperature environment at the
initial diurnal test temperature (65ordmF)
E The SHED is sealed allowed to stabilize at the 65degF temperature and the 3-day
California Diurnal Test is started
10 We define the ldquohot soakrdquo to be the temporary increase in emission rate caused by the immediately preceding
operation of the vehicle It is the increase in the SHED mass (corrected for EtOH MeOH and R-134a) over the
one hour period minus the previously established ldquostaticrdquo permeation rate
12
F ldquoContinuousrdquo (every 30 seconds) THC measurements are made using a FID Ethanol
methanol and R134a (refrigerant) concentrations are measured using an INNOVA
analyzer at least every 10 minutes for the duration of the test (72 hours)
Static Permeation Test ndash Leak Validation
If a leak is detected during either the vapor system pressure portion (Step J) or the pump
energized portion (Step K) of the Static Permeation Test procedure it calls into question whether
the permeation rate measurement accurately reflects fuel system permeation or if instead a
combination of permeation and the implied leak was measured If a leak is confirmed the
permeation rate measurement is called into question and an investigation possible remedy and
retest is indicated
The permeation rate measurement must be corrected for the FIDrsquos ethanol misrepresentation and
the presence of non-fuel hydrocarbons (methanol and refrigerant) The leak check however is
made using the change in mass increase in the SHED using the uncorrected FID mass calculation
as the determinate It was found that the corrections for ethanol methanol and refrigerant were
introducing ldquonoiserdquo into the trace and that these were being misinterpreted as leaks
y = 062x - 19
y = 047x + 67
y = 055x - 01
0
10
20
30
40
50
60
70
80
90
100
0 20 40 60 80 100 120
SH
ED
Mas
s -
mg
Test Time - minutes
Leak TestVehicle 204 - 1999 Honda Accord - 9 psi E0
Test 7028
Pump ActivatedTank Pressurized
Figure 8 above represents the calculations made during the inspection of data from a successful
test EXCELrsquostrade ldquoSLOPErdquo function is used to calculate the linear regression values based on
the FID calculation for mass for Time 0 to 60 minutes Time 64 to 90 minutes and Time 94 to
120 minutes A 4-minute gap was included between each sequence to establish the new mass
emission rate during the ldquopressure onrdquo (T60 to T90) and the ldquopump energizedrdquo periods
The slope of 047 for the ldquoTank Pressurizedrdquo period in the example above is compared to the
slope of 062 calculated for the permeation rate (or hot soak) period Since the ldquoTank
Figure 8 ndash Leak Test
13
Pressurizedrdquo slope is not more than 10 higher than the hot soak permeation rate we assume
that there is no leak present A similar comparison is made for the slope determined during the
ldquopump onrdquo period The choice of a 10 allowance is arbitrary and is used here to allow for
normal and unavoidable test variation
For tests in which the above procedure determines that no leak is present a value of zero is
reported in the test summary for the leak results If a positive value is reported it calls that test
into question and an investigation possible repair and retest is indicated
Static Permeation Rate Determination
The static permeation rate is determined based on a linear regression through the individual
SHED mass data points (data measured each 30 seconds) of the corrected fuel results (corrected
for the FID error and subtracting the methanol and refrigerant) from the first 60 minutes of
testing as illustrated in Figure 9 below
y = 05636x + 0505
0
5
10
15
20
25
30
35
40
45
0 10 20 30 40 50 60
Pe
rme
ati
on
-m
gs
Test Time - mins
Static Permeation DeterminationVehicle 204 - 1999 Honda Accord - 9 psi E0 Fuel
Raw SHED
Corrected Fuel
Permeation Rate Based on Corrected Results
Permeation Rate = 5636 x Time = 338 mgshr
In this example the static permeation rate is 338 mghr
Dynamic (Running Loss) and Hot Soak Test
The preceding section addressed the concepts of separating the permeation emissions from the
tank venting emissions and establishing the presence or absence of leaks The second part of
this study includes a dynamic test to measure the permeation and tank venting emissions during
Figure 9 ndash Static Permeation Determination
14
vehicle operation (ldquorunning lossesrdquo) and the temporary condition following vehicle operation
known as the ldquohot soakrdquo
This is considered a ldquodynamicrdquo test because the vehicle is driven and the fuel and vapor system
temperatures rise during the test The ambient temperature in the Running Loss SHED during
the test was held constant at 86degF while the vehiclersquos fuel system temperature rose during the
test Two 1435 second (239-minute) LA-92 driving cycles were performed consecutively during
the running loss measurements with a 30-second idle in-between During this test tank fuel
temperature was expected to rise by an average approximately 18degF above the initial ambient
temperature The running loss air handling system included a proportional speed under-car
blower operated as a slave to dynamometer speed This apparatus was used during running loss
testing with minor tuning for specific vehicles Without additional input it is capable of
reasonable fuel tank temperature control Each vehicle was fitted with a surface-mount
thermocouple at the front of the fuel tank located at approximately the 18th
fill level to measure
the fuel liquid temperature No attempt was made to follow a predefined fuel tank temperature
profile (FTTP) in this program Fuel temperatures were recorded and results are available in the
real-time records
Vehicle running loss emissions are measured in a special version of a SHED known as a
Running Loss SHED (RL-SHED) shown in Figure 10 Special features of the RL-SHED
include a sealed chassis dynamometer for simulating vehicle driving loads a sealed outside air
supply for engine intake a sealed exhaust conduit for engine exhaust and an under-chassis fan
for simulating underbody air flow as described above A vehicle is operated inside the RL-SHED
over a chosen driving cycle The increase in HC emissions inside the enclosure are measured
and calculated as mass emissions per 40 CFR sect86163-96
Figure 10 - Running Loss SHED
15
Vehicle testing in an RL-SHED is complicated by several factors including
1 Engine must be supplied with external induction air
2 Exhaust must be conducted externally without any leaks
3 Load supplied to the vehicle through the chassis dynamometer must not create or
allow external leaks
4 Internal SHED temperature must be maintained while sizable heat is rejected to the
ambient by the running engine and exhaust
5 Cooling air supplied to the radiator must be modulated to represent the vehiclersquos road
speed
6 Underbody (and especially the fuel system) temperature should represent the rate of
rise experienced by a real road-drive
Canister vent losses were isolated from permeation emissions using the technique previously
described The vehiclersquos carbon canister fresh air vent was connected to the outside of the RL-
SHED using a leak-tight PTFEreg
hose (38rdquo OD commercial tubing US Plastics 58055 PTFE or
equivalent) connected to a small carbon ldquotraprdquo canister located on a top-loading precision scale
The scale precision was 001 grams (10 milligrams) and it was purged prior to each test There
were no tank venting emissions measured on any of the running loss test measurements All of
the vehicles appeared to be actively ldquopurgingrdquo their respective control canisters and drawing
fresh air during the test If there were any emissions from the vehiclersquos control canister as might
have occurred if there were no vehicle purge or if very high volatility fuels with excessive vapor
generation were used they would have been measured
The Running Loss Driving Cycle consisted of two cycles of the ldquoUnified Driving Cyclerdquo
otherwise known as the LA-92 A velocity versus time plot for one cycle is shown in Figure 11
The LA-92 cycle takes 24 minutes to complete and covers 98 miles with many speed changes
Two back-to-back cycles were driven the first as a ldquocold startrdquo and the second following a 30-
second vehicle idle The ldquocold startrdquo condition was created by soaking the vehicle for a
Figure 11 ndash Running Loss Driving Cycle
Unified Cycle (LA-92)
0
10
20
30
40
50
60
70
80
0 5 10 15 20 25Test Time - minutes
Spe
ed -
mph
Cycle Time (min) 239
Maximum Speed (mph) 672
Average Speed (mph) 246
Average Non-Zero Speed (mph) 294
Time Zero Speed () 162
Distance (miles) 982
16
minimum of 18 hours at 86degF moving it to the stabilized 86degF RL-SHED making the test
connections and then waiting a minimum of one hour before the initial start and run
The SHED emissions were measured during 48 minutes of engine operation and then
continuously for one hour after the engine was turned off This one hour engine-off duration
was the ldquohot soakrdquo period The total test time is 1 hour and 48 minutes
Figure 12 shows results from the 9 psi E0 fuel test on Vehicle 204 The horizontal axis is test
time in minutes and the vertical axis is the HC mass measured in the RL-SHED during the test
period
The engine was shut off at the end of the second LA92 drive cycle (~48 minutes) and the
analysis system continued to measure the HC emissions in the SHED for the next 60 minutes
This represented the ldquohot soakrdquo portion of the test
0
50
100
150
200
250
300
0 20 40 60 80 100 120
Co
rre
cte
d T
ota
l F
ue
l C
um
ula
tiv
e P
erm
ea
tio
n -
mg
Test Time - minutes
Running Loss and Hot SoakVehicle 204 - 1999 Honda Accord - 9 psi E0 Fuel
Test 25668
Running Loss Hot Soak
Running Loss Std =005 gmiThis Test = 0010 gmi
RL = 249 mghr
2774
2332
Tru HS = 442
1990
The ldquoTruerdquo Hot Soak
The traditional hot soak is determined from the increase in SHED emissions as measured for one
hour following a prescribed drive to heat up the vehicle (2 LA-92 cycles during the Running
Loss Test) Hot soak emissions however have two components that caused by the elevated
temperature resulting from the drive and that resulting from one hour of static permeation
Figure 12 ndash Running Loss Test Results
17
To separate these two components and determine the ldquotruerdquo hot soak emissions the following
procedure was used ldquoTraditionalrdquo hot soak emissions were first calculated by subtracting the
ldquostart of hot soakrdquo cumulative SHED hydrocarbon value (ie 199 mg t = 48 minutes) from
the final cumulative SHED hydrocarbon value (ie 2774 mg t = 108 min) This resulted in a
cumulative SHED hydrocarbon value of 78 mg for the 1 hour hot soak The previously
determined static permeation value (ie 338 mg for a 1 hour hot soak test- see Figure 9) was
then subtracted to arrive at the ldquotruerdquo hot soak value of 442 mg The increase in the permeation
rate (the ldquohot soak effectrdquo) caused by the increase in the system temperature is accounted for by
subtracting the ldquostabilized permeation raterdquo at 86degF
In Figure 12 the static permeation rate is superimposed as a solid blue line on the plot from the
starting point of the hot soak until its end (one hour) While the ldquotraditionalrdquo hot soak would be
calculated as 78 mg (277 mg ndash 199 mg) the ldquotruerdquo hot soak is determined as 442 mg (2774 mg
ndash 2332 mg) True hot soak values reported here were determined in this manner
Diurnal Test
Diurnal permeation was determined by subjecting the vehicle to a three-day period in a
temperature controlled SHED while continuously recording the total hydrocarbon every 30
seconds The SHED environmental temperature was varied from 65degF to 105degF per the
California Diurnal Test protocol Canister vent losses were isolated from permeation emissions
using the technique previously described The vehiclersquos carbon canister fresh air vent was
connected to the outside of the RL-SHED using a leak-tight PTFEreg
hose connected to a small
carbon ldquotraprdquo canister located on a top-loading precision scale The scale precision was 001
grams (10 milligrams) and it was purged before each test
DISCUSSION OF TEST RESULTS
Results
Emission results are presented below by ldquomechanism11
rdquo with the data averaged for the five
ldquoenhancedrdquo and the two ldquonear zerordquo vehicles The lone ldquopre-enhancedrdquo vehicle the 1996 Ford
Taurus (202) was a special case and will be discussed in a separate section Two of the vehicles
the 2001 Dodge Caravan (207) and the 2004 Toyota Camry (211) were also subjected to limited
testing with an ldquoimplanted leakrdquo (a 0020rdquo dia hole in a special tank gas cap) to investigate the
magnitude of a known leak These results (ldquoLeakersrdquo) follow the discussion on the Taurus
Static Permeation Rate (Constant Temperature (86degF)) - Average permeation rate compared
by fuel specification for two vehicle groups ldquoenhancedrdquo and the ldquonear zerordquo evaporative
emissions
11 The ldquomechanismsrdquo are 1 Permeation 2 Tank Venting (Daily Temperature Rise) and 3 Leaks
18
0
10
20
30
40
50
60
Co
rrecte
d P
erm
eati
on
Rate
-m
gh
r
Fuel
Static Permeation Rate - All FuelsE77-2 Program Vehicles
7 E0 9 E2010 E107 E109 E0 7 E0 9 E2010 E107 E109 E0
Enhanced(5 veh)
Near Zero(2 veh)
Figure 13 presents the static permeation rate performance for the average of the 5 ldquoenhancedrdquo
and 2 ldquonear zerordquo vehicles on the five fuels included in the test program Each group is ordered
from left to right by ethanol level The vertical scale is the average permeation rate in mghour
for the static (86degF constant temperature) test
Previous studies1213
had shown that vehicles operated on the fuel containing 10 vol- ethanol
would have higher permeation rates compared to those resulting from operation on a non-ethanol
(E0) fuel of similar properties We also expected that vehicles using higher vapor pressure fuel
would exhibit increased permeation levels at similar ethanol levels Other studies had reported
mixed results when comparing E20 permeation rates against E10 measurements ndash some were
higher and some were lower The difference may have been within the repeatability of the
measurements and probably suffered from a limited number of observations These mixed
results are present in this testing of the enhanced vehicles however the E20 (violet bar) is higher
on average for static permeation rate for the Near Zero group The data that were used to
construct the averages in Figure 13 are listed in Table 3 below There is significant variability in
the test results and the limited sample size precludes making conclusive statements with
statistical confidence
12 CRC E-653 Fuel Permeation from Automotive Systems E0 E6 E10 E20 and E85 December 2006 13
CRC E-77 Vehicle Evaporative Emission Mechanisms A Pilot Study June 2008
Figure 13 ndash Static Permeation Rate Comparison
19
Table 3
Vehicle ID Technology 7psi E0 9 psi E0 7 psi E10 10 psi E10 9 psi E20
204
1999 Honda Enhanced 129 338 664 843 553
Accord
205
2001 Toyota Enhanced 99 195 596 416 462
Corolla
207
2001 Dodge Enhanced 401 325 644 787 882
Caravan
214
2004 Ford Enhanced 252 107 239 244 168
Escape
215
2004 Toyota Enhanced 87 85 122 104 193
Highlander
194 210 453 479 452
211
2004 Toyota Near Zero 91 101 94 199 558
Camry XLE
212
2006 Ford Near Zero 09 32 218 106 47
Taurus
50 67 156 153 303
Static Permeation Rate - mghr
CRC E-77-2 Program - Static Permeation Results
Enhanced Averages
Near Zero Averages
Summary ndash Static permeation rate increased with increase in ethanol level Three of the 5
enhanced emission vehicles did not show an increase in permeation rate when tested with the 9
psi E0 compared to the 7 psi E0
20
Dynamic (Running Loss) Permeation - In a similar presentation Figure 14 shows the average
ldquoRunning Lossrdquo permeation rate for the vehicle types and the fuels tested ldquoRunning Lossrdquo
permeation as described here is the permeation measured during a ldquocold startrdquo 48 minute drive in
a Running-Loss SHED (RL-SHED) at 86degF
0
50
100
150
200
250
300
350
400
7E0 9E0 7E10 10E10 9E20 7E0 9E0 7E10 10E10 9E20
Co
rre
cte
d R
un
nin
g L
os
s P
erm
ea
tio
n -
mg
hr
Fuel
Running Loss Permeation Rate - All FuelsE77-2 Program Vehicles
Enhanced(5 vehs)
Near Zero(2 vehs)
The dynamic permeation rates for the enhanced vehicles (left panel) followed a similar pattern as
the static permeation The average of the E20 fuel was the highest of the average values
observed on both the enhanced and the near-zero vehicles (left and right panels respectively)
Table 4 below shows the data used to generate the averages used in Figure 14
Figure 14 ndash Running Loss Permeation Comparison
21
Table 4
Vehicle ID Technology 7psi E0 9 psi E0 7 psi E10 10 psi E10 9 psi E20
204
1999 Honda Enhanced 2226 2492 2879 3164 2720
Accord
205
2001 Toyota Enhanced 671 1031 2328 1916 1697
Corolla
207
2001 Dodge Enhanced 8425 8339 8122 8581 10282
Caravan
214
2004 Ford Enhanced 363 967 1057 1331 1394
Escape
215
2005 Toyota Enhanced 797 811 979 719 1025
Highlander
2496 2728 3073 3142 3424
211
2004 Toyota Near Zero 1046 837 563 1383 4106
Camry XLE
212
2006 Ford Near Zero 1845 1158 2012 1489 1168
Taurus
1446 998 1288 1436 2637
Enhanced Averages
Near Zero Averages
CRC E-77-2 Program - Running Loss Permeation Results
Running Loss Permeation Rate - mghr
Summary ndash The dynamic permeation rate (measured during vehicle operation) was higher with
the E10 fuel compared to E0 for the enhanced vehicles The E20 permeation rate was higher
than E0 and the E10 fuel The small sample size and limited data precludes us from making
statements about statistical confidence but this may indicate a trend The near zero vehicle
average increased as the ethanol level increased Trends with volatility were mixed or
inconclusive
22
Hot Soak (ldquoTrue Hot Soakrdquo) Permeation ndash The Hot Soak emissions as defined in this report
are the net increase in permeation rate following vehicle operation We measured the mass
increase in the SHED for one hour immediately following vehicle operation and subtracted the
previously measured static (or normal) permeation at the same temperature While this is not the
traditional Code of Federal Regulations (CFR) definition we feel it is appropriate for the intent
of this project
0
10
20
30
40
50
60
70
7E0 9E0 7E10 10E10 9E20 7E0 9E0 7E10 10E10 9E20
Co
rre
cte
d H
ot
So
ak
Pe
rme
ati
on
-m
gh
r
Fuel
True Hot Soak Permeation Rate - All FuelsE77-2 Program Vehicles
Enhanced(5 vehs)
Near Zero(2 vehs)
The ldquoTrue Hot Soakrdquo performance for the average of the Enhanced Vehicles is summarized in
Figure 15 above There was a large increase in the hot soak value with the E10 fuel compared to
the E0 The hot soak value with the E20 fuel was comparable to the E0 results and lower than
the E10
The Near Zero vehicles (2) had zero hot soak emissions when tested on the 10 psi E10 fuel
(Figure 16) With only two vehicles and the very low levels attained no statistically significant
conclusions can be drawn from the data available Table 5 presents the individual tests used in
calculating the average values plotted in Figure 15
Figure 15 ndash True Hot Soak Permeation Comparison
23
Table 5
Vehicle ID Technology 7psi E0 9 psi E0 7 psi E10 10 psi E10 9 psi E20
204
1999 Honda Enhanced 187 443 297 04 134
Accord
205
2001 Toyota Enhanced 00 10 719 295 603
Corolla
207
2001 Dodge Enhanced 00 58 1222 2377 00
Caravan
214
2004 Ford Enhanced 33 521 329 574 560
Escape
215
2005 Toyota Enhanced 225 251 00 16 00
Highlander
89 257 513 653 259
211
2004 Toyota Near Zero 07 153 138 00 00
Camry XLE
212
2006 Ford Near Zero 18 04 00 00 49
Taurus
13 79 69 00 25
CRC E-77-2 Program - True Hot Soak Permeation Results
True Hot Soak Permeation Rate - mghr
Near Zero Averages
Enhanced Averages
Summary - The True Hot Soak permeation (permeation rate measured following vehicle
operation less the static constant temperature permeation rate) rate was higher with the E10 fuel
compared to E0 for the enhanced vehicles The E20 permeation rate was higher than E0 and
lower than the E10 fuel The near zero vehicle trends with both ethanol content and volatility
were mixed or inconclusive The small sample size and limited data precludes us from making
statements about statistical confidence
24
Diurnal Permeation Performance ndash Figure 16 presents the diurnal permeation results for the
first day of the three-day diurnal test (65deg to 105degF)
0
200
400
600
800
1000
1200
7E0 9E0 7E10 10E10 9E20 7E0 9E0 7E10 10E10 9E20
Co
rre
cte
d F
ue
l D
iurn
al
Pe
rme
ati
on
-m
gs
da
y
Day 1 Diurnal Permeation RatesAverages from E-77-2 Vehicles
Fuel
Enhanced(5 vehs)
Near Zero(2 vehs)
The average day 1 diurnal permeation for the five Enhanced Vehicles tended to increase as
ethanol content increased (with the exception of the E20 fuel) Again sample size and limited
data makes statistical conclusions inappropriate Table 6 presents the individual test used to
generate the averages used in Figure 16 The table includes the data from days 2 and 3 The
ethanol content of the diurnal measurements was calculated and appear in a series of figures in
the Appendix starting at page 37 Unlike Figure 16 the figures shown in the appendix have not
been corrected to exclude the non-fuel emissions (methanol and refrigerant) that were present
during these tests
Figure 16 ndash Day 1 Diurnal Permeation Comparison
25
Table 6
Vehicle ID Technology 7psi E0 9 psi E0 7 psi E10 10 psi E10 9 psi E20
204 Day 1 3672 6283 12601 15479 11034
1999 Honda Enhanced Day 2 2877 5810 11652 17799 9581
Accord Day 3 2936 5770 11653 17711 9812
205 Day 1 3830 4995 17834 17941 17752
2001 Toyota Enhanced Day 2 3654 4810 17150 17309 16900
Corolla Day 3 3670 5072 15239 17417 16802
207 Day 1 3975 4064 10865 14064 15480
2001 Dodge Enhanced Day 2 3026 3373 8120 12644 13702
Caravan Day 3 2689 3080 8236 12237 13605
214 Day 1 4943 4559 5242 4920 4709
2004 Ford Enhanced Day 2 3190 3585 3974 8394 4400
Escape Day 3 2815 11017 3944 113738 7518
215 Day 1 2483 2021 2247 3192 4168
2004 Toyota Enhanced Day 2 2941 1659 2317 2602 4148
Highlander Day 3 2888 1763 2675 2370 4506
3781 4384 9758 11119 10629
211 Day 1 2071 1303 2438 3370 2840
2004 Toyota Near Zero Day 2 1002 1158 1838 2268 2218
Camry XLE Day 3 874 1006 1843 2179 2034
212 Day 1 1016 1005 1848 1243 1310
2006 Ford Near Zero Day 2 712 708 1002 879 833
Taurus Day 3 570 574 758 1028 750
1544 1154 2143 2307 2075
CRC E-77-2 Program Results - Diurnal Permeation
Diurnal Permeation Rate - mgday
Enhanced Averages
Near Zero Averages
Carbon Canister Breakthrough ndash Canister breakthrough is measured by the weight change
recorded for the trap canister outside the SHED It quantifies the amount of vapors that
overwhelm the evaporative system storage canister Figure 17 displays the breakthrough
resulting from testing of 9 psi E0 fuel Only four of seven vehicles exhibited breakthrough
60
65
70
75
80
85
90
95
100
105
110
0
5
10
15
20
25
30
35
40
0 10 20 30 40 50 60 70
SH
ED
Te
mp
era
ture
-d
eg
F
Bre
ak
thro
ug
h -
mg
Test Time - hrs
Canister Breakthrough9 psi E0 Fuel - 65ordm to 105ordm F Diurnal
204 - 1999 Honda Accord
211 - 2004 Toyota Camry
215 - 2004 Toyota Highlander
205 - 2001 Toyota Corolla
Figure 17 ndashDiurnal Canister Breakthrough
26
Table 7 shows the breakthrough generated during the diurnal tests conducted
Table 7
Vehicle ID Technology 7psi E0 9 psi E0 7 psi E10 10 psi E10 9 psi E20
204 Day 1 --- 24 --- 310 ---
1999 Honda Enhanced Day 2 --- 136 --- 360 ---
Accord Day 3 --- 198 --- 360 ---
205 Day 1 --- --- --- 204 ---
2001 Toyota Enhanced Day 2 --- --- --- 309 ---
Corolla Day 3 --- 26 --- 293 ---
207 Day 1 --- --- --- --- ---
2001 Dodge Enhanced Day 2 --- --- --- --- ---
Caravan Day 3 --- --- --- --- ---
214 Day 1 --- --- --- --- ---
2004 Ford Enhanced Day 2 --- --- --- --- ---
Escape Day 3 --- --- --- 49 ---
215 Day 1 --- --- --- --- ---
2004 Toyota Enhanced Day 2 --- 02 --- --- ---
Highlander Day 3 --- 72 --- --- ---
211 Day 1 --- --- --- --- ---
2004 Toyota Near Zero Day 2 --- 129 --- 191 ---
Camry XLE Day 3 --- 176 --- 289 ---
212 Day 1 --- --- --- --- ---
2006 Ford Near Zero Day 2 --- --- --- --- ---
Taurus Day 3 --- --- --- 204 ---
CRC E-77-2 Program - Carbon Canister Diurnal Breakthrough Results
Diurnal Breakthrough - grams
Summary ndash The lack of canister breakthrough for the 7 psi fuels (summer grade) indicates that
the storage capacity of the seven systems tested is appropriately sized Breakthrough began to
appear when testing of 9 psi E0 fuel (not summer grade) and was more prevalent with the 10 psi
E10 fuel (winter grade) The lack of breakthrough with the 9 psi E20 fuel seems to be an
anomaly
27
Overall Trend Summary - The following chart (Figure 18) visually summarizes the trends seen
from all testing performed during this program
Higher Volatility E0 to E10 E0 to E20 E10 to E20
uarr uarr uarr uarr
Higher Volatility E0 to E10 E0 to E20 E10 to E20
uarr uarr uarr uarr
Higher Volatility E0 to E10 E0 to E20 E10 to E20
uarr uarr uarr uarr
Higher Volatility E0 to E10 E0 to E20 E10 to E20
uarr uarr uarr uarr
Higher Volatility E0 to E10 E0 to E20 E10 to E20
uarrharr uarr uarr uarr
Higher Volatility E0 to E10 E0 to E20 E10 to E20
uarr uarr uarr uarr
Higher Volatility E0 to E10 E0 to E20 E10 to E20
uarr darr darr
Higher Volatility E0 to E10 E0 to E20 E10 to E20
uarr uarr uarr harr
Ethanol Content
Diurnal
Trend Analysis for E-77-2 Program
Ethanol Content
Static Permeation
Ethanol Content
Running Loss Permeation
Ethanol Content
Ethanol Content
Diurnal
Enhanced Vehicles (Sample of 5)
Static Permeation
Ethanol Content
Ethanol Content
Running Loss Permeation
Ethanol Content
True Hot Soak (TEFVO)
Near-Zero Vehicles (Sample of 2)
True Hot Soak (TEFVO)
Figure 18 Trend Analysis Summaries
28
Vehicle 202 ndash 1996 Ford Taurus - Special Case
We have treated vehicle 202 as a special case This was the oldest of the vehicles tested and had
been subjected to limited exhaust emission tests with a 20-volume percent ethanol fuel (E20)
during the CRC E-74b test program
Vehicle 202 completed the E10 portion of the test program (10 and 7 psi fuels) successfully and
completed the road preconditioning on the E0 fuel prior to the E0 evaluations The first test on
the E0 fuel was excessively high indicating a fuel leak It was traced to a leaky fuel injector o-
ring and there was considerable discussion as to an appropriate repair Tests were made on the 9
and the 7 psi E0 fuel to measure the magnitude of a vehicle in a ldquoleakrdquo condition and the tests
were labeled as ldquo202L (Leak)rdquo The fuel injector o-rings were replaced as a complete set and
the vehicle resumed testing as ldquo202Rrsquo (Repaired) A new elusive vapor leak was present later
identified as a very small leak at the top of the fuel fill pipe
The circle on Figure 19 at the right shows
the location of the small leak This leak
was problematic as to its effect on the
emission measurements because its
magnitude or presence seemed to depend
on the torque exerted on the fuel cap The
tests on the E0 fuels (9 and 7 psi) are
noted as 202R but with a vapor leak
We attempted to fix this leak and repeated
the E10 test with the vehicle re-identified
as 216 with reasonable results We also
ran the E20 test sequence and declared the
vehicle done
The testing history for this vehicle is shown in Tables 8 (Static) 9 (Dynamic) and 10 (Diurnal)
The tests highlighted in yellow are those that exhibited a liquid or vapor leak as identified during
the static test leak validation
Figure 19 ndash Vehicle 202 Fuel Fill Pipe Leak
29
Table 8
Static Permeation Results 1996 Ford Taurus SHED
Corrected Results Canister
Fuel Permeation mgday Loss
Veh psiEtOH Test Type Date Test mghr (Corrected) g
202 100E10 Static Perm 071807 7018 345 000
Press Incr 00 No Leak
Prs+Fuel Incr 00
202 70E10 Static Perm 082107 7031 223 000
Press Incr 00 No Leak
Prs+Fuel Incr 00
202L 90E0 Static Perm 030408 7169 2292 000
Press Incr DNA
Prs+Fuel Incr 4921 Liquid Leak
202L 70E0 Static Perm 032008 7183 2991 000
Press Incr DNA
Prs+Fuel Incr 19896 Liquid Leak
202R 90E0 Static Perm 050808 7228 178 000
Press Incr 136 Vapor Leak
Prs+Fuel Incr 00
202R 70E0 Static Perm 052208 7239 204 000
Press Incr 380 Vapor Leak
Prs+Fuel Incr 00
216 100E10 Static Perm 081408 7299 324 000
Press Incr 00 No Leak
Prs+Fuel Incr 00
216 70E10 Static Perm 091708 7326 325 000
Press Incr 00 No Leak
Prs+Fuel Incr 00
216 90E20 Static Perm 103008 7363 204 000
Press Incr 00 No Leak
Prs+Fuel Incr 00
30
Table 9
Dynamic Permeation Results 1996 Ford Taurus SHED
Corrected Results Canister From
Fuel Permeation mgday Loss Static
Veh psiEtOH Test Type Date Test mghr (Corrected) g Test
202 100E10 Dynamic RL 072007 25662 1278 000 No Leak
TEFVO 386 000
202L 90E0 Dynamic RL 030508 25695 3870 000 Liquid Leak
TEFVO 00 000
202L 70E0 Dynamic RL 032408 25699 7269 000 Liquid Leak
TEFVO 00 000
202R 90E0 Dynamic RL 050908 25704 1091 000 Vapor Leak
TEFVO 50 000
202R 70E0 Dynamic RL 052308 25706 787 000 Vapor Leak
TEFVO 00 000
216 100E10 Dynamic RL 081508 25718 1742 000 No Leak
TEFVO 14 000
216 70E10 Dynamic RL 091808 25721 1683 000 No Leak
TEFVO 423 000
216 90E20 Dynamic RL 110708 25730 543 000 No Leak
TEFVO 00 000
31
Table 10
Diurnal Permeation Results 1996 Ford Taurus SHED
Corrected Results Canister From
Fuel Permeation mgday Loss Static
Veh psiEtOH Test Type Date Test mghr (Corrected) g Test
202 100E10 72 DHB 65-105 073107 7023
Day 1 10429 612 No Leak
Day 2 7069 3264
Day 3 7043 3869
202 70E10 72 DHB 65-105 082807 7034
Day 1 6278 000 No Leak
Day 2 5065 000
Day 3 4535 000
202L 90E0 72 DHB 65-105 031108 7173
Day 1 22589 000 Liquid Leak
Day 2 32310 000
Day 3 23069 1260
202L 70E0 72 DHB 65-105 040108 7196
Day 1 47425 000 Liquid Leak
Day 2 44517 000
Day 3 31798 000
202R 90E0 72 DHB 65-105 051308 7230
Day 1 3270 000 Vapor Leak
Day 2 2667 000
Day 3 2746 1083
202R 70E0 72 DHB 65-105 052808 7243
Day 1 2117 000 Vapor Leak
Day 2 2208 000
Day 3 2081 000
216 100E10 72 DHB 65-105 082008 7305
Day 1 25907 5777 No Leak
Day 2 34779 6299
Day 3 36014 6343
216 70E10 72 DHB 65-105 092308 7331
Day 1 3975 022 No Leak
Day 2 3550 006
Day 3 3621 037
216 90E20 72 DHB 65-105 111108 7373
Day 1 4685 000 No Leak
Day 2 4526 000
Day 3 4198 000
32
The Implanted Leak Test Results
Project E-77-2 included evaluating two vehicles with implanted leaks This interest followed the
information gathered in the Pilot Study where tests were run with a specially modified fuel cap
containing a 002rdquo dia hole The results with the implanted leak from the Pilot Study are
repeated in Table 11 below as the diurnal results are shown for a 1996 Chevrolet Cavalier first
without the implanted leak at 038 grams per day and then at 207 grams per day (a 54x
increase) with the leak
Table 11
Veh No
Evap
Tech Fuel
Results
gmsday
gms
Increase
6 1996 Chevrolet Cavalier Enhanced 7 psi E0 038
7 2070 2032
207 2001 Dodge Caravan Enhanced 7 psi E10 109
207L 213 104
211 2004 Toyota Camry LE Near Zero 7 psi E10 024
211L 068 044
- Implanted 020 leak in fuel cap
Vehicle Description
Implanted Leak Impact on Diurnal PermeationDay One Results 65deg - 105degF Diurnal
The two E-77-2 vehicles (207 amp 211) were given a limited evaluation with an induced leak and
saw a significantly lesser impact Vehicle 207 gave diurnal results increases from 109 to 213
grams per day (a 2x increase) and Vehicle 211 increased from 024 grams per day to 068 grams
per day (a 28x increase) The following Figure 20 displays the imbedded leak impact from Table
11
33
0
5
10
15
20
On
e D
ay
Diu
rna
l P
erm
ea
tio
n -
gm
sd
ay
Vehicle Number
Implanted Leak Impact on One Day Diurnal Permeation020 Leak in Fuel Cap - 65 to 105 F Diurnal
207L 211L21120776
As Received - No Leak
020 Fuel Cap Leak
The newer vehicles evaluated in this phase of the study were configured and certified to the
Onboard Refueling Vapor Regulations (ORVR) These are capable of containing 95 or more
control of the refueling vapors at up to 10 gallons per minute fueling rate Where the Chevrolet
Cavalier had a small (0055rdquo dia) orifice and a long vapor tube venting the tankrsquos vapor space to
the carbon canister (and then to the atmosphere) the ORVR compliant vehicles have a large
(0688rdquo ID) short vent hose to a low flow restriction carbon canister
The following bar charts (Figures 21 through 24) show the impacts of the leak on all phases of
the evaporative testing performed and compare those results with all fuels tested With only two
vehicles (207 and 211) evaluated on two fuels statistically significant effects cannot be
quantified but the trend of increased emissions is apparent
Figure 20 ndash Implanted Leak Impact
34
0
20
40
60
80
100
120
140
160
7E0 9E0 7E10 10E10 9E20 7E0 9E0 7E10 10E10 9E20
Sta
tic
Pe
rme
ati
on
-m
gh
r
Fuel
0020 dia Induced Leak EffectStatic Permeation
Vehicle 211Vehicle 207
Leak
Leak
0
200
400
600
800
1000
1200
7E0 9E0 7E10 10E10 9E20 7E0 9E0 7E10 10E10 9E20
Ru
nn
ing
Lo
ss
Pe
rme
ati
on
-m
gh
r
Fuel
0020 dia Induced Leak EffectRunning Loss Permeation
Vehicle 211Vehicle 207
Leak
Leak
Figure 21 ndash Vehicles 207 and 211 with Induced Leak - Static
Figure 22 ndash Vehicles 207 and 211with Induced Leak ndash Running Loss
35
0
100
200
300
400
500
600
700
7E0 9E0 7E10 10E10 9E20 7E0 9E0 7E10 10E10 9E20
Tru
e H
ot S
oa
k P
erm
ea
tio
n -
mg
hr
Fuel
0020 dia Induced Leak EffectTrue Hot Soak Permeation
Vehicle 211Vehicle 207
Leak
Leak
0
500
1000
1500
2000
2500
7E0 9E0 7E10 10E10 9E20 7E0 9E0 7E10 10E10 9E20
Da
y 1
Diu
rna
l P
erm
ea
tio
n -
mg
da
y
Fuel
0020 dia Induced Leak EffectDay 1 Diurnal Permeation
Vehicle 211Vehicle 207
Leak
Leak
Figure 24 ndash Vehicles 207 and 211 with Induced Leak - Diurnal
Figure 23 ndash Vehicles 207 and 211 with Induced Leak ndash True Hot Soak
36
Summary of Findings and Results
The E-77-2 test program was a continuation of the previously published E-77 test project and
added eight vehicles tested on five fuels to the knowledge base The permeation trends
previously shown were again present The small sample size and limited number of tests
preclude making statements about statistical validity but in general
o The newer vehicle groups had lower emissions
o Adding ethanol to the fuel increased permeation over the non-oxygenated levels
o Increased volatility increased permeation levels
o SHED emission rates must be corrected for the ethanol error in the FID and the
non-fuel methanol and refrigerant in the measurement
As this test program evolved and additional experience was gathered two program modifications
were made 1) The leak validation methodology was changed and 2) a different metric and
definition of the ldquoHot Soakrdquo was adopted
The leak validation portion of the static permeation test was found to be very sensitive and when
the data was corrected on a minute-by-minute basis for ethanol methanol and refrigerant the
change in apparent permeation rate was due as much to variation as to leaks See the discussion
starting at page 12 for the details of the development
Concern for and recognition of ldquoHot Soakrdquo emissions started in the original evaporative emission
regulations Carburetors had float bowls with ~ 50 ml of fuel that absorbed the latent engine heat
after the vehicle was shut down after operation The heat would cause the bowl temperature to
increase driving fuel vapors out through vents and leak paths to the atmosphere after vehicle
operation Todayrsquos fuel injection engines do not have the open bowls and the emission rates
following vehicle operation are mainly increased temperature permeation We recommended
and adopted a new name for the ldquotemporary emissions following vehicle operationrdquo (TEFVO)
which subtracts the basic permeation rate from the measured emissions See the discussion
starting at page 16 for details
37
Appendix
Acknowledgements
E-77-2 Steering Committee
David Brzezinski EPA
Kevin Cullen GM Powertrain
Dominic DiCicco Ford Motor Company
King D Eng Shell Global Solutions
Ben Hancock CARB
Constance Hart EPA
Phil Heirigs Chevron Global Downstream
Jeff Jetter Honda RampD Americas
Keith KnollNREL
John Koupal EPA
David H Lax API
Jeff Long CARB
Hector Maldonado CARB
Mani Natarajan Marathon Oil Company
David N Patterson Mitsubishi Motors RampD Americas
Jenny Sigelko Chrysler
James P UihleinChevron Global Downstream
Marie Valentine Toyota Technical Center
Kenneth J Wright ConocoPhillips
CRC Members
Brent Bailey CRC
Chris Tennant CRC
Jane Beck CRC
38
Table 12
E0 E10 E20
Inspection Units Fuel 6 Fuel 7 Fuel 4
API Gravity degAPI 602 585 570
Relative Density 6060degF 07382 07447 07508
DVPE psi 701 730 849
Oxygenates--D4815
MTBE vol 000 000 000
ETBE vol 000 000 000
EtOH vol 000 954 2034
O2 wt 000 353 747
Hydrocarbon Composition
Aromatics vol 221 244 108
Olefins vol 80 88 55
Saturates vol 700 573 234
D86 Distillation
IBP degF 974 1040 1022
5 Evaporated degF 1316 1280 1252
10 Evaporated degF 1423 1330 1314
20 Evaporated degF 1564 1410 1413
30 Evaporated degF 1704 1450 1486
40 Evaporated degF 1840 1530 1547
50 Evaporated degF 1975 1950 1596
60 Evaporated degF 2120 2190 1636
70 Evaporated degF 2305 2410 2274
80 Evaporated degF 2588 2710 2695
90 Evaporated degF 3139 3170 3139
95 Evaporated degF 3322 3300 3255
EP degF 3603 3600 3406
Recovery vol 978 978 983
Residue vol 13 10 10
Loss vol 09 12 07
Driveability Index 11199 11015 9898
Data from CRC E-74
CRC E-77-2 Fuel Inspection Results
39
Fuel Units Fuel 6 Fuel 7 Fuel 4
Sulfur Content ppm 29 27 27
Estimated CH Ratio 62090 63323 63252
Est Net Heat of Combustion btulb 18573 18514 18513
Benzene vol 090 100 096
Research Octane Number 932 940 946
Motor Octane Number 838 838 834
(R+M)2 885 889 890
Fuel Units Fuel 6 Fuel 7 Fuel 4
Aromatics vol 2386 2481 2178
Olefins vol 752 892 1074
Saturates vol 6743 5621 4623
Unclassified vol 115 086 015
Ethanol vol 000 920 2111
Benzene vol 089 106 097
CH Ratio 6200 6092 5835
Oxygen wt 0008 1 340 773
Net Heat of Combustion btulb 18703 18016 17160
1 Contains 004 vol MTBE
Fuel Units Fuel 6 Fuel 7 Fuel 4
Oxygen wt 0008 3396 7733
C+H wt 9999 9660 9227
H wt 1389 1362 1350
C wt 8610 8298 7877
Fuel Units 6 7 4
Haltermann D3338 Btulb 18573 18514 18513
Average D3338 Btulb 18579 18514 18491
Oxygen Corrected D3338 Btulb 18579 17860 17103
DHA Btulb 18703 18016 17160
Table 12 (cont)
Suppliers Additional Inspections
Net Heat of Combusion -- Btulb
Carbon Hydrogen and Oxygen
Detailed Hydrocarbon Analysis
40
Vehicle Day 1 Day 2 Day 3
No Fuel Base + Press + Pump RL True HS Perm (Brkthru) Perm (Brkthru) Perm (Brkthru)
E10 - 10 psi 345 --- --- 1278 503 10429 (63) 7069 (348) 7043 (425)
E10 - 7 psi 223 --- --- 994 113 6278 (00) 5065 (00) 4535 (00)
E0 - 9 psi 2229 --- 4921 3870 00 22580 (00) 32310 (00) 23069 (126)
E0 - 7 psi 2991 --- 19896 7269 00 47425 (00) 44517 (00) 31798 (00)
E10 - 10 psi 843 --- --- 3164 04 15479 (310) 17799 (383) 17711 (419)
E10 - 7 psi 664 --- --- 2879 297 12601 (00) 11652 (00) 11653 (00)
E0 - 9 psi 338 --- --- 2492 443 6283 (24) 5810 (136) 5770 (225)
E0 - 7 psi 129 --- --- 2226 187 3672 (00) 2877 (00) 2936 (00)
E20 - 9 psi 553 --- --- 2720 134 11034 (00) 9581 (00) 9812 (00)
E10 - 10 psi 416 --- --- 1916 295 17941 (204) 17309 (346) 17417 (375)
E10 - 7 psi 596 --- --- 2328 719 17834 (00) 17150 (00) 15239 (00)
E0 - 9 psi 195 --- --- 1031 10 4995 (00) 4810 (00) 5072 (26)
E0 - 7 psi 99 --- --- 671 00 3830 (00) 3654 (00) 3670 (00)
E20 - 9 psi 462 --- --- 1697 603 17752 (00) 16900 (00) 16802 (00)
E10 - 10 psi 787 --- --- 8581 2377 14064 (00) 12644 (00) 12237 (00)
E10 - 7 psi 644 --- --- 8122 1222 10865 (00) 8120 (00) 8236 (00)
E0 - 9 psi 325 --- --- 8339 58 4064 (00) 3373 (00) 3080 (00)
E0 - 7 psi 401 --- --- 8425 00 3975 (00) 3026 (00) 2689 (00)
E20 - 9 psi 882 --- --- 10282 00 15480 (00) 13702 (00) 13605 (00)
E10 - 10 psi 976 --- 1209 10012 3929 16449 (00) NA NA
E10 - 7 psi 1468 --- --- 11393 5850 21342 (00) NA NA
E10 - 10 psi 199 --- --- 1383 00 3370 (00) 2268 (191) 2179 (330)
E10 - 7 psi 94 266 --- 563 138 2438 (00) 1838 (00) 1843 (00)
E0 - 9 psi 101 --- --- 837 153 1303 (00) 1158 (129) 1006 (221)
E0 - 7 psi 91 --- --- 1046 07 2071 (00) 1002 (00) 874 (00)
E20 - 9 psi 558 --- --- 4106 00 2840 (00) 2218 (00) 2034 (00)
E10 - 10 psi 551 --- 821 3024 2450 25454 (040) NA NA
E10 - 7 psi 481 --- 1664 2511 62 6783 (00) NA NA
E10 - 10 psi 106 --- --- 1489 00 1243 (00) 879 (00) 1028 (200)
E10 - 7 psi 218 --- --- 2012 00 1848 (00) 1002 (00) 758 (00)
E0 - 9 psi 32 --- --- 1158 04 1005 (00) 708 (00) 574 (00)
E0 - 7 psi 09 --- --- 1845 18 1016 (00) 712 (00) 570 (00)
E20 - 9 psi 47 --- --- 1168 49 1310 (00) 833 (00) 750 (00)
E10 - 10 psi 244 --- --- 1331 574 4920 (00) 8394 (00) 113738 (49)
E10 - 7 psi 239 --- --- 1057 329 5242 (00) 3974 (00) 3944 (00)
E0 - 9 psi 107 --- --- 967 521 4559 (00) 3585 (00) 11017 (00)
E0 - 7 psi 252 --- --- 363 33 4943 (00) 3190 (00) 2815 (00)
E20 - 9 psi 168 --- --- 1394 560 4709 (00) 4400 (00) 7518 (00)
E10 - 10 psi 104 90 --- 719 16 3192 (00) 2602 (00) 2370 (00)
E10 - 7 psi 122 --- --- 979 00 2247 (00) 2317 (00) 2675 (00)
E0 - 9 psi 85 --- --- 811 251 2021 (00) 1659 (2) 1763 (72)
E0 - 7 psi 87 --- --- 797 225 2483 (00) 2941 (00) 2888 (00)
E20 - 9 psi 193 --- --- 1025 00 4168 (00) 4148 (00) 4506 (00)
E10 - 10 psi 324 --- --- 1742 118 25907 (578) 34779 (630) 36014 (643)
E10 - 7 psi 325 --- --- 1683 192 3975 (02) 3550 (01) 3621 (04)
E0 - 9 psi 178 136 --- 1091 254 3270 (00) 2667 (00) 2746 (108)
E0 - 7 psi 204 380 --- 787 00 2117 (00) 2208 (00) 2081 (00)
E20 - 9 psi 204 --- --- 543 74 4685 (00) 4526 (00) 4198 (00)
216
211
2004
Toyota
Camry
XLE
215
2004
Toyota
High-
lander
212
2006
Ford
Taurus
214
2004
Ford
Escape
211L
207L
Static Permeation - mghr Dynamic Perm - mghr
CRC E-77-2 Program Test Results
Diurnal (65ordm to 105ordm) - mgday
202
1996
Taurus
205
2001
Toyota
Corolla
204
1999
Honda
Accord
207
2001
Dodge
Caravan
202L
Table 13
41
Individual Vehicle Diurnal Performance on the Various Fuels
0
1000
2000
3000
4000
5000
6000
0 10 20 30 40 50 60 70
Cu
mu
lati
ve
Pe
rme
ati
on
-m
g
Test Time - hrs
Three Day DiurnalVehicle 204 1999 Honda Accord
10 psi E10
7 psi E10
9 psi E0
7 psi E0
9 psi E20
0
1000
2000
3000
4000
5000
6000
0 10 20 30 40 50 60 70
Cu
mu
lati
ve
Pe
rme
ati
on
-m
g
Test Time - hrs
Three Day DiurnalVehicle 205 - 2001 Toyota Corolla
10 psi E10
7 psi E10
9 psi E0
7 psi E0
9 psi E20
Figure 25 ndash Vehicle 204 Diurnal Performance
Figure 26 ndash Vehicle 205 Diurnal Performance
42
0
500
1000
1500
2000
2500
3000
3500
4000
4500
5000
0 10 20 30 40 50 60 70
Cu
mu
lati
ve
Co
rre
cte
d P
erm
ea
tio
n -
mg
Test Time - hrs
Three Day DiurnalVehicle 207 - 2001 Dodge Caravan
10 psi E10
7 psi E10
9 psi E0
7 psi E0
9 psi E20
0
100
200
300
400
500
600
700
800
900
0 10 20 30 40 50 60 70
Cu
mu
lati
ve
Pe
rme
ati
on
-m
g
Test Time - hrs
Three Day DiurnalVehicle 211 - 2004 Toyota Camry XLE
10 psi E10
7 psi E10
9 psi E0
7 psi E0
9 psi E20
Figure 27 ndash Vehicle 207 Diurnal Performance
Figure 28 ndash Vehicle 211 Diurnal Performance
43
0
50
100
150
200
250
300
350
400
450
500
0 10 20 30 40 50 60 70
Cu
mu
lati
ve
Pe
rme
ati
on
-m
g
Test Time - hrs
Three Day DiurnalVehicle 212 - 2006 Ford Taurus
10 psi E10
7 psi E10
9 psi E0
7 psi E0
9 psi E20
0
500
1000
1500
2000
2500
3000
3500
4000
4500
5000
0 10 20 30 40 50 60 70
Cu
mu
lati
ve
Pe
rme
ati
on
-m
g
Test Time - hrs
Three Day DiurnalVehicle 214 2004 Ford Escape
10 psi E10
7 psi E10
9 psi E0
7 psi E0
9 psi E20
Note The incomplete cumulative results for the 10 psi E10 results resulted from a conflict for the use
of the INNOVA analyzer during the test The INNOVA analyzer is required to correct for the FIDrsquos
ethanol error and the presence of methanol and refrigerant (R-134a) The data was available for the
50+ hour results and the data is valid as shown We have no explanation for the high levels
experienced on the third day of the test No test errors were identified
Figure 29 ndash Vehicle 212 Diurnal Performance
Figure 30 ndash Vehicle 214 Diurnal Performance
44
0
200
400
600
800
1000
1200
1400
1600
0 10 20 30 40 50 60 70
Cu
mu
lati
ve
Pe
rme
ati
on
-m
g
Test Time - hrs
Three Day DiurnalVehicle 215 2004 Toyota Highlander
10 psi E10
7 psi E10
9 psi E0
7 psi E0
9 psi E20
Figure 31 ndash Vehicle 215 Diurnal Performance
45
Table 14
Test Corrected
Vehicle Fuel Total Fuel EtOH R134a Methanol
204 10 psi E10 509899 144040 18298 16754
1999 Honda 7 psi E10 359057 130806 17551 15221
Accord 9 psi E0 178635 13843 18230 9896
7 psi E0 94846 1856 16631 2379
9 psi E20 304271 128408 18261 12143
205 10 psi E10 526659 186599 23354 20895
2001 Toyota 7 psi E10 502229 204246 25990 19198
Corolla 9 psi E0 148775 000 20434 4613
7 psi E0 111536 5489 22408 5619
9 psi E20 514540 212708 25677 19584
207 10 psi E10 389450 196248 12013 30399
2001 Dodge 7 psi E10 272201 114027 11731 19616
Caravan 9 psi E0 105167 1820 12224 15284
7 psi E0 96906 1118 22141 14276
9 psi E20 427882 241488 14268 25432
211 10 psi E10 78164 19733 15159 46970
2004 Toyota 7 psi E10 61190 20211 15929 46525
Camry LE 9 psi E0 34668 1681 14329 42659
7 psi E0 39468 000 16197 57303
9 psi E20 71013 26726 16213 36879
212 10 psi E10 31508 7222 14831 7896
2006 Ford 7 psi E10 36079 10132 15481 3400
Taurus 9 psi E0 22870 2409 15182 3761
7 psi E0 22973 000 15393 4362
9 psi E20 28935 11156 14116 2629
214 10 psi E10 1257887 000 19947 27992
2004 Ford 7 psi E10 131593 24571 16025 8879
Escape 9 psi E0 191611 2940 16487 7213
7 psi E0 109481 5386 80650 3106
9 psi E20 166271 24097 14491 6096
215 10 psi E10 81644 12178 14658 42609
2004 Toyota 7 psi E10 72399 15092 15532 36061
Highlander 9 psi E0 54431 000 14806 25822
7 psi E0 83115 000 14072 26255
9 psi E20 128223 38822 12841 34420
3 Day Diurnal Results
CRC E77-2 Program Diurnal ResultsAll values are in mg
46
0
200
400
600
800
1000
1200
1400
1600
1800
2000
Co
rrecte
d D
aily D
iurn
al
-m
g
Diurnal Ethanol PortionVehicle 204 - 1999 Honda Accord
Ethanol Portion
10 psi E10 9 psi E07 psi E10
1 32
315
341368
383
264273
1 321 321 321 32
9 psi E207 psi E0
1122097
39
0510
442
405412
Figure 32 ndash Vehicle 204 Diurnal Ethanol Portion
0
200
400
600
800
1000
1200
1400
1600
1800
2000
Co
rrecte
d D
aily D
iurn
al
-m
g
Diurnal Ethanol PortionVehicle 205 - 2001 Toyota Corolla
Ethanol Portion
10 psi E10 9 psi E07 psi E10
1 32
359
406
382
431355349
1 321 321 321 32
9 psi E207 psi E0
0 00
712649
406
420414
Figure 33 ndash Vehicle 205 Diurnal Ethanol Portion
47
0
200
400
600
800
1000
1200
1400
1600C
orr
ecte
d D
aily D
iurn
al
-m
g
Diurnal Ethanol PortionVehicle 207 - 2001 Dodge Caravan
Ethanol Portion
10 psi E10 9 psi E07 psi E10
1 32
488
442408
409
490535
1 321 321 321 32
9 psi E207 psi E0
00
1144
27
0101
556
587552
Figure 34 ndash Vehicle 207 Diurnal Ethanol Portion
0
50
100
150
200
250
300
350
400
Co
rrecte
d D
aily D
iurn
al
-m
g
Diurnal Ethanol PortionVehicle 211 - 2004 Toyota Camry XLE
Ethanol Portion
10 psi E10 9 psi E07 psi E10
1 32
264
242245
1 321 321 321 32
9 psi E207 psi E0
329
306356
00
73
64
00
00
00
325
431
370
Figure 35 ndash Vehicle 211 Diurnal Ethanol Portion
48
0
20
40
60
80
100
120
140
160
180
200C
orr
ecte
d D
aily D
iurn
al
-m
g
Diurnal Ethanol PortionVehicle 212 - 2006 Ford Taurus
Ethanol Portion
10 psi E10 9 psi E07 psi E10
1 32
216
170
316
1 321 321 321 32
9 psi E207 psi E0
194
288
436 102
105
85
00
00
00476
529
243
Figure 36 ndash Vehicle 212 Diurnal Ethanol Portion
0
200
400
600
800
1000
1200
Co
rrecte
d D
aily D
iurn
al
-m
g
Diurnal Ethanol PortionVehicle 214 - 2004 Ford Escape
Ethanol Portion
10 psi E10 9 psi E07 psi E10
1 32
00
1 321 321 321 32
9 psi E207 psi E0
201
202152
38
05
19
56
1469
103
171188
143
67
11275
Figure 37 ndash Vehicle 214 Diurnal Ethanol Portion
49
0
50
100
150
200
250
300
350
400
450
500C
orr
ecte
d D
aily D
iurn
al
-m
g
Diurnal Ethanol PortionVehicle 215 - 2004 Toyota Highlander
Ethanol Portion
10 psi E10 9 psi E07 psi E10
1 32
121
136
196
1 321 321 321 32
9 psi E207 psi E0
198
217213
0000
00
0000
00
335 292
283
Figure 38 ndash Vehicle 215 Diurnal Ethanol Portion

1
ENHANCED EVAPORATIVE EMISSION VEHICLES CRC E-77-2
INTRODUCTION
Background - The Coordinating Research Council (CRC)1 has sponsored studies on evaporative
emissions of vehicles for over two decades Whereas the exhaust (or tailpipe) emissions have
been extensively studied as a source of air pollution and through the development of advanced
control systems reduced to very low levels in properly maintained and functioning vehicles the
non-tailpipe emissions levels are not as well understood or documented
This report describes an on-going investigation into the evaporative emission performance of
light-duty vehicles as they exist in the American population Evaporative emissions are in this
context the fuel-related emissions that escape from the vehicle at rest and during vehicle
operation (omitting those that come from the tailpipe) The CRC E-77-2 Evaporative Emission
Test Program the subject of this report evolved from the CRC E-77 Pilot Study and used test
procedures and insight borrowed from other CRC test programs including E-65 Fuel
Permeation from Automotive Systems All of these programs including the subject of this
report were conducted at the Automotive Testing Laboratories Inc (ATL) in Mesa AZ2 which
provides unique experience and facilities to perform evaporative emission programs of this
nature
For the follow-up study E-77-2 the sponsor selected eight vehicles for evaluation on five
gasoline fuel blends including three levels of ethanol (zero 10 and 20 volume percent) In
addition two of the vehicles were given a limited evaluation with implanted small leaks in the
evaporative system The selected vehicles were prepared for test preconditioned for a minimum
of four weeks on the test fuel when the ethanol level was changed and then subjected to the test
sequence The evaporative emission test sequence consisted of the following four parts
1 Static Permeation Rate Measurement at 86degF (Includes leak checks)
2 Dynamic (Running Loss) Permeation and Canister Loss Measurement at 86degF
3 Hot Soak (ldquoTruerdquo or Net Value) following the Dynamic Test at 86degF
4 Two Day Diurnal (65degF to 105degF) Permeation and Canister Loss Measurement
While one objective of this project was to measure the evaporative emission performance of the
selected vehicles a second objective was to develop and refine the test procedures and analysis
methods We have included documentation of these test procedures beginning on page 10
Each vehicle started the evaluation with a 4-week preconditioning on 10 psi E10 fuel and then
ran the 10 psi E10 evaporative emission test sequence (static running loss hot soak and
1 Coordinating Research Council Inc 3650 Mansell Road Suite 140 Alpharetta GA 30022 (678) 795-0506
wwwcrcaoorg
2 ATL 263 S Mulberry Street Mesa AZ (480) 649 7906 wwwATL-AZcom Greg Barton President
2
diurnal) Based on the previous experience with CRC E-65 it was thought that the four week
period was appropriate for the permeation rate to re-stabilize following the fuel change After
validation and committee approval of the data the fuel was changed to a lower volatility (7 psi)
E10 fuel allowed to re-stabilize for up to one week and then re-evaluated on the emission test
sequence The shorter stabilization period was thought appropriate to allow the system to
respond to a volatility change of a similar ethanol content fuel
Once the test results were approved the vehicle was refueled with 9 psi E0 fuel and again
subjected to a 4-week minimum re-stabilization The evaporative performance test sequence was
then repeated and repeated again with a 7 psi E0 fuel after a one week stabilization period The
final test fuel was the 9 psi E20 mixture again after a 4-week stabilization
Contract History ndash Members of the CRC Real World Vehicle Emissions and Emissions
Modeling Group together with technical representatives from EPA and the California Air
Resources Board met at EPArsquos Ann Arbor office on December 14 2006 and outlined the scope
and content of the study A follow-on to the CRC E-77 Pilot Study it included evaporative
emission performance testing of eight recent model light duty vehicles using three ethanol levels
(E0 E10 and E20) at various RVP levels The vehicles were not the same as those used in the
Pilot Study
The original contract included eight vehicles tested on four fuels (7 psi E0 9 psi E0 7 psi E10
and 10 psi E10) A later contract modification added limited testing on two vehicles with
implanted leaks added testing on 9 psi E20 Fuel and included monies to pay for retesting and
repairs of a problem vehicle
Period of Performance ndash Vehicle preconditioning was first reported in the Volume 3 Number 1
progress report dated April 22 2007 and continued through Volume 3 Number 83 dated
November 16 2008 Figure 1 depicts the actual program testing activity The colored bars
indicate both the preconditioning and the vehicle performance testing period Analysis and
comments were contained in the progress reports through November
ID Vehicle Apr May Jun Jul Aug Sep Oct Nov Dec Jan Feb Mar Apr May Jun Jul Aug Sep Oct Nov Dec
202 1996 Ford Taurus
204 1999 Honda Accord
205 2001 Toyota Corolla
207 2005 Dodge Caravan
207L Caravan with Leak
211 2004 Toyota Camry
211L Camry with Leak
212 2006 Ford Taurus
214 2004 Ford Escape
215 2004 Toyota Highlander
2007 2008
E77-2 Project Timing
Figure 1 ndash Testing Activity
3
TEST PROGRAM OVERVIEW
Vehicle Selection
The sponsors chose to evaluate eight vehicles on five fuel blends The vehicles were defined to
be one pre-enhanced evaporative system vehicle (1996 model year) five ldquoEnhanced
Evaporativerdquo system vehicles (model years 1999 to 2001) and two ldquoTier 2rdquo (Near Zero) vehicles
that were 2004 model year vehicles or later The pre-enhanced vehicle was certified to a single
dayrsquos diurnal control The enhanced control vehicles were subject to a much more severe
performance test including a three-day diurnal a high temperature hot soak and a measured
running loss test The Tier 2 vehiclesrsquo test requirements were similar to the enhanced vehicles
but at a standard of about one-fourth of the enhanced vehicles level All but the 1996 pre-
enhanced vehicle were certified to the On-Board Refueling Vapor Recovery (ORVR) emission
requirements All the vehicles were the property of CRC having been bought along with other
vehicles for CRC Project E-74b (CO vs RVP) The vehicles were originally purchased for the
E-74b project from local retail sources in the Phoenix AZ area
Each candidate vehicle was checked at the start of the test program to make sure that there were
no system leaks to verify system purge was present and to generally establish that it was safe to
operate
Vehicle Fleet
Table 1 below lists and describes the eight vehicles studied in this program A more complete
file containing the vehicle road load coefficients and dynamometer settings is included in the ldquoE-
77-2 Companion Filesxlsrdquo (Microsoft EXCELtrade) file available on the CRC website
wwwcrcaoorg
Table 1
Vehicle
Number
Model
Year Make Model
Odometer
Miles Evap Standards Evap Family
Fuel
Tank
Plastic
Metal
202 1996 Ford Taurus 86538 Pre-Enhanced TFM1115AYMEB Metal
204 1999 Honda Accord 100418 EnhancedORVR XHNXR0130AAA Metal
205 2001 Toyota Corolla 92047 EnhancedORVR 1TYXR0115AK1 Metal
207 2001 Dodge Caravan 92740 EnhancedORVR 1CRXR0165XAA Plastic
214 2004 Ford Escape 40188 EnhancedORVR 4FMXR0110BBE Plastic
215 2004 Toyota Highlander 88000 EnhancedORVR 4TYXR0165PZ1 Plastic
211 2004 Toyota Camry 42592 Near ZeroORVR 4TYXR0130A11 Plastic
212 2006 Ford Taurus 28354 Near ZeroORVR 6FMXR0185GAK Metal
E77-2 Vehicle Fleet
4
Test Fuels
The fuel comparisons selected for this project were three levels of ethanol content with volatility
varied as listed in Table 2 below
Table 2
Test Fuel Target Values
7 psi 9 psi 10 psi
E0 X X
E10 X X
E20 X
CRC had fuels remaining from Project E-74 in quantities sufficient to conduct this program eg
7 psi E0 and E10 and 9 psi E203 Inspection records of the base fuels are repeated in the
Appendix using their E-74b identifications fuels 6 7 and 4 respectively The nominal 7 psi
fuels both E0 and E10 were locally blended with commercial butane to make the higher
volatility 9 psi E0 and the 10 psi E10 The blends were done in drum batches approximately 50
gallons at a time by adding small amounts of butane circulating for a brief period then
sampling and determining the new volatility with a ldquoGrabner4rdquo instrument using test procedures
described in ASTM D 5191 The higher (10 instead of 9) volatility of the E10 fuel was specified
because many localities permit ldquosplash blendingrdquo of ethanol to gasoline and allow a 1 psi
volatility exemption for their vapor pressure limits
Adaption Period for Test Fuel Change
Many areas of the United States were required5 to use an oxygenated fuel to improve vehicle
emissions especially during the summer season While MTBE was the most common
oxygenate ethanol was also used CRC Project E-65 demonstrated that the permeation of
vehicle fuel systems increased with the use of fuels containing ethanol compared to fuels with
MTBE or no oxygenate CRC Project E-65 also demonstrated that if ethanol had been
previously used and the fuel replaced with a non-ethanol blend it could take two to four weeks
for the ethanol increase to dissipate
The protocols adopted for this test program were to require a minimum of four weeks of vehicle
exposure to a new fuel when first introducing 10 or 20 volume percent ethanol to the vehicle and
the same period of time when moving to an ethanol-free (E0) fuel Note when changing RVP
only a one week exposure has been demonstrated as sufficient
3 While the E20 target was 9 psi the average inspection value (5 labs) was 85 psi The sponsor chose to continue
the test at this level
4 wwwgrabner-instrumentscom MINIVAP VPS VPSH Vapor Pressure Tester The portable MINIVAP VPS
and VPSH vapor pressure testers are the worldwide accepted standard instruments for determination of the vapor
pressure of gasoline according to ASTM D 5191 ASTM D 6377 ASTM D 6378 and EN 13016 1+2
5 The requirement for oxygen content in RFG fuels was removed by EPA in May of 2005 as directed by the
Energy Policy Act of 2005 The Renewable Fuels Standard requiring renewable fuels (eg ethanol) in increasing
amounts over the years replaces the mandate
5
The Test Concept Measuring Leaks Permeation and Diurnal Vapor Losses
Mass emissions are measured in a VT SHED or Variable Temperature Sealed Housing for
Evaporative Determination The SHED test method
combines all three emission mechanisms (leaks
diurnal venting and permeation) into a single test
result
The SHED technique involves placing the vehicle in
a sealed enclosure (Figure 2) and calculating the
mass in the enclosure from the volume density and
concentration in the enclosure at the start and end of
a time period The difference between the mass at
the start and end of test is the emission rate eg
grams per unit time
CRCrsquos E-77 emission test programs have
developed (and strive to continually improve)
new methodologies for understanding and quantifying vehicle evaporative emission rates The
concept partitions and assigns the vehiclersquos contribution to the evaporative emission inventory
into three mechanisms
1 Permeation
2 Tank vapor venting
3 Leaks (with two subsets - Liquid and Vapor)
Permeation is the migration of HC through the various elastomers (polymers) in a vehicle fuel
system6 Previous testing has shown that permeation rate is strongly affected by the materialrsquos
temperature doubling for each 10ordmC (18ordmF) increase in the range of normal summer
temperatures It is also strongly affected by gasoline composition especially with ethanol-
containing fuels
6 ldquoFuel Permeation from Automotive Systems Final Report CRC Project E-65rdquo Haskew Liberty and McClement
September 2004 available on the CRC and California Air Resources Board websites
Figure 2 ndash Sealed Housing for Evaporative
Determination
6
Tank vapor venting emissions are controlled by fitting a carbon canister to the atmospheric tank
vent Figure 3 is a schematic of a typical early control system During a daily heating period the
temperature of the vehiclersquos fuel tank increases forcing HC vapors from the tank Excess
emissions exceeding the carbon canisterrsquos capacity are vented to the atmosphere
Figure 3 - Control System Schematic
Leaks can be liquid or vapor Permeation and tank venting losses are strongly driven by fuel
composition ambient temperature and ambient temperature change Liquid leaks are not
strongly affected by normal summer temperatures and are thought to have two components
1 Static leaks occurring while the engine is turned off and the vehicle is stationary
2 Increase in leak rate caused by the system pressure increase during engine operation
A Test Method for Separating Permeation from Tank Venting and Leaks ndash In a previous
CRC Project (E-65) the canister loss was separated from the permeation measurement by
venting the losses from the carbon canister outside
the SHED For Project E-77 the canister vent
losses were collected and measured in a separate
ldquotrap canisterrdquo on a scale outside the SHED as
shown in Figure 4 This vent line was capped off
(ie sealed during the Static Test) but connected
as shown in the figure for the Dynamic and the
Diurnal Test The ambient temperature in the
SHED was constant during the static test and
there was no vapor created at constant
temperature
Figure 4 - Trap Canister
7
This vent was closed to pressurize the system for the leak evaluations The resulting SHED
increase in HC mass was permeation7 The last mechanism that needed to be evaluated was
leaks Leaks can be both vapor and liquid A liquid leak can have significant mass currently
undetected by the vehiclersquos on-board diagnostic system Considerable thought and effort have
gone into the creation of a simple and effective liquid leak detection methodology without
success The techniques used in this project required the use of a SHED for measurements The
techniques were not simple but they proved effective
Based on experience a vehiclersquos permeation rate is expected to be between the range of 4 to 90
mghour at the 86degF test temperature The presence of a static liquid leak is expected to
overwhelm this value such a leak would (or could) be apparent by inspection Leaks from the
vehicles were quantified in a three-step test process The first step was to measure the static
permeation rate of the vehicle at 86ordmF The vehicle was allowed to stabilize overnight at 86ordmF in
the SHED and the permeation rate was calculated from the mass increase in the SHED during a
one-hour measurement period The second part of the test looking for pressure driven leaks in
the vapor system was performed by pressurizing the vehiclersquos tank to 5rdquo H2O through a special
fuel cap and tubing from outside the SHED (Figure 5) The special fuel cap the hose and the
pressurization apparatus were installed before the start of the sequence The HC concentration in
the SHED was monitored and the increase in the mass of HC in the SHED during the 30-minute
pressurization period compared to the static permeation rate If there was no (or insignificant)
rate of increase it was deduced that no vapor leak was present
The third and final part of the test was to energize the vehiclersquos fuel pump and pressurize the
system up to and including the injectors (Figure 6) If there were a pressure leak in the liquid
system an increase in the SHED mass over the 30-minute measurement period would be seen
ie the leak would be additive to the permeation rate
6 This is a simplification There are other HC sources present that are not fuel permeation These include tire paint
adhesives and vinyl emissions and the possibility of fuel leaks from the fuel injectors We believe these to be a
minor component of the emissions measured in this study
Figure 5 - Static Test ndash Tank Pressurization
8
Figure 6 ndash Static Test ndash Fuel Pump Energized
Other Tests (Dynamic Hot Soak and Diurnal) - A similar configuration is used to isolate the
tank venting losses from the permeation measurements determined by other test procedures The
vehiclersquos canister vent is connected with a low permeation hose (Teflontrade) to a bulk-head fitting
in the SHED wall and then to a separate ldquotrap canisterrdquo on a top-loading scale Any HC
emissions that escape from the vehiclersquos canister are captured in the trap canister and measured
at a 001 g (10 milligram) precision The trap canister (a 1 Liter Ford model) is purged before
each test and maintained at a ldquodryrdquo condition so that it captures all of the vehiclersquos escaping
emissions This assumption is probably violated during the high volatility tests where there are
30 grams of daily emissions but this is not a concern at this time
Test Elements for E-77-2 - The following flow chart (Figure 7) displays the various elements
utilized during the testing of the various vehicles and fuels during this program Details of each
of the four basic tests follow the flow chart
9
Drain and 40 Fill
with 10 psi E10 Test Fuel
Road Preconditioning
Four LA-4rsquos or Equivalent
Drain and 40 Fill
with 10psi E10 Test Fuel
Overnight Park at 86degF
Move to SHED
Connect Test Instrumentation
Stabilize at 86degF
Perform Constant Temperature
Permeation Series (86degF)
1 hour Permeation Rate Test
frac12 hour Tank Pressurized Test
frac12 hour Pump Energized Test
Transfer to RL SHED
Connect Test Instrumentation
Stabilize at 86degF
Perform Dynamic Permeation Test
Two LA92 Driving Cycles amp
One Hour Hot Soak
Drain and 40 Fill
With 10 psi E10 Test Fuel
Road Preconditioning
Four LA-4rsquos or Equivalent
Move to VT-SHED
Connect Test Instrumentation
Stabilize at 65degF for 6 hrs Minimum
Perform 3-Day Diurnal Evaluation
72 hr 65deg to 105degF VT Test
Drain and 40 Fill
with 7 psi E10 Test Fuel
Condition Fuel System
By Driving for One Week
Repeat Steps 1 ndash 12
On 7 psi E10 Test Fuel
Drain and Fill with 9 psi E0 Test Fuel
Condition Fuel System by 4 weeks Driving
Repeat Steps 1 ndash 12
On 9 and 7 psi E0 and
Repeat Steps 0-12
On 9 psi E20 Test Fuels
Precondition Fuel System
With 4 Weeks Driving on
10 psi E10 Test Fuel
1
2
3
4
5
6
7
8
9
10
11
12
0
Figure 7 ndash Testing Flow Chart
10
Test Procedures ndash There are four basic tests in the E-77-2 test protocol
1 Static Permeation Rate (includes checks for vapor and liquid leaks)
2 Running Emissions (Dynamic Test)
3 Hot Soak
4 Diurnal
Each is described in detail below
1 Static Permeation Rate Testing
The constant temperature (static) permeation rate is measured in a traditional SHED (Constant
temperature) in the following manner
A The fuel tank is drained and filled to 40 tank capacity with the test fuel
B The day before testing the vehicle is driven over four road trips of 75 miles each
to precondition the canister8 (These drives are similar to the LA-4)
C Upon return from the road pre-conditioning the fuel tank is drained and filled to
40 tank capacity with the test fuel9
D Vehicle is parked for 18-22 hours in a controlled temperature environment at test
temperature (86ordmF)
E The vehicle is then moved (without starting) into the test (86ordmF) SHED
F The canister vent is connected to the SHED bulkhead fitting which routes the
vapor to the trap canister outside the SHED
G The tank system pressurization hose is connected
H The fuel pump electrical connection is connected
I The SHED is sealed the inside temperature is allowed to stabilize and the test is
started Continuous THC measurements are made using a FID Ethanol
methanol and R134a concentrations are measured using an INNOVA analyzer
All measurements are made at least every minute for one hour to determine the
stabilized permeation rate
J At the end of the static test (60 minutes) the vehiclersquos vapor system is pressurized
to 5 inches of water for thirty minutes Measurements are made to quantify vapor
leaks as determined by a change in the THC in the SHED
K The fuel pump is then energized for 30 minutes while maintaining the 5 inches of
water on the vapor system Liquid leaks are quantified as determined by a change
in the concentration of THC in the SHED
The purpose of steps J and K above is to validate that the permeation rate measurement was
made without the presence of any leak ndash either liquid or vapor A detailed discussion follows
starting at page 12
8 This conditioning can be done in the laboratory on a chassis dynamometer if proper attention is paid to underbody
cooling and unrepresentative fuel tank temperatures are avoided 9 Vehicles with ORVR systems will add the refueling vapors to the canister This is OK
11
2 Running Loss Test (Dynamic Test)
A The vehicle is placed in the RL-SHED and prepared for test (The fuel level and
condition for the dynamic test is the fuel remaining after completion of the static test ndash
40 fresh fill of the appropriate test fuel)
B Outside air source for the engine is connected
C Vehicle exhaust is connected
D Fuel tank thermocouple is connected
E Canister vent is connected to the SHED bulkhead fitting which routes the vapor to the
trap canister outside the SHED
F Vehicle is allowed to stabilize in the RL-SHED at test temperature (86degF) for a minimum
of 12 hours ndash preferably overnight
G Two cycles of the Unified Cycle (LA-92) driving schedule (48 mins) are driven while
measuring the mass emissions in the SHED Vehicle is allowed to idle (in drive) for 30
seconds between the two cycles Ambient air temperature is maintained (to the extent
possible) at 86degF Fuel tank surface temperature is monitored during vehicle operation It
should increase during the drive from 10 to 18degF to simulate expected on-road
temperature increase Measured mass emissions are corrected using the INNOVA data
for the ethanol methanol and refrigerant emissions
3 Hot Soak10
This procedure is executed immediately following the Running Loss Test procedure
described above
A Engine is turned off transmission selector is placed in park and driver exits the
enclosure using the double door air lock taking care to minimize any air exchange
between the laboratory and the SHED This starts the one hour ldquohot soakrdquo period
B Measurements of mass emissions in the SHED are continued for another 60 minutes
(until time = 108 minutes) correcting for the ethanol methanol and refrigerant mass
using the INNOVA instrument data This ends the hot soak Hot soak emissions are
calculated as the net difference for the one hour hot soak (CorrMass108 ndash CorrMass48
minus the 86degF static hourly rate all mass rates in mghour)
4 Diurnal Test
A The fuel tank is drained and filled to 40 tank capacity with the test fuel
B The day before testing the vehicle is driven over four road trips of 75 miles each to
precondition the vehicle and the canister
C Upon return from the road pre-conditioning the fuel tank is drained and filled to 40
tank capacity with the test fuel
D The vehicle is parked for 18-22 hours in a controlled temperature environment at the
initial diurnal test temperature (65ordmF)
E The SHED is sealed allowed to stabilize at the 65degF temperature and the 3-day
California Diurnal Test is started
10 We define the ldquohot soakrdquo to be the temporary increase in emission rate caused by the immediately preceding
operation of the vehicle It is the increase in the SHED mass (corrected for EtOH MeOH and R-134a) over the
one hour period minus the previously established ldquostaticrdquo permeation rate
12
F ldquoContinuousrdquo (every 30 seconds) THC measurements are made using a FID Ethanol
methanol and R134a (refrigerant) concentrations are measured using an INNOVA
analyzer at least every 10 minutes for the duration of the test (72 hours)
Static Permeation Test ndash Leak Validation
If a leak is detected during either the vapor system pressure portion (Step J) or the pump
energized portion (Step K) of the Static Permeation Test procedure it calls into question whether
the permeation rate measurement accurately reflects fuel system permeation or if instead a
combination of permeation and the implied leak was measured If a leak is confirmed the
permeation rate measurement is called into question and an investigation possible remedy and
retest is indicated
The permeation rate measurement must be corrected for the FIDrsquos ethanol misrepresentation and
the presence of non-fuel hydrocarbons (methanol and refrigerant) The leak check however is
made using the change in mass increase in the SHED using the uncorrected FID mass calculation
as the determinate It was found that the corrections for ethanol methanol and refrigerant were
introducing ldquonoiserdquo into the trace and that these were being misinterpreted as leaks
y = 062x - 19
y = 047x + 67
y = 055x - 01
0
10
20
30
40
50
60
70
80
90
100
0 20 40 60 80 100 120
SH
ED
Mas
s -
mg
Test Time - minutes
Leak TestVehicle 204 - 1999 Honda Accord - 9 psi E0
Test 7028
Pump ActivatedTank Pressurized
Figure 8 above represents the calculations made during the inspection of data from a successful
test EXCELrsquostrade ldquoSLOPErdquo function is used to calculate the linear regression values based on
the FID calculation for mass for Time 0 to 60 minutes Time 64 to 90 minutes and Time 94 to
120 minutes A 4-minute gap was included between each sequence to establish the new mass
emission rate during the ldquopressure onrdquo (T60 to T90) and the ldquopump energizedrdquo periods
The slope of 047 for the ldquoTank Pressurizedrdquo period in the example above is compared to the
slope of 062 calculated for the permeation rate (or hot soak) period Since the ldquoTank
Figure 8 ndash Leak Test
13
Pressurizedrdquo slope is not more than 10 higher than the hot soak permeation rate we assume
that there is no leak present A similar comparison is made for the slope determined during the
ldquopump onrdquo period The choice of a 10 allowance is arbitrary and is used here to allow for
normal and unavoidable test variation
For tests in which the above procedure determines that no leak is present a value of zero is
reported in the test summary for the leak results If a positive value is reported it calls that test
into question and an investigation possible repair and retest is indicated
Static Permeation Rate Determination
The static permeation rate is determined based on a linear regression through the individual
SHED mass data points (data measured each 30 seconds) of the corrected fuel results (corrected
for the FID error and subtracting the methanol and refrigerant) from the first 60 minutes of
testing as illustrated in Figure 9 below
y = 05636x + 0505
0
5
10
15
20
25
30
35
40
45
0 10 20 30 40 50 60
Pe
rme
ati
on
-m
gs
Test Time - mins
Static Permeation DeterminationVehicle 204 - 1999 Honda Accord - 9 psi E0 Fuel
Raw SHED
Corrected Fuel
Permeation Rate Based on Corrected Results
Permeation Rate = 5636 x Time = 338 mgshr
In this example the static permeation rate is 338 mghr
Dynamic (Running Loss) and Hot Soak Test
The preceding section addressed the concepts of separating the permeation emissions from the
tank venting emissions and establishing the presence or absence of leaks The second part of
this study includes a dynamic test to measure the permeation and tank venting emissions during
Figure 9 ndash Static Permeation Determination
14
vehicle operation (ldquorunning lossesrdquo) and the temporary condition following vehicle operation
known as the ldquohot soakrdquo
This is considered a ldquodynamicrdquo test because the vehicle is driven and the fuel and vapor system
temperatures rise during the test The ambient temperature in the Running Loss SHED during
the test was held constant at 86degF while the vehiclersquos fuel system temperature rose during the
test Two 1435 second (239-minute) LA-92 driving cycles were performed consecutively during
the running loss measurements with a 30-second idle in-between During this test tank fuel
temperature was expected to rise by an average approximately 18degF above the initial ambient
temperature The running loss air handling system included a proportional speed under-car
blower operated as a slave to dynamometer speed This apparatus was used during running loss
testing with minor tuning for specific vehicles Without additional input it is capable of
reasonable fuel tank temperature control Each vehicle was fitted with a surface-mount
thermocouple at the front of the fuel tank located at approximately the 18th
fill level to measure
the fuel liquid temperature No attempt was made to follow a predefined fuel tank temperature
profile (FTTP) in this program Fuel temperatures were recorded and results are available in the
real-time records
Vehicle running loss emissions are measured in a special version of a SHED known as a
Running Loss SHED (RL-SHED) shown in Figure 10 Special features of the RL-SHED
include a sealed chassis dynamometer for simulating vehicle driving loads a sealed outside air
supply for engine intake a sealed exhaust conduit for engine exhaust and an under-chassis fan
for simulating underbody air flow as described above A vehicle is operated inside the RL-SHED
over a chosen driving cycle The increase in HC emissions inside the enclosure are measured
and calculated as mass emissions per 40 CFR sect86163-96
Figure 10 - Running Loss SHED
15
Vehicle testing in an RL-SHED is complicated by several factors including
1 Engine must be supplied with external induction air
2 Exhaust must be conducted externally without any leaks
3 Load supplied to the vehicle through the chassis dynamometer must not create or
allow external leaks
4 Internal SHED temperature must be maintained while sizable heat is rejected to the
ambient by the running engine and exhaust
5 Cooling air supplied to the radiator must be modulated to represent the vehiclersquos road
speed
6 Underbody (and especially the fuel system) temperature should represent the rate of
rise experienced by a real road-drive
Canister vent losses were isolated from permeation emissions using the technique previously
described The vehiclersquos carbon canister fresh air vent was connected to the outside of the RL-
SHED using a leak-tight PTFEreg
hose (38rdquo OD commercial tubing US Plastics 58055 PTFE or
equivalent) connected to a small carbon ldquotraprdquo canister located on a top-loading precision scale
The scale precision was 001 grams (10 milligrams) and it was purged prior to each test There
were no tank venting emissions measured on any of the running loss test measurements All of
the vehicles appeared to be actively ldquopurgingrdquo their respective control canisters and drawing
fresh air during the test If there were any emissions from the vehiclersquos control canister as might
have occurred if there were no vehicle purge or if very high volatility fuels with excessive vapor
generation were used they would have been measured
The Running Loss Driving Cycle consisted of two cycles of the ldquoUnified Driving Cyclerdquo
otherwise known as the LA-92 A velocity versus time plot for one cycle is shown in Figure 11
The LA-92 cycle takes 24 minutes to complete and covers 98 miles with many speed changes
Two back-to-back cycles were driven the first as a ldquocold startrdquo and the second following a 30-
second vehicle idle The ldquocold startrdquo condition was created by soaking the vehicle for a
Figure 11 ndash Running Loss Driving Cycle
Unified Cycle (LA-92)
0
10
20
30
40
50
60
70
80
0 5 10 15 20 25Test Time - minutes
Spe
ed -
mph
Cycle Time (min) 239
Maximum Speed (mph) 672
Average Speed (mph) 246
Average Non-Zero Speed (mph) 294
Time Zero Speed () 162
Distance (miles) 982
16
minimum of 18 hours at 86degF moving it to the stabilized 86degF RL-SHED making the test
connections and then waiting a minimum of one hour before the initial start and run
The SHED emissions were measured during 48 minutes of engine operation and then
continuously for one hour after the engine was turned off This one hour engine-off duration
was the ldquohot soakrdquo period The total test time is 1 hour and 48 minutes
Figure 12 shows results from the 9 psi E0 fuel test on Vehicle 204 The horizontal axis is test
time in minutes and the vertical axis is the HC mass measured in the RL-SHED during the test
period
The engine was shut off at the end of the second LA92 drive cycle (~48 minutes) and the
analysis system continued to measure the HC emissions in the SHED for the next 60 minutes
This represented the ldquohot soakrdquo portion of the test
0
50
100
150
200
250
300
0 20 40 60 80 100 120
Co
rre
cte
d T
ota
l F
ue
l C
um
ula
tiv
e P
erm
ea
tio
n -
mg
Test Time - minutes
Running Loss and Hot SoakVehicle 204 - 1999 Honda Accord - 9 psi E0 Fuel
Test 25668
Running Loss Hot Soak
Running Loss Std =005 gmiThis Test = 0010 gmi
RL = 249 mghr
2774
2332
Tru HS = 442
1990
The ldquoTruerdquo Hot Soak
The traditional hot soak is determined from the increase in SHED emissions as measured for one
hour following a prescribed drive to heat up the vehicle (2 LA-92 cycles during the Running
Loss Test) Hot soak emissions however have two components that caused by the elevated
temperature resulting from the drive and that resulting from one hour of static permeation
Figure 12 ndash Running Loss Test Results
17
To separate these two components and determine the ldquotruerdquo hot soak emissions the following
procedure was used ldquoTraditionalrdquo hot soak emissions were first calculated by subtracting the
ldquostart of hot soakrdquo cumulative SHED hydrocarbon value (ie 199 mg t = 48 minutes) from
the final cumulative SHED hydrocarbon value (ie 2774 mg t = 108 min) This resulted in a
cumulative SHED hydrocarbon value of 78 mg for the 1 hour hot soak The previously
determined static permeation value (ie 338 mg for a 1 hour hot soak test- see Figure 9) was
then subtracted to arrive at the ldquotruerdquo hot soak value of 442 mg The increase in the permeation
rate (the ldquohot soak effectrdquo) caused by the increase in the system temperature is accounted for by
subtracting the ldquostabilized permeation raterdquo at 86degF
In Figure 12 the static permeation rate is superimposed as a solid blue line on the plot from the
starting point of the hot soak until its end (one hour) While the ldquotraditionalrdquo hot soak would be
calculated as 78 mg (277 mg ndash 199 mg) the ldquotruerdquo hot soak is determined as 442 mg (2774 mg
ndash 2332 mg) True hot soak values reported here were determined in this manner
Diurnal Test
Diurnal permeation was determined by subjecting the vehicle to a three-day period in a
temperature controlled SHED while continuously recording the total hydrocarbon every 30
seconds The SHED environmental temperature was varied from 65degF to 105degF per the
California Diurnal Test protocol Canister vent losses were isolated from permeation emissions
using the technique previously described The vehiclersquos carbon canister fresh air vent was
connected to the outside of the RL-SHED using a leak-tight PTFEreg
hose connected to a small
carbon ldquotraprdquo canister located on a top-loading precision scale The scale precision was 001
grams (10 milligrams) and it was purged before each test
DISCUSSION OF TEST RESULTS
Results
Emission results are presented below by ldquomechanism11
rdquo with the data averaged for the five
ldquoenhancedrdquo and the two ldquonear zerordquo vehicles The lone ldquopre-enhancedrdquo vehicle the 1996 Ford
Taurus (202) was a special case and will be discussed in a separate section Two of the vehicles
the 2001 Dodge Caravan (207) and the 2004 Toyota Camry (211) were also subjected to limited
testing with an ldquoimplanted leakrdquo (a 0020rdquo dia hole in a special tank gas cap) to investigate the
magnitude of a known leak These results (ldquoLeakersrdquo) follow the discussion on the Taurus
Static Permeation Rate (Constant Temperature (86degF)) - Average permeation rate compared
by fuel specification for two vehicle groups ldquoenhancedrdquo and the ldquonear zerordquo evaporative
emissions
11 The ldquomechanismsrdquo are 1 Permeation 2 Tank Venting (Daily Temperature Rise) and 3 Leaks
18
0
10
20
30
40
50
60
Co
rrecte
d P
erm
eati
on
Rate
-m
gh
r
Fuel
Static Permeation Rate - All FuelsE77-2 Program Vehicles
7 E0 9 E2010 E107 E109 E0 7 E0 9 E2010 E107 E109 E0
Enhanced(5 veh)
Near Zero(2 veh)
Figure 13 presents the static permeation rate performance for the average of the 5 ldquoenhancedrdquo
and 2 ldquonear zerordquo vehicles on the five fuels included in the test program Each group is ordered
from left to right by ethanol level The vertical scale is the average permeation rate in mghour
for the static (86degF constant temperature) test
Previous studies1213
had shown that vehicles operated on the fuel containing 10 vol- ethanol
would have higher permeation rates compared to those resulting from operation on a non-ethanol
(E0) fuel of similar properties We also expected that vehicles using higher vapor pressure fuel
would exhibit increased permeation levels at similar ethanol levels Other studies had reported
mixed results when comparing E20 permeation rates against E10 measurements ndash some were
higher and some were lower The difference may have been within the repeatability of the
measurements and probably suffered from a limited number of observations These mixed
results are present in this testing of the enhanced vehicles however the E20 (violet bar) is higher
on average for static permeation rate for the Near Zero group The data that were used to
construct the averages in Figure 13 are listed in Table 3 below There is significant variability in
the test results and the limited sample size precludes making conclusive statements with
statistical confidence
12 CRC E-653 Fuel Permeation from Automotive Systems E0 E6 E10 E20 and E85 December 2006 13
CRC E-77 Vehicle Evaporative Emission Mechanisms A Pilot Study June 2008
Figure 13 ndash Static Permeation Rate Comparison
19
Table 3
Vehicle ID Technology 7psi E0 9 psi E0 7 psi E10 10 psi E10 9 psi E20
204
1999 Honda Enhanced 129 338 664 843 553
Accord
205
2001 Toyota Enhanced 99 195 596 416 462
Corolla
207
2001 Dodge Enhanced 401 325 644 787 882
Caravan
214
2004 Ford Enhanced 252 107 239 244 168
Escape
215
2004 Toyota Enhanced 87 85 122 104 193
Highlander
194 210 453 479 452
211
2004 Toyota Near Zero 91 101 94 199 558
Camry XLE
212
2006 Ford Near Zero 09 32 218 106 47
Taurus
50 67 156 153 303
Static Permeation Rate - mghr
CRC E-77-2 Program - Static Permeation Results
Enhanced Averages
Near Zero Averages
Summary ndash Static permeation rate increased with increase in ethanol level Three of the 5
enhanced emission vehicles did not show an increase in permeation rate when tested with the 9
psi E0 compared to the 7 psi E0
20
Dynamic (Running Loss) Permeation - In a similar presentation Figure 14 shows the average
ldquoRunning Lossrdquo permeation rate for the vehicle types and the fuels tested ldquoRunning Lossrdquo
permeation as described here is the permeation measured during a ldquocold startrdquo 48 minute drive in
a Running-Loss SHED (RL-SHED) at 86degF
0
50
100
150
200
250
300
350
400
7E0 9E0 7E10 10E10 9E20 7E0 9E0 7E10 10E10 9E20
Co
rre
cte
d R
un
nin
g L
os
s P
erm
ea
tio
n -
mg
hr
Fuel
Running Loss Permeation Rate - All FuelsE77-2 Program Vehicles
Enhanced(5 vehs)
Near Zero(2 vehs)
The dynamic permeation rates for the enhanced vehicles (left panel) followed a similar pattern as
the static permeation The average of the E20 fuel was the highest of the average values
observed on both the enhanced and the near-zero vehicles (left and right panels respectively)
Table 4 below shows the data used to generate the averages used in Figure 14
Figure 14 ndash Running Loss Permeation Comparison
21
Table 4
Vehicle ID Technology 7psi E0 9 psi E0 7 psi E10 10 psi E10 9 psi E20
204
1999 Honda Enhanced 2226 2492 2879 3164 2720
Accord
205
2001 Toyota Enhanced 671 1031 2328 1916 1697
Corolla
207
2001 Dodge Enhanced 8425 8339 8122 8581 10282
Caravan
214
2004 Ford Enhanced 363 967 1057 1331 1394
Escape
215
2005 Toyota Enhanced 797 811 979 719 1025
Highlander
2496 2728 3073 3142 3424
211
2004 Toyota Near Zero 1046 837 563 1383 4106
Camry XLE
212
2006 Ford Near Zero 1845 1158 2012 1489 1168
Taurus
1446 998 1288 1436 2637
Enhanced Averages
Near Zero Averages
CRC E-77-2 Program - Running Loss Permeation Results
Running Loss Permeation Rate - mghr
Summary ndash The dynamic permeation rate (measured during vehicle operation) was higher with
the E10 fuel compared to E0 for the enhanced vehicles The E20 permeation rate was higher
than E0 and the E10 fuel The small sample size and limited data precludes us from making
statements about statistical confidence but this may indicate a trend The near zero vehicle
average increased as the ethanol level increased Trends with volatility were mixed or
inconclusive
22
Hot Soak (ldquoTrue Hot Soakrdquo) Permeation ndash The Hot Soak emissions as defined in this report
are the net increase in permeation rate following vehicle operation We measured the mass
increase in the SHED for one hour immediately following vehicle operation and subtracted the
previously measured static (or normal) permeation at the same temperature While this is not the
traditional Code of Federal Regulations (CFR) definition we feel it is appropriate for the intent
of this project
0
10
20
30
40
50
60
70
7E0 9E0 7E10 10E10 9E20 7E0 9E0 7E10 10E10 9E20
Co
rre
cte
d H
ot
So
ak
Pe
rme
ati
on
-m
gh
r
Fuel
True Hot Soak Permeation Rate - All FuelsE77-2 Program Vehicles
Enhanced(5 vehs)
Near Zero(2 vehs)
The ldquoTrue Hot Soakrdquo performance for the average of the Enhanced Vehicles is summarized in
Figure 15 above There was a large increase in the hot soak value with the E10 fuel compared to
the E0 The hot soak value with the E20 fuel was comparable to the E0 results and lower than
the E10
The Near Zero vehicles (2) had zero hot soak emissions when tested on the 10 psi E10 fuel
(Figure 16) With only two vehicles and the very low levels attained no statistically significant
conclusions can be drawn from the data available Table 5 presents the individual tests used in
calculating the average values plotted in Figure 15
Figure 15 ndash True Hot Soak Permeation Comparison
23
Table 5
Vehicle ID Technology 7psi E0 9 psi E0 7 psi E10 10 psi E10 9 psi E20
204
1999 Honda Enhanced 187 443 297 04 134
Accord
205
2001 Toyota Enhanced 00 10 719 295 603
Corolla
207
2001 Dodge Enhanced 00 58 1222 2377 00
Caravan
214
2004 Ford Enhanced 33 521 329 574 560
Escape
215
2005 Toyota Enhanced 225 251 00 16 00
Highlander
89 257 513 653 259
211
2004 Toyota Near Zero 07 153 138 00 00
Camry XLE
212
2006 Ford Near Zero 18 04 00 00 49
Taurus
13 79 69 00 25
CRC E-77-2 Program - True Hot Soak Permeation Results
True Hot Soak Permeation Rate - mghr
Near Zero Averages
Enhanced Averages
Summary - The True Hot Soak permeation (permeation rate measured following vehicle
operation less the static constant temperature permeation rate) rate was higher with the E10 fuel
compared to E0 for the enhanced vehicles The E20 permeation rate was higher than E0 and
lower than the E10 fuel The near zero vehicle trends with both ethanol content and volatility
were mixed or inconclusive The small sample size and limited data precludes us from making
statements about statistical confidence
24
Diurnal Permeation Performance ndash Figure 16 presents the diurnal permeation results for the
first day of the three-day diurnal test (65deg to 105degF)
0
200
400
600
800
1000
1200
7E0 9E0 7E10 10E10 9E20 7E0 9E0 7E10 10E10 9E20
Co
rre
cte
d F
ue
l D
iurn
al
Pe
rme
ati
on
-m
gs
da
y
Day 1 Diurnal Permeation RatesAverages from E-77-2 Vehicles
Fuel
Enhanced(5 vehs)
Near Zero(2 vehs)
The average day 1 diurnal permeation for the five Enhanced Vehicles tended to increase as
ethanol content increased (with the exception of the E20 fuel) Again sample size and limited
data makes statistical conclusions inappropriate Table 6 presents the individual test used to
generate the averages used in Figure 16 The table includes the data from days 2 and 3 The
ethanol content of the diurnal measurements was calculated and appear in a series of figures in
the Appendix starting at page 37 Unlike Figure 16 the figures shown in the appendix have not
been corrected to exclude the non-fuel emissions (methanol and refrigerant) that were present
during these tests
Figure 16 ndash Day 1 Diurnal Permeation Comparison
25
Table 6
Vehicle ID Technology 7psi E0 9 psi E0 7 psi E10 10 psi E10 9 psi E20
204 Day 1 3672 6283 12601 15479 11034
1999 Honda Enhanced Day 2 2877 5810 11652 17799 9581
Accord Day 3 2936 5770 11653 17711 9812
205 Day 1 3830 4995 17834 17941 17752
2001 Toyota Enhanced Day 2 3654 4810 17150 17309 16900
Corolla Day 3 3670 5072 15239 17417 16802
207 Day 1 3975 4064 10865 14064 15480
2001 Dodge Enhanced Day 2 3026 3373 8120 12644 13702
Caravan Day 3 2689 3080 8236 12237 13605
214 Day 1 4943 4559 5242 4920 4709
2004 Ford Enhanced Day 2 3190 3585 3974 8394 4400
Escape Day 3 2815 11017 3944 113738 7518
215 Day 1 2483 2021 2247 3192 4168
2004 Toyota Enhanced Day 2 2941 1659 2317 2602 4148
Highlander Day 3 2888 1763 2675 2370 4506
3781 4384 9758 11119 10629
211 Day 1 2071 1303 2438 3370 2840
2004 Toyota Near Zero Day 2 1002 1158 1838 2268 2218
Camry XLE Day 3 874 1006 1843 2179 2034
212 Day 1 1016 1005 1848 1243 1310
2006 Ford Near Zero Day 2 712 708 1002 879 833
Taurus Day 3 570 574 758 1028 750
1544 1154 2143 2307 2075
CRC E-77-2 Program Results - Diurnal Permeation
Diurnal Permeation Rate - mgday
Enhanced Averages
Near Zero Averages
Carbon Canister Breakthrough ndash Canister breakthrough is measured by the weight change
recorded for the trap canister outside the SHED It quantifies the amount of vapors that
overwhelm the evaporative system storage canister Figure 17 displays the breakthrough
resulting from testing of 9 psi E0 fuel Only four of seven vehicles exhibited breakthrough
60
65
70
75
80
85
90
95
100
105
110
0
5
10
15
20
25
30
35
40
0 10 20 30 40 50 60 70
SH
ED
Te
mp
era
ture
-d
eg
F
Bre
ak
thro
ug
h -
mg
Test Time - hrs
Canister Breakthrough9 psi E0 Fuel - 65ordm to 105ordm F Diurnal
204 - 1999 Honda Accord
211 - 2004 Toyota Camry
215 - 2004 Toyota Highlander
205 - 2001 Toyota Corolla
Figure 17 ndashDiurnal Canister Breakthrough
26
Table 7 shows the breakthrough generated during the diurnal tests conducted
Table 7
Vehicle ID Technology 7psi E0 9 psi E0 7 psi E10 10 psi E10 9 psi E20
204 Day 1 --- 24 --- 310 ---
1999 Honda Enhanced Day 2 --- 136 --- 360 ---
Accord Day 3 --- 198 --- 360 ---
205 Day 1 --- --- --- 204 ---
2001 Toyota Enhanced Day 2 --- --- --- 309 ---
Corolla Day 3 --- 26 --- 293 ---
207 Day 1 --- --- --- --- ---
2001 Dodge Enhanced Day 2 --- --- --- --- ---
Caravan Day 3 --- --- --- --- ---
214 Day 1 --- --- --- --- ---
2004 Ford Enhanced Day 2 --- --- --- --- ---
Escape Day 3 --- --- --- 49 ---
215 Day 1 --- --- --- --- ---
2004 Toyota Enhanced Day 2 --- 02 --- --- ---
Highlander Day 3 --- 72 --- --- ---
211 Day 1 --- --- --- --- ---
2004 Toyota Near Zero Day 2 --- 129 --- 191 ---
Camry XLE Day 3 --- 176 --- 289 ---
212 Day 1 --- --- --- --- ---
2006 Ford Near Zero Day 2 --- --- --- --- ---
Taurus Day 3 --- --- --- 204 ---
CRC E-77-2 Program - Carbon Canister Diurnal Breakthrough Results
Diurnal Breakthrough - grams
Summary ndash The lack of canister breakthrough for the 7 psi fuels (summer grade) indicates that
the storage capacity of the seven systems tested is appropriately sized Breakthrough began to
appear when testing of 9 psi E0 fuel (not summer grade) and was more prevalent with the 10 psi
E10 fuel (winter grade) The lack of breakthrough with the 9 psi E20 fuel seems to be an
anomaly
27
Overall Trend Summary - The following chart (Figure 18) visually summarizes the trends seen
from all testing performed during this program
Higher Volatility E0 to E10 E0 to E20 E10 to E20
uarr uarr uarr uarr
Higher Volatility E0 to E10 E0 to E20 E10 to E20
uarr uarr uarr uarr
Higher Volatility E0 to E10 E0 to E20 E10 to E20
uarr uarr uarr uarr
Higher Volatility E0 to E10 E0 to E20 E10 to E20
uarr uarr uarr uarr
Higher Volatility E0 to E10 E0 to E20 E10 to E20
uarrharr uarr uarr uarr
Higher Volatility E0 to E10 E0 to E20 E10 to E20
uarr uarr uarr uarr
Higher Volatility E0 to E10 E0 to E20 E10 to E20
uarr darr darr
Higher Volatility E0 to E10 E0 to E20 E10 to E20
uarr uarr uarr harr
Ethanol Content
Diurnal
Trend Analysis for E-77-2 Program
Ethanol Content
Static Permeation
Ethanol Content
Running Loss Permeation
Ethanol Content
Ethanol Content
Diurnal
Enhanced Vehicles (Sample of 5)
Static Permeation
Ethanol Content
Ethanol Content
Running Loss Permeation
Ethanol Content
True Hot Soak (TEFVO)
Near-Zero Vehicles (Sample of 2)
True Hot Soak (TEFVO)
Figure 18 Trend Analysis Summaries
28
Vehicle 202 ndash 1996 Ford Taurus - Special Case
We have treated vehicle 202 as a special case This was the oldest of the vehicles tested and had
been subjected to limited exhaust emission tests with a 20-volume percent ethanol fuel (E20)
during the CRC E-74b test program
Vehicle 202 completed the E10 portion of the test program (10 and 7 psi fuels) successfully and
completed the road preconditioning on the E0 fuel prior to the E0 evaluations The first test on
the E0 fuel was excessively high indicating a fuel leak It was traced to a leaky fuel injector o-
ring and there was considerable discussion as to an appropriate repair Tests were made on the 9
and the 7 psi E0 fuel to measure the magnitude of a vehicle in a ldquoleakrdquo condition and the tests
were labeled as ldquo202L (Leak)rdquo The fuel injector o-rings were replaced as a complete set and
the vehicle resumed testing as ldquo202Rrsquo (Repaired) A new elusive vapor leak was present later
identified as a very small leak at the top of the fuel fill pipe
The circle on Figure 19 at the right shows
the location of the small leak This leak
was problematic as to its effect on the
emission measurements because its
magnitude or presence seemed to depend
on the torque exerted on the fuel cap The
tests on the E0 fuels (9 and 7 psi) are
noted as 202R but with a vapor leak
We attempted to fix this leak and repeated
the E10 test with the vehicle re-identified
as 216 with reasonable results We also
ran the E20 test sequence and declared the
vehicle done
The testing history for this vehicle is shown in Tables 8 (Static) 9 (Dynamic) and 10 (Diurnal)
The tests highlighted in yellow are those that exhibited a liquid or vapor leak as identified during
the static test leak validation
Figure 19 ndash Vehicle 202 Fuel Fill Pipe Leak
29
Table 8
Static Permeation Results 1996 Ford Taurus SHED
Corrected Results Canister
Fuel Permeation mgday Loss
Veh psiEtOH Test Type Date Test mghr (Corrected) g
202 100E10 Static Perm 071807 7018 345 000
Press Incr 00 No Leak
Prs+Fuel Incr 00
202 70E10 Static Perm 082107 7031 223 000
Press Incr 00 No Leak
Prs+Fuel Incr 00
202L 90E0 Static Perm 030408 7169 2292 000
Press Incr DNA
Prs+Fuel Incr 4921 Liquid Leak
202L 70E0 Static Perm 032008 7183 2991 000
Press Incr DNA
Prs+Fuel Incr 19896 Liquid Leak
202R 90E0 Static Perm 050808 7228 178 000
Press Incr 136 Vapor Leak
Prs+Fuel Incr 00
202R 70E0 Static Perm 052208 7239 204 000
Press Incr 380 Vapor Leak
Prs+Fuel Incr 00
216 100E10 Static Perm 081408 7299 324 000
Press Incr 00 No Leak
Prs+Fuel Incr 00
216 70E10 Static Perm 091708 7326 325 000
Press Incr 00 No Leak
Prs+Fuel Incr 00
216 90E20 Static Perm 103008 7363 204 000
Press Incr 00 No Leak
Prs+Fuel Incr 00
30
Table 9
Dynamic Permeation Results 1996 Ford Taurus SHED
Corrected Results Canister From
Fuel Permeation mgday Loss Static
Veh psiEtOH Test Type Date Test mghr (Corrected) g Test
202 100E10 Dynamic RL 072007 25662 1278 000 No Leak
TEFVO 386 000
202L 90E0 Dynamic RL 030508 25695 3870 000 Liquid Leak
TEFVO 00 000
202L 70E0 Dynamic RL 032408 25699 7269 000 Liquid Leak
TEFVO 00 000
202R 90E0 Dynamic RL 050908 25704 1091 000 Vapor Leak
TEFVO 50 000
202R 70E0 Dynamic RL 052308 25706 787 000 Vapor Leak
TEFVO 00 000
216 100E10 Dynamic RL 081508 25718 1742 000 No Leak
TEFVO 14 000
216 70E10 Dynamic RL 091808 25721 1683 000 No Leak
TEFVO 423 000
216 90E20 Dynamic RL 110708 25730 543 000 No Leak
TEFVO 00 000
31
Table 10
Diurnal Permeation Results 1996 Ford Taurus SHED
Corrected Results Canister From
Fuel Permeation mgday Loss Static
Veh psiEtOH Test Type Date Test mghr (Corrected) g Test
202 100E10 72 DHB 65-105 073107 7023
Day 1 10429 612 No Leak
Day 2 7069 3264
Day 3 7043 3869
202 70E10 72 DHB 65-105 082807 7034
Day 1 6278 000 No Leak
Day 2 5065 000
Day 3 4535 000
202L 90E0 72 DHB 65-105 031108 7173
Day 1 22589 000 Liquid Leak
Day 2 32310 000
Day 3 23069 1260
202L 70E0 72 DHB 65-105 040108 7196
Day 1 47425 000 Liquid Leak
Day 2 44517 000
Day 3 31798 000
202R 90E0 72 DHB 65-105 051308 7230
Day 1 3270 000 Vapor Leak
Day 2 2667 000
Day 3 2746 1083
202R 70E0 72 DHB 65-105 052808 7243
Day 1 2117 000 Vapor Leak
Day 2 2208 000
Day 3 2081 000
216 100E10 72 DHB 65-105 082008 7305
Day 1 25907 5777 No Leak
Day 2 34779 6299
Day 3 36014 6343
216 70E10 72 DHB 65-105 092308 7331
Day 1 3975 022 No Leak
Day 2 3550 006
Day 3 3621 037
216 90E20 72 DHB 65-105 111108 7373
Day 1 4685 000 No Leak
Day 2 4526 000
Day 3 4198 000
32
The Implanted Leak Test Results
Project E-77-2 included evaluating two vehicles with implanted leaks This interest followed the
information gathered in the Pilot Study where tests were run with a specially modified fuel cap
containing a 002rdquo dia hole The results with the implanted leak from the Pilot Study are
repeated in Table 11 below as the diurnal results are shown for a 1996 Chevrolet Cavalier first
without the implanted leak at 038 grams per day and then at 207 grams per day (a 54x
increase) with the leak
Table 11
Veh No
Evap
Tech Fuel
Results
gmsday
gms
Increase
6 1996 Chevrolet Cavalier Enhanced 7 psi E0 038
7 2070 2032
207 2001 Dodge Caravan Enhanced 7 psi E10 109
207L 213 104
211 2004 Toyota Camry LE Near Zero 7 psi E10 024
211L 068 044
- Implanted 020 leak in fuel cap
Vehicle Description
Implanted Leak Impact on Diurnal PermeationDay One Results 65deg - 105degF Diurnal
The two E-77-2 vehicles (207 amp 211) were given a limited evaluation with an induced leak and
saw a significantly lesser impact Vehicle 207 gave diurnal results increases from 109 to 213
grams per day (a 2x increase) and Vehicle 211 increased from 024 grams per day to 068 grams
per day (a 28x increase) The following Figure 20 displays the imbedded leak impact from Table
11
33
0
5
10
15
20
On
e D
ay
Diu
rna
l P
erm
ea
tio
n -
gm
sd
ay
Vehicle Number
Implanted Leak Impact on One Day Diurnal Permeation020 Leak in Fuel Cap - 65 to 105 F Diurnal
207L 211L21120776
As Received - No Leak
020 Fuel Cap Leak
The newer vehicles evaluated in this phase of the study were configured and certified to the
Onboard Refueling Vapor Regulations (ORVR) These are capable of containing 95 or more
control of the refueling vapors at up to 10 gallons per minute fueling rate Where the Chevrolet
Cavalier had a small (0055rdquo dia) orifice and a long vapor tube venting the tankrsquos vapor space to
the carbon canister (and then to the atmosphere) the ORVR compliant vehicles have a large
(0688rdquo ID) short vent hose to a low flow restriction carbon canister
The following bar charts (Figures 21 through 24) show the impacts of the leak on all phases of
the evaporative testing performed and compare those results with all fuels tested With only two
vehicles (207 and 211) evaluated on two fuels statistically significant effects cannot be
quantified but the trend of increased emissions is apparent
Figure 20 ndash Implanted Leak Impact
34
0
20
40
60
80
100
120
140
160
7E0 9E0 7E10 10E10 9E20 7E0 9E0 7E10 10E10 9E20
Sta
tic
Pe
rme
ati
on
-m
gh
r
Fuel
0020 dia Induced Leak EffectStatic Permeation
Vehicle 211Vehicle 207
Leak
Leak
0
200
400
600
800
1000
1200
7E0 9E0 7E10 10E10 9E20 7E0 9E0 7E10 10E10 9E20
Ru
nn
ing
Lo
ss
Pe
rme
ati
on
-m
gh
r
Fuel
0020 dia Induced Leak EffectRunning Loss Permeation
Vehicle 211Vehicle 207
Leak
Leak
Figure 21 ndash Vehicles 207 and 211 with Induced Leak - Static
Figure 22 ndash Vehicles 207 and 211with Induced Leak ndash Running Loss
35
0
100
200
300
400
500
600
700
7E0 9E0 7E10 10E10 9E20 7E0 9E0 7E10 10E10 9E20
Tru
e H
ot S
oa
k P
erm
ea
tio
n -
mg
hr
Fuel
0020 dia Induced Leak EffectTrue Hot Soak Permeation
Vehicle 211Vehicle 207
Leak
Leak
0
500
1000
1500
2000
2500
7E0 9E0 7E10 10E10 9E20 7E0 9E0 7E10 10E10 9E20
Da
y 1
Diu
rna
l P
erm
ea
tio
n -
mg
da
y
Fuel
0020 dia Induced Leak EffectDay 1 Diurnal Permeation
Vehicle 211Vehicle 207
Leak
Leak
Figure 24 ndash Vehicles 207 and 211 with Induced Leak - Diurnal
Figure 23 ndash Vehicles 207 and 211 with Induced Leak ndash True Hot Soak
36
Summary of Findings and Results
The E-77-2 test program was a continuation of the previously published E-77 test project and
added eight vehicles tested on five fuels to the knowledge base The permeation trends
previously shown were again present The small sample size and limited number of tests
preclude making statements about statistical validity but in general
o The newer vehicle groups had lower emissions
o Adding ethanol to the fuel increased permeation over the non-oxygenated levels
o Increased volatility increased permeation levels
o SHED emission rates must be corrected for the ethanol error in the FID and the
non-fuel methanol and refrigerant in the measurement
As this test program evolved and additional experience was gathered two program modifications
were made 1) The leak validation methodology was changed and 2) a different metric and
definition of the ldquoHot Soakrdquo was adopted
The leak validation portion of the static permeation test was found to be very sensitive and when
the data was corrected on a minute-by-minute basis for ethanol methanol and refrigerant the
change in apparent permeation rate was due as much to variation as to leaks See the discussion
starting at page 12 for the details of the development
Concern for and recognition of ldquoHot Soakrdquo emissions started in the original evaporative emission
regulations Carburetors had float bowls with ~ 50 ml of fuel that absorbed the latent engine heat
after the vehicle was shut down after operation The heat would cause the bowl temperature to
increase driving fuel vapors out through vents and leak paths to the atmosphere after vehicle
operation Todayrsquos fuel injection engines do not have the open bowls and the emission rates
following vehicle operation are mainly increased temperature permeation We recommended
and adopted a new name for the ldquotemporary emissions following vehicle operationrdquo (TEFVO)
which subtracts the basic permeation rate from the measured emissions See the discussion
starting at page 16 for details
37
Appendix
Acknowledgements
E-77-2 Steering Committee
David Brzezinski EPA
Kevin Cullen GM Powertrain
Dominic DiCicco Ford Motor Company
King D Eng Shell Global Solutions
Ben Hancock CARB
Constance Hart EPA
Phil Heirigs Chevron Global Downstream
Jeff Jetter Honda RampD Americas
Keith KnollNREL
John Koupal EPA
David H Lax API
Jeff Long CARB
Hector Maldonado CARB
Mani Natarajan Marathon Oil Company
David N Patterson Mitsubishi Motors RampD Americas
Jenny Sigelko Chrysler
James P UihleinChevron Global Downstream
Marie Valentine Toyota Technical Center
Kenneth J Wright ConocoPhillips
CRC Members
Brent Bailey CRC
Chris Tennant CRC
Jane Beck CRC
38
Table 12
E0 E10 E20
Inspection Units Fuel 6 Fuel 7 Fuel 4
API Gravity degAPI 602 585 570
Relative Density 6060degF 07382 07447 07508
DVPE psi 701 730 849
Oxygenates--D4815
MTBE vol 000 000 000
ETBE vol 000 000 000
EtOH vol 000 954 2034
O2 wt 000 353 747
Hydrocarbon Composition
Aromatics vol 221 244 108
Olefins vol 80 88 55
Saturates vol 700 573 234
D86 Distillation
IBP degF 974 1040 1022
5 Evaporated degF 1316 1280 1252
10 Evaporated degF 1423 1330 1314
20 Evaporated degF 1564 1410 1413
30 Evaporated degF 1704 1450 1486
40 Evaporated degF 1840 1530 1547
50 Evaporated degF 1975 1950 1596
60 Evaporated degF 2120 2190 1636
70 Evaporated degF 2305 2410 2274
80 Evaporated degF 2588 2710 2695
90 Evaporated degF 3139 3170 3139
95 Evaporated degF 3322 3300 3255
EP degF 3603 3600 3406
Recovery vol 978 978 983
Residue vol 13 10 10
Loss vol 09 12 07
Driveability Index 11199 11015 9898
Data from CRC E-74
CRC E-77-2 Fuel Inspection Results
39
Fuel Units Fuel 6 Fuel 7 Fuel 4
Sulfur Content ppm 29 27 27
Estimated CH Ratio 62090 63323 63252
Est Net Heat of Combustion btulb 18573 18514 18513
Benzene vol 090 100 096
Research Octane Number 932 940 946
Motor Octane Number 838 838 834
(R+M)2 885 889 890
Fuel Units Fuel 6 Fuel 7 Fuel 4
Aromatics vol 2386 2481 2178
Olefins vol 752 892 1074
Saturates vol 6743 5621 4623
Unclassified vol 115 086 015
Ethanol vol 000 920 2111
Benzene vol 089 106 097
CH Ratio 6200 6092 5835
Oxygen wt 0008 1 340 773
Net Heat of Combustion btulb 18703 18016 17160
1 Contains 004 vol MTBE
Fuel Units Fuel 6 Fuel 7 Fuel 4
Oxygen wt 0008 3396 7733
C+H wt 9999 9660 9227
H wt 1389 1362 1350
C wt 8610 8298 7877
Fuel Units 6 7 4
Haltermann D3338 Btulb 18573 18514 18513
Average D3338 Btulb 18579 18514 18491
Oxygen Corrected D3338 Btulb 18579 17860 17103
DHA Btulb 18703 18016 17160
Table 12 (cont)
Suppliers Additional Inspections
Net Heat of Combusion -- Btulb
Carbon Hydrogen and Oxygen
Detailed Hydrocarbon Analysis
40
Vehicle Day 1 Day 2 Day 3
No Fuel Base + Press + Pump RL True HS Perm (Brkthru) Perm (Brkthru) Perm (Brkthru)
E10 - 10 psi 345 --- --- 1278 503 10429 (63) 7069 (348) 7043 (425)
E10 - 7 psi 223 --- --- 994 113 6278 (00) 5065 (00) 4535 (00)
E0 - 9 psi 2229 --- 4921 3870 00 22580 (00) 32310 (00) 23069 (126)
E0 - 7 psi 2991 --- 19896 7269 00 47425 (00) 44517 (00) 31798 (00)
E10 - 10 psi 843 --- --- 3164 04 15479 (310) 17799 (383) 17711 (419)
E10 - 7 psi 664 --- --- 2879 297 12601 (00) 11652 (00) 11653 (00)
E0 - 9 psi 338 --- --- 2492 443 6283 (24) 5810 (136) 5770 (225)
E0 - 7 psi 129 --- --- 2226 187 3672 (00) 2877 (00) 2936 (00)
E20 - 9 psi 553 --- --- 2720 134 11034 (00) 9581 (00) 9812 (00)
E10 - 10 psi 416 --- --- 1916 295 17941 (204) 17309 (346) 17417 (375)
E10 - 7 psi 596 --- --- 2328 719 17834 (00) 17150 (00) 15239 (00)
E0 - 9 psi 195 --- --- 1031 10 4995 (00) 4810 (00) 5072 (26)
E0 - 7 psi 99 --- --- 671 00 3830 (00) 3654 (00) 3670 (00)
E20 - 9 psi 462 --- --- 1697 603 17752 (00) 16900 (00) 16802 (00)
E10 - 10 psi 787 --- --- 8581 2377 14064 (00) 12644 (00) 12237 (00)
E10 - 7 psi 644 --- --- 8122 1222 10865 (00) 8120 (00) 8236 (00)
E0 - 9 psi 325 --- --- 8339 58 4064 (00) 3373 (00) 3080 (00)
E0 - 7 psi 401 --- --- 8425 00 3975 (00) 3026 (00) 2689 (00)
E20 - 9 psi 882 --- --- 10282 00 15480 (00) 13702 (00) 13605 (00)
E10 - 10 psi 976 --- 1209 10012 3929 16449 (00) NA NA
E10 - 7 psi 1468 --- --- 11393 5850 21342 (00) NA NA
E10 - 10 psi 199 --- --- 1383 00 3370 (00) 2268 (191) 2179 (330)
E10 - 7 psi 94 266 --- 563 138 2438 (00) 1838 (00) 1843 (00)
E0 - 9 psi 101 --- --- 837 153 1303 (00) 1158 (129) 1006 (221)
E0 - 7 psi 91 --- --- 1046 07 2071 (00) 1002 (00) 874 (00)
E20 - 9 psi 558 --- --- 4106 00 2840 (00) 2218 (00) 2034 (00)
E10 - 10 psi 551 --- 821 3024 2450 25454 (040) NA NA
E10 - 7 psi 481 --- 1664 2511 62 6783 (00) NA NA
E10 - 10 psi 106 --- --- 1489 00 1243 (00) 879 (00) 1028 (200)
E10 - 7 psi 218 --- --- 2012 00 1848 (00) 1002 (00) 758 (00)
E0 - 9 psi 32 --- --- 1158 04 1005 (00) 708 (00) 574 (00)
E0 - 7 psi 09 --- --- 1845 18 1016 (00) 712 (00) 570 (00)
E20 - 9 psi 47 --- --- 1168 49 1310 (00) 833 (00) 750 (00)
E10 - 10 psi 244 --- --- 1331 574 4920 (00) 8394 (00) 113738 (49)
E10 - 7 psi 239 --- --- 1057 329 5242 (00) 3974 (00) 3944 (00)
E0 - 9 psi 107 --- --- 967 521 4559 (00) 3585 (00) 11017 (00)
E0 - 7 psi 252 --- --- 363 33 4943 (00) 3190 (00) 2815 (00)
E20 - 9 psi 168 --- --- 1394 560 4709 (00) 4400 (00) 7518 (00)
E10 - 10 psi 104 90 --- 719 16 3192 (00) 2602 (00) 2370 (00)
E10 - 7 psi 122 --- --- 979 00 2247 (00) 2317 (00) 2675 (00)
E0 - 9 psi 85 --- --- 811 251 2021 (00) 1659 (2) 1763 (72)
E0 - 7 psi 87 --- --- 797 225 2483 (00) 2941 (00) 2888 (00)
E20 - 9 psi 193 --- --- 1025 00 4168 (00) 4148 (00) 4506 (00)
E10 - 10 psi 324 --- --- 1742 118 25907 (578) 34779 (630) 36014 (643)
E10 - 7 psi 325 --- --- 1683 192 3975 (02) 3550 (01) 3621 (04)
E0 - 9 psi 178 136 --- 1091 254 3270 (00) 2667 (00) 2746 (108)
E0 - 7 psi 204 380 --- 787 00 2117 (00) 2208 (00) 2081 (00)
E20 - 9 psi 204 --- --- 543 74 4685 (00) 4526 (00) 4198 (00)
216
211
2004
Toyota
Camry
XLE
215
2004
Toyota
High-
lander
212
2006
Ford
Taurus
214
2004
Ford
Escape
211L
207L
Static Permeation - mghr Dynamic Perm - mghr
CRC E-77-2 Program Test Results
Diurnal (65ordm to 105ordm) - mgday
202
1996
Taurus
205
2001
Toyota
Corolla
204
1999
Honda
Accord
207
2001
Dodge
Caravan
202L
Table 13
41
Individual Vehicle Diurnal Performance on the Various Fuels
0
1000
2000
3000
4000
5000
6000
0 10 20 30 40 50 60 70
Cu
mu
lati
ve
Pe
rme
ati
on
-m
g
Test Time - hrs
Three Day DiurnalVehicle 204 1999 Honda Accord
10 psi E10
7 psi E10
9 psi E0
7 psi E0
9 psi E20
0
1000
2000
3000
4000
5000
6000
0 10 20 30 40 50 60 70
Cu
mu
lati
ve
Pe
rme
ati
on
-m
g
Test Time - hrs
Three Day DiurnalVehicle 205 - 2001 Toyota Corolla
10 psi E10
7 psi E10
9 psi E0
7 psi E0
9 psi E20
Figure 25 ndash Vehicle 204 Diurnal Performance
Figure 26 ndash Vehicle 205 Diurnal Performance
42
0
500
1000
1500
2000
2500
3000
3500
4000
4500
5000
0 10 20 30 40 50 60 70
Cu
mu
lati
ve
Co
rre
cte
d P
erm
ea
tio
n -
mg
Test Time - hrs
Three Day DiurnalVehicle 207 - 2001 Dodge Caravan
10 psi E10
7 psi E10
9 psi E0
7 psi E0
9 psi E20
0
100
200
300
400
500
600
700
800
900
0 10 20 30 40 50 60 70
Cu
mu
lati
ve
Pe
rme
ati
on
-m
g
Test Time - hrs
Three Day DiurnalVehicle 211 - 2004 Toyota Camry XLE
10 psi E10
7 psi E10
9 psi E0
7 psi E0
9 psi E20
Figure 27 ndash Vehicle 207 Diurnal Performance
Figure 28 ndash Vehicle 211 Diurnal Performance
43
0
50
100
150
200
250
300
350
400
450
500
0 10 20 30 40 50 60 70
Cu
mu
lati
ve
Pe
rme
ati
on
-m
g
Test Time - hrs
Three Day DiurnalVehicle 212 - 2006 Ford Taurus
10 psi E10
7 psi E10
9 psi E0
7 psi E0
9 psi E20
0
500
1000
1500
2000
2500
3000
3500
4000
4500
5000
0 10 20 30 40 50 60 70
Cu
mu
lati
ve
Pe
rme
ati
on
-m
g
Test Time - hrs
Three Day DiurnalVehicle 214 2004 Ford Escape
10 psi E10
7 psi E10
9 psi E0
7 psi E0
9 psi E20
Note The incomplete cumulative results for the 10 psi E10 results resulted from a conflict for the use
of the INNOVA analyzer during the test The INNOVA analyzer is required to correct for the FIDrsquos
ethanol error and the presence of methanol and refrigerant (R-134a) The data was available for the
50+ hour results and the data is valid as shown We have no explanation for the high levels
experienced on the third day of the test No test errors were identified
Figure 29 ndash Vehicle 212 Diurnal Performance
Figure 30 ndash Vehicle 214 Diurnal Performance
44
0
200
400
600
800
1000
1200
1400
1600
0 10 20 30 40 50 60 70
Cu
mu
lati
ve
Pe
rme
ati
on
-m
g
Test Time - hrs
Three Day DiurnalVehicle 215 2004 Toyota Highlander
10 psi E10
7 psi E10
9 psi E0
7 psi E0
9 psi E20
Figure 31 ndash Vehicle 215 Diurnal Performance
45
Table 14
Test Corrected
Vehicle Fuel Total Fuel EtOH R134a Methanol
204 10 psi E10 509899 144040 18298 16754
1999 Honda 7 psi E10 359057 130806 17551 15221
Accord 9 psi E0 178635 13843 18230 9896
7 psi E0 94846 1856 16631 2379
9 psi E20 304271 128408 18261 12143
205 10 psi E10 526659 186599 23354 20895
2001 Toyota 7 psi E10 502229 204246 25990 19198
Corolla 9 psi E0 148775 000 20434 4613
7 psi E0 111536 5489 22408 5619
9 psi E20 514540 212708 25677 19584
207 10 psi E10 389450 196248 12013 30399
2001 Dodge 7 psi E10 272201 114027 11731 19616
Caravan 9 psi E0 105167 1820 12224 15284
7 psi E0 96906 1118 22141 14276
9 psi E20 427882 241488 14268 25432
211 10 psi E10 78164 19733 15159 46970
2004 Toyota 7 psi E10 61190 20211 15929 46525
Camry LE 9 psi E0 34668 1681 14329 42659
7 psi E0 39468 000 16197 57303
9 psi E20 71013 26726 16213 36879
212 10 psi E10 31508 7222 14831 7896
2006 Ford 7 psi E10 36079 10132 15481 3400
Taurus 9 psi E0 22870 2409 15182 3761
7 psi E0 22973 000 15393 4362
9 psi E20 28935 11156 14116 2629
214 10 psi E10 1257887 000 19947 27992
2004 Ford 7 psi E10 131593 24571 16025 8879
Escape 9 psi E0 191611 2940 16487 7213
7 psi E0 109481 5386 80650 3106
9 psi E20 166271 24097 14491 6096
215 10 psi E10 81644 12178 14658 42609
2004 Toyota 7 psi E10 72399 15092 15532 36061
Highlander 9 psi E0 54431 000 14806 25822
7 psi E0 83115 000 14072 26255
9 psi E20 128223 38822 12841 34420
3 Day Diurnal Results
CRC E77-2 Program Diurnal ResultsAll values are in mg
46
0
200
400
600
800
1000
1200
1400
1600
1800
2000
Co
rrecte
d D
aily D
iurn
al
-m
g
Diurnal Ethanol PortionVehicle 204 - 1999 Honda Accord
Ethanol Portion
10 psi E10 9 psi E07 psi E10
1 32
315
341368
383
264273
1 321 321 321 32
9 psi E207 psi E0
1122097
39
0510
442
405412
Figure 32 ndash Vehicle 204 Diurnal Ethanol Portion
0
200
400
600
800
1000
1200
1400
1600
1800
2000
Co
rrecte
d D
aily D
iurn
al
-m
g
Diurnal Ethanol PortionVehicle 205 - 2001 Toyota Corolla
Ethanol Portion
10 psi E10 9 psi E07 psi E10
1 32
359
406
382
431355349
1 321 321 321 32
9 psi E207 psi E0
0 00
712649
406
420414
Figure 33 ndash Vehicle 205 Diurnal Ethanol Portion
47
0
200
400
600
800
1000
1200
1400
1600C
orr
ecte
d D
aily D
iurn
al
-m
g
Diurnal Ethanol PortionVehicle 207 - 2001 Dodge Caravan
Ethanol Portion
10 psi E10 9 psi E07 psi E10
1 32
488
442408
409
490535
1 321 321 321 32
9 psi E207 psi E0
00
1144
27
0101
556
587552
Figure 34 ndash Vehicle 207 Diurnal Ethanol Portion
0
50
100
150
200
250
300
350
400
Co
rrecte
d D
aily D
iurn
al
-m
g
Diurnal Ethanol PortionVehicle 211 - 2004 Toyota Camry XLE
Ethanol Portion
10 psi E10 9 psi E07 psi E10
1 32
264
242245
1 321 321 321 32
9 psi E207 psi E0
329
306356
00
73
64
00
00
00
325
431
370
Figure 35 ndash Vehicle 211 Diurnal Ethanol Portion
48
0
20
40
60
80
100
120
140
160
180
200C
orr
ecte
d D
aily D
iurn
al
-m
g
Diurnal Ethanol PortionVehicle 212 - 2006 Ford Taurus
Ethanol Portion
10 psi E10 9 psi E07 psi E10
1 32
216
170
316
1 321 321 321 32
9 psi E207 psi E0
194
288
436 102
105
85
00
00
00476
529
243
Figure 36 ndash Vehicle 212 Diurnal Ethanol Portion
0
200
400
600
800
1000
1200
Co
rrecte
d D
aily D
iurn
al
-m
g
Diurnal Ethanol PortionVehicle 214 - 2004 Ford Escape
Ethanol Portion
10 psi E10 9 psi E07 psi E10
1 32
00
1 321 321 321 32
9 psi E207 psi E0
201
202152
38
05
19
56
1469
103
171188
143
67
11275
Figure 37 ndash Vehicle 214 Diurnal Ethanol Portion
49
0
50
100
150
200
250
300
350
400
450
500C
orr
ecte
d D
aily D
iurn
al
-m
g
Diurnal Ethanol PortionVehicle 215 - 2004 Toyota Highlander
Ethanol Portion
10 psi E10 9 psi E07 psi E10
1 32
121
136
196
1 321 321 321 32
9 psi E207 psi E0
198
217213
0000
00
0000
00
335 292
283
Figure 38 ndash Vehicle 215 Diurnal Ethanol Portion

2
diurnal) Based on the previous experience with CRC E-65 it was thought that the four week
period was appropriate for the permeation rate to re-stabilize following the fuel change After
validation and committee approval of the data the fuel was changed to a lower volatility (7 psi)
E10 fuel allowed to re-stabilize for up to one week and then re-evaluated on the emission test
sequence The shorter stabilization period was thought appropriate to allow the system to
respond to a volatility change of a similar ethanol content fuel
Once the test results were approved the vehicle was refueled with 9 psi E0 fuel and again
subjected to a 4-week minimum re-stabilization The evaporative performance test sequence was
then repeated and repeated again with a 7 psi E0 fuel after a one week stabilization period The
final test fuel was the 9 psi E20 mixture again after a 4-week stabilization
Contract History ndash Members of the CRC Real World Vehicle Emissions and Emissions
Modeling Group together with technical representatives from EPA and the California Air
Resources Board met at EPArsquos Ann Arbor office on December 14 2006 and outlined the scope
and content of the study A follow-on to the CRC E-77 Pilot Study it included evaporative
emission performance testing of eight recent model light duty vehicles using three ethanol levels
(E0 E10 and E20) at various RVP levels The vehicles were not the same as those used in the
Pilot Study
The original contract included eight vehicles tested on four fuels (7 psi E0 9 psi E0 7 psi E10
and 10 psi E10) A later contract modification added limited testing on two vehicles with
implanted leaks added testing on 9 psi E20 Fuel and included monies to pay for retesting and
repairs of a problem vehicle
Period of Performance ndash Vehicle preconditioning was first reported in the Volume 3 Number 1
progress report dated April 22 2007 and continued through Volume 3 Number 83 dated
November 16 2008 Figure 1 depicts the actual program testing activity The colored bars
indicate both the preconditioning and the vehicle performance testing period Analysis and
comments were contained in the progress reports through November
ID Vehicle Apr May Jun Jul Aug Sep Oct Nov Dec Jan Feb Mar Apr May Jun Jul Aug Sep Oct Nov Dec
202 1996 Ford Taurus
204 1999 Honda Accord
205 2001 Toyota Corolla
207 2005 Dodge Caravan
207L Caravan with Leak
211 2004 Toyota Camry
211L Camry with Leak
212 2006 Ford Taurus
214 2004 Ford Escape
215 2004 Toyota Highlander
2007 2008
E77-2 Project Timing
Figure 1 ndash Testing Activity
3
TEST PROGRAM OVERVIEW
Vehicle Selection
The sponsors chose to evaluate eight vehicles on five fuel blends The vehicles were defined to
be one pre-enhanced evaporative system vehicle (1996 model year) five ldquoEnhanced
Evaporativerdquo system vehicles (model years 1999 to 2001) and two ldquoTier 2rdquo (Near Zero) vehicles
that were 2004 model year vehicles or later The pre-enhanced vehicle was certified to a single
dayrsquos diurnal control The enhanced control vehicles were subject to a much more severe
performance test including a three-day diurnal a high temperature hot soak and a measured
running loss test The Tier 2 vehiclesrsquo test requirements were similar to the enhanced vehicles
but at a standard of about one-fourth of the enhanced vehicles level All but the 1996 pre-
enhanced vehicle were certified to the On-Board Refueling Vapor Recovery (ORVR) emission
requirements All the vehicles were the property of CRC having been bought along with other
vehicles for CRC Project E-74b (CO vs RVP) The vehicles were originally purchased for the
E-74b project from local retail sources in the Phoenix AZ area
Each candidate vehicle was checked at the start of the test program to make sure that there were
no system leaks to verify system purge was present and to generally establish that it was safe to
operate
Vehicle Fleet
Table 1 below lists and describes the eight vehicles studied in this program A more complete
file containing the vehicle road load coefficients and dynamometer settings is included in the ldquoE-
77-2 Companion Filesxlsrdquo (Microsoft EXCELtrade) file available on the CRC website
wwwcrcaoorg
Table 1
Vehicle
Number
Model
Year Make Model
Odometer
Miles Evap Standards Evap Family
Fuel
Tank
Plastic
Metal
202 1996 Ford Taurus 86538 Pre-Enhanced TFM1115AYMEB Metal
204 1999 Honda Accord 100418 EnhancedORVR XHNXR0130AAA Metal
205 2001 Toyota Corolla 92047 EnhancedORVR 1TYXR0115AK1 Metal
207 2001 Dodge Caravan 92740 EnhancedORVR 1CRXR0165XAA Plastic
214 2004 Ford Escape 40188 EnhancedORVR 4FMXR0110BBE Plastic
215 2004 Toyota Highlander 88000 EnhancedORVR 4TYXR0165PZ1 Plastic
211 2004 Toyota Camry 42592 Near ZeroORVR 4TYXR0130A11 Plastic
212 2006 Ford Taurus 28354 Near ZeroORVR 6FMXR0185GAK Metal
E77-2 Vehicle Fleet
4
Test Fuels
The fuel comparisons selected for this project were three levels of ethanol content with volatility
varied as listed in Table 2 below
Table 2
Test Fuel Target Values
7 psi 9 psi 10 psi
E0 X X
E10 X X
E20 X
CRC had fuels remaining from Project E-74 in quantities sufficient to conduct this program eg
7 psi E0 and E10 and 9 psi E203 Inspection records of the base fuels are repeated in the
Appendix using their E-74b identifications fuels 6 7 and 4 respectively The nominal 7 psi
fuels both E0 and E10 were locally blended with commercial butane to make the higher
volatility 9 psi E0 and the 10 psi E10 The blends were done in drum batches approximately 50
gallons at a time by adding small amounts of butane circulating for a brief period then
sampling and determining the new volatility with a ldquoGrabner4rdquo instrument using test procedures
described in ASTM D 5191 The higher (10 instead of 9) volatility of the E10 fuel was specified
because many localities permit ldquosplash blendingrdquo of ethanol to gasoline and allow a 1 psi
volatility exemption for their vapor pressure limits
Adaption Period for Test Fuel Change
Many areas of the United States were required5 to use an oxygenated fuel to improve vehicle
emissions especially during the summer season While MTBE was the most common
oxygenate ethanol was also used CRC Project E-65 demonstrated that the permeation of
vehicle fuel systems increased with the use of fuels containing ethanol compared to fuels with
MTBE or no oxygenate CRC Project E-65 also demonstrated that if ethanol had been
previously used and the fuel replaced with a non-ethanol blend it could take two to four weeks
for the ethanol increase to dissipate
The protocols adopted for this test program were to require a minimum of four weeks of vehicle
exposure to a new fuel when first introducing 10 or 20 volume percent ethanol to the vehicle and
the same period of time when moving to an ethanol-free (E0) fuel Note when changing RVP
only a one week exposure has been demonstrated as sufficient
3 While the E20 target was 9 psi the average inspection value (5 labs) was 85 psi The sponsor chose to continue
the test at this level
4 wwwgrabner-instrumentscom MINIVAP VPS VPSH Vapor Pressure Tester The portable MINIVAP VPS
and VPSH vapor pressure testers are the worldwide accepted standard instruments for determination of the vapor
pressure of gasoline according to ASTM D 5191 ASTM D 6377 ASTM D 6378 and EN 13016 1+2
5 The requirement for oxygen content in RFG fuels was removed by EPA in May of 2005 as directed by the
Energy Policy Act of 2005 The Renewable Fuels Standard requiring renewable fuels (eg ethanol) in increasing
amounts over the years replaces the mandate
5
The Test Concept Measuring Leaks Permeation and Diurnal Vapor Losses
Mass emissions are measured in a VT SHED or Variable Temperature Sealed Housing for
Evaporative Determination The SHED test method
combines all three emission mechanisms (leaks
diurnal venting and permeation) into a single test
result
The SHED technique involves placing the vehicle in
a sealed enclosure (Figure 2) and calculating the
mass in the enclosure from the volume density and
concentration in the enclosure at the start and end of
a time period The difference between the mass at
the start and end of test is the emission rate eg
grams per unit time
CRCrsquos E-77 emission test programs have
developed (and strive to continually improve)
new methodologies for understanding and quantifying vehicle evaporative emission rates The
concept partitions and assigns the vehiclersquos contribution to the evaporative emission inventory
into three mechanisms
1 Permeation
2 Tank vapor venting
3 Leaks (with two subsets - Liquid and Vapor)
Permeation is the migration of HC through the various elastomers (polymers) in a vehicle fuel
system6 Previous testing has shown that permeation rate is strongly affected by the materialrsquos
temperature doubling for each 10ordmC (18ordmF) increase in the range of normal summer
temperatures It is also strongly affected by gasoline composition especially with ethanol-
containing fuels
6 ldquoFuel Permeation from Automotive Systems Final Report CRC Project E-65rdquo Haskew Liberty and McClement
September 2004 available on the CRC and California Air Resources Board websites
Figure 2 ndash Sealed Housing for Evaporative
Determination
6
Tank vapor venting emissions are controlled by fitting a carbon canister to the atmospheric tank
vent Figure 3 is a schematic of a typical early control system During a daily heating period the
temperature of the vehiclersquos fuel tank increases forcing HC vapors from the tank Excess
emissions exceeding the carbon canisterrsquos capacity are vented to the atmosphere
Figure 3 - Control System Schematic
Leaks can be liquid or vapor Permeation and tank venting losses are strongly driven by fuel
composition ambient temperature and ambient temperature change Liquid leaks are not
strongly affected by normal summer temperatures and are thought to have two components
1 Static leaks occurring while the engine is turned off and the vehicle is stationary
2 Increase in leak rate caused by the system pressure increase during engine operation
A Test Method for Separating Permeation from Tank Venting and Leaks ndash In a previous
CRC Project (E-65) the canister loss was separated from the permeation measurement by
venting the losses from the carbon canister outside
the SHED For Project E-77 the canister vent
losses were collected and measured in a separate
ldquotrap canisterrdquo on a scale outside the SHED as
shown in Figure 4 This vent line was capped off
(ie sealed during the Static Test) but connected
as shown in the figure for the Dynamic and the
Diurnal Test The ambient temperature in the
SHED was constant during the static test and
there was no vapor created at constant
temperature
Figure 4 - Trap Canister
7
This vent was closed to pressurize the system for the leak evaluations The resulting SHED
increase in HC mass was permeation7 The last mechanism that needed to be evaluated was
leaks Leaks can be both vapor and liquid A liquid leak can have significant mass currently
undetected by the vehiclersquos on-board diagnostic system Considerable thought and effort have
gone into the creation of a simple and effective liquid leak detection methodology without
success The techniques used in this project required the use of a SHED for measurements The
techniques were not simple but they proved effective
Based on experience a vehiclersquos permeation rate is expected to be between the range of 4 to 90
mghour at the 86degF test temperature The presence of a static liquid leak is expected to
overwhelm this value such a leak would (or could) be apparent by inspection Leaks from the
vehicles were quantified in a three-step test process The first step was to measure the static
permeation rate of the vehicle at 86ordmF The vehicle was allowed to stabilize overnight at 86ordmF in
the SHED and the permeation rate was calculated from the mass increase in the SHED during a
one-hour measurement period The second part of the test looking for pressure driven leaks in
the vapor system was performed by pressurizing the vehiclersquos tank to 5rdquo H2O through a special
fuel cap and tubing from outside the SHED (Figure 5) The special fuel cap the hose and the
pressurization apparatus were installed before the start of the sequence The HC concentration in
the SHED was monitored and the increase in the mass of HC in the SHED during the 30-minute
pressurization period compared to the static permeation rate If there was no (or insignificant)
rate of increase it was deduced that no vapor leak was present
The third and final part of the test was to energize the vehiclersquos fuel pump and pressurize the
system up to and including the injectors (Figure 6) If there were a pressure leak in the liquid
system an increase in the SHED mass over the 30-minute measurement period would be seen
ie the leak would be additive to the permeation rate
6 This is a simplification There are other HC sources present that are not fuel permeation These include tire paint
adhesives and vinyl emissions and the possibility of fuel leaks from the fuel injectors We believe these to be a
minor component of the emissions measured in this study
Figure 5 - Static Test ndash Tank Pressurization
8
Figure 6 ndash Static Test ndash Fuel Pump Energized
Other Tests (Dynamic Hot Soak and Diurnal) - A similar configuration is used to isolate the
tank venting losses from the permeation measurements determined by other test procedures The
vehiclersquos canister vent is connected with a low permeation hose (Teflontrade) to a bulk-head fitting
in the SHED wall and then to a separate ldquotrap canisterrdquo on a top-loading scale Any HC
emissions that escape from the vehiclersquos canister are captured in the trap canister and measured
at a 001 g (10 milligram) precision The trap canister (a 1 Liter Ford model) is purged before
each test and maintained at a ldquodryrdquo condition so that it captures all of the vehiclersquos escaping
emissions This assumption is probably violated during the high volatility tests where there are
30 grams of daily emissions but this is not a concern at this time
Test Elements for E-77-2 - The following flow chart (Figure 7) displays the various elements
utilized during the testing of the various vehicles and fuels during this program Details of each
of the four basic tests follow the flow chart
9
Drain and 40 Fill
with 10 psi E10 Test Fuel
Road Preconditioning
Four LA-4rsquos or Equivalent
Drain and 40 Fill
with 10psi E10 Test Fuel
Overnight Park at 86degF
Move to SHED
Connect Test Instrumentation
Stabilize at 86degF
Perform Constant Temperature
Permeation Series (86degF)
1 hour Permeation Rate Test
frac12 hour Tank Pressurized Test
frac12 hour Pump Energized Test
Transfer to RL SHED
Connect Test Instrumentation
Stabilize at 86degF
Perform Dynamic Permeation Test
Two LA92 Driving Cycles amp
One Hour Hot Soak
Drain and 40 Fill
With 10 psi E10 Test Fuel
Road Preconditioning
Four LA-4rsquos or Equivalent
Move to VT-SHED
Connect Test Instrumentation
Stabilize at 65degF for 6 hrs Minimum
Perform 3-Day Diurnal Evaluation
72 hr 65deg to 105degF VT Test
Drain and 40 Fill
with 7 psi E10 Test Fuel
Condition Fuel System
By Driving for One Week
Repeat Steps 1 ndash 12
On 7 psi E10 Test Fuel
Drain and Fill with 9 psi E0 Test Fuel
Condition Fuel System by 4 weeks Driving
Repeat Steps 1 ndash 12
On 9 and 7 psi E0 and
Repeat Steps 0-12
On 9 psi E20 Test Fuels
Precondition Fuel System
With 4 Weeks Driving on
10 psi E10 Test Fuel
1
2
3
4
5
6
7
8
9
10
11
12
0
Figure 7 ndash Testing Flow Chart
10
Test Procedures ndash There are four basic tests in the E-77-2 test protocol
1 Static Permeation Rate (includes checks for vapor and liquid leaks)
2 Running Emissions (Dynamic Test)
3 Hot Soak
4 Diurnal
Each is described in detail below
1 Static Permeation Rate Testing
The constant temperature (static) permeation rate is measured in a traditional SHED (Constant
temperature) in the following manner
A The fuel tank is drained and filled to 40 tank capacity with the test fuel
B The day before testing the vehicle is driven over four road trips of 75 miles each
to precondition the canister8 (These drives are similar to the LA-4)
C Upon return from the road pre-conditioning the fuel tank is drained and filled to
40 tank capacity with the test fuel9
D Vehicle is parked for 18-22 hours in a controlled temperature environment at test
temperature (86ordmF)
E The vehicle is then moved (without starting) into the test (86ordmF) SHED
F The canister vent is connected to the SHED bulkhead fitting which routes the
vapor to the trap canister outside the SHED
G The tank system pressurization hose is connected
H The fuel pump electrical connection is connected
I The SHED is sealed the inside temperature is allowed to stabilize and the test is
started Continuous THC measurements are made using a FID Ethanol
methanol and R134a concentrations are measured using an INNOVA analyzer
All measurements are made at least every minute for one hour to determine the
stabilized permeation rate
J At the end of the static test (60 minutes) the vehiclersquos vapor system is pressurized
to 5 inches of water for thirty minutes Measurements are made to quantify vapor
leaks as determined by a change in the THC in the SHED
K The fuel pump is then energized for 30 minutes while maintaining the 5 inches of
water on the vapor system Liquid leaks are quantified as determined by a change
in the concentration of THC in the SHED
The purpose of steps J and K above is to validate that the permeation rate measurement was
made without the presence of any leak ndash either liquid or vapor A detailed discussion follows
starting at page 12
8 This conditioning can be done in the laboratory on a chassis dynamometer if proper attention is paid to underbody
cooling and unrepresentative fuel tank temperatures are avoided 9 Vehicles with ORVR systems will add the refueling vapors to the canister This is OK
11
2 Running Loss Test (Dynamic Test)
A The vehicle is placed in the RL-SHED and prepared for test (The fuel level and
condition for the dynamic test is the fuel remaining after completion of the static test ndash
40 fresh fill of the appropriate test fuel)
B Outside air source for the engine is connected
C Vehicle exhaust is connected
D Fuel tank thermocouple is connected
E Canister vent is connected to the SHED bulkhead fitting which routes the vapor to the
trap canister outside the SHED
F Vehicle is allowed to stabilize in the RL-SHED at test temperature (86degF) for a minimum
of 12 hours ndash preferably overnight
G Two cycles of the Unified Cycle (LA-92) driving schedule (48 mins) are driven while
measuring the mass emissions in the SHED Vehicle is allowed to idle (in drive) for 30
seconds between the two cycles Ambient air temperature is maintained (to the extent
possible) at 86degF Fuel tank surface temperature is monitored during vehicle operation It
should increase during the drive from 10 to 18degF to simulate expected on-road
temperature increase Measured mass emissions are corrected using the INNOVA data
for the ethanol methanol and refrigerant emissions
3 Hot Soak10
This procedure is executed immediately following the Running Loss Test procedure
described above
A Engine is turned off transmission selector is placed in park and driver exits the
enclosure using the double door air lock taking care to minimize any air exchange
between the laboratory and the SHED This starts the one hour ldquohot soakrdquo period
B Measurements of mass emissions in the SHED are continued for another 60 minutes
(until time = 108 minutes) correcting for the ethanol methanol and refrigerant mass
using the INNOVA instrument data This ends the hot soak Hot soak emissions are
calculated as the net difference for the one hour hot soak (CorrMass108 ndash CorrMass48
minus the 86degF static hourly rate all mass rates in mghour)
4 Diurnal Test
A The fuel tank is drained and filled to 40 tank capacity with the test fuel
B The day before testing the vehicle is driven over four road trips of 75 miles each to
precondition the vehicle and the canister
C Upon return from the road pre-conditioning the fuel tank is drained and filled to 40
tank capacity with the test fuel
D The vehicle is parked for 18-22 hours in a controlled temperature environment at the
initial diurnal test temperature (65ordmF)
E The SHED is sealed allowed to stabilize at the 65degF temperature and the 3-day
California Diurnal Test is started
10 We define the ldquohot soakrdquo to be the temporary increase in emission rate caused by the immediately preceding
operation of the vehicle It is the increase in the SHED mass (corrected for EtOH MeOH and R-134a) over the
one hour period minus the previously established ldquostaticrdquo permeation rate
12
F ldquoContinuousrdquo (every 30 seconds) THC measurements are made using a FID Ethanol
methanol and R134a (refrigerant) concentrations are measured using an INNOVA
analyzer at least every 10 minutes for the duration of the test (72 hours)
Static Permeation Test ndash Leak Validation
If a leak is detected during either the vapor system pressure portion (Step J) or the pump
energized portion (Step K) of the Static Permeation Test procedure it calls into question whether
the permeation rate measurement accurately reflects fuel system permeation or if instead a
combination of permeation and the implied leak was measured If a leak is confirmed the
permeation rate measurement is called into question and an investigation possible remedy and
retest is indicated
The permeation rate measurement must be corrected for the FIDrsquos ethanol misrepresentation and
the presence of non-fuel hydrocarbons (methanol and refrigerant) The leak check however is
made using the change in mass increase in the SHED using the uncorrected FID mass calculation
as the determinate It was found that the corrections for ethanol methanol and refrigerant were
introducing ldquonoiserdquo into the trace and that these were being misinterpreted as leaks
y = 062x - 19
y = 047x + 67
y = 055x - 01
0
10
20
30
40
50
60
70
80
90
100
0 20 40 60 80 100 120
SH
ED
Mas
s -
mg
Test Time - minutes
Leak TestVehicle 204 - 1999 Honda Accord - 9 psi E0
Test 7028
Pump ActivatedTank Pressurized
Figure 8 above represents the calculations made during the inspection of data from a successful
test EXCELrsquostrade ldquoSLOPErdquo function is used to calculate the linear regression values based on
the FID calculation for mass for Time 0 to 60 minutes Time 64 to 90 minutes and Time 94 to
120 minutes A 4-minute gap was included between each sequence to establish the new mass
emission rate during the ldquopressure onrdquo (T60 to T90) and the ldquopump energizedrdquo periods
The slope of 047 for the ldquoTank Pressurizedrdquo period in the example above is compared to the
slope of 062 calculated for the permeation rate (or hot soak) period Since the ldquoTank
Figure 8 ndash Leak Test
13
Pressurizedrdquo slope is not more than 10 higher than the hot soak permeation rate we assume
that there is no leak present A similar comparison is made for the slope determined during the
ldquopump onrdquo period The choice of a 10 allowance is arbitrary and is used here to allow for
normal and unavoidable test variation
For tests in which the above procedure determines that no leak is present a value of zero is
reported in the test summary for the leak results If a positive value is reported it calls that test
into question and an investigation possible repair and retest is indicated
Static Permeation Rate Determination
The static permeation rate is determined based on a linear regression through the individual
SHED mass data points (data measured each 30 seconds) of the corrected fuel results (corrected
for the FID error and subtracting the methanol and refrigerant) from the first 60 minutes of
testing as illustrated in Figure 9 below
y = 05636x + 0505
0
5
10
15
20
25
30
35
40
45
0 10 20 30 40 50 60
Pe
rme
ati
on
-m
gs
Test Time - mins
Static Permeation DeterminationVehicle 204 - 1999 Honda Accord - 9 psi E0 Fuel
Raw SHED
Corrected Fuel
Permeation Rate Based on Corrected Results
Permeation Rate = 5636 x Time = 338 mgshr
In this example the static permeation rate is 338 mghr
Dynamic (Running Loss) and Hot Soak Test
The preceding section addressed the concepts of separating the permeation emissions from the
tank venting emissions and establishing the presence or absence of leaks The second part of
this study includes a dynamic test to measure the permeation and tank venting emissions during
Figure 9 ndash Static Permeation Determination
14
vehicle operation (ldquorunning lossesrdquo) and the temporary condition following vehicle operation
known as the ldquohot soakrdquo
This is considered a ldquodynamicrdquo test because the vehicle is driven and the fuel and vapor system
temperatures rise during the test The ambient temperature in the Running Loss SHED during
the test was held constant at 86degF while the vehiclersquos fuel system temperature rose during the
test Two 1435 second (239-minute) LA-92 driving cycles were performed consecutively during
the running loss measurements with a 30-second idle in-between During this test tank fuel
temperature was expected to rise by an average approximately 18degF above the initial ambient
temperature The running loss air handling system included a proportional speed under-car
blower operated as a slave to dynamometer speed This apparatus was used during running loss
testing with minor tuning for specific vehicles Without additional input it is capable of
reasonable fuel tank temperature control Each vehicle was fitted with a surface-mount
thermocouple at the front of the fuel tank located at approximately the 18th
fill level to measure
the fuel liquid temperature No attempt was made to follow a predefined fuel tank temperature
profile (FTTP) in this program Fuel temperatures were recorded and results are available in the
real-time records
Vehicle running loss emissions are measured in a special version of a SHED known as a
Running Loss SHED (RL-SHED) shown in Figure 10 Special features of the RL-SHED
include a sealed chassis dynamometer for simulating vehicle driving loads a sealed outside air
supply for engine intake a sealed exhaust conduit for engine exhaust and an under-chassis fan
for simulating underbody air flow as described above A vehicle is operated inside the RL-SHED
over a chosen driving cycle The increase in HC emissions inside the enclosure are measured
and calculated as mass emissions per 40 CFR sect86163-96
Figure 10 - Running Loss SHED
15
Vehicle testing in an RL-SHED is complicated by several factors including
1 Engine must be supplied with external induction air
2 Exhaust must be conducted externally without any leaks
3 Load supplied to the vehicle through the chassis dynamometer must not create or
allow external leaks
4 Internal SHED temperature must be maintained while sizable heat is rejected to the
ambient by the running engine and exhaust
5 Cooling air supplied to the radiator must be modulated to represent the vehiclersquos road
speed
6 Underbody (and especially the fuel system) temperature should represent the rate of
rise experienced by a real road-drive
Canister vent losses were isolated from permeation emissions using the technique previously
described The vehiclersquos carbon canister fresh air vent was connected to the outside of the RL-
SHED using a leak-tight PTFEreg
hose (38rdquo OD commercial tubing US Plastics 58055 PTFE or
equivalent) connected to a small carbon ldquotraprdquo canister located on a top-loading precision scale
The scale precision was 001 grams (10 milligrams) and it was purged prior to each test There
were no tank venting emissions measured on any of the running loss test measurements All of
the vehicles appeared to be actively ldquopurgingrdquo their respective control canisters and drawing
fresh air during the test If there were any emissions from the vehiclersquos control canister as might
have occurred if there were no vehicle purge or if very high volatility fuels with excessive vapor
generation were used they would have been measured
The Running Loss Driving Cycle consisted of two cycles of the ldquoUnified Driving Cyclerdquo
otherwise known as the LA-92 A velocity versus time plot for one cycle is shown in Figure 11
The LA-92 cycle takes 24 minutes to complete and covers 98 miles with many speed changes
Two back-to-back cycles were driven the first as a ldquocold startrdquo and the second following a 30-
second vehicle idle The ldquocold startrdquo condition was created by soaking the vehicle for a
Figure 11 ndash Running Loss Driving Cycle
Unified Cycle (LA-92)
0
10
20
30
40
50
60
70
80
0 5 10 15 20 25Test Time - minutes
Spe
ed -
mph
Cycle Time (min) 239
Maximum Speed (mph) 672
Average Speed (mph) 246
Average Non-Zero Speed (mph) 294
Time Zero Speed () 162
Distance (miles) 982
16
minimum of 18 hours at 86degF moving it to the stabilized 86degF RL-SHED making the test
connections and then waiting a minimum of one hour before the initial start and run
The SHED emissions were measured during 48 minutes of engine operation and then
continuously for one hour after the engine was turned off This one hour engine-off duration
was the ldquohot soakrdquo period The total test time is 1 hour and 48 minutes
Figure 12 shows results from the 9 psi E0 fuel test on Vehicle 204 The horizontal axis is test
time in minutes and the vertical axis is the HC mass measured in the RL-SHED during the test
period
The engine was shut off at the end of the second LA92 drive cycle (~48 minutes) and the
analysis system continued to measure the HC emissions in the SHED for the next 60 minutes
This represented the ldquohot soakrdquo portion of the test
0
50
100
150
200
250
300
0 20 40 60 80 100 120
Co
rre
cte
d T
ota
l F
ue
l C
um
ula
tiv
e P
erm
ea
tio
n -
mg
Test Time - minutes
Running Loss and Hot SoakVehicle 204 - 1999 Honda Accord - 9 psi E0 Fuel
Test 25668
Running Loss Hot Soak
Running Loss Std =005 gmiThis Test = 0010 gmi
RL = 249 mghr
2774
2332
Tru HS = 442
1990
The ldquoTruerdquo Hot Soak
The traditional hot soak is determined from the increase in SHED emissions as measured for one
hour following a prescribed drive to heat up the vehicle (2 LA-92 cycles during the Running
Loss Test) Hot soak emissions however have two components that caused by the elevated
temperature resulting from the drive and that resulting from one hour of static permeation
Figure 12 ndash Running Loss Test Results
17
To separate these two components and determine the ldquotruerdquo hot soak emissions the following
procedure was used ldquoTraditionalrdquo hot soak emissions were first calculated by subtracting the
ldquostart of hot soakrdquo cumulative SHED hydrocarbon value (ie 199 mg t = 48 minutes) from
the final cumulative SHED hydrocarbon value (ie 2774 mg t = 108 min) This resulted in a
cumulative SHED hydrocarbon value of 78 mg for the 1 hour hot soak The previously
determined static permeation value (ie 338 mg for a 1 hour hot soak test- see Figure 9) was
then subtracted to arrive at the ldquotruerdquo hot soak value of 442 mg The increase in the permeation
rate (the ldquohot soak effectrdquo) caused by the increase in the system temperature is accounted for by
subtracting the ldquostabilized permeation raterdquo at 86degF
In Figure 12 the static permeation rate is superimposed as a solid blue line on the plot from the
starting point of the hot soak until its end (one hour) While the ldquotraditionalrdquo hot soak would be
calculated as 78 mg (277 mg ndash 199 mg) the ldquotruerdquo hot soak is determined as 442 mg (2774 mg
ndash 2332 mg) True hot soak values reported here were determined in this manner
Diurnal Test
Diurnal permeation was determined by subjecting the vehicle to a three-day period in a
temperature controlled SHED while continuously recording the total hydrocarbon every 30
seconds The SHED environmental temperature was varied from 65degF to 105degF per the
California Diurnal Test protocol Canister vent losses were isolated from permeation emissions
using the technique previously described The vehiclersquos carbon canister fresh air vent was
connected to the outside of the RL-SHED using a leak-tight PTFEreg
hose connected to a small
carbon ldquotraprdquo canister located on a top-loading precision scale The scale precision was 001
grams (10 milligrams) and it was purged before each test
DISCUSSION OF TEST RESULTS
Results
Emission results are presented below by ldquomechanism11
rdquo with the data averaged for the five
ldquoenhancedrdquo and the two ldquonear zerordquo vehicles The lone ldquopre-enhancedrdquo vehicle the 1996 Ford
Taurus (202) was a special case and will be discussed in a separate section Two of the vehicles
the 2001 Dodge Caravan (207) and the 2004 Toyota Camry (211) were also subjected to limited
testing with an ldquoimplanted leakrdquo (a 0020rdquo dia hole in a special tank gas cap) to investigate the
magnitude of a known leak These results (ldquoLeakersrdquo) follow the discussion on the Taurus
Static Permeation Rate (Constant Temperature (86degF)) - Average permeation rate compared
by fuel specification for two vehicle groups ldquoenhancedrdquo and the ldquonear zerordquo evaporative
emissions
11 The ldquomechanismsrdquo are 1 Permeation 2 Tank Venting (Daily Temperature Rise) and 3 Leaks
18
0
10
20
30
40
50
60
Co
rrecte
d P
erm
eati
on
Rate
-m
gh
r
Fuel
Static Permeation Rate - All FuelsE77-2 Program Vehicles
7 E0 9 E2010 E107 E109 E0 7 E0 9 E2010 E107 E109 E0
Enhanced(5 veh)
Near Zero(2 veh)
Figure 13 presents the static permeation rate performance for the average of the 5 ldquoenhancedrdquo
and 2 ldquonear zerordquo vehicles on the five fuels included in the test program Each group is ordered
from left to right by ethanol level The vertical scale is the average permeation rate in mghour
for the static (86degF constant temperature) test
Previous studies1213
had shown that vehicles operated on the fuel containing 10 vol- ethanol
would have higher permeation rates compared to those resulting from operation on a non-ethanol
(E0) fuel of similar properties We also expected that vehicles using higher vapor pressure fuel
would exhibit increased permeation levels at similar ethanol levels Other studies had reported
mixed results when comparing E20 permeation rates against E10 measurements ndash some were
higher and some were lower The difference may have been within the repeatability of the
measurements and probably suffered from a limited number of observations These mixed
results are present in this testing of the enhanced vehicles however the E20 (violet bar) is higher
on average for static permeation rate for the Near Zero group The data that were used to
construct the averages in Figure 13 are listed in Table 3 below There is significant variability in
the test results and the limited sample size precludes making conclusive statements with
statistical confidence
12 CRC E-653 Fuel Permeation from Automotive Systems E0 E6 E10 E20 and E85 December 2006 13
CRC E-77 Vehicle Evaporative Emission Mechanisms A Pilot Study June 2008
Figure 13 ndash Static Permeation Rate Comparison
19
Table 3
Vehicle ID Technology 7psi E0 9 psi E0 7 psi E10 10 psi E10 9 psi E20
204
1999 Honda Enhanced 129 338 664 843 553
Accord
205
2001 Toyota Enhanced 99 195 596 416 462
Corolla
207
2001 Dodge Enhanced 401 325 644 787 882
Caravan
214
2004 Ford Enhanced 252 107 239 244 168
Escape
215
2004 Toyota Enhanced 87 85 122 104 193
Highlander
194 210 453 479 452
211
2004 Toyota Near Zero 91 101 94 199 558
Camry XLE
212
2006 Ford Near Zero 09 32 218 106 47
Taurus
50 67 156 153 303
Static Permeation Rate - mghr
CRC E-77-2 Program - Static Permeation Results
Enhanced Averages
Near Zero Averages
Summary ndash Static permeation rate increased with increase in ethanol level Three of the 5
enhanced emission vehicles did not show an increase in permeation rate when tested with the 9
psi E0 compared to the 7 psi E0
20
Dynamic (Running Loss) Permeation - In a similar presentation Figure 14 shows the average
ldquoRunning Lossrdquo permeation rate for the vehicle types and the fuels tested ldquoRunning Lossrdquo
permeation as described here is the permeation measured during a ldquocold startrdquo 48 minute drive in
a Running-Loss SHED (RL-SHED) at 86degF
0
50
100
150
200
250
300
350
400
7E0 9E0 7E10 10E10 9E20 7E0 9E0 7E10 10E10 9E20
Co
rre
cte
d R
un
nin
g L
os
s P
erm
ea
tio
n -
mg
hr
Fuel
Running Loss Permeation Rate - All FuelsE77-2 Program Vehicles
Enhanced(5 vehs)
Near Zero(2 vehs)
The dynamic permeation rates for the enhanced vehicles (left panel) followed a similar pattern as
the static permeation The average of the E20 fuel was the highest of the average values
observed on both the enhanced and the near-zero vehicles (left and right panels respectively)
Table 4 below shows the data used to generate the averages used in Figure 14
Figure 14 ndash Running Loss Permeation Comparison
21
Table 4
Vehicle ID Technology 7psi E0 9 psi E0 7 psi E10 10 psi E10 9 psi E20
204
1999 Honda Enhanced 2226 2492 2879 3164 2720
Accord
205
2001 Toyota Enhanced 671 1031 2328 1916 1697
Corolla
207
2001 Dodge Enhanced 8425 8339 8122 8581 10282
Caravan
214
2004 Ford Enhanced 363 967 1057 1331 1394
Escape
215
2005 Toyota Enhanced 797 811 979 719 1025
Highlander
2496 2728 3073 3142 3424
211
2004 Toyota Near Zero 1046 837 563 1383 4106
Camry XLE
212
2006 Ford Near Zero 1845 1158 2012 1489 1168
Taurus
1446 998 1288 1436 2637
Enhanced Averages
Near Zero Averages
CRC E-77-2 Program - Running Loss Permeation Results
Running Loss Permeation Rate - mghr
Summary ndash The dynamic permeation rate (measured during vehicle operation) was higher with
the E10 fuel compared to E0 for the enhanced vehicles The E20 permeation rate was higher
than E0 and the E10 fuel The small sample size and limited data precludes us from making
statements about statistical confidence but this may indicate a trend The near zero vehicle
average increased as the ethanol level increased Trends with volatility were mixed or
inconclusive
22
Hot Soak (ldquoTrue Hot Soakrdquo) Permeation ndash The Hot Soak emissions as defined in this report
are the net increase in permeation rate following vehicle operation We measured the mass
increase in the SHED for one hour immediately following vehicle operation and subtracted the
previously measured static (or normal) permeation at the same temperature While this is not the
traditional Code of Federal Regulations (CFR) definition we feel it is appropriate for the intent
of this project
0
10
20
30
40
50
60
70
7E0 9E0 7E10 10E10 9E20 7E0 9E0 7E10 10E10 9E20
Co
rre
cte
d H
ot
So
ak
Pe
rme
ati
on
-m
gh
r
Fuel
True Hot Soak Permeation Rate - All FuelsE77-2 Program Vehicles
Enhanced(5 vehs)
Near Zero(2 vehs)
The ldquoTrue Hot Soakrdquo performance for the average of the Enhanced Vehicles is summarized in
Figure 15 above There was a large increase in the hot soak value with the E10 fuel compared to
the E0 The hot soak value with the E20 fuel was comparable to the E0 results and lower than
the E10
The Near Zero vehicles (2) had zero hot soak emissions when tested on the 10 psi E10 fuel
(Figure 16) With only two vehicles and the very low levels attained no statistically significant
conclusions can be drawn from the data available Table 5 presents the individual tests used in
calculating the average values plotted in Figure 15
Figure 15 ndash True Hot Soak Permeation Comparison
23
Table 5
Vehicle ID Technology 7psi E0 9 psi E0 7 psi E10 10 psi E10 9 psi E20
204
1999 Honda Enhanced 187 443 297 04 134
Accord
205
2001 Toyota Enhanced 00 10 719 295 603
Corolla
207
2001 Dodge Enhanced 00 58 1222 2377 00
Caravan
214
2004 Ford Enhanced 33 521 329 574 560
Escape
215
2005 Toyota Enhanced 225 251 00 16 00
Highlander
89 257 513 653 259
211
2004 Toyota Near Zero 07 153 138 00 00
Camry XLE
212
2006 Ford Near Zero 18 04 00 00 49
Taurus
13 79 69 00 25
CRC E-77-2 Program - True Hot Soak Permeation Results
True Hot Soak Permeation Rate - mghr
Near Zero Averages
Enhanced Averages
Summary - The True Hot Soak permeation (permeation rate measured following vehicle
operation less the static constant temperature permeation rate) rate was higher with the E10 fuel
compared to E0 for the enhanced vehicles The E20 permeation rate was higher than E0 and
lower than the E10 fuel The near zero vehicle trends with both ethanol content and volatility
were mixed or inconclusive The small sample size and limited data precludes us from making
statements about statistical confidence
24
Diurnal Permeation Performance ndash Figure 16 presents the diurnal permeation results for the
first day of the three-day diurnal test (65deg to 105degF)
0
200
400
600
800
1000
1200
7E0 9E0 7E10 10E10 9E20 7E0 9E0 7E10 10E10 9E20
Co
rre
cte
d F
ue
l D
iurn
al
Pe
rme
ati
on
-m
gs
da
y
Day 1 Diurnal Permeation RatesAverages from E-77-2 Vehicles
Fuel
Enhanced(5 vehs)
Near Zero(2 vehs)
The average day 1 diurnal permeation for the five Enhanced Vehicles tended to increase as
ethanol content increased (with the exception of the E20 fuel) Again sample size and limited
data makes statistical conclusions inappropriate Table 6 presents the individual test used to
generate the averages used in Figure 16 The table includes the data from days 2 and 3 The
ethanol content of the diurnal measurements was calculated and appear in a series of figures in
the Appendix starting at page 37 Unlike Figure 16 the figures shown in the appendix have not
been corrected to exclude the non-fuel emissions (methanol and refrigerant) that were present
during these tests
Figure 16 ndash Day 1 Diurnal Permeation Comparison
25
Table 6
Vehicle ID Technology 7psi E0 9 psi E0 7 psi E10 10 psi E10 9 psi E20
204 Day 1 3672 6283 12601 15479 11034
1999 Honda Enhanced Day 2 2877 5810 11652 17799 9581
Accord Day 3 2936 5770 11653 17711 9812
205 Day 1 3830 4995 17834 17941 17752
2001 Toyota Enhanced Day 2 3654 4810 17150 17309 16900
Corolla Day 3 3670 5072 15239 17417 16802
207 Day 1 3975 4064 10865 14064 15480
2001 Dodge Enhanced Day 2 3026 3373 8120 12644 13702
Caravan Day 3 2689 3080 8236 12237 13605
214 Day 1 4943 4559 5242 4920 4709
2004 Ford Enhanced Day 2 3190 3585 3974 8394 4400
Escape Day 3 2815 11017 3944 113738 7518
215 Day 1 2483 2021 2247 3192 4168
2004 Toyota Enhanced Day 2 2941 1659 2317 2602 4148
Highlander Day 3 2888 1763 2675 2370 4506
3781 4384 9758 11119 10629
211 Day 1 2071 1303 2438 3370 2840
2004 Toyota Near Zero Day 2 1002 1158 1838 2268 2218
Camry XLE Day 3 874 1006 1843 2179 2034
212 Day 1 1016 1005 1848 1243 1310
2006 Ford Near Zero Day 2 712 708 1002 879 833
Taurus Day 3 570 574 758 1028 750
1544 1154 2143 2307 2075
CRC E-77-2 Program Results - Diurnal Permeation
Diurnal Permeation Rate - mgday
Enhanced Averages
Near Zero Averages
Carbon Canister Breakthrough ndash Canister breakthrough is measured by the weight change
recorded for the trap canister outside the SHED It quantifies the amount of vapors that
overwhelm the evaporative system storage canister Figure 17 displays the breakthrough
resulting from testing of 9 psi E0 fuel Only four of seven vehicles exhibited breakthrough
60
65
70
75
80
85
90
95
100
105
110
0
5
10
15
20
25
30
35
40
0 10 20 30 40 50 60 70
SH
ED
Te
mp
era
ture
-d
eg
F
Bre
ak
thro
ug
h -
mg
Test Time - hrs
Canister Breakthrough9 psi E0 Fuel - 65ordm to 105ordm F Diurnal
204 - 1999 Honda Accord
211 - 2004 Toyota Camry
215 - 2004 Toyota Highlander
205 - 2001 Toyota Corolla
Figure 17 ndashDiurnal Canister Breakthrough
26
Table 7 shows the breakthrough generated during the diurnal tests conducted
Table 7
Vehicle ID Technology 7psi E0 9 psi E0 7 psi E10 10 psi E10 9 psi E20
204 Day 1 --- 24 --- 310 ---
1999 Honda Enhanced Day 2 --- 136 --- 360 ---
Accord Day 3 --- 198 --- 360 ---
205 Day 1 --- --- --- 204 ---
2001 Toyota Enhanced Day 2 --- --- --- 309 ---
Corolla Day 3 --- 26 --- 293 ---
207 Day 1 --- --- --- --- ---
2001 Dodge Enhanced Day 2 --- --- --- --- ---
Caravan Day 3 --- --- --- --- ---
214 Day 1 --- --- --- --- ---
2004 Ford Enhanced Day 2 --- --- --- --- ---
Escape Day 3 --- --- --- 49 ---
215 Day 1 --- --- --- --- ---
2004 Toyota Enhanced Day 2 --- 02 --- --- ---
Highlander Day 3 --- 72 --- --- ---
211 Day 1 --- --- --- --- ---
2004 Toyota Near Zero Day 2 --- 129 --- 191 ---
Camry XLE Day 3 --- 176 --- 289 ---
212 Day 1 --- --- --- --- ---
2006 Ford Near Zero Day 2 --- --- --- --- ---
Taurus Day 3 --- --- --- 204 ---
CRC E-77-2 Program - Carbon Canister Diurnal Breakthrough Results
Diurnal Breakthrough - grams
Summary ndash The lack of canister breakthrough for the 7 psi fuels (summer grade) indicates that
the storage capacity of the seven systems tested is appropriately sized Breakthrough began to
appear when testing of 9 psi E0 fuel (not summer grade) and was more prevalent with the 10 psi
E10 fuel (winter grade) The lack of breakthrough with the 9 psi E20 fuel seems to be an
anomaly
27
Overall Trend Summary - The following chart (Figure 18) visually summarizes the trends seen
from all testing performed during this program
Higher Volatility E0 to E10 E0 to E20 E10 to E20
uarr uarr uarr uarr
Higher Volatility E0 to E10 E0 to E20 E10 to E20
uarr uarr uarr uarr
Higher Volatility E0 to E10 E0 to E20 E10 to E20
uarr uarr uarr uarr
Higher Volatility E0 to E10 E0 to E20 E10 to E20
uarr uarr uarr uarr
Higher Volatility E0 to E10 E0 to E20 E10 to E20
uarrharr uarr uarr uarr
Higher Volatility E0 to E10 E0 to E20 E10 to E20
uarr uarr uarr uarr
Higher Volatility E0 to E10 E0 to E20 E10 to E20
uarr darr darr
Higher Volatility E0 to E10 E0 to E20 E10 to E20
uarr uarr uarr harr
Ethanol Content
Diurnal
Trend Analysis for E-77-2 Program
Ethanol Content
Static Permeation
Ethanol Content
Running Loss Permeation
Ethanol Content
Ethanol Content
Diurnal
Enhanced Vehicles (Sample of 5)
Static Permeation
Ethanol Content
Ethanol Content
Running Loss Permeation
Ethanol Content
True Hot Soak (TEFVO)
Near-Zero Vehicles (Sample of 2)
True Hot Soak (TEFVO)
Figure 18 Trend Analysis Summaries
28
Vehicle 202 ndash 1996 Ford Taurus - Special Case
We have treated vehicle 202 as a special case This was the oldest of the vehicles tested and had
been subjected to limited exhaust emission tests with a 20-volume percent ethanol fuel (E20)
during the CRC E-74b test program
Vehicle 202 completed the E10 portion of the test program (10 and 7 psi fuels) successfully and
completed the road preconditioning on the E0 fuel prior to the E0 evaluations The first test on
the E0 fuel was excessively high indicating a fuel leak It was traced to a leaky fuel injector o-
ring and there was considerable discussion as to an appropriate repair Tests were made on the 9
and the 7 psi E0 fuel to measure the magnitude of a vehicle in a ldquoleakrdquo condition and the tests
were labeled as ldquo202L (Leak)rdquo The fuel injector o-rings were replaced as a complete set and
the vehicle resumed testing as ldquo202Rrsquo (Repaired) A new elusive vapor leak was present later
identified as a very small leak at the top of the fuel fill pipe
The circle on Figure 19 at the right shows
the location of the small leak This leak
was problematic as to its effect on the
emission measurements because its
magnitude or presence seemed to depend
on the torque exerted on the fuel cap The
tests on the E0 fuels (9 and 7 psi) are
noted as 202R but with a vapor leak
We attempted to fix this leak and repeated
the E10 test with the vehicle re-identified
as 216 with reasonable results We also
ran the E20 test sequence and declared the
vehicle done
The testing history for this vehicle is shown in Tables 8 (Static) 9 (Dynamic) and 10 (Diurnal)
The tests highlighted in yellow are those that exhibited a liquid or vapor leak as identified during
the static test leak validation
Figure 19 ndash Vehicle 202 Fuel Fill Pipe Leak
29
Table 8
Static Permeation Results 1996 Ford Taurus SHED
Corrected Results Canister
Fuel Permeation mgday Loss
Veh psiEtOH Test Type Date Test mghr (Corrected) g
202 100E10 Static Perm 071807 7018 345 000
Press Incr 00 No Leak
Prs+Fuel Incr 00
202 70E10 Static Perm 082107 7031 223 000
Press Incr 00 No Leak
Prs+Fuel Incr 00
202L 90E0 Static Perm 030408 7169 2292 000
Press Incr DNA
Prs+Fuel Incr 4921 Liquid Leak
202L 70E0 Static Perm 032008 7183 2991 000
Press Incr DNA
Prs+Fuel Incr 19896 Liquid Leak
202R 90E0 Static Perm 050808 7228 178 000
Press Incr 136 Vapor Leak
Prs+Fuel Incr 00
202R 70E0 Static Perm 052208 7239 204 000
Press Incr 380 Vapor Leak
Prs+Fuel Incr 00
216 100E10 Static Perm 081408 7299 324 000
Press Incr 00 No Leak
Prs+Fuel Incr 00
216 70E10 Static Perm 091708 7326 325 000
Press Incr 00 No Leak
Prs+Fuel Incr 00
216 90E20 Static Perm 103008 7363 204 000
Press Incr 00 No Leak
Prs+Fuel Incr 00
30
Table 9
Dynamic Permeation Results 1996 Ford Taurus SHED
Corrected Results Canister From
Fuel Permeation mgday Loss Static
Veh psiEtOH Test Type Date Test mghr (Corrected) g Test
202 100E10 Dynamic RL 072007 25662 1278 000 No Leak
TEFVO 386 000
202L 90E0 Dynamic RL 030508 25695 3870 000 Liquid Leak
TEFVO 00 000
202L 70E0 Dynamic RL 032408 25699 7269 000 Liquid Leak
TEFVO 00 000
202R 90E0 Dynamic RL 050908 25704 1091 000 Vapor Leak
TEFVO 50 000
202R 70E0 Dynamic RL 052308 25706 787 000 Vapor Leak
TEFVO 00 000
216 100E10 Dynamic RL 081508 25718 1742 000 No Leak
TEFVO 14 000
216 70E10 Dynamic RL 091808 25721 1683 000 No Leak
TEFVO 423 000
216 90E20 Dynamic RL 110708 25730 543 000 No Leak
TEFVO 00 000
31
Table 10
Diurnal Permeation Results 1996 Ford Taurus SHED
Corrected Results Canister From
Fuel Permeation mgday Loss Static
Veh psiEtOH Test Type Date Test mghr (Corrected) g Test
202 100E10 72 DHB 65-105 073107 7023
Day 1 10429 612 No Leak
Day 2 7069 3264
Day 3 7043 3869
202 70E10 72 DHB 65-105 082807 7034
Day 1 6278 000 No Leak
Day 2 5065 000
Day 3 4535 000
202L 90E0 72 DHB 65-105 031108 7173
Day 1 22589 000 Liquid Leak
Day 2 32310 000
Day 3 23069 1260
202L 70E0 72 DHB 65-105 040108 7196
Day 1 47425 000 Liquid Leak
Day 2 44517 000
Day 3 31798 000
202R 90E0 72 DHB 65-105 051308 7230
Day 1 3270 000 Vapor Leak
Day 2 2667 000
Day 3 2746 1083
202R 70E0 72 DHB 65-105 052808 7243
Day 1 2117 000 Vapor Leak
Day 2 2208 000
Day 3 2081 000
216 100E10 72 DHB 65-105 082008 7305
Day 1 25907 5777 No Leak
Day 2 34779 6299
Day 3 36014 6343
216 70E10 72 DHB 65-105 092308 7331
Day 1 3975 022 No Leak
Day 2 3550 006
Day 3 3621 037
216 90E20 72 DHB 65-105 111108 7373
Day 1 4685 000 No Leak
Day 2 4526 000
Day 3 4198 000
32
The Implanted Leak Test Results
Project E-77-2 included evaluating two vehicles with implanted leaks This interest followed the
information gathered in the Pilot Study where tests were run with a specially modified fuel cap
containing a 002rdquo dia hole The results with the implanted leak from the Pilot Study are
repeated in Table 11 below as the diurnal results are shown for a 1996 Chevrolet Cavalier first
without the implanted leak at 038 grams per day and then at 207 grams per day (a 54x
increase) with the leak
Table 11
Veh No
Evap
Tech Fuel
Results
gmsday
gms
Increase
6 1996 Chevrolet Cavalier Enhanced 7 psi E0 038
7 2070 2032
207 2001 Dodge Caravan Enhanced 7 psi E10 109
207L 213 104
211 2004 Toyota Camry LE Near Zero 7 psi E10 024
211L 068 044
- Implanted 020 leak in fuel cap
Vehicle Description
Implanted Leak Impact on Diurnal PermeationDay One Results 65deg - 105degF Diurnal
The two E-77-2 vehicles (207 amp 211) were given a limited evaluation with an induced leak and
saw a significantly lesser impact Vehicle 207 gave diurnal results increases from 109 to 213
grams per day (a 2x increase) and Vehicle 211 increased from 024 grams per day to 068 grams
per day (a 28x increase) The following Figure 20 displays the imbedded leak impact from Table
11
33
0
5
10
15
20
On
e D
ay
Diu
rna
l P
erm
ea
tio
n -
gm
sd
ay
Vehicle Number
Implanted Leak Impact on One Day Diurnal Permeation020 Leak in Fuel Cap - 65 to 105 F Diurnal
207L 211L21120776
As Received - No Leak
020 Fuel Cap Leak
The newer vehicles evaluated in this phase of the study were configured and certified to the
Onboard Refueling Vapor Regulations (ORVR) These are capable of containing 95 or more
control of the refueling vapors at up to 10 gallons per minute fueling rate Where the Chevrolet
Cavalier had a small (0055rdquo dia) orifice and a long vapor tube venting the tankrsquos vapor space to
the carbon canister (and then to the atmosphere) the ORVR compliant vehicles have a large
(0688rdquo ID) short vent hose to a low flow restriction carbon canister
The following bar charts (Figures 21 through 24) show the impacts of the leak on all phases of
the evaporative testing performed and compare those results with all fuels tested With only two
vehicles (207 and 211) evaluated on two fuels statistically significant effects cannot be
quantified but the trend of increased emissions is apparent
Figure 20 ndash Implanted Leak Impact
34
0
20
40
60
80
100
120
140
160
7E0 9E0 7E10 10E10 9E20 7E0 9E0 7E10 10E10 9E20
Sta
tic
Pe
rme
ati
on
-m
gh
r
Fuel
0020 dia Induced Leak EffectStatic Permeation
Vehicle 211Vehicle 207
Leak
Leak
0
200
400
600
800
1000
1200
7E0 9E0 7E10 10E10 9E20 7E0 9E0 7E10 10E10 9E20
Ru
nn
ing
Lo
ss
Pe
rme
ati
on
-m
gh
r
Fuel
0020 dia Induced Leak EffectRunning Loss Permeation
Vehicle 211Vehicle 207
Leak
Leak
Figure 21 ndash Vehicles 207 and 211 with Induced Leak - Static
Figure 22 ndash Vehicles 207 and 211with Induced Leak ndash Running Loss
35
0
100
200
300
400
500
600
700
7E0 9E0 7E10 10E10 9E20 7E0 9E0 7E10 10E10 9E20
Tru
e H
ot S
oa
k P
erm
ea
tio
n -
mg
hr
Fuel
0020 dia Induced Leak EffectTrue Hot Soak Permeation
Vehicle 211Vehicle 207
Leak
Leak
0
500
1000
1500
2000
2500
7E0 9E0 7E10 10E10 9E20 7E0 9E0 7E10 10E10 9E20
Da
y 1
Diu
rna
l P
erm
ea
tio
n -
mg
da
y
Fuel
0020 dia Induced Leak EffectDay 1 Diurnal Permeation
Vehicle 211Vehicle 207
Leak
Leak
Figure 24 ndash Vehicles 207 and 211 with Induced Leak - Diurnal
Figure 23 ndash Vehicles 207 and 211 with Induced Leak ndash True Hot Soak
36
Summary of Findings and Results
The E-77-2 test program was a continuation of the previously published E-77 test project and
added eight vehicles tested on five fuels to the knowledge base The permeation trends
previously shown were again present The small sample size and limited number of tests
preclude making statements about statistical validity but in general
o The newer vehicle groups had lower emissions
o Adding ethanol to the fuel increased permeation over the non-oxygenated levels
o Increased volatility increased permeation levels
o SHED emission rates must be corrected for the ethanol error in the FID and the
non-fuel methanol and refrigerant in the measurement
As this test program evolved and additional experience was gathered two program modifications
were made 1) The leak validation methodology was changed and 2) a different metric and
definition of the ldquoHot Soakrdquo was adopted
The leak validation portion of the static permeation test was found to be very sensitive and when
the data was corrected on a minute-by-minute basis for ethanol methanol and refrigerant the
change in apparent permeation rate was due as much to variation as to leaks See the discussion
starting at page 12 for the details of the development
Concern for and recognition of ldquoHot Soakrdquo emissions started in the original evaporative emission
regulations Carburetors had float bowls with ~ 50 ml of fuel that absorbed the latent engine heat
after the vehicle was shut down after operation The heat would cause the bowl temperature to
increase driving fuel vapors out through vents and leak paths to the atmosphere after vehicle
operation Todayrsquos fuel injection engines do not have the open bowls and the emission rates
following vehicle operation are mainly increased temperature permeation We recommended
and adopted a new name for the ldquotemporary emissions following vehicle operationrdquo (TEFVO)
which subtracts the basic permeation rate from the measured emissions See the discussion
starting at page 16 for details
37
Appendix
Acknowledgements
E-77-2 Steering Committee
David Brzezinski EPA
Kevin Cullen GM Powertrain
Dominic DiCicco Ford Motor Company
King D Eng Shell Global Solutions
Ben Hancock CARB
Constance Hart EPA
Phil Heirigs Chevron Global Downstream
Jeff Jetter Honda RampD Americas
Keith KnollNREL
John Koupal EPA
David H Lax API
Jeff Long CARB
Hector Maldonado CARB
Mani Natarajan Marathon Oil Company
David N Patterson Mitsubishi Motors RampD Americas
Jenny Sigelko Chrysler
James P UihleinChevron Global Downstream
Marie Valentine Toyota Technical Center
Kenneth J Wright ConocoPhillips
CRC Members
Brent Bailey CRC
Chris Tennant CRC
Jane Beck CRC
38
Table 12
E0 E10 E20
Inspection Units Fuel 6 Fuel 7 Fuel 4
API Gravity degAPI 602 585 570
Relative Density 6060degF 07382 07447 07508
DVPE psi 701 730 849
Oxygenates--D4815
MTBE vol 000 000 000
ETBE vol 000 000 000
EtOH vol 000 954 2034
O2 wt 000 353 747
Hydrocarbon Composition
Aromatics vol 221 244 108
Olefins vol 80 88 55
Saturates vol 700 573 234
D86 Distillation
IBP degF 974 1040 1022
5 Evaporated degF 1316 1280 1252
10 Evaporated degF 1423 1330 1314
20 Evaporated degF 1564 1410 1413
30 Evaporated degF 1704 1450 1486
40 Evaporated degF 1840 1530 1547
50 Evaporated degF 1975 1950 1596
60 Evaporated degF 2120 2190 1636
70 Evaporated degF 2305 2410 2274
80 Evaporated degF 2588 2710 2695
90 Evaporated degF 3139 3170 3139
95 Evaporated degF 3322 3300 3255
EP degF 3603 3600 3406
Recovery vol 978 978 983
Residue vol 13 10 10
Loss vol 09 12 07
Driveability Index 11199 11015 9898
Data from CRC E-74
CRC E-77-2 Fuel Inspection Results
39
Fuel Units Fuel 6 Fuel 7 Fuel 4
Sulfur Content ppm 29 27 27
Estimated CH Ratio 62090 63323 63252
Est Net Heat of Combustion btulb 18573 18514 18513
Benzene vol 090 100 096
Research Octane Number 932 940 946
Motor Octane Number 838 838 834
(R+M)2 885 889 890
Fuel Units Fuel 6 Fuel 7 Fuel 4
Aromatics vol 2386 2481 2178
Olefins vol 752 892 1074
Saturates vol 6743 5621 4623
Unclassified vol 115 086 015
Ethanol vol 000 920 2111
Benzene vol 089 106 097
CH Ratio 6200 6092 5835
Oxygen wt 0008 1 340 773
Net Heat of Combustion btulb 18703 18016 17160
1 Contains 004 vol MTBE
Fuel Units Fuel 6 Fuel 7 Fuel 4
Oxygen wt 0008 3396 7733
C+H wt 9999 9660 9227
H wt 1389 1362 1350
C wt 8610 8298 7877
Fuel Units 6 7 4
Haltermann D3338 Btulb 18573 18514 18513
Average D3338 Btulb 18579 18514 18491
Oxygen Corrected D3338 Btulb 18579 17860 17103
DHA Btulb 18703 18016 17160
Table 12 (cont)
Suppliers Additional Inspections
Net Heat of Combusion -- Btulb
Carbon Hydrogen and Oxygen
Detailed Hydrocarbon Analysis
40
Vehicle Day 1 Day 2 Day 3
No Fuel Base + Press + Pump RL True HS Perm (Brkthru) Perm (Brkthru) Perm (Brkthru)
E10 - 10 psi 345 --- --- 1278 503 10429 (63) 7069 (348) 7043 (425)
E10 - 7 psi 223 --- --- 994 113 6278 (00) 5065 (00) 4535 (00)
E0 - 9 psi 2229 --- 4921 3870 00 22580 (00) 32310 (00) 23069 (126)
E0 - 7 psi 2991 --- 19896 7269 00 47425 (00) 44517 (00) 31798 (00)
E10 - 10 psi 843 --- --- 3164 04 15479 (310) 17799 (383) 17711 (419)
E10 - 7 psi 664 --- --- 2879 297 12601 (00) 11652 (00) 11653 (00)
E0 - 9 psi 338 --- --- 2492 443 6283 (24) 5810 (136) 5770 (225)
E0 - 7 psi 129 --- --- 2226 187 3672 (00) 2877 (00) 2936 (00)
E20 - 9 psi 553 --- --- 2720 134 11034 (00) 9581 (00) 9812 (00)
E10 - 10 psi 416 --- --- 1916 295 17941 (204) 17309 (346) 17417 (375)
E10 - 7 psi 596 --- --- 2328 719 17834 (00) 17150 (00) 15239 (00)
E0 - 9 psi 195 --- --- 1031 10 4995 (00) 4810 (00) 5072 (26)
E0 - 7 psi 99 --- --- 671 00 3830 (00) 3654 (00) 3670 (00)
E20 - 9 psi 462 --- --- 1697 603 17752 (00) 16900 (00) 16802 (00)
E10 - 10 psi 787 --- --- 8581 2377 14064 (00) 12644 (00) 12237 (00)
E10 - 7 psi 644 --- --- 8122 1222 10865 (00) 8120 (00) 8236 (00)
E0 - 9 psi 325 --- --- 8339 58 4064 (00) 3373 (00) 3080 (00)
E0 - 7 psi 401 --- --- 8425 00 3975 (00) 3026 (00) 2689 (00)
E20 - 9 psi 882 --- --- 10282 00 15480 (00) 13702 (00) 13605 (00)
E10 - 10 psi 976 --- 1209 10012 3929 16449 (00) NA NA
E10 - 7 psi 1468 --- --- 11393 5850 21342 (00) NA NA
E10 - 10 psi 199 --- --- 1383 00 3370 (00) 2268 (191) 2179 (330)
E10 - 7 psi 94 266 --- 563 138 2438 (00) 1838 (00) 1843 (00)
E0 - 9 psi 101 --- --- 837 153 1303 (00) 1158 (129) 1006 (221)
E0 - 7 psi 91 --- --- 1046 07 2071 (00) 1002 (00) 874 (00)
E20 - 9 psi 558 --- --- 4106 00 2840 (00) 2218 (00) 2034 (00)
E10 - 10 psi 551 --- 821 3024 2450 25454 (040) NA NA
E10 - 7 psi 481 --- 1664 2511 62 6783 (00) NA NA
E10 - 10 psi 106 --- --- 1489 00 1243 (00) 879 (00) 1028 (200)
E10 - 7 psi 218 --- --- 2012 00 1848 (00) 1002 (00) 758 (00)
E0 - 9 psi 32 --- --- 1158 04 1005 (00) 708 (00) 574 (00)
E0 - 7 psi 09 --- --- 1845 18 1016 (00) 712 (00) 570 (00)
E20 - 9 psi 47 --- --- 1168 49 1310 (00) 833 (00) 750 (00)
E10 - 10 psi 244 --- --- 1331 574 4920 (00) 8394 (00) 113738 (49)
E10 - 7 psi 239 --- --- 1057 329 5242 (00) 3974 (00) 3944 (00)
E0 - 9 psi 107 --- --- 967 521 4559 (00) 3585 (00) 11017 (00)
E0 - 7 psi 252 --- --- 363 33 4943 (00) 3190 (00) 2815 (00)
E20 - 9 psi 168 --- --- 1394 560 4709 (00) 4400 (00) 7518 (00)
E10 - 10 psi 104 90 --- 719 16 3192 (00) 2602 (00) 2370 (00)
E10 - 7 psi 122 --- --- 979 00 2247 (00) 2317 (00) 2675 (00)
E0 - 9 psi 85 --- --- 811 251 2021 (00) 1659 (2) 1763 (72)
E0 - 7 psi 87 --- --- 797 225 2483 (00) 2941 (00) 2888 (00)
E20 - 9 psi 193 --- --- 1025 00 4168 (00) 4148 (00) 4506 (00)
E10 - 10 psi 324 --- --- 1742 118 25907 (578) 34779 (630) 36014 (643)
E10 - 7 psi 325 --- --- 1683 192 3975 (02) 3550 (01) 3621 (04)
E0 - 9 psi 178 136 --- 1091 254 3270 (00) 2667 (00) 2746 (108)
E0 - 7 psi 204 380 --- 787 00 2117 (00) 2208 (00) 2081 (00)
E20 - 9 psi 204 --- --- 543 74 4685 (00) 4526 (00) 4198 (00)
216
211
2004
Toyota
Camry
XLE
215
2004
Toyota
High-
lander
212
2006
Ford
Taurus
214
2004
Ford
Escape
211L
207L
Static Permeation - mghr Dynamic Perm - mghr
CRC E-77-2 Program Test Results
Diurnal (65ordm to 105ordm) - mgday
202
1996
Taurus
205
2001
Toyota
Corolla
204
1999
Honda
Accord
207
2001
Dodge
Caravan
202L
Table 13
41
Individual Vehicle Diurnal Performance on the Various Fuels
0
1000
2000
3000
4000
5000
6000
0 10 20 30 40 50 60 70
Cu
mu
lati
ve
Pe
rme
ati
on
-m
g
Test Time - hrs
Three Day DiurnalVehicle 204 1999 Honda Accord
10 psi E10
7 psi E10
9 psi E0
7 psi E0
9 psi E20
0
1000
2000
3000
4000
5000
6000
0 10 20 30 40 50 60 70
Cu
mu
lati
ve
Pe
rme
ati
on
-m
g
Test Time - hrs
Three Day DiurnalVehicle 205 - 2001 Toyota Corolla
10 psi E10
7 psi E10
9 psi E0
7 psi E0
9 psi E20
Figure 25 ndash Vehicle 204 Diurnal Performance
Figure 26 ndash Vehicle 205 Diurnal Performance
42
0
500
1000
1500
2000
2500
3000
3500
4000
4500
5000
0 10 20 30 40 50 60 70
Cu
mu
lati
ve
Co
rre
cte
d P
erm
ea
tio
n -
mg
Test Time - hrs
Three Day DiurnalVehicle 207 - 2001 Dodge Caravan
10 psi E10
7 psi E10
9 psi E0
7 psi E0
9 psi E20
0
100
200
300
400
500
600
700
800
900
0 10 20 30 40 50 60 70
Cu
mu
lati
ve
Pe
rme
ati
on
-m
g
Test Time - hrs
Three Day DiurnalVehicle 211 - 2004 Toyota Camry XLE
10 psi E10
7 psi E10
9 psi E0
7 psi E0
9 psi E20
Figure 27 ndash Vehicle 207 Diurnal Performance
Figure 28 ndash Vehicle 211 Diurnal Performance
43
0
50
100
150
200
250
300
350
400
450
500
0 10 20 30 40 50 60 70
Cu
mu
lati
ve
Pe
rme
ati
on
-m
g
Test Time - hrs
Three Day DiurnalVehicle 212 - 2006 Ford Taurus
10 psi E10
7 psi E10
9 psi E0
7 psi E0
9 psi E20
0
500
1000
1500
2000
2500
3000
3500
4000
4500
5000
0 10 20 30 40 50 60 70
Cu
mu
lati
ve
Pe
rme
ati
on
-m
g
Test Time - hrs
Three Day DiurnalVehicle 214 2004 Ford Escape
10 psi E10
7 psi E10
9 psi E0
7 psi E0
9 psi E20
Note The incomplete cumulative results for the 10 psi E10 results resulted from a conflict for the use
of the INNOVA analyzer during the test The INNOVA analyzer is required to correct for the FIDrsquos
ethanol error and the presence of methanol and refrigerant (R-134a) The data was available for the
50+ hour results and the data is valid as shown We have no explanation for the high levels
experienced on the third day of the test No test errors were identified
Figure 29 ndash Vehicle 212 Diurnal Performance
Figure 30 ndash Vehicle 214 Diurnal Performance
44
0
200
400
600
800
1000
1200
1400
1600
0 10 20 30 40 50 60 70
Cu
mu
lati
ve
Pe
rme
ati
on
-m
g
Test Time - hrs
Three Day DiurnalVehicle 215 2004 Toyota Highlander
10 psi E10
7 psi E10
9 psi E0
7 psi E0
9 psi E20
Figure 31 ndash Vehicle 215 Diurnal Performance
45
Table 14
Test Corrected
Vehicle Fuel Total Fuel EtOH R134a Methanol
204 10 psi E10 509899 144040 18298 16754
1999 Honda 7 psi E10 359057 130806 17551 15221
Accord 9 psi E0 178635 13843 18230 9896
7 psi E0 94846 1856 16631 2379
9 psi E20 304271 128408 18261 12143
205 10 psi E10 526659 186599 23354 20895
2001 Toyota 7 psi E10 502229 204246 25990 19198
Corolla 9 psi E0 148775 000 20434 4613
7 psi E0 111536 5489 22408 5619
9 psi E20 514540 212708 25677 19584
207 10 psi E10 389450 196248 12013 30399
2001 Dodge 7 psi E10 272201 114027 11731 19616
Caravan 9 psi E0 105167 1820 12224 15284
7 psi E0 96906 1118 22141 14276
9 psi E20 427882 241488 14268 25432
211 10 psi E10 78164 19733 15159 46970
2004 Toyota 7 psi E10 61190 20211 15929 46525
Camry LE 9 psi E0 34668 1681 14329 42659
7 psi E0 39468 000 16197 57303
9 psi E20 71013 26726 16213 36879
212 10 psi E10 31508 7222 14831 7896
2006 Ford 7 psi E10 36079 10132 15481 3400
Taurus 9 psi E0 22870 2409 15182 3761
7 psi E0 22973 000 15393 4362
9 psi E20 28935 11156 14116 2629
214 10 psi E10 1257887 000 19947 27992
2004 Ford 7 psi E10 131593 24571 16025 8879
Escape 9 psi E0 191611 2940 16487 7213
7 psi E0 109481 5386 80650 3106
9 psi E20 166271 24097 14491 6096
215 10 psi E10 81644 12178 14658 42609
2004 Toyota 7 psi E10 72399 15092 15532 36061
Highlander 9 psi E0 54431 000 14806 25822
7 psi E0 83115 000 14072 26255
9 psi E20 128223 38822 12841 34420
3 Day Diurnal Results
CRC E77-2 Program Diurnal ResultsAll values are in mg
46
0
200
400
600
800
1000
1200
1400
1600
1800
2000
Co
rrecte
d D
aily D
iurn
al
-m
g
Diurnal Ethanol PortionVehicle 204 - 1999 Honda Accord
Ethanol Portion
10 psi E10 9 psi E07 psi E10
1 32
315
341368
383
264273
1 321 321 321 32
9 psi E207 psi E0
1122097
39
0510
442
405412
Figure 32 ndash Vehicle 204 Diurnal Ethanol Portion
0
200
400
600
800
1000
1200
1400
1600
1800
2000
Co
rrecte
d D
aily D
iurn
al
-m
g
Diurnal Ethanol PortionVehicle 205 - 2001 Toyota Corolla
Ethanol Portion
10 psi E10 9 psi E07 psi E10
1 32
359
406
382
431355349
1 321 321 321 32
9 psi E207 psi E0
0 00
712649
406
420414
Figure 33 ndash Vehicle 205 Diurnal Ethanol Portion
47
0
200
400
600
800
1000
1200
1400
1600C
orr
ecte
d D
aily D
iurn
al
-m
g
Diurnal Ethanol PortionVehicle 207 - 2001 Dodge Caravan
Ethanol Portion
10 psi E10 9 psi E07 psi E10
1 32
488
442408
409
490535
1 321 321 321 32
9 psi E207 psi E0
00
1144
27
0101
556
587552
Figure 34 ndash Vehicle 207 Diurnal Ethanol Portion
0
50
100
150
200
250
300
350
400
Co
rrecte
d D
aily D
iurn
al
-m
g
Diurnal Ethanol PortionVehicle 211 - 2004 Toyota Camry XLE
Ethanol Portion
10 psi E10 9 psi E07 psi E10
1 32
264
242245
1 321 321 321 32
9 psi E207 psi E0
329
306356
00
73
64
00
00
00
325
431
370
Figure 35 ndash Vehicle 211 Diurnal Ethanol Portion
48
0
20
40
60
80
100
120
140
160
180
200C
orr
ecte
d D
aily D
iurn
al
-m
g
Diurnal Ethanol PortionVehicle 212 - 2006 Ford Taurus
Ethanol Portion
10 psi E10 9 psi E07 psi E10
1 32
216
170
316
1 321 321 321 32
9 psi E207 psi E0
194
288
436 102
105
85
00
00
00476
529
243
Figure 36 ndash Vehicle 212 Diurnal Ethanol Portion
0
200
400
600
800
1000
1200
Co
rrecte
d D
aily D
iurn
al
-m
g
Diurnal Ethanol PortionVehicle 214 - 2004 Ford Escape
Ethanol Portion
10 psi E10 9 psi E07 psi E10
1 32
00
1 321 321 321 32
9 psi E207 psi E0
201
202152
38
05
19
56
1469
103
171188
143
67
11275
Figure 37 ndash Vehicle 214 Diurnal Ethanol Portion
49
0
50
100
150
200
250
300
350
400
450
500C
orr
ecte
d D
aily D
iurn
al
-m
g
Diurnal Ethanol PortionVehicle 215 - 2004 Toyota Highlander
Ethanol Portion
10 psi E10 9 psi E07 psi E10
1 32
121
136
196
1 321 321 321 32
9 psi E207 psi E0
198
217213
0000
00
0000
00
335 292
283
Figure 38 ndash Vehicle 215 Diurnal Ethanol Portion

3
TEST PROGRAM OVERVIEW
Vehicle Selection
The sponsors chose to evaluate eight vehicles on five fuel blends The vehicles were defined to
be one pre-enhanced evaporative system vehicle (1996 model year) five ldquoEnhanced
Evaporativerdquo system vehicles (model years 1999 to 2001) and two ldquoTier 2rdquo (Near Zero) vehicles
that were 2004 model year vehicles or later The pre-enhanced vehicle was certified to a single
dayrsquos diurnal control The enhanced control vehicles were subject to a much more severe
performance test including a three-day diurnal a high temperature hot soak and a measured
running loss test The Tier 2 vehiclesrsquo test requirements were similar to the enhanced vehicles
but at a standard of about one-fourth of the enhanced vehicles level All but the 1996 pre-
enhanced vehicle were certified to the On-Board Refueling Vapor Recovery (ORVR) emission
requirements All the vehicles were the property of CRC having been bought along with other
vehicles for CRC Project E-74b (CO vs RVP) The vehicles were originally purchased for the
E-74b project from local retail sources in the Phoenix AZ area
Each candidate vehicle was checked at the start of the test program to make sure that there were
no system leaks to verify system purge was present and to generally establish that it was safe to
operate
Vehicle Fleet
Table 1 below lists and describes the eight vehicles studied in this program A more complete
file containing the vehicle road load coefficients and dynamometer settings is included in the ldquoE-
77-2 Companion Filesxlsrdquo (Microsoft EXCELtrade) file available on the CRC website
wwwcrcaoorg
Table 1
Vehicle
Number
Model
Year Make Model
Odometer
Miles Evap Standards Evap Family
Fuel
Tank
Plastic
Metal
202 1996 Ford Taurus 86538 Pre-Enhanced TFM1115AYMEB Metal
204 1999 Honda Accord 100418 EnhancedORVR XHNXR0130AAA Metal
205 2001 Toyota Corolla 92047 EnhancedORVR 1TYXR0115AK1 Metal
207 2001 Dodge Caravan 92740 EnhancedORVR 1CRXR0165XAA Plastic
214 2004 Ford Escape 40188 EnhancedORVR 4FMXR0110BBE Plastic
215 2004 Toyota Highlander 88000 EnhancedORVR 4TYXR0165PZ1 Plastic
211 2004 Toyota Camry 42592 Near ZeroORVR 4TYXR0130A11 Plastic
212 2006 Ford Taurus 28354 Near ZeroORVR 6FMXR0185GAK Metal
E77-2 Vehicle Fleet
4
Test Fuels
The fuel comparisons selected for this project were three levels of ethanol content with volatility
varied as listed in Table 2 below
Table 2
Test Fuel Target Values
7 psi 9 psi 10 psi
E0 X X
E10 X X
E20 X
CRC had fuels remaining from Project E-74 in quantities sufficient to conduct this program eg
7 psi E0 and E10 and 9 psi E203 Inspection records of the base fuels are repeated in the
Appendix using their E-74b identifications fuels 6 7 and 4 respectively The nominal 7 psi
fuels both E0 and E10 were locally blended with commercial butane to make the higher
volatility 9 psi E0 and the 10 psi E10 The blends were done in drum batches approximately 50
gallons at a time by adding small amounts of butane circulating for a brief period then
sampling and determining the new volatility with a ldquoGrabner4rdquo instrument using test procedures
described in ASTM D 5191 The higher (10 instead of 9) volatility of the E10 fuel was specified
because many localities permit ldquosplash blendingrdquo of ethanol to gasoline and allow a 1 psi
volatility exemption for their vapor pressure limits
Adaption Period for Test Fuel Change
Many areas of the United States were required5 to use an oxygenated fuel to improve vehicle
emissions especially during the summer season While MTBE was the most common
oxygenate ethanol was also used CRC Project E-65 demonstrated that the permeation of
vehicle fuel systems increased with the use of fuels containing ethanol compared to fuels with
MTBE or no oxygenate CRC Project E-65 also demonstrated that if ethanol had been
previously used and the fuel replaced with a non-ethanol blend it could take two to four weeks
for the ethanol increase to dissipate
The protocols adopted for this test program were to require a minimum of four weeks of vehicle
exposure to a new fuel when first introducing 10 or 20 volume percent ethanol to the vehicle and
the same period of time when moving to an ethanol-free (E0) fuel Note when changing RVP
only a one week exposure has been demonstrated as sufficient
3 While the E20 target was 9 psi the average inspection value (5 labs) was 85 psi The sponsor chose to continue
the test at this level
4 wwwgrabner-instrumentscom MINIVAP VPS VPSH Vapor Pressure Tester The portable MINIVAP VPS
and VPSH vapor pressure testers are the worldwide accepted standard instruments for determination of the vapor
pressure of gasoline according to ASTM D 5191 ASTM D 6377 ASTM D 6378 and EN 13016 1+2
5 The requirement for oxygen content in RFG fuels was removed by EPA in May of 2005 as directed by the
Energy Policy Act of 2005 The Renewable Fuels Standard requiring renewable fuels (eg ethanol) in increasing
amounts over the years replaces the mandate
5
The Test Concept Measuring Leaks Permeation and Diurnal Vapor Losses
Mass emissions are measured in a VT SHED or Variable Temperature Sealed Housing for
Evaporative Determination The SHED test method
combines all three emission mechanisms (leaks
diurnal venting and permeation) into a single test
result
The SHED technique involves placing the vehicle in
a sealed enclosure (Figure 2) and calculating the
mass in the enclosure from the volume density and
concentration in the enclosure at the start and end of
a time period The difference between the mass at
the start and end of test is the emission rate eg
grams per unit time
CRCrsquos E-77 emission test programs have
developed (and strive to continually improve)
new methodologies for understanding and quantifying vehicle evaporative emission rates The
concept partitions and assigns the vehiclersquos contribution to the evaporative emission inventory
into three mechanisms
1 Permeation
2 Tank vapor venting
3 Leaks (with two subsets - Liquid and Vapor)
Permeation is the migration of HC through the various elastomers (polymers) in a vehicle fuel
system6 Previous testing has shown that permeation rate is strongly affected by the materialrsquos
temperature doubling for each 10ordmC (18ordmF) increase in the range of normal summer
temperatures It is also strongly affected by gasoline composition especially with ethanol-
containing fuels
6 ldquoFuel Permeation from Automotive Systems Final Report CRC Project E-65rdquo Haskew Liberty and McClement
September 2004 available on the CRC and California Air Resources Board websites
Figure 2 ndash Sealed Housing for Evaporative
Determination
6
Tank vapor venting emissions are controlled by fitting a carbon canister to the atmospheric tank
vent Figure 3 is a schematic of a typical early control system During a daily heating period the
temperature of the vehiclersquos fuel tank increases forcing HC vapors from the tank Excess
emissions exceeding the carbon canisterrsquos capacity are vented to the atmosphere
Figure 3 - Control System Schematic
Leaks can be liquid or vapor Permeation and tank venting losses are strongly driven by fuel
composition ambient temperature and ambient temperature change Liquid leaks are not
strongly affected by normal summer temperatures and are thought to have two components
1 Static leaks occurring while the engine is turned off and the vehicle is stationary
2 Increase in leak rate caused by the system pressure increase during engine operation
A Test Method for Separating Permeation from Tank Venting and Leaks ndash In a previous
CRC Project (E-65) the canister loss was separated from the permeation measurement by
venting the losses from the carbon canister outside
the SHED For Project E-77 the canister vent
losses were collected and measured in a separate
ldquotrap canisterrdquo on a scale outside the SHED as
shown in Figure 4 This vent line was capped off
(ie sealed during the Static Test) but connected
as shown in the figure for the Dynamic and the
Diurnal Test The ambient temperature in the
SHED was constant during the static test and
there was no vapor created at constant
temperature
Figure 4 - Trap Canister
7
This vent was closed to pressurize the system for the leak evaluations The resulting SHED
increase in HC mass was permeation7 The last mechanism that needed to be evaluated was
leaks Leaks can be both vapor and liquid A liquid leak can have significant mass currently
undetected by the vehiclersquos on-board diagnostic system Considerable thought and effort have
gone into the creation of a simple and effective liquid leak detection methodology without
success The techniques used in this project required the use of a SHED for measurements The
techniques were not simple but they proved effective
Based on experience a vehiclersquos permeation rate is expected to be between the range of 4 to 90
mghour at the 86degF test temperature The presence of a static liquid leak is expected to
overwhelm this value such a leak would (or could) be apparent by inspection Leaks from the
vehicles were quantified in a three-step test process The first step was to measure the static
permeation rate of the vehicle at 86ordmF The vehicle was allowed to stabilize overnight at 86ordmF in
the SHED and the permeation rate was calculated from the mass increase in the SHED during a
one-hour measurement period The second part of the test looking for pressure driven leaks in
the vapor system was performed by pressurizing the vehiclersquos tank to 5rdquo H2O through a special
fuel cap and tubing from outside the SHED (Figure 5) The special fuel cap the hose and the
pressurization apparatus were installed before the start of the sequence The HC concentration in
the SHED was monitored and the increase in the mass of HC in the SHED during the 30-minute
pressurization period compared to the static permeation rate If there was no (or insignificant)
rate of increase it was deduced that no vapor leak was present
The third and final part of the test was to energize the vehiclersquos fuel pump and pressurize the
system up to and including the injectors (Figure 6) If there were a pressure leak in the liquid
system an increase in the SHED mass over the 30-minute measurement period would be seen
ie the leak would be additive to the permeation rate
6 This is a simplification There are other HC sources present that are not fuel permeation These include tire paint
adhesives and vinyl emissions and the possibility of fuel leaks from the fuel injectors We believe these to be a
minor component of the emissions measured in this study
Figure 5 - Static Test ndash Tank Pressurization
8
Figure 6 ndash Static Test ndash Fuel Pump Energized
Other Tests (Dynamic Hot Soak and Diurnal) - A similar configuration is used to isolate the
tank venting losses from the permeation measurements determined by other test procedures The
vehiclersquos canister vent is connected with a low permeation hose (Teflontrade) to a bulk-head fitting
in the SHED wall and then to a separate ldquotrap canisterrdquo on a top-loading scale Any HC
emissions that escape from the vehiclersquos canister are captured in the trap canister and measured
at a 001 g (10 milligram) precision The trap canister (a 1 Liter Ford model) is purged before
each test and maintained at a ldquodryrdquo condition so that it captures all of the vehiclersquos escaping
emissions This assumption is probably violated during the high volatility tests where there are
30 grams of daily emissions but this is not a concern at this time
Test Elements for E-77-2 - The following flow chart (Figure 7) displays the various elements
utilized during the testing of the various vehicles and fuels during this program Details of each
of the four basic tests follow the flow chart
9
Drain and 40 Fill
with 10 psi E10 Test Fuel
Road Preconditioning
Four LA-4rsquos or Equivalent
Drain and 40 Fill
with 10psi E10 Test Fuel
Overnight Park at 86degF
Move to SHED
Connect Test Instrumentation
Stabilize at 86degF
Perform Constant Temperature
Permeation Series (86degF)
1 hour Permeation Rate Test
frac12 hour Tank Pressurized Test
frac12 hour Pump Energized Test
Transfer to RL SHED
Connect Test Instrumentation
Stabilize at 86degF
Perform Dynamic Permeation Test
Two LA92 Driving Cycles amp
One Hour Hot Soak
Drain and 40 Fill
With 10 psi E10 Test Fuel
Road Preconditioning
Four LA-4rsquos or Equivalent
Move to VT-SHED
Connect Test Instrumentation
Stabilize at 65degF for 6 hrs Minimum
Perform 3-Day Diurnal Evaluation
72 hr 65deg to 105degF VT Test
Drain and 40 Fill
with 7 psi E10 Test Fuel
Condition Fuel System
By Driving for One Week
Repeat Steps 1 ndash 12
On 7 psi E10 Test Fuel
Drain and Fill with 9 psi E0 Test Fuel
Condition Fuel System by 4 weeks Driving
Repeat Steps 1 ndash 12
On 9 and 7 psi E0 and
Repeat Steps 0-12
On 9 psi E20 Test Fuels
Precondition Fuel System
With 4 Weeks Driving on
10 psi E10 Test Fuel
1
2
3
4
5
6
7
8
9
10
11
12
0
Figure 7 ndash Testing Flow Chart
10
Test Procedures ndash There are four basic tests in the E-77-2 test protocol
1 Static Permeation Rate (includes checks for vapor and liquid leaks)
2 Running Emissions (Dynamic Test)
3 Hot Soak
4 Diurnal
Each is described in detail below
1 Static Permeation Rate Testing
The constant temperature (static) permeation rate is measured in a traditional SHED (Constant
temperature) in the following manner
A The fuel tank is drained and filled to 40 tank capacity with the test fuel
B The day before testing the vehicle is driven over four road trips of 75 miles each
to precondition the canister8 (These drives are similar to the LA-4)
C Upon return from the road pre-conditioning the fuel tank is drained and filled to
40 tank capacity with the test fuel9
D Vehicle is parked for 18-22 hours in a controlled temperature environment at test
temperature (86ordmF)
E The vehicle is then moved (without starting) into the test (86ordmF) SHED
F The canister vent is connected to the SHED bulkhead fitting which routes the
vapor to the trap canister outside the SHED
G The tank system pressurization hose is connected
H The fuel pump electrical connection is connected
I The SHED is sealed the inside temperature is allowed to stabilize and the test is
started Continuous THC measurements are made using a FID Ethanol
methanol and R134a concentrations are measured using an INNOVA analyzer
All measurements are made at least every minute for one hour to determine the
stabilized permeation rate
J At the end of the static test (60 minutes) the vehiclersquos vapor system is pressurized
to 5 inches of water for thirty minutes Measurements are made to quantify vapor
leaks as determined by a change in the THC in the SHED
K The fuel pump is then energized for 30 minutes while maintaining the 5 inches of
water on the vapor system Liquid leaks are quantified as determined by a change
in the concentration of THC in the SHED
The purpose of steps J and K above is to validate that the permeation rate measurement was
made without the presence of any leak ndash either liquid or vapor A detailed discussion follows
starting at page 12
8 This conditioning can be done in the laboratory on a chassis dynamometer if proper attention is paid to underbody
cooling and unrepresentative fuel tank temperatures are avoided 9 Vehicles with ORVR systems will add the refueling vapors to the canister This is OK
11
2 Running Loss Test (Dynamic Test)
A The vehicle is placed in the RL-SHED and prepared for test (The fuel level and
condition for the dynamic test is the fuel remaining after completion of the static test ndash
40 fresh fill of the appropriate test fuel)
B Outside air source for the engine is connected
C Vehicle exhaust is connected
D Fuel tank thermocouple is connected
E Canister vent is connected to the SHED bulkhead fitting which routes the vapor to the
trap canister outside the SHED
F Vehicle is allowed to stabilize in the RL-SHED at test temperature (86degF) for a minimum
of 12 hours ndash preferably overnight
G Two cycles of the Unified Cycle (LA-92) driving schedule (48 mins) are driven while
measuring the mass emissions in the SHED Vehicle is allowed to idle (in drive) for 30
seconds between the two cycles Ambient air temperature is maintained (to the extent
possible) at 86degF Fuel tank surface temperature is monitored during vehicle operation It
should increase during the drive from 10 to 18degF to simulate expected on-road
temperature increase Measured mass emissions are corrected using the INNOVA data
for the ethanol methanol and refrigerant emissions
3 Hot Soak10
This procedure is executed immediately following the Running Loss Test procedure
described above
A Engine is turned off transmission selector is placed in park and driver exits the
enclosure using the double door air lock taking care to minimize any air exchange
between the laboratory and the SHED This starts the one hour ldquohot soakrdquo period
B Measurements of mass emissions in the SHED are continued for another 60 minutes
(until time = 108 minutes) correcting for the ethanol methanol and refrigerant mass
using the INNOVA instrument data This ends the hot soak Hot soak emissions are
calculated as the net difference for the one hour hot soak (CorrMass108 ndash CorrMass48
minus the 86degF static hourly rate all mass rates in mghour)
4 Diurnal Test
A The fuel tank is drained and filled to 40 tank capacity with the test fuel
B The day before testing the vehicle is driven over four road trips of 75 miles each to
precondition the vehicle and the canister
C Upon return from the road pre-conditioning the fuel tank is drained and filled to 40
tank capacity with the test fuel
D The vehicle is parked for 18-22 hours in a controlled temperature environment at the
initial diurnal test temperature (65ordmF)
E The SHED is sealed allowed to stabilize at the 65degF temperature and the 3-day
California Diurnal Test is started
10 We define the ldquohot soakrdquo to be the temporary increase in emission rate caused by the immediately preceding
operation of the vehicle It is the increase in the SHED mass (corrected for EtOH MeOH and R-134a) over the
one hour period minus the previously established ldquostaticrdquo permeation rate
12
F ldquoContinuousrdquo (every 30 seconds) THC measurements are made using a FID Ethanol
methanol and R134a (refrigerant) concentrations are measured using an INNOVA
analyzer at least every 10 minutes for the duration of the test (72 hours)
Static Permeation Test ndash Leak Validation
If a leak is detected during either the vapor system pressure portion (Step J) or the pump
energized portion (Step K) of the Static Permeation Test procedure it calls into question whether
the permeation rate measurement accurately reflects fuel system permeation or if instead a
combination of permeation and the implied leak was measured If a leak is confirmed the
permeation rate measurement is called into question and an investigation possible remedy and
retest is indicated
The permeation rate measurement must be corrected for the FIDrsquos ethanol misrepresentation and
the presence of non-fuel hydrocarbons (methanol and refrigerant) The leak check however is
made using the change in mass increase in the SHED using the uncorrected FID mass calculation
as the determinate It was found that the corrections for ethanol methanol and refrigerant were
introducing ldquonoiserdquo into the trace and that these were being misinterpreted as leaks
y = 062x - 19
y = 047x + 67
y = 055x - 01
0
10
20
30
40
50
60
70
80
90
100
0 20 40 60 80 100 120
SH
ED
Mas
s -
mg
Test Time - minutes
Leak TestVehicle 204 - 1999 Honda Accord - 9 psi E0
Test 7028
Pump ActivatedTank Pressurized
Figure 8 above represents the calculations made during the inspection of data from a successful
test EXCELrsquostrade ldquoSLOPErdquo function is used to calculate the linear regression values based on
the FID calculation for mass for Time 0 to 60 minutes Time 64 to 90 minutes and Time 94 to
120 minutes A 4-minute gap was included between each sequence to establish the new mass
emission rate during the ldquopressure onrdquo (T60 to T90) and the ldquopump energizedrdquo periods
The slope of 047 for the ldquoTank Pressurizedrdquo period in the example above is compared to the
slope of 062 calculated for the permeation rate (or hot soak) period Since the ldquoTank
Figure 8 ndash Leak Test
13
Pressurizedrdquo slope is not more than 10 higher than the hot soak permeation rate we assume
that there is no leak present A similar comparison is made for the slope determined during the
ldquopump onrdquo period The choice of a 10 allowance is arbitrary and is used here to allow for
normal and unavoidable test variation
For tests in which the above procedure determines that no leak is present a value of zero is
reported in the test summary for the leak results If a positive value is reported it calls that test
into question and an investigation possible repair and retest is indicated
Static Permeation Rate Determination
The static permeation rate is determined based on a linear regression through the individual
SHED mass data points (data measured each 30 seconds) of the corrected fuel results (corrected
for the FID error and subtracting the methanol and refrigerant) from the first 60 minutes of
testing as illustrated in Figure 9 below
y = 05636x + 0505
0
5
10
15
20
25
30
35
40
45
0 10 20 30 40 50 60
Pe
rme
ati
on
-m
gs
Test Time - mins
Static Permeation DeterminationVehicle 204 - 1999 Honda Accord - 9 psi E0 Fuel
Raw SHED
Corrected Fuel
Permeation Rate Based on Corrected Results
Permeation Rate = 5636 x Time = 338 mgshr
In this example the static permeation rate is 338 mghr
Dynamic (Running Loss) and Hot Soak Test
The preceding section addressed the concepts of separating the permeation emissions from the
tank venting emissions and establishing the presence or absence of leaks The second part of
this study includes a dynamic test to measure the permeation and tank venting emissions during
Figure 9 ndash Static Permeation Determination
14
vehicle operation (ldquorunning lossesrdquo) and the temporary condition following vehicle operation
known as the ldquohot soakrdquo
This is considered a ldquodynamicrdquo test because the vehicle is driven and the fuel and vapor system
temperatures rise during the test The ambient temperature in the Running Loss SHED during
the test was held constant at 86degF while the vehiclersquos fuel system temperature rose during the
test Two 1435 second (239-minute) LA-92 driving cycles were performed consecutively during
the running loss measurements with a 30-second idle in-between During this test tank fuel
temperature was expected to rise by an average approximately 18degF above the initial ambient
temperature The running loss air handling system included a proportional speed under-car
blower operated as a slave to dynamometer speed This apparatus was used during running loss
testing with minor tuning for specific vehicles Without additional input it is capable of
reasonable fuel tank temperature control Each vehicle was fitted with a surface-mount
thermocouple at the front of the fuel tank located at approximately the 18th
fill level to measure
the fuel liquid temperature No attempt was made to follow a predefined fuel tank temperature
profile (FTTP) in this program Fuel temperatures were recorded and results are available in the
real-time records
Vehicle running loss emissions are measured in a special version of a SHED known as a
Running Loss SHED (RL-SHED) shown in Figure 10 Special features of the RL-SHED
include a sealed chassis dynamometer for simulating vehicle driving loads a sealed outside air
supply for engine intake a sealed exhaust conduit for engine exhaust and an under-chassis fan
for simulating underbody air flow as described above A vehicle is operated inside the RL-SHED
over a chosen driving cycle The increase in HC emissions inside the enclosure are measured
and calculated as mass emissions per 40 CFR sect86163-96
Figure 10 - Running Loss SHED
15
Vehicle testing in an RL-SHED is complicated by several factors including
1 Engine must be supplied with external induction air
2 Exhaust must be conducted externally without any leaks
3 Load supplied to the vehicle through the chassis dynamometer must not create or
allow external leaks
4 Internal SHED temperature must be maintained while sizable heat is rejected to the
ambient by the running engine and exhaust
5 Cooling air supplied to the radiator must be modulated to represent the vehiclersquos road
speed
6 Underbody (and especially the fuel system) temperature should represent the rate of
rise experienced by a real road-drive
Canister vent losses were isolated from permeation emissions using the technique previously
described The vehiclersquos carbon canister fresh air vent was connected to the outside of the RL-
SHED using a leak-tight PTFEreg
hose (38rdquo OD commercial tubing US Plastics 58055 PTFE or
equivalent) connected to a small carbon ldquotraprdquo canister located on a top-loading precision scale
The scale precision was 001 grams (10 milligrams) and it was purged prior to each test There
were no tank venting emissions measured on any of the running loss test measurements All of
the vehicles appeared to be actively ldquopurgingrdquo their respective control canisters and drawing
fresh air during the test If there were any emissions from the vehiclersquos control canister as might
have occurred if there were no vehicle purge or if very high volatility fuels with excessive vapor
generation were used they would have been measured
The Running Loss Driving Cycle consisted of two cycles of the ldquoUnified Driving Cyclerdquo
otherwise known as the LA-92 A velocity versus time plot for one cycle is shown in Figure 11
The LA-92 cycle takes 24 minutes to complete and covers 98 miles with many speed changes
Two back-to-back cycles were driven the first as a ldquocold startrdquo and the second following a 30-
second vehicle idle The ldquocold startrdquo condition was created by soaking the vehicle for a
Figure 11 ndash Running Loss Driving Cycle
Unified Cycle (LA-92)
0
10
20
30
40
50
60
70
80
0 5 10 15 20 25Test Time - minutes
Spe
ed -
mph
Cycle Time (min) 239
Maximum Speed (mph) 672
Average Speed (mph) 246
Average Non-Zero Speed (mph) 294
Time Zero Speed () 162
Distance (miles) 982
16
minimum of 18 hours at 86degF moving it to the stabilized 86degF RL-SHED making the test
connections and then waiting a minimum of one hour before the initial start and run
The SHED emissions were measured during 48 minutes of engine operation and then
continuously for one hour after the engine was turned off This one hour engine-off duration
was the ldquohot soakrdquo period The total test time is 1 hour and 48 minutes
Figure 12 shows results from the 9 psi E0 fuel test on Vehicle 204 The horizontal axis is test
time in minutes and the vertical axis is the HC mass measured in the RL-SHED during the test
period
The engine was shut off at the end of the second LA92 drive cycle (~48 minutes) and the
analysis system continued to measure the HC emissions in the SHED for the next 60 minutes
This represented the ldquohot soakrdquo portion of the test
0
50
100
150
200
250
300
0 20 40 60 80 100 120
Co
rre
cte
d T
ota
l F
ue
l C
um
ula
tiv
e P
erm
ea
tio
n -
mg
Test Time - minutes
Running Loss and Hot SoakVehicle 204 - 1999 Honda Accord - 9 psi E0 Fuel
Test 25668
Running Loss Hot Soak
Running Loss Std =005 gmiThis Test = 0010 gmi
RL = 249 mghr
2774
2332
Tru HS = 442
1990
The ldquoTruerdquo Hot Soak
The traditional hot soak is determined from the increase in SHED emissions as measured for one
hour following a prescribed drive to heat up the vehicle (2 LA-92 cycles during the Running
Loss Test) Hot soak emissions however have two components that caused by the elevated
temperature resulting from the drive and that resulting from one hour of static permeation
Figure 12 ndash Running Loss Test Results
17
To separate these two components and determine the ldquotruerdquo hot soak emissions the following
procedure was used ldquoTraditionalrdquo hot soak emissions were first calculated by subtracting the
ldquostart of hot soakrdquo cumulative SHED hydrocarbon value (ie 199 mg t = 48 minutes) from
the final cumulative SHED hydrocarbon value (ie 2774 mg t = 108 min) This resulted in a
cumulative SHED hydrocarbon value of 78 mg for the 1 hour hot soak The previously
determined static permeation value (ie 338 mg for a 1 hour hot soak test- see Figure 9) was
then subtracted to arrive at the ldquotruerdquo hot soak value of 442 mg The increase in the permeation
rate (the ldquohot soak effectrdquo) caused by the increase in the system temperature is accounted for by
subtracting the ldquostabilized permeation raterdquo at 86degF
In Figure 12 the static permeation rate is superimposed as a solid blue line on the plot from the
starting point of the hot soak until its end (one hour) While the ldquotraditionalrdquo hot soak would be
calculated as 78 mg (277 mg ndash 199 mg) the ldquotruerdquo hot soak is determined as 442 mg (2774 mg
ndash 2332 mg) True hot soak values reported here were determined in this manner
Diurnal Test
Diurnal permeation was determined by subjecting the vehicle to a three-day period in a
temperature controlled SHED while continuously recording the total hydrocarbon every 30
seconds The SHED environmental temperature was varied from 65degF to 105degF per the
California Diurnal Test protocol Canister vent losses were isolated from permeation emissions
using the technique previously described The vehiclersquos carbon canister fresh air vent was
connected to the outside of the RL-SHED using a leak-tight PTFEreg
hose connected to a small
carbon ldquotraprdquo canister located on a top-loading precision scale The scale precision was 001
grams (10 milligrams) and it was purged before each test
DISCUSSION OF TEST RESULTS
Results
Emission results are presented below by ldquomechanism11
rdquo with the data averaged for the five
ldquoenhancedrdquo and the two ldquonear zerordquo vehicles The lone ldquopre-enhancedrdquo vehicle the 1996 Ford
Taurus (202) was a special case and will be discussed in a separate section Two of the vehicles
the 2001 Dodge Caravan (207) and the 2004 Toyota Camry (211) were also subjected to limited
testing with an ldquoimplanted leakrdquo (a 0020rdquo dia hole in a special tank gas cap) to investigate the
magnitude of a known leak These results (ldquoLeakersrdquo) follow the discussion on the Taurus
Static Permeation Rate (Constant Temperature (86degF)) - Average permeation rate compared
by fuel specification for two vehicle groups ldquoenhancedrdquo and the ldquonear zerordquo evaporative
emissions
11 The ldquomechanismsrdquo are 1 Permeation 2 Tank Venting (Daily Temperature Rise) and 3 Leaks
18
0
10
20
30
40
50
60
Co
rrecte
d P
erm
eati
on
Rate
-m
gh
r
Fuel
Static Permeation Rate - All FuelsE77-2 Program Vehicles
7 E0 9 E2010 E107 E109 E0 7 E0 9 E2010 E107 E109 E0
Enhanced(5 veh)
Near Zero(2 veh)
Figure 13 presents the static permeation rate performance for the average of the 5 ldquoenhancedrdquo
and 2 ldquonear zerordquo vehicles on the five fuels included in the test program Each group is ordered
from left to right by ethanol level The vertical scale is the average permeation rate in mghour
for the static (86degF constant temperature) test
Previous studies1213
had shown that vehicles operated on the fuel containing 10 vol- ethanol
would have higher permeation rates compared to those resulting from operation on a non-ethanol
(E0) fuel of similar properties We also expected that vehicles using higher vapor pressure fuel
would exhibit increased permeation levels at similar ethanol levels Other studies had reported
mixed results when comparing E20 permeation rates against E10 measurements ndash some were
higher and some were lower The difference may have been within the repeatability of the
measurements and probably suffered from a limited number of observations These mixed
results are present in this testing of the enhanced vehicles however the E20 (violet bar) is higher
on average for static permeation rate for the Near Zero group The data that were used to
construct the averages in Figure 13 are listed in Table 3 below There is significant variability in
the test results and the limited sample size precludes making conclusive statements with
statistical confidence
12 CRC E-653 Fuel Permeation from Automotive Systems E0 E6 E10 E20 and E85 December 2006 13
CRC E-77 Vehicle Evaporative Emission Mechanisms A Pilot Study June 2008
Figure 13 ndash Static Permeation Rate Comparison
19
Table 3
Vehicle ID Technology 7psi E0 9 psi E0 7 psi E10 10 psi E10 9 psi E20
204
1999 Honda Enhanced 129 338 664 843 553
Accord
205
2001 Toyota Enhanced 99 195 596 416 462
Corolla
207
2001 Dodge Enhanced 401 325 644 787 882
Caravan
214
2004 Ford Enhanced 252 107 239 244 168
Escape
215
2004 Toyota Enhanced 87 85 122 104 193
Highlander
194 210 453 479 452
211
2004 Toyota Near Zero 91 101 94 199 558
Camry XLE
212
2006 Ford Near Zero 09 32 218 106 47
Taurus
50 67 156 153 303
Static Permeation Rate - mghr
CRC E-77-2 Program - Static Permeation Results
Enhanced Averages
Near Zero Averages
Summary ndash Static permeation rate increased with increase in ethanol level Three of the 5
enhanced emission vehicles did not show an increase in permeation rate when tested with the 9
psi E0 compared to the 7 psi E0
20
Dynamic (Running Loss) Permeation - In a similar presentation Figure 14 shows the average
ldquoRunning Lossrdquo permeation rate for the vehicle types and the fuels tested ldquoRunning Lossrdquo
permeation as described here is the permeation measured during a ldquocold startrdquo 48 minute drive in
a Running-Loss SHED (RL-SHED) at 86degF
0
50
100
150
200
250
300
350
400
7E0 9E0 7E10 10E10 9E20 7E0 9E0 7E10 10E10 9E20
Co
rre
cte
d R
un
nin
g L
os
s P
erm
ea
tio
n -
mg
hr
Fuel
Running Loss Permeation Rate - All FuelsE77-2 Program Vehicles
Enhanced(5 vehs)
Near Zero(2 vehs)
The dynamic permeation rates for the enhanced vehicles (left panel) followed a similar pattern as
the static permeation The average of the E20 fuel was the highest of the average values
observed on both the enhanced and the near-zero vehicles (left and right panels respectively)
Table 4 below shows the data used to generate the averages used in Figure 14
Figure 14 ndash Running Loss Permeation Comparison
21
Table 4
Vehicle ID Technology 7psi E0 9 psi E0 7 psi E10 10 psi E10 9 psi E20
204
1999 Honda Enhanced 2226 2492 2879 3164 2720
Accord
205
2001 Toyota Enhanced 671 1031 2328 1916 1697
Corolla
207
2001 Dodge Enhanced 8425 8339 8122 8581 10282
Caravan
214
2004 Ford Enhanced 363 967 1057 1331 1394
Escape
215
2005 Toyota Enhanced 797 811 979 719 1025
Highlander
2496 2728 3073 3142 3424
211
2004 Toyota Near Zero 1046 837 563 1383 4106
Camry XLE
212
2006 Ford Near Zero 1845 1158 2012 1489 1168
Taurus
1446 998 1288 1436 2637
Enhanced Averages
Near Zero Averages
CRC E-77-2 Program - Running Loss Permeation Results
Running Loss Permeation Rate - mghr
Summary ndash The dynamic permeation rate (measured during vehicle operation) was higher with
the E10 fuel compared to E0 for the enhanced vehicles The E20 permeation rate was higher
than E0 and the E10 fuel The small sample size and limited data precludes us from making
statements about statistical confidence but this may indicate a trend The near zero vehicle
average increased as the ethanol level increased Trends with volatility were mixed or
inconclusive
22
Hot Soak (ldquoTrue Hot Soakrdquo) Permeation ndash The Hot Soak emissions as defined in this report
are the net increase in permeation rate following vehicle operation We measured the mass
increase in the SHED for one hour immediately following vehicle operation and subtracted the
previously measured static (or normal) permeation at the same temperature While this is not the
traditional Code of Federal Regulations (CFR) definition we feel it is appropriate for the intent
of this project
0
10
20
30
40
50
60
70
7E0 9E0 7E10 10E10 9E20 7E0 9E0 7E10 10E10 9E20
Co
rre
cte
d H
ot
So
ak
Pe
rme
ati
on
-m
gh
r
Fuel
True Hot Soak Permeation Rate - All FuelsE77-2 Program Vehicles
Enhanced(5 vehs)
Near Zero(2 vehs)
The ldquoTrue Hot Soakrdquo performance for the average of the Enhanced Vehicles is summarized in
Figure 15 above There was a large increase in the hot soak value with the E10 fuel compared to
the E0 The hot soak value with the E20 fuel was comparable to the E0 results and lower than
the E10
The Near Zero vehicles (2) had zero hot soak emissions when tested on the 10 psi E10 fuel
(Figure 16) With only two vehicles and the very low levels attained no statistically significant
conclusions can be drawn from the data available Table 5 presents the individual tests used in
calculating the average values plotted in Figure 15
Figure 15 ndash True Hot Soak Permeation Comparison
23
Table 5
Vehicle ID Technology 7psi E0 9 psi E0 7 psi E10 10 psi E10 9 psi E20
204
1999 Honda Enhanced 187 443 297 04 134
Accord
205
2001 Toyota Enhanced 00 10 719 295 603
Corolla
207
2001 Dodge Enhanced 00 58 1222 2377 00
Caravan
214
2004 Ford Enhanced 33 521 329 574 560
Escape
215
2005 Toyota Enhanced 225 251 00 16 00
Highlander
89 257 513 653 259
211
2004 Toyota Near Zero 07 153 138 00 00
Camry XLE
212
2006 Ford Near Zero 18 04 00 00 49
Taurus
13 79 69 00 25
CRC E-77-2 Program - True Hot Soak Permeation Results
True Hot Soak Permeation Rate - mghr
Near Zero Averages
Enhanced Averages
Summary - The True Hot Soak permeation (permeation rate measured following vehicle
operation less the static constant temperature permeation rate) rate was higher with the E10 fuel
compared to E0 for the enhanced vehicles The E20 permeation rate was higher than E0 and
lower than the E10 fuel The near zero vehicle trends with both ethanol content and volatility
were mixed or inconclusive The small sample size and limited data precludes us from making
statements about statistical confidence
24
Diurnal Permeation Performance ndash Figure 16 presents the diurnal permeation results for the
first day of the three-day diurnal test (65deg to 105degF)
0
200
400
600
800
1000
1200
7E0 9E0 7E10 10E10 9E20 7E0 9E0 7E10 10E10 9E20
Co
rre
cte
d F
ue
l D
iurn
al
Pe
rme
ati
on
-m
gs
da
y
Day 1 Diurnal Permeation RatesAverages from E-77-2 Vehicles
Fuel
Enhanced(5 vehs)
Near Zero(2 vehs)
The average day 1 diurnal permeation for the five Enhanced Vehicles tended to increase as
ethanol content increased (with the exception of the E20 fuel) Again sample size and limited
data makes statistical conclusions inappropriate Table 6 presents the individual test used to
generate the averages used in Figure 16 The table includes the data from days 2 and 3 The
ethanol content of the diurnal measurements was calculated and appear in a series of figures in
the Appendix starting at page 37 Unlike Figure 16 the figures shown in the appendix have not
been corrected to exclude the non-fuel emissions (methanol and refrigerant) that were present
during these tests
Figure 16 ndash Day 1 Diurnal Permeation Comparison
25
Table 6
Vehicle ID Technology 7psi E0 9 psi E0 7 psi E10 10 psi E10 9 psi E20
204 Day 1 3672 6283 12601 15479 11034
1999 Honda Enhanced Day 2 2877 5810 11652 17799 9581
Accord Day 3 2936 5770 11653 17711 9812
205 Day 1 3830 4995 17834 17941 17752
2001 Toyota Enhanced Day 2 3654 4810 17150 17309 16900
Corolla Day 3 3670 5072 15239 17417 16802
207 Day 1 3975 4064 10865 14064 15480
2001 Dodge Enhanced Day 2 3026 3373 8120 12644 13702
Caravan Day 3 2689 3080 8236 12237 13605
214 Day 1 4943 4559 5242 4920 4709
2004 Ford Enhanced Day 2 3190 3585 3974 8394 4400
Escape Day 3 2815 11017 3944 113738 7518
215 Day 1 2483 2021 2247 3192 4168
2004 Toyota Enhanced Day 2 2941 1659 2317 2602 4148
Highlander Day 3 2888 1763 2675 2370 4506
3781 4384 9758 11119 10629
211 Day 1 2071 1303 2438 3370 2840
2004 Toyota Near Zero Day 2 1002 1158 1838 2268 2218
Camry XLE Day 3 874 1006 1843 2179 2034
212 Day 1 1016 1005 1848 1243 1310
2006 Ford Near Zero Day 2 712 708 1002 879 833
Taurus Day 3 570 574 758 1028 750
1544 1154 2143 2307 2075
CRC E-77-2 Program Results - Diurnal Permeation
Diurnal Permeation Rate - mgday
Enhanced Averages
Near Zero Averages
Carbon Canister Breakthrough ndash Canister breakthrough is measured by the weight change
recorded for the trap canister outside the SHED It quantifies the amount of vapors that
overwhelm the evaporative system storage canister Figure 17 displays the breakthrough
resulting from testing of 9 psi E0 fuel Only four of seven vehicles exhibited breakthrough
60
65
70
75
80
85
90
95
100
105
110
0
5
10
15
20
25
30
35
40
0 10 20 30 40 50 60 70
SH
ED
Te
mp
era
ture
-d
eg
F
Bre
ak
thro
ug
h -
mg
Test Time - hrs
Canister Breakthrough9 psi E0 Fuel - 65ordm to 105ordm F Diurnal
204 - 1999 Honda Accord
211 - 2004 Toyota Camry
215 - 2004 Toyota Highlander
205 - 2001 Toyota Corolla
Figure 17 ndashDiurnal Canister Breakthrough
26
Table 7 shows the breakthrough generated during the diurnal tests conducted
Table 7
Vehicle ID Technology 7psi E0 9 psi E0 7 psi E10 10 psi E10 9 psi E20
204 Day 1 --- 24 --- 310 ---
1999 Honda Enhanced Day 2 --- 136 --- 360 ---
Accord Day 3 --- 198 --- 360 ---
205 Day 1 --- --- --- 204 ---
2001 Toyota Enhanced Day 2 --- --- --- 309 ---
Corolla Day 3 --- 26 --- 293 ---
207 Day 1 --- --- --- --- ---
2001 Dodge Enhanced Day 2 --- --- --- --- ---
Caravan Day 3 --- --- --- --- ---
214 Day 1 --- --- --- --- ---
2004 Ford Enhanced Day 2 --- --- --- --- ---
Escape Day 3 --- --- --- 49 ---
215 Day 1 --- --- --- --- ---
2004 Toyota Enhanced Day 2 --- 02 --- --- ---
Highlander Day 3 --- 72 --- --- ---
211 Day 1 --- --- --- --- ---
2004 Toyota Near Zero Day 2 --- 129 --- 191 ---
Camry XLE Day 3 --- 176 --- 289 ---
212 Day 1 --- --- --- --- ---
2006 Ford Near Zero Day 2 --- --- --- --- ---
Taurus Day 3 --- --- --- 204 ---
CRC E-77-2 Program - Carbon Canister Diurnal Breakthrough Results
Diurnal Breakthrough - grams
Summary ndash The lack of canister breakthrough for the 7 psi fuels (summer grade) indicates that
the storage capacity of the seven systems tested is appropriately sized Breakthrough began to
appear when testing of 9 psi E0 fuel (not summer grade) and was more prevalent with the 10 psi
E10 fuel (winter grade) The lack of breakthrough with the 9 psi E20 fuel seems to be an
anomaly
27
Overall Trend Summary - The following chart (Figure 18) visually summarizes the trends seen
from all testing performed during this program
Higher Volatility E0 to E10 E0 to E20 E10 to E20
uarr uarr uarr uarr
Higher Volatility E0 to E10 E0 to E20 E10 to E20
uarr uarr uarr uarr
Higher Volatility E0 to E10 E0 to E20 E10 to E20
uarr uarr uarr uarr
Higher Volatility E0 to E10 E0 to E20 E10 to E20
uarr uarr uarr uarr
Higher Volatility E0 to E10 E0 to E20 E10 to E20
uarrharr uarr uarr uarr
Higher Volatility E0 to E10 E0 to E20 E10 to E20
uarr uarr uarr uarr
Higher Volatility E0 to E10 E0 to E20 E10 to E20
uarr darr darr
Higher Volatility E0 to E10 E0 to E20 E10 to E20
uarr uarr uarr harr
Ethanol Content
Diurnal
Trend Analysis for E-77-2 Program
Ethanol Content
Static Permeation
Ethanol Content
Running Loss Permeation
Ethanol Content
Ethanol Content
Diurnal
Enhanced Vehicles (Sample of 5)
Static Permeation
Ethanol Content
Ethanol Content
Running Loss Permeation
Ethanol Content
True Hot Soak (TEFVO)
Near-Zero Vehicles (Sample of 2)
True Hot Soak (TEFVO)
Figure 18 Trend Analysis Summaries
28
Vehicle 202 ndash 1996 Ford Taurus - Special Case
We have treated vehicle 202 as a special case This was the oldest of the vehicles tested and had
been subjected to limited exhaust emission tests with a 20-volume percent ethanol fuel (E20)
during the CRC E-74b test program
Vehicle 202 completed the E10 portion of the test program (10 and 7 psi fuels) successfully and
completed the road preconditioning on the E0 fuel prior to the E0 evaluations The first test on
the E0 fuel was excessively high indicating a fuel leak It was traced to a leaky fuel injector o-
ring and there was considerable discussion as to an appropriate repair Tests were made on the 9
and the 7 psi E0 fuel to measure the magnitude of a vehicle in a ldquoleakrdquo condition and the tests
were labeled as ldquo202L (Leak)rdquo The fuel injector o-rings were replaced as a complete set and
the vehicle resumed testing as ldquo202Rrsquo (Repaired) A new elusive vapor leak was present later
identified as a very small leak at the top of the fuel fill pipe
The circle on Figure 19 at the right shows
the location of the small leak This leak
was problematic as to its effect on the
emission measurements because its
magnitude or presence seemed to depend
on the torque exerted on the fuel cap The
tests on the E0 fuels (9 and 7 psi) are
noted as 202R but with a vapor leak
We attempted to fix this leak and repeated
the E10 test with the vehicle re-identified
as 216 with reasonable results We also
ran the E20 test sequence and declared the
vehicle done
The testing history for this vehicle is shown in Tables 8 (Static) 9 (Dynamic) and 10 (Diurnal)
The tests highlighted in yellow are those that exhibited a liquid or vapor leak as identified during
the static test leak validation
Figure 19 ndash Vehicle 202 Fuel Fill Pipe Leak
29
Table 8
Static Permeation Results 1996 Ford Taurus SHED
Corrected Results Canister
Fuel Permeation mgday Loss
Veh psiEtOH Test Type Date Test mghr (Corrected) g
202 100E10 Static Perm 071807 7018 345 000
Press Incr 00 No Leak
Prs+Fuel Incr 00
202 70E10 Static Perm 082107 7031 223 000
Press Incr 00 No Leak
Prs+Fuel Incr 00
202L 90E0 Static Perm 030408 7169 2292 000
Press Incr DNA
Prs+Fuel Incr 4921 Liquid Leak
202L 70E0 Static Perm 032008 7183 2991 000
Press Incr DNA
Prs+Fuel Incr 19896 Liquid Leak
202R 90E0 Static Perm 050808 7228 178 000
Press Incr 136 Vapor Leak
Prs+Fuel Incr 00
202R 70E0 Static Perm 052208 7239 204 000
Press Incr 380 Vapor Leak
Prs+Fuel Incr 00
216 100E10 Static Perm 081408 7299 324 000
Press Incr 00 No Leak
Prs+Fuel Incr 00
216 70E10 Static Perm 091708 7326 325 000
Press Incr 00 No Leak
Prs+Fuel Incr 00
216 90E20 Static Perm 103008 7363 204 000
Press Incr 00 No Leak
Prs+Fuel Incr 00
30
Table 9
Dynamic Permeation Results 1996 Ford Taurus SHED
Corrected Results Canister From
Fuel Permeation mgday Loss Static
Veh psiEtOH Test Type Date Test mghr (Corrected) g Test
202 100E10 Dynamic RL 072007 25662 1278 000 No Leak
TEFVO 386 000
202L 90E0 Dynamic RL 030508 25695 3870 000 Liquid Leak
TEFVO 00 000
202L 70E0 Dynamic RL 032408 25699 7269 000 Liquid Leak
TEFVO 00 000
202R 90E0 Dynamic RL 050908 25704 1091 000 Vapor Leak
TEFVO 50 000
202R 70E0 Dynamic RL 052308 25706 787 000 Vapor Leak
TEFVO 00 000
216 100E10 Dynamic RL 081508 25718 1742 000 No Leak
TEFVO 14 000
216 70E10 Dynamic RL 091808 25721 1683 000 No Leak
TEFVO 423 000
216 90E20 Dynamic RL 110708 25730 543 000 No Leak
TEFVO 00 000
31
Table 10
Diurnal Permeation Results 1996 Ford Taurus SHED
Corrected Results Canister From
Fuel Permeation mgday Loss Static
Veh psiEtOH Test Type Date Test mghr (Corrected) g Test
202 100E10 72 DHB 65-105 073107 7023
Day 1 10429 612 No Leak
Day 2 7069 3264
Day 3 7043 3869
202 70E10 72 DHB 65-105 082807 7034
Day 1 6278 000 No Leak
Day 2 5065 000
Day 3 4535 000
202L 90E0 72 DHB 65-105 031108 7173
Day 1 22589 000 Liquid Leak
Day 2 32310 000
Day 3 23069 1260
202L 70E0 72 DHB 65-105 040108 7196
Day 1 47425 000 Liquid Leak
Day 2 44517 000
Day 3 31798 000
202R 90E0 72 DHB 65-105 051308 7230
Day 1 3270 000 Vapor Leak
Day 2 2667 000
Day 3 2746 1083
202R 70E0 72 DHB 65-105 052808 7243
Day 1 2117 000 Vapor Leak
Day 2 2208 000
Day 3 2081 000
216 100E10 72 DHB 65-105 082008 7305
Day 1 25907 5777 No Leak
Day 2 34779 6299
Day 3 36014 6343
216 70E10 72 DHB 65-105 092308 7331
Day 1 3975 022 No Leak
Day 2 3550 006
Day 3 3621 037
216 90E20 72 DHB 65-105 111108 7373
Day 1 4685 000 No Leak
Day 2 4526 000
Day 3 4198 000
32
The Implanted Leak Test Results
Project E-77-2 included evaluating two vehicles with implanted leaks This interest followed the
information gathered in the Pilot Study where tests were run with a specially modified fuel cap
containing a 002rdquo dia hole The results with the implanted leak from the Pilot Study are
repeated in Table 11 below as the diurnal results are shown for a 1996 Chevrolet Cavalier first
without the implanted leak at 038 grams per day and then at 207 grams per day (a 54x
increase) with the leak
Table 11
Veh No
Evap
Tech Fuel
Results
gmsday
gms
Increase
6 1996 Chevrolet Cavalier Enhanced 7 psi E0 038
7 2070 2032
207 2001 Dodge Caravan Enhanced 7 psi E10 109
207L 213 104
211 2004 Toyota Camry LE Near Zero 7 psi E10 024
211L 068 044
- Implanted 020 leak in fuel cap
Vehicle Description
Implanted Leak Impact on Diurnal PermeationDay One Results 65deg - 105degF Diurnal
The two E-77-2 vehicles (207 amp 211) were given a limited evaluation with an induced leak and
saw a significantly lesser impact Vehicle 207 gave diurnal results increases from 109 to 213
grams per day (a 2x increase) and Vehicle 211 increased from 024 grams per day to 068 grams
per day (a 28x increase) The following Figure 20 displays the imbedded leak impact from Table
11
33
0
5
10
15
20
On
e D
ay
Diu
rna
l P
erm
ea
tio
n -
gm
sd
ay
Vehicle Number
Implanted Leak Impact on One Day Diurnal Permeation020 Leak in Fuel Cap - 65 to 105 F Diurnal
207L 211L21120776
As Received - No Leak
020 Fuel Cap Leak
The newer vehicles evaluated in this phase of the study were configured and certified to the
Onboard Refueling Vapor Regulations (ORVR) These are capable of containing 95 or more
control of the refueling vapors at up to 10 gallons per minute fueling rate Where the Chevrolet
Cavalier had a small (0055rdquo dia) orifice and a long vapor tube venting the tankrsquos vapor space to
the carbon canister (and then to the atmosphere) the ORVR compliant vehicles have a large
(0688rdquo ID) short vent hose to a low flow restriction carbon canister
The following bar charts (Figures 21 through 24) show the impacts of the leak on all phases of
the evaporative testing performed and compare those results with all fuels tested With only two
vehicles (207 and 211) evaluated on two fuels statistically significant effects cannot be
quantified but the trend of increased emissions is apparent
Figure 20 ndash Implanted Leak Impact
34
0
20
40
60
80
100
120
140
160
7E0 9E0 7E10 10E10 9E20 7E0 9E0 7E10 10E10 9E20
Sta
tic
Pe
rme
ati
on
-m
gh
r
Fuel
0020 dia Induced Leak EffectStatic Permeation
Vehicle 211Vehicle 207
Leak
Leak
0
200
400
600
800
1000
1200
7E0 9E0 7E10 10E10 9E20 7E0 9E0 7E10 10E10 9E20
Ru
nn
ing
Lo
ss
Pe
rme
ati
on
-m
gh
r
Fuel
0020 dia Induced Leak EffectRunning Loss Permeation
Vehicle 211Vehicle 207
Leak
Leak
Figure 21 ndash Vehicles 207 and 211 with Induced Leak - Static
Figure 22 ndash Vehicles 207 and 211with Induced Leak ndash Running Loss
35
0
100
200
300
400
500
600
700
7E0 9E0 7E10 10E10 9E20 7E0 9E0 7E10 10E10 9E20
Tru
e H
ot S
oa
k P
erm
ea
tio
n -
mg
hr
Fuel
0020 dia Induced Leak EffectTrue Hot Soak Permeation
Vehicle 211Vehicle 207
Leak
Leak
0
500
1000
1500
2000
2500
7E0 9E0 7E10 10E10 9E20 7E0 9E0 7E10 10E10 9E20
Da
y 1
Diu
rna
l P
erm
ea
tio
n -
mg
da
y
Fuel
0020 dia Induced Leak EffectDay 1 Diurnal Permeation
Vehicle 211Vehicle 207
Leak
Leak
Figure 24 ndash Vehicles 207 and 211 with Induced Leak - Diurnal
Figure 23 ndash Vehicles 207 and 211 with Induced Leak ndash True Hot Soak
36
Summary of Findings and Results
The E-77-2 test program was a continuation of the previously published E-77 test project and
added eight vehicles tested on five fuels to the knowledge base The permeation trends
previously shown were again present The small sample size and limited number of tests
preclude making statements about statistical validity but in general
o The newer vehicle groups had lower emissions
o Adding ethanol to the fuel increased permeation over the non-oxygenated levels
o Increased volatility increased permeation levels
o SHED emission rates must be corrected for the ethanol error in the FID and the
non-fuel methanol and refrigerant in the measurement
As this test program evolved and additional experience was gathered two program modifications
were made 1) The leak validation methodology was changed and 2) a different metric and
definition of the ldquoHot Soakrdquo was adopted
The leak validation portion of the static permeation test was found to be very sensitive and when
the data was corrected on a minute-by-minute basis for ethanol methanol and refrigerant the
change in apparent permeation rate was due as much to variation as to leaks See the discussion
starting at page 12 for the details of the development
Concern for and recognition of ldquoHot Soakrdquo emissions started in the original evaporative emission
regulations Carburetors had float bowls with ~ 50 ml of fuel that absorbed the latent engine heat
after the vehicle was shut down after operation The heat would cause the bowl temperature to
increase driving fuel vapors out through vents and leak paths to the atmosphere after vehicle
operation Todayrsquos fuel injection engines do not have the open bowls and the emission rates
following vehicle operation are mainly increased temperature permeation We recommended
and adopted a new name for the ldquotemporary emissions following vehicle operationrdquo (TEFVO)
which subtracts the basic permeation rate from the measured emissions See the discussion
starting at page 16 for details
37
Appendix
Acknowledgements
E-77-2 Steering Committee
David Brzezinski EPA
Kevin Cullen GM Powertrain
Dominic DiCicco Ford Motor Company
King D Eng Shell Global Solutions
Ben Hancock CARB
Constance Hart EPA
Phil Heirigs Chevron Global Downstream
Jeff Jetter Honda RampD Americas
Keith KnollNREL
John Koupal EPA
David H Lax API
Jeff Long CARB
Hector Maldonado CARB
Mani Natarajan Marathon Oil Company
David N Patterson Mitsubishi Motors RampD Americas
Jenny Sigelko Chrysler
James P UihleinChevron Global Downstream
Marie Valentine Toyota Technical Center
Kenneth J Wright ConocoPhillips
CRC Members
Brent Bailey CRC
Chris Tennant CRC
Jane Beck CRC
38
Table 12
E0 E10 E20
Inspection Units Fuel 6 Fuel 7 Fuel 4
API Gravity degAPI 602 585 570
Relative Density 6060degF 07382 07447 07508
DVPE psi 701 730 849
Oxygenates--D4815
MTBE vol 000 000 000
ETBE vol 000 000 000
EtOH vol 000 954 2034
O2 wt 000 353 747
Hydrocarbon Composition
Aromatics vol 221 244 108
Olefins vol 80 88 55
Saturates vol 700 573 234
D86 Distillation
IBP degF 974 1040 1022
5 Evaporated degF 1316 1280 1252
10 Evaporated degF 1423 1330 1314
20 Evaporated degF 1564 1410 1413
30 Evaporated degF 1704 1450 1486
40 Evaporated degF 1840 1530 1547
50 Evaporated degF 1975 1950 1596
60 Evaporated degF 2120 2190 1636
70 Evaporated degF 2305 2410 2274
80 Evaporated degF 2588 2710 2695
90 Evaporated degF 3139 3170 3139
95 Evaporated degF 3322 3300 3255
EP degF 3603 3600 3406
Recovery vol 978 978 983
Residue vol 13 10 10
Loss vol 09 12 07
Driveability Index 11199 11015 9898
Data from CRC E-74
CRC E-77-2 Fuel Inspection Results
39
Fuel Units Fuel 6 Fuel 7 Fuel 4
Sulfur Content ppm 29 27 27
Estimated CH Ratio 62090 63323 63252
Est Net Heat of Combustion btulb 18573 18514 18513
Benzene vol 090 100 096
Research Octane Number 932 940 946
Motor Octane Number 838 838 834
(R+M)2 885 889 890
Fuel Units Fuel 6 Fuel 7 Fuel 4
Aromatics vol 2386 2481 2178
Olefins vol 752 892 1074
Saturates vol 6743 5621 4623
Unclassified vol 115 086 015
Ethanol vol 000 920 2111
Benzene vol 089 106 097
CH Ratio 6200 6092 5835
Oxygen wt 0008 1 340 773
Net Heat of Combustion btulb 18703 18016 17160
1 Contains 004 vol MTBE
Fuel Units Fuel 6 Fuel 7 Fuel 4
Oxygen wt 0008 3396 7733
C+H wt 9999 9660 9227
H wt 1389 1362 1350
C wt 8610 8298 7877
Fuel Units 6 7 4
Haltermann D3338 Btulb 18573 18514 18513
Average D3338 Btulb 18579 18514 18491
Oxygen Corrected D3338 Btulb 18579 17860 17103
DHA Btulb 18703 18016 17160
Table 12 (cont)
Suppliers Additional Inspections
Net Heat of Combusion -- Btulb
Carbon Hydrogen and Oxygen
Detailed Hydrocarbon Analysis
40
Vehicle Day 1 Day 2 Day 3
No Fuel Base + Press + Pump RL True HS Perm (Brkthru) Perm (Brkthru) Perm (Brkthru)
E10 - 10 psi 345 --- --- 1278 503 10429 (63) 7069 (348) 7043 (425)
E10 - 7 psi 223 --- --- 994 113 6278 (00) 5065 (00) 4535 (00)
E0 - 9 psi 2229 --- 4921 3870 00 22580 (00) 32310 (00) 23069 (126)
E0 - 7 psi 2991 --- 19896 7269 00 47425 (00) 44517 (00) 31798 (00)
E10 - 10 psi 843 --- --- 3164 04 15479 (310) 17799 (383) 17711 (419)
E10 - 7 psi 664 --- --- 2879 297 12601 (00) 11652 (00) 11653 (00)
E0 - 9 psi 338 --- --- 2492 443 6283 (24) 5810 (136) 5770 (225)
E0 - 7 psi 129 --- --- 2226 187 3672 (00) 2877 (00) 2936 (00)
E20 - 9 psi 553 --- --- 2720 134 11034 (00) 9581 (00) 9812 (00)
E10 - 10 psi 416 --- --- 1916 295 17941 (204) 17309 (346) 17417 (375)
E10 - 7 psi 596 --- --- 2328 719 17834 (00) 17150 (00) 15239 (00)
E0 - 9 psi 195 --- --- 1031 10 4995 (00) 4810 (00) 5072 (26)
E0 - 7 psi 99 --- --- 671 00 3830 (00) 3654 (00) 3670 (00)
E20 - 9 psi 462 --- --- 1697 603 17752 (00) 16900 (00) 16802 (00)
E10 - 10 psi 787 --- --- 8581 2377 14064 (00) 12644 (00) 12237 (00)
E10 - 7 psi 644 --- --- 8122 1222 10865 (00) 8120 (00) 8236 (00)
E0 - 9 psi 325 --- --- 8339 58 4064 (00) 3373 (00) 3080 (00)
E0 - 7 psi 401 --- --- 8425 00 3975 (00) 3026 (00) 2689 (00)
E20 - 9 psi 882 --- --- 10282 00 15480 (00) 13702 (00) 13605 (00)
E10 - 10 psi 976 --- 1209 10012 3929 16449 (00) NA NA
E10 - 7 psi 1468 --- --- 11393 5850 21342 (00) NA NA
E10 - 10 psi 199 --- --- 1383 00 3370 (00) 2268 (191) 2179 (330)
E10 - 7 psi 94 266 --- 563 138 2438 (00) 1838 (00) 1843 (00)
E0 - 9 psi 101 --- --- 837 153 1303 (00) 1158 (129) 1006 (221)
E0 - 7 psi 91 --- --- 1046 07 2071 (00) 1002 (00) 874 (00)
E20 - 9 psi 558 --- --- 4106 00 2840 (00) 2218 (00) 2034 (00)
E10 - 10 psi 551 --- 821 3024 2450 25454 (040) NA NA
E10 - 7 psi 481 --- 1664 2511 62 6783 (00) NA NA
E10 - 10 psi 106 --- --- 1489 00 1243 (00) 879 (00) 1028 (200)
E10 - 7 psi 218 --- --- 2012 00 1848 (00) 1002 (00) 758 (00)
E0 - 9 psi 32 --- --- 1158 04 1005 (00) 708 (00) 574 (00)
E0 - 7 psi 09 --- --- 1845 18 1016 (00) 712 (00) 570 (00)
E20 - 9 psi 47 --- --- 1168 49 1310 (00) 833 (00) 750 (00)
E10 - 10 psi 244 --- --- 1331 574 4920 (00) 8394 (00) 113738 (49)
E10 - 7 psi 239 --- --- 1057 329 5242 (00) 3974 (00) 3944 (00)
E0 - 9 psi 107 --- --- 967 521 4559 (00) 3585 (00) 11017 (00)
E0 - 7 psi 252 --- --- 363 33 4943 (00) 3190 (00) 2815 (00)
E20 - 9 psi 168 --- --- 1394 560 4709 (00) 4400 (00) 7518 (00)
E10 - 10 psi 104 90 --- 719 16 3192 (00) 2602 (00) 2370 (00)
E10 - 7 psi 122 --- --- 979 00 2247 (00) 2317 (00) 2675 (00)
E0 - 9 psi 85 --- --- 811 251 2021 (00) 1659 (2) 1763 (72)
E0 - 7 psi 87 --- --- 797 225 2483 (00) 2941 (00) 2888 (00)
E20 - 9 psi 193 --- --- 1025 00 4168 (00) 4148 (00) 4506 (00)
E10 - 10 psi 324 --- --- 1742 118 25907 (578) 34779 (630) 36014 (643)
E10 - 7 psi 325 --- --- 1683 192 3975 (02) 3550 (01) 3621 (04)
E0 - 9 psi 178 136 --- 1091 254 3270 (00) 2667 (00) 2746 (108)
E0 - 7 psi 204 380 --- 787 00 2117 (00) 2208 (00) 2081 (00)
E20 - 9 psi 204 --- --- 543 74 4685 (00) 4526 (00) 4198 (00)
216
211
2004
Toyota
Camry
XLE
215
2004
Toyota
High-
lander
212
2006
Ford
Taurus
214
2004
Ford
Escape
211L
207L
Static Permeation - mghr Dynamic Perm - mghr
CRC E-77-2 Program Test Results
Diurnal (65ordm to 105ordm) - mgday
202
1996
Taurus
205
2001
Toyota
Corolla
204
1999
Honda
Accord
207
2001
Dodge
Caravan
202L
Table 13
41
Individual Vehicle Diurnal Performance on the Various Fuels
0
1000
2000
3000
4000
5000
6000
0 10 20 30 40 50 60 70
Cu
mu
lati
ve
Pe
rme
ati
on
-m
g
Test Time - hrs
Three Day DiurnalVehicle 204 1999 Honda Accord
10 psi E10
7 psi E10
9 psi E0
7 psi E0
9 psi E20
0
1000
2000
3000
4000
5000
6000
0 10 20 30 40 50 60 70
Cu
mu
lati
ve
Pe
rme
ati
on
-m
g
Test Time - hrs
Three Day DiurnalVehicle 205 - 2001 Toyota Corolla
10 psi E10
7 psi E10
9 psi E0
7 psi E0
9 psi E20
Figure 25 ndash Vehicle 204 Diurnal Performance
Figure 26 ndash Vehicle 205 Diurnal Performance
42
0
500
1000
1500
2000
2500
3000
3500
4000
4500
5000
0 10 20 30 40 50 60 70
Cu
mu
lati
ve
Co
rre
cte
d P
erm
ea
tio
n -
mg
Test Time - hrs
Three Day DiurnalVehicle 207 - 2001 Dodge Caravan
10 psi E10
7 psi E10
9 psi E0
7 psi E0
9 psi E20
0
100
200
300
400
500
600
700
800
900
0 10 20 30 40 50 60 70
Cu
mu
lati
ve
Pe
rme
ati
on
-m
g
Test Time - hrs
Three Day DiurnalVehicle 211 - 2004 Toyota Camry XLE
10 psi E10
7 psi E10
9 psi E0
7 psi E0
9 psi E20
Figure 27 ndash Vehicle 207 Diurnal Performance
Figure 28 ndash Vehicle 211 Diurnal Performance
43
0
50
100
150
200
250
300
350
400
450
500
0 10 20 30 40 50 60 70
Cu
mu
lati
ve
Pe
rme
ati
on
-m
g
Test Time - hrs
Three Day DiurnalVehicle 212 - 2006 Ford Taurus
10 psi E10
7 psi E10
9 psi E0
7 psi E0
9 psi E20
0
500
1000
1500
2000
2500
3000
3500
4000
4500
5000
0 10 20 30 40 50 60 70
Cu
mu
lati
ve
Pe
rme
ati
on
-m
g
Test Time - hrs
Three Day DiurnalVehicle 214 2004 Ford Escape
10 psi E10
7 psi E10
9 psi E0
7 psi E0
9 psi E20
Note The incomplete cumulative results for the 10 psi E10 results resulted from a conflict for the use
of the INNOVA analyzer during the test The INNOVA analyzer is required to correct for the FIDrsquos
ethanol error and the presence of methanol and refrigerant (R-134a) The data was available for the
50+ hour results and the data is valid as shown We have no explanation for the high levels
experienced on the third day of the test No test errors were identified
Figure 29 ndash Vehicle 212 Diurnal Performance
Figure 30 ndash Vehicle 214 Diurnal Performance
44
0
200
400
600
800
1000
1200
1400
1600
0 10 20 30 40 50 60 70
Cu
mu
lati
ve
Pe
rme
ati
on
-m
g
Test Time - hrs
Three Day DiurnalVehicle 215 2004 Toyota Highlander
10 psi E10
7 psi E10
9 psi E0
7 psi E0
9 psi E20
Figure 31 ndash Vehicle 215 Diurnal Performance
45
Table 14
Test Corrected
Vehicle Fuel Total Fuel EtOH R134a Methanol
204 10 psi E10 509899 144040 18298 16754
1999 Honda 7 psi E10 359057 130806 17551 15221
Accord 9 psi E0 178635 13843 18230 9896
7 psi E0 94846 1856 16631 2379
9 psi E20 304271 128408 18261 12143
205 10 psi E10 526659 186599 23354 20895
2001 Toyota 7 psi E10 502229 204246 25990 19198
Corolla 9 psi E0 148775 000 20434 4613
7 psi E0 111536 5489 22408 5619
9 psi E20 514540 212708 25677 19584
207 10 psi E10 389450 196248 12013 30399
2001 Dodge 7 psi E10 272201 114027 11731 19616
Caravan 9 psi E0 105167 1820 12224 15284
7 psi E0 96906 1118 22141 14276
9 psi E20 427882 241488 14268 25432
211 10 psi E10 78164 19733 15159 46970
2004 Toyota 7 psi E10 61190 20211 15929 46525
Camry LE 9 psi E0 34668 1681 14329 42659
7 psi E0 39468 000 16197 57303
9 psi E20 71013 26726 16213 36879
212 10 psi E10 31508 7222 14831 7896
2006 Ford 7 psi E10 36079 10132 15481 3400
Taurus 9 psi E0 22870 2409 15182 3761
7 psi E0 22973 000 15393 4362
9 psi E20 28935 11156 14116 2629
214 10 psi E10 1257887 000 19947 27992
2004 Ford 7 psi E10 131593 24571 16025 8879
Escape 9 psi E0 191611 2940 16487 7213
7 psi E0 109481 5386 80650 3106
9 psi E20 166271 24097 14491 6096
215 10 psi E10 81644 12178 14658 42609
2004 Toyota 7 psi E10 72399 15092 15532 36061
Highlander 9 psi E0 54431 000 14806 25822
7 psi E0 83115 000 14072 26255
9 psi E20 128223 38822 12841 34420
3 Day Diurnal Results
CRC E77-2 Program Diurnal ResultsAll values are in mg
46
0
200
400
600
800
1000
1200
1400
1600
1800
2000
Co
rrecte
d D
aily D
iurn
al
-m
g
Diurnal Ethanol PortionVehicle 204 - 1999 Honda Accord
Ethanol Portion
10 psi E10 9 psi E07 psi E10
1 32
315
341368
383
264273
1 321 321 321 32
9 psi E207 psi E0
1122097
39
0510
442
405412
Figure 32 ndash Vehicle 204 Diurnal Ethanol Portion
0
200
400
600
800
1000
1200
1400
1600
1800
2000
Co
rrecte
d D
aily D
iurn
al
-m
g
Diurnal Ethanol PortionVehicle 205 - 2001 Toyota Corolla
Ethanol Portion
10 psi E10 9 psi E07 psi E10
1 32
359
406
382
431355349
1 321 321 321 32
9 psi E207 psi E0
0 00
712649
406
420414
Figure 33 ndash Vehicle 205 Diurnal Ethanol Portion
47
0
200
400
600
800
1000
1200
1400
1600C
orr
ecte
d D
aily D
iurn
al
-m
g
Diurnal Ethanol PortionVehicle 207 - 2001 Dodge Caravan
Ethanol Portion
10 psi E10 9 psi E07 psi E10
1 32
488
442408
409
490535
1 321 321 321 32
9 psi E207 psi E0
00
1144
27
0101
556
587552
Figure 34 ndash Vehicle 207 Diurnal Ethanol Portion
0
50
100
150
200
250
300
350
400
Co
rrecte
d D
aily D
iurn
al
-m
g
Diurnal Ethanol PortionVehicle 211 - 2004 Toyota Camry XLE
Ethanol Portion
10 psi E10 9 psi E07 psi E10
1 32
264
242245
1 321 321 321 32
9 psi E207 psi E0
329
306356
00
73
64
00
00
00
325
431
370
Figure 35 ndash Vehicle 211 Diurnal Ethanol Portion
48
0
20
40
60
80
100
120
140
160
180
200C
orr
ecte
d D
aily D
iurn
al
-m
g
Diurnal Ethanol PortionVehicle 212 - 2006 Ford Taurus
Ethanol Portion
10 psi E10 9 psi E07 psi E10
1 32
216
170
316
1 321 321 321 32
9 psi E207 psi E0
194
288
436 102
105
85
00
00
00476
529
243
Figure 36 ndash Vehicle 212 Diurnal Ethanol Portion
0
200
400
600
800
1000
1200
Co
rrecte
d D
aily D
iurn
al
-m
g
Diurnal Ethanol PortionVehicle 214 - 2004 Ford Escape
Ethanol Portion
10 psi E10 9 psi E07 psi E10
1 32
00
1 321 321 321 32
9 psi E207 psi E0
201
202152
38
05
19
56
1469
103
171188
143
67
11275
Figure 37 ndash Vehicle 214 Diurnal Ethanol Portion
49
0
50
100
150
200
250
300
350
400
450
500C
orr
ecte
d D
aily D
iurn
al
-m
g
Diurnal Ethanol PortionVehicle 215 - 2004 Toyota Highlander
Ethanol Portion
10 psi E10 9 psi E07 psi E10
1 32
121
136
196
1 321 321 321 32
9 psi E207 psi E0
198
217213
0000
00
0000
00
335 292
283
Figure 38 ndash Vehicle 215 Diurnal Ethanol Portion

4
Test Fuels
The fuel comparisons selected for this project were three levels of ethanol content with volatility
varied as listed in Table 2 below
Table 2
Test Fuel Target Values
7 psi 9 psi 10 psi
E0 X X
E10 X X
E20 X
CRC had fuels remaining from Project E-74 in quantities sufficient to conduct this program eg
7 psi E0 and E10 and 9 psi E203 Inspection records of the base fuels are repeated in the
Appendix using their E-74b identifications fuels 6 7 and 4 respectively The nominal 7 psi
fuels both E0 and E10 were locally blended with commercial butane to make the higher
volatility 9 psi E0 and the 10 psi E10 The blends were done in drum batches approximately 50
gallons at a time by adding small amounts of butane circulating for a brief period then
sampling and determining the new volatility with a ldquoGrabner4rdquo instrument using test procedures
described in ASTM D 5191 The higher (10 instead of 9) volatility of the E10 fuel was specified
because many localities permit ldquosplash blendingrdquo of ethanol to gasoline and allow a 1 psi
volatility exemption for their vapor pressure limits
Adaption Period for Test Fuel Change
Many areas of the United States were required5 to use an oxygenated fuel to improve vehicle
emissions especially during the summer season While MTBE was the most common
oxygenate ethanol was also used CRC Project E-65 demonstrated that the permeation of
vehicle fuel systems increased with the use of fuels containing ethanol compared to fuels with
MTBE or no oxygenate CRC Project E-65 also demonstrated that if ethanol had been
previously used and the fuel replaced with a non-ethanol blend it could take two to four weeks
for the ethanol increase to dissipate
The protocols adopted for this test program were to require a minimum of four weeks of vehicle
exposure to a new fuel when first introducing 10 or 20 volume percent ethanol to the vehicle and
the same period of time when moving to an ethanol-free (E0) fuel Note when changing RVP
only a one week exposure has been demonstrated as sufficient
3 While the E20 target was 9 psi the average inspection value (5 labs) was 85 psi The sponsor chose to continue
the test at this level
4 wwwgrabner-instrumentscom MINIVAP VPS VPSH Vapor Pressure Tester The portable MINIVAP VPS
and VPSH vapor pressure testers are the worldwide accepted standard instruments for determination of the vapor
pressure of gasoline according to ASTM D 5191 ASTM D 6377 ASTM D 6378 and EN 13016 1+2
5 The requirement for oxygen content in RFG fuels was removed by EPA in May of 2005 as directed by the
Energy Policy Act of 2005 The Renewable Fuels Standard requiring renewable fuels (eg ethanol) in increasing
amounts over the years replaces the mandate
5
The Test Concept Measuring Leaks Permeation and Diurnal Vapor Losses
Mass emissions are measured in a VT SHED or Variable Temperature Sealed Housing for
Evaporative Determination The SHED test method
combines all three emission mechanisms (leaks
diurnal venting and permeation) into a single test
result
The SHED technique involves placing the vehicle in
a sealed enclosure (Figure 2) and calculating the
mass in the enclosure from the volume density and
concentration in the enclosure at the start and end of
a time period The difference between the mass at
the start and end of test is the emission rate eg
grams per unit time
CRCrsquos E-77 emission test programs have
developed (and strive to continually improve)
new methodologies for understanding and quantifying vehicle evaporative emission rates The
concept partitions and assigns the vehiclersquos contribution to the evaporative emission inventory
into three mechanisms
1 Permeation
2 Tank vapor venting
3 Leaks (with two subsets - Liquid and Vapor)
Permeation is the migration of HC through the various elastomers (polymers) in a vehicle fuel
system6 Previous testing has shown that permeation rate is strongly affected by the materialrsquos
temperature doubling for each 10ordmC (18ordmF) increase in the range of normal summer
temperatures It is also strongly affected by gasoline composition especially with ethanol-
containing fuels
6 ldquoFuel Permeation from Automotive Systems Final Report CRC Project E-65rdquo Haskew Liberty and McClement
September 2004 available on the CRC and California Air Resources Board websites
Figure 2 ndash Sealed Housing for Evaporative
Determination
6
Tank vapor venting emissions are controlled by fitting a carbon canister to the atmospheric tank
vent Figure 3 is a schematic of a typical early control system During a daily heating period the
temperature of the vehiclersquos fuel tank increases forcing HC vapors from the tank Excess
emissions exceeding the carbon canisterrsquos capacity are vented to the atmosphere
Figure 3 - Control System Schematic
Leaks can be liquid or vapor Permeation and tank venting losses are strongly driven by fuel
composition ambient temperature and ambient temperature change Liquid leaks are not
strongly affected by normal summer temperatures and are thought to have two components
1 Static leaks occurring while the engine is turned off and the vehicle is stationary
2 Increase in leak rate caused by the system pressure increase during engine operation
A Test Method for Separating Permeation from Tank Venting and Leaks ndash In a previous
CRC Project (E-65) the canister loss was separated from the permeation measurement by
venting the losses from the carbon canister outside
the SHED For Project E-77 the canister vent
losses were collected and measured in a separate
ldquotrap canisterrdquo on a scale outside the SHED as
shown in Figure 4 This vent line was capped off
(ie sealed during the Static Test) but connected
as shown in the figure for the Dynamic and the
Diurnal Test The ambient temperature in the
SHED was constant during the static test and
there was no vapor created at constant
temperature
Figure 4 - Trap Canister
7
This vent was closed to pressurize the system for the leak evaluations The resulting SHED
increase in HC mass was permeation7 The last mechanism that needed to be evaluated was
leaks Leaks can be both vapor and liquid A liquid leak can have significant mass currently
undetected by the vehiclersquos on-board diagnostic system Considerable thought and effort have
gone into the creation of a simple and effective liquid leak detection methodology without
success The techniques used in this project required the use of a SHED for measurements The
techniques were not simple but they proved effective
Based on experience a vehiclersquos permeation rate is expected to be between the range of 4 to 90
mghour at the 86degF test temperature The presence of a static liquid leak is expected to
overwhelm this value such a leak would (or could) be apparent by inspection Leaks from the
vehicles were quantified in a three-step test process The first step was to measure the static
permeation rate of the vehicle at 86ordmF The vehicle was allowed to stabilize overnight at 86ordmF in
the SHED and the permeation rate was calculated from the mass increase in the SHED during a
one-hour measurement period The second part of the test looking for pressure driven leaks in
the vapor system was performed by pressurizing the vehiclersquos tank to 5rdquo H2O through a special
fuel cap and tubing from outside the SHED (Figure 5) The special fuel cap the hose and the
pressurization apparatus were installed before the start of the sequence The HC concentration in
the SHED was monitored and the increase in the mass of HC in the SHED during the 30-minute
pressurization period compared to the static permeation rate If there was no (or insignificant)
rate of increase it was deduced that no vapor leak was present
The third and final part of the test was to energize the vehiclersquos fuel pump and pressurize the
system up to and including the injectors (Figure 6) If there were a pressure leak in the liquid
system an increase in the SHED mass over the 30-minute measurement period would be seen
ie the leak would be additive to the permeation rate
6 This is a simplification There are other HC sources present that are not fuel permeation These include tire paint
adhesives and vinyl emissions and the possibility of fuel leaks from the fuel injectors We believe these to be a
minor component of the emissions measured in this study
Figure 5 - Static Test ndash Tank Pressurization
8
Figure 6 ndash Static Test ndash Fuel Pump Energized
Other Tests (Dynamic Hot Soak and Diurnal) - A similar configuration is used to isolate the
tank venting losses from the permeation measurements determined by other test procedures The
vehiclersquos canister vent is connected with a low permeation hose (Teflontrade) to a bulk-head fitting
in the SHED wall and then to a separate ldquotrap canisterrdquo on a top-loading scale Any HC
emissions that escape from the vehiclersquos canister are captured in the trap canister and measured
at a 001 g (10 milligram) precision The trap canister (a 1 Liter Ford model) is purged before
each test and maintained at a ldquodryrdquo condition so that it captures all of the vehiclersquos escaping
emissions This assumption is probably violated during the high volatility tests where there are
30 grams of daily emissions but this is not a concern at this time
Test Elements for E-77-2 - The following flow chart (Figure 7) displays the various elements
utilized during the testing of the various vehicles and fuels during this program Details of each
of the four basic tests follow the flow chart
9
Drain and 40 Fill
with 10 psi E10 Test Fuel
Road Preconditioning
Four LA-4rsquos or Equivalent
Drain and 40 Fill
with 10psi E10 Test Fuel
Overnight Park at 86degF
Move to SHED
Connect Test Instrumentation
Stabilize at 86degF
Perform Constant Temperature
Permeation Series (86degF)
1 hour Permeation Rate Test
frac12 hour Tank Pressurized Test
frac12 hour Pump Energized Test
Transfer to RL SHED
Connect Test Instrumentation
Stabilize at 86degF
Perform Dynamic Permeation Test
Two LA92 Driving Cycles amp
One Hour Hot Soak
Drain and 40 Fill
With 10 psi E10 Test Fuel
Road Preconditioning
Four LA-4rsquos or Equivalent
Move to VT-SHED
Connect Test Instrumentation
Stabilize at 65degF for 6 hrs Minimum
Perform 3-Day Diurnal Evaluation
72 hr 65deg to 105degF VT Test
Drain and 40 Fill
with 7 psi E10 Test Fuel
Condition Fuel System
By Driving for One Week
Repeat Steps 1 ndash 12
On 7 psi E10 Test Fuel
Drain and Fill with 9 psi E0 Test Fuel
Condition Fuel System by 4 weeks Driving
Repeat Steps 1 ndash 12
On 9 and 7 psi E0 and
Repeat Steps 0-12
On 9 psi E20 Test Fuels
Precondition Fuel System
With 4 Weeks Driving on
10 psi E10 Test Fuel
1
2
3
4
5
6
7
8
9
10
11
12
0
Figure 7 ndash Testing Flow Chart
10
Test Procedures ndash There are four basic tests in the E-77-2 test protocol
1 Static Permeation Rate (includes checks for vapor and liquid leaks)
2 Running Emissions (Dynamic Test)
3 Hot Soak
4 Diurnal
Each is described in detail below
1 Static Permeation Rate Testing
The constant temperature (static) permeation rate is measured in a traditional SHED (Constant
temperature) in the following manner
A The fuel tank is drained and filled to 40 tank capacity with the test fuel
B The day before testing the vehicle is driven over four road trips of 75 miles each
to precondition the canister8 (These drives are similar to the LA-4)
C Upon return from the road pre-conditioning the fuel tank is drained and filled to
40 tank capacity with the test fuel9
D Vehicle is parked for 18-22 hours in a controlled temperature environment at test
temperature (86ordmF)
E The vehicle is then moved (without starting) into the test (86ordmF) SHED
F The canister vent is connected to the SHED bulkhead fitting which routes the
vapor to the trap canister outside the SHED
G The tank system pressurization hose is connected
H The fuel pump electrical connection is connected
I The SHED is sealed the inside temperature is allowed to stabilize and the test is
started Continuous THC measurements are made using a FID Ethanol
methanol and R134a concentrations are measured using an INNOVA analyzer
All measurements are made at least every minute for one hour to determine the
stabilized permeation rate
J At the end of the static test (60 minutes) the vehiclersquos vapor system is pressurized
to 5 inches of water for thirty minutes Measurements are made to quantify vapor
leaks as determined by a change in the THC in the SHED
K The fuel pump is then energized for 30 minutes while maintaining the 5 inches of
water on the vapor system Liquid leaks are quantified as determined by a change
in the concentration of THC in the SHED
The purpose of steps J and K above is to validate that the permeation rate measurement was
made without the presence of any leak ndash either liquid or vapor A detailed discussion follows
starting at page 12
8 This conditioning can be done in the laboratory on a chassis dynamometer if proper attention is paid to underbody
cooling and unrepresentative fuel tank temperatures are avoided 9 Vehicles with ORVR systems will add the refueling vapors to the canister This is OK
11
2 Running Loss Test (Dynamic Test)
A The vehicle is placed in the RL-SHED and prepared for test (The fuel level and
condition for the dynamic test is the fuel remaining after completion of the static test ndash
40 fresh fill of the appropriate test fuel)
B Outside air source for the engine is connected
C Vehicle exhaust is connected
D Fuel tank thermocouple is connected
E Canister vent is connected to the SHED bulkhead fitting which routes the vapor to the
trap canister outside the SHED
F Vehicle is allowed to stabilize in the RL-SHED at test temperature (86degF) for a minimum
of 12 hours ndash preferably overnight
G Two cycles of the Unified Cycle (LA-92) driving schedule (48 mins) are driven while
measuring the mass emissions in the SHED Vehicle is allowed to idle (in drive) for 30
seconds between the two cycles Ambient air temperature is maintained (to the extent
possible) at 86degF Fuel tank surface temperature is monitored during vehicle operation It
should increase during the drive from 10 to 18degF to simulate expected on-road
temperature increase Measured mass emissions are corrected using the INNOVA data
for the ethanol methanol and refrigerant emissions
3 Hot Soak10
This procedure is executed immediately following the Running Loss Test procedure
described above
A Engine is turned off transmission selector is placed in park and driver exits the
enclosure using the double door air lock taking care to minimize any air exchange
between the laboratory and the SHED This starts the one hour ldquohot soakrdquo period
B Measurements of mass emissions in the SHED are continued for another 60 minutes
(until time = 108 minutes) correcting for the ethanol methanol and refrigerant mass
using the INNOVA instrument data This ends the hot soak Hot soak emissions are
calculated as the net difference for the one hour hot soak (CorrMass108 ndash CorrMass48
minus the 86degF static hourly rate all mass rates in mghour)
4 Diurnal Test
A The fuel tank is drained and filled to 40 tank capacity with the test fuel
B The day before testing the vehicle is driven over four road trips of 75 miles each to
precondition the vehicle and the canister
C Upon return from the road pre-conditioning the fuel tank is drained and filled to 40
tank capacity with the test fuel
D The vehicle is parked for 18-22 hours in a controlled temperature environment at the
initial diurnal test temperature (65ordmF)
E The SHED is sealed allowed to stabilize at the 65degF temperature and the 3-day
California Diurnal Test is started
10 We define the ldquohot soakrdquo to be the temporary increase in emission rate caused by the immediately preceding
operation of the vehicle It is the increase in the SHED mass (corrected for EtOH MeOH and R-134a) over the
one hour period minus the previously established ldquostaticrdquo permeation rate
12
F ldquoContinuousrdquo (every 30 seconds) THC measurements are made using a FID Ethanol
methanol and R134a (refrigerant) concentrations are measured using an INNOVA
analyzer at least every 10 minutes for the duration of the test (72 hours)
Static Permeation Test ndash Leak Validation
If a leak is detected during either the vapor system pressure portion (Step J) or the pump
energized portion (Step K) of the Static Permeation Test procedure it calls into question whether
the permeation rate measurement accurately reflects fuel system permeation or if instead a
combination of permeation and the implied leak was measured If a leak is confirmed the
permeation rate measurement is called into question and an investigation possible remedy and
retest is indicated
The permeation rate measurement must be corrected for the FIDrsquos ethanol misrepresentation and
the presence of non-fuel hydrocarbons (methanol and refrigerant) The leak check however is
made using the change in mass increase in the SHED using the uncorrected FID mass calculation
as the determinate It was found that the corrections for ethanol methanol and refrigerant were
introducing ldquonoiserdquo into the trace and that these were being misinterpreted as leaks
y = 062x - 19
y = 047x + 67
y = 055x - 01
0
10
20
30
40
50
60
70
80
90
100
0 20 40 60 80 100 120
SH
ED
Mas
s -
mg
Test Time - minutes
Leak TestVehicle 204 - 1999 Honda Accord - 9 psi E0
Test 7028
Pump ActivatedTank Pressurized
Figure 8 above represents the calculations made during the inspection of data from a successful
test EXCELrsquostrade ldquoSLOPErdquo function is used to calculate the linear regression values based on
the FID calculation for mass for Time 0 to 60 minutes Time 64 to 90 minutes and Time 94 to
120 minutes A 4-minute gap was included between each sequence to establish the new mass
emission rate during the ldquopressure onrdquo (T60 to T90) and the ldquopump energizedrdquo periods
The slope of 047 for the ldquoTank Pressurizedrdquo period in the example above is compared to the
slope of 062 calculated for the permeation rate (or hot soak) period Since the ldquoTank
Figure 8 ndash Leak Test
13
Pressurizedrdquo slope is not more than 10 higher than the hot soak permeation rate we assume
that there is no leak present A similar comparison is made for the slope determined during the
ldquopump onrdquo period The choice of a 10 allowance is arbitrary and is used here to allow for
normal and unavoidable test variation
For tests in which the above procedure determines that no leak is present a value of zero is
reported in the test summary for the leak results If a positive value is reported it calls that test
into question and an investigation possible repair and retest is indicated
Static Permeation Rate Determination
The static permeation rate is determined based on a linear regression through the individual
SHED mass data points (data measured each 30 seconds) of the corrected fuel results (corrected
for the FID error and subtracting the methanol and refrigerant) from the first 60 minutes of
testing as illustrated in Figure 9 below
y = 05636x + 0505
0
5
10
15
20
25
30
35
40
45
0 10 20 30 40 50 60
Pe
rme
ati
on
-m
gs
Test Time - mins
Static Permeation DeterminationVehicle 204 - 1999 Honda Accord - 9 psi E0 Fuel
Raw SHED
Corrected Fuel
Permeation Rate Based on Corrected Results
Permeation Rate = 5636 x Time = 338 mgshr
In this example the static permeation rate is 338 mghr
Dynamic (Running Loss) and Hot Soak Test
The preceding section addressed the concepts of separating the permeation emissions from the
tank venting emissions and establishing the presence or absence of leaks The second part of
this study includes a dynamic test to measure the permeation and tank venting emissions during
Figure 9 ndash Static Permeation Determination
14
vehicle operation (ldquorunning lossesrdquo) and the temporary condition following vehicle operation
known as the ldquohot soakrdquo
This is considered a ldquodynamicrdquo test because the vehicle is driven and the fuel and vapor system
temperatures rise during the test The ambient temperature in the Running Loss SHED during
the test was held constant at 86degF while the vehiclersquos fuel system temperature rose during the
test Two 1435 second (239-minute) LA-92 driving cycles were performed consecutively during
the running loss measurements with a 30-second idle in-between During this test tank fuel
temperature was expected to rise by an average approximately 18degF above the initial ambient
temperature The running loss air handling system included a proportional speed under-car
blower operated as a slave to dynamometer speed This apparatus was used during running loss
testing with minor tuning for specific vehicles Without additional input it is capable of
reasonable fuel tank temperature control Each vehicle was fitted with a surface-mount
thermocouple at the front of the fuel tank located at approximately the 18th
fill level to measure
the fuel liquid temperature No attempt was made to follow a predefined fuel tank temperature
profile (FTTP) in this program Fuel temperatures were recorded and results are available in the
real-time records
Vehicle running loss emissions are measured in a special version of a SHED known as a
Running Loss SHED (RL-SHED) shown in Figure 10 Special features of the RL-SHED
include a sealed chassis dynamometer for simulating vehicle driving loads a sealed outside air
supply for engine intake a sealed exhaust conduit for engine exhaust and an under-chassis fan
for simulating underbody air flow as described above A vehicle is operated inside the RL-SHED
over a chosen driving cycle The increase in HC emissions inside the enclosure are measured
and calculated as mass emissions per 40 CFR sect86163-96
Figure 10 - Running Loss SHED
15
Vehicle testing in an RL-SHED is complicated by several factors including
1 Engine must be supplied with external induction air
2 Exhaust must be conducted externally without any leaks
3 Load supplied to the vehicle through the chassis dynamometer must not create or
allow external leaks
4 Internal SHED temperature must be maintained while sizable heat is rejected to the
ambient by the running engine and exhaust
5 Cooling air supplied to the radiator must be modulated to represent the vehiclersquos road
speed
6 Underbody (and especially the fuel system) temperature should represent the rate of
rise experienced by a real road-drive
Canister vent losses were isolated from permeation emissions using the technique previously
described The vehiclersquos carbon canister fresh air vent was connected to the outside of the RL-
SHED using a leak-tight PTFEreg
hose (38rdquo OD commercial tubing US Plastics 58055 PTFE or
equivalent) connected to a small carbon ldquotraprdquo canister located on a top-loading precision scale
The scale precision was 001 grams (10 milligrams) and it was purged prior to each test There
were no tank venting emissions measured on any of the running loss test measurements All of
the vehicles appeared to be actively ldquopurgingrdquo their respective control canisters and drawing
fresh air during the test If there were any emissions from the vehiclersquos control canister as might
have occurred if there were no vehicle purge or if very high volatility fuels with excessive vapor
generation were used they would have been measured
The Running Loss Driving Cycle consisted of two cycles of the ldquoUnified Driving Cyclerdquo
otherwise known as the LA-92 A velocity versus time plot for one cycle is shown in Figure 11
The LA-92 cycle takes 24 minutes to complete and covers 98 miles with many speed changes
Two back-to-back cycles were driven the first as a ldquocold startrdquo and the second following a 30-
second vehicle idle The ldquocold startrdquo condition was created by soaking the vehicle for a
Figure 11 ndash Running Loss Driving Cycle
Unified Cycle (LA-92)
0
10
20
30
40
50
60
70
80
0 5 10 15 20 25Test Time - minutes
Spe
ed -
mph
Cycle Time (min) 239
Maximum Speed (mph) 672
Average Speed (mph) 246
Average Non-Zero Speed (mph) 294
Time Zero Speed () 162
Distance (miles) 982
16
minimum of 18 hours at 86degF moving it to the stabilized 86degF RL-SHED making the test
connections and then waiting a minimum of one hour before the initial start and run
The SHED emissions were measured during 48 minutes of engine operation and then
continuously for one hour after the engine was turned off This one hour engine-off duration
was the ldquohot soakrdquo period The total test time is 1 hour and 48 minutes
Figure 12 shows results from the 9 psi E0 fuel test on Vehicle 204 The horizontal axis is test
time in minutes and the vertical axis is the HC mass measured in the RL-SHED during the test
period
The engine was shut off at the end of the second LA92 drive cycle (~48 minutes) and the
analysis system continued to measure the HC emissions in the SHED for the next 60 minutes
This represented the ldquohot soakrdquo portion of the test
0
50
100
150
200
250
300
0 20 40 60 80 100 120
Co
rre
cte
d T
ota
l F
ue
l C
um
ula
tiv
e P
erm
ea
tio
n -
mg
Test Time - minutes
Running Loss and Hot SoakVehicle 204 - 1999 Honda Accord - 9 psi E0 Fuel
Test 25668
Running Loss Hot Soak
Running Loss Std =005 gmiThis Test = 0010 gmi
RL = 249 mghr
2774
2332
Tru HS = 442
1990
The ldquoTruerdquo Hot Soak
The traditional hot soak is determined from the increase in SHED emissions as measured for one
hour following a prescribed drive to heat up the vehicle (2 LA-92 cycles during the Running
Loss Test) Hot soak emissions however have two components that caused by the elevated
temperature resulting from the drive and that resulting from one hour of static permeation
Figure 12 ndash Running Loss Test Results
17
To separate these two components and determine the ldquotruerdquo hot soak emissions the following
procedure was used ldquoTraditionalrdquo hot soak emissions were first calculated by subtracting the
ldquostart of hot soakrdquo cumulative SHED hydrocarbon value (ie 199 mg t = 48 minutes) from
the final cumulative SHED hydrocarbon value (ie 2774 mg t = 108 min) This resulted in a
cumulative SHED hydrocarbon value of 78 mg for the 1 hour hot soak The previously
determined static permeation value (ie 338 mg for a 1 hour hot soak test- see Figure 9) was
then subtracted to arrive at the ldquotruerdquo hot soak value of 442 mg The increase in the permeation
rate (the ldquohot soak effectrdquo) caused by the increase in the system temperature is accounted for by
subtracting the ldquostabilized permeation raterdquo at 86degF
In Figure 12 the static permeation rate is superimposed as a solid blue line on the plot from the
starting point of the hot soak until its end (one hour) While the ldquotraditionalrdquo hot soak would be
calculated as 78 mg (277 mg ndash 199 mg) the ldquotruerdquo hot soak is determined as 442 mg (2774 mg
ndash 2332 mg) True hot soak values reported here were determined in this manner
Diurnal Test
Diurnal permeation was determined by subjecting the vehicle to a three-day period in a
temperature controlled SHED while continuously recording the total hydrocarbon every 30
seconds The SHED environmental temperature was varied from 65degF to 105degF per the
California Diurnal Test protocol Canister vent losses were isolated from permeation emissions
using the technique previously described The vehiclersquos carbon canister fresh air vent was
connected to the outside of the RL-SHED using a leak-tight PTFEreg
hose connected to a small
carbon ldquotraprdquo canister located on a top-loading precision scale The scale precision was 001
grams (10 milligrams) and it was purged before each test
DISCUSSION OF TEST RESULTS
Results
Emission results are presented below by ldquomechanism11
rdquo with the data averaged for the five
ldquoenhancedrdquo and the two ldquonear zerordquo vehicles The lone ldquopre-enhancedrdquo vehicle the 1996 Ford
Taurus (202) was a special case and will be discussed in a separate section Two of the vehicles
the 2001 Dodge Caravan (207) and the 2004 Toyota Camry (211) were also subjected to limited
testing with an ldquoimplanted leakrdquo (a 0020rdquo dia hole in a special tank gas cap) to investigate the
magnitude of a known leak These results (ldquoLeakersrdquo) follow the discussion on the Taurus
Static Permeation Rate (Constant Temperature (86degF)) - Average permeation rate compared
by fuel specification for two vehicle groups ldquoenhancedrdquo and the ldquonear zerordquo evaporative
emissions
11 The ldquomechanismsrdquo are 1 Permeation 2 Tank Venting (Daily Temperature Rise) and 3 Leaks
18
0
10
20
30
40
50
60
Co
rrecte
d P
erm
eati
on
Rate
-m
gh
r
Fuel
Static Permeation Rate - All FuelsE77-2 Program Vehicles
7 E0 9 E2010 E107 E109 E0 7 E0 9 E2010 E107 E109 E0
Enhanced(5 veh)
Near Zero(2 veh)
Figure 13 presents the static permeation rate performance for the average of the 5 ldquoenhancedrdquo
and 2 ldquonear zerordquo vehicles on the five fuels included in the test program Each group is ordered
from left to right by ethanol level The vertical scale is the average permeation rate in mghour
for the static (86degF constant temperature) test
Previous studies1213
had shown that vehicles operated on the fuel containing 10 vol- ethanol
would have higher permeation rates compared to those resulting from operation on a non-ethanol
(E0) fuel of similar properties We also expected that vehicles using higher vapor pressure fuel
would exhibit increased permeation levels at similar ethanol levels Other studies had reported
mixed results when comparing E20 permeation rates against E10 measurements ndash some were
higher and some were lower The difference may have been within the repeatability of the
measurements and probably suffered from a limited number of observations These mixed
results are present in this testing of the enhanced vehicles however the E20 (violet bar) is higher
on average for static permeation rate for the Near Zero group The data that were used to
construct the averages in Figure 13 are listed in Table 3 below There is significant variability in
the test results and the limited sample size precludes making conclusive statements with
statistical confidence
12 CRC E-653 Fuel Permeation from Automotive Systems E0 E6 E10 E20 and E85 December 2006 13
CRC E-77 Vehicle Evaporative Emission Mechanisms A Pilot Study June 2008
Figure 13 ndash Static Permeation Rate Comparison
19
Table 3
Vehicle ID Technology 7psi E0 9 psi E0 7 psi E10 10 psi E10 9 psi E20
204
1999 Honda Enhanced 129 338 664 843 553
Accord
205
2001 Toyota Enhanced 99 195 596 416 462
Corolla
207
2001 Dodge Enhanced 401 325 644 787 882
Caravan
214
2004 Ford Enhanced 252 107 239 244 168
Escape
215
2004 Toyota Enhanced 87 85 122 104 193
Highlander
194 210 453 479 452
211
2004 Toyota Near Zero 91 101 94 199 558
Camry XLE
212
2006 Ford Near Zero 09 32 218 106 47
Taurus
50 67 156 153 303
Static Permeation Rate - mghr
CRC E-77-2 Program - Static Permeation Results
Enhanced Averages
Near Zero Averages
Summary ndash Static permeation rate increased with increase in ethanol level Three of the 5
enhanced emission vehicles did not show an increase in permeation rate when tested with the 9
psi E0 compared to the 7 psi E0
20
Dynamic (Running Loss) Permeation - In a similar presentation Figure 14 shows the average
ldquoRunning Lossrdquo permeation rate for the vehicle types and the fuels tested ldquoRunning Lossrdquo
permeation as described here is the permeation measured during a ldquocold startrdquo 48 minute drive in
a Running-Loss SHED (RL-SHED) at 86degF
0
50
100
150
200
250
300
350
400
7E0 9E0 7E10 10E10 9E20 7E0 9E0 7E10 10E10 9E20
Co
rre
cte
d R
un
nin
g L
os
s P
erm
ea
tio
n -
mg
hr
Fuel
Running Loss Permeation Rate - All FuelsE77-2 Program Vehicles
Enhanced(5 vehs)
Near Zero(2 vehs)
The dynamic permeation rates for the enhanced vehicles (left panel) followed a similar pattern as
the static permeation The average of the E20 fuel was the highest of the average values
observed on both the enhanced and the near-zero vehicles (left and right panels respectively)
Table 4 below shows the data used to generate the averages used in Figure 14
Figure 14 ndash Running Loss Permeation Comparison
21
Table 4
Vehicle ID Technology 7psi E0 9 psi E0 7 psi E10 10 psi E10 9 psi E20
204
1999 Honda Enhanced 2226 2492 2879 3164 2720
Accord
205
2001 Toyota Enhanced 671 1031 2328 1916 1697
Corolla
207
2001 Dodge Enhanced 8425 8339 8122 8581 10282
Caravan
214
2004 Ford Enhanced 363 967 1057 1331 1394
Escape
215
2005 Toyota Enhanced 797 811 979 719 1025
Highlander
2496 2728 3073 3142 3424
211
2004 Toyota Near Zero 1046 837 563 1383 4106
Camry XLE
212
2006 Ford Near Zero 1845 1158 2012 1489 1168
Taurus
1446 998 1288 1436 2637
Enhanced Averages
Near Zero Averages
CRC E-77-2 Program - Running Loss Permeation Results
Running Loss Permeation Rate - mghr
Summary ndash The dynamic permeation rate (measured during vehicle operation) was higher with
the E10 fuel compared to E0 for the enhanced vehicles The E20 permeation rate was higher
than E0 and the E10 fuel The small sample size and limited data precludes us from making
statements about statistical confidence but this may indicate a trend The near zero vehicle
average increased as the ethanol level increased Trends with volatility were mixed or
inconclusive
22
Hot Soak (ldquoTrue Hot Soakrdquo) Permeation ndash The Hot Soak emissions as defined in this report
are the net increase in permeation rate following vehicle operation We measured the mass
increase in the SHED for one hour immediately following vehicle operation and subtracted the
previously measured static (or normal) permeation at the same temperature While this is not the
traditional Code of Federal Regulations (CFR) definition we feel it is appropriate for the intent
of this project
0
10
20
30
40
50
60
70
7E0 9E0 7E10 10E10 9E20 7E0 9E0 7E10 10E10 9E20
Co
rre
cte
d H
ot
So
ak
Pe
rme
ati
on
-m
gh
r
Fuel
True Hot Soak Permeation Rate - All FuelsE77-2 Program Vehicles
Enhanced(5 vehs)
Near Zero(2 vehs)
The ldquoTrue Hot Soakrdquo performance for the average of the Enhanced Vehicles is summarized in
Figure 15 above There was a large increase in the hot soak value with the E10 fuel compared to
the E0 The hot soak value with the E20 fuel was comparable to the E0 results and lower than
the E10
The Near Zero vehicles (2) had zero hot soak emissions when tested on the 10 psi E10 fuel
(Figure 16) With only two vehicles and the very low levels attained no statistically significant
conclusions can be drawn from the data available Table 5 presents the individual tests used in
calculating the average values plotted in Figure 15
Figure 15 ndash True Hot Soak Permeation Comparison
23
Table 5
Vehicle ID Technology 7psi E0 9 psi E0 7 psi E10 10 psi E10 9 psi E20
204
1999 Honda Enhanced 187 443 297 04 134
Accord
205
2001 Toyota Enhanced 00 10 719 295 603
Corolla
207
2001 Dodge Enhanced 00 58 1222 2377 00
Caravan
214
2004 Ford Enhanced 33 521 329 574 560
Escape
215
2005 Toyota Enhanced 225 251 00 16 00
Highlander
89 257 513 653 259
211
2004 Toyota Near Zero 07 153 138 00 00
Camry XLE
212
2006 Ford Near Zero 18 04 00 00 49
Taurus
13 79 69 00 25
CRC E-77-2 Program - True Hot Soak Permeation Results
True Hot Soak Permeation Rate - mghr
Near Zero Averages
Enhanced Averages
Summary - The True Hot Soak permeation (permeation rate measured following vehicle
operation less the static constant temperature permeation rate) rate was higher with the E10 fuel
compared to E0 for the enhanced vehicles The E20 permeation rate was higher than E0 and
lower than the E10 fuel The near zero vehicle trends with both ethanol content and volatility
were mixed or inconclusive The small sample size and limited data precludes us from making
statements about statistical confidence
24
Diurnal Permeation Performance ndash Figure 16 presents the diurnal permeation results for the
first day of the three-day diurnal test (65deg to 105degF)
0
200
400
600
800
1000
1200
7E0 9E0 7E10 10E10 9E20 7E0 9E0 7E10 10E10 9E20
Co
rre
cte
d F
ue
l D
iurn
al
Pe
rme
ati
on
-m
gs
da
y
Day 1 Diurnal Permeation RatesAverages from E-77-2 Vehicles
Fuel
Enhanced(5 vehs)
Near Zero(2 vehs)
The average day 1 diurnal permeation for the five Enhanced Vehicles tended to increase as
ethanol content increased (with the exception of the E20 fuel) Again sample size and limited
data makes statistical conclusions inappropriate Table 6 presents the individual test used to
generate the averages used in Figure 16 The table includes the data from days 2 and 3 The
ethanol content of the diurnal measurements was calculated and appear in a series of figures in
the Appendix starting at page 37 Unlike Figure 16 the figures shown in the appendix have not
been corrected to exclude the non-fuel emissions (methanol and refrigerant) that were present
during these tests
Figure 16 ndash Day 1 Diurnal Permeation Comparison
25
Table 6
Vehicle ID Technology 7psi E0 9 psi E0 7 psi E10 10 psi E10 9 psi E20
204 Day 1 3672 6283 12601 15479 11034
1999 Honda Enhanced Day 2 2877 5810 11652 17799 9581
Accord Day 3 2936 5770 11653 17711 9812
205 Day 1 3830 4995 17834 17941 17752
2001 Toyota Enhanced Day 2 3654 4810 17150 17309 16900
Corolla Day 3 3670 5072 15239 17417 16802
207 Day 1 3975 4064 10865 14064 15480
2001 Dodge Enhanced Day 2 3026 3373 8120 12644 13702
Caravan Day 3 2689 3080 8236 12237 13605
214 Day 1 4943 4559 5242 4920 4709
2004 Ford Enhanced Day 2 3190 3585 3974 8394 4400
Escape Day 3 2815 11017 3944 113738 7518
215 Day 1 2483 2021 2247 3192 4168
2004 Toyota Enhanced Day 2 2941 1659 2317 2602 4148
Highlander Day 3 2888 1763 2675 2370 4506
3781 4384 9758 11119 10629
211 Day 1 2071 1303 2438 3370 2840
2004 Toyota Near Zero Day 2 1002 1158 1838 2268 2218
Camry XLE Day 3 874 1006 1843 2179 2034
212 Day 1 1016 1005 1848 1243 1310
2006 Ford Near Zero Day 2 712 708 1002 879 833
Taurus Day 3 570 574 758 1028 750
1544 1154 2143 2307 2075
CRC E-77-2 Program Results - Diurnal Permeation
Diurnal Permeation Rate - mgday
Enhanced Averages
Near Zero Averages
Carbon Canister Breakthrough ndash Canister breakthrough is measured by the weight change
recorded for the trap canister outside the SHED It quantifies the amount of vapors that
overwhelm the evaporative system storage canister Figure 17 displays the breakthrough
resulting from testing of 9 psi E0 fuel Only four of seven vehicles exhibited breakthrough
60
65
70
75
80
85
90
95
100
105
110
0
5
10
15
20
25
30
35
40
0 10 20 30 40 50 60 70
SH
ED
Te
mp
era
ture
-d
eg
F
Bre
ak
thro
ug
h -
mg
Test Time - hrs
Canister Breakthrough9 psi E0 Fuel - 65ordm to 105ordm F Diurnal
204 - 1999 Honda Accord
211 - 2004 Toyota Camry
215 - 2004 Toyota Highlander
205 - 2001 Toyota Corolla
Figure 17 ndashDiurnal Canister Breakthrough
26
Table 7 shows the breakthrough generated during the diurnal tests conducted
Table 7
Vehicle ID Technology 7psi E0 9 psi E0 7 psi E10 10 psi E10 9 psi E20
204 Day 1 --- 24 --- 310 ---
1999 Honda Enhanced Day 2 --- 136 --- 360 ---
Accord Day 3 --- 198 --- 360 ---
205 Day 1 --- --- --- 204 ---
2001 Toyota Enhanced Day 2 --- --- --- 309 ---
Corolla Day 3 --- 26 --- 293 ---
207 Day 1 --- --- --- --- ---
2001 Dodge Enhanced Day 2 --- --- --- --- ---
Caravan Day 3 --- --- --- --- ---
214 Day 1 --- --- --- --- ---
2004 Ford Enhanced Day 2 --- --- --- --- ---
Escape Day 3 --- --- --- 49 ---
215 Day 1 --- --- --- --- ---
2004 Toyota Enhanced Day 2 --- 02 --- --- ---
Highlander Day 3 --- 72 --- --- ---
211 Day 1 --- --- --- --- ---
2004 Toyota Near Zero Day 2 --- 129 --- 191 ---
Camry XLE Day 3 --- 176 --- 289 ---
212 Day 1 --- --- --- --- ---
2006 Ford Near Zero Day 2 --- --- --- --- ---
Taurus Day 3 --- --- --- 204 ---
CRC E-77-2 Program - Carbon Canister Diurnal Breakthrough Results
Diurnal Breakthrough - grams
Summary ndash The lack of canister breakthrough for the 7 psi fuels (summer grade) indicates that
the storage capacity of the seven systems tested is appropriately sized Breakthrough began to
appear when testing of 9 psi E0 fuel (not summer grade) and was more prevalent with the 10 psi
E10 fuel (winter grade) The lack of breakthrough with the 9 psi E20 fuel seems to be an
anomaly
27
Overall Trend Summary - The following chart (Figure 18) visually summarizes the trends seen
from all testing performed during this program
Higher Volatility E0 to E10 E0 to E20 E10 to E20
uarr uarr uarr uarr
Higher Volatility E0 to E10 E0 to E20 E10 to E20
uarr uarr uarr uarr
Higher Volatility E0 to E10 E0 to E20 E10 to E20
uarr uarr uarr uarr
Higher Volatility E0 to E10 E0 to E20 E10 to E20
uarr uarr uarr uarr
Higher Volatility E0 to E10 E0 to E20 E10 to E20
uarrharr uarr uarr uarr
Higher Volatility E0 to E10 E0 to E20 E10 to E20
uarr uarr uarr uarr
Higher Volatility E0 to E10 E0 to E20 E10 to E20
uarr darr darr
Higher Volatility E0 to E10 E0 to E20 E10 to E20
uarr uarr uarr harr
Ethanol Content
Diurnal
Trend Analysis for E-77-2 Program
Ethanol Content
Static Permeation
Ethanol Content
Running Loss Permeation
Ethanol Content
Ethanol Content
Diurnal
Enhanced Vehicles (Sample of 5)
Static Permeation
Ethanol Content
Ethanol Content
Running Loss Permeation
Ethanol Content
True Hot Soak (TEFVO)
Near-Zero Vehicles (Sample of 2)
True Hot Soak (TEFVO)
Figure 18 Trend Analysis Summaries
28
Vehicle 202 ndash 1996 Ford Taurus - Special Case
We have treated vehicle 202 as a special case This was the oldest of the vehicles tested and had
been subjected to limited exhaust emission tests with a 20-volume percent ethanol fuel (E20)
during the CRC E-74b test program
Vehicle 202 completed the E10 portion of the test program (10 and 7 psi fuels) successfully and
completed the road preconditioning on the E0 fuel prior to the E0 evaluations The first test on
the E0 fuel was excessively high indicating a fuel leak It was traced to a leaky fuel injector o-
ring and there was considerable discussion as to an appropriate repair Tests were made on the 9
and the 7 psi E0 fuel to measure the magnitude of a vehicle in a ldquoleakrdquo condition and the tests
were labeled as ldquo202L (Leak)rdquo The fuel injector o-rings were replaced as a complete set and
the vehicle resumed testing as ldquo202Rrsquo (Repaired) A new elusive vapor leak was present later
identified as a very small leak at the top of the fuel fill pipe
The circle on Figure 19 at the right shows
the location of the small leak This leak
was problematic as to its effect on the
emission measurements because its
magnitude or presence seemed to depend
on the torque exerted on the fuel cap The
tests on the E0 fuels (9 and 7 psi) are
noted as 202R but with a vapor leak
We attempted to fix this leak and repeated
the E10 test with the vehicle re-identified
as 216 with reasonable results We also
ran the E20 test sequence and declared the
vehicle done
The testing history for this vehicle is shown in Tables 8 (Static) 9 (Dynamic) and 10 (Diurnal)
The tests highlighted in yellow are those that exhibited a liquid or vapor leak as identified during
the static test leak validation
Figure 19 ndash Vehicle 202 Fuel Fill Pipe Leak
29
Table 8
Static Permeation Results 1996 Ford Taurus SHED
Corrected Results Canister
Fuel Permeation mgday Loss
Veh psiEtOH Test Type Date Test mghr (Corrected) g
202 100E10 Static Perm 071807 7018 345 000
Press Incr 00 No Leak
Prs+Fuel Incr 00
202 70E10 Static Perm 082107 7031 223 000
Press Incr 00 No Leak
Prs+Fuel Incr 00
202L 90E0 Static Perm 030408 7169 2292 000
Press Incr DNA
Prs+Fuel Incr 4921 Liquid Leak
202L 70E0 Static Perm 032008 7183 2991 000
Press Incr DNA
Prs+Fuel Incr 19896 Liquid Leak
202R 90E0 Static Perm 050808 7228 178 000
Press Incr 136 Vapor Leak
Prs+Fuel Incr 00
202R 70E0 Static Perm 052208 7239 204 000
Press Incr 380 Vapor Leak
Prs+Fuel Incr 00
216 100E10 Static Perm 081408 7299 324 000
Press Incr 00 No Leak
Prs+Fuel Incr 00
216 70E10 Static Perm 091708 7326 325 000
Press Incr 00 No Leak
Prs+Fuel Incr 00
216 90E20 Static Perm 103008 7363 204 000
Press Incr 00 No Leak
Prs+Fuel Incr 00
30
Table 9
Dynamic Permeation Results 1996 Ford Taurus SHED
Corrected Results Canister From
Fuel Permeation mgday Loss Static
Veh psiEtOH Test Type Date Test mghr (Corrected) g Test
202 100E10 Dynamic RL 072007 25662 1278 000 No Leak
TEFVO 386 000
202L 90E0 Dynamic RL 030508 25695 3870 000 Liquid Leak
TEFVO 00 000
202L 70E0 Dynamic RL 032408 25699 7269 000 Liquid Leak
TEFVO 00 000
202R 90E0 Dynamic RL 050908 25704 1091 000 Vapor Leak
TEFVO 50 000
202R 70E0 Dynamic RL 052308 25706 787 000 Vapor Leak
TEFVO 00 000
216 100E10 Dynamic RL 081508 25718 1742 000 No Leak
TEFVO 14 000
216 70E10 Dynamic RL 091808 25721 1683 000 No Leak
TEFVO 423 000
216 90E20 Dynamic RL 110708 25730 543 000 No Leak
TEFVO 00 000
31
Table 10
Diurnal Permeation Results 1996 Ford Taurus SHED
Corrected Results Canister From
Fuel Permeation mgday Loss Static
Veh psiEtOH Test Type Date Test mghr (Corrected) g Test
202 100E10 72 DHB 65-105 073107 7023
Day 1 10429 612 No Leak
Day 2 7069 3264
Day 3 7043 3869
202 70E10 72 DHB 65-105 082807 7034
Day 1 6278 000 No Leak
Day 2 5065 000
Day 3 4535 000
202L 90E0 72 DHB 65-105 031108 7173
Day 1 22589 000 Liquid Leak
Day 2 32310 000
Day 3 23069 1260
202L 70E0 72 DHB 65-105 040108 7196
Day 1 47425 000 Liquid Leak
Day 2 44517 000
Day 3 31798 000
202R 90E0 72 DHB 65-105 051308 7230
Day 1 3270 000 Vapor Leak
Day 2 2667 000
Day 3 2746 1083
202R 70E0 72 DHB 65-105 052808 7243
Day 1 2117 000 Vapor Leak
Day 2 2208 000
Day 3 2081 000
216 100E10 72 DHB 65-105 082008 7305
Day 1 25907 5777 No Leak
Day 2 34779 6299
Day 3 36014 6343
216 70E10 72 DHB 65-105 092308 7331
Day 1 3975 022 No Leak
Day 2 3550 006
Day 3 3621 037
216 90E20 72 DHB 65-105 111108 7373
Day 1 4685 000 No Leak
Day 2 4526 000
Day 3 4198 000
32
The Implanted Leak Test Results
Project E-77-2 included evaluating two vehicles with implanted leaks This interest followed the
information gathered in the Pilot Study where tests were run with a specially modified fuel cap
containing a 002rdquo dia hole The results with the implanted leak from the Pilot Study are
repeated in Table 11 below as the diurnal results are shown for a 1996 Chevrolet Cavalier first
without the implanted leak at 038 grams per day and then at 207 grams per day (a 54x
increase) with the leak
Table 11
Veh No
Evap
Tech Fuel
Results
gmsday
gms
Increase
6 1996 Chevrolet Cavalier Enhanced 7 psi E0 038
7 2070 2032
207 2001 Dodge Caravan Enhanced 7 psi E10 109
207L 213 104
211 2004 Toyota Camry LE Near Zero 7 psi E10 024
211L 068 044
- Implanted 020 leak in fuel cap
Vehicle Description
Implanted Leak Impact on Diurnal PermeationDay One Results 65deg - 105degF Diurnal
The two E-77-2 vehicles (207 amp 211) were given a limited evaluation with an induced leak and
saw a significantly lesser impact Vehicle 207 gave diurnal results increases from 109 to 213
grams per day (a 2x increase) and Vehicle 211 increased from 024 grams per day to 068 grams
per day (a 28x increase) The following Figure 20 displays the imbedded leak impact from Table
11
33
0
5
10
15
20
On
e D
ay
Diu
rna
l P
erm
ea
tio
n -
gm
sd
ay
Vehicle Number
Implanted Leak Impact on One Day Diurnal Permeation020 Leak in Fuel Cap - 65 to 105 F Diurnal
207L 211L21120776
As Received - No Leak
020 Fuel Cap Leak
The newer vehicles evaluated in this phase of the study were configured and certified to the
Onboard Refueling Vapor Regulations (ORVR) These are capable of containing 95 or more
control of the refueling vapors at up to 10 gallons per minute fueling rate Where the Chevrolet
Cavalier had a small (0055rdquo dia) orifice and a long vapor tube venting the tankrsquos vapor space to
the carbon canister (and then to the atmosphere) the ORVR compliant vehicles have a large
(0688rdquo ID) short vent hose to a low flow restriction carbon canister
The following bar charts (Figures 21 through 24) show the impacts of the leak on all phases of
the evaporative testing performed and compare those results with all fuels tested With only two
vehicles (207 and 211) evaluated on two fuels statistically significant effects cannot be
quantified but the trend of increased emissions is apparent
Figure 20 ndash Implanted Leak Impact
34
0
20
40
60
80
100
120
140
160
7E0 9E0 7E10 10E10 9E20 7E0 9E0 7E10 10E10 9E20
Sta
tic
Pe
rme
ati
on
-m
gh
r
Fuel
0020 dia Induced Leak EffectStatic Permeation
Vehicle 211Vehicle 207
Leak
Leak
0
200
400
600
800
1000
1200
7E0 9E0 7E10 10E10 9E20 7E0 9E0 7E10 10E10 9E20
Ru
nn
ing
Lo
ss
Pe
rme
ati
on
-m
gh
r
Fuel
0020 dia Induced Leak EffectRunning Loss Permeation
Vehicle 211Vehicle 207
Leak
Leak
Figure 21 ndash Vehicles 207 and 211 with Induced Leak - Static
Figure 22 ndash Vehicles 207 and 211with Induced Leak ndash Running Loss
35
0
100
200
300
400
500
600
700
7E0 9E0 7E10 10E10 9E20 7E0 9E0 7E10 10E10 9E20
Tru
e H
ot S
oa
k P
erm
ea
tio
n -
mg
hr
Fuel
0020 dia Induced Leak EffectTrue Hot Soak Permeation
Vehicle 211Vehicle 207
Leak
Leak
0
500
1000
1500
2000
2500
7E0 9E0 7E10 10E10 9E20 7E0 9E0 7E10 10E10 9E20
Da
y 1
Diu
rna
l P
erm
ea
tio
n -
mg
da
y
Fuel
0020 dia Induced Leak EffectDay 1 Diurnal Permeation
Vehicle 211Vehicle 207
Leak
Leak
Figure 24 ndash Vehicles 207 and 211 with Induced Leak - Diurnal
Figure 23 ndash Vehicles 207 and 211 with Induced Leak ndash True Hot Soak
36
Summary of Findings and Results
The E-77-2 test program was a continuation of the previously published E-77 test project and
added eight vehicles tested on five fuels to the knowledge base The permeation trends
previously shown were again present The small sample size and limited number of tests
preclude making statements about statistical validity but in general
o The newer vehicle groups had lower emissions
o Adding ethanol to the fuel increased permeation over the non-oxygenated levels
o Increased volatility increased permeation levels
o SHED emission rates must be corrected for the ethanol error in the FID and the
non-fuel methanol and refrigerant in the measurement
As this test program evolved and additional experience was gathered two program modifications
were made 1) The leak validation methodology was changed and 2) a different metric and
definition of the ldquoHot Soakrdquo was adopted
The leak validation portion of the static permeation test was found to be very sensitive and when
the data was corrected on a minute-by-minute basis for ethanol methanol and refrigerant the
change in apparent permeation rate was due as much to variation as to leaks See the discussion
starting at page 12 for the details of the development
Concern for and recognition of ldquoHot Soakrdquo emissions started in the original evaporative emission
regulations Carburetors had float bowls with ~ 50 ml of fuel that absorbed the latent engine heat
after the vehicle was shut down after operation The heat would cause the bowl temperature to
increase driving fuel vapors out through vents and leak paths to the atmosphere after vehicle
operation Todayrsquos fuel injection engines do not have the open bowls and the emission rates
following vehicle operation are mainly increased temperature permeation We recommended
and adopted a new name for the ldquotemporary emissions following vehicle operationrdquo (TEFVO)
which subtracts the basic permeation rate from the measured emissions See the discussion
starting at page 16 for details
37
Appendix
Acknowledgements
E-77-2 Steering Committee
David Brzezinski EPA
Kevin Cullen GM Powertrain
Dominic DiCicco Ford Motor Company
King D Eng Shell Global Solutions
Ben Hancock CARB
Constance Hart EPA
Phil Heirigs Chevron Global Downstream
Jeff Jetter Honda RampD Americas
Keith KnollNREL
John Koupal EPA
David H Lax API
Jeff Long CARB
Hector Maldonado CARB
Mani Natarajan Marathon Oil Company
David N Patterson Mitsubishi Motors RampD Americas
Jenny Sigelko Chrysler
James P UihleinChevron Global Downstream
Marie Valentine Toyota Technical Center
Kenneth J Wright ConocoPhillips
CRC Members
Brent Bailey CRC
Chris Tennant CRC
Jane Beck CRC
38
Table 12
E0 E10 E20
Inspection Units Fuel 6 Fuel 7 Fuel 4
API Gravity degAPI 602 585 570
Relative Density 6060degF 07382 07447 07508
DVPE psi 701 730 849
Oxygenates--D4815
MTBE vol 000 000 000
ETBE vol 000 000 000
EtOH vol 000 954 2034
O2 wt 000 353 747
Hydrocarbon Composition
Aromatics vol 221 244 108
Olefins vol 80 88 55
Saturates vol 700 573 234
D86 Distillation
IBP degF 974 1040 1022
5 Evaporated degF 1316 1280 1252
10 Evaporated degF 1423 1330 1314
20 Evaporated degF 1564 1410 1413
30 Evaporated degF 1704 1450 1486
40 Evaporated degF 1840 1530 1547
50 Evaporated degF 1975 1950 1596
60 Evaporated degF 2120 2190 1636
70 Evaporated degF 2305 2410 2274
80 Evaporated degF 2588 2710 2695
90 Evaporated degF 3139 3170 3139
95 Evaporated degF 3322 3300 3255
EP degF 3603 3600 3406
Recovery vol 978 978 983
Residue vol 13 10 10
Loss vol 09 12 07
Driveability Index 11199 11015 9898
Data from CRC E-74
CRC E-77-2 Fuel Inspection Results
39
Fuel Units Fuel 6 Fuel 7 Fuel 4
Sulfur Content ppm 29 27 27
Estimated CH Ratio 62090 63323 63252
Est Net Heat of Combustion btulb 18573 18514 18513
Benzene vol 090 100 096
Research Octane Number 932 940 946
Motor Octane Number 838 838 834
(R+M)2 885 889 890
Fuel Units Fuel 6 Fuel 7 Fuel 4
Aromatics vol 2386 2481 2178
Olefins vol 752 892 1074
Saturates vol 6743 5621 4623
Unclassified vol 115 086 015
Ethanol vol 000 920 2111
Benzene vol 089 106 097
CH Ratio 6200 6092 5835
Oxygen wt 0008 1 340 773
Net Heat of Combustion btulb 18703 18016 17160
1 Contains 004 vol MTBE
Fuel Units Fuel 6 Fuel 7 Fuel 4
Oxygen wt 0008 3396 7733
C+H wt 9999 9660 9227
H wt 1389 1362 1350
C wt 8610 8298 7877
Fuel Units 6 7 4
Haltermann D3338 Btulb 18573 18514 18513
Average D3338 Btulb 18579 18514 18491
Oxygen Corrected D3338 Btulb 18579 17860 17103
DHA Btulb 18703 18016 17160
Table 12 (cont)
Suppliers Additional Inspections
Net Heat of Combusion -- Btulb
Carbon Hydrogen and Oxygen
Detailed Hydrocarbon Analysis
40
Vehicle Day 1 Day 2 Day 3
No Fuel Base + Press + Pump RL True HS Perm (Brkthru) Perm (Brkthru) Perm (Brkthru)
E10 - 10 psi 345 --- --- 1278 503 10429 (63) 7069 (348) 7043 (425)
E10 - 7 psi 223 --- --- 994 113 6278 (00) 5065 (00) 4535 (00)
E0 - 9 psi 2229 --- 4921 3870 00 22580 (00) 32310 (00) 23069 (126)
E0 - 7 psi 2991 --- 19896 7269 00 47425 (00) 44517 (00) 31798 (00)
E10 - 10 psi 843 --- --- 3164 04 15479 (310) 17799 (383) 17711 (419)
E10 - 7 psi 664 --- --- 2879 297 12601 (00) 11652 (00) 11653 (00)
E0 - 9 psi 338 --- --- 2492 443 6283 (24) 5810 (136) 5770 (225)
E0 - 7 psi 129 --- --- 2226 187 3672 (00) 2877 (00) 2936 (00)
E20 - 9 psi 553 --- --- 2720 134 11034 (00) 9581 (00) 9812 (00)
E10 - 10 psi 416 --- --- 1916 295 17941 (204) 17309 (346) 17417 (375)
E10 - 7 psi 596 --- --- 2328 719 17834 (00) 17150 (00) 15239 (00)
E0 - 9 psi 195 --- --- 1031 10 4995 (00) 4810 (00) 5072 (26)
E0 - 7 psi 99 --- --- 671 00 3830 (00) 3654 (00) 3670 (00)
E20 - 9 psi 462 --- --- 1697 603 17752 (00) 16900 (00) 16802 (00)
E10 - 10 psi 787 --- --- 8581 2377 14064 (00) 12644 (00) 12237 (00)
E10 - 7 psi 644 --- --- 8122 1222 10865 (00) 8120 (00) 8236 (00)
E0 - 9 psi 325 --- --- 8339 58 4064 (00) 3373 (00) 3080 (00)
E0 - 7 psi 401 --- --- 8425 00 3975 (00) 3026 (00) 2689 (00)
E20 - 9 psi 882 --- --- 10282 00 15480 (00) 13702 (00) 13605 (00)
E10 - 10 psi 976 --- 1209 10012 3929 16449 (00) NA NA
E10 - 7 psi 1468 --- --- 11393 5850 21342 (00) NA NA
E10 - 10 psi 199 --- --- 1383 00 3370 (00) 2268 (191) 2179 (330)
E10 - 7 psi 94 266 --- 563 138 2438 (00) 1838 (00) 1843 (00)
E0 - 9 psi 101 --- --- 837 153 1303 (00) 1158 (129) 1006 (221)
E0 - 7 psi 91 --- --- 1046 07 2071 (00) 1002 (00) 874 (00)
E20 - 9 psi 558 --- --- 4106 00 2840 (00) 2218 (00) 2034 (00)
E10 - 10 psi 551 --- 821 3024 2450 25454 (040) NA NA
E10 - 7 psi 481 --- 1664 2511 62 6783 (00) NA NA
E10 - 10 psi 106 --- --- 1489 00 1243 (00) 879 (00) 1028 (200)
E10 - 7 psi 218 --- --- 2012 00 1848 (00) 1002 (00) 758 (00)
E0 - 9 psi 32 --- --- 1158 04 1005 (00) 708 (00) 574 (00)
E0 - 7 psi 09 --- --- 1845 18 1016 (00) 712 (00) 570 (00)
E20 - 9 psi 47 --- --- 1168 49 1310 (00) 833 (00) 750 (00)
E10 - 10 psi 244 --- --- 1331 574 4920 (00) 8394 (00) 113738 (49)
E10 - 7 psi 239 --- --- 1057 329 5242 (00) 3974 (00) 3944 (00)
E0 - 9 psi 107 --- --- 967 521 4559 (00) 3585 (00) 11017 (00)
E0 - 7 psi 252 --- --- 363 33 4943 (00) 3190 (00) 2815 (00)
E20 - 9 psi 168 --- --- 1394 560 4709 (00) 4400 (00) 7518 (00)
E10 - 10 psi 104 90 --- 719 16 3192 (00) 2602 (00) 2370 (00)
E10 - 7 psi 122 --- --- 979 00 2247 (00) 2317 (00) 2675 (00)
E0 - 9 psi 85 --- --- 811 251 2021 (00) 1659 (2) 1763 (72)
E0 - 7 psi 87 --- --- 797 225 2483 (00) 2941 (00) 2888 (00)
E20 - 9 psi 193 --- --- 1025 00 4168 (00) 4148 (00) 4506 (00)
E10 - 10 psi 324 --- --- 1742 118 25907 (578) 34779 (630) 36014 (643)
E10 - 7 psi 325 --- --- 1683 192 3975 (02) 3550 (01) 3621 (04)
E0 - 9 psi 178 136 --- 1091 254 3270 (00) 2667 (00) 2746 (108)
E0 - 7 psi 204 380 --- 787 00 2117 (00) 2208 (00) 2081 (00)
E20 - 9 psi 204 --- --- 543 74 4685 (00) 4526 (00) 4198 (00)
216
211
2004
Toyota
Camry
XLE
215
2004
Toyota
High-
lander
212
2006
Ford
Taurus
214
2004
Ford
Escape
211L
207L
Static Permeation - mghr Dynamic Perm - mghr
CRC E-77-2 Program Test Results
Diurnal (65ordm to 105ordm) - mgday
202
1996
Taurus
205
2001
Toyota
Corolla
204
1999
Honda
Accord
207
2001
Dodge
Caravan
202L
Table 13
41
Individual Vehicle Diurnal Performance on the Various Fuels
0
1000
2000
3000
4000
5000
6000
0 10 20 30 40 50 60 70
Cu
mu
lati
ve
Pe
rme
ati
on
-m
g
Test Time - hrs
Three Day DiurnalVehicle 204 1999 Honda Accord
10 psi E10
7 psi E10
9 psi E0
7 psi E0
9 psi E20
0
1000
2000
3000
4000
5000
6000
0 10 20 30 40 50 60 70
Cu
mu
lati
ve
Pe
rme
ati
on
-m
g
Test Time - hrs
Three Day DiurnalVehicle 205 - 2001 Toyota Corolla
10 psi E10
7 psi E10
9 psi E0
7 psi E0
9 psi E20
Figure 25 ndash Vehicle 204 Diurnal Performance
Figure 26 ndash Vehicle 205 Diurnal Performance
42
0
500
1000
1500
2000
2500
3000
3500
4000
4500
5000
0 10 20 30 40 50 60 70
Cu
mu
lati
ve
Co
rre
cte
d P
erm
ea
tio
n -
mg
Test Time - hrs
Three Day DiurnalVehicle 207 - 2001 Dodge Caravan
10 psi E10
7 psi E10
9 psi E0
7 psi E0
9 psi E20
0
100
200
300
400
500
600
700
800
900
0 10 20 30 40 50 60 70
Cu
mu
lati
ve
Pe
rme
ati
on
-m
g
Test Time - hrs
Three Day DiurnalVehicle 211 - 2004 Toyota Camry XLE
10 psi E10
7 psi E10
9 psi E0
7 psi E0
9 psi E20
Figure 27 ndash Vehicle 207 Diurnal Performance
Figure 28 ndash Vehicle 211 Diurnal Performance
43
0
50
100
150
200
250
300
350
400
450
500
0 10 20 30 40 50 60 70
Cu
mu
lati
ve
Pe
rme
ati
on
-m
g
Test Time - hrs
Three Day DiurnalVehicle 212 - 2006 Ford Taurus
10 psi E10
7 psi E10
9 psi E0
7 psi E0
9 psi E20
0
500
1000
1500
2000
2500
3000
3500
4000
4500
5000
0 10 20 30 40 50 60 70
Cu
mu
lati
ve
Pe
rme
ati
on
-m
g
Test Time - hrs
Three Day DiurnalVehicle 214 2004 Ford Escape
10 psi E10
7 psi E10
9 psi E0
7 psi E0
9 psi E20
Note The incomplete cumulative results for the 10 psi E10 results resulted from a conflict for the use
of the INNOVA analyzer during the test The INNOVA analyzer is required to correct for the FIDrsquos
ethanol error and the presence of methanol and refrigerant (R-134a) The data was available for the
50+ hour results and the data is valid as shown We have no explanation for the high levels
experienced on the third day of the test No test errors were identified
Figure 29 ndash Vehicle 212 Diurnal Performance
Figure 30 ndash Vehicle 214 Diurnal Performance
44
0
200
400
600
800
1000
1200
1400
1600
0 10 20 30 40 50 60 70
Cu
mu
lati
ve
Pe
rme
ati
on
-m
g
Test Time - hrs
Three Day DiurnalVehicle 215 2004 Toyota Highlander
10 psi E10
7 psi E10
9 psi E0
7 psi E0
9 psi E20
Figure 31 ndash Vehicle 215 Diurnal Performance
45
Table 14
Test Corrected
Vehicle Fuel Total Fuel EtOH R134a Methanol
204 10 psi E10 509899 144040 18298 16754
1999 Honda 7 psi E10 359057 130806 17551 15221
Accord 9 psi E0 178635 13843 18230 9896
7 psi E0 94846 1856 16631 2379
9 psi E20 304271 128408 18261 12143
205 10 psi E10 526659 186599 23354 20895
2001 Toyota 7 psi E10 502229 204246 25990 19198
Corolla 9 psi E0 148775 000 20434 4613
7 psi E0 111536 5489 22408 5619
9 psi E20 514540 212708 25677 19584
207 10 psi E10 389450 196248 12013 30399
2001 Dodge 7 psi E10 272201 114027 11731 19616
Caravan 9 psi E0 105167 1820 12224 15284
7 psi E0 96906 1118 22141 14276
9 psi E20 427882 241488 14268 25432
211 10 psi E10 78164 19733 15159 46970
2004 Toyota 7 psi E10 61190 20211 15929 46525
Camry LE 9 psi E0 34668 1681 14329 42659
7 psi E0 39468 000 16197 57303
9 psi E20 71013 26726 16213 36879
212 10 psi E10 31508 7222 14831 7896
2006 Ford 7 psi E10 36079 10132 15481 3400
Taurus 9 psi E0 22870 2409 15182 3761
7 psi E0 22973 000 15393 4362
9 psi E20 28935 11156 14116 2629
214 10 psi E10 1257887 000 19947 27992
2004 Ford 7 psi E10 131593 24571 16025 8879
Escape 9 psi E0 191611 2940 16487 7213
7 psi E0 109481 5386 80650 3106
9 psi E20 166271 24097 14491 6096
215 10 psi E10 81644 12178 14658 42609
2004 Toyota 7 psi E10 72399 15092 15532 36061
Highlander 9 psi E0 54431 000 14806 25822
7 psi E0 83115 000 14072 26255
9 psi E20 128223 38822 12841 34420
3 Day Diurnal Results
CRC E77-2 Program Diurnal ResultsAll values are in mg
46
0
200
400
600
800
1000
1200
1400
1600
1800
2000
Co
rrecte
d D
aily D
iurn
al
-m
g
Diurnal Ethanol PortionVehicle 204 - 1999 Honda Accord
Ethanol Portion
10 psi E10 9 psi E07 psi E10
1 32
315
341368
383
264273
1 321 321 321 32
9 psi E207 psi E0
1122097
39
0510
442
405412
Figure 32 ndash Vehicle 204 Diurnal Ethanol Portion
0
200
400
600
800
1000
1200
1400
1600
1800
2000
Co
rrecte
d D
aily D
iurn
al
-m
g
Diurnal Ethanol PortionVehicle 205 - 2001 Toyota Corolla
Ethanol Portion
10 psi E10 9 psi E07 psi E10
1 32
359
406
382
431355349
1 321 321 321 32
9 psi E207 psi E0
0 00
712649
406
420414
Figure 33 ndash Vehicle 205 Diurnal Ethanol Portion
47
0
200
400
600
800
1000
1200
1400
1600C
orr
ecte
d D
aily D
iurn
al
-m
g
Diurnal Ethanol PortionVehicle 207 - 2001 Dodge Caravan
Ethanol Portion
10 psi E10 9 psi E07 psi E10
1 32
488
442408
409
490535
1 321 321 321 32
9 psi E207 psi E0
00
1144
27
0101
556
587552
Figure 34 ndash Vehicle 207 Diurnal Ethanol Portion
0
50
100
150
200
250
300
350
400
Co
rrecte
d D
aily D
iurn
al
-m
g
Diurnal Ethanol PortionVehicle 211 - 2004 Toyota Camry XLE
Ethanol Portion
10 psi E10 9 psi E07 psi E10
1 32
264
242245
1 321 321 321 32
9 psi E207 psi E0
329
306356
00
73
64
00
00
00
325
431
370
Figure 35 ndash Vehicle 211 Diurnal Ethanol Portion
48
0
20
40
60
80
100
120
140
160
180
200C
orr
ecte
d D
aily D
iurn
al
-m
g
Diurnal Ethanol PortionVehicle 212 - 2006 Ford Taurus
Ethanol Portion
10 psi E10 9 psi E07 psi E10
1 32
216
170
316
1 321 321 321 32
9 psi E207 psi E0
194
288
436 102
105
85
00
00
00476
529
243
Figure 36 ndash Vehicle 212 Diurnal Ethanol Portion
0
200
400
600
800
1000
1200
Co
rrecte
d D
aily D
iurn
al
-m
g
Diurnal Ethanol PortionVehicle 214 - 2004 Ford Escape
Ethanol Portion
10 psi E10 9 psi E07 psi E10
1 32
00
1 321 321 321 32
9 psi E207 psi E0
201
202152
38
05
19
56
1469
103
171188
143
67
11275
Figure 37 ndash Vehicle 214 Diurnal Ethanol Portion
49
0
50
100
150
200
250
300
350
400
450
500C
orr
ecte
d D
aily D
iurn
al
-m
g
Diurnal Ethanol PortionVehicle 215 - 2004 Toyota Highlander
Ethanol Portion
10 psi E10 9 psi E07 psi E10
1 32
121
136
196
1 321 321 321 32
9 psi E207 psi E0
198
217213
0000
00
0000
00
335 292
283
Figure 38 ndash Vehicle 215 Diurnal Ethanol Portion

5
The Test Concept Measuring Leaks Permeation and Diurnal Vapor Losses
Mass emissions are measured in a VT SHED or Variable Temperature Sealed Housing for
Evaporative Determination The SHED test method
combines all three emission mechanisms (leaks
diurnal venting and permeation) into a single test
result
The SHED technique involves placing the vehicle in
a sealed enclosure (Figure 2) and calculating the
mass in the enclosure from the volume density and
concentration in the enclosure at the start and end of
a time period The difference between the mass at
the start and end of test is the emission rate eg
grams per unit time
CRCrsquos E-77 emission test programs have
developed (and strive to continually improve)
new methodologies for understanding and quantifying vehicle evaporative emission rates The
concept partitions and assigns the vehiclersquos contribution to the evaporative emission inventory
into three mechanisms
1 Permeation
2 Tank vapor venting
3 Leaks (with two subsets - Liquid and Vapor)
Permeation is the migration of HC through the various elastomers (polymers) in a vehicle fuel
system6 Previous testing has shown that permeation rate is strongly affected by the materialrsquos
temperature doubling for each 10ordmC (18ordmF) increase in the range of normal summer
temperatures It is also strongly affected by gasoline composition especially with ethanol-
containing fuels
6 ldquoFuel Permeation from Automotive Systems Final Report CRC Project E-65rdquo Haskew Liberty and McClement
September 2004 available on the CRC and California Air Resources Board websites
Figure 2 ndash Sealed Housing for Evaporative
Determination
6
Tank vapor venting emissions are controlled by fitting a carbon canister to the atmospheric tank
vent Figure 3 is a schematic of a typical early control system During a daily heating period the
temperature of the vehiclersquos fuel tank increases forcing HC vapors from the tank Excess
emissions exceeding the carbon canisterrsquos capacity are vented to the atmosphere
Figure 3 - Control System Schematic
Leaks can be liquid or vapor Permeation and tank venting losses are strongly driven by fuel
composition ambient temperature and ambient temperature change Liquid leaks are not
strongly affected by normal summer temperatures and are thought to have two components
1 Static leaks occurring while the engine is turned off and the vehicle is stationary
2 Increase in leak rate caused by the system pressure increase during engine operation
A Test Method for Separating Permeation from Tank Venting and Leaks ndash In a previous
CRC Project (E-65) the canister loss was separated from the permeation measurement by
venting the losses from the carbon canister outside
the SHED For Project E-77 the canister vent
losses were collected and measured in a separate
ldquotrap canisterrdquo on a scale outside the SHED as
shown in Figure 4 This vent line was capped off
(ie sealed during the Static Test) but connected
as shown in the figure for the Dynamic and the
Diurnal Test The ambient temperature in the
SHED was constant during the static test and
there was no vapor created at constant
temperature
Figure 4 - Trap Canister
7
This vent was closed to pressurize the system for the leak evaluations The resulting SHED
increase in HC mass was permeation7 The last mechanism that needed to be evaluated was
leaks Leaks can be both vapor and liquid A liquid leak can have significant mass currently
undetected by the vehiclersquos on-board diagnostic system Considerable thought and effort have
gone into the creation of a simple and effective liquid leak detection methodology without
success The techniques used in this project required the use of a SHED for measurements The
techniques were not simple but they proved effective
Based on experience a vehiclersquos permeation rate is expected to be between the range of 4 to 90
mghour at the 86degF test temperature The presence of a static liquid leak is expected to
overwhelm this value such a leak would (or could) be apparent by inspection Leaks from the
vehicles were quantified in a three-step test process The first step was to measure the static
permeation rate of the vehicle at 86ordmF The vehicle was allowed to stabilize overnight at 86ordmF in
the SHED and the permeation rate was calculated from the mass increase in the SHED during a
one-hour measurement period The second part of the test looking for pressure driven leaks in
the vapor system was performed by pressurizing the vehiclersquos tank to 5rdquo H2O through a special
fuel cap and tubing from outside the SHED (Figure 5) The special fuel cap the hose and the
pressurization apparatus were installed before the start of the sequence The HC concentration in
the SHED was monitored and the increase in the mass of HC in the SHED during the 30-minute
pressurization period compared to the static permeation rate If there was no (or insignificant)
rate of increase it was deduced that no vapor leak was present
The third and final part of the test was to energize the vehiclersquos fuel pump and pressurize the
system up to and including the injectors (Figure 6) If there were a pressure leak in the liquid
system an increase in the SHED mass over the 30-minute measurement period would be seen
ie the leak would be additive to the permeation rate
6 This is a simplification There are other HC sources present that are not fuel permeation These include tire paint
adhesives and vinyl emissions and the possibility of fuel leaks from the fuel injectors We believe these to be a
minor component of the emissions measured in this study
Figure 5 - Static Test ndash Tank Pressurization
8
Figure 6 ndash Static Test ndash Fuel Pump Energized
Other Tests (Dynamic Hot Soak and Diurnal) - A similar configuration is used to isolate the
tank venting losses from the permeation measurements determined by other test procedures The
vehiclersquos canister vent is connected with a low permeation hose (Teflontrade) to a bulk-head fitting
in the SHED wall and then to a separate ldquotrap canisterrdquo on a top-loading scale Any HC
emissions that escape from the vehiclersquos canister are captured in the trap canister and measured
at a 001 g (10 milligram) precision The trap canister (a 1 Liter Ford model) is purged before
each test and maintained at a ldquodryrdquo condition so that it captures all of the vehiclersquos escaping
emissions This assumption is probably violated during the high volatility tests where there are
30 grams of daily emissions but this is not a concern at this time
Test Elements for E-77-2 - The following flow chart (Figure 7) displays the various elements
utilized during the testing of the various vehicles and fuels during this program Details of each
of the four basic tests follow the flow chart
9
Drain and 40 Fill
with 10 psi E10 Test Fuel
Road Preconditioning
Four LA-4rsquos or Equivalent
Drain and 40 Fill
with 10psi E10 Test Fuel
Overnight Park at 86degF
Move to SHED
Connect Test Instrumentation
Stabilize at 86degF
Perform Constant Temperature
Permeation Series (86degF)
1 hour Permeation Rate Test
frac12 hour Tank Pressurized Test
frac12 hour Pump Energized Test
Transfer to RL SHED
Connect Test Instrumentation
Stabilize at 86degF
Perform Dynamic Permeation Test
Two LA92 Driving Cycles amp
One Hour Hot Soak
Drain and 40 Fill
With 10 psi E10 Test Fuel
Road Preconditioning
Four LA-4rsquos or Equivalent
Move to VT-SHED
Connect Test Instrumentation
Stabilize at 65degF for 6 hrs Minimum
Perform 3-Day Diurnal Evaluation
72 hr 65deg to 105degF VT Test
Drain and 40 Fill
with 7 psi E10 Test Fuel
Condition Fuel System
By Driving for One Week
Repeat Steps 1 ndash 12
On 7 psi E10 Test Fuel
Drain and Fill with 9 psi E0 Test Fuel
Condition Fuel System by 4 weeks Driving
Repeat Steps 1 ndash 12
On 9 and 7 psi E0 and
Repeat Steps 0-12
On 9 psi E20 Test Fuels
Precondition Fuel System
With 4 Weeks Driving on
10 psi E10 Test Fuel
1
2
3
4
5
6
7
8
9
10
11
12
0
Figure 7 ndash Testing Flow Chart
10
Test Procedures ndash There are four basic tests in the E-77-2 test protocol
1 Static Permeation Rate (includes checks for vapor and liquid leaks)
2 Running Emissions (Dynamic Test)
3 Hot Soak
4 Diurnal
Each is described in detail below
1 Static Permeation Rate Testing
The constant temperature (static) permeation rate is measured in a traditional SHED (Constant
temperature) in the following manner
A The fuel tank is drained and filled to 40 tank capacity with the test fuel
B The day before testing the vehicle is driven over four road trips of 75 miles each
to precondition the canister8 (These drives are similar to the LA-4)
C Upon return from the road pre-conditioning the fuel tank is drained and filled to
40 tank capacity with the test fuel9
D Vehicle is parked for 18-22 hours in a controlled temperature environment at test
temperature (86ordmF)
E The vehicle is then moved (without starting) into the test (86ordmF) SHED
F The canister vent is connected to the SHED bulkhead fitting which routes the
vapor to the trap canister outside the SHED
G The tank system pressurization hose is connected
H The fuel pump electrical connection is connected
I The SHED is sealed the inside temperature is allowed to stabilize and the test is
started Continuous THC measurements are made using a FID Ethanol
methanol and R134a concentrations are measured using an INNOVA analyzer
All measurements are made at least every minute for one hour to determine the
stabilized permeation rate
J At the end of the static test (60 minutes) the vehiclersquos vapor system is pressurized
to 5 inches of water for thirty minutes Measurements are made to quantify vapor
leaks as determined by a change in the THC in the SHED
K The fuel pump is then energized for 30 minutes while maintaining the 5 inches of
water on the vapor system Liquid leaks are quantified as determined by a change
in the concentration of THC in the SHED
The purpose of steps J and K above is to validate that the permeation rate measurement was
made without the presence of any leak ndash either liquid or vapor A detailed discussion follows
starting at page 12
8 This conditioning can be done in the laboratory on a chassis dynamometer if proper attention is paid to underbody
cooling and unrepresentative fuel tank temperatures are avoided 9 Vehicles with ORVR systems will add the refueling vapors to the canister This is OK
11
2 Running Loss Test (Dynamic Test)
A The vehicle is placed in the RL-SHED and prepared for test (The fuel level and
condition for the dynamic test is the fuel remaining after completion of the static test ndash
40 fresh fill of the appropriate test fuel)
B Outside air source for the engine is connected
C Vehicle exhaust is connected
D Fuel tank thermocouple is connected
E Canister vent is connected to the SHED bulkhead fitting which routes the vapor to the
trap canister outside the SHED
F Vehicle is allowed to stabilize in the RL-SHED at test temperature (86degF) for a minimum
of 12 hours ndash preferably overnight
G Two cycles of the Unified Cycle (LA-92) driving schedule (48 mins) are driven while
measuring the mass emissions in the SHED Vehicle is allowed to idle (in drive) for 30
seconds between the two cycles Ambient air temperature is maintained (to the extent
possible) at 86degF Fuel tank surface temperature is monitored during vehicle operation It
should increase during the drive from 10 to 18degF to simulate expected on-road
temperature increase Measured mass emissions are corrected using the INNOVA data
for the ethanol methanol and refrigerant emissions
3 Hot Soak10
This procedure is executed immediately following the Running Loss Test procedure
described above
A Engine is turned off transmission selector is placed in park and driver exits the
enclosure using the double door air lock taking care to minimize any air exchange
between the laboratory and the SHED This starts the one hour ldquohot soakrdquo period
B Measurements of mass emissions in the SHED are continued for another 60 minutes
(until time = 108 minutes) correcting for the ethanol methanol and refrigerant mass
using the INNOVA instrument data This ends the hot soak Hot soak emissions are
calculated as the net difference for the one hour hot soak (CorrMass108 ndash CorrMass48
minus the 86degF static hourly rate all mass rates in mghour)
4 Diurnal Test
A The fuel tank is drained and filled to 40 tank capacity with the test fuel
B The day before testing the vehicle is driven over four road trips of 75 miles each to
precondition the vehicle and the canister
C Upon return from the road pre-conditioning the fuel tank is drained and filled to 40
tank capacity with the test fuel
D The vehicle is parked for 18-22 hours in a controlled temperature environment at the
initial diurnal test temperature (65ordmF)
E The SHED is sealed allowed to stabilize at the 65degF temperature and the 3-day
California Diurnal Test is started
10 We define the ldquohot soakrdquo to be the temporary increase in emission rate caused by the immediately preceding
operation of the vehicle It is the increase in the SHED mass (corrected for EtOH MeOH and R-134a) over the
one hour period minus the previously established ldquostaticrdquo permeation rate
12
F ldquoContinuousrdquo (every 30 seconds) THC measurements are made using a FID Ethanol
methanol and R134a (refrigerant) concentrations are measured using an INNOVA
analyzer at least every 10 minutes for the duration of the test (72 hours)
Static Permeation Test ndash Leak Validation
If a leak is detected during either the vapor system pressure portion (Step J) or the pump
energized portion (Step K) of the Static Permeation Test procedure it calls into question whether
the permeation rate measurement accurately reflects fuel system permeation or if instead a
combination of permeation and the implied leak was measured If a leak is confirmed the
permeation rate measurement is called into question and an investigation possible remedy and
retest is indicated
The permeation rate measurement must be corrected for the FIDrsquos ethanol misrepresentation and
the presence of non-fuel hydrocarbons (methanol and refrigerant) The leak check however is
made using the change in mass increase in the SHED using the uncorrected FID mass calculation
as the determinate It was found that the corrections for ethanol methanol and refrigerant were
introducing ldquonoiserdquo into the trace and that these were being misinterpreted as leaks
y = 062x - 19
y = 047x + 67
y = 055x - 01
0
10
20
30
40
50
60
70
80
90
100
0 20 40 60 80 100 120
SH
ED
Mas
s -
mg
Test Time - minutes
Leak TestVehicle 204 - 1999 Honda Accord - 9 psi E0
Test 7028
Pump ActivatedTank Pressurized
Figure 8 above represents the calculations made during the inspection of data from a successful
test EXCELrsquostrade ldquoSLOPErdquo function is used to calculate the linear regression values based on
the FID calculation for mass for Time 0 to 60 minutes Time 64 to 90 minutes and Time 94 to
120 minutes A 4-minute gap was included between each sequence to establish the new mass
emission rate during the ldquopressure onrdquo (T60 to T90) and the ldquopump energizedrdquo periods
The slope of 047 for the ldquoTank Pressurizedrdquo period in the example above is compared to the
slope of 062 calculated for the permeation rate (or hot soak) period Since the ldquoTank
Figure 8 ndash Leak Test
13
Pressurizedrdquo slope is not more than 10 higher than the hot soak permeation rate we assume
that there is no leak present A similar comparison is made for the slope determined during the
ldquopump onrdquo period The choice of a 10 allowance is arbitrary and is used here to allow for
normal and unavoidable test variation
For tests in which the above procedure determines that no leak is present a value of zero is
reported in the test summary for the leak results If a positive value is reported it calls that test
into question and an investigation possible repair and retest is indicated
Static Permeation Rate Determination
The static permeation rate is determined based on a linear regression through the individual
SHED mass data points (data measured each 30 seconds) of the corrected fuel results (corrected
for the FID error and subtracting the methanol and refrigerant) from the first 60 minutes of
testing as illustrated in Figure 9 below
y = 05636x + 0505
0
5
10
15
20
25
30
35
40
45
0 10 20 30 40 50 60
Pe
rme
ati
on
-m
gs
Test Time - mins
Static Permeation DeterminationVehicle 204 - 1999 Honda Accord - 9 psi E0 Fuel
Raw SHED
Corrected Fuel
Permeation Rate Based on Corrected Results
Permeation Rate = 5636 x Time = 338 mgshr
In this example the static permeation rate is 338 mghr
Dynamic (Running Loss) and Hot Soak Test
The preceding section addressed the concepts of separating the permeation emissions from the
tank venting emissions and establishing the presence or absence of leaks The second part of
this study includes a dynamic test to measure the permeation and tank venting emissions during
Figure 9 ndash Static Permeation Determination
14
vehicle operation (ldquorunning lossesrdquo) and the temporary condition following vehicle operation
known as the ldquohot soakrdquo
This is considered a ldquodynamicrdquo test because the vehicle is driven and the fuel and vapor system
temperatures rise during the test The ambient temperature in the Running Loss SHED during
the test was held constant at 86degF while the vehiclersquos fuel system temperature rose during the
test Two 1435 second (239-minute) LA-92 driving cycles were performed consecutively during
the running loss measurements with a 30-second idle in-between During this test tank fuel
temperature was expected to rise by an average approximately 18degF above the initial ambient
temperature The running loss air handling system included a proportional speed under-car
blower operated as a slave to dynamometer speed This apparatus was used during running loss
testing with minor tuning for specific vehicles Without additional input it is capable of
reasonable fuel tank temperature control Each vehicle was fitted with a surface-mount
thermocouple at the front of the fuel tank located at approximately the 18th
fill level to measure
the fuel liquid temperature No attempt was made to follow a predefined fuel tank temperature
profile (FTTP) in this program Fuel temperatures were recorded and results are available in the
real-time records
Vehicle running loss emissions are measured in a special version of a SHED known as a
Running Loss SHED (RL-SHED) shown in Figure 10 Special features of the RL-SHED
include a sealed chassis dynamometer for simulating vehicle driving loads a sealed outside air
supply for engine intake a sealed exhaust conduit for engine exhaust and an under-chassis fan
for simulating underbody air flow as described above A vehicle is operated inside the RL-SHED
over a chosen driving cycle The increase in HC emissions inside the enclosure are measured
and calculated as mass emissions per 40 CFR sect86163-96
Figure 10 - Running Loss SHED
15
Vehicle testing in an RL-SHED is complicated by several factors including
1 Engine must be supplied with external induction air
2 Exhaust must be conducted externally without any leaks
3 Load supplied to the vehicle through the chassis dynamometer must not create or
allow external leaks
4 Internal SHED temperature must be maintained while sizable heat is rejected to the
ambient by the running engine and exhaust
5 Cooling air supplied to the radiator must be modulated to represent the vehiclersquos road
speed
6 Underbody (and especially the fuel system) temperature should represent the rate of
rise experienced by a real road-drive
Canister vent losses were isolated from permeation emissions using the technique previously
described The vehiclersquos carbon canister fresh air vent was connected to the outside of the RL-
SHED using a leak-tight PTFEreg
hose (38rdquo OD commercial tubing US Plastics 58055 PTFE or
equivalent) connected to a small carbon ldquotraprdquo canister located on a top-loading precision scale
The scale precision was 001 grams (10 milligrams) and it was purged prior to each test There
were no tank venting emissions measured on any of the running loss test measurements All of
the vehicles appeared to be actively ldquopurgingrdquo their respective control canisters and drawing
fresh air during the test If there were any emissions from the vehiclersquos control canister as might
have occurred if there were no vehicle purge or if very high volatility fuels with excessive vapor
generation were used they would have been measured
The Running Loss Driving Cycle consisted of two cycles of the ldquoUnified Driving Cyclerdquo
otherwise known as the LA-92 A velocity versus time plot for one cycle is shown in Figure 11
The LA-92 cycle takes 24 minutes to complete and covers 98 miles with many speed changes
Two back-to-back cycles were driven the first as a ldquocold startrdquo and the second following a 30-
second vehicle idle The ldquocold startrdquo condition was created by soaking the vehicle for a
Figure 11 ndash Running Loss Driving Cycle
Unified Cycle (LA-92)
0
10
20
30
40
50
60
70
80
0 5 10 15 20 25Test Time - minutes
Spe
ed -
mph
Cycle Time (min) 239
Maximum Speed (mph) 672
Average Speed (mph) 246
Average Non-Zero Speed (mph) 294
Time Zero Speed () 162
Distance (miles) 982
16
minimum of 18 hours at 86degF moving it to the stabilized 86degF RL-SHED making the test
connections and then waiting a minimum of one hour before the initial start and run
The SHED emissions were measured during 48 minutes of engine operation and then
continuously for one hour after the engine was turned off This one hour engine-off duration
was the ldquohot soakrdquo period The total test time is 1 hour and 48 minutes
Figure 12 shows results from the 9 psi E0 fuel test on Vehicle 204 The horizontal axis is test
time in minutes and the vertical axis is the HC mass measured in the RL-SHED during the test
period
The engine was shut off at the end of the second LA92 drive cycle (~48 minutes) and the
analysis system continued to measure the HC emissions in the SHED for the next 60 minutes
This represented the ldquohot soakrdquo portion of the test
0
50
100
150
200
250
300
0 20 40 60 80 100 120
Co
rre
cte
d T
ota
l F
ue
l C
um
ula
tiv
e P
erm
ea
tio
n -
mg
Test Time - minutes
Running Loss and Hot SoakVehicle 204 - 1999 Honda Accord - 9 psi E0 Fuel
Test 25668
Running Loss Hot Soak
Running Loss Std =005 gmiThis Test = 0010 gmi
RL = 249 mghr
2774
2332
Tru HS = 442
1990
The ldquoTruerdquo Hot Soak
The traditional hot soak is determined from the increase in SHED emissions as measured for one
hour following a prescribed drive to heat up the vehicle (2 LA-92 cycles during the Running
Loss Test) Hot soak emissions however have two components that caused by the elevated
temperature resulting from the drive and that resulting from one hour of static permeation
Figure 12 ndash Running Loss Test Results
17
To separate these two components and determine the ldquotruerdquo hot soak emissions the following
procedure was used ldquoTraditionalrdquo hot soak emissions were first calculated by subtracting the
ldquostart of hot soakrdquo cumulative SHED hydrocarbon value (ie 199 mg t = 48 minutes) from
the final cumulative SHED hydrocarbon value (ie 2774 mg t = 108 min) This resulted in a
cumulative SHED hydrocarbon value of 78 mg for the 1 hour hot soak The previously
determined static permeation value (ie 338 mg for a 1 hour hot soak test- see Figure 9) was
then subtracted to arrive at the ldquotruerdquo hot soak value of 442 mg The increase in the permeation
rate (the ldquohot soak effectrdquo) caused by the increase in the system temperature is accounted for by
subtracting the ldquostabilized permeation raterdquo at 86degF
In Figure 12 the static permeation rate is superimposed as a solid blue line on the plot from the
starting point of the hot soak until its end (one hour) While the ldquotraditionalrdquo hot soak would be
calculated as 78 mg (277 mg ndash 199 mg) the ldquotruerdquo hot soak is determined as 442 mg (2774 mg
ndash 2332 mg) True hot soak values reported here were determined in this manner
Diurnal Test
Diurnal permeation was determined by subjecting the vehicle to a three-day period in a
temperature controlled SHED while continuously recording the total hydrocarbon every 30
seconds The SHED environmental temperature was varied from 65degF to 105degF per the
California Diurnal Test protocol Canister vent losses were isolated from permeation emissions
using the technique previously described The vehiclersquos carbon canister fresh air vent was
connected to the outside of the RL-SHED using a leak-tight PTFEreg
hose connected to a small
carbon ldquotraprdquo canister located on a top-loading precision scale The scale precision was 001
grams (10 milligrams) and it was purged before each test
DISCUSSION OF TEST RESULTS
Results
Emission results are presented below by ldquomechanism11
rdquo with the data averaged for the five
ldquoenhancedrdquo and the two ldquonear zerordquo vehicles The lone ldquopre-enhancedrdquo vehicle the 1996 Ford
Taurus (202) was a special case and will be discussed in a separate section Two of the vehicles
the 2001 Dodge Caravan (207) and the 2004 Toyota Camry (211) were also subjected to limited
testing with an ldquoimplanted leakrdquo (a 0020rdquo dia hole in a special tank gas cap) to investigate the
magnitude of a known leak These results (ldquoLeakersrdquo) follow the discussion on the Taurus
Static Permeation Rate (Constant Temperature (86degF)) - Average permeation rate compared
by fuel specification for two vehicle groups ldquoenhancedrdquo and the ldquonear zerordquo evaporative
emissions
11 The ldquomechanismsrdquo are 1 Permeation 2 Tank Venting (Daily Temperature Rise) and 3 Leaks
18
0
10
20
30
40
50
60
Co
rrecte
d P
erm
eati
on
Rate
-m
gh
r
Fuel
Static Permeation Rate - All FuelsE77-2 Program Vehicles
7 E0 9 E2010 E107 E109 E0 7 E0 9 E2010 E107 E109 E0
Enhanced(5 veh)
Near Zero(2 veh)
Figure 13 presents the static permeation rate performance for the average of the 5 ldquoenhancedrdquo
and 2 ldquonear zerordquo vehicles on the five fuels included in the test program Each group is ordered
from left to right by ethanol level The vertical scale is the average permeation rate in mghour
for the static (86degF constant temperature) test
Previous studies1213
had shown that vehicles operated on the fuel containing 10 vol- ethanol
would have higher permeation rates compared to those resulting from operation on a non-ethanol
(E0) fuel of similar properties We also expected that vehicles using higher vapor pressure fuel
would exhibit increased permeation levels at similar ethanol levels Other studies had reported
mixed results when comparing E20 permeation rates against E10 measurements ndash some were
higher and some were lower The difference may have been within the repeatability of the
measurements and probably suffered from a limited number of observations These mixed
results are present in this testing of the enhanced vehicles however the E20 (violet bar) is higher
on average for static permeation rate for the Near Zero group The data that were used to
construct the averages in Figure 13 are listed in Table 3 below There is significant variability in
the test results and the limited sample size precludes making conclusive statements with
statistical confidence
12 CRC E-653 Fuel Permeation from Automotive Systems E0 E6 E10 E20 and E85 December 2006 13
CRC E-77 Vehicle Evaporative Emission Mechanisms A Pilot Study June 2008
Figure 13 ndash Static Permeation Rate Comparison
19
Table 3
Vehicle ID Technology 7psi E0 9 psi E0 7 psi E10 10 psi E10 9 psi E20
204
1999 Honda Enhanced 129 338 664 843 553
Accord
205
2001 Toyota Enhanced 99 195 596 416 462
Corolla
207
2001 Dodge Enhanced 401 325 644 787 882
Caravan
214
2004 Ford Enhanced 252 107 239 244 168
Escape
215
2004 Toyota Enhanced 87 85 122 104 193
Highlander
194 210 453 479 452
211
2004 Toyota Near Zero 91 101 94 199 558
Camry XLE
212
2006 Ford Near Zero 09 32 218 106 47
Taurus
50 67 156 153 303
Static Permeation Rate - mghr
CRC E-77-2 Program - Static Permeation Results
Enhanced Averages
Near Zero Averages
Summary ndash Static permeation rate increased with increase in ethanol level Three of the 5
enhanced emission vehicles did not show an increase in permeation rate when tested with the 9
psi E0 compared to the 7 psi E0
20
Dynamic (Running Loss) Permeation - In a similar presentation Figure 14 shows the average
ldquoRunning Lossrdquo permeation rate for the vehicle types and the fuels tested ldquoRunning Lossrdquo
permeation as described here is the permeation measured during a ldquocold startrdquo 48 minute drive in
a Running-Loss SHED (RL-SHED) at 86degF
0
50
100
150
200
250
300
350
400
7E0 9E0 7E10 10E10 9E20 7E0 9E0 7E10 10E10 9E20
Co
rre
cte
d R
un
nin
g L
os
s P
erm
ea
tio
n -
mg
hr
Fuel
Running Loss Permeation Rate - All FuelsE77-2 Program Vehicles
Enhanced(5 vehs)
Near Zero(2 vehs)
The dynamic permeation rates for the enhanced vehicles (left panel) followed a similar pattern as
the static permeation The average of the E20 fuel was the highest of the average values
observed on both the enhanced and the near-zero vehicles (left and right panels respectively)
Table 4 below shows the data used to generate the averages used in Figure 14
Figure 14 ndash Running Loss Permeation Comparison
21
Table 4
Vehicle ID Technology 7psi E0 9 psi E0 7 psi E10 10 psi E10 9 psi E20
204
1999 Honda Enhanced 2226 2492 2879 3164 2720
Accord
205
2001 Toyota Enhanced 671 1031 2328 1916 1697
Corolla
207
2001 Dodge Enhanced 8425 8339 8122 8581 10282
Caravan
214
2004 Ford Enhanced 363 967 1057 1331 1394
Escape
215
2005 Toyota Enhanced 797 811 979 719 1025
Highlander
2496 2728 3073 3142 3424
211
2004 Toyota Near Zero 1046 837 563 1383 4106
Camry XLE
212
2006 Ford Near Zero 1845 1158 2012 1489 1168
Taurus
1446 998 1288 1436 2637
Enhanced Averages
Near Zero Averages
CRC E-77-2 Program - Running Loss Permeation Results
Running Loss Permeation Rate - mghr
Summary ndash The dynamic permeation rate (measured during vehicle operation) was higher with
the E10 fuel compared to E0 for the enhanced vehicles The E20 permeation rate was higher
than E0 and the E10 fuel The small sample size and limited data precludes us from making
statements about statistical confidence but this may indicate a trend The near zero vehicle
average increased as the ethanol level increased Trends with volatility were mixed or
inconclusive
22
Hot Soak (ldquoTrue Hot Soakrdquo) Permeation ndash The Hot Soak emissions as defined in this report
are the net increase in permeation rate following vehicle operation We measured the mass
increase in the SHED for one hour immediately following vehicle operation and subtracted the
previously measured static (or normal) permeation at the same temperature While this is not the
traditional Code of Federal Regulations (CFR) definition we feel it is appropriate for the intent
of this project
0
10
20
30
40
50
60
70
7E0 9E0 7E10 10E10 9E20 7E0 9E0 7E10 10E10 9E20
Co
rre
cte
d H
ot
So
ak
Pe
rme
ati
on
-m
gh
r
Fuel
True Hot Soak Permeation Rate - All FuelsE77-2 Program Vehicles
Enhanced(5 vehs)
Near Zero(2 vehs)
The ldquoTrue Hot Soakrdquo performance for the average of the Enhanced Vehicles is summarized in
Figure 15 above There was a large increase in the hot soak value with the E10 fuel compared to
the E0 The hot soak value with the E20 fuel was comparable to the E0 results and lower than
the E10
The Near Zero vehicles (2) had zero hot soak emissions when tested on the 10 psi E10 fuel
(Figure 16) With only two vehicles and the very low levels attained no statistically significant
conclusions can be drawn from the data available Table 5 presents the individual tests used in
calculating the average values plotted in Figure 15
Figure 15 ndash True Hot Soak Permeation Comparison
23
Table 5
Vehicle ID Technology 7psi E0 9 psi E0 7 psi E10 10 psi E10 9 psi E20
204
1999 Honda Enhanced 187 443 297 04 134
Accord
205
2001 Toyota Enhanced 00 10 719 295 603
Corolla
207
2001 Dodge Enhanced 00 58 1222 2377 00
Caravan
214
2004 Ford Enhanced 33 521 329 574 560
Escape
215
2005 Toyota Enhanced 225 251 00 16 00
Highlander
89 257 513 653 259
211
2004 Toyota Near Zero 07 153 138 00 00
Camry XLE
212
2006 Ford Near Zero 18 04 00 00 49
Taurus
13 79 69 00 25
CRC E-77-2 Program - True Hot Soak Permeation Results
True Hot Soak Permeation Rate - mghr
Near Zero Averages
Enhanced Averages
Summary - The True Hot Soak permeation (permeation rate measured following vehicle
operation less the static constant temperature permeation rate) rate was higher with the E10 fuel
compared to E0 for the enhanced vehicles The E20 permeation rate was higher than E0 and
lower than the E10 fuel The near zero vehicle trends with both ethanol content and volatility
were mixed or inconclusive The small sample size and limited data precludes us from making
statements about statistical confidence
24
Diurnal Permeation Performance ndash Figure 16 presents the diurnal permeation results for the
first day of the three-day diurnal test (65deg to 105degF)
0
200
400
600
800
1000
1200
7E0 9E0 7E10 10E10 9E20 7E0 9E0 7E10 10E10 9E20
Co
rre
cte
d F
ue
l D
iurn
al
Pe
rme
ati
on
-m
gs
da
y
Day 1 Diurnal Permeation RatesAverages from E-77-2 Vehicles
Fuel
Enhanced(5 vehs)
Near Zero(2 vehs)
The average day 1 diurnal permeation for the five Enhanced Vehicles tended to increase as
ethanol content increased (with the exception of the E20 fuel) Again sample size and limited
data makes statistical conclusions inappropriate Table 6 presents the individual test used to
generate the averages used in Figure 16 The table includes the data from days 2 and 3 The
ethanol content of the diurnal measurements was calculated and appear in a series of figures in
the Appendix starting at page 37 Unlike Figure 16 the figures shown in the appendix have not
been corrected to exclude the non-fuel emissions (methanol and refrigerant) that were present
during these tests
Figure 16 ndash Day 1 Diurnal Permeation Comparison
25
Table 6
Vehicle ID Technology 7psi E0 9 psi E0 7 psi E10 10 psi E10 9 psi E20
204 Day 1 3672 6283 12601 15479 11034
1999 Honda Enhanced Day 2 2877 5810 11652 17799 9581
Accord Day 3 2936 5770 11653 17711 9812
205 Day 1 3830 4995 17834 17941 17752
2001 Toyota Enhanced Day 2 3654 4810 17150 17309 16900
Corolla Day 3 3670 5072 15239 17417 16802
207 Day 1 3975 4064 10865 14064 15480
2001 Dodge Enhanced Day 2 3026 3373 8120 12644 13702
Caravan Day 3 2689 3080 8236 12237 13605
214 Day 1 4943 4559 5242 4920 4709
2004 Ford Enhanced Day 2 3190 3585 3974 8394 4400
Escape Day 3 2815 11017 3944 113738 7518
215 Day 1 2483 2021 2247 3192 4168
2004 Toyota Enhanced Day 2 2941 1659 2317 2602 4148
Highlander Day 3 2888 1763 2675 2370 4506
3781 4384 9758 11119 10629
211 Day 1 2071 1303 2438 3370 2840
2004 Toyota Near Zero Day 2 1002 1158 1838 2268 2218
Camry XLE Day 3 874 1006 1843 2179 2034
212 Day 1 1016 1005 1848 1243 1310
2006 Ford Near Zero Day 2 712 708 1002 879 833
Taurus Day 3 570 574 758 1028 750
1544 1154 2143 2307 2075
CRC E-77-2 Program Results - Diurnal Permeation
Diurnal Permeation Rate - mgday
Enhanced Averages
Near Zero Averages
Carbon Canister Breakthrough ndash Canister breakthrough is measured by the weight change
recorded for the trap canister outside the SHED It quantifies the amount of vapors that
overwhelm the evaporative system storage canister Figure 17 displays the breakthrough
resulting from testing of 9 psi E0 fuel Only four of seven vehicles exhibited breakthrough
60
65
70
75
80
85
90
95
100
105
110
0
5
10
15
20
25
30
35
40
0 10 20 30 40 50 60 70
SH
ED
Te
mp
era
ture
-d
eg
F
Bre
ak
thro
ug
h -
mg
Test Time - hrs
Canister Breakthrough9 psi E0 Fuel - 65ordm to 105ordm F Diurnal
204 - 1999 Honda Accord
211 - 2004 Toyota Camry
215 - 2004 Toyota Highlander
205 - 2001 Toyota Corolla
Figure 17 ndashDiurnal Canister Breakthrough
26
Table 7 shows the breakthrough generated during the diurnal tests conducted
Table 7
Vehicle ID Technology 7psi E0 9 psi E0 7 psi E10 10 psi E10 9 psi E20
204 Day 1 --- 24 --- 310 ---
1999 Honda Enhanced Day 2 --- 136 --- 360 ---
Accord Day 3 --- 198 --- 360 ---
205 Day 1 --- --- --- 204 ---
2001 Toyota Enhanced Day 2 --- --- --- 309 ---
Corolla Day 3 --- 26 --- 293 ---
207 Day 1 --- --- --- --- ---
2001 Dodge Enhanced Day 2 --- --- --- --- ---
Caravan Day 3 --- --- --- --- ---
214 Day 1 --- --- --- --- ---
2004 Ford Enhanced Day 2 --- --- --- --- ---
Escape Day 3 --- --- --- 49 ---
215 Day 1 --- --- --- --- ---
2004 Toyota Enhanced Day 2 --- 02 --- --- ---
Highlander Day 3 --- 72 --- --- ---
211 Day 1 --- --- --- --- ---
2004 Toyota Near Zero Day 2 --- 129 --- 191 ---
Camry XLE Day 3 --- 176 --- 289 ---
212 Day 1 --- --- --- --- ---
2006 Ford Near Zero Day 2 --- --- --- --- ---
Taurus Day 3 --- --- --- 204 ---
CRC E-77-2 Program - Carbon Canister Diurnal Breakthrough Results
Diurnal Breakthrough - grams
Summary ndash The lack of canister breakthrough for the 7 psi fuels (summer grade) indicates that
the storage capacity of the seven systems tested is appropriately sized Breakthrough began to
appear when testing of 9 psi E0 fuel (not summer grade) and was more prevalent with the 10 psi
E10 fuel (winter grade) The lack of breakthrough with the 9 psi E20 fuel seems to be an
anomaly
27
Overall Trend Summary - The following chart (Figure 18) visually summarizes the trends seen
from all testing performed during this program
Higher Volatility E0 to E10 E0 to E20 E10 to E20
uarr uarr uarr uarr
Higher Volatility E0 to E10 E0 to E20 E10 to E20
uarr uarr uarr uarr
Higher Volatility E0 to E10 E0 to E20 E10 to E20
uarr uarr uarr uarr
Higher Volatility E0 to E10 E0 to E20 E10 to E20
uarr uarr uarr uarr
Higher Volatility E0 to E10 E0 to E20 E10 to E20
uarrharr uarr uarr uarr
Higher Volatility E0 to E10 E0 to E20 E10 to E20
uarr uarr uarr uarr
Higher Volatility E0 to E10 E0 to E20 E10 to E20
uarr darr darr
Higher Volatility E0 to E10 E0 to E20 E10 to E20
uarr uarr uarr harr
Ethanol Content
Diurnal
Trend Analysis for E-77-2 Program
Ethanol Content
Static Permeation
Ethanol Content
Running Loss Permeation
Ethanol Content
Ethanol Content
Diurnal
Enhanced Vehicles (Sample of 5)
Static Permeation
Ethanol Content
Ethanol Content
Running Loss Permeation
Ethanol Content
True Hot Soak (TEFVO)
Near-Zero Vehicles (Sample of 2)
True Hot Soak (TEFVO)
Figure 18 Trend Analysis Summaries
28
Vehicle 202 ndash 1996 Ford Taurus - Special Case
We have treated vehicle 202 as a special case This was the oldest of the vehicles tested and had
been subjected to limited exhaust emission tests with a 20-volume percent ethanol fuel (E20)
during the CRC E-74b test program
Vehicle 202 completed the E10 portion of the test program (10 and 7 psi fuels) successfully and
completed the road preconditioning on the E0 fuel prior to the E0 evaluations The first test on
the E0 fuel was excessively high indicating a fuel leak It was traced to a leaky fuel injector o-
ring and there was considerable discussion as to an appropriate repair Tests were made on the 9
and the 7 psi E0 fuel to measure the magnitude of a vehicle in a ldquoleakrdquo condition and the tests
were labeled as ldquo202L (Leak)rdquo The fuel injector o-rings were replaced as a complete set and
the vehicle resumed testing as ldquo202Rrsquo (Repaired) A new elusive vapor leak was present later
identified as a very small leak at the top of the fuel fill pipe
The circle on Figure 19 at the right shows
the location of the small leak This leak
was problematic as to its effect on the
emission measurements because its
magnitude or presence seemed to depend
on the torque exerted on the fuel cap The
tests on the E0 fuels (9 and 7 psi) are
noted as 202R but with a vapor leak
We attempted to fix this leak and repeated
the E10 test with the vehicle re-identified
as 216 with reasonable results We also
ran the E20 test sequence and declared the
vehicle done
The testing history for this vehicle is shown in Tables 8 (Static) 9 (Dynamic) and 10 (Diurnal)
The tests highlighted in yellow are those that exhibited a liquid or vapor leak as identified during
the static test leak validation
Figure 19 ndash Vehicle 202 Fuel Fill Pipe Leak
29
Table 8
Static Permeation Results 1996 Ford Taurus SHED
Corrected Results Canister
Fuel Permeation mgday Loss
Veh psiEtOH Test Type Date Test mghr (Corrected) g
202 100E10 Static Perm 071807 7018 345 000
Press Incr 00 No Leak
Prs+Fuel Incr 00
202 70E10 Static Perm 082107 7031 223 000
Press Incr 00 No Leak
Prs+Fuel Incr 00
202L 90E0 Static Perm 030408 7169 2292 000
Press Incr DNA
Prs+Fuel Incr 4921 Liquid Leak
202L 70E0 Static Perm 032008 7183 2991 000
Press Incr DNA
Prs+Fuel Incr 19896 Liquid Leak
202R 90E0 Static Perm 050808 7228 178 000
Press Incr 136 Vapor Leak
Prs+Fuel Incr 00
202R 70E0 Static Perm 052208 7239 204 000
Press Incr 380 Vapor Leak
Prs+Fuel Incr 00
216 100E10 Static Perm 081408 7299 324 000
Press Incr 00 No Leak
Prs+Fuel Incr 00
216 70E10 Static Perm 091708 7326 325 000
Press Incr 00 No Leak
Prs+Fuel Incr 00
216 90E20 Static Perm 103008 7363 204 000
Press Incr 00 No Leak
Prs+Fuel Incr 00
30
Table 9
Dynamic Permeation Results 1996 Ford Taurus SHED
Corrected Results Canister From
Fuel Permeation mgday Loss Static
Veh psiEtOH Test Type Date Test mghr (Corrected) g Test
202 100E10 Dynamic RL 072007 25662 1278 000 No Leak
TEFVO 386 000
202L 90E0 Dynamic RL 030508 25695 3870 000 Liquid Leak
TEFVO 00 000
202L 70E0 Dynamic RL 032408 25699 7269 000 Liquid Leak
TEFVO 00 000
202R 90E0 Dynamic RL 050908 25704 1091 000 Vapor Leak
TEFVO 50 000
202R 70E0 Dynamic RL 052308 25706 787 000 Vapor Leak
TEFVO 00 000
216 100E10 Dynamic RL 081508 25718 1742 000 No Leak
TEFVO 14 000
216 70E10 Dynamic RL 091808 25721 1683 000 No Leak
TEFVO 423 000
216 90E20 Dynamic RL 110708 25730 543 000 No Leak
TEFVO 00 000
31
Table 10
Diurnal Permeation Results 1996 Ford Taurus SHED
Corrected Results Canister From
Fuel Permeation mgday Loss Static
Veh psiEtOH Test Type Date Test mghr (Corrected) g Test
202 100E10 72 DHB 65-105 073107 7023
Day 1 10429 612 No Leak
Day 2 7069 3264
Day 3 7043 3869
202 70E10 72 DHB 65-105 082807 7034
Day 1 6278 000 No Leak
Day 2 5065 000
Day 3 4535 000
202L 90E0 72 DHB 65-105 031108 7173
Day 1 22589 000 Liquid Leak
Day 2 32310 000
Day 3 23069 1260
202L 70E0 72 DHB 65-105 040108 7196
Day 1 47425 000 Liquid Leak
Day 2 44517 000
Day 3 31798 000
202R 90E0 72 DHB 65-105 051308 7230
Day 1 3270 000 Vapor Leak
Day 2 2667 000
Day 3 2746 1083
202R 70E0 72 DHB 65-105 052808 7243
Day 1 2117 000 Vapor Leak
Day 2 2208 000
Day 3 2081 000
216 100E10 72 DHB 65-105 082008 7305
Day 1 25907 5777 No Leak
Day 2 34779 6299
Day 3 36014 6343
216 70E10 72 DHB 65-105 092308 7331
Day 1 3975 022 No Leak
Day 2 3550 006
Day 3 3621 037
216 90E20 72 DHB 65-105 111108 7373
Day 1 4685 000 No Leak
Day 2 4526 000
Day 3 4198 000
32
The Implanted Leak Test Results
Project E-77-2 included evaluating two vehicles with implanted leaks This interest followed the
information gathered in the Pilot Study where tests were run with a specially modified fuel cap
containing a 002rdquo dia hole The results with the implanted leak from the Pilot Study are
repeated in Table 11 below as the diurnal results are shown for a 1996 Chevrolet Cavalier first
without the implanted leak at 038 grams per day and then at 207 grams per day (a 54x
increase) with the leak
Table 11
Veh No
Evap
Tech Fuel
Results
gmsday
gms
Increase
6 1996 Chevrolet Cavalier Enhanced 7 psi E0 038
7 2070 2032
207 2001 Dodge Caravan Enhanced 7 psi E10 109
207L 213 104
211 2004 Toyota Camry LE Near Zero 7 psi E10 024
211L 068 044
- Implanted 020 leak in fuel cap
Vehicle Description
Implanted Leak Impact on Diurnal PermeationDay One Results 65deg - 105degF Diurnal
The two E-77-2 vehicles (207 amp 211) were given a limited evaluation with an induced leak and
saw a significantly lesser impact Vehicle 207 gave diurnal results increases from 109 to 213
grams per day (a 2x increase) and Vehicle 211 increased from 024 grams per day to 068 grams
per day (a 28x increase) The following Figure 20 displays the imbedded leak impact from Table
11
33
0
5
10
15
20
On
e D
ay
Diu
rna
l P
erm
ea
tio
n -
gm
sd
ay
Vehicle Number
Implanted Leak Impact on One Day Diurnal Permeation020 Leak in Fuel Cap - 65 to 105 F Diurnal
207L 211L21120776
As Received - No Leak
020 Fuel Cap Leak
The newer vehicles evaluated in this phase of the study were configured and certified to the
Onboard Refueling Vapor Regulations (ORVR) These are capable of containing 95 or more
control of the refueling vapors at up to 10 gallons per minute fueling rate Where the Chevrolet
Cavalier had a small (0055rdquo dia) orifice and a long vapor tube venting the tankrsquos vapor space to
the carbon canister (and then to the atmosphere) the ORVR compliant vehicles have a large
(0688rdquo ID) short vent hose to a low flow restriction carbon canister
The following bar charts (Figures 21 through 24) show the impacts of the leak on all phases of
the evaporative testing performed and compare those results with all fuels tested With only two
vehicles (207 and 211) evaluated on two fuels statistically significant effects cannot be
quantified but the trend of increased emissions is apparent
Figure 20 ndash Implanted Leak Impact
34
0
20
40
60
80
100
120
140
160
7E0 9E0 7E10 10E10 9E20 7E0 9E0 7E10 10E10 9E20
Sta
tic
Pe
rme
ati
on
-m
gh
r
Fuel
0020 dia Induced Leak EffectStatic Permeation
Vehicle 211Vehicle 207
Leak
Leak
0
200
400
600
800
1000
1200
7E0 9E0 7E10 10E10 9E20 7E0 9E0 7E10 10E10 9E20
Ru
nn
ing
Lo
ss
Pe
rme
ati
on
-m
gh
r
Fuel
0020 dia Induced Leak EffectRunning Loss Permeation
Vehicle 211Vehicle 207
Leak
Leak
Figure 21 ndash Vehicles 207 and 211 with Induced Leak - Static
Figure 22 ndash Vehicles 207 and 211with Induced Leak ndash Running Loss
35
0
100
200
300
400
500
600
700
7E0 9E0 7E10 10E10 9E20 7E0 9E0 7E10 10E10 9E20
Tru
e H
ot S
oa
k P
erm
ea
tio
n -
mg
hr
Fuel
0020 dia Induced Leak EffectTrue Hot Soak Permeation
Vehicle 211Vehicle 207
Leak
Leak
0
500
1000
1500
2000
2500
7E0 9E0 7E10 10E10 9E20 7E0 9E0 7E10 10E10 9E20
Da
y 1
Diu
rna
l P
erm
ea
tio
n -
mg
da
y
Fuel
0020 dia Induced Leak EffectDay 1 Diurnal Permeation
Vehicle 211Vehicle 207
Leak
Leak
Figure 24 ndash Vehicles 207 and 211 with Induced Leak - Diurnal
Figure 23 ndash Vehicles 207 and 211 with Induced Leak ndash True Hot Soak
36
Summary of Findings and Results
The E-77-2 test program was a continuation of the previously published E-77 test project and
added eight vehicles tested on five fuels to the knowledge base The permeation trends
previously shown were again present The small sample size and limited number of tests
preclude making statements about statistical validity but in general
o The newer vehicle groups had lower emissions
o Adding ethanol to the fuel increased permeation over the non-oxygenated levels
o Increased volatility increased permeation levels
o SHED emission rates must be corrected for the ethanol error in the FID and the
non-fuel methanol and refrigerant in the measurement
As this test program evolved and additional experience was gathered two program modifications
were made 1) The leak validation methodology was changed and 2) a different metric and
definition of the ldquoHot Soakrdquo was adopted
The leak validation portion of the static permeation test was found to be very sensitive and when
the data was corrected on a minute-by-minute basis for ethanol methanol and refrigerant the
change in apparent permeation rate was due as much to variation as to leaks See the discussion
starting at page 12 for the details of the development
Concern for and recognition of ldquoHot Soakrdquo emissions started in the original evaporative emission
regulations Carburetors had float bowls with ~ 50 ml of fuel that absorbed the latent engine heat
after the vehicle was shut down after operation The heat would cause the bowl temperature to
increase driving fuel vapors out through vents and leak paths to the atmosphere after vehicle
operation Todayrsquos fuel injection engines do not have the open bowls and the emission rates
following vehicle operation are mainly increased temperature permeation We recommended
and adopted a new name for the ldquotemporary emissions following vehicle operationrdquo (TEFVO)
which subtracts the basic permeation rate from the measured emissions See the discussion
starting at page 16 for details
37
Appendix
Acknowledgements
E-77-2 Steering Committee
David Brzezinski EPA
Kevin Cullen GM Powertrain
Dominic DiCicco Ford Motor Company
King D Eng Shell Global Solutions
Ben Hancock CARB
Constance Hart EPA
Phil Heirigs Chevron Global Downstream
Jeff Jetter Honda RampD Americas
Keith KnollNREL
John Koupal EPA
David H Lax API
Jeff Long CARB
Hector Maldonado CARB
Mani Natarajan Marathon Oil Company
David N Patterson Mitsubishi Motors RampD Americas
Jenny Sigelko Chrysler
James P UihleinChevron Global Downstream
Marie Valentine Toyota Technical Center
Kenneth J Wright ConocoPhillips
CRC Members
Brent Bailey CRC
Chris Tennant CRC
Jane Beck CRC
38
Table 12
E0 E10 E20
Inspection Units Fuel 6 Fuel 7 Fuel 4
API Gravity degAPI 602 585 570
Relative Density 6060degF 07382 07447 07508
DVPE psi 701 730 849
Oxygenates--D4815
MTBE vol 000 000 000
ETBE vol 000 000 000
EtOH vol 000 954 2034
O2 wt 000 353 747
Hydrocarbon Composition
Aromatics vol 221 244 108
Olefins vol 80 88 55
Saturates vol 700 573 234
D86 Distillation
IBP degF 974 1040 1022
5 Evaporated degF 1316 1280 1252
10 Evaporated degF 1423 1330 1314
20 Evaporated degF 1564 1410 1413
30 Evaporated degF 1704 1450 1486
40 Evaporated degF 1840 1530 1547
50 Evaporated degF 1975 1950 1596
60 Evaporated degF 2120 2190 1636
70 Evaporated degF 2305 2410 2274
80 Evaporated degF 2588 2710 2695
90 Evaporated degF 3139 3170 3139
95 Evaporated degF 3322 3300 3255
EP degF 3603 3600 3406
Recovery vol 978 978 983
Residue vol 13 10 10
Loss vol 09 12 07
Driveability Index 11199 11015 9898
Data from CRC E-74
CRC E-77-2 Fuel Inspection Results
39
Fuel Units Fuel 6 Fuel 7 Fuel 4
Sulfur Content ppm 29 27 27
Estimated CH Ratio 62090 63323 63252
Est Net Heat of Combustion btulb 18573 18514 18513
Benzene vol 090 100 096
Research Octane Number 932 940 946
Motor Octane Number 838 838 834
(R+M)2 885 889 890
Fuel Units Fuel 6 Fuel 7 Fuel 4
Aromatics vol 2386 2481 2178
Olefins vol 752 892 1074
Saturates vol 6743 5621 4623
Unclassified vol 115 086 015
Ethanol vol 000 920 2111
Benzene vol 089 106 097
CH Ratio 6200 6092 5835
Oxygen wt 0008 1 340 773
Net Heat of Combustion btulb 18703 18016 17160
1 Contains 004 vol MTBE
Fuel Units Fuel 6 Fuel 7 Fuel 4
Oxygen wt 0008 3396 7733
C+H wt 9999 9660 9227
H wt 1389 1362 1350
C wt 8610 8298 7877
Fuel Units 6 7 4
Haltermann D3338 Btulb 18573 18514 18513
Average D3338 Btulb 18579 18514 18491
Oxygen Corrected D3338 Btulb 18579 17860 17103
DHA Btulb 18703 18016 17160
Table 12 (cont)
Suppliers Additional Inspections
Net Heat of Combusion -- Btulb
Carbon Hydrogen and Oxygen
Detailed Hydrocarbon Analysis
40
Vehicle Day 1 Day 2 Day 3
No Fuel Base + Press + Pump RL True HS Perm (Brkthru) Perm (Brkthru) Perm (Brkthru)
E10 - 10 psi 345 --- --- 1278 503 10429 (63) 7069 (348) 7043 (425)
E10 - 7 psi 223 --- --- 994 113 6278 (00) 5065 (00) 4535 (00)
E0 - 9 psi 2229 --- 4921 3870 00 22580 (00) 32310 (00) 23069 (126)
E0 - 7 psi 2991 --- 19896 7269 00 47425 (00) 44517 (00) 31798 (00)
E10 - 10 psi 843 --- --- 3164 04 15479 (310) 17799 (383) 17711 (419)
E10 - 7 psi 664 --- --- 2879 297 12601 (00) 11652 (00) 11653 (00)
E0 - 9 psi 338 --- --- 2492 443 6283 (24) 5810 (136) 5770 (225)
E0 - 7 psi 129 --- --- 2226 187 3672 (00) 2877 (00) 2936 (00)
E20 - 9 psi 553 --- --- 2720 134 11034 (00) 9581 (00) 9812 (00)
E10 - 10 psi 416 --- --- 1916 295 17941 (204) 17309 (346) 17417 (375)
E10 - 7 psi 596 --- --- 2328 719 17834 (00) 17150 (00) 15239 (00)
E0 - 9 psi 195 --- --- 1031 10 4995 (00) 4810 (00) 5072 (26)
E0 - 7 psi 99 --- --- 671 00 3830 (00) 3654 (00) 3670 (00)
E20 - 9 psi 462 --- --- 1697 603 17752 (00) 16900 (00) 16802 (00)
E10 - 10 psi 787 --- --- 8581 2377 14064 (00) 12644 (00) 12237 (00)
E10 - 7 psi 644 --- --- 8122 1222 10865 (00) 8120 (00) 8236 (00)
E0 - 9 psi 325 --- --- 8339 58 4064 (00) 3373 (00) 3080 (00)
E0 - 7 psi 401 --- --- 8425 00 3975 (00) 3026 (00) 2689 (00)
E20 - 9 psi 882 --- --- 10282 00 15480 (00) 13702 (00) 13605 (00)
E10 - 10 psi 976 --- 1209 10012 3929 16449 (00) NA NA
E10 - 7 psi 1468 --- --- 11393 5850 21342 (00) NA NA
E10 - 10 psi 199 --- --- 1383 00 3370 (00) 2268 (191) 2179 (330)
E10 - 7 psi 94 266 --- 563 138 2438 (00) 1838 (00) 1843 (00)
E0 - 9 psi 101 --- --- 837 153 1303 (00) 1158 (129) 1006 (221)
E0 - 7 psi 91 --- --- 1046 07 2071 (00) 1002 (00) 874 (00)
E20 - 9 psi 558 --- --- 4106 00 2840 (00) 2218 (00) 2034 (00)
E10 - 10 psi 551 --- 821 3024 2450 25454 (040) NA NA
E10 - 7 psi 481 --- 1664 2511 62 6783 (00) NA NA
E10 - 10 psi 106 --- --- 1489 00 1243 (00) 879 (00) 1028 (200)
E10 - 7 psi 218 --- --- 2012 00 1848 (00) 1002 (00) 758 (00)
E0 - 9 psi 32 --- --- 1158 04 1005 (00) 708 (00) 574 (00)
E0 - 7 psi 09 --- --- 1845 18 1016 (00) 712 (00) 570 (00)
E20 - 9 psi 47 --- --- 1168 49 1310 (00) 833 (00) 750 (00)
E10 - 10 psi 244 --- --- 1331 574 4920 (00) 8394 (00) 113738 (49)
E10 - 7 psi 239 --- --- 1057 329 5242 (00) 3974 (00) 3944 (00)
E0 - 9 psi 107 --- --- 967 521 4559 (00) 3585 (00) 11017 (00)
E0 - 7 psi 252 --- --- 363 33 4943 (00) 3190 (00) 2815 (00)
E20 - 9 psi 168 --- --- 1394 560 4709 (00) 4400 (00) 7518 (00)
E10 - 10 psi 104 90 --- 719 16 3192 (00) 2602 (00) 2370 (00)
E10 - 7 psi 122 --- --- 979 00 2247 (00) 2317 (00) 2675 (00)
E0 - 9 psi 85 --- --- 811 251 2021 (00) 1659 (2) 1763 (72)
E0 - 7 psi 87 --- --- 797 225 2483 (00) 2941 (00) 2888 (00)
E20 - 9 psi 193 --- --- 1025 00 4168 (00) 4148 (00) 4506 (00)
E10 - 10 psi 324 --- --- 1742 118 25907 (578) 34779 (630) 36014 (643)
E10 - 7 psi 325 --- --- 1683 192 3975 (02) 3550 (01) 3621 (04)
E0 - 9 psi 178 136 --- 1091 254 3270 (00) 2667 (00) 2746 (108)
E0 - 7 psi 204 380 --- 787 00 2117 (00) 2208 (00) 2081 (00)
E20 - 9 psi 204 --- --- 543 74 4685 (00) 4526 (00) 4198 (00)
216
211
2004
Toyota
Camry
XLE
215
2004
Toyota
High-
lander
212
2006
Ford
Taurus
214
2004
Ford
Escape
211L
207L
Static Permeation - mghr Dynamic Perm - mghr
CRC E-77-2 Program Test Results
Diurnal (65ordm to 105ordm) - mgday
202
1996
Taurus
205
2001
Toyota
Corolla
204
1999
Honda
Accord
207
2001
Dodge
Caravan
202L
Table 13
41
Individual Vehicle Diurnal Performance on the Various Fuels
0
1000
2000
3000
4000
5000
6000
0 10 20 30 40 50 60 70
Cu
mu
lati
ve
Pe
rme
ati
on
-m
g
Test Time - hrs
Three Day DiurnalVehicle 204 1999 Honda Accord
10 psi E10
7 psi E10
9 psi E0
7 psi E0
9 psi E20
0
1000
2000
3000
4000
5000
6000
0 10 20 30 40 50 60 70
Cu
mu
lati
ve
Pe
rme
ati
on
-m
g
Test Time - hrs
Three Day DiurnalVehicle 205 - 2001 Toyota Corolla
10 psi E10
7 psi E10
9 psi E0
7 psi E0
9 psi E20
Figure 25 ndash Vehicle 204 Diurnal Performance
Figure 26 ndash Vehicle 205 Diurnal Performance
42
0
500
1000
1500
2000
2500
3000
3500
4000
4500
5000
0 10 20 30 40 50 60 70
Cu
mu
lati
ve
Co
rre
cte
d P
erm
ea
tio
n -
mg
Test Time - hrs
Three Day DiurnalVehicle 207 - 2001 Dodge Caravan
10 psi E10
7 psi E10
9 psi E0
7 psi E0
9 psi E20
0
100
200
300
400
500
600
700
800
900
0 10 20 30 40 50 60 70
Cu
mu
lati
ve
Pe
rme
ati
on
-m
g
Test Time - hrs
Three Day DiurnalVehicle 211 - 2004 Toyota Camry XLE
10 psi E10
7 psi E10
9 psi E0
7 psi E0
9 psi E20
Figure 27 ndash Vehicle 207 Diurnal Performance
Figure 28 ndash Vehicle 211 Diurnal Performance
43
0
50
100
150
200
250
300
350
400
450
500
0 10 20 30 40 50 60 70
Cu
mu
lati
ve
Pe
rme
ati
on
-m
g
Test Time - hrs
Three Day DiurnalVehicle 212 - 2006 Ford Taurus
10 psi E10
7 psi E10
9 psi E0
7 psi E0
9 psi E20
0
500
1000
1500
2000
2500
3000
3500
4000
4500
5000
0 10 20 30 40 50 60 70
Cu
mu
lati
ve
Pe
rme
ati
on
-m
g
Test Time - hrs
Three Day DiurnalVehicle 214 2004 Ford Escape
10 psi E10
7 psi E10
9 psi E0
7 psi E0
9 psi E20
Note The incomplete cumulative results for the 10 psi E10 results resulted from a conflict for the use
of the INNOVA analyzer during the test The INNOVA analyzer is required to correct for the FIDrsquos
ethanol error and the presence of methanol and refrigerant (R-134a) The data was available for the
50+ hour results and the data is valid as shown We have no explanation for the high levels
experienced on the third day of the test No test errors were identified
Figure 29 ndash Vehicle 212 Diurnal Performance
Figure 30 ndash Vehicle 214 Diurnal Performance
44
0
200
400
600
800
1000
1200
1400
1600
0 10 20 30 40 50 60 70
Cu
mu
lati
ve
Pe
rme
ati
on
-m
g
Test Time - hrs
Three Day DiurnalVehicle 215 2004 Toyota Highlander
10 psi E10
7 psi E10
9 psi E0
7 psi E0
9 psi E20
Figure 31 ndash Vehicle 215 Diurnal Performance
45
Table 14
Test Corrected
Vehicle Fuel Total Fuel EtOH R134a Methanol
204 10 psi E10 509899 144040 18298 16754
1999 Honda 7 psi E10 359057 130806 17551 15221
Accord 9 psi E0 178635 13843 18230 9896
7 psi E0 94846 1856 16631 2379
9 psi E20 304271 128408 18261 12143
205 10 psi E10 526659 186599 23354 20895
2001 Toyota 7 psi E10 502229 204246 25990 19198
Corolla 9 psi E0 148775 000 20434 4613
7 psi E0 111536 5489 22408 5619
9 psi E20 514540 212708 25677 19584
207 10 psi E10 389450 196248 12013 30399
2001 Dodge 7 psi E10 272201 114027 11731 19616
Caravan 9 psi E0 105167 1820 12224 15284
7 psi E0 96906 1118 22141 14276
9 psi E20 427882 241488 14268 25432
211 10 psi E10 78164 19733 15159 46970
2004 Toyota 7 psi E10 61190 20211 15929 46525
Camry LE 9 psi E0 34668 1681 14329 42659
7 psi E0 39468 000 16197 57303
9 psi E20 71013 26726 16213 36879
212 10 psi E10 31508 7222 14831 7896
2006 Ford 7 psi E10 36079 10132 15481 3400
Taurus 9 psi E0 22870 2409 15182 3761
7 psi E0 22973 000 15393 4362
9 psi E20 28935 11156 14116 2629
214 10 psi E10 1257887 000 19947 27992
2004 Ford 7 psi E10 131593 24571 16025 8879
Escape 9 psi E0 191611 2940 16487 7213
7 psi E0 109481 5386 80650 3106
9 psi E20 166271 24097 14491 6096
215 10 psi E10 81644 12178 14658 42609
2004 Toyota 7 psi E10 72399 15092 15532 36061
Highlander 9 psi E0 54431 000 14806 25822
7 psi E0 83115 000 14072 26255
9 psi E20 128223 38822 12841 34420
3 Day Diurnal Results
CRC E77-2 Program Diurnal ResultsAll values are in mg
46
0
200
400
600
800
1000
1200
1400
1600
1800
2000
Co
rrecte
d D
aily D
iurn
al
-m
g
Diurnal Ethanol PortionVehicle 204 - 1999 Honda Accord
Ethanol Portion
10 psi E10 9 psi E07 psi E10
1 32
315
341368
383
264273
1 321 321 321 32
9 psi E207 psi E0
1122097
39
0510
442
405412
Figure 32 ndash Vehicle 204 Diurnal Ethanol Portion
0
200
400
600
800
1000
1200
1400
1600
1800
2000
Co
rrecte
d D
aily D
iurn
al
-m
g
Diurnal Ethanol PortionVehicle 205 - 2001 Toyota Corolla
Ethanol Portion
10 psi E10 9 psi E07 psi E10
1 32
359
406
382
431355349
1 321 321 321 32
9 psi E207 psi E0
0 00
712649
406
420414
Figure 33 ndash Vehicle 205 Diurnal Ethanol Portion
47
0
200
400
600
800
1000
1200
1400
1600C
orr
ecte
d D
aily D
iurn
al
-m
g
Diurnal Ethanol PortionVehicle 207 - 2001 Dodge Caravan
Ethanol Portion
10 psi E10 9 psi E07 psi E10
1 32
488
442408
409
490535
1 321 321 321 32
9 psi E207 psi E0
00
1144
27
0101
556
587552
Figure 34 ndash Vehicle 207 Diurnal Ethanol Portion
0
50
100
150
200
250
300
350
400
Co
rrecte
d D
aily D
iurn
al
-m
g
Diurnal Ethanol PortionVehicle 211 - 2004 Toyota Camry XLE
Ethanol Portion
10 psi E10 9 psi E07 psi E10
1 32
264
242245
1 321 321 321 32
9 psi E207 psi E0
329
306356
00
73
64
00
00
00
325
431
370
Figure 35 ndash Vehicle 211 Diurnal Ethanol Portion
48
0
20
40
60
80
100
120
140
160
180
200C
orr
ecte
d D
aily D
iurn
al
-m
g
Diurnal Ethanol PortionVehicle 212 - 2006 Ford Taurus
Ethanol Portion
10 psi E10 9 psi E07 psi E10
1 32
216
170
316
1 321 321 321 32
9 psi E207 psi E0
194
288
436 102
105
85
00
00
00476
529
243
Figure 36 ndash Vehicle 212 Diurnal Ethanol Portion
0
200
400
600
800
1000
1200
Co
rrecte
d D
aily D
iurn
al
-m
g
Diurnal Ethanol PortionVehicle 214 - 2004 Ford Escape
Ethanol Portion
10 psi E10 9 psi E07 psi E10
1 32
00
1 321 321 321 32
9 psi E207 psi E0
201
202152
38
05
19
56
1469
103
171188
143
67
11275
Figure 37 ndash Vehicle 214 Diurnal Ethanol Portion
49
0
50
100
150
200
250
300
350
400
450
500C
orr
ecte
d D
aily D
iurn
al
-m
g
Diurnal Ethanol PortionVehicle 215 - 2004 Toyota Highlander
Ethanol Portion
10 psi E10 9 psi E07 psi E10
1 32
121
136
196
1 321 321 321 32
9 psi E207 psi E0
198
217213
0000
00
0000
00
335 292
283
Figure 38 ndash Vehicle 215 Diurnal Ethanol Portion

6
Tank vapor venting emissions are controlled by fitting a carbon canister to the atmospheric tank
vent Figure 3 is a schematic of a typical early control system During a daily heating period the
temperature of the vehiclersquos fuel tank increases forcing HC vapors from the tank Excess
emissions exceeding the carbon canisterrsquos capacity are vented to the atmosphere
Figure 3 - Control System Schematic
Leaks can be liquid or vapor Permeation and tank venting losses are strongly driven by fuel
composition ambient temperature and ambient temperature change Liquid leaks are not
strongly affected by normal summer temperatures and are thought to have two components
1 Static leaks occurring while the engine is turned off and the vehicle is stationary
2 Increase in leak rate caused by the system pressure increase during engine operation
A Test Method for Separating Permeation from Tank Venting and Leaks ndash In a previous
CRC Project (E-65) the canister loss was separated from the permeation measurement by
venting the losses from the carbon canister outside
the SHED For Project E-77 the canister vent
losses were collected and measured in a separate
ldquotrap canisterrdquo on a scale outside the SHED as
shown in Figure 4 This vent line was capped off
(ie sealed during the Static Test) but connected
as shown in the figure for the Dynamic and the
Diurnal Test The ambient temperature in the
SHED was constant during the static test and
there was no vapor created at constant
temperature
Figure 4 - Trap Canister
7
This vent was closed to pressurize the system for the leak evaluations The resulting SHED
increase in HC mass was permeation7 The last mechanism that needed to be evaluated was
leaks Leaks can be both vapor and liquid A liquid leak can have significant mass currently
undetected by the vehiclersquos on-board diagnostic system Considerable thought and effort have
gone into the creation of a simple and effective liquid leak detection methodology without
success The techniques used in this project required the use of a SHED for measurements The
techniques were not simple but they proved effective
Based on experience a vehiclersquos permeation rate is expected to be between the range of 4 to 90
mghour at the 86degF test temperature The presence of a static liquid leak is expected to
overwhelm this value such a leak would (or could) be apparent by inspection Leaks from the
vehicles were quantified in a three-step test process The first step was to measure the static
permeation rate of the vehicle at 86ordmF The vehicle was allowed to stabilize overnight at 86ordmF in
the SHED and the permeation rate was calculated from the mass increase in the SHED during a
one-hour measurement period The second part of the test looking for pressure driven leaks in
the vapor system was performed by pressurizing the vehiclersquos tank to 5rdquo H2O through a special
fuel cap and tubing from outside the SHED (Figure 5) The special fuel cap the hose and the
pressurization apparatus were installed before the start of the sequence The HC concentration in
the SHED was monitored and the increase in the mass of HC in the SHED during the 30-minute
pressurization period compared to the static permeation rate If there was no (or insignificant)
rate of increase it was deduced that no vapor leak was present
The third and final part of the test was to energize the vehiclersquos fuel pump and pressurize the
system up to and including the injectors (Figure 6) If there were a pressure leak in the liquid
system an increase in the SHED mass over the 30-minute measurement period would be seen
ie the leak would be additive to the permeation rate
6 This is a simplification There are other HC sources present that are not fuel permeation These include tire paint
adhesives and vinyl emissions and the possibility of fuel leaks from the fuel injectors We believe these to be a
minor component of the emissions measured in this study
Figure 5 - Static Test ndash Tank Pressurization
8
Figure 6 ndash Static Test ndash Fuel Pump Energized
Other Tests (Dynamic Hot Soak and Diurnal) - A similar configuration is used to isolate the
tank venting losses from the permeation measurements determined by other test procedures The
vehiclersquos canister vent is connected with a low permeation hose (Teflontrade) to a bulk-head fitting
in the SHED wall and then to a separate ldquotrap canisterrdquo on a top-loading scale Any HC
emissions that escape from the vehiclersquos canister are captured in the trap canister and measured
at a 001 g (10 milligram) precision The trap canister (a 1 Liter Ford model) is purged before
each test and maintained at a ldquodryrdquo condition so that it captures all of the vehiclersquos escaping
emissions This assumption is probably violated during the high volatility tests where there are
30 grams of daily emissions but this is not a concern at this time
Test Elements for E-77-2 - The following flow chart (Figure 7) displays the various elements
utilized during the testing of the various vehicles and fuels during this program Details of each
of the four basic tests follow the flow chart
9
Drain and 40 Fill
with 10 psi E10 Test Fuel
Road Preconditioning
Four LA-4rsquos or Equivalent
Drain and 40 Fill
with 10psi E10 Test Fuel
Overnight Park at 86degF
Move to SHED
Connect Test Instrumentation
Stabilize at 86degF
Perform Constant Temperature
Permeation Series (86degF)
1 hour Permeation Rate Test
frac12 hour Tank Pressurized Test
frac12 hour Pump Energized Test
Transfer to RL SHED
Connect Test Instrumentation
Stabilize at 86degF
Perform Dynamic Permeation Test
Two LA92 Driving Cycles amp
One Hour Hot Soak
Drain and 40 Fill
With 10 psi E10 Test Fuel
Road Preconditioning
Four LA-4rsquos or Equivalent
Move to VT-SHED
Connect Test Instrumentation
Stabilize at 65degF for 6 hrs Minimum
Perform 3-Day Diurnal Evaluation
72 hr 65deg to 105degF VT Test
Drain and 40 Fill
with 7 psi E10 Test Fuel
Condition Fuel System
By Driving for One Week
Repeat Steps 1 ndash 12
On 7 psi E10 Test Fuel
Drain and Fill with 9 psi E0 Test Fuel
Condition Fuel System by 4 weeks Driving
Repeat Steps 1 ndash 12
On 9 and 7 psi E0 and
Repeat Steps 0-12
On 9 psi E20 Test Fuels
Precondition Fuel System
With 4 Weeks Driving on
10 psi E10 Test Fuel
1
2
3
4
5
6
7
8
9
10
11
12
0
Figure 7 ndash Testing Flow Chart
10
Test Procedures ndash There are four basic tests in the E-77-2 test protocol
1 Static Permeation Rate (includes checks for vapor and liquid leaks)
2 Running Emissions (Dynamic Test)
3 Hot Soak
4 Diurnal
Each is described in detail below
1 Static Permeation Rate Testing
The constant temperature (static) permeation rate is measured in a traditional SHED (Constant
temperature) in the following manner
A The fuel tank is drained and filled to 40 tank capacity with the test fuel
B The day before testing the vehicle is driven over four road trips of 75 miles each
to precondition the canister8 (These drives are similar to the LA-4)
C Upon return from the road pre-conditioning the fuel tank is drained and filled to
40 tank capacity with the test fuel9
D Vehicle is parked for 18-22 hours in a controlled temperature environment at test
temperature (86ordmF)
E The vehicle is then moved (without starting) into the test (86ordmF) SHED
F The canister vent is connected to the SHED bulkhead fitting which routes the
vapor to the trap canister outside the SHED
G The tank system pressurization hose is connected
H The fuel pump electrical connection is connected
I The SHED is sealed the inside temperature is allowed to stabilize and the test is
started Continuous THC measurements are made using a FID Ethanol
methanol and R134a concentrations are measured using an INNOVA analyzer
All measurements are made at least every minute for one hour to determine the
stabilized permeation rate
J At the end of the static test (60 minutes) the vehiclersquos vapor system is pressurized
to 5 inches of water for thirty minutes Measurements are made to quantify vapor
leaks as determined by a change in the THC in the SHED
K The fuel pump is then energized for 30 minutes while maintaining the 5 inches of
water on the vapor system Liquid leaks are quantified as determined by a change
in the concentration of THC in the SHED
The purpose of steps J and K above is to validate that the permeation rate measurement was
made without the presence of any leak ndash either liquid or vapor A detailed discussion follows
starting at page 12
8 This conditioning can be done in the laboratory on a chassis dynamometer if proper attention is paid to underbody
cooling and unrepresentative fuel tank temperatures are avoided 9 Vehicles with ORVR systems will add the refueling vapors to the canister This is OK
11
2 Running Loss Test (Dynamic Test)
A The vehicle is placed in the RL-SHED and prepared for test (The fuel level and
condition for the dynamic test is the fuel remaining after completion of the static test ndash
40 fresh fill of the appropriate test fuel)
B Outside air source for the engine is connected
C Vehicle exhaust is connected
D Fuel tank thermocouple is connected
E Canister vent is connected to the SHED bulkhead fitting which routes the vapor to the
trap canister outside the SHED
F Vehicle is allowed to stabilize in the RL-SHED at test temperature (86degF) for a minimum
of 12 hours ndash preferably overnight
G Two cycles of the Unified Cycle (LA-92) driving schedule (48 mins) are driven while
measuring the mass emissions in the SHED Vehicle is allowed to idle (in drive) for 30
seconds between the two cycles Ambient air temperature is maintained (to the extent
possible) at 86degF Fuel tank surface temperature is monitored during vehicle operation It
should increase during the drive from 10 to 18degF to simulate expected on-road
temperature increase Measured mass emissions are corrected using the INNOVA data
for the ethanol methanol and refrigerant emissions
3 Hot Soak10
This procedure is executed immediately following the Running Loss Test procedure
described above
A Engine is turned off transmission selector is placed in park and driver exits the
enclosure using the double door air lock taking care to minimize any air exchange
between the laboratory and the SHED This starts the one hour ldquohot soakrdquo period
B Measurements of mass emissions in the SHED are continued for another 60 minutes
(until time = 108 minutes) correcting for the ethanol methanol and refrigerant mass
using the INNOVA instrument data This ends the hot soak Hot soak emissions are
calculated as the net difference for the one hour hot soak (CorrMass108 ndash CorrMass48
minus the 86degF static hourly rate all mass rates in mghour)
4 Diurnal Test
A The fuel tank is drained and filled to 40 tank capacity with the test fuel
B The day before testing the vehicle is driven over four road trips of 75 miles each to
precondition the vehicle and the canister
C Upon return from the road pre-conditioning the fuel tank is drained and filled to 40
tank capacity with the test fuel
D The vehicle is parked for 18-22 hours in a controlled temperature environment at the
initial diurnal test temperature (65ordmF)
E The SHED is sealed allowed to stabilize at the 65degF temperature and the 3-day
California Diurnal Test is started
10 We define the ldquohot soakrdquo to be the temporary increase in emission rate caused by the immediately preceding
operation of the vehicle It is the increase in the SHED mass (corrected for EtOH MeOH and R-134a) over the
one hour period minus the previously established ldquostaticrdquo permeation rate
12
F ldquoContinuousrdquo (every 30 seconds) THC measurements are made using a FID Ethanol
methanol and R134a (refrigerant) concentrations are measured using an INNOVA
analyzer at least every 10 minutes for the duration of the test (72 hours)
Static Permeation Test ndash Leak Validation
If a leak is detected during either the vapor system pressure portion (Step J) or the pump
energized portion (Step K) of the Static Permeation Test procedure it calls into question whether
the permeation rate measurement accurately reflects fuel system permeation or if instead a
combination of permeation and the implied leak was measured If a leak is confirmed the
permeation rate measurement is called into question and an investigation possible remedy and
retest is indicated
The permeation rate measurement must be corrected for the FIDrsquos ethanol misrepresentation and
the presence of non-fuel hydrocarbons (methanol and refrigerant) The leak check however is
made using the change in mass increase in the SHED using the uncorrected FID mass calculation
as the determinate It was found that the corrections for ethanol methanol and refrigerant were
introducing ldquonoiserdquo into the trace and that these were being misinterpreted as leaks
y = 062x - 19
y = 047x + 67
y = 055x - 01
0
10
20
30
40
50
60
70
80
90
100
0 20 40 60 80 100 120
SH
ED
Mas
s -
mg
Test Time - minutes
Leak TestVehicle 204 - 1999 Honda Accord - 9 psi E0
Test 7028
Pump ActivatedTank Pressurized
Figure 8 above represents the calculations made during the inspection of data from a successful
test EXCELrsquostrade ldquoSLOPErdquo function is used to calculate the linear regression values based on
the FID calculation for mass for Time 0 to 60 minutes Time 64 to 90 minutes and Time 94 to
120 minutes A 4-minute gap was included between each sequence to establish the new mass
emission rate during the ldquopressure onrdquo (T60 to T90) and the ldquopump energizedrdquo periods
The slope of 047 for the ldquoTank Pressurizedrdquo period in the example above is compared to the
slope of 062 calculated for the permeation rate (or hot soak) period Since the ldquoTank
Figure 8 ndash Leak Test
13
Pressurizedrdquo slope is not more than 10 higher than the hot soak permeation rate we assume
that there is no leak present A similar comparison is made for the slope determined during the
ldquopump onrdquo period The choice of a 10 allowance is arbitrary and is used here to allow for
normal and unavoidable test variation
For tests in which the above procedure determines that no leak is present a value of zero is
reported in the test summary for the leak results If a positive value is reported it calls that test
into question and an investigation possible repair and retest is indicated
Static Permeation Rate Determination
The static permeation rate is determined based on a linear regression through the individual
SHED mass data points (data measured each 30 seconds) of the corrected fuel results (corrected
for the FID error and subtracting the methanol and refrigerant) from the first 60 minutes of
testing as illustrated in Figure 9 below
y = 05636x + 0505
0
5
10
15
20
25
30
35
40
45
0 10 20 30 40 50 60
Pe
rme
ati
on
-m
gs
Test Time - mins
Static Permeation DeterminationVehicle 204 - 1999 Honda Accord - 9 psi E0 Fuel
Raw SHED
Corrected Fuel
Permeation Rate Based on Corrected Results
Permeation Rate = 5636 x Time = 338 mgshr
In this example the static permeation rate is 338 mghr
Dynamic (Running Loss) and Hot Soak Test
The preceding section addressed the concepts of separating the permeation emissions from the
tank venting emissions and establishing the presence or absence of leaks The second part of
this study includes a dynamic test to measure the permeation and tank venting emissions during
Figure 9 ndash Static Permeation Determination
14
vehicle operation (ldquorunning lossesrdquo) and the temporary condition following vehicle operation
known as the ldquohot soakrdquo
This is considered a ldquodynamicrdquo test because the vehicle is driven and the fuel and vapor system
temperatures rise during the test The ambient temperature in the Running Loss SHED during
the test was held constant at 86degF while the vehiclersquos fuel system temperature rose during the
test Two 1435 second (239-minute) LA-92 driving cycles were performed consecutively during
the running loss measurements with a 30-second idle in-between During this test tank fuel
temperature was expected to rise by an average approximately 18degF above the initial ambient
temperature The running loss air handling system included a proportional speed under-car
blower operated as a slave to dynamometer speed This apparatus was used during running loss
testing with minor tuning for specific vehicles Without additional input it is capable of
reasonable fuel tank temperature control Each vehicle was fitted with a surface-mount
thermocouple at the front of the fuel tank located at approximately the 18th
fill level to measure
the fuel liquid temperature No attempt was made to follow a predefined fuel tank temperature
profile (FTTP) in this program Fuel temperatures were recorded and results are available in the
real-time records
Vehicle running loss emissions are measured in a special version of a SHED known as a
Running Loss SHED (RL-SHED) shown in Figure 10 Special features of the RL-SHED
include a sealed chassis dynamometer for simulating vehicle driving loads a sealed outside air
supply for engine intake a sealed exhaust conduit for engine exhaust and an under-chassis fan
for simulating underbody air flow as described above A vehicle is operated inside the RL-SHED
over a chosen driving cycle The increase in HC emissions inside the enclosure are measured
and calculated as mass emissions per 40 CFR sect86163-96
Figure 10 - Running Loss SHED
15
Vehicle testing in an RL-SHED is complicated by several factors including
1 Engine must be supplied with external induction air
2 Exhaust must be conducted externally without any leaks
3 Load supplied to the vehicle through the chassis dynamometer must not create or
allow external leaks
4 Internal SHED temperature must be maintained while sizable heat is rejected to the
ambient by the running engine and exhaust
5 Cooling air supplied to the radiator must be modulated to represent the vehiclersquos road
speed
6 Underbody (and especially the fuel system) temperature should represent the rate of
rise experienced by a real road-drive
Canister vent losses were isolated from permeation emissions using the technique previously
described The vehiclersquos carbon canister fresh air vent was connected to the outside of the RL-
SHED using a leak-tight PTFEreg
hose (38rdquo OD commercial tubing US Plastics 58055 PTFE or
equivalent) connected to a small carbon ldquotraprdquo canister located on a top-loading precision scale
The scale precision was 001 grams (10 milligrams) and it was purged prior to each test There
were no tank venting emissions measured on any of the running loss test measurements All of
the vehicles appeared to be actively ldquopurgingrdquo their respective control canisters and drawing
fresh air during the test If there were any emissions from the vehiclersquos control canister as might
have occurred if there were no vehicle purge or if very high volatility fuels with excessive vapor
generation were used they would have been measured
The Running Loss Driving Cycle consisted of two cycles of the ldquoUnified Driving Cyclerdquo
otherwise known as the LA-92 A velocity versus time plot for one cycle is shown in Figure 11
The LA-92 cycle takes 24 minutes to complete and covers 98 miles with many speed changes
Two back-to-back cycles were driven the first as a ldquocold startrdquo and the second following a 30-
second vehicle idle The ldquocold startrdquo condition was created by soaking the vehicle for a
Figure 11 ndash Running Loss Driving Cycle
Unified Cycle (LA-92)
0
10
20
30
40
50
60
70
80
0 5 10 15 20 25Test Time - minutes
Spe
ed -
mph
Cycle Time (min) 239
Maximum Speed (mph) 672
Average Speed (mph) 246
Average Non-Zero Speed (mph) 294
Time Zero Speed () 162
Distance (miles) 982
16
minimum of 18 hours at 86degF moving it to the stabilized 86degF RL-SHED making the test
connections and then waiting a minimum of one hour before the initial start and run
The SHED emissions were measured during 48 minutes of engine operation and then
continuously for one hour after the engine was turned off This one hour engine-off duration
was the ldquohot soakrdquo period The total test time is 1 hour and 48 minutes
Figure 12 shows results from the 9 psi E0 fuel test on Vehicle 204 The horizontal axis is test
time in minutes and the vertical axis is the HC mass measured in the RL-SHED during the test
period
The engine was shut off at the end of the second LA92 drive cycle (~48 minutes) and the
analysis system continued to measure the HC emissions in the SHED for the next 60 minutes
This represented the ldquohot soakrdquo portion of the test
0
50
100
150
200
250
300
0 20 40 60 80 100 120
Co
rre
cte
d T
ota
l F
ue
l C
um
ula
tiv
e P
erm
ea
tio
n -
mg
Test Time - minutes
Running Loss and Hot SoakVehicle 204 - 1999 Honda Accord - 9 psi E0 Fuel
Test 25668
Running Loss Hot Soak
Running Loss Std =005 gmiThis Test = 0010 gmi
RL = 249 mghr
2774
2332
Tru HS = 442
1990
The ldquoTruerdquo Hot Soak
The traditional hot soak is determined from the increase in SHED emissions as measured for one
hour following a prescribed drive to heat up the vehicle (2 LA-92 cycles during the Running
Loss Test) Hot soak emissions however have two components that caused by the elevated
temperature resulting from the drive and that resulting from one hour of static permeation
Figure 12 ndash Running Loss Test Results
17
To separate these two components and determine the ldquotruerdquo hot soak emissions the following
procedure was used ldquoTraditionalrdquo hot soak emissions were first calculated by subtracting the
ldquostart of hot soakrdquo cumulative SHED hydrocarbon value (ie 199 mg t = 48 minutes) from
the final cumulative SHED hydrocarbon value (ie 2774 mg t = 108 min) This resulted in a
cumulative SHED hydrocarbon value of 78 mg for the 1 hour hot soak The previously
determined static permeation value (ie 338 mg for a 1 hour hot soak test- see Figure 9) was
then subtracted to arrive at the ldquotruerdquo hot soak value of 442 mg The increase in the permeation
rate (the ldquohot soak effectrdquo) caused by the increase in the system temperature is accounted for by
subtracting the ldquostabilized permeation raterdquo at 86degF
In Figure 12 the static permeation rate is superimposed as a solid blue line on the plot from the
starting point of the hot soak until its end (one hour) While the ldquotraditionalrdquo hot soak would be
calculated as 78 mg (277 mg ndash 199 mg) the ldquotruerdquo hot soak is determined as 442 mg (2774 mg
ndash 2332 mg) True hot soak values reported here were determined in this manner
Diurnal Test
Diurnal permeation was determined by subjecting the vehicle to a three-day period in a
temperature controlled SHED while continuously recording the total hydrocarbon every 30
seconds The SHED environmental temperature was varied from 65degF to 105degF per the
California Diurnal Test protocol Canister vent losses were isolated from permeation emissions
using the technique previously described The vehiclersquos carbon canister fresh air vent was
connected to the outside of the RL-SHED using a leak-tight PTFEreg
hose connected to a small
carbon ldquotraprdquo canister located on a top-loading precision scale The scale precision was 001
grams (10 milligrams) and it was purged before each test
DISCUSSION OF TEST RESULTS
Results
Emission results are presented below by ldquomechanism11
rdquo with the data averaged for the five
ldquoenhancedrdquo and the two ldquonear zerordquo vehicles The lone ldquopre-enhancedrdquo vehicle the 1996 Ford
Taurus (202) was a special case and will be discussed in a separate section Two of the vehicles
the 2001 Dodge Caravan (207) and the 2004 Toyota Camry (211) were also subjected to limited
testing with an ldquoimplanted leakrdquo (a 0020rdquo dia hole in a special tank gas cap) to investigate the
magnitude of a known leak These results (ldquoLeakersrdquo) follow the discussion on the Taurus
Static Permeation Rate (Constant Temperature (86degF)) - Average permeation rate compared
by fuel specification for two vehicle groups ldquoenhancedrdquo and the ldquonear zerordquo evaporative
emissions
11 The ldquomechanismsrdquo are 1 Permeation 2 Tank Venting (Daily Temperature Rise) and 3 Leaks
18
0
10
20
30
40
50
60
Co
rrecte
d P
erm
eati
on
Rate
-m
gh
r
Fuel
Static Permeation Rate - All FuelsE77-2 Program Vehicles
7 E0 9 E2010 E107 E109 E0 7 E0 9 E2010 E107 E109 E0
Enhanced(5 veh)
Near Zero(2 veh)
Figure 13 presents the static permeation rate performance for the average of the 5 ldquoenhancedrdquo
and 2 ldquonear zerordquo vehicles on the five fuels included in the test program Each group is ordered
from left to right by ethanol level The vertical scale is the average permeation rate in mghour
for the static (86degF constant temperature) test
Previous studies1213
had shown that vehicles operated on the fuel containing 10 vol- ethanol
would have higher permeation rates compared to those resulting from operation on a non-ethanol
(E0) fuel of similar properties We also expected that vehicles using higher vapor pressure fuel
would exhibit increased permeation levels at similar ethanol levels Other studies had reported
mixed results when comparing E20 permeation rates against E10 measurements ndash some were
higher and some were lower The difference may have been within the repeatability of the
measurements and probably suffered from a limited number of observations These mixed
results are present in this testing of the enhanced vehicles however the E20 (violet bar) is higher
on average for static permeation rate for the Near Zero group The data that were used to
construct the averages in Figure 13 are listed in Table 3 below There is significant variability in
the test results and the limited sample size precludes making conclusive statements with
statistical confidence
12 CRC E-653 Fuel Permeation from Automotive Systems E0 E6 E10 E20 and E85 December 2006 13
CRC E-77 Vehicle Evaporative Emission Mechanisms A Pilot Study June 2008
Figure 13 ndash Static Permeation Rate Comparison
19
Table 3
Vehicle ID Technology 7psi E0 9 psi E0 7 psi E10 10 psi E10 9 psi E20
204
1999 Honda Enhanced 129 338 664 843 553
Accord
205
2001 Toyota Enhanced 99 195 596 416 462
Corolla
207
2001 Dodge Enhanced 401 325 644 787 882
Caravan
214
2004 Ford Enhanced 252 107 239 244 168
Escape
215
2004 Toyota Enhanced 87 85 122 104 193
Highlander
194 210 453 479 452
211
2004 Toyota Near Zero 91 101 94 199 558
Camry XLE
212
2006 Ford Near Zero 09 32 218 106 47
Taurus
50 67 156 153 303
Static Permeation Rate - mghr
CRC E-77-2 Program - Static Permeation Results
Enhanced Averages
Near Zero Averages
Summary ndash Static permeation rate increased with increase in ethanol level Three of the 5
enhanced emission vehicles did not show an increase in permeation rate when tested with the 9
psi E0 compared to the 7 psi E0
20
Dynamic (Running Loss) Permeation - In a similar presentation Figure 14 shows the average
ldquoRunning Lossrdquo permeation rate for the vehicle types and the fuels tested ldquoRunning Lossrdquo
permeation as described here is the permeation measured during a ldquocold startrdquo 48 minute drive in
a Running-Loss SHED (RL-SHED) at 86degF
0
50
100
150
200
250
300
350
400
7E0 9E0 7E10 10E10 9E20 7E0 9E0 7E10 10E10 9E20
Co
rre
cte
d R
un
nin
g L
os
s P
erm
ea
tio
n -
mg
hr
Fuel
Running Loss Permeation Rate - All FuelsE77-2 Program Vehicles
Enhanced(5 vehs)
Near Zero(2 vehs)
The dynamic permeation rates for the enhanced vehicles (left panel) followed a similar pattern as
the static permeation The average of the E20 fuel was the highest of the average values
observed on both the enhanced and the near-zero vehicles (left and right panels respectively)
Table 4 below shows the data used to generate the averages used in Figure 14
Figure 14 ndash Running Loss Permeation Comparison
21
Table 4
Vehicle ID Technology 7psi E0 9 psi E0 7 psi E10 10 psi E10 9 psi E20
204
1999 Honda Enhanced 2226 2492 2879 3164 2720
Accord
205
2001 Toyota Enhanced 671 1031 2328 1916 1697
Corolla
207
2001 Dodge Enhanced 8425 8339 8122 8581 10282
Caravan
214
2004 Ford Enhanced 363 967 1057 1331 1394
Escape
215
2005 Toyota Enhanced 797 811 979 719 1025
Highlander
2496 2728 3073 3142 3424
211
2004 Toyota Near Zero 1046 837 563 1383 4106
Camry XLE
212
2006 Ford Near Zero 1845 1158 2012 1489 1168
Taurus
1446 998 1288 1436 2637
Enhanced Averages
Near Zero Averages
CRC E-77-2 Program - Running Loss Permeation Results
Running Loss Permeation Rate - mghr
Summary ndash The dynamic permeation rate (measured during vehicle operation) was higher with
the E10 fuel compared to E0 for the enhanced vehicles The E20 permeation rate was higher
than E0 and the E10 fuel The small sample size and limited data precludes us from making
statements about statistical confidence but this may indicate a trend The near zero vehicle
average increased as the ethanol level increased Trends with volatility were mixed or
inconclusive
22
Hot Soak (ldquoTrue Hot Soakrdquo) Permeation ndash The Hot Soak emissions as defined in this report
are the net increase in permeation rate following vehicle operation We measured the mass
increase in the SHED for one hour immediately following vehicle operation and subtracted the
previously measured static (or normal) permeation at the same temperature While this is not the
traditional Code of Federal Regulations (CFR) definition we feel it is appropriate for the intent
of this project
0
10
20
30
40
50
60
70
7E0 9E0 7E10 10E10 9E20 7E0 9E0 7E10 10E10 9E20
Co
rre
cte
d H
ot
So
ak
Pe
rme
ati
on
-m
gh
r
Fuel
True Hot Soak Permeation Rate - All FuelsE77-2 Program Vehicles
Enhanced(5 vehs)
Near Zero(2 vehs)
The ldquoTrue Hot Soakrdquo performance for the average of the Enhanced Vehicles is summarized in
Figure 15 above There was a large increase in the hot soak value with the E10 fuel compared to
the E0 The hot soak value with the E20 fuel was comparable to the E0 results and lower than
the E10
The Near Zero vehicles (2) had zero hot soak emissions when tested on the 10 psi E10 fuel
(Figure 16) With only two vehicles and the very low levels attained no statistically significant
conclusions can be drawn from the data available Table 5 presents the individual tests used in
calculating the average values plotted in Figure 15
Figure 15 ndash True Hot Soak Permeation Comparison
23
Table 5
Vehicle ID Technology 7psi E0 9 psi E0 7 psi E10 10 psi E10 9 psi E20
204
1999 Honda Enhanced 187 443 297 04 134
Accord
205
2001 Toyota Enhanced 00 10 719 295 603
Corolla
207
2001 Dodge Enhanced 00 58 1222 2377 00
Caravan
214
2004 Ford Enhanced 33 521 329 574 560
Escape
215
2005 Toyota Enhanced 225 251 00 16 00
Highlander
89 257 513 653 259
211
2004 Toyota Near Zero 07 153 138 00 00
Camry XLE
212
2006 Ford Near Zero 18 04 00 00 49
Taurus
13 79 69 00 25
CRC E-77-2 Program - True Hot Soak Permeation Results
True Hot Soak Permeation Rate - mghr
Near Zero Averages
Enhanced Averages
Summary - The True Hot Soak permeation (permeation rate measured following vehicle
operation less the static constant temperature permeation rate) rate was higher with the E10 fuel
compared to E0 for the enhanced vehicles The E20 permeation rate was higher than E0 and
lower than the E10 fuel The near zero vehicle trends with both ethanol content and volatility
were mixed or inconclusive The small sample size and limited data precludes us from making
statements about statistical confidence
24
Diurnal Permeation Performance ndash Figure 16 presents the diurnal permeation results for the
first day of the three-day diurnal test (65deg to 105degF)
0
200
400
600
800
1000
1200
7E0 9E0 7E10 10E10 9E20 7E0 9E0 7E10 10E10 9E20
Co
rre
cte
d F
ue
l D
iurn
al
Pe
rme
ati
on
-m
gs
da
y
Day 1 Diurnal Permeation RatesAverages from E-77-2 Vehicles
Fuel
Enhanced(5 vehs)
Near Zero(2 vehs)
The average day 1 diurnal permeation for the five Enhanced Vehicles tended to increase as
ethanol content increased (with the exception of the E20 fuel) Again sample size and limited
data makes statistical conclusions inappropriate Table 6 presents the individual test used to
generate the averages used in Figure 16 The table includes the data from days 2 and 3 The
ethanol content of the diurnal measurements was calculated and appear in a series of figures in
the Appendix starting at page 37 Unlike Figure 16 the figures shown in the appendix have not
been corrected to exclude the non-fuel emissions (methanol and refrigerant) that were present
during these tests
Figure 16 ndash Day 1 Diurnal Permeation Comparison
25
Table 6
Vehicle ID Technology 7psi E0 9 psi E0 7 psi E10 10 psi E10 9 psi E20
204 Day 1 3672 6283 12601 15479 11034
1999 Honda Enhanced Day 2 2877 5810 11652 17799 9581
Accord Day 3 2936 5770 11653 17711 9812
205 Day 1 3830 4995 17834 17941 17752
2001 Toyota Enhanced Day 2 3654 4810 17150 17309 16900
Corolla Day 3 3670 5072 15239 17417 16802
207 Day 1 3975 4064 10865 14064 15480
2001 Dodge Enhanced Day 2 3026 3373 8120 12644 13702
Caravan Day 3 2689 3080 8236 12237 13605
214 Day 1 4943 4559 5242 4920 4709
2004 Ford Enhanced Day 2 3190 3585 3974 8394 4400
Escape Day 3 2815 11017 3944 113738 7518
215 Day 1 2483 2021 2247 3192 4168
2004 Toyota Enhanced Day 2 2941 1659 2317 2602 4148
Highlander Day 3 2888 1763 2675 2370 4506
3781 4384 9758 11119 10629
211 Day 1 2071 1303 2438 3370 2840
2004 Toyota Near Zero Day 2 1002 1158 1838 2268 2218
Camry XLE Day 3 874 1006 1843 2179 2034
212 Day 1 1016 1005 1848 1243 1310
2006 Ford Near Zero Day 2 712 708 1002 879 833
Taurus Day 3 570 574 758 1028 750
1544 1154 2143 2307 2075
CRC E-77-2 Program Results - Diurnal Permeation
Diurnal Permeation Rate - mgday
Enhanced Averages
Near Zero Averages
Carbon Canister Breakthrough ndash Canister breakthrough is measured by the weight change
recorded for the trap canister outside the SHED It quantifies the amount of vapors that
overwhelm the evaporative system storage canister Figure 17 displays the breakthrough
resulting from testing of 9 psi E0 fuel Only four of seven vehicles exhibited breakthrough
60
65
70
75
80
85
90
95
100
105
110
0
5
10
15
20
25
30
35
40
0 10 20 30 40 50 60 70
SH
ED
Te
mp
era
ture
-d
eg
F
Bre
ak
thro
ug
h -
mg
Test Time - hrs
Canister Breakthrough9 psi E0 Fuel - 65ordm to 105ordm F Diurnal
204 - 1999 Honda Accord
211 - 2004 Toyota Camry
215 - 2004 Toyota Highlander
205 - 2001 Toyota Corolla
Figure 17 ndashDiurnal Canister Breakthrough
26
Table 7 shows the breakthrough generated during the diurnal tests conducted
Table 7
Vehicle ID Technology 7psi E0 9 psi E0 7 psi E10 10 psi E10 9 psi E20
204 Day 1 --- 24 --- 310 ---
1999 Honda Enhanced Day 2 --- 136 --- 360 ---
Accord Day 3 --- 198 --- 360 ---
205 Day 1 --- --- --- 204 ---
2001 Toyota Enhanced Day 2 --- --- --- 309 ---
Corolla Day 3 --- 26 --- 293 ---
207 Day 1 --- --- --- --- ---
2001 Dodge Enhanced Day 2 --- --- --- --- ---
Caravan Day 3 --- --- --- --- ---
214 Day 1 --- --- --- --- ---
2004 Ford Enhanced Day 2 --- --- --- --- ---
Escape Day 3 --- --- --- 49 ---
215 Day 1 --- --- --- --- ---
2004 Toyota Enhanced Day 2 --- 02 --- --- ---
Highlander Day 3 --- 72 --- --- ---
211 Day 1 --- --- --- --- ---
2004 Toyota Near Zero Day 2 --- 129 --- 191 ---
Camry XLE Day 3 --- 176 --- 289 ---
212 Day 1 --- --- --- --- ---
2006 Ford Near Zero Day 2 --- --- --- --- ---
Taurus Day 3 --- --- --- 204 ---
CRC E-77-2 Program - Carbon Canister Diurnal Breakthrough Results
Diurnal Breakthrough - grams
Summary ndash The lack of canister breakthrough for the 7 psi fuels (summer grade) indicates that
the storage capacity of the seven systems tested is appropriately sized Breakthrough began to
appear when testing of 9 psi E0 fuel (not summer grade) and was more prevalent with the 10 psi
E10 fuel (winter grade) The lack of breakthrough with the 9 psi E20 fuel seems to be an
anomaly
27
Overall Trend Summary - The following chart (Figure 18) visually summarizes the trends seen
from all testing performed during this program
Higher Volatility E0 to E10 E0 to E20 E10 to E20
uarr uarr uarr uarr
Higher Volatility E0 to E10 E0 to E20 E10 to E20
uarr uarr uarr uarr
Higher Volatility E0 to E10 E0 to E20 E10 to E20
uarr uarr uarr uarr
Higher Volatility E0 to E10 E0 to E20 E10 to E20
uarr uarr uarr uarr
Higher Volatility E0 to E10 E0 to E20 E10 to E20
uarrharr uarr uarr uarr
Higher Volatility E0 to E10 E0 to E20 E10 to E20
uarr uarr uarr uarr
Higher Volatility E0 to E10 E0 to E20 E10 to E20
uarr darr darr
Higher Volatility E0 to E10 E0 to E20 E10 to E20
uarr uarr uarr harr
Ethanol Content
Diurnal
Trend Analysis for E-77-2 Program
Ethanol Content
Static Permeation
Ethanol Content
Running Loss Permeation
Ethanol Content
Ethanol Content
Diurnal
Enhanced Vehicles (Sample of 5)
Static Permeation
Ethanol Content
Ethanol Content
Running Loss Permeation
Ethanol Content
True Hot Soak (TEFVO)
Near-Zero Vehicles (Sample of 2)
True Hot Soak (TEFVO)
Figure 18 Trend Analysis Summaries
28
Vehicle 202 ndash 1996 Ford Taurus - Special Case
We have treated vehicle 202 as a special case This was the oldest of the vehicles tested and had
been subjected to limited exhaust emission tests with a 20-volume percent ethanol fuel (E20)
during the CRC E-74b test program
Vehicle 202 completed the E10 portion of the test program (10 and 7 psi fuels) successfully and
completed the road preconditioning on the E0 fuel prior to the E0 evaluations The first test on
the E0 fuel was excessively high indicating a fuel leak It was traced to a leaky fuel injector o-
ring and there was considerable discussion as to an appropriate repair Tests were made on the 9
and the 7 psi E0 fuel to measure the magnitude of a vehicle in a ldquoleakrdquo condition and the tests
were labeled as ldquo202L (Leak)rdquo The fuel injector o-rings were replaced as a complete set and
the vehicle resumed testing as ldquo202Rrsquo (Repaired) A new elusive vapor leak was present later
identified as a very small leak at the top of the fuel fill pipe
The circle on Figure 19 at the right shows
the location of the small leak This leak
was problematic as to its effect on the
emission measurements because its
magnitude or presence seemed to depend
on the torque exerted on the fuel cap The
tests on the E0 fuels (9 and 7 psi) are
noted as 202R but with a vapor leak
We attempted to fix this leak and repeated
the E10 test with the vehicle re-identified
as 216 with reasonable results We also
ran the E20 test sequence and declared the
vehicle done
The testing history for this vehicle is shown in Tables 8 (Static) 9 (Dynamic) and 10 (Diurnal)
The tests highlighted in yellow are those that exhibited a liquid or vapor leak as identified during
the static test leak validation
Figure 19 ndash Vehicle 202 Fuel Fill Pipe Leak
29
Table 8
Static Permeation Results 1996 Ford Taurus SHED
Corrected Results Canister
Fuel Permeation mgday Loss
Veh psiEtOH Test Type Date Test mghr (Corrected) g
202 100E10 Static Perm 071807 7018 345 000
Press Incr 00 No Leak
Prs+Fuel Incr 00
202 70E10 Static Perm 082107 7031 223 000
Press Incr 00 No Leak
Prs+Fuel Incr 00
202L 90E0 Static Perm 030408 7169 2292 000
Press Incr DNA
Prs+Fuel Incr 4921 Liquid Leak
202L 70E0 Static Perm 032008 7183 2991 000
Press Incr DNA
Prs+Fuel Incr 19896 Liquid Leak
202R 90E0 Static Perm 050808 7228 178 000
Press Incr 136 Vapor Leak
Prs+Fuel Incr 00
202R 70E0 Static Perm 052208 7239 204 000
Press Incr 380 Vapor Leak
Prs+Fuel Incr 00
216 100E10 Static Perm 081408 7299 324 000
Press Incr 00 No Leak
Prs+Fuel Incr 00
216 70E10 Static Perm 091708 7326 325 000
Press Incr 00 No Leak
Prs+Fuel Incr 00
216 90E20 Static Perm 103008 7363 204 000
Press Incr 00 No Leak
Prs+Fuel Incr 00
30
Table 9
Dynamic Permeation Results 1996 Ford Taurus SHED
Corrected Results Canister From
Fuel Permeation mgday Loss Static
Veh psiEtOH Test Type Date Test mghr (Corrected) g Test
202 100E10 Dynamic RL 072007 25662 1278 000 No Leak
TEFVO 386 000
202L 90E0 Dynamic RL 030508 25695 3870 000 Liquid Leak
TEFVO 00 000
202L 70E0 Dynamic RL 032408 25699 7269 000 Liquid Leak
TEFVO 00 000
202R 90E0 Dynamic RL 050908 25704 1091 000 Vapor Leak
TEFVO 50 000
202R 70E0 Dynamic RL 052308 25706 787 000 Vapor Leak
TEFVO 00 000
216 100E10 Dynamic RL 081508 25718 1742 000 No Leak
TEFVO 14 000
216 70E10 Dynamic RL 091808 25721 1683 000 No Leak
TEFVO 423 000
216 90E20 Dynamic RL 110708 25730 543 000 No Leak
TEFVO 00 000
31
Table 10
Diurnal Permeation Results 1996 Ford Taurus SHED
Corrected Results Canister From
Fuel Permeation mgday Loss Static
Veh psiEtOH Test Type Date Test mghr (Corrected) g Test
202 100E10 72 DHB 65-105 073107 7023
Day 1 10429 612 No Leak
Day 2 7069 3264
Day 3 7043 3869
202 70E10 72 DHB 65-105 082807 7034
Day 1 6278 000 No Leak
Day 2 5065 000
Day 3 4535 000
202L 90E0 72 DHB 65-105 031108 7173
Day 1 22589 000 Liquid Leak
Day 2 32310 000
Day 3 23069 1260
202L 70E0 72 DHB 65-105 040108 7196
Day 1 47425 000 Liquid Leak
Day 2 44517 000
Day 3 31798 000
202R 90E0 72 DHB 65-105 051308 7230
Day 1 3270 000 Vapor Leak
Day 2 2667 000
Day 3 2746 1083
202R 70E0 72 DHB 65-105 052808 7243
Day 1 2117 000 Vapor Leak
Day 2 2208 000
Day 3 2081 000
216 100E10 72 DHB 65-105 082008 7305
Day 1 25907 5777 No Leak
Day 2 34779 6299
Day 3 36014 6343
216 70E10 72 DHB 65-105 092308 7331
Day 1 3975 022 No Leak
Day 2 3550 006
Day 3 3621 037
216 90E20 72 DHB 65-105 111108 7373
Day 1 4685 000 No Leak
Day 2 4526 000
Day 3 4198 000
32
The Implanted Leak Test Results
Project E-77-2 included evaluating two vehicles with implanted leaks This interest followed the
information gathered in the Pilot Study where tests were run with a specially modified fuel cap
containing a 002rdquo dia hole The results with the implanted leak from the Pilot Study are
repeated in Table 11 below as the diurnal results are shown for a 1996 Chevrolet Cavalier first
without the implanted leak at 038 grams per day and then at 207 grams per day (a 54x
increase) with the leak
Table 11
Veh No
Evap
Tech Fuel
Results
gmsday
gms
Increase
6 1996 Chevrolet Cavalier Enhanced 7 psi E0 038
7 2070 2032
207 2001 Dodge Caravan Enhanced 7 psi E10 109
207L 213 104
211 2004 Toyota Camry LE Near Zero 7 psi E10 024
211L 068 044
- Implanted 020 leak in fuel cap
Vehicle Description
Implanted Leak Impact on Diurnal PermeationDay One Results 65deg - 105degF Diurnal
The two E-77-2 vehicles (207 amp 211) were given a limited evaluation with an induced leak and
saw a significantly lesser impact Vehicle 207 gave diurnal results increases from 109 to 213
grams per day (a 2x increase) and Vehicle 211 increased from 024 grams per day to 068 grams
per day (a 28x increase) The following Figure 20 displays the imbedded leak impact from Table
11
33
0
5
10
15
20
On
e D
ay
Diu
rna
l P
erm
ea
tio
n -
gm
sd
ay
Vehicle Number
Implanted Leak Impact on One Day Diurnal Permeation020 Leak in Fuel Cap - 65 to 105 F Diurnal
207L 211L21120776
As Received - No Leak
020 Fuel Cap Leak
The newer vehicles evaluated in this phase of the study were configured and certified to the
Onboard Refueling Vapor Regulations (ORVR) These are capable of containing 95 or more
control of the refueling vapors at up to 10 gallons per minute fueling rate Where the Chevrolet
Cavalier had a small (0055rdquo dia) orifice and a long vapor tube venting the tankrsquos vapor space to
the carbon canister (and then to the atmosphere) the ORVR compliant vehicles have a large
(0688rdquo ID) short vent hose to a low flow restriction carbon canister
The following bar charts (Figures 21 through 24) show the impacts of the leak on all phases of
the evaporative testing performed and compare those results with all fuels tested With only two
vehicles (207 and 211) evaluated on two fuels statistically significant effects cannot be
quantified but the trend of increased emissions is apparent
Figure 20 ndash Implanted Leak Impact
34
0
20
40
60
80
100
120
140
160
7E0 9E0 7E10 10E10 9E20 7E0 9E0 7E10 10E10 9E20
Sta
tic
Pe
rme
ati
on
-m
gh
r
Fuel
0020 dia Induced Leak EffectStatic Permeation
Vehicle 211Vehicle 207
Leak
Leak
0
200
400
600
800
1000
1200
7E0 9E0 7E10 10E10 9E20 7E0 9E0 7E10 10E10 9E20
Ru
nn
ing
Lo
ss
Pe
rme
ati
on
-m
gh
r
Fuel
0020 dia Induced Leak EffectRunning Loss Permeation
Vehicle 211Vehicle 207
Leak
Leak
Figure 21 ndash Vehicles 207 and 211 with Induced Leak - Static
Figure 22 ndash Vehicles 207 and 211with Induced Leak ndash Running Loss
35
0
100
200
300
400
500
600
700
7E0 9E0 7E10 10E10 9E20 7E0 9E0 7E10 10E10 9E20
Tru
e H
ot S
oa
k P
erm
ea
tio
n -
mg
hr
Fuel
0020 dia Induced Leak EffectTrue Hot Soak Permeation
Vehicle 211Vehicle 207
Leak
Leak
0
500
1000
1500
2000
2500
7E0 9E0 7E10 10E10 9E20 7E0 9E0 7E10 10E10 9E20
Da
y 1
Diu
rna
l P
erm
ea
tio
n -
mg
da
y
Fuel
0020 dia Induced Leak EffectDay 1 Diurnal Permeation
Vehicle 211Vehicle 207
Leak
Leak
Figure 24 ndash Vehicles 207 and 211 with Induced Leak - Diurnal
Figure 23 ndash Vehicles 207 and 211 with Induced Leak ndash True Hot Soak
36
Summary of Findings and Results
The E-77-2 test program was a continuation of the previously published E-77 test project and
added eight vehicles tested on five fuels to the knowledge base The permeation trends
previously shown were again present The small sample size and limited number of tests
preclude making statements about statistical validity but in general
o The newer vehicle groups had lower emissions
o Adding ethanol to the fuel increased permeation over the non-oxygenated levels
o Increased volatility increased permeation levels
o SHED emission rates must be corrected for the ethanol error in the FID and the
non-fuel methanol and refrigerant in the measurement
As this test program evolved and additional experience was gathered two program modifications
were made 1) The leak validation methodology was changed and 2) a different metric and
definition of the ldquoHot Soakrdquo was adopted
The leak validation portion of the static permeation test was found to be very sensitive and when
the data was corrected on a minute-by-minute basis for ethanol methanol and refrigerant the
change in apparent permeation rate was due as much to variation as to leaks See the discussion
starting at page 12 for the details of the development
Concern for and recognition of ldquoHot Soakrdquo emissions started in the original evaporative emission
regulations Carburetors had float bowls with ~ 50 ml of fuel that absorbed the latent engine heat
after the vehicle was shut down after operation The heat would cause the bowl temperature to
increase driving fuel vapors out through vents and leak paths to the atmosphere after vehicle
operation Todayrsquos fuel injection engines do not have the open bowls and the emission rates
following vehicle operation are mainly increased temperature permeation We recommended
and adopted a new name for the ldquotemporary emissions following vehicle operationrdquo (TEFVO)
which subtracts the basic permeation rate from the measured emissions See the discussion
starting at page 16 for details
37
Appendix
Acknowledgements
E-77-2 Steering Committee
David Brzezinski EPA
Kevin Cullen GM Powertrain
Dominic DiCicco Ford Motor Company
King D Eng Shell Global Solutions
Ben Hancock CARB
Constance Hart EPA
Phil Heirigs Chevron Global Downstream
Jeff Jetter Honda RampD Americas
Keith KnollNREL
John Koupal EPA
David H Lax API
Jeff Long CARB
Hector Maldonado CARB
Mani Natarajan Marathon Oil Company
David N Patterson Mitsubishi Motors RampD Americas
Jenny Sigelko Chrysler
James P UihleinChevron Global Downstream
Marie Valentine Toyota Technical Center
Kenneth J Wright ConocoPhillips
CRC Members
Brent Bailey CRC
Chris Tennant CRC
Jane Beck CRC
38
Table 12
E0 E10 E20
Inspection Units Fuel 6 Fuel 7 Fuel 4
API Gravity degAPI 602 585 570
Relative Density 6060degF 07382 07447 07508
DVPE psi 701 730 849
Oxygenates--D4815
MTBE vol 000 000 000
ETBE vol 000 000 000
EtOH vol 000 954 2034
O2 wt 000 353 747
Hydrocarbon Composition
Aromatics vol 221 244 108
Olefins vol 80 88 55
Saturates vol 700 573 234
D86 Distillation
IBP degF 974 1040 1022
5 Evaporated degF 1316 1280 1252
10 Evaporated degF 1423 1330 1314
20 Evaporated degF 1564 1410 1413
30 Evaporated degF 1704 1450 1486
40 Evaporated degF 1840 1530 1547
50 Evaporated degF 1975 1950 1596
60 Evaporated degF 2120 2190 1636
70 Evaporated degF 2305 2410 2274
80 Evaporated degF 2588 2710 2695
90 Evaporated degF 3139 3170 3139
95 Evaporated degF 3322 3300 3255
EP degF 3603 3600 3406
Recovery vol 978 978 983
Residue vol 13 10 10
Loss vol 09 12 07
Driveability Index 11199 11015 9898
Data from CRC E-74
CRC E-77-2 Fuel Inspection Results
39
Fuel Units Fuel 6 Fuel 7 Fuel 4
Sulfur Content ppm 29 27 27
Estimated CH Ratio 62090 63323 63252
Est Net Heat of Combustion btulb 18573 18514 18513
Benzene vol 090 100 096
Research Octane Number 932 940 946
Motor Octane Number 838 838 834
(R+M)2 885 889 890
Fuel Units Fuel 6 Fuel 7 Fuel 4
Aromatics vol 2386 2481 2178
Olefins vol 752 892 1074
Saturates vol 6743 5621 4623
Unclassified vol 115 086 015
Ethanol vol 000 920 2111
Benzene vol 089 106 097
CH Ratio 6200 6092 5835
Oxygen wt 0008 1 340 773
Net Heat of Combustion btulb 18703 18016 17160
1 Contains 004 vol MTBE
Fuel Units Fuel 6 Fuel 7 Fuel 4
Oxygen wt 0008 3396 7733
C+H wt 9999 9660 9227
H wt 1389 1362 1350
C wt 8610 8298 7877
Fuel Units 6 7 4
Haltermann D3338 Btulb 18573 18514 18513
Average D3338 Btulb 18579 18514 18491
Oxygen Corrected D3338 Btulb 18579 17860 17103
DHA Btulb 18703 18016 17160
Table 12 (cont)
Suppliers Additional Inspections
Net Heat of Combusion -- Btulb
Carbon Hydrogen and Oxygen
Detailed Hydrocarbon Analysis
40
Vehicle Day 1 Day 2 Day 3
No Fuel Base + Press + Pump RL True HS Perm (Brkthru) Perm (Brkthru) Perm (Brkthru)
E10 - 10 psi 345 --- --- 1278 503 10429 (63) 7069 (348) 7043 (425)
E10 - 7 psi 223 --- --- 994 113 6278 (00) 5065 (00) 4535 (00)
E0 - 9 psi 2229 --- 4921 3870 00 22580 (00) 32310 (00) 23069 (126)
E0 - 7 psi 2991 --- 19896 7269 00 47425 (00) 44517 (00) 31798 (00)
E10 - 10 psi 843 --- --- 3164 04 15479 (310) 17799 (383) 17711 (419)
E10 - 7 psi 664 --- --- 2879 297 12601 (00) 11652 (00) 11653 (00)
E0 - 9 psi 338 --- --- 2492 443 6283 (24) 5810 (136) 5770 (225)
E0 - 7 psi 129 --- --- 2226 187 3672 (00) 2877 (00) 2936 (00)
E20 - 9 psi 553 --- --- 2720 134 11034 (00) 9581 (00) 9812 (00)
E10 - 10 psi 416 --- --- 1916 295 17941 (204) 17309 (346) 17417 (375)
E10 - 7 psi 596 --- --- 2328 719 17834 (00) 17150 (00) 15239 (00)
E0 - 9 psi 195 --- --- 1031 10 4995 (00) 4810 (00) 5072 (26)
E0 - 7 psi 99 --- --- 671 00 3830 (00) 3654 (00) 3670 (00)
E20 - 9 psi 462 --- --- 1697 603 17752 (00) 16900 (00) 16802 (00)
E10 - 10 psi 787 --- --- 8581 2377 14064 (00) 12644 (00) 12237 (00)
E10 - 7 psi 644 --- --- 8122 1222 10865 (00) 8120 (00) 8236 (00)
E0 - 9 psi 325 --- --- 8339 58 4064 (00) 3373 (00) 3080 (00)
E0 - 7 psi 401 --- --- 8425 00 3975 (00) 3026 (00) 2689 (00)
E20 - 9 psi 882 --- --- 10282 00 15480 (00) 13702 (00) 13605 (00)
E10 - 10 psi 976 --- 1209 10012 3929 16449 (00) NA NA
E10 - 7 psi 1468 --- --- 11393 5850 21342 (00) NA NA
E10 - 10 psi 199 --- --- 1383 00 3370 (00) 2268 (191) 2179 (330)
E10 - 7 psi 94 266 --- 563 138 2438 (00) 1838 (00) 1843 (00)
E0 - 9 psi 101 --- --- 837 153 1303 (00) 1158 (129) 1006 (221)
E0 - 7 psi 91 --- --- 1046 07 2071 (00) 1002 (00) 874 (00)
E20 - 9 psi 558 --- --- 4106 00 2840 (00) 2218 (00) 2034 (00)
E10 - 10 psi 551 --- 821 3024 2450 25454 (040) NA NA
E10 - 7 psi 481 --- 1664 2511 62 6783 (00) NA NA
E10 - 10 psi 106 --- --- 1489 00 1243 (00) 879 (00) 1028 (200)
E10 - 7 psi 218 --- --- 2012 00 1848 (00) 1002 (00) 758 (00)
E0 - 9 psi 32 --- --- 1158 04 1005 (00) 708 (00) 574 (00)
E0 - 7 psi 09 --- --- 1845 18 1016 (00) 712 (00) 570 (00)
E20 - 9 psi 47 --- --- 1168 49 1310 (00) 833 (00) 750 (00)
E10 - 10 psi 244 --- --- 1331 574 4920 (00) 8394 (00) 113738 (49)
E10 - 7 psi 239 --- --- 1057 329 5242 (00) 3974 (00) 3944 (00)
E0 - 9 psi 107 --- --- 967 521 4559 (00) 3585 (00) 11017 (00)
E0 - 7 psi 252 --- --- 363 33 4943 (00) 3190 (00) 2815 (00)
E20 - 9 psi 168 --- --- 1394 560 4709 (00) 4400 (00) 7518 (00)
E10 - 10 psi 104 90 --- 719 16 3192 (00) 2602 (00) 2370 (00)
E10 - 7 psi 122 --- --- 979 00 2247 (00) 2317 (00) 2675 (00)
E0 - 9 psi 85 --- --- 811 251 2021 (00) 1659 (2) 1763 (72)
E0 - 7 psi 87 --- --- 797 225 2483 (00) 2941 (00) 2888 (00)
E20 - 9 psi 193 --- --- 1025 00 4168 (00) 4148 (00) 4506 (00)
E10 - 10 psi 324 --- --- 1742 118 25907 (578) 34779 (630) 36014 (643)
E10 - 7 psi 325 --- --- 1683 192 3975 (02) 3550 (01) 3621 (04)
E0 - 9 psi 178 136 --- 1091 254 3270 (00) 2667 (00) 2746 (108)
E0 - 7 psi 204 380 --- 787 00 2117 (00) 2208 (00) 2081 (00)
E20 - 9 psi 204 --- --- 543 74 4685 (00) 4526 (00) 4198 (00)
216
211
2004
Toyota
Camry
XLE
215
2004
Toyota
High-
lander
212
2006
Ford
Taurus
214
2004
Ford
Escape
211L
207L
Static Permeation - mghr Dynamic Perm - mghr
CRC E-77-2 Program Test Results
Diurnal (65ordm to 105ordm) - mgday
202
1996
Taurus
205
2001
Toyota
Corolla
204
1999
Honda
Accord
207
2001
Dodge
Caravan
202L
Table 13
41
Individual Vehicle Diurnal Performance on the Various Fuels
0
1000
2000
3000
4000
5000
6000
0 10 20 30 40 50 60 70
Cu
mu
lati
ve
Pe
rme
ati
on
-m
g
Test Time - hrs
Three Day DiurnalVehicle 204 1999 Honda Accord
10 psi E10
7 psi E10
9 psi E0
7 psi E0
9 psi E20
0
1000
2000
3000
4000
5000
6000
0 10 20 30 40 50 60 70
Cu
mu
lati
ve
Pe
rme
ati
on
-m
g
Test Time - hrs
Three Day DiurnalVehicle 205 - 2001 Toyota Corolla
10 psi E10
7 psi E10
9 psi E0
7 psi E0
9 psi E20
Figure 25 ndash Vehicle 204 Diurnal Performance
Figure 26 ndash Vehicle 205 Diurnal Performance
42
0
500
1000
1500
2000
2500
3000
3500
4000
4500
5000
0 10 20 30 40 50 60 70
Cu
mu
lati
ve
Co
rre
cte
d P
erm
ea
tio
n -
mg
Test Time - hrs
Three Day DiurnalVehicle 207 - 2001 Dodge Caravan
10 psi E10
7 psi E10
9 psi E0
7 psi E0
9 psi E20
0
100
200
300
400
500
600
700
800
900
0 10 20 30 40 50 60 70
Cu
mu
lati
ve
Pe
rme
ati
on
-m
g
Test Time - hrs
Three Day DiurnalVehicle 211 - 2004 Toyota Camry XLE
10 psi E10
7 psi E10
9 psi E0
7 psi E0
9 psi E20
Figure 27 ndash Vehicle 207 Diurnal Performance
Figure 28 ndash Vehicle 211 Diurnal Performance
43
0
50
100
150
200
250
300
350
400
450
500
0 10 20 30 40 50 60 70
Cu
mu
lati
ve
Pe
rme
ati
on
-m
g
Test Time - hrs
Three Day DiurnalVehicle 212 - 2006 Ford Taurus
10 psi E10
7 psi E10
9 psi E0
7 psi E0
9 psi E20
0
500
1000
1500
2000
2500
3000
3500
4000
4500
5000
0 10 20 30 40 50 60 70
Cu
mu
lati
ve
Pe
rme
ati
on
-m
g
Test Time - hrs
Three Day DiurnalVehicle 214 2004 Ford Escape
10 psi E10
7 psi E10
9 psi E0
7 psi E0
9 psi E20
Note The incomplete cumulative results for the 10 psi E10 results resulted from a conflict for the use
of the INNOVA analyzer during the test The INNOVA analyzer is required to correct for the FIDrsquos
ethanol error and the presence of methanol and refrigerant (R-134a) The data was available for the
50+ hour results and the data is valid as shown We have no explanation for the high levels
experienced on the third day of the test No test errors were identified
Figure 29 ndash Vehicle 212 Diurnal Performance
Figure 30 ndash Vehicle 214 Diurnal Performance
44
0
200
400
600
800
1000
1200
1400
1600
0 10 20 30 40 50 60 70
Cu
mu
lati
ve
Pe
rme
ati
on
-m
g
Test Time - hrs
Three Day DiurnalVehicle 215 2004 Toyota Highlander
10 psi E10
7 psi E10
9 psi E0
7 psi E0
9 psi E20
Figure 31 ndash Vehicle 215 Diurnal Performance
45
Table 14
Test Corrected
Vehicle Fuel Total Fuel EtOH R134a Methanol
204 10 psi E10 509899 144040 18298 16754
1999 Honda 7 psi E10 359057 130806 17551 15221
Accord 9 psi E0 178635 13843 18230 9896
7 psi E0 94846 1856 16631 2379
9 psi E20 304271 128408 18261 12143
205 10 psi E10 526659 186599 23354 20895
2001 Toyota 7 psi E10 502229 204246 25990 19198
Corolla 9 psi E0 148775 000 20434 4613
7 psi E0 111536 5489 22408 5619
9 psi E20 514540 212708 25677 19584
207 10 psi E10 389450 196248 12013 30399
2001 Dodge 7 psi E10 272201 114027 11731 19616
Caravan 9 psi E0 105167 1820 12224 15284
7 psi E0 96906 1118 22141 14276
9 psi E20 427882 241488 14268 25432
211 10 psi E10 78164 19733 15159 46970
2004 Toyota 7 psi E10 61190 20211 15929 46525
Camry LE 9 psi E0 34668 1681 14329 42659
7 psi E0 39468 000 16197 57303
9 psi E20 71013 26726 16213 36879
212 10 psi E10 31508 7222 14831 7896
2006 Ford 7 psi E10 36079 10132 15481 3400
Taurus 9 psi E0 22870 2409 15182 3761
7 psi E0 22973 000 15393 4362
9 psi E20 28935 11156 14116 2629
214 10 psi E10 1257887 000 19947 27992
2004 Ford 7 psi E10 131593 24571 16025 8879
Escape 9 psi E0 191611 2940 16487 7213
7 psi E0 109481 5386 80650 3106
9 psi E20 166271 24097 14491 6096
215 10 psi E10 81644 12178 14658 42609
2004 Toyota 7 psi E10 72399 15092 15532 36061
Highlander 9 psi E0 54431 000 14806 25822
7 psi E0 83115 000 14072 26255
9 psi E20 128223 38822 12841 34420
3 Day Diurnal Results
CRC E77-2 Program Diurnal ResultsAll values are in mg
46
0
200
400
600
800
1000
1200
1400
1600
1800
2000
Co
rrecte
d D
aily D
iurn
al
-m
g
Diurnal Ethanol PortionVehicle 204 - 1999 Honda Accord
Ethanol Portion
10 psi E10 9 psi E07 psi E10
1 32
315
341368
383
264273
1 321 321 321 32
9 psi E207 psi E0
1122097
39
0510
442
405412
Figure 32 ndash Vehicle 204 Diurnal Ethanol Portion
0
200
400
600
800
1000
1200
1400
1600
1800
2000
Co
rrecte
d D
aily D
iurn
al
-m
g
Diurnal Ethanol PortionVehicle 205 - 2001 Toyota Corolla
Ethanol Portion
10 psi E10 9 psi E07 psi E10
1 32
359
406
382
431355349
1 321 321 321 32
9 psi E207 psi E0
0 00
712649
406
420414
Figure 33 ndash Vehicle 205 Diurnal Ethanol Portion
47
0
200
400
600
800
1000
1200
1400
1600C
orr
ecte
d D
aily D
iurn
al
-m
g
Diurnal Ethanol PortionVehicle 207 - 2001 Dodge Caravan
Ethanol Portion
10 psi E10 9 psi E07 psi E10
1 32
488
442408
409
490535
1 321 321 321 32
9 psi E207 psi E0
00
1144
27
0101
556
587552
Figure 34 ndash Vehicle 207 Diurnal Ethanol Portion
0
50
100
150
200
250
300
350
400
Co
rrecte
d D
aily D
iurn
al
-m
g
Diurnal Ethanol PortionVehicle 211 - 2004 Toyota Camry XLE
Ethanol Portion
10 psi E10 9 psi E07 psi E10
1 32
264
242245
1 321 321 321 32
9 psi E207 psi E0
329
306356
00
73
64
00
00
00
325
431
370
Figure 35 ndash Vehicle 211 Diurnal Ethanol Portion
48
0
20
40
60
80
100
120
140
160
180
200C
orr
ecte
d D
aily D
iurn
al
-m
g
Diurnal Ethanol PortionVehicle 212 - 2006 Ford Taurus
Ethanol Portion
10 psi E10 9 psi E07 psi E10
1 32
216
170
316
1 321 321 321 32
9 psi E207 psi E0
194
288
436 102
105
85
00
00
00476
529
243
Figure 36 ndash Vehicle 212 Diurnal Ethanol Portion
0
200
400
600
800
1000
1200
Co
rrecte
d D
aily D
iurn
al
-m
g
Diurnal Ethanol PortionVehicle 214 - 2004 Ford Escape
Ethanol Portion
10 psi E10 9 psi E07 psi E10
1 32
00
1 321 321 321 32
9 psi E207 psi E0
201
202152
38
05
19
56
1469
103
171188
143
67
11275
Figure 37 ndash Vehicle 214 Diurnal Ethanol Portion
49
0
50
100
150
200
250
300
350
400
450
500C
orr
ecte
d D
aily D
iurn
al
-m
g
Diurnal Ethanol PortionVehicle 215 - 2004 Toyota Highlander
Ethanol Portion
10 psi E10 9 psi E07 psi E10
1 32
121
136
196
1 321 321 321 32
9 psi E207 psi E0
198
217213
0000
00
0000
00
335 292
283
Figure 38 ndash Vehicle 215 Diurnal Ethanol Portion

7
This vent was closed to pressurize the system for the leak evaluations The resulting SHED
increase in HC mass was permeation7 The last mechanism that needed to be evaluated was
leaks Leaks can be both vapor and liquid A liquid leak can have significant mass currently
undetected by the vehiclersquos on-board diagnostic system Considerable thought and effort have
gone into the creation of a simple and effective liquid leak detection methodology without
success The techniques used in this project required the use of a SHED for measurements The
techniques were not simple but they proved effective
Based on experience a vehiclersquos permeation rate is expected to be between the range of 4 to 90
mghour at the 86degF test temperature The presence of a static liquid leak is expected to
overwhelm this value such a leak would (or could) be apparent by inspection Leaks from the
vehicles were quantified in a three-step test process The first step was to measure the static
permeation rate of the vehicle at 86ordmF The vehicle was allowed to stabilize overnight at 86ordmF in
the SHED and the permeation rate was calculated from the mass increase in the SHED during a
one-hour measurement period The second part of the test looking for pressure driven leaks in
the vapor system was performed by pressurizing the vehiclersquos tank to 5rdquo H2O through a special
fuel cap and tubing from outside the SHED (Figure 5) The special fuel cap the hose and the
pressurization apparatus were installed before the start of the sequence The HC concentration in
the SHED was monitored and the increase in the mass of HC in the SHED during the 30-minute
pressurization period compared to the static permeation rate If there was no (or insignificant)
rate of increase it was deduced that no vapor leak was present
The third and final part of the test was to energize the vehiclersquos fuel pump and pressurize the
system up to and including the injectors (Figure 6) If there were a pressure leak in the liquid
system an increase in the SHED mass over the 30-minute measurement period would be seen
ie the leak would be additive to the permeation rate
6 This is a simplification There are other HC sources present that are not fuel permeation These include tire paint
adhesives and vinyl emissions and the possibility of fuel leaks from the fuel injectors We believe these to be a
minor component of the emissions measured in this study
Figure 5 - Static Test ndash Tank Pressurization
8
Figure 6 ndash Static Test ndash Fuel Pump Energized
Other Tests (Dynamic Hot Soak and Diurnal) - A similar configuration is used to isolate the
tank venting losses from the permeation measurements determined by other test procedures The
vehiclersquos canister vent is connected with a low permeation hose (Teflontrade) to a bulk-head fitting
in the SHED wall and then to a separate ldquotrap canisterrdquo on a top-loading scale Any HC
emissions that escape from the vehiclersquos canister are captured in the trap canister and measured
at a 001 g (10 milligram) precision The trap canister (a 1 Liter Ford model) is purged before
each test and maintained at a ldquodryrdquo condition so that it captures all of the vehiclersquos escaping
emissions This assumption is probably violated during the high volatility tests where there are
30 grams of daily emissions but this is not a concern at this time
Test Elements for E-77-2 - The following flow chart (Figure 7) displays the various elements
utilized during the testing of the various vehicles and fuels during this program Details of each
of the four basic tests follow the flow chart
9
Drain and 40 Fill
with 10 psi E10 Test Fuel
Road Preconditioning
Four LA-4rsquos or Equivalent
Drain and 40 Fill
with 10psi E10 Test Fuel
Overnight Park at 86degF
Move to SHED
Connect Test Instrumentation
Stabilize at 86degF
Perform Constant Temperature
Permeation Series (86degF)
1 hour Permeation Rate Test
frac12 hour Tank Pressurized Test
frac12 hour Pump Energized Test
Transfer to RL SHED
Connect Test Instrumentation
Stabilize at 86degF
Perform Dynamic Permeation Test
Two LA92 Driving Cycles amp
One Hour Hot Soak
Drain and 40 Fill
With 10 psi E10 Test Fuel
Road Preconditioning
Four LA-4rsquos or Equivalent
Move to VT-SHED
Connect Test Instrumentation
Stabilize at 65degF for 6 hrs Minimum
Perform 3-Day Diurnal Evaluation
72 hr 65deg to 105degF VT Test
Drain and 40 Fill
with 7 psi E10 Test Fuel
Condition Fuel System
By Driving for One Week
Repeat Steps 1 ndash 12
On 7 psi E10 Test Fuel
Drain and Fill with 9 psi E0 Test Fuel
Condition Fuel System by 4 weeks Driving
Repeat Steps 1 ndash 12
On 9 and 7 psi E0 and
Repeat Steps 0-12
On 9 psi E20 Test Fuels
Precondition Fuel System
With 4 Weeks Driving on
10 psi E10 Test Fuel
1
2
3
4
5
6
7
8
9
10
11
12
0
Figure 7 ndash Testing Flow Chart
10
Test Procedures ndash There are four basic tests in the E-77-2 test protocol
1 Static Permeation Rate (includes checks for vapor and liquid leaks)
2 Running Emissions (Dynamic Test)
3 Hot Soak
4 Diurnal
Each is described in detail below
1 Static Permeation Rate Testing
The constant temperature (static) permeation rate is measured in a traditional SHED (Constant
temperature) in the following manner
A The fuel tank is drained and filled to 40 tank capacity with the test fuel
B The day before testing the vehicle is driven over four road trips of 75 miles each
to precondition the canister8 (These drives are similar to the LA-4)
C Upon return from the road pre-conditioning the fuel tank is drained and filled to
40 tank capacity with the test fuel9
D Vehicle is parked for 18-22 hours in a controlled temperature environment at test
temperature (86ordmF)
E The vehicle is then moved (without starting) into the test (86ordmF) SHED
F The canister vent is connected to the SHED bulkhead fitting which routes the
vapor to the trap canister outside the SHED
G The tank system pressurization hose is connected
H The fuel pump electrical connection is connected
I The SHED is sealed the inside temperature is allowed to stabilize and the test is
started Continuous THC measurements are made using a FID Ethanol
methanol and R134a concentrations are measured using an INNOVA analyzer
All measurements are made at least every minute for one hour to determine the
stabilized permeation rate
J At the end of the static test (60 minutes) the vehiclersquos vapor system is pressurized
to 5 inches of water for thirty minutes Measurements are made to quantify vapor
leaks as determined by a change in the THC in the SHED
K The fuel pump is then energized for 30 minutes while maintaining the 5 inches of
water on the vapor system Liquid leaks are quantified as determined by a change
in the concentration of THC in the SHED
The purpose of steps J and K above is to validate that the permeation rate measurement was
made without the presence of any leak ndash either liquid or vapor A detailed discussion follows
starting at page 12
8 This conditioning can be done in the laboratory on a chassis dynamometer if proper attention is paid to underbody
cooling and unrepresentative fuel tank temperatures are avoided 9 Vehicles with ORVR systems will add the refueling vapors to the canister This is OK
11
2 Running Loss Test (Dynamic Test)
A The vehicle is placed in the RL-SHED and prepared for test (The fuel level and
condition for the dynamic test is the fuel remaining after completion of the static test ndash
40 fresh fill of the appropriate test fuel)
B Outside air source for the engine is connected
C Vehicle exhaust is connected
D Fuel tank thermocouple is connected
E Canister vent is connected to the SHED bulkhead fitting which routes the vapor to the
trap canister outside the SHED
F Vehicle is allowed to stabilize in the RL-SHED at test temperature (86degF) for a minimum
of 12 hours ndash preferably overnight
G Two cycles of the Unified Cycle (LA-92) driving schedule (48 mins) are driven while
measuring the mass emissions in the SHED Vehicle is allowed to idle (in drive) for 30
seconds between the two cycles Ambient air temperature is maintained (to the extent
possible) at 86degF Fuel tank surface temperature is monitored during vehicle operation It
should increase during the drive from 10 to 18degF to simulate expected on-road
temperature increase Measured mass emissions are corrected using the INNOVA data
for the ethanol methanol and refrigerant emissions
3 Hot Soak10
This procedure is executed immediately following the Running Loss Test procedure
described above
A Engine is turned off transmission selector is placed in park and driver exits the
enclosure using the double door air lock taking care to minimize any air exchange
between the laboratory and the SHED This starts the one hour ldquohot soakrdquo period
B Measurements of mass emissions in the SHED are continued for another 60 minutes
(until time = 108 minutes) correcting for the ethanol methanol and refrigerant mass
using the INNOVA instrument data This ends the hot soak Hot soak emissions are
calculated as the net difference for the one hour hot soak (CorrMass108 ndash CorrMass48
minus the 86degF static hourly rate all mass rates in mghour)
4 Diurnal Test
A The fuel tank is drained and filled to 40 tank capacity with the test fuel
B The day before testing the vehicle is driven over four road trips of 75 miles each to
precondition the vehicle and the canister
C Upon return from the road pre-conditioning the fuel tank is drained and filled to 40
tank capacity with the test fuel
D The vehicle is parked for 18-22 hours in a controlled temperature environment at the
initial diurnal test temperature (65ordmF)
E The SHED is sealed allowed to stabilize at the 65degF temperature and the 3-day
California Diurnal Test is started
10 We define the ldquohot soakrdquo to be the temporary increase in emission rate caused by the immediately preceding
operation of the vehicle It is the increase in the SHED mass (corrected for EtOH MeOH and R-134a) over the
one hour period minus the previously established ldquostaticrdquo permeation rate
12
F ldquoContinuousrdquo (every 30 seconds) THC measurements are made using a FID Ethanol
methanol and R134a (refrigerant) concentrations are measured using an INNOVA
analyzer at least every 10 minutes for the duration of the test (72 hours)
Static Permeation Test ndash Leak Validation
If a leak is detected during either the vapor system pressure portion (Step J) or the pump
energized portion (Step K) of the Static Permeation Test procedure it calls into question whether
the permeation rate measurement accurately reflects fuel system permeation or if instead a
combination of permeation and the implied leak was measured If a leak is confirmed the
permeation rate measurement is called into question and an investigation possible remedy and
retest is indicated
The permeation rate measurement must be corrected for the FIDrsquos ethanol misrepresentation and
the presence of non-fuel hydrocarbons (methanol and refrigerant) The leak check however is
made using the change in mass increase in the SHED using the uncorrected FID mass calculation
as the determinate It was found that the corrections for ethanol methanol and refrigerant were
introducing ldquonoiserdquo into the trace and that these were being misinterpreted as leaks
y = 062x - 19
y = 047x + 67
y = 055x - 01
0
10
20
30
40
50
60
70
80
90
100
0 20 40 60 80 100 120
SH
ED
Mas
s -
mg
Test Time - minutes
Leak TestVehicle 204 - 1999 Honda Accord - 9 psi E0
Test 7028
Pump ActivatedTank Pressurized
Figure 8 above represents the calculations made during the inspection of data from a successful
test EXCELrsquostrade ldquoSLOPErdquo function is used to calculate the linear regression values based on
the FID calculation for mass for Time 0 to 60 minutes Time 64 to 90 minutes and Time 94 to
120 minutes A 4-minute gap was included between each sequence to establish the new mass
emission rate during the ldquopressure onrdquo (T60 to T90) and the ldquopump energizedrdquo periods
The slope of 047 for the ldquoTank Pressurizedrdquo period in the example above is compared to the
slope of 062 calculated for the permeation rate (or hot soak) period Since the ldquoTank
Figure 8 ndash Leak Test
13
Pressurizedrdquo slope is not more than 10 higher than the hot soak permeation rate we assume
that there is no leak present A similar comparison is made for the slope determined during the
ldquopump onrdquo period The choice of a 10 allowance is arbitrary and is used here to allow for
normal and unavoidable test variation
For tests in which the above procedure determines that no leak is present a value of zero is
reported in the test summary for the leak results If a positive value is reported it calls that test
into question and an investigation possible repair and retest is indicated
Static Permeation Rate Determination
The static permeation rate is determined based on a linear regression through the individual
SHED mass data points (data measured each 30 seconds) of the corrected fuel results (corrected
for the FID error and subtracting the methanol and refrigerant) from the first 60 minutes of
testing as illustrated in Figure 9 below
y = 05636x + 0505
0
5
10
15
20
25
30
35
40
45
0 10 20 30 40 50 60
Pe
rme
ati
on
-m
gs
Test Time - mins
Static Permeation DeterminationVehicle 204 - 1999 Honda Accord - 9 psi E0 Fuel
Raw SHED
Corrected Fuel
Permeation Rate Based on Corrected Results
Permeation Rate = 5636 x Time = 338 mgshr
In this example the static permeation rate is 338 mghr
Dynamic (Running Loss) and Hot Soak Test
The preceding section addressed the concepts of separating the permeation emissions from the
tank venting emissions and establishing the presence or absence of leaks The second part of
this study includes a dynamic test to measure the permeation and tank venting emissions during
Figure 9 ndash Static Permeation Determination
14
vehicle operation (ldquorunning lossesrdquo) and the temporary condition following vehicle operation
known as the ldquohot soakrdquo
This is considered a ldquodynamicrdquo test because the vehicle is driven and the fuel and vapor system
temperatures rise during the test The ambient temperature in the Running Loss SHED during
the test was held constant at 86degF while the vehiclersquos fuel system temperature rose during the
test Two 1435 second (239-minute) LA-92 driving cycles were performed consecutively during
the running loss measurements with a 30-second idle in-between During this test tank fuel
temperature was expected to rise by an average approximately 18degF above the initial ambient
temperature The running loss air handling system included a proportional speed under-car
blower operated as a slave to dynamometer speed This apparatus was used during running loss
testing with minor tuning for specific vehicles Without additional input it is capable of
reasonable fuel tank temperature control Each vehicle was fitted with a surface-mount
thermocouple at the front of the fuel tank located at approximately the 18th
fill level to measure
the fuel liquid temperature No attempt was made to follow a predefined fuel tank temperature
profile (FTTP) in this program Fuel temperatures were recorded and results are available in the
real-time records
Vehicle running loss emissions are measured in a special version of a SHED known as a
Running Loss SHED (RL-SHED) shown in Figure 10 Special features of the RL-SHED
include a sealed chassis dynamometer for simulating vehicle driving loads a sealed outside air
supply for engine intake a sealed exhaust conduit for engine exhaust and an under-chassis fan
for simulating underbody air flow as described above A vehicle is operated inside the RL-SHED
over a chosen driving cycle The increase in HC emissions inside the enclosure are measured
and calculated as mass emissions per 40 CFR sect86163-96
Figure 10 - Running Loss SHED
15
Vehicle testing in an RL-SHED is complicated by several factors including
1 Engine must be supplied with external induction air
2 Exhaust must be conducted externally without any leaks
3 Load supplied to the vehicle through the chassis dynamometer must not create or
allow external leaks
4 Internal SHED temperature must be maintained while sizable heat is rejected to the
ambient by the running engine and exhaust
5 Cooling air supplied to the radiator must be modulated to represent the vehiclersquos road
speed
6 Underbody (and especially the fuel system) temperature should represent the rate of
rise experienced by a real road-drive
Canister vent losses were isolated from permeation emissions using the technique previously
described The vehiclersquos carbon canister fresh air vent was connected to the outside of the RL-
SHED using a leak-tight PTFEreg
hose (38rdquo OD commercial tubing US Plastics 58055 PTFE or
equivalent) connected to a small carbon ldquotraprdquo canister located on a top-loading precision scale
The scale precision was 001 grams (10 milligrams) and it was purged prior to each test There
were no tank venting emissions measured on any of the running loss test measurements All of
the vehicles appeared to be actively ldquopurgingrdquo their respective control canisters and drawing
fresh air during the test If there were any emissions from the vehiclersquos control canister as might
have occurred if there were no vehicle purge or if very high volatility fuels with excessive vapor
generation were used they would have been measured
The Running Loss Driving Cycle consisted of two cycles of the ldquoUnified Driving Cyclerdquo
otherwise known as the LA-92 A velocity versus time plot for one cycle is shown in Figure 11
The LA-92 cycle takes 24 minutes to complete and covers 98 miles with many speed changes
Two back-to-back cycles were driven the first as a ldquocold startrdquo and the second following a 30-
second vehicle idle The ldquocold startrdquo condition was created by soaking the vehicle for a
Figure 11 ndash Running Loss Driving Cycle
Unified Cycle (LA-92)
0
10
20
30
40
50
60
70
80
0 5 10 15 20 25Test Time - minutes
Spe
ed -
mph
Cycle Time (min) 239
Maximum Speed (mph) 672
Average Speed (mph) 246
Average Non-Zero Speed (mph) 294
Time Zero Speed () 162
Distance (miles) 982
16
minimum of 18 hours at 86degF moving it to the stabilized 86degF RL-SHED making the test
connections and then waiting a minimum of one hour before the initial start and run
The SHED emissions were measured during 48 minutes of engine operation and then
continuously for one hour after the engine was turned off This one hour engine-off duration
was the ldquohot soakrdquo period The total test time is 1 hour and 48 minutes
Figure 12 shows results from the 9 psi E0 fuel test on Vehicle 204 The horizontal axis is test
time in minutes and the vertical axis is the HC mass measured in the RL-SHED during the test
period
The engine was shut off at the end of the second LA92 drive cycle (~48 minutes) and the
analysis system continued to measure the HC emissions in the SHED for the next 60 minutes
This represented the ldquohot soakrdquo portion of the test
0
50
100
150
200
250
300
0 20 40 60 80 100 120
Co
rre
cte
d T
ota
l F
ue
l C
um
ula
tiv
e P
erm
ea
tio
n -
mg
Test Time - minutes
Running Loss and Hot SoakVehicle 204 - 1999 Honda Accord - 9 psi E0 Fuel
Test 25668
Running Loss Hot Soak
Running Loss Std =005 gmiThis Test = 0010 gmi
RL = 249 mghr
2774
2332
Tru HS = 442
1990
The ldquoTruerdquo Hot Soak
The traditional hot soak is determined from the increase in SHED emissions as measured for one
hour following a prescribed drive to heat up the vehicle (2 LA-92 cycles during the Running
Loss Test) Hot soak emissions however have two components that caused by the elevated
temperature resulting from the drive and that resulting from one hour of static permeation
Figure 12 ndash Running Loss Test Results
17
To separate these two components and determine the ldquotruerdquo hot soak emissions the following
procedure was used ldquoTraditionalrdquo hot soak emissions were first calculated by subtracting the
ldquostart of hot soakrdquo cumulative SHED hydrocarbon value (ie 199 mg t = 48 minutes) from
the final cumulative SHED hydrocarbon value (ie 2774 mg t = 108 min) This resulted in a
cumulative SHED hydrocarbon value of 78 mg for the 1 hour hot soak The previously
determined static permeation value (ie 338 mg for a 1 hour hot soak test- see Figure 9) was
then subtracted to arrive at the ldquotruerdquo hot soak value of 442 mg The increase in the permeation
rate (the ldquohot soak effectrdquo) caused by the increase in the system temperature is accounted for by
subtracting the ldquostabilized permeation raterdquo at 86degF
In Figure 12 the static permeation rate is superimposed as a solid blue line on the plot from the
starting point of the hot soak until its end (one hour) While the ldquotraditionalrdquo hot soak would be
calculated as 78 mg (277 mg ndash 199 mg) the ldquotruerdquo hot soak is determined as 442 mg (2774 mg
ndash 2332 mg) True hot soak values reported here were determined in this manner
Diurnal Test
Diurnal permeation was determined by subjecting the vehicle to a three-day period in a
temperature controlled SHED while continuously recording the total hydrocarbon every 30
seconds The SHED environmental temperature was varied from 65degF to 105degF per the
California Diurnal Test protocol Canister vent losses were isolated from permeation emissions
using the technique previously described The vehiclersquos carbon canister fresh air vent was
connected to the outside of the RL-SHED using a leak-tight PTFEreg
hose connected to a small
carbon ldquotraprdquo canister located on a top-loading precision scale The scale precision was 001
grams (10 milligrams) and it was purged before each test
DISCUSSION OF TEST RESULTS
Results
Emission results are presented below by ldquomechanism11
rdquo with the data averaged for the five
ldquoenhancedrdquo and the two ldquonear zerordquo vehicles The lone ldquopre-enhancedrdquo vehicle the 1996 Ford
Taurus (202) was a special case and will be discussed in a separate section Two of the vehicles
the 2001 Dodge Caravan (207) and the 2004 Toyota Camry (211) were also subjected to limited
testing with an ldquoimplanted leakrdquo (a 0020rdquo dia hole in a special tank gas cap) to investigate the
magnitude of a known leak These results (ldquoLeakersrdquo) follow the discussion on the Taurus
Static Permeation Rate (Constant Temperature (86degF)) - Average permeation rate compared
by fuel specification for two vehicle groups ldquoenhancedrdquo and the ldquonear zerordquo evaporative
emissions
11 The ldquomechanismsrdquo are 1 Permeation 2 Tank Venting (Daily Temperature Rise) and 3 Leaks
18
0
10
20
30
40
50
60
Co
rrecte
d P
erm
eati
on
Rate
-m
gh
r
Fuel
Static Permeation Rate - All FuelsE77-2 Program Vehicles
7 E0 9 E2010 E107 E109 E0 7 E0 9 E2010 E107 E109 E0
Enhanced(5 veh)
Near Zero(2 veh)
Figure 13 presents the static permeation rate performance for the average of the 5 ldquoenhancedrdquo
and 2 ldquonear zerordquo vehicles on the five fuels included in the test program Each group is ordered
from left to right by ethanol level The vertical scale is the average permeation rate in mghour
for the static (86degF constant temperature) test
Previous studies1213
had shown that vehicles operated on the fuel containing 10 vol- ethanol
would have higher permeation rates compared to those resulting from operation on a non-ethanol
(E0) fuel of similar properties We also expected that vehicles using higher vapor pressure fuel
would exhibit increased permeation levels at similar ethanol levels Other studies had reported
mixed results when comparing E20 permeation rates against E10 measurements ndash some were
higher and some were lower The difference may have been within the repeatability of the
measurements and probably suffered from a limited number of observations These mixed
results are present in this testing of the enhanced vehicles however the E20 (violet bar) is higher
on average for static permeation rate for the Near Zero group The data that were used to
construct the averages in Figure 13 are listed in Table 3 below There is significant variability in
the test results and the limited sample size precludes making conclusive statements with
statistical confidence
12 CRC E-653 Fuel Permeation from Automotive Systems E0 E6 E10 E20 and E85 December 2006 13
CRC E-77 Vehicle Evaporative Emission Mechanisms A Pilot Study June 2008
Figure 13 ndash Static Permeation Rate Comparison
19
Table 3
Vehicle ID Technology 7psi E0 9 psi E0 7 psi E10 10 psi E10 9 psi E20
204
1999 Honda Enhanced 129 338 664 843 553
Accord
205
2001 Toyota Enhanced 99 195 596 416 462
Corolla
207
2001 Dodge Enhanced 401 325 644 787 882
Caravan
214
2004 Ford Enhanced 252 107 239 244 168
Escape
215
2004 Toyota Enhanced 87 85 122 104 193
Highlander
194 210 453 479 452
211
2004 Toyota Near Zero 91 101 94 199 558
Camry XLE
212
2006 Ford Near Zero 09 32 218 106 47
Taurus
50 67 156 153 303
Static Permeation Rate - mghr
CRC E-77-2 Program - Static Permeation Results
Enhanced Averages
Near Zero Averages
Summary ndash Static permeation rate increased with increase in ethanol level Three of the 5
enhanced emission vehicles did not show an increase in permeation rate when tested with the 9
psi E0 compared to the 7 psi E0
20
Dynamic (Running Loss) Permeation - In a similar presentation Figure 14 shows the average
ldquoRunning Lossrdquo permeation rate for the vehicle types and the fuels tested ldquoRunning Lossrdquo
permeation as described here is the permeation measured during a ldquocold startrdquo 48 minute drive in
a Running-Loss SHED (RL-SHED) at 86degF
0
50
100
150
200
250
300
350
400
7E0 9E0 7E10 10E10 9E20 7E0 9E0 7E10 10E10 9E20
Co
rre
cte
d R
un
nin
g L
os
s P
erm
ea
tio
n -
mg
hr
Fuel
Running Loss Permeation Rate - All FuelsE77-2 Program Vehicles
Enhanced(5 vehs)
Near Zero(2 vehs)
The dynamic permeation rates for the enhanced vehicles (left panel) followed a similar pattern as
the static permeation The average of the E20 fuel was the highest of the average values
observed on both the enhanced and the near-zero vehicles (left and right panels respectively)
Table 4 below shows the data used to generate the averages used in Figure 14
Figure 14 ndash Running Loss Permeation Comparison
21
Table 4
Vehicle ID Technology 7psi E0 9 psi E0 7 psi E10 10 psi E10 9 psi E20
204
1999 Honda Enhanced 2226 2492 2879 3164 2720
Accord
205
2001 Toyota Enhanced 671 1031 2328 1916 1697
Corolla
207
2001 Dodge Enhanced 8425 8339 8122 8581 10282
Caravan
214
2004 Ford Enhanced 363 967 1057 1331 1394
Escape
215
2005 Toyota Enhanced 797 811 979 719 1025
Highlander
2496 2728 3073 3142 3424
211
2004 Toyota Near Zero 1046 837 563 1383 4106
Camry XLE
212
2006 Ford Near Zero 1845 1158 2012 1489 1168
Taurus
1446 998 1288 1436 2637
Enhanced Averages
Near Zero Averages
CRC E-77-2 Program - Running Loss Permeation Results
Running Loss Permeation Rate - mghr
Summary ndash The dynamic permeation rate (measured during vehicle operation) was higher with
the E10 fuel compared to E0 for the enhanced vehicles The E20 permeation rate was higher
than E0 and the E10 fuel The small sample size and limited data precludes us from making
statements about statistical confidence but this may indicate a trend The near zero vehicle
average increased as the ethanol level increased Trends with volatility were mixed or
inconclusive
22
Hot Soak (ldquoTrue Hot Soakrdquo) Permeation ndash The Hot Soak emissions as defined in this report
are the net increase in permeation rate following vehicle operation We measured the mass
increase in the SHED for one hour immediately following vehicle operation and subtracted the
previously measured static (or normal) permeation at the same temperature While this is not the
traditional Code of Federal Regulations (CFR) definition we feel it is appropriate for the intent
of this project
0
10
20
30
40
50
60
70
7E0 9E0 7E10 10E10 9E20 7E0 9E0 7E10 10E10 9E20
Co
rre
cte
d H
ot
So
ak
Pe
rme
ati
on
-m
gh
r
Fuel
True Hot Soak Permeation Rate - All FuelsE77-2 Program Vehicles
Enhanced(5 vehs)
Near Zero(2 vehs)
The ldquoTrue Hot Soakrdquo performance for the average of the Enhanced Vehicles is summarized in
Figure 15 above There was a large increase in the hot soak value with the E10 fuel compared to
the E0 The hot soak value with the E20 fuel was comparable to the E0 results and lower than
the E10
The Near Zero vehicles (2) had zero hot soak emissions when tested on the 10 psi E10 fuel
(Figure 16) With only two vehicles and the very low levels attained no statistically significant
conclusions can be drawn from the data available Table 5 presents the individual tests used in
calculating the average values plotted in Figure 15
Figure 15 ndash True Hot Soak Permeation Comparison
23
Table 5
Vehicle ID Technology 7psi E0 9 psi E0 7 psi E10 10 psi E10 9 psi E20
204
1999 Honda Enhanced 187 443 297 04 134
Accord
205
2001 Toyota Enhanced 00 10 719 295 603
Corolla
207
2001 Dodge Enhanced 00 58 1222 2377 00
Caravan
214
2004 Ford Enhanced 33 521 329 574 560
Escape
215
2005 Toyota Enhanced 225 251 00 16 00
Highlander
89 257 513 653 259
211
2004 Toyota Near Zero 07 153 138 00 00
Camry XLE
212
2006 Ford Near Zero 18 04 00 00 49
Taurus
13 79 69 00 25
CRC E-77-2 Program - True Hot Soak Permeation Results
True Hot Soak Permeation Rate - mghr
Near Zero Averages
Enhanced Averages
Summary - The True Hot Soak permeation (permeation rate measured following vehicle
operation less the static constant temperature permeation rate) rate was higher with the E10 fuel
compared to E0 for the enhanced vehicles The E20 permeation rate was higher than E0 and
lower than the E10 fuel The near zero vehicle trends with both ethanol content and volatility
were mixed or inconclusive The small sample size and limited data precludes us from making
statements about statistical confidence
24
Diurnal Permeation Performance ndash Figure 16 presents the diurnal permeation results for the
first day of the three-day diurnal test (65deg to 105degF)
0
200
400
600
800
1000
1200
7E0 9E0 7E10 10E10 9E20 7E0 9E0 7E10 10E10 9E20
Co
rre
cte
d F
ue
l D
iurn
al
Pe
rme
ati
on
-m
gs
da
y
Day 1 Diurnal Permeation RatesAverages from E-77-2 Vehicles
Fuel
Enhanced(5 vehs)
Near Zero(2 vehs)
The average day 1 diurnal permeation for the five Enhanced Vehicles tended to increase as
ethanol content increased (with the exception of the E20 fuel) Again sample size and limited
data makes statistical conclusions inappropriate Table 6 presents the individual test used to
generate the averages used in Figure 16 The table includes the data from days 2 and 3 The
ethanol content of the diurnal measurements was calculated and appear in a series of figures in
the Appendix starting at page 37 Unlike Figure 16 the figures shown in the appendix have not
been corrected to exclude the non-fuel emissions (methanol and refrigerant) that were present
during these tests
Figure 16 ndash Day 1 Diurnal Permeation Comparison
25
Table 6
Vehicle ID Technology 7psi E0 9 psi E0 7 psi E10 10 psi E10 9 psi E20
204 Day 1 3672 6283 12601 15479 11034
1999 Honda Enhanced Day 2 2877 5810 11652 17799 9581
Accord Day 3 2936 5770 11653 17711 9812
205 Day 1 3830 4995 17834 17941 17752
2001 Toyota Enhanced Day 2 3654 4810 17150 17309 16900
Corolla Day 3 3670 5072 15239 17417 16802
207 Day 1 3975 4064 10865 14064 15480
2001 Dodge Enhanced Day 2 3026 3373 8120 12644 13702
Caravan Day 3 2689 3080 8236 12237 13605
214 Day 1 4943 4559 5242 4920 4709
2004 Ford Enhanced Day 2 3190 3585 3974 8394 4400
Escape Day 3 2815 11017 3944 113738 7518
215 Day 1 2483 2021 2247 3192 4168
2004 Toyota Enhanced Day 2 2941 1659 2317 2602 4148
Highlander Day 3 2888 1763 2675 2370 4506
3781 4384 9758 11119 10629
211 Day 1 2071 1303 2438 3370 2840
2004 Toyota Near Zero Day 2 1002 1158 1838 2268 2218
Camry XLE Day 3 874 1006 1843 2179 2034
212 Day 1 1016 1005 1848 1243 1310
2006 Ford Near Zero Day 2 712 708 1002 879 833
Taurus Day 3 570 574 758 1028 750
1544 1154 2143 2307 2075
CRC E-77-2 Program Results - Diurnal Permeation
Diurnal Permeation Rate - mgday
Enhanced Averages
Near Zero Averages
Carbon Canister Breakthrough ndash Canister breakthrough is measured by the weight change
recorded for the trap canister outside the SHED It quantifies the amount of vapors that
overwhelm the evaporative system storage canister Figure 17 displays the breakthrough
resulting from testing of 9 psi E0 fuel Only four of seven vehicles exhibited breakthrough
60
65
70
75
80
85
90
95
100
105
110
0
5
10
15
20
25
30
35
40
0 10 20 30 40 50 60 70
SH
ED
Te
mp
era
ture
-d
eg
F
Bre
ak
thro
ug
h -
mg
Test Time - hrs
Canister Breakthrough9 psi E0 Fuel - 65ordm to 105ordm F Diurnal
204 - 1999 Honda Accord
211 - 2004 Toyota Camry
215 - 2004 Toyota Highlander
205 - 2001 Toyota Corolla
Figure 17 ndashDiurnal Canister Breakthrough
26
Table 7 shows the breakthrough generated during the diurnal tests conducted
Table 7
Vehicle ID Technology 7psi E0 9 psi E0 7 psi E10 10 psi E10 9 psi E20
204 Day 1 --- 24 --- 310 ---
1999 Honda Enhanced Day 2 --- 136 --- 360 ---
Accord Day 3 --- 198 --- 360 ---
205 Day 1 --- --- --- 204 ---
2001 Toyota Enhanced Day 2 --- --- --- 309 ---
Corolla Day 3 --- 26 --- 293 ---
207 Day 1 --- --- --- --- ---
2001 Dodge Enhanced Day 2 --- --- --- --- ---
Caravan Day 3 --- --- --- --- ---
214 Day 1 --- --- --- --- ---
2004 Ford Enhanced Day 2 --- --- --- --- ---
Escape Day 3 --- --- --- 49 ---
215 Day 1 --- --- --- --- ---
2004 Toyota Enhanced Day 2 --- 02 --- --- ---
Highlander Day 3 --- 72 --- --- ---
211 Day 1 --- --- --- --- ---
2004 Toyota Near Zero Day 2 --- 129 --- 191 ---
Camry XLE Day 3 --- 176 --- 289 ---
212 Day 1 --- --- --- --- ---
2006 Ford Near Zero Day 2 --- --- --- --- ---
Taurus Day 3 --- --- --- 204 ---
CRC E-77-2 Program - Carbon Canister Diurnal Breakthrough Results
Diurnal Breakthrough - grams
Summary ndash The lack of canister breakthrough for the 7 psi fuels (summer grade) indicates that
the storage capacity of the seven systems tested is appropriately sized Breakthrough began to
appear when testing of 9 psi E0 fuel (not summer grade) and was more prevalent with the 10 psi
E10 fuel (winter grade) The lack of breakthrough with the 9 psi E20 fuel seems to be an
anomaly
27
Overall Trend Summary - The following chart (Figure 18) visually summarizes the trends seen
from all testing performed during this program
Higher Volatility E0 to E10 E0 to E20 E10 to E20
uarr uarr uarr uarr
Higher Volatility E0 to E10 E0 to E20 E10 to E20
uarr uarr uarr uarr
Higher Volatility E0 to E10 E0 to E20 E10 to E20
uarr uarr uarr uarr
Higher Volatility E0 to E10 E0 to E20 E10 to E20
uarr uarr uarr uarr
Higher Volatility E0 to E10 E0 to E20 E10 to E20
uarrharr uarr uarr uarr
Higher Volatility E0 to E10 E0 to E20 E10 to E20
uarr uarr uarr uarr
Higher Volatility E0 to E10 E0 to E20 E10 to E20
uarr darr darr
Higher Volatility E0 to E10 E0 to E20 E10 to E20
uarr uarr uarr harr
Ethanol Content
Diurnal
Trend Analysis for E-77-2 Program
Ethanol Content
Static Permeation
Ethanol Content
Running Loss Permeation
Ethanol Content
Ethanol Content
Diurnal
Enhanced Vehicles (Sample of 5)
Static Permeation
Ethanol Content
Ethanol Content
Running Loss Permeation
Ethanol Content
True Hot Soak (TEFVO)
Near-Zero Vehicles (Sample of 2)
True Hot Soak (TEFVO)
Figure 18 Trend Analysis Summaries
28
Vehicle 202 ndash 1996 Ford Taurus - Special Case
We have treated vehicle 202 as a special case This was the oldest of the vehicles tested and had
been subjected to limited exhaust emission tests with a 20-volume percent ethanol fuel (E20)
during the CRC E-74b test program
Vehicle 202 completed the E10 portion of the test program (10 and 7 psi fuels) successfully and
completed the road preconditioning on the E0 fuel prior to the E0 evaluations The first test on
the E0 fuel was excessively high indicating a fuel leak It was traced to a leaky fuel injector o-
ring and there was considerable discussion as to an appropriate repair Tests were made on the 9
and the 7 psi E0 fuel to measure the magnitude of a vehicle in a ldquoleakrdquo condition and the tests
were labeled as ldquo202L (Leak)rdquo The fuel injector o-rings were replaced as a complete set and
the vehicle resumed testing as ldquo202Rrsquo (Repaired) A new elusive vapor leak was present later
identified as a very small leak at the top of the fuel fill pipe
The circle on Figure 19 at the right shows
the location of the small leak This leak
was problematic as to its effect on the
emission measurements because its
magnitude or presence seemed to depend
on the torque exerted on the fuel cap The
tests on the E0 fuels (9 and 7 psi) are
noted as 202R but with a vapor leak
We attempted to fix this leak and repeated
the E10 test with the vehicle re-identified
as 216 with reasonable results We also
ran the E20 test sequence and declared the
vehicle done
The testing history for this vehicle is shown in Tables 8 (Static) 9 (Dynamic) and 10 (Diurnal)
The tests highlighted in yellow are those that exhibited a liquid or vapor leak as identified during
the static test leak validation
Figure 19 ndash Vehicle 202 Fuel Fill Pipe Leak
29
Table 8
Static Permeation Results 1996 Ford Taurus SHED
Corrected Results Canister
Fuel Permeation mgday Loss
Veh psiEtOH Test Type Date Test mghr (Corrected) g
202 100E10 Static Perm 071807 7018 345 000
Press Incr 00 No Leak
Prs+Fuel Incr 00
202 70E10 Static Perm 082107 7031 223 000
Press Incr 00 No Leak
Prs+Fuel Incr 00
202L 90E0 Static Perm 030408 7169 2292 000
Press Incr DNA
Prs+Fuel Incr 4921 Liquid Leak
202L 70E0 Static Perm 032008 7183 2991 000
Press Incr DNA
Prs+Fuel Incr 19896 Liquid Leak
202R 90E0 Static Perm 050808 7228 178 000
Press Incr 136 Vapor Leak
Prs+Fuel Incr 00
202R 70E0 Static Perm 052208 7239 204 000
Press Incr 380 Vapor Leak
Prs+Fuel Incr 00
216 100E10 Static Perm 081408 7299 324 000
Press Incr 00 No Leak
Prs+Fuel Incr 00
216 70E10 Static Perm 091708 7326 325 000
Press Incr 00 No Leak
Prs+Fuel Incr 00
216 90E20 Static Perm 103008 7363 204 000
Press Incr 00 No Leak
Prs+Fuel Incr 00
30
Table 9
Dynamic Permeation Results 1996 Ford Taurus SHED
Corrected Results Canister From
Fuel Permeation mgday Loss Static
Veh psiEtOH Test Type Date Test mghr (Corrected) g Test
202 100E10 Dynamic RL 072007 25662 1278 000 No Leak
TEFVO 386 000
202L 90E0 Dynamic RL 030508 25695 3870 000 Liquid Leak
TEFVO 00 000
202L 70E0 Dynamic RL 032408 25699 7269 000 Liquid Leak
TEFVO 00 000
202R 90E0 Dynamic RL 050908 25704 1091 000 Vapor Leak
TEFVO 50 000
202R 70E0 Dynamic RL 052308 25706 787 000 Vapor Leak
TEFVO 00 000
216 100E10 Dynamic RL 081508 25718 1742 000 No Leak
TEFVO 14 000
216 70E10 Dynamic RL 091808 25721 1683 000 No Leak
TEFVO 423 000
216 90E20 Dynamic RL 110708 25730 543 000 No Leak
TEFVO 00 000
31
Table 10
Diurnal Permeation Results 1996 Ford Taurus SHED
Corrected Results Canister From
Fuel Permeation mgday Loss Static
Veh psiEtOH Test Type Date Test mghr (Corrected) g Test
202 100E10 72 DHB 65-105 073107 7023
Day 1 10429 612 No Leak
Day 2 7069 3264
Day 3 7043 3869
202 70E10 72 DHB 65-105 082807 7034
Day 1 6278 000 No Leak
Day 2 5065 000
Day 3 4535 000
202L 90E0 72 DHB 65-105 031108 7173
Day 1 22589 000 Liquid Leak
Day 2 32310 000
Day 3 23069 1260
202L 70E0 72 DHB 65-105 040108 7196
Day 1 47425 000 Liquid Leak
Day 2 44517 000
Day 3 31798 000
202R 90E0 72 DHB 65-105 051308 7230
Day 1 3270 000 Vapor Leak
Day 2 2667 000
Day 3 2746 1083
202R 70E0 72 DHB 65-105 052808 7243
Day 1 2117 000 Vapor Leak
Day 2 2208 000
Day 3 2081 000
216 100E10 72 DHB 65-105 082008 7305
Day 1 25907 5777 No Leak
Day 2 34779 6299
Day 3 36014 6343
216 70E10 72 DHB 65-105 092308 7331
Day 1 3975 022 No Leak
Day 2 3550 006
Day 3 3621 037
216 90E20 72 DHB 65-105 111108 7373
Day 1 4685 000 No Leak
Day 2 4526 000
Day 3 4198 000
32
The Implanted Leak Test Results
Project E-77-2 included evaluating two vehicles with implanted leaks This interest followed the
information gathered in the Pilot Study where tests were run with a specially modified fuel cap
containing a 002rdquo dia hole The results with the implanted leak from the Pilot Study are
repeated in Table 11 below as the diurnal results are shown for a 1996 Chevrolet Cavalier first
without the implanted leak at 038 grams per day and then at 207 grams per day (a 54x
increase) with the leak
Table 11
Veh No
Evap
Tech Fuel
Results
gmsday
gms
Increase
6 1996 Chevrolet Cavalier Enhanced 7 psi E0 038
7 2070 2032
207 2001 Dodge Caravan Enhanced 7 psi E10 109
207L 213 104
211 2004 Toyota Camry LE Near Zero 7 psi E10 024
211L 068 044
- Implanted 020 leak in fuel cap
Vehicle Description
Implanted Leak Impact on Diurnal PermeationDay One Results 65deg - 105degF Diurnal
The two E-77-2 vehicles (207 amp 211) were given a limited evaluation with an induced leak and
saw a significantly lesser impact Vehicle 207 gave diurnal results increases from 109 to 213
grams per day (a 2x increase) and Vehicle 211 increased from 024 grams per day to 068 grams
per day (a 28x increase) The following Figure 20 displays the imbedded leak impact from Table
11
33
0
5
10
15
20
On
e D
ay
Diu
rna
l P
erm
ea
tio
n -
gm
sd
ay
Vehicle Number
Implanted Leak Impact on One Day Diurnal Permeation020 Leak in Fuel Cap - 65 to 105 F Diurnal
207L 211L21120776
As Received - No Leak
020 Fuel Cap Leak
The newer vehicles evaluated in this phase of the study were configured and certified to the
Onboard Refueling Vapor Regulations (ORVR) These are capable of containing 95 or more
control of the refueling vapors at up to 10 gallons per minute fueling rate Where the Chevrolet
Cavalier had a small (0055rdquo dia) orifice and a long vapor tube venting the tankrsquos vapor space to
the carbon canister (and then to the atmosphere) the ORVR compliant vehicles have a large
(0688rdquo ID) short vent hose to a low flow restriction carbon canister
The following bar charts (Figures 21 through 24) show the impacts of the leak on all phases of
the evaporative testing performed and compare those results with all fuels tested With only two
vehicles (207 and 211) evaluated on two fuels statistically significant effects cannot be
quantified but the trend of increased emissions is apparent
Figure 20 ndash Implanted Leak Impact
34
0
20
40
60
80
100
120
140
160
7E0 9E0 7E10 10E10 9E20 7E0 9E0 7E10 10E10 9E20
Sta
tic
Pe
rme
ati
on
-m
gh
r
Fuel
0020 dia Induced Leak EffectStatic Permeation
Vehicle 211Vehicle 207
Leak
Leak
0
200
400
600
800
1000
1200
7E0 9E0 7E10 10E10 9E20 7E0 9E0 7E10 10E10 9E20
Ru
nn
ing
Lo
ss
Pe
rme
ati
on
-m
gh
r
Fuel
0020 dia Induced Leak EffectRunning Loss Permeation
Vehicle 211Vehicle 207
Leak
Leak
Figure 21 ndash Vehicles 207 and 211 with Induced Leak - Static
Figure 22 ndash Vehicles 207 and 211with Induced Leak ndash Running Loss
35
0
100
200
300
400
500
600
700
7E0 9E0 7E10 10E10 9E20 7E0 9E0 7E10 10E10 9E20
Tru
e H
ot S
oa
k P
erm
ea
tio
n -
mg
hr
Fuel
0020 dia Induced Leak EffectTrue Hot Soak Permeation
Vehicle 211Vehicle 207
Leak
Leak
0
500
1000
1500
2000
2500
7E0 9E0 7E10 10E10 9E20 7E0 9E0 7E10 10E10 9E20
Da
y 1
Diu
rna
l P
erm
ea
tio
n -
mg
da
y
Fuel
0020 dia Induced Leak EffectDay 1 Diurnal Permeation
Vehicle 211Vehicle 207
Leak
Leak
Figure 24 ndash Vehicles 207 and 211 with Induced Leak - Diurnal
Figure 23 ndash Vehicles 207 and 211 with Induced Leak ndash True Hot Soak
36
Summary of Findings and Results
The E-77-2 test program was a continuation of the previously published E-77 test project and
added eight vehicles tested on five fuels to the knowledge base The permeation trends
previously shown were again present The small sample size and limited number of tests
preclude making statements about statistical validity but in general
o The newer vehicle groups had lower emissions
o Adding ethanol to the fuel increased permeation over the non-oxygenated levels
o Increased volatility increased permeation levels
o SHED emission rates must be corrected for the ethanol error in the FID and the
non-fuel methanol and refrigerant in the measurement
As this test program evolved and additional experience was gathered two program modifications
were made 1) The leak validation methodology was changed and 2) a different metric and
definition of the ldquoHot Soakrdquo was adopted
The leak validation portion of the static permeation test was found to be very sensitive and when
the data was corrected on a minute-by-minute basis for ethanol methanol and refrigerant the
change in apparent permeation rate was due as much to variation as to leaks See the discussion
starting at page 12 for the details of the development
Concern for and recognition of ldquoHot Soakrdquo emissions started in the original evaporative emission
regulations Carburetors had float bowls with ~ 50 ml of fuel that absorbed the latent engine heat
after the vehicle was shut down after operation The heat would cause the bowl temperature to
increase driving fuel vapors out through vents and leak paths to the atmosphere after vehicle
operation Todayrsquos fuel injection engines do not have the open bowls and the emission rates
following vehicle operation are mainly increased temperature permeation We recommended
and adopted a new name for the ldquotemporary emissions following vehicle operationrdquo (TEFVO)
which subtracts the basic permeation rate from the measured emissions See the discussion
starting at page 16 for details
37
Appendix
Acknowledgements
E-77-2 Steering Committee
David Brzezinski EPA
Kevin Cullen GM Powertrain
Dominic DiCicco Ford Motor Company
King D Eng Shell Global Solutions
Ben Hancock CARB
Constance Hart EPA
Phil Heirigs Chevron Global Downstream
Jeff Jetter Honda RampD Americas
Keith KnollNREL
John Koupal EPA
David H Lax API
Jeff Long CARB
Hector Maldonado CARB
Mani Natarajan Marathon Oil Company
David N Patterson Mitsubishi Motors RampD Americas
Jenny Sigelko Chrysler
James P UihleinChevron Global Downstream
Marie Valentine Toyota Technical Center
Kenneth J Wright ConocoPhillips
CRC Members
Brent Bailey CRC
Chris Tennant CRC
Jane Beck CRC
38
Table 12
E0 E10 E20
Inspection Units Fuel 6 Fuel 7 Fuel 4
API Gravity degAPI 602 585 570
Relative Density 6060degF 07382 07447 07508
DVPE psi 701 730 849
Oxygenates--D4815
MTBE vol 000 000 000
ETBE vol 000 000 000
EtOH vol 000 954 2034
O2 wt 000 353 747
Hydrocarbon Composition
Aromatics vol 221 244 108
Olefins vol 80 88 55
Saturates vol 700 573 234
D86 Distillation
IBP degF 974 1040 1022
5 Evaporated degF 1316 1280 1252
10 Evaporated degF 1423 1330 1314
20 Evaporated degF 1564 1410 1413
30 Evaporated degF 1704 1450 1486
40 Evaporated degF 1840 1530 1547
50 Evaporated degF 1975 1950 1596
60 Evaporated degF 2120 2190 1636
70 Evaporated degF 2305 2410 2274
80 Evaporated degF 2588 2710 2695
90 Evaporated degF 3139 3170 3139
95 Evaporated degF 3322 3300 3255
EP degF 3603 3600 3406
Recovery vol 978 978 983
Residue vol 13 10 10
Loss vol 09 12 07
Driveability Index 11199 11015 9898
Data from CRC E-74
CRC E-77-2 Fuel Inspection Results
39
Fuel Units Fuel 6 Fuel 7 Fuel 4
Sulfur Content ppm 29 27 27
Estimated CH Ratio 62090 63323 63252
Est Net Heat of Combustion btulb 18573 18514 18513
Benzene vol 090 100 096
Research Octane Number 932 940 946
Motor Octane Number 838 838 834
(R+M)2 885 889 890
Fuel Units Fuel 6 Fuel 7 Fuel 4
Aromatics vol 2386 2481 2178
Olefins vol 752 892 1074
Saturates vol 6743 5621 4623
Unclassified vol 115 086 015
Ethanol vol 000 920 2111
Benzene vol 089 106 097
CH Ratio 6200 6092 5835
Oxygen wt 0008 1 340 773
Net Heat of Combustion btulb 18703 18016 17160
1 Contains 004 vol MTBE
Fuel Units Fuel 6 Fuel 7 Fuel 4
Oxygen wt 0008 3396 7733
C+H wt 9999 9660 9227
H wt 1389 1362 1350
C wt 8610 8298 7877
Fuel Units 6 7 4
Haltermann D3338 Btulb 18573 18514 18513
Average D3338 Btulb 18579 18514 18491
Oxygen Corrected D3338 Btulb 18579 17860 17103
DHA Btulb 18703 18016 17160
Table 12 (cont)
Suppliers Additional Inspections
Net Heat of Combusion -- Btulb
Carbon Hydrogen and Oxygen
Detailed Hydrocarbon Analysis
40
Vehicle Day 1 Day 2 Day 3
No Fuel Base + Press + Pump RL True HS Perm (Brkthru) Perm (Brkthru) Perm (Brkthru)
E10 - 10 psi 345 --- --- 1278 503 10429 (63) 7069 (348) 7043 (425)
E10 - 7 psi 223 --- --- 994 113 6278 (00) 5065 (00) 4535 (00)
E0 - 9 psi 2229 --- 4921 3870 00 22580 (00) 32310 (00) 23069 (126)
E0 - 7 psi 2991 --- 19896 7269 00 47425 (00) 44517 (00) 31798 (00)
E10 - 10 psi 843 --- --- 3164 04 15479 (310) 17799 (383) 17711 (419)
E10 - 7 psi 664 --- --- 2879 297 12601 (00) 11652 (00) 11653 (00)
E0 - 9 psi 338 --- --- 2492 443 6283 (24) 5810 (136) 5770 (225)
E0 - 7 psi 129 --- --- 2226 187 3672 (00) 2877 (00) 2936 (00)
E20 - 9 psi 553 --- --- 2720 134 11034 (00) 9581 (00) 9812 (00)
E10 - 10 psi 416 --- --- 1916 295 17941 (204) 17309 (346) 17417 (375)
E10 - 7 psi 596 --- --- 2328 719 17834 (00) 17150 (00) 15239 (00)
E0 - 9 psi 195 --- --- 1031 10 4995 (00) 4810 (00) 5072 (26)
E0 - 7 psi 99 --- --- 671 00 3830 (00) 3654 (00) 3670 (00)
E20 - 9 psi 462 --- --- 1697 603 17752 (00) 16900 (00) 16802 (00)
E10 - 10 psi 787 --- --- 8581 2377 14064 (00) 12644 (00) 12237 (00)
E10 - 7 psi 644 --- --- 8122 1222 10865 (00) 8120 (00) 8236 (00)
E0 - 9 psi 325 --- --- 8339 58 4064 (00) 3373 (00) 3080 (00)
E0 - 7 psi 401 --- --- 8425 00 3975 (00) 3026 (00) 2689 (00)
E20 - 9 psi 882 --- --- 10282 00 15480 (00) 13702 (00) 13605 (00)
E10 - 10 psi 976 --- 1209 10012 3929 16449 (00) NA NA
E10 - 7 psi 1468 --- --- 11393 5850 21342 (00) NA NA
E10 - 10 psi 199 --- --- 1383 00 3370 (00) 2268 (191) 2179 (330)
E10 - 7 psi 94 266 --- 563 138 2438 (00) 1838 (00) 1843 (00)
E0 - 9 psi 101 --- --- 837 153 1303 (00) 1158 (129) 1006 (221)
E0 - 7 psi 91 --- --- 1046 07 2071 (00) 1002 (00) 874 (00)
E20 - 9 psi 558 --- --- 4106 00 2840 (00) 2218 (00) 2034 (00)
E10 - 10 psi 551 --- 821 3024 2450 25454 (040) NA NA
E10 - 7 psi 481 --- 1664 2511 62 6783 (00) NA NA
E10 - 10 psi 106 --- --- 1489 00 1243 (00) 879 (00) 1028 (200)
E10 - 7 psi 218 --- --- 2012 00 1848 (00) 1002 (00) 758 (00)
E0 - 9 psi 32 --- --- 1158 04 1005 (00) 708 (00) 574 (00)
E0 - 7 psi 09 --- --- 1845 18 1016 (00) 712 (00) 570 (00)
E20 - 9 psi 47 --- --- 1168 49 1310 (00) 833 (00) 750 (00)
E10 - 10 psi 244 --- --- 1331 574 4920 (00) 8394 (00) 113738 (49)
E10 - 7 psi 239 --- --- 1057 329 5242 (00) 3974 (00) 3944 (00)
E0 - 9 psi 107 --- --- 967 521 4559 (00) 3585 (00) 11017 (00)
E0 - 7 psi 252 --- --- 363 33 4943 (00) 3190 (00) 2815 (00)
E20 - 9 psi 168 --- --- 1394 560 4709 (00) 4400 (00) 7518 (00)
E10 - 10 psi 104 90 --- 719 16 3192 (00) 2602 (00) 2370 (00)
E10 - 7 psi 122 --- --- 979 00 2247 (00) 2317 (00) 2675 (00)
E0 - 9 psi 85 --- --- 811 251 2021 (00) 1659 (2) 1763 (72)
E0 - 7 psi 87 --- --- 797 225 2483 (00) 2941 (00) 2888 (00)
E20 - 9 psi 193 --- --- 1025 00 4168 (00) 4148 (00) 4506 (00)
E10 - 10 psi 324 --- --- 1742 118 25907 (578) 34779 (630) 36014 (643)
E10 - 7 psi 325 --- --- 1683 192 3975 (02) 3550 (01) 3621 (04)
E0 - 9 psi 178 136 --- 1091 254 3270 (00) 2667 (00) 2746 (108)
E0 - 7 psi 204 380 --- 787 00 2117 (00) 2208 (00) 2081 (00)
E20 - 9 psi 204 --- --- 543 74 4685 (00) 4526 (00) 4198 (00)
216
211
2004
Toyota
Camry
XLE
215
2004
Toyota
High-
lander
212
2006
Ford
Taurus
214
2004
Ford
Escape
211L
207L
Static Permeation - mghr Dynamic Perm - mghr
CRC E-77-2 Program Test Results
Diurnal (65ordm to 105ordm) - mgday
202
1996
Taurus
205
2001
Toyota
Corolla
204
1999
Honda
Accord
207
2001
Dodge
Caravan
202L
Table 13
41
Individual Vehicle Diurnal Performance on the Various Fuels
0
1000
2000
3000
4000
5000
6000
0 10 20 30 40 50 60 70
Cu
mu
lati
ve
Pe
rme
ati
on
-m
g
Test Time - hrs
Three Day DiurnalVehicle 204 1999 Honda Accord
10 psi E10
7 psi E10
9 psi E0
7 psi E0
9 psi E20
0
1000
2000
3000
4000
5000
6000
0 10 20 30 40 50 60 70
Cu
mu
lati
ve
Pe
rme
ati
on
-m
g
Test Time - hrs
Three Day DiurnalVehicle 205 - 2001 Toyota Corolla
10 psi E10
7 psi E10
9 psi E0
7 psi E0
9 psi E20
Figure 25 ndash Vehicle 204 Diurnal Performance
Figure 26 ndash Vehicle 205 Diurnal Performance
42
0
500
1000
1500
2000
2500
3000
3500
4000
4500
5000
0 10 20 30 40 50 60 70
Cu
mu
lati
ve
Co
rre
cte
d P
erm
ea
tio
n -
mg
Test Time - hrs
Three Day DiurnalVehicle 207 - 2001 Dodge Caravan
10 psi E10
7 psi E10
9 psi E0
7 psi E0
9 psi E20
0
100
200
300
400
500
600
700
800
900
0 10 20 30 40 50 60 70
Cu
mu
lati
ve
Pe
rme
ati
on
-m
g
Test Time - hrs
Three Day DiurnalVehicle 211 - 2004 Toyota Camry XLE
10 psi E10
7 psi E10
9 psi E0
7 psi E0
9 psi E20
Figure 27 ndash Vehicle 207 Diurnal Performance
Figure 28 ndash Vehicle 211 Diurnal Performance
43
0
50
100
150
200
250
300
350
400
450
500
0 10 20 30 40 50 60 70
Cu
mu
lati
ve
Pe
rme
ati
on
-m
g
Test Time - hrs
Three Day DiurnalVehicle 212 - 2006 Ford Taurus
10 psi E10
7 psi E10
9 psi E0
7 psi E0
9 psi E20
0
500
1000
1500
2000
2500
3000
3500
4000
4500
5000
0 10 20 30 40 50 60 70
Cu
mu
lati
ve
Pe
rme
ati
on
-m
g
Test Time - hrs
Three Day DiurnalVehicle 214 2004 Ford Escape
10 psi E10
7 psi E10
9 psi E0
7 psi E0
9 psi E20
Note The incomplete cumulative results for the 10 psi E10 results resulted from a conflict for the use
of the INNOVA analyzer during the test The INNOVA analyzer is required to correct for the FIDrsquos
ethanol error and the presence of methanol and refrigerant (R-134a) The data was available for the
50+ hour results and the data is valid as shown We have no explanation for the high levels
experienced on the third day of the test No test errors were identified
Figure 29 ndash Vehicle 212 Diurnal Performance
Figure 30 ndash Vehicle 214 Diurnal Performance
44
0
200
400
600
800
1000
1200
1400
1600
0 10 20 30 40 50 60 70
Cu
mu
lati
ve
Pe
rme
ati
on
-m
g
Test Time - hrs
Three Day DiurnalVehicle 215 2004 Toyota Highlander
10 psi E10
7 psi E10
9 psi E0
7 psi E0
9 psi E20
Figure 31 ndash Vehicle 215 Diurnal Performance
45
Table 14
Test Corrected
Vehicle Fuel Total Fuel EtOH R134a Methanol
204 10 psi E10 509899 144040 18298 16754
1999 Honda 7 psi E10 359057 130806 17551 15221
Accord 9 psi E0 178635 13843 18230 9896
7 psi E0 94846 1856 16631 2379
9 psi E20 304271 128408 18261 12143
205 10 psi E10 526659 186599 23354 20895
2001 Toyota 7 psi E10 502229 204246 25990 19198
Corolla 9 psi E0 148775 000 20434 4613
7 psi E0 111536 5489 22408 5619
9 psi E20 514540 212708 25677 19584
207 10 psi E10 389450 196248 12013 30399
2001 Dodge 7 psi E10 272201 114027 11731 19616
Caravan 9 psi E0 105167 1820 12224 15284
7 psi E0 96906 1118 22141 14276
9 psi E20 427882 241488 14268 25432
211 10 psi E10 78164 19733 15159 46970
2004 Toyota 7 psi E10 61190 20211 15929 46525
Camry LE 9 psi E0 34668 1681 14329 42659
7 psi E0 39468 000 16197 57303
9 psi E20 71013 26726 16213 36879
212 10 psi E10 31508 7222 14831 7896
2006 Ford 7 psi E10 36079 10132 15481 3400
Taurus 9 psi E0 22870 2409 15182 3761
7 psi E0 22973 000 15393 4362
9 psi E20 28935 11156 14116 2629
214 10 psi E10 1257887 000 19947 27992
2004 Ford 7 psi E10 131593 24571 16025 8879
Escape 9 psi E0 191611 2940 16487 7213
7 psi E0 109481 5386 80650 3106
9 psi E20 166271 24097 14491 6096
215 10 psi E10 81644 12178 14658 42609
2004 Toyota 7 psi E10 72399 15092 15532 36061
Highlander 9 psi E0 54431 000 14806 25822
7 psi E0 83115 000 14072 26255
9 psi E20 128223 38822 12841 34420
3 Day Diurnal Results
CRC E77-2 Program Diurnal ResultsAll values are in mg
46
0
200
400
600
800
1000
1200
1400
1600
1800
2000
Co
rrecte
d D
aily D
iurn
al
-m
g
Diurnal Ethanol PortionVehicle 204 - 1999 Honda Accord
Ethanol Portion
10 psi E10 9 psi E07 psi E10
1 32
315
341368
383
264273
1 321 321 321 32
9 psi E207 psi E0
1122097
39
0510
442
405412
Figure 32 ndash Vehicle 204 Diurnal Ethanol Portion
0
200
400
600
800
1000
1200
1400
1600
1800
2000
Co
rrecte
d D
aily D
iurn
al
-m
g
Diurnal Ethanol PortionVehicle 205 - 2001 Toyota Corolla
Ethanol Portion
10 psi E10 9 psi E07 psi E10
1 32
359
406
382
431355349
1 321 321 321 32
9 psi E207 psi E0
0 00
712649
406
420414
Figure 33 ndash Vehicle 205 Diurnal Ethanol Portion
47
0
200
400
600
800
1000
1200
1400
1600C
orr
ecte
d D
aily D
iurn
al
-m
g
Diurnal Ethanol PortionVehicle 207 - 2001 Dodge Caravan
Ethanol Portion
10 psi E10 9 psi E07 psi E10
1 32
488
442408
409
490535
1 321 321 321 32
9 psi E207 psi E0
00
1144
27
0101
556
587552
Figure 34 ndash Vehicle 207 Diurnal Ethanol Portion
0
50
100
150
200
250
300
350
400
Co
rrecte
d D
aily D
iurn
al
-m
g
Diurnal Ethanol PortionVehicle 211 - 2004 Toyota Camry XLE
Ethanol Portion
10 psi E10 9 psi E07 psi E10
1 32
264
242245
1 321 321 321 32
9 psi E207 psi E0
329
306356
00
73
64
00
00
00
325
431
370
Figure 35 ndash Vehicle 211 Diurnal Ethanol Portion
48
0
20
40
60
80
100
120
140
160
180
200C
orr
ecte
d D
aily D
iurn
al
-m
g
Diurnal Ethanol PortionVehicle 212 - 2006 Ford Taurus
Ethanol Portion
10 psi E10 9 psi E07 psi E10
1 32
216
170
316
1 321 321 321 32
9 psi E207 psi E0
194
288
436 102
105
85
00
00
00476
529
243
Figure 36 ndash Vehicle 212 Diurnal Ethanol Portion
0
200
400
600
800
1000
1200
Co
rrecte
d D
aily D
iurn
al
-m
g
Diurnal Ethanol PortionVehicle 214 - 2004 Ford Escape
Ethanol Portion
10 psi E10 9 psi E07 psi E10
1 32
00
1 321 321 321 32
9 psi E207 psi E0
201
202152
38
05
19
56
1469
103
171188
143
67
11275
Figure 37 ndash Vehicle 214 Diurnal Ethanol Portion
49
0
50
100
150
200
250
300
350
400
450
500C
orr
ecte
d D
aily D
iurn
al
-m
g
Diurnal Ethanol PortionVehicle 215 - 2004 Toyota Highlander
Ethanol Portion
10 psi E10 9 psi E07 psi E10
1 32
121
136
196
1 321 321 321 32
9 psi E207 psi E0
198
217213
0000
00
0000
00
335 292
283
Figure 38 ndash Vehicle 215 Diurnal Ethanol Portion

8
Figure 6 ndash Static Test ndash Fuel Pump Energized
Other Tests (Dynamic Hot Soak and Diurnal) - A similar configuration is used to isolate the
tank venting losses from the permeation measurements determined by other test procedures The
vehiclersquos canister vent is connected with a low permeation hose (Teflontrade) to a bulk-head fitting
in the SHED wall and then to a separate ldquotrap canisterrdquo on a top-loading scale Any HC
emissions that escape from the vehiclersquos canister are captured in the trap canister and measured
at a 001 g (10 milligram) precision The trap canister (a 1 Liter Ford model) is purged before
each test and maintained at a ldquodryrdquo condition so that it captures all of the vehiclersquos escaping
emissions This assumption is probably violated during the high volatility tests where there are
30 grams of daily emissions but this is not a concern at this time
Test Elements for E-77-2 - The following flow chart (Figure 7) displays the various elements
utilized during the testing of the various vehicles and fuels during this program Details of each
of the four basic tests follow the flow chart
9
Drain and 40 Fill
with 10 psi E10 Test Fuel
Road Preconditioning
Four LA-4rsquos or Equivalent
Drain and 40 Fill
with 10psi E10 Test Fuel
Overnight Park at 86degF
Move to SHED
Connect Test Instrumentation
Stabilize at 86degF
Perform Constant Temperature
Permeation Series (86degF)
1 hour Permeation Rate Test
frac12 hour Tank Pressurized Test
frac12 hour Pump Energized Test
Transfer to RL SHED
Connect Test Instrumentation
Stabilize at 86degF
Perform Dynamic Permeation Test
Two LA92 Driving Cycles amp
One Hour Hot Soak
Drain and 40 Fill
With 10 psi E10 Test Fuel
Road Preconditioning
Four LA-4rsquos or Equivalent
Move to VT-SHED
Connect Test Instrumentation
Stabilize at 65degF for 6 hrs Minimum
Perform 3-Day Diurnal Evaluation
72 hr 65deg to 105degF VT Test
Drain and 40 Fill
with 7 psi E10 Test Fuel
Condition Fuel System
By Driving for One Week
Repeat Steps 1 ndash 12
On 7 psi E10 Test Fuel
Drain and Fill with 9 psi E0 Test Fuel
Condition Fuel System by 4 weeks Driving
Repeat Steps 1 ndash 12
On 9 and 7 psi E0 and
Repeat Steps 0-12
On 9 psi E20 Test Fuels
Precondition Fuel System
With 4 Weeks Driving on
10 psi E10 Test Fuel
1
2
3
4
5
6
7
8
9
10
11
12
0
Figure 7 ndash Testing Flow Chart
10
Test Procedures ndash There are four basic tests in the E-77-2 test protocol
1 Static Permeation Rate (includes checks for vapor and liquid leaks)
2 Running Emissions (Dynamic Test)
3 Hot Soak
4 Diurnal
Each is described in detail below
1 Static Permeation Rate Testing
The constant temperature (static) permeation rate is measured in a traditional SHED (Constant
temperature) in the following manner
A The fuel tank is drained and filled to 40 tank capacity with the test fuel
B The day before testing the vehicle is driven over four road trips of 75 miles each
to precondition the canister8 (These drives are similar to the LA-4)
C Upon return from the road pre-conditioning the fuel tank is drained and filled to
40 tank capacity with the test fuel9
D Vehicle is parked for 18-22 hours in a controlled temperature environment at test
temperature (86ordmF)
E The vehicle is then moved (without starting) into the test (86ordmF) SHED
F The canister vent is connected to the SHED bulkhead fitting which routes the
vapor to the trap canister outside the SHED
G The tank system pressurization hose is connected
H The fuel pump electrical connection is connected
I The SHED is sealed the inside temperature is allowed to stabilize and the test is
started Continuous THC measurements are made using a FID Ethanol
methanol and R134a concentrations are measured using an INNOVA analyzer
All measurements are made at least every minute for one hour to determine the
stabilized permeation rate
J At the end of the static test (60 minutes) the vehiclersquos vapor system is pressurized
to 5 inches of water for thirty minutes Measurements are made to quantify vapor
leaks as determined by a change in the THC in the SHED
K The fuel pump is then energized for 30 minutes while maintaining the 5 inches of
water on the vapor system Liquid leaks are quantified as determined by a change
in the concentration of THC in the SHED
The purpose of steps J and K above is to validate that the permeation rate measurement was
made without the presence of any leak ndash either liquid or vapor A detailed discussion follows
starting at page 12
8 This conditioning can be done in the laboratory on a chassis dynamometer if proper attention is paid to underbody
cooling and unrepresentative fuel tank temperatures are avoided 9 Vehicles with ORVR systems will add the refueling vapors to the canister This is OK
11
2 Running Loss Test (Dynamic Test)
A The vehicle is placed in the RL-SHED and prepared for test (The fuel level and
condition for the dynamic test is the fuel remaining after completion of the static test ndash
40 fresh fill of the appropriate test fuel)
B Outside air source for the engine is connected
C Vehicle exhaust is connected
D Fuel tank thermocouple is connected
E Canister vent is connected to the SHED bulkhead fitting which routes the vapor to the
trap canister outside the SHED
F Vehicle is allowed to stabilize in the RL-SHED at test temperature (86degF) for a minimum
of 12 hours ndash preferably overnight
G Two cycles of the Unified Cycle (LA-92) driving schedule (48 mins) are driven while
measuring the mass emissions in the SHED Vehicle is allowed to idle (in drive) for 30
seconds between the two cycles Ambient air temperature is maintained (to the extent
possible) at 86degF Fuel tank surface temperature is monitored during vehicle operation It
should increase during the drive from 10 to 18degF to simulate expected on-road
temperature increase Measured mass emissions are corrected using the INNOVA data
for the ethanol methanol and refrigerant emissions
3 Hot Soak10
This procedure is executed immediately following the Running Loss Test procedure
described above
A Engine is turned off transmission selector is placed in park and driver exits the
enclosure using the double door air lock taking care to minimize any air exchange
between the laboratory and the SHED This starts the one hour ldquohot soakrdquo period
B Measurements of mass emissions in the SHED are continued for another 60 minutes
(until time = 108 minutes) correcting for the ethanol methanol and refrigerant mass
using the INNOVA instrument data This ends the hot soak Hot soak emissions are
calculated as the net difference for the one hour hot soak (CorrMass108 ndash CorrMass48
minus the 86degF static hourly rate all mass rates in mghour)
4 Diurnal Test
A The fuel tank is drained and filled to 40 tank capacity with the test fuel
B The day before testing the vehicle is driven over four road trips of 75 miles each to
precondition the vehicle and the canister
C Upon return from the road pre-conditioning the fuel tank is drained and filled to 40
tank capacity with the test fuel
D The vehicle is parked for 18-22 hours in a controlled temperature environment at the
initial diurnal test temperature (65ordmF)
E The SHED is sealed allowed to stabilize at the 65degF temperature and the 3-day
California Diurnal Test is started
10 We define the ldquohot soakrdquo to be the temporary increase in emission rate caused by the immediately preceding
operation of the vehicle It is the increase in the SHED mass (corrected for EtOH MeOH and R-134a) over the
one hour period minus the previously established ldquostaticrdquo permeation rate
12
F ldquoContinuousrdquo (every 30 seconds) THC measurements are made using a FID Ethanol
methanol and R134a (refrigerant) concentrations are measured using an INNOVA
analyzer at least every 10 minutes for the duration of the test (72 hours)
Static Permeation Test ndash Leak Validation
If a leak is detected during either the vapor system pressure portion (Step J) or the pump
energized portion (Step K) of the Static Permeation Test procedure it calls into question whether
the permeation rate measurement accurately reflects fuel system permeation or if instead a
combination of permeation and the implied leak was measured If a leak is confirmed the
permeation rate measurement is called into question and an investigation possible remedy and
retest is indicated
The permeation rate measurement must be corrected for the FIDrsquos ethanol misrepresentation and
the presence of non-fuel hydrocarbons (methanol and refrigerant) The leak check however is
made using the change in mass increase in the SHED using the uncorrected FID mass calculation
as the determinate It was found that the corrections for ethanol methanol and refrigerant were
introducing ldquonoiserdquo into the trace and that these were being misinterpreted as leaks
y = 062x - 19
y = 047x + 67
y = 055x - 01
0
10
20
30
40
50
60
70
80
90
100
0 20 40 60 80 100 120
SH
ED
Mas
s -
mg
Test Time - minutes
Leak TestVehicle 204 - 1999 Honda Accord - 9 psi E0
Test 7028
Pump ActivatedTank Pressurized
Figure 8 above represents the calculations made during the inspection of data from a successful
test EXCELrsquostrade ldquoSLOPErdquo function is used to calculate the linear regression values based on
the FID calculation for mass for Time 0 to 60 minutes Time 64 to 90 minutes and Time 94 to
120 minutes A 4-minute gap was included between each sequence to establish the new mass
emission rate during the ldquopressure onrdquo (T60 to T90) and the ldquopump energizedrdquo periods
The slope of 047 for the ldquoTank Pressurizedrdquo period in the example above is compared to the
slope of 062 calculated for the permeation rate (or hot soak) period Since the ldquoTank
Figure 8 ndash Leak Test
13
Pressurizedrdquo slope is not more than 10 higher than the hot soak permeation rate we assume
that there is no leak present A similar comparison is made for the slope determined during the
ldquopump onrdquo period The choice of a 10 allowance is arbitrary and is used here to allow for
normal and unavoidable test variation
For tests in which the above procedure determines that no leak is present a value of zero is
reported in the test summary for the leak results If a positive value is reported it calls that test
into question and an investigation possible repair and retest is indicated
Static Permeation Rate Determination
The static permeation rate is determined based on a linear regression through the individual
SHED mass data points (data measured each 30 seconds) of the corrected fuel results (corrected
for the FID error and subtracting the methanol and refrigerant) from the first 60 minutes of
testing as illustrated in Figure 9 below
y = 05636x + 0505
0
5
10
15
20
25
30
35
40
45
0 10 20 30 40 50 60
Pe
rme
ati
on
-m
gs
Test Time - mins
Static Permeation DeterminationVehicle 204 - 1999 Honda Accord - 9 psi E0 Fuel
Raw SHED
Corrected Fuel
Permeation Rate Based on Corrected Results
Permeation Rate = 5636 x Time = 338 mgshr
In this example the static permeation rate is 338 mghr
Dynamic (Running Loss) and Hot Soak Test
The preceding section addressed the concepts of separating the permeation emissions from the
tank venting emissions and establishing the presence or absence of leaks The second part of
this study includes a dynamic test to measure the permeation and tank venting emissions during
Figure 9 ndash Static Permeation Determination
14
vehicle operation (ldquorunning lossesrdquo) and the temporary condition following vehicle operation
known as the ldquohot soakrdquo
This is considered a ldquodynamicrdquo test because the vehicle is driven and the fuel and vapor system
temperatures rise during the test The ambient temperature in the Running Loss SHED during
the test was held constant at 86degF while the vehiclersquos fuel system temperature rose during the
test Two 1435 second (239-minute) LA-92 driving cycles were performed consecutively during
the running loss measurements with a 30-second idle in-between During this test tank fuel
temperature was expected to rise by an average approximately 18degF above the initial ambient
temperature The running loss air handling system included a proportional speed under-car
blower operated as a slave to dynamometer speed This apparatus was used during running loss
testing with minor tuning for specific vehicles Without additional input it is capable of
reasonable fuel tank temperature control Each vehicle was fitted with a surface-mount
thermocouple at the front of the fuel tank located at approximately the 18th
fill level to measure
the fuel liquid temperature No attempt was made to follow a predefined fuel tank temperature
profile (FTTP) in this program Fuel temperatures were recorded and results are available in the
real-time records
Vehicle running loss emissions are measured in a special version of a SHED known as a
Running Loss SHED (RL-SHED) shown in Figure 10 Special features of the RL-SHED
include a sealed chassis dynamometer for simulating vehicle driving loads a sealed outside air
supply for engine intake a sealed exhaust conduit for engine exhaust and an under-chassis fan
for simulating underbody air flow as described above A vehicle is operated inside the RL-SHED
over a chosen driving cycle The increase in HC emissions inside the enclosure are measured
and calculated as mass emissions per 40 CFR sect86163-96
Figure 10 - Running Loss SHED
15
Vehicle testing in an RL-SHED is complicated by several factors including
1 Engine must be supplied with external induction air
2 Exhaust must be conducted externally without any leaks
3 Load supplied to the vehicle through the chassis dynamometer must not create or
allow external leaks
4 Internal SHED temperature must be maintained while sizable heat is rejected to the
ambient by the running engine and exhaust
5 Cooling air supplied to the radiator must be modulated to represent the vehiclersquos road
speed
6 Underbody (and especially the fuel system) temperature should represent the rate of
rise experienced by a real road-drive
Canister vent losses were isolated from permeation emissions using the technique previously
described The vehiclersquos carbon canister fresh air vent was connected to the outside of the RL-
SHED using a leak-tight PTFEreg
hose (38rdquo OD commercial tubing US Plastics 58055 PTFE or
equivalent) connected to a small carbon ldquotraprdquo canister located on a top-loading precision scale
The scale precision was 001 grams (10 milligrams) and it was purged prior to each test There
were no tank venting emissions measured on any of the running loss test measurements All of
the vehicles appeared to be actively ldquopurgingrdquo their respective control canisters and drawing
fresh air during the test If there were any emissions from the vehiclersquos control canister as might
have occurred if there were no vehicle purge or if very high volatility fuels with excessive vapor
generation were used they would have been measured
The Running Loss Driving Cycle consisted of two cycles of the ldquoUnified Driving Cyclerdquo
otherwise known as the LA-92 A velocity versus time plot for one cycle is shown in Figure 11
The LA-92 cycle takes 24 minutes to complete and covers 98 miles with many speed changes
Two back-to-back cycles were driven the first as a ldquocold startrdquo and the second following a 30-
second vehicle idle The ldquocold startrdquo condition was created by soaking the vehicle for a
Figure 11 ndash Running Loss Driving Cycle
Unified Cycle (LA-92)
0
10
20
30
40
50
60
70
80
0 5 10 15 20 25Test Time - minutes
Spe
ed -
mph
Cycle Time (min) 239
Maximum Speed (mph) 672
Average Speed (mph) 246
Average Non-Zero Speed (mph) 294
Time Zero Speed () 162
Distance (miles) 982
16
minimum of 18 hours at 86degF moving it to the stabilized 86degF RL-SHED making the test
connections and then waiting a minimum of one hour before the initial start and run
The SHED emissions were measured during 48 minutes of engine operation and then
continuously for one hour after the engine was turned off This one hour engine-off duration
was the ldquohot soakrdquo period The total test time is 1 hour and 48 minutes
Figure 12 shows results from the 9 psi E0 fuel test on Vehicle 204 The horizontal axis is test
time in minutes and the vertical axis is the HC mass measured in the RL-SHED during the test
period
The engine was shut off at the end of the second LA92 drive cycle (~48 minutes) and the
analysis system continued to measure the HC emissions in the SHED for the next 60 minutes
This represented the ldquohot soakrdquo portion of the test
0
50
100
150
200
250
300
0 20 40 60 80 100 120
Co
rre
cte
d T
ota
l F
ue
l C
um
ula
tiv
e P
erm
ea
tio
n -
mg
Test Time - minutes
Running Loss and Hot SoakVehicle 204 - 1999 Honda Accord - 9 psi E0 Fuel
Test 25668
Running Loss Hot Soak
Running Loss Std =005 gmiThis Test = 0010 gmi
RL = 249 mghr
2774
2332
Tru HS = 442
1990
The ldquoTruerdquo Hot Soak
The traditional hot soak is determined from the increase in SHED emissions as measured for one
hour following a prescribed drive to heat up the vehicle (2 LA-92 cycles during the Running
Loss Test) Hot soak emissions however have two components that caused by the elevated
temperature resulting from the drive and that resulting from one hour of static permeation
Figure 12 ndash Running Loss Test Results
17
To separate these two components and determine the ldquotruerdquo hot soak emissions the following
procedure was used ldquoTraditionalrdquo hot soak emissions were first calculated by subtracting the
ldquostart of hot soakrdquo cumulative SHED hydrocarbon value (ie 199 mg t = 48 minutes) from
the final cumulative SHED hydrocarbon value (ie 2774 mg t = 108 min) This resulted in a
cumulative SHED hydrocarbon value of 78 mg for the 1 hour hot soak The previously
determined static permeation value (ie 338 mg for a 1 hour hot soak test- see Figure 9) was
then subtracted to arrive at the ldquotruerdquo hot soak value of 442 mg The increase in the permeation
rate (the ldquohot soak effectrdquo) caused by the increase in the system temperature is accounted for by
subtracting the ldquostabilized permeation raterdquo at 86degF
In Figure 12 the static permeation rate is superimposed as a solid blue line on the plot from the
starting point of the hot soak until its end (one hour) While the ldquotraditionalrdquo hot soak would be
calculated as 78 mg (277 mg ndash 199 mg) the ldquotruerdquo hot soak is determined as 442 mg (2774 mg
ndash 2332 mg) True hot soak values reported here were determined in this manner
Diurnal Test
Diurnal permeation was determined by subjecting the vehicle to a three-day period in a
temperature controlled SHED while continuously recording the total hydrocarbon every 30
seconds The SHED environmental temperature was varied from 65degF to 105degF per the
California Diurnal Test protocol Canister vent losses were isolated from permeation emissions
using the technique previously described The vehiclersquos carbon canister fresh air vent was
connected to the outside of the RL-SHED using a leak-tight PTFEreg
hose connected to a small
carbon ldquotraprdquo canister located on a top-loading precision scale The scale precision was 001
grams (10 milligrams) and it was purged before each test
DISCUSSION OF TEST RESULTS
Results
Emission results are presented below by ldquomechanism11
rdquo with the data averaged for the five
ldquoenhancedrdquo and the two ldquonear zerordquo vehicles The lone ldquopre-enhancedrdquo vehicle the 1996 Ford
Taurus (202) was a special case and will be discussed in a separate section Two of the vehicles
the 2001 Dodge Caravan (207) and the 2004 Toyota Camry (211) were also subjected to limited
testing with an ldquoimplanted leakrdquo (a 0020rdquo dia hole in a special tank gas cap) to investigate the
magnitude of a known leak These results (ldquoLeakersrdquo) follow the discussion on the Taurus
Static Permeation Rate (Constant Temperature (86degF)) - Average permeation rate compared
by fuel specification for two vehicle groups ldquoenhancedrdquo and the ldquonear zerordquo evaporative
emissions
11 The ldquomechanismsrdquo are 1 Permeation 2 Tank Venting (Daily Temperature Rise) and 3 Leaks
18
0
10
20
30
40
50
60
Co
rrecte
d P
erm
eati
on
Rate
-m
gh
r
Fuel
Static Permeation Rate - All FuelsE77-2 Program Vehicles
7 E0 9 E2010 E107 E109 E0 7 E0 9 E2010 E107 E109 E0
Enhanced(5 veh)
Near Zero(2 veh)
Figure 13 presents the static permeation rate performance for the average of the 5 ldquoenhancedrdquo
and 2 ldquonear zerordquo vehicles on the five fuels included in the test program Each group is ordered
from left to right by ethanol level The vertical scale is the average permeation rate in mghour
for the static (86degF constant temperature) test
Previous studies1213
had shown that vehicles operated on the fuel containing 10 vol- ethanol
would have higher permeation rates compared to those resulting from operation on a non-ethanol
(E0) fuel of similar properties We also expected that vehicles using higher vapor pressure fuel
would exhibit increased permeation levels at similar ethanol levels Other studies had reported
mixed results when comparing E20 permeation rates against E10 measurements ndash some were
higher and some were lower The difference may have been within the repeatability of the
measurements and probably suffered from a limited number of observations These mixed
results are present in this testing of the enhanced vehicles however the E20 (violet bar) is higher
on average for static permeation rate for the Near Zero group The data that were used to
construct the averages in Figure 13 are listed in Table 3 below There is significant variability in
the test results and the limited sample size precludes making conclusive statements with
statistical confidence
12 CRC E-653 Fuel Permeation from Automotive Systems E0 E6 E10 E20 and E85 December 2006 13
CRC E-77 Vehicle Evaporative Emission Mechanisms A Pilot Study June 2008
Figure 13 ndash Static Permeation Rate Comparison
19
Table 3
Vehicle ID Technology 7psi E0 9 psi E0 7 psi E10 10 psi E10 9 psi E20
204
1999 Honda Enhanced 129 338 664 843 553
Accord
205
2001 Toyota Enhanced 99 195 596 416 462
Corolla
207
2001 Dodge Enhanced 401 325 644 787 882
Caravan
214
2004 Ford Enhanced 252 107 239 244 168
Escape
215
2004 Toyota Enhanced 87 85 122 104 193
Highlander
194 210 453 479 452
211
2004 Toyota Near Zero 91 101 94 199 558
Camry XLE
212
2006 Ford Near Zero 09 32 218 106 47
Taurus
50 67 156 153 303
Static Permeation Rate - mghr
CRC E-77-2 Program - Static Permeation Results
Enhanced Averages
Near Zero Averages
Summary ndash Static permeation rate increased with increase in ethanol level Three of the 5
enhanced emission vehicles did not show an increase in permeation rate when tested with the 9
psi E0 compared to the 7 psi E0
20
Dynamic (Running Loss) Permeation - In a similar presentation Figure 14 shows the average
ldquoRunning Lossrdquo permeation rate for the vehicle types and the fuels tested ldquoRunning Lossrdquo
permeation as described here is the permeation measured during a ldquocold startrdquo 48 minute drive in
a Running-Loss SHED (RL-SHED) at 86degF
0
50
100
150
200
250
300
350
400
7E0 9E0 7E10 10E10 9E20 7E0 9E0 7E10 10E10 9E20
Co
rre
cte
d R
un
nin
g L
os
s P
erm
ea
tio
n -
mg
hr
Fuel
Running Loss Permeation Rate - All FuelsE77-2 Program Vehicles
Enhanced(5 vehs)
Near Zero(2 vehs)
The dynamic permeation rates for the enhanced vehicles (left panel) followed a similar pattern as
the static permeation The average of the E20 fuel was the highest of the average values
observed on both the enhanced and the near-zero vehicles (left and right panels respectively)
Table 4 below shows the data used to generate the averages used in Figure 14
Figure 14 ndash Running Loss Permeation Comparison
21
Table 4
Vehicle ID Technology 7psi E0 9 psi E0 7 psi E10 10 psi E10 9 psi E20
204
1999 Honda Enhanced 2226 2492 2879 3164 2720
Accord
205
2001 Toyota Enhanced 671 1031 2328 1916 1697
Corolla
207
2001 Dodge Enhanced 8425 8339 8122 8581 10282
Caravan
214
2004 Ford Enhanced 363 967 1057 1331 1394
Escape
215
2005 Toyota Enhanced 797 811 979 719 1025
Highlander
2496 2728 3073 3142 3424
211
2004 Toyota Near Zero 1046 837 563 1383 4106
Camry XLE
212
2006 Ford Near Zero 1845 1158 2012 1489 1168
Taurus
1446 998 1288 1436 2637
Enhanced Averages
Near Zero Averages
CRC E-77-2 Program - Running Loss Permeation Results
Running Loss Permeation Rate - mghr
Summary ndash The dynamic permeation rate (measured during vehicle operation) was higher with
the E10 fuel compared to E0 for the enhanced vehicles The E20 permeation rate was higher
than E0 and the E10 fuel The small sample size and limited data precludes us from making
statements about statistical confidence but this may indicate a trend The near zero vehicle
average increased as the ethanol level increased Trends with volatility were mixed or
inconclusive
22
Hot Soak (ldquoTrue Hot Soakrdquo) Permeation ndash The Hot Soak emissions as defined in this report
are the net increase in permeation rate following vehicle operation We measured the mass
increase in the SHED for one hour immediately following vehicle operation and subtracted the
previously measured static (or normal) permeation at the same temperature While this is not the
traditional Code of Federal Regulations (CFR) definition we feel it is appropriate for the intent
of this project
0
10
20
30
40
50
60
70
7E0 9E0 7E10 10E10 9E20 7E0 9E0 7E10 10E10 9E20
Co
rre
cte
d H
ot
So
ak
Pe
rme
ati
on
-m
gh
r
Fuel
True Hot Soak Permeation Rate - All FuelsE77-2 Program Vehicles
Enhanced(5 vehs)
Near Zero(2 vehs)
The ldquoTrue Hot Soakrdquo performance for the average of the Enhanced Vehicles is summarized in
Figure 15 above There was a large increase in the hot soak value with the E10 fuel compared to
the E0 The hot soak value with the E20 fuel was comparable to the E0 results and lower than
the E10
The Near Zero vehicles (2) had zero hot soak emissions when tested on the 10 psi E10 fuel
(Figure 16) With only two vehicles and the very low levels attained no statistically significant
conclusions can be drawn from the data available Table 5 presents the individual tests used in
calculating the average values plotted in Figure 15
Figure 15 ndash True Hot Soak Permeation Comparison
23
Table 5
Vehicle ID Technology 7psi E0 9 psi E0 7 psi E10 10 psi E10 9 psi E20
204
1999 Honda Enhanced 187 443 297 04 134
Accord
205
2001 Toyota Enhanced 00 10 719 295 603
Corolla
207
2001 Dodge Enhanced 00 58 1222 2377 00
Caravan
214
2004 Ford Enhanced 33 521 329 574 560
Escape
215
2005 Toyota Enhanced 225 251 00 16 00
Highlander
89 257 513 653 259
211
2004 Toyota Near Zero 07 153 138 00 00
Camry XLE
212
2006 Ford Near Zero 18 04 00 00 49
Taurus
13 79 69 00 25
CRC E-77-2 Program - True Hot Soak Permeation Results
True Hot Soak Permeation Rate - mghr
Near Zero Averages
Enhanced Averages
Summary - The True Hot Soak permeation (permeation rate measured following vehicle
operation less the static constant temperature permeation rate) rate was higher with the E10 fuel
compared to E0 for the enhanced vehicles The E20 permeation rate was higher than E0 and
lower than the E10 fuel The near zero vehicle trends with both ethanol content and volatility
were mixed or inconclusive The small sample size and limited data precludes us from making
statements about statistical confidence
24
Diurnal Permeation Performance ndash Figure 16 presents the diurnal permeation results for the
first day of the three-day diurnal test (65deg to 105degF)
0
200
400
600
800
1000
1200
7E0 9E0 7E10 10E10 9E20 7E0 9E0 7E10 10E10 9E20
Co
rre
cte
d F
ue
l D
iurn
al
Pe
rme
ati
on
-m
gs
da
y
Day 1 Diurnal Permeation RatesAverages from E-77-2 Vehicles
Fuel
Enhanced(5 vehs)
Near Zero(2 vehs)
The average day 1 diurnal permeation for the five Enhanced Vehicles tended to increase as
ethanol content increased (with the exception of the E20 fuel) Again sample size and limited
data makes statistical conclusions inappropriate Table 6 presents the individual test used to
generate the averages used in Figure 16 The table includes the data from days 2 and 3 The
ethanol content of the diurnal measurements was calculated and appear in a series of figures in
the Appendix starting at page 37 Unlike Figure 16 the figures shown in the appendix have not
been corrected to exclude the non-fuel emissions (methanol and refrigerant) that were present
during these tests
Figure 16 ndash Day 1 Diurnal Permeation Comparison
25
Table 6
Vehicle ID Technology 7psi E0 9 psi E0 7 psi E10 10 psi E10 9 psi E20
204 Day 1 3672 6283 12601 15479 11034
1999 Honda Enhanced Day 2 2877 5810 11652 17799 9581
Accord Day 3 2936 5770 11653 17711 9812
205 Day 1 3830 4995 17834 17941 17752
2001 Toyota Enhanced Day 2 3654 4810 17150 17309 16900
Corolla Day 3 3670 5072 15239 17417 16802
207 Day 1 3975 4064 10865 14064 15480
2001 Dodge Enhanced Day 2 3026 3373 8120 12644 13702
Caravan Day 3 2689 3080 8236 12237 13605
214 Day 1 4943 4559 5242 4920 4709
2004 Ford Enhanced Day 2 3190 3585 3974 8394 4400
Escape Day 3 2815 11017 3944 113738 7518
215 Day 1 2483 2021 2247 3192 4168
2004 Toyota Enhanced Day 2 2941 1659 2317 2602 4148
Highlander Day 3 2888 1763 2675 2370 4506
3781 4384 9758 11119 10629
211 Day 1 2071 1303 2438 3370 2840
2004 Toyota Near Zero Day 2 1002 1158 1838 2268 2218
Camry XLE Day 3 874 1006 1843 2179 2034
212 Day 1 1016 1005 1848 1243 1310
2006 Ford Near Zero Day 2 712 708 1002 879 833
Taurus Day 3 570 574 758 1028 750
1544 1154 2143 2307 2075
CRC E-77-2 Program Results - Diurnal Permeation
Diurnal Permeation Rate - mgday
Enhanced Averages
Near Zero Averages
Carbon Canister Breakthrough ndash Canister breakthrough is measured by the weight change
recorded for the trap canister outside the SHED It quantifies the amount of vapors that
overwhelm the evaporative system storage canister Figure 17 displays the breakthrough
resulting from testing of 9 psi E0 fuel Only four of seven vehicles exhibited breakthrough
60
65
70
75
80
85
90
95
100
105
110
0
5
10
15
20
25
30
35
40
0 10 20 30 40 50 60 70
SH
ED
Te
mp
era
ture
-d
eg
F
Bre
ak
thro
ug
h -
mg
Test Time - hrs
Canister Breakthrough9 psi E0 Fuel - 65ordm to 105ordm F Diurnal
204 - 1999 Honda Accord
211 - 2004 Toyota Camry
215 - 2004 Toyota Highlander
205 - 2001 Toyota Corolla
Figure 17 ndashDiurnal Canister Breakthrough
26
Table 7 shows the breakthrough generated during the diurnal tests conducted
Table 7
Vehicle ID Technology 7psi E0 9 psi E0 7 psi E10 10 psi E10 9 psi E20
204 Day 1 --- 24 --- 310 ---
1999 Honda Enhanced Day 2 --- 136 --- 360 ---
Accord Day 3 --- 198 --- 360 ---
205 Day 1 --- --- --- 204 ---
2001 Toyota Enhanced Day 2 --- --- --- 309 ---
Corolla Day 3 --- 26 --- 293 ---
207 Day 1 --- --- --- --- ---
2001 Dodge Enhanced Day 2 --- --- --- --- ---
Caravan Day 3 --- --- --- --- ---
214 Day 1 --- --- --- --- ---
2004 Ford Enhanced Day 2 --- --- --- --- ---
Escape Day 3 --- --- --- 49 ---
215 Day 1 --- --- --- --- ---
2004 Toyota Enhanced Day 2 --- 02 --- --- ---
Highlander Day 3 --- 72 --- --- ---
211 Day 1 --- --- --- --- ---
2004 Toyota Near Zero Day 2 --- 129 --- 191 ---
Camry XLE Day 3 --- 176 --- 289 ---
212 Day 1 --- --- --- --- ---
2006 Ford Near Zero Day 2 --- --- --- --- ---
Taurus Day 3 --- --- --- 204 ---
CRC E-77-2 Program - Carbon Canister Diurnal Breakthrough Results
Diurnal Breakthrough - grams
Summary ndash The lack of canister breakthrough for the 7 psi fuels (summer grade) indicates that
the storage capacity of the seven systems tested is appropriately sized Breakthrough began to
appear when testing of 9 psi E0 fuel (not summer grade) and was more prevalent with the 10 psi
E10 fuel (winter grade) The lack of breakthrough with the 9 psi E20 fuel seems to be an
anomaly
27
Overall Trend Summary - The following chart (Figure 18) visually summarizes the trends seen
from all testing performed during this program
Higher Volatility E0 to E10 E0 to E20 E10 to E20
uarr uarr uarr uarr
Higher Volatility E0 to E10 E0 to E20 E10 to E20
uarr uarr uarr uarr
Higher Volatility E0 to E10 E0 to E20 E10 to E20
uarr uarr uarr uarr
Higher Volatility E0 to E10 E0 to E20 E10 to E20
uarr uarr uarr uarr
Higher Volatility E0 to E10 E0 to E20 E10 to E20
uarrharr uarr uarr uarr
Higher Volatility E0 to E10 E0 to E20 E10 to E20
uarr uarr uarr uarr
Higher Volatility E0 to E10 E0 to E20 E10 to E20
uarr darr darr
Higher Volatility E0 to E10 E0 to E20 E10 to E20
uarr uarr uarr harr
Ethanol Content
Diurnal
Trend Analysis for E-77-2 Program
Ethanol Content
Static Permeation
Ethanol Content
Running Loss Permeation
Ethanol Content
Ethanol Content
Diurnal
Enhanced Vehicles (Sample of 5)
Static Permeation
Ethanol Content
Ethanol Content
Running Loss Permeation
Ethanol Content
True Hot Soak (TEFVO)
Near-Zero Vehicles (Sample of 2)
True Hot Soak (TEFVO)
Figure 18 Trend Analysis Summaries
28
Vehicle 202 ndash 1996 Ford Taurus - Special Case
We have treated vehicle 202 as a special case This was the oldest of the vehicles tested and had
been subjected to limited exhaust emission tests with a 20-volume percent ethanol fuel (E20)
during the CRC E-74b test program
Vehicle 202 completed the E10 portion of the test program (10 and 7 psi fuels) successfully and
completed the road preconditioning on the E0 fuel prior to the E0 evaluations The first test on
the E0 fuel was excessively high indicating a fuel leak It was traced to a leaky fuel injector o-
ring and there was considerable discussion as to an appropriate repair Tests were made on the 9
and the 7 psi E0 fuel to measure the magnitude of a vehicle in a ldquoleakrdquo condition and the tests
were labeled as ldquo202L (Leak)rdquo The fuel injector o-rings were replaced as a complete set and
the vehicle resumed testing as ldquo202Rrsquo (Repaired) A new elusive vapor leak was present later
identified as a very small leak at the top of the fuel fill pipe
The circle on Figure 19 at the right shows
the location of the small leak This leak
was problematic as to its effect on the
emission measurements because its
magnitude or presence seemed to depend
on the torque exerted on the fuel cap The
tests on the E0 fuels (9 and 7 psi) are
noted as 202R but with a vapor leak
We attempted to fix this leak and repeated
the E10 test with the vehicle re-identified
as 216 with reasonable results We also
ran the E20 test sequence and declared the
vehicle done
The testing history for this vehicle is shown in Tables 8 (Static) 9 (Dynamic) and 10 (Diurnal)
The tests highlighted in yellow are those that exhibited a liquid or vapor leak as identified during
the static test leak validation
Figure 19 ndash Vehicle 202 Fuel Fill Pipe Leak
29
Table 8
Static Permeation Results 1996 Ford Taurus SHED
Corrected Results Canister
Fuel Permeation mgday Loss
Veh psiEtOH Test Type Date Test mghr (Corrected) g
202 100E10 Static Perm 071807 7018 345 000
Press Incr 00 No Leak
Prs+Fuel Incr 00
202 70E10 Static Perm 082107 7031 223 000
Press Incr 00 No Leak
Prs+Fuel Incr 00
202L 90E0 Static Perm 030408 7169 2292 000
Press Incr DNA
Prs+Fuel Incr 4921 Liquid Leak
202L 70E0 Static Perm 032008 7183 2991 000
Press Incr DNA
Prs+Fuel Incr 19896 Liquid Leak
202R 90E0 Static Perm 050808 7228 178 000
Press Incr 136 Vapor Leak
Prs+Fuel Incr 00
202R 70E0 Static Perm 052208 7239 204 000
Press Incr 380 Vapor Leak
Prs+Fuel Incr 00
216 100E10 Static Perm 081408 7299 324 000
Press Incr 00 No Leak
Prs+Fuel Incr 00
216 70E10 Static Perm 091708 7326 325 000
Press Incr 00 No Leak
Prs+Fuel Incr 00
216 90E20 Static Perm 103008 7363 204 000
Press Incr 00 No Leak
Prs+Fuel Incr 00
30
Table 9
Dynamic Permeation Results 1996 Ford Taurus SHED
Corrected Results Canister From
Fuel Permeation mgday Loss Static
Veh psiEtOH Test Type Date Test mghr (Corrected) g Test
202 100E10 Dynamic RL 072007 25662 1278 000 No Leak
TEFVO 386 000
202L 90E0 Dynamic RL 030508 25695 3870 000 Liquid Leak
TEFVO 00 000
202L 70E0 Dynamic RL 032408 25699 7269 000 Liquid Leak
TEFVO 00 000
202R 90E0 Dynamic RL 050908 25704 1091 000 Vapor Leak
TEFVO 50 000
202R 70E0 Dynamic RL 052308 25706 787 000 Vapor Leak
TEFVO 00 000
216 100E10 Dynamic RL 081508 25718 1742 000 No Leak
TEFVO 14 000
216 70E10 Dynamic RL 091808 25721 1683 000 No Leak
TEFVO 423 000
216 90E20 Dynamic RL 110708 25730 543 000 No Leak
TEFVO 00 000
31
Table 10
Diurnal Permeation Results 1996 Ford Taurus SHED
Corrected Results Canister From
Fuel Permeation mgday Loss Static
Veh psiEtOH Test Type Date Test mghr (Corrected) g Test
202 100E10 72 DHB 65-105 073107 7023
Day 1 10429 612 No Leak
Day 2 7069 3264
Day 3 7043 3869
202 70E10 72 DHB 65-105 082807 7034
Day 1 6278 000 No Leak
Day 2 5065 000
Day 3 4535 000
202L 90E0 72 DHB 65-105 031108 7173
Day 1 22589 000 Liquid Leak
Day 2 32310 000
Day 3 23069 1260
202L 70E0 72 DHB 65-105 040108 7196
Day 1 47425 000 Liquid Leak
Day 2 44517 000
Day 3 31798 000
202R 90E0 72 DHB 65-105 051308 7230
Day 1 3270 000 Vapor Leak
Day 2 2667 000
Day 3 2746 1083
202R 70E0 72 DHB 65-105 052808 7243
Day 1 2117 000 Vapor Leak
Day 2 2208 000
Day 3 2081 000
216 100E10 72 DHB 65-105 082008 7305
Day 1 25907 5777 No Leak
Day 2 34779 6299
Day 3 36014 6343
216 70E10 72 DHB 65-105 092308 7331
Day 1 3975 022 No Leak
Day 2 3550 006
Day 3 3621 037
216 90E20 72 DHB 65-105 111108 7373
Day 1 4685 000 No Leak
Day 2 4526 000
Day 3 4198 000
32
The Implanted Leak Test Results
Project E-77-2 included evaluating two vehicles with implanted leaks This interest followed the
information gathered in the Pilot Study where tests were run with a specially modified fuel cap
containing a 002rdquo dia hole The results with the implanted leak from the Pilot Study are
repeated in Table 11 below as the diurnal results are shown for a 1996 Chevrolet Cavalier first
without the implanted leak at 038 grams per day and then at 207 grams per day (a 54x
increase) with the leak
Table 11
Veh No
Evap
Tech Fuel
Results
gmsday
gms
Increase
6 1996 Chevrolet Cavalier Enhanced 7 psi E0 038
7 2070 2032
207 2001 Dodge Caravan Enhanced 7 psi E10 109
207L 213 104
211 2004 Toyota Camry LE Near Zero 7 psi E10 024
211L 068 044
- Implanted 020 leak in fuel cap
Vehicle Description
Implanted Leak Impact on Diurnal PermeationDay One Results 65deg - 105degF Diurnal
The two E-77-2 vehicles (207 amp 211) were given a limited evaluation with an induced leak and
saw a significantly lesser impact Vehicle 207 gave diurnal results increases from 109 to 213
grams per day (a 2x increase) and Vehicle 211 increased from 024 grams per day to 068 grams
per day (a 28x increase) The following Figure 20 displays the imbedded leak impact from Table
11
33
0
5
10
15
20
On
e D
ay
Diu
rna
l P
erm
ea
tio
n -
gm
sd
ay
Vehicle Number
Implanted Leak Impact on One Day Diurnal Permeation020 Leak in Fuel Cap - 65 to 105 F Diurnal
207L 211L21120776
As Received - No Leak
020 Fuel Cap Leak
The newer vehicles evaluated in this phase of the study were configured and certified to the
Onboard Refueling Vapor Regulations (ORVR) These are capable of containing 95 or more
control of the refueling vapors at up to 10 gallons per minute fueling rate Where the Chevrolet
Cavalier had a small (0055rdquo dia) orifice and a long vapor tube venting the tankrsquos vapor space to
the carbon canister (and then to the atmosphere) the ORVR compliant vehicles have a large
(0688rdquo ID) short vent hose to a low flow restriction carbon canister
The following bar charts (Figures 21 through 24) show the impacts of the leak on all phases of
the evaporative testing performed and compare those results with all fuels tested With only two
vehicles (207 and 211) evaluated on two fuels statistically significant effects cannot be
quantified but the trend of increased emissions is apparent
Figure 20 ndash Implanted Leak Impact
34
0
20
40
60
80
100
120
140
160
7E0 9E0 7E10 10E10 9E20 7E0 9E0 7E10 10E10 9E20
Sta
tic
Pe
rme
ati
on
-m
gh
r
Fuel
0020 dia Induced Leak EffectStatic Permeation
Vehicle 211Vehicle 207
Leak
Leak
0
200
400
600
800
1000
1200
7E0 9E0 7E10 10E10 9E20 7E0 9E0 7E10 10E10 9E20
Ru
nn
ing
Lo
ss
Pe
rme
ati
on
-m
gh
r
Fuel
0020 dia Induced Leak EffectRunning Loss Permeation
Vehicle 211Vehicle 207
Leak
Leak
Figure 21 ndash Vehicles 207 and 211 with Induced Leak - Static
Figure 22 ndash Vehicles 207 and 211with Induced Leak ndash Running Loss
35
0
100
200
300
400
500
600
700
7E0 9E0 7E10 10E10 9E20 7E0 9E0 7E10 10E10 9E20
Tru
e H
ot S
oa
k P
erm
ea
tio
n -
mg
hr
Fuel
0020 dia Induced Leak EffectTrue Hot Soak Permeation
Vehicle 211Vehicle 207
Leak
Leak
0
500
1000
1500
2000
2500
7E0 9E0 7E10 10E10 9E20 7E0 9E0 7E10 10E10 9E20
Da
y 1
Diu
rna
l P
erm
ea
tio
n -
mg
da
y
Fuel
0020 dia Induced Leak EffectDay 1 Diurnal Permeation
Vehicle 211Vehicle 207
Leak
Leak
Figure 24 ndash Vehicles 207 and 211 with Induced Leak - Diurnal
Figure 23 ndash Vehicles 207 and 211 with Induced Leak ndash True Hot Soak
36
Summary of Findings and Results
The E-77-2 test program was a continuation of the previously published E-77 test project and
added eight vehicles tested on five fuels to the knowledge base The permeation trends
previously shown were again present The small sample size and limited number of tests
preclude making statements about statistical validity but in general
o The newer vehicle groups had lower emissions
o Adding ethanol to the fuel increased permeation over the non-oxygenated levels
o Increased volatility increased permeation levels
o SHED emission rates must be corrected for the ethanol error in the FID and the
non-fuel methanol and refrigerant in the measurement
As this test program evolved and additional experience was gathered two program modifications
were made 1) The leak validation methodology was changed and 2) a different metric and
definition of the ldquoHot Soakrdquo was adopted
The leak validation portion of the static permeation test was found to be very sensitive and when
the data was corrected on a minute-by-minute basis for ethanol methanol and refrigerant the
change in apparent permeation rate was due as much to variation as to leaks See the discussion
starting at page 12 for the details of the development
Concern for and recognition of ldquoHot Soakrdquo emissions started in the original evaporative emission
regulations Carburetors had float bowls with ~ 50 ml of fuel that absorbed the latent engine heat
after the vehicle was shut down after operation The heat would cause the bowl temperature to
increase driving fuel vapors out through vents and leak paths to the atmosphere after vehicle
operation Todayrsquos fuel injection engines do not have the open bowls and the emission rates
following vehicle operation are mainly increased temperature permeation We recommended
and adopted a new name for the ldquotemporary emissions following vehicle operationrdquo (TEFVO)
which subtracts the basic permeation rate from the measured emissions See the discussion
starting at page 16 for details
37
Appendix
Acknowledgements
E-77-2 Steering Committee
David Brzezinski EPA
Kevin Cullen GM Powertrain
Dominic DiCicco Ford Motor Company
King D Eng Shell Global Solutions
Ben Hancock CARB
Constance Hart EPA
Phil Heirigs Chevron Global Downstream
Jeff Jetter Honda RampD Americas
Keith KnollNREL
John Koupal EPA
David H Lax API
Jeff Long CARB
Hector Maldonado CARB
Mani Natarajan Marathon Oil Company
David N Patterson Mitsubishi Motors RampD Americas
Jenny Sigelko Chrysler
James P UihleinChevron Global Downstream
Marie Valentine Toyota Technical Center
Kenneth J Wright ConocoPhillips
CRC Members
Brent Bailey CRC
Chris Tennant CRC
Jane Beck CRC
38
Table 12
E0 E10 E20
Inspection Units Fuel 6 Fuel 7 Fuel 4
API Gravity degAPI 602 585 570
Relative Density 6060degF 07382 07447 07508
DVPE psi 701 730 849
Oxygenates--D4815
MTBE vol 000 000 000
ETBE vol 000 000 000
EtOH vol 000 954 2034
O2 wt 000 353 747
Hydrocarbon Composition
Aromatics vol 221 244 108
Olefins vol 80 88 55
Saturates vol 700 573 234
D86 Distillation
IBP degF 974 1040 1022
5 Evaporated degF 1316 1280 1252
10 Evaporated degF 1423 1330 1314
20 Evaporated degF 1564 1410 1413
30 Evaporated degF 1704 1450 1486
40 Evaporated degF 1840 1530 1547
50 Evaporated degF 1975 1950 1596
60 Evaporated degF 2120 2190 1636
70 Evaporated degF 2305 2410 2274
80 Evaporated degF 2588 2710 2695
90 Evaporated degF 3139 3170 3139
95 Evaporated degF 3322 3300 3255
EP degF 3603 3600 3406
Recovery vol 978 978 983
Residue vol 13 10 10
Loss vol 09 12 07
Driveability Index 11199 11015 9898
Data from CRC E-74
CRC E-77-2 Fuel Inspection Results
39
Fuel Units Fuel 6 Fuel 7 Fuel 4
Sulfur Content ppm 29 27 27
Estimated CH Ratio 62090 63323 63252
Est Net Heat of Combustion btulb 18573 18514 18513
Benzene vol 090 100 096
Research Octane Number 932 940 946
Motor Octane Number 838 838 834
(R+M)2 885 889 890
Fuel Units Fuel 6 Fuel 7 Fuel 4
Aromatics vol 2386 2481 2178
Olefins vol 752 892 1074
Saturates vol 6743 5621 4623
Unclassified vol 115 086 015
Ethanol vol 000 920 2111
Benzene vol 089 106 097
CH Ratio 6200 6092 5835
Oxygen wt 0008 1 340 773
Net Heat of Combustion btulb 18703 18016 17160
1 Contains 004 vol MTBE
Fuel Units Fuel 6 Fuel 7 Fuel 4
Oxygen wt 0008 3396 7733
C+H wt 9999 9660 9227
H wt 1389 1362 1350
C wt 8610 8298 7877
Fuel Units 6 7 4
Haltermann D3338 Btulb 18573 18514 18513
Average D3338 Btulb 18579 18514 18491
Oxygen Corrected D3338 Btulb 18579 17860 17103
DHA Btulb 18703 18016 17160
Table 12 (cont)
Suppliers Additional Inspections
Net Heat of Combusion -- Btulb
Carbon Hydrogen and Oxygen
Detailed Hydrocarbon Analysis
40
Vehicle Day 1 Day 2 Day 3
No Fuel Base + Press + Pump RL True HS Perm (Brkthru) Perm (Brkthru) Perm (Brkthru)
E10 - 10 psi 345 --- --- 1278 503 10429 (63) 7069 (348) 7043 (425)
E10 - 7 psi 223 --- --- 994 113 6278 (00) 5065 (00) 4535 (00)
E0 - 9 psi 2229 --- 4921 3870 00 22580 (00) 32310 (00) 23069 (126)
E0 - 7 psi 2991 --- 19896 7269 00 47425 (00) 44517 (00) 31798 (00)
E10 - 10 psi 843 --- --- 3164 04 15479 (310) 17799 (383) 17711 (419)
E10 - 7 psi 664 --- --- 2879 297 12601 (00) 11652 (00) 11653 (00)
E0 - 9 psi 338 --- --- 2492 443 6283 (24) 5810 (136) 5770 (225)
E0 - 7 psi 129 --- --- 2226 187 3672 (00) 2877 (00) 2936 (00)
E20 - 9 psi 553 --- --- 2720 134 11034 (00) 9581 (00) 9812 (00)
E10 - 10 psi 416 --- --- 1916 295 17941 (204) 17309 (346) 17417 (375)
E10 - 7 psi 596 --- --- 2328 719 17834 (00) 17150 (00) 15239 (00)
E0 - 9 psi 195 --- --- 1031 10 4995 (00) 4810 (00) 5072 (26)
E0 - 7 psi 99 --- --- 671 00 3830 (00) 3654 (00) 3670 (00)
E20 - 9 psi 462 --- --- 1697 603 17752 (00) 16900 (00) 16802 (00)
E10 - 10 psi 787 --- --- 8581 2377 14064 (00) 12644 (00) 12237 (00)
E10 - 7 psi 644 --- --- 8122 1222 10865 (00) 8120 (00) 8236 (00)
E0 - 9 psi 325 --- --- 8339 58 4064 (00) 3373 (00) 3080 (00)
E0 - 7 psi 401 --- --- 8425 00 3975 (00) 3026 (00) 2689 (00)
E20 - 9 psi 882 --- --- 10282 00 15480 (00) 13702 (00) 13605 (00)
E10 - 10 psi 976 --- 1209 10012 3929 16449 (00) NA NA
E10 - 7 psi 1468 --- --- 11393 5850 21342 (00) NA NA
E10 - 10 psi 199 --- --- 1383 00 3370 (00) 2268 (191) 2179 (330)
E10 - 7 psi 94 266 --- 563 138 2438 (00) 1838 (00) 1843 (00)
E0 - 9 psi 101 --- --- 837 153 1303 (00) 1158 (129) 1006 (221)
E0 - 7 psi 91 --- --- 1046 07 2071 (00) 1002 (00) 874 (00)
E20 - 9 psi 558 --- --- 4106 00 2840 (00) 2218 (00) 2034 (00)
E10 - 10 psi 551 --- 821 3024 2450 25454 (040) NA NA
E10 - 7 psi 481 --- 1664 2511 62 6783 (00) NA NA
E10 - 10 psi 106 --- --- 1489 00 1243 (00) 879 (00) 1028 (200)
E10 - 7 psi 218 --- --- 2012 00 1848 (00) 1002 (00) 758 (00)
E0 - 9 psi 32 --- --- 1158 04 1005 (00) 708 (00) 574 (00)
E0 - 7 psi 09 --- --- 1845 18 1016 (00) 712 (00) 570 (00)
E20 - 9 psi 47 --- --- 1168 49 1310 (00) 833 (00) 750 (00)
E10 - 10 psi 244 --- --- 1331 574 4920 (00) 8394 (00) 113738 (49)
E10 - 7 psi 239 --- --- 1057 329 5242 (00) 3974 (00) 3944 (00)
E0 - 9 psi 107 --- --- 967 521 4559 (00) 3585 (00) 11017 (00)
E0 - 7 psi 252 --- --- 363 33 4943 (00) 3190 (00) 2815 (00)
E20 - 9 psi 168 --- --- 1394 560 4709 (00) 4400 (00) 7518 (00)
E10 - 10 psi 104 90 --- 719 16 3192 (00) 2602 (00) 2370 (00)
E10 - 7 psi 122 --- --- 979 00 2247 (00) 2317 (00) 2675 (00)
E0 - 9 psi 85 --- --- 811 251 2021 (00) 1659 (2) 1763 (72)
E0 - 7 psi 87 --- --- 797 225 2483 (00) 2941 (00) 2888 (00)
E20 - 9 psi 193 --- --- 1025 00 4168 (00) 4148 (00) 4506 (00)
E10 - 10 psi 324 --- --- 1742 118 25907 (578) 34779 (630) 36014 (643)
E10 - 7 psi 325 --- --- 1683 192 3975 (02) 3550 (01) 3621 (04)
E0 - 9 psi 178 136 --- 1091 254 3270 (00) 2667 (00) 2746 (108)
E0 - 7 psi 204 380 --- 787 00 2117 (00) 2208 (00) 2081 (00)
E20 - 9 psi 204 --- --- 543 74 4685 (00) 4526 (00) 4198 (00)
216
211
2004
Toyota
Camry
XLE
215
2004
Toyota
High-
lander
212
2006
Ford
Taurus
214
2004
Ford
Escape
211L
207L
Static Permeation - mghr Dynamic Perm - mghr
CRC E-77-2 Program Test Results
Diurnal (65ordm to 105ordm) - mgday
202
1996
Taurus
205
2001
Toyota
Corolla
204
1999
Honda
Accord
207
2001
Dodge
Caravan
202L
Table 13
41
Individual Vehicle Diurnal Performance on the Various Fuels
0
1000
2000
3000
4000
5000
6000
0 10 20 30 40 50 60 70
Cu
mu
lati
ve
Pe
rme
ati
on
-m
g
Test Time - hrs
Three Day DiurnalVehicle 204 1999 Honda Accord
10 psi E10
7 psi E10
9 psi E0
7 psi E0
9 psi E20
0
1000
2000
3000
4000
5000
6000
0 10 20 30 40 50 60 70
Cu
mu
lati
ve
Pe
rme
ati
on
-m
g
Test Time - hrs
Three Day DiurnalVehicle 205 - 2001 Toyota Corolla
10 psi E10
7 psi E10
9 psi E0
7 psi E0
9 psi E20
Figure 25 ndash Vehicle 204 Diurnal Performance
Figure 26 ndash Vehicle 205 Diurnal Performance
42
0
500
1000
1500
2000
2500
3000
3500
4000
4500
5000
0 10 20 30 40 50 60 70
Cu
mu
lati
ve
Co
rre
cte
d P
erm
ea
tio
n -
mg
Test Time - hrs
Three Day DiurnalVehicle 207 - 2001 Dodge Caravan
10 psi E10
7 psi E10
9 psi E0
7 psi E0
9 psi E20
0
100
200
300
400
500
600
700
800
900
0 10 20 30 40 50 60 70
Cu
mu
lati
ve
Pe
rme
ati
on
-m
g
Test Time - hrs
Three Day DiurnalVehicle 211 - 2004 Toyota Camry XLE
10 psi E10
7 psi E10
9 psi E0
7 psi E0
9 psi E20
Figure 27 ndash Vehicle 207 Diurnal Performance
Figure 28 ndash Vehicle 211 Diurnal Performance
43
0
50
100
150
200
250
300
350
400
450
500
0 10 20 30 40 50 60 70
Cu
mu
lati
ve
Pe
rme
ati
on
-m
g
Test Time - hrs
Three Day DiurnalVehicle 212 - 2006 Ford Taurus
10 psi E10
7 psi E10
9 psi E0
7 psi E0
9 psi E20
0
500
1000
1500
2000
2500
3000
3500
4000
4500
5000
0 10 20 30 40 50 60 70
Cu
mu
lati
ve
Pe
rme
ati
on
-m
g
Test Time - hrs
Three Day DiurnalVehicle 214 2004 Ford Escape
10 psi E10
7 psi E10
9 psi E0
7 psi E0
9 psi E20
Note The incomplete cumulative results for the 10 psi E10 results resulted from a conflict for the use
of the INNOVA analyzer during the test The INNOVA analyzer is required to correct for the FIDrsquos
ethanol error and the presence of methanol and refrigerant (R-134a) The data was available for the
50+ hour results and the data is valid as shown We have no explanation for the high levels
experienced on the third day of the test No test errors were identified
Figure 29 ndash Vehicle 212 Diurnal Performance
Figure 30 ndash Vehicle 214 Diurnal Performance
44
0
200
400
600
800
1000
1200
1400
1600
0 10 20 30 40 50 60 70
Cu
mu
lati
ve
Pe
rme
ati
on
-m
g
Test Time - hrs
Three Day DiurnalVehicle 215 2004 Toyota Highlander
10 psi E10
7 psi E10
9 psi E0
7 psi E0
9 psi E20
Figure 31 ndash Vehicle 215 Diurnal Performance
45
Table 14
Test Corrected
Vehicle Fuel Total Fuel EtOH R134a Methanol
204 10 psi E10 509899 144040 18298 16754
1999 Honda 7 psi E10 359057 130806 17551 15221
Accord 9 psi E0 178635 13843 18230 9896
7 psi E0 94846 1856 16631 2379
9 psi E20 304271 128408 18261 12143
205 10 psi E10 526659 186599 23354 20895
2001 Toyota 7 psi E10 502229 204246 25990 19198
Corolla 9 psi E0 148775 000 20434 4613
7 psi E0 111536 5489 22408 5619
9 psi E20 514540 212708 25677 19584
207 10 psi E10 389450 196248 12013 30399
2001 Dodge 7 psi E10 272201 114027 11731 19616
Caravan 9 psi E0 105167 1820 12224 15284
7 psi E0 96906 1118 22141 14276
9 psi E20 427882 241488 14268 25432
211 10 psi E10 78164 19733 15159 46970
2004 Toyota 7 psi E10 61190 20211 15929 46525
Camry LE 9 psi E0 34668 1681 14329 42659
7 psi E0 39468 000 16197 57303
9 psi E20 71013 26726 16213 36879
212 10 psi E10 31508 7222 14831 7896
2006 Ford 7 psi E10 36079 10132 15481 3400
Taurus 9 psi E0 22870 2409 15182 3761
7 psi E0 22973 000 15393 4362
9 psi E20 28935 11156 14116 2629
214 10 psi E10 1257887 000 19947 27992
2004 Ford 7 psi E10 131593 24571 16025 8879
Escape 9 psi E0 191611 2940 16487 7213
7 psi E0 109481 5386 80650 3106
9 psi E20 166271 24097 14491 6096
215 10 psi E10 81644 12178 14658 42609
2004 Toyota 7 psi E10 72399 15092 15532 36061
Highlander 9 psi E0 54431 000 14806 25822
7 psi E0 83115 000 14072 26255
9 psi E20 128223 38822 12841 34420
3 Day Diurnal Results
CRC E77-2 Program Diurnal ResultsAll values are in mg
46
0
200
400
600
800
1000
1200
1400
1600
1800
2000
Co
rrecte
d D
aily D
iurn
al
-m
g
Diurnal Ethanol PortionVehicle 204 - 1999 Honda Accord
Ethanol Portion
10 psi E10 9 psi E07 psi E10
1 32
315
341368
383
264273
1 321 321 321 32
9 psi E207 psi E0
1122097
39
0510
442
405412
Figure 32 ndash Vehicle 204 Diurnal Ethanol Portion
0
200
400
600
800
1000
1200
1400
1600
1800
2000
Co
rrecte
d D
aily D
iurn
al
-m
g
Diurnal Ethanol PortionVehicle 205 - 2001 Toyota Corolla
Ethanol Portion
10 psi E10 9 psi E07 psi E10
1 32
359
406
382
431355349
1 321 321 321 32
9 psi E207 psi E0
0 00
712649
406
420414
Figure 33 ndash Vehicle 205 Diurnal Ethanol Portion
47
0
200
400
600
800
1000
1200
1400
1600C
orr
ecte
d D
aily D
iurn
al
-m
g
Diurnal Ethanol PortionVehicle 207 - 2001 Dodge Caravan
Ethanol Portion
10 psi E10 9 psi E07 psi E10
1 32
488
442408
409
490535
1 321 321 321 32
9 psi E207 psi E0
00
1144
27
0101
556
587552
Figure 34 ndash Vehicle 207 Diurnal Ethanol Portion
0
50
100
150
200
250
300
350
400
Co
rrecte
d D
aily D
iurn
al
-m
g
Diurnal Ethanol PortionVehicle 211 - 2004 Toyota Camry XLE
Ethanol Portion
10 psi E10 9 psi E07 psi E10
1 32
264
242245
1 321 321 321 32
9 psi E207 psi E0
329
306356
00
73
64
00
00
00
325
431
370
Figure 35 ndash Vehicle 211 Diurnal Ethanol Portion
48
0
20
40
60
80
100
120
140
160
180
200C
orr
ecte
d D
aily D
iurn
al
-m
g
Diurnal Ethanol PortionVehicle 212 - 2006 Ford Taurus
Ethanol Portion
10 psi E10 9 psi E07 psi E10
1 32
216
170
316
1 321 321 321 32
9 psi E207 psi E0
194
288
436 102
105
85
00
00
00476
529
243
Figure 36 ndash Vehicle 212 Diurnal Ethanol Portion
0
200
400
600
800
1000
1200
Co
rrecte
d D
aily D
iurn
al
-m
g
Diurnal Ethanol PortionVehicle 214 - 2004 Ford Escape
Ethanol Portion
10 psi E10 9 psi E07 psi E10
1 32
00
1 321 321 321 32
9 psi E207 psi E0
201
202152
38
05
19
56
1469
103
171188
143
67
11275
Figure 37 ndash Vehicle 214 Diurnal Ethanol Portion
49
0
50
100
150
200
250
300
350
400
450
500C
orr
ecte
d D
aily D
iurn
al
-m
g
Diurnal Ethanol PortionVehicle 215 - 2004 Toyota Highlander
Ethanol Portion
10 psi E10 9 psi E07 psi E10
1 32
121
136
196
1 321 321 321 32
9 psi E207 psi E0
198
217213
0000
00
0000
00
335 292
283
Figure 38 ndash Vehicle 215 Diurnal Ethanol Portion

9
Drain and 40 Fill
with 10 psi E10 Test Fuel
Road Preconditioning
Four LA-4rsquos or Equivalent
Drain and 40 Fill
with 10psi E10 Test Fuel
Overnight Park at 86degF
Move to SHED
Connect Test Instrumentation
Stabilize at 86degF
Perform Constant Temperature
Permeation Series (86degF)
1 hour Permeation Rate Test
frac12 hour Tank Pressurized Test
frac12 hour Pump Energized Test
Transfer to RL SHED
Connect Test Instrumentation
Stabilize at 86degF
Perform Dynamic Permeation Test
Two LA92 Driving Cycles amp
One Hour Hot Soak
Drain and 40 Fill
With 10 psi E10 Test Fuel
Road Preconditioning
Four LA-4rsquos or Equivalent
Move to VT-SHED
Connect Test Instrumentation
Stabilize at 65degF for 6 hrs Minimum
Perform 3-Day Diurnal Evaluation
72 hr 65deg to 105degF VT Test
Drain and 40 Fill
with 7 psi E10 Test Fuel
Condition Fuel System
By Driving for One Week
Repeat Steps 1 ndash 12
On 7 psi E10 Test Fuel
Drain and Fill with 9 psi E0 Test Fuel
Condition Fuel System by 4 weeks Driving
Repeat Steps 1 ndash 12
On 9 and 7 psi E0 and
Repeat Steps 0-12
On 9 psi E20 Test Fuels
Precondition Fuel System
With 4 Weeks Driving on
10 psi E10 Test Fuel
1
2
3
4
5
6
7
8
9
10
11
12
0
Figure 7 ndash Testing Flow Chart
10
Test Procedures ndash There are four basic tests in the E-77-2 test protocol
1 Static Permeation Rate (includes checks for vapor and liquid leaks)
2 Running Emissions (Dynamic Test)
3 Hot Soak
4 Diurnal
Each is described in detail below
1 Static Permeation Rate Testing
The constant temperature (static) permeation rate is measured in a traditional SHED (Constant
temperature) in the following manner
A The fuel tank is drained and filled to 40 tank capacity with the test fuel
B The day before testing the vehicle is driven over four road trips of 75 miles each
to precondition the canister8 (These drives are similar to the LA-4)
C Upon return from the road pre-conditioning the fuel tank is drained and filled to
40 tank capacity with the test fuel9
D Vehicle is parked for 18-22 hours in a controlled temperature environment at test
temperature (86ordmF)
E The vehicle is then moved (without starting) into the test (86ordmF) SHED
F The canister vent is connected to the SHED bulkhead fitting which routes the
vapor to the trap canister outside the SHED
G The tank system pressurization hose is connected
H The fuel pump electrical connection is connected
I The SHED is sealed the inside temperature is allowed to stabilize and the test is
started Continuous THC measurements are made using a FID Ethanol
methanol and R134a concentrations are measured using an INNOVA analyzer
All measurements are made at least every minute for one hour to determine the
stabilized permeation rate
J At the end of the static test (60 minutes) the vehiclersquos vapor system is pressurized
to 5 inches of water for thirty minutes Measurements are made to quantify vapor
leaks as determined by a change in the THC in the SHED
K The fuel pump is then energized for 30 minutes while maintaining the 5 inches of
water on the vapor system Liquid leaks are quantified as determined by a change
in the concentration of THC in the SHED
The purpose of steps J and K above is to validate that the permeation rate measurement was
made without the presence of any leak ndash either liquid or vapor A detailed discussion follows
starting at page 12
8 This conditioning can be done in the laboratory on a chassis dynamometer if proper attention is paid to underbody
cooling and unrepresentative fuel tank temperatures are avoided 9 Vehicles with ORVR systems will add the refueling vapors to the canister This is OK
11
2 Running Loss Test (Dynamic Test)
A The vehicle is placed in the RL-SHED and prepared for test (The fuel level and
condition for the dynamic test is the fuel remaining after completion of the static test ndash
40 fresh fill of the appropriate test fuel)
B Outside air source for the engine is connected
C Vehicle exhaust is connected
D Fuel tank thermocouple is connected
E Canister vent is connected to the SHED bulkhead fitting which routes the vapor to the
trap canister outside the SHED
F Vehicle is allowed to stabilize in the RL-SHED at test temperature (86degF) for a minimum
of 12 hours ndash preferably overnight
G Two cycles of the Unified Cycle (LA-92) driving schedule (48 mins) are driven while
measuring the mass emissions in the SHED Vehicle is allowed to idle (in drive) for 30
seconds between the two cycles Ambient air temperature is maintained (to the extent
possible) at 86degF Fuel tank surface temperature is monitored during vehicle operation It
should increase during the drive from 10 to 18degF to simulate expected on-road
temperature increase Measured mass emissions are corrected using the INNOVA data
for the ethanol methanol and refrigerant emissions
3 Hot Soak10
This procedure is executed immediately following the Running Loss Test procedure
described above
A Engine is turned off transmission selector is placed in park and driver exits the
enclosure using the double door air lock taking care to minimize any air exchange
between the laboratory and the SHED This starts the one hour ldquohot soakrdquo period
B Measurements of mass emissions in the SHED are continued for another 60 minutes
(until time = 108 minutes) correcting for the ethanol methanol and refrigerant mass
using the INNOVA instrument data This ends the hot soak Hot soak emissions are
calculated as the net difference for the one hour hot soak (CorrMass108 ndash CorrMass48
minus the 86degF static hourly rate all mass rates in mghour)
4 Diurnal Test
A The fuel tank is drained and filled to 40 tank capacity with the test fuel
B The day before testing the vehicle is driven over four road trips of 75 miles each to
precondition the vehicle and the canister
C Upon return from the road pre-conditioning the fuel tank is drained and filled to 40
tank capacity with the test fuel
D The vehicle is parked for 18-22 hours in a controlled temperature environment at the
initial diurnal test temperature (65ordmF)
E The SHED is sealed allowed to stabilize at the 65degF temperature and the 3-day
California Diurnal Test is started
10 We define the ldquohot soakrdquo to be the temporary increase in emission rate caused by the immediately preceding
operation of the vehicle It is the increase in the SHED mass (corrected for EtOH MeOH and R-134a) over the
one hour period minus the previously established ldquostaticrdquo permeation rate
12
F ldquoContinuousrdquo (every 30 seconds) THC measurements are made using a FID Ethanol
methanol and R134a (refrigerant) concentrations are measured using an INNOVA
analyzer at least every 10 minutes for the duration of the test (72 hours)
Static Permeation Test ndash Leak Validation
If a leak is detected during either the vapor system pressure portion (Step J) or the pump
energized portion (Step K) of the Static Permeation Test procedure it calls into question whether
the permeation rate measurement accurately reflects fuel system permeation or if instead a
combination of permeation and the implied leak was measured If a leak is confirmed the
permeation rate measurement is called into question and an investigation possible remedy and
retest is indicated
The permeation rate measurement must be corrected for the FIDrsquos ethanol misrepresentation and
the presence of non-fuel hydrocarbons (methanol and refrigerant) The leak check however is
made using the change in mass increase in the SHED using the uncorrected FID mass calculation
as the determinate It was found that the corrections for ethanol methanol and refrigerant were
introducing ldquonoiserdquo into the trace and that these were being misinterpreted as leaks
y = 062x - 19
y = 047x + 67
y = 055x - 01
0
10
20
30
40
50
60
70
80
90
100
0 20 40 60 80 100 120
SH
ED
Mas
s -
mg
Test Time - minutes
Leak TestVehicle 204 - 1999 Honda Accord - 9 psi E0
Test 7028
Pump ActivatedTank Pressurized
Figure 8 above represents the calculations made during the inspection of data from a successful
test EXCELrsquostrade ldquoSLOPErdquo function is used to calculate the linear regression values based on
the FID calculation for mass for Time 0 to 60 minutes Time 64 to 90 minutes and Time 94 to
120 minutes A 4-minute gap was included between each sequence to establish the new mass
emission rate during the ldquopressure onrdquo (T60 to T90) and the ldquopump energizedrdquo periods
The slope of 047 for the ldquoTank Pressurizedrdquo period in the example above is compared to the
slope of 062 calculated for the permeation rate (or hot soak) period Since the ldquoTank
Figure 8 ndash Leak Test
13
Pressurizedrdquo slope is not more than 10 higher than the hot soak permeation rate we assume
that there is no leak present A similar comparison is made for the slope determined during the
ldquopump onrdquo period The choice of a 10 allowance is arbitrary and is used here to allow for
normal and unavoidable test variation
For tests in which the above procedure determines that no leak is present a value of zero is
reported in the test summary for the leak results If a positive value is reported it calls that test
into question and an investigation possible repair and retest is indicated
Static Permeation Rate Determination
The static permeation rate is determined based on a linear regression through the individual
SHED mass data points (data measured each 30 seconds) of the corrected fuel results (corrected
for the FID error and subtracting the methanol and refrigerant) from the first 60 minutes of
testing as illustrated in Figure 9 below
y = 05636x + 0505
0
5
10
15
20
25
30
35
40
45
0 10 20 30 40 50 60
Pe
rme
ati
on
-m
gs
Test Time - mins
Static Permeation DeterminationVehicle 204 - 1999 Honda Accord - 9 psi E0 Fuel
Raw SHED
Corrected Fuel
Permeation Rate Based on Corrected Results
Permeation Rate = 5636 x Time = 338 mgshr
In this example the static permeation rate is 338 mghr
Dynamic (Running Loss) and Hot Soak Test
The preceding section addressed the concepts of separating the permeation emissions from the
tank venting emissions and establishing the presence or absence of leaks The second part of
this study includes a dynamic test to measure the permeation and tank venting emissions during
Figure 9 ndash Static Permeation Determination
14
vehicle operation (ldquorunning lossesrdquo) and the temporary condition following vehicle operation
known as the ldquohot soakrdquo
This is considered a ldquodynamicrdquo test because the vehicle is driven and the fuel and vapor system
temperatures rise during the test The ambient temperature in the Running Loss SHED during
the test was held constant at 86degF while the vehiclersquos fuel system temperature rose during the
test Two 1435 second (239-minute) LA-92 driving cycles were performed consecutively during
the running loss measurements with a 30-second idle in-between During this test tank fuel
temperature was expected to rise by an average approximately 18degF above the initial ambient
temperature The running loss air handling system included a proportional speed under-car
blower operated as a slave to dynamometer speed This apparatus was used during running loss
testing with minor tuning for specific vehicles Without additional input it is capable of
reasonable fuel tank temperature control Each vehicle was fitted with a surface-mount
thermocouple at the front of the fuel tank located at approximately the 18th
fill level to measure
the fuel liquid temperature No attempt was made to follow a predefined fuel tank temperature
profile (FTTP) in this program Fuel temperatures were recorded and results are available in the
real-time records
Vehicle running loss emissions are measured in a special version of a SHED known as a
Running Loss SHED (RL-SHED) shown in Figure 10 Special features of the RL-SHED
include a sealed chassis dynamometer for simulating vehicle driving loads a sealed outside air
supply for engine intake a sealed exhaust conduit for engine exhaust and an under-chassis fan
for simulating underbody air flow as described above A vehicle is operated inside the RL-SHED
over a chosen driving cycle The increase in HC emissions inside the enclosure are measured
and calculated as mass emissions per 40 CFR sect86163-96
Figure 10 - Running Loss SHED
15
Vehicle testing in an RL-SHED is complicated by several factors including
1 Engine must be supplied with external induction air
2 Exhaust must be conducted externally without any leaks
3 Load supplied to the vehicle through the chassis dynamometer must not create or
allow external leaks
4 Internal SHED temperature must be maintained while sizable heat is rejected to the
ambient by the running engine and exhaust
5 Cooling air supplied to the radiator must be modulated to represent the vehiclersquos road
speed
6 Underbody (and especially the fuel system) temperature should represent the rate of
rise experienced by a real road-drive
Canister vent losses were isolated from permeation emissions using the technique previously
described The vehiclersquos carbon canister fresh air vent was connected to the outside of the RL-
SHED using a leak-tight PTFEreg
hose (38rdquo OD commercial tubing US Plastics 58055 PTFE or
equivalent) connected to a small carbon ldquotraprdquo canister located on a top-loading precision scale
The scale precision was 001 grams (10 milligrams) and it was purged prior to each test There
were no tank venting emissions measured on any of the running loss test measurements All of
the vehicles appeared to be actively ldquopurgingrdquo their respective control canisters and drawing
fresh air during the test If there were any emissions from the vehiclersquos control canister as might
have occurred if there were no vehicle purge or if very high volatility fuels with excessive vapor
generation were used they would have been measured
The Running Loss Driving Cycle consisted of two cycles of the ldquoUnified Driving Cyclerdquo
otherwise known as the LA-92 A velocity versus time plot for one cycle is shown in Figure 11
The LA-92 cycle takes 24 minutes to complete and covers 98 miles with many speed changes
Two back-to-back cycles were driven the first as a ldquocold startrdquo and the second following a 30-
second vehicle idle The ldquocold startrdquo condition was created by soaking the vehicle for a
Figure 11 ndash Running Loss Driving Cycle
Unified Cycle (LA-92)
0
10
20
30
40
50
60
70
80
0 5 10 15 20 25Test Time - minutes
Spe
ed -
mph
Cycle Time (min) 239
Maximum Speed (mph) 672
Average Speed (mph) 246
Average Non-Zero Speed (mph) 294
Time Zero Speed () 162
Distance (miles) 982
16
minimum of 18 hours at 86degF moving it to the stabilized 86degF RL-SHED making the test
connections and then waiting a minimum of one hour before the initial start and run
The SHED emissions were measured during 48 minutes of engine operation and then
continuously for one hour after the engine was turned off This one hour engine-off duration
was the ldquohot soakrdquo period The total test time is 1 hour and 48 minutes
Figure 12 shows results from the 9 psi E0 fuel test on Vehicle 204 The horizontal axis is test
time in minutes and the vertical axis is the HC mass measured in the RL-SHED during the test
period
The engine was shut off at the end of the second LA92 drive cycle (~48 minutes) and the
analysis system continued to measure the HC emissions in the SHED for the next 60 minutes
This represented the ldquohot soakrdquo portion of the test
0
50
100
150
200
250
300
0 20 40 60 80 100 120
Co
rre
cte
d T
ota
l F
ue
l C
um
ula
tiv
e P
erm
ea
tio
n -
mg
Test Time - minutes
Running Loss and Hot SoakVehicle 204 - 1999 Honda Accord - 9 psi E0 Fuel
Test 25668
Running Loss Hot Soak
Running Loss Std =005 gmiThis Test = 0010 gmi
RL = 249 mghr
2774
2332
Tru HS = 442
1990
The ldquoTruerdquo Hot Soak
The traditional hot soak is determined from the increase in SHED emissions as measured for one
hour following a prescribed drive to heat up the vehicle (2 LA-92 cycles during the Running
Loss Test) Hot soak emissions however have two components that caused by the elevated
temperature resulting from the drive and that resulting from one hour of static permeation
Figure 12 ndash Running Loss Test Results
17
To separate these two components and determine the ldquotruerdquo hot soak emissions the following
procedure was used ldquoTraditionalrdquo hot soak emissions were first calculated by subtracting the
ldquostart of hot soakrdquo cumulative SHED hydrocarbon value (ie 199 mg t = 48 minutes) from
the final cumulative SHED hydrocarbon value (ie 2774 mg t = 108 min) This resulted in a
cumulative SHED hydrocarbon value of 78 mg for the 1 hour hot soak The previously
determined static permeation value (ie 338 mg for a 1 hour hot soak test- see Figure 9) was
then subtracted to arrive at the ldquotruerdquo hot soak value of 442 mg The increase in the permeation
rate (the ldquohot soak effectrdquo) caused by the increase in the system temperature is accounted for by
subtracting the ldquostabilized permeation raterdquo at 86degF
In Figure 12 the static permeation rate is superimposed as a solid blue line on the plot from the
starting point of the hot soak until its end (one hour) While the ldquotraditionalrdquo hot soak would be
calculated as 78 mg (277 mg ndash 199 mg) the ldquotruerdquo hot soak is determined as 442 mg (2774 mg
ndash 2332 mg) True hot soak values reported here were determined in this manner
Diurnal Test
Diurnal permeation was determined by subjecting the vehicle to a three-day period in a
temperature controlled SHED while continuously recording the total hydrocarbon every 30
seconds The SHED environmental temperature was varied from 65degF to 105degF per the
California Diurnal Test protocol Canister vent losses were isolated from permeation emissions
using the technique previously described The vehiclersquos carbon canister fresh air vent was
connected to the outside of the RL-SHED using a leak-tight PTFEreg
hose connected to a small
carbon ldquotraprdquo canister located on a top-loading precision scale The scale precision was 001
grams (10 milligrams) and it was purged before each test
DISCUSSION OF TEST RESULTS
Results
Emission results are presented below by ldquomechanism11
rdquo with the data averaged for the five
ldquoenhancedrdquo and the two ldquonear zerordquo vehicles The lone ldquopre-enhancedrdquo vehicle the 1996 Ford
Taurus (202) was a special case and will be discussed in a separate section Two of the vehicles
the 2001 Dodge Caravan (207) and the 2004 Toyota Camry (211) were also subjected to limited
testing with an ldquoimplanted leakrdquo (a 0020rdquo dia hole in a special tank gas cap) to investigate the
magnitude of a known leak These results (ldquoLeakersrdquo) follow the discussion on the Taurus
Static Permeation Rate (Constant Temperature (86degF)) - Average permeation rate compared
by fuel specification for two vehicle groups ldquoenhancedrdquo and the ldquonear zerordquo evaporative
emissions
11 The ldquomechanismsrdquo are 1 Permeation 2 Tank Venting (Daily Temperature Rise) and 3 Leaks
18
0
10
20
30
40
50
60
Co
rrecte
d P
erm
eati
on
Rate
-m
gh
r
Fuel
Static Permeation Rate - All FuelsE77-2 Program Vehicles
7 E0 9 E2010 E107 E109 E0 7 E0 9 E2010 E107 E109 E0
Enhanced(5 veh)
Near Zero(2 veh)
Figure 13 presents the static permeation rate performance for the average of the 5 ldquoenhancedrdquo
and 2 ldquonear zerordquo vehicles on the five fuels included in the test program Each group is ordered
from left to right by ethanol level The vertical scale is the average permeation rate in mghour
for the static (86degF constant temperature) test
Previous studies1213
had shown that vehicles operated on the fuel containing 10 vol- ethanol
would have higher permeation rates compared to those resulting from operation on a non-ethanol
(E0) fuel of similar properties We also expected that vehicles using higher vapor pressure fuel
would exhibit increased permeation levels at similar ethanol levels Other studies had reported
mixed results when comparing E20 permeation rates against E10 measurements ndash some were
higher and some were lower The difference may have been within the repeatability of the
measurements and probably suffered from a limited number of observations These mixed
results are present in this testing of the enhanced vehicles however the E20 (violet bar) is higher
on average for static permeation rate for the Near Zero group The data that were used to
construct the averages in Figure 13 are listed in Table 3 below There is significant variability in
the test results and the limited sample size precludes making conclusive statements with
statistical confidence
12 CRC E-653 Fuel Permeation from Automotive Systems E0 E6 E10 E20 and E85 December 2006 13
CRC E-77 Vehicle Evaporative Emission Mechanisms A Pilot Study June 2008
Figure 13 ndash Static Permeation Rate Comparison
19
Table 3
Vehicle ID Technology 7psi E0 9 psi E0 7 psi E10 10 psi E10 9 psi E20
204
1999 Honda Enhanced 129 338 664 843 553
Accord
205
2001 Toyota Enhanced 99 195 596 416 462
Corolla
207
2001 Dodge Enhanced 401 325 644 787 882
Caravan
214
2004 Ford Enhanced 252 107 239 244 168
Escape
215
2004 Toyota Enhanced 87 85 122 104 193
Highlander
194 210 453 479 452
211
2004 Toyota Near Zero 91 101 94 199 558
Camry XLE
212
2006 Ford Near Zero 09 32 218 106 47
Taurus
50 67 156 153 303
Static Permeation Rate - mghr
CRC E-77-2 Program - Static Permeation Results
Enhanced Averages
Near Zero Averages
Summary ndash Static permeation rate increased with increase in ethanol level Three of the 5
enhanced emission vehicles did not show an increase in permeation rate when tested with the 9
psi E0 compared to the 7 psi E0
20
Dynamic (Running Loss) Permeation - In a similar presentation Figure 14 shows the average
ldquoRunning Lossrdquo permeation rate for the vehicle types and the fuels tested ldquoRunning Lossrdquo
permeation as described here is the permeation measured during a ldquocold startrdquo 48 minute drive in
a Running-Loss SHED (RL-SHED) at 86degF
0
50
100
150
200
250
300
350
400
7E0 9E0 7E10 10E10 9E20 7E0 9E0 7E10 10E10 9E20
Co
rre
cte
d R
un
nin
g L
os
s P
erm
ea
tio
n -
mg
hr
Fuel
Running Loss Permeation Rate - All FuelsE77-2 Program Vehicles
Enhanced(5 vehs)
Near Zero(2 vehs)
The dynamic permeation rates for the enhanced vehicles (left panel) followed a similar pattern as
the static permeation The average of the E20 fuel was the highest of the average values
observed on both the enhanced and the near-zero vehicles (left and right panels respectively)
Table 4 below shows the data used to generate the averages used in Figure 14
Figure 14 ndash Running Loss Permeation Comparison
21
Table 4
Vehicle ID Technology 7psi E0 9 psi E0 7 psi E10 10 psi E10 9 psi E20
204
1999 Honda Enhanced 2226 2492 2879 3164 2720
Accord
205
2001 Toyota Enhanced 671 1031 2328 1916 1697
Corolla
207
2001 Dodge Enhanced 8425 8339 8122 8581 10282
Caravan
214
2004 Ford Enhanced 363 967 1057 1331 1394
Escape
215
2005 Toyota Enhanced 797 811 979 719 1025
Highlander
2496 2728 3073 3142 3424
211
2004 Toyota Near Zero 1046 837 563 1383 4106
Camry XLE
212
2006 Ford Near Zero 1845 1158 2012 1489 1168
Taurus
1446 998 1288 1436 2637
Enhanced Averages
Near Zero Averages
CRC E-77-2 Program - Running Loss Permeation Results
Running Loss Permeation Rate - mghr
Summary ndash The dynamic permeation rate (measured during vehicle operation) was higher with
the E10 fuel compared to E0 for the enhanced vehicles The E20 permeation rate was higher
than E0 and the E10 fuel The small sample size and limited data precludes us from making
statements about statistical confidence but this may indicate a trend The near zero vehicle
average increased as the ethanol level increased Trends with volatility were mixed or
inconclusive
22
Hot Soak (ldquoTrue Hot Soakrdquo) Permeation ndash The Hot Soak emissions as defined in this report
are the net increase in permeation rate following vehicle operation We measured the mass
increase in the SHED for one hour immediately following vehicle operation and subtracted the
previously measured static (or normal) permeation at the same temperature While this is not the
traditional Code of Federal Regulations (CFR) definition we feel it is appropriate for the intent
of this project
0
10
20
30
40
50
60
70
7E0 9E0 7E10 10E10 9E20 7E0 9E0 7E10 10E10 9E20
Co
rre
cte
d H
ot
So
ak
Pe
rme
ati
on
-m
gh
r
Fuel
True Hot Soak Permeation Rate - All FuelsE77-2 Program Vehicles
Enhanced(5 vehs)
Near Zero(2 vehs)
The ldquoTrue Hot Soakrdquo performance for the average of the Enhanced Vehicles is summarized in
Figure 15 above There was a large increase in the hot soak value with the E10 fuel compared to
the E0 The hot soak value with the E20 fuel was comparable to the E0 results and lower than
the E10
The Near Zero vehicles (2) had zero hot soak emissions when tested on the 10 psi E10 fuel
(Figure 16) With only two vehicles and the very low levels attained no statistically significant
conclusions can be drawn from the data available Table 5 presents the individual tests used in
calculating the average values plotted in Figure 15
Figure 15 ndash True Hot Soak Permeation Comparison
23
Table 5
Vehicle ID Technology 7psi E0 9 psi E0 7 psi E10 10 psi E10 9 psi E20
204
1999 Honda Enhanced 187 443 297 04 134
Accord
205
2001 Toyota Enhanced 00 10 719 295 603
Corolla
207
2001 Dodge Enhanced 00 58 1222 2377 00
Caravan
214
2004 Ford Enhanced 33 521 329 574 560
Escape
215
2005 Toyota Enhanced 225 251 00 16 00
Highlander
89 257 513 653 259
211
2004 Toyota Near Zero 07 153 138 00 00
Camry XLE
212
2006 Ford Near Zero 18 04 00 00 49
Taurus
13 79 69 00 25
CRC E-77-2 Program - True Hot Soak Permeation Results
True Hot Soak Permeation Rate - mghr
Near Zero Averages
Enhanced Averages
Summary - The True Hot Soak permeation (permeation rate measured following vehicle
operation less the static constant temperature permeation rate) rate was higher with the E10 fuel
compared to E0 for the enhanced vehicles The E20 permeation rate was higher than E0 and
lower than the E10 fuel The near zero vehicle trends with both ethanol content and volatility
were mixed or inconclusive The small sample size and limited data precludes us from making
statements about statistical confidence
24
Diurnal Permeation Performance ndash Figure 16 presents the diurnal permeation results for the
first day of the three-day diurnal test (65deg to 105degF)
0
200
400
600
800
1000
1200
7E0 9E0 7E10 10E10 9E20 7E0 9E0 7E10 10E10 9E20
Co
rre
cte
d F
ue
l D
iurn
al
Pe
rme
ati
on
-m
gs
da
y
Day 1 Diurnal Permeation RatesAverages from E-77-2 Vehicles
Fuel
Enhanced(5 vehs)
Near Zero(2 vehs)
The average day 1 diurnal permeation for the five Enhanced Vehicles tended to increase as
ethanol content increased (with the exception of the E20 fuel) Again sample size and limited
data makes statistical conclusions inappropriate Table 6 presents the individual test used to
generate the averages used in Figure 16 The table includes the data from days 2 and 3 The
ethanol content of the diurnal measurements was calculated and appear in a series of figures in
the Appendix starting at page 37 Unlike Figure 16 the figures shown in the appendix have not
been corrected to exclude the non-fuel emissions (methanol and refrigerant) that were present
during these tests
Figure 16 ndash Day 1 Diurnal Permeation Comparison
25
Table 6
Vehicle ID Technology 7psi E0 9 psi E0 7 psi E10 10 psi E10 9 psi E20
204 Day 1 3672 6283 12601 15479 11034
1999 Honda Enhanced Day 2 2877 5810 11652 17799 9581
Accord Day 3 2936 5770 11653 17711 9812
205 Day 1 3830 4995 17834 17941 17752
2001 Toyota Enhanced Day 2 3654 4810 17150 17309 16900
Corolla Day 3 3670 5072 15239 17417 16802
207 Day 1 3975 4064 10865 14064 15480
2001 Dodge Enhanced Day 2 3026 3373 8120 12644 13702
Caravan Day 3 2689 3080 8236 12237 13605
214 Day 1 4943 4559 5242 4920 4709
2004 Ford Enhanced Day 2 3190 3585 3974 8394 4400
Escape Day 3 2815 11017 3944 113738 7518
215 Day 1 2483 2021 2247 3192 4168
2004 Toyota Enhanced Day 2 2941 1659 2317 2602 4148
Highlander Day 3 2888 1763 2675 2370 4506
3781 4384 9758 11119 10629
211 Day 1 2071 1303 2438 3370 2840
2004 Toyota Near Zero Day 2 1002 1158 1838 2268 2218
Camry XLE Day 3 874 1006 1843 2179 2034
212 Day 1 1016 1005 1848 1243 1310
2006 Ford Near Zero Day 2 712 708 1002 879 833
Taurus Day 3 570 574 758 1028 750
1544 1154 2143 2307 2075
CRC E-77-2 Program Results - Diurnal Permeation
Diurnal Permeation Rate - mgday
Enhanced Averages
Near Zero Averages
Carbon Canister Breakthrough ndash Canister breakthrough is measured by the weight change
recorded for the trap canister outside the SHED It quantifies the amount of vapors that
overwhelm the evaporative system storage canister Figure 17 displays the breakthrough
resulting from testing of 9 psi E0 fuel Only four of seven vehicles exhibited breakthrough
60
65
70
75
80
85
90
95
100
105
110
0
5
10
15
20
25
30
35
40
0 10 20 30 40 50 60 70
SH
ED
Te
mp
era
ture
-d
eg
F
Bre
ak
thro
ug
h -
mg
Test Time - hrs
Canister Breakthrough9 psi E0 Fuel - 65ordm to 105ordm F Diurnal
204 - 1999 Honda Accord
211 - 2004 Toyota Camry
215 - 2004 Toyota Highlander
205 - 2001 Toyota Corolla
Figure 17 ndashDiurnal Canister Breakthrough
26
Table 7 shows the breakthrough generated during the diurnal tests conducted
Table 7
Vehicle ID Technology 7psi E0 9 psi E0 7 psi E10 10 psi E10 9 psi E20
204 Day 1 --- 24 --- 310 ---
1999 Honda Enhanced Day 2 --- 136 --- 360 ---
Accord Day 3 --- 198 --- 360 ---
205 Day 1 --- --- --- 204 ---
2001 Toyota Enhanced Day 2 --- --- --- 309 ---
Corolla Day 3 --- 26 --- 293 ---
207 Day 1 --- --- --- --- ---
2001 Dodge Enhanced Day 2 --- --- --- --- ---
Caravan Day 3 --- --- --- --- ---
214 Day 1 --- --- --- --- ---
2004 Ford Enhanced Day 2 --- --- --- --- ---
Escape Day 3 --- --- --- 49 ---
215 Day 1 --- --- --- --- ---
2004 Toyota Enhanced Day 2 --- 02 --- --- ---
Highlander Day 3 --- 72 --- --- ---
211 Day 1 --- --- --- --- ---
2004 Toyota Near Zero Day 2 --- 129 --- 191 ---
Camry XLE Day 3 --- 176 --- 289 ---
212 Day 1 --- --- --- --- ---
2006 Ford Near Zero Day 2 --- --- --- --- ---
Taurus Day 3 --- --- --- 204 ---
CRC E-77-2 Program - Carbon Canister Diurnal Breakthrough Results
Diurnal Breakthrough - grams
Summary ndash The lack of canister breakthrough for the 7 psi fuels (summer grade) indicates that
the storage capacity of the seven systems tested is appropriately sized Breakthrough began to
appear when testing of 9 psi E0 fuel (not summer grade) and was more prevalent with the 10 psi
E10 fuel (winter grade) The lack of breakthrough with the 9 psi E20 fuel seems to be an
anomaly
27
Overall Trend Summary - The following chart (Figure 18) visually summarizes the trends seen
from all testing performed during this program
Higher Volatility E0 to E10 E0 to E20 E10 to E20
uarr uarr uarr uarr
Higher Volatility E0 to E10 E0 to E20 E10 to E20
uarr uarr uarr uarr
Higher Volatility E0 to E10 E0 to E20 E10 to E20
uarr uarr uarr uarr
Higher Volatility E0 to E10 E0 to E20 E10 to E20
uarr uarr uarr uarr
Higher Volatility E0 to E10 E0 to E20 E10 to E20
uarrharr uarr uarr uarr
Higher Volatility E0 to E10 E0 to E20 E10 to E20
uarr uarr uarr uarr
Higher Volatility E0 to E10 E0 to E20 E10 to E20
uarr darr darr
Higher Volatility E0 to E10 E0 to E20 E10 to E20
uarr uarr uarr harr
Ethanol Content
Diurnal
Trend Analysis for E-77-2 Program
Ethanol Content
Static Permeation
Ethanol Content
Running Loss Permeation
Ethanol Content
Ethanol Content
Diurnal
Enhanced Vehicles (Sample of 5)
Static Permeation
Ethanol Content
Ethanol Content
Running Loss Permeation
Ethanol Content
True Hot Soak (TEFVO)
Near-Zero Vehicles (Sample of 2)
True Hot Soak (TEFVO)
Figure 18 Trend Analysis Summaries
28
Vehicle 202 ndash 1996 Ford Taurus - Special Case
We have treated vehicle 202 as a special case This was the oldest of the vehicles tested and had
been subjected to limited exhaust emission tests with a 20-volume percent ethanol fuel (E20)
during the CRC E-74b test program
Vehicle 202 completed the E10 portion of the test program (10 and 7 psi fuels) successfully and
completed the road preconditioning on the E0 fuel prior to the E0 evaluations The first test on
the E0 fuel was excessively high indicating a fuel leak It was traced to a leaky fuel injector o-
ring and there was considerable discussion as to an appropriate repair Tests were made on the 9
and the 7 psi E0 fuel to measure the magnitude of a vehicle in a ldquoleakrdquo condition and the tests
were labeled as ldquo202L (Leak)rdquo The fuel injector o-rings were replaced as a complete set and
the vehicle resumed testing as ldquo202Rrsquo (Repaired) A new elusive vapor leak was present later
identified as a very small leak at the top of the fuel fill pipe
The circle on Figure 19 at the right shows
the location of the small leak This leak
was problematic as to its effect on the
emission measurements because its
magnitude or presence seemed to depend
on the torque exerted on the fuel cap The
tests on the E0 fuels (9 and 7 psi) are
noted as 202R but with a vapor leak
We attempted to fix this leak and repeated
the E10 test with the vehicle re-identified
as 216 with reasonable results We also
ran the E20 test sequence and declared the
vehicle done
The testing history for this vehicle is shown in Tables 8 (Static) 9 (Dynamic) and 10 (Diurnal)
The tests highlighted in yellow are those that exhibited a liquid or vapor leak as identified during
the static test leak validation
Figure 19 ndash Vehicle 202 Fuel Fill Pipe Leak
29
Table 8
Static Permeation Results 1996 Ford Taurus SHED
Corrected Results Canister
Fuel Permeation mgday Loss
Veh psiEtOH Test Type Date Test mghr (Corrected) g
202 100E10 Static Perm 071807 7018 345 000
Press Incr 00 No Leak
Prs+Fuel Incr 00
202 70E10 Static Perm 082107 7031 223 000
Press Incr 00 No Leak
Prs+Fuel Incr 00
202L 90E0 Static Perm 030408 7169 2292 000
Press Incr DNA
Prs+Fuel Incr 4921 Liquid Leak
202L 70E0 Static Perm 032008 7183 2991 000
Press Incr DNA
Prs+Fuel Incr 19896 Liquid Leak
202R 90E0 Static Perm 050808 7228 178 000
Press Incr 136 Vapor Leak
Prs+Fuel Incr 00
202R 70E0 Static Perm 052208 7239 204 000
Press Incr 380 Vapor Leak
Prs+Fuel Incr 00
216 100E10 Static Perm 081408 7299 324 000
Press Incr 00 No Leak
Prs+Fuel Incr 00
216 70E10 Static Perm 091708 7326 325 000
Press Incr 00 No Leak
Prs+Fuel Incr 00
216 90E20 Static Perm 103008 7363 204 000
Press Incr 00 No Leak
Prs+Fuel Incr 00
30
Table 9
Dynamic Permeation Results 1996 Ford Taurus SHED
Corrected Results Canister From
Fuel Permeation mgday Loss Static
Veh psiEtOH Test Type Date Test mghr (Corrected) g Test
202 100E10 Dynamic RL 072007 25662 1278 000 No Leak
TEFVO 386 000
202L 90E0 Dynamic RL 030508 25695 3870 000 Liquid Leak
TEFVO 00 000
202L 70E0 Dynamic RL 032408 25699 7269 000 Liquid Leak
TEFVO 00 000
202R 90E0 Dynamic RL 050908 25704 1091 000 Vapor Leak
TEFVO 50 000
202R 70E0 Dynamic RL 052308 25706 787 000 Vapor Leak
TEFVO 00 000
216 100E10 Dynamic RL 081508 25718 1742 000 No Leak
TEFVO 14 000
216 70E10 Dynamic RL 091808 25721 1683 000 No Leak
TEFVO 423 000
216 90E20 Dynamic RL 110708 25730 543 000 No Leak
TEFVO 00 000
31
Table 10
Diurnal Permeation Results 1996 Ford Taurus SHED
Corrected Results Canister From
Fuel Permeation mgday Loss Static
Veh psiEtOH Test Type Date Test mghr (Corrected) g Test
202 100E10 72 DHB 65-105 073107 7023
Day 1 10429 612 No Leak
Day 2 7069 3264
Day 3 7043 3869
202 70E10 72 DHB 65-105 082807 7034
Day 1 6278 000 No Leak
Day 2 5065 000
Day 3 4535 000
202L 90E0 72 DHB 65-105 031108 7173
Day 1 22589 000 Liquid Leak
Day 2 32310 000
Day 3 23069 1260
202L 70E0 72 DHB 65-105 040108 7196
Day 1 47425 000 Liquid Leak
Day 2 44517 000
Day 3 31798 000
202R 90E0 72 DHB 65-105 051308 7230
Day 1 3270 000 Vapor Leak
Day 2 2667 000
Day 3 2746 1083
202R 70E0 72 DHB 65-105 052808 7243
Day 1 2117 000 Vapor Leak
Day 2 2208 000
Day 3 2081 000
216 100E10 72 DHB 65-105 082008 7305
Day 1 25907 5777 No Leak
Day 2 34779 6299
Day 3 36014 6343
216 70E10 72 DHB 65-105 092308 7331
Day 1 3975 022 No Leak
Day 2 3550 006
Day 3 3621 037
216 90E20 72 DHB 65-105 111108 7373
Day 1 4685 000 No Leak
Day 2 4526 000
Day 3 4198 000
32
The Implanted Leak Test Results
Project E-77-2 included evaluating two vehicles with implanted leaks This interest followed the
information gathered in the Pilot Study where tests were run with a specially modified fuel cap
containing a 002rdquo dia hole The results with the implanted leak from the Pilot Study are
repeated in Table 11 below as the diurnal results are shown for a 1996 Chevrolet Cavalier first
without the implanted leak at 038 grams per day and then at 207 grams per day (a 54x
increase) with the leak
Table 11
Veh No
Evap
Tech Fuel
Results
gmsday
gms
Increase
6 1996 Chevrolet Cavalier Enhanced 7 psi E0 038
7 2070 2032
207 2001 Dodge Caravan Enhanced 7 psi E10 109
207L 213 104
211 2004 Toyota Camry LE Near Zero 7 psi E10 024
211L 068 044
- Implanted 020 leak in fuel cap
Vehicle Description
Implanted Leak Impact on Diurnal PermeationDay One Results 65deg - 105degF Diurnal
The two E-77-2 vehicles (207 amp 211) were given a limited evaluation with an induced leak and
saw a significantly lesser impact Vehicle 207 gave diurnal results increases from 109 to 213
grams per day (a 2x increase) and Vehicle 211 increased from 024 grams per day to 068 grams
per day (a 28x increase) The following Figure 20 displays the imbedded leak impact from Table
11
33
0
5
10
15
20
On
e D
ay
Diu
rna
l P
erm
ea
tio
n -
gm
sd
ay
Vehicle Number
Implanted Leak Impact on One Day Diurnal Permeation020 Leak in Fuel Cap - 65 to 105 F Diurnal
207L 211L21120776
As Received - No Leak
020 Fuel Cap Leak
The newer vehicles evaluated in this phase of the study were configured and certified to the
Onboard Refueling Vapor Regulations (ORVR) These are capable of containing 95 or more
control of the refueling vapors at up to 10 gallons per minute fueling rate Where the Chevrolet
Cavalier had a small (0055rdquo dia) orifice and a long vapor tube venting the tankrsquos vapor space to
the carbon canister (and then to the atmosphere) the ORVR compliant vehicles have a large
(0688rdquo ID) short vent hose to a low flow restriction carbon canister
The following bar charts (Figures 21 through 24) show the impacts of the leak on all phases of
the evaporative testing performed and compare those results with all fuels tested With only two
vehicles (207 and 211) evaluated on two fuels statistically significant effects cannot be
quantified but the trend of increased emissions is apparent
Figure 20 ndash Implanted Leak Impact
34
0
20
40
60
80
100
120
140
160
7E0 9E0 7E10 10E10 9E20 7E0 9E0 7E10 10E10 9E20
Sta
tic
Pe
rme
ati
on
-m
gh
r
Fuel
0020 dia Induced Leak EffectStatic Permeation
Vehicle 211Vehicle 207
Leak
Leak
0
200
400
600
800
1000
1200
7E0 9E0 7E10 10E10 9E20 7E0 9E0 7E10 10E10 9E20
Ru
nn
ing
Lo
ss
Pe
rme
ati
on
-m
gh
r
Fuel
0020 dia Induced Leak EffectRunning Loss Permeation
Vehicle 211Vehicle 207
Leak
Leak
Figure 21 ndash Vehicles 207 and 211 with Induced Leak - Static
Figure 22 ndash Vehicles 207 and 211with Induced Leak ndash Running Loss
35
0
100
200
300
400
500
600
700
7E0 9E0 7E10 10E10 9E20 7E0 9E0 7E10 10E10 9E20
Tru
e H
ot S
oa
k P
erm
ea
tio
n -
mg
hr
Fuel
0020 dia Induced Leak EffectTrue Hot Soak Permeation
Vehicle 211Vehicle 207
Leak
Leak
0
500
1000
1500
2000
2500
7E0 9E0 7E10 10E10 9E20 7E0 9E0 7E10 10E10 9E20
Da
y 1
Diu
rna
l P
erm
ea
tio
n -
mg
da
y
Fuel
0020 dia Induced Leak EffectDay 1 Diurnal Permeation
Vehicle 211Vehicle 207
Leak
Leak
Figure 24 ndash Vehicles 207 and 211 with Induced Leak - Diurnal
Figure 23 ndash Vehicles 207 and 211 with Induced Leak ndash True Hot Soak
36
Summary of Findings and Results
The E-77-2 test program was a continuation of the previously published E-77 test project and
added eight vehicles tested on five fuels to the knowledge base The permeation trends
previously shown were again present The small sample size and limited number of tests
preclude making statements about statistical validity but in general
o The newer vehicle groups had lower emissions
o Adding ethanol to the fuel increased permeation over the non-oxygenated levels
o Increased volatility increased permeation levels
o SHED emission rates must be corrected for the ethanol error in the FID and the
non-fuel methanol and refrigerant in the measurement
As this test program evolved and additional experience was gathered two program modifications
were made 1) The leak validation methodology was changed and 2) a different metric and
definition of the ldquoHot Soakrdquo was adopted
The leak validation portion of the static permeation test was found to be very sensitive and when
the data was corrected on a minute-by-minute basis for ethanol methanol and refrigerant the
change in apparent permeation rate was due as much to variation as to leaks See the discussion
starting at page 12 for the details of the development
Concern for and recognition of ldquoHot Soakrdquo emissions started in the original evaporative emission
regulations Carburetors had float bowls with ~ 50 ml of fuel that absorbed the latent engine heat
after the vehicle was shut down after operation The heat would cause the bowl temperature to
increase driving fuel vapors out through vents and leak paths to the atmosphere after vehicle
operation Todayrsquos fuel injection engines do not have the open bowls and the emission rates
following vehicle operation are mainly increased temperature permeation We recommended
and adopted a new name for the ldquotemporary emissions following vehicle operationrdquo (TEFVO)
which subtracts the basic permeation rate from the measured emissions See the discussion
starting at page 16 for details
37
Appendix
Acknowledgements
E-77-2 Steering Committee
David Brzezinski EPA
Kevin Cullen GM Powertrain
Dominic DiCicco Ford Motor Company
King D Eng Shell Global Solutions
Ben Hancock CARB
Constance Hart EPA
Phil Heirigs Chevron Global Downstream
Jeff Jetter Honda RampD Americas
Keith KnollNREL
John Koupal EPA
David H Lax API
Jeff Long CARB
Hector Maldonado CARB
Mani Natarajan Marathon Oil Company
David N Patterson Mitsubishi Motors RampD Americas
Jenny Sigelko Chrysler
James P UihleinChevron Global Downstream
Marie Valentine Toyota Technical Center
Kenneth J Wright ConocoPhillips
CRC Members
Brent Bailey CRC
Chris Tennant CRC
Jane Beck CRC
38
Table 12
E0 E10 E20
Inspection Units Fuel 6 Fuel 7 Fuel 4
API Gravity degAPI 602 585 570
Relative Density 6060degF 07382 07447 07508
DVPE psi 701 730 849
Oxygenates--D4815
MTBE vol 000 000 000
ETBE vol 000 000 000
EtOH vol 000 954 2034
O2 wt 000 353 747
Hydrocarbon Composition
Aromatics vol 221 244 108
Olefins vol 80 88 55
Saturates vol 700 573 234
D86 Distillation
IBP degF 974 1040 1022
5 Evaporated degF 1316 1280 1252
10 Evaporated degF 1423 1330 1314
20 Evaporated degF 1564 1410 1413
30 Evaporated degF 1704 1450 1486
40 Evaporated degF 1840 1530 1547
50 Evaporated degF 1975 1950 1596
60 Evaporated degF 2120 2190 1636
70 Evaporated degF 2305 2410 2274
80 Evaporated degF 2588 2710 2695
90 Evaporated degF 3139 3170 3139
95 Evaporated degF 3322 3300 3255
EP degF 3603 3600 3406
Recovery vol 978 978 983
Residue vol 13 10 10
Loss vol 09 12 07
Driveability Index 11199 11015 9898
Data from CRC E-74
CRC E-77-2 Fuel Inspection Results
39
Fuel Units Fuel 6 Fuel 7 Fuel 4
Sulfur Content ppm 29 27 27
Estimated CH Ratio 62090 63323 63252
Est Net Heat of Combustion btulb 18573 18514 18513
Benzene vol 090 100 096
Research Octane Number 932 940 946
Motor Octane Number 838 838 834
(R+M)2 885 889 890
Fuel Units Fuel 6 Fuel 7 Fuel 4
Aromatics vol 2386 2481 2178
Olefins vol 752 892 1074
Saturates vol 6743 5621 4623
Unclassified vol 115 086 015
Ethanol vol 000 920 2111
Benzene vol 089 106 097
CH Ratio 6200 6092 5835
Oxygen wt 0008 1 340 773
Net Heat of Combustion btulb 18703 18016 17160
1 Contains 004 vol MTBE
Fuel Units Fuel 6 Fuel 7 Fuel 4
Oxygen wt 0008 3396 7733
C+H wt 9999 9660 9227
H wt 1389 1362 1350
C wt 8610 8298 7877
Fuel Units 6 7 4
Haltermann D3338 Btulb 18573 18514 18513
Average D3338 Btulb 18579 18514 18491
Oxygen Corrected D3338 Btulb 18579 17860 17103
DHA Btulb 18703 18016 17160
Table 12 (cont)
Suppliers Additional Inspections
Net Heat of Combusion -- Btulb
Carbon Hydrogen and Oxygen
Detailed Hydrocarbon Analysis
40
Vehicle Day 1 Day 2 Day 3
No Fuel Base + Press + Pump RL True HS Perm (Brkthru) Perm (Brkthru) Perm (Brkthru)
E10 - 10 psi 345 --- --- 1278 503 10429 (63) 7069 (348) 7043 (425)
E10 - 7 psi 223 --- --- 994 113 6278 (00) 5065 (00) 4535 (00)
E0 - 9 psi 2229 --- 4921 3870 00 22580 (00) 32310 (00) 23069 (126)
E0 - 7 psi 2991 --- 19896 7269 00 47425 (00) 44517 (00) 31798 (00)
E10 - 10 psi 843 --- --- 3164 04 15479 (310) 17799 (383) 17711 (419)
E10 - 7 psi 664 --- --- 2879 297 12601 (00) 11652 (00) 11653 (00)
E0 - 9 psi 338 --- --- 2492 443 6283 (24) 5810 (136) 5770 (225)
E0 - 7 psi 129 --- --- 2226 187 3672 (00) 2877 (00) 2936 (00)
E20 - 9 psi 553 --- --- 2720 134 11034 (00) 9581 (00) 9812 (00)
E10 - 10 psi 416 --- --- 1916 295 17941 (204) 17309 (346) 17417 (375)
E10 - 7 psi 596 --- --- 2328 719 17834 (00) 17150 (00) 15239 (00)
E0 - 9 psi 195 --- --- 1031 10 4995 (00) 4810 (00) 5072 (26)
E0 - 7 psi 99 --- --- 671 00 3830 (00) 3654 (00) 3670 (00)
E20 - 9 psi 462 --- --- 1697 603 17752 (00) 16900 (00) 16802 (00)
E10 - 10 psi 787 --- --- 8581 2377 14064 (00) 12644 (00) 12237 (00)
E10 - 7 psi 644 --- --- 8122 1222 10865 (00) 8120 (00) 8236 (00)
E0 - 9 psi 325 --- --- 8339 58 4064 (00) 3373 (00) 3080 (00)
E0 - 7 psi 401 --- --- 8425 00 3975 (00) 3026 (00) 2689 (00)
E20 - 9 psi 882 --- --- 10282 00 15480 (00) 13702 (00) 13605 (00)
E10 - 10 psi 976 --- 1209 10012 3929 16449 (00) NA NA
E10 - 7 psi 1468 --- --- 11393 5850 21342 (00) NA NA
E10 - 10 psi 199 --- --- 1383 00 3370 (00) 2268 (191) 2179 (330)
E10 - 7 psi 94 266 --- 563 138 2438 (00) 1838 (00) 1843 (00)
E0 - 9 psi 101 --- --- 837 153 1303 (00) 1158 (129) 1006 (221)
E0 - 7 psi 91 --- --- 1046 07 2071 (00) 1002 (00) 874 (00)
E20 - 9 psi 558 --- --- 4106 00 2840 (00) 2218 (00) 2034 (00)
E10 - 10 psi 551 --- 821 3024 2450 25454 (040) NA NA
E10 - 7 psi 481 --- 1664 2511 62 6783 (00) NA NA
E10 - 10 psi 106 --- --- 1489 00 1243 (00) 879 (00) 1028 (200)
E10 - 7 psi 218 --- --- 2012 00 1848 (00) 1002 (00) 758 (00)
E0 - 9 psi 32 --- --- 1158 04 1005 (00) 708 (00) 574 (00)
E0 - 7 psi 09 --- --- 1845 18 1016 (00) 712 (00) 570 (00)
E20 - 9 psi 47 --- --- 1168 49 1310 (00) 833 (00) 750 (00)
E10 - 10 psi 244 --- --- 1331 574 4920 (00) 8394 (00) 113738 (49)
E10 - 7 psi 239 --- --- 1057 329 5242 (00) 3974 (00) 3944 (00)
E0 - 9 psi 107 --- --- 967 521 4559 (00) 3585 (00) 11017 (00)
E0 - 7 psi 252 --- --- 363 33 4943 (00) 3190 (00) 2815 (00)
E20 - 9 psi 168 --- --- 1394 560 4709 (00) 4400 (00) 7518 (00)
E10 - 10 psi 104 90 --- 719 16 3192 (00) 2602 (00) 2370 (00)
E10 - 7 psi 122 --- --- 979 00 2247 (00) 2317 (00) 2675 (00)
E0 - 9 psi 85 --- --- 811 251 2021 (00) 1659 (2) 1763 (72)
E0 - 7 psi 87 --- --- 797 225 2483 (00) 2941 (00) 2888 (00)
E20 - 9 psi 193 --- --- 1025 00 4168 (00) 4148 (00) 4506 (00)
E10 - 10 psi 324 --- --- 1742 118 25907 (578) 34779 (630) 36014 (643)
E10 - 7 psi 325 --- --- 1683 192 3975 (02) 3550 (01) 3621 (04)
E0 - 9 psi 178 136 --- 1091 254 3270 (00) 2667 (00) 2746 (108)
E0 - 7 psi 204 380 --- 787 00 2117 (00) 2208 (00) 2081 (00)
E20 - 9 psi 204 --- --- 543 74 4685 (00) 4526 (00) 4198 (00)
216
211
2004
Toyota
Camry
XLE
215
2004
Toyota
High-
lander
212
2006
Ford
Taurus
214
2004
Ford
Escape
211L
207L
Static Permeation - mghr Dynamic Perm - mghr
CRC E-77-2 Program Test Results
Diurnal (65ordm to 105ordm) - mgday
202
1996
Taurus
205
2001
Toyota
Corolla
204
1999
Honda
Accord
207
2001
Dodge
Caravan
202L
Table 13
41
Individual Vehicle Diurnal Performance on the Various Fuels
0
1000
2000
3000
4000
5000
6000
0 10 20 30 40 50 60 70
Cu
mu
lati
ve
Pe
rme
ati
on
-m
g
Test Time - hrs
Three Day DiurnalVehicle 204 1999 Honda Accord
10 psi E10
7 psi E10
9 psi E0
7 psi E0
9 psi E20
0
1000
2000
3000
4000
5000
6000
0 10 20 30 40 50 60 70
Cu
mu
lati
ve
Pe
rme
ati
on
-m
g
Test Time - hrs
Three Day DiurnalVehicle 205 - 2001 Toyota Corolla
10 psi E10
7 psi E10
9 psi E0
7 psi E0
9 psi E20
Figure 25 ndash Vehicle 204 Diurnal Performance
Figure 26 ndash Vehicle 205 Diurnal Performance
42
0
500
1000
1500
2000
2500
3000
3500
4000
4500
5000
0 10 20 30 40 50 60 70
Cu
mu
lati
ve
Co
rre
cte
d P
erm
ea
tio
n -
mg
Test Time - hrs
Three Day DiurnalVehicle 207 - 2001 Dodge Caravan
10 psi E10
7 psi E10
9 psi E0
7 psi E0
9 psi E20
0
100
200
300
400
500
600
700
800
900
0 10 20 30 40 50 60 70
Cu
mu
lati
ve
Pe
rme
ati
on
-m
g
Test Time - hrs
Three Day DiurnalVehicle 211 - 2004 Toyota Camry XLE
10 psi E10
7 psi E10
9 psi E0
7 psi E0
9 psi E20
Figure 27 ndash Vehicle 207 Diurnal Performance
Figure 28 ndash Vehicle 211 Diurnal Performance
43
0
50
100
150
200
250
300
350
400
450
500
0 10 20 30 40 50 60 70
Cu
mu
lati
ve
Pe
rme
ati
on
-m
g
Test Time - hrs
Three Day DiurnalVehicle 212 - 2006 Ford Taurus
10 psi E10
7 psi E10
9 psi E0
7 psi E0
9 psi E20
0
500
1000
1500
2000
2500
3000
3500
4000
4500
5000
0 10 20 30 40 50 60 70
Cu
mu
lati
ve
Pe
rme
ati
on
-m
g
Test Time - hrs
Three Day DiurnalVehicle 214 2004 Ford Escape
10 psi E10
7 psi E10
9 psi E0
7 psi E0
9 psi E20
Note The incomplete cumulative results for the 10 psi E10 results resulted from a conflict for the use
of the INNOVA analyzer during the test The INNOVA analyzer is required to correct for the FIDrsquos
ethanol error and the presence of methanol and refrigerant (R-134a) The data was available for the
50+ hour results and the data is valid as shown We have no explanation for the high levels
experienced on the third day of the test No test errors were identified
Figure 29 ndash Vehicle 212 Diurnal Performance
Figure 30 ndash Vehicle 214 Diurnal Performance
44
0
200
400
600
800
1000
1200
1400
1600
0 10 20 30 40 50 60 70
Cu
mu
lati
ve
Pe
rme
ati
on
-m
g
Test Time - hrs
Three Day DiurnalVehicle 215 2004 Toyota Highlander
10 psi E10
7 psi E10
9 psi E0
7 psi E0
9 psi E20
Figure 31 ndash Vehicle 215 Diurnal Performance
45
Table 14
Test Corrected
Vehicle Fuel Total Fuel EtOH R134a Methanol
204 10 psi E10 509899 144040 18298 16754
1999 Honda 7 psi E10 359057 130806 17551 15221
Accord 9 psi E0 178635 13843 18230 9896
7 psi E0 94846 1856 16631 2379
9 psi E20 304271 128408 18261 12143
205 10 psi E10 526659 186599 23354 20895
2001 Toyota 7 psi E10 502229 204246 25990 19198
Corolla 9 psi E0 148775 000 20434 4613
7 psi E0 111536 5489 22408 5619
9 psi E20 514540 212708 25677 19584
207 10 psi E10 389450 196248 12013 30399
2001 Dodge 7 psi E10 272201 114027 11731 19616
Caravan 9 psi E0 105167 1820 12224 15284
7 psi E0 96906 1118 22141 14276
9 psi E20 427882 241488 14268 25432
211 10 psi E10 78164 19733 15159 46970
2004 Toyota 7 psi E10 61190 20211 15929 46525
Camry LE 9 psi E0 34668 1681 14329 42659
7 psi E0 39468 000 16197 57303
9 psi E20 71013 26726 16213 36879
212 10 psi E10 31508 7222 14831 7896
2006 Ford 7 psi E10 36079 10132 15481 3400
Taurus 9 psi E0 22870 2409 15182 3761
7 psi E0 22973 000 15393 4362
9 psi E20 28935 11156 14116 2629
214 10 psi E10 1257887 000 19947 27992
2004 Ford 7 psi E10 131593 24571 16025 8879
Escape 9 psi E0 191611 2940 16487 7213
7 psi E0 109481 5386 80650 3106
9 psi E20 166271 24097 14491 6096
215 10 psi E10 81644 12178 14658 42609
2004 Toyota 7 psi E10 72399 15092 15532 36061
Highlander 9 psi E0 54431 000 14806 25822
7 psi E0 83115 000 14072 26255
9 psi E20 128223 38822 12841 34420
3 Day Diurnal Results
CRC E77-2 Program Diurnal ResultsAll values are in mg
46
0
200
400
600
800
1000
1200
1400
1600
1800
2000
Co
rrecte
d D
aily D
iurn
al
-m
g
Diurnal Ethanol PortionVehicle 204 - 1999 Honda Accord
Ethanol Portion
10 psi E10 9 psi E07 psi E10
1 32
315
341368
383
264273
1 321 321 321 32
9 psi E207 psi E0
1122097
39
0510
442
405412
Figure 32 ndash Vehicle 204 Diurnal Ethanol Portion
0
200
400
600
800
1000
1200
1400
1600
1800
2000
Co
rrecte
d D
aily D
iurn
al
-m
g
Diurnal Ethanol PortionVehicle 205 - 2001 Toyota Corolla
Ethanol Portion
10 psi E10 9 psi E07 psi E10
1 32
359
406
382
431355349
1 321 321 321 32
9 psi E207 psi E0
0 00
712649
406
420414
Figure 33 ndash Vehicle 205 Diurnal Ethanol Portion
47
0
200
400
600
800
1000
1200
1400
1600C
orr
ecte
d D
aily D
iurn
al
-m
g
Diurnal Ethanol PortionVehicle 207 - 2001 Dodge Caravan
Ethanol Portion
10 psi E10 9 psi E07 psi E10
1 32
488
442408
409
490535
1 321 321 321 32
9 psi E207 psi E0
00
1144
27
0101
556
587552
Figure 34 ndash Vehicle 207 Diurnal Ethanol Portion
0
50
100
150
200
250
300
350
400
Co
rrecte
d D
aily D
iurn
al
-m
g
Diurnal Ethanol PortionVehicle 211 - 2004 Toyota Camry XLE
Ethanol Portion
10 psi E10 9 psi E07 psi E10
1 32
264
242245
1 321 321 321 32
9 psi E207 psi E0
329
306356
00
73
64
00
00
00
325
431
370
Figure 35 ndash Vehicle 211 Diurnal Ethanol Portion
48
0
20
40
60
80
100
120
140
160
180
200C
orr
ecte
d D
aily D
iurn
al
-m
g
Diurnal Ethanol PortionVehicle 212 - 2006 Ford Taurus
Ethanol Portion
10 psi E10 9 psi E07 psi E10
1 32
216
170
316
1 321 321 321 32
9 psi E207 psi E0
194
288
436 102
105
85
00
00
00476
529
243
Figure 36 ndash Vehicle 212 Diurnal Ethanol Portion
0
200
400
600
800
1000
1200
Co
rrecte
d D
aily D
iurn
al
-m
g
Diurnal Ethanol PortionVehicle 214 - 2004 Ford Escape
Ethanol Portion
10 psi E10 9 psi E07 psi E10
1 32
00
1 321 321 321 32
9 psi E207 psi E0
201
202152
38
05
19
56
1469
103
171188
143
67
11275
Figure 37 ndash Vehicle 214 Diurnal Ethanol Portion
49
0
50
100
150
200
250
300
350
400
450
500C
orr
ecte
d D
aily D
iurn
al
-m
g
Diurnal Ethanol PortionVehicle 215 - 2004 Toyota Highlander
Ethanol Portion
10 psi E10 9 psi E07 psi E10
1 32
121
136
196
1 321 321 321 32
9 psi E207 psi E0
198
217213
0000
00
0000
00
335 292
283
Figure 38 ndash Vehicle 215 Diurnal Ethanol Portion

10
Test Procedures ndash There are four basic tests in the E-77-2 test protocol
1 Static Permeation Rate (includes checks for vapor and liquid leaks)
2 Running Emissions (Dynamic Test)
3 Hot Soak
4 Diurnal
Each is described in detail below
1 Static Permeation Rate Testing
The constant temperature (static) permeation rate is measured in a traditional SHED (Constant
temperature) in the following manner
A The fuel tank is drained and filled to 40 tank capacity with the test fuel
B The day before testing the vehicle is driven over four road trips of 75 miles each
to precondition the canister8 (These drives are similar to the LA-4)
C Upon return from the road pre-conditioning the fuel tank is drained and filled to
40 tank capacity with the test fuel9
D Vehicle is parked for 18-22 hours in a controlled temperature environment at test
temperature (86ordmF)
E The vehicle is then moved (without starting) into the test (86ordmF) SHED
F The canister vent is connected to the SHED bulkhead fitting which routes the
vapor to the trap canister outside the SHED
G The tank system pressurization hose is connected
H The fuel pump electrical connection is connected
I The SHED is sealed the inside temperature is allowed to stabilize and the test is
started Continuous THC measurements are made using a FID Ethanol
methanol and R134a concentrations are measured using an INNOVA analyzer
All measurements are made at least every minute for one hour to determine the
stabilized permeation rate
J At the end of the static test (60 minutes) the vehiclersquos vapor system is pressurized
to 5 inches of water for thirty minutes Measurements are made to quantify vapor
leaks as determined by a change in the THC in the SHED
K The fuel pump is then energized for 30 minutes while maintaining the 5 inches of
water on the vapor system Liquid leaks are quantified as determined by a change
in the concentration of THC in the SHED
The purpose of steps J and K above is to validate that the permeation rate measurement was
made without the presence of any leak ndash either liquid or vapor A detailed discussion follows
starting at page 12
8 This conditioning can be done in the laboratory on a chassis dynamometer if proper attention is paid to underbody
cooling and unrepresentative fuel tank temperatures are avoided 9 Vehicles with ORVR systems will add the refueling vapors to the canister This is OK
11
2 Running Loss Test (Dynamic Test)
A The vehicle is placed in the RL-SHED and prepared for test (The fuel level and
condition for the dynamic test is the fuel remaining after completion of the static test ndash
40 fresh fill of the appropriate test fuel)
B Outside air source for the engine is connected
C Vehicle exhaust is connected
D Fuel tank thermocouple is connected
E Canister vent is connected to the SHED bulkhead fitting which routes the vapor to the
trap canister outside the SHED
F Vehicle is allowed to stabilize in the RL-SHED at test temperature (86degF) for a minimum
of 12 hours ndash preferably overnight
G Two cycles of the Unified Cycle (LA-92) driving schedule (48 mins) are driven while
measuring the mass emissions in the SHED Vehicle is allowed to idle (in drive) for 30
seconds between the two cycles Ambient air temperature is maintained (to the extent
possible) at 86degF Fuel tank surface temperature is monitored during vehicle operation It
should increase during the drive from 10 to 18degF to simulate expected on-road
temperature increase Measured mass emissions are corrected using the INNOVA data
for the ethanol methanol and refrigerant emissions
3 Hot Soak10
This procedure is executed immediately following the Running Loss Test procedure
described above
A Engine is turned off transmission selector is placed in park and driver exits the
enclosure using the double door air lock taking care to minimize any air exchange
between the laboratory and the SHED This starts the one hour ldquohot soakrdquo period
B Measurements of mass emissions in the SHED are continued for another 60 minutes
(until time = 108 minutes) correcting for the ethanol methanol and refrigerant mass
using the INNOVA instrument data This ends the hot soak Hot soak emissions are
calculated as the net difference for the one hour hot soak (CorrMass108 ndash CorrMass48
minus the 86degF static hourly rate all mass rates in mghour)
4 Diurnal Test
A The fuel tank is drained and filled to 40 tank capacity with the test fuel
B The day before testing the vehicle is driven over four road trips of 75 miles each to
precondition the vehicle and the canister
C Upon return from the road pre-conditioning the fuel tank is drained and filled to 40
tank capacity with the test fuel
D The vehicle is parked for 18-22 hours in a controlled temperature environment at the
initial diurnal test temperature (65ordmF)
E The SHED is sealed allowed to stabilize at the 65degF temperature and the 3-day
California Diurnal Test is started
10 We define the ldquohot soakrdquo to be the temporary increase in emission rate caused by the immediately preceding
operation of the vehicle It is the increase in the SHED mass (corrected for EtOH MeOH and R-134a) over the
one hour period minus the previously established ldquostaticrdquo permeation rate
12
F ldquoContinuousrdquo (every 30 seconds) THC measurements are made using a FID Ethanol
methanol and R134a (refrigerant) concentrations are measured using an INNOVA
analyzer at least every 10 minutes for the duration of the test (72 hours)
Static Permeation Test ndash Leak Validation
If a leak is detected during either the vapor system pressure portion (Step J) or the pump
energized portion (Step K) of the Static Permeation Test procedure it calls into question whether
the permeation rate measurement accurately reflects fuel system permeation or if instead a
combination of permeation and the implied leak was measured If a leak is confirmed the
permeation rate measurement is called into question and an investigation possible remedy and
retest is indicated
The permeation rate measurement must be corrected for the FIDrsquos ethanol misrepresentation and
the presence of non-fuel hydrocarbons (methanol and refrigerant) The leak check however is
made using the change in mass increase in the SHED using the uncorrected FID mass calculation
as the determinate It was found that the corrections for ethanol methanol and refrigerant were
introducing ldquonoiserdquo into the trace and that these were being misinterpreted as leaks
y = 062x - 19
y = 047x + 67
y = 055x - 01
0
10
20
30
40
50
60
70
80
90
100
0 20 40 60 80 100 120
SH
ED
Mas
s -
mg
Test Time - minutes
Leak TestVehicle 204 - 1999 Honda Accord - 9 psi E0
Test 7028
Pump ActivatedTank Pressurized
Figure 8 above represents the calculations made during the inspection of data from a successful
test EXCELrsquostrade ldquoSLOPErdquo function is used to calculate the linear regression values based on
the FID calculation for mass for Time 0 to 60 minutes Time 64 to 90 minutes and Time 94 to
120 minutes A 4-minute gap was included between each sequence to establish the new mass
emission rate during the ldquopressure onrdquo (T60 to T90) and the ldquopump energizedrdquo periods
The slope of 047 for the ldquoTank Pressurizedrdquo period in the example above is compared to the
slope of 062 calculated for the permeation rate (or hot soak) period Since the ldquoTank
Figure 8 ndash Leak Test
13
Pressurizedrdquo slope is not more than 10 higher than the hot soak permeation rate we assume
that there is no leak present A similar comparison is made for the slope determined during the
ldquopump onrdquo period The choice of a 10 allowance is arbitrary and is used here to allow for
normal and unavoidable test variation
For tests in which the above procedure determines that no leak is present a value of zero is
reported in the test summary for the leak results If a positive value is reported it calls that test
into question and an investigation possible repair and retest is indicated
Static Permeation Rate Determination
The static permeation rate is determined based on a linear regression through the individual
SHED mass data points (data measured each 30 seconds) of the corrected fuel results (corrected
for the FID error and subtracting the methanol and refrigerant) from the first 60 minutes of
testing as illustrated in Figure 9 below
y = 05636x + 0505
0
5
10
15
20
25
30
35
40
45
0 10 20 30 40 50 60
Pe
rme
ati
on
-m
gs
Test Time - mins
Static Permeation DeterminationVehicle 204 - 1999 Honda Accord - 9 psi E0 Fuel
Raw SHED
Corrected Fuel
Permeation Rate Based on Corrected Results
Permeation Rate = 5636 x Time = 338 mgshr
In this example the static permeation rate is 338 mghr
Dynamic (Running Loss) and Hot Soak Test
The preceding section addressed the concepts of separating the permeation emissions from the
tank venting emissions and establishing the presence or absence of leaks The second part of
this study includes a dynamic test to measure the permeation and tank venting emissions during
Figure 9 ndash Static Permeation Determination
14
vehicle operation (ldquorunning lossesrdquo) and the temporary condition following vehicle operation
known as the ldquohot soakrdquo
This is considered a ldquodynamicrdquo test because the vehicle is driven and the fuel and vapor system
temperatures rise during the test The ambient temperature in the Running Loss SHED during
the test was held constant at 86degF while the vehiclersquos fuel system temperature rose during the
test Two 1435 second (239-minute) LA-92 driving cycles were performed consecutively during
the running loss measurements with a 30-second idle in-between During this test tank fuel
temperature was expected to rise by an average approximately 18degF above the initial ambient
temperature The running loss air handling system included a proportional speed under-car
blower operated as a slave to dynamometer speed This apparatus was used during running loss
testing with minor tuning for specific vehicles Without additional input it is capable of
reasonable fuel tank temperature control Each vehicle was fitted with a surface-mount
thermocouple at the front of the fuel tank located at approximately the 18th
fill level to measure
the fuel liquid temperature No attempt was made to follow a predefined fuel tank temperature
profile (FTTP) in this program Fuel temperatures were recorded and results are available in the
real-time records
Vehicle running loss emissions are measured in a special version of a SHED known as a
Running Loss SHED (RL-SHED) shown in Figure 10 Special features of the RL-SHED
include a sealed chassis dynamometer for simulating vehicle driving loads a sealed outside air
supply for engine intake a sealed exhaust conduit for engine exhaust and an under-chassis fan
for simulating underbody air flow as described above A vehicle is operated inside the RL-SHED
over a chosen driving cycle The increase in HC emissions inside the enclosure are measured
and calculated as mass emissions per 40 CFR sect86163-96
Figure 10 - Running Loss SHED
15
Vehicle testing in an RL-SHED is complicated by several factors including
1 Engine must be supplied with external induction air
2 Exhaust must be conducted externally without any leaks
3 Load supplied to the vehicle through the chassis dynamometer must not create or
allow external leaks
4 Internal SHED temperature must be maintained while sizable heat is rejected to the
ambient by the running engine and exhaust
5 Cooling air supplied to the radiator must be modulated to represent the vehiclersquos road
speed
6 Underbody (and especially the fuel system) temperature should represent the rate of
rise experienced by a real road-drive
Canister vent losses were isolated from permeation emissions using the technique previously
described The vehiclersquos carbon canister fresh air vent was connected to the outside of the RL-
SHED using a leak-tight PTFEreg
hose (38rdquo OD commercial tubing US Plastics 58055 PTFE or
equivalent) connected to a small carbon ldquotraprdquo canister located on a top-loading precision scale
The scale precision was 001 grams (10 milligrams) and it was purged prior to each test There
were no tank venting emissions measured on any of the running loss test measurements All of
the vehicles appeared to be actively ldquopurgingrdquo their respective control canisters and drawing
fresh air during the test If there were any emissions from the vehiclersquos control canister as might
have occurred if there were no vehicle purge or if very high volatility fuels with excessive vapor
generation were used they would have been measured
The Running Loss Driving Cycle consisted of two cycles of the ldquoUnified Driving Cyclerdquo
otherwise known as the LA-92 A velocity versus time plot for one cycle is shown in Figure 11
The LA-92 cycle takes 24 minutes to complete and covers 98 miles with many speed changes
Two back-to-back cycles were driven the first as a ldquocold startrdquo and the second following a 30-
second vehicle idle The ldquocold startrdquo condition was created by soaking the vehicle for a
Figure 11 ndash Running Loss Driving Cycle
Unified Cycle (LA-92)
0
10
20
30
40
50
60
70
80
0 5 10 15 20 25Test Time - minutes
Spe
ed -
mph
Cycle Time (min) 239
Maximum Speed (mph) 672
Average Speed (mph) 246
Average Non-Zero Speed (mph) 294
Time Zero Speed () 162
Distance (miles) 982
16
minimum of 18 hours at 86degF moving it to the stabilized 86degF RL-SHED making the test
connections and then waiting a minimum of one hour before the initial start and run
The SHED emissions were measured during 48 minutes of engine operation and then
continuously for one hour after the engine was turned off This one hour engine-off duration
was the ldquohot soakrdquo period The total test time is 1 hour and 48 minutes
Figure 12 shows results from the 9 psi E0 fuel test on Vehicle 204 The horizontal axis is test
time in minutes and the vertical axis is the HC mass measured in the RL-SHED during the test
period
The engine was shut off at the end of the second LA92 drive cycle (~48 minutes) and the
analysis system continued to measure the HC emissions in the SHED for the next 60 minutes
This represented the ldquohot soakrdquo portion of the test
0
50
100
150
200
250
300
0 20 40 60 80 100 120
Co
rre
cte
d T
ota
l F
ue
l C
um
ula
tiv
e P
erm
ea
tio
n -
mg
Test Time - minutes
Running Loss and Hot SoakVehicle 204 - 1999 Honda Accord - 9 psi E0 Fuel
Test 25668
Running Loss Hot Soak
Running Loss Std =005 gmiThis Test = 0010 gmi
RL = 249 mghr
2774
2332
Tru HS = 442
1990
The ldquoTruerdquo Hot Soak
The traditional hot soak is determined from the increase in SHED emissions as measured for one
hour following a prescribed drive to heat up the vehicle (2 LA-92 cycles during the Running
Loss Test) Hot soak emissions however have two components that caused by the elevated
temperature resulting from the drive and that resulting from one hour of static permeation
Figure 12 ndash Running Loss Test Results
17
To separate these two components and determine the ldquotruerdquo hot soak emissions the following
procedure was used ldquoTraditionalrdquo hot soak emissions were first calculated by subtracting the
ldquostart of hot soakrdquo cumulative SHED hydrocarbon value (ie 199 mg t = 48 minutes) from
the final cumulative SHED hydrocarbon value (ie 2774 mg t = 108 min) This resulted in a
cumulative SHED hydrocarbon value of 78 mg for the 1 hour hot soak The previously
determined static permeation value (ie 338 mg for a 1 hour hot soak test- see Figure 9) was
then subtracted to arrive at the ldquotruerdquo hot soak value of 442 mg The increase in the permeation
rate (the ldquohot soak effectrdquo) caused by the increase in the system temperature is accounted for by
subtracting the ldquostabilized permeation raterdquo at 86degF
In Figure 12 the static permeation rate is superimposed as a solid blue line on the plot from the
starting point of the hot soak until its end (one hour) While the ldquotraditionalrdquo hot soak would be
calculated as 78 mg (277 mg ndash 199 mg) the ldquotruerdquo hot soak is determined as 442 mg (2774 mg
ndash 2332 mg) True hot soak values reported here were determined in this manner
Diurnal Test
Diurnal permeation was determined by subjecting the vehicle to a three-day period in a
temperature controlled SHED while continuously recording the total hydrocarbon every 30
seconds The SHED environmental temperature was varied from 65degF to 105degF per the
California Diurnal Test protocol Canister vent losses were isolated from permeation emissions
using the technique previously described The vehiclersquos carbon canister fresh air vent was
connected to the outside of the RL-SHED using a leak-tight PTFEreg
hose connected to a small
carbon ldquotraprdquo canister located on a top-loading precision scale The scale precision was 001
grams (10 milligrams) and it was purged before each test
DISCUSSION OF TEST RESULTS
Results
Emission results are presented below by ldquomechanism11
rdquo with the data averaged for the five
ldquoenhancedrdquo and the two ldquonear zerordquo vehicles The lone ldquopre-enhancedrdquo vehicle the 1996 Ford
Taurus (202) was a special case and will be discussed in a separate section Two of the vehicles
the 2001 Dodge Caravan (207) and the 2004 Toyota Camry (211) were also subjected to limited
testing with an ldquoimplanted leakrdquo (a 0020rdquo dia hole in a special tank gas cap) to investigate the
magnitude of a known leak These results (ldquoLeakersrdquo) follow the discussion on the Taurus
Static Permeation Rate (Constant Temperature (86degF)) - Average permeation rate compared
by fuel specification for two vehicle groups ldquoenhancedrdquo and the ldquonear zerordquo evaporative
emissions
11 The ldquomechanismsrdquo are 1 Permeation 2 Tank Venting (Daily Temperature Rise) and 3 Leaks
18
0
10
20
30
40
50
60
Co
rrecte
d P
erm
eati
on
Rate
-m
gh
r
Fuel
Static Permeation Rate - All FuelsE77-2 Program Vehicles
7 E0 9 E2010 E107 E109 E0 7 E0 9 E2010 E107 E109 E0
Enhanced(5 veh)
Near Zero(2 veh)
Figure 13 presents the static permeation rate performance for the average of the 5 ldquoenhancedrdquo
and 2 ldquonear zerordquo vehicles on the five fuels included in the test program Each group is ordered
from left to right by ethanol level The vertical scale is the average permeation rate in mghour
for the static (86degF constant temperature) test
Previous studies1213
had shown that vehicles operated on the fuel containing 10 vol- ethanol
would have higher permeation rates compared to those resulting from operation on a non-ethanol
(E0) fuel of similar properties We also expected that vehicles using higher vapor pressure fuel
would exhibit increased permeation levels at similar ethanol levels Other studies had reported
mixed results when comparing E20 permeation rates against E10 measurements ndash some were
higher and some were lower The difference may have been within the repeatability of the
measurements and probably suffered from a limited number of observations These mixed
results are present in this testing of the enhanced vehicles however the E20 (violet bar) is higher
on average for static permeation rate for the Near Zero group The data that were used to
construct the averages in Figure 13 are listed in Table 3 below There is significant variability in
the test results and the limited sample size precludes making conclusive statements with
statistical confidence
12 CRC E-653 Fuel Permeation from Automotive Systems E0 E6 E10 E20 and E85 December 2006 13
CRC E-77 Vehicle Evaporative Emission Mechanisms A Pilot Study June 2008
Figure 13 ndash Static Permeation Rate Comparison
19
Table 3
Vehicle ID Technology 7psi E0 9 psi E0 7 psi E10 10 psi E10 9 psi E20
204
1999 Honda Enhanced 129 338 664 843 553
Accord
205
2001 Toyota Enhanced 99 195 596 416 462
Corolla
207
2001 Dodge Enhanced 401 325 644 787 882
Caravan
214
2004 Ford Enhanced 252 107 239 244 168
Escape
215
2004 Toyota Enhanced 87 85 122 104 193
Highlander
194 210 453 479 452
211
2004 Toyota Near Zero 91 101 94 199 558
Camry XLE
212
2006 Ford Near Zero 09 32 218 106 47
Taurus
50 67 156 153 303
Static Permeation Rate - mghr
CRC E-77-2 Program - Static Permeation Results
Enhanced Averages
Near Zero Averages
Summary ndash Static permeation rate increased with increase in ethanol level Three of the 5
enhanced emission vehicles did not show an increase in permeation rate when tested with the 9
psi E0 compared to the 7 psi E0
20
Dynamic (Running Loss) Permeation - In a similar presentation Figure 14 shows the average
ldquoRunning Lossrdquo permeation rate for the vehicle types and the fuels tested ldquoRunning Lossrdquo
permeation as described here is the permeation measured during a ldquocold startrdquo 48 minute drive in
a Running-Loss SHED (RL-SHED) at 86degF
0
50
100
150
200
250
300
350
400
7E0 9E0 7E10 10E10 9E20 7E0 9E0 7E10 10E10 9E20
Co
rre
cte
d R
un
nin
g L
os
s P
erm
ea
tio
n -
mg
hr
Fuel
Running Loss Permeation Rate - All FuelsE77-2 Program Vehicles
Enhanced(5 vehs)
Near Zero(2 vehs)
The dynamic permeation rates for the enhanced vehicles (left panel) followed a similar pattern as
the static permeation The average of the E20 fuel was the highest of the average values
observed on both the enhanced and the near-zero vehicles (left and right panels respectively)
Table 4 below shows the data used to generate the averages used in Figure 14
Figure 14 ndash Running Loss Permeation Comparison
21
Table 4
Vehicle ID Technology 7psi E0 9 psi E0 7 psi E10 10 psi E10 9 psi E20
204
1999 Honda Enhanced 2226 2492 2879 3164 2720
Accord
205
2001 Toyota Enhanced 671 1031 2328 1916 1697
Corolla
207
2001 Dodge Enhanced 8425 8339 8122 8581 10282
Caravan
214
2004 Ford Enhanced 363 967 1057 1331 1394
Escape
215
2005 Toyota Enhanced 797 811 979 719 1025
Highlander
2496 2728 3073 3142 3424
211
2004 Toyota Near Zero 1046 837 563 1383 4106
Camry XLE
212
2006 Ford Near Zero 1845 1158 2012 1489 1168
Taurus
1446 998 1288 1436 2637
Enhanced Averages
Near Zero Averages
CRC E-77-2 Program - Running Loss Permeation Results
Running Loss Permeation Rate - mghr
Summary ndash The dynamic permeation rate (measured during vehicle operation) was higher with
the E10 fuel compared to E0 for the enhanced vehicles The E20 permeation rate was higher
than E0 and the E10 fuel The small sample size and limited data precludes us from making
statements about statistical confidence but this may indicate a trend The near zero vehicle
average increased as the ethanol level increased Trends with volatility were mixed or
inconclusive
22
Hot Soak (ldquoTrue Hot Soakrdquo) Permeation ndash The Hot Soak emissions as defined in this report
are the net increase in permeation rate following vehicle operation We measured the mass
increase in the SHED for one hour immediately following vehicle operation and subtracted the
previously measured static (or normal) permeation at the same temperature While this is not the
traditional Code of Federal Regulations (CFR) definition we feel it is appropriate for the intent
of this project
0
10
20
30
40
50
60
70
7E0 9E0 7E10 10E10 9E20 7E0 9E0 7E10 10E10 9E20
Co
rre
cte
d H
ot
So
ak
Pe
rme
ati
on
-m
gh
r
Fuel
True Hot Soak Permeation Rate - All FuelsE77-2 Program Vehicles
Enhanced(5 vehs)
Near Zero(2 vehs)
The ldquoTrue Hot Soakrdquo performance for the average of the Enhanced Vehicles is summarized in
Figure 15 above There was a large increase in the hot soak value with the E10 fuel compared to
the E0 The hot soak value with the E20 fuel was comparable to the E0 results and lower than
the E10
The Near Zero vehicles (2) had zero hot soak emissions when tested on the 10 psi E10 fuel
(Figure 16) With only two vehicles and the very low levels attained no statistically significant
conclusions can be drawn from the data available Table 5 presents the individual tests used in
calculating the average values plotted in Figure 15
Figure 15 ndash True Hot Soak Permeation Comparison
23
Table 5
Vehicle ID Technology 7psi E0 9 psi E0 7 psi E10 10 psi E10 9 psi E20
204
1999 Honda Enhanced 187 443 297 04 134
Accord
205
2001 Toyota Enhanced 00 10 719 295 603
Corolla
207
2001 Dodge Enhanced 00 58 1222 2377 00
Caravan
214
2004 Ford Enhanced 33 521 329 574 560
Escape
215
2005 Toyota Enhanced 225 251 00 16 00
Highlander
89 257 513 653 259
211
2004 Toyota Near Zero 07 153 138 00 00
Camry XLE
212
2006 Ford Near Zero 18 04 00 00 49
Taurus
13 79 69 00 25
CRC E-77-2 Program - True Hot Soak Permeation Results
True Hot Soak Permeation Rate - mghr
Near Zero Averages
Enhanced Averages
Summary - The True Hot Soak permeation (permeation rate measured following vehicle
operation less the static constant temperature permeation rate) rate was higher with the E10 fuel
compared to E0 for the enhanced vehicles The E20 permeation rate was higher than E0 and
lower than the E10 fuel The near zero vehicle trends with both ethanol content and volatility
were mixed or inconclusive The small sample size and limited data precludes us from making
statements about statistical confidence
24
Diurnal Permeation Performance ndash Figure 16 presents the diurnal permeation results for the
first day of the three-day diurnal test (65deg to 105degF)
0
200
400
600
800
1000
1200
7E0 9E0 7E10 10E10 9E20 7E0 9E0 7E10 10E10 9E20
Co
rre
cte
d F
ue
l D
iurn
al
Pe
rme
ati
on
-m
gs
da
y
Day 1 Diurnal Permeation RatesAverages from E-77-2 Vehicles
Fuel
Enhanced(5 vehs)
Near Zero(2 vehs)
The average day 1 diurnal permeation for the five Enhanced Vehicles tended to increase as
ethanol content increased (with the exception of the E20 fuel) Again sample size and limited
data makes statistical conclusions inappropriate Table 6 presents the individual test used to
generate the averages used in Figure 16 The table includes the data from days 2 and 3 The
ethanol content of the diurnal measurements was calculated and appear in a series of figures in
the Appendix starting at page 37 Unlike Figure 16 the figures shown in the appendix have not
been corrected to exclude the non-fuel emissions (methanol and refrigerant) that were present
during these tests
Figure 16 ndash Day 1 Diurnal Permeation Comparison
25
Table 6
Vehicle ID Technology 7psi E0 9 psi E0 7 psi E10 10 psi E10 9 psi E20
204 Day 1 3672 6283 12601 15479 11034
1999 Honda Enhanced Day 2 2877 5810 11652 17799 9581
Accord Day 3 2936 5770 11653 17711 9812
205 Day 1 3830 4995 17834 17941 17752
2001 Toyota Enhanced Day 2 3654 4810 17150 17309 16900
Corolla Day 3 3670 5072 15239 17417 16802
207 Day 1 3975 4064 10865 14064 15480
2001 Dodge Enhanced Day 2 3026 3373 8120 12644 13702
Caravan Day 3 2689 3080 8236 12237 13605
214 Day 1 4943 4559 5242 4920 4709
2004 Ford Enhanced Day 2 3190 3585 3974 8394 4400
Escape Day 3 2815 11017 3944 113738 7518
215 Day 1 2483 2021 2247 3192 4168
2004 Toyota Enhanced Day 2 2941 1659 2317 2602 4148
Highlander Day 3 2888 1763 2675 2370 4506
3781 4384 9758 11119 10629
211 Day 1 2071 1303 2438 3370 2840
2004 Toyota Near Zero Day 2 1002 1158 1838 2268 2218
Camry XLE Day 3 874 1006 1843 2179 2034
212 Day 1 1016 1005 1848 1243 1310
2006 Ford Near Zero Day 2 712 708 1002 879 833
Taurus Day 3 570 574 758 1028 750
1544 1154 2143 2307 2075
CRC E-77-2 Program Results - Diurnal Permeation
Diurnal Permeation Rate - mgday
Enhanced Averages
Near Zero Averages
Carbon Canister Breakthrough ndash Canister breakthrough is measured by the weight change
recorded for the trap canister outside the SHED It quantifies the amount of vapors that
overwhelm the evaporative system storage canister Figure 17 displays the breakthrough
resulting from testing of 9 psi E0 fuel Only four of seven vehicles exhibited breakthrough
60
65
70
75
80
85
90
95
100
105
110
0
5
10
15
20
25
30
35
40
0 10 20 30 40 50 60 70
SH
ED
Te
mp
era
ture
-d
eg
F
Bre
ak
thro
ug
h -
mg
Test Time - hrs
Canister Breakthrough9 psi E0 Fuel - 65ordm to 105ordm F Diurnal
204 - 1999 Honda Accord
211 - 2004 Toyota Camry
215 - 2004 Toyota Highlander
205 - 2001 Toyota Corolla
Figure 17 ndashDiurnal Canister Breakthrough
26
Table 7 shows the breakthrough generated during the diurnal tests conducted
Table 7
Vehicle ID Technology 7psi E0 9 psi E0 7 psi E10 10 psi E10 9 psi E20
204 Day 1 --- 24 --- 310 ---
1999 Honda Enhanced Day 2 --- 136 --- 360 ---
Accord Day 3 --- 198 --- 360 ---
205 Day 1 --- --- --- 204 ---
2001 Toyota Enhanced Day 2 --- --- --- 309 ---
Corolla Day 3 --- 26 --- 293 ---
207 Day 1 --- --- --- --- ---
2001 Dodge Enhanced Day 2 --- --- --- --- ---
Caravan Day 3 --- --- --- --- ---
214 Day 1 --- --- --- --- ---
2004 Ford Enhanced Day 2 --- --- --- --- ---
Escape Day 3 --- --- --- 49 ---
215 Day 1 --- --- --- --- ---
2004 Toyota Enhanced Day 2 --- 02 --- --- ---
Highlander Day 3 --- 72 --- --- ---
211 Day 1 --- --- --- --- ---
2004 Toyota Near Zero Day 2 --- 129 --- 191 ---
Camry XLE Day 3 --- 176 --- 289 ---
212 Day 1 --- --- --- --- ---
2006 Ford Near Zero Day 2 --- --- --- --- ---
Taurus Day 3 --- --- --- 204 ---
CRC E-77-2 Program - Carbon Canister Diurnal Breakthrough Results
Diurnal Breakthrough - grams
Summary ndash The lack of canister breakthrough for the 7 psi fuels (summer grade) indicates that
the storage capacity of the seven systems tested is appropriately sized Breakthrough began to
appear when testing of 9 psi E0 fuel (not summer grade) and was more prevalent with the 10 psi
E10 fuel (winter grade) The lack of breakthrough with the 9 psi E20 fuel seems to be an
anomaly
27
Overall Trend Summary - The following chart (Figure 18) visually summarizes the trends seen
from all testing performed during this program
Higher Volatility E0 to E10 E0 to E20 E10 to E20
uarr uarr uarr uarr
Higher Volatility E0 to E10 E0 to E20 E10 to E20
uarr uarr uarr uarr
Higher Volatility E0 to E10 E0 to E20 E10 to E20
uarr uarr uarr uarr
Higher Volatility E0 to E10 E0 to E20 E10 to E20
uarr uarr uarr uarr
Higher Volatility E0 to E10 E0 to E20 E10 to E20
uarrharr uarr uarr uarr
Higher Volatility E0 to E10 E0 to E20 E10 to E20
uarr uarr uarr uarr
Higher Volatility E0 to E10 E0 to E20 E10 to E20
uarr darr darr
Higher Volatility E0 to E10 E0 to E20 E10 to E20
uarr uarr uarr harr
Ethanol Content
Diurnal
Trend Analysis for E-77-2 Program
Ethanol Content
Static Permeation
Ethanol Content
Running Loss Permeation
Ethanol Content
Ethanol Content
Diurnal
Enhanced Vehicles (Sample of 5)
Static Permeation
Ethanol Content
Ethanol Content
Running Loss Permeation
Ethanol Content
True Hot Soak (TEFVO)
Near-Zero Vehicles (Sample of 2)
True Hot Soak (TEFVO)
Figure 18 Trend Analysis Summaries
28
Vehicle 202 ndash 1996 Ford Taurus - Special Case
We have treated vehicle 202 as a special case This was the oldest of the vehicles tested and had
been subjected to limited exhaust emission tests with a 20-volume percent ethanol fuel (E20)
during the CRC E-74b test program
Vehicle 202 completed the E10 portion of the test program (10 and 7 psi fuels) successfully and
completed the road preconditioning on the E0 fuel prior to the E0 evaluations The first test on
the E0 fuel was excessively high indicating a fuel leak It was traced to a leaky fuel injector o-
ring and there was considerable discussion as to an appropriate repair Tests were made on the 9
and the 7 psi E0 fuel to measure the magnitude of a vehicle in a ldquoleakrdquo condition and the tests
were labeled as ldquo202L (Leak)rdquo The fuel injector o-rings were replaced as a complete set and
the vehicle resumed testing as ldquo202Rrsquo (Repaired) A new elusive vapor leak was present later
identified as a very small leak at the top of the fuel fill pipe
The circle on Figure 19 at the right shows
the location of the small leak This leak
was problematic as to its effect on the
emission measurements because its
magnitude or presence seemed to depend
on the torque exerted on the fuel cap The
tests on the E0 fuels (9 and 7 psi) are
noted as 202R but with a vapor leak
We attempted to fix this leak and repeated
the E10 test with the vehicle re-identified
as 216 with reasonable results We also
ran the E20 test sequence and declared the
vehicle done
The testing history for this vehicle is shown in Tables 8 (Static) 9 (Dynamic) and 10 (Diurnal)
The tests highlighted in yellow are those that exhibited a liquid or vapor leak as identified during
the static test leak validation
Figure 19 ndash Vehicle 202 Fuel Fill Pipe Leak
29
Table 8
Static Permeation Results 1996 Ford Taurus SHED
Corrected Results Canister
Fuel Permeation mgday Loss
Veh psiEtOH Test Type Date Test mghr (Corrected) g
202 100E10 Static Perm 071807 7018 345 000
Press Incr 00 No Leak
Prs+Fuel Incr 00
202 70E10 Static Perm 082107 7031 223 000
Press Incr 00 No Leak
Prs+Fuel Incr 00
202L 90E0 Static Perm 030408 7169 2292 000
Press Incr DNA
Prs+Fuel Incr 4921 Liquid Leak
202L 70E0 Static Perm 032008 7183 2991 000
Press Incr DNA
Prs+Fuel Incr 19896 Liquid Leak
202R 90E0 Static Perm 050808 7228 178 000
Press Incr 136 Vapor Leak
Prs+Fuel Incr 00
202R 70E0 Static Perm 052208 7239 204 000
Press Incr 380 Vapor Leak
Prs+Fuel Incr 00
216 100E10 Static Perm 081408 7299 324 000
Press Incr 00 No Leak
Prs+Fuel Incr 00
216 70E10 Static Perm 091708 7326 325 000
Press Incr 00 No Leak
Prs+Fuel Incr 00
216 90E20 Static Perm 103008 7363 204 000
Press Incr 00 No Leak
Prs+Fuel Incr 00
30
Table 9
Dynamic Permeation Results 1996 Ford Taurus SHED
Corrected Results Canister From
Fuel Permeation mgday Loss Static
Veh psiEtOH Test Type Date Test mghr (Corrected) g Test
202 100E10 Dynamic RL 072007 25662 1278 000 No Leak
TEFVO 386 000
202L 90E0 Dynamic RL 030508 25695 3870 000 Liquid Leak
TEFVO 00 000
202L 70E0 Dynamic RL 032408 25699 7269 000 Liquid Leak
TEFVO 00 000
202R 90E0 Dynamic RL 050908 25704 1091 000 Vapor Leak
TEFVO 50 000
202R 70E0 Dynamic RL 052308 25706 787 000 Vapor Leak
TEFVO 00 000
216 100E10 Dynamic RL 081508 25718 1742 000 No Leak
TEFVO 14 000
216 70E10 Dynamic RL 091808 25721 1683 000 No Leak
TEFVO 423 000
216 90E20 Dynamic RL 110708 25730 543 000 No Leak
TEFVO 00 000
31
Table 10
Diurnal Permeation Results 1996 Ford Taurus SHED
Corrected Results Canister From
Fuel Permeation mgday Loss Static
Veh psiEtOH Test Type Date Test mghr (Corrected) g Test
202 100E10 72 DHB 65-105 073107 7023
Day 1 10429 612 No Leak
Day 2 7069 3264
Day 3 7043 3869
202 70E10 72 DHB 65-105 082807 7034
Day 1 6278 000 No Leak
Day 2 5065 000
Day 3 4535 000
202L 90E0 72 DHB 65-105 031108 7173
Day 1 22589 000 Liquid Leak
Day 2 32310 000
Day 3 23069 1260
202L 70E0 72 DHB 65-105 040108 7196
Day 1 47425 000 Liquid Leak
Day 2 44517 000
Day 3 31798 000
202R 90E0 72 DHB 65-105 051308 7230
Day 1 3270 000 Vapor Leak
Day 2 2667 000
Day 3 2746 1083
202R 70E0 72 DHB 65-105 052808 7243
Day 1 2117 000 Vapor Leak
Day 2 2208 000
Day 3 2081 000
216 100E10 72 DHB 65-105 082008 7305
Day 1 25907 5777 No Leak
Day 2 34779 6299
Day 3 36014 6343
216 70E10 72 DHB 65-105 092308 7331
Day 1 3975 022 No Leak
Day 2 3550 006
Day 3 3621 037
216 90E20 72 DHB 65-105 111108 7373
Day 1 4685 000 No Leak
Day 2 4526 000
Day 3 4198 000
32
The Implanted Leak Test Results
Project E-77-2 included evaluating two vehicles with implanted leaks This interest followed the
information gathered in the Pilot Study where tests were run with a specially modified fuel cap
containing a 002rdquo dia hole The results with the implanted leak from the Pilot Study are
repeated in Table 11 below as the diurnal results are shown for a 1996 Chevrolet Cavalier first
without the implanted leak at 038 grams per day and then at 207 grams per day (a 54x
increase) with the leak
Table 11
Veh No
Evap
Tech Fuel
Results
gmsday
gms
Increase
6 1996 Chevrolet Cavalier Enhanced 7 psi E0 038
7 2070 2032
207 2001 Dodge Caravan Enhanced 7 psi E10 109
207L 213 104
211 2004 Toyota Camry LE Near Zero 7 psi E10 024
211L 068 044
- Implanted 020 leak in fuel cap
Vehicle Description
Implanted Leak Impact on Diurnal PermeationDay One Results 65deg - 105degF Diurnal
The two E-77-2 vehicles (207 amp 211) were given a limited evaluation with an induced leak and
saw a significantly lesser impact Vehicle 207 gave diurnal results increases from 109 to 213
grams per day (a 2x increase) and Vehicle 211 increased from 024 grams per day to 068 grams
per day (a 28x increase) The following Figure 20 displays the imbedded leak impact from Table
11
33
0
5
10
15
20
On
e D
ay
Diu
rna
l P
erm
ea
tio
n -
gm
sd
ay
Vehicle Number
Implanted Leak Impact on One Day Diurnal Permeation020 Leak in Fuel Cap - 65 to 105 F Diurnal
207L 211L21120776
As Received - No Leak
020 Fuel Cap Leak
The newer vehicles evaluated in this phase of the study were configured and certified to the
Onboard Refueling Vapor Regulations (ORVR) These are capable of containing 95 or more
control of the refueling vapors at up to 10 gallons per minute fueling rate Where the Chevrolet
Cavalier had a small (0055rdquo dia) orifice and a long vapor tube venting the tankrsquos vapor space to
the carbon canister (and then to the atmosphere) the ORVR compliant vehicles have a large
(0688rdquo ID) short vent hose to a low flow restriction carbon canister
The following bar charts (Figures 21 through 24) show the impacts of the leak on all phases of
the evaporative testing performed and compare those results with all fuels tested With only two
vehicles (207 and 211) evaluated on two fuels statistically significant effects cannot be
quantified but the trend of increased emissions is apparent
Figure 20 ndash Implanted Leak Impact
34
0
20
40
60
80
100
120
140
160
7E0 9E0 7E10 10E10 9E20 7E0 9E0 7E10 10E10 9E20
Sta
tic
Pe
rme
ati
on
-m
gh
r
Fuel
0020 dia Induced Leak EffectStatic Permeation
Vehicle 211Vehicle 207
Leak
Leak
0
200
400
600
800
1000
1200
7E0 9E0 7E10 10E10 9E20 7E0 9E0 7E10 10E10 9E20
Ru
nn
ing
Lo
ss
Pe
rme
ati
on
-m
gh
r
Fuel
0020 dia Induced Leak EffectRunning Loss Permeation
Vehicle 211Vehicle 207
Leak
Leak
Figure 21 ndash Vehicles 207 and 211 with Induced Leak - Static
Figure 22 ndash Vehicles 207 and 211with Induced Leak ndash Running Loss
35
0
100
200
300
400
500
600
700
7E0 9E0 7E10 10E10 9E20 7E0 9E0 7E10 10E10 9E20
Tru
e H
ot S
oa
k P
erm
ea
tio
n -
mg
hr
Fuel
0020 dia Induced Leak EffectTrue Hot Soak Permeation
Vehicle 211Vehicle 207
Leak
Leak
0
500
1000
1500
2000
2500
7E0 9E0 7E10 10E10 9E20 7E0 9E0 7E10 10E10 9E20
Da
y 1
Diu
rna
l P
erm
ea
tio
n -
mg
da
y
Fuel
0020 dia Induced Leak EffectDay 1 Diurnal Permeation
Vehicle 211Vehicle 207
Leak
Leak
Figure 24 ndash Vehicles 207 and 211 with Induced Leak - Diurnal
Figure 23 ndash Vehicles 207 and 211 with Induced Leak ndash True Hot Soak
36
Summary of Findings and Results
The E-77-2 test program was a continuation of the previously published E-77 test project and
added eight vehicles tested on five fuels to the knowledge base The permeation trends
previously shown were again present The small sample size and limited number of tests
preclude making statements about statistical validity but in general
o The newer vehicle groups had lower emissions
o Adding ethanol to the fuel increased permeation over the non-oxygenated levels
o Increased volatility increased permeation levels
o SHED emission rates must be corrected for the ethanol error in the FID and the
non-fuel methanol and refrigerant in the measurement
As this test program evolved and additional experience was gathered two program modifications
were made 1) The leak validation methodology was changed and 2) a different metric and
definition of the ldquoHot Soakrdquo was adopted
The leak validation portion of the static permeation test was found to be very sensitive and when
the data was corrected on a minute-by-minute basis for ethanol methanol and refrigerant the
change in apparent permeation rate was due as much to variation as to leaks See the discussion
starting at page 12 for the details of the development
Concern for and recognition of ldquoHot Soakrdquo emissions started in the original evaporative emission
regulations Carburetors had float bowls with ~ 50 ml of fuel that absorbed the latent engine heat
after the vehicle was shut down after operation The heat would cause the bowl temperature to
increase driving fuel vapors out through vents and leak paths to the atmosphere after vehicle
operation Todayrsquos fuel injection engines do not have the open bowls and the emission rates
following vehicle operation are mainly increased temperature permeation We recommended
and adopted a new name for the ldquotemporary emissions following vehicle operationrdquo (TEFVO)
which subtracts the basic permeation rate from the measured emissions See the discussion
starting at page 16 for details
37
Appendix
Acknowledgements
E-77-2 Steering Committee
David Brzezinski EPA
Kevin Cullen GM Powertrain
Dominic DiCicco Ford Motor Company
King D Eng Shell Global Solutions
Ben Hancock CARB
Constance Hart EPA
Phil Heirigs Chevron Global Downstream
Jeff Jetter Honda RampD Americas
Keith KnollNREL
John Koupal EPA
David H Lax API
Jeff Long CARB
Hector Maldonado CARB
Mani Natarajan Marathon Oil Company
David N Patterson Mitsubishi Motors RampD Americas
Jenny Sigelko Chrysler
James P UihleinChevron Global Downstream
Marie Valentine Toyota Technical Center
Kenneth J Wright ConocoPhillips
CRC Members
Brent Bailey CRC
Chris Tennant CRC
Jane Beck CRC
38
Table 12
E0 E10 E20
Inspection Units Fuel 6 Fuel 7 Fuel 4
API Gravity degAPI 602 585 570
Relative Density 6060degF 07382 07447 07508
DVPE psi 701 730 849
Oxygenates--D4815
MTBE vol 000 000 000
ETBE vol 000 000 000
EtOH vol 000 954 2034
O2 wt 000 353 747
Hydrocarbon Composition
Aromatics vol 221 244 108
Olefins vol 80 88 55
Saturates vol 700 573 234
D86 Distillation
IBP degF 974 1040 1022
5 Evaporated degF 1316 1280 1252
10 Evaporated degF 1423 1330 1314
20 Evaporated degF 1564 1410 1413
30 Evaporated degF 1704 1450 1486
40 Evaporated degF 1840 1530 1547
50 Evaporated degF 1975 1950 1596
60 Evaporated degF 2120 2190 1636
70 Evaporated degF 2305 2410 2274
80 Evaporated degF 2588 2710 2695
90 Evaporated degF 3139 3170 3139
95 Evaporated degF 3322 3300 3255
EP degF 3603 3600 3406
Recovery vol 978 978 983
Residue vol 13 10 10
Loss vol 09 12 07
Driveability Index 11199 11015 9898
Data from CRC E-74
CRC E-77-2 Fuel Inspection Results
39
Fuel Units Fuel 6 Fuel 7 Fuel 4
Sulfur Content ppm 29 27 27
Estimated CH Ratio 62090 63323 63252
Est Net Heat of Combustion btulb 18573 18514 18513
Benzene vol 090 100 096
Research Octane Number 932 940 946
Motor Octane Number 838 838 834
(R+M)2 885 889 890
Fuel Units Fuel 6 Fuel 7 Fuel 4
Aromatics vol 2386 2481 2178
Olefins vol 752 892 1074
Saturates vol 6743 5621 4623
Unclassified vol 115 086 015
Ethanol vol 000 920 2111
Benzene vol 089 106 097
CH Ratio 6200 6092 5835
Oxygen wt 0008 1 340 773
Net Heat of Combustion btulb 18703 18016 17160
1 Contains 004 vol MTBE
Fuel Units Fuel 6 Fuel 7 Fuel 4
Oxygen wt 0008 3396 7733
C+H wt 9999 9660 9227
H wt 1389 1362 1350
C wt 8610 8298 7877
Fuel Units 6 7 4
Haltermann D3338 Btulb 18573 18514 18513
Average D3338 Btulb 18579 18514 18491
Oxygen Corrected D3338 Btulb 18579 17860 17103
DHA Btulb 18703 18016 17160
Table 12 (cont)
Suppliers Additional Inspections
Net Heat of Combusion -- Btulb
Carbon Hydrogen and Oxygen
Detailed Hydrocarbon Analysis
40
Vehicle Day 1 Day 2 Day 3
No Fuel Base + Press + Pump RL True HS Perm (Brkthru) Perm (Brkthru) Perm (Brkthru)
E10 - 10 psi 345 --- --- 1278 503 10429 (63) 7069 (348) 7043 (425)
E10 - 7 psi 223 --- --- 994 113 6278 (00) 5065 (00) 4535 (00)
E0 - 9 psi 2229 --- 4921 3870 00 22580 (00) 32310 (00) 23069 (126)
E0 - 7 psi 2991 --- 19896 7269 00 47425 (00) 44517 (00) 31798 (00)
E10 - 10 psi 843 --- --- 3164 04 15479 (310) 17799 (383) 17711 (419)
E10 - 7 psi 664 --- --- 2879 297 12601 (00) 11652 (00) 11653 (00)
E0 - 9 psi 338 --- --- 2492 443 6283 (24) 5810 (136) 5770 (225)
E0 - 7 psi 129 --- --- 2226 187 3672 (00) 2877 (00) 2936 (00)
E20 - 9 psi 553 --- --- 2720 134 11034 (00) 9581 (00) 9812 (00)
E10 - 10 psi 416 --- --- 1916 295 17941 (204) 17309 (346) 17417 (375)
E10 - 7 psi 596 --- --- 2328 719 17834 (00) 17150 (00) 15239 (00)
E0 - 9 psi 195 --- --- 1031 10 4995 (00) 4810 (00) 5072 (26)
E0 - 7 psi 99 --- --- 671 00 3830 (00) 3654 (00) 3670 (00)
E20 - 9 psi 462 --- --- 1697 603 17752 (00) 16900 (00) 16802 (00)
E10 - 10 psi 787 --- --- 8581 2377 14064 (00) 12644 (00) 12237 (00)
E10 - 7 psi 644 --- --- 8122 1222 10865 (00) 8120 (00) 8236 (00)
E0 - 9 psi 325 --- --- 8339 58 4064 (00) 3373 (00) 3080 (00)
E0 - 7 psi 401 --- --- 8425 00 3975 (00) 3026 (00) 2689 (00)
E20 - 9 psi 882 --- --- 10282 00 15480 (00) 13702 (00) 13605 (00)
E10 - 10 psi 976 --- 1209 10012 3929 16449 (00) NA NA
E10 - 7 psi 1468 --- --- 11393 5850 21342 (00) NA NA
E10 - 10 psi 199 --- --- 1383 00 3370 (00) 2268 (191) 2179 (330)
E10 - 7 psi 94 266 --- 563 138 2438 (00) 1838 (00) 1843 (00)
E0 - 9 psi 101 --- --- 837 153 1303 (00) 1158 (129) 1006 (221)
E0 - 7 psi 91 --- --- 1046 07 2071 (00) 1002 (00) 874 (00)
E20 - 9 psi 558 --- --- 4106 00 2840 (00) 2218 (00) 2034 (00)
E10 - 10 psi 551 --- 821 3024 2450 25454 (040) NA NA
E10 - 7 psi 481 --- 1664 2511 62 6783 (00) NA NA
E10 - 10 psi 106 --- --- 1489 00 1243 (00) 879 (00) 1028 (200)
E10 - 7 psi 218 --- --- 2012 00 1848 (00) 1002 (00) 758 (00)
E0 - 9 psi 32 --- --- 1158 04 1005 (00) 708 (00) 574 (00)
E0 - 7 psi 09 --- --- 1845 18 1016 (00) 712 (00) 570 (00)
E20 - 9 psi 47 --- --- 1168 49 1310 (00) 833 (00) 750 (00)
E10 - 10 psi 244 --- --- 1331 574 4920 (00) 8394 (00) 113738 (49)
E10 - 7 psi 239 --- --- 1057 329 5242 (00) 3974 (00) 3944 (00)
E0 - 9 psi 107 --- --- 967 521 4559 (00) 3585 (00) 11017 (00)
E0 - 7 psi 252 --- --- 363 33 4943 (00) 3190 (00) 2815 (00)
E20 - 9 psi 168 --- --- 1394 560 4709 (00) 4400 (00) 7518 (00)
E10 - 10 psi 104 90 --- 719 16 3192 (00) 2602 (00) 2370 (00)
E10 - 7 psi 122 --- --- 979 00 2247 (00) 2317 (00) 2675 (00)
E0 - 9 psi 85 --- --- 811 251 2021 (00) 1659 (2) 1763 (72)
E0 - 7 psi 87 --- --- 797 225 2483 (00) 2941 (00) 2888 (00)
E20 - 9 psi 193 --- --- 1025 00 4168 (00) 4148 (00) 4506 (00)
E10 - 10 psi 324 --- --- 1742 118 25907 (578) 34779 (630) 36014 (643)
E10 - 7 psi 325 --- --- 1683 192 3975 (02) 3550 (01) 3621 (04)
E0 - 9 psi 178 136 --- 1091 254 3270 (00) 2667 (00) 2746 (108)
E0 - 7 psi 204 380 --- 787 00 2117 (00) 2208 (00) 2081 (00)
E20 - 9 psi 204 --- --- 543 74 4685 (00) 4526 (00) 4198 (00)
216
211
2004
Toyota
Camry
XLE
215
2004
Toyota
High-
lander
212
2006
Ford
Taurus
214
2004
Ford
Escape
211L
207L
Static Permeation - mghr Dynamic Perm - mghr
CRC E-77-2 Program Test Results
Diurnal (65ordm to 105ordm) - mgday
202
1996
Taurus
205
2001
Toyota
Corolla
204
1999
Honda
Accord
207
2001
Dodge
Caravan
202L
Table 13
41
Individual Vehicle Diurnal Performance on the Various Fuels
0
1000
2000
3000
4000
5000
6000
0 10 20 30 40 50 60 70
Cu
mu
lati
ve
Pe
rme
ati
on
-m
g
Test Time - hrs
Three Day DiurnalVehicle 204 1999 Honda Accord
10 psi E10
7 psi E10
9 psi E0
7 psi E0
9 psi E20
0
1000
2000
3000
4000
5000
6000
0 10 20 30 40 50 60 70
Cu
mu
lati
ve
Pe
rme
ati
on
-m
g
Test Time - hrs
Three Day DiurnalVehicle 205 - 2001 Toyota Corolla
10 psi E10
7 psi E10
9 psi E0
7 psi E0
9 psi E20
Figure 25 ndash Vehicle 204 Diurnal Performance
Figure 26 ndash Vehicle 205 Diurnal Performance
42
0
500
1000
1500
2000
2500
3000
3500
4000
4500
5000
0 10 20 30 40 50 60 70
Cu
mu
lati
ve
Co
rre
cte
d P
erm
ea
tio
n -
mg
Test Time - hrs
Three Day DiurnalVehicle 207 - 2001 Dodge Caravan
10 psi E10
7 psi E10
9 psi E0
7 psi E0
9 psi E20
0
100
200
300
400
500
600
700
800
900
0 10 20 30 40 50 60 70
Cu
mu
lati
ve
Pe
rme
ati
on
-m
g
Test Time - hrs
Three Day DiurnalVehicle 211 - 2004 Toyota Camry XLE
10 psi E10
7 psi E10
9 psi E0
7 psi E0
9 psi E20
Figure 27 ndash Vehicle 207 Diurnal Performance
Figure 28 ndash Vehicle 211 Diurnal Performance
43
0
50
100
150
200
250
300
350
400
450
500
0 10 20 30 40 50 60 70
Cu
mu
lati
ve
Pe
rme
ati
on
-m
g
Test Time - hrs
Three Day DiurnalVehicle 212 - 2006 Ford Taurus
10 psi E10
7 psi E10
9 psi E0
7 psi E0
9 psi E20
0
500
1000
1500
2000
2500
3000
3500
4000
4500
5000
0 10 20 30 40 50 60 70
Cu
mu
lati
ve
Pe
rme
ati
on
-m
g
Test Time - hrs
Three Day DiurnalVehicle 214 2004 Ford Escape
10 psi E10
7 psi E10
9 psi E0
7 psi E0
9 psi E20
Note The incomplete cumulative results for the 10 psi E10 results resulted from a conflict for the use
of the INNOVA analyzer during the test The INNOVA analyzer is required to correct for the FIDrsquos
ethanol error and the presence of methanol and refrigerant (R-134a) The data was available for the
50+ hour results and the data is valid as shown We have no explanation for the high levels
experienced on the third day of the test No test errors were identified
Figure 29 ndash Vehicle 212 Diurnal Performance
Figure 30 ndash Vehicle 214 Diurnal Performance
44
0
200
400
600
800
1000
1200
1400
1600
0 10 20 30 40 50 60 70
Cu
mu
lati
ve
Pe
rme
ati
on
-m
g
Test Time - hrs
Three Day DiurnalVehicle 215 2004 Toyota Highlander
10 psi E10
7 psi E10
9 psi E0
7 psi E0
9 psi E20
Figure 31 ndash Vehicle 215 Diurnal Performance
45
Table 14
Test Corrected
Vehicle Fuel Total Fuel EtOH R134a Methanol
204 10 psi E10 509899 144040 18298 16754
1999 Honda 7 psi E10 359057 130806 17551 15221
Accord 9 psi E0 178635 13843 18230 9896
7 psi E0 94846 1856 16631 2379
9 psi E20 304271 128408 18261 12143
205 10 psi E10 526659 186599 23354 20895
2001 Toyota 7 psi E10 502229 204246 25990 19198
Corolla 9 psi E0 148775 000 20434 4613
7 psi E0 111536 5489 22408 5619
9 psi E20 514540 212708 25677 19584
207 10 psi E10 389450 196248 12013 30399
2001 Dodge 7 psi E10 272201 114027 11731 19616
Caravan 9 psi E0 105167 1820 12224 15284
7 psi E0 96906 1118 22141 14276
9 psi E20 427882 241488 14268 25432
211 10 psi E10 78164 19733 15159 46970
2004 Toyota 7 psi E10 61190 20211 15929 46525
Camry LE 9 psi E0 34668 1681 14329 42659
7 psi E0 39468 000 16197 57303
9 psi E20 71013 26726 16213 36879
212 10 psi E10 31508 7222 14831 7896
2006 Ford 7 psi E10 36079 10132 15481 3400
Taurus 9 psi E0 22870 2409 15182 3761
7 psi E0 22973 000 15393 4362
9 psi E20 28935 11156 14116 2629
214 10 psi E10 1257887 000 19947 27992
2004 Ford 7 psi E10 131593 24571 16025 8879
Escape 9 psi E0 191611 2940 16487 7213
7 psi E0 109481 5386 80650 3106
9 psi E20 166271 24097 14491 6096
215 10 psi E10 81644 12178 14658 42609
2004 Toyota 7 psi E10 72399 15092 15532 36061
Highlander 9 psi E0 54431 000 14806 25822
7 psi E0 83115 000 14072 26255
9 psi E20 128223 38822 12841 34420
3 Day Diurnal Results
CRC E77-2 Program Diurnal ResultsAll values are in mg
46
0
200
400
600
800
1000
1200
1400
1600
1800
2000
Co
rrecte
d D
aily D
iurn
al
-m
g
Diurnal Ethanol PortionVehicle 204 - 1999 Honda Accord
Ethanol Portion
10 psi E10 9 psi E07 psi E10
1 32
315
341368
383
264273
1 321 321 321 32
9 psi E207 psi E0
1122097
39
0510
442
405412
Figure 32 ndash Vehicle 204 Diurnal Ethanol Portion
0
200
400
600
800
1000
1200
1400
1600
1800
2000
Co
rrecte
d D
aily D
iurn
al
-m
g
Diurnal Ethanol PortionVehicle 205 - 2001 Toyota Corolla
Ethanol Portion
10 psi E10 9 psi E07 psi E10
1 32
359
406
382
431355349
1 321 321 321 32
9 psi E207 psi E0
0 00
712649
406
420414
Figure 33 ndash Vehicle 205 Diurnal Ethanol Portion
47
0
200
400
600
800
1000
1200
1400
1600C
orr
ecte
d D
aily D
iurn
al
-m
g
Diurnal Ethanol PortionVehicle 207 - 2001 Dodge Caravan
Ethanol Portion
10 psi E10 9 psi E07 psi E10
1 32
488
442408
409
490535
1 321 321 321 32
9 psi E207 psi E0
00
1144
27
0101
556
587552
Figure 34 ndash Vehicle 207 Diurnal Ethanol Portion
0
50
100
150
200
250
300
350
400
Co
rrecte
d D
aily D
iurn
al
-m
g
Diurnal Ethanol PortionVehicle 211 - 2004 Toyota Camry XLE
Ethanol Portion
10 psi E10 9 psi E07 psi E10
1 32
264
242245
1 321 321 321 32
9 psi E207 psi E0
329
306356
00
73
64
00
00
00
325
431
370
Figure 35 ndash Vehicle 211 Diurnal Ethanol Portion
48
0
20
40
60
80
100
120
140
160
180
200C
orr
ecte
d D
aily D
iurn
al
-m
g
Diurnal Ethanol PortionVehicle 212 - 2006 Ford Taurus
Ethanol Portion
10 psi E10 9 psi E07 psi E10
1 32
216
170
316
1 321 321 321 32
9 psi E207 psi E0
194
288
436 102
105
85
00
00
00476
529
243
Figure 36 ndash Vehicle 212 Diurnal Ethanol Portion
0
200
400
600
800
1000
1200
Co
rrecte
d D
aily D
iurn
al
-m
g
Diurnal Ethanol PortionVehicle 214 - 2004 Ford Escape
Ethanol Portion
10 psi E10 9 psi E07 psi E10
1 32
00
1 321 321 321 32
9 psi E207 psi E0
201
202152
38
05
19
56
1469
103
171188
143
67
11275
Figure 37 ndash Vehicle 214 Diurnal Ethanol Portion
49
0
50
100
150
200
250
300
350
400
450
500C
orr
ecte
d D
aily D
iurn
al
-m
g
Diurnal Ethanol PortionVehicle 215 - 2004 Toyota Highlander
Ethanol Portion
10 psi E10 9 psi E07 psi E10
1 32
121
136
196
1 321 321 321 32
9 psi E207 psi E0
198
217213
0000
00
0000
00
335 292
283
Figure 38 ndash Vehicle 215 Diurnal Ethanol Portion

11
2 Running Loss Test (Dynamic Test)
A The vehicle is placed in the RL-SHED and prepared for test (The fuel level and
condition for the dynamic test is the fuel remaining after completion of the static test ndash
40 fresh fill of the appropriate test fuel)
B Outside air source for the engine is connected
C Vehicle exhaust is connected
D Fuel tank thermocouple is connected
E Canister vent is connected to the SHED bulkhead fitting which routes the vapor to the
trap canister outside the SHED
F Vehicle is allowed to stabilize in the RL-SHED at test temperature (86degF) for a minimum
of 12 hours ndash preferably overnight
G Two cycles of the Unified Cycle (LA-92) driving schedule (48 mins) are driven while
measuring the mass emissions in the SHED Vehicle is allowed to idle (in drive) for 30
seconds between the two cycles Ambient air temperature is maintained (to the extent
possible) at 86degF Fuel tank surface temperature is monitored during vehicle operation It
should increase during the drive from 10 to 18degF to simulate expected on-road
temperature increase Measured mass emissions are corrected using the INNOVA data
for the ethanol methanol and refrigerant emissions
3 Hot Soak10
This procedure is executed immediately following the Running Loss Test procedure
described above
A Engine is turned off transmission selector is placed in park and driver exits the
enclosure using the double door air lock taking care to minimize any air exchange
between the laboratory and the SHED This starts the one hour ldquohot soakrdquo period
B Measurements of mass emissions in the SHED are continued for another 60 minutes
(until time = 108 minutes) correcting for the ethanol methanol and refrigerant mass
using the INNOVA instrument data This ends the hot soak Hot soak emissions are
calculated as the net difference for the one hour hot soak (CorrMass108 ndash CorrMass48
minus the 86degF static hourly rate all mass rates in mghour)
4 Diurnal Test
A The fuel tank is drained and filled to 40 tank capacity with the test fuel
B The day before testing the vehicle is driven over four road trips of 75 miles each to
precondition the vehicle and the canister
C Upon return from the road pre-conditioning the fuel tank is drained and filled to 40
tank capacity with the test fuel
D The vehicle is parked for 18-22 hours in a controlled temperature environment at the
initial diurnal test temperature (65ordmF)
E The SHED is sealed allowed to stabilize at the 65degF temperature and the 3-day
California Diurnal Test is started
10 We define the ldquohot soakrdquo to be the temporary increase in emission rate caused by the immediately preceding
operation of the vehicle It is the increase in the SHED mass (corrected for EtOH MeOH and R-134a) over the
one hour period minus the previously established ldquostaticrdquo permeation rate
12
F ldquoContinuousrdquo (every 30 seconds) THC measurements are made using a FID Ethanol
methanol and R134a (refrigerant) concentrations are measured using an INNOVA
analyzer at least every 10 minutes for the duration of the test (72 hours)
Static Permeation Test ndash Leak Validation
If a leak is detected during either the vapor system pressure portion (Step J) or the pump
energized portion (Step K) of the Static Permeation Test procedure it calls into question whether
the permeation rate measurement accurately reflects fuel system permeation or if instead a
combination of permeation and the implied leak was measured If a leak is confirmed the
permeation rate measurement is called into question and an investigation possible remedy and
retest is indicated
The permeation rate measurement must be corrected for the FIDrsquos ethanol misrepresentation and
the presence of non-fuel hydrocarbons (methanol and refrigerant) The leak check however is
made using the change in mass increase in the SHED using the uncorrected FID mass calculation
as the determinate It was found that the corrections for ethanol methanol and refrigerant were
introducing ldquonoiserdquo into the trace and that these were being misinterpreted as leaks
y = 062x - 19
y = 047x + 67
y = 055x - 01
0
10
20
30
40
50
60
70
80
90
100
0 20 40 60 80 100 120
SH
ED
Mas
s -
mg
Test Time - minutes
Leak TestVehicle 204 - 1999 Honda Accord - 9 psi E0
Test 7028
Pump ActivatedTank Pressurized
Figure 8 above represents the calculations made during the inspection of data from a successful
test EXCELrsquostrade ldquoSLOPErdquo function is used to calculate the linear regression values based on
the FID calculation for mass for Time 0 to 60 minutes Time 64 to 90 minutes and Time 94 to
120 minutes A 4-minute gap was included between each sequence to establish the new mass
emission rate during the ldquopressure onrdquo (T60 to T90) and the ldquopump energizedrdquo periods
The slope of 047 for the ldquoTank Pressurizedrdquo period in the example above is compared to the
slope of 062 calculated for the permeation rate (or hot soak) period Since the ldquoTank
Figure 8 ndash Leak Test
13
Pressurizedrdquo slope is not more than 10 higher than the hot soak permeation rate we assume
that there is no leak present A similar comparison is made for the slope determined during the
ldquopump onrdquo period The choice of a 10 allowance is arbitrary and is used here to allow for
normal and unavoidable test variation
For tests in which the above procedure determines that no leak is present a value of zero is
reported in the test summary for the leak results If a positive value is reported it calls that test
into question and an investigation possible repair and retest is indicated
Static Permeation Rate Determination
The static permeation rate is determined based on a linear regression through the individual
SHED mass data points (data measured each 30 seconds) of the corrected fuel results (corrected
for the FID error and subtracting the methanol and refrigerant) from the first 60 minutes of
testing as illustrated in Figure 9 below
y = 05636x + 0505
0
5
10
15
20
25
30
35
40
45
0 10 20 30 40 50 60
Pe
rme
ati
on
-m
gs
Test Time - mins
Static Permeation DeterminationVehicle 204 - 1999 Honda Accord - 9 psi E0 Fuel
Raw SHED
Corrected Fuel
Permeation Rate Based on Corrected Results
Permeation Rate = 5636 x Time = 338 mgshr
In this example the static permeation rate is 338 mghr
Dynamic (Running Loss) and Hot Soak Test
The preceding section addressed the concepts of separating the permeation emissions from the
tank venting emissions and establishing the presence or absence of leaks The second part of
this study includes a dynamic test to measure the permeation and tank venting emissions during
Figure 9 ndash Static Permeation Determination
14
vehicle operation (ldquorunning lossesrdquo) and the temporary condition following vehicle operation
known as the ldquohot soakrdquo
This is considered a ldquodynamicrdquo test because the vehicle is driven and the fuel and vapor system
temperatures rise during the test The ambient temperature in the Running Loss SHED during
the test was held constant at 86degF while the vehiclersquos fuel system temperature rose during the
test Two 1435 second (239-minute) LA-92 driving cycles were performed consecutively during
the running loss measurements with a 30-second idle in-between During this test tank fuel
temperature was expected to rise by an average approximately 18degF above the initial ambient
temperature The running loss air handling system included a proportional speed under-car
blower operated as a slave to dynamometer speed This apparatus was used during running loss
testing with minor tuning for specific vehicles Without additional input it is capable of
reasonable fuel tank temperature control Each vehicle was fitted with a surface-mount
thermocouple at the front of the fuel tank located at approximately the 18th
fill level to measure
the fuel liquid temperature No attempt was made to follow a predefined fuel tank temperature
profile (FTTP) in this program Fuel temperatures were recorded and results are available in the
real-time records
Vehicle running loss emissions are measured in a special version of a SHED known as a
Running Loss SHED (RL-SHED) shown in Figure 10 Special features of the RL-SHED
include a sealed chassis dynamometer for simulating vehicle driving loads a sealed outside air
supply for engine intake a sealed exhaust conduit for engine exhaust and an under-chassis fan
for simulating underbody air flow as described above A vehicle is operated inside the RL-SHED
over a chosen driving cycle The increase in HC emissions inside the enclosure are measured
and calculated as mass emissions per 40 CFR sect86163-96
Figure 10 - Running Loss SHED
15
Vehicle testing in an RL-SHED is complicated by several factors including
1 Engine must be supplied with external induction air
2 Exhaust must be conducted externally without any leaks
3 Load supplied to the vehicle through the chassis dynamometer must not create or
allow external leaks
4 Internal SHED temperature must be maintained while sizable heat is rejected to the
ambient by the running engine and exhaust
5 Cooling air supplied to the radiator must be modulated to represent the vehiclersquos road
speed
6 Underbody (and especially the fuel system) temperature should represent the rate of
rise experienced by a real road-drive
Canister vent losses were isolated from permeation emissions using the technique previously
described The vehiclersquos carbon canister fresh air vent was connected to the outside of the RL-
SHED using a leak-tight PTFEreg
hose (38rdquo OD commercial tubing US Plastics 58055 PTFE or
equivalent) connected to a small carbon ldquotraprdquo canister located on a top-loading precision scale
The scale precision was 001 grams (10 milligrams) and it was purged prior to each test There
were no tank venting emissions measured on any of the running loss test measurements All of
the vehicles appeared to be actively ldquopurgingrdquo their respective control canisters and drawing
fresh air during the test If there were any emissions from the vehiclersquos control canister as might
have occurred if there were no vehicle purge or if very high volatility fuels with excessive vapor
generation were used they would have been measured
The Running Loss Driving Cycle consisted of two cycles of the ldquoUnified Driving Cyclerdquo
otherwise known as the LA-92 A velocity versus time plot for one cycle is shown in Figure 11
The LA-92 cycle takes 24 minutes to complete and covers 98 miles with many speed changes
Two back-to-back cycles were driven the first as a ldquocold startrdquo and the second following a 30-
second vehicle idle The ldquocold startrdquo condition was created by soaking the vehicle for a
Figure 11 ndash Running Loss Driving Cycle
Unified Cycle (LA-92)
0
10
20
30
40
50
60
70
80
0 5 10 15 20 25Test Time - minutes
Spe
ed -
mph
Cycle Time (min) 239
Maximum Speed (mph) 672
Average Speed (mph) 246
Average Non-Zero Speed (mph) 294
Time Zero Speed () 162
Distance (miles) 982
16
minimum of 18 hours at 86degF moving it to the stabilized 86degF RL-SHED making the test
connections and then waiting a minimum of one hour before the initial start and run
The SHED emissions were measured during 48 minutes of engine operation and then
continuously for one hour after the engine was turned off This one hour engine-off duration
was the ldquohot soakrdquo period The total test time is 1 hour and 48 minutes
Figure 12 shows results from the 9 psi E0 fuel test on Vehicle 204 The horizontal axis is test
time in minutes and the vertical axis is the HC mass measured in the RL-SHED during the test
period
The engine was shut off at the end of the second LA92 drive cycle (~48 minutes) and the
analysis system continued to measure the HC emissions in the SHED for the next 60 minutes
This represented the ldquohot soakrdquo portion of the test
0
50
100
150
200
250
300
0 20 40 60 80 100 120
Co
rre
cte
d T
ota
l F
ue
l C
um
ula
tiv
e P
erm
ea
tio
n -
mg
Test Time - minutes
Running Loss and Hot SoakVehicle 204 - 1999 Honda Accord - 9 psi E0 Fuel
Test 25668
Running Loss Hot Soak
Running Loss Std =005 gmiThis Test = 0010 gmi
RL = 249 mghr
2774
2332
Tru HS = 442
1990
The ldquoTruerdquo Hot Soak
The traditional hot soak is determined from the increase in SHED emissions as measured for one
hour following a prescribed drive to heat up the vehicle (2 LA-92 cycles during the Running
Loss Test) Hot soak emissions however have two components that caused by the elevated
temperature resulting from the drive and that resulting from one hour of static permeation
Figure 12 ndash Running Loss Test Results
17
To separate these two components and determine the ldquotruerdquo hot soak emissions the following
procedure was used ldquoTraditionalrdquo hot soak emissions were first calculated by subtracting the
ldquostart of hot soakrdquo cumulative SHED hydrocarbon value (ie 199 mg t = 48 minutes) from
the final cumulative SHED hydrocarbon value (ie 2774 mg t = 108 min) This resulted in a
cumulative SHED hydrocarbon value of 78 mg for the 1 hour hot soak The previously
determined static permeation value (ie 338 mg for a 1 hour hot soak test- see Figure 9) was
then subtracted to arrive at the ldquotruerdquo hot soak value of 442 mg The increase in the permeation
rate (the ldquohot soak effectrdquo) caused by the increase in the system temperature is accounted for by
subtracting the ldquostabilized permeation raterdquo at 86degF
In Figure 12 the static permeation rate is superimposed as a solid blue line on the plot from the
starting point of the hot soak until its end (one hour) While the ldquotraditionalrdquo hot soak would be
calculated as 78 mg (277 mg ndash 199 mg) the ldquotruerdquo hot soak is determined as 442 mg (2774 mg
ndash 2332 mg) True hot soak values reported here were determined in this manner
Diurnal Test
Diurnal permeation was determined by subjecting the vehicle to a three-day period in a
temperature controlled SHED while continuously recording the total hydrocarbon every 30
seconds The SHED environmental temperature was varied from 65degF to 105degF per the
California Diurnal Test protocol Canister vent losses were isolated from permeation emissions
using the technique previously described The vehiclersquos carbon canister fresh air vent was
connected to the outside of the RL-SHED using a leak-tight PTFEreg
hose connected to a small
carbon ldquotraprdquo canister located on a top-loading precision scale The scale precision was 001
grams (10 milligrams) and it was purged before each test
DISCUSSION OF TEST RESULTS
Results
Emission results are presented below by ldquomechanism11
rdquo with the data averaged for the five
ldquoenhancedrdquo and the two ldquonear zerordquo vehicles The lone ldquopre-enhancedrdquo vehicle the 1996 Ford
Taurus (202) was a special case and will be discussed in a separate section Two of the vehicles
the 2001 Dodge Caravan (207) and the 2004 Toyota Camry (211) were also subjected to limited
testing with an ldquoimplanted leakrdquo (a 0020rdquo dia hole in a special tank gas cap) to investigate the
magnitude of a known leak These results (ldquoLeakersrdquo) follow the discussion on the Taurus
Static Permeation Rate (Constant Temperature (86degF)) - Average permeation rate compared
by fuel specification for two vehicle groups ldquoenhancedrdquo and the ldquonear zerordquo evaporative
emissions
11 The ldquomechanismsrdquo are 1 Permeation 2 Tank Venting (Daily Temperature Rise) and 3 Leaks
18
0
10
20
30
40
50
60
Co
rrecte
d P
erm
eati
on
Rate
-m
gh
r
Fuel
Static Permeation Rate - All FuelsE77-2 Program Vehicles
7 E0 9 E2010 E107 E109 E0 7 E0 9 E2010 E107 E109 E0
Enhanced(5 veh)
Near Zero(2 veh)
Figure 13 presents the static permeation rate performance for the average of the 5 ldquoenhancedrdquo
and 2 ldquonear zerordquo vehicles on the five fuels included in the test program Each group is ordered
from left to right by ethanol level The vertical scale is the average permeation rate in mghour
for the static (86degF constant temperature) test
Previous studies1213
had shown that vehicles operated on the fuel containing 10 vol- ethanol
would have higher permeation rates compared to those resulting from operation on a non-ethanol
(E0) fuel of similar properties We also expected that vehicles using higher vapor pressure fuel
would exhibit increased permeation levels at similar ethanol levels Other studies had reported
mixed results when comparing E20 permeation rates against E10 measurements ndash some were
higher and some were lower The difference may have been within the repeatability of the
measurements and probably suffered from a limited number of observations These mixed
results are present in this testing of the enhanced vehicles however the E20 (violet bar) is higher
on average for static permeation rate for the Near Zero group The data that were used to
construct the averages in Figure 13 are listed in Table 3 below There is significant variability in
the test results and the limited sample size precludes making conclusive statements with
statistical confidence
12 CRC E-653 Fuel Permeation from Automotive Systems E0 E6 E10 E20 and E85 December 2006 13
CRC E-77 Vehicle Evaporative Emission Mechanisms A Pilot Study June 2008
Figure 13 ndash Static Permeation Rate Comparison
19
Table 3
Vehicle ID Technology 7psi E0 9 psi E0 7 psi E10 10 psi E10 9 psi E20
204
1999 Honda Enhanced 129 338 664 843 553
Accord
205
2001 Toyota Enhanced 99 195 596 416 462
Corolla
207
2001 Dodge Enhanced 401 325 644 787 882
Caravan
214
2004 Ford Enhanced 252 107 239 244 168
Escape
215
2004 Toyota Enhanced 87 85 122 104 193
Highlander
194 210 453 479 452
211
2004 Toyota Near Zero 91 101 94 199 558
Camry XLE
212
2006 Ford Near Zero 09 32 218 106 47
Taurus
50 67 156 153 303
Static Permeation Rate - mghr
CRC E-77-2 Program - Static Permeation Results
Enhanced Averages
Near Zero Averages
Summary ndash Static permeation rate increased with increase in ethanol level Three of the 5
enhanced emission vehicles did not show an increase in permeation rate when tested with the 9
psi E0 compared to the 7 psi E0
20
Dynamic (Running Loss) Permeation - In a similar presentation Figure 14 shows the average
ldquoRunning Lossrdquo permeation rate for the vehicle types and the fuels tested ldquoRunning Lossrdquo
permeation as described here is the permeation measured during a ldquocold startrdquo 48 minute drive in
a Running-Loss SHED (RL-SHED) at 86degF
0
50
100
150
200
250
300
350
400
7E0 9E0 7E10 10E10 9E20 7E0 9E0 7E10 10E10 9E20
Co
rre
cte
d R
un
nin
g L
os
s P
erm
ea
tio
n -
mg
hr
Fuel
Running Loss Permeation Rate - All FuelsE77-2 Program Vehicles
Enhanced(5 vehs)
Near Zero(2 vehs)
The dynamic permeation rates for the enhanced vehicles (left panel) followed a similar pattern as
the static permeation The average of the E20 fuel was the highest of the average values
observed on both the enhanced and the near-zero vehicles (left and right panels respectively)
Table 4 below shows the data used to generate the averages used in Figure 14
Figure 14 ndash Running Loss Permeation Comparison
21
Table 4
Vehicle ID Technology 7psi E0 9 psi E0 7 psi E10 10 psi E10 9 psi E20
204
1999 Honda Enhanced 2226 2492 2879 3164 2720
Accord
205
2001 Toyota Enhanced 671 1031 2328 1916 1697
Corolla
207
2001 Dodge Enhanced 8425 8339 8122 8581 10282
Caravan
214
2004 Ford Enhanced 363 967 1057 1331 1394
Escape
215
2005 Toyota Enhanced 797 811 979 719 1025
Highlander
2496 2728 3073 3142 3424
211
2004 Toyota Near Zero 1046 837 563 1383 4106
Camry XLE
212
2006 Ford Near Zero 1845 1158 2012 1489 1168
Taurus
1446 998 1288 1436 2637
Enhanced Averages
Near Zero Averages
CRC E-77-2 Program - Running Loss Permeation Results
Running Loss Permeation Rate - mghr
Summary ndash The dynamic permeation rate (measured during vehicle operation) was higher with
the E10 fuel compared to E0 for the enhanced vehicles The E20 permeation rate was higher
than E0 and the E10 fuel The small sample size and limited data precludes us from making
statements about statistical confidence but this may indicate a trend The near zero vehicle
average increased as the ethanol level increased Trends with volatility were mixed or
inconclusive
22
Hot Soak (ldquoTrue Hot Soakrdquo) Permeation ndash The Hot Soak emissions as defined in this report
are the net increase in permeation rate following vehicle operation We measured the mass
increase in the SHED for one hour immediately following vehicle operation and subtracted the
previously measured static (or normal) permeation at the same temperature While this is not the
traditional Code of Federal Regulations (CFR) definition we feel it is appropriate for the intent
of this project
0
10
20
30
40
50
60
70
7E0 9E0 7E10 10E10 9E20 7E0 9E0 7E10 10E10 9E20
Co
rre
cte
d H
ot
So
ak
Pe
rme
ati
on
-m
gh
r
Fuel
True Hot Soak Permeation Rate - All FuelsE77-2 Program Vehicles
Enhanced(5 vehs)
Near Zero(2 vehs)
The ldquoTrue Hot Soakrdquo performance for the average of the Enhanced Vehicles is summarized in
Figure 15 above There was a large increase in the hot soak value with the E10 fuel compared to
the E0 The hot soak value with the E20 fuel was comparable to the E0 results and lower than
the E10
The Near Zero vehicles (2) had zero hot soak emissions when tested on the 10 psi E10 fuel
(Figure 16) With only two vehicles and the very low levels attained no statistically significant
conclusions can be drawn from the data available Table 5 presents the individual tests used in
calculating the average values plotted in Figure 15
Figure 15 ndash True Hot Soak Permeation Comparison
23
Table 5
Vehicle ID Technology 7psi E0 9 psi E0 7 psi E10 10 psi E10 9 psi E20
204
1999 Honda Enhanced 187 443 297 04 134
Accord
205
2001 Toyota Enhanced 00 10 719 295 603
Corolla
207
2001 Dodge Enhanced 00 58 1222 2377 00
Caravan
214
2004 Ford Enhanced 33 521 329 574 560
Escape
215
2005 Toyota Enhanced 225 251 00 16 00
Highlander
89 257 513 653 259
211
2004 Toyota Near Zero 07 153 138 00 00
Camry XLE
212
2006 Ford Near Zero 18 04 00 00 49
Taurus
13 79 69 00 25
CRC E-77-2 Program - True Hot Soak Permeation Results
True Hot Soak Permeation Rate - mghr
Near Zero Averages
Enhanced Averages
Summary - The True Hot Soak permeation (permeation rate measured following vehicle
operation less the static constant temperature permeation rate) rate was higher with the E10 fuel
compared to E0 for the enhanced vehicles The E20 permeation rate was higher than E0 and
lower than the E10 fuel The near zero vehicle trends with both ethanol content and volatility
were mixed or inconclusive The small sample size and limited data precludes us from making
statements about statistical confidence
24
Diurnal Permeation Performance ndash Figure 16 presents the diurnal permeation results for the
first day of the three-day diurnal test (65deg to 105degF)
0
200
400
600
800
1000
1200
7E0 9E0 7E10 10E10 9E20 7E0 9E0 7E10 10E10 9E20
Co
rre
cte
d F
ue
l D
iurn
al
Pe
rme
ati
on
-m
gs
da
y
Day 1 Diurnal Permeation RatesAverages from E-77-2 Vehicles
Fuel
Enhanced(5 vehs)
Near Zero(2 vehs)
The average day 1 diurnal permeation for the five Enhanced Vehicles tended to increase as
ethanol content increased (with the exception of the E20 fuel) Again sample size and limited
data makes statistical conclusions inappropriate Table 6 presents the individual test used to
generate the averages used in Figure 16 The table includes the data from days 2 and 3 The
ethanol content of the diurnal measurements was calculated and appear in a series of figures in
the Appendix starting at page 37 Unlike Figure 16 the figures shown in the appendix have not
been corrected to exclude the non-fuel emissions (methanol and refrigerant) that were present
during these tests
Figure 16 ndash Day 1 Diurnal Permeation Comparison
25
Table 6
Vehicle ID Technology 7psi E0 9 psi E0 7 psi E10 10 psi E10 9 psi E20
204 Day 1 3672 6283 12601 15479 11034
1999 Honda Enhanced Day 2 2877 5810 11652 17799 9581
Accord Day 3 2936 5770 11653 17711 9812
205 Day 1 3830 4995 17834 17941 17752
2001 Toyota Enhanced Day 2 3654 4810 17150 17309 16900
Corolla Day 3 3670 5072 15239 17417 16802
207 Day 1 3975 4064 10865 14064 15480
2001 Dodge Enhanced Day 2 3026 3373 8120 12644 13702
Caravan Day 3 2689 3080 8236 12237 13605
214 Day 1 4943 4559 5242 4920 4709
2004 Ford Enhanced Day 2 3190 3585 3974 8394 4400
Escape Day 3 2815 11017 3944 113738 7518
215 Day 1 2483 2021 2247 3192 4168
2004 Toyota Enhanced Day 2 2941 1659 2317 2602 4148
Highlander Day 3 2888 1763 2675 2370 4506
3781 4384 9758 11119 10629
211 Day 1 2071 1303 2438 3370 2840
2004 Toyota Near Zero Day 2 1002 1158 1838 2268 2218
Camry XLE Day 3 874 1006 1843 2179 2034
212 Day 1 1016 1005 1848 1243 1310
2006 Ford Near Zero Day 2 712 708 1002 879 833
Taurus Day 3 570 574 758 1028 750
1544 1154 2143 2307 2075
CRC E-77-2 Program Results - Diurnal Permeation
Diurnal Permeation Rate - mgday
Enhanced Averages
Near Zero Averages
Carbon Canister Breakthrough ndash Canister breakthrough is measured by the weight change
recorded for the trap canister outside the SHED It quantifies the amount of vapors that
overwhelm the evaporative system storage canister Figure 17 displays the breakthrough
resulting from testing of 9 psi E0 fuel Only four of seven vehicles exhibited breakthrough
60
65
70
75
80
85
90
95
100
105
110
0
5
10
15
20
25
30
35
40
0 10 20 30 40 50 60 70
SH
ED
Te
mp
era
ture
-d
eg
F
Bre
ak
thro
ug
h -
mg
Test Time - hrs
Canister Breakthrough9 psi E0 Fuel - 65ordm to 105ordm F Diurnal
204 - 1999 Honda Accord
211 - 2004 Toyota Camry
215 - 2004 Toyota Highlander
205 - 2001 Toyota Corolla
Figure 17 ndashDiurnal Canister Breakthrough
26
Table 7 shows the breakthrough generated during the diurnal tests conducted
Table 7
Vehicle ID Technology 7psi E0 9 psi E0 7 psi E10 10 psi E10 9 psi E20
204 Day 1 --- 24 --- 310 ---
1999 Honda Enhanced Day 2 --- 136 --- 360 ---
Accord Day 3 --- 198 --- 360 ---
205 Day 1 --- --- --- 204 ---
2001 Toyota Enhanced Day 2 --- --- --- 309 ---
Corolla Day 3 --- 26 --- 293 ---
207 Day 1 --- --- --- --- ---
2001 Dodge Enhanced Day 2 --- --- --- --- ---
Caravan Day 3 --- --- --- --- ---
214 Day 1 --- --- --- --- ---
2004 Ford Enhanced Day 2 --- --- --- --- ---
Escape Day 3 --- --- --- 49 ---
215 Day 1 --- --- --- --- ---
2004 Toyota Enhanced Day 2 --- 02 --- --- ---
Highlander Day 3 --- 72 --- --- ---
211 Day 1 --- --- --- --- ---
2004 Toyota Near Zero Day 2 --- 129 --- 191 ---
Camry XLE Day 3 --- 176 --- 289 ---
212 Day 1 --- --- --- --- ---
2006 Ford Near Zero Day 2 --- --- --- --- ---
Taurus Day 3 --- --- --- 204 ---
CRC E-77-2 Program - Carbon Canister Diurnal Breakthrough Results
Diurnal Breakthrough - grams
Summary ndash The lack of canister breakthrough for the 7 psi fuels (summer grade) indicates that
the storage capacity of the seven systems tested is appropriately sized Breakthrough began to
appear when testing of 9 psi E0 fuel (not summer grade) and was more prevalent with the 10 psi
E10 fuel (winter grade) The lack of breakthrough with the 9 psi E20 fuel seems to be an
anomaly
27
Overall Trend Summary - The following chart (Figure 18) visually summarizes the trends seen
from all testing performed during this program
Higher Volatility E0 to E10 E0 to E20 E10 to E20
uarr uarr uarr uarr
Higher Volatility E0 to E10 E0 to E20 E10 to E20
uarr uarr uarr uarr
Higher Volatility E0 to E10 E0 to E20 E10 to E20
uarr uarr uarr uarr
Higher Volatility E0 to E10 E0 to E20 E10 to E20
uarr uarr uarr uarr
Higher Volatility E0 to E10 E0 to E20 E10 to E20
uarrharr uarr uarr uarr
Higher Volatility E0 to E10 E0 to E20 E10 to E20
uarr uarr uarr uarr
Higher Volatility E0 to E10 E0 to E20 E10 to E20
uarr darr darr
Higher Volatility E0 to E10 E0 to E20 E10 to E20
uarr uarr uarr harr
Ethanol Content
Diurnal
Trend Analysis for E-77-2 Program
Ethanol Content
Static Permeation
Ethanol Content
Running Loss Permeation
Ethanol Content
Ethanol Content
Diurnal
Enhanced Vehicles (Sample of 5)
Static Permeation
Ethanol Content
Ethanol Content
Running Loss Permeation
Ethanol Content
True Hot Soak (TEFVO)
Near-Zero Vehicles (Sample of 2)
True Hot Soak (TEFVO)
Figure 18 Trend Analysis Summaries
28
Vehicle 202 ndash 1996 Ford Taurus - Special Case
We have treated vehicle 202 as a special case This was the oldest of the vehicles tested and had
been subjected to limited exhaust emission tests with a 20-volume percent ethanol fuel (E20)
during the CRC E-74b test program
Vehicle 202 completed the E10 portion of the test program (10 and 7 psi fuels) successfully and
completed the road preconditioning on the E0 fuel prior to the E0 evaluations The first test on
the E0 fuel was excessively high indicating a fuel leak It was traced to a leaky fuel injector o-
ring and there was considerable discussion as to an appropriate repair Tests were made on the 9
and the 7 psi E0 fuel to measure the magnitude of a vehicle in a ldquoleakrdquo condition and the tests
were labeled as ldquo202L (Leak)rdquo The fuel injector o-rings were replaced as a complete set and
the vehicle resumed testing as ldquo202Rrsquo (Repaired) A new elusive vapor leak was present later
identified as a very small leak at the top of the fuel fill pipe
The circle on Figure 19 at the right shows
the location of the small leak This leak
was problematic as to its effect on the
emission measurements because its
magnitude or presence seemed to depend
on the torque exerted on the fuel cap The
tests on the E0 fuels (9 and 7 psi) are
noted as 202R but with a vapor leak
We attempted to fix this leak and repeated
the E10 test with the vehicle re-identified
as 216 with reasonable results We also
ran the E20 test sequence and declared the
vehicle done
The testing history for this vehicle is shown in Tables 8 (Static) 9 (Dynamic) and 10 (Diurnal)
The tests highlighted in yellow are those that exhibited a liquid or vapor leak as identified during
the static test leak validation
Figure 19 ndash Vehicle 202 Fuel Fill Pipe Leak
29
Table 8
Static Permeation Results 1996 Ford Taurus SHED
Corrected Results Canister
Fuel Permeation mgday Loss
Veh psiEtOH Test Type Date Test mghr (Corrected) g
202 100E10 Static Perm 071807 7018 345 000
Press Incr 00 No Leak
Prs+Fuel Incr 00
202 70E10 Static Perm 082107 7031 223 000
Press Incr 00 No Leak
Prs+Fuel Incr 00
202L 90E0 Static Perm 030408 7169 2292 000
Press Incr DNA
Prs+Fuel Incr 4921 Liquid Leak
202L 70E0 Static Perm 032008 7183 2991 000
Press Incr DNA
Prs+Fuel Incr 19896 Liquid Leak
202R 90E0 Static Perm 050808 7228 178 000
Press Incr 136 Vapor Leak
Prs+Fuel Incr 00
202R 70E0 Static Perm 052208 7239 204 000
Press Incr 380 Vapor Leak
Prs+Fuel Incr 00
216 100E10 Static Perm 081408 7299 324 000
Press Incr 00 No Leak
Prs+Fuel Incr 00
216 70E10 Static Perm 091708 7326 325 000
Press Incr 00 No Leak
Prs+Fuel Incr 00
216 90E20 Static Perm 103008 7363 204 000
Press Incr 00 No Leak
Prs+Fuel Incr 00
30
Table 9
Dynamic Permeation Results 1996 Ford Taurus SHED
Corrected Results Canister From
Fuel Permeation mgday Loss Static
Veh psiEtOH Test Type Date Test mghr (Corrected) g Test
202 100E10 Dynamic RL 072007 25662 1278 000 No Leak
TEFVO 386 000
202L 90E0 Dynamic RL 030508 25695 3870 000 Liquid Leak
TEFVO 00 000
202L 70E0 Dynamic RL 032408 25699 7269 000 Liquid Leak
TEFVO 00 000
202R 90E0 Dynamic RL 050908 25704 1091 000 Vapor Leak
TEFVO 50 000
202R 70E0 Dynamic RL 052308 25706 787 000 Vapor Leak
TEFVO 00 000
216 100E10 Dynamic RL 081508 25718 1742 000 No Leak
TEFVO 14 000
216 70E10 Dynamic RL 091808 25721 1683 000 No Leak
TEFVO 423 000
216 90E20 Dynamic RL 110708 25730 543 000 No Leak
TEFVO 00 000
31
Table 10
Diurnal Permeation Results 1996 Ford Taurus SHED
Corrected Results Canister From
Fuel Permeation mgday Loss Static
Veh psiEtOH Test Type Date Test mghr (Corrected) g Test
202 100E10 72 DHB 65-105 073107 7023
Day 1 10429 612 No Leak
Day 2 7069 3264
Day 3 7043 3869
202 70E10 72 DHB 65-105 082807 7034
Day 1 6278 000 No Leak
Day 2 5065 000
Day 3 4535 000
202L 90E0 72 DHB 65-105 031108 7173
Day 1 22589 000 Liquid Leak
Day 2 32310 000
Day 3 23069 1260
202L 70E0 72 DHB 65-105 040108 7196
Day 1 47425 000 Liquid Leak
Day 2 44517 000
Day 3 31798 000
202R 90E0 72 DHB 65-105 051308 7230
Day 1 3270 000 Vapor Leak
Day 2 2667 000
Day 3 2746 1083
202R 70E0 72 DHB 65-105 052808 7243
Day 1 2117 000 Vapor Leak
Day 2 2208 000
Day 3 2081 000
216 100E10 72 DHB 65-105 082008 7305
Day 1 25907 5777 No Leak
Day 2 34779 6299
Day 3 36014 6343
216 70E10 72 DHB 65-105 092308 7331
Day 1 3975 022 No Leak
Day 2 3550 006
Day 3 3621 037
216 90E20 72 DHB 65-105 111108 7373
Day 1 4685 000 No Leak
Day 2 4526 000
Day 3 4198 000
32
The Implanted Leak Test Results
Project E-77-2 included evaluating two vehicles with implanted leaks This interest followed the
information gathered in the Pilot Study where tests were run with a specially modified fuel cap
containing a 002rdquo dia hole The results with the implanted leak from the Pilot Study are
repeated in Table 11 below as the diurnal results are shown for a 1996 Chevrolet Cavalier first
without the implanted leak at 038 grams per day and then at 207 grams per day (a 54x
increase) with the leak
Table 11
Veh No
Evap
Tech Fuel
Results
gmsday
gms
Increase
6 1996 Chevrolet Cavalier Enhanced 7 psi E0 038
7 2070 2032
207 2001 Dodge Caravan Enhanced 7 psi E10 109
207L 213 104
211 2004 Toyota Camry LE Near Zero 7 psi E10 024
211L 068 044
- Implanted 020 leak in fuel cap
Vehicle Description
Implanted Leak Impact on Diurnal PermeationDay One Results 65deg - 105degF Diurnal
The two E-77-2 vehicles (207 amp 211) were given a limited evaluation with an induced leak and
saw a significantly lesser impact Vehicle 207 gave diurnal results increases from 109 to 213
grams per day (a 2x increase) and Vehicle 211 increased from 024 grams per day to 068 grams
per day (a 28x increase) The following Figure 20 displays the imbedded leak impact from Table
11
33
0
5
10
15
20
On
e D
ay
Diu
rna
l P
erm
ea
tio
n -
gm
sd
ay
Vehicle Number
Implanted Leak Impact on One Day Diurnal Permeation020 Leak in Fuel Cap - 65 to 105 F Diurnal
207L 211L21120776
As Received - No Leak
020 Fuel Cap Leak
The newer vehicles evaluated in this phase of the study were configured and certified to the
Onboard Refueling Vapor Regulations (ORVR) These are capable of containing 95 or more
control of the refueling vapors at up to 10 gallons per minute fueling rate Where the Chevrolet
Cavalier had a small (0055rdquo dia) orifice and a long vapor tube venting the tankrsquos vapor space to
the carbon canister (and then to the atmosphere) the ORVR compliant vehicles have a large
(0688rdquo ID) short vent hose to a low flow restriction carbon canister
The following bar charts (Figures 21 through 24) show the impacts of the leak on all phases of
the evaporative testing performed and compare those results with all fuels tested With only two
vehicles (207 and 211) evaluated on two fuels statistically significant effects cannot be
quantified but the trend of increased emissions is apparent
Figure 20 ndash Implanted Leak Impact
34
0
20
40
60
80
100
120
140
160
7E0 9E0 7E10 10E10 9E20 7E0 9E0 7E10 10E10 9E20
Sta
tic
Pe
rme
ati
on
-m
gh
r
Fuel
0020 dia Induced Leak EffectStatic Permeation
Vehicle 211Vehicle 207
Leak
Leak
0
200
400
600
800
1000
1200
7E0 9E0 7E10 10E10 9E20 7E0 9E0 7E10 10E10 9E20
Ru
nn
ing
Lo
ss
Pe
rme
ati
on
-m
gh
r
Fuel
0020 dia Induced Leak EffectRunning Loss Permeation
Vehicle 211Vehicle 207
Leak
Leak
Figure 21 ndash Vehicles 207 and 211 with Induced Leak - Static
Figure 22 ndash Vehicles 207 and 211with Induced Leak ndash Running Loss
35
0
100
200
300
400
500
600
700
7E0 9E0 7E10 10E10 9E20 7E0 9E0 7E10 10E10 9E20
Tru
e H
ot S
oa
k P
erm
ea
tio
n -
mg
hr
Fuel
0020 dia Induced Leak EffectTrue Hot Soak Permeation
Vehicle 211Vehicle 207
Leak
Leak
0
500
1000
1500
2000
2500
7E0 9E0 7E10 10E10 9E20 7E0 9E0 7E10 10E10 9E20
Da
y 1
Diu
rna
l P
erm
ea
tio
n -
mg
da
y
Fuel
0020 dia Induced Leak EffectDay 1 Diurnal Permeation
Vehicle 211Vehicle 207
Leak
Leak
Figure 24 ndash Vehicles 207 and 211 with Induced Leak - Diurnal
Figure 23 ndash Vehicles 207 and 211 with Induced Leak ndash True Hot Soak
36
Summary of Findings and Results
The E-77-2 test program was a continuation of the previously published E-77 test project and
added eight vehicles tested on five fuels to the knowledge base The permeation trends
previously shown were again present The small sample size and limited number of tests
preclude making statements about statistical validity but in general
o The newer vehicle groups had lower emissions
o Adding ethanol to the fuel increased permeation over the non-oxygenated levels
o Increased volatility increased permeation levels
o SHED emission rates must be corrected for the ethanol error in the FID and the
non-fuel methanol and refrigerant in the measurement
As this test program evolved and additional experience was gathered two program modifications
were made 1) The leak validation methodology was changed and 2) a different metric and
definition of the ldquoHot Soakrdquo was adopted
The leak validation portion of the static permeation test was found to be very sensitive and when
the data was corrected on a minute-by-minute basis for ethanol methanol and refrigerant the
change in apparent permeation rate was due as much to variation as to leaks See the discussion
starting at page 12 for the details of the development
Concern for and recognition of ldquoHot Soakrdquo emissions started in the original evaporative emission
regulations Carburetors had float bowls with ~ 50 ml of fuel that absorbed the latent engine heat
after the vehicle was shut down after operation The heat would cause the bowl temperature to
increase driving fuel vapors out through vents and leak paths to the atmosphere after vehicle
operation Todayrsquos fuel injection engines do not have the open bowls and the emission rates
following vehicle operation are mainly increased temperature permeation We recommended
and adopted a new name for the ldquotemporary emissions following vehicle operationrdquo (TEFVO)
which subtracts the basic permeation rate from the measured emissions See the discussion
starting at page 16 for details
37
Appendix
Acknowledgements
E-77-2 Steering Committee
David Brzezinski EPA
Kevin Cullen GM Powertrain
Dominic DiCicco Ford Motor Company
King D Eng Shell Global Solutions
Ben Hancock CARB
Constance Hart EPA
Phil Heirigs Chevron Global Downstream
Jeff Jetter Honda RampD Americas
Keith KnollNREL
John Koupal EPA
David H Lax API
Jeff Long CARB
Hector Maldonado CARB
Mani Natarajan Marathon Oil Company
David N Patterson Mitsubishi Motors RampD Americas
Jenny Sigelko Chrysler
James P UihleinChevron Global Downstream
Marie Valentine Toyota Technical Center
Kenneth J Wright ConocoPhillips
CRC Members
Brent Bailey CRC
Chris Tennant CRC
Jane Beck CRC
38
Table 12
E0 E10 E20
Inspection Units Fuel 6 Fuel 7 Fuel 4
API Gravity degAPI 602 585 570
Relative Density 6060degF 07382 07447 07508
DVPE psi 701 730 849
Oxygenates--D4815
MTBE vol 000 000 000
ETBE vol 000 000 000
EtOH vol 000 954 2034
O2 wt 000 353 747
Hydrocarbon Composition
Aromatics vol 221 244 108
Olefins vol 80 88 55
Saturates vol 700 573 234
D86 Distillation
IBP degF 974 1040 1022
5 Evaporated degF 1316 1280 1252
10 Evaporated degF 1423 1330 1314
20 Evaporated degF 1564 1410 1413
30 Evaporated degF 1704 1450 1486
40 Evaporated degF 1840 1530 1547
50 Evaporated degF 1975 1950 1596
60 Evaporated degF 2120 2190 1636
70 Evaporated degF 2305 2410 2274
80 Evaporated degF 2588 2710 2695
90 Evaporated degF 3139 3170 3139
95 Evaporated degF 3322 3300 3255
EP degF 3603 3600 3406
Recovery vol 978 978 983
Residue vol 13 10 10
Loss vol 09 12 07
Driveability Index 11199 11015 9898
Data from CRC E-74
CRC E-77-2 Fuel Inspection Results
39
Fuel Units Fuel 6 Fuel 7 Fuel 4
Sulfur Content ppm 29 27 27
Estimated CH Ratio 62090 63323 63252
Est Net Heat of Combustion btulb 18573 18514 18513
Benzene vol 090 100 096
Research Octane Number 932 940 946
Motor Octane Number 838 838 834
(R+M)2 885 889 890
Fuel Units Fuel 6 Fuel 7 Fuel 4
Aromatics vol 2386 2481 2178
Olefins vol 752 892 1074
Saturates vol 6743 5621 4623
Unclassified vol 115 086 015
Ethanol vol 000 920 2111
Benzene vol 089 106 097
CH Ratio 6200 6092 5835
Oxygen wt 0008 1 340 773
Net Heat of Combustion btulb 18703 18016 17160
1 Contains 004 vol MTBE
Fuel Units Fuel 6 Fuel 7 Fuel 4
Oxygen wt 0008 3396 7733
C+H wt 9999 9660 9227
H wt 1389 1362 1350
C wt 8610 8298 7877
Fuel Units 6 7 4
Haltermann D3338 Btulb 18573 18514 18513
Average D3338 Btulb 18579 18514 18491
Oxygen Corrected D3338 Btulb 18579 17860 17103
DHA Btulb 18703 18016 17160
Table 12 (cont)
Suppliers Additional Inspections
Net Heat of Combusion -- Btulb
Carbon Hydrogen and Oxygen
Detailed Hydrocarbon Analysis
40
Vehicle Day 1 Day 2 Day 3
No Fuel Base + Press + Pump RL True HS Perm (Brkthru) Perm (Brkthru) Perm (Brkthru)
E10 - 10 psi 345 --- --- 1278 503 10429 (63) 7069 (348) 7043 (425)
E10 - 7 psi 223 --- --- 994 113 6278 (00) 5065 (00) 4535 (00)
E0 - 9 psi 2229 --- 4921 3870 00 22580 (00) 32310 (00) 23069 (126)
E0 - 7 psi 2991 --- 19896 7269 00 47425 (00) 44517 (00) 31798 (00)
E10 - 10 psi 843 --- --- 3164 04 15479 (310) 17799 (383) 17711 (419)
E10 - 7 psi 664 --- --- 2879 297 12601 (00) 11652 (00) 11653 (00)
E0 - 9 psi 338 --- --- 2492 443 6283 (24) 5810 (136) 5770 (225)
E0 - 7 psi 129 --- --- 2226 187 3672 (00) 2877 (00) 2936 (00)
E20 - 9 psi 553 --- --- 2720 134 11034 (00) 9581 (00) 9812 (00)
E10 - 10 psi 416 --- --- 1916 295 17941 (204) 17309 (346) 17417 (375)
E10 - 7 psi 596 --- --- 2328 719 17834 (00) 17150 (00) 15239 (00)
E0 - 9 psi 195 --- --- 1031 10 4995 (00) 4810 (00) 5072 (26)
E0 - 7 psi 99 --- --- 671 00 3830 (00) 3654 (00) 3670 (00)
E20 - 9 psi 462 --- --- 1697 603 17752 (00) 16900 (00) 16802 (00)
E10 - 10 psi 787 --- --- 8581 2377 14064 (00) 12644 (00) 12237 (00)
E10 - 7 psi 644 --- --- 8122 1222 10865 (00) 8120 (00) 8236 (00)
E0 - 9 psi 325 --- --- 8339 58 4064 (00) 3373 (00) 3080 (00)
E0 - 7 psi 401 --- --- 8425 00 3975 (00) 3026 (00) 2689 (00)
E20 - 9 psi 882 --- --- 10282 00 15480 (00) 13702 (00) 13605 (00)
E10 - 10 psi 976 --- 1209 10012 3929 16449 (00) NA NA
E10 - 7 psi 1468 --- --- 11393 5850 21342 (00) NA NA
E10 - 10 psi 199 --- --- 1383 00 3370 (00) 2268 (191) 2179 (330)
E10 - 7 psi 94 266 --- 563 138 2438 (00) 1838 (00) 1843 (00)
E0 - 9 psi 101 --- --- 837 153 1303 (00) 1158 (129) 1006 (221)
E0 - 7 psi 91 --- --- 1046 07 2071 (00) 1002 (00) 874 (00)
E20 - 9 psi 558 --- --- 4106 00 2840 (00) 2218 (00) 2034 (00)
E10 - 10 psi 551 --- 821 3024 2450 25454 (040) NA NA
E10 - 7 psi 481 --- 1664 2511 62 6783 (00) NA NA
E10 - 10 psi 106 --- --- 1489 00 1243 (00) 879 (00) 1028 (200)
E10 - 7 psi 218 --- --- 2012 00 1848 (00) 1002 (00) 758 (00)
E0 - 9 psi 32 --- --- 1158 04 1005 (00) 708 (00) 574 (00)
E0 - 7 psi 09 --- --- 1845 18 1016 (00) 712 (00) 570 (00)
E20 - 9 psi 47 --- --- 1168 49 1310 (00) 833 (00) 750 (00)
E10 - 10 psi 244 --- --- 1331 574 4920 (00) 8394 (00) 113738 (49)
E10 - 7 psi 239 --- --- 1057 329 5242 (00) 3974 (00) 3944 (00)
E0 - 9 psi 107 --- --- 967 521 4559 (00) 3585 (00) 11017 (00)
E0 - 7 psi 252 --- --- 363 33 4943 (00) 3190 (00) 2815 (00)
E20 - 9 psi 168 --- --- 1394 560 4709 (00) 4400 (00) 7518 (00)
E10 - 10 psi 104 90 --- 719 16 3192 (00) 2602 (00) 2370 (00)
E10 - 7 psi 122 --- --- 979 00 2247 (00) 2317 (00) 2675 (00)
E0 - 9 psi 85 --- --- 811 251 2021 (00) 1659 (2) 1763 (72)
E0 - 7 psi 87 --- --- 797 225 2483 (00) 2941 (00) 2888 (00)
E20 - 9 psi 193 --- --- 1025 00 4168 (00) 4148 (00) 4506 (00)
E10 - 10 psi 324 --- --- 1742 118 25907 (578) 34779 (630) 36014 (643)
E10 - 7 psi 325 --- --- 1683 192 3975 (02) 3550 (01) 3621 (04)
E0 - 9 psi 178 136 --- 1091 254 3270 (00) 2667 (00) 2746 (108)
E0 - 7 psi 204 380 --- 787 00 2117 (00) 2208 (00) 2081 (00)
E20 - 9 psi 204 --- --- 543 74 4685 (00) 4526 (00) 4198 (00)
216
211
2004
Toyota
Camry
XLE
215
2004
Toyota
High-
lander
212
2006
Ford
Taurus
214
2004
Ford
Escape
211L
207L
Static Permeation - mghr Dynamic Perm - mghr
CRC E-77-2 Program Test Results
Diurnal (65ordm to 105ordm) - mgday
202
1996
Taurus
205
2001
Toyota
Corolla
204
1999
Honda
Accord
207
2001
Dodge
Caravan
202L
Table 13
41
Individual Vehicle Diurnal Performance on the Various Fuels
0
1000
2000
3000
4000
5000
6000
0 10 20 30 40 50 60 70
Cu
mu
lati
ve
Pe
rme
ati
on
-m
g
Test Time - hrs
Three Day DiurnalVehicle 204 1999 Honda Accord
10 psi E10
7 psi E10
9 psi E0
7 psi E0
9 psi E20
0
1000
2000
3000
4000
5000
6000
0 10 20 30 40 50 60 70
Cu
mu
lati
ve
Pe
rme
ati
on
-m
g
Test Time - hrs
Three Day DiurnalVehicle 205 - 2001 Toyota Corolla
10 psi E10
7 psi E10
9 psi E0
7 psi E0
9 psi E20
Figure 25 ndash Vehicle 204 Diurnal Performance
Figure 26 ndash Vehicle 205 Diurnal Performance
42
0
500
1000
1500
2000
2500
3000
3500
4000
4500
5000
0 10 20 30 40 50 60 70
Cu
mu
lati
ve
Co
rre
cte
d P
erm
ea
tio
n -
mg
Test Time - hrs
Three Day DiurnalVehicle 207 - 2001 Dodge Caravan
10 psi E10
7 psi E10
9 psi E0
7 psi E0
9 psi E20
0
100
200
300
400
500
600
700
800
900
0 10 20 30 40 50 60 70
Cu
mu
lati
ve
Pe
rme
ati
on
-m
g
Test Time - hrs
Three Day DiurnalVehicle 211 - 2004 Toyota Camry XLE
10 psi E10
7 psi E10
9 psi E0
7 psi E0
9 psi E20
Figure 27 ndash Vehicle 207 Diurnal Performance
Figure 28 ndash Vehicle 211 Diurnal Performance
43
0
50
100
150
200
250
300
350
400
450
500
0 10 20 30 40 50 60 70
Cu
mu
lati
ve
Pe
rme
ati
on
-m
g
Test Time - hrs
Three Day DiurnalVehicle 212 - 2006 Ford Taurus
10 psi E10
7 psi E10
9 psi E0
7 psi E0
9 psi E20
0
500
1000
1500
2000
2500
3000
3500
4000
4500
5000
0 10 20 30 40 50 60 70
Cu
mu
lati
ve
Pe
rme
ati
on
-m
g
Test Time - hrs
Three Day DiurnalVehicle 214 2004 Ford Escape
10 psi E10
7 psi E10
9 psi E0
7 psi E0
9 psi E20
Note The incomplete cumulative results for the 10 psi E10 results resulted from a conflict for the use
of the INNOVA analyzer during the test The INNOVA analyzer is required to correct for the FIDrsquos
ethanol error and the presence of methanol and refrigerant (R-134a) The data was available for the
50+ hour results and the data is valid as shown We have no explanation for the high levels
experienced on the third day of the test No test errors were identified
Figure 29 ndash Vehicle 212 Diurnal Performance
Figure 30 ndash Vehicle 214 Diurnal Performance
44
0
200
400
600
800
1000
1200
1400
1600
0 10 20 30 40 50 60 70
Cu
mu
lati
ve
Pe
rme
ati
on
-m
g
Test Time - hrs
Three Day DiurnalVehicle 215 2004 Toyota Highlander
10 psi E10
7 psi E10
9 psi E0
7 psi E0
9 psi E20
Figure 31 ndash Vehicle 215 Diurnal Performance
45
Table 14
Test Corrected
Vehicle Fuel Total Fuel EtOH R134a Methanol
204 10 psi E10 509899 144040 18298 16754
1999 Honda 7 psi E10 359057 130806 17551 15221
Accord 9 psi E0 178635 13843 18230 9896
7 psi E0 94846 1856 16631 2379
9 psi E20 304271 128408 18261 12143
205 10 psi E10 526659 186599 23354 20895
2001 Toyota 7 psi E10 502229 204246 25990 19198
Corolla 9 psi E0 148775 000 20434 4613
7 psi E0 111536 5489 22408 5619
9 psi E20 514540 212708 25677 19584
207 10 psi E10 389450 196248 12013 30399
2001 Dodge 7 psi E10 272201 114027 11731 19616
Caravan 9 psi E0 105167 1820 12224 15284
7 psi E0 96906 1118 22141 14276
9 psi E20 427882 241488 14268 25432
211 10 psi E10 78164 19733 15159 46970
2004 Toyota 7 psi E10 61190 20211 15929 46525
Camry LE 9 psi E0 34668 1681 14329 42659
7 psi E0 39468 000 16197 57303
9 psi E20 71013 26726 16213 36879
212 10 psi E10 31508 7222 14831 7896
2006 Ford 7 psi E10 36079 10132 15481 3400
Taurus 9 psi E0 22870 2409 15182 3761
7 psi E0 22973 000 15393 4362
9 psi E20 28935 11156 14116 2629
214 10 psi E10 1257887 000 19947 27992
2004 Ford 7 psi E10 131593 24571 16025 8879
Escape 9 psi E0 191611 2940 16487 7213
7 psi E0 109481 5386 80650 3106
9 psi E20 166271 24097 14491 6096
215 10 psi E10 81644 12178 14658 42609
2004 Toyota 7 psi E10 72399 15092 15532 36061
Highlander 9 psi E0 54431 000 14806 25822
7 psi E0 83115 000 14072 26255
9 psi E20 128223 38822 12841 34420
3 Day Diurnal Results
CRC E77-2 Program Diurnal ResultsAll values are in mg
46
0
200
400
600
800
1000
1200
1400
1600
1800
2000
Co
rrecte
d D
aily D
iurn
al
-m
g
Diurnal Ethanol PortionVehicle 204 - 1999 Honda Accord
Ethanol Portion
10 psi E10 9 psi E07 psi E10
1 32
315
341368
383
264273
1 321 321 321 32
9 psi E207 psi E0
1122097
39
0510
442
405412
Figure 32 ndash Vehicle 204 Diurnal Ethanol Portion
0
200
400
600
800
1000
1200
1400
1600
1800
2000
Co
rrecte
d D
aily D
iurn
al
-m
g
Diurnal Ethanol PortionVehicle 205 - 2001 Toyota Corolla
Ethanol Portion
10 psi E10 9 psi E07 psi E10
1 32
359
406
382
431355349
1 321 321 321 32
9 psi E207 psi E0
0 00
712649
406
420414
Figure 33 ndash Vehicle 205 Diurnal Ethanol Portion
47
0
200
400
600
800
1000
1200
1400
1600C
orr
ecte
d D
aily D
iurn
al
-m
g
Diurnal Ethanol PortionVehicle 207 - 2001 Dodge Caravan
Ethanol Portion
10 psi E10 9 psi E07 psi E10
1 32
488
442408
409
490535
1 321 321 321 32
9 psi E207 psi E0
00
1144
27
0101
556
587552
Figure 34 ndash Vehicle 207 Diurnal Ethanol Portion
0
50
100
150
200
250
300
350
400
Co
rrecte
d D
aily D
iurn
al
-m
g
Diurnal Ethanol PortionVehicle 211 - 2004 Toyota Camry XLE
Ethanol Portion
10 psi E10 9 psi E07 psi E10
1 32
264
242245
1 321 321 321 32
9 psi E207 psi E0
329
306356
00
73
64
00
00
00
325
431
370
Figure 35 ndash Vehicle 211 Diurnal Ethanol Portion
48
0
20
40
60
80
100
120
140
160
180
200C
orr
ecte
d D
aily D
iurn
al
-m
g
Diurnal Ethanol PortionVehicle 212 - 2006 Ford Taurus
Ethanol Portion
10 psi E10 9 psi E07 psi E10
1 32
216
170
316
1 321 321 321 32
9 psi E207 psi E0
194
288
436 102
105
85
00
00
00476
529
243
Figure 36 ndash Vehicle 212 Diurnal Ethanol Portion
0
200
400
600
800
1000
1200
Co
rrecte
d D
aily D
iurn
al
-m
g
Diurnal Ethanol PortionVehicle 214 - 2004 Ford Escape
Ethanol Portion
10 psi E10 9 psi E07 psi E10
1 32
00
1 321 321 321 32
9 psi E207 psi E0
201
202152
38
05
19
56
1469
103
171188
143
67
11275
Figure 37 ndash Vehicle 214 Diurnal Ethanol Portion
49
0
50
100
150
200
250
300
350
400
450
500C
orr
ecte
d D
aily D
iurn
al
-m
g
Diurnal Ethanol PortionVehicle 215 - 2004 Toyota Highlander
Ethanol Portion
10 psi E10 9 psi E07 psi E10
1 32
121
136
196
1 321 321 321 32
9 psi E207 psi E0
198
217213
0000
00
0000
00
335 292
283
Figure 38 ndash Vehicle 215 Diurnal Ethanol Portion

15
Vehicle testing in an RL-SHED is complicated by several factors including
1 Engine must be supplied with external induction air
2 Exhaust must be conducted externally without any leaks
3 Load supplied to the vehicle through the chassis dynamometer must not create or
allow external leaks
4 Internal SHED temperature must be maintained while sizable heat is rejected to the
ambient by the running engine and exhaust
5 Cooling air supplied to the radiator must be modulated to represent the vehiclersquos road
speed
6 Underbody (and especially the fuel system) temperature should represent the rate of
rise experienced by a real road-drive
Canister vent losses were isolated from permeation emissions using the technique previously
described The vehiclersquos carbon canister fresh air vent was connected to the outside of the RL-
SHED using a leak-tight PTFEreg
hose (38rdquo OD commercial tubing US Plastics 58055 PTFE or
equivalent) connected to a small carbon ldquotraprdquo canister located on a top-loading precision scale
The scale precision was 001 grams (10 milligrams) and it was purged prior to each test There
were no tank venting emissions measured on any of the running loss test measurements All of
the vehicles appeared to be actively ldquopurgingrdquo their respective control canisters and drawing
fresh air during the test If there were any emissions from the vehiclersquos control canister as might
have occurred if there were no vehicle purge or if very high volatility fuels with excessive vapor
generation were used they would have been measured
The Running Loss Driving Cycle consisted of two cycles of the ldquoUnified Driving Cyclerdquo
otherwise known as the LA-92 A velocity versus time plot for one cycle is shown in Figure 11
The LA-92 cycle takes 24 minutes to complete and covers 98 miles with many speed changes
Two back-to-back cycles were driven the first as a ldquocold startrdquo and the second following a 30-
second vehicle idle The ldquocold startrdquo condition was created by soaking the vehicle for a
Figure 11 ndash Running Loss Driving Cycle
Unified Cycle (LA-92)
0
10
20
30
40
50
60
70
80
0 5 10 15 20 25Test Time - minutes
Spe
ed -
mph
Cycle Time (min) 239
Maximum Speed (mph) 672
Average Speed (mph) 246
Average Non-Zero Speed (mph) 294
Time Zero Speed () 162
Distance (miles) 982
16
minimum of 18 hours at 86degF moving it to the stabilized 86degF RL-SHED making the test
connections and then waiting a minimum of one hour before the initial start and run
The SHED emissions were measured during 48 minutes of engine operation and then
continuously for one hour after the engine was turned off This one hour engine-off duration
was the ldquohot soakrdquo period The total test time is 1 hour and 48 minutes
Figure 12 shows results from the 9 psi E0 fuel test on Vehicle 204 The horizontal axis is test
time in minutes and the vertical axis is the HC mass measured in the RL-SHED during the test
period
The engine was shut off at the end of the second LA92 drive cycle (~48 minutes) and the
analysis system continued to measure the HC emissions in the SHED for the next 60 minutes
This represented the ldquohot soakrdquo portion of the test
0
50
100
150
200
250
300
0 20 40 60 80 100 120
Co
rre
cte
d T
ota
l F
ue
l C
um
ula
tiv
e P
erm
ea
tio
n -
mg
Test Time - minutes
Running Loss and Hot SoakVehicle 204 - 1999 Honda Accord - 9 psi E0 Fuel
Test 25668
Running Loss Hot Soak
Running Loss Std =005 gmiThis Test = 0010 gmi
RL = 249 mghr
2774
2332
Tru HS = 442
1990
The ldquoTruerdquo Hot Soak
The traditional hot soak is determined from the increase in SHED emissions as measured for one
hour following a prescribed drive to heat up the vehicle (2 LA-92 cycles during the Running
Loss Test) Hot soak emissions however have two components that caused by the elevated
temperature resulting from the drive and that resulting from one hour of static permeation
Figure 12 ndash Running Loss Test Results
17
To separate these two components and determine the ldquotruerdquo hot soak emissions the following
procedure was used ldquoTraditionalrdquo hot soak emissions were first calculated by subtracting the
ldquostart of hot soakrdquo cumulative SHED hydrocarbon value (ie 199 mg t = 48 minutes) from
the final cumulative SHED hydrocarbon value (ie 2774 mg t = 108 min) This resulted in a
cumulative SHED hydrocarbon value of 78 mg for the 1 hour hot soak The previously
determined static permeation value (ie 338 mg for a 1 hour hot soak test- see Figure 9) was
then subtracted to arrive at the ldquotruerdquo hot soak value of 442 mg The increase in the permeation
rate (the ldquohot soak effectrdquo) caused by the increase in the system temperature is accounted for by
subtracting the ldquostabilized permeation raterdquo at 86degF
In Figure 12 the static permeation rate is superimposed as a solid blue line on the plot from the
starting point of the hot soak until its end (one hour) While the ldquotraditionalrdquo hot soak would be
calculated as 78 mg (277 mg ndash 199 mg) the ldquotruerdquo hot soak is determined as 442 mg (2774 mg
ndash 2332 mg) True hot soak values reported here were determined in this manner
Diurnal Test
Diurnal permeation was determined by subjecting the vehicle to a three-day period in a
temperature controlled SHED while continuously recording the total hydrocarbon every 30
seconds The SHED environmental temperature was varied from 65degF to 105degF per the
California Diurnal Test protocol Canister vent losses were isolated from permeation emissions
using the technique previously described The vehiclersquos carbon canister fresh air vent was
connected to the outside of the RL-SHED using a leak-tight PTFEreg
hose connected to a small
carbon ldquotraprdquo canister located on a top-loading precision scale The scale precision was 001
grams (10 milligrams) and it was purged before each test
DISCUSSION OF TEST RESULTS
Results
Emission results are presented below by ldquomechanism11
rdquo with the data averaged for the five
ldquoenhancedrdquo and the two ldquonear zerordquo vehicles The lone ldquopre-enhancedrdquo vehicle the 1996 Ford
Taurus (202) was a special case and will be discussed in a separate section Two of the vehicles
the 2001 Dodge Caravan (207) and the 2004 Toyota Camry (211) were also subjected to limited
testing with an ldquoimplanted leakrdquo (a 0020rdquo dia hole in a special tank gas cap) to investigate the
magnitude of a known leak These results (ldquoLeakersrdquo) follow the discussion on the Taurus
Static Permeation Rate (Constant Temperature (86degF)) - Average permeation rate compared
by fuel specification for two vehicle groups ldquoenhancedrdquo and the ldquonear zerordquo evaporative
emissions
11 The ldquomechanismsrdquo are 1 Permeation 2 Tank Venting (Daily Temperature Rise) and 3 Leaks
18
0
10
20
30
40
50
60
Co
rrecte
d P
erm
eati
on
Rate
-m
gh
r
Fuel
Static Permeation Rate - All FuelsE77-2 Program Vehicles
7 E0 9 E2010 E107 E109 E0 7 E0 9 E2010 E107 E109 E0
Enhanced(5 veh)
Near Zero(2 veh)
Figure 13 presents the static permeation rate performance for the average of the 5 ldquoenhancedrdquo
and 2 ldquonear zerordquo vehicles on the five fuels included in the test program Each group is ordered
from left to right by ethanol level The vertical scale is the average permeation rate in mghour
for the static (86degF constant temperature) test
Previous studies1213
had shown that vehicles operated on the fuel containing 10 vol- ethanol
would have higher permeation rates compared to those resulting from operation on a non-ethanol
(E0) fuel of similar properties We also expected that vehicles using higher vapor pressure fuel
would exhibit increased permeation levels at similar ethanol levels Other studies had reported
mixed results when comparing E20 permeation rates against E10 measurements ndash some were
higher and some were lower The difference may have been within the repeatability of the
measurements and probably suffered from a limited number of observations These mixed
results are present in this testing of the enhanced vehicles however the E20 (violet bar) is higher
on average for static permeation rate for the Near Zero group The data that were used to
construct the averages in Figure 13 are listed in Table 3 below There is significant variability in
the test results and the limited sample size precludes making conclusive statements with
statistical confidence
12 CRC E-653 Fuel Permeation from Automotive Systems E0 E6 E10 E20 and E85 December 2006 13
CRC E-77 Vehicle Evaporative Emission Mechanisms A Pilot Study June 2008
Figure 13 ndash Static Permeation Rate Comparison
19
Table 3
Vehicle ID Technology 7psi E0 9 psi E0 7 psi E10 10 psi E10 9 psi E20
204
1999 Honda Enhanced 129 338 664 843 553
Accord
205
2001 Toyota Enhanced 99 195 596 416 462
Corolla
207
2001 Dodge Enhanced 401 325 644 787 882
Caravan
214
2004 Ford Enhanced 252 107 239 244 168
Escape
215
2004 Toyota Enhanced 87 85 122 104 193
Highlander
194 210 453 479 452
211
2004 Toyota Near Zero 91 101 94 199 558
Camry XLE
212
2006 Ford Near Zero 09 32 218 106 47
Taurus
50 67 156 153 303
Static Permeation Rate - mghr
CRC E-77-2 Program - Static Permeation Results
Enhanced Averages
Near Zero Averages
Summary ndash Static permeation rate increased with increase in ethanol level Three of the 5
enhanced emission vehicles did not show an increase in permeation rate when tested with the 9
psi E0 compared to the 7 psi E0
20
Dynamic (Running Loss) Permeation - In a similar presentation Figure 14 shows the average
ldquoRunning Lossrdquo permeation rate for the vehicle types and the fuels tested ldquoRunning Lossrdquo
permeation as described here is the permeation measured during a ldquocold startrdquo 48 minute drive in
a Running-Loss SHED (RL-SHED) at 86degF
0
50
100
150
200
250
300
350
400
7E0 9E0 7E10 10E10 9E20 7E0 9E0 7E10 10E10 9E20
Co
rre
cte
d R
un
nin
g L
os
s P
erm
ea
tio
n -
mg
hr
Fuel
Running Loss Permeation Rate - All FuelsE77-2 Program Vehicles
Enhanced(5 vehs)
Near Zero(2 vehs)
The dynamic permeation rates for the enhanced vehicles (left panel) followed a similar pattern as
the static permeation The average of the E20 fuel was the highest of the average values
observed on both the enhanced and the near-zero vehicles (left and right panels respectively)
Table 4 below shows the data used to generate the averages used in Figure 14
Figure 14 ndash Running Loss Permeation Comparison
21
Table 4
Vehicle ID Technology 7psi E0 9 psi E0 7 psi E10 10 psi E10 9 psi E20
204
1999 Honda Enhanced 2226 2492 2879 3164 2720
Accord
205
2001 Toyota Enhanced 671 1031 2328 1916 1697
Corolla
207
2001 Dodge Enhanced 8425 8339 8122 8581 10282
Caravan
214
2004 Ford Enhanced 363 967 1057 1331 1394
Escape
215
2005 Toyota Enhanced 797 811 979 719 1025
Highlander
2496 2728 3073 3142 3424
211
2004 Toyota Near Zero 1046 837 563 1383 4106
Camry XLE
212
2006 Ford Near Zero 1845 1158 2012 1489 1168
Taurus
1446 998 1288 1436 2637
Enhanced Averages
Near Zero Averages
CRC E-77-2 Program - Running Loss Permeation Results
Running Loss Permeation Rate - mghr
Summary ndash The dynamic permeation rate (measured during vehicle operation) was higher with
the E10 fuel compared to E0 for the enhanced vehicles The E20 permeation rate was higher
than E0 and the E10 fuel The small sample size and limited data precludes us from making
statements about statistical confidence but this may indicate a trend The near zero vehicle
average increased as the ethanol level increased Trends with volatility were mixed or
inconclusive
22
Hot Soak (ldquoTrue Hot Soakrdquo) Permeation ndash The Hot Soak emissions as defined in this report
are the net increase in permeation rate following vehicle operation We measured the mass
increase in the SHED for one hour immediately following vehicle operation and subtracted the
previously measured static (or normal) permeation at the same temperature While this is not the
traditional Code of Federal Regulations (CFR) definition we feel it is appropriate for the intent
of this project
0
10
20
30
40
50
60
70
7E0 9E0 7E10 10E10 9E20 7E0 9E0 7E10 10E10 9E20
Co
rre
cte
d H
ot
So
ak
Pe
rme
ati
on
-m
gh
r
Fuel
True Hot Soak Permeation Rate - All FuelsE77-2 Program Vehicles
Enhanced(5 vehs)
Near Zero(2 vehs)
The ldquoTrue Hot Soakrdquo performance for the average of the Enhanced Vehicles is summarized in
Figure 15 above There was a large increase in the hot soak value with the E10 fuel compared to
the E0 The hot soak value with the E20 fuel was comparable to the E0 results and lower than
the E10
The Near Zero vehicles (2) had zero hot soak emissions when tested on the 10 psi E10 fuel
(Figure 16) With only two vehicles and the very low levels attained no statistically significant
conclusions can be drawn from the data available Table 5 presents the individual tests used in
calculating the average values plotted in Figure 15
Figure 15 ndash True Hot Soak Permeation Comparison
23
Table 5
Vehicle ID Technology 7psi E0 9 psi E0 7 psi E10 10 psi E10 9 psi E20
204
1999 Honda Enhanced 187 443 297 04 134
Accord
205
2001 Toyota Enhanced 00 10 719 295 603
Corolla
207
2001 Dodge Enhanced 00 58 1222 2377 00
Caravan
214
2004 Ford Enhanced 33 521 329 574 560
Escape
215
2005 Toyota Enhanced 225 251 00 16 00
Highlander
89 257 513 653 259
211
2004 Toyota Near Zero 07 153 138 00 00
Camry XLE
212
2006 Ford Near Zero 18 04 00 00 49
Taurus
13 79 69 00 25
CRC E-77-2 Program - True Hot Soak Permeation Results
True Hot Soak Permeation Rate - mghr
Near Zero Averages
Enhanced Averages
Summary - The True Hot Soak permeation (permeation rate measured following vehicle
operation less the static constant temperature permeation rate) rate was higher with the E10 fuel
compared to E0 for the enhanced vehicles The E20 permeation rate was higher than E0 and
lower than the E10 fuel The near zero vehicle trends with both ethanol content and volatility
were mixed or inconclusive The small sample size and limited data precludes us from making
statements about statistical confidence
24
Diurnal Permeation Performance ndash Figure 16 presents the diurnal permeation results for the
first day of the three-day diurnal test (65deg to 105degF)
0
200
400
600
800
1000
1200
7E0 9E0 7E10 10E10 9E20 7E0 9E0 7E10 10E10 9E20
Co
rre
cte
d F
ue
l D
iurn
al
Pe
rme
ati
on
-m
gs
da
y
Day 1 Diurnal Permeation RatesAverages from E-77-2 Vehicles
Fuel
Enhanced(5 vehs)
Near Zero(2 vehs)
The average day 1 diurnal permeation for the five Enhanced Vehicles tended to increase as
ethanol content increased (with the exception of the E20 fuel) Again sample size and limited
data makes statistical conclusions inappropriate Table 6 presents the individual test used to
generate the averages used in Figure 16 The table includes the data from days 2 and 3 The
ethanol content of the diurnal measurements was calculated and appear in a series of figures in
the Appendix starting at page 37 Unlike Figure 16 the figures shown in the appendix have not
been corrected to exclude the non-fuel emissions (methanol and refrigerant) that were present
during these tests
Figure 16 ndash Day 1 Diurnal Permeation Comparison
25
Table 6
Vehicle ID Technology 7psi E0 9 psi E0 7 psi E10 10 psi E10 9 psi E20
204 Day 1 3672 6283 12601 15479 11034
1999 Honda Enhanced Day 2 2877 5810 11652 17799 9581
Accord Day 3 2936 5770 11653 17711 9812
205 Day 1 3830 4995 17834 17941 17752
2001 Toyota Enhanced Day 2 3654 4810 17150 17309 16900
Corolla Day 3 3670 5072 15239 17417 16802
207 Day 1 3975 4064 10865 14064 15480
2001 Dodge Enhanced Day 2 3026 3373 8120 12644 13702
Caravan Day 3 2689 3080 8236 12237 13605
214 Day 1 4943 4559 5242 4920 4709
2004 Ford Enhanced Day 2 3190 3585 3974 8394 4400
Escape Day 3 2815 11017 3944 113738 7518
215 Day 1 2483 2021 2247 3192 4168
2004 Toyota Enhanced Day 2 2941 1659 2317 2602 4148
Highlander Day 3 2888 1763 2675 2370 4506
3781 4384 9758 11119 10629
211 Day 1 2071 1303 2438 3370 2840
2004 Toyota Near Zero Day 2 1002 1158 1838 2268 2218
Camry XLE Day 3 874 1006 1843 2179 2034
212 Day 1 1016 1005 1848 1243 1310
2006 Ford Near Zero Day 2 712 708 1002 879 833
Taurus Day 3 570 574 758 1028 750
1544 1154 2143 2307 2075
CRC E-77-2 Program Results - Diurnal Permeation
Diurnal Permeation Rate - mgday
Enhanced Averages
Near Zero Averages
Carbon Canister Breakthrough ndash Canister breakthrough is measured by the weight change
recorded for the trap canister outside the SHED It quantifies the amount of vapors that
overwhelm the evaporative system storage canister Figure 17 displays the breakthrough
resulting from testing of 9 psi E0 fuel Only four of seven vehicles exhibited breakthrough
60
65
70
75
80
85
90
95
100
105
110
0
5
10
15
20
25
30
35
40
0 10 20 30 40 50 60 70
SH
ED
Te
mp
era
ture
-d
eg
F
Bre
ak
thro
ug
h -
mg
Test Time - hrs
Canister Breakthrough9 psi E0 Fuel - 65ordm to 105ordm F Diurnal
204 - 1999 Honda Accord
211 - 2004 Toyota Camry
215 - 2004 Toyota Highlander
205 - 2001 Toyota Corolla
Figure 17 ndashDiurnal Canister Breakthrough
26
Table 7 shows the breakthrough generated during the diurnal tests conducted
Table 7
Vehicle ID Technology 7psi E0 9 psi E0 7 psi E10 10 psi E10 9 psi E20
204 Day 1 --- 24 --- 310 ---
1999 Honda Enhanced Day 2 --- 136 --- 360 ---
Accord Day 3 --- 198 --- 360 ---
205 Day 1 --- --- --- 204 ---
2001 Toyota Enhanced Day 2 --- --- --- 309 ---
Corolla Day 3 --- 26 --- 293 ---
207 Day 1 --- --- --- --- ---
2001 Dodge Enhanced Day 2 --- --- --- --- ---
Caravan Day 3 --- --- --- --- ---
214 Day 1 --- --- --- --- ---
2004 Ford Enhanced Day 2 --- --- --- --- ---
Escape Day 3 --- --- --- 49 ---
215 Day 1 --- --- --- --- ---
2004 Toyota Enhanced Day 2 --- 02 --- --- ---
Highlander Day 3 --- 72 --- --- ---
211 Day 1 --- --- --- --- ---
2004 Toyota Near Zero Day 2 --- 129 --- 191 ---
Camry XLE Day 3 --- 176 --- 289 ---
212 Day 1 --- --- --- --- ---
2006 Ford Near Zero Day 2 --- --- --- --- ---
Taurus Day 3 --- --- --- 204 ---
CRC E-77-2 Program - Carbon Canister Diurnal Breakthrough Results
Diurnal Breakthrough - grams
Summary ndash The lack of canister breakthrough for the 7 psi fuels (summer grade) indicates that
the storage capacity of the seven systems tested is appropriately sized Breakthrough began to
appear when testing of 9 psi E0 fuel (not summer grade) and was more prevalent with the 10 psi
E10 fuel (winter grade) The lack of breakthrough with the 9 psi E20 fuel seems to be an
anomaly
27
Overall Trend Summary - The following chart (Figure 18) visually summarizes the trends seen
from all testing performed during this program
Higher Volatility E0 to E10 E0 to E20 E10 to E20
uarr uarr uarr uarr
Higher Volatility E0 to E10 E0 to E20 E10 to E20
uarr uarr uarr uarr
Higher Volatility E0 to E10 E0 to E20 E10 to E20
uarr uarr uarr uarr
Higher Volatility E0 to E10 E0 to E20 E10 to E20
uarr uarr uarr uarr
Higher Volatility E0 to E10 E0 to E20 E10 to E20
uarrharr uarr uarr uarr
Higher Volatility E0 to E10 E0 to E20 E10 to E20
uarr uarr uarr uarr
Higher Volatility E0 to E10 E0 to E20 E10 to E20
uarr darr darr
Higher Volatility E0 to E10 E0 to E20 E10 to E20
uarr uarr uarr harr
Ethanol Content
Diurnal
Trend Analysis for E-77-2 Program
Ethanol Content
Static Permeation
Ethanol Content
Running Loss Permeation
Ethanol Content
Ethanol Content
Diurnal
Enhanced Vehicles (Sample of 5)
Static Permeation
Ethanol Content
Ethanol Content
Running Loss Permeation
Ethanol Content
True Hot Soak (TEFVO)
Near-Zero Vehicles (Sample of 2)
True Hot Soak (TEFVO)
Figure 18 Trend Analysis Summaries
28
Vehicle 202 ndash 1996 Ford Taurus - Special Case
We have treated vehicle 202 as a special case This was the oldest of the vehicles tested and had
been subjected to limited exhaust emission tests with a 20-volume percent ethanol fuel (E20)
during the CRC E-74b test program
Vehicle 202 completed the E10 portion of the test program (10 and 7 psi fuels) successfully and
completed the road preconditioning on the E0 fuel prior to the E0 evaluations The first test on
the E0 fuel was excessively high indicating a fuel leak It was traced to a leaky fuel injector o-
ring and there was considerable discussion as to an appropriate repair Tests were made on the 9
and the 7 psi E0 fuel to measure the magnitude of a vehicle in a ldquoleakrdquo condition and the tests
were labeled as ldquo202L (Leak)rdquo The fuel injector o-rings were replaced as a complete set and
the vehicle resumed testing as ldquo202Rrsquo (Repaired) A new elusive vapor leak was present later
identified as a very small leak at the top of the fuel fill pipe
The circle on Figure 19 at the right shows
the location of the small leak This leak
was problematic as to its effect on the
emission measurements because its
magnitude or presence seemed to depend
on the torque exerted on the fuel cap The
tests on the E0 fuels (9 and 7 psi) are
noted as 202R but with a vapor leak
We attempted to fix this leak and repeated
the E10 test with the vehicle re-identified
as 216 with reasonable results We also
ran the E20 test sequence and declared the
vehicle done
The testing history for this vehicle is shown in Tables 8 (Static) 9 (Dynamic) and 10 (Diurnal)
The tests highlighted in yellow are those that exhibited a liquid or vapor leak as identified during
the static test leak validation
Figure 19 ndash Vehicle 202 Fuel Fill Pipe Leak
29
Table 8
Static Permeation Results 1996 Ford Taurus SHED
Corrected Results Canister
Fuel Permeation mgday Loss
Veh psiEtOH Test Type Date Test mghr (Corrected) g
202 100E10 Static Perm 071807 7018 345 000
Press Incr 00 No Leak
Prs+Fuel Incr 00
202 70E10 Static Perm 082107 7031 223 000
Press Incr 00 No Leak
Prs+Fuel Incr 00
202L 90E0 Static Perm 030408 7169 2292 000
Press Incr DNA
Prs+Fuel Incr 4921 Liquid Leak
202L 70E0 Static Perm 032008 7183 2991 000
Press Incr DNA
Prs+Fuel Incr 19896 Liquid Leak
202R 90E0 Static Perm 050808 7228 178 000
Press Incr 136 Vapor Leak
Prs+Fuel Incr 00
202R 70E0 Static Perm 052208 7239 204 000
Press Incr 380 Vapor Leak
Prs+Fuel Incr 00
216 100E10 Static Perm 081408 7299 324 000
Press Incr 00 No Leak
Prs+Fuel Incr 00
216 70E10 Static Perm 091708 7326 325 000
Press Incr 00 No Leak
Prs+Fuel Incr 00
216 90E20 Static Perm 103008 7363 204 000
Press Incr 00 No Leak
Prs+Fuel Incr 00
30
Table 9
Dynamic Permeation Results 1996 Ford Taurus SHED
Corrected Results Canister From
Fuel Permeation mgday Loss Static
Veh psiEtOH Test Type Date Test mghr (Corrected) g Test
202 100E10 Dynamic RL 072007 25662 1278 000 No Leak
TEFVO 386 000
202L 90E0 Dynamic RL 030508 25695 3870 000 Liquid Leak
TEFVO 00 000
202L 70E0 Dynamic RL 032408 25699 7269 000 Liquid Leak
TEFVO 00 000
202R 90E0 Dynamic RL 050908 25704 1091 000 Vapor Leak
TEFVO 50 000
202R 70E0 Dynamic RL 052308 25706 787 000 Vapor Leak
TEFVO 00 000
216 100E10 Dynamic RL 081508 25718 1742 000 No Leak
TEFVO 14 000
216 70E10 Dynamic RL 091808 25721 1683 000 No Leak
TEFVO 423 000
216 90E20 Dynamic RL 110708 25730 543 000 No Leak
TEFVO 00 000
31
Table 10
Diurnal Permeation Results 1996 Ford Taurus SHED
Corrected Results Canister From
Fuel Permeation mgday Loss Static
Veh psiEtOH Test Type Date Test mghr (Corrected) g Test
202 100E10 72 DHB 65-105 073107 7023
Day 1 10429 612 No Leak
Day 2 7069 3264
Day 3 7043 3869
202 70E10 72 DHB 65-105 082807 7034
Day 1 6278 000 No Leak
Day 2 5065 000
Day 3 4535 000
202L 90E0 72 DHB 65-105 031108 7173
Day 1 22589 000 Liquid Leak
Day 2 32310 000
Day 3 23069 1260
202L 70E0 72 DHB 65-105 040108 7196
Day 1 47425 000 Liquid Leak
Day 2 44517 000
Day 3 31798 000
202R 90E0 72 DHB 65-105 051308 7230
Day 1 3270 000 Vapor Leak
Day 2 2667 000
Day 3 2746 1083
202R 70E0 72 DHB 65-105 052808 7243
Day 1 2117 000 Vapor Leak
Day 2 2208 000
Day 3 2081 000
216 100E10 72 DHB 65-105 082008 7305
Day 1 25907 5777 No Leak
Day 2 34779 6299
Day 3 36014 6343
216 70E10 72 DHB 65-105 092308 7331
Day 1 3975 022 No Leak
Day 2 3550 006
Day 3 3621 037
216 90E20 72 DHB 65-105 111108 7373
Day 1 4685 000 No Leak
Day 2 4526 000
Day 3 4198 000
32
The Implanted Leak Test Results
Project E-77-2 included evaluating two vehicles with implanted leaks This interest followed the
information gathered in the Pilot Study where tests were run with a specially modified fuel cap
containing a 002rdquo dia hole The results with the implanted leak from the Pilot Study are
repeated in Table 11 below as the diurnal results are shown for a 1996 Chevrolet Cavalier first
without the implanted leak at 038 grams per day and then at 207 grams per day (a 54x
increase) with the leak
Table 11
Veh No
Evap
Tech Fuel
Results
gmsday
gms
Increase
6 1996 Chevrolet Cavalier Enhanced 7 psi E0 038
7 2070 2032
207 2001 Dodge Caravan Enhanced 7 psi E10 109
207L 213 104
211 2004 Toyota Camry LE Near Zero 7 psi E10 024
211L 068 044
- Implanted 020 leak in fuel cap
Vehicle Description
Implanted Leak Impact on Diurnal PermeationDay One Results 65deg - 105degF Diurnal
The two E-77-2 vehicles (207 amp 211) were given a limited evaluation with an induced leak and
saw a significantly lesser impact Vehicle 207 gave diurnal results increases from 109 to 213
grams per day (a 2x increase) and Vehicle 211 increased from 024 grams per day to 068 grams
per day (a 28x increase) The following Figure 20 displays the imbedded leak impact from Table
11
33
0
5
10
15
20
On
e D
ay
Diu
rna
l P
erm
ea
tio
n -
gm
sd
ay
Vehicle Number
Implanted Leak Impact on One Day Diurnal Permeation020 Leak in Fuel Cap - 65 to 105 F Diurnal
207L 211L21120776
As Received - No Leak
020 Fuel Cap Leak
The newer vehicles evaluated in this phase of the study were configured and certified to the
Onboard Refueling Vapor Regulations (ORVR) These are capable of containing 95 or more
control of the refueling vapors at up to 10 gallons per minute fueling rate Where the Chevrolet
Cavalier had a small (0055rdquo dia) orifice and a long vapor tube venting the tankrsquos vapor space to
the carbon canister (and then to the atmosphere) the ORVR compliant vehicles have a large
(0688rdquo ID) short vent hose to a low flow restriction carbon canister
The following bar charts (Figures 21 through 24) show the impacts of the leak on all phases of
the evaporative testing performed and compare those results with all fuels tested With only two
vehicles (207 and 211) evaluated on two fuels statistically significant effects cannot be
quantified but the trend of increased emissions is apparent
Figure 20 ndash Implanted Leak Impact
34
0
20
40
60
80
100
120
140
160
7E0 9E0 7E10 10E10 9E20 7E0 9E0 7E10 10E10 9E20
Sta
tic
Pe
rme
ati
on
-m
gh
r
Fuel
0020 dia Induced Leak EffectStatic Permeation
Vehicle 211Vehicle 207
Leak
Leak
0
200
400
600
800
1000
1200
7E0 9E0 7E10 10E10 9E20 7E0 9E0 7E10 10E10 9E20
Ru
nn
ing
Lo
ss
Pe
rme
ati
on
-m
gh
r
Fuel
0020 dia Induced Leak EffectRunning Loss Permeation
Vehicle 211Vehicle 207
Leak
Leak
Figure 21 ndash Vehicles 207 and 211 with Induced Leak - Static
Figure 22 ndash Vehicles 207 and 211with Induced Leak ndash Running Loss
35
0
100
200
300
400
500
600
700
7E0 9E0 7E10 10E10 9E20 7E0 9E0 7E10 10E10 9E20
Tru
e H
ot S
oa
k P
erm
ea
tio
n -
mg
hr
Fuel
0020 dia Induced Leak EffectTrue Hot Soak Permeation
Vehicle 211Vehicle 207
Leak
Leak
0
500
1000
1500
2000
2500
7E0 9E0 7E10 10E10 9E20 7E0 9E0 7E10 10E10 9E20
Da
y 1
Diu
rna
l P
erm
ea
tio
n -
mg
da
y
Fuel
0020 dia Induced Leak EffectDay 1 Diurnal Permeation
Vehicle 211Vehicle 207
Leak
Leak
Figure 24 ndash Vehicles 207 and 211 with Induced Leak - Diurnal
Figure 23 ndash Vehicles 207 and 211 with Induced Leak ndash True Hot Soak
36
Summary of Findings and Results
The E-77-2 test program was a continuation of the previously published E-77 test project and
added eight vehicles tested on five fuels to the knowledge base The permeation trends
previously shown were again present The small sample size and limited number of tests
preclude making statements about statistical validity but in general
o The newer vehicle groups had lower emissions
o Adding ethanol to the fuel increased permeation over the non-oxygenated levels
o Increased volatility increased permeation levels
o SHED emission rates must be corrected for the ethanol error in the FID and the
non-fuel methanol and refrigerant in the measurement
As this test program evolved and additional experience was gathered two program modifications
were made 1) The leak validation methodology was changed and 2) a different metric and
definition of the ldquoHot Soakrdquo was adopted
The leak validation portion of the static permeation test was found to be very sensitive and when
the data was corrected on a minute-by-minute basis for ethanol methanol and refrigerant the
change in apparent permeation rate was due as much to variation as to leaks See the discussion
starting at page 12 for the details of the development
Concern for and recognition of ldquoHot Soakrdquo emissions started in the original evaporative emission
regulations Carburetors had float bowls with ~ 50 ml of fuel that absorbed the latent engine heat
after the vehicle was shut down after operation The heat would cause the bowl temperature to
increase driving fuel vapors out through vents and leak paths to the atmosphere after vehicle
operation Todayrsquos fuel injection engines do not have the open bowls and the emission rates
following vehicle operation are mainly increased temperature permeation We recommended
and adopted a new name for the ldquotemporary emissions following vehicle operationrdquo (TEFVO)
which subtracts the basic permeation rate from the measured emissions See the discussion
starting at page 16 for details
37
Appendix
Acknowledgements
E-77-2 Steering Committee
David Brzezinski EPA
Kevin Cullen GM Powertrain
Dominic DiCicco Ford Motor Company
King D Eng Shell Global Solutions
Ben Hancock CARB
Constance Hart EPA
Phil Heirigs Chevron Global Downstream
Jeff Jetter Honda RampD Americas
Keith KnollNREL
John Koupal EPA
David H Lax API
Jeff Long CARB
Hector Maldonado CARB
Mani Natarajan Marathon Oil Company
David N Patterson Mitsubishi Motors RampD Americas
Jenny Sigelko Chrysler
James P UihleinChevron Global Downstream
Marie Valentine Toyota Technical Center
Kenneth J Wright ConocoPhillips
CRC Members
Brent Bailey CRC
Chris Tennant CRC
Jane Beck CRC
38
Table 12
E0 E10 E20
Inspection Units Fuel 6 Fuel 7 Fuel 4
API Gravity degAPI 602 585 570
Relative Density 6060degF 07382 07447 07508
DVPE psi 701 730 849
Oxygenates--D4815
MTBE vol 000 000 000
ETBE vol 000 000 000
EtOH vol 000 954 2034
O2 wt 000 353 747
Hydrocarbon Composition
Aromatics vol 221 244 108
Olefins vol 80 88 55
Saturates vol 700 573 234
D86 Distillation
IBP degF 974 1040 1022
5 Evaporated degF 1316 1280 1252
10 Evaporated degF 1423 1330 1314
20 Evaporated degF 1564 1410 1413
30 Evaporated degF 1704 1450 1486
40 Evaporated degF 1840 1530 1547
50 Evaporated degF 1975 1950 1596
60 Evaporated degF 2120 2190 1636
70 Evaporated degF 2305 2410 2274
80 Evaporated degF 2588 2710 2695
90 Evaporated degF 3139 3170 3139
95 Evaporated degF 3322 3300 3255
EP degF 3603 3600 3406
Recovery vol 978 978 983
Residue vol 13 10 10
Loss vol 09 12 07
Driveability Index 11199 11015 9898
Data from CRC E-74
CRC E-77-2 Fuel Inspection Results
39
Fuel Units Fuel 6 Fuel 7 Fuel 4
Sulfur Content ppm 29 27 27
Estimated CH Ratio 62090 63323 63252
Est Net Heat of Combustion btulb 18573 18514 18513
Benzene vol 090 100 096
Research Octane Number 932 940 946
Motor Octane Number 838 838 834
(R+M)2 885 889 890
Fuel Units Fuel 6 Fuel 7 Fuel 4
Aromatics vol 2386 2481 2178
Olefins vol 752 892 1074
Saturates vol 6743 5621 4623
Unclassified vol 115 086 015
Ethanol vol 000 920 2111
Benzene vol 089 106 097
CH Ratio 6200 6092 5835
Oxygen wt 0008 1 340 773
Net Heat of Combustion btulb 18703 18016 17160
1 Contains 004 vol MTBE
Fuel Units Fuel 6 Fuel 7 Fuel 4
Oxygen wt 0008 3396 7733
C+H wt 9999 9660 9227
H wt 1389 1362 1350
C wt 8610 8298 7877
Fuel Units 6 7 4
Haltermann D3338 Btulb 18573 18514 18513
Average D3338 Btulb 18579 18514 18491
Oxygen Corrected D3338 Btulb 18579 17860 17103
DHA Btulb 18703 18016 17160
Table 12 (cont)
Suppliers Additional Inspections
Net Heat of Combusion -- Btulb
Carbon Hydrogen and Oxygen
Detailed Hydrocarbon Analysis
40
Vehicle Day 1 Day 2 Day 3
No Fuel Base + Press + Pump RL True HS Perm (Brkthru) Perm (Brkthru) Perm (Brkthru)
E10 - 10 psi 345 --- --- 1278 503 10429 (63) 7069 (348) 7043 (425)
E10 - 7 psi 223 --- --- 994 113 6278 (00) 5065 (00) 4535 (00)
E0 - 9 psi 2229 --- 4921 3870 00 22580 (00) 32310 (00) 23069 (126)
E0 - 7 psi 2991 --- 19896 7269 00 47425 (00) 44517 (00) 31798 (00)
E10 - 10 psi 843 --- --- 3164 04 15479 (310) 17799 (383) 17711 (419)
E10 - 7 psi 664 --- --- 2879 297 12601 (00) 11652 (00) 11653 (00)
E0 - 9 psi 338 --- --- 2492 443 6283 (24) 5810 (136) 5770 (225)
E0 - 7 psi 129 --- --- 2226 187 3672 (00) 2877 (00) 2936 (00)
E20 - 9 psi 553 --- --- 2720 134 11034 (00) 9581 (00) 9812 (00)
E10 - 10 psi 416 --- --- 1916 295 17941 (204) 17309 (346) 17417 (375)
E10 - 7 psi 596 --- --- 2328 719 17834 (00) 17150 (00) 15239 (00)
E0 - 9 psi 195 --- --- 1031 10 4995 (00) 4810 (00) 5072 (26)
E0 - 7 psi 99 --- --- 671 00 3830 (00) 3654 (00) 3670 (00)
E20 - 9 psi 462 --- --- 1697 603 17752 (00) 16900 (00) 16802 (00)
E10 - 10 psi 787 --- --- 8581 2377 14064 (00) 12644 (00) 12237 (00)
E10 - 7 psi 644 --- --- 8122 1222 10865 (00) 8120 (00) 8236 (00)
E0 - 9 psi 325 --- --- 8339 58 4064 (00) 3373 (00) 3080 (00)
E0 - 7 psi 401 --- --- 8425 00 3975 (00) 3026 (00) 2689 (00)
E20 - 9 psi 882 --- --- 10282 00 15480 (00) 13702 (00) 13605 (00)
E10 - 10 psi 976 --- 1209 10012 3929 16449 (00) NA NA
E10 - 7 psi 1468 --- --- 11393 5850 21342 (00) NA NA
E10 - 10 psi 199 --- --- 1383 00 3370 (00) 2268 (191) 2179 (330)
E10 - 7 psi 94 266 --- 563 138 2438 (00) 1838 (00) 1843 (00)
E0 - 9 psi 101 --- --- 837 153 1303 (00) 1158 (129) 1006 (221)
E0 - 7 psi 91 --- --- 1046 07 2071 (00) 1002 (00) 874 (00)
E20 - 9 psi 558 --- --- 4106 00 2840 (00) 2218 (00) 2034 (00)
E10 - 10 psi 551 --- 821 3024 2450 25454 (040) NA NA
E10 - 7 psi 481 --- 1664 2511 62 6783 (00) NA NA
E10 - 10 psi 106 --- --- 1489 00 1243 (00) 879 (00) 1028 (200)
E10 - 7 psi 218 --- --- 2012 00 1848 (00) 1002 (00) 758 (00)
E0 - 9 psi 32 --- --- 1158 04 1005 (00) 708 (00) 574 (00)
E0 - 7 psi 09 --- --- 1845 18 1016 (00) 712 (00) 570 (00)
E20 - 9 psi 47 --- --- 1168 49 1310 (00) 833 (00) 750 (00)
E10 - 10 psi 244 --- --- 1331 574 4920 (00) 8394 (00) 113738 (49)
E10 - 7 psi 239 --- --- 1057 329 5242 (00) 3974 (00) 3944 (00)
E0 - 9 psi 107 --- --- 967 521 4559 (00) 3585 (00) 11017 (00)
E0 - 7 psi 252 --- --- 363 33 4943 (00) 3190 (00) 2815 (00)
E20 - 9 psi 168 --- --- 1394 560 4709 (00) 4400 (00) 7518 (00)
E10 - 10 psi 104 90 --- 719 16 3192 (00) 2602 (00) 2370 (00)
E10 - 7 psi 122 --- --- 979 00 2247 (00) 2317 (00) 2675 (00)
E0 - 9 psi 85 --- --- 811 251 2021 (00) 1659 (2) 1763 (72)
E0 - 7 psi 87 --- --- 797 225 2483 (00) 2941 (00) 2888 (00)
E20 - 9 psi 193 --- --- 1025 00 4168 (00) 4148 (00) 4506 (00)
E10 - 10 psi 324 --- --- 1742 118 25907 (578) 34779 (630) 36014 (643)
E10 - 7 psi 325 --- --- 1683 192 3975 (02) 3550 (01) 3621 (04)
E0 - 9 psi 178 136 --- 1091 254 3270 (00) 2667 (00) 2746 (108)
E0 - 7 psi 204 380 --- 787 00 2117 (00) 2208 (00) 2081 (00)
E20 - 9 psi 204 --- --- 543 74 4685 (00) 4526 (00) 4198 (00)
216
211
2004
Toyota
Camry
XLE
215
2004
Toyota
High-
lander
212
2006
Ford
Taurus
214
2004
Ford
Escape
211L
207L
Static Permeation - mghr Dynamic Perm - mghr
CRC E-77-2 Program Test Results
Diurnal (65ordm to 105ordm) - mgday
202
1996
Taurus
205
2001
Toyota
Corolla
204
1999
Honda
Accord
207
2001
Dodge
Caravan
202L
Table 13
41
Individual Vehicle Diurnal Performance on the Various Fuels
0
1000
2000
3000
4000
5000
6000
0 10 20 30 40 50 60 70
Cu
mu
lati
ve
Pe
rme
ati
on
-m
g
Test Time - hrs
Three Day DiurnalVehicle 204 1999 Honda Accord
10 psi E10
7 psi E10
9 psi E0
7 psi E0
9 psi E20
0
1000
2000
3000
4000
5000
6000
0 10 20 30 40 50 60 70
Cu
mu
lati
ve
Pe
rme
ati
on
-m
g
Test Time - hrs
Three Day DiurnalVehicle 205 - 2001 Toyota Corolla
10 psi E10
7 psi E10
9 psi E0
7 psi E0
9 psi E20
Figure 25 ndash Vehicle 204 Diurnal Performance
Figure 26 ndash Vehicle 205 Diurnal Performance
42
0
500
1000
1500
2000
2500
3000
3500
4000
4500
5000
0 10 20 30 40 50 60 70
Cu
mu
lati
ve
Co
rre
cte
d P
erm
ea
tio
n -
mg
Test Time - hrs
Three Day DiurnalVehicle 207 - 2001 Dodge Caravan
10 psi E10
7 psi E10
9 psi E0
7 psi E0
9 psi E20
0
100
200
300
400
500
600
700
800
900
0 10 20 30 40 50 60 70
Cu
mu
lati
ve
Pe
rme
ati
on
-m
g
Test Time - hrs
Three Day DiurnalVehicle 211 - 2004 Toyota Camry XLE
10 psi E10
7 psi E10
9 psi E0
7 psi E0
9 psi E20
Figure 27 ndash Vehicle 207 Diurnal Performance
Figure 28 ndash Vehicle 211 Diurnal Performance
43
0
50
100
150
200
250
300
350
400
450
500
0 10 20 30 40 50 60 70
Cu
mu
lati
ve
Pe
rme
ati
on
-m
g
Test Time - hrs
Three Day DiurnalVehicle 212 - 2006 Ford Taurus
10 psi E10
7 psi E10
9 psi E0
7 psi E0
9 psi E20
0
500
1000
1500
2000
2500
3000
3500
4000
4500
5000
0 10 20 30 40 50 60 70
Cu
mu
lati
ve
Pe
rme
ati
on
-m
g
Test Time - hrs
Three Day DiurnalVehicle 214 2004 Ford Escape
10 psi E10
7 psi E10
9 psi E0
7 psi E0
9 psi E20
Note The incomplete cumulative results for the 10 psi E10 results resulted from a conflict for the use
of the INNOVA analyzer during the test The INNOVA analyzer is required to correct for the FIDrsquos
ethanol error and the presence of methanol and refrigerant (R-134a) The data was available for the
50+ hour results and the data is valid as shown We have no explanation for the high levels
experienced on the third day of the test No test errors were identified
Figure 29 ndash Vehicle 212 Diurnal Performance
Figure 30 ndash Vehicle 214 Diurnal Performance
44
0
200
400
600
800
1000
1200
1400
1600
0 10 20 30 40 50 60 70
Cu
mu
lati
ve
Pe
rme
ati
on
-m
g
Test Time - hrs
Three Day DiurnalVehicle 215 2004 Toyota Highlander
10 psi E10
7 psi E10
9 psi E0
7 psi E0
9 psi E20
Figure 31 ndash Vehicle 215 Diurnal Performance
45
Table 14
Test Corrected
Vehicle Fuel Total Fuel EtOH R134a Methanol
204 10 psi E10 509899 144040 18298 16754
1999 Honda 7 psi E10 359057 130806 17551 15221
Accord 9 psi E0 178635 13843 18230 9896
7 psi E0 94846 1856 16631 2379
9 psi E20 304271 128408 18261 12143
205 10 psi E10 526659 186599 23354 20895
2001 Toyota 7 psi E10 502229 204246 25990 19198
Corolla 9 psi E0 148775 000 20434 4613
7 psi E0 111536 5489 22408 5619
9 psi E20 514540 212708 25677 19584
207 10 psi E10 389450 196248 12013 30399
2001 Dodge 7 psi E10 272201 114027 11731 19616
Caravan 9 psi E0 105167 1820 12224 15284
7 psi E0 96906 1118 22141 14276
9 psi E20 427882 241488 14268 25432
211 10 psi E10 78164 19733 15159 46970
2004 Toyota 7 psi E10 61190 20211 15929 46525
Camry LE 9 psi E0 34668 1681 14329 42659
7 psi E0 39468 000 16197 57303
9 psi E20 71013 26726 16213 36879
212 10 psi E10 31508 7222 14831 7896
2006 Ford 7 psi E10 36079 10132 15481 3400
Taurus 9 psi E0 22870 2409 15182 3761
7 psi E0 22973 000 15393 4362
9 psi E20 28935 11156 14116 2629
214 10 psi E10 1257887 000 19947 27992
2004 Ford 7 psi E10 131593 24571 16025 8879
Escape 9 psi E0 191611 2940 16487 7213
7 psi E0 109481 5386 80650 3106
9 psi E20 166271 24097 14491 6096
215 10 psi E10 81644 12178 14658 42609
2004 Toyota 7 psi E10 72399 15092 15532 36061
Highlander 9 psi E0 54431 000 14806 25822
7 psi E0 83115 000 14072 26255
9 psi E20 128223 38822 12841 34420
3 Day Diurnal Results
CRC E77-2 Program Diurnal ResultsAll values are in mg
46
0
200
400
600
800
1000
1200
1400
1600
1800
2000
Co
rrecte
d D
aily D
iurn
al
-m
g
Diurnal Ethanol PortionVehicle 204 - 1999 Honda Accord
Ethanol Portion
10 psi E10 9 psi E07 psi E10
1 32
315
341368
383
264273
1 321 321 321 32
9 psi E207 psi E0
1122097
39
0510
442
405412
Figure 32 ndash Vehicle 204 Diurnal Ethanol Portion
0
200
400
600
800
1000
1200
1400
1600
1800
2000
Co
rrecte
d D
aily D
iurn
al
-m
g
Diurnal Ethanol PortionVehicle 205 - 2001 Toyota Corolla
Ethanol Portion
10 psi E10 9 psi E07 psi E10
1 32
359
406
382
431355349
1 321 321 321 32
9 psi E207 psi E0
0 00
712649
406
420414
Figure 33 ndash Vehicle 205 Diurnal Ethanol Portion
47
0
200
400
600
800
1000
1200
1400
1600C
orr
ecte
d D
aily D
iurn
al
-m
g
Diurnal Ethanol PortionVehicle 207 - 2001 Dodge Caravan
Ethanol Portion
10 psi E10 9 psi E07 psi E10
1 32
488
442408
409
490535
1 321 321 321 32
9 psi E207 psi E0
00
1144
27
0101
556
587552
Figure 34 ndash Vehicle 207 Diurnal Ethanol Portion
0
50
100
150
200
250
300
350
400
Co
rrecte
d D
aily D
iurn
al
-m
g
Diurnal Ethanol PortionVehicle 211 - 2004 Toyota Camry XLE
Ethanol Portion
10 psi E10 9 psi E07 psi E10
1 32
264
242245
1 321 321 321 32
9 psi E207 psi E0
329
306356
00
73
64
00
00
00
325
431
370
Figure 35 ndash Vehicle 211 Diurnal Ethanol Portion
48
0
20
40
60
80
100
120
140
160
180
200C
orr
ecte
d D
aily D
iurn
al
-m
g
Diurnal Ethanol PortionVehicle 212 - 2006 Ford Taurus
Ethanol Portion
10 psi E10 9 psi E07 psi E10
1 32
216
170
316
1 321 321 321 32
9 psi E207 psi E0
194
288
436 102
105
85
00
00
00476
529
243
Figure 36 ndash Vehicle 212 Diurnal Ethanol Portion
0
200
400
600
800
1000
1200
Co
rrecte
d D
aily D
iurn
al
-m
g
Diurnal Ethanol PortionVehicle 214 - 2004 Ford Escape
Ethanol Portion
10 psi E10 9 psi E07 psi E10
1 32
00
1 321 321 321 32
9 psi E207 psi E0
201
202152
38
05
19
56
1469
103
171188
143
67
11275
Figure 37 ndash Vehicle 214 Diurnal Ethanol Portion
49
0
50
100
150
200
250
300
350
400
450
500C
orr
ecte
d D
aily D
iurn
al
-m
g
Diurnal Ethanol PortionVehicle 215 - 2004 Toyota Highlander
Ethanol Portion
10 psi E10 9 psi E07 psi E10
1 32
121
136
196
1 321 321 321 32
9 psi E207 psi E0
198
217213
0000
00
0000
00
335 292
283
Figure 38 ndash Vehicle 215 Diurnal Ethanol Portion

19
Table 3
Vehicle ID Technology 7psi E0 9 psi E0 7 psi E10 10 psi E10 9 psi E20
204
1999 Honda Enhanced 129 338 664 843 553
Accord
205
2001 Toyota Enhanced 99 195 596 416 462
Corolla
207
2001 Dodge Enhanced 401 325 644 787 882
Caravan
214
2004 Ford Enhanced 252 107 239 244 168
Escape
215
2004 Toyota Enhanced 87 85 122 104 193
Highlander
194 210 453 479 452
211
2004 Toyota Near Zero 91 101 94 199 558
Camry XLE
212
2006 Ford Near Zero 09 32 218 106 47
Taurus
50 67 156 153 303
Static Permeation Rate - mghr
CRC E-77-2 Program - Static Permeation Results
Enhanced Averages
Near Zero Averages
Summary ndash Static permeation rate increased with increase in ethanol level Three of the 5
enhanced emission vehicles did not show an increase in permeation rate when tested with the 9
psi E0 compared to the 7 psi E0
20
Dynamic (Running Loss) Permeation - In a similar presentation Figure 14 shows the average
ldquoRunning Lossrdquo permeation rate for the vehicle types and the fuels tested ldquoRunning Lossrdquo
permeation as described here is the permeation measured during a ldquocold startrdquo 48 minute drive in
a Running-Loss SHED (RL-SHED) at 86degF
0
50
100
150
200
250
300
350
400
7E0 9E0 7E10 10E10 9E20 7E0 9E0 7E10 10E10 9E20
Co
rre
cte
d R
un
nin
g L
os
s P
erm
ea
tio
n -
mg
hr
Fuel
Running Loss Permeation Rate - All FuelsE77-2 Program Vehicles
Enhanced(5 vehs)
Near Zero(2 vehs)
The dynamic permeation rates for the enhanced vehicles (left panel) followed a similar pattern as
the static permeation The average of the E20 fuel was the highest of the average values
observed on both the enhanced and the near-zero vehicles (left and right panels respectively)
Table 4 below shows the data used to generate the averages used in Figure 14
Figure 14 ndash Running Loss Permeation Comparison
21
Table 4
Vehicle ID Technology 7psi E0 9 psi E0 7 psi E10 10 psi E10 9 psi E20
204
1999 Honda Enhanced 2226 2492 2879 3164 2720
Accord
205
2001 Toyota Enhanced 671 1031 2328 1916 1697
Corolla
207
2001 Dodge Enhanced 8425 8339 8122 8581 10282
Caravan
214
2004 Ford Enhanced 363 967 1057 1331 1394
Escape
215
2005 Toyota Enhanced 797 811 979 719 1025
Highlander
2496 2728 3073 3142 3424
211
2004 Toyota Near Zero 1046 837 563 1383 4106
Camry XLE
212
2006 Ford Near Zero 1845 1158 2012 1489 1168
Taurus
1446 998 1288 1436 2637
Enhanced Averages
Near Zero Averages
CRC E-77-2 Program - Running Loss Permeation Results
Running Loss Permeation Rate - mghr
Summary ndash The dynamic permeation rate (measured during vehicle operation) was higher with
the E10 fuel compared to E0 for the enhanced vehicles The E20 permeation rate was higher
than E0 and the E10 fuel The small sample size and limited data precludes us from making
statements about statistical confidence but this may indicate a trend The near zero vehicle
average increased as the ethanol level increased Trends with volatility were mixed or
inconclusive
22
Hot Soak (ldquoTrue Hot Soakrdquo) Permeation ndash The Hot Soak emissions as defined in this report
are the net increase in permeation rate following vehicle operation We measured the mass
increase in the SHED for one hour immediately following vehicle operation and subtracted the
previously measured static (or normal) permeation at the same temperature While this is not the
traditional Code of Federal Regulations (CFR) definition we feel it is appropriate for the intent
of this project
0
10
20
30
40
50
60
70
7E0 9E0 7E10 10E10 9E20 7E0 9E0 7E10 10E10 9E20
Co
rre
cte
d H
ot
So
ak
Pe
rme
ati
on
-m
gh
r
Fuel
True Hot Soak Permeation Rate - All FuelsE77-2 Program Vehicles
Enhanced(5 vehs)
Near Zero(2 vehs)
The ldquoTrue Hot Soakrdquo performance for the average of the Enhanced Vehicles is summarized in
Figure 15 above There was a large increase in the hot soak value with the E10 fuel compared to
the E0 The hot soak value with the E20 fuel was comparable to the E0 results and lower than
the E10
The Near Zero vehicles (2) had zero hot soak emissions when tested on the 10 psi E10 fuel
(Figure 16) With only two vehicles and the very low levels attained no statistically significant
conclusions can be drawn from the data available Table 5 presents the individual tests used in
calculating the average values plotted in Figure 15
Figure 15 ndash True Hot Soak Permeation Comparison
23
Table 5
Vehicle ID Technology 7psi E0 9 psi E0 7 psi E10 10 psi E10 9 psi E20
204
1999 Honda Enhanced 187 443 297 04 134
Accord
205
2001 Toyota Enhanced 00 10 719 295 603
Corolla
207
2001 Dodge Enhanced 00 58 1222 2377 00
Caravan
214
2004 Ford Enhanced 33 521 329 574 560
Escape
215
2005 Toyota Enhanced 225 251 00 16 00
Highlander
89 257 513 653 259
211
2004 Toyota Near Zero 07 153 138 00 00
Camry XLE
212
2006 Ford Near Zero 18 04 00 00 49
Taurus
13 79 69 00 25
CRC E-77-2 Program - True Hot Soak Permeation Results
True Hot Soak Permeation Rate - mghr
Near Zero Averages
Enhanced Averages
Summary - The True Hot Soak permeation (permeation rate measured following vehicle
operation less the static constant temperature permeation rate) rate was higher with the E10 fuel
compared to E0 for the enhanced vehicles The E20 permeation rate was higher than E0 and
lower than the E10 fuel The near zero vehicle trends with both ethanol content and volatility
were mixed or inconclusive The small sample size and limited data precludes us from making
statements about statistical confidence
24
Diurnal Permeation Performance ndash Figure 16 presents the diurnal permeation results for the
first day of the three-day diurnal test (65deg to 105degF)
0
200
400
600
800
1000
1200
7E0 9E0 7E10 10E10 9E20 7E0 9E0 7E10 10E10 9E20
Co
rre
cte
d F
ue
l D
iurn
al
Pe
rme
ati
on
-m
gs
da
y
Day 1 Diurnal Permeation RatesAverages from E-77-2 Vehicles
Fuel
Enhanced(5 vehs)
Near Zero(2 vehs)
The average day 1 diurnal permeation for the five Enhanced Vehicles tended to increase as
ethanol content increased (with the exception of the E20 fuel) Again sample size and limited
data makes statistical conclusions inappropriate Table 6 presents the individual test used to
generate the averages used in Figure 16 The table includes the data from days 2 and 3 The
ethanol content of the diurnal measurements was calculated and appear in a series of figures in
the Appendix starting at page 37 Unlike Figure 16 the figures shown in the appendix have not
been corrected to exclude the non-fuel emissions (methanol and refrigerant) that were present
during these tests
Figure 16 ndash Day 1 Diurnal Permeation Comparison
25
Table 6
Vehicle ID Technology 7psi E0 9 psi E0 7 psi E10 10 psi E10 9 psi E20
204 Day 1 3672 6283 12601 15479 11034
1999 Honda Enhanced Day 2 2877 5810 11652 17799 9581
Accord Day 3 2936 5770 11653 17711 9812
205 Day 1 3830 4995 17834 17941 17752
2001 Toyota Enhanced Day 2 3654 4810 17150 17309 16900
Corolla Day 3 3670 5072 15239 17417 16802
207 Day 1 3975 4064 10865 14064 15480
2001 Dodge Enhanced Day 2 3026 3373 8120 12644 13702
Caravan Day 3 2689 3080 8236 12237 13605
214 Day 1 4943 4559 5242 4920 4709
2004 Ford Enhanced Day 2 3190 3585 3974 8394 4400
Escape Day 3 2815 11017 3944 113738 7518
215 Day 1 2483 2021 2247 3192 4168
2004 Toyota Enhanced Day 2 2941 1659 2317 2602 4148
Highlander Day 3 2888 1763 2675 2370 4506
3781 4384 9758 11119 10629
211 Day 1 2071 1303 2438 3370 2840
2004 Toyota Near Zero Day 2 1002 1158 1838 2268 2218
Camry XLE Day 3 874 1006 1843 2179 2034
212 Day 1 1016 1005 1848 1243 1310
2006 Ford Near Zero Day 2 712 708 1002 879 833
Taurus Day 3 570 574 758 1028 750
1544 1154 2143 2307 2075
CRC E-77-2 Program Results - Diurnal Permeation
Diurnal Permeation Rate - mgday
Enhanced Averages
Near Zero Averages
Carbon Canister Breakthrough ndash Canister breakthrough is measured by the weight change
recorded for the trap canister outside the SHED It quantifies the amount of vapors that
overwhelm the evaporative system storage canister Figure 17 displays the breakthrough
resulting from testing of 9 psi E0 fuel Only four of seven vehicles exhibited breakthrough
60
65
70
75
80
85
90
95
100
105
110
0
5
10
15
20
25
30
35
40
0 10 20 30 40 50 60 70
SH
ED
Te
mp
era
ture
-d
eg
F
Bre
ak
thro
ug
h -
mg
Test Time - hrs
Canister Breakthrough9 psi E0 Fuel - 65ordm to 105ordm F Diurnal
204 - 1999 Honda Accord
211 - 2004 Toyota Camry
215 - 2004 Toyota Highlander
205 - 2001 Toyota Corolla
Figure 17 ndashDiurnal Canister Breakthrough
26
Table 7 shows the breakthrough generated during the diurnal tests conducted
Table 7
Vehicle ID Technology 7psi E0 9 psi E0 7 psi E10 10 psi E10 9 psi E20
204 Day 1 --- 24 --- 310 ---
1999 Honda Enhanced Day 2 --- 136 --- 360 ---
Accord Day 3 --- 198 --- 360 ---
205 Day 1 --- --- --- 204 ---
2001 Toyota Enhanced Day 2 --- --- --- 309 ---
Corolla Day 3 --- 26 --- 293 ---
207 Day 1 --- --- --- --- ---
2001 Dodge Enhanced Day 2 --- --- --- --- ---
Caravan Day 3 --- --- --- --- ---
214 Day 1 --- --- --- --- ---
2004 Ford Enhanced Day 2 --- --- --- --- ---
Escape Day 3 --- --- --- 49 ---
215 Day 1 --- --- --- --- ---
2004 Toyota Enhanced Day 2 --- 02 --- --- ---
Highlander Day 3 --- 72 --- --- ---
211 Day 1 --- --- --- --- ---
2004 Toyota Near Zero Day 2 --- 129 --- 191 ---
Camry XLE Day 3 --- 176 --- 289 ---
212 Day 1 --- --- --- --- ---
2006 Ford Near Zero Day 2 --- --- --- --- ---
Taurus Day 3 --- --- --- 204 ---
CRC E-77-2 Program - Carbon Canister Diurnal Breakthrough Results
Diurnal Breakthrough - grams
Summary ndash The lack of canister breakthrough for the 7 psi fuels (summer grade) indicates that
the storage capacity of the seven systems tested is appropriately sized Breakthrough began to
appear when testing of 9 psi E0 fuel (not summer grade) and was more prevalent with the 10 psi
E10 fuel (winter grade) The lack of breakthrough with the 9 psi E20 fuel seems to be an
anomaly
27
Overall Trend Summary - The following chart (Figure 18) visually summarizes the trends seen
from all testing performed during this program
Higher Volatility E0 to E10 E0 to E20 E10 to E20
uarr uarr uarr uarr
Higher Volatility E0 to E10 E0 to E20 E10 to E20
uarr uarr uarr uarr
Higher Volatility E0 to E10 E0 to E20 E10 to E20
uarr uarr uarr uarr
Higher Volatility E0 to E10 E0 to E20 E10 to E20
uarr uarr uarr uarr
Higher Volatility E0 to E10 E0 to E20 E10 to E20
uarrharr uarr uarr uarr
Higher Volatility E0 to E10 E0 to E20 E10 to E20
uarr uarr uarr uarr
Higher Volatility E0 to E10 E0 to E20 E10 to E20
uarr darr darr
Higher Volatility E0 to E10 E0 to E20 E10 to E20
uarr uarr uarr harr
Ethanol Content
Diurnal
Trend Analysis for E-77-2 Program
Ethanol Content
Static Permeation
Ethanol Content
Running Loss Permeation
Ethanol Content
Ethanol Content
Diurnal
Enhanced Vehicles (Sample of 5)
Static Permeation
Ethanol Content
Ethanol Content
Running Loss Permeation
Ethanol Content
True Hot Soak (TEFVO)
Near-Zero Vehicles (Sample of 2)
True Hot Soak (TEFVO)
Figure 18 Trend Analysis Summaries
28
Vehicle 202 ndash 1996 Ford Taurus - Special Case
We have treated vehicle 202 as a special case This was the oldest of the vehicles tested and had
been subjected to limited exhaust emission tests with a 20-volume percent ethanol fuel (E20)
during the CRC E-74b test program
Vehicle 202 completed the E10 portion of the test program (10 and 7 psi fuels) successfully and
completed the road preconditioning on the E0 fuel prior to the E0 evaluations The first test on
the E0 fuel was excessively high indicating a fuel leak It was traced to a leaky fuel injector o-
ring and there was considerable discussion as to an appropriate repair Tests were made on the 9
and the 7 psi E0 fuel to measure the magnitude of a vehicle in a ldquoleakrdquo condition and the tests
were labeled as ldquo202L (Leak)rdquo The fuel injector o-rings were replaced as a complete set and
the vehicle resumed testing as ldquo202Rrsquo (Repaired) A new elusive vapor leak was present later
identified as a very small leak at the top of the fuel fill pipe
The circle on Figure 19 at the right shows
the location of the small leak This leak
was problematic as to its effect on the
emission measurements because its
magnitude or presence seemed to depend
on the torque exerted on the fuel cap The
tests on the E0 fuels (9 and 7 psi) are
noted as 202R but with a vapor leak
We attempted to fix this leak and repeated
the E10 test with the vehicle re-identified
as 216 with reasonable results We also
ran the E20 test sequence and declared the
vehicle done
The testing history for this vehicle is shown in Tables 8 (Static) 9 (Dynamic) and 10 (Diurnal)
The tests highlighted in yellow are those that exhibited a liquid or vapor leak as identified during
the static test leak validation
Figure 19 ndash Vehicle 202 Fuel Fill Pipe Leak
29
Table 8
Static Permeation Results 1996 Ford Taurus SHED
Corrected Results Canister
Fuel Permeation mgday Loss
Veh psiEtOH Test Type Date Test mghr (Corrected) g
202 100E10 Static Perm 071807 7018 345 000
Press Incr 00 No Leak
Prs+Fuel Incr 00
202 70E10 Static Perm 082107 7031 223 000
Press Incr 00 No Leak
Prs+Fuel Incr 00
202L 90E0 Static Perm 030408 7169 2292 000
Press Incr DNA
Prs+Fuel Incr 4921 Liquid Leak
202L 70E0 Static Perm 032008 7183 2991 000
Press Incr DNA
Prs+Fuel Incr 19896 Liquid Leak
202R 90E0 Static Perm 050808 7228 178 000
Press Incr 136 Vapor Leak
Prs+Fuel Incr 00
202R 70E0 Static Perm 052208 7239 204 000
Press Incr 380 Vapor Leak
Prs+Fuel Incr 00
216 100E10 Static Perm 081408 7299 324 000
Press Incr 00 No Leak
Prs+Fuel Incr 00
216 70E10 Static Perm 091708 7326 325 000
Press Incr 00 No Leak
Prs+Fuel Incr 00
216 90E20 Static Perm 103008 7363 204 000
Press Incr 00 No Leak
Prs+Fuel Incr 00
30
Table 9
Dynamic Permeation Results 1996 Ford Taurus SHED
Corrected Results Canister From
Fuel Permeation mgday Loss Static
Veh psiEtOH Test Type Date Test mghr (Corrected) g Test
202 100E10 Dynamic RL 072007 25662 1278 000 No Leak
TEFVO 386 000
202L 90E0 Dynamic RL 030508 25695 3870 000 Liquid Leak
TEFVO 00 000
202L 70E0 Dynamic RL 032408 25699 7269 000 Liquid Leak
TEFVO 00 000
202R 90E0 Dynamic RL 050908 25704 1091 000 Vapor Leak
TEFVO 50 000
202R 70E0 Dynamic RL 052308 25706 787 000 Vapor Leak
TEFVO 00 000
216 100E10 Dynamic RL 081508 25718 1742 000 No Leak
TEFVO 14 000
216 70E10 Dynamic RL 091808 25721 1683 000 No Leak
TEFVO 423 000
216 90E20 Dynamic RL 110708 25730 543 000 No Leak
TEFVO 00 000
31
Table 10
Diurnal Permeation Results 1996 Ford Taurus SHED
Corrected Results Canister From
Fuel Permeation mgday Loss Static
Veh psiEtOH Test Type Date Test mghr (Corrected) g Test
202 100E10 72 DHB 65-105 073107 7023
Day 1 10429 612 No Leak
Day 2 7069 3264
Day 3 7043 3869
202 70E10 72 DHB 65-105 082807 7034
Day 1 6278 000 No Leak
Day 2 5065 000
Day 3 4535 000
202L 90E0 72 DHB 65-105 031108 7173
Day 1 22589 000 Liquid Leak
Day 2 32310 000
Day 3 23069 1260
202L 70E0 72 DHB 65-105 040108 7196
Day 1 47425 000 Liquid Leak
Day 2 44517 000
Day 3 31798 000
202R 90E0 72 DHB 65-105 051308 7230
Day 1 3270 000 Vapor Leak
Day 2 2667 000
Day 3 2746 1083
202R 70E0 72 DHB 65-105 052808 7243
Day 1 2117 000 Vapor Leak
Day 2 2208 000
Day 3 2081 000
216 100E10 72 DHB 65-105 082008 7305
Day 1 25907 5777 No Leak
Day 2 34779 6299
Day 3 36014 6343
216 70E10 72 DHB 65-105 092308 7331
Day 1 3975 022 No Leak
Day 2 3550 006
Day 3 3621 037
216 90E20 72 DHB 65-105 111108 7373
Day 1 4685 000 No Leak
Day 2 4526 000
Day 3 4198 000
32
The Implanted Leak Test Results
Project E-77-2 included evaluating two vehicles with implanted leaks This interest followed the
information gathered in the Pilot Study where tests were run with a specially modified fuel cap
containing a 002rdquo dia hole The results with the implanted leak from the Pilot Study are
repeated in Table 11 below as the diurnal results are shown for a 1996 Chevrolet Cavalier first
without the implanted leak at 038 grams per day and then at 207 grams per day (a 54x
increase) with the leak
Table 11
Veh No
Evap
Tech Fuel
Results
gmsday
gms
Increase
6 1996 Chevrolet Cavalier Enhanced 7 psi E0 038
7 2070 2032
207 2001 Dodge Caravan Enhanced 7 psi E10 109
207L 213 104
211 2004 Toyota Camry LE Near Zero 7 psi E10 024
211L 068 044
- Implanted 020 leak in fuel cap
Vehicle Description
Implanted Leak Impact on Diurnal PermeationDay One Results 65deg - 105degF Diurnal
The two E-77-2 vehicles (207 amp 211) were given a limited evaluation with an induced leak and
saw a significantly lesser impact Vehicle 207 gave diurnal results increases from 109 to 213
grams per day (a 2x increase) and Vehicle 211 increased from 024 grams per day to 068 grams
per day (a 28x increase) The following Figure 20 displays the imbedded leak impact from Table
11
33
0
5
10
15
20
On
e D
ay
Diu
rna
l P
erm
ea
tio
n -
gm
sd
ay
Vehicle Number
Implanted Leak Impact on One Day Diurnal Permeation020 Leak in Fuel Cap - 65 to 105 F Diurnal
207L 211L21120776
As Received - No Leak
020 Fuel Cap Leak
The newer vehicles evaluated in this phase of the study were configured and certified to the
Onboard Refueling Vapor Regulations (ORVR) These are capable of containing 95 or more
control of the refueling vapors at up to 10 gallons per minute fueling rate Where the Chevrolet
Cavalier had a small (0055rdquo dia) orifice and a long vapor tube venting the tankrsquos vapor space to
the carbon canister (and then to the atmosphere) the ORVR compliant vehicles have a large
(0688rdquo ID) short vent hose to a low flow restriction carbon canister
The following bar charts (Figures 21 through 24) show the impacts of the leak on all phases of
the evaporative testing performed and compare those results with all fuels tested With only two
vehicles (207 and 211) evaluated on two fuels statistically significant effects cannot be
quantified but the trend of increased emissions is apparent
Figure 20 ndash Implanted Leak Impact
34
0
20
40
60
80
100
120
140
160
7E0 9E0 7E10 10E10 9E20 7E0 9E0 7E10 10E10 9E20
Sta
tic
Pe
rme
ati
on
-m
gh
r
Fuel
0020 dia Induced Leak EffectStatic Permeation
Vehicle 211Vehicle 207
Leak
Leak
0
200
400
600
800
1000
1200
7E0 9E0 7E10 10E10 9E20 7E0 9E0 7E10 10E10 9E20
Ru
nn
ing
Lo
ss
Pe
rme
ati
on
-m
gh
r
Fuel
0020 dia Induced Leak EffectRunning Loss Permeation
Vehicle 211Vehicle 207
Leak
Leak
Figure 21 ndash Vehicles 207 and 211 with Induced Leak - Static
Figure 22 ndash Vehicles 207 and 211with Induced Leak ndash Running Loss
35
0
100
200
300
400
500
600
700
7E0 9E0 7E10 10E10 9E20 7E0 9E0 7E10 10E10 9E20
Tru
e H
ot S
oa
k P
erm
ea
tio
n -
mg
hr
Fuel
0020 dia Induced Leak EffectTrue Hot Soak Permeation
Vehicle 211Vehicle 207
Leak
Leak
0
500
1000
1500
2000
2500
7E0 9E0 7E10 10E10 9E20 7E0 9E0 7E10 10E10 9E20
Da
y 1
Diu
rna
l P
erm
ea
tio
n -
mg
da
y
Fuel
0020 dia Induced Leak EffectDay 1 Diurnal Permeation
Vehicle 211Vehicle 207
Leak
Leak
Figure 24 ndash Vehicles 207 and 211 with Induced Leak - Diurnal
Figure 23 ndash Vehicles 207 and 211 with Induced Leak ndash True Hot Soak
36
Summary of Findings and Results
The E-77-2 test program was a continuation of the previously published E-77 test project and
added eight vehicles tested on five fuels to the knowledge base The permeation trends
previously shown were again present The small sample size and limited number of tests
preclude making statements about statistical validity but in general
o The newer vehicle groups had lower emissions
o Adding ethanol to the fuel increased permeation over the non-oxygenated levels
o Increased volatility increased permeation levels
o SHED emission rates must be corrected for the ethanol error in the FID and the
non-fuel methanol and refrigerant in the measurement
As this test program evolved and additional experience was gathered two program modifications
were made 1) The leak validation methodology was changed and 2) a different metric and
definition of the ldquoHot Soakrdquo was adopted
The leak validation portion of the static permeation test was found to be very sensitive and when
the data was corrected on a minute-by-minute basis for ethanol methanol and refrigerant the
change in apparent permeation rate was due as much to variation as to leaks See the discussion
starting at page 12 for the details of the development
Concern for and recognition of ldquoHot Soakrdquo emissions started in the original evaporative emission
regulations Carburetors had float bowls with ~ 50 ml of fuel that absorbed the latent engine heat
after the vehicle was shut down after operation The heat would cause the bowl temperature to
increase driving fuel vapors out through vents and leak paths to the atmosphere after vehicle
operation Todayrsquos fuel injection engines do not have the open bowls and the emission rates
following vehicle operation are mainly increased temperature permeation We recommended
and adopted a new name for the ldquotemporary emissions following vehicle operationrdquo (TEFVO)
which subtracts the basic permeation rate from the measured emissions See the discussion
starting at page 16 for details
37
Appendix
Acknowledgements
E-77-2 Steering Committee
David Brzezinski EPA
Kevin Cullen GM Powertrain
Dominic DiCicco Ford Motor Company
King D Eng Shell Global Solutions
Ben Hancock CARB
Constance Hart EPA
Phil Heirigs Chevron Global Downstream
Jeff Jetter Honda RampD Americas
Keith KnollNREL
John Koupal EPA
David H Lax API
Jeff Long CARB
Hector Maldonado CARB
Mani Natarajan Marathon Oil Company
David N Patterson Mitsubishi Motors RampD Americas
Jenny Sigelko Chrysler
James P UihleinChevron Global Downstream
Marie Valentine Toyota Technical Center
Kenneth J Wright ConocoPhillips
CRC Members
Brent Bailey CRC
Chris Tennant CRC
Jane Beck CRC
38
Table 12
E0 E10 E20
Inspection Units Fuel 6 Fuel 7 Fuel 4
API Gravity degAPI 602 585 570
Relative Density 6060degF 07382 07447 07508
DVPE psi 701 730 849
Oxygenates--D4815
MTBE vol 000 000 000
ETBE vol 000 000 000
EtOH vol 000 954 2034
O2 wt 000 353 747
Hydrocarbon Composition
Aromatics vol 221 244 108
Olefins vol 80 88 55
Saturates vol 700 573 234
D86 Distillation
IBP degF 974 1040 1022
5 Evaporated degF 1316 1280 1252
10 Evaporated degF 1423 1330 1314
20 Evaporated degF 1564 1410 1413
30 Evaporated degF 1704 1450 1486
40 Evaporated degF 1840 1530 1547
50 Evaporated degF 1975 1950 1596
60 Evaporated degF 2120 2190 1636
70 Evaporated degF 2305 2410 2274
80 Evaporated degF 2588 2710 2695
90 Evaporated degF 3139 3170 3139
95 Evaporated degF 3322 3300 3255
EP degF 3603 3600 3406
Recovery vol 978 978 983
Residue vol 13 10 10
Loss vol 09 12 07
Driveability Index 11199 11015 9898
Data from CRC E-74
CRC E-77-2 Fuel Inspection Results
39
Fuel Units Fuel 6 Fuel 7 Fuel 4
Sulfur Content ppm 29 27 27
Estimated CH Ratio 62090 63323 63252
Est Net Heat of Combustion btulb 18573 18514 18513
Benzene vol 090 100 096
Research Octane Number 932 940 946
Motor Octane Number 838 838 834
(R+M)2 885 889 890
Fuel Units Fuel 6 Fuel 7 Fuel 4
Aromatics vol 2386 2481 2178
Olefins vol 752 892 1074
Saturates vol 6743 5621 4623
Unclassified vol 115 086 015
Ethanol vol 000 920 2111
Benzene vol 089 106 097
CH Ratio 6200 6092 5835
Oxygen wt 0008 1 340 773
Net Heat of Combustion btulb 18703 18016 17160
1 Contains 004 vol MTBE
Fuel Units Fuel 6 Fuel 7 Fuel 4
Oxygen wt 0008 3396 7733
C+H wt 9999 9660 9227
H wt 1389 1362 1350
C wt 8610 8298 7877
Fuel Units 6 7 4
Haltermann D3338 Btulb 18573 18514 18513
Average D3338 Btulb 18579 18514 18491
Oxygen Corrected D3338 Btulb 18579 17860 17103
DHA Btulb 18703 18016 17160
Table 12 (cont)
Suppliers Additional Inspections
Net Heat of Combusion -- Btulb
Carbon Hydrogen and Oxygen
Detailed Hydrocarbon Analysis
40
Vehicle Day 1 Day 2 Day 3
No Fuel Base + Press + Pump RL True HS Perm (Brkthru) Perm (Brkthru) Perm (Brkthru)
E10 - 10 psi 345 --- --- 1278 503 10429 (63) 7069 (348) 7043 (425)
E10 - 7 psi 223 --- --- 994 113 6278 (00) 5065 (00) 4535 (00)
E0 - 9 psi 2229 --- 4921 3870 00 22580 (00) 32310 (00) 23069 (126)
E0 - 7 psi 2991 --- 19896 7269 00 47425 (00) 44517 (00) 31798 (00)
E10 - 10 psi 843 --- --- 3164 04 15479 (310) 17799 (383) 17711 (419)
E10 - 7 psi 664 --- --- 2879 297 12601 (00) 11652 (00) 11653 (00)
E0 - 9 psi 338 --- --- 2492 443 6283 (24) 5810 (136) 5770 (225)
E0 - 7 psi 129 --- --- 2226 187 3672 (00) 2877 (00) 2936 (00)
E20 - 9 psi 553 --- --- 2720 134 11034 (00) 9581 (00) 9812 (00)
E10 - 10 psi 416 --- --- 1916 295 17941 (204) 17309 (346) 17417 (375)
E10 - 7 psi 596 --- --- 2328 719 17834 (00) 17150 (00) 15239 (00)
E0 - 9 psi 195 --- --- 1031 10 4995 (00) 4810 (00) 5072 (26)
E0 - 7 psi 99 --- --- 671 00 3830 (00) 3654 (00) 3670 (00)
E20 - 9 psi 462 --- --- 1697 603 17752 (00) 16900 (00) 16802 (00)
E10 - 10 psi 787 --- --- 8581 2377 14064 (00) 12644 (00) 12237 (00)
E10 - 7 psi 644 --- --- 8122 1222 10865 (00) 8120 (00) 8236 (00)
E0 - 9 psi 325 --- --- 8339 58 4064 (00) 3373 (00) 3080 (00)
E0 - 7 psi 401 --- --- 8425 00 3975 (00) 3026 (00) 2689 (00)
E20 - 9 psi 882 --- --- 10282 00 15480 (00) 13702 (00) 13605 (00)
E10 - 10 psi 976 --- 1209 10012 3929 16449 (00) NA NA
E10 - 7 psi 1468 --- --- 11393 5850 21342 (00) NA NA
E10 - 10 psi 199 --- --- 1383 00 3370 (00) 2268 (191) 2179 (330)
E10 - 7 psi 94 266 --- 563 138 2438 (00) 1838 (00) 1843 (00)
E0 - 9 psi 101 --- --- 837 153 1303 (00) 1158 (129) 1006 (221)
E0 - 7 psi 91 --- --- 1046 07 2071 (00) 1002 (00) 874 (00)
E20 - 9 psi 558 --- --- 4106 00 2840 (00) 2218 (00) 2034 (00)
E10 - 10 psi 551 --- 821 3024 2450 25454 (040) NA NA
E10 - 7 psi 481 --- 1664 2511 62 6783 (00) NA NA
E10 - 10 psi 106 --- --- 1489 00 1243 (00) 879 (00) 1028 (200)
E10 - 7 psi 218 --- --- 2012 00 1848 (00) 1002 (00) 758 (00)
E0 - 9 psi 32 --- --- 1158 04 1005 (00) 708 (00) 574 (00)
E0 - 7 psi 09 --- --- 1845 18 1016 (00) 712 (00) 570 (00)
E20 - 9 psi 47 --- --- 1168 49 1310 (00) 833 (00) 750 (00)
E10 - 10 psi 244 --- --- 1331 574 4920 (00) 8394 (00) 113738 (49)
E10 - 7 psi 239 --- --- 1057 329 5242 (00) 3974 (00) 3944 (00)
E0 - 9 psi 107 --- --- 967 521 4559 (00) 3585 (00) 11017 (00)
E0 - 7 psi 252 --- --- 363 33 4943 (00) 3190 (00) 2815 (00)
E20 - 9 psi 168 --- --- 1394 560 4709 (00) 4400 (00) 7518 (00)
E10 - 10 psi 104 90 --- 719 16 3192 (00) 2602 (00) 2370 (00)
E10 - 7 psi 122 --- --- 979 00 2247 (00) 2317 (00) 2675 (00)
E0 - 9 psi 85 --- --- 811 251 2021 (00) 1659 (2) 1763 (72)
E0 - 7 psi 87 --- --- 797 225 2483 (00) 2941 (00) 2888 (00)
E20 - 9 psi 193 --- --- 1025 00 4168 (00) 4148 (00) 4506 (00)
E10 - 10 psi 324 --- --- 1742 118 25907 (578) 34779 (630) 36014 (643)
E10 - 7 psi 325 --- --- 1683 192 3975 (02) 3550 (01) 3621 (04)
E0 - 9 psi 178 136 --- 1091 254 3270 (00) 2667 (00) 2746 (108)
E0 - 7 psi 204 380 --- 787 00 2117 (00) 2208 (00) 2081 (00)
E20 - 9 psi 204 --- --- 543 74 4685 (00) 4526 (00) 4198 (00)
216
211
2004
Toyota
Camry
XLE
215
2004
Toyota
High-
lander
212
2006
Ford
Taurus
214
2004
Ford
Escape
211L
207L
Static Permeation - mghr Dynamic Perm - mghr
CRC E-77-2 Program Test Results
Diurnal (65ordm to 105ordm) - mgday
202
1996
Taurus
205
2001
Toyota
Corolla
204
1999
Honda
Accord
207
2001
Dodge
Caravan
202L
Table 13
41
Individual Vehicle Diurnal Performance on the Various Fuels
0
1000
2000
3000
4000
5000
6000
0 10 20 30 40 50 60 70
Cu
mu
lati
ve
Pe
rme
ati
on
-m
g
Test Time - hrs
Three Day DiurnalVehicle 204 1999 Honda Accord
10 psi E10
7 psi E10
9 psi E0
7 psi E0
9 psi E20
0
1000
2000
3000
4000
5000
6000
0 10 20 30 40 50 60 70
Cu
mu
lati
ve
Pe
rme
ati
on
-m
g
Test Time - hrs
Three Day DiurnalVehicle 205 - 2001 Toyota Corolla
10 psi E10
7 psi E10
9 psi E0
7 psi E0
9 psi E20
Figure 25 ndash Vehicle 204 Diurnal Performance
Figure 26 ndash Vehicle 205 Diurnal Performance
42
0
500
1000
1500
2000
2500
3000
3500
4000
4500
5000
0 10 20 30 40 50 60 70
Cu
mu
lati
ve
Co
rre
cte
d P
erm
ea
tio
n -
mg
Test Time - hrs
Three Day DiurnalVehicle 207 - 2001 Dodge Caravan
10 psi E10
7 psi E10
9 psi E0
7 psi E0
9 psi E20
0
100
200
300
400
500
600
700
800
900
0 10 20 30 40 50 60 70
Cu
mu
lati
ve
Pe
rme
ati
on
-m
g
Test Time - hrs
Three Day DiurnalVehicle 211 - 2004 Toyota Camry XLE
10 psi E10
7 psi E10
9 psi E0
7 psi E0
9 psi E20
Figure 27 ndash Vehicle 207 Diurnal Performance
Figure 28 ndash Vehicle 211 Diurnal Performance
43
0
50
100
150
200
250
300
350
400
450
500
0 10 20 30 40 50 60 70
Cu
mu
lati
ve
Pe
rme
ati
on
-m
g
Test Time - hrs
Three Day DiurnalVehicle 212 - 2006 Ford Taurus
10 psi E10
7 psi E10
9 psi E0
7 psi E0
9 psi E20
0
500
1000
1500
2000
2500
3000
3500
4000
4500
5000
0 10 20 30 40 50 60 70
Cu
mu
lati
ve
Pe
rme
ati
on
-m
g
Test Time - hrs
Three Day DiurnalVehicle 214 2004 Ford Escape
10 psi E10
7 psi E10
9 psi E0
7 psi E0
9 psi E20
Note The incomplete cumulative results for the 10 psi E10 results resulted from a conflict for the use
of the INNOVA analyzer during the test The INNOVA analyzer is required to correct for the FIDrsquos
ethanol error and the presence of methanol and refrigerant (R-134a) The data was available for the
50+ hour results and the data is valid as shown We have no explanation for the high levels
experienced on the third day of the test No test errors were identified
Figure 29 ndash Vehicle 212 Diurnal Performance
Figure 30 ndash Vehicle 214 Diurnal Performance
44
0
200
400
600
800
1000
1200
1400
1600
0 10 20 30 40 50 60 70
Cu
mu
lati
ve
Pe
rme
ati
on
-m
g
Test Time - hrs
Three Day DiurnalVehicle 215 2004 Toyota Highlander
10 psi E10
7 psi E10
9 psi E0
7 psi E0
9 psi E20
Figure 31 ndash Vehicle 215 Diurnal Performance
45
Table 14
Test Corrected
Vehicle Fuel Total Fuel EtOH R134a Methanol
204 10 psi E10 509899 144040 18298 16754
1999 Honda 7 psi E10 359057 130806 17551 15221
Accord 9 psi E0 178635 13843 18230 9896
7 psi E0 94846 1856 16631 2379
9 psi E20 304271 128408 18261 12143
205 10 psi E10 526659 186599 23354 20895
2001 Toyota 7 psi E10 502229 204246 25990 19198
Corolla 9 psi E0 148775 000 20434 4613
7 psi E0 111536 5489 22408 5619
9 psi E20 514540 212708 25677 19584
207 10 psi E10 389450 196248 12013 30399
2001 Dodge 7 psi E10 272201 114027 11731 19616
Caravan 9 psi E0 105167 1820 12224 15284
7 psi E0 96906 1118 22141 14276
9 psi E20 427882 241488 14268 25432
211 10 psi E10 78164 19733 15159 46970
2004 Toyota 7 psi E10 61190 20211 15929 46525
Camry LE 9 psi E0 34668 1681 14329 42659
7 psi E0 39468 000 16197 57303
9 psi E20 71013 26726 16213 36879
212 10 psi E10 31508 7222 14831 7896
2006 Ford 7 psi E10 36079 10132 15481 3400
Taurus 9 psi E0 22870 2409 15182 3761
7 psi E0 22973 000 15393 4362
9 psi E20 28935 11156 14116 2629
214 10 psi E10 1257887 000 19947 27992
2004 Ford 7 psi E10 131593 24571 16025 8879
Escape 9 psi E0 191611 2940 16487 7213
7 psi E0 109481 5386 80650 3106
9 psi E20 166271 24097 14491 6096
215 10 psi E10 81644 12178 14658 42609
2004 Toyota 7 psi E10 72399 15092 15532 36061
Highlander 9 psi E0 54431 000 14806 25822
7 psi E0 83115 000 14072 26255
9 psi E20 128223 38822 12841 34420
3 Day Diurnal Results
CRC E77-2 Program Diurnal ResultsAll values are in mg
46
0
200
400
600
800
1000
1200
1400
1600
1800
2000
Co
rrecte
d D
aily D
iurn
al
-m
g
Diurnal Ethanol PortionVehicle 204 - 1999 Honda Accord
Ethanol Portion
10 psi E10 9 psi E07 psi E10
1 32
315
341368
383
264273
1 321 321 321 32
9 psi E207 psi E0
1122097
39
0510
442
405412
Figure 32 ndash Vehicle 204 Diurnal Ethanol Portion
0
200
400
600
800
1000
1200
1400
1600
1800
2000
Co
rrecte
d D
aily D
iurn
al
-m
g
Diurnal Ethanol PortionVehicle 205 - 2001 Toyota Corolla
Ethanol Portion
10 psi E10 9 psi E07 psi E10
1 32
359
406
382
431355349
1 321 321 321 32
9 psi E207 psi E0
0 00
712649
406
420414
Figure 33 ndash Vehicle 205 Diurnal Ethanol Portion
47
0
200
400
600
800
1000
1200
1400
1600C
orr
ecte
d D
aily D
iurn
al
-m
g
Diurnal Ethanol PortionVehicle 207 - 2001 Dodge Caravan
Ethanol Portion
10 psi E10 9 psi E07 psi E10
1 32
488
442408
409
490535
1 321 321 321 32
9 psi E207 psi E0
00
1144
27
0101
556
587552
Figure 34 ndash Vehicle 207 Diurnal Ethanol Portion
0
50
100
150
200
250
300
350
400
Co
rrecte
d D
aily D
iurn
al
-m
g
Diurnal Ethanol PortionVehicle 211 - 2004 Toyota Camry XLE
Ethanol Portion
10 psi E10 9 psi E07 psi E10
1 32
264
242245
1 321 321 321 32
9 psi E207 psi E0
329
306356
00
73
64
00
00
00
325
431
370
Figure 35 ndash Vehicle 211 Diurnal Ethanol Portion
48
0
20
40
60
80
100
120
140
160
180
200C
orr
ecte
d D
aily D
iurn
al
-m
g
Diurnal Ethanol PortionVehicle 212 - 2006 Ford Taurus
Ethanol Portion
10 psi E10 9 psi E07 psi E10
1 32
216
170
316
1 321 321 321 32
9 psi E207 psi E0
194
288
436 102
105
85
00
00
00476
529
243
Figure 36 ndash Vehicle 212 Diurnal Ethanol Portion
0
200
400
600
800
1000
1200
Co
rrecte
d D
aily D
iurn
al
-m
g
Diurnal Ethanol PortionVehicle 214 - 2004 Ford Escape
Ethanol Portion
10 psi E10 9 psi E07 psi E10
1 32
00
1 321 321 321 32
9 psi E207 psi E0
201
202152
38
05
19
56
1469
103
171188
143
67
11275
Figure 37 ndash Vehicle 214 Diurnal Ethanol Portion
49
0
50
100
150
200
250
300
350
400
450
500C
orr
ecte
d D
aily D
iurn
al
-m
g
Diurnal Ethanol PortionVehicle 215 - 2004 Toyota Highlander
Ethanol Portion
10 psi E10 9 psi E07 psi E10
1 32
121
136
196
1 321 321 321 32
9 psi E207 psi E0
198
217213
0000
00
0000
00
335 292
283
Figure 38 ndash Vehicle 215 Diurnal Ethanol Portion

20
Dynamic (Running Loss) Permeation - In a similar presentation Figure 14 shows the average
ldquoRunning Lossrdquo permeation rate for the vehicle types and the fuels tested ldquoRunning Lossrdquo
permeation as described here is the permeation measured during a ldquocold startrdquo 48 minute drive in
a Running-Loss SHED (RL-SHED) at 86degF
0
50
100
150
200
250
300
350
400
7E0 9E0 7E10 10E10 9E20 7E0 9E0 7E10 10E10 9E20
Co
rre
cte
d R
un
nin
g L
os
s P
erm
ea
tio
n -
mg
hr
Fuel
Running Loss Permeation Rate - All FuelsE77-2 Program Vehicles
Enhanced(5 vehs)
Near Zero(2 vehs)
The dynamic permeation rates for the enhanced vehicles (left panel) followed a similar pattern as
the static permeation The average of the E20 fuel was the highest of the average values
observed on both the enhanced and the near-zero vehicles (left and right panels respectively)
Table 4 below shows the data used to generate the averages used in Figure 14
Figure 14 ndash Running Loss Permeation Comparison
21
Table 4
Vehicle ID Technology 7psi E0 9 psi E0 7 psi E10 10 psi E10 9 psi E20
204
1999 Honda Enhanced 2226 2492 2879 3164 2720
Accord
205
2001 Toyota Enhanced 671 1031 2328 1916 1697
Corolla
207
2001 Dodge Enhanced 8425 8339 8122 8581 10282
Caravan
214
2004 Ford Enhanced 363 967 1057 1331 1394
Escape
215
2005 Toyota Enhanced 797 811 979 719 1025
Highlander
2496 2728 3073 3142 3424
211
2004 Toyota Near Zero 1046 837 563 1383 4106
Camry XLE
212
2006 Ford Near Zero 1845 1158 2012 1489 1168
Taurus
1446 998 1288 1436 2637
Enhanced Averages
Near Zero Averages
CRC E-77-2 Program - Running Loss Permeation Results
Running Loss Permeation Rate - mghr
Summary ndash The dynamic permeation rate (measured during vehicle operation) was higher with
the E10 fuel compared to E0 for the enhanced vehicles The E20 permeation rate was higher
than E0 and the E10 fuel The small sample size and limited data precludes us from making
statements about statistical confidence but this may indicate a trend The near zero vehicle
average increased as the ethanol level increased Trends with volatility were mixed or
inconclusive
22
Hot Soak (ldquoTrue Hot Soakrdquo) Permeation ndash The Hot Soak emissions as defined in this report
are the net increase in permeation rate following vehicle operation We measured the mass
increase in the SHED for one hour immediately following vehicle operation and subtracted the
previously measured static (or normal) permeation at the same temperature While this is not the
traditional Code of Federal Regulations (CFR) definition we feel it is appropriate for the intent
of this project
0
10
20
30
40
50
60
70
7E0 9E0 7E10 10E10 9E20 7E0 9E0 7E10 10E10 9E20
Co
rre
cte
d H
ot
So
ak
Pe
rme
ati
on
-m
gh
r
Fuel
True Hot Soak Permeation Rate - All FuelsE77-2 Program Vehicles
Enhanced(5 vehs)
Near Zero(2 vehs)
The ldquoTrue Hot Soakrdquo performance for the average of the Enhanced Vehicles is summarized in
Figure 15 above There was a large increase in the hot soak value with the E10 fuel compared to
the E0 The hot soak value with the E20 fuel was comparable to the E0 results and lower than
the E10
The Near Zero vehicles (2) had zero hot soak emissions when tested on the 10 psi E10 fuel
(Figure 16) With only two vehicles and the very low levels attained no statistically significant
conclusions can be drawn from the data available Table 5 presents the individual tests used in
calculating the average values plotted in Figure 15
Figure 15 ndash True Hot Soak Permeation Comparison
23
Table 5
Vehicle ID Technology 7psi E0 9 psi E0 7 psi E10 10 psi E10 9 psi E20
204
1999 Honda Enhanced 187 443 297 04 134
Accord
205
2001 Toyota Enhanced 00 10 719 295 603
Corolla
207
2001 Dodge Enhanced 00 58 1222 2377 00
Caravan
214
2004 Ford Enhanced 33 521 329 574 560
Escape
215
2005 Toyota Enhanced 225 251 00 16 00
Highlander
89 257 513 653 259
211
2004 Toyota Near Zero 07 153 138 00 00
Camry XLE
212
2006 Ford Near Zero 18 04 00 00 49
Taurus
13 79 69 00 25
CRC E-77-2 Program - True Hot Soak Permeation Results
True Hot Soak Permeation Rate - mghr
Near Zero Averages
Enhanced Averages
Summary - The True Hot Soak permeation (permeation rate measured following vehicle
operation less the static constant temperature permeation rate) rate was higher with the E10 fuel
compared to E0 for the enhanced vehicles The E20 permeation rate was higher than E0 and
lower than the E10 fuel The near zero vehicle trends with both ethanol content and volatility
were mixed or inconclusive The small sample size and limited data precludes us from making
statements about statistical confidence
24
Diurnal Permeation Performance ndash Figure 16 presents the diurnal permeation results for the
first day of the three-day diurnal test (65deg to 105degF)
0
200
400
600
800
1000
1200
7E0 9E0 7E10 10E10 9E20 7E0 9E0 7E10 10E10 9E20
Co
rre
cte
d F
ue
l D
iurn
al
Pe
rme
ati
on
-m
gs
da
y
Day 1 Diurnal Permeation RatesAverages from E-77-2 Vehicles
Fuel
Enhanced(5 vehs)
Near Zero(2 vehs)
The average day 1 diurnal permeation for the five Enhanced Vehicles tended to increase as
ethanol content increased (with the exception of the E20 fuel) Again sample size and limited
data makes statistical conclusions inappropriate Table 6 presents the individual test used to
generate the averages used in Figure 16 The table includes the data from days 2 and 3 The
ethanol content of the diurnal measurements was calculated and appear in a series of figures in
the Appendix starting at page 37 Unlike Figure 16 the figures shown in the appendix have not
been corrected to exclude the non-fuel emissions (methanol and refrigerant) that were present
during these tests
Figure 16 ndash Day 1 Diurnal Permeation Comparison
25
Table 6
Vehicle ID Technology 7psi E0 9 psi E0 7 psi E10 10 psi E10 9 psi E20
204 Day 1 3672 6283 12601 15479 11034
1999 Honda Enhanced Day 2 2877 5810 11652 17799 9581
Accord Day 3 2936 5770 11653 17711 9812
205 Day 1 3830 4995 17834 17941 17752
2001 Toyota Enhanced Day 2 3654 4810 17150 17309 16900
Corolla Day 3 3670 5072 15239 17417 16802
207 Day 1 3975 4064 10865 14064 15480
2001 Dodge Enhanced Day 2 3026 3373 8120 12644 13702
Caravan Day 3 2689 3080 8236 12237 13605
214 Day 1 4943 4559 5242 4920 4709
2004 Ford Enhanced Day 2 3190 3585 3974 8394 4400
Escape Day 3 2815 11017 3944 113738 7518
215 Day 1 2483 2021 2247 3192 4168
2004 Toyota Enhanced Day 2 2941 1659 2317 2602 4148
Highlander Day 3 2888 1763 2675 2370 4506
3781 4384 9758 11119 10629
211 Day 1 2071 1303 2438 3370 2840
2004 Toyota Near Zero Day 2 1002 1158 1838 2268 2218
Camry XLE Day 3 874 1006 1843 2179 2034
212 Day 1 1016 1005 1848 1243 1310
2006 Ford Near Zero Day 2 712 708 1002 879 833
Taurus Day 3 570 574 758 1028 750
1544 1154 2143 2307 2075
CRC E-77-2 Program Results - Diurnal Permeation
Diurnal Permeation Rate - mgday
Enhanced Averages
Near Zero Averages
Carbon Canister Breakthrough ndash Canister breakthrough is measured by the weight change
recorded for the trap canister outside the SHED It quantifies the amount of vapors that
overwhelm the evaporative system storage canister Figure 17 displays the breakthrough
resulting from testing of 9 psi E0 fuel Only four of seven vehicles exhibited breakthrough
60
65
70
75
80
85
90
95
100
105
110
0
5
10
15
20
25
30
35
40
0 10 20 30 40 50 60 70
SH
ED
Te
mp
era
ture
-d
eg
F
Bre
ak
thro
ug
h -
mg
Test Time - hrs
Canister Breakthrough9 psi E0 Fuel - 65ordm to 105ordm F Diurnal
204 - 1999 Honda Accord
211 - 2004 Toyota Camry
215 - 2004 Toyota Highlander
205 - 2001 Toyota Corolla
Figure 17 ndashDiurnal Canister Breakthrough
26
Table 7 shows the breakthrough generated during the diurnal tests conducted
Table 7
Vehicle ID Technology 7psi E0 9 psi E0 7 psi E10 10 psi E10 9 psi E20
204 Day 1 --- 24 --- 310 ---
1999 Honda Enhanced Day 2 --- 136 --- 360 ---
Accord Day 3 --- 198 --- 360 ---
205 Day 1 --- --- --- 204 ---
2001 Toyota Enhanced Day 2 --- --- --- 309 ---
Corolla Day 3 --- 26 --- 293 ---
207 Day 1 --- --- --- --- ---
2001 Dodge Enhanced Day 2 --- --- --- --- ---
Caravan Day 3 --- --- --- --- ---
214 Day 1 --- --- --- --- ---
2004 Ford Enhanced Day 2 --- --- --- --- ---
Escape Day 3 --- --- --- 49 ---
215 Day 1 --- --- --- --- ---
2004 Toyota Enhanced Day 2 --- 02 --- --- ---
Highlander Day 3 --- 72 --- --- ---
211 Day 1 --- --- --- --- ---
2004 Toyota Near Zero Day 2 --- 129 --- 191 ---
Camry XLE Day 3 --- 176 --- 289 ---
212 Day 1 --- --- --- --- ---
2006 Ford Near Zero Day 2 --- --- --- --- ---
Taurus Day 3 --- --- --- 204 ---
CRC E-77-2 Program - Carbon Canister Diurnal Breakthrough Results
Diurnal Breakthrough - grams
Summary ndash The lack of canister breakthrough for the 7 psi fuels (summer grade) indicates that
the storage capacity of the seven systems tested is appropriately sized Breakthrough began to
appear when testing of 9 psi E0 fuel (not summer grade) and was more prevalent with the 10 psi
E10 fuel (winter grade) The lack of breakthrough with the 9 psi E20 fuel seems to be an
anomaly
27
Overall Trend Summary - The following chart (Figure 18) visually summarizes the trends seen
from all testing performed during this program
Higher Volatility E0 to E10 E0 to E20 E10 to E20
uarr uarr uarr uarr
Higher Volatility E0 to E10 E0 to E20 E10 to E20
uarr uarr uarr uarr
Higher Volatility E0 to E10 E0 to E20 E10 to E20
uarr uarr uarr uarr
Higher Volatility E0 to E10 E0 to E20 E10 to E20
uarr uarr uarr uarr
Higher Volatility E0 to E10 E0 to E20 E10 to E20
uarrharr uarr uarr uarr
Higher Volatility E0 to E10 E0 to E20 E10 to E20
uarr uarr uarr uarr
Higher Volatility E0 to E10 E0 to E20 E10 to E20
uarr darr darr
Higher Volatility E0 to E10 E0 to E20 E10 to E20
uarr uarr uarr harr
Ethanol Content
Diurnal
Trend Analysis for E-77-2 Program
Ethanol Content
Static Permeation
Ethanol Content
Running Loss Permeation
Ethanol Content
Ethanol Content
Diurnal
Enhanced Vehicles (Sample of 5)
Static Permeation
Ethanol Content
Ethanol Content
Running Loss Permeation
Ethanol Content
True Hot Soak (TEFVO)
Near-Zero Vehicles (Sample of 2)
True Hot Soak (TEFVO)
Figure 18 Trend Analysis Summaries
28
Vehicle 202 ndash 1996 Ford Taurus - Special Case
We have treated vehicle 202 as a special case This was the oldest of the vehicles tested and had
been subjected to limited exhaust emission tests with a 20-volume percent ethanol fuel (E20)
during the CRC E-74b test program
Vehicle 202 completed the E10 portion of the test program (10 and 7 psi fuels) successfully and
completed the road preconditioning on the E0 fuel prior to the E0 evaluations The first test on
the E0 fuel was excessively high indicating a fuel leak It was traced to a leaky fuel injector o-
ring and there was considerable discussion as to an appropriate repair Tests were made on the 9
and the 7 psi E0 fuel to measure the magnitude of a vehicle in a ldquoleakrdquo condition and the tests
were labeled as ldquo202L (Leak)rdquo The fuel injector o-rings were replaced as a complete set and
the vehicle resumed testing as ldquo202Rrsquo (Repaired) A new elusive vapor leak was present later
identified as a very small leak at the top of the fuel fill pipe
The circle on Figure 19 at the right shows
the location of the small leak This leak
was problematic as to its effect on the
emission measurements because its
magnitude or presence seemed to depend
on the torque exerted on the fuel cap The
tests on the E0 fuels (9 and 7 psi) are
noted as 202R but with a vapor leak
We attempted to fix this leak and repeated
the E10 test with the vehicle re-identified
as 216 with reasonable results We also
ran the E20 test sequence and declared the
vehicle done
The testing history for this vehicle is shown in Tables 8 (Static) 9 (Dynamic) and 10 (Diurnal)
The tests highlighted in yellow are those that exhibited a liquid or vapor leak as identified during
the static test leak validation
Figure 19 ndash Vehicle 202 Fuel Fill Pipe Leak
29
Table 8
Static Permeation Results 1996 Ford Taurus SHED
Corrected Results Canister
Fuel Permeation mgday Loss
Veh psiEtOH Test Type Date Test mghr (Corrected) g
202 100E10 Static Perm 071807 7018 345 000
Press Incr 00 No Leak
Prs+Fuel Incr 00
202 70E10 Static Perm 082107 7031 223 000
Press Incr 00 No Leak
Prs+Fuel Incr 00
202L 90E0 Static Perm 030408 7169 2292 000
Press Incr DNA
Prs+Fuel Incr 4921 Liquid Leak
202L 70E0 Static Perm 032008 7183 2991 000
Press Incr DNA
Prs+Fuel Incr 19896 Liquid Leak
202R 90E0 Static Perm 050808 7228 178 000
Press Incr 136 Vapor Leak
Prs+Fuel Incr 00
202R 70E0 Static Perm 052208 7239 204 000
Press Incr 380 Vapor Leak
Prs+Fuel Incr 00
216 100E10 Static Perm 081408 7299 324 000
Press Incr 00 No Leak
Prs+Fuel Incr 00
216 70E10 Static Perm 091708 7326 325 000
Press Incr 00 No Leak
Prs+Fuel Incr 00
216 90E20 Static Perm 103008 7363 204 000
Press Incr 00 No Leak
Prs+Fuel Incr 00
30
Table 9
Dynamic Permeation Results 1996 Ford Taurus SHED
Corrected Results Canister From
Fuel Permeation mgday Loss Static
Veh psiEtOH Test Type Date Test mghr (Corrected) g Test
202 100E10 Dynamic RL 072007 25662 1278 000 No Leak
TEFVO 386 000
202L 90E0 Dynamic RL 030508 25695 3870 000 Liquid Leak
TEFVO 00 000
202L 70E0 Dynamic RL 032408 25699 7269 000 Liquid Leak
TEFVO 00 000
202R 90E0 Dynamic RL 050908 25704 1091 000 Vapor Leak
TEFVO 50 000
202R 70E0 Dynamic RL 052308 25706 787 000 Vapor Leak
TEFVO 00 000
216 100E10 Dynamic RL 081508 25718 1742 000 No Leak
TEFVO 14 000
216 70E10 Dynamic RL 091808 25721 1683 000 No Leak
TEFVO 423 000
216 90E20 Dynamic RL 110708 25730 543 000 No Leak
TEFVO 00 000
31
Table 10
Diurnal Permeation Results 1996 Ford Taurus SHED
Corrected Results Canister From
Fuel Permeation mgday Loss Static
Veh psiEtOH Test Type Date Test mghr (Corrected) g Test
202 100E10 72 DHB 65-105 073107 7023
Day 1 10429 612 No Leak
Day 2 7069 3264
Day 3 7043 3869
202 70E10 72 DHB 65-105 082807 7034
Day 1 6278 000 No Leak
Day 2 5065 000
Day 3 4535 000
202L 90E0 72 DHB 65-105 031108 7173
Day 1 22589 000 Liquid Leak
Day 2 32310 000
Day 3 23069 1260
202L 70E0 72 DHB 65-105 040108 7196
Day 1 47425 000 Liquid Leak
Day 2 44517 000
Day 3 31798 000
202R 90E0 72 DHB 65-105 051308 7230
Day 1 3270 000 Vapor Leak
Day 2 2667 000
Day 3 2746 1083
202R 70E0 72 DHB 65-105 052808 7243
Day 1 2117 000 Vapor Leak
Day 2 2208 000
Day 3 2081 000
216 100E10 72 DHB 65-105 082008 7305
Day 1 25907 5777 No Leak
Day 2 34779 6299
Day 3 36014 6343
216 70E10 72 DHB 65-105 092308 7331
Day 1 3975 022 No Leak
Day 2 3550 006
Day 3 3621 037
216 90E20 72 DHB 65-105 111108 7373
Day 1 4685 000 No Leak
Day 2 4526 000
Day 3 4198 000
32
The Implanted Leak Test Results
Project E-77-2 included evaluating two vehicles with implanted leaks This interest followed the
information gathered in the Pilot Study where tests were run with a specially modified fuel cap
containing a 002rdquo dia hole The results with the implanted leak from the Pilot Study are
repeated in Table 11 below as the diurnal results are shown for a 1996 Chevrolet Cavalier first
without the implanted leak at 038 grams per day and then at 207 grams per day (a 54x
increase) with the leak
Table 11
Veh No
Evap
Tech Fuel
Results
gmsday
gms
Increase
6 1996 Chevrolet Cavalier Enhanced 7 psi E0 038
7 2070 2032
207 2001 Dodge Caravan Enhanced 7 psi E10 109
207L 213 104
211 2004 Toyota Camry LE Near Zero 7 psi E10 024
211L 068 044
- Implanted 020 leak in fuel cap
Vehicle Description
Implanted Leak Impact on Diurnal PermeationDay One Results 65deg - 105degF Diurnal
The two E-77-2 vehicles (207 amp 211) were given a limited evaluation with an induced leak and
saw a significantly lesser impact Vehicle 207 gave diurnal results increases from 109 to 213
grams per day (a 2x increase) and Vehicle 211 increased from 024 grams per day to 068 grams
per day (a 28x increase) The following Figure 20 displays the imbedded leak impact from Table
11
33
0
5
10
15
20
On
e D
ay
Diu
rna
l P
erm
ea
tio
n -
gm
sd
ay
Vehicle Number
Implanted Leak Impact on One Day Diurnal Permeation020 Leak in Fuel Cap - 65 to 105 F Diurnal
207L 211L21120776
As Received - No Leak
020 Fuel Cap Leak
The newer vehicles evaluated in this phase of the study were configured and certified to the
Onboard Refueling Vapor Regulations (ORVR) These are capable of containing 95 or more
control of the refueling vapors at up to 10 gallons per minute fueling rate Where the Chevrolet
Cavalier had a small (0055rdquo dia) orifice and a long vapor tube venting the tankrsquos vapor space to
the carbon canister (and then to the atmosphere) the ORVR compliant vehicles have a large
(0688rdquo ID) short vent hose to a low flow restriction carbon canister
The following bar charts (Figures 21 through 24) show the impacts of the leak on all phases of
the evaporative testing performed and compare those results with all fuels tested With only two
vehicles (207 and 211) evaluated on two fuels statistically significant effects cannot be
quantified but the trend of increased emissions is apparent
Figure 20 ndash Implanted Leak Impact
34
0
20
40
60
80
100
120
140
160
7E0 9E0 7E10 10E10 9E20 7E0 9E0 7E10 10E10 9E20
Sta
tic
Pe
rme
ati
on
-m
gh
r
Fuel
0020 dia Induced Leak EffectStatic Permeation
Vehicle 211Vehicle 207
Leak
Leak
0
200
400
600
800
1000
1200
7E0 9E0 7E10 10E10 9E20 7E0 9E0 7E10 10E10 9E20
Ru
nn
ing
Lo
ss
Pe
rme
ati
on
-m
gh
r
Fuel
0020 dia Induced Leak EffectRunning Loss Permeation
Vehicle 211Vehicle 207
Leak
Leak
Figure 21 ndash Vehicles 207 and 211 with Induced Leak - Static
Figure 22 ndash Vehicles 207 and 211with Induced Leak ndash Running Loss
35
0
100
200
300
400
500
600
700
7E0 9E0 7E10 10E10 9E20 7E0 9E0 7E10 10E10 9E20
Tru
e H
ot S
oa
k P
erm
ea
tio
n -
mg
hr
Fuel
0020 dia Induced Leak EffectTrue Hot Soak Permeation
Vehicle 211Vehicle 207
Leak
Leak
0
500
1000
1500
2000
2500
7E0 9E0 7E10 10E10 9E20 7E0 9E0 7E10 10E10 9E20
Da
y 1
Diu
rna
l P
erm
ea
tio
n -
mg
da
y
Fuel
0020 dia Induced Leak EffectDay 1 Diurnal Permeation
Vehicle 211Vehicle 207
Leak
Leak
Figure 24 ndash Vehicles 207 and 211 with Induced Leak - Diurnal
Figure 23 ndash Vehicles 207 and 211 with Induced Leak ndash True Hot Soak
36
Summary of Findings and Results
The E-77-2 test program was a continuation of the previously published E-77 test project and
added eight vehicles tested on five fuels to the knowledge base The permeation trends
previously shown were again present The small sample size and limited number of tests
preclude making statements about statistical validity but in general
o The newer vehicle groups had lower emissions
o Adding ethanol to the fuel increased permeation over the non-oxygenated levels
o Increased volatility increased permeation levels
o SHED emission rates must be corrected for the ethanol error in the FID and the
non-fuel methanol and refrigerant in the measurement
As this test program evolved and additional experience was gathered two program modifications
were made 1) The leak validation methodology was changed and 2) a different metric and
definition of the ldquoHot Soakrdquo was adopted
The leak validation portion of the static permeation test was found to be very sensitive and when
the data was corrected on a minute-by-minute basis for ethanol methanol and refrigerant the
change in apparent permeation rate was due as much to variation as to leaks See the discussion
starting at page 12 for the details of the development
Concern for and recognition of ldquoHot Soakrdquo emissions started in the original evaporative emission
regulations Carburetors had float bowls with ~ 50 ml of fuel that absorbed the latent engine heat
after the vehicle was shut down after operation The heat would cause the bowl temperature to
increase driving fuel vapors out through vents and leak paths to the atmosphere after vehicle
operation Todayrsquos fuel injection engines do not have the open bowls and the emission rates
following vehicle operation are mainly increased temperature permeation We recommended
and adopted a new name for the ldquotemporary emissions following vehicle operationrdquo (TEFVO)
which subtracts the basic permeation rate from the measured emissions See the discussion
starting at page 16 for details
37
Appendix
Acknowledgements
E-77-2 Steering Committee
David Brzezinski EPA
Kevin Cullen GM Powertrain
Dominic DiCicco Ford Motor Company
King D Eng Shell Global Solutions
Ben Hancock CARB
Constance Hart EPA
Phil Heirigs Chevron Global Downstream
Jeff Jetter Honda RampD Americas
Keith KnollNREL
John Koupal EPA
David H Lax API
Jeff Long CARB
Hector Maldonado CARB
Mani Natarajan Marathon Oil Company
David N Patterson Mitsubishi Motors RampD Americas
Jenny Sigelko Chrysler
James P UihleinChevron Global Downstream
Marie Valentine Toyota Technical Center
Kenneth J Wright ConocoPhillips
CRC Members
Brent Bailey CRC
Chris Tennant CRC
Jane Beck CRC
38
Table 12
E0 E10 E20
Inspection Units Fuel 6 Fuel 7 Fuel 4
API Gravity degAPI 602 585 570
Relative Density 6060degF 07382 07447 07508
DVPE psi 701 730 849
Oxygenates--D4815
MTBE vol 000 000 000
ETBE vol 000 000 000
EtOH vol 000 954 2034
O2 wt 000 353 747
Hydrocarbon Composition
Aromatics vol 221 244 108
Olefins vol 80 88 55
Saturates vol 700 573 234
D86 Distillation
IBP degF 974 1040 1022
5 Evaporated degF 1316 1280 1252
10 Evaporated degF 1423 1330 1314
20 Evaporated degF 1564 1410 1413
30 Evaporated degF 1704 1450 1486
40 Evaporated degF 1840 1530 1547
50 Evaporated degF 1975 1950 1596
60 Evaporated degF 2120 2190 1636
70 Evaporated degF 2305 2410 2274
80 Evaporated degF 2588 2710 2695
90 Evaporated degF 3139 3170 3139
95 Evaporated degF 3322 3300 3255
EP degF 3603 3600 3406
Recovery vol 978 978 983
Residue vol 13 10 10
Loss vol 09 12 07
Driveability Index 11199 11015 9898
Data from CRC E-74
CRC E-77-2 Fuel Inspection Results
39
Fuel Units Fuel 6 Fuel 7 Fuel 4
Sulfur Content ppm 29 27 27
Estimated CH Ratio 62090 63323 63252
Est Net Heat of Combustion btulb 18573 18514 18513
Benzene vol 090 100 096
Research Octane Number 932 940 946
Motor Octane Number 838 838 834
(R+M)2 885 889 890
Fuel Units Fuel 6 Fuel 7 Fuel 4
Aromatics vol 2386 2481 2178
Olefins vol 752 892 1074
Saturates vol 6743 5621 4623
Unclassified vol 115 086 015
Ethanol vol 000 920 2111
Benzene vol 089 106 097
CH Ratio 6200 6092 5835
Oxygen wt 0008 1 340 773
Net Heat of Combustion btulb 18703 18016 17160
1 Contains 004 vol MTBE
Fuel Units Fuel 6 Fuel 7 Fuel 4
Oxygen wt 0008 3396 7733
C+H wt 9999 9660 9227
H wt 1389 1362 1350
C wt 8610 8298 7877
Fuel Units 6 7 4
Haltermann D3338 Btulb 18573 18514 18513
Average D3338 Btulb 18579 18514 18491
Oxygen Corrected D3338 Btulb 18579 17860 17103
DHA Btulb 18703 18016 17160
Table 12 (cont)
Suppliers Additional Inspections
Net Heat of Combusion -- Btulb
Carbon Hydrogen and Oxygen
Detailed Hydrocarbon Analysis
40
Vehicle Day 1 Day 2 Day 3
No Fuel Base + Press + Pump RL True HS Perm (Brkthru) Perm (Brkthru) Perm (Brkthru)
E10 - 10 psi 345 --- --- 1278 503 10429 (63) 7069 (348) 7043 (425)
E10 - 7 psi 223 --- --- 994 113 6278 (00) 5065 (00) 4535 (00)
E0 - 9 psi 2229 --- 4921 3870 00 22580 (00) 32310 (00) 23069 (126)
E0 - 7 psi 2991 --- 19896 7269 00 47425 (00) 44517 (00) 31798 (00)
E10 - 10 psi 843 --- --- 3164 04 15479 (310) 17799 (383) 17711 (419)
E10 - 7 psi 664 --- --- 2879 297 12601 (00) 11652 (00) 11653 (00)
E0 - 9 psi 338 --- --- 2492 443 6283 (24) 5810 (136) 5770 (225)
E0 - 7 psi 129 --- --- 2226 187 3672 (00) 2877 (00) 2936 (00)
E20 - 9 psi 553 --- --- 2720 134 11034 (00) 9581 (00) 9812 (00)
E10 - 10 psi 416 --- --- 1916 295 17941 (204) 17309 (346) 17417 (375)
E10 - 7 psi 596 --- --- 2328 719 17834 (00) 17150 (00) 15239 (00)
E0 - 9 psi 195 --- --- 1031 10 4995 (00) 4810 (00) 5072 (26)
E0 - 7 psi 99 --- --- 671 00 3830 (00) 3654 (00) 3670 (00)
E20 - 9 psi 462 --- --- 1697 603 17752 (00) 16900 (00) 16802 (00)
E10 - 10 psi 787 --- --- 8581 2377 14064 (00) 12644 (00) 12237 (00)
E10 - 7 psi 644 --- --- 8122 1222 10865 (00) 8120 (00) 8236 (00)
E0 - 9 psi 325 --- --- 8339 58 4064 (00) 3373 (00) 3080 (00)
E0 - 7 psi 401 --- --- 8425 00 3975 (00) 3026 (00) 2689 (00)
E20 - 9 psi 882 --- --- 10282 00 15480 (00) 13702 (00) 13605 (00)
E10 - 10 psi 976 --- 1209 10012 3929 16449 (00) NA NA
E10 - 7 psi 1468 --- --- 11393 5850 21342 (00) NA NA
E10 - 10 psi 199 --- --- 1383 00 3370 (00) 2268 (191) 2179 (330)
E10 - 7 psi 94 266 --- 563 138 2438 (00) 1838 (00) 1843 (00)
E0 - 9 psi 101 --- --- 837 153 1303 (00) 1158 (129) 1006 (221)
E0 - 7 psi 91 --- --- 1046 07 2071 (00) 1002 (00) 874 (00)
E20 - 9 psi 558 --- --- 4106 00 2840 (00) 2218 (00) 2034 (00)
E10 - 10 psi 551 --- 821 3024 2450 25454 (040) NA NA
E10 - 7 psi 481 --- 1664 2511 62 6783 (00) NA NA
E10 - 10 psi 106 --- --- 1489 00 1243 (00) 879 (00) 1028 (200)
E10 - 7 psi 218 --- --- 2012 00 1848 (00) 1002 (00) 758 (00)
E0 - 9 psi 32 --- --- 1158 04 1005 (00) 708 (00) 574 (00)
E0 - 7 psi 09 --- --- 1845 18 1016 (00) 712 (00) 570 (00)
E20 - 9 psi 47 --- --- 1168 49 1310 (00) 833 (00) 750 (00)
E10 - 10 psi 244 --- --- 1331 574 4920 (00) 8394 (00) 113738 (49)
E10 - 7 psi 239 --- --- 1057 329 5242 (00) 3974 (00) 3944 (00)
E0 - 9 psi 107 --- --- 967 521 4559 (00) 3585 (00) 11017 (00)
E0 - 7 psi 252 --- --- 363 33 4943 (00) 3190 (00) 2815 (00)
E20 - 9 psi 168 --- --- 1394 560 4709 (00) 4400 (00) 7518 (00)
E10 - 10 psi 104 90 --- 719 16 3192 (00) 2602 (00) 2370 (00)
E10 - 7 psi 122 --- --- 979 00 2247 (00) 2317 (00) 2675 (00)
E0 - 9 psi 85 --- --- 811 251 2021 (00) 1659 (2) 1763 (72)
E0 - 7 psi 87 --- --- 797 225 2483 (00) 2941 (00) 2888 (00)
E20 - 9 psi 193 --- --- 1025 00 4168 (00) 4148 (00) 4506 (00)
E10 - 10 psi 324 --- --- 1742 118 25907 (578) 34779 (630) 36014 (643)
E10 - 7 psi 325 --- --- 1683 192 3975 (02) 3550 (01) 3621 (04)
E0 - 9 psi 178 136 --- 1091 254 3270 (00) 2667 (00) 2746 (108)
E0 - 7 psi 204 380 --- 787 00 2117 (00) 2208 (00) 2081 (00)
E20 - 9 psi 204 --- --- 543 74 4685 (00) 4526 (00) 4198 (00)
216
211
2004
Toyota
Camry
XLE
215
2004
Toyota
High-
lander
212
2006
Ford
Taurus
214
2004
Ford
Escape
211L
207L
Static Permeation - mghr Dynamic Perm - mghr
CRC E-77-2 Program Test Results
Diurnal (65ordm to 105ordm) - mgday
202
1996
Taurus
205
2001
Toyota
Corolla
204
1999
Honda
Accord
207
2001
Dodge
Caravan
202L
Table 13
41
Individual Vehicle Diurnal Performance on the Various Fuels
0
1000
2000
3000
4000
5000
6000
0 10 20 30 40 50 60 70
Cu
mu
lati
ve
Pe
rme
ati
on
-m
g
Test Time - hrs
Three Day DiurnalVehicle 204 1999 Honda Accord
10 psi E10
7 psi E10
9 psi E0
7 psi E0
9 psi E20
0
1000
2000
3000
4000
5000
6000
0 10 20 30 40 50 60 70
Cu
mu
lati
ve
Pe
rme
ati
on
-m
g
Test Time - hrs
Three Day DiurnalVehicle 205 - 2001 Toyota Corolla
10 psi E10
7 psi E10
9 psi E0
7 psi E0
9 psi E20
Figure 25 ndash Vehicle 204 Diurnal Performance
Figure 26 ndash Vehicle 205 Diurnal Performance
42
0
500
1000
1500
2000
2500
3000
3500
4000
4500
5000
0 10 20 30 40 50 60 70
Cu
mu
lati
ve
Co
rre
cte
d P
erm
ea
tio
n -
mg
Test Time - hrs
Three Day DiurnalVehicle 207 - 2001 Dodge Caravan
10 psi E10
7 psi E10
9 psi E0
7 psi E0
9 psi E20
0
100
200
300
400
500
600
700
800
900
0 10 20 30 40 50 60 70
Cu
mu
lati
ve
Pe
rme
ati
on
-m
g
Test Time - hrs
Three Day DiurnalVehicle 211 - 2004 Toyota Camry XLE
10 psi E10
7 psi E10
9 psi E0
7 psi E0
9 psi E20
Figure 27 ndash Vehicle 207 Diurnal Performance
Figure 28 ndash Vehicle 211 Diurnal Performance
43
0
50
100
150
200
250
300
350
400
450
500
0 10 20 30 40 50 60 70
Cu
mu
lati
ve
Pe
rme
ati
on
-m
g
Test Time - hrs
Three Day DiurnalVehicle 212 - 2006 Ford Taurus
10 psi E10
7 psi E10
9 psi E0
7 psi E0
9 psi E20
0
500
1000
1500
2000
2500
3000
3500
4000
4500
5000
0 10 20 30 40 50 60 70
Cu
mu
lati
ve
Pe
rme
ati
on
-m
g
Test Time - hrs
Three Day DiurnalVehicle 214 2004 Ford Escape
10 psi E10
7 psi E10
9 psi E0
7 psi E0
9 psi E20
Note The incomplete cumulative results for the 10 psi E10 results resulted from a conflict for the use
of the INNOVA analyzer during the test The INNOVA analyzer is required to correct for the FIDrsquos
ethanol error and the presence of methanol and refrigerant (R-134a) The data was available for the
50+ hour results and the data is valid as shown We have no explanation for the high levels
experienced on the third day of the test No test errors were identified
Figure 29 ndash Vehicle 212 Diurnal Performance
Figure 30 ndash Vehicle 214 Diurnal Performance
44
0
200
400
600
800
1000
1200
1400
1600
0 10 20 30 40 50 60 70
Cu
mu
lati
ve
Pe
rme
ati
on
-m
g
Test Time - hrs
Three Day DiurnalVehicle 215 2004 Toyota Highlander
10 psi E10
7 psi E10
9 psi E0
7 psi E0
9 psi E20
Figure 31 ndash Vehicle 215 Diurnal Performance
45
Table 14
Test Corrected
Vehicle Fuel Total Fuel EtOH R134a Methanol
204 10 psi E10 509899 144040 18298 16754
1999 Honda 7 psi E10 359057 130806 17551 15221
Accord 9 psi E0 178635 13843 18230 9896
7 psi E0 94846 1856 16631 2379
9 psi E20 304271 128408 18261 12143
205 10 psi E10 526659 186599 23354 20895
2001 Toyota 7 psi E10 502229 204246 25990 19198
Corolla 9 psi E0 148775 000 20434 4613
7 psi E0 111536 5489 22408 5619
9 psi E20 514540 212708 25677 19584
207 10 psi E10 389450 196248 12013 30399
2001 Dodge 7 psi E10 272201 114027 11731 19616
Caravan 9 psi E0 105167 1820 12224 15284
7 psi E0 96906 1118 22141 14276
9 psi E20 427882 241488 14268 25432
211 10 psi E10 78164 19733 15159 46970
2004 Toyota 7 psi E10 61190 20211 15929 46525
Camry LE 9 psi E0 34668 1681 14329 42659
7 psi E0 39468 000 16197 57303
9 psi E20 71013 26726 16213 36879
212 10 psi E10 31508 7222 14831 7896
2006 Ford 7 psi E10 36079 10132 15481 3400
Taurus 9 psi E0 22870 2409 15182 3761
7 psi E0 22973 000 15393 4362
9 psi E20 28935 11156 14116 2629
214 10 psi E10 1257887 000 19947 27992
2004 Ford 7 psi E10 131593 24571 16025 8879
Escape 9 psi E0 191611 2940 16487 7213
7 psi E0 109481 5386 80650 3106
9 psi E20 166271 24097 14491 6096
215 10 psi E10 81644 12178 14658 42609
2004 Toyota 7 psi E10 72399 15092 15532 36061
Highlander 9 psi E0 54431 000 14806 25822
7 psi E0 83115 000 14072 26255
9 psi E20 128223 38822 12841 34420
3 Day Diurnal Results
CRC E77-2 Program Diurnal ResultsAll values are in mg
46
0
200
400
600
800
1000
1200
1400
1600
1800
2000
Co
rrecte
d D
aily D
iurn
al
-m
g
Diurnal Ethanol PortionVehicle 204 - 1999 Honda Accord
Ethanol Portion
10 psi E10 9 psi E07 psi E10
1 32
315
341368
383
264273
1 321 321 321 32
9 psi E207 psi E0
1122097
39
0510
442
405412
Figure 32 ndash Vehicle 204 Diurnal Ethanol Portion
0
200
400
600
800
1000
1200
1400
1600
1800
2000
Co
rrecte
d D
aily D
iurn
al
-m
g
Diurnal Ethanol PortionVehicle 205 - 2001 Toyota Corolla
Ethanol Portion
10 psi E10 9 psi E07 psi E10
1 32
359
406
382
431355349
1 321 321 321 32
9 psi E207 psi E0
0 00
712649
406
420414
Figure 33 ndash Vehicle 205 Diurnal Ethanol Portion
47
0
200
400
600
800
1000
1200
1400
1600C
orr
ecte
d D
aily D
iurn
al
-m
g
Diurnal Ethanol PortionVehicle 207 - 2001 Dodge Caravan
Ethanol Portion
10 psi E10 9 psi E07 psi E10
1 32
488
442408
409
490535
1 321 321 321 32
9 psi E207 psi E0
00
1144
27
0101
556
587552
Figure 34 ndash Vehicle 207 Diurnal Ethanol Portion
0
50
100
150
200
250
300
350
400
Co
rrecte
d D
aily D
iurn
al
-m
g
Diurnal Ethanol PortionVehicle 211 - 2004 Toyota Camry XLE
Ethanol Portion
10 psi E10 9 psi E07 psi E10
1 32
264
242245
1 321 321 321 32
9 psi E207 psi E0
329
306356
00
73
64
00
00
00
325
431
370
Figure 35 ndash Vehicle 211 Diurnal Ethanol Portion
48
0
20
40
60
80
100
120
140
160
180
200C
orr
ecte
d D
aily D
iurn
al
-m
g
Diurnal Ethanol PortionVehicle 212 - 2006 Ford Taurus
Ethanol Portion
10 psi E10 9 psi E07 psi E10
1 32
216
170
316
1 321 321 321 32
9 psi E207 psi E0
194
288
436 102
105
85
00
00
00476
529
243
Figure 36 ndash Vehicle 212 Diurnal Ethanol Portion
0
200
400
600
800
1000
1200
Co
rrecte
d D
aily D
iurn
al
-m
g
Diurnal Ethanol PortionVehicle 214 - 2004 Ford Escape
Ethanol Portion
10 psi E10 9 psi E07 psi E10
1 32
00
1 321 321 321 32
9 psi E207 psi E0
201
202152
38
05
19
56
1469
103
171188
143
67
11275
Figure 37 ndash Vehicle 214 Diurnal Ethanol Portion
49
0
50
100
150
200
250
300
350
400
450
500C
orr
ecte
d D
aily D
iurn
al
-m
g
Diurnal Ethanol PortionVehicle 215 - 2004 Toyota Highlander
Ethanol Portion
10 psi E10 9 psi E07 psi E10
1 32
121
136
196
1 321 321 321 32
9 psi E207 psi E0
198
217213
0000
00
0000
00
335 292
283
Figure 38 ndash Vehicle 215 Diurnal Ethanol Portion

25
Table 6
Vehicle ID Technology 7psi E0 9 psi E0 7 psi E10 10 psi E10 9 psi E20
204 Day 1 3672 6283 12601 15479 11034
1999 Honda Enhanced Day 2 2877 5810 11652 17799 9581
Accord Day 3 2936 5770 11653 17711 9812
205 Day 1 3830 4995 17834 17941 17752
2001 Toyota Enhanced Day 2 3654 4810 17150 17309 16900
Corolla Day 3 3670 5072 15239 17417 16802
207 Day 1 3975 4064 10865 14064 15480
2001 Dodge Enhanced Day 2 3026 3373 8120 12644 13702
Caravan Day 3 2689 3080 8236 12237 13605
214 Day 1 4943 4559 5242 4920 4709
2004 Ford Enhanced Day 2 3190 3585 3974 8394 4400
Escape Day 3 2815 11017 3944 113738 7518
215 Day 1 2483 2021 2247 3192 4168
2004 Toyota Enhanced Day 2 2941 1659 2317 2602 4148
Highlander Day 3 2888 1763 2675 2370 4506
3781 4384 9758 11119 10629
211 Day 1 2071 1303 2438 3370 2840
2004 Toyota Near Zero Day 2 1002 1158 1838 2268 2218
Camry XLE Day 3 874 1006 1843 2179 2034
212 Day 1 1016 1005 1848 1243 1310
2006 Ford Near Zero Day 2 712 708 1002 879 833
Taurus Day 3 570 574 758 1028 750
1544 1154 2143 2307 2075
CRC E-77-2 Program Results - Diurnal Permeation
Diurnal Permeation Rate - mgday
Enhanced Averages
Near Zero Averages
Carbon Canister Breakthrough ndash Canister breakthrough is measured by the weight change
recorded for the trap canister outside the SHED It quantifies the amount of vapors that
overwhelm the evaporative system storage canister Figure 17 displays the breakthrough
resulting from testing of 9 psi E0 fuel Only four of seven vehicles exhibited breakthrough
60
65
70
75
80
85
90
95
100
105
110
0
5
10
15
20
25
30
35
40
0 10 20 30 40 50 60 70
SH
ED
Te
mp
era
ture
-d
eg
F
Bre
ak
thro
ug
h -
mg
Test Time - hrs
Canister Breakthrough9 psi E0 Fuel - 65ordm to 105ordm F Diurnal
204 - 1999 Honda Accord
211 - 2004 Toyota Camry
215 - 2004 Toyota Highlander
205 - 2001 Toyota Corolla
Figure 17 ndashDiurnal Canister Breakthrough
26
Table 7 shows the breakthrough generated during the diurnal tests conducted
Table 7
Vehicle ID Technology 7psi E0 9 psi E0 7 psi E10 10 psi E10 9 psi E20
204 Day 1 --- 24 --- 310 ---
1999 Honda Enhanced Day 2 --- 136 --- 360 ---
Accord Day 3 --- 198 --- 360 ---
205 Day 1 --- --- --- 204 ---
2001 Toyota Enhanced Day 2 --- --- --- 309 ---
Corolla Day 3 --- 26 --- 293 ---
207 Day 1 --- --- --- --- ---
2001 Dodge Enhanced Day 2 --- --- --- --- ---
Caravan Day 3 --- --- --- --- ---
214 Day 1 --- --- --- --- ---
2004 Ford Enhanced Day 2 --- --- --- --- ---
Escape Day 3 --- --- --- 49 ---
215 Day 1 --- --- --- --- ---
2004 Toyota Enhanced Day 2 --- 02 --- --- ---
Highlander Day 3 --- 72 --- --- ---
211 Day 1 --- --- --- --- ---
2004 Toyota Near Zero Day 2 --- 129 --- 191 ---
Camry XLE Day 3 --- 176 --- 289 ---
212 Day 1 --- --- --- --- ---
2006 Ford Near Zero Day 2 --- --- --- --- ---
Taurus Day 3 --- --- --- 204 ---
CRC E-77-2 Program - Carbon Canister Diurnal Breakthrough Results
Diurnal Breakthrough - grams
Summary ndash The lack of canister breakthrough for the 7 psi fuels (summer grade) indicates that
the storage capacity of the seven systems tested is appropriately sized Breakthrough began to
appear when testing of 9 psi E0 fuel (not summer grade) and was more prevalent with the 10 psi
E10 fuel (winter grade) The lack of breakthrough with the 9 psi E20 fuel seems to be an
anomaly
27
Overall Trend Summary - The following chart (Figure 18) visually summarizes the trends seen
from all testing performed during this program
Higher Volatility E0 to E10 E0 to E20 E10 to E20
uarr uarr uarr uarr
Higher Volatility E0 to E10 E0 to E20 E10 to E20
uarr uarr uarr uarr
Higher Volatility E0 to E10 E0 to E20 E10 to E20
uarr uarr uarr uarr
Higher Volatility E0 to E10 E0 to E20 E10 to E20
uarr uarr uarr uarr
Higher Volatility E0 to E10 E0 to E20 E10 to E20
uarrharr uarr uarr uarr
Higher Volatility E0 to E10 E0 to E20 E10 to E20
uarr uarr uarr uarr
Higher Volatility E0 to E10 E0 to E20 E10 to E20
uarr darr darr
Higher Volatility E0 to E10 E0 to E20 E10 to E20
uarr uarr uarr harr
Ethanol Content
Diurnal
Trend Analysis for E-77-2 Program
Ethanol Content
Static Permeation
Ethanol Content
Running Loss Permeation
Ethanol Content
Ethanol Content
Diurnal
Enhanced Vehicles (Sample of 5)
Static Permeation
Ethanol Content
Ethanol Content
Running Loss Permeation
Ethanol Content
True Hot Soak (TEFVO)
Near-Zero Vehicles (Sample of 2)
True Hot Soak (TEFVO)
Figure 18 Trend Analysis Summaries
28
Vehicle 202 ndash 1996 Ford Taurus - Special Case
We have treated vehicle 202 as a special case This was the oldest of the vehicles tested and had
been subjected to limited exhaust emission tests with a 20-volume percent ethanol fuel (E20)
during the CRC E-74b test program
Vehicle 202 completed the E10 portion of the test program (10 and 7 psi fuels) successfully and
completed the road preconditioning on the E0 fuel prior to the E0 evaluations The first test on
the E0 fuel was excessively high indicating a fuel leak It was traced to a leaky fuel injector o-
ring and there was considerable discussion as to an appropriate repair Tests were made on the 9
and the 7 psi E0 fuel to measure the magnitude of a vehicle in a ldquoleakrdquo condition and the tests
were labeled as ldquo202L (Leak)rdquo The fuel injector o-rings were replaced as a complete set and
the vehicle resumed testing as ldquo202Rrsquo (Repaired) A new elusive vapor leak was present later
identified as a very small leak at the top of the fuel fill pipe
The circle on Figure 19 at the right shows
the location of the small leak This leak
was problematic as to its effect on the
emission measurements because its
magnitude or presence seemed to depend
on the torque exerted on the fuel cap The
tests on the E0 fuels (9 and 7 psi) are
noted as 202R but with a vapor leak
We attempted to fix this leak and repeated
the E10 test with the vehicle re-identified
as 216 with reasonable results We also
ran the E20 test sequence and declared the
vehicle done
The testing history for this vehicle is shown in Tables 8 (Static) 9 (Dynamic) and 10 (Diurnal)
The tests highlighted in yellow are those that exhibited a liquid or vapor leak as identified during
the static test leak validation
Figure 19 ndash Vehicle 202 Fuel Fill Pipe Leak
29
Table 8
Static Permeation Results 1996 Ford Taurus SHED
Corrected Results Canister
Fuel Permeation mgday Loss
Veh psiEtOH Test Type Date Test mghr (Corrected) g
202 100E10 Static Perm 071807 7018 345 000
Press Incr 00 No Leak
Prs+Fuel Incr 00
202 70E10 Static Perm 082107 7031 223 000
Press Incr 00 No Leak
Prs+Fuel Incr 00
202L 90E0 Static Perm 030408 7169 2292 000
Press Incr DNA
Prs+Fuel Incr 4921 Liquid Leak
202L 70E0 Static Perm 032008 7183 2991 000
Press Incr DNA
Prs+Fuel Incr 19896 Liquid Leak
202R 90E0 Static Perm 050808 7228 178 000
Press Incr 136 Vapor Leak
Prs+Fuel Incr 00
202R 70E0 Static Perm 052208 7239 204 000
Press Incr 380 Vapor Leak
Prs+Fuel Incr 00
216 100E10 Static Perm 081408 7299 324 000
Press Incr 00 No Leak
Prs+Fuel Incr 00
216 70E10 Static Perm 091708 7326 325 000
Press Incr 00 No Leak
Prs+Fuel Incr 00
216 90E20 Static Perm 103008 7363 204 000
Press Incr 00 No Leak
Prs+Fuel Incr 00
30
Table 9
Dynamic Permeation Results 1996 Ford Taurus SHED
Corrected Results Canister From
Fuel Permeation mgday Loss Static
Veh psiEtOH Test Type Date Test mghr (Corrected) g Test
202 100E10 Dynamic RL 072007 25662 1278 000 No Leak
TEFVO 386 000
202L 90E0 Dynamic RL 030508 25695 3870 000 Liquid Leak
TEFVO 00 000
202L 70E0 Dynamic RL 032408 25699 7269 000 Liquid Leak
TEFVO 00 000
202R 90E0 Dynamic RL 050908 25704 1091 000 Vapor Leak
TEFVO 50 000
202R 70E0 Dynamic RL 052308 25706 787 000 Vapor Leak
TEFVO 00 000
216 100E10 Dynamic RL 081508 25718 1742 000 No Leak
TEFVO 14 000
216 70E10 Dynamic RL 091808 25721 1683 000 No Leak
TEFVO 423 000
216 90E20 Dynamic RL 110708 25730 543 000 No Leak
TEFVO 00 000
31
Table 10
Diurnal Permeation Results 1996 Ford Taurus SHED
Corrected Results Canister From
Fuel Permeation mgday Loss Static
Veh psiEtOH Test Type Date Test mghr (Corrected) g Test
202 100E10 72 DHB 65-105 073107 7023
Day 1 10429 612 No Leak
Day 2 7069 3264
Day 3 7043 3869
202 70E10 72 DHB 65-105 082807 7034
Day 1 6278 000 No Leak
Day 2 5065 000
Day 3 4535 000
202L 90E0 72 DHB 65-105 031108 7173
Day 1 22589 000 Liquid Leak
Day 2 32310 000
Day 3 23069 1260
202L 70E0 72 DHB 65-105 040108 7196
Day 1 47425 000 Liquid Leak
Day 2 44517 000
Day 3 31798 000
202R 90E0 72 DHB 65-105 051308 7230
Day 1 3270 000 Vapor Leak
Day 2 2667 000
Day 3 2746 1083
202R 70E0 72 DHB 65-105 052808 7243
Day 1 2117 000 Vapor Leak
Day 2 2208 000
Day 3 2081 000
216 100E10 72 DHB 65-105 082008 7305
Day 1 25907 5777 No Leak
Day 2 34779 6299
Day 3 36014 6343
216 70E10 72 DHB 65-105 092308 7331
Day 1 3975 022 No Leak
Day 2 3550 006
Day 3 3621 037
216 90E20 72 DHB 65-105 111108 7373
Day 1 4685 000 No Leak
Day 2 4526 000
Day 3 4198 000
32
The Implanted Leak Test Results
Project E-77-2 included evaluating two vehicles with implanted leaks This interest followed the
information gathered in the Pilot Study where tests were run with a specially modified fuel cap
containing a 002rdquo dia hole The results with the implanted leak from the Pilot Study are
repeated in Table 11 below as the diurnal results are shown for a 1996 Chevrolet Cavalier first
without the implanted leak at 038 grams per day and then at 207 grams per day (a 54x
increase) with the leak
Table 11
Veh No
Evap
Tech Fuel
Results
gmsday
gms
Increase
6 1996 Chevrolet Cavalier Enhanced 7 psi E0 038
7 2070 2032
207 2001 Dodge Caravan Enhanced 7 psi E10 109
207L 213 104
211 2004 Toyota Camry LE Near Zero 7 psi E10 024
211L 068 044
- Implanted 020 leak in fuel cap
Vehicle Description
Implanted Leak Impact on Diurnal PermeationDay One Results 65deg - 105degF Diurnal
The two E-77-2 vehicles (207 amp 211) were given a limited evaluation with an induced leak and
saw a significantly lesser impact Vehicle 207 gave diurnal results increases from 109 to 213
grams per day (a 2x increase) and Vehicle 211 increased from 024 grams per day to 068 grams
per day (a 28x increase) The following Figure 20 displays the imbedded leak impact from Table
11
33
0
5
10
15
20
On
e D
ay
Diu
rna
l P
erm
ea
tio
n -
gm
sd
ay
Vehicle Number
Implanted Leak Impact on One Day Diurnal Permeation020 Leak in Fuel Cap - 65 to 105 F Diurnal
207L 211L21120776
As Received - No Leak
020 Fuel Cap Leak
The newer vehicles evaluated in this phase of the study were configured and certified to the
Onboard Refueling Vapor Regulations (ORVR) These are capable of containing 95 or more
control of the refueling vapors at up to 10 gallons per minute fueling rate Where the Chevrolet
Cavalier had a small (0055rdquo dia) orifice and a long vapor tube venting the tankrsquos vapor space to
the carbon canister (and then to the atmosphere) the ORVR compliant vehicles have a large
(0688rdquo ID) short vent hose to a low flow restriction carbon canister
The following bar charts (Figures 21 through 24) show the impacts of the leak on all phases of
the evaporative testing performed and compare those results with all fuels tested With only two
vehicles (207 and 211) evaluated on two fuels statistically significant effects cannot be
quantified but the trend of increased emissions is apparent
Figure 20 ndash Implanted Leak Impact
34
0
20
40
60
80
100
120
140
160
7E0 9E0 7E10 10E10 9E20 7E0 9E0 7E10 10E10 9E20
Sta
tic
Pe
rme
ati
on
-m
gh
r
Fuel
0020 dia Induced Leak EffectStatic Permeation
Vehicle 211Vehicle 207
Leak
Leak
0
200
400
600
800
1000
1200
7E0 9E0 7E10 10E10 9E20 7E0 9E0 7E10 10E10 9E20
Ru
nn
ing
Lo
ss
Pe
rme
ati
on
-m
gh
r
Fuel
0020 dia Induced Leak EffectRunning Loss Permeation
Vehicle 211Vehicle 207
Leak
Leak
Figure 21 ndash Vehicles 207 and 211 with Induced Leak - Static
Figure 22 ndash Vehicles 207 and 211with Induced Leak ndash Running Loss
35
0
100
200
300
400
500
600
700
7E0 9E0 7E10 10E10 9E20 7E0 9E0 7E10 10E10 9E20
Tru
e H
ot S
oa
k P
erm
ea
tio
n -
mg
hr
Fuel
0020 dia Induced Leak EffectTrue Hot Soak Permeation
Vehicle 211Vehicle 207
Leak
Leak
0
500
1000
1500
2000
2500
7E0 9E0 7E10 10E10 9E20 7E0 9E0 7E10 10E10 9E20
Da
y 1
Diu
rna
l P
erm
ea
tio
n -
mg
da
y
Fuel
0020 dia Induced Leak EffectDay 1 Diurnal Permeation
Vehicle 211Vehicle 207
Leak
Leak
Figure 24 ndash Vehicles 207 and 211 with Induced Leak - Diurnal
Figure 23 ndash Vehicles 207 and 211 with Induced Leak ndash True Hot Soak
36
Summary of Findings and Results
The E-77-2 test program was a continuation of the previously published E-77 test project and
added eight vehicles tested on five fuels to the knowledge base The permeation trends
previously shown were again present The small sample size and limited number of tests
preclude making statements about statistical validity but in general
o The newer vehicle groups had lower emissions
o Adding ethanol to the fuel increased permeation over the non-oxygenated levels
o Increased volatility increased permeation levels
o SHED emission rates must be corrected for the ethanol error in the FID and the
non-fuel methanol and refrigerant in the measurement
As this test program evolved and additional experience was gathered two program modifications
were made 1) The leak validation methodology was changed and 2) a different metric and
definition of the ldquoHot Soakrdquo was adopted
The leak validation portion of the static permeation test was found to be very sensitive and when
the data was corrected on a minute-by-minute basis for ethanol methanol and refrigerant the
change in apparent permeation rate was due as much to variation as to leaks See the discussion
starting at page 12 for the details of the development
Concern for and recognition of ldquoHot Soakrdquo emissions started in the original evaporative emission
regulations Carburetors had float bowls with ~ 50 ml of fuel that absorbed the latent engine heat
after the vehicle was shut down after operation The heat would cause the bowl temperature to
increase driving fuel vapors out through vents and leak paths to the atmosphere after vehicle
operation Todayrsquos fuel injection engines do not have the open bowls and the emission rates
following vehicle operation are mainly increased temperature permeation We recommended
and adopted a new name for the ldquotemporary emissions following vehicle operationrdquo (TEFVO)
which subtracts the basic permeation rate from the measured emissions See the discussion
starting at page 16 for details
37
Appendix
Acknowledgements
E-77-2 Steering Committee
David Brzezinski EPA
Kevin Cullen GM Powertrain
Dominic DiCicco Ford Motor Company
King D Eng Shell Global Solutions
Ben Hancock CARB
Constance Hart EPA
Phil Heirigs Chevron Global Downstream
Jeff Jetter Honda RampD Americas
Keith KnollNREL
John Koupal EPA
David H Lax API
Jeff Long CARB
Hector Maldonado CARB
Mani Natarajan Marathon Oil Company
David N Patterson Mitsubishi Motors RampD Americas
Jenny Sigelko Chrysler
James P UihleinChevron Global Downstream
Marie Valentine Toyota Technical Center
Kenneth J Wright ConocoPhillips
CRC Members
Brent Bailey CRC
Chris Tennant CRC
Jane Beck CRC
38
Table 12
E0 E10 E20
Inspection Units Fuel 6 Fuel 7 Fuel 4
API Gravity degAPI 602 585 570
Relative Density 6060degF 07382 07447 07508
DVPE psi 701 730 849
Oxygenates--D4815
MTBE vol 000 000 000
ETBE vol 000 000 000
EtOH vol 000 954 2034
O2 wt 000 353 747
Hydrocarbon Composition
Aromatics vol 221 244 108
Olefins vol 80 88 55
Saturates vol 700 573 234
D86 Distillation
IBP degF 974 1040 1022
5 Evaporated degF 1316 1280 1252
10 Evaporated degF 1423 1330 1314
20 Evaporated degF 1564 1410 1413
30 Evaporated degF 1704 1450 1486
40 Evaporated degF 1840 1530 1547
50 Evaporated degF 1975 1950 1596
60 Evaporated degF 2120 2190 1636
70 Evaporated degF 2305 2410 2274
80 Evaporated degF 2588 2710 2695
90 Evaporated degF 3139 3170 3139
95 Evaporated degF 3322 3300 3255
EP degF 3603 3600 3406
Recovery vol 978 978 983
Residue vol 13 10 10
Loss vol 09 12 07
Driveability Index 11199 11015 9898
Data from CRC E-74
CRC E-77-2 Fuel Inspection Results
39
Fuel Units Fuel 6 Fuel 7 Fuel 4
Sulfur Content ppm 29 27 27
Estimated CH Ratio 62090 63323 63252
Est Net Heat of Combustion btulb 18573 18514 18513
Benzene vol 090 100 096
Research Octane Number 932 940 946
Motor Octane Number 838 838 834
(R+M)2 885 889 890
Fuel Units Fuel 6 Fuel 7 Fuel 4
Aromatics vol 2386 2481 2178
Olefins vol 752 892 1074
Saturates vol 6743 5621 4623
Unclassified vol 115 086 015
Ethanol vol 000 920 2111
Benzene vol 089 106 097
CH Ratio 6200 6092 5835
Oxygen wt 0008 1 340 773
Net Heat of Combustion btulb 18703 18016 17160
1 Contains 004 vol MTBE
Fuel Units Fuel 6 Fuel 7 Fuel 4
Oxygen wt 0008 3396 7733
C+H wt 9999 9660 9227
H wt 1389 1362 1350
C wt 8610 8298 7877
Fuel Units 6 7 4
Haltermann D3338 Btulb 18573 18514 18513
Average D3338 Btulb 18579 18514 18491
Oxygen Corrected D3338 Btulb 18579 17860 17103
DHA Btulb 18703 18016 17160
Table 12 (cont)
Suppliers Additional Inspections
Net Heat of Combusion -- Btulb
Carbon Hydrogen and Oxygen
Detailed Hydrocarbon Analysis
40
Vehicle Day 1 Day 2 Day 3
No Fuel Base + Press + Pump RL True HS Perm (Brkthru) Perm (Brkthru) Perm (Brkthru)
E10 - 10 psi 345 --- --- 1278 503 10429 (63) 7069 (348) 7043 (425)
E10 - 7 psi 223 --- --- 994 113 6278 (00) 5065 (00) 4535 (00)
E0 - 9 psi 2229 --- 4921 3870 00 22580 (00) 32310 (00) 23069 (126)
E0 - 7 psi 2991 --- 19896 7269 00 47425 (00) 44517 (00) 31798 (00)
E10 - 10 psi 843 --- --- 3164 04 15479 (310) 17799 (383) 17711 (419)
E10 - 7 psi 664 --- --- 2879 297 12601 (00) 11652 (00) 11653 (00)
E0 - 9 psi 338 --- --- 2492 443 6283 (24) 5810 (136) 5770 (225)
E0 - 7 psi 129 --- --- 2226 187 3672 (00) 2877 (00) 2936 (00)
E20 - 9 psi 553 --- --- 2720 134 11034 (00) 9581 (00) 9812 (00)
E10 - 10 psi 416 --- --- 1916 295 17941 (204) 17309 (346) 17417 (375)
E10 - 7 psi 596 --- --- 2328 719 17834 (00) 17150 (00) 15239 (00)
E0 - 9 psi 195 --- --- 1031 10 4995 (00) 4810 (00) 5072 (26)
E0 - 7 psi 99 --- --- 671 00 3830 (00) 3654 (00) 3670 (00)
E20 - 9 psi 462 --- --- 1697 603 17752 (00) 16900 (00) 16802 (00)
E10 - 10 psi 787 --- --- 8581 2377 14064 (00) 12644 (00) 12237 (00)
E10 - 7 psi 644 --- --- 8122 1222 10865 (00) 8120 (00) 8236 (00)
E0 - 9 psi 325 --- --- 8339 58 4064 (00) 3373 (00) 3080 (00)
E0 - 7 psi 401 --- --- 8425 00 3975 (00) 3026 (00) 2689 (00)
E20 - 9 psi 882 --- --- 10282 00 15480 (00) 13702 (00) 13605 (00)
E10 - 10 psi 976 --- 1209 10012 3929 16449 (00) NA NA
E10 - 7 psi 1468 --- --- 11393 5850 21342 (00) NA NA
E10 - 10 psi 199 --- --- 1383 00 3370 (00) 2268 (191) 2179 (330)
E10 - 7 psi 94 266 --- 563 138 2438 (00) 1838 (00) 1843 (00)
E0 - 9 psi 101 --- --- 837 153 1303 (00) 1158 (129) 1006 (221)
E0 - 7 psi 91 --- --- 1046 07 2071 (00) 1002 (00) 874 (00)
E20 - 9 psi 558 --- --- 4106 00 2840 (00) 2218 (00) 2034 (00)
E10 - 10 psi 551 --- 821 3024 2450 25454 (040) NA NA
E10 - 7 psi 481 --- 1664 2511 62 6783 (00) NA NA
E10 - 10 psi 106 --- --- 1489 00 1243 (00) 879 (00) 1028 (200)
E10 - 7 psi 218 --- --- 2012 00 1848 (00) 1002 (00) 758 (00)
E0 - 9 psi 32 --- --- 1158 04 1005 (00) 708 (00) 574 (00)
E0 - 7 psi 09 --- --- 1845 18 1016 (00) 712 (00) 570 (00)
E20 - 9 psi 47 --- --- 1168 49 1310 (00) 833 (00) 750 (00)
E10 - 10 psi 244 --- --- 1331 574 4920 (00) 8394 (00) 113738 (49)
E10 - 7 psi 239 --- --- 1057 329 5242 (00) 3974 (00) 3944 (00)
E0 - 9 psi 107 --- --- 967 521 4559 (00) 3585 (00) 11017 (00)
E0 - 7 psi 252 --- --- 363 33 4943 (00) 3190 (00) 2815 (00)
E20 - 9 psi 168 --- --- 1394 560 4709 (00) 4400 (00) 7518 (00)
E10 - 10 psi 104 90 --- 719 16 3192 (00) 2602 (00) 2370 (00)
E10 - 7 psi 122 --- --- 979 00 2247 (00) 2317 (00) 2675 (00)
E0 - 9 psi 85 --- --- 811 251 2021 (00) 1659 (2) 1763 (72)
E0 - 7 psi 87 --- --- 797 225 2483 (00) 2941 (00) 2888 (00)
E20 - 9 psi 193 --- --- 1025 00 4168 (00) 4148 (00) 4506 (00)
E10 - 10 psi 324 --- --- 1742 118 25907 (578) 34779 (630) 36014 (643)
E10 - 7 psi 325 --- --- 1683 192 3975 (02) 3550 (01) 3621 (04)
E0 - 9 psi 178 136 --- 1091 254 3270 (00) 2667 (00) 2746 (108)
E0 - 7 psi 204 380 --- 787 00 2117 (00) 2208 (00) 2081 (00)
E20 - 9 psi 204 --- --- 543 74 4685 (00) 4526 (00) 4198 (00)
216
211
2004
Toyota
Camry
XLE
215
2004
Toyota
High-
lander
212
2006
Ford
Taurus
214
2004
Ford
Escape
211L
207L
Static Permeation - mghr Dynamic Perm - mghr
CRC E-77-2 Program Test Results
Diurnal (65ordm to 105ordm) - mgday
202
1996
Taurus
205
2001
Toyota
Corolla
204
1999
Honda
Accord
207
2001
Dodge
Caravan
202L
Table 13
41
Individual Vehicle Diurnal Performance on the Various Fuels
0
1000
2000
3000
4000
5000
6000
0 10 20 30 40 50 60 70
Cu
mu
lati
ve
Pe
rme
ati
on
-m
g
Test Time - hrs
Three Day DiurnalVehicle 204 1999 Honda Accord
10 psi E10
7 psi E10
9 psi E0
7 psi E0
9 psi E20
0
1000
2000
3000
4000
5000
6000
0 10 20 30 40 50 60 70
Cu
mu
lati
ve
Pe
rme
ati
on
-m
g
Test Time - hrs
Three Day DiurnalVehicle 205 - 2001 Toyota Corolla
10 psi E10
7 psi E10
9 psi E0
7 psi E0
9 psi E20
Figure 25 ndash Vehicle 204 Diurnal Performance
Figure 26 ndash Vehicle 205 Diurnal Performance
42
0
500
1000
1500
2000
2500
3000
3500
4000
4500
5000
0 10 20 30 40 50 60 70
Cu
mu
lati
ve
Co
rre
cte
d P
erm
ea
tio
n -
mg
Test Time - hrs
Three Day DiurnalVehicle 207 - 2001 Dodge Caravan
10 psi E10
7 psi E10
9 psi E0
7 psi E0
9 psi E20
0
100
200
300
400
500
600
700
800
900
0 10 20 30 40 50 60 70
Cu
mu
lati
ve
Pe
rme
ati
on
-m
g
Test Time - hrs
Three Day DiurnalVehicle 211 - 2004 Toyota Camry XLE
10 psi E10
7 psi E10
9 psi E0
7 psi E0
9 psi E20
Figure 27 ndash Vehicle 207 Diurnal Performance
Figure 28 ndash Vehicle 211 Diurnal Performance
43
0
50
100
150
200
250
300
350
400
450
500
0 10 20 30 40 50 60 70
Cu
mu
lati
ve
Pe
rme
ati
on
-m
g
Test Time - hrs
Three Day DiurnalVehicle 212 - 2006 Ford Taurus
10 psi E10
7 psi E10
9 psi E0
7 psi E0
9 psi E20
0
500
1000
1500
2000
2500
3000
3500
4000
4500
5000
0 10 20 30 40 50 60 70
Cu
mu
lati
ve
Pe
rme
ati
on
-m
g
Test Time - hrs
Three Day DiurnalVehicle 214 2004 Ford Escape
10 psi E10
7 psi E10
9 psi E0
7 psi E0
9 psi E20
Note The incomplete cumulative results for the 10 psi E10 results resulted from a conflict for the use
of the INNOVA analyzer during the test The INNOVA analyzer is required to correct for the FIDrsquos
ethanol error and the presence of methanol and refrigerant (R-134a) The data was available for the
50+ hour results and the data is valid as shown We have no explanation for the high levels
experienced on the third day of the test No test errors were identified
Figure 29 ndash Vehicle 212 Diurnal Performance
Figure 30 ndash Vehicle 214 Diurnal Performance
44
0
200
400
600
800
1000
1200
1400
1600
0 10 20 30 40 50 60 70
Cu
mu
lati
ve
Pe
rme
ati
on
-m
g
Test Time - hrs
Three Day DiurnalVehicle 215 2004 Toyota Highlander
10 psi E10
7 psi E10
9 psi E0
7 psi E0
9 psi E20
Figure 31 ndash Vehicle 215 Diurnal Performance
45
Table 14
Test Corrected
Vehicle Fuel Total Fuel EtOH R134a Methanol
204 10 psi E10 509899 144040 18298 16754
1999 Honda 7 psi E10 359057 130806 17551 15221
Accord 9 psi E0 178635 13843 18230 9896
7 psi E0 94846 1856 16631 2379
9 psi E20 304271 128408 18261 12143
205 10 psi E10 526659 186599 23354 20895
2001 Toyota 7 psi E10 502229 204246 25990 19198
Corolla 9 psi E0 148775 000 20434 4613
7 psi E0 111536 5489 22408 5619
9 psi E20 514540 212708 25677 19584
207 10 psi E10 389450 196248 12013 30399
2001 Dodge 7 psi E10 272201 114027 11731 19616
Caravan 9 psi E0 105167 1820 12224 15284
7 psi E0 96906 1118 22141 14276
9 psi E20 427882 241488 14268 25432
211 10 psi E10 78164 19733 15159 46970
2004 Toyota 7 psi E10 61190 20211 15929 46525
Camry LE 9 psi E0 34668 1681 14329 42659
7 psi E0 39468 000 16197 57303
9 psi E20 71013 26726 16213 36879
212 10 psi E10 31508 7222 14831 7896
2006 Ford 7 psi E10 36079 10132 15481 3400
Taurus 9 psi E0 22870 2409 15182 3761
7 psi E0 22973 000 15393 4362
9 psi E20 28935 11156 14116 2629
214 10 psi E10 1257887 000 19947 27992
2004 Ford 7 psi E10 131593 24571 16025 8879
Escape 9 psi E0 191611 2940 16487 7213
7 psi E0 109481 5386 80650 3106
9 psi E20 166271 24097 14491 6096
215 10 psi E10 81644 12178 14658 42609
2004 Toyota 7 psi E10 72399 15092 15532 36061
Highlander 9 psi E0 54431 000 14806 25822
7 psi E0 83115 000 14072 26255
9 psi E20 128223 38822 12841 34420
3 Day Diurnal Results
CRC E77-2 Program Diurnal ResultsAll values are in mg
46
0
200
400
600
800
1000
1200
1400
1600
1800
2000
Co
rrecte
d D
aily D
iurn
al
-m
g
Diurnal Ethanol PortionVehicle 204 - 1999 Honda Accord
Ethanol Portion
10 psi E10 9 psi E07 psi E10
1 32
315
341368
383
264273
1 321 321 321 32
9 psi E207 psi E0
1122097
39
0510
442
405412
Figure 32 ndash Vehicle 204 Diurnal Ethanol Portion
0
200
400
600
800
1000
1200
1400
1600
1800
2000
Co
rrecte
d D
aily D
iurn
al
-m
g
Diurnal Ethanol PortionVehicle 205 - 2001 Toyota Corolla
Ethanol Portion
10 psi E10 9 psi E07 psi E10
1 32
359
406
382
431355349
1 321 321 321 32
9 psi E207 psi E0
0 00
712649
406
420414
Figure 33 ndash Vehicle 205 Diurnal Ethanol Portion
47
0
200
400
600
800
1000
1200
1400
1600C
orr
ecte
d D
aily D
iurn
al
-m
g
Diurnal Ethanol PortionVehicle 207 - 2001 Dodge Caravan
Ethanol Portion
10 psi E10 9 psi E07 psi E10
1 32
488
442408
409
490535
1 321 321 321 32
9 psi E207 psi E0
00
1144
27
0101
556
587552
Figure 34 ndash Vehicle 207 Diurnal Ethanol Portion
0
50
100
150
200
250
300
350
400
Co
rrecte
d D
aily D
iurn
al
-m
g
Diurnal Ethanol PortionVehicle 211 - 2004 Toyota Camry XLE
Ethanol Portion
10 psi E10 9 psi E07 psi E10
1 32
264
242245
1 321 321 321 32
9 psi E207 psi E0
329
306356
00
73
64
00
00
00
325
431
370
Figure 35 ndash Vehicle 211 Diurnal Ethanol Portion
48
0
20
40
60
80
100
120
140
160
180
200C
orr
ecte
d D
aily D
iurn
al
-m
g
Diurnal Ethanol PortionVehicle 212 - 2006 Ford Taurus
Ethanol Portion
10 psi E10 9 psi E07 psi E10
1 32
216
170
316
1 321 321 321 32
9 psi E207 psi E0
194
288
436 102
105
85
00
00
00476
529
243
Figure 36 ndash Vehicle 212 Diurnal Ethanol Portion
0
200
400
600
800
1000
1200
Co
rrecte
d D
aily D
iurn
al
-m
g
Diurnal Ethanol PortionVehicle 214 - 2004 Ford Escape
Ethanol Portion
10 psi E10 9 psi E07 psi E10
1 32
00
1 321 321 321 32
9 psi E207 psi E0
201
202152
38
05
19
56
1469
103
171188
143
67
11275
Figure 37 ndash Vehicle 214 Diurnal Ethanol Portion
49
0
50
100
150
200
250
300
350
400
450
500C
orr
ecte
d D
aily D
iurn
al
-m
g
Diurnal Ethanol PortionVehicle 215 - 2004 Toyota Highlander
Ethanol Portion
10 psi E10 9 psi E07 psi E10
1 32
121
136
196
1 321 321 321 32
9 psi E207 psi E0
198
217213
0000
00
0000
00
335 292
283
Figure 38 ndash Vehicle 215 Diurnal Ethanol Portion

27
Overall Trend Summary - The following chart (Figure 18) visually summarizes the trends seen
from all testing performed during this program
Higher Volatility E0 to E10 E0 to E20 E10 to E20
uarr uarr uarr uarr
Higher Volatility E0 to E10 E0 to E20 E10 to E20
uarr uarr uarr uarr
Higher Volatility E0 to E10 E0 to E20 E10 to E20
uarr uarr uarr uarr
Higher Volatility E0 to E10 E0 to E20 E10 to E20
uarr uarr uarr uarr
Higher Volatility E0 to E10 E0 to E20 E10 to E20
uarrharr uarr uarr uarr
Higher Volatility E0 to E10 E0 to E20 E10 to E20
uarr uarr uarr uarr
Higher Volatility E0 to E10 E0 to E20 E10 to E20
uarr darr darr
Higher Volatility E0 to E10 E0 to E20 E10 to E20
uarr uarr uarr harr
Ethanol Content
Diurnal
Trend Analysis for E-77-2 Program
Ethanol Content
Static Permeation
Ethanol Content
Running Loss Permeation
Ethanol Content
Ethanol Content
Diurnal
Enhanced Vehicles (Sample of 5)
Static Permeation
Ethanol Content
Ethanol Content
Running Loss Permeation
Ethanol Content
True Hot Soak (TEFVO)
Near-Zero Vehicles (Sample of 2)
True Hot Soak (TEFVO)
Figure 18 Trend Analysis Summaries
28
Vehicle 202 ndash 1996 Ford Taurus - Special Case
We have treated vehicle 202 as a special case This was the oldest of the vehicles tested and had
been subjected to limited exhaust emission tests with a 20-volume percent ethanol fuel (E20)
during the CRC E-74b test program
Vehicle 202 completed the E10 portion of the test program (10 and 7 psi fuels) successfully and
completed the road preconditioning on the E0 fuel prior to the E0 evaluations The first test on
the E0 fuel was excessively high indicating a fuel leak It was traced to a leaky fuel injector o-
ring and there was considerable discussion as to an appropriate repair Tests were made on the 9
and the 7 psi E0 fuel to measure the magnitude of a vehicle in a ldquoleakrdquo condition and the tests
were labeled as ldquo202L (Leak)rdquo The fuel injector o-rings were replaced as a complete set and
the vehicle resumed testing as ldquo202Rrsquo (Repaired) A new elusive vapor leak was present later
identified as a very small leak at the top of the fuel fill pipe
The circle on Figure 19 at the right shows
the location of the small leak This leak
was problematic as to its effect on the
emission measurements because its
magnitude or presence seemed to depend
on the torque exerted on the fuel cap The
tests on the E0 fuels (9 and 7 psi) are
noted as 202R but with a vapor leak
We attempted to fix this leak and repeated
the E10 test with the vehicle re-identified
as 216 with reasonable results We also
ran the E20 test sequence and declared the
vehicle done
The testing history for this vehicle is shown in Tables 8 (Static) 9 (Dynamic) and 10 (Diurnal)
The tests highlighted in yellow are those that exhibited a liquid or vapor leak as identified during
the static test leak validation
Figure 19 ndash Vehicle 202 Fuel Fill Pipe Leak
29
Table 8
Static Permeation Results 1996 Ford Taurus SHED
Corrected Results Canister
Fuel Permeation mgday Loss
Veh psiEtOH Test Type Date Test mghr (Corrected) g
202 100E10 Static Perm 071807 7018 345 000
Press Incr 00 No Leak
Prs+Fuel Incr 00
202 70E10 Static Perm 082107 7031 223 000
Press Incr 00 No Leak
Prs+Fuel Incr 00
202L 90E0 Static Perm 030408 7169 2292 000
Press Incr DNA
Prs+Fuel Incr 4921 Liquid Leak
202L 70E0 Static Perm 032008 7183 2991 000
Press Incr DNA
Prs+Fuel Incr 19896 Liquid Leak
202R 90E0 Static Perm 050808 7228 178 000
Press Incr 136 Vapor Leak
Prs+Fuel Incr 00
202R 70E0 Static Perm 052208 7239 204 000
Press Incr 380 Vapor Leak
Prs+Fuel Incr 00
216 100E10 Static Perm 081408 7299 324 000
Press Incr 00 No Leak
Prs+Fuel Incr 00
216 70E10 Static Perm 091708 7326 325 000
Press Incr 00 No Leak
Prs+Fuel Incr 00
216 90E20 Static Perm 103008 7363 204 000
Press Incr 00 No Leak
Prs+Fuel Incr 00
30
Table 9
Dynamic Permeation Results 1996 Ford Taurus SHED
Corrected Results Canister From
Fuel Permeation mgday Loss Static
Veh psiEtOH Test Type Date Test mghr (Corrected) g Test
202 100E10 Dynamic RL 072007 25662 1278 000 No Leak
TEFVO 386 000
202L 90E0 Dynamic RL 030508 25695 3870 000 Liquid Leak
TEFVO 00 000
202L 70E0 Dynamic RL 032408 25699 7269 000 Liquid Leak
TEFVO 00 000
202R 90E0 Dynamic RL 050908 25704 1091 000 Vapor Leak
TEFVO 50 000
202R 70E0 Dynamic RL 052308 25706 787 000 Vapor Leak
TEFVO 00 000
216 100E10 Dynamic RL 081508 25718 1742 000 No Leak
TEFVO 14 000
216 70E10 Dynamic RL 091808 25721 1683 000 No Leak
TEFVO 423 000
216 90E20 Dynamic RL 110708 25730 543 000 No Leak
TEFVO 00 000
31
Table 10
Diurnal Permeation Results 1996 Ford Taurus SHED
Corrected Results Canister From
Fuel Permeation mgday Loss Static
Veh psiEtOH Test Type Date Test mghr (Corrected) g Test
202 100E10 72 DHB 65-105 073107 7023
Day 1 10429 612 No Leak
Day 2 7069 3264
Day 3 7043 3869
202 70E10 72 DHB 65-105 082807 7034
Day 1 6278 000 No Leak
Day 2 5065 000
Day 3 4535 000
202L 90E0 72 DHB 65-105 031108 7173
Day 1 22589 000 Liquid Leak
Day 2 32310 000
Day 3 23069 1260
202L 70E0 72 DHB 65-105 040108 7196
Day 1 47425 000 Liquid Leak
Day 2 44517 000
Day 3 31798 000
202R 90E0 72 DHB 65-105 051308 7230
Day 1 3270 000 Vapor Leak
Day 2 2667 000
Day 3 2746 1083
202R 70E0 72 DHB 65-105 052808 7243
Day 1 2117 000 Vapor Leak
Day 2 2208 000
Day 3 2081 000
216 100E10 72 DHB 65-105 082008 7305
Day 1 25907 5777 No Leak
Day 2 34779 6299
Day 3 36014 6343
216 70E10 72 DHB 65-105 092308 7331
Day 1 3975 022 No Leak
Day 2 3550 006
Day 3 3621 037
216 90E20 72 DHB 65-105 111108 7373
Day 1 4685 000 No Leak
Day 2 4526 000
Day 3 4198 000
32
The Implanted Leak Test Results
Project E-77-2 included evaluating two vehicles with implanted leaks This interest followed the
information gathered in the Pilot Study where tests were run with a specially modified fuel cap
containing a 002rdquo dia hole The results with the implanted leak from the Pilot Study are
repeated in Table 11 below as the diurnal results are shown for a 1996 Chevrolet Cavalier first
without the implanted leak at 038 grams per day and then at 207 grams per day (a 54x
increase) with the leak
Table 11
Veh No
Evap
Tech Fuel
Results
gmsday
gms
Increase
6 1996 Chevrolet Cavalier Enhanced 7 psi E0 038
7 2070 2032
207 2001 Dodge Caravan Enhanced 7 psi E10 109
207L 213 104
211 2004 Toyota Camry LE Near Zero 7 psi E10 024
211L 068 044
- Implanted 020 leak in fuel cap
Vehicle Description
Implanted Leak Impact on Diurnal PermeationDay One Results 65deg - 105degF Diurnal
The two E-77-2 vehicles (207 amp 211) were given a limited evaluation with an induced leak and
saw a significantly lesser impact Vehicle 207 gave diurnal results increases from 109 to 213
grams per day (a 2x increase) and Vehicle 211 increased from 024 grams per day to 068 grams
per day (a 28x increase) The following Figure 20 displays the imbedded leak impact from Table
11
33
0
5
10
15
20
On
e D
ay
Diu
rna
l P
erm
ea
tio
n -
gm
sd
ay
Vehicle Number
Implanted Leak Impact on One Day Diurnal Permeation020 Leak in Fuel Cap - 65 to 105 F Diurnal
207L 211L21120776
As Received - No Leak
020 Fuel Cap Leak
The newer vehicles evaluated in this phase of the study were configured and certified to the
Onboard Refueling Vapor Regulations (ORVR) These are capable of containing 95 or more
control of the refueling vapors at up to 10 gallons per minute fueling rate Where the Chevrolet
Cavalier had a small (0055rdquo dia) orifice and a long vapor tube venting the tankrsquos vapor space to
the carbon canister (and then to the atmosphere) the ORVR compliant vehicles have a large
(0688rdquo ID) short vent hose to a low flow restriction carbon canister
The following bar charts (Figures 21 through 24) show the impacts of the leak on all phases of
the evaporative testing performed and compare those results with all fuels tested With only two
vehicles (207 and 211) evaluated on two fuels statistically significant effects cannot be
quantified but the trend of increased emissions is apparent
Figure 20 ndash Implanted Leak Impact
34
0
20
40
60
80
100
120
140
160
7E0 9E0 7E10 10E10 9E20 7E0 9E0 7E10 10E10 9E20
Sta
tic
Pe
rme
ati
on
-m
gh
r
Fuel
0020 dia Induced Leak EffectStatic Permeation
Vehicle 211Vehicle 207
Leak
Leak
0
200
400
600
800
1000
1200
7E0 9E0 7E10 10E10 9E20 7E0 9E0 7E10 10E10 9E20
Ru
nn
ing
Lo
ss
Pe
rme
ati
on
-m
gh
r
Fuel
0020 dia Induced Leak EffectRunning Loss Permeation
Vehicle 211Vehicle 207
Leak
Leak
Figure 21 ndash Vehicles 207 and 211 with Induced Leak - Static
Figure 22 ndash Vehicles 207 and 211with Induced Leak ndash Running Loss
35
0
100
200
300
400
500
600
700
7E0 9E0 7E10 10E10 9E20 7E0 9E0 7E10 10E10 9E20
Tru
e H
ot S
oa
k P
erm
ea
tio
n -
mg
hr
Fuel
0020 dia Induced Leak EffectTrue Hot Soak Permeation
Vehicle 211Vehicle 207
Leak
Leak
0
500
1000
1500
2000
2500
7E0 9E0 7E10 10E10 9E20 7E0 9E0 7E10 10E10 9E20
Da
y 1
Diu
rna
l P
erm
ea
tio
n -
mg
da
y
Fuel
0020 dia Induced Leak EffectDay 1 Diurnal Permeation
Vehicle 211Vehicle 207
Leak
Leak
Figure 24 ndash Vehicles 207 and 211 with Induced Leak - Diurnal
Figure 23 ndash Vehicles 207 and 211 with Induced Leak ndash True Hot Soak
36
Summary of Findings and Results
The E-77-2 test program was a continuation of the previously published E-77 test project and
added eight vehicles tested on five fuels to the knowledge base The permeation trends
previously shown were again present The small sample size and limited number of tests
preclude making statements about statistical validity but in general
o The newer vehicle groups had lower emissions
o Adding ethanol to the fuel increased permeation over the non-oxygenated levels
o Increased volatility increased permeation levels
o SHED emission rates must be corrected for the ethanol error in the FID and the
non-fuel methanol and refrigerant in the measurement
As this test program evolved and additional experience was gathered two program modifications
were made 1) The leak validation methodology was changed and 2) a different metric and
definition of the ldquoHot Soakrdquo was adopted
The leak validation portion of the static permeation test was found to be very sensitive and when
the data was corrected on a minute-by-minute basis for ethanol methanol and refrigerant the
change in apparent permeation rate was due as much to variation as to leaks See the discussion
starting at page 12 for the details of the development
Concern for and recognition of ldquoHot Soakrdquo emissions started in the original evaporative emission
regulations Carburetors had float bowls with ~ 50 ml of fuel that absorbed the latent engine heat
after the vehicle was shut down after operation The heat would cause the bowl temperature to
increase driving fuel vapors out through vents and leak paths to the atmosphere after vehicle
operation Todayrsquos fuel injection engines do not have the open bowls and the emission rates
following vehicle operation are mainly increased temperature permeation We recommended
and adopted a new name for the ldquotemporary emissions following vehicle operationrdquo (TEFVO)
which subtracts the basic permeation rate from the measured emissions See the discussion
starting at page 16 for details
37
Appendix
Acknowledgements
E-77-2 Steering Committee
David Brzezinski EPA
Kevin Cullen GM Powertrain
Dominic DiCicco Ford Motor Company
King D Eng Shell Global Solutions
Ben Hancock CARB
Constance Hart EPA
Phil Heirigs Chevron Global Downstream
Jeff Jetter Honda RampD Americas
Keith KnollNREL
John Koupal EPA
David H Lax API
Jeff Long CARB
Hector Maldonado CARB
Mani Natarajan Marathon Oil Company
David N Patterson Mitsubishi Motors RampD Americas
Jenny Sigelko Chrysler
James P UihleinChevron Global Downstream
Marie Valentine Toyota Technical Center
Kenneth J Wright ConocoPhillips
CRC Members
Brent Bailey CRC
Chris Tennant CRC
Jane Beck CRC
38
Table 12
E0 E10 E20
Inspection Units Fuel 6 Fuel 7 Fuel 4
API Gravity degAPI 602 585 570
Relative Density 6060degF 07382 07447 07508
DVPE psi 701 730 849
Oxygenates--D4815
MTBE vol 000 000 000
ETBE vol 000 000 000
EtOH vol 000 954 2034
O2 wt 000 353 747
Hydrocarbon Composition
Aromatics vol 221 244 108
Olefins vol 80 88 55
Saturates vol 700 573 234
D86 Distillation
IBP degF 974 1040 1022
5 Evaporated degF 1316 1280 1252
10 Evaporated degF 1423 1330 1314
20 Evaporated degF 1564 1410 1413
30 Evaporated degF 1704 1450 1486
40 Evaporated degF 1840 1530 1547
50 Evaporated degF 1975 1950 1596
60 Evaporated degF 2120 2190 1636
70 Evaporated degF 2305 2410 2274
80 Evaporated degF 2588 2710 2695
90 Evaporated degF 3139 3170 3139
95 Evaporated degF 3322 3300 3255
EP degF 3603 3600 3406
Recovery vol 978 978 983
Residue vol 13 10 10
Loss vol 09 12 07
Driveability Index 11199 11015 9898
Data from CRC E-74
CRC E-77-2 Fuel Inspection Results
39
Fuel Units Fuel 6 Fuel 7 Fuel 4
Sulfur Content ppm 29 27 27
Estimated CH Ratio 62090 63323 63252
Est Net Heat of Combustion btulb 18573 18514 18513
Benzene vol 090 100 096
Research Octane Number 932 940 946
Motor Octane Number 838 838 834
(R+M)2 885 889 890
Fuel Units Fuel 6 Fuel 7 Fuel 4
Aromatics vol 2386 2481 2178
Olefins vol 752 892 1074
Saturates vol 6743 5621 4623
Unclassified vol 115 086 015
Ethanol vol 000 920 2111
Benzene vol 089 106 097
CH Ratio 6200 6092 5835
Oxygen wt 0008 1 340 773
Net Heat of Combustion btulb 18703 18016 17160
1 Contains 004 vol MTBE
Fuel Units Fuel 6 Fuel 7 Fuel 4
Oxygen wt 0008 3396 7733
C+H wt 9999 9660 9227
H wt 1389 1362 1350
C wt 8610 8298 7877
Fuel Units 6 7 4
Haltermann D3338 Btulb 18573 18514 18513
Average D3338 Btulb 18579 18514 18491
Oxygen Corrected D3338 Btulb 18579 17860 17103
DHA Btulb 18703 18016 17160
Table 12 (cont)
Suppliers Additional Inspections
Net Heat of Combusion -- Btulb
Carbon Hydrogen and Oxygen
Detailed Hydrocarbon Analysis
40
Vehicle Day 1 Day 2 Day 3
No Fuel Base + Press + Pump RL True HS Perm (Brkthru) Perm (Brkthru) Perm (Brkthru)
E10 - 10 psi 345 --- --- 1278 503 10429 (63) 7069 (348) 7043 (425)
E10 - 7 psi 223 --- --- 994 113 6278 (00) 5065 (00) 4535 (00)
E0 - 9 psi 2229 --- 4921 3870 00 22580 (00) 32310 (00) 23069 (126)
E0 - 7 psi 2991 --- 19896 7269 00 47425 (00) 44517 (00) 31798 (00)
E10 - 10 psi 843 --- --- 3164 04 15479 (310) 17799 (383) 17711 (419)
E10 - 7 psi 664 --- --- 2879 297 12601 (00) 11652 (00) 11653 (00)
E0 - 9 psi 338 --- --- 2492 443 6283 (24) 5810 (136) 5770 (225)
E0 - 7 psi 129 --- --- 2226 187 3672 (00) 2877 (00) 2936 (00)
E20 - 9 psi 553 --- --- 2720 134 11034 (00) 9581 (00) 9812 (00)
E10 - 10 psi 416 --- --- 1916 295 17941 (204) 17309 (346) 17417 (375)
E10 - 7 psi 596 --- --- 2328 719 17834 (00) 17150 (00) 15239 (00)
E0 - 9 psi 195 --- --- 1031 10 4995 (00) 4810 (00) 5072 (26)
E0 - 7 psi 99 --- --- 671 00 3830 (00) 3654 (00) 3670 (00)
E20 - 9 psi 462 --- --- 1697 603 17752 (00) 16900 (00) 16802 (00)
E10 - 10 psi 787 --- --- 8581 2377 14064 (00) 12644 (00) 12237 (00)
E10 - 7 psi 644 --- --- 8122 1222 10865 (00) 8120 (00) 8236 (00)
E0 - 9 psi 325 --- --- 8339 58 4064 (00) 3373 (00) 3080 (00)
E0 - 7 psi 401 --- --- 8425 00 3975 (00) 3026 (00) 2689 (00)
E20 - 9 psi 882 --- --- 10282 00 15480 (00) 13702 (00) 13605 (00)
E10 - 10 psi 976 --- 1209 10012 3929 16449 (00) NA NA
E10 - 7 psi 1468 --- --- 11393 5850 21342 (00) NA NA
E10 - 10 psi 199 --- --- 1383 00 3370 (00) 2268 (191) 2179 (330)
E10 - 7 psi 94 266 --- 563 138 2438 (00) 1838 (00) 1843 (00)
E0 - 9 psi 101 --- --- 837 153 1303 (00) 1158 (129) 1006 (221)
E0 - 7 psi 91 --- --- 1046 07 2071 (00) 1002 (00) 874 (00)
E20 - 9 psi 558 --- --- 4106 00 2840 (00) 2218 (00) 2034 (00)
E10 - 10 psi 551 --- 821 3024 2450 25454 (040) NA NA
E10 - 7 psi 481 --- 1664 2511 62 6783 (00) NA NA
E10 - 10 psi 106 --- --- 1489 00 1243 (00) 879 (00) 1028 (200)
E10 - 7 psi 218 --- --- 2012 00 1848 (00) 1002 (00) 758 (00)
E0 - 9 psi 32 --- --- 1158 04 1005 (00) 708 (00) 574 (00)
E0 - 7 psi 09 --- --- 1845 18 1016 (00) 712 (00) 570 (00)
E20 - 9 psi 47 --- --- 1168 49 1310 (00) 833 (00) 750 (00)
E10 - 10 psi 244 --- --- 1331 574 4920 (00) 8394 (00) 113738 (49)
E10 - 7 psi 239 --- --- 1057 329 5242 (00) 3974 (00) 3944 (00)
E0 - 9 psi 107 --- --- 967 521 4559 (00) 3585 (00) 11017 (00)
E0 - 7 psi 252 --- --- 363 33 4943 (00) 3190 (00) 2815 (00)
E20 - 9 psi 168 --- --- 1394 560 4709 (00) 4400 (00) 7518 (00)
E10 - 10 psi 104 90 --- 719 16 3192 (00) 2602 (00) 2370 (00)
E10 - 7 psi 122 --- --- 979 00 2247 (00) 2317 (00) 2675 (00)
E0 - 9 psi 85 --- --- 811 251 2021 (00) 1659 (2) 1763 (72)
E0 - 7 psi 87 --- --- 797 225 2483 (00) 2941 (00) 2888 (00)
E20 - 9 psi 193 --- --- 1025 00 4168 (00) 4148 (00) 4506 (00)
E10 - 10 psi 324 --- --- 1742 118 25907 (578) 34779 (630) 36014 (643)
E10 - 7 psi 325 --- --- 1683 192 3975 (02) 3550 (01) 3621 (04)
E0 - 9 psi 178 136 --- 1091 254 3270 (00) 2667 (00) 2746 (108)
E0 - 7 psi 204 380 --- 787 00 2117 (00) 2208 (00) 2081 (00)
E20 - 9 psi 204 --- --- 543 74 4685 (00) 4526 (00) 4198 (00)
216
211
2004
Toyota
Camry
XLE
215
2004
Toyota
High-
lander
212
2006
Ford
Taurus
214
2004
Ford
Escape
211L
207L
Static Permeation - mghr Dynamic Perm - mghr
CRC E-77-2 Program Test Results
Diurnal (65ordm to 105ordm) - mgday
202
1996
Taurus
205
2001
Toyota
Corolla
204
1999
Honda
Accord
207
2001
Dodge
Caravan
202L
Table 13
41
Individual Vehicle Diurnal Performance on the Various Fuels
0
1000
2000
3000
4000
5000
6000
0 10 20 30 40 50 60 70
Cu
mu
lati
ve
Pe
rme
ati
on
-m
g
Test Time - hrs
Three Day DiurnalVehicle 204 1999 Honda Accord
10 psi E10
7 psi E10
9 psi E0
7 psi E0
9 psi E20
0
1000
2000
3000
4000
5000
6000
0 10 20 30 40 50 60 70
Cu
mu
lati
ve
Pe
rme
ati
on
-m
g
Test Time - hrs
Three Day DiurnalVehicle 205 - 2001 Toyota Corolla
10 psi E10
7 psi E10
9 psi E0
7 psi E0
9 psi E20
Figure 25 ndash Vehicle 204 Diurnal Performance
Figure 26 ndash Vehicle 205 Diurnal Performance
42
0
500
1000
1500
2000
2500
3000
3500
4000
4500
5000
0 10 20 30 40 50 60 70
Cu
mu
lati
ve
Co
rre
cte
d P
erm
ea
tio
n -
mg
Test Time - hrs
Three Day DiurnalVehicle 207 - 2001 Dodge Caravan
10 psi E10
7 psi E10
9 psi E0
7 psi E0
9 psi E20
0
100
200
300
400
500
600
700
800
900
0 10 20 30 40 50 60 70
Cu
mu
lati
ve
Pe
rme
ati
on
-m
g
Test Time - hrs
Three Day DiurnalVehicle 211 - 2004 Toyota Camry XLE
10 psi E10
7 psi E10
9 psi E0
7 psi E0
9 psi E20
Figure 27 ndash Vehicle 207 Diurnal Performance
Figure 28 ndash Vehicle 211 Diurnal Performance
43
0
50
100
150
200
250
300
350
400
450
500
0 10 20 30 40 50 60 70
Cu
mu
lati
ve
Pe
rme
ati
on
-m
g
Test Time - hrs
Three Day DiurnalVehicle 212 - 2006 Ford Taurus
10 psi E10
7 psi E10
9 psi E0
7 psi E0
9 psi E20
0
500
1000
1500
2000
2500
3000
3500
4000
4500
5000
0 10 20 30 40 50 60 70
Cu
mu
lati
ve
Pe
rme
ati
on
-m
g
Test Time - hrs
Three Day DiurnalVehicle 214 2004 Ford Escape
10 psi E10
7 psi E10
9 psi E0
7 psi E0
9 psi E20
Note The incomplete cumulative results for the 10 psi E10 results resulted from a conflict for the use
of the INNOVA analyzer during the test The INNOVA analyzer is required to correct for the FIDrsquos
ethanol error and the presence of methanol and refrigerant (R-134a) The data was available for the
50+ hour results and the data is valid as shown We have no explanation for the high levels
experienced on the third day of the test No test errors were identified
Figure 29 ndash Vehicle 212 Diurnal Performance
Figure 30 ndash Vehicle 214 Diurnal Performance
44
0
200
400
600
800
1000
1200
1400
1600
0 10 20 30 40 50 60 70
Cu
mu
lati
ve
Pe
rme
ati
on
-m
g
Test Time - hrs
Three Day DiurnalVehicle 215 2004 Toyota Highlander
10 psi E10
7 psi E10
9 psi E0
7 psi E0
9 psi E20
Figure 31 ndash Vehicle 215 Diurnal Performance
45
Table 14
Test Corrected
Vehicle Fuel Total Fuel EtOH R134a Methanol
204 10 psi E10 509899 144040 18298 16754
1999 Honda 7 psi E10 359057 130806 17551 15221
Accord 9 psi E0 178635 13843 18230 9896
7 psi E0 94846 1856 16631 2379
9 psi E20 304271 128408 18261 12143
205 10 psi E10 526659 186599 23354 20895
2001 Toyota 7 psi E10 502229 204246 25990 19198
Corolla 9 psi E0 148775 000 20434 4613
7 psi E0 111536 5489 22408 5619
9 psi E20 514540 212708 25677 19584
207 10 psi E10 389450 196248 12013 30399
2001 Dodge 7 psi E10 272201 114027 11731 19616
Caravan 9 psi E0 105167 1820 12224 15284
7 psi E0 96906 1118 22141 14276
9 psi E20 427882 241488 14268 25432
211 10 psi E10 78164 19733 15159 46970
2004 Toyota 7 psi E10 61190 20211 15929 46525
Camry LE 9 psi E0 34668 1681 14329 42659
7 psi E0 39468 000 16197 57303
9 psi E20 71013 26726 16213 36879
212 10 psi E10 31508 7222 14831 7896
2006 Ford 7 psi E10 36079 10132 15481 3400
Taurus 9 psi E0 22870 2409 15182 3761
7 psi E0 22973 000 15393 4362
9 psi E20 28935 11156 14116 2629
214 10 psi E10 1257887 000 19947 27992
2004 Ford 7 psi E10 131593 24571 16025 8879
Escape 9 psi E0 191611 2940 16487 7213
7 psi E0 109481 5386 80650 3106
9 psi E20 166271 24097 14491 6096
215 10 psi E10 81644 12178 14658 42609
2004 Toyota 7 psi E10 72399 15092 15532 36061
Highlander 9 psi E0 54431 000 14806 25822
7 psi E0 83115 000 14072 26255
9 psi E20 128223 38822 12841 34420
3 Day Diurnal Results
CRC E77-2 Program Diurnal ResultsAll values are in mg
46
0
200
400
600
800
1000
1200
1400
1600
1800
2000
Co
rrecte
d D
aily D
iurn
al
-m
g
Diurnal Ethanol PortionVehicle 204 - 1999 Honda Accord
Ethanol Portion
10 psi E10 9 psi E07 psi E10
1 32
315
341368
383
264273
1 321 321 321 32
9 psi E207 psi E0
1122097
39
0510
442
405412
Figure 32 ndash Vehicle 204 Diurnal Ethanol Portion
0
200
400
600
800
1000
1200
1400
1600
1800
2000
Co
rrecte
d D
aily D
iurn
al
-m
g
Diurnal Ethanol PortionVehicle 205 - 2001 Toyota Corolla
Ethanol Portion
10 psi E10 9 psi E07 psi E10
1 32
359
406
382
431355349
1 321 321 321 32
9 psi E207 psi E0
0 00
712649
406
420414
Figure 33 ndash Vehicle 205 Diurnal Ethanol Portion
47
0
200
400
600
800
1000
1200
1400
1600C
orr
ecte
d D
aily D
iurn
al
-m
g
Diurnal Ethanol PortionVehicle 207 - 2001 Dodge Caravan
Ethanol Portion
10 psi E10 9 psi E07 psi E10
1 32
488
442408
409
490535
1 321 321 321 32
9 psi E207 psi E0
00
1144
27
0101
556
587552
Figure 34 ndash Vehicle 207 Diurnal Ethanol Portion
0
50
100
150
200
250
300
350
400
Co
rrecte
d D
aily D
iurn
al
-m
g
Diurnal Ethanol PortionVehicle 211 - 2004 Toyota Camry XLE
Ethanol Portion
10 psi E10 9 psi E07 psi E10
1 32
264
242245
1 321 321 321 32
9 psi E207 psi E0
329
306356
00
73
64
00
00
00
325
431
370
Figure 35 ndash Vehicle 211 Diurnal Ethanol Portion
48
0
20
40
60
80
100
120
140
160
180
200C
orr
ecte
d D
aily D
iurn
al
-m
g
Diurnal Ethanol PortionVehicle 212 - 2006 Ford Taurus
Ethanol Portion
10 psi E10 9 psi E07 psi E10
1 32
216
170
316
1 321 321 321 32
9 psi E207 psi E0
194
288
436 102
105
85
00
00
00476
529
243
Figure 36 ndash Vehicle 212 Diurnal Ethanol Portion
0
200
400
600
800
1000
1200
Co
rrecte
d D
aily D
iurn
al
-m
g
Diurnal Ethanol PortionVehicle 214 - 2004 Ford Escape
Ethanol Portion
10 psi E10 9 psi E07 psi E10
1 32
00
1 321 321 321 32
9 psi E207 psi E0
201
202152
38
05
19
56
1469
103
171188
143
67
11275
Figure 37 ndash Vehicle 214 Diurnal Ethanol Portion
49
0
50
100
150
200
250
300
350
400
450
500C
orr
ecte
d D
aily D
iurn
al
-m
g
Diurnal Ethanol PortionVehicle 215 - 2004 Toyota Highlander
Ethanol Portion
10 psi E10 9 psi E07 psi E10
1 32
121
136
196
1 321 321 321 32
9 psi E207 psi E0
198
217213
0000
00
0000
00
335 292
283
Figure 38 ndash Vehicle 215 Diurnal Ethanol Portion
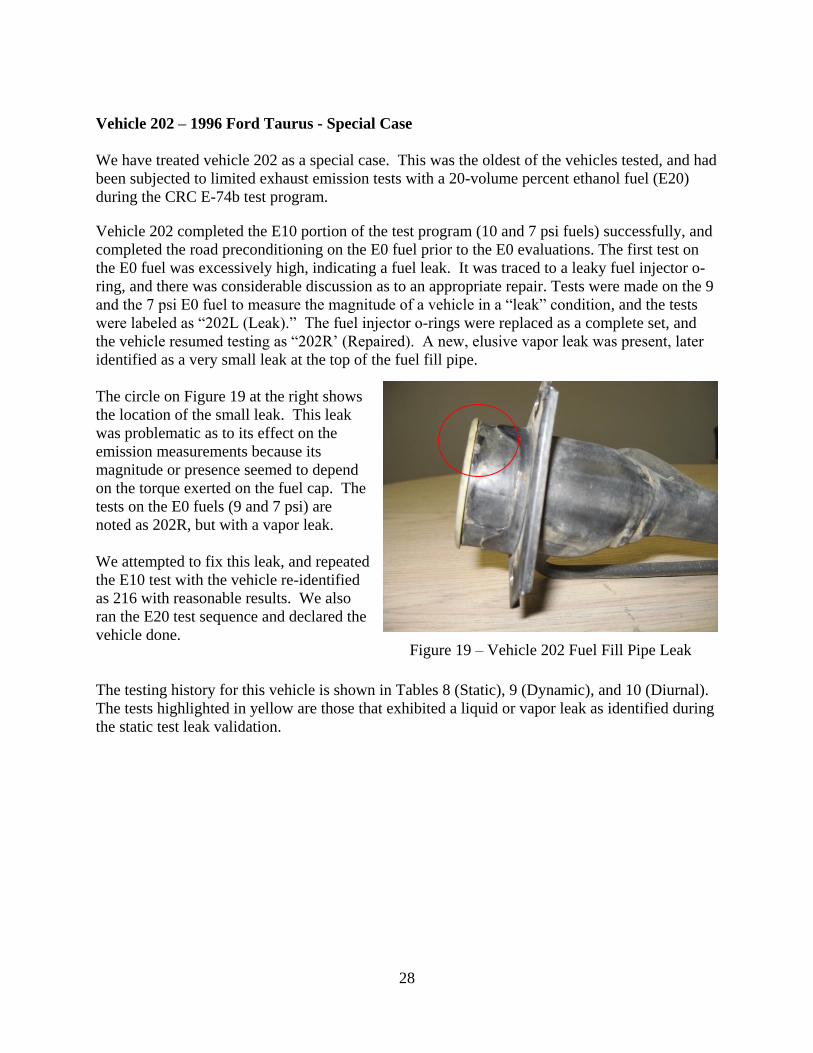
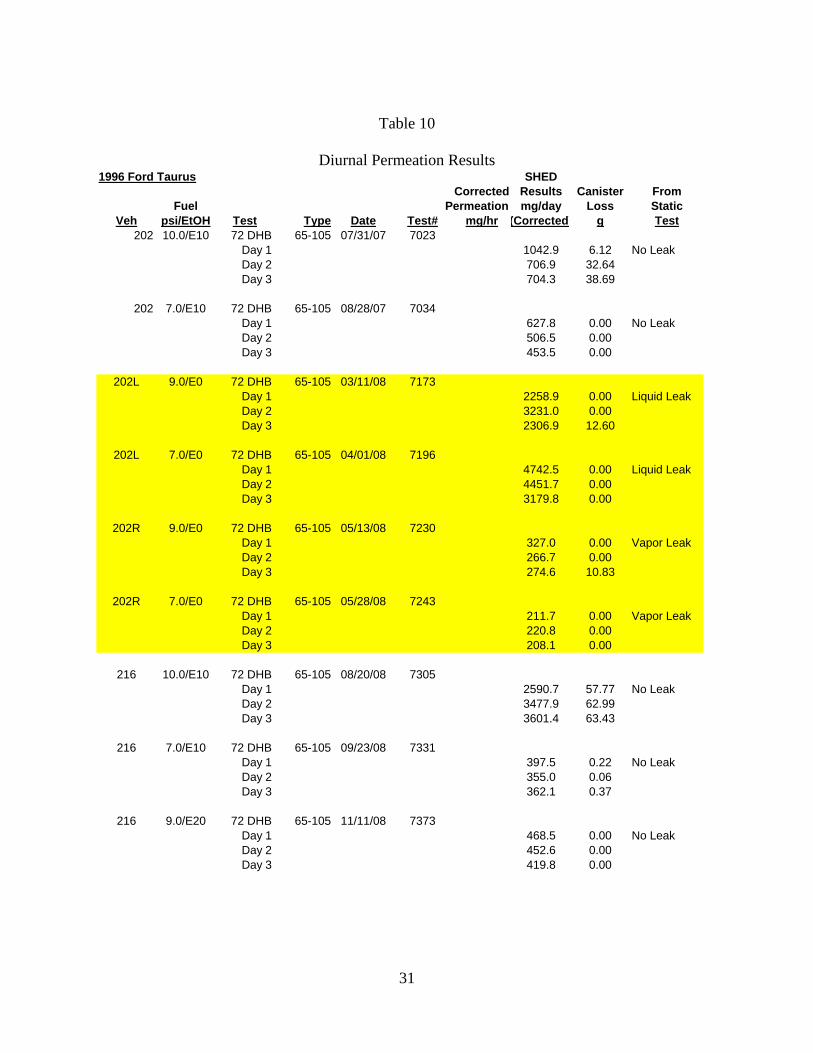
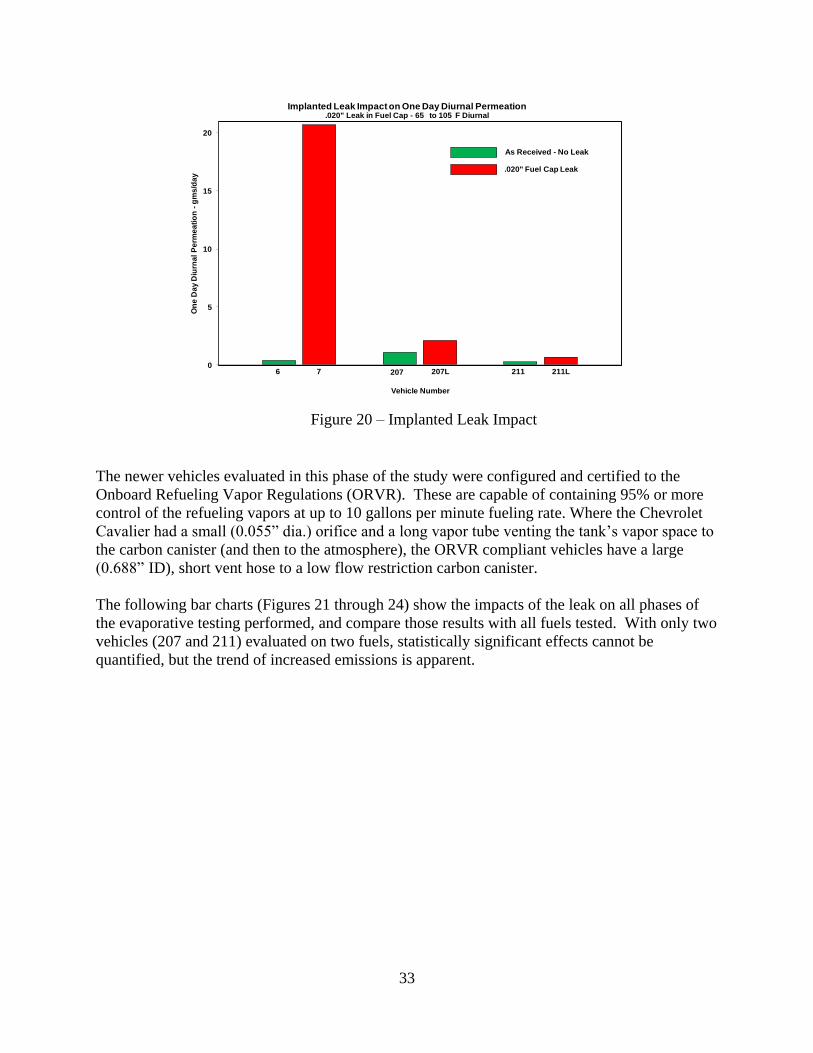
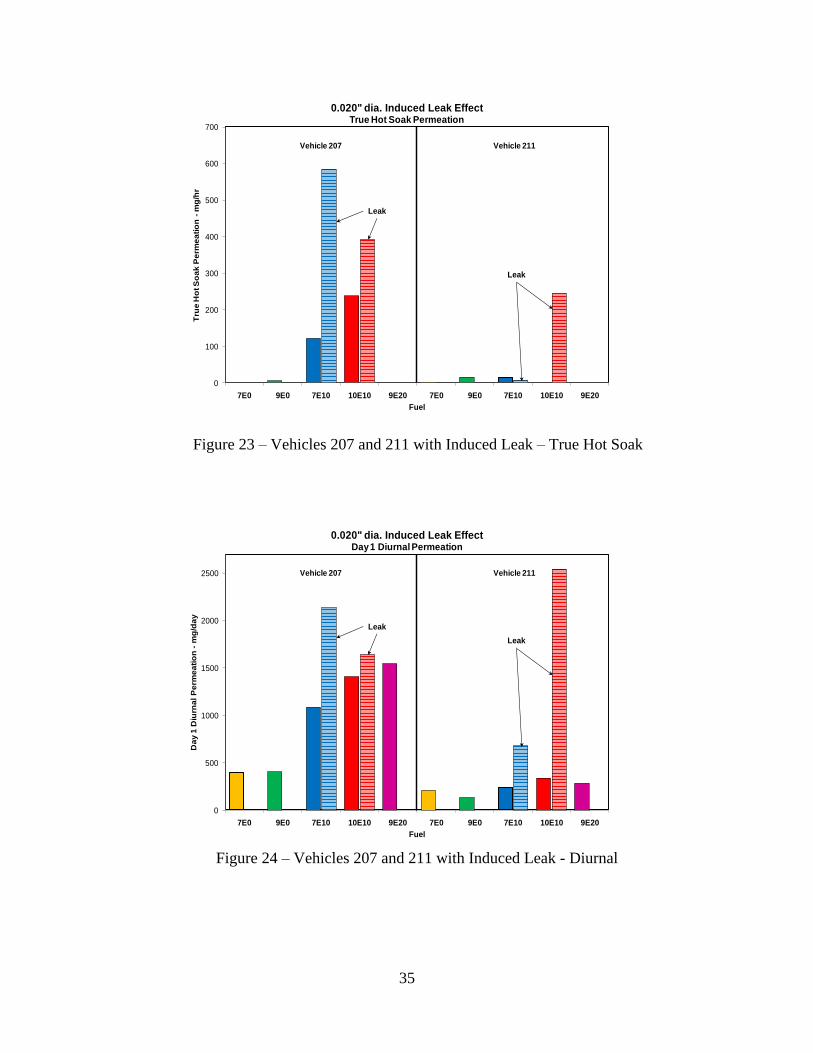

38
Table 12
E0 E10 E20
Inspection Units Fuel 6 Fuel 7 Fuel 4
API Gravity degAPI 602 585 570
Relative Density 6060degF 07382 07447 07508
DVPE psi 701 730 849
Oxygenates--D4815
MTBE vol 000 000 000
ETBE vol 000 000 000
EtOH vol 000 954 2034
O2 wt 000 353 747
Hydrocarbon Composition
Aromatics vol 221 244 108
Olefins vol 80 88 55
Saturates vol 700 573 234
D86 Distillation
IBP degF 974 1040 1022
5 Evaporated degF 1316 1280 1252
10 Evaporated degF 1423 1330 1314
20 Evaporated degF 1564 1410 1413
30 Evaporated degF 1704 1450 1486
40 Evaporated degF 1840 1530 1547
50 Evaporated degF 1975 1950 1596
60 Evaporated degF 2120 2190 1636
70 Evaporated degF 2305 2410 2274
80 Evaporated degF 2588 2710 2695
90 Evaporated degF 3139 3170 3139
95 Evaporated degF 3322 3300 3255
EP degF 3603 3600 3406
Recovery vol 978 978 983
Residue vol 13 10 10
Loss vol 09 12 07
Driveability Index 11199 11015 9898
Data from CRC E-74
CRC E-77-2 Fuel Inspection Results
39
Fuel Units Fuel 6 Fuel 7 Fuel 4
Sulfur Content ppm 29 27 27
Estimated CH Ratio 62090 63323 63252
Est Net Heat of Combustion btulb 18573 18514 18513
Benzene vol 090 100 096
Research Octane Number 932 940 946
Motor Octane Number 838 838 834
(R+M)2 885 889 890
Fuel Units Fuel 6 Fuel 7 Fuel 4
Aromatics vol 2386 2481 2178
Olefins vol 752 892 1074
Saturates vol 6743 5621 4623
Unclassified vol 115 086 015
Ethanol vol 000 920 2111
Benzene vol 089 106 097
CH Ratio 6200 6092 5835
Oxygen wt 0008 1 340 773
Net Heat of Combustion btulb 18703 18016 17160
1 Contains 004 vol MTBE
Fuel Units Fuel 6 Fuel 7 Fuel 4
Oxygen wt 0008 3396 7733
C+H wt 9999 9660 9227
H wt 1389 1362 1350
C wt 8610 8298 7877
Fuel Units 6 7 4
Haltermann D3338 Btulb 18573 18514 18513
Average D3338 Btulb 18579 18514 18491
Oxygen Corrected D3338 Btulb 18579 17860 17103
DHA Btulb 18703 18016 17160
Table 12 (cont)
Suppliers Additional Inspections
Net Heat of Combusion -- Btulb
Carbon Hydrogen and Oxygen
Detailed Hydrocarbon Analysis
40
Vehicle Day 1 Day 2 Day 3
No Fuel Base + Press + Pump RL True HS Perm (Brkthru) Perm (Brkthru) Perm (Brkthru)
E10 - 10 psi 345 --- --- 1278 503 10429 (63) 7069 (348) 7043 (425)
E10 - 7 psi 223 --- --- 994 113 6278 (00) 5065 (00) 4535 (00)
E0 - 9 psi 2229 --- 4921 3870 00 22580 (00) 32310 (00) 23069 (126)
E0 - 7 psi 2991 --- 19896 7269 00 47425 (00) 44517 (00) 31798 (00)
E10 - 10 psi 843 --- --- 3164 04 15479 (310) 17799 (383) 17711 (419)
E10 - 7 psi 664 --- --- 2879 297 12601 (00) 11652 (00) 11653 (00)
E0 - 9 psi 338 --- --- 2492 443 6283 (24) 5810 (136) 5770 (225)
E0 - 7 psi 129 --- --- 2226 187 3672 (00) 2877 (00) 2936 (00)
E20 - 9 psi 553 --- --- 2720 134 11034 (00) 9581 (00) 9812 (00)
E10 - 10 psi 416 --- --- 1916 295 17941 (204) 17309 (346) 17417 (375)
E10 - 7 psi 596 --- --- 2328 719 17834 (00) 17150 (00) 15239 (00)
E0 - 9 psi 195 --- --- 1031 10 4995 (00) 4810 (00) 5072 (26)
E0 - 7 psi 99 --- --- 671 00 3830 (00) 3654 (00) 3670 (00)
E20 - 9 psi 462 --- --- 1697 603 17752 (00) 16900 (00) 16802 (00)
E10 - 10 psi 787 --- --- 8581 2377 14064 (00) 12644 (00) 12237 (00)
E10 - 7 psi 644 --- --- 8122 1222 10865 (00) 8120 (00) 8236 (00)
E0 - 9 psi 325 --- --- 8339 58 4064 (00) 3373 (00) 3080 (00)
E0 - 7 psi 401 --- --- 8425 00 3975 (00) 3026 (00) 2689 (00)
E20 - 9 psi 882 --- --- 10282 00 15480 (00) 13702 (00) 13605 (00)
E10 - 10 psi 976 --- 1209 10012 3929 16449 (00) NA NA
E10 - 7 psi 1468 --- --- 11393 5850 21342 (00) NA NA
E10 - 10 psi 199 --- --- 1383 00 3370 (00) 2268 (191) 2179 (330)
E10 - 7 psi 94 266 --- 563 138 2438 (00) 1838 (00) 1843 (00)
E0 - 9 psi 101 --- --- 837 153 1303 (00) 1158 (129) 1006 (221)
E0 - 7 psi 91 --- --- 1046 07 2071 (00) 1002 (00) 874 (00)
E20 - 9 psi 558 --- --- 4106 00 2840 (00) 2218 (00) 2034 (00)
E10 - 10 psi 551 --- 821 3024 2450 25454 (040) NA NA
E10 - 7 psi 481 --- 1664 2511 62 6783 (00) NA NA
E10 - 10 psi 106 --- --- 1489 00 1243 (00) 879 (00) 1028 (200)
E10 - 7 psi 218 --- --- 2012 00 1848 (00) 1002 (00) 758 (00)
E0 - 9 psi 32 --- --- 1158 04 1005 (00) 708 (00) 574 (00)
E0 - 7 psi 09 --- --- 1845 18 1016 (00) 712 (00) 570 (00)
E20 - 9 psi 47 --- --- 1168 49 1310 (00) 833 (00) 750 (00)
E10 - 10 psi 244 --- --- 1331 574 4920 (00) 8394 (00) 113738 (49)
E10 - 7 psi 239 --- --- 1057 329 5242 (00) 3974 (00) 3944 (00)
E0 - 9 psi 107 --- --- 967 521 4559 (00) 3585 (00) 11017 (00)
E0 - 7 psi 252 --- --- 363 33 4943 (00) 3190 (00) 2815 (00)
E20 - 9 psi 168 --- --- 1394 560 4709 (00) 4400 (00) 7518 (00)
E10 - 10 psi 104 90 --- 719 16 3192 (00) 2602 (00) 2370 (00)
E10 - 7 psi 122 --- --- 979 00 2247 (00) 2317 (00) 2675 (00)
E0 - 9 psi 85 --- --- 811 251 2021 (00) 1659 (2) 1763 (72)
E0 - 7 psi 87 --- --- 797 225 2483 (00) 2941 (00) 2888 (00)
E20 - 9 psi 193 --- --- 1025 00 4168 (00) 4148 (00) 4506 (00)
E10 - 10 psi 324 --- --- 1742 118 25907 (578) 34779 (630) 36014 (643)
E10 - 7 psi 325 --- --- 1683 192 3975 (02) 3550 (01) 3621 (04)
E0 - 9 psi 178 136 --- 1091 254 3270 (00) 2667 (00) 2746 (108)
E0 - 7 psi 204 380 --- 787 00 2117 (00) 2208 (00) 2081 (00)
E20 - 9 psi 204 --- --- 543 74 4685 (00) 4526 (00) 4198 (00)
216
211
2004
Toyota
Camry
XLE
215
2004
Toyota
High-
lander
212
2006
Ford
Taurus
214
2004
Ford
Escape
211L
207L
Static Permeation - mghr Dynamic Perm - mghr
CRC E-77-2 Program Test Results
Diurnal (65ordm to 105ordm) - mgday
202
1996
Taurus
205
2001
Toyota
Corolla
204
1999
Honda
Accord
207
2001
Dodge
Caravan
202L
Table 13
41
Individual Vehicle Diurnal Performance on the Various Fuels
0
1000
2000
3000
4000
5000
6000
0 10 20 30 40 50 60 70
Cu
mu
lati
ve
Pe
rme
ati
on
-m
g
Test Time - hrs
Three Day DiurnalVehicle 204 1999 Honda Accord
10 psi E10
7 psi E10
9 psi E0
7 psi E0
9 psi E20
0
1000
2000
3000
4000
5000
6000
0 10 20 30 40 50 60 70
Cu
mu
lati
ve
Pe
rme
ati
on
-m
g
Test Time - hrs
Three Day DiurnalVehicle 205 - 2001 Toyota Corolla
10 psi E10
7 psi E10
9 psi E0
7 psi E0
9 psi E20
Figure 25 ndash Vehicle 204 Diurnal Performance
Figure 26 ndash Vehicle 205 Diurnal Performance
42
0
500
1000
1500
2000
2500
3000
3500
4000
4500
5000
0 10 20 30 40 50 60 70
Cu
mu
lati
ve
Co
rre
cte
d P
erm
ea
tio
n -
mg
Test Time - hrs
Three Day DiurnalVehicle 207 - 2001 Dodge Caravan
10 psi E10
7 psi E10
9 psi E0
7 psi E0
9 psi E20
0
100
200
300
400
500
600
700
800
900
0 10 20 30 40 50 60 70
Cu
mu
lati
ve
Pe
rme
ati
on
-m
g
Test Time - hrs
Three Day DiurnalVehicle 211 - 2004 Toyota Camry XLE
10 psi E10
7 psi E10
9 psi E0
7 psi E0
9 psi E20
Figure 27 ndash Vehicle 207 Diurnal Performance
Figure 28 ndash Vehicle 211 Diurnal Performance
43
0
50
100
150
200
250
300
350
400
450
500
0 10 20 30 40 50 60 70
Cu
mu
lati
ve
Pe
rme
ati
on
-m
g
Test Time - hrs
Three Day DiurnalVehicle 212 - 2006 Ford Taurus
10 psi E10
7 psi E10
9 psi E0
7 psi E0
9 psi E20
0
500
1000
1500
2000
2500
3000
3500
4000
4500
5000
0 10 20 30 40 50 60 70
Cu
mu
lati
ve
Pe
rme
ati
on
-m
g
Test Time - hrs
Three Day DiurnalVehicle 214 2004 Ford Escape
10 psi E10
7 psi E10
9 psi E0
7 psi E0
9 psi E20
Note The incomplete cumulative results for the 10 psi E10 results resulted from a conflict for the use
of the INNOVA analyzer during the test The INNOVA analyzer is required to correct for the FIDrsquos
ethanol error and the presence of methanol and refrigerant (R-134a) The data was available for the
50+ hour results and the data is valid as shown We have no explanation for the high levels
experienced on the third day of the test No test errors were identified
Figure 29 ndash Vehicle 212 Diurnal Performance
Figure 30 ndash Vehicle 214 Diurnal Performance
44
0
200
400
600
800
1000
1200
1400
1600
0 10 20 30 40 50 60 70
Cu
mu
lati
ve
Pe
rme
ati
on
-m
g
Test Time - hrs
Three Day DiurnalVehicle 215 2004 Toyota Highlander
10 psi E10
7 psi E10
9 psi E0
7 psi E0
9 psi E20
Figure 31 ndash Vehicle 215 Diurnal Performance
45
Table 14
Test Corrected
Vehicle Fuel Total Fuel EtOH R134a Methanol
204 10 psi E10 509899 144040 18298 16754
1999 Honda 7 psi E10 359057 130806 17551 15221
Accord 9 psi E0 178635 13843 18230 9896
7 psi E0 94846 1856 16631 2379
9 psi E20 304271 128408 18261 12143
205 10 psi E10 526659 186599 23354 20895
2001 Toyota 7 psi E10 502229 204246 25990 19198
Corolla 9 psi E0 148775 000 20434 4613
7 psi E0 111536 5489 22408 5619
9 psi E20 514540 212708 25677 19584
207 10 psi E10 389450 196248 12013 30399
2001 Dodge 7 psi E10 272201 114027 11731 19616
Caravan 9 psi E0 105167 1820 12224 15284
7 psi E0 96906 1118 22141 14276
9 psi E20 427882 241488 14268 25432
211 10 psi E10 78164 19733 15159 46970
2004 Toyota 7 psi E10 61190 20211 15929 46525
Camry LE 9 psi E0 34668 1681 14329 42659
7 psi E0 39468 000 16197 57303
9 psi E20 71013 26726 16213 36879
212 10 psi E10 31508 7222 14831 7896
2006 Ford 7 psi E10 36079 10132 15481 3400
Taurus 9 psi E0 22870 2409 15182 3761
7 psi E0 22973 000 15393 4362
9 psi E20 28935 11156 14116 2629
214 10 psi E10 1257887 000 19947 27992
2004 Ford 7 psi E10 131593 24571 16025 8879
Escape 9 psi E0 191611 2940 16487 7213
7 psi E0 109481 5386 80650 3106
9 psi E20 166271 24097 14491 6096
215 10 psi E10 81644 12178 14658 42609
2004 Toyota 7 psi E10 72399 15092 15532 36061
Highlander 9 psi E0 54431 000 14806 25822
7 psi E0 83115 000 14072 26255
9 psi E20 128223 38822 12841 34420
3 Day Diurnal Results
CRC E77-2 Program Diurnal ResultsAll values are in mg
46
0
200
400
600
800
1000
1200
1400
1600
1800
2000
Co
rrecte
d D
aily D
iurn
al
-m
g
Diurnal Ethanol PortionVehicle 204 - 1999 Honda Accord
Ethanol Portion
10 psi E10 9 psi E07 psi E10
1 32
315
341368
383
264273
1 321 321 321 32
9 psi E207 psi E0
1122097
39
0510
442
405412
Figure 32 ndash Vehicle 204 Diurnal Ethanol Portion
0
200
400
600
800
1000
1200
1400
1600
1800
2000
Co
rrecte
d D
aily D
iurn
al
-m
g
Diurnal Ethanol PortionVehicle 205 - 2001 Toyota Corolla
Ethanol Portion
10 psi E10 9 psi E07 psi E10
1 32
359
406
382
431355349
1 321 321 321 32
9 psi E207 psi E0
0 00
712649
406
420414
Figure 33 ndash Vehicle 205 Diurnal Ethanol Portion
47
0
200
400
600
800
1000
1200
1400
1600C
orr
ecte
d D
aily D
iurn
al
-m
g
Diurnal Ethanol PortionVehicle 207 - 2001 Dodge Caravan
Ethanol Portion
10 psi E10 9 psi E07 psi E10
1 32
488
442408
409
490535
1 321 321 321 32
9 psi E207 psi E0
00
1144
27
0101
556
587552
Figure 34 ndash Vehicle 207 Diurnal Ethanol Portion
0
50
100
150
200
250
300
350
400
Co
rrecte
d D
aily D
iurn
al
-m
g
Diurnal Ethanol PortionVehicle 211 - 2004 Toyota Camry XLE
Ethanol Portion
10 psi E10 9 psi E07 psi E10
1 32
264
242245
1 321 321 321 32
9 psi E207 psi E0
329
306356
00
73
64
00
00
00
325
431
370
Figure 35 ndash Vehicle 211 Diurnal Ethanol Portion
48
0
20
40
60
80
100
120
140
160
180
200C
orr
ecte
d D
aily D
iurn
al
-m
g
Diurnal Ethanol PortionVehicle 212 - 2006 Ford Taurus
Ethanol Portion
10 psi E10 9 psi E07 psi E10
1 32
216
170
316
1 321 321 321 32
9 psi E207 psi E0
194
288
436 102
105
85
00
00
00476
529
243
Figure 36 ndash Vehicle 212 Diurnal Ethanol Portion
0
200
400
600
800
1000
1200
Co
rrecte
d D
aily D
iurn
al
-m
g
Diurnal Ethanol PortionVehicle 214 - 2004 Ford Escape
Ethanol Portion
10 psi E10 9 psi E07 psi E10
1 32
00
1 321 321 321 32
9 psi E207 psi E0
201
202152
38
05
19
56
1469
103
171188
143
67
11275
Figure 37 ndash Vehicle 214 Diurnal Ethanol Portion
49
0
50
100
150
200
250
300
350
400
450
500C
orr
ecte
d D
aily D
iurn
al
-m
g
Diurnal Ethanol PortionVehicle 215 - 2004 Toyota Highlander
Ethanol Portion
10 psi E10 9 psi E07 psi E10
1 32
121
136
196
1 321 321 321 32
9 psi E207 psi E0
198
217213
0000
00
0000
00
335 292
283
Figure 38 ndash Vehicle 215 Diurnal Ethanol Portion

39
Fuel Units Fuel 6 Fuel 7 Fuel 4
Sulfur Content ppm 29 27 27
Estimated CH Ratio 62090 63323 63252
Est Net Heat of Combustion btulb 18573 18514 18513
Benzene vol 090 100 096
Research Octane Number 932 940 946
Motor Octane Number 838 838 834
(R+M)2 885 889 890
Fuel Units Fuel 6 Fuel 7 Fuel 4
Aromatics vol 2386 2481 2178
Olefins vol 752 892 1074
Saturates vol 6743 5621 4623
Unclassified vol 115 086 015
Ethanol vol 000 920 2111
Benzene vol 089 106 097
CH Ratio 6200 6092 5835
Oxygen wt 0008 1 340 773
Net Heat of Combustion btulb 18703 18016 17160
1 Contains 004 vol MTBE
Fuel Units Fuel 6 Fuel 7 Fuel 4
Oxygen wt 0008 3396 7733
C+H wt 9999 9660 9227
H wt 1389 1362 1350
C wt 8610 8298 7877
Fuel Units 6 7 4
Haltermann D3338 Btulb 18573 18514 18513
Average D3338 Btulb 18579 18514 18491
Oxygen Corrected D3338 Btulb 18579 17860 17103
DHA Btulb 18703 18016 17160
Table 12 (cont)
Suppliers Additional Inspections
Net Heat of Combusion -- Btulb
Carbon Hydrogen and Oxygen
Detailed Hydrocarbon Analysis
40
Vehicle Day 1 Day 2 Day 3
No Fuel Base + Press + Pump RL True HS Perm (Brkthru) Perm (Brkthru) Perm (Brkthru)
E10 - 10 psi 345 --- --- 1278 503 10429 (63) 7069 (348) 7043 (425)
E10 - 7 psi 223 --- --- 994 113 6278 (00) 5065 (00) 4535 (00)
E0 - 9 psi 2229 --- 4921 3870 00 22580 (00) 32310 (00) 23069 (126)
E0 - 7 psi 2991 --- 19896 7269 00 47425 (00) 44517 (00) 31798 (00)
E10 - 10 psi 843 --- --- 3164 04 15479 (310) 17799 (383) 17711 (419)
E10 - 7 psi 664 --- --- 2879 297 12601 (00) 11652 (00) 11653 (00)
E0 - 9 psi 338 --- --- 2492 443 6283 (24) 5810 (136) 5770 (225)
E0 - 7 psi 129 --- --- 2226 187 3672 (00) 2877 (00) 2936 (00)
E20 - 9 psi 553 --- --- 2720 134 11034 (00) 9581 (00) 9812 (00)
E10 - 10 psi 416 --- --- 1916 295 17941 (204) 17309 (346) 17417 (375)
E10 - 7 psi 596 --- --- 2328 719 17834 (00) 17150 (00) 15239 (00)
E0 - 9 psi 195 --- --- 1031 10 4995 (00) 4810 (00) 5072 (26)
E0 - 7 psi 99 --- --- 671 00 3830 (00) 3654 (00) 3670 (00)
E20 - 9 psi 462 --- --- 1697 603 17752 (00) 16900 (00) 16802 (00)
E10 - 10 psi 787 --- --- 8581 2377 14064 (00) 12644 (00) 12237 (00)
E10 - 7 psi 644 --- --- 8122 1222 10865 (00) 8120 (00) 8236 (00)
E0 - 9 psi 325 --- --- 8339 58 4064 (00) 3373 (00) 3080 (00)
E0 - 7 psi 401 --- --- 8425 00 3975 (00) 3026 (00) 2689 (00)
E20 - 9 psi 882 --- --- 10282 00 15480 (00) 13702 (00) 13605 (00)
E10 - 10 psi 976 --- 1209 10012 3929 16449 (00) NA NA
E10 - 7 psi 1468 --- --- 11393 5850 21342 (00) NA NA
E10 - 10 psi 199 --- --- 1383 00 3370 (00) 2268 (191) 2179 (330)
E10 - 7 psi 94 266 --- 563 138 2438 (00) 1838 (00) 1843 (00)
E0 - 9 psi 101 --- --- 837 153 1303 (00) 1158 (129) 1006 (221)
E0 - 7 psi 91 --- --- 1046 07 2071 (00) 1002 (00) 874 (00)
E20 - 9 psi 558 --- --- 4106 00 2840 (00) 2218 (00) 2034 (00)
E10 - 10 psi 551 --- 821 3024 2450 25454 (040) NA NA
E10 - 7 psi 481 --- 1664 2511 62 6783 (00) NA NA
E10 - 10 psi 106 --- --- 1489 00 1243 (00) 879 (00) 1028 (200)
E10 - 7 psi 218 --- --- 2012 00 1848 (00) 1002 (00) 758 (00)
E0 - 9 psi 32 --- --- 1158 04 1005 (00) 708 (00) 574 (00)
E0 - 7 psi 09 --- --- 1845 18 1016 (00) 712 (00) 570 (00)
E20 - 9 psi 47 --- --- 1168 49 1310 (00) 833 (00) 750 (00)
E10 - 10 psi 244 --- --- 1331 574 4920 (00) 8394 (00) 113738 (49)
E10 - 7 psi 239 --- --- 1057 329 5242 (00) 3974 (00) 3944 (00)
E0 - 9 psi 107 --- --- 967 521 4559 (00) 3585 (00) 11017 (00)
E0 - 7 psi 252 --- --- 363 33 4943 (00) 3190 (00) 2815 (00)
E20 - 9 psi 168 --- --- 1394 560 4709 (00) 4400 (00) 7518 (00)
E10 - 10 psi 104 90 --- 719 16 3192 (00) 2602 (00) 2370 (00)
E10 - 7 psi 122 --- --- 979 00 2247 (00) 2317 (00) 2675 (00)
E0 - 9 psi 85 --- --- 811 251 2021 (00) 1659 (2) 1763 (72)
E0 - 7 psi 87 --- --- 797 225 2483 (00) 2941 (00) 2888 (00)
E20 - 9 psi 193 --- --- 1025 00 4168 (00) 4148 (00) 4506 (00)
E10 - 10 psi 324 --- --- 1742 118 25907 (578) 34779 (630) 36014 (643)
E10 - 7 psi 325 --- --- 1683 192 3975 (02) 3550 (01) 3621 (04)
E0 - 9 psi 178 136 --- 1091 254 3270 (00) 2667 (00) 2746 (108)
E0 - 7 psi 204 380 --- 787 00 2117 (00) 2208 (00) 2081 (00)
E20 - 9 psi 204 --- --- 543 74 4685 (00) 4526 (00) 4198 (00)
216
211
2004
Toyota
Camry
XLE
215
2004
Toyota
High-
lander
212
2006
Ford
Taurus
214
2004
Ford
Escape
211L
207L
Static Permeation - mghr Dynamic Perm - mghr
CRC E-77-2 Program Test Results
Diurnal (65ordm to 105ordm) - mgday
202
1996
Taurus
205
2001
Toyota
Corolla
204
1999
Honda
Accord
207
2001
Dodge
Caravan
202L
Table 13
41
Individual Vehicle Diurnal Performance on the Various Fuels
0
1000
2000
3000
4000
5000
6000
0 10 20 30 40 50 60 70
Cu
mu
lati
ve
Pe
rme
ati
on
-m
g
Test Time - hrs
Three Day DiurnalVehicle 204 1999 Honda Accord
10 psi E10
7 psi E10
9 psi E0
7 psi E0
9 psi E20
0
1000
2000
3000
4000
5000
6000
0 10 20 30 40 50 60 70
Cu
mu
lati
ve
Pe
rme
ati
on
-m
g
Test Time - hrs
Three Day DiurnalVehicle 205 - 2001 Toyota Corolla
10 psi E10
7 psi E10
9 psi E0
7 psi E0
9 psi E20
Figure 25 ndash Vehicle 204 Diurnal Performance
Figure 26 ndash Vehicle 205 Diurnal Performance
42
0
500
1000
1500
2000
2500
3000
3500
4000
4500
5000
0 10 20 30 40 50 60 70
Cu
mu
lati
ve
Co
rre
cte
d P
erm
ea
tio
n -
mg
Test Time - hrs
Three Day DiurnalVehicle 207 - 2001 Dodge Caravan
10 psi E10
7 psi E10
9 psi E0
7 psi E0
9 psi E20
0
100
200
300
400
500
600
700
800
900
0 10 20 30 40 50 60 70
Cu
mu
lati
ve
Pe
rme
ati
on
-m
g
Test Time - hrs
Three Day DiurnalVehicle 211 - 2004 Toyota Camry XLE
10 psi E10
7 psi E10
9 psi E0
7 psi E0
9 psi E20
Figure 27 ndash Vehicle 207 Diurnal Performance
Figure 28 ndash Vehicle 211 Diurnal Performance
43
0
50
100
150
200
250
300
350
400
450
500
0 10 20 30 40 50 60 70
Cu
mu
lati
ve
Pe
rme
ati
on
-m
g
Test Time - hrs
Three Day DiurnalVehicle 212 - 2006 Ford Taurus
10 psi E10
7 psi E10
9 psi E0
7 psi E0
9 psi E20
0
500
1000
1500
2000
2500
3000
3500
4000
4500
5000
0 10 20 30 40 50 60 70
Cu
mu
lati
ve
Pe
rme
ati
on
-m
g
Test Time - hrs
Three Day DiurnalVehicle 214 2004 Ford Escape
10 psi E10
7 psi E10
9 psi E0
7 psi E0
9 psi E20
Note The incomplete cumulative results for the 10 psi E10 results resulted from a conflict for the use
of the INNOVA analyzer during the test The INNOVA analyzer is required to correct for the FIDrsquos
ethanol error and the presence of methanol and refrigerant (R-134a) The data was available for the
50+ hour results and the data is valid as shown We have no explanation for the high levels
experienced on the third day of the test No test errors were identified
Figure 29 ndash Vehicle 212 Diurnal Performance
Figure 30 ndash Vehicle 214 Diurnal Performance
44
0
200
400
600
800
1000
1200
1400
1600
0 10 20 30 40 50 60 70
Cu
mu
lati
ve
Pe
rme
ati
on
-m
g
Test Time - hrs
Three Day DiurnalVehicle 215 2004 Toyota Highlander
10 psi E10
7 psi E10
9 psi E0
7 psi E0
9 psi E20
Figure 31 ndash Vehicle 215 Diurnal Performance
45
Table 14
Test Corrected
Vehicle Fuel Total Fuel EtOH R134a Methanol
204 10 psi E10 509899 144040 18298 16754
1999 Honda 7 psi E10 359057 130806 17551 15221
Accord 9 psi E0 178635 13843 18230 9896
7 psi E0 94846 1856 16631 2379
9 psi E20 304271 128408 18261 12143
205 10 psi E10 526659 186599 23354 20895
2001 Toyota 7 psi E10 502229 204246 25990 19198
Corolla 9 psi E0 148775 000 20434 4613
7 psi E0 111536 5489 22408 5619
9 psi E20 514540 212708 25677 19584
207 10 psi E10 389450 196248 12013 30399
2001 Dodge 7 psi E10 272201 114027 11731 19616
Caravan 9 psi E0 105167 1820 12224 15284
7 psi E0 96906 1118 22141 14276
9 psi E20 427882 241488 14268 25432
211 10 psi E10 78164 19733 15159 46970
2004 Toyota 7 psi E10 61190 20211 15929 46525
Camry LE 9 psi E0 34668 1681 14329 42659
7 psi E0 39468 000 16197 57303
9 psi E20 71013 26726 16213 36879
212 10 psi E10 31508 7222 14831 7896
2006 Ford 7 psi E10 36079 10132 15481 3400
Taurus 9 psi E0 22870 2409 15182 3761
7 psi E0 22973 000 15393 4362
9 psi E20 28935 11156 14116 2629
214 10 psi E10 1257887 000 19947 27992
2004 Ford 7 psi E10 131593 24571 16025 8879
Escape 9 psi E0 191611 2940 16487 7213
7 psi E0 109481 5386 80650 3106
9 psi E20 166271 24097 14491 6096
215 10 psi E10 81644 12178 14658 42609
2004 Toyota 7 psi E10 72399 15092 15532 36061
Highlander 9 psi E0 54431 000 14806 25822
7 psi E0 83115 000 14072 26255
9 psi E20 128223 38822 12841 34420
3 Day Diurnal Results
CRC E77-2 Program Diurnal ResultsAll values are in mg
46
0
200
400
600
800
1000
1200
1400
1600
1800
2000
Co
rrecte
d D
aily D
iurn
al
-m
g
Diurnal Ethanol PortionVehicle 204 - 1999 Honda Accord
Ethanol Portion
10 psi E10 9 psi E07 psi E10
1 32
315
341368
383
264273
1 321 321 321 32
9 psi E207 psi E0
1122097
39
0510
442
405412
Figure 32 ndash Vehicle 204 Diurnal Ethanol Portion
0
200
400
600
800
1000
1200
1400
1600
1800
2000
Co
rrecte
d D
aily D
iurn
al
-m
g
Diurnal Ethanol PortionVehicle 205 - 2001 Toyota Corolla
Ethanol Portion
10 psi E10 9 psi E07 psi E10
1 32
359
406
382
431355349
1 321 321 321 32
9 psi E207 psi E0
0 00
712649
406
420414
Figure 33 ndash Vehicle 205 Diurnal Ethanol Portion
47
0
200
400
600
800
1000
1200
1400
1600C
orr
ecte
d D
aily D
iurn
al
-m
g
Diurnal Ethanol PortionVehicle 207 - 2001 Dodge Caravan
Ethanol Portion
10 psi E10 9 psi E07 psi E10
1 32
488
442408
409
490535
1 321 321 321 32
9 psi E207 psi E0
00
1144
27
0101
556
587552
Figure 34 ndash Vehicle 207 Diurnal Ethanol Portion
0
50
100
150
200
250
300
350
400
Co
rrecte
d D
aily D
iurn
al
-m
g
Diurnal Ethanol PortionVehicle 211 - 2004 Toyota Camry XLE
Ethanol Portion
10 psi E10 9 psi E07 psi E10
1 32
264
242245
1 321 321 321 32
9 psi E207 psi E0
329
306356
00
73
64
00
00
00
325
431
370
Figure 35 ndash Vehicle 211 Diurnal Ethanol Portion
48
0
20
40
60
80
100
120
140
160
180
200C
orr
ecte
d D
aily D
iurn
al
-m
g
Diurnal Ethanol PortionVehicle 212 - 2006 Ford Taurus
Ethanol Portion
10 psi E10 9 psi E07 psi E10
1 32
216
170
316
1 321 321 321 32
9 psi E207 psi E0
194
288
436 102
105
85
00
00
00476
529
243
Figure 36 ndash Vehicle 212 Diurnal Ethanol Portion
0
200
400
600
800
1000
1200
Co
rrecte
d D
aily D
iurn
al
-m
g
Diurnal Ethanol PortionVehicle 214 - 2004 Ford Escape
Ethanol Portion
10 psi E10 9 psi E07 psi E10
1 32
00
1 321 321 321 32
9 psi E207 psi E0
201
202152
38
05
19
56
1469
103
171188
143
67
11275
Figure 37 ndash Vehicle 214 Diurnal Ethanol Portion
49
0
50
100
150
200
250
300
350
400
450
500C
orr
ecte
d D
aily D
iurn
al
-m
g
Diurnal Ethanol PortionVehicle 215 - 2004 Toyota Highlander
Ethanol Portion
10 psi E10 9 psi E07 psi E10
1 32
121
136
196
1 321 321 321 32
9 psi E207 psi E0
198
217213
0000
00
0000
00
335 292
283
Figure 38 ndash Vehicle 215 Diurnal Ethanol Portion

40
Vehicle Day 1 Day 2 Day 3
No Fuel Base + Press + Pump RL True HS Perm (Brkthru) Perm (Brkthru) Perm (Brkthru)
E10 - 10 psi 345 --- --- 1278 503 10429 (63) 7069 (348) 7043 (425)
E10 - 7 psi 223 --- --- 994 113 6278 (00) 5065 (00) 4535 (00)
E0 - 9 psi 2229 --- 4921 3870 00 22580 (00) 32310 (00) 23069 (126)
E0 - 7 psi 2991 --- 19896 7269 00 47425 (00) 44517 (00) 31798 (00)
E10 - 10 psi 843 --- --- 3164 04 15479 (310) 17799 (383) 17711 (419)
E10 - 7 psi 664 --- --- 2879 297 12601 (00) 11652 (00) 11653 (00)
E0 - 9 psi 338 --- --- 2492 443 6283 (24) 5810 (136) 5770 (225)
E0 - 7 psi 129 --- --- 2226 187 3672 (00) 2877 (00) 2936 (00)
E20 - 9 psi 553 --- --- 2720 134 11034 (00) 9581 (00) 9812 (00)
E10 - 10 psi 416 --- --- 1916 295 17941 (204) 17309 (346) 17417 (375)
E10 - 7 psi 596 --- --- 2328 719 17834 (00) 17150 (00) 15239 (00)
E0 - 9 psi 195 --- --- 1031 10 4995 (00) 4810 (00) 5072 (26)
E0 - 7 psi 99 --- --- 671 00 3830 (00) 3654 (00) 3670 (00)
E20 - 9 psi 462 --- --- 1697 603 17752 (00) 16900 (00) 16802 (00)
E10 - 10 psi 787 --- --- 8581 2377 14064 (00) 12644 (00) 12237 (00)
E10 - 7 psi 644 --- --- 8122 1222 10865 (00) 8120 (00) 8236 (00)
E0 - 9 psi 325 --- --- 8339 58 4064 (00) 3373 (00) 3080 (00)
E0 - 7 psi 401 --- --- 8425 00 3975 (00) 3026 (00) 2689 (00)
E20 - 9 psi 882 --- --- 10282 00 15480 (00) 13702 (00) 13605 (00)
E10 - 10 psi 976 --- 1209 10012 3929 16449 (00) NA NA
E10 - 7 psi 1468 --- --- 11393 5850 21342 (00) NA NA
E10 - 10 psi 199 --- --- 1383 00 3370 (00) 2268 (191) 2179 (330)
E10 - 7 psi 94 266 --- 563 138 2438 (00) 1838 (00) 1843 (00)
E0 - 9 psi 101 --- --- 837 153 1303 (00) 1158 (129) 1006 (221)
E0 - 7 psi 91 --- --- 1046 07 2071 (00) 1002 (00) 874 (00)
E20 - 9 psi 558 --- --- 4106 00 2840 (00) 2218 (00) 2034 (00)
E10 - 10 psi 551 --- 821 3024 2450 25454 (040) NA NA
E10 - 7 psi 481 --- 1664 2511 62 6783 (00) NA NA
E10 - 10 psi 106 --- --- 1489 00 1243 (00) 879 (00) 1028 (200)
E10 - 7 psi 218 --- --- 2012 00 1848 (00) 1002 (00) 758 (00)
E0 - 9 psi 32 --- --- 1158 04 1005 (00) 708 (00) 574 (00)
E0 - 7 psi 09 --- --- 1845 18 1016 (00) 712 (00) 570 (00)
E20 - 9 psi 47 --- --- 1168 49 1310 (00) 833 (00) 750 (00)
E10 - 10 psi 244 --- --- 1331 574 4920 (00) 8394 (00) 113738 (49)
E10 - 7 psi 239 --- --- 1057 329 5242 (00) 3974 (00) 3944 (00)
E0 - 9 psi 107 --- --- 967 521 4559 (00) 3585 (00) 11017 (00)
E0 - 7 psi 252 --- --- 363 33 4943 (00) 3190 (00) 2815 (00)
E20 - 9 psi 168 --- --- 1394 560 4709 (00) 4400 (00) 7518 (00)
E10 - 10 psi 104 90 --- 719 16 3192 (00) 2602 (00) 2370 (00)
E10 - 7 psi 122 --- --- 979 00 2247 (00) 2317 (00) 2675 (00)
E0 - 9 psi 85 --- --- 811 251 2021 (00) 1659 (2) 1763 (72)
E0 - 7 psi 87 --- --- 797 225 2483 (00) 2941 (00) 2888 (00)
E20 - 9 psi 193 --- --- 1025 00 4168 (00) 4148 (00) 4506 (00)
E10 - 10 psi 324 --- --- 1742 118 25907 (578) 34779 (630) 36014 (643)
E10 - 7 psi 325 --- --- 1683 192 3975 (02) 3550 (01) 3621 (04)
E0 - 9 psi 178 136 --- 1091 254 3270 (00) 2667 (00) 2746 (108)
E0 - 7 psi 204 380 --- 787 00 2117 (00) 2208 (00) 2081 (00)
E20 - 9 psi 204 --- --- 543 74 4685 (00) 4526 (00) 4198 (00)
216
211
2004
Toyota
Camry
XLE
215
2004
Toyota
High-
lander
212
2006
Ford
Taurus
214
2004
Ford
Escape
211L
207L
Static Permeation - mghr Dynamic Perm - mghr
CRC E-77-2 Program Test Results
Diurnal (65ordm to 105ordm) - mgday
202
1996
Taurus
205
2001
Toyota
Corolla
204
1999
Honda
Accord
207
2001
Dodge
Caravan
202L
Table 13
41
Individual Vehicle Diurnal Performance on the Various Fuels
0
1000
2000
3000
4000
5000
6000
0 10 20 30 40 50 60 70
Cu
mu
lati
ve
Pe
rme
ati
on
-m
g
Test Time - hrs
Three Day DiurnalVehicle 204 1999 Honda Accord
10 psi E10
7 psi E10
9 psi E0
7 psi E0
9 psi E20
0
1000
2000
3000
4000
5000
6000
0 10 20 30 40 50 60 70
Cu
mu
lati
ve
Pe
rme
ati
on
-m
g
Test Time - hrs
Three Day DiurnalVehicle 205 - 2001 Toyota Corolla
10 psi E10
7 psi E10
9 psi E0
7 psi E0
9 psi E20
Figure 25 ndash Vehicle 204 Diurnal Performance
Figure 26 ndash Vehicle 205 Diurnal Performance
42
0
500
1000
1500
2000
2500
3000
3500
4000
4500
5000
0 10 20 30 40 50 60 70
Cu
mu
lati
ve
Co
rre
cte
d P
erm
ea
tio
n -
mg
Test Time - hrs
Three Day DiurnalVehicle 207 - 2001 Dodge Caravan
10 psi E10
7 psi E10
9 psi E0
7 psi E0
9 psi E20
0
100
200
300
400
500
600
700
800
900
0 10 20 30 40 50 60 70
Cu
mu
lati
ve
Pe
rme
ati
on
-m
g
Test Time - hrs
Three Day DiurnalVehicle 211 - 2004 Toyota Camry XLE
10 psi E10
7 psi E10
9 psi E0
7 psi E0
9 psi E20
Figure 27 ndash Vehicle 207 Diurnal Performance
Figure 28 ndash Vehicle 211 Diurnal Performance
43
0
50
100
150
200
250
300
350
400
450
500
0 10 20 30 40 50 60 70
Cu
mu
lati
ve
Pe
rme
ati
on
-m
g
Test Time - hrs
Three Day DiurnalVehicle 212 - 2006 Ford Taurus
10 psi E10
7 psi E10
9 psi E0
7 psi E0
9 psi E20
0
500
1000
1500
2000
2500
3000
3500
4000
4500
5000
0 10 20 30 40 50 60 70
Cu
mu
lati
ve
Pe
rme
ati
on
-m
g
Test Time - hrs
Three Day DiurnalVehicle 214 2004 Ford Escape
10 psi E10
7 psi E10
9 psi E0
7 psi E0
9 psi E20
Note The incomplete cumulative results for the 10 psi E10 results resulted from a conflict for the use
of the INNOVA analyzer during the test The INNOVA analyzer is required to correct for the FIDrsquos
ethanol error and the presence of methanol and refrigerant (R-134a) The data was available for the
50+ hour results and the data is valid as shown We have no explanation for the high levels
experienced on the third day of the test No test errors were identified
Figure 29 ndash Vehicle 212 Diurnal Performance
Figure 30 ndash Vehicle 214 Diurnal Performance
44
0
200
400
600
800
1000
1200
1400
1600
0 10 20 30 40 50 60 70
Cu
mu
lati
ve
Pe
rme
ati
on
-m
g
Test Time - hrs
Three Day DiurnalVehicle 215 2004 Toyota Highlander
10 psi E10
7 psi E10
9 psi E0
7 psi E0
9 psi E20
Figure 31 ndash Vehicle 215 Diurnal Performance
45
Table 14
Test Corrected
Vehicle Fuel Total Fuel EtOH R134a Methanol
204 10 psi E10 509899 144040 18298 16754
1999 Honda 7 psi E10 359057 130806 17551 15221
Accord 9 psi E0 178635 13843 18230 9896
7 psi E0 94846 1856 16631 2379
9 psi E20 304271 128408 18261 12143
205 10 psi E10 526659 186599 23354 20895
2001 Toyota 7 psi E10 502229 204246 25990 19198
Corolla 9 psi E0 148775 000 20434 4613
7 psi E0 111536 5489 22408 5619
9 psi E20 514540 212708 25677 19584
207 10 psi E10 389450 196248 12013 30399
2001 Dodge 7 psi E10 272201 114027 11731 19616
Caravan 9 psi E0 105167 1820 12224 15284
7 psi E0 96906 1118 22141 14276
9 psi E20 427882 241488 14268 25432
211 10 psi E10 78164 19733 15159 46970
2004 Toyota 7 psi E10 61190 20211 15929 46525
Camry LE 9 psi E0 34668 1681 14329 42659
7 psi E0 39468 000 16197 57303
9 psi E20 71013 26726 16213 36879
212 10 psi E10 31508 7222 14831 7896
2006 Ford 7 psi E10 36079 10132 15481 3400
Taurus 9 psi E0 22870 2409 15182 3761
7 psi E0 22973 000 15393 4362
9 psi E20 28935 11156 14116 2629
214 10 psi E10 1257887 000 19947 27992
2004 Ford 7 psi E10 131593 24571 16025 8879
Escape 9 psi E0 191611 2940 16487 7213
7 psi E0 109481 5386 80650 3106
9 psi E20 166271 24097 14491 6096
215 10 psi E10 81644 12178 14658 42609
2004 Toyota 7 psi E10 72399 15092 15532 36061
Highlander 9 psi E0 54431 000 14806 25822
7 psi E0 83115 000 14072 26255
9 psi E20 128223 38822 12841 34420
3 Day Diurnal Results
CRC E77-2 Program Diurnal ResultsAll values are in mg
46
0
200
400
600
800
1000
1200
1400
1600
1800
2000
Co
rrecte
d D
aily D
iurn
al
-m
g
Diurnal Ethanol PortionVehicle 204 - 1999 Honda Accord
Ethanol Portion
10 psi E10 9 psi E07 psi E10
1 32
315
341368
383
264273
1 321 321 321 32
9 psi E207 psi E0
1122097
39
0510
442
405412
Figure 32 ndash Vehicle 204 Diurnal Ethanol Portion
0
200
400
600
800
1000
1200
1400
1600
1800
2000
Co
rrecte
d D
aily D
iurn
al
-m
g
Diurnal Ethanol PortionVehicle 205 - 2001 Toyota Corolla
Ethanol Portion
10 psi E10 9 psi E07 psi E10
1 32
359
406
382
431355349
1 321 321 321 32
9 psi E207 psi E0
0 00
712649
406
420414
Figure 33 ndash Vehicle 205 Diurnal Ethanol Portion
47
0
200
400
600
800
1000
1200
1400
1600C
orr
ecte
d D
aily D
iurn
al
-m
g
Diurnal Ethanol PortionVehicle 207 - 2001 Dodge Caravan
Ethanol Portion
10 psi E10 9 psi E07 psi E10
1 32
488
442408
409
490535
1 321 321 321 32
9 psi E207 psi E0
00
1144
27
0101
556
587552
Figure 34 ndash Vehicle 207 Diurnal Ethanol Portion
0
50
100
150
200
250
300
350
400
Co
rrecte
d D
aily D
iurn
al
-m
g
Diurnal Ethanol PortionVehicle 211 - 2004 Toyota Camry XLE
Ethanol Portion
10 psi E10 9 psi E07 psi E10
1 32
264
242245
1 321 321 321 32
9 psi E207 psi E0
329
306356
00
73
64
00
00
00
325
431
370
Figure 35 ndash Vehicle 211 Diurnal Ethanol Portion
48
0
20
40
60
80
100
120
140
160
180
200C
orr
ecte
d D
aily D
iurn
al
-m
g
Diurnal Ethanol PortionVehicle 212 - 2006 Ford Taurus
Ethanol Portion
10 psi E10 9 psi E07 psi E10
1 32
216
170
316
1 321 321 321 32
9 psi E207 psi E0
194
288
436 102
105
85
00
00
00476
529
243
Figure 36 ndash Vehicle 212 Diurnal Ethanol Portion
0
200
400
600
800
1000
1200
Co
rrecte
d D
aily D
iurn
al
-m
g
Diurnal Ethanol PortionVehicle 214 - 2004 Ford Escape
Ethanol Portion
10 psi E10 9 psi E07 psi E10
1 32
00
1 321 321 321 32
9 psi E207 psi E0
201
202152
38
05
19
56
1469
103
171188
143
67
11275
Figure 37 ndash Vehicle 214 Diurnal Ethanol Portion
49
0
50
100
150
200
250
300
350
400
450
500C
orr
ecte
d D
aily D
iurn
al
-m
g
Diurnal Ethanol PortionVehicle 215 - 2004 Toyota Highlander
Ethanol Portion
10 psi E10 9 psi E07 psi E10
1 32
121
136
196
1 321 321 321 32
9 psi E207 psi E0
198
217213
0000
00
0000
00
335 292
283
Figure 38 ndash Vehicle 215 Diurnal Ethanol Portion
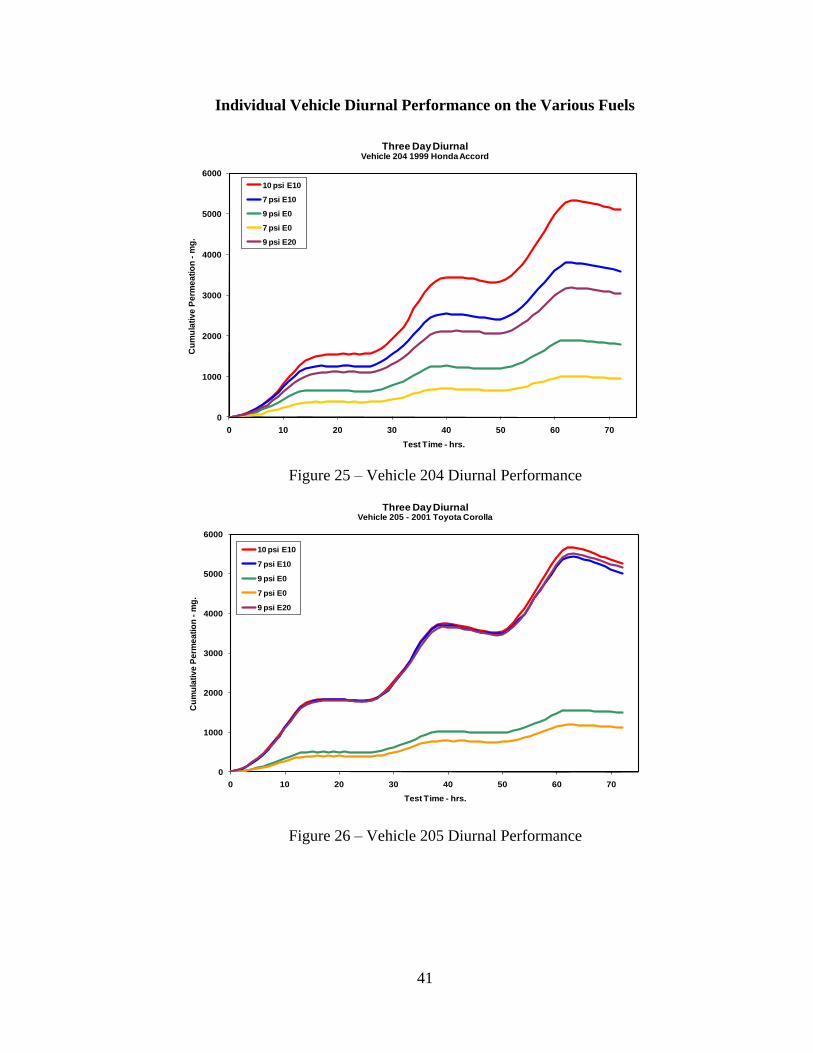


![1-0 Intro Presentation CRC Background - crcao.org Presentations/Session 1/1-0_I… · Microsoft PowerPoint - 1-0_Intro Presentation CRC Background [Compatibility Mode] Author: btaylor](https://img.pdfslide.us/doc/110x75/5f697a2a73af13026a0d1e03/1-0-intro-presentation-crc-background-crcaoorg-presentationssession-11-0i.jpg)