Embed Size (px)
Citation preview

Crawling Complex Networks: An Experimental Evaluation of Data CollectionAlgorithms and Network Structural Properties
Katchaguy Areekijseree and Sucheta Soundarajan{kareekij,susounda}@syr.edu
Syracuse University, New York, USA.
In recent years, researchers and data analysts have increasingly used online social network data tostudy human behavior. Before such study can begin, one must first obtain appropriate data. Thisprocess poses many challenges: e.g. a this platform may provide a public API for accessing data, butsuch APIs are often rate limited, restricting the amount of data that an individual collect in a givenamount of time. Thus, in order for the data collector to efficiently collect data, she needs to makeintelligent use of her limited API queries. The network science literature has proposed numerousnetwork crawling methods, but it is not always easy for the data collector to select an appropriatemethod: methods that are successful on one network may fail on other networks.
In this work, we demonstrate that the performance of network crawling methods is highly dependenton the structural properties of the network. To do that, we perform a detailed, hypothesis-drivenanalysis of the performance of eight popular crawling methods with respect to the task of maximizingnode coverage. We perform experiments on both directed and undirected networks, under fivedifferent query response models: complete, paginated, partial, in-out, and out responses. We identifythree important network properties: community separation, average community size, and averagenode degree. We begin by performing controlled experiments on synthetic networks, and then verifyour observations on real networks. Finally, we provide guidelines to data collectors on how to selectan appropriate crawling method for a particular network.
I. Introduction
The study of social networks has become a criticalaspect of research in a wide range of fields, and studyof such networks can give us rich insight into humanbehavior. In recent years, many researchers have chosento collect network data from online platforms. Theseplatforms typically provide a public API for accessingthe data. In other cases, human network data can becollected through surveys, interviews, etc.
The data collection process can require a significantamount of time, money, or resources. Thus, when collect-ing data, efficiency is extremely important. In particular,researchers are often interested in obtaining the most datapossible given a limited data collection budget. In thispaper, we consider the problem of network samplingthrough crawling, in which we have no knowledge aboutthe network of interest except for the identity of a sin-gle starting node in the graph. The only way to obtainmore information about the network is to query observednodes for their neighbors, and thus expand the observednetwork. In this paper, we use network sampling andnetwork crawling interchangeably.
In network crawling, there are a number of importantgoals, such as finding samples that are unbiased withrespect to some property, locating ‘important’ nodes, orfinding a sample that preserves information flow patterns.Here, we focus on the efficiency of the crawling algorithmitself- i.e., how quickly nodes and edges can be discoveredthrough the crawling process. Our considered goal is max-imizing the total number of nodes observed. A multitudeof network sampling algorithms [6, 25] have been createdfor this and other goals, and it is often difficult for a userto select an algorithm for her particular application.
The goal of this work is to analyze, characterize, and cat-
egorize the the performance of various network samplingalgorithms at the node coverage task, over networks withvarying structural properties. This paper is an extensionof our earlier work in [4], in which we (1) demonstratedthat node importance-based methods (i.e., those thatseek to find and query the ‘most important’ node at eachtime step) performed well on networks with fuzzy com-munity structure, but tended to get stuck in a region fornetworks with crisp community borders, and (2) showedthat Random walk-based methods were able to transitionbetween regions, regardless of community structure. (3)By knowing network properties or network type, we cansuggest the appropriate method that will work the best.
Most previous work, including our earlier work in [4],has assumed that all neighboring nodes are returned inresponse to a query [5, 6]. However, this assumption isnot valid in many real-world scenarios; e.g. FacebookAPI returns a list of 25 users as a response when requestfor a list of friends. Therefore, the crawler may needmultiple queries to obtain all friends of this particularuser. In this paper, we extend our earlier analysis toseveral other query models, each motivated by a real-world application. In particular, we define a total offive different responses on both undirected and directednetworks; complete, paginated, partial, in-out and outresponse. This work extends our earlier work in [4]. Ourmain contributions here are as follows:
1. In addition to the ‘complete’ query response, we con-sider four other realistic query models- paginated, par-tial, in-out, and out responses- which describe the neigh-bor data obtained in response to a query on a node.
2. While existing work, including our previous work, con-siders undirected networks, we perform the analysis on

2
both directed and undirected networks.
3. We observe that the performance of crawling algorithmsunder the complete, partial, paginated, and in-out querymodels are similar. In contrast, under the out query re-sponse model, algorithms exhibit different performance.In particular, under the out query response, we see thatthe performance of G1 methods is not substantiallyaffected as average degree or community size increases.Moreover, all methods tend to have similar performanceon networks with high community mixing.
4. We provide guidelines on how a user can select anappropriate crawling method for a network from agiven domain, under a specific query model, even beforeobserving specific properties of that network.
II. Related Work
Network sampling can be separated into two main cat-egories. The first is work on down-sampling, in whichone has full access to or ownership of the network data,but the size of the data makes the network too large tofeasibly analyze. The objective in this case is to scale thenetwork down to some desired size. A good sample shouldmaintain the relevant properties and characteristics of theoriginal network so that the results of analysis obtainedfrom the sample should be similar to the results one wouldhave obtained from the original network.
The second category of work is on the problem of net-work crawling. In this case, one has a limited access tothe network data, and can retrieve information about thenetwork by performing queries on observed nodes (e.g.,through an API or surveys). By repeatedly querying theobserved parts of the network, the sample is expandedfrom the single initially observed node or set of nodes.
Both cases are often broadly referred to as ‘sampling’;however, they require fundamentally different approaches.The goal of our work is to analyze and characterize theperformance of network crawling algorithms. We refer thereader to the survey in [2] for a more detailed discussion.
Algorithms for Network Crawling: Network crawl-ing is frequently used in scientific studies. For example,Mislove, et al. use a BFS crawler to collect data fromlarge networks, including Orkut, Youtube, Live Journal,and Flickr, before analyzing the structures of those net-works [19]. Similarly, Ahn, et al. use a BFS crawler tocollect data from CyWorld, a South Korean social net-working site, and MySpace [3]. However, it is known thatthe network samples produced by a BFS crawler containbias: specifically, the crawler is disproportionately likelyto visit hub nodes. Kurant, et al. present a modificationof BFS to correct this issue [14], and Gjoka, et al. pro-pose an unbiased approach based on Metropolis-HastingsRandom Walks [12]. These latter works demonstrate thatthe proposed crawlers can balance the visiting frequenciesbetween low and high degree nodes.
There has additionally been a great deal of intereston network crawling for specific applications. Salehi, et
al. introduce a method, based on PageRank, for crawl-ing networks to preserve community structure [25], andAvrachenkov, et al. propose a greedy crawling method,called Maximum Observed Degree (MOD), that has thegoal of finding as many nodes as possible with a lim-ited query budget [6]. MOD operates by selecting thenode with the highest observed degree in each step, withthe assumption that nodes that have a high sample de-gree are also likely to have a high true degree. The OPICmethod [1] adopts a similar idea, except that it queries thenode with the highest PageRank in each step. Experimen-tal results show that both MOD and OPIC significantlyoutperform other crawling methods [1, 6]
Analysis of Sampling Algorithms: There has addi-tionally been a great deal of work on comparing samplingmethods. Leskovec and Faloutsos present a study of thecharacteristics of different down-sampling methods, withthe goal of determining which method leads to sampleswith the least bias with respect to various network prop-erties [17]. They conclude that Random walk sampling isthe best at preserving network properties. Similarly, Ku-rant, et al. analyze BFS crawlers, and demonstrate thatsuch methods are biased towards high degree nodes [13].Ye, et al. present an empirical study that focuses on per-formance, sensitivity, and bias in [29], and Ahmed, et al.provide a framework for classifying sampling algorithmswith respect to how well they preserve graph statistics [2].
These existing works have generally sought to deter-mine which method is ‘best’ overall, at a high level. Incontrast, our goal is to understand the interplay betweennetwork structure and crawler performance, rather thansimply evaluating performance. We wish to understandthe underlying reasons behind why certain algorithms aresuccessful on certain types of networks, but may showweaker performance on other networks. These insightsgive guidance to those who are developing new networkcrawling algorithms, as well as to those who seek to selecta single algorithm for crawling a specific network.
III. Network Crawling Overview
A. The Network Crawling Problem
Let G = (V,E) be an unobserved network (either di-rected or undirected). In this problem, one is given astarting node ns ∈ V and a query budget b. To collectdata, one may perform a query on a previously-observednode. As a query response, a list of neighboring nodes isreturned. In this work, we consider five different typesof query responses, as described in Section III B. In eachiteration, the crawler selects one node whose neighbor-hood has not yet been fully explored to query (for furtherdiscussion of this step, see Section III C. The crawlerstops once b queries have been made. The output is asample graph S = (V ′, E′), where V ′ ⊆ V and E′ ⊆ E,containing all nodes and edges observed.
In this work, we consider the case where the crawlinggoal is to find nodes as many as possible. We refer to this

3
goal as maximizing node coverage1. We selected this goalbecause it has been closely tied to several important appli-cations; e.g., Maiya, et al. use the node coverage goal forthe task of generating a sample that preserves communitystructure [18]. There are numerous other crawling goalsthat one could consider (such as obtaining an unbiasedsample), but these goals require fundamentally differentapproaches, and so we do not consider them here.
B. Query Responses
The data that one obtains in response to a query ona node varies depending on domain. For example, someAPIs may return all neighbors of the queried node, whileothers may only return a subset, and so the crawler mustquery that node repeatedly to obtain all neighbors. Ifquestioning an individual as to the identities of her friends,one may receive a random sample in response. Our earlierwork considered only the case where all neighbors arereturned in response to a query [4]. Here, we considerfive different responses, motivated by these various real-world settings. First, for undirected networks, we considerthree types of query responses: complete, paginated andpartial. For directed networks, we consider in-out, andout responses. Details are as follows:
1. Responses on Undirected NetworksComplete Response: In this query model, all neigh-
boring nodes are returned in response to a query on anode. This is motivated by settings such as networkrouting; e.g. the ‘netstat ‘ command in Linux returns allnetwork connections that connect from the machine.
Paginated Response: In the paginated responsequery model, only k neighboring nodes are returned inresponse to a query on a node. The neighbors of eachnode are divided into distinct chunks, or pages. Each pagecontains up to k neighbors (except the last page, whichmay contain fewer); thus, the crawler may need to querya node more than once to obtain all of its neighbors. Thisresponse is common in APIs for online social networks,such as querying photos/albums on Facebook. We assumethat the crawler is notified (e.g., by the API) when thereare no further pages to be returned.
Partial Response: In the partial response querymodel, like the paginated response model, k neighbors ofa node are returned in response to a query on that node.However, in the partial response case, these neighborsare returned in a random fashion, and different queriesmay result in duplicate returned neighbors. To observeall neighbors of a node v, the crawler must conduct atleast dv/k queries on v, where dv is the degree of nodev, but even after performing this many queries, one can-not be guaranteed that all neighbors have been observed.This model is motivated by scenarios such as personalinterviews, such as surveys or criminal interrogations. In
1 We also considered the equivalent edge coverage goal, and theresults were largely similar.
such cases, one may ask a respondent to identify all ofher friends, but her memory is likely to be incomplete,with an element of randomness.
2. Responses on Directed NetworksThere are two types of edges incident to any node v;
incoming edges originate at another node u and terminateat v, while outgoing edges originate at u and terminateat another node v. Accordingly, we define two queryresponses: in-out and out.
In-Out Response: The crawler can choose to queryfor either incoming or outgoing edges. To get all of theneighbors of a node, the crawler must perform two querieson that node. This query model can be found in someonline social networks- e.g., on Twitter, one can separatelyquery for the followers or friends (followees) of a node.
Out Response: The query for incoming edges is notavailable, and the crawler can only query for outgoingedges of a node. This response applies to the web scrap-ing scenario: one can quickly identify which websites aparticular site is linking to, but not which websites it islinked from. Some OSN platforms also provide APIs withsimilar behavior (e.g., Flickr has an API call for obtaininga list of users that user A follows, but not the users whofollow A).
C. Closed nodes vs. Open nodes
As the crawler proceeds, the nodes seen so far can begrouped into various categories. We refer to all the nodesin a sample as observed nodes. An observed node maybe either closed or open. Closed nodes are the nodeswhose entire neighborhood is believed to be known, whileopen nodes are those nodes that are believed to still haveunobserved neighbors.
Under the complete, paginated, in-out, and out queryresponse models, we know exactly how many queries arerequired to observe all neighbors of a node. The complete,in-out, and out models return all [in/out] edges of a node,and for the paginated response model, we assume thatthe crawler is informed when no further pages can bereturned (e.g., the API indicates that no more data isavailable, or provides the total degree of a node). Onceall of a node’s neighbors are observed, that node will bechanged from open to closed.
The partial response model is somewhat more challeng-ing to deal with, because each query returns a randomsubset of the queried node’s neighbors. Information aboutnode’s total degree is unavailable, so the crawler mustestimate each node’s degree. Once the observed degree isequal the estimate degree, the node is switched from opento closed. To perform this estimate, we adopt the “markand recapture” technique from ecology, which is used toestimate population size [24]. The degree of node v can beestimated by dv = M ·C/R, where M is the total numberof distinct neighbors that have been discovered prior tothe current query, C is the total number of number ofneighbors discovered after the current query and R is thenumber of neighbors returned by the current query thathad been previously observed.

4
D. Online Crawling Methods
Maximum Observed Degree (MOD): The crawlergreedily selects the open node with the highest observeddegree [6]. MOD substantially outperforms other methodsat the node coverage task.
Maximum Observed PageRank (PR): The crawleracts similarly to MOD, except that the PageRank score ofevery node is used to select the query node. It has beendemonstrated that this technique captures the communitystructure of the network [25].
Online Page Importance Computation (OPIC):OPIC aims to calculate each node’s importance scorewithout recalculating it in each step. The crawlerupdates only the scores of the most recently queried nodeand its neighbors. Initially, each observed node is givenan equal amount of “cash”. The crawler queries the nodewith the highest cash, and this cash is spread equallybetween the node’s neighbors. OPIC can quickly computethe importance of nodes, as demonstrated in [1].
Random Crawling (Rand): The crawler randomly se-lects one open node for the next query.
Breadth-First Search (BFS): The crawler maintainsa queue of open node in a FIFO fashion, and queriesthe first node in the queue. BFS crawling is extremelypopular, due partly to it its simplicity, but also becausethe obtained sample contains all nodes and edges ona particular region of the graph. Analysis on networksamples obtained using a BFS crawl is presented in [19].
Snowball Sampling (SB): The crawler acts similarlyto BFS, except for only a p fraction of each node’s neigh-bors is put into the queue (we set p to 0.5). This methodcan find hub nodes in a few iterations, as presented in [3].
Depth-first Search (DFS): The crawler acts similarlyto BFS, except that a node is selected in LIFO fashion.
Random Walk (RW): In each step, the crawler ran-domly moves to a neighbor of the most recently queriednode. Nodes may be visited multiple times, but areonly queried if they are still an open node. The resultsof Random Walk crawling came out on top in [17]. Ondirected graphs, to prevent the crawler from becoming‘trapped’, we use a teleport probability of 0.15, allowingthe crawler to jump to an already-observed node.
Note that under the in-out query model, we assume thata crawler will make double queries on each node. This isbecause all of the considered algorithms are not designedfor directed graphs. To adapt the above algorithms for thein-out query model, we assume that a crawler queries eachselected node twice- once for the in-edges and once forthe out-edges [15]. Under the paginated and partial querymodels, the BFS, SB, DFS crawlers keep querying until allneighbors are seen. The MOD, PR and OPIC crawlers selectthe node with the highest observed centrality with at leastk unobserved neighbors remaining (where k is the size ofthe query response).
E. The Effects of Network Structure on CrawlerPerformance
The overarching goal of our work is to investigate howthe structural properties of a network can affect the perfor-mance of various crawling algorithms. As demonstratedin [29], the performance of different crawlers may vary bythe network. This variance is surely due to differences instructure; but which properties are important, and howdo they affect crawler performance?
1. Structural Properties of Interest
We hypothesize that the performance of crawling meth-ods strongly depends on how well a crawling algorithm canmove between different regions of the graph. At a highlevel, if a crawler has difficulty in transitioning betweenregions of the graph, it may become ‘trapped’ in one area,and repeatedly see the same nodes returned in responseto its queries. Because the goal considered in this paperis that of node coverage, this is effectively a waste ofbudget. To verify our hypothesis, we select three networkstructural properties:2
Community Separation: A community is a sub-graph with dense intra-connections and sparse inter-connections. We find communities using the Louvainmethod [7], and then use the modularity Q of the detectedpartition to measure how well-separated the communitiesare [21]. The higher the modularity, the stronger theseparation between communities, and so a crawler maybe more likely to get trapped in a region.
Average Degree: We compute the average degree ofnodes in the network.3 If average degree is high relativeto community size, this indicates that nodes are likelyto have many connections outside their own community,making it easier for a crawler to move between regions.
Average Community Size: Finally, we consider theaverage community size (in terms of number of nodes)of the communities found using the Louvain method.As described earlier, this property is useful when takentogether with average degree.
2. Properties of Real Networks
As we will see, the above three structural propertieshave a large effect on the comparative performance ofthe various crawling methods. However, in a real-worldsetting, one would not know these network propertiesahead of time; so how can one use these results in practice?
As is well-known from the network science literature,networks of the same type (e.g., social, hyperlink, etc.)tend to have similar properties [8, 9, 19, 20]. For example,Boccaletti et al. show that P2P networks have an averagedegree of around 4-6, while Mislove et al. show that the
2 We explored other properties, such as clustering coefficient, butthese three emerged as having the greatest effect on performance.
3 We also look at median degree, since the real networks havedegree distribution follows power-law. However, it does not showany different in terms of the results.

5
average degree of OSNs ranges between 15-140. Numer-ous studies have investigated specific properties of othernetwork categories, including the degree distribution, sizeof LCC, and diameter of the WWW [10, 27], the averagedegree and path length of OSNs [3, 19] and communitystructure of citation networks [11]. One cannot reasonablyexpect a single crawling method to be the best on everynetwork under different query responses. In Section VII,we provide a set of guidelines for users on selecting asuitable crawling method when network type is known.
IV. Experimental Setup
We now evaluate the effect of network properties oncrawler performance through a series of experiments onsynthetic and real networks. First, we perform a set ofexperiments on synthetic networks with carefully con-trolled properties, and investigate how changes in thesestructural properties affect performance of the crawlingalgorithms. Next, we perform another set of experimentson real networks, and use the results to validate the obser-vations that we see on synthetic networks. For each set ofexperiment, we consider the five different query responses:complete, paginated, partial, in-out and out responses.
We adopt the LFR network model [16] for generatingnetworks. This model allows us to generate undirectedor directed networks with desired properties includingnumber of nodes, average degree, power-law exponent,community size, community mixing and etc. We set eachgenerated network to have 5000 nodes with a maximumdegree of 300. Then, we vary the value of three networkproperties; davg, CSavg, and µ. µ has a range between0 and 1, and indicates the fraction of edges that link tonodes outside the community.
Community mixing µ and modularity Q are related.Networks with high µ will have low modularity and viceversa. Higher values of µ indicate overlapping communitystructure. For our experiments, we vary the value of µ (0.1to 0.9), davg from 7-200, and CSavg sizes from 100-2500.To reduce the effects of randomness, for each parametersetting, we generate 10 networks. We consider the querybudgets up to 1000 queries (20% of total nodes).
We categorize the eight crawling methods into threegroups. These groups correspond both to how the meth-ods work and, as we will see, their performance on variousnetworks. The methods in each class are:
G1: (Node Importance-based) MOD, OPIC and PR.G2: Random walkG3: (Graph Traversal-based) BFS, DFS, SB, Rand.
Throughout the figures in this paper, we use colors torepresent the different methods, and different linetypeto represent the different groups. ‘dashed ’, ‘dotted ’ and‘solid ’ lines represent G1, G2 and G3, respectively.
V. Experiments on Synthetic Networks
We first analyze crawler performance on undirectednetworks, under three query response models- complete,
paginated, and partial - and then consider directed net-works, under two query response models- in-out and out.
A. Responses on Undirected Graphs1. Complete Response
Recall that in the complete response query model, allneighboring nodes are returned when a node is queried.We plot results for each method in Figures 1-3.
FIG. 1: [Best viewed in color] Complete Resp.:Results on networks with different values of d and CS(µ=0.1). G2 is stable. G1 and G3 performance improvesas CS and d increases, respectively.
First, we consider the case where networks have a clearcommunity structure (high modularity, low µ: sharp com-munity borders with few edges between communities), andaverage degree and community size are varied. Resultsare shown in Figure 1.
FIG. 2: [Best viewed in color] Complete Resp:Results on networks with different values of µ (davg=15,CSavg=300). G1 methods improve as µ increases.
The outer axes indicates different values of the testproperties. The outer x-axis represent the increasing in
6
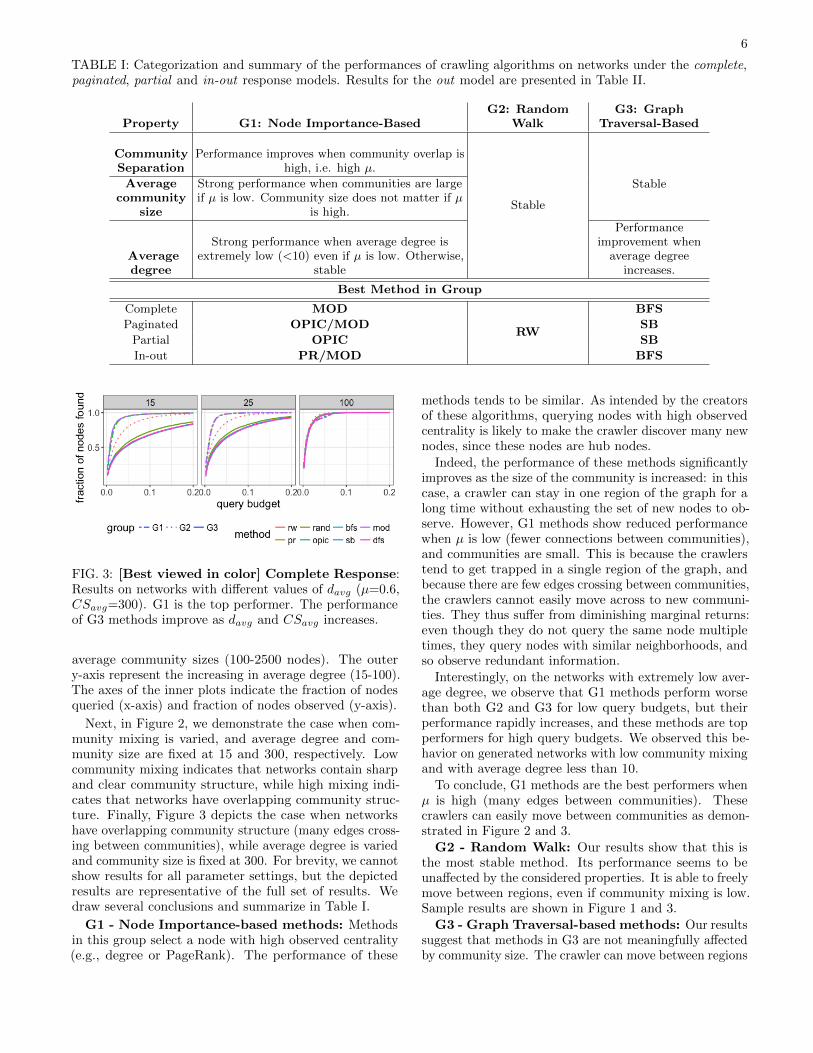
TABLE I: Categorization and summary of the performances of crawling algorithms on networks under the complete,paginated, partial and in-out response models. Results for the out model are presented in Table II.
Property G1: Node Importance-BasedG2: Random
WalkG3: Graph
Traversal-Based
CommunitySeparation
Performance improves when community overlap ishigh, i.e. high µ.
Stable
StableAveragecommunity
size
Strong performance when communities are largeif µ is low. Community size does not matter if µ
is high.
Averagedegree
Strong performance when average degree isextremely low (<10) even if µ is low. Otherwise,
stable
Performanceimprovement when
average degreeincreases.
Best Method in Group
Complete MOD
RW
BFS
Paginated OPIC/MOD SB
Partial OPIC SB
In-out PR/MOD BFS
FIG. 3: [Best viewed in color] Complete Response:Results on networks with different values of davg (µ=0.6,CSavg=300). G1 is the top performer. The performanceof G3 methods improve as davg and CSavg increases.
average community sizes (100-2500 nodes). The outery-axis represent the increasing in average degree (15-100).The axes of the inner plots indicate the fraction of nodesqueried (x-axis) and fraction of nodes observed (y-axis).
Next, in Figure 2, we demonstrate the case when com-munity mixing is varied, and average degree and com-munity size are fixed at 15 and 300, respectively. Lowcommunity mixing indicates that networks contain sharpand clear community structure, while high mixing indi-cates that networks have overlapping community struc-ture. Finally, Figure 3 depicts the case when networkshave overlapping community structure (many edges cross-ing between communities), while average degree is variedand community size is fixed at 300. For brevity, we cannotshow results for all parameter settings, but the depictedresults are representative of the full set of results. Wedraw several conclusions and summarize in Table I.
G1 - Node Importance-based methods: Methodsin this group select a node with high observed centrality(e.g., degree or PageRank). The performance of these
methods tends to be similar. As intended by the creatorsof these algorithms, querying nodes with high observedcentrality is likely to make the crawler discover many newnodes, since these nodes are hub nodes.
Indeed, the performance of these methods significantlyimproves as the size of the community is increased: in thiscase, a crawler can stay in one region of the graph for along time without exhausting the set of new nodes to ob-serve. However, G1 methods show reduced performancewhen µ is low (fewer connections between communities),and communities are small. This is because the crawlerstend to get trapped in a single region of the graph, andbecause there are few edges crossing between communities,the crawlers cannot easily move across to new communi-ties. They thus suffer from diminishing marginal returns:even though they do not query the same node multipletimes, they query nodes with similar neighborhoods, andso observe redundant information.
Interestingly, on the networks with extremely low aver-age degree, we observe that G1 methods perform worsethan both G2 and G3 for low query budgets, but theirperformance rapidly increases, and these methods are topperformers for high query budgets. We observed this be-havior on generated networks with low community mixingand with average degree less than 10.
To conclude, G1 methods are the best performers whenµ is high (many edges between communities). Thesecrawlers can easily move between communities as demon-strated in Figure 2 and 3.
G2 - Random Walk: Our results show that this isthe most stable method. Its performance seems to beunaffected by the considered properties. It is able to freelymove between regions, even if community mixing is low.Sample results are shown in Figure 1 and 3.
G3 - Graph Traversal-based methods: Our resultssuggest that methods in G3 are not meaningfully affectedby community size. The crawler can move between regions

7
of the graph by uniformly expanding the sample frontier.As shown in Figure 1, G3 performs better when averagedegree increases (moving up along y-axis) and becometop performers on networks with large average degree.
2. Paginated Response
In this section, we describe the results of each crawleron generated networks with paginated response. In thepaginated query model, only k neighboring nodes arereturned for each query on a node. We observe thatresults are similar to those of the complete response querymodel. A summary of how structural properties affecteach method is shown in Table I.
G1 - Node Importance-based methods: Thesemethods tend to exhibit similar behavior as in the caseof the complete query model. They exhibit excellentperformance and are the top performers in two cases; 1)when communities are overlapping and 2) when averagecommunity size is high or average degree is extremely low,even if communities are not overlapping. Examples areshown in Figures 2 and 3.
G2 - Random Walk: As before, the Random Walkcrawler is very stable, and its performance appears to beindependent of these properties.
G3 - Graph Traversal-based methods: The per-formance of methods in this group seems to be unaffectedby modularity and average community size, but is affectedby average degree. Results show that these crawlers havean performance improvement on networks with high aver-age degree. We observe that Snowball sampling is thebest among this group.
3. Partial Response
Next, we present the results of crawling methods onthe generated networks under the partial response model.The partial query model is similar to paginated response,in that only k neighboring nodes are returned after eachquery. However, nodes are returned randomly, thus, thecrawler can see the same neighbor from different queries.A summary of how the structural properties affect eachmethod in this scenario is shown in Table I.
FIG. 4: [Best viewed in color] Partial Response:Results on networks with different values of µ (davg=15,CSavg=300). G1 methods improve as µ increases, butthey generally perform similarly to methods in G3.
Under this query model, we observe some different be-haviors in term of performance of these methods. Firstly,we observe that average degree has a small effect theRandom Walk performance. Next, the performance of G1is affected by community mixing as expected, however,all methods in G1 except OPIC can perform as good asmethods in G3. Lastly, we observe that average degreeand community size have less effect on G1 performance.
FIG. 5: [Best viewed in color] Partial Resp:Results on networks with different davg and CSavg (µ=0.1). G3 methods improve when davg increases. G1performance improves when CSavg increases, they seemto be the worst performers.
G1 - Node Importance-based methods: The per-formance of methods in this group slightly improves whencommunity mixing increases (i.e., overlap increases), asshown in Figure 4. In Figure 5, G1 performance slightlyincreases as average degree or average community size isincreased. However, their overall performance is worsethan methods in G3. These methods do not perform wellbecause the correlation between the observed centralitymeasure and actual centrality measure is very low: e.g.,a node with high observed degree in the sample does notnecessarily have high true degree. When a crawler queriesthe same node multiple times, it is likely to retrieve dupli-cate nodes from different queries. We observe that manyof the open nodes tend to have the same observed degree,and so due to this low correlation, observed degree isnot useful for distinguishing between medium- and high-degree nodes. On one hand, if a crawler happens to queryon a node with (true) medium degree, a crawler needs tospend only a few queries, but the payoff (i.e. number ofnodes returned) is low. On the other hand, if a crawlerhappens to query a node with extremely high (true) de-gree, it will retrieve many neighbors, but extends a large

8
amount of budget because many duplicates are returned.G2 - Random Walk: As before, the performance of
the Random Walk crawler is still stable and unaffected byany of the considered properties. On networks with lowcommunity mixing, regardless of the other two properties,this method exhibits good performance, and is generallythe top performer.
G3 - Graph Traversal-based methods: Similar toprevious results under other query models, these methodsshow improvement as average degree is increased, but aremostly unaffected by µ and CSavg.
B. Responses on Directed Networks
We present the experiment results on synthetic directednetworks under the in-out and out response models.
1. In-out Response
Under the in-out query response model, a crawler mustquery each node twice to obtain all of its edges: once toobtain its incoming edges and again to obtain its outgoingedges. We observe that results are similar to those onundirected networks under the complete response model.A summary is shown in Table I.
FIG. 6: [Best viewed in color] In-Out Response:Results on networks with different values of d and CS(µ=0.1). G2 is stable. G1 and G3 performance slightlyimproves as CSavg and davg increases, respectively.
G1 - Node Importance-based methods: As be-fore, methods in this group show an improvement inperformance as community mixing is increased. Thisis expected, because these methods behave similarly tocrawls on undirected networks under the complete re-sponse scenario, except that the crawler must query eachnode twice. We also observe a slight improvement inperformance when either average degree or average com-munity size is increased on networks with low community
mixing, as illustrated in Figure 6. Surprisingly, thesemethods are often the worst performers on networks withlow community mixing.
G2 - Random Walk: As in previous cases, the per-formance of the G2 crawler is generally stable, though itslightly improves as average community size increases.
G3 - Graph Traversal-based methods: The per-formance of the G3 methods is not meaningfully affectedby µ and CSavg; however, they are affected by average de-gree, and tend to perform very well on the networks withhigh average degree. Surprisingly, G3 performance is asgood as or better than G2 performance on networks withhigh average degree (davg = 100 in these experiments).
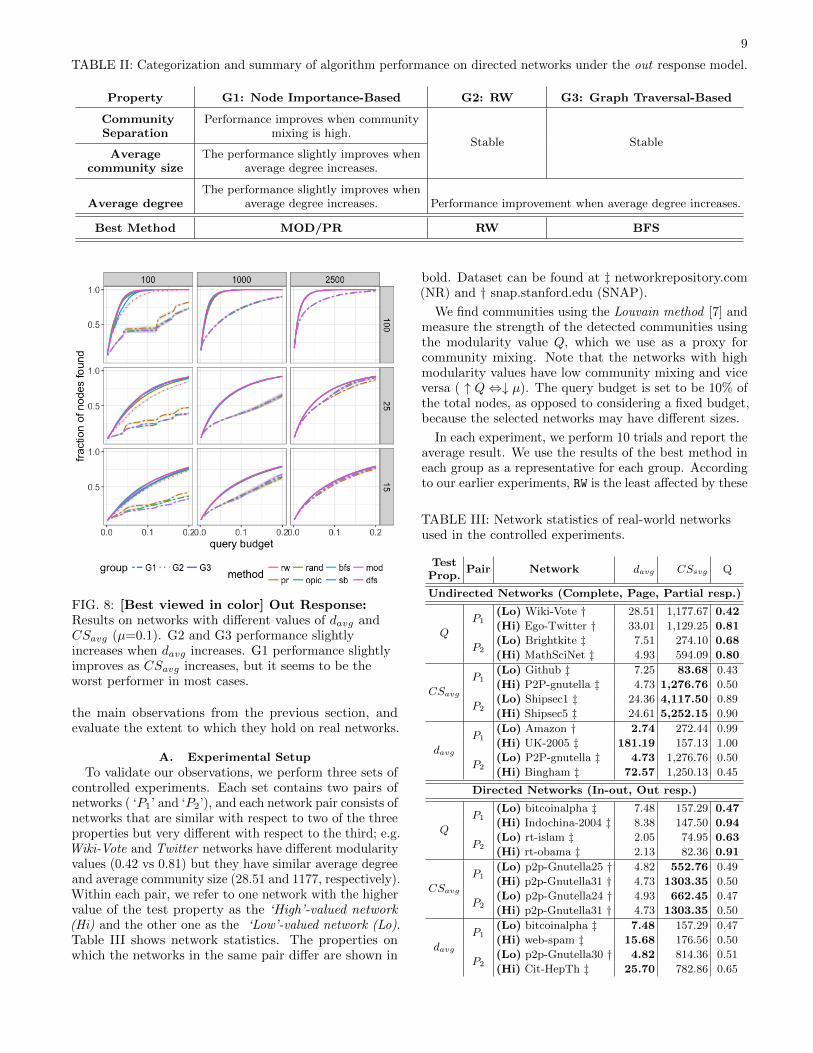
2. Out Response
Here, a crawler is only able to request the edges outgo-ing from a node. Results under this model are somewhatdifferent than those observed earlier, though there is nodifference in terms of performance for these methods onnetworks with high community mixing, as illustrated inFigure 7. The summary is shown in Table II.
FIG. 7: [Best viewed in color] Out Response:Results on networks with different µ (d=15, CS=300).There is no difference in terms of performance for thesemethods on the networks with high community mixing.
G1 - Node Importance-based methods: In Fig-ure 8, the performance of methods in G1 improves whenaverage degree or average community size increases on net-works with low µ (few connections between communities),however, methods in G1 do not perform well comparedto other methods. We see that the PR crawler is the best(among the crawlers in this group).
G2 - Random Walk: The G2 Random Walk crawlerperformance seems to be stable. We observe a slightimprovement when average degree increases on networkswith low µ (i.e., few edges between communities).
G3 - Graph Traversal-based methods: The per-formance of methods in G3 improves when average degreeincreases. In contrast to previous results, G3 methodsperform very well and seem to be top performers.
VI. Real World Networks
The previous experiments show that the major factor inthe performance of each method is the ability to transitionbetween different regions of the graph. Here, we consider
9
TABLE II: Categorization and summary of algorithm performance on directed networks under the out response model.
Property G1: Node Importance-Based G2: RW G3: Graph Traversal-Based
CommunitySeparation
Performance improves when communitymixing is high.
Stable StableAverage
community sizeThe performance slightly improves when
average degree increases.
Average degreeThe performance slightly improves when
average degree increases. Performance improvement when average degree increases.
Best Method MOD/PR RW BFS
FIG. 8: [Best viewed in color] Out Response:Results on networks with different values of davg andCSavg (µ=0.1). G2 and G3 performance slightlyincreases when davg increases. G1 performance slightlyimproves as CSavg increases, but it seems to be theworst performer in most cases.
the main observations from the previous section, andevaluate the extent to which they hold on real networks.
A. Experimental Setup
To validate our observations, we perform three sets ofcontrolled experiments. Each set contains two pairs ofnetworks ( ‘P1’ and ‘P2’), and each network pair consists ofnetworks that are similar with respect to two of the threeproperties but very different with respect to the third; e.g.Wiki-Vote and Twitter networks have different modularityvalues (0.42 vs 0.81) but they have similar average degreeand average community size (28.51 and 1177, respectively).Within each pair, we refer to one network with the highervalue of the test property as the ‘High’-valued network(Hi) and the other one as the ‘Low’-valued network (Lo).Table III shows network statistics. The properties onwhich the networks in the same pair differ are shown in
bold. Dataset can be found at ‡ networkrepository.com(NR) and † snap.stanford.edu (SNAP).
We find communities using the Louvain method [7] andmeasure the strength of the detected communities usingthe modularity value Q, which we use as a proxy forcommunity mixing. Note that the networks with highmodularity values have low community mixing and viceversa ( ↑ Q⇔↓ µ). The query budget is set to be 10% ofthe total nodes, as opposed to considering a fixed budget,because the selected networks may have different sizes.
In each experiment, we perform 10 trials and report theaverage result. We use the results of the best method ineach group as a representative for each group. Accordingto our earlier experiments, RW is the least affected by these
TABLE III: Network statistics of real-world networksused in the controlled experiments.
TestProp.
Pair Network davg CSsvg Q
Undirected Networks (Complete, Page, Partial resp.)
Q
P1(Lo) Wiki-Vote † 28.51 1,177.67 0.42
(Hi) Ego-Twitter † 33.01 1,129.25 0.81
P2(Lo) Brightkite ‡ 7.51 274.10 0.68
(Hi) MathSciNet ‡ 4.93 594.09 0.80
CSavg
P1(Lo) Github ‡ 7.25 83.68 0.43
(Hi) P2P-gnutella ‡ 4.73 1,276.76 0.50
P2(Lo) Shipsec1 ‡ 24.36 4,117.50 0.89
(Hi) Shipsec5 ‡ 24.61 5,252.15 0.90
davg
P1(Lo) Amazon † 2.74 272.44 0.99
(Hi) UK-2005 ‡ 181.19 157.13 1.00
P2(Lo) P2P-gnutella ‡ 4.73 1,276.76 0.50
(Hi) Bingham ‡ 72.57 1,250.13 0.45
Directed Networks (In-out, Out resp.)
Q
P1(Lo) bitcoinalpha ‡ 7.48 157.29 0.47
(Hi) Indochina-2004 ‡ 8.38 147.50 0.94
P2(Lo) rt-islam ‡ 2.05 74.95 0.63
(Hi) rt-obama ‡ 2.13 82.36 0.91
CSavg
P1(Lo) p2p-Gnutella25 † 4.82 552.76 0.49
(Hi) p2p-Gnutella31 † 4.73 1303.35 0.50
P2(Lo) p2p-Gnutella24 † 4.93 662.45 0.47
(Hi) p2p-Gnutella31 † 4.73 1303.35 0.50
davg
P1(Lo) bitcoinalpha ‡ 7.48 157.29 0.47
(Hi) web-spam ‡ 15.68 176.56 0.50
P2(Lo) p2p-Gnutella30 † 4.82 814.36 0.51
(Hi) Cit-HepTh ‡ 25.70 782.86 0.65

10
(a) Performance changes ∆P of G1 methods (Left: Pair P1 Right: P2).
(b) Performance changes ∆P of G3 methods (Left: Pair P1 Right: P2).
FIG. 9: [Best viewed in color] Results of controlled experiment. Each cell shows the changes in performance (∆P )of G1 and G3 methods on low -valued and high-valued network. Positive value indicates an improvement inperformance and negative value indicates a performance degradation as controlled property increases. Zero indicatesperformance is unchanged.
properties, we use it as a reference point to normalize theresults of the other methods.
The results of these experiments are shown in Figure 9.Each row corresponds to a controlled property, and con-tains results on network pairs that differ with respectto that property. The columns represent different queryresponses. For each cell, the value indicates the changesin performance of the method x, ∆Px, on low- vs. high-valued networks, defined as ∆Px = Phi − Plo, where Pis the number of nodes found by method x divided bythe number of nodes found by RW. Positive values of ∆Px
indicate that the amount of nodes found by method x isgreater on the high-valued network than the low-valuednetwork, and negative values indicate the opposite. Thedifferences in performance of G1 and G3 on both pairs ofnetworks are shown in Figure 9a and 9b, respectively. Wealso report the percentage improvement above (or below)the number of nodes found by RW, including the summaryof all observations. Please see Table VIII in the Appendixfor full details.
B. Experimental Results
Obs1: The effect of structural properties on crawlers’ per-formance is similar for all types of queried responses,
with the exception of out response.
Figure 9 shows the change in each crawler’s performanceacross properties, for the different query models. Thevalue indicates how the performance changes when thereis a change in controlled properties. We can clearly see thechanges of complete, partial, paginated and in-out queryresponses are similar.
Obs2: Methods in G1 have excellent performance on net-works with overlapping communities.
As expected, G1 methods generally perform well when Qis low. The results of P1, when modularity is a controlledproperty indicate that the performance of G1 methodsdrop when modularity increases, shown in Figure 9a (left).
Obs3: Methods in G1 perform well on networks with ex-tremely low average degree even if Q is high.
On the other hand, G1 methods also perform very well onnetworks with extremely low average degree (davg < 10)even if modularity is high. We can see the consistent resultsfor every pair P2 when modularity is a test property onall responses in Figure 9a (right).
Obs4: The performance of methods in G1 improves onundirected networks with larger community size

11
even if modularity is high.
On undirected networks with complete and paginatedresponse, we observed that community size affects theperformance of G1. Networks with larger communitysize seems to improve the G1 performance. However,this property does not seem to affect G1 performance onnetworks with other responses.
Obs5: RW crawler is the best under partial response.
The Random Walk crawler seems to be the best methodon networks with a partial response, as we observed fromsynthetic networks. This also holds on real-world networks.As illustrated in Table VIII, G1 and G3 have negative nor-malized performance, meaning that these crawlers’ performworse than Random Walk.
Obs6: Average degree affects the performance of G3.
In Figure 9b, G3 methods show a performance improve-ment on networks with higher average degree under everyquery response.
Obs7: G3 methods are generally the weakest.
As we observed on the synthetic networks, the performanceof methods in G3 comes in last. This also holds on real-world network, as seen in Table VIII.
VII. Guidelines for Users
When collecting network data, the structural propertiesof the network are not known in advance. How can a datacollector decide which crawler to use?
Here, we demonstrate that we can select a crawlingmethod by using the network domain. Networks of thesame type tend to have similar properties, and so it is pos-sible to make reasonably accurate generalizations aboutthe relevant structural properties. In addition, our guide-lines cover different query responses from real applicationscenarios; e.g., most of the APIs provided by OSNs returnpaginated results, while only outgoing neighbors can beobtained when crawling web pages. For the sake of com-pleteness, we include all combinations of network typeand query response.
We categorize 21 networks into six network types: sci-entific collaboration networks, recommendation networks,Facebook100 networks, Web (hyperlink) networks, andtechnological networks (router-level network topology).Although the Facebook100 networks are online social net-works, we consider them as a separate categories due tothe restricted nature of the Facebook100 networks. Thesenetworks represent early versions of the Facebook net-work, dating to the period when universities each hadseparate Facebook networks. All nodes are thus membersof the same university population, as opposed to mod-ern online social networks, which include a much morediverse population. Due to this membership restriction,the Facebook100 networks exhibit very strong communitystructure, in contrast to the fuzzier structure one wouldexpect from an OSN. All networks statistics are listed inTable IV. Datasets are taken from SNAP (†) and NR (‡).
Again, the maximum query budget is set to be 10percent of the total number nodes. For standardization,
TABLE IV: Categories of the real-world networks andtheir structural characteristics.
Type Network davg CSavg Q Properties
Undirected Networks (Complete, Page, Partial)
Collab.
Citeseer ‡ 7.16 988.35 0.90Low degree,medium-sized andclear communities
Dblp-2010 ‡ 6.33 739.91 0.86
Dblp-2012‡ 6.62 1248.35 0.82
MathSciNet ‡ 4.93 594.09 0.80
Recmnd.Amazon ‡ 2.74 272.44 0.99 Low degree, small
clear communities.Github‡ 7.25 83.68 0.43
FB100
OR ‡ 25.77 1074.44 0.63 High degree, largeand clearcommunities
Penn ‡ 65.59 2186.11 0.49
WestOhio ‡ 25.77 856.65 0.63
OSNs.
Themarker ‡ 29.87 458.90 0.31 High degree, small-to-medium-sized andfuzzy communities
BlogCatalog ‡ 47.15 1455.48 0.32
Catster ‡ 73.22 1294.14 0.38
Directed Networks (In-Out, Out)
Web.
Arabic-2005 ‡ 21.36 115.86 1.00High degree,medium-sized andfuzzy communities
Italycnr-2000 ‡ 17.36 1134.34 0.91
Sk-2005 ‡ 5.51 338.22 0.99
Uk-2005 ‡ 181.19 157.13 1.00
Tech.P2P-gnutella ‡ 4.73 1276.76 0.50 Low degree, large
clear communitiesRL-caida ‡ 6.37 856.12 0.86
OSNs.(directed)
Slashdot ‡ 10.24 173.87 0.36 High degree, small-to-medium-sizedfuzzy communities
Ego-Twitter † 90.93 2038.33 0.51
Wiki-Vote † 28.51 1009.43 0.42
TABLE V: Summary of algorithm performance.Algorithms perform similarly within the same category.
TypeBest Method
Comp. Page Part.
Undirected Networks
Collaboration:low davg, medium CSavg, high Q G1 G1 G2
Recommendation:low davg, low CSavg, high Q
FB100:high davg, high CSavg, high Q
G2 G2
OSNs:high davg, lo-med CSavg, low Q
G1 G1 G1
Directed Networks
TypeBest MethodIn-Out Out
Technological:low davg, high CSavg, high Q
G1 G3
Web:high davg, medium CSavg,low Q
G2G2
OSNs (directed):high davg, high CSavg, high Q
G1
we set the number of returned nodes for paginated andpartial response to be the mean of the average degreeacross networks in that group. 10 trials are performed foreach method and depict the mean and standard deviationof the percentage of nodes. A summary is shown inTable V. Full results are show in Table VI and VII.
Newman suggests that networks with Q ≥ 0.3 have astrong community structure [21]. From Table IV, OSNscontain overlapping community structure, indicated bytheir having the lowest modularity of all considered types.This is because people can be part of several groups inreal life; e.g. group of friends, family, co-workers, etc. Asshown in the Table IV, all Facebook networks indicate a
12
strong community structure (Q ≥ 0.5). As expected, G1methods perform well on these OSNs, because they canfreely move between regions. Other network types havehigher modularity (0.4-0.9), so, the performance can bedetermined by average degree and community size.
A. Undirected Networks
We first consider the network categories with high com-munity separation (high Q). Here, we examine collab-oration and recommendation networks. Both of thesecategories exhibit a large average community size of atleast approximately 50 times larger than their averagedegrees (davg < 10). These networks have clear commu-nity structure and low average degree, and as expectedfrom earlier experiments, G1 methods perform very wellunder the complete and paginated models. In contrast,Facebook networks have communities only 30 times largerthan their average degrees. On networks with smallercommunities, the performance of methods in G2 are thebest under all query response models. On networks withpartial response, as suggested by our earlier experiments,the performance of the G2 method outperforms othermethods. It is the best method to use on these types.
B. Directed Networks
On technological networks, the ratio of community sizeto average degree is approximately 200, indicating largecommunities. As expected, the performance of G1 isthe best on networks under the in-out response model.In contrast, web networks have small communities- onlyapproximately 35 times larger than average degree. Aspredicted by our earlier results, the G2 method worksthe best in this case. In addition, the G2 method isalso the best on web and online social networks underthe out response model. Finally, methods in G3 seemsto perform slightly better than others on technologicalnetworks under the out response model. All the resultsare consistent with the results in previous experiments.
VIII. Major Takeaways
We have presented a wide variety of results across dif-ferent types of networks and query models. We makeseveral common observations. First and foremost, com-munity mixing has a strong effect on the performance ofmethods in G1, which query nodes with high observedcentrality (degree or other). The G1 methods are ableto quickly discover a large number of nodes, but whenµ is low, these methods risk becoming trapped insidea community. This occurs because even if a node fromanother community is observed, it is on the periphery ofthe observed sample, and so has low centrality. Thesemethods repeatedly query nodes in the same region, butif the network has low mixing between communities, thequeried nodes are likely to have similar neighborhoods.This results in the same nodes being observed over andover again, leading to diminishing marginal returns andthus reduced node coverage, and much of the budget is
spent before the crawler moves to a new region. In con-trast, if µ is high, then nodes from outside the startingcommunity can reach high observed centrality, and arethen queried. An exception to this observation generallyoccurs if the average community size is high relative tothe average degree. This behavior is demonstrated on thereal OSNs, which contain community structure with lowmodularity values. On these networks, the G1 methodstend to be best.
Secondly, regardless of the query response model, theconsidered properties have little effect on the performanceon Random Walk, which is consistently a good performed.The Random Walk crawler, unlike the G1 methods, is ableto easily escape dense regions of the network, because thecrawler selects the next query node randomly from theneighbors of the current visited node. We see this behavioron the Facebook networks (Q ≥ 0.5), as well. Finally,average degree has the most effect on methods in G3.Higher average degree tends to increase the performance ofG3 methods, which do not encounter difficulty in movingbetween regions, because the crawler uniformly expandsthe sample frontier.
Limitations: Our experiments are conducted on net-works downloaded from SNAP and Network Repository.For the most part, these networks themselves representsamples of larger networks. To the best of our knowledge,the FB100 dataset, which contains all friendships betweenusers from different universities in 2005, is the only set of‘complete’ networks. This data was provided directly byFacebook [22]. However, because these networks are froman early point in Facebook’s history, they may not beaccurate representations of the current Facebook network.
Other networks are collected by crawling the originalnetworks, where the crawling method is often not publiclystated. The properties of these collected network maynot accurately reflect the the actual properties of thewhole underlying network, but it has been shown thatsome network properties are self-similar (same statisticalproperties at many scales) [26, 28]. Although, these sam-ples may not be perfect representations of the underlyingnetwork, they have been used to capture the communitystructure [18, 25], degree distribution [23] or clusteringcoefficient [17, 23] of the original networks.
IX. Conclusion
We evaluated the performance of crawling algorithmson the goal of maximizing node coverage with respect tothree network properties: community separation, com-munity size, and average degree. We defined five queryresponses based on real data collection scenarios. We per-formed a set of controlled experiments on synthetic andreal networks. We demonstrated that the performance ofcrawling methods highly depends on the network proper-ties. In particular, their performance is largely dependenton the ease with which the method is able to transitionbetween different regions of the graph. Lastly, we showedhow a user can select an appropriate crawling methodbased on the network type and queried response.

13
X. Acknowledgements
This work was supported by the U.S. Army ResearchOffice under grant #W911NF1810047. The authorsthank Jeremy Wendt of Sandia National Laboratoriesfor thoughtful conversations.
Appendix
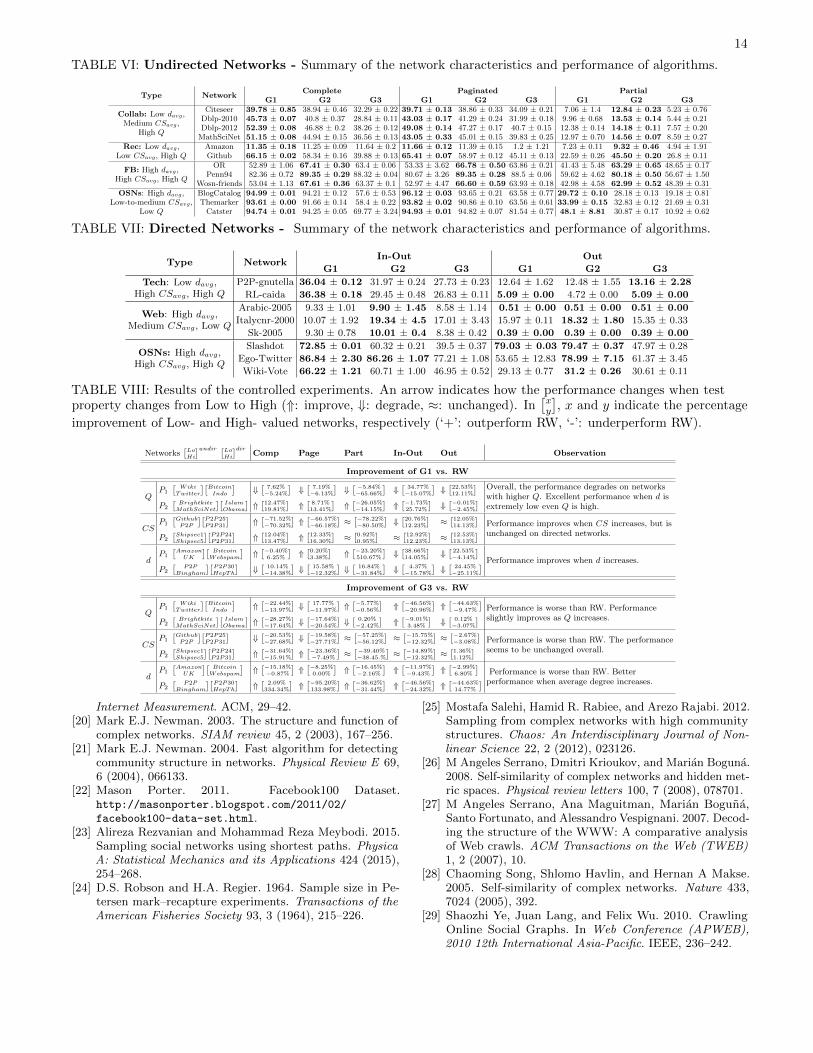
Table VIII shows the percentage improvement above (orbelow) the number of nodes found by RW of both pairs ‘P1’and ‘P2’ from the experiments in Section VI. Each rowcorresponds to a network property, and contains resultson network pairs that differ with respect to that property.The columns represent different query responses. Eachcell shows the performance improvement of G1 and G3as compared to the performance of Random Walk. Thearrow indicates how the performance changes (improvesor degrades) when the considered property changes fromlow value to higher value.
As we expected, the performance of G1 drops whenmodularity increases (pair P1). However, in pair P2, theperformance of G1 improves even when modularity in-creases because the selected network pairs have extremelylow average degree (all of them have the average degreeless than 10). When average community size is a con-trolled property, we see small changes for the complete,paginated and partial query models. This is because theselected networks have too large of a community sizerelative to the given query budget. Thus, we cannot ob-serve substantial changes in performance here. Lastly, asexpected, the performance of G3 methods increases asaverage degree increases.
Next, we show complete results of the experiments fromSection VII. We provide the mean and standard deviationof the percentage of node coverage in Tables VI and VIIfor undirected and directed networks.
[1] Serge Abiteboul, Mihai Preda, and Gregory Cobena. 2003.Adaptive on-line page importance computation. In Pro-ceedings of the 12th International Conference on WorldWide Web. ACM, 280–290.
[2] Nesreen K. Ahmed, Jennifer Neville, and Ramana Kom-pella. 2014. Network sampling: From static to streaminggraphs. ACM Transactions on Knowledge Discovery fromData (TKDD) 8, 2 (2014), 7.
[3] Yong-Yeol Ahn, Seungyeop Han, Haewoon Kwak, SueMoon, and Hawoong Jeong. 2007. Analysis of topologicalcharacteristics of huge online social networking services.In Proceedings of the 16th International Conference onWorld Wide Web. ACM, 835–844.
[4] Katchaguy Areekijseree, Ricky Laishram, and SuchetaSoundarajan. 2018. Guidelines for Online Network Crawl-ing: A Study of Data Collection Approaches and NetworkProperties. In Proceedings of the 10th ACM Conferenceon Web Science. ACM, 57–66.
[5] Katchaguy Areekijseree and Sucheta Soundarajan. 2018.DE-Crawler: A Densification-Expansion Algorithm forOnline Data Collection. In 2018 IEEE/ACM InternationalConference on Advances in Social Networks Analysis andMining (ASONAM). IEEE, 164–169.
[6] Konstantin Avrachenkov, Prithwish Basu, GiovanniNeglia, Bernardete Ribeiro, and Don Towsley. 2014. Payfew, influence most: Online myopic network covering. In2014 IEEE Conference on Computer CommunicationsWorkshops (INFOCOM WKSHPS). IEEE, 813–818.
[7] Vincent D. Blondel, Jean-Loup Guillaume, Renaud Lam-biotte, and Etienne Lefebvre. 2008. Fast unfolding ofcommunities in large networks. Journal of Statistical Me-chanics: Theory and Experiment 2008, 10 (2008), P10008.
[8] Stefano Boccaletti, Vito Latora, Yamir Moreno, Mar-tin Chavez, and D-U Hwang. 2006. Complex networks:Structure and dynamics. Physics reports 424, 4-5 (2006),175–308.
[9] Stephen Bonner, John Brennan, Georgios Theodoropou-los, Ibad Kureshi, and Andrew Stephen McGough. 2016.Deep topology classification: A new approach for massive
graph classification. In 2016 IEEE International Confer-ence on Big Data (Big Data). IEEE, 3290–3297.
[10] Andrei Broder, Ravi Kumar, Farzin Maghoul, PrabhakarRaghavan, Sridhar Rajagopalan, Raymie Stata, AndrewTomkins, and Janet Wiener. 2000. Graph structure inthe web. Computer networks 33, 1-6 (2000), 309–320.
[11] P Chen and Sidney Redner. 2010. Community struc-ture of the physical review citation network. Journal ofInformetrics 4, 3 (2010), 278–290.
[12] Minas Gjoka, Maciej Kurant, Carter T. Butts, and AthinaMarkopoulou. 2009. Unbiased sampling of facebook.preprint arXiv 906 (2009).
[13] Maciej Kurant, Athina Markopoulou, and Patrick Thiran.2010. On the bias of BFS. arXiv preprint arXiv:1004.1729(2010).
[14] Maciej Kurant, Athina Markopoulou, and Patrick Thiran.2011. Towards unbiased BFS sampling. IEEE Journalon Selected Areas in Communications 29, 9 (2011), 1799–1809.
[15] Ricky Laishram, Katchaguy Areekijseree, and SuchetaSoundarajan. 2017. Predicted max degree sampling:Sampling in directed networks to maximize node cov-erage through crawling. In 2017 IEEE Conference onComputer Communications Workshops (INFOCOM WK-SHPS). IEEE, 940–945.
[16] Andrea Lancichinetti, Santo Fortunato, and Filippo Radic-chi. 2008. Benchmark graphs for testing community detec-tion algorithms. Physical Review E 78, 4 (2008), 046110.
[17] Jure Leskovec and Christos Faloutsos. 2006. Samplingfrom large graphs. In Proceedings of the 12th ACMSIGKDD International Conference on Knowledge Dis-covery and Data Mining. ACM, 631–636.
[18] Arun S. Maiya and Tanya Y. Berger-Wolf. 2010. Samplingcommunity structure. In Proceedings of the 19th Interna-tional Conference on World Wide Web. ACM, 701–710.
[19] Alan Mislove, Massimiliano Marcon, Krishna P. Gum-madi, Peter Druschel, and Bobby Bhattacharjee. 2007.Measurement and analysis of online social networks. InProceedings of the 7th ACM SIGCOMM Conference on
14
TABLE VI: Undirected Networks - Summary of the network characteristics and performance of algorithms.
Type NetworkComplete Paginated Partial
G1 G2 G3 G1 G2 G3 G1 G2 G3
Collab: Low davg,Medium CSavg,
High Q
Citeseer 39.78 ± 0.85 38.94 ± 0.46 32.29 ± 0.22 39.71 ± 0.13 38.86 ± 0.33 34.09 ± 0.21 7.06 ± 1.4 12.84 ± 0.23 5.23 ± 0.76Dblp-2010 45.73 ± 0.07 40.8 ± 0.37 28.84 ± 0.11 43.03 ± 0.17 41.29 ± 0.24 31.99 ± 0.18 9.96 ± 0.68 13.53 ± 0.14 5.44 ± 0.21Dblp-2012 52.39 ± 0.08 46.88 ± 0.2 38.26 ± 0.12 49.08 ± 0.14 47.27 ± 0.17 40.7 ± 0.15 12.38 ± 0.14 14.18 ± 0.11 7.57 ± 0.20
MathSciNet 51.15 ± 0.08 44.94 ± 0.15 36.56 ± 0.13 43.05 ± 0.33 45.01 ± 0.15 39.83 ± 0.25 12.97 ± 0.70 14.56 ± 0.07 8.59 ± 0.27Rec: Low davg,
Low CSavg, High QAmazon 11.35 ± 0.18 11.25 ± 0.09 11.64 ± 0.2 11.66 ± 0.12 11.39 ± 0.15 1.2 ± 1.21 7.23 ± 0.11 9.32 ± 0.46 4.94 ± 1.91Github 66.15 ± 0.02 58.34 ± 0.16 39.88 ± 0.13 65.41 ± 0.07 58.97 ± 0.12 45.11 ± 0.13 22.59 ± 0.26 45.50 ± 0.20 26.8 ± 0.11
FB: High davg,High CSavg, High Q
OR 52.89 ± 1.06 67.41 ± 0.30 63.4 ± 0.06 53.33 ± 3.62 66.78 ± 0.50 63.86 ± 0.21 41.43 ± 5.48 63.29 ± 0.65 48.65 ± 0.17Penn94 82.36 ± 0.72 89.35 ± 0.29 88.32 ± 0.04 80.67 ± 3.26 89.35 ± 0.28 88.5 ± 0.06 59.62 ± 4.62 80.18 ± 0.50 56.67 ± 1.50
Wosn-friends 53.04 ± 1.13 67.61 ± 0.36 63.37 ± 0.1 52.97 ± 4.47 66.60 ± 0.59 63.93 ± 0.18 42.98 ± 4.58 62.99 ± 0.52 48.39 ± 0.31OSNs: High davg,
Low-to-medium CSavg,Low Q
BlogCatalog 94.99 ± 0.01 94.21 ± 0.12 57.6 ± 0.53 96.12 ± 0.03 93.65 ± 0.21 63.58 ± 0.77 29.72 ± 0.10 28.18 ± 0.13 19.18 ± 0.81Themarker 93.61 ± 0.00 91.66 ± 0.14 58.4 ± 0.22 93.82 ± 0.02 90.86 ± 0.10 63.56 ± 0.61 33.99 ± 0.15 32.83 ± 0.12 21.69 ± 0.31
Catster 94.74 ± 0.01 94.25 ± 0.05 69.77 ± 3.24 94.93 ± 0.01 94.82 ± 0.07 81.54 ± 0.77 48.1 ± 8.81 30.87 ± 0.17 10.92 ± 0.62
TABLE VII: Directed Networks - Summary of the network characteristics and performance of algorithms.
Type NetworkIn-Out Out
G1 G2 G3 G1 G2 G3
Tech: Low davg,High CSavg, High Q
P2P-gnutella 36.04 ± 0.12 31.97 ± 0.24 27.73 ± 0.23 12.64 ± 1.62 12.48 ± 1.55 13.16 ± 2.28
RL-caida 36.38 ± 0.18 29.45 ± 0.48 26.83 ± 0.11 5.09 ± 0.00 4.72 ± 0.00 5.09 ± 0.00
Web: High davg,Medium CSavg, Low Q
Arabic-2005 9.33 ± 1.01 9.90 ± 1.45 8.58 ± 1.14 0.51 ± 0.00 0.51 ± 0.00 0.51 ± 0.00
Italycnr-2000 10.07 ± 1.92 19.34 ± 4.5 17.01 ± 3.43 15.97 ± 0.11 18.32 ± 1.80 15.35 ± 0.33
Sk-2005 9.30 ± 0.78 10.01 ± 0.4 8.38 ± 0.42 0.39 ± 0.00 0.39 ± 0.00 0.39 ± 0.00
OSNs: High davg,High CSavg, High Q
Slashdot 72.85 ± 0.01 60.32 ± 0.21 39.5 ± 0.37 79.03 ± 0.03 79.47 ± 0.37 47.97 ± 0.28
Ego-Twitter 86.84 ± 2.30 86.26 ± 1.07 77.21 ± 1.08 53.65 ± 12.83 78.99 ± 7.15 61.37 ± 3.45
Wiki-Vote 66.22 ± 1.21 60.71 ± 1.00 46.95 ± 0.52 29.13 ± 0.77 31.2 ± 0.26 30.61 ± 0.11
TABLE VIII: Results of the controlled experiments. An arrow indicates how the performance changes when testproperty changes from Low to High (⇑: improve, ⇓: degrade, ≈: unchanged). In
[xy
], x and y indicate the percentage
improvement of Low- and High- valued networks, respectively (‘+’: outperform RW, ‘-’: underperform RW).
Networks[LoHi
]undir [LoHi
]dirComp Page Part In-Out Out Observation
Improvement of G1 vs. RW
QP1
[Wiki
][BitcoinIndo
]⇓[
7.62%−5.24%
]⇓[
7.19%−6.13%
]⇓[ −5.84%−65.66%
]⇓[
34.77%−15.07%
]⇓[22.53%12.11%
] Overall, the performance degrades on networkswith higher Q. Excellent performance when d isextremely low even Q is high.P2
[Brightkite
MathSciNet
][IslamObama
]⇑[12.47%19.81%
]⇑[8.71%13.41%
]⇑[−26.05%−14.15%
]⇑[−1.73%25.72%
]⇓[−0.01%−2.45%
]CS
P1
[GithubP2P
][P2P25P2P31
]⇑[−71.52%−70.32%
]⇑[−66.57%−66.18%
]≈
[−78.22%−80.50%
]⇓[20.76%12.23%
]≈
[12.05%14.13%
]Performance improves when CS increases, but isunchanged on directed networks.P2
[Shipsec1Shipsec5
][P2P24P2P31
]⇑[12.04%13.47%
]⇑[12.33%16.30%
]≈
[0.92%0.95%
]≈
[12.92%12.23%
]≈
[12.53%13.13%
]d
P1
[Amazon
UK
][Bitcoin
Webspam
]⇑[−0.40%
6.25%
]⇑[0.20%3.38%
]⇑[−23.20%510.67%
]⇓[38.66%14.05%
]⇓[22.53%−4.14%
]Performance improves when d increases.
P2
[P2P
Bingham
][P2P30HepTh
]⇓[
10.14%−14.38%
]⇓[
15.58%−12.32%
]⇓[
16.84%−31.84%
]⇓[
4.37%−15.78%
]⇓[
24.45%−25.11%
]Improvement of G3 vs. RW
QP1
[Wiki
][BitcoinIndo
]⇑[−22.44%−13.97%
]⇓[
17.77%−11.97%
]⇑[−5.77%−0.56%
]⇑[−46.56%−20.96%
]⇑[−44.63%−9.47%
]Performance is worse than RW. Performanceslightly improves as Q increases.P2
[Brightkite
MathSciNet
][IslamObama
]⇑[−28.27%−17.64%
]⇓[−17.64%−20.54%
]⇓[
0.20%−2.42%
]⇑[−9.01%
3.48%
]⇓[
0.12%−3.07%
]CS
P1
[GithubP2P
][P2P25P2P31
]⇓[−20.53%−27.68%
]⇓[−19.58%−27.71%
]≈
[−57.25%−56.12%
]≈
[−15.75%−12.32%
]≈
[−2.67%−3.08%
]Performance is worse than RW. The performanceseems to be unchanged overall.P2
[Shipsec1Shipsec5
][P2P24P2P31
]⇑[−31.64%−15.91%
]⇑[−23.36%−7.49%
]≈
[−39.40%−38.45.%
]≈
[−14.89%−12.32%
]≈
[1.36%1.12%
]d
P1
[Amazon
UK
][Bitcoin
Webspam
]⇑[−15.18%−0.87%
]⇑[−8.25%
0.00%
]⇑[−16.45%−2.16%
]⇑[−11.97%−9.43%
]⇑[−2.99%
6.80%
]Performance is worse than RW. Better
performance when average degree increases.P2
[P2P
Bingham
][P2P30HepTh
]⇑[
2.09%334.34%
]⇑[−95.20%133.98%
]⇑[−36.62%−31.44%
]⇑[−46.56%−24.32%
]⇑[−44.63%
14.77%
]Internet Measurement. ACM, 29–42.
[20] Mark E.J. Newman. 2003. The structure and function ofcomplex networks. SIAM review 45, 2 (2003), 167–256.
[21] Mark E.J. Newman. 2004. Fast algorithm for detectingcommunity structure in networks. Physical Review E 69,6 (2004), 066133.
[22] Mason Porter. 2011. Facebook100 Dataset.http://masonporter.blogspot.com/2011/02/
facebook100-data-set.html.[23] Alireza Rezvanian and Mohammad Reza Meybodi. 2015.
Sampling social networks using shortest paths. PhysicaA: Statistical Mechanics and its Applications 424 (2015),254–268.
[24] D.S. Robson and H.A. Regier. 1964. Sample size in Pe-tersen mark–recapture experiments. Transactions of theAmerican Fisheries Society 93, 3 (1964), 215–226.
[25] Mostafa Salehi, Hamid R. Rabiee, and Arezo Rajabi. 2012.Sampling from complex networks with high communitystructures. Chaos: An Interdisciplinary Journal of Non-linear Science 22, 2 (2012), 023126.
[26] M Angeles Serrano, Dmitri Krioukov, and Marian Boguna.2008. Self-similarity of complex networks and hidden met-ric spaces. Physical review letters 100, 7 (2008), 078701.
[27] M Angeles Serrano, Ana Maguitman, Marian Boguna,Santo Fortunato, and Alessandro Vespignani. 2007. Decod-ing the structure of the WWW: A comparative analysisof Web crawls. ACM Transactions on the Web (TWEB)1, 2 (2007), 10.
[28] Chaoming Song, Shlomo Havlin, and Hernan A Makse.2005. Self-similarity of complex networks. Nature 433,7024 (2005), 392.
[29] Shaozhi Ye, Juan Lang, and Felix Wu. 2010. CrawlingOnline Social Graphs. In Web Conference (APWEB),2010 12th International Asia-Pacific. IEEE, 236–242.