Embed Size (px)
DESCRIPTION
Signaling in cochlear hair cells experiment done in 1979, revolutionizing what we thought about the distribution of BK channels along the basilar membrane of various specis
Citation preview
J. Phwyjol. (1980), 306, pp. 79-125 79With 2 plate and 21 text-ftgure8Printed in Great Britain
THE FREQUENCY SELECTIVITY OF AUDITORY NERVE FIBRESAND HAIR CELLS IN THE COCHLEA OF THE TURTLE
BY A. C. CRAWFORD AND R. FETTIPPLACEFrom the Physiological Laboratory, University of Cambridge,
Downing Street, Cambridge
(Received 16 Augwst 1979)
SUMMARY
1. The electrical responses of single auditory nerve fibres or cochlear hair cellswere recorded in the isolated half-head of the turtle Pseudemys scripta elegant.Responses to sound stimuli presented to the tympanum could be recorded for atleast 4 hr after isolation.
2. Impulses were recorded extracellularly from single auditory nerve fibres. Fortones of suprathreshold intensity the impulses occurred with a preferred phaserelation (i.e. they were phase-locked) to the cycles of the sound stimulus. Nervefibres had sharp tuning curves (Qlo db = 0.5-75) with single characteristic frequencies(c.f.) ranging from about 30 to 700 Hz. Best threshold sensitivities of fibres at theirc.f. were in the region of 30-40 db sound pressure level with respect to 20 #Pa.
3. Intracellular recordings were made from hair cells in the basilar papilla. Follow-ing injection of a fluorescent dye into a cell through the recording electrode, the dyewas localized in a single hair cell in a transverse section of the cochlea.
4. Hair cells had resting potentials of about -50 mV, and, to low frequencytones, gave periodic responses graded with the intensity and frequency of thestimulus. Recordings were obtained from cells with characteristic frequenciesbetween 70 and 670 Hz.
5. The voltage response to a pure tone at low sound pressure was sinusoidal forall frequencies of stimulation; at higher sound pressures a number of non-linearitieswere apparent in the response wave form. One of these was a steady depolarizingcomponent, which, relative to the periodic component of the response, was mostprominent at high frequencies.
6. The amplitude of the response evoked in a hair cell by a low intensity tone waslinearly related to the sound pressure; for loud sounds, the response eventuallyreached a saturating amplitude, which in some cells was as great as 30-45 mV peak-to-peak.
7. The linear sensitivity of a hair cell is defined as the r.m.s. voltage for a linearresponse of the cell at its c.f. divided by the sound pressure at the tympanum. In themost sensitive cells this value was 30-90 mV/Pa.
8. If the frequency selectivity of a hair cell was expressed in terms of the soundpressure needed to produce a constant amplitude of response, the sharpness of thisfrequency selectivity was found to be virtually independent of the response criterionfor responses between 1 and 10 mV; in the cells which gave the largest responses, the
0022-3751/80/1490-0458 $07.50 © 1980 The Physiological Society
A. C. CRAWFORD AND R. FETTIPLACE
frequency selectivity expressed in this way was comparable to that of the nervefibres. Cells with smaller maximum responses often had broader tuning curves.
9. Responses of hair cells to short low intensity tone bursts at the c.f. built upapproximately exponentially during the tone, and decayed away exponentiallywhen the tone was terminated. The terminal oscillations were at the c.f. of the cell,and independent of the frequency of stimulation.
10. From the time constant of the build up and decay of the linear response to atone burst at the c.f. the sharpness of tuning of the cell was estimated and found toagree with that obtained from the responses of the cell to continuous tones. The mosthighly tuned cells had quality factors (Q3 db) in the range 5-10.
11. The c.f. of a hair cell was correlated with its position along the basilar mem-brane. Low frequency hair cells were located towards the apical or lagenar end andhigh frequency cells were found towards the basal or saccular end. On the assump-tion of an exponential distribution of c.f. with distance, each octave occupied about94 1sm along the membrane.
12. A hair cell's response to a click was a decaying oscillation at the characteristicfrequency of the cell. From the initial polarity of the responses to condensation andrarefaction clicks it was concluded that the hair cell depolarized as a result of move-ments of the basilar membrane towards the scala vestibule, and hyperpolarized formotion towards the scala tympani.
13. In the absence of deliberate sound stimulation, the hair cell voltage fluctuatedcontinuously about its mean level. The principal frequency components in the noisewere concentrated around the c.f. of the cell. The voltage noise in the hair cellsshowed no significant cross-correlation with sound pressure fluctuations at thetympanum.
INTRODUCTION
It is generally assumed that the cochlear hair cells are responsible for convertingbasilar membrane motion into electrical signals which are then relayed via theauditory nerve to the brain. Although the responses of single auditory nerve fibreshave been extensively studied (for reviews see Kiang, Watanabe, Thomas & Clark,1965; Rose, 1970; Evans, 1975) little is known about the functioning of the haircells and their contribution in shaping the discharge of the nerve fibres. The objectof the present work was to examine, by means of intracellular recording, the propertiesof the hair cells in the cochlea of the turtle Pseudemys scripta elegant.As a measure of the auditory receptor potential, the cochlear microphonic that
can be recorded with extracellular electrodes (Adrian, 1931; Dallos, 1973) is un-satisfactory, since at best it probably represents the activity of a large number ofcells. However, it has proved difficult to make intracellular recordings from singlecochlear hair cells in intact anaesthetized animals. Responses have been reported forthese cells in the alligator lizard (Mulroy, Altmann, Weiss & Peake, 1974) and theguinea-pig (Russell & Sellick, 1978). We have tried to avoid the problem inherentin experiments on whole animals by using an isolated reptilian preparation. This typeof preparation was originally described by Adrian, Craik & Sturdy (1938) and itoffers the advantage of the greater mechanical stability which is needed for intra-cellular recording.
$0
RESPONSES OF TURTLE HAIR CELLSIn this paper our concern has been with describing some of the general properties
of the hair cell's responses to pure tones, and assessing to what extent these responsesare consistent with the discharge in the auditory nerve fibres. The selectivity ofthe response for tones of different frequencies has been measured and under thebest circumstances is shown to be comparable to the tuning of the nerve fibres in thesame kind of preparation. We have suggested previously that the cochlea's frequencyselectivity in this animal arises in two stages and that the second stage may reside inthe cell itself (Crawford & Fettiplace, 1978; Fettiplace & Crawford, 1978). In alater paper (Crawford & Fettiplace, 1980) we will examine the evidence for this ideain more detail and show that the second filtering stage, which is the most important,may be attibutable to an electrical resonance in the hair cell.
METHODSPreparation
Experiments were performed on the isolated half-head of the red-eared turtle, Pmeudemy88cripta elegan&. In most cases juvenile specimens, carapace length 30-35 mm, were used. Afterdecapitation and sagittal sectioning of the head, most of the brain was removed except for asmall piece of the medulla which was left attached to the intact auditory and facial nerves. Carewas taken to cut the other caudal cranial nerves close to the brain surface and sot interferewith the meninges or the periotic sac in the region of the vagal foramen (Adrian et al. 1938). Theotic capsule was then opened on the cranial side, thus exposing the scala tympani and givingaccess to the basilar membrane over most of its length, and also to the cochlear ganglion andthe neural limb. The half-head was placed in a closed chamber gassed with a moist 95% 02:5%CO2 mixture, as shown in Fig. 1A. The scala tympani was flushed periodically with Ringerssolution, the fluid level being maintained close to normal. The composition of the Ringer solutionwas (Dessauer, 1970): 130 mM-NaCl; 4 mm-KCl; 2-8 mm-CaCl2; 2-2 m¶-MgCl2; 5-0 mM-Trischloride buffer, pH 7- 8. The experimental chamber was positioned on a large steel table mountedon inflated rubber inner tubes which served to isolate the preparation from mechanical vibrationstransmitted through the building. The resonant frequency of the table perpendicular to thetympanum was 5-6 Hz as measured with a Bruel & Kjaer 8603 accelerometer. In the auditoryrange, the principal disturbing displacements of the chamber perpendicular to the tympanumwere at 98, 242 and 484 Hz and had a maximum amplitude of less than 0- Inm. Since this is com-parable to the displacement of the tympanum at the auditory threshold of the turtle (0-1 nm at40 db re 20 Pa from the data of Moffat & Capranica, 1978), it seems unlikely that the cochleais subject to vibrational stimulation in our experiments. Experiments were carried out at roomtemperature (19-25 "C) and usually lasted for 3-4 hr, over which period there was no evidence ofa deterioration in the preparation.
AnatomyThe anatomy of the labyrinth in P8eudemy8 has been described in detail by Baird (1960, 1974).
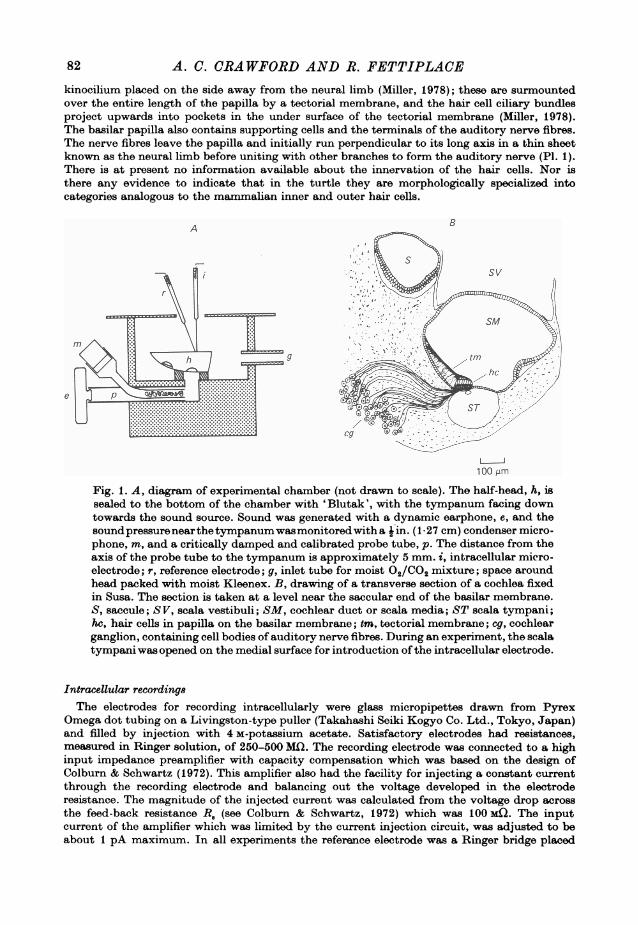
The anatomy of the cochlea shows considerable variation among different reptiles (Wever, 1978),and the following is a brief summary of the main features of the cochlea in P8eudemy8. Some ofthese features are visible in PI. 1 and Fig. 1 B. P1. 1 shows a photomicrograph of a stainedwhole-mount of the cochlear duct of a juvenile; Fig. 1 B is a drawing of a transverse sectionthrough the cochlea near its basal end, and shows the basilar papilla, and the arrangement ofthe scale. The cochlear duct, which is homologous to the mammalian structure, is an uncoiledtube which terminates blindly as the lagena. The basilar membrane is roughly elliptical, andthe dimensions of the major and minor axes are about 700 and 170 ,c.m in juvenile specimens(see P1. 1). The sensory organ is the basilar papilla, which is seated upon the basilar membraneover towards the neural edge (Fig. 1 B). The papilla is composed largely of columnar hair cells,and tapers from about twelve hair cells in width at the apical end near the lagena down to aboutthree hair cells in width at the basal end close to the saccule and contains a total of about 1000hair cells arranged in about 100 rows. The hair cells are unidirectionally oriented with their
81
82 A. C. CRAWFORD AND R. FETTIPLACE
kinocilium placed on the side away from the neural limb (Miller, 1978); these are surmountedover the entire length of the papilla by a tectorial membrane, and the hair cell ciliary bundlesproject upwards into pockets in the under surface of the tectorial membrane (Miller, 1978).The basilar papilla also contains supporting cells and the terminals of the auditory nerve fibres.The nerve fibres leave the papilla and initially run perpendicular to its long axis in a thin sheetknown as the neural limb before uniting with other branches to form the auditory nerve (PI. 1).There is at present no information available about the innervation of the hair cells. Nor isthere any evidence to indicate that in the turtle they are morphologically specialized intocategories analogous to the mammalian inner and outer hair cells.
AB
/~~~~~~~~~~
m= ~ ~~~~~~~~~~~~~~~~~~~~~~ V
100 pm
Fig. 1. A, diagram of experimental chamber (not drawn to scale). The half-head, h, issealed to the. bottom of the chamber with 'Blutak ', with the tympanum facing downtowards the sound source. Sound was generated with a dynamic earphone, e, and thesoundpressurenearthetympanumwas monitoredwith a i in. (1127 cm) condenser micro-phone, m, and a critically damped and calibrated probe tube, p. The distance from theaxis of the probe tube to the tympanum is approximately 5 mm. i, intracellular micro-electrode; r, reference electrode; g, inlet tube for moist 02/C02 mixture; space aroundhead packed with moist Kleenex. B, drawing of a transverse section of a cochlea fixedin Susa. The section is taken at a level near the saccular end of the basilar membrane.5, saccule; SV, scala vestibuli; SM, cochlear duct or scala media; ST scala tympani;he, hair cells in papilla on the basilar membrane; tin, t~ectorial membrane; eg, cochlearganglion, containing cell bodies of auditory nerve fibres. During an experiment, the scalatympani was opened on the medial surface for introduction of the intracellular electrode.
Intracellular recordingsThe electrodes for recording intracellularly were glass micropipettes drawn from Pyrex
Omega dot tubing on a Livingston-type puller (Takahashi Seiki Kogyo Co. Ltd., Tokyo, Japan)and filled by injection with 4 M-potassium acetate. Satisfactory electrodes had resistances,measured in Ringer solution, of 250-500 Mfl. The recording electrode was connected to a highinput impedance preamplifier with capacity compensation which was based on the design ofColburn & Schwartz (1972). This amplifier also had the facility for injecting a constant currentthrough the recording electrode and balancing out the voltage developed in the electroderesistance. The magnitude of the injected current was calculated from the voltage drop acrossthe feed-back resistanceRb (see Colburn &itSchwartz, 1972) which was 100f igThe inputcurrent of the amplifier which was limited by the current injection circuit, was adjusted to beabout 1 pA maximum. In all experiments the reference electrode was a Ringer bridge placed
RESPONSES OF TURTLE HAIR CELLS 83
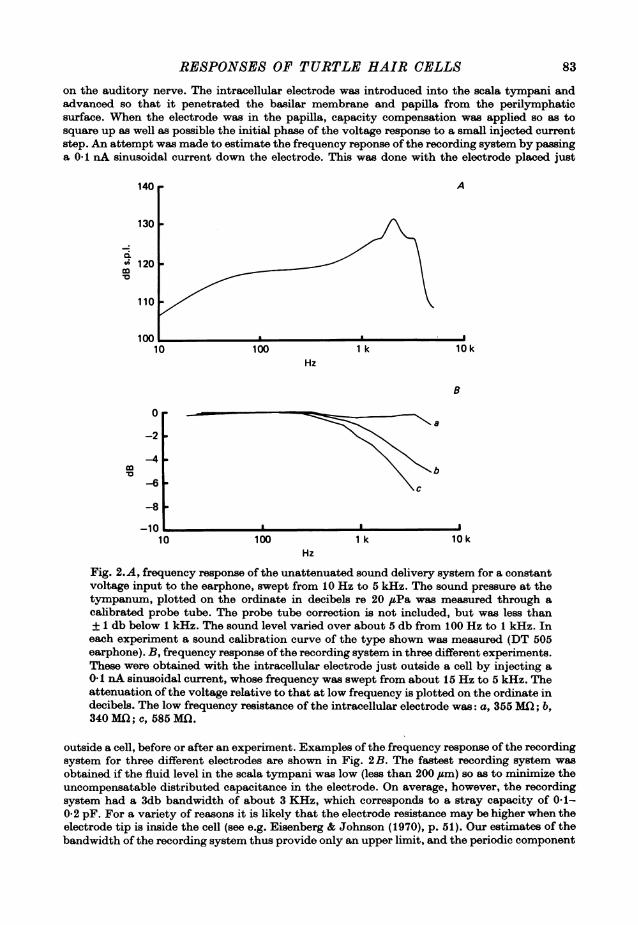
on the auditory nerve. The intracellular electrode was introduced into the scala tympani andadvanced so that it penetrated the basilar membrane and papilla from the perilymphaticsurface. When the electrode was in the papilla, capacity compensation was applied so as tosquare up as well as possible the initial phase of the voltage response to a small injected currentstep. An attempt was made to estimate the frequency reponse of the recording system by passinga 0*1 nA sinusoidal current down the electrode. This was done with the electrode placed just
140 A
130
" 120
110
10010 100 1 k 10k
Hz
0a-2
-4b
-6C
-8
-1010 100 1 k 10k
Hz
Fig. 2.A, frequency response of the unattenuated sound delivery system for a constantvoltage input to the earphone, swept from 1O Hz to 5 kHz. The sound pressure at thetympanum, plotted on the ordinate in decibels re 20 ,uPa was measured through acalibrated probe tube. The probe tube correction is not included, but was less than+1 db below 1 kHz. The sound level varied over about 5 db from 100 Hz to 1 kHz. Ineach experiment a sound calibration curve of the type shown was measured (DT 505earphone). B, frequency response ofthe recording system in three different experiments.These were obtained with the intracellular electrode just outside a cell by injecting a0.1 nA sinusoidal current, whose frequency was swept from about 15 Hz to 5 kHz. Theattenuation of the voltage relative to that at low frequency is plotted on the ordinate indecibels. The low frequency resistance of the intracellular electrode was: a, 355 MD; b,340 MCI; c, 585 MD.
outside a cell, before or after an experiment. Examples of the frequency response of the recordingsystem for three different electrodes are shown in Fig. 2B. The fastest recording system wasobtained if the fluid level in the scala tympani was low (less than 200 Gum) so as to minimize theuncompensatable distributed capacitance in the electrode. On average, however, the recordingsystem had a 3db bandwidth of about 3 KHz, which corresponds to a stray capacity of 0-1-0-2 pF. For a variety of reasons it is likely that the electrode resistance may be higher when theelectrode tip is inside the cell (see e.g. Eisenberg & Johnson (1970), p. 51). Our estimates of thebandwidth of the recording system thus provide only an upper limit, and the periodic component
84 A. C. CRAWFORD AND R. FETTIPLACE
of the hair cell potentials above 1 kHz may have been subject to some attenuation. All dataduring an experiment was recorded at 15 in./sec on an FM tape recorder (Racal Store 4) witha band width DC to 5 kHz.
Penetration of cells was accomplished by applying an oscillating voltage to the electrode tipby over-compensating the capacitance neutralization (see Baylor, Fuortes & O'Bryan, 1971).This could be achieved without disturbing the setting previously established for neutralizingthe input capacity. Intracellular recordings were made from more than sixty hair cells, withmaximum peak-to-peak responses of 10 mV or more; however, most of the information in theresults is derived from twenty-three of these cells, each of which gave a maximum response ofover 15 mV. The mean duration of a recording was about 20 min, but several cells were heldfor up to an hour.The high resistance of the intracellular micro-electrode introduced considerable noise into
the electrical records, in addition to any biological noise present, which could also be substantial(see Results). Thus in order to improve the resolution in the recordings of responses to tonebursts, these responses were often subsequently averaged on a Biomac 500 signal averagingcomputer. To achieve a signal-to-noise improvement in the responses to tones of swept frequencythese responses were measured with two phase-lock amplifiers (Brookdeal 9503 SC and 5042omniphase). The amplifiers were referenced in quadrature to the driving signal delivered to theearphone and were set in the 'sinetrac' mode in order to measure the amplitude and phase ofthe fundamental component of the hair cell's response. This technique was used to obtain thelinear iso-intensity tuning curve of a hair cell, the measuring band width being 0 25-2 5 Hz.
Noise spectra were measured with the two phase-lock amplifiers on pieces of record about30-60 see in duration. Spot measurements were made at a series of frequencies determined bythat of an external reference signal supplied from an independent oscillator. The time constantT of the phase-lock loop was set at 300 msec, and hence the noise equivalent band width jT(see Gardner, 1966) was 0O833 Hz. The modulus output of the 'omniphase' was smoothed witha 6 see time constant. The method was used for obtaining spectra of the noise in the voltagerecordings and also the spectrum of the room noise.
Extracellular recordingsImpulses were recorded extracellularly from auditory nerve fibres using glass micropipettes
filled with 3 M-NaCl (resistances in Ringer solution 20-40 Mn). The impulses were amplifiedand displayed on an oscilloscope, or fed into earphones for audiovisual determination of thethreshold response. This was accomplished by adjusting the sound stimulus until it was justpossible to see or hear a change in the pattern of the impulse discharge above the spontaneouslevel. In some experiments, peri-stimulus histograms of the timing of the impulses were con-structed using the Biomac. The audiovisual threshold corresponded approximately to a doublingin the firing rate over the spontaneous level on the peaks of the responses.The extracellular recordings were obtained with the electrode either in the auditory nerve or,
in three experiments, in the neural limb adjacent to the papilla. In all cases, the scala tympanihad been opened and the preparation was identical to that used for intracellular recordings fromcells in the papilla. When recordings were made in the eighth nerve, units were sometimes ob-tained which were not driven by auditory stimuli. Some of these had rhythmic activity whichcould be altered by rocking the anti-vibration table on which the preparation was mounted.
Dye marking of hair cellsWhen the intracellular micro-electrode was in a cell in the basilar papilla one of two categories
of response to sound could be recorded, and these were distinguishable as described in theResults. In order to verify which response was originating in the hair cells, we carried out aseries of experiments to mark the impaled cell by injecting a fluorescent dye, Lucifer yellowCH (Stewart, 1978) from the electrode. The electrodes were filled with a 5% solution of the Lisalt of the dye and had resistances of 1-2 GQ. The dye was ionophoresed into cells by 0*5 seepulses of inward current (0.5-1.0 nA). The response of the cell to sound was checked periodicallyduring the current injection and the process terminated if the response failed. After an experi-ment, the half-head was fixed in 4% formaldehyde buffered with 0 1 M-phosphate, pH 7-2.The cochlea was subsequently dissected out, embedded in paraffin wax and cut into transversesections 10 gm in thickness.
RESPONSES OF TURTLE HAIR CELLS 85
Dye-marked cells were localized in the sections by their yellow-green fluorescence. Out oftwenty-two cells which were injected, seven hair cells were clearly stained and no dye wasfound in any other type of cell. An example of a section containing a dye marked hair cell isshown in PI. 2.
Sound stimulation
Tones were generated by a dynamic earphone (Beyer DT505 or DT48) connected to the earvia a sealed coupler (see Fig. 1). The sound pressure near the tympanum expressed in the textin decibels sound pressure level (db s.p.l.) relative to 20 pAPa (Pa = N/M2), was monitored witha calibrated M in. (1-27 cm) condenser microphone (Bruel & Kjaer, 4134) and probe tube. Themicrophone was connected through its preamplifier to a measuring amplifier (Briiel & Kjaer,2608). The probe tube was damped and calibrated, either separately using a Bruel & Kjaercoupler or in the experimental chamber by substituting a second microphone in the position ofthe tympanum. An example of the frequency response of the sound-producing system underexperimental conditions is shown in Fig. 2A.For producing tone bursts or clicks, the driving sinusoid delivered to the earphone was genera-
ted by gating the output of a function generator (Feedback TWG 500). The sinusoid was gatedat a fixed point in the cycle, thus ensuring that the phase of the sinusoid and the number ofcycles within a tone burst were the same for each of a given set of stimuli. The output of thefunction generator was then attenuated by a Hatfield 2135 balanced attenuator and fed througha driver amplifier to the earphone. Tone bursts were sometimes shaped by bandpass filteringprior to attenuation. This was done using six-pole Butterworth high and low-pass filters setas close to the stimulating frequency as possible. This arrangement also had the virtue of reducingthe harmonic distortion in the output of the function generator.
Swept-frequency continuous tones were generated by a digital oscillator. This operated byreading cyclically through a quarter cycle sine table in a read-only memory (Signetics, 256 by8 bit ROM programmed by Farnell). The resulting sine wave contained 1024 points per cycle,and its frequency could be varied continuously depending upon the rate at which the numbers inthe table were transferred. This was determined by a clock whose frequency was controlled, upto a maximum of 10 MHz, by a ramp voltage. For most experiments the frequency of the outputsignal was swept exponentially from 5 Hz to 5 kHz over a duration of about 1 min. Since thefull range of the signal was quantized into 512 levels, there was an error in the sine wave whichwas equivalent to an added noise. It may be shown (Bendat & Piersol, 1971, p. 232) that thesignal-to-noise ratio is about 60 db.For swept tones and filtered tone bursts of frequencies above 30 Hz the second harmonic in
the sound stimulus was less than -62 db relative to the fundamental when the sound pressureof the fundamental was at 120 db s.p.l. The second harmonic was the major distortion productin the sound and, under these conditions, was generated chiefly by the earphone. For unfilteredtone bursts, the second harmonic distortion was determined by the function generator and wasless than -48 db relative to the fundamental.No precautions were taken to sound-proof the preparation, this being originally justified in
terms of the lower auditory sensitivity of the turtle as compared to the mammal. On severaloccasions, however, the background noise in the room was measured, and was found to have atotal pressure of about 56 db s.p.l. at the tympanum in the frequency band 5 Hz-5 kHz. Thespectrum of the noise was pink, i.e. its amplitude fell linearly with frequency and had a valueof the order of 3 x 10⁻⁴ Pa/VHz at 100 Hz.
Correlation mea8urements
Cross-correlation functions between pressure and voltage (Rv) were calculated (Bendat &Piersol, 1971) as
RPV(') = | p(t). V(t+r) dt, (1)
where p(t) and V(t) are simultaneous samples of duration T, of the sound pressure fluctuationsand the hair cell voltage fluctuations respectively, and r is the lag time. All cross-correlation
86 A. C. CRAWFORD AND R. FETTIPLACEfunctions were normalized to give the cross-correlation coefficient (ply) by
pV(r) = (2) (2)
where o-." andary2 are the variances of the samples of acoustic noise and hair cell voltage noise
respectively. pv(r) then lies in the range + 1 to - 1. Computations were performed on a PDP-11laboratory computer according to the direct procedure outlined by Bendat & Piersol (1971,
p. 332), using a programme written by Dr T. D. Lamb. Sample records varied between 512 and4096 points with an interpoint interval of 0.5ms. All samples were low-pass filtered at 700 Hz
using a six-pole active filter to prevent aliasing. The standard deviation of the correlationcoefficient (SDp) is given (Bendat & Piersol, 1971) by
SD,, =I{1 +p2}), (3)
V2BTwhere B is the bandwidth of the correlation, in this case1 kHz. Values of SDp are given in thetext.
Triggered correlation functions between sound pressure at the tympanum and auditory nervedischarge were obtained according to the methods of de Boer (1968). Samples of auditory nervedischarge were obtained both in the absence of intentional acoustic stimulation and underconditions where the preparation was stimulated with noise signals at different levels. Electricalnoise signals were produced by a pseudo-random noise generator, clocked through a 65535sequence at 5 kHz. Triggered correlograms were obtained by using each spike in the nerve
discharge, played backwards from the tape recorder, to trigger the sweep of an averaging com-
puter (Biomac 500) and thus averaged 20 ms samples of the sound pressure at the tympanumthat preceded each sweep. Between 1024 and 16 384 sweeps were collected for each correlogram.The procedure reveals consistent features (if any) of the pressure wave form that immediatelyprecedes the occurrence of a spike in the auditory nerve. If the ear is stimulated with whitenoise the triggered correlogram under certain conditions is related to the impulse response of the
pathway leading to the nerve fibre (de Boer & Kuyper, 1968; de Boer, 1968).
RESULTS
The responses of auditorynerve fibresIn the first part of the investigation, we were concerned with establishing the
capabilities of the cochlea in the isolated preparation, by recording the responsesof single fibres in the auditory nerve. The nerve fibres continued to give responses tosound for several hours after beginning an experiment, and there was no majordeterioration in sensitivity or sharpness of tuning over this period. The nerve fibresresponded to sounds containing frequency components between about 10 Hz and
1 kHz, and the pattern of responses resembled that previously described for lowfrequency fibres of the mammalian auditory nerve. Some of the properties of the
responses are illustrated in Fig. 3, which gives histograms of the probability offiring of a single fibre to tone bursts at its characteristic frequency at various in-tensities. In the absence of an applied sound, each nerve fibre exhibited a spontaneousdischarge of impulses, whose mean rate varied from one fibre to another between afew impulses per sec up to about 70 per sec. In response to pure tones, the impulsessynchronized at a constant phase to the cycles of the sound stimulus, and for lowintensities the firing was modulated approximately sinusoidally about the basallevel, thus reflecting the stimulus wave form. This can be seen for the responses tothe lowest intensities for the cell of Fig. 3; the spontaneous firing rate was about60 spikes/sec and in response to a 165 Hz tone at 40 db s.p.l. (the second lowest in-
86
RESPONSES OF TURTLE HAIR CELLS
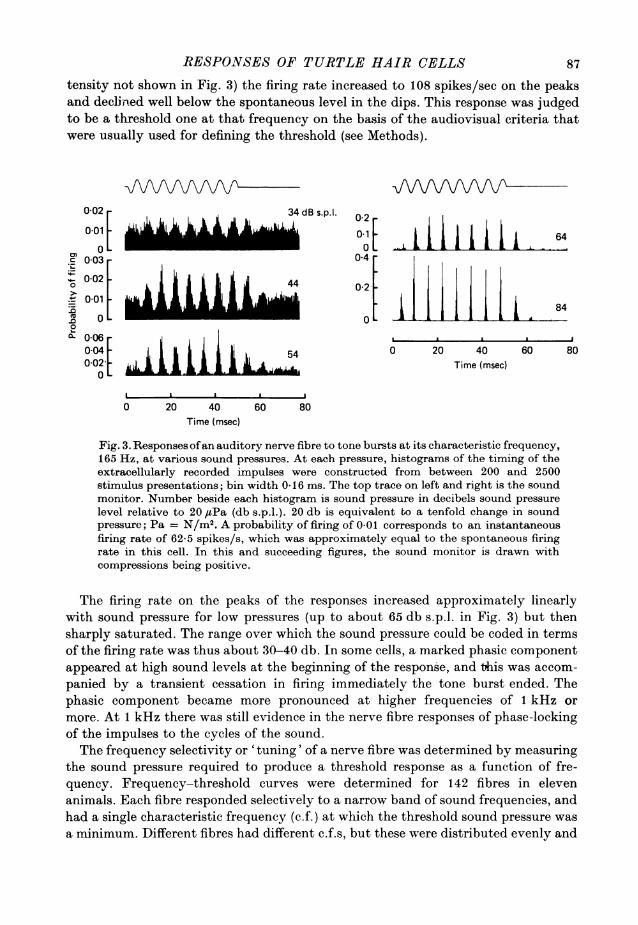
tensity not shown in Fig. 3) the firing rate increased to 108 spikes/sec on the peaksand declined well below the spontaneous level in the dips. This response was judgedto be a threshold one at that frequency on the basis of the audiovisual criteria thatwere usually used for defining the threshold (see Methods).
0-02[ 34dB s.p.l. 0-2-
~~[jjjjjj~~~~j 640M 04-c 0-03 -
- 002 02
0-01I i8
IL 0-06. . ..004 -5 4 ° 20 40 60 80
0J-02'- iL~1Time (msec)
I I
0 20 40 60 80Time (msec)
Fig. 3. Responses ofan auditory nerve fibre to tone bursts at its characteristic frequency,165 Hz, at various sound pressures. At each pressure, histograms of the timing of theextracellularly recorded impulses were constructed from between 200 and 2500stimulus presentations; bin width 0-16 ms. The top trace on left and right is the soundmonitor. Number beside each histogram is sound pressure in decibels sound pressurelevel relative to 20 #uPa (db s.p.l.). 20 db is equivalent to a tenfold change in soundpressure; Pa = N/M2. A probability of firing of 0 01 corresponds to an instantaneousfiring rate of 62 5 spikes/s, which was approximately equal to the spontaneous firingrate in this cell. In this and succeeding figures, the sound monitor is drawn withcompressions being positive.
The firing rate on the peaks of the responses increased approximately linearlywith sound pressure for low pressures (up to about 65 db s.p.l. in Fig. 3) but thensharply saturated. The range over which the sound pressure could be coded in termsof the firing rate was thus about 30-40 db. In some cells, a marked phasic componentappeared at high sound levels at the beginning of the response, and this was accom-panied by a transient cessation in firing immediately the tone burst ended. Thephasic component became more pronounced at higher frequencies of 1 kHz ormore. At 1 kHz there was still evidence in the nerve fibre responses of phase-lockingof the impulses to the cycles of the sound.The frequency selectivity or 'tuning' of a nerve fibre was determined by measuring
the sound pressure required to produce a threshold response as a function of fre-quency. Frequency-threshold curves were determined for 142 fibres in elevenanimals. Each fibre responded selectively to a narrow band of sound frequencies, andhad a single characteristic frequency (c.f.) at which the threshold sound pressure wasa minimum. Different fibres had different c.f.s, but these were distributed evenly and
87
A. C. CRAWFORD AND R. FETTIPLACE
unimodally in the range 30-700 Hz. There was no evidence of any large gaps ordiscontinuities in the frequency representation in this range although the accuracywith which this point could be established was limited by the small number offibres sampled. The continuity is best judged by the results shown in Figs. 5 and 6.
IlI11I1
tt
I I II I I I
100Hz
I I I I 1 1 111
1 k
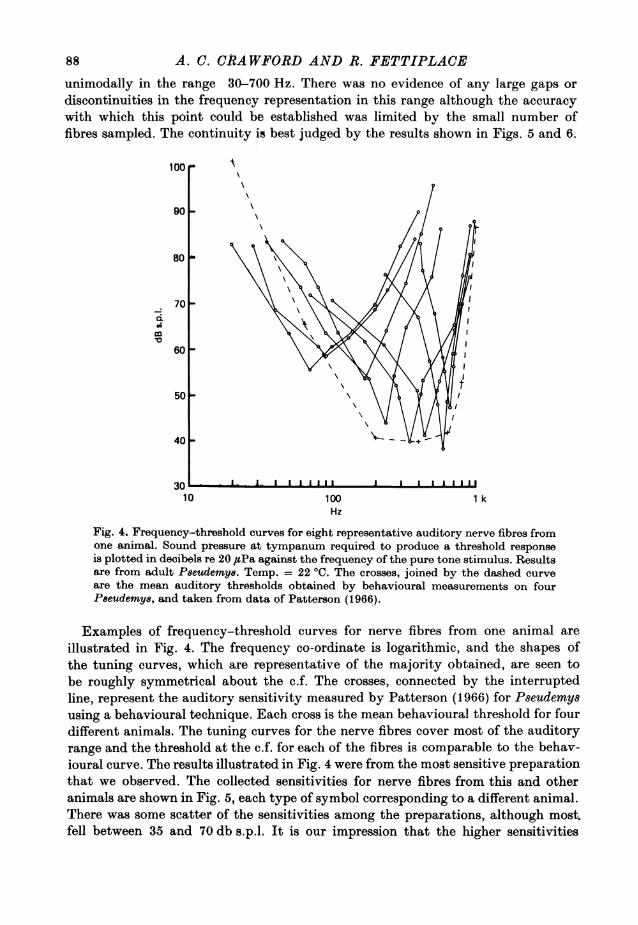
Fig. 4. Frequency-threshold curves for eight representative auditory nerve fibres fromone animal. Sound pressure at tympanum required to produce a threshold response
is plotted in decibels re 20 #sPa against the frequency of the pure tone stimulus. Resultsare from adult Peeudemye. Temp. = 22 'C. The crosses, joined by the dashed curve
are the mean auditory thresholds obtained by behavioural measurements on fourP8eudemy8, and taken from data of Patterson (1966).
Examples of frequency-threshold curves for nerve fibres from one animal are
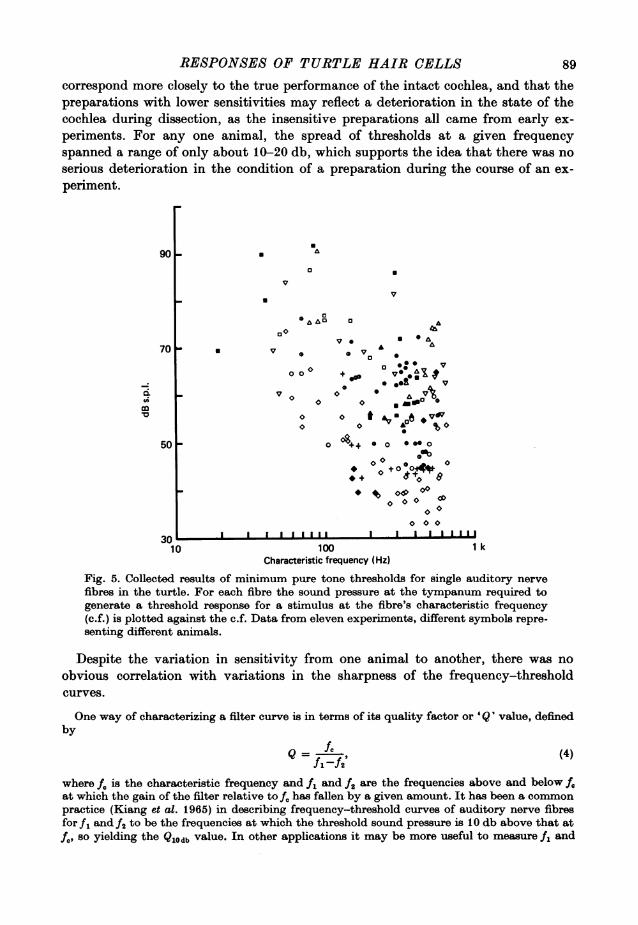
illustrated in Fig. 4. The frequency co-ordinate is logarithmic, and the shapes ofthe tuning curves, which are representative of the majority obtained, are seen tobe roughly symmetrical about the c.f. The crosses, connected by the interruptedline, represent the auditory sensitivity measured by Patterson (1966) for Pseudemysusing a behavioural technique. Each cross is the mean behavioural threshold for fourdifferent animals. The tuning curves for the nerve fibres cover most of the auditoryrange and the threshold at the c.f. for each of the fibres is comparable to the behav-ioural curve. The results illustrated in Fig. 4 were from the most sensitive preparationthat we observed. The collected sensitivities for nerve fibres from this and otheranimals are shown in Fig. 5, each type of symbol corresponding to a different animal.There was some scatter of the sensitivities among the preparations, although most.fell between 35 and 70 db s.p.l. It is our impression that the higher sensitivities
1oor
901-
80 -
701-dm;
601-
501-
40
10;Su - . . . . . . . . . . . . . .
88
RESPONSES OF TURTLE HAIR CELLS 89
correspond more closely to the true performance of the intact cochlea, and that thepreparations with lower sensitivities may reflect a deterioration in the state of thecochlea during dissection, as the insensitive preparations all came from early ex-periments. For any one animal, the spread of thresholds at a given frequencyspanned a range of only about 10-20 db, which supports the idea that there was noserious deterioration in the condition of a preparation during the course of an ex-periment.
90 .
V
0
AO 0
ye0 UeaVv
d 0~~~~00
VA 0 A70 0. v ^0 0v *_ 0 0 * s v
50 - O 44 + O00 *50 0 0~~~~~~~~~0* Q
+ ° 00
0000 0
30~ ~ ~ ~ ~ ~ 0
10 100 1 kCharacteristic frequency (Hz)
Fig. 5. Collected results of minimum pure tone thresholds for single auditory nervefibres in the turtle. For each fibre the sound pressure at the tympanum required togenerate a threshold response for a stimulus at the fibre's characteristic frequency(c.f.) is plotted against the c.f. Data from eleven experiments, different symbols repre-senting different animals.
Despite the variation in sensitivity from one animal to another, there was noobvious correlation with variations in the sharpness of the frequency-thresholdcurves.
One way of characterizing a filter curve is in terms of its quality factor or 'Q' value, definedby
Q L(4)Afl-f2'
where Ae is the characteristic frequency and fl and f2 are the frequencies above and below foat which the gain of the filter relative to f, has fallen by a given amount. It has been a commonpractice (Kiang et at. 1965) in describing frequency-threshold curves of auditory nerve fibresfor fI andf2 to be the frequencies at which the threshold sound pressure is 10 db above that atf., so yielding the Qlodb value. In other applications it may be more useful to measure f1 and
90 A. C. CRAWFORD AND R. FETTIPLACE
f2 at the half-power point, which is an amplitude gain of 1/ 2 or -3 db relative to that at f0For certain kinds of filter, the QSdb value then appears in other descriptions of the filter systemsuch as its transient response. In a later section of this paper, the Qsdb will be used, but for thepresent purpose, the Qlodb will be retained to describe the frequency-threshold curves of auditorynerve fibres, in order that these values should be comparable with the data on the mammalianauditory nerve.
80
0 .
6o4
0~~~~~~~~~~~~~~
'7~~~~~~~~~~~~~~~~~~~~~'
4 00
0~~~~~~~~~~~~~~~~~~~~~~~.
0 200 400 600Characteristic frequency (Hz)
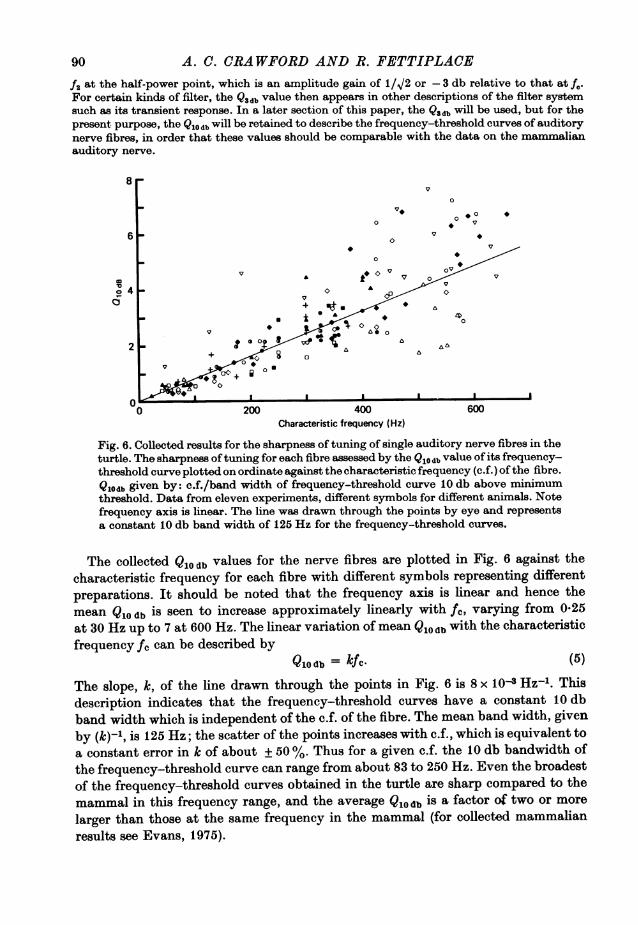
Fig. 6. Collected results for the sharpness of tuning of single auditory nerve fibres in theturtle. The sharpness oftuning for each fibre assessed by the Qlodb value of its frequency-threshold curve plotted on ordinate against the characteristic frequency (c.f.) of the fibre.Qlodb given by: c.f./band width of frequency-threshold curve 10 db above minimumthreshold. Data from eleven experiments, different symbols for different animals. Notefrequency axis is linear. The line was drawn through the points by eye and representsa constant 10 db band width of 125 Hz for the frequency-threshold curves.
The collected Q10 b values for the nerve fibres are plotted in Fig. 6 against thecharacteristic frequency for each fibre with different symbols representing differentpreparations. It should be noted that the frequency axis is linear and hence themean Q10 db is seen to increase approximately linearly with fc, varig from 0'25at 30 Hz up to 7 at 600 Hz. The linear variation of mean Q10 db with the characteristicfrequency fc can be described by
Qlodb = kfc. (5)
The slope, k, of the line drawn through the points in Fig. 6 is 8 x 10t Hz-l. Thisdescription indicates that the frequency-threshold curves have a constant 10 dbband width which is independent of the c.f. of the fibre. The mean band width, givenby (kfqn,is 125 Hz; the scatter of the points increases with c.f., which is equivalent toa constant error in ic of about ±50%°/. Thus for a given c.f. the 10 db bandwidth ofthe frequency-threshold curve can range from about 83 to 250 Hz. Even the broadestof the frequency-threshold curves obtained in the turtle are sharp compared to themammal in this frequency range, and the averageQucdb is a factor of two or morelarger than those at the same frequency in the mammal (for collected mammalianresults see Evans, 1975).
RESPONSES OF TURTLE HAIR CELLS
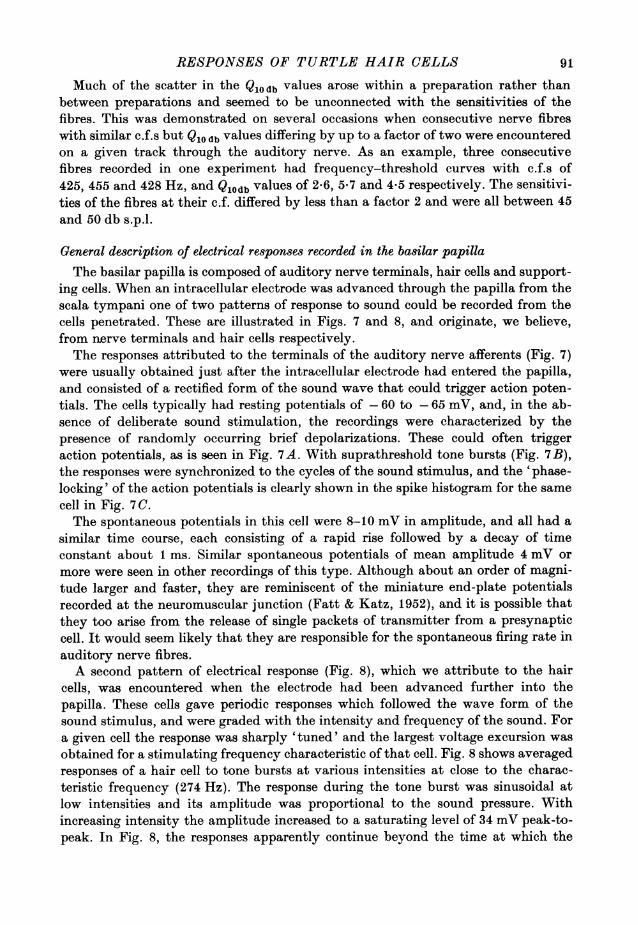
Much of the scatter in the Q10 db values arose within a preparation rather thanbetween preparations and seemed to be unconnected with the sensitivities of thefibres. This was demonstrated on several occasions when consecutive nerve fibreswith similar c.f.s but Q10 db values differing by up to a factor of two were encounteredon a given track through the auditory nerve. As an example, three consecutivefibres recorded in one experiment had frequency-threshold curves with c.f.s of425, 455 and 428 Hz, and Qlodb values of 2-6, 5-7 and 4-5 respectively. The sensitivi-ties of the fibres at their c.f. differed by less than a factor 2 and were all between 45and 50 db s.p.l.
General description of electrical responses recorded in the basilar papillaThe basilar papilla is composed of auditory nerve terminals, hair cells and support-
ing cells. When an intracellular electrode was advanced through the papilla from thescala tympani one of two patterns of response to sound could be recorded from thecells penetrated. These are illustrated in Figs. 7 and 8, and originate, we believe,from nerve terminals and hair cells respectively.The responses attributed to the terminals of the auditory nerve afferents (Fig. 7)
were usually obtained just after the intracellular electrode had entered the papilla,and consisted of a rectified form of the sound wave that could trigger action poten-tials. The cells typically had resting potentials of -60 to -65 mV, and, in the ab-sence of deliberate sound stimulation, the recordings were characterized by thepresence of randomly occurring brief depolarizations. These could often triggeraction potentials, as is seen in Fig. 7A. With suprathreshold tone bursts (Fig. 7B),the responses were synchronized to the cycles of the sound stimulus, and the 'phase-locking' of the action potentials is clearly shown in the spike histogram for the samecell in Fig. 7 C.The spontaneous potentials in this cell were 8-10 mV in amplitude, and all had a
similar time course, each consisting of a rapid rise followed by a decay of timeconstant about 1 ms. Similar spontaneous potentials of mean amplitude 4 mV ormore were seen in other recordings of this type. Although about an order of magni-tude larger and faster, they are reminiscent of the miniature end-plate potentialsrecorded at the neuromuscular junction (Fatt & Katz, 1952), and it is possible thatthey too arise from the release of single packets of transmitter from a presynapticcell. It would seem likely that they are responsible for the spontaneous firing rate inauditory nerve fibres.A second pattern of electrical response (Fig. 8), which we attribute to the hair
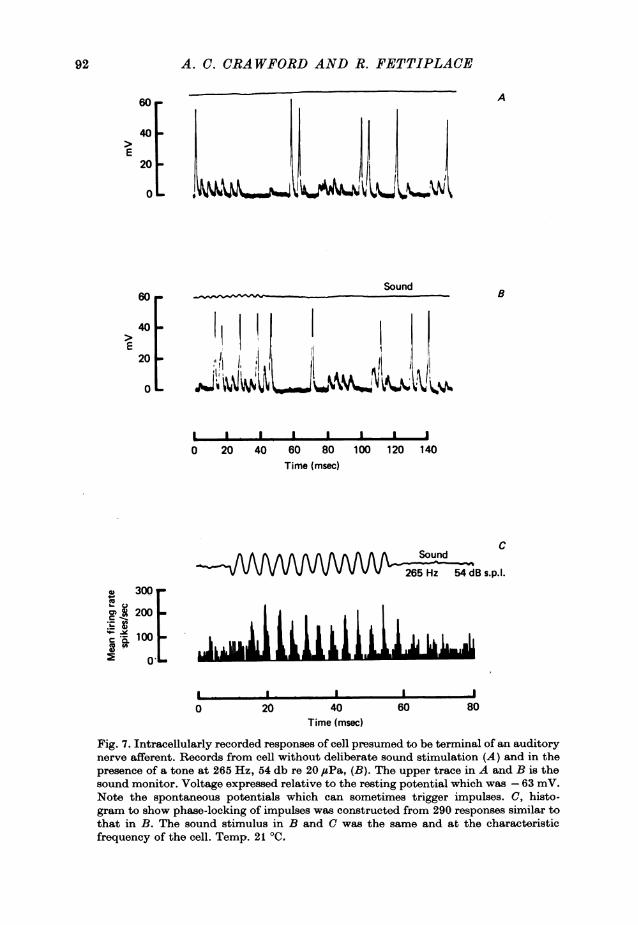
cells, was encountered when the electrode had been advanced further into thepapilla. These cells gave periodic responses which followed the wave form of thesound stimulus, and were graded with the intensity and frequency of the sound. Fora given cell the response was sharply 'tuned' and the largest voltage excursion wasobtained for a stimulating frequency characteristic of that cell. Fig. 8 shows averagedresponses of a hair cell to tone bursts at various intensities at close to the charac-teristic frequency (274 Hz). The response during the tone burst was sinusoidal atlow intensities and its amplitude was proportional to the sound pressure. Withincreasing intensity the amplitude increased to a saturating level of 34 mV peak-to-peak. In Fig. 8, the responses apparently continue beyond the time at which the
91
A. C. CRAWFORD AND R. FETTIPLACE
60_ A
E20i<i _ i _2
Sound60 _ B
40>~
0 20 40 60 80 100 120 140Time (msec)
C
Hz 54 dB s.p.l.
X 300
, 200
100
0 20 40 60 80Time (msec)
Fig. 7. Intracellularly recorded responses of cell presumed to be terminal of an auditorynerve afferent. Records from cell without deliberate sound stimulation (A) and in thepresence of a tone at 265 Hz, 54 db re 20 ,usPa, (B). The upper trace in A and B is thesound monitor. Voltage expressed relative to the resting potential which was -63 mV.Note the spontaneous potentials which can sometimes trigger impulses. C, histo-gram to show phase-locking of impulses was constructed from 290 responses similar tothat in B. The sound stimulus in B and C was the same and at the characteristicfrequency of the cell. Temp. 21 'C.
92
RESPONSES OF TURTLE HAIR CELLS
tone burst was switched off, and the potential can be seen to undergo dampedoscillations which are most prominent at the lowest intensities. It is thought thatthese oscillations are a consequence of the tuning of the cell's response, as will bediscussed in a later section (see p. 106).
In a number of experiments we injected cells which gave responses similar tothose in Fig. 8, with the fluorescent dye Lucifer yellow in order to establish theiridentity firmly. Although the fraction of stained cells recovered was low (about 30 %)
mV 4EAiw- mVE 125dB 7
-15E2E0 ~~~~~~105 065
0 20 40 60 0 20 40 60time (msec) Time (msec)
Fig. 8. Intracellularly recorded response of a hair cell to tone bursts at 276 Hz closeto its characteristic frequency at various intensities. At each intensity, between 16 and128 responses have been averaged. Number by each response gives the sound pressureexpressed in decibels relative to 20 ,uPa. (20 db is equivalent to a tenfold change in soundpressure.) Voltages are with respect to the resting potential, which was -54 mV;maximum peak-to-peak response of cell, 34 mV. The top trace on the left and rightis the sound monitor. The tone burst was untapered. Temp. 21-5 0C.
those that were dye-marked were all identifiable as hair cells in transverse sectionsof the cochlea. In three cases, the dye had diffused into the cilia, which were visibleas they were clumped together in a bundle. One example of a marked cell which hasthe cilia stained, is shown in P1. 2.
It will be assumed, on the dye-marking evidence, that cells with properties similarto the one illustrated in Fig. 8 are all hair cells, There were several other features ofthis type of recording which distinguished it. Thus, for example, there was never anyevidence of generation of action potentials, or spontaneous potentials of the kindobserved in the nerve terminal recordings. However, the hair cell recordings werecharacterized by a continuous narrow-band noise several millivolts in amplitude.The properties of this noise will be described in detail later in the paper (see p. 112).
All hair cell recordings were associated with large and stable resting potentials,and on loss of a penetration, the response and the noise vanished abruptly along withthe resting potential. The 'cochlear microphonic' recorded from just outside thecell (but with the electrode still in the basilar papilla) was 50-100 times smaller
93
A. C. CRAWFORD AND R. FETTIPLACE
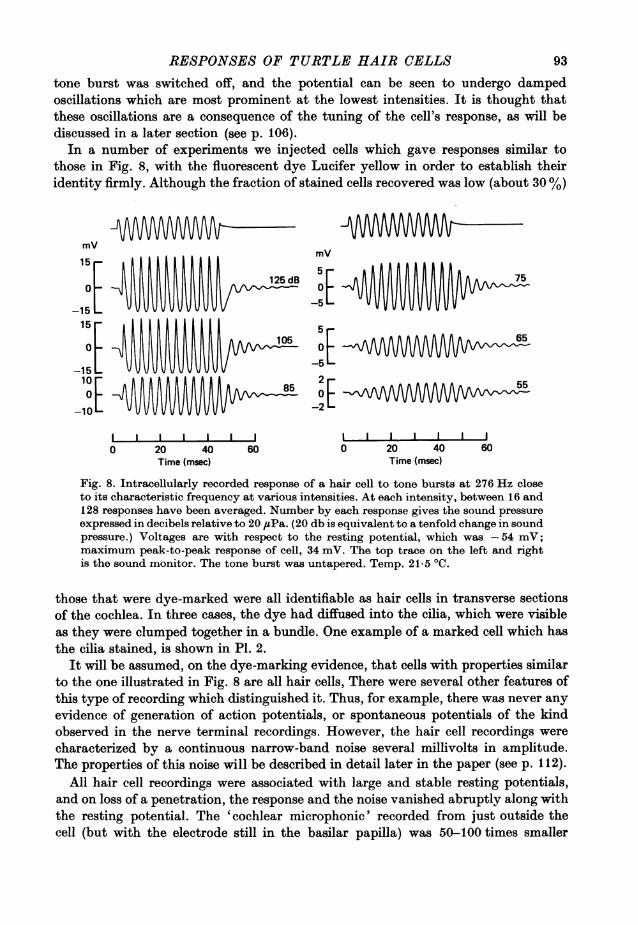
than the intracellularly recorded responses at the same sound pressure. This wouldargue against the observed potentials being electromechanical artifacts resultingsimply from movements of the electrode tip. In the most stable recordings the cellshad resting potentials between -45 and -55 mV (- 501 + 1-3 mV, mean + S.E. ofmean, n = 7) and gave maximum responses at the characteristic frequency of 30-45 mV peak-to-peak. Some of the features of the recordings from the seven cells withthe largest responses are presented in Table 1.
TABLE 1. Electrical properties of hair cells with large responses
Sound press-ureforImV 10dbresponse at bandwidth
R.. (mV) Er (mV) c.f. (Hz) c.f. (db s.p.l.) (Hz) Q10db Temp. (00)34 - 50 94 73.7 94 1-00 22-045 - 55 100 51-5 248 0-40 21-040 -48 250 59-4 196 1-27 19-534 - 54 274 46-3 114 2-46 21-536 - 50 311 48-4 130 2-39 21-036 -48 346 52-5 326 1-01 21-028 -46 425 60-7 240 1-77 25-0
c.f., characteristic frequency; R.,,, saturated peak-to-peak response at c.f.; E, resting potential.Figures in columns 3-6 derived from measurements on 1 mV iso-response tuning curves;Qlodb = characteristic frequency/10 db band width.
The properties of a cell often appeared to be linked to the stability of the recording,or its quality as reflected by the maximum size of response obtainable from the cell.The cell was judged to be acceptable for most purposes if it was capable of givingat least 15 mV peak-to-peak. This threshold is somewhat arbitrary (it represents athird of the largest response seen), but it correlated remarkably well with a consistentresting potential. In recordings from twenty-three cells which fell into this category,the resting potential was - 48-9 + 4-7 mV (mean + S.D.). Some of the scatter in theresting potentials and size of the responses can be seen in the results given inTable 3.During the course of a penetration through the basilar papilla, the intracellular
electrode often impaled cells with larger resting potentials (-70 to -80 mV) andnegligible response to sound. In addition to these recordings, which were presumablyfrom supporting cells, a large stable potential of about -80 mV was often observedat the end of a penetration if the electrode was pushed right through the hair celllayer. It is conceivable that at this stage, the electrode was embedded in the tectorialmembrane; further advancement of the electrode, resulting in a loss of the potential,always brought it into the cochlear duct. The endocochlear potential was never morethan a few millivolts with respect to the perilymph, and this is in agreement withthe results of Schmidt & Fernandez (1962) who measured endocochlear potentialsof -2 to + 5 mV in intact turtles.
94
RESPONSES OF TURTLE HAIR CELLS
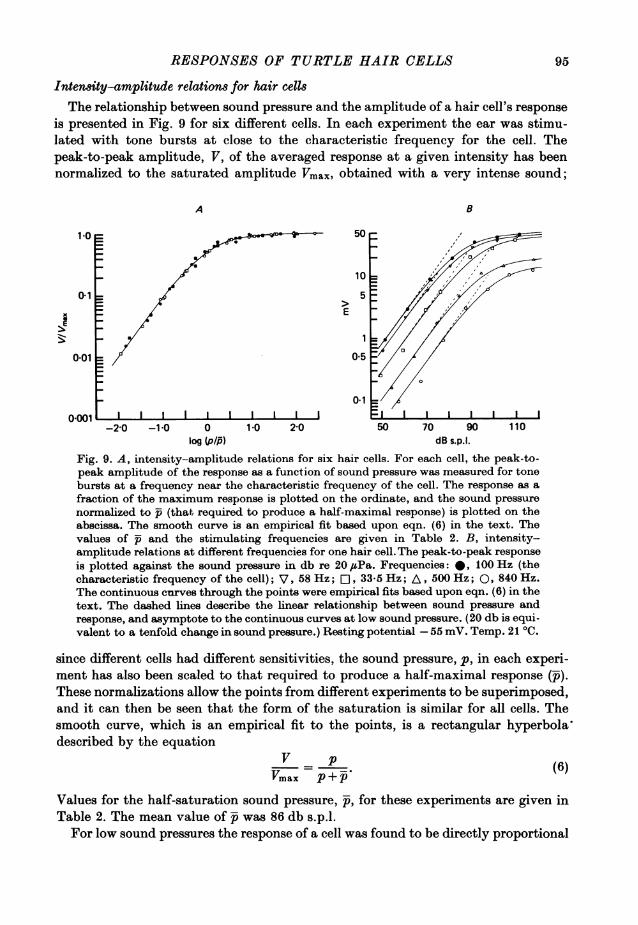
Intensity-amplitude relations for hair cellsThe relationship between sound pressure and the amplitude of a hair cell's response
is presented in Fig. 9 for six different cells. In each experiment the ear was stimu-lated with tone bursts at close to the characteristic frequency for the cell. Thepeak-to-peak amplitude, V, of the averaged response at a given intensity has beennormalized to the saturated amplitude Vmax, obtained with a very intense sound;
A B
1.0 50
0*1~~~~~~~~~~~~~1
0.1 5;1 ,
0*01 0-5
0*10-001 l l l l l l l l l l_
-2-0 -1.0 0 1-0 2-0 50 70 90 110log (piff) dB s.p.l.
Fig. 9. A, intensity-amplitude relations for six hair cells. For each cell, the peak-to-peak amplitude of the response as a function of sound pressure was measured for tonebursts at a frequency near the characteristic frequency of the cell. The response as afraction of the maximum response is plotted on the ordinate, and the sound pressurenormalized to p5 (that, required to produce a half-maximal response) is plotted on theabscissa. The smooth curve is an empirical fit based upon eqn. (6) in the text. Thevalues of P and the stimulating frequencies are given in Table 2. B, intensity-amplitude relations at different frequencies for one hair cell. The peak-to-peak responseis plotted against the sound pressure in db re 20 #Pa. Frequencies: *, 100 Hz (thecharacteristic frequency of the cell); V, 58 Hz; [., 33.5 Hz; A, 500 Hz; 0. 840 Hz.The continuous curves through the points were empirical fits based upon eqn. (6) in thetext. The dashed lines describe the linear relationship between sound pressure andresponse, and asymptote to the continuous curves at low sound pressure. (20 db is equi-valent to a tenfold change in sound pressure.) Resting potential -55 mV. Temp. 21 'C.
since different cells had different sensitivities, the sound pressure, p, in each experi-ment has also been scaled to that required to produce a half-maximal response (i).These normalizations allow the points from different experiments to be superimposed,and it can then be seen that the form of the saturation is similar for all cells. Thesmooth curve, which is an empirical fit to the points, is a rectangular hyperbola'described by the equation
V _ p (6)Vmax P + P
Values for the half-saturation sound pressure, -, for these experiments are given inTable 2. The mean value of was 86 db s.p.l.For low sound pressures the response of a cell was found to be directly proportional
95
A. C. CRAWFORD AND R. FETTIPLACE
to sound pressure, as may be inferred from the limiting slope of the intensity ampli-tude plots in Fig. 9A. The generalization of linearity held for most hair cells if thesound produced a response of less than about 2 mV peak-to-peak. From the small res-ponses it is thus possible to calculate a linear sensitivity, S, for a cell, given by theroot mean square voltage response divided by the sound pressure (which is also anr.m.s. value) for a tone at the characteristic frequency. The most sensitive cells hadvalues of S in the range 30-90 mV/Pa (Table 2).
TABLE 2. Sound sensitivities of hair cells
f P SSymbol (Hz) (db s.p.l.) (mV/Pa)
A\ 120 83-2 56-6* 250 86-7 32-5
250 84-9 36*1o 275 75-7 88.8* 350 96.3 5.3El 450 88-2 18.4
Values obtained from averaged responses to tone bursts at frequency f (close to the c.f.) atvarious intensities. Results plotted in Fig. 9, each symbol representing a different cell; p,sound pressure for half-saturated response, in decibels re 20 flPa; S, linear sensitivity calculatedas described in text.
If the amplitude of a cell's response as a function of sound pressure was examinedaway from the c.f. the response exhibited a similar form of saturation, although thesaturated response Vmax, was smaller than at the c.f., and a higher sound pressurewas required to reach it, i.e. the value of was larger than at the c.f. This can be seenin Fig. 9B which gives sound pressure-amplitude relations for a single cell at fivedifferent frequencies. The upper set of points (filled circles) represent the responsesat the c.f. of the cell (100 Hz); the open symbols are for frequencies on either sideof the c.f. The smooth curve calculated from eqn. (6) fits the points for frequenciesother than the c.f. with reduced values of Vmax and increased p. A possible explana-tion for this type of behaviour has been put forward previously in terms of a dualmechanism for achieving frequency selectivity (Fettiplace & Crawford, 1978). Itwas envisaged that the saturation process was sandwiched between the two filterswhose form could be inferred from the variations in p and Vmax respectively as afunction of frequency. This is only completely correct if the fundamental in thecell's response is plotted and if both filters are linear and the saturation is instanta-neous. In reality the second filter is markedly non-linear (Fettiplace & Crawford,1978; Crawford & Fettiplace, 1980,) which may contribute to the variation inVmax and p, particularly near the c.f.The interrupted lines in Fig. 9B represent the linear relationship between the
amplitude of the response and the sound pressure, and asymptote to the continuouscurves at low sound pressure. It should be noted that if the response at a givensound pressure is in the linear range at the c.f., it will also be linear at other fre-quencies.
96
RESPONSES OF TURTLE HAIR CELLS
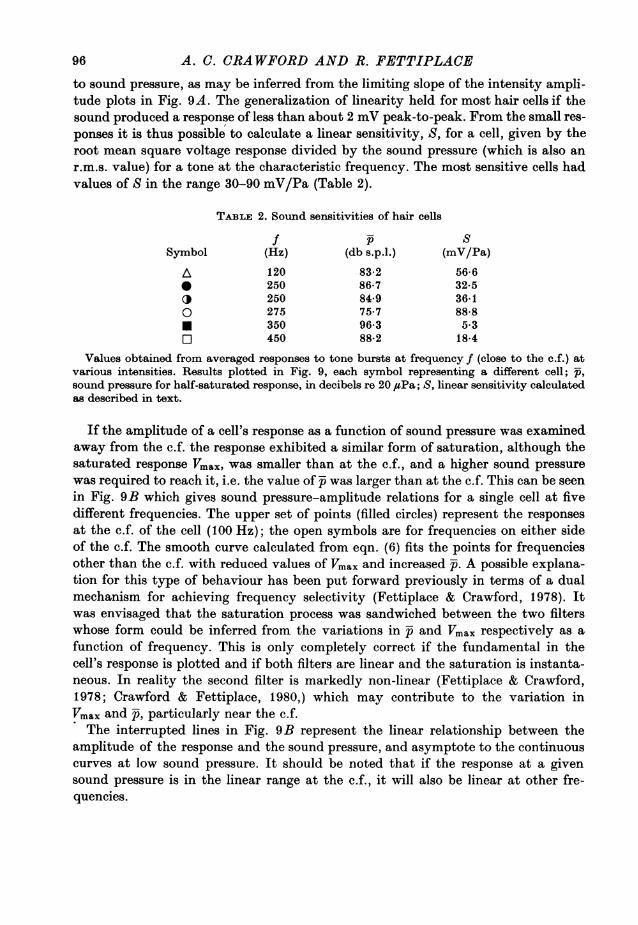
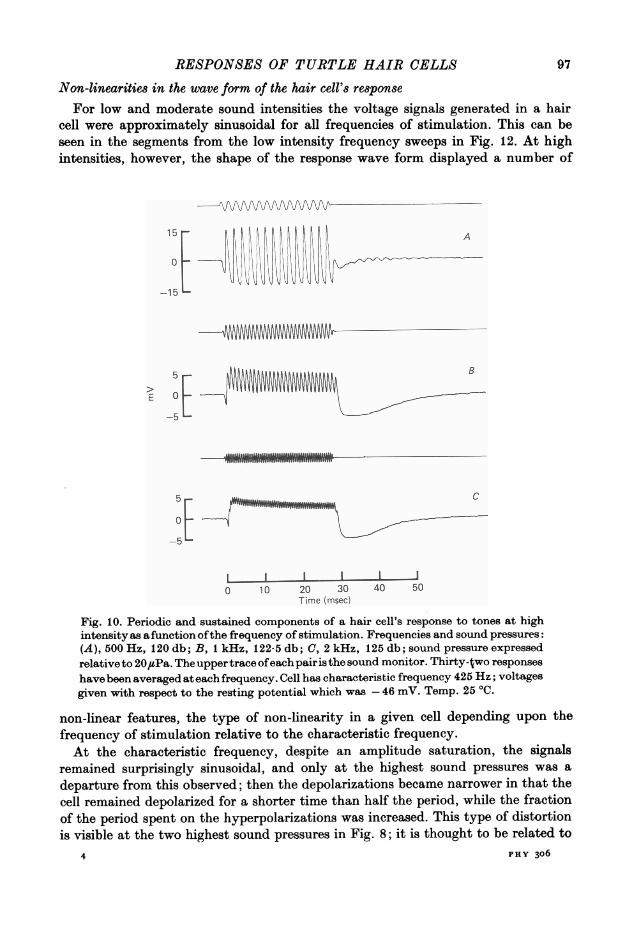
Non-linearities in the wave form of the hair cell's response
For low and moderate sound intensities the voltage signals generated in a haircell were approximately sinusoidal for all frequencies of stimulation. This can beseen in the segments from the low intensity frequency sweeps in Fig. 12. At highintensities, however, the shape of the response wave form displayed a number of
_~~~~~~~~~~~
15E
0~~~~~~~~~~~
-15
5c
E 0
1 , , , l I
0 10 20 30 40 50Time (msec)
Fig. 10. Periodic and sustained components of a hair cell's response to tones at highintensity as afunctionofthe frequency of stimulation. Frequencies and sound pressures:(A), 500 Hz, 120 db; B, 1 kHz, 122-5 db; a, 2 kHz, 125 db; sound pressure expressedrelative to 2QtsPa. The upper trace ofeach pair is the sound monitor. Thirty-two responseshavebeenaveragedateachfrequency. Cell has characteristic frequency 425 Hz; voltagesgiven with respect to the resting potential which was-46 mY. Temp. 25 0C.
non-linear features, the type of non-linearity in a given cell depending upon thefrequency of stimulation relative to the characteristic frequency.At the characteristic frequency, despite an amplitude saturation, the signals
remained surprisingly sinusoidal, and only at the highest sound pressures was adeparture from this observed; then the depolarizations became narrower in that thecell remained depolarized for a shorter time than half the period, while the fractionof the period spent on the hyperpolarizations was increased. This type of distortionis visible at the two highest sound pressures in Fig. 8; it is thought to be related to
(A) 50 z 2 b ,Ikz 2- b ,2kz 2 on rsueepHYs306
97
PHY 3064
A. C. CRAWFORD AND R. FETTIPLACEthe distortion which occurs at frequencies well below the c.f. (Fettiplace & Crawford,1978).A second type of non-linearity consisted of a maintained depolarizing component
which became more pronounced relative to the periodic signal at high frequencies.The phenomenon is illustrated in Fig. 10 which shows averaged responses to tonebursts at three frequencies above the c.f. of the cell. The upper record (Fig. IOA) is
40
40[
E
40
40_
I I I I I I I I I0 40 80 120 160
Time (msec)
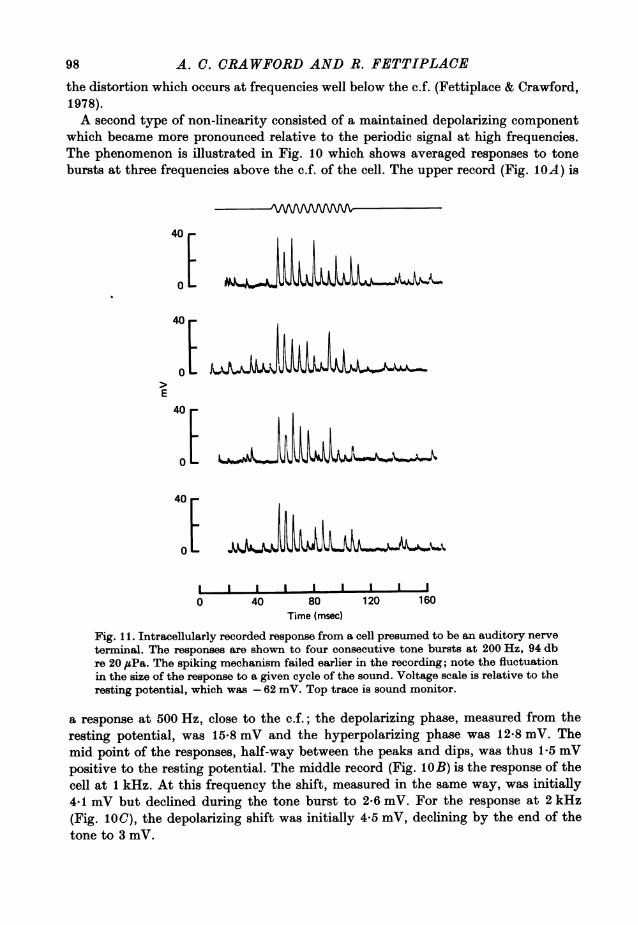
Fig. 11. Intracellularly recorded response from a cell presumed to be an auditory nerveterminal. The responses are shown to four consecutive tone bursts at 200 Hz, 94 dbre 20 #sPa. The spiking mechanism failed earlier in the recording; note the fluctuationin the size of the response to a given cycle of the sound. Voltage scale is relative to theresting potential, which was -62 mV. Top trace is sound monitor.
a response at 500 Hz, close to the c.f.; the depolarizing phase, measured from theresting potential, was 15*8 mV and the hyperpolarizing phase was 12-8 mV. Themid point of the responses, half-way between the peaks and dips, was thus 1-5 mVpositive to the resting potential. The middle record (Fig. lOB) is the response of thecell at 1 kHz. At this frequency the shift, measured in the same way, was initially4-1 mV but declined during the tone burst to 2.6 mV. For the response at 2 kHz(Fig. 1O0), the depolarizing shift was initially 4*5 mV, declining by the end of thetone to 3 mV.
98
RESPONSES OF TURTLE HAIR CELLS
The steady component of the response may reflect a rectification in the periodicsignal which, at the higher frequencies, is then presumably smoothed or low-passfiltered, thus attenuating the periodic component relative to the steady component(Russell & Sellick, 1978). This could account for the form of the responses in Fig. lOB
173 Hz 280 Hz 530 Hz
A10r~A A A
> 0 -MANJV*ii~ vVVW*JV 4E,_10 Ebx
0 10 20 30 40 50
31 Hz Time (msec) 100 Hz 350 HzV\AJ\/VWI NV#HNKMBNWWi
20 ~~~~~~~~~~~~~~~~B
-20 100 Hz 360 Hz> 31 Hz W \M N
0 VVVVVV\1P~lN,8 Q i~ilgl^Vg30 !_.C
0 20 40 60 80 100Time (msec)
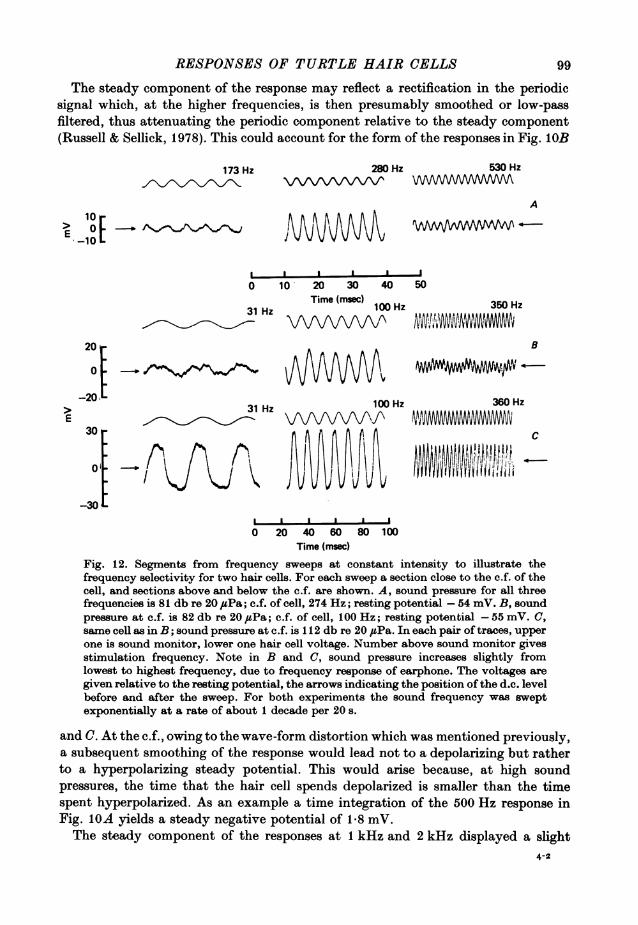
Fig. 12. Segments from frequency sweeps at constant intensity to illustrate thefrequency selectivity for two hair cells. For each sweep a section close to the c.f. of thecell, and sections above and below the c.f. are shown. A, sound pressure for all threefrequencies is 81 db re 20 ,uPa; c.f. of cell, 274 Hz; resting potential -54 mV. B, soundpressure at c.f. is 82 db re 20 #sPa; c.f. of cell, 100 Hz; resting potential -55 mV. C,same cell as in B; sound pressure at c.f. is 11 2 db re 20 ,UPa. In each pair of traces, upperone is sound monitor, lower one hair cell voltage. Number above sound monitor givesstimulation frequency. Note in B and C, sound pressure increases slightly fromlowest to highest frequency, due to frequency response of earphone. The voltages aregiven relative to the resting potential, the arrows indicating the position of the d.c. levelbefore and after the sweep. For both experiments the sound frequency was sweptexponentially at a rate of about 1 decade per 20 s.
and C. At the c.f., owing to the wave-form distortion which was mentioned previously,a subsequent smoothing of the response would lead not to a depolarizing but ratherto a hyperpolarizing steady potential. This would arise because, at high soundpressures, the time that the hair cell spends depolarized is smaller than the timespent hyperpolarized. As an example a time integration of the 500 Hz response inFig. IOA yields a steady negative potential of 1-8 mV.The steady component of the responses at 1 kHz and 2 kHz displayed a slight
4-2
99
A. C. CRAWFORD AND R. FETTIPLACEadaptation or sag, the majority of which occurred with a time constant of about10 ms. Accompanying the sag during the tone was a hyperpolarization when thetone was terminated. This after-hyperpolarization could be as large as 10 mV.There was found to be no significant adaptation of the periodic component of the
response over a duration of a minute or more, and this enabled us to use continuoustones to examine the tuning of the hair cell, as described in the next section. Norwas the sag in the steady potential, as shown in Fig. 10, observed at stimulatingfrequencies less than about 1 kHz. It is a phenomenon restricted to high frequenciesand in this respect it differs from the adaptation which is sometimes seen in auditorynerve firing.The nerve fibre adaptation could occasionally be observed in the intracellularly
recorded responses from what are presumed to be the nerve terminals. Often, duringthe course of such a recording, the spiking mechanism would fail, so revealing the formof the underlying synaptic potentials. An example is shown in Fig. 11. Althoughthese potentials fluctuate from one sound presentation to the next, their averagesize declines during the tone burst. A comparable adaptation has previously beenreported by Furukawa & Matsuura (1978) for the excitatory synaptic potentials inthe auditory nerve fibres of the goldfish. The probabilistic nature of the synapticpotentials (Fig. 11) is also quite different from the hair cell potentials whose con-stancy is evident in the responses at the c.f. in Fig. 12.What has been said so far about the wave forms of the hair cell responses generally
applied only to cells with maximum peak-to-peak responses of 15 mV or more.Quite satisfactory, and often stable recordings, could be secured from cells withsmaller responses, but the features of the wave form were altered, the most markeddifference being that, at the c.f., the responses were more rectified. In addition, thepeaking in the wave form at the c.f. was absent and the responses became flat-toppedat high sound pressures.
The frequency selectivity of the hair cell's responseIso-response tuning curves. In all hair cell recordings the size of the periodic
signal depended upon the frequency of the sound stimulus, each cell being 'tuned',i.e. responding best at a frequency characteristic of the cell, and giving smallerresponses at higher or lower frequencies. Most of our information on the tuning ofthe response is derived from presentations of a steady tone whose frequency could becontinuously varied. Fig. 12 shows examples from three such frequency sweeps atconstant sound pressure for two cells with different c.f.s; segments above, belowand at the c.f. have been taken from each sweep in order to illustrate the selectivity.In Fig. 12A the cell is shown responding near its c.f. (280 Hz) and also on either sideof the c.f. at 173 Hz and 530 Hz. In each pair of traces the upper one gives a monitorof the sound pressure, and the lower one the recording from the intracellular electrode.Fig. 12B and C show sections from two frequency sweeps at different intensitiesfor another cell, illustrating the responses near the c.f. (100 Hz) and also at 31 Hzand 350 Hz. From the traces in Fig. 12C it can be seen that at the higher soundintensity the cell was not as selective as at the lower intensity (see also Fig. 13B).This result is similar to the broadening of the iso-intensity curves found by Rose,Hind, Anderson & Brugge (1971) for mammalian auditory nerve fibres.
100
RESPONSES OF TURTLE HAIR CELLS 101
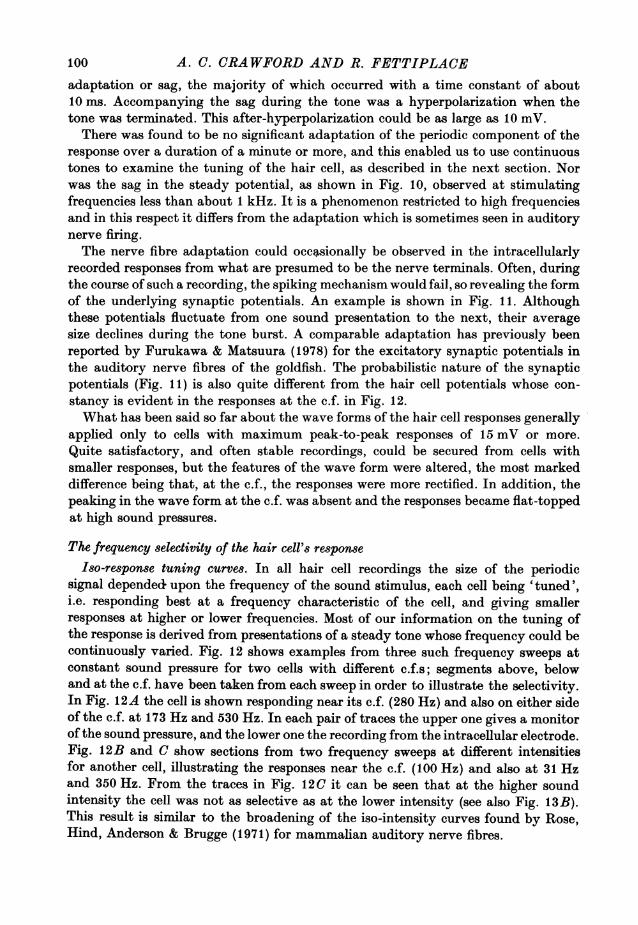
In order to compare the frequency selectivity of the hair cell's response with thatfor the auditory nerve fibres, it is necessary to express the two in an analogousfashion. The tuning curves that have been measured for a given nerve fibre representthe sound pressure required to elicit a constant increment in the firing rate. Frequencyselectivity curves at a constant level of response were generated for the hair cells asfollows: at a number of different frequencies intensity-amplitude relations were con-
100 A B
50
00
400
10 30100 300 1 k 3 k 1~~030 100 300 1
H0 H80 0ic
pressure (expresd30 0 0
were: 0, 1mV;0, mV A,10 V. atapoins wre ntepoltedfro inens0 A A
V~~~~~~~~~~E A A
60 C'20 -
A
10 *
40 010 30 100 300 1 k 3 k 10 30 100 300 1 k
Hz Hz
Fig. 13.A, iso-amplitude contours for hair cell of Fig. 12A. The ordinate is the soundpressure (expressed in decibels re 20diPa) required to produce a constant amplitudeof response in the hair cell as a function of the stimulation frequency on the abscissa.The three curves are for three different amplitude criteria, whose peak-to-peak valueswere: 0,i mV;Lst , 4 mV; A, 10 mV. Data points were interpolated from intensity-amplitude plots at the various frequencies. For details of recording see legends forFig. 8 and Fig. 12A. B, iso-intensity frequency response curves for a hair cell. Thesensitivity of the cell (r.m.s. voltage divided by the sound pressure) is plotted againstthe stimulation frequency; the results were obtained from frequency sweeps at con-stant intensity. Sound pressures in decibels re 20 /zPa: 0t 52 db; 0p62 db; re, 72 db;A, 82 db; V, 92 db. Intensity-amplitude curves at some frequencies are given for thiscell in Fig. 9B. Note that for the two lowest intensities, the points are virtually super-imposable; at these intensities the responses were linear with sound pressure at allfrequencies. Same cell as Fig. 12 B and C; see legend to Fig. 12 for details of recording.
structed (for examples of these see Fig. 9B), and the sound pressure required toproduce a given peak-to-peak response, say 1 mV, in the hair cell at these variousfrequencies was then interpolated from the plots. Fig. 13A shows iso-responsecurves obtained in this way for the hair cell of Fig. 12 A: the three curves correspondto criterion responses of 1, 4 and 10 mV peak-to-peak respectively. For all the curvesthe sound pressure needed to elicit the required response was a minimum at 274 Hz,and rose on either side of this optimum frequency. In several other cells, the optimumfrequency did not vary, within experimental error, between the 1 and 10 mV iso-response curves.
A. C. CRAWFORD AND R. FETTIPLACE
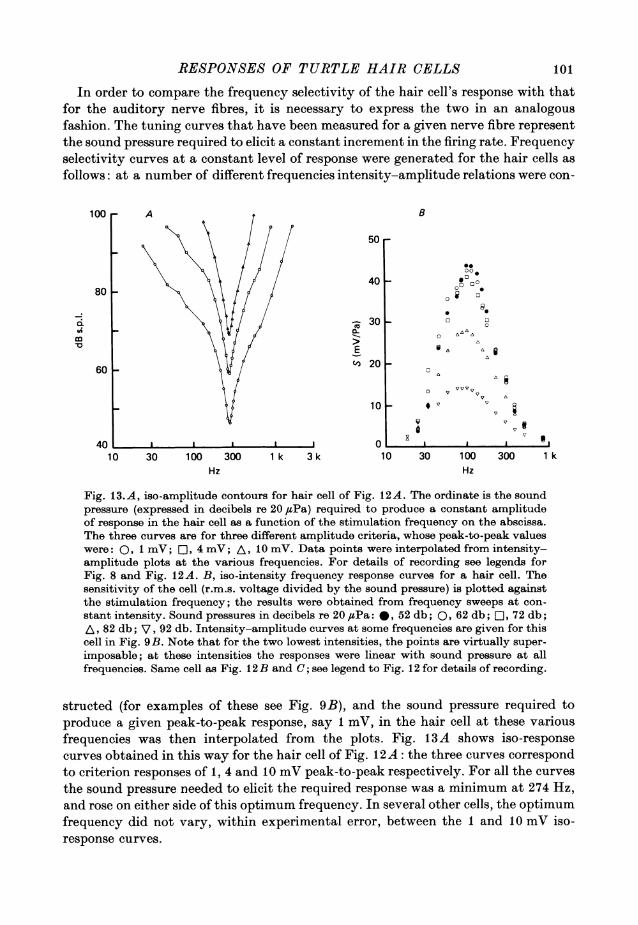
The sharpness of tuning of the iso-response curves was evaluated in the same wayas was done for the frequency threshold curves for the auditory nerve fibres. Forthe 1, 4 and 10 mV iso-response curvesin Fig. 13A the 10 db bandwidth was 114,114 and 109 Hz respectively. Each band width was then divided into the c.f. togive the Qlodb value, which is 2-46 for the1 and 4 mV curves, and 2-57 for the 10mVcurve. It is likely that this slight increase in the Q value for the larger responsecriterion is significant, as it was consistently observed in the other cells examined, butit is small compared to the variation in Q between different cells. Thus it is unneces-sary to know the exact size of the response in a hair cell at 'threshold' for the nervefibres in order to compare their tuning curves. For the other cells details of iso-response curves for a single criterion response of1 mV will be given. These iso-response curves for seven cells are collected in Fig. 14, and the constants for thecurves are given in Table 1. Several conclusions can be drawn from these results: (a)each hair cell had a single c.f., which was different for different cells; (b) the soundpressure required to generate a response of 1 mV at the c.f. varied from 46-3 dbs.p.l. to 73-7 db s.p.l.; these sound pressures fall within the range of 'thresholds'for most of the nerve fibres (see Fig. 5), and this suggests that the hair cells might beproducing of the order of1 mV at the nerve fibre 'threshold'; (c) there was somevariation in the sharpness of tuning between hair cells. A similar divergence intuning was observed in the frequency threshold curves of the nerve fibres, but mostof the 10db band widths fell within the range 83-250 Hz. The band widths of theiso-response curve of all the hair cells in Table 1, except for cell number 6 (fc = 346Hz) were within this range. For the hair cells, the mean and standard deviationof the inverse bandwidth, k, (eqn. (5)) was 6-21 + 2*84 x 10- Hz-1, as compared to8 x10-3Hz-1 for the nerve fibres. This mean is equivalent to a 10 db band width of161 Hz. From these results we would conclude that the frequency selectivity of thehair cells is comparable to that of the nerve fibres. Russell & Sellick (1978) havereached the same conclusion about the inner cells in the guinea-pig cochlea, which,they report, are as sharply tuned as the auditory nerve fibres in that animal.
For comparing the sharpness of tuning of the hair cells and auditory nerve fibres, only thebest recordings have been taken into consideration. This was done because we felt that theobserved tuning was related to the quality of the recording, and furthermore could changeduring the course of an experiment. Some of the difficulties in determining the tuning propertiesof a hair cell are illustrated by considering the case of the more broadly tuned cell 6 in Table 1. Afew minutes after beginning to record from the cell, an iso-intensity frequency sweep at 74 dbs.p.l. generated a maximum response of1 7 mV at the c.f., which was 226 Hz. The resting potentialof the cell at this point was -34 mV, and the Qadb of the tuning curve was 0-67. About 5 minlater, the resting potential had increased to -48 mV, and a frequency sweep at the sameintensity gave 10-6 mV at the c.f., which had increased to 328 Hz. The Qadb of the tuning curvewas now 2-73. A third frequency sweep several minutes later at the same intensity now gave13 3mV at the c.f., 346 Hz, and the Q3db was 3*22. This final improvement had been accomplishedwithout any further change in the resting potential. The properties of the iso-response curvefor the cell, given in Table 1, were derived at about this point in the recording, and it is possiblethat the real sharpness of tuning and c.f. of the cell were still underestimated. Thus the Q valuederived from the terminal oscillations to tone bursts, as described in the next section, was evenhigher later in the experiment.
Io-intensity tuning curves. For most of the hair cells, less complete measurementswere available and it was not possible to construct sets of iso-response curves. Foralmost all the cells, however, a linear iso-intensity curve could be obtained from the
102
RESPONSES OF TURTLE HAIR CELLS
response to a low intensity frequency sweep which generated a response of less thanabout 2 mV at the c.f. of the cell. The linearity was sometimes verified by a secondsweep at an intensity 10 db higher or lower. A low sound pressure which producesresponses in the linear range at the c.f. will also generate linear responses at otherfrequencies (Fig. 9B). Hence the form of the iso-intensity frequency response curve
120- -0 130
10 100 1 A10k 1. 110
00 ~~A
I80 0~ ,\A)0I
004
60 - 070
I 3 3 11111 I I11111 I 111111 I111111 11111 II liii 50
10 100 1 k 10 k 10 100 1 k 10k
Hz
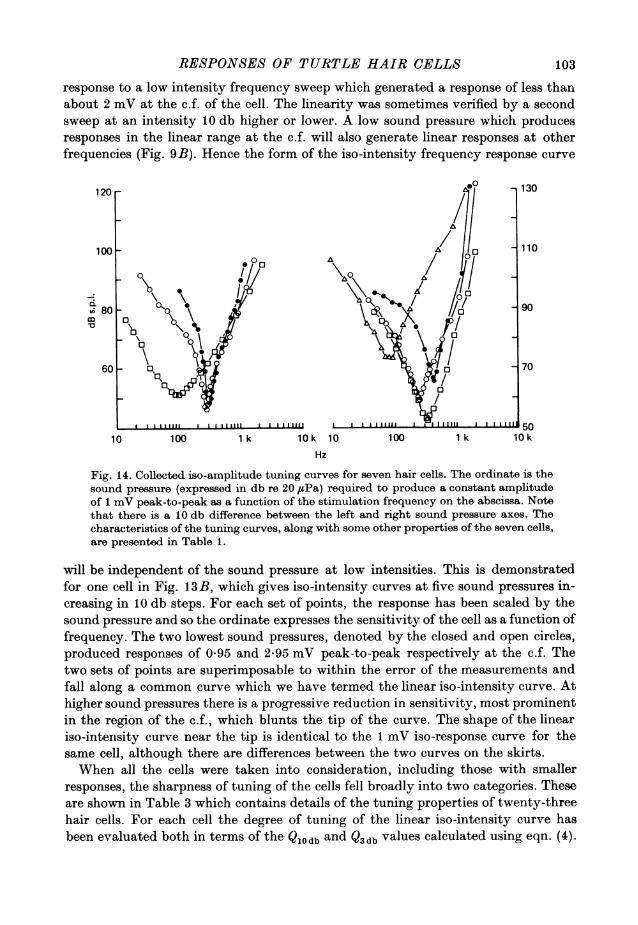
Fig. 14. Collected iso-amplitude tuning curves for seven hair cells. The ordinate is thesound pressure (expressed in db re 20 ,uPa) required to produce a constant amplitudeof 1 mV peak-to-peak as a function of the stimulation frequency on the abscissa. Notethat there is a 10 db difference between the left and right sound pressure axes. Thecharacteristics of the tuning curves, along with some other properties of the seven cells,are presented in Table 1.
will be independent of the sound pressure at low intensities. This is demonstratedfor one cell in Fig. 13B, which gives iso-intensity curves at five sound pressures in-creasing in 10 db steps. For each set of points, the response has been scaled by thesound pressure and so the ordinate expresses the sensitivity of the cell as a function offrequency. The two lowest sound pressures, denoted by the closed and open circles,produced responses of 0-95 and 2-95 mV peak-to-peak respectively at the c.f. Thetwo sets of points are superimposable to within the error of the measurements andfall along a common curve which we have termed the linear iso-intensity curve. Athigher sound pressures there is a progressive reduction in sensitivity, most prominentin the region of the c.f., which blunts the tip of the curve. The shape of the lineariso-intensity curve near the tip is identical to the 1 mV iso-response curve for thesame cell, although there are differences between the two curves on the skirts.When all the cells were taken into consideration, including those with smaller
responses, the sharpness of tuning of the cells fell broadly into two categories. Theseare shown in Table 3 which contains details of the tuning properties of twenty-threehair cells. For each cell the degree of tuning of the linear iso-intensity curve hasbeen evaluated both in terms of the Q10 db and Q3 db values calculated using eqn. (4).
103
A. C. CRAWFORD ANDR. FETTIPLACE
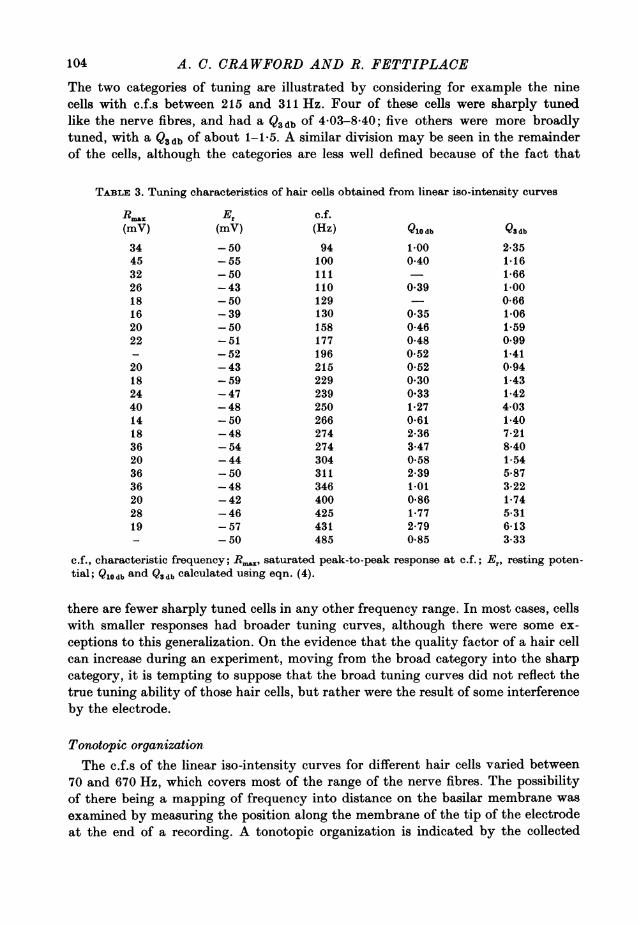
The two categories of tuning are illustrated by considering for example the ninecells with c.f.s between 215 and 311 Hz. Four of these cells were sharply tunedlike the nerve fibres, and had a Q3 db of 4-03-8-40; five others were more broadlytuned, with a Qsdb of about 1-1-5. A similar division may be seen in the remainderof the cells, although the categories are less well defined because of the fact that
TABLE 3. Tuning characteristics of hair cells obtained from linear iso-intensity curves
R.." Er c.f.(mV) (mV) (Hz) Qlo db Q3 db
34 -50 94 1-00 2-3545 -55 100 0-40 1-1632 -50 111 1-6626 -43 110 0-39 1-0018 -50 129 - 0-6616 -39 130 0-35 1-0620 -50 158 0-46 1-5922 -51 177 0-48 0-99- -52 196 0-52 1-4120 -43 215 0-52 0-9418 -59 229 0-30 1-4324 -47 239 0-33 1-4240 - 48 250 1-27 4-0314 -50 266 0-61 1-4018 -48 274 2-36 7-2136 -54 274 3-47 8-4020 -44 304 0-58 1-5436 -50 311 2-39 5-8736 -48 346 1-01 3-2220 -42 400 0-86 1-7428 -46 425 1-77 5-3119 -57 431 2-79 6-13- -50 485 0-85 3-33
c.f., characteristic frequency; Rmn, saturated peak-to-peak response at c.f.; Er, resting poten-tial; Q10db and Q3db calculated using eqn. (4).
there are fewer sharply tuned cells in any other frequency range. In most cases, cellswith smaller responses had broader tuning curves, although there were some ex-ceptions to this generalization. On the evidence that the quality factor of a hair cellcan increase during an experiment, moving from the broad category into the sharpcategory, it is tempting to suppose that the broad tuning curves did not reflect thetrue tuning ability of those hair cells, but rather were the result of some interferenceby the electrode.
Tonotopic organizationThe c.f.s of the linear iso-intensity curves for different hair cells varied between
70 and 670 Hz, which covers most of the range of the nerve fibres. The possibilityof there being a mapping of frequency into distance on the basilar membrane wasexamined by measuring the position along the membrane of the tip of the electrodeat the end of a recording. A tonotopic organization is indicated by the collected
104
RESPONSES OF TURTLE HAIR CELLS 105
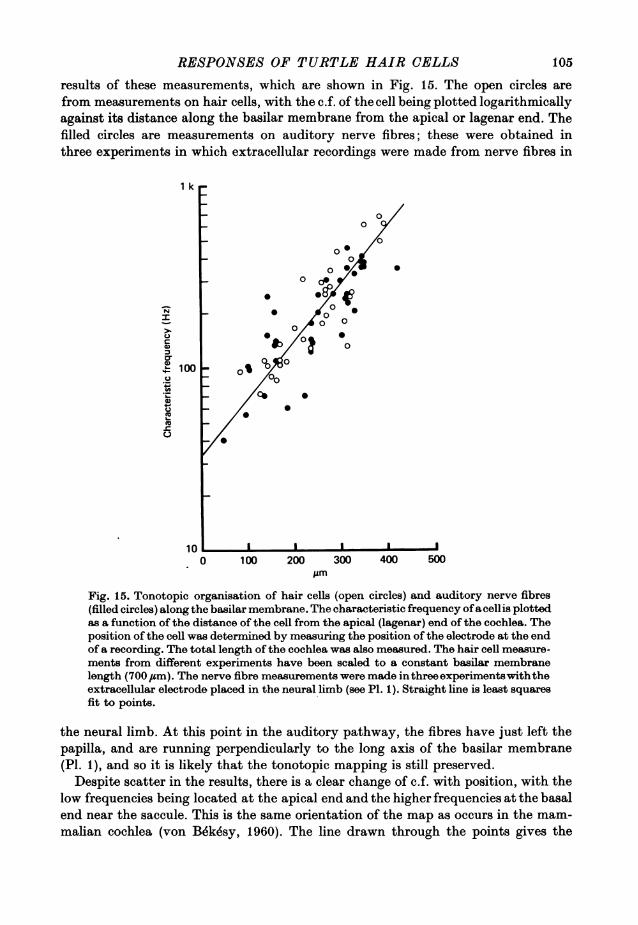
results of these measurements, which are shown in Fig. 15. The open circles arefrom measurements on hair cells, with the c.f. of the cell being plotted logarithmicallyagainst its distance along the basilar membrane from the apical or lagenar end. Thefilled circles are measurements on auditory nerve fibres; these were obtained inthree experiments in which extracellular recordings were made from nerve fibres in
1 k
00
0
000
N 00 -U _ 0X
C)~100 00
0 100 200 500Mum
Fig. 15. Tonotopic organisation of hair cells (open circles) and auditory nerve fibres(filled circles) along the basilar membrane. The characteristic frequency ofacellis plottedas a function of the distance of the cell from the apical (lagenar) end of the cochlea. Theposition of the cell was determined by measuring the position of the electrode at the endof a recording. The total length of the cochlea was also measured. The hair cell measure-ments from different experiments have been scaled to a constant basilar membranelength (700 #sm). The nerve fibre measurements were made inthreeexperimentswiththeextracellular electrode placed in the neural limb (see P1. 1). Straight line is least squaresfit to points.
the neural limb. At this point in the auditory pathway, the fibres have just left thepapilla, and are running perpendicularly to the long axis of the basilar membrane(P1. 1), and so it is likely that the tonotopic mapping is still preserved.
Despite scatter in the results, there is a clear change of c.f. with position, with thelow frequencies being located at the apical end and the higher frequencies at the basalend near the saccule. This is the same orientation of the map as occurs in the mam-malian cochlea (von Bekesy, 1960). The line drawn through the points gives the
A. C. CRAWFORD AND R. FETTIPLACErelationship between the characteristic frequency, f, of a cell and its distance x, in,um along the membrane from the apex, described by:
A = foex/A, (7)
fo and A are constants, with values of 34 Hz and 135 #sm respectively; the value ofthe space constant A is equivalent to a doubling of the frequency in 94/m.With the scatter in the points it is doubtful whether, over the limited frequency
range available, it is really possible to distinguish between a linear and a logarithmicmap. It would be useful to examine the continuation of the map in the basal 150 pm.So far we have been unable to record from this region of the papilla, as it is normallycovered by a branch of the auditory nerve which innervates the ampulla of theposterior semicircular canal. There are two main sources of error in the presentmeasurements which may partly account for the scatter in the points. One is thedifficulty of accurately measuring the position of the tip of the electrode in the papilla;some of this arises because the cochlea was normally tilted during an experiment.A more serious source of error would be that, for cells with small responses, themeasured c.f. may have been incorrect for reasons described in the previous section.
Hair cell tuning as a resonance phenomenonResponses to tone bursts. The temporal properties and frequency selectivity of a
linear filter are intimately related such that the sharper the tuning of the filter, themore prolonged is its time response. The phenomenon is illustrated by the records inFig. 8 for a hair cell which was very sharply tuned. The responses to tone bursts atthe characteristic frequency were spread out, so that for small responses, the ampli-tude of the sinusoidal voltage took several cycles to build up to a maximum valueduring the tone, and the oscillations then continued after the tone burst was ended,with the response amplitude decaying exponentially. The frequency of the terminaloscillations was close to the characteristic frequency of the cell and was unrelatedto the frequency of stimulation.The following analysis is an attempt to relate quantitatively the temporal proper-
ties and frequency selectivity of a hair cell, and provides an independent way ofassessing the quality factor of the tuning of a hair cell from its responses to tonebursts. For the analysis it is necessary to assume that the system is behaving linearly,and this is probably the case if the cell is producing a response of no more than afew millivolts in amplitude. The analysis is based upon the idea that the temporalresponse of a hair cell to a tone burst near its c.f. is determined by the shape of itstuning curve near the tip, and that this can be approximated by the spectrum for asecond-order resonance filter. The differential equation for the behaviour of such afilter is:
y+ y +w2y = F(t). (8)
This equation could describe, for example, an electrical filter incorporating aninductance, resistance and capacitance, or a mechanical filter comprising a mass,resistance and compliance; y is the output of the filter, the dot indicating differentia-tion with respect to time, and wo and y are the resonant angular frequency and damp-ing constant of the filter respectively. F(t) is a driving function, in the present case
106
RESPONSES OF TURTLE HAIR CELLS
representing a tone burst of duration T and angular frequency w.
F(t)= F coswt 0 t( (T)=0 t < 0,t > T. J
The terminal oscillations which occur when the tone burst is switched off are theresult of the system being set into free vibration, and their form may be obtained bysolving eqn. (8) with F(t) = 0. For light damping (y < 2o), which is always the casefor the hair cell, the solution is an exponentially decaying oscillation:
y = A exp [-jy(t-T)] cos [wr(t-T)+q] (10)
for t > T. A and 0 are constants set by the amplitude and phase of the steady res-ponse when the tone is switched off; wf is the frequency of free vibration, given by
Wf = Wo [1(2Q1)] (11)
and is approximately equal to the resonant frequency w),, for large Q'. Q', the qualityfactor is defined by
Q = . (12)7
The value of Q' obtained from this analysis is approximately equal to the Q derivedfrom measurements of the tuning curve; Q is defined by eqn. (4):
(01 - (02
where &½ and &)2 are the frequencies at which the amplitude has fallen to VI of itsmaximum value. The discrepancy between the two values of Q decreases as Qbecomes large, depending upon the system. (For a second order resonance, theydiffer by 2 % for a Q of 5.) It should be noted that neither definition of the qualityfactor is strictly correct for a more complicated filter, where it is normally definedin terms of the energy lost within the oscillating system.The solution to eqn. (8) for the tone burst being switched on is:
y = FU-2 {(&2 - o2) cos at + wy sin wt}
- F#-2e4y ((02 - 2) COt +y (2 Si)8 tl (13)COS2&)f2 = (W2 -o2)2 + 02y2
for the initial conditionsy=y=0 at t=0
wa being given by eqn. (11). The solution depends upon the difference between wi,the frequency of stimulation, and wr, the frequency of free vibration of the filter. Ifthe frequencies are approximately equal, and Q' is large, in eqn. (13) y is givenapproximately by
y = A{cos (wt+ o')-elvt cos(&)wrt+q')} (o - cot)
107
(14)
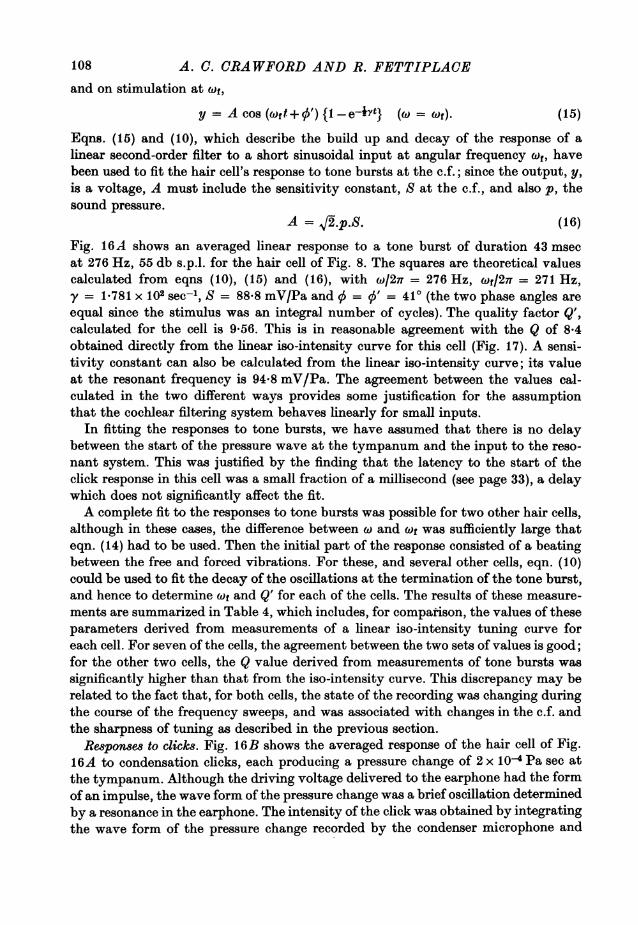
A. C. CRAWFORD AND R. FETTIPLACEand on stimulation at (ofe,
y = A cos (frt+q') {1-e4fYt} (w = er). (15)
Eqns. (15) and (10), which describe the build up and decay of the response of alinear second-order filter to a short sinusoidal input at angular frequency (Of, havebeen used to fit the hair cell's response to tone bursts at the c.f.; since the output, y,is a voltage, A must include the sensitivity constant, S at the c.f., and also p, thesound pressure.
A = 42.p.S. (16)
Fig. 16A shows an averaged linear response to a tone burst of duration 43 msecat 276 Hz, 55 db s.p.l. for the hair cell of Fig. 8. The squares are theoretical valuescalculated from eqns (10), (15) and (16), with Cw/27T = 276 Hz, rl/27r = 271 Hz,y = 1*781 x 102 sec-1, S = 88-8 mV/Pa and 0 = O' = 410 (the two phase angles areequal since the stimulus was an integral number of cycles). The quality factor Q',calculated for the cell is 9-56. This is in reasonable agreement with the Q of 8-4obtained directly from the linear iso-intensity curve for this cell (Fig. 17). A sensi-tivity constant can also be calculated from the linear iso-intensity curve; its valueat the resonant frequency is 94-8 mV/Pa. The agreement between the values cal-culated in the two different ways provides some justification for the assumptionthat the cochlear filtering system behaves linearly for small inputs.
In fitting the responses to tone bursts, we have assumed that there is no delaybetween the start of the pressure wave at the tympanum and the input to the reso-nant system. This was justified by the finding that the latency to the start of theclick response in this cell was a small fraction of a millisecond (see page 33), a delaywhich does not significantly affect the fit.A complete fit to the responses to tone bursts was possible for two other hair cells,
although in these cases, the difference between o and (r was sufficiently large thateqn. (14) had to be used. Then the initial part of the response consisted of a beatingbetween the free and forced vibrations. For these, and several other cells, eqn. (10)could be used to fit the decay of the oscillations at the termination of the tone burst,and hence to determine cof and Q' for each of the cells. The results of these measure-ments are summarized in Table 4, which includes, for comparison, the values of theseparameters derived from measurements of a linear iso-intensity tuning curve foreach cell. For seven of the cells, the agreement between the two sets of values is good;for the other two cells, the Q value derived from measurements of tone bursts wassignificantly higher than that from the iso-intensity curve. This discrepancy may berelated to the fact that, for both cells, the state of the recording was changing duringthe course of the frequency sweeps, and was associated with changes in the c.f. andthe sharpness of tuning as described in the previous section.
Responses to clicks. Fig. 16B shows the averaged response of the hair cell of Fig.16A to condensation clicks, each producing a pressure change of 2 x 10- Pa sec atthe tympanum. Although the driving voltage delivered to the earphone had the formof an impulse, the wave form of the pressure change was a brief oscillation determinedby a resonance in the earphone. The intensity of the click was obtained by integratingthe wave form of the pressure change recorded by the condenser microphone and
108
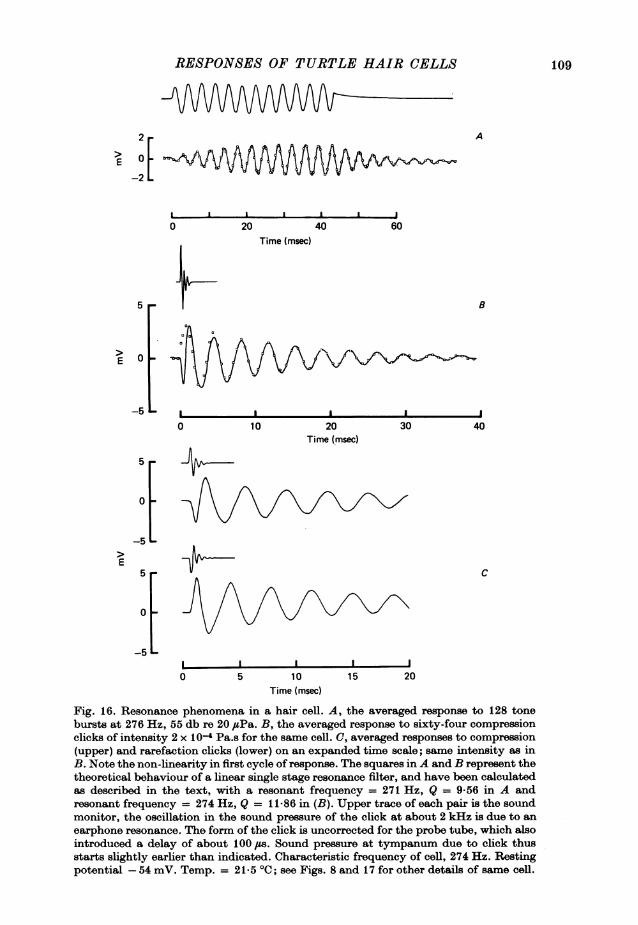
RESPONSES OF TURTLE HAIR CELLS
A
E
L
0 20 40 60Time (msec)
5
E 0
B
-5 _-
E
5
-5_
5_
-5_
a I a I
0 10 20 30Time (msec)
-440
C
I I I
0 5 10 15 20Time (msec)
Fig. 16. Resonance phenomena in a hair cell. A, the averaged response to 128 tonebursts at 276 Hz, 55 db re 20 #tPa. B, the averaged response to sixty-four compressionclicks of intensity 2 x 10- Pa.s for the same cell. C, averaged responses to compression(upper) and rarefaction clicks (lower) on an expanded time scale; same intensity as inB. Note the non-linearity in first cycle of response. The squares in A and B represent thetheoretical behaviour of a linear single stage resonance filter, and have been calculatedas described in the text, with a resonant frequency = 271 Hz, Q = 9-56 in A andresonant frequency = 274 Hz, Q = 11-86 in (B). Upper trace of each pair is the soundmonitor, the oscillation in the sound pressure of the click at about 2 kHz is due to anearphone resonance. The form of the click is uncorrected for the probe tube, which alsointroduced a delay of about 100 pss. Sound pressure at tympanum due to click thusstarts slightly earlier than indicated. Characteristic frequency of cell, 274 Hz. Restingpotential -54 mV. Temp. = 21-5 0C; see Figs. 8 and 17 for other details of same cell.
109
J...
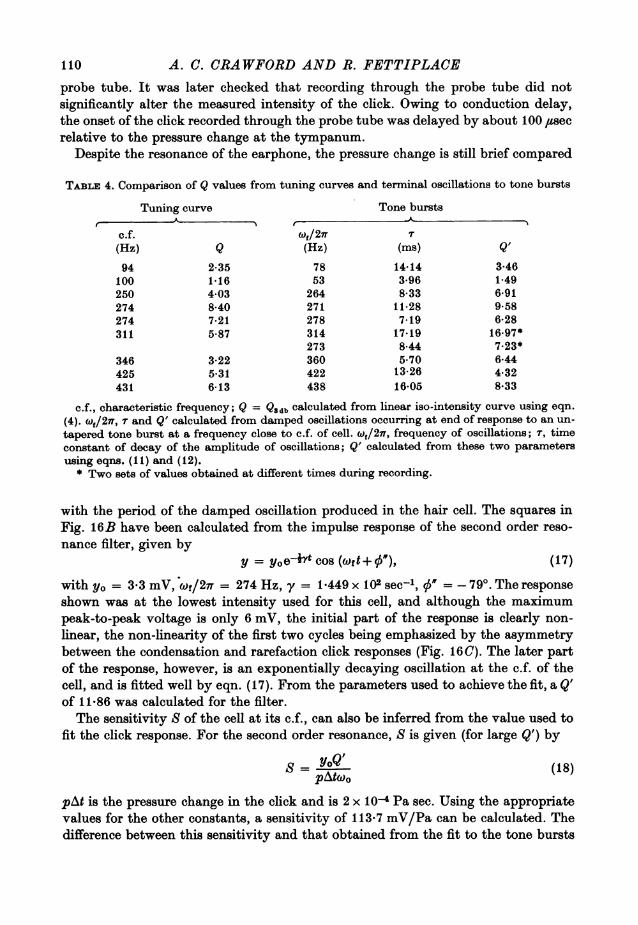
A. C. CRAWFORD AND R. FETTIPLACE
probe tube. It was later checked that recording through the probe tube did notsignificantly alter the measured intensity of the click. Owing to conduction delay,the onset of the click recorded through the probe tube was delayed by about 100 4usecrelative to the pressure change at the tympanum.
Despite the resonance of the earphone, the pressure change is still brief compared
TABLE 4. Comparison of Q values from tuning curves and terminal oscillations to tone bursts
Tuning curve Tone burstsA K,
c.f. Wf/27T(Hz) Q (Hz) (Ms) Q.
94 2*35 78 14*14 3*46100 1-16 53 3.96 1-49250 4 03 264 8-33 6.91274 8-40 271 11*28 9*58274 7*21 278 7-19 6-28311 5*87 314 17-19 16.97*
273 8-44 7-23*346 3*22 360 5*70 6*44425 5-31 422 13*26 4.32431 6*13 438 16*05 8.33
c.f., characteristic frequency; Q = Qdb calculated from linear iso-intensity curve using eqn.(4). wl/2n, T and Q' calculated from damped oscillations occurring at end of response to an un-tapered tone burst at a frequency close to c.f. of cell. wf/2i7, frequency of oscillations; T, timeconstant of decay of the amplitude of oscillations; Q' calculated from these two parametersusing eqns. (11) and (12).
* Two sets of values obtained at different times during recording.
with the period of the damped oscillation produced in the hair cell. The squares inFig. 16B have been calculated from the impulse response of the second order reso-nance filter, given by
y = yoe-0 cos(wet+S ), (17)
with yo = 3.3 mV, wl/27T = 274 Hz, y = 1-449 x 102 sec-1, q =-79°. The responseshown was at the lowest intensity used for this cell, and although the maximumpeak-to-peak voltage is only 6 mV, the initial part of the response is clearly non-linear, the non-linearity of the first two cycles being emphasized by the asymmetrybetween the condensation and rarefaction click responses (Fig. 16 C). The later partof the response, however, is an exponentially decaying oscillation at the c.f. of thecell, and is fitted well by eqn. (17). From the parameters used to achieve the fit, a Q'of 11-86 was calculated for the filter.The sensitivity S of the cell at its c.f., can also be inferred from the value used to
fit the click response. For the second order resonance, S is given (for large Q') by
S= Y0Q (18)
pAt is the pressure change in the click and is 2 x 10- Pa sec. Using the appropriatevalues for the other constants, a sensitivity of 113-7 mV/Pa can be calculated. Thedifference between this sensitivity and that obtained from the fit to the tone bursts
110
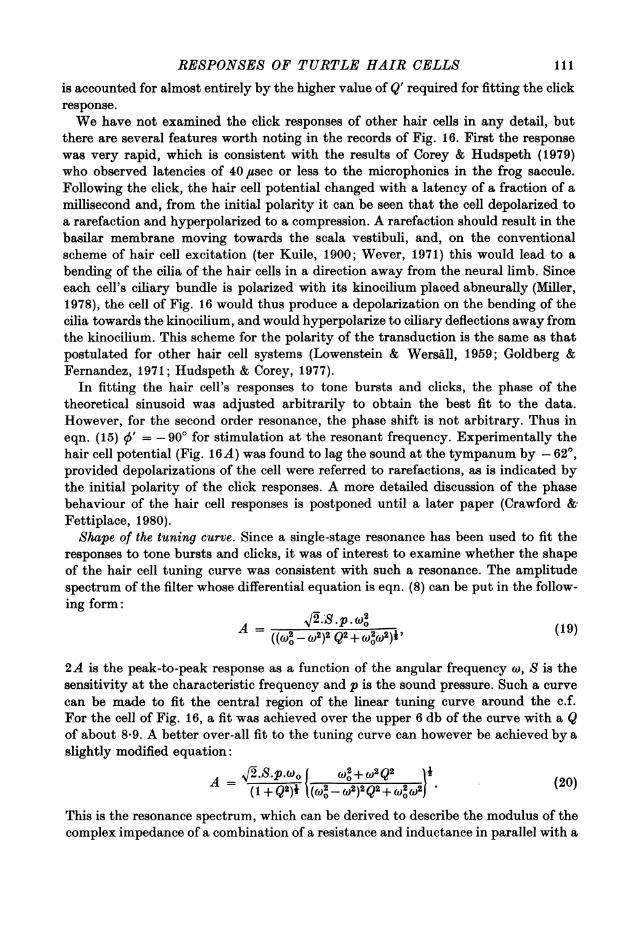
RESPONSES OF TURTLE HAIR CELLS
is accounted for almost entirely by the higher value of Q' required for fitting the clickresponse.We have not examined the click responses of other hair cells in any detail, but
there are several features worth noting in the records of Fig. 16. First the responsewas very rapid, which is consistent with the results of Corey & Hudspeth (1979)who observed latencies of 40 ,ssec or less to the microphonics in the frog saccule.Following the click, the hair cell potential changed with a latency of a fraction of amillisecond and, from the initial polarity it can be seen that the cell depolarized toa rarefaction and hyperpolarized to a compression. A rarefaction should result in thebasilar membrane moving towards the scala vestibule, and, on the conventionalscheme of hair cell excitation (ter Kuile, 1900; Wever, 1971) this would lead to abending of the cilia of the hair cells in a direction away from the neural limb. Sinceeach cell's ciliary bundle is polarized with its kinocilium placed abneurally (Miller,1978), the cell of Fig. 16 would thus produce a depolarization on the bending of thecilia towards the kinocilium, and would hyperpolarize to ciliary deflections away fromthe kinocilium. This scheme for the polarity of the transduction is the same as thatpostulated for other hair cell systems (Lowenstein & Wersall, 1959; Goldberg &Fernandez, 1971; Hudspeth & Corey, 1977).
In fitting the hair cell's responses to tone bursts and clicks, the phase of thetheoretical sinusoid was adjusted arbitrarily to obtain the best fit to the data.However, for the second order resonance, the phase shift is not arbitrary. Thus ineqn. (15) q' = - 900 for stimulation at the resonant frequency. Experimentally thehair cell potential (Fig. 16A) was found to lag the sound at the tympanum by - 620,provided depolarizations of the cell were referred to rarefactions, as is indicated bythe initial polarity of the click responses. A more detailed discussion of the phasebehaviour of the hair cell responses is postponed until a later paper (Crawford &'Fettiplace, 1980).Shape of the tuning curve. Since a single-stage resonance has been used to fit the
responses to tone bursts and clicks, it was of interest to examine whether the shapeof the hair cell tuning curve was consistent with such a resonance. The amplitudespectrum of the filter whose differential equation is eqn. (8) can be put in the follow-ing form:
A - 2S 0a, (19)((wp v(,2)2 Q2+&w2&o2)X9
2A is the peak-to-peak response as a function of the angular frequency w, S is thesensitivity at the characteristic frequency and p is the sound pressure. Such a curvecan be made to fit the central region of the linear tuning curve around the c.f.For the cell of Fig. 16, a fit was achieved over the upper 6 db of the curve with a Qof about 8-9. A better over-all fit to the tuning curve can however be achieved by aslightly modified equation:
A -4~/.S.1~k) f 2+wO2Q2 1A-* P ° =o+V2 it (20)(1+Q2)l ((02w_02)2Q2+Ow2w2(
This is the resonance spectrum, which can be derived to describe the modulus of thecomplex impedance of a combination of a resistance and inductance in parallel with a
III
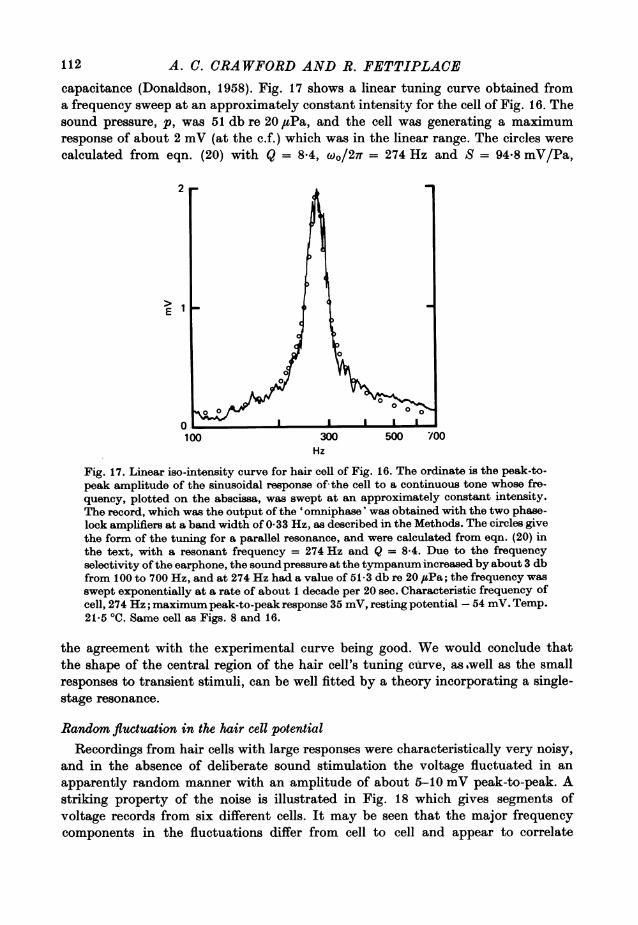
A. C. CRAWFORD AND R. FETTIPLACE
capacitance (Donaldson, 1958). Fig. 17 shows a linear tuning curve obtained froma frequency sweep at an approximately constant intensity for the cell of Fig. 16. Thesound pressure, p, was 51 db re 20 ,uPa, and the cell was generating a maximumresponse of about 2 mV (at the c.f.) which was in the linear range. The circles werecalculated from eqn. (20) with Q = 8-4, oo/27r = 274 Hz and S = 94-8 mV/Pa,
2
>~~~~~~~~~~E~~~~~~
0
0
0~~~~~~~~~~~
100 300 500 700Hz
Fig. 17. Linear iso-intensity curve for hair cell of Fig. 16. The ordinate is the peak-to-peak amplitude of the sinusoidal response of the cell to a continuous tone whose fre-quency, plotted on the abscissa, was swept at an approximately constant intensity.The record, which was the output of the 'omniphase' was obtained with the two phase-lock amplifiers at a band width of 0-33 Hz, as described in the Methods. The circles givethe form of the tuning for a parallel resonance, and were calculated from eqn. (20) inthe text, with a resonant frequency = 274 Hz and Q = 8-4. Due to the frequencyselectivity ofthe earphone, the sound pressure at the tympanum increased by about 3 dbfrom 100 to 700 Hz, and at 274 Hz had a value of 51-3 db re 20 paPa; the frequency wasswept exponentially at a rate of about 1 decade per 20 sec. Characteristic frequency ofcell, 274 Hz; maximum peak-to-peak response 35 mV, resting potential -54 mV. Temp.21-5 'C. Same cell as Figs. 8 and 16.
the agreement with the experimental curve being good. We would conclude thatthe shape of the central region of the hair cell's tuning curve, as.well as the smallresponses to transient stimuli, can be well fitted by a theory incorporating a single-stage resonance.
Random fluctuation in the hair cell potentialRecordings from hair cells with large responses were characteristically very noisy,
and in the absence of deliberate sound stimulation the voltage fluctuated in anapparently random manner with an amplitude of about 5-10 mV peak-to-peak. Astriking property of the noise is illustrated in Fig. 18 which gives segments ofvoltage records from six different cells. It may be seen that the major frequencycomponents in the fluctuations differ from cell to cell and appear to correlate
112
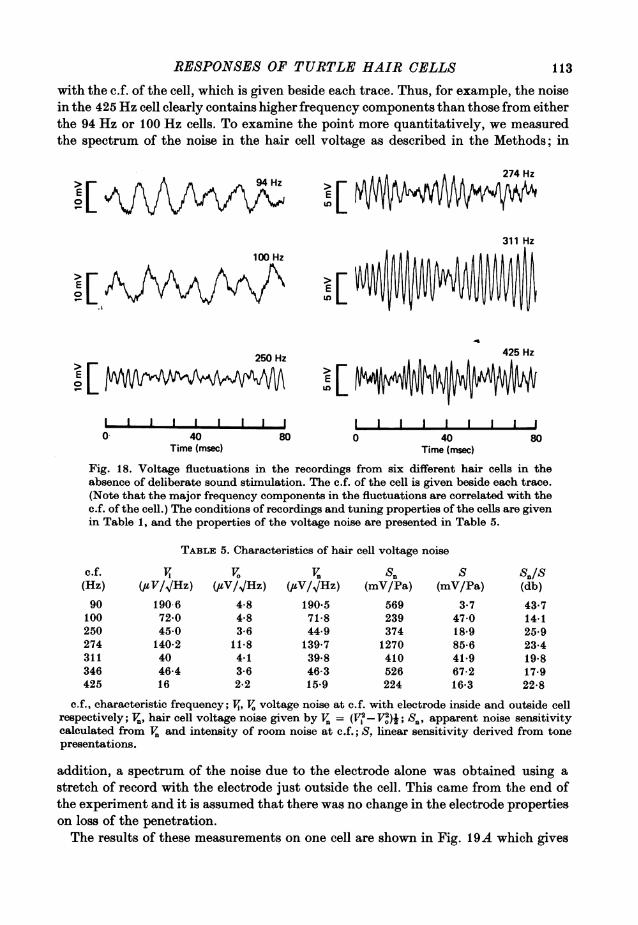
RESPONSES OF TURTLE HAIR CELLS
with the c.f. of the cell, which is given beside each trace. Thus, for example, the noisein the 425 Hz cell clearly contains higher frequency components than those from eitherthe 94 Hz or 100 Hz cells. To examine the point more quantitatively, we measuredthe spectrum of the noise in the hair cell voltage as described in the Methods; in
> ~~~~~~94HzE
100 Hz
E[I
250 Hz
E[ ELa
I I I I I I I I I0. 40
Time (msec)80
274 Hz
E
311 Hz
425 Hz
I I I I I I I I..0 40
Time (msec)
Fig. 18. Voltage fluctuations in the recordings from six different hair cells in theabsence of deliberate sound stimulation. The c.f. of the cell is given beside each trace.(Note that the major frequency components in the fluctuations are correlated with thec.f. of the cell.) The conditions of recordings and tuning properties of the cells are givenin Table 1, and the properties of the voltage noise are presented in Table 5.
TABLE 5. Characteristics of hair cell voltage noise
c.f.(Hz)
90100250274311346425
Vi(EVIVHz)
190 672-045-0
140-24046-416
V0
(#V/JHz)4-84-83-6
11-84*13-62-2
En
(#V/lHz)190X571-844.9
139X739X846-315-9
Sn
(mV/Pa)
569
2393741270410526224
S
(mV/Pa)
3-747*018-985-641*967-216-3
Sn/S(db)
43.714-125-923-419-817-922-8
c.f., characteristic frequency; Vi, V. voltage noise at c.f. with electrode inside and outside cellrespectively; V., hair cell voltage noise given by V, = (F2- V2)j; S., apparent noise sensitivitycalculated from V. and intensity of room noise at c.f.; S. linear sensitivity derived from tonepresentations.
addition, a spectrum of the noise due to the electrode alone was obtained using a
stretch of record with the electrode just outside the cell. This came from the end ofthe experiment and it is assumed that there was no change in the electrode propertieson loss of the penetration.The results of these measurements on one cell are shown in Fig. 19A which gives
80
113
A. C. CRAWFORD AND R. FETTIPLACEthe spectra of the r.m.s. noise voltage with the electrode inside (filled circles) andoutside (open circles) the cell. Most of the power in the hair cell noise was concentra-ted in a narrow band of frequencies around the c.f. of the cell (274 Hz) with thepeak occurring at 280 Hz. In contrast, the electrode noise was virtually flat up toabout 1 kHz, and was a factor of twelve smaller than the hair cell noise at the c.f.of cell. The total variance in the hair cell noise for the frequency band 190 to 350 Hzwas 1.1 mV2. Similar results were obtained from the noise spectra of other cells.Thus, for example, the cell with a c.f. of 94 Hz had a peak noise voltage at 85 Hz,and the cell with a c.f. of 425 Hz had a peak noise voltage at 450 Hz. In each casethe value at the peak was about an order of magnitude larger than the electrodenoise alone. Peak noise voltages and the corresponding values corrected for thenoise in the electrode are presented in Table 5 for seven cells. The conclusion fromthese results is that, whatever the origin of the noise, it is present in the hair cellpotential during a recording and is correlated with the tuning properties of the cell.
Cross correlation between hair cell noise voltage and acoustic noise pressureAn obvious possible source of the noise voltage in the hair cells is background
acoustic noise present at the tympanum. A difficulty immediately arises, however, ifthis explanation is pursued quantitatively; by measuring the standard deviation ofthe hair cell noise voltage and the standard deviation of the acoustic noise pressureover the same band of frequencies as those present in the hair cell signal, one cancalculate a sensitivity constant in mV/Pa. This calculation assumes linearity butthe magnitude of the hair cell voltage fluctuations lies close to the range over whichthe cells responded linearly to intentionally presented sounds. Thus in the exampleshown in Fig. 19A the hair cell produced a voltage noise signal of 139-7 1,V/4Hzat 280 Hz. At the same frequency the acoustic noise at the tympanum had a valueof 1.1 x 10⁴ Pa/VHz (about four times the equivalent pressure noise level in themicrophone preamplifier) and hence the apparent sensitivity of the cell was 1270 mV/Pa. In comparison, the cell's sensitivity to tones of the same frequency was 86 mV/Pa. Further examples of this calculation are given in Table 5. Considered in thisway, all hair cells are apparently about an order of magnitude more sensitive to thebackground acoustic noise than they are to tones presented at the c.f. of the haircell. This large discrepancy led us to suspect that the hair cell voltage noise aroseby a process other than spurious acoustic stimulation. One direct check is to examinethe cross correlation function between the two noise signals; if hair cells act as
independent noise generators then the voltage fluctuations in the cell will be com-
pletely uncorrelated with the pressure fluctuations at the tympanum.The filled circles in Fig. 19B are an example of the cross-correlation coefficient
(eqn. (2)) between acoustic and hair cell voltage noise for the cell of Fig. 19A in theabsence of intentional stimulation. These were calculated from sample records 26slong and for lag times of 0-5-30 ms. The maximum value of the cross-correlationcoefficient (Pvv) was 0 005. Since the standard deviation of the correlation calculatedusing eqn. (3) was 0'005, the samples contain no significant cross-correlated com-
ponents. To check the accuracy of the correlation, a tone at 60 db s.p.l. and 263 Hzwas presented and the cross-correlation coefficients calculated from samples of haircell voltage and tympanic pressure of duration 0-256 s. These conditions of stimula-
114
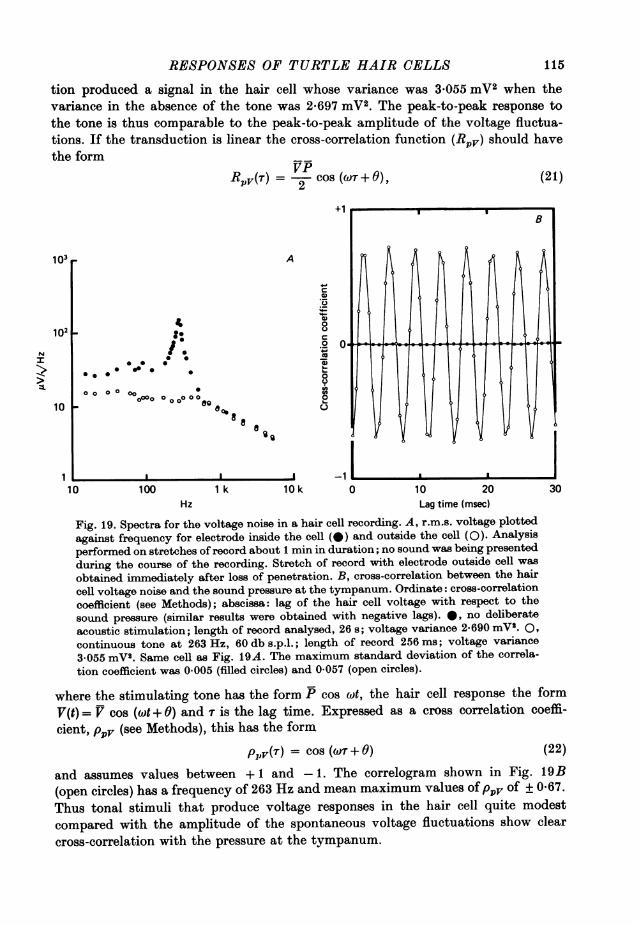
RESPONSES OF TURTLE HAIR CELLS
tion produced a signal in the hair cell whose variance was 3 055 mV2 when thevariance in the absence of the tone was 2-697 mV2. The peak-to-peak response tothe tone is thus comparable to the peak-to-peak amplitude of the voltage fluctua-tions. If the transduction is linear the cross-correlation function (Rpv) should havethe form
Rpv(r) = 2 COS (WT+O), (21)
+1
103 A
0
102I [ / .D02
N .0_
0O~~~~~~~~:L 0.0 0
1 | I I -1 * 0
00000 0 000 0 0
10 0
10 100 1 k 10k 0 10 20 30Hz Lag time (msec)
Fig. 19. Spectra for the voltage noise in a hair cell recording. A, r.m.s. voltage plottedagainst frequency for electrode inside the cell (@) and outside the cell (0). Analysisperformed on stretches of record about 1 min in duration; no sound was being presentedduring the course of the recording. Stretch of record with electrode outside cell was
obtained immediately after loss of penetration. B, cross-correlation between the haircell voltage noise and the sound pressure at the tympanum. Ordinate: cross-correlationcoefficient (see Methods); abscissa: lag of the hair cell voltage with respect to thesound pressure (similar results were obtained with negative lags). *, no deliberateacoustic stimulation; length of record analysed, 26 s; voltage variance 2-690 mV2. 0,continuous tone at 263 Hz, 60 db s.p.l.; length of record 256 ms; voltage variance3 055 mV2. Same cell as Fig. 19A. The maximum standard deviation of the correla-tion coefficient was 0 005 (filled circles) and 0-057 (open circles).
where the stimulating tone has the form P cos wt, the hair cell response the formV(t) = V cos (Wt + 0) and r is the lag time. Expressed as a cross correlation coeffi-cient, pV (see Methods), this has the form
Plv(T) = Cos (wr+o) (22)
and assumes values between +1 and -1. The correlogram shown in Fig. 19B(open circles) has a frequency of 263 Hz and mean maximum values of pPv of + 0-67.Thus tonal stimuli that produce voltage responses in the hair cell quite modestcompared with the amplitude of the spontaneous voltage fluctuations show clearcross-correlation with the pressure at the tympanum.
115
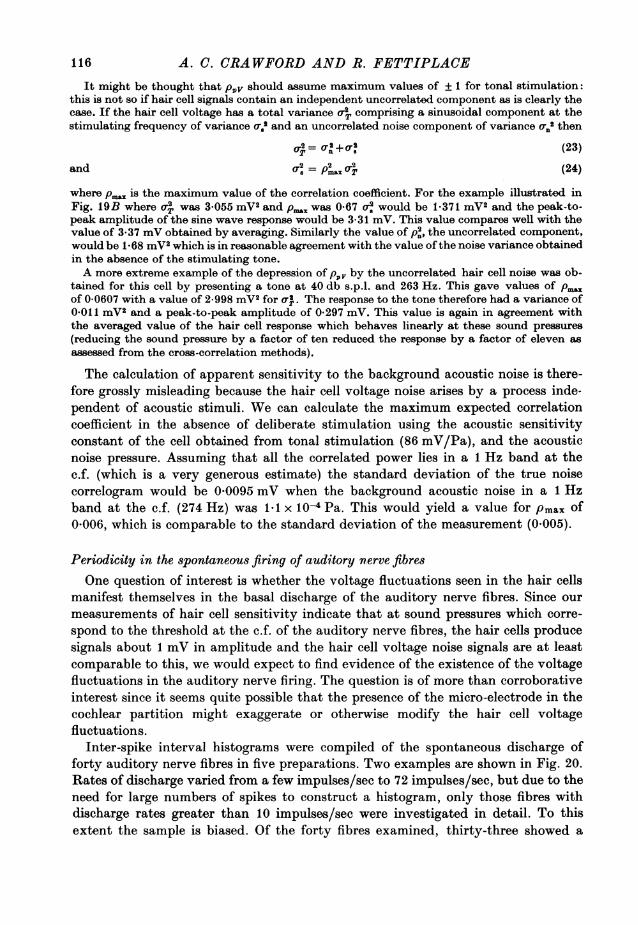
A. C. CRAWFORD AND R. FETTIPLACE
It might be thought thatPv should assume maximum values of + 1 for tonal stimulation:this is not so if hair cell signals contain an independent uncorrelated component as is clearly thecase. If the hair cell voltage has a total variancea`comprising a sinusoidal component at thestimulating frequency of variance er,' and an uncorrelated noise component of variancecr.2 then
o+ rA (23)and cr2 = p2 so? (24)
wherepM. is the maximum value of the correlation coefficient. For the example illustrated inFig. 19B where (4T was 3 055mV2 andpa, was 0x67 o. would be 1-371mV2 and the peak-to-peak amplitude of the sine wave response would be 3-31 mV. This value compares well with thevalue of 3.37 mV obtained by averaging. Similarly the value ofp., the uncorrelated component,would be1-68mV2 which is in reasonable agreement with the value of the noise variance obtainedin the absence of the stimulating tone.A more extreme example of the depression ofPpv by the uncorrelated hair cell noise was ob-
tained for this cell by presenting a tone at 40 db s.p.l. and 263 Hz. This gave values of P.bof 0-0607 with a value of 2-998mV2 forOa. The response to the tone therefore had a variance of0.011mV2 and a peak-to-peak amplitude of 0-297 mV. This value is again in agreement withthe averaged value of the hair cell response which behaves linearly at these sound pressures(reducing the sound pressure by a factor of ten reduced the response by a factor of eleven asassessed from the cross-correlation methods).
The calculation of apparent sensitivity to the background acoustic noise is there-fore grossly misleading because the hair cell voltage noise arises by a process inde-pendent of acoustic stimuli. We can calculate the maximum expected correlationcoefficient in the absence of deliberate stimulation using the acoustic sensitivityconstant of the cell obtained from tonal stimulation (86 mV/Pa), and the acousticnoise pressure. Assuming that all the correlated power lies in a 1 Hz band at thec.f. (which is a very generous estimate) the standard deviation of the true noisecorrelogram would be 0-0095 mV when the background acoustic noise in a 1 Hzband at the c.f. (274 Hz) was 1-1 x 10- Pa. This would yield a value for pmax of0-006, which is comparable to the standard deviation of the measurement (0.005).
Periodicity in the spontaneous firing of auditory nerve fibresOne question of interest is whether the voltage fluctuations seen in the hair cells
manifest themselves in the basal discharge of the auditory nerve fibres. Since ourmeasurements of hair cell sensitivity indicate that at sound pressures which corre-spond to the threshold at the c.f. of the auditory nerve fibres, the hair cells producesignals about 1 mV in amplitude and the hair cell voltage noise signals are at leastcomparable to this, we would expect to find evidence of the existence of the voltagefluctuations in the auditory nerve firing. The question is of more than corroborativeinterest since it seems quite possible that the presence of the micro-electrode in thecochlear partition might exaggerate or otherwise modify the hair cell voltagefluctuations.
Inter-spike interval histograms were compiled of the spontaneous discharge offorty auditory nerve fibres in five preparations. Two examples are shown in Fig. 20.Rates of discharge varied from a few impulses/sec to 72 impulses/sec, but due to theneed for large numbers of spikes to construct a histogram, only those fibres withdischarge rates greater than 10 impulses/sec were investigated in detail. To thisextent the sample is biased. Of the forty fibres examined, thirty-three showed a
116
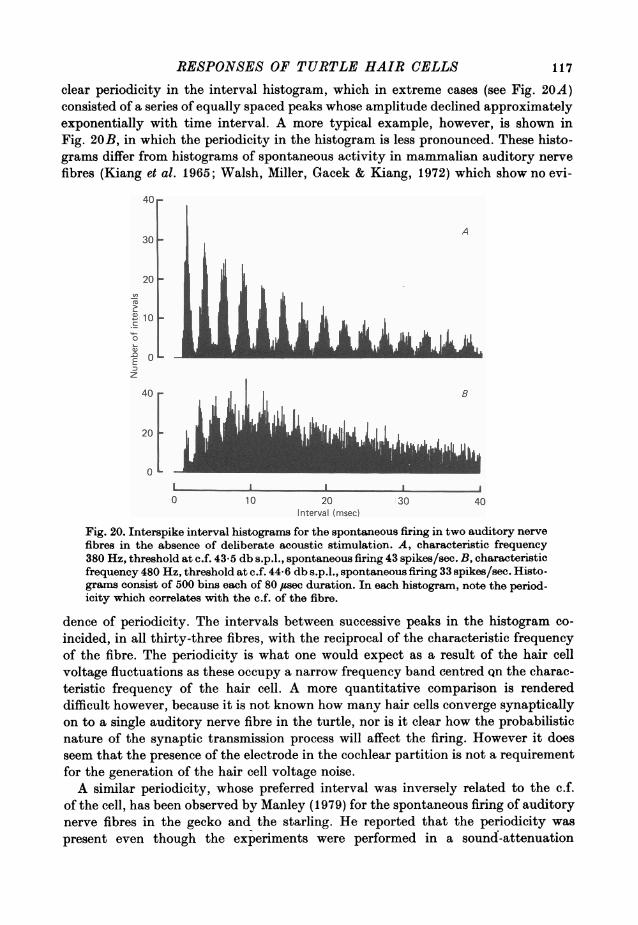
RESPONSES OF TURTLE HAIR CELLS
clear periodicity in the interval histogram, which in extreme cases (see Fig. 20A)consisted of a series of equally spaced peaks whose amplitude declined approximatelyexponentially with time interval. A more typical example, however, is shown inFig. 20B, in which the periodicity in the histogram is less pronounced. These histo-grams differ from histograms of spontaneous activity in mammalian auditory nervefibres (Kiang et al. 1965; Walsh, Miller, Gacek & Kiang, 1972) which show no evi-
40
A30
20
Io
~:0
. oLz
40
20
0I I I I I
0 10 20 130 40Interval (msec)
Fig. 20. Interspike interval histograms for the spontaneous firing in two auditory nervefibres in the absence of deliberate acoustic stimulation. A, characteristic frequency380 Hz, threshold at c.f. 43.5 db s.p.l., spontaneous firing 43 spikes/sec. B, characteristicfrequency 480 Hz, threshold at c.f. 44-6 db s.p.i., spontaneous firing 33 spikes/sec. Histo-grams consist of 500 bins each of 80 Alsec duration. In each histogram, note the period-icity which correlates with the c.f. of the fibre.
dence of periodicity. The intervals between successive peaks in the histogram co-incided, in all thirty-three fibres, with the reciprocal of the characteristic frequencyof the fibre. The periodicity is what one would expect as a result of the hair cellvoltage fluctuations as these occupy a narrow frequency band centred Qn the charac-teristic frequency of the hair cell. A more quantitative comparison is rendereddifficult however, because it is not known how many hair cells converge synapticallyon to a single auditory nerve fibre in the turtle, nor is it clear how the probabilisticnature of the synaptic transmission process will affect the firing. However it doesseem that the presence of the electrode in the cochlear partition is not a requirementfor the generation of the hair cell voltage noise.A similar periodicity, whose preferred interval was inversely related to the c.f.
of the cell, has been observed by Manley (1979) for the spontaneous firing of auditorynerve fibres in the gecko and the starling. He reported that the periodicity waspresent even though the experiments were performed in a sound-attenuation
117
118 A. C. CRAWFORD AND R. FETTIPLACEchamber, which argues against the phenomenon arising by inadvertent stimulationdue to extraneous noise.
In two experiments the tympanum was completely removed and the columellaclipped back close to the quadrate bone. Auditory nerve fibre thresholds in these
5 A
0
-5
L I I I I0 5 10 15 20
Time before spike (ms)
Fig. 21. Reverse correlograms between the spikes in a nerve fibre and the sound pressureat the tympanum: in the absence of deliberate acoustic stimulation (C) and in thepresence of added acoustic noise at 66 db s.p.l. (B) and 76 db s.p.l. (A). Each recordrepresents the average sound pressure for 20 ms before the occurrence of a spike whichtakes place at time zero (see Methods for details of measurement). The mean firingrate was 43 spikes/s (C), 58 spikes/s (B) and 76 spikes/s (A); same cell as Fig. 20A.Number of sweeps to produce average: A, 1024; B, 4096; C, 2048.
animals were 86-3 + 9-4 db s.p.l. (mean + S.D.; n = 16) and 99*0+ 8-1 db s.p.l.(mean + S.D.; n = 15). These values represent a sensitivity loss of about 40 db whichis similar to the loss in sensitivity as assayed by the cochlear microphonic inP8evdemys on removal of the tympanum (Wever & Vernon, 1956). Despite the lossin sensitivity, high spontaneous firing rates were still observed. Interval histogramsof the spontaneous firing were examined in twenty nerve fibres in these animals andseventeen showed clear evidence of periodicity. In view of the grossly impairedsensitivity of the ear under these conditions it seems unlikely that backgroundacoustic stimulation could contribute significantly to the existence of the periodicdischarge in the auditory nerve of the turtle.
RESPONSES OF TURTLE HAIR CELLS 119The histograms shown in Fig. 20 bear many resemblances to interval histograms
obtained by Rose, Brugge, Anderson & Hind (1967) from squirrel monkey auditorynerve fibres when stimulated with continuous tones at the c.f. of the fibre. As afurther check on the lack of effect of spurious acoustic stimulation in our experimentswe used the technique of triggered correlation (de Boer, 1968; de Boer & Kuyper,1968) to look for a correlation between the spontaneous auditory nerve dischargeand the sound pressure at the tympanum. The procedure reveals any consistentfeatures of the sound pressure wave form that precede the occurrence of a spike inthe auditory nerve. Since the hair cell voltage fluctuations are uncorrelated with thebackground acoustic fluctuations we would expect the triggered correlograms toconfirm this point. Fig. 21 shows triggered correlograms for a nerve fibre whoseinterval histogram is shown in Fig. 20A. The fibre had a spontaneous firing rate of43 spikes/s with a particularly pronounced periodicity. On deliberately adding inacoustic noise at 66 db s.p.l. the mean firing rate increased to 58 spikes/s andwith the added noise at 76 db s.p.l. the mean firing rate was 76 spikes/s. Thetriggered correlograms obtained under these conditions are shown in Fig. 21 A and B.Both correlograms show a damped oscillation at about 380 Hz, which was the c.f.of the fibre. The similarity between the wave forms and the hair cell click response isstriking (see Fig. 16) and interestingly, correlograms begin with a negative pressuredeflection indicating again that the rarefaction phase of the sound is excitatory. Incontrast to these correlograms, that obtained from the spontaneous discharge in theabsence of intentional acoustic stimulation was flat (Fig. 21 C). This was the case inall of the thirty-three fibres that were examined, no matter how many sweeps wereaveraged. These results provide further support for the idea that most of the spon-taneous firing in the auditory nerve is not a consequence of spurious acoustic stimula-tion of the ear.
DISCUSSIONThe isolated cochleaWe have used an isolated cochlea preparation in the hope that its mechanical
stability would improve the chances of making intracellular recordings from thehair cells. The viability of the isolated preparation is indicated by the sensitivitiesand sharp tuning curves of the auditory nerve fibres, and its suitability for this kindof experiment is confirmed by the large voltage responses that can be recordedintracellularly from the hair cells. These potentials are larger than previous measure-ments made in the reptilian cochlea (Mulroy et al. 1974) but are comparable toresponses reported for inner hair cells in the guinea-pig cochlea (Russell & Sellick,1978). The survival of the isolated reptilian preparation was first described byAdrian et al. (1938), who recorded auditory responses in the tortoise and thealligator. The relative immunity to anoxia of the turtle cochlea is remarkable incomparison to the mammal, where merely slowing the rate of artificial ventilationhas been shown to detune and increase the thresholds of the auditory nerve fibres(Robertson & Manley, 1974). Some of this difference may be a consequence of thesusceptibility to anoxia of the endocochlear potential in the mammal unlike theturtle (Schmidt & Fernandez, 1962). However, the ability of the turtle to survive onanaerobic metabolism associated with its prolonged diving (Robin, Vester, Murdaugh
119
A. C. CRAWFORD AND R. FETTIPLACE& Millen, 1964) is probably the major reason for the survival of the isolated prep-aration.The lowest thresholds reported in this paper for the auditory nerve fibre responses
were around 35-45 db s.p.l. The values are almost identical to the thresholds ob-tained by Paton, Moffat & Capranica (1976) for auditory nerve fibres in intactanaesthetized Pseudemys, and are similar to the auditory thresholds given by Manley(1970) for cells in the cochlear nucleus of the box turtle, Terrapene carolina. Thenerve reponses recorded by Adrian et al. (1938) were an order of magnitude lesssensitive. The auditory range, reflected in the distribution of characteristic fre-quencies from about 30-700 Hz was also comparable to the range found in intactchelonia at room temperature, although Adrian et al. (1938) noted that the upperfrequency limit of the nerve responses was temperature-sensitive, being reducedto about 200 Hz at 10 'C. The sensitivity of the middle ear transfer in Pseudemyshas been found to fall off quite steeply above 650 Hz (Moffat & Capranica, 1978)which coincides with the upper limit of the distribution of c.f.s in the auditorynerve.On the basis of these various comparisons we have no reason to believe that coch-
lear function in the most sensitive isolated preparations was seriously impaired. Itis worth pointing out, however, that our results would indicate that the auditorysensitivity of the turtle over its optimal frequency range (200-600 Hz) is not as highas other reptiles such as the alligator, Caiman crocodiles (Klinke & Pause, 1977) orthe alligator lizard Gerrhonotus multicarinatus (Weiss, Mulroy, Turner & Pike, 1976).Despite the difference in sensitivities, the sharpness of the tuning of the nervefibres in all three reptiles is similar. The Qlodb values for the nerve fibre tuning inPseudemys are two to three times larger than in the mammal over the same fre-quency range (for collected mammalian results see Evans, 1975).
Nature of the resonanceThe detailed form of the responses and the tip of the tuning curve for several
hair cells have been described by the equations for a single stage resonance. Themost likely source of such a resonance would be in the mechanical properties of thebasilar membrane. The rapid change in frequency with position may howeverpresent a difficulty in explaining the frequency selectivity of the turtle's cochleasolely in terms of the mechanics of the basilar membrane motion. This is illustratedby the following calculation. Assuming an exponential frequency map (eqn. (7))then the 3 db bandwidth of a tuning curve is equivalent to a distance Ax along thebasilar membrane given approximately (for large Q) by
Ax = 2A log (1+ 2Q1) (25)
where A is the length of the basilar membrane over which there is an e-fold change infrequency. For A = 135 jtm (p. 106) and Q3db = 10, Ax is 13-2 ,m which is lessthan two hair cell diameters. Although a Q3db of 10 corresponds to the most selectivehair cell recorded from, some of the sharply tuned high frequency auditory nervefibres had Q3db values in the region of 20, which would give a Ax of 6 6 /sm. Thediameter of a hair cell (about 8 #um) sets an upper limit on the sharpness of tuning
120
RESPONSES OF TURTLE HAIR CELLSof a mechanical resonance on the basilar membrane that can be faithfully detected.For comparison the value of A for the mammalian cochlea (von B6k6sy, 1960) ismore than an order of magnitude larger than in the turtle, and so any tuning of thebasilar membrane spans a much greater number of hair cells.
So far there have been no measurements of the basilar membrane motion inPmeudemy8 to confirm whether it is capable of performing a mechanical frequencyanalysis. The limitation on tuning imposed by the hair cell dimensions can be avoidedby supposing either that the frequency selectivity is generated in more than onestage with the basilar membrane vibration not being as sharply tuned as the haircell responses, or that the resonance could be entirely localized to the hair cell itself.In a subsequent paper (Crawford & Fettiplace, 1980) we will present evidence tosupport the idea that the major part of the frequency selectivity results from anelectrical resonance in the hair cells.An undesirable consequence of a sharply tuned resonance is the loss in time resolu-
tion for short tone bursts at the c.f. (Fig. 8). Since there is a scatter in the sharpnessof tuning of auditory nerve fibres, however, there will be a concomitant variation intheir temporal properties, and it is conceivable that this variation is part of a delib-erate attempt to provide accurate coding of both the temporal and frequencycharacteristics of incoming signals. The time constant of the build up and decayof the linear responses is proportional to the 3 db bandwidth of the tuning curveswhich can vary from about 25 to 90 Hz thus producing a range of time constantsfrom 3*5 to 12-7 ins.
Hair cell sensitivityThe sensitivity of the hair cells has been expressed in terms of the voltage they
produce for a given sound pressure at the tympanum, the value for the most sensitivecell being about 90 mV/Pa. There are several steps which lie between the movementsof the tympanum and the bending of the hair cell cilia, and it would be useful toderive a more direct measure of the sensitivity of the hair cell transduction mechan-ism. The only measurements of basilar membrane motion available for a reptile witha similar cochlea have been made in the alligator lizard (Weiss, Peake, Ling &Holton, 1978). These measurements extrapolate, on the assumption of linearity, togive a peak basilar membrane displacement of + 0-2 nm at 40 db s.p.l. If one allowsfor a 20 db difference in auditory nerve fibre thresholds between the two species(making the assumption that all this difference derives from the lower sensitivity ofthe middle ear, there is evidence to support the view that at least 10 db can beaccounted for in this way: e.g. Moffat & Capranica 1978) the basilar membrane dis-placement in the turtle might be closer to + 0*02 nm at 40 db s.p.l. At this sound pres-sure, corresponding approximately to the animal's behavioural threshold (Fig. 4)the most sensitive hair cell would have been producing a maximum peak-to-peakresponse of 0 5 mV. This would therefore give a sensitivity of 12-5 mV per nmdisplacement of the basilar membrane.To proceed any further it is necessary to make an assumption about what is the
effective stimulus for hair cell excitation. For example, stimulation could be deter-mined by the angle of deflexion of rigid cilia pivoted at the point at which they arejoined to the apical surface of the cell. An alternative assumption would be that
121
A. C. CRAWFORD AND R. FETTIPLACE
excitation is a consequence of a shearing force between the hair cell body and the ciliawhich are embedded in the tectorial membrane (ter Kuile, 1900; von Bekesy, 1960).Hudspeth & Corey (1977) have shown that saccular hair cells can be artificiallystimulated by deflexion of their ciliary bundles with a glass probe slipped over the tipsof the cilia. These results would be consistent with either of the excitation hypotheses,and, depending upon which is correct, there could be a considerable amplificationof the transmitted force or angular deflexion (ter Kuile, 1900; von B&k6sy, 1960).On the first hypothesis, if the cilia are assumed to be rigid and anchored only at
their tips, the angle of deflexion of the basilar membrane from the horizontal isamplified by a factor approximately equal to the height of the basilar papilla (fromthe apical surface of the hair cell to the base of the membrane) divided by the lengthof the cilia. In the turtle this factor is about ten (see P1. 2). Thus the hair cell sensi-tivity expressed in terms of the voltage response for a given angular deflexion of thecilia would have a value in the most sensitive cell of 2 V/degree. This is nearly threeorders of magnitude greater than the 3 mV/degree inferred from the data of Huds-peth & Corey (1977) for the sensitivity of saccular hair cells. It is conceivable that thelarge discrepancy between the two values is due to the fact that the shearing forcerather than ciliary deflexion is the effective stimulus for hair cell excitation. Theremay also be an amplification of the voltage signals introduced by the electricalresonance in the hair cells (Crawford & Fettiplace, 1980).
Voltage noise in the hair cellsThe presence of voltage fluctuations in the hair cells in the absence of acoustic
stimulation is an observation that finds parallels in recordings from statocyst haircells of invertebrates (Detwiler & Fuortes, 1975; Wiederhold, 1978; DeFelice &Alkon, 1977). Statocyst hair cells show a spontaneous noise voltage when the stato-conia lie over the sensory hairs. If the cyst is rotated so that the beat of the cilia isunhindered by the statoconia, the noise voltage disappears (Wiederhold, 1978;Grossman, Alkon & Heldman, 1979). It is possible that the noise signals in thecochlear hair cells of Pseudemys may have a similar origin for the ciliary bundles arerestrained in pockets in the tectorial membrane. It would be envisaged that the ciliaare motile, and that the voltage noise would arise due to restriction of their move-ment. There is, however, no evidence as yet to indicate that the cilia of the cochlearhair cells are motile.Since the spectrum of the noise voltage is comparable to the hair cell's tuning
curve, this would argue that wherever the noise source is located, it precedes or isassociated with the mechanism responsible for most of the hair cell's tuning. Thepresence of the noise poses a considerable problem for the animal in terms of signaldetection since, in a given hair cell, it possesses the same frequency components andis several times larger in amplitude than the sound-induced voltages at the be-havioural threshold. There is, however, an interaction between the noise voltage andthe sound-induced voltages. For the largest responses the noise is completely sup-pressed, but the noise variance may be somewhat reduced even in the presence ofsmaller responses.
122
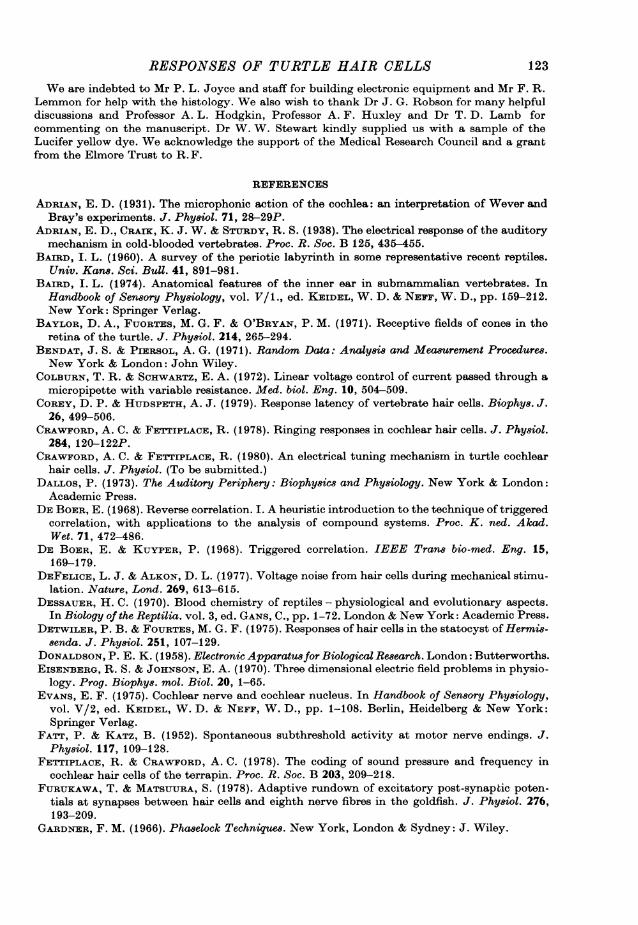
RESPONSES OF TURTLE HAIR CELLS 123
We are indebted to Mr P. L. Joyce and staff for building electronic equipment and Mr F. R.Lemmon for help with the histology. We also wish to thank Dr J. G. Robson for many helpfuldiscussions and Professor A. L. Hodgkin, Professor A. F. Huxley and Dr T. D. Lamb forcommenting on the manuscript. Dr W. W. Stewart kindly supplied us with a sample of theLucifer yellow dye. We acknowledge the support of the Medical Research Council and a grantfrom the Elmore Trust to R. F.
REFERENCES
ADRIAN, E. D. (1931). The microphonic action of the cochlea: an interpretation of Wever andBray's experiments. J. Physiol. 71, 28-29P.
ADRIAN, E. D., CRAIx, K. J. W. & STURDY, R. S. (1938). The electrical response of the auditorymechanism in cold-blooded vertebrates. Proc. R. Soc. B 125, 435455.
BAIRD, I. L. (1960). A survey of the periotic labyrinth in some representative recent reptiles.Univ. Kans. Sci. Bull. 41, 891-981.
BAIRD, I. L. (1974). Anatomical features of the inner ear in submammalian vertebrates. InHandbook of Sensory Phy8iology, vol. V/1., ed. KEIDEL, W. D. & NEFF, W. D., pp. 159-212.New York: Springer Verlag.
BAYLOR, D. A., FUORTES, M. G. F. & O'BRYAN, P. M. (1971). Receptive fields of cones in theretina of the turtle. J. Phy8iol. 214, 265-294.
BENDAT, J. S. & PIERSOL, A. G. (1971). Random Data: Analy8i8 and Measurement Procedures.New York & London: John Wiley.
COLBURN, T. R. & SCHWARTZ, E. A. (1972). Linear voltage control of current passed through amicropipette with variable resistance. Med. biol. Eng. 10, 504-509.
COREY, D. P. & HUDSPETH, A. J. (1979). Response latency of vertebrate hair cells. Biophys. J.26, 499-506.
CRAWFORD, A. C. & FETTIPLAcE, R. (1978). Ringing responses in cochlear hair cells. J. Phy8iol.284, 120-122P.
CRAWFORD, A. C. & FErrIPLACE, R. (1980). An electrical tuning mechanism in turtle cochlearhair cells. J. Physiol. (To be submitted.)
DAIaJOS, P. (1973). The Auditory Periphery: Biophysics and Phy8iology. New York & London:Academic Press.
DE BOER, E. (1968). Reverse correlation. I. A heuristic introduction to the technique of triggeredcorrelation, with applications to the analysis of compound systems. Proc. K. ned. Akad.Wet. 71, 472-486.
DE BOER, E. & KUYPER, P. (1968). Triggered correlation. IEEE Trans bio-med. Eng. 15,169-179.
DEFELICE, L. J. & ALKON, D. L. (1977). Voltage noise from hair cells during mechanical stimu-lation. Nature, Lond. 269, 613-615.
DESSAUER, H. C. (1970). Blood chemistry of reptiles - physiological and evolutionary aspects.In Biology of the Reptilia. vol. 3, ed. GANS, C., pp. 1-72. London & New York: Academic Press.
DETWILER, P. B. & FoURTEs, M. G. F. (1975). Responses of hair cells in the statocyst of Hermis-senda. J. Physiol. 251, 107-129.
DONALDSON, P. E. K. (1958). Electronic Apparatu8for Biological Research. London: Butterworths.EISENBERG, R. S. & JOHNSON, E. A. (1970). Three dimensional electric field problems in physio-
logy. Prog. Biophys. mol. Biol. 20, 1-65.EVANS, E. F. (1975). Cochlear nerve and cochlear nucleus. In Handbook of Sensory Physiology,
vol. V/2, ed. KEIDEL, W. D. & NEFF, W. D., pp. 1-108. Berlin, Heidelberg & New York:Springer Verlag.
FATT, P. & KATZ, B. (1952). Spontaneous subthreshold activity at motor nerve endings. J.Phy8iol. 117, 109-128.
FETTIPLAcE, R. & CRAWFORD, A. C. (1978). The coding of sound pressure and frequency incochlear hair cells of the terrapin. Proc. R. Soc. B 203, 209-218.
FURUKAWA, T. & MATSUURA, S. (1978). Adaptive rundown of excitatory post-synaptic poten-tials at synapses between hair cells and eighth nerve fibres in the goldfish. J. Physiol. 276,193-209.
GARDNER, F. M. (1966). Phaselock Techniques. New York, London & Sydney: J. Wiley.
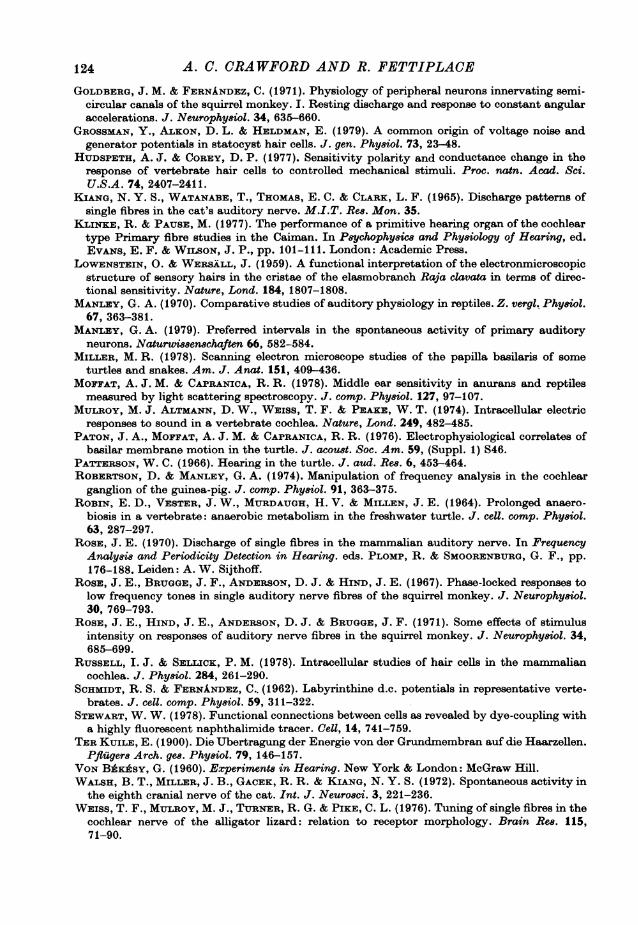
A. C. CRAWFORD AND R. FETTIPLACEGOLDBERG, J. M. & FERNANDEZ, C. (1971). Physiology of peripheral neurons innervating semi-
circular canals of the squirrel monkey. I. Resting discharge and response to constant angularaccelerations. J. Neurophyriol. 34, 635-660.
GROSSMAN, Y., ALKON, D. L. & HELDMAN, E. (1979). A common origin of voltage noise andgenerator potentials in statocyst hair cells. J. gen. Phy8iol. 73, 23-48.
HUDSPETH, A. J. & COREY, D. P. (1977). Sensitivity polarity and conductance change in theresponse of vertebrate hair cells to controlled mechanical stimuli. Proc. natn. Acad. Sci.U.S.A. 74, 2407-2411.
KIANG, N. Y. S., WATANABE, T., THOMAS, E. C. & CLARK, L. F. (1965). Discharge patterns ofsingle fibres in the cat's auditory nerve. M.I.T. Re8. Mon. 35.
KLiNxz, R. & PAUSE, M. (1977). The performance of a primitive hearing organ of the cochleartype Primary fibre studies in the Caiman. In Pgychophyeic and Physiology of Hearing, ed.EvANs, E. F. & WILSON, J. P., pp. 101-111. London: Academic Press.
LOwENsTEIN, 0. & WERSALL, J. (1959). A functional interpretation of the electronmicroscopicstructure of sensory hairs in the cristae of the elasmobranch Raja clavata in terms of direc-tional sensitivity. Nature, Lond. 184, 1807-1808.
MANLEY, G. A. (1970). Comparative studies of auditory physiology in reptiles. Z. vergl. Physiol.67, 363-381.
MANLEY, G. A. (1979). Preferred intervals in the spontaneous activity of primary auditoryneurons. Naturwieeenechaften 66, 582-584.
MILLER, M. R. (1978). Scanning electron microscope studies of the papilla basilaris of someturtles and snakes. Am. J. Anat. 151, 409-436.
MOFFAT, A. J. M. & CAPRANICA, R. R. (1978). Middle ear sensitivity in anurans and reptilesmeasured by light scattering spectroscopy. J. comp. Phyeiol. 127, 97-107.
MULROY, M. J. ALTMANN, D. W., WEISS, T. F. & PEAxE, W. T. (1974). Intracellular electricresponses to sound in a vertebrate cochlea. Nature, Lond. 249, 482-485.
PATON, J. A., MOFFAT, A. J. M. & CAPRANICA, R. R. (1976). Electrophysiological correlates ofbasilar membrane motion in the turtle. J. acouet. Soc. Am. 59, (Suppl. 1) S46.
PATTERSON, W. C. (1966). Hearing in the turtle. J. aud. Re8. 6, 453-464.ROBERTSON, D. & MANLEY, G. A. (1974). Manipulation of frequency analysis in the cochlear
ganglion of the guinea-pig. J. comp. Phyeiol. 91, 363-375.ROBIN, E. D., VESTER, J. W., MURDAUGH, H. V. & MILTEN, J. E. (1964). Prolonged anaero-
biosis in a vertebrate: anaerobic metabolism in the freshwater turtle. J. cell. comp. Phy8iol.63, 287-297.
ROSE, J. E. (1970). Discharge of single fibres in the mammalian auditory nerve. In FrequencyAnalysis and Periodicity Detection in Hearing. eds. PLOMP, R. & SMOORENBURG, G. F., pp.176-188. Leiden: A. W. Sijthoff.
ROSE, J. E., BRUGGE, J. F., ANDERSON, D. J. & HIND, J. E. (1967). Phase-locked responses tolow frequency tones in single auditory nerve fibres of the squirrel monkey. J. Neurophysiol.30, 769-793.
ROSE, J. E., HIND, J. E., ANDERSON, D. J. & BRUGGE, J. F. (1971). Some effects of stimulusintensity on responses of auditory nerve fibres in the squirrel monkey. J. Neurophyeiol. 34,685-699.
RUSSELL, I. J. & SELLICK, P. M. (1978). Intracellular studies of hair cells in the mammaliancochlea. J. Physiol. 284, 261-290.
SCHMIDT, R. S. & FERNANDEZ, C.. (1962). Labyrinthine d.c. potentials in representative verte-brates. J. cell. comp. Phy8iol. 59, 311-322.
STEWART, W. W. (1978). Functional connections between cells as revealed by dye-coupling witha highly fluorescent naphthalimide tracer. Cell, 14, 741-759.
TER KUILE, E. (1900). Die Ubertragung der Energie von der Grundmembran auf die Haarzellen.Pfiiugers Arch. gee. Physiol. 79, 146-157.
VON BfKASY, G. (1960). Experiments in Hearing. New York & London: McGraw Hill.WALSH, B. T., MILLER, J. B., GACEK, R. R. & KIANG, N. Y. S. (1972). Spontaneous activity in
the eighth cranial nerve of the cat. Int. J. Neurosci. 3, 221-236.WEISS, T. F., MULROY, M. J., TURNER, R. G. & PIKE, C. L. (1976). Tuning of single fibres in the
cochlear nerve of the alligator lizard: relation to receptor morphology. Brain Ree. 115,71-90.
124
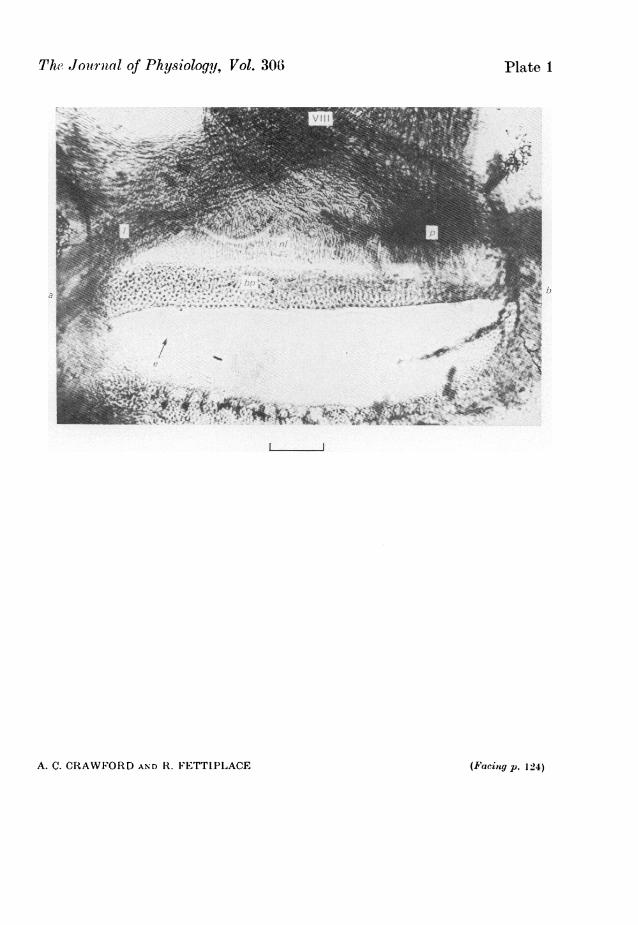
Thiw Journal of Physiology, Vol. 306 Plate 1
IF I;
, , ',,X' b
l.. l
A. C. CRAWFORD AND R. FETTIPLACE (F'acing p. TV2*4)
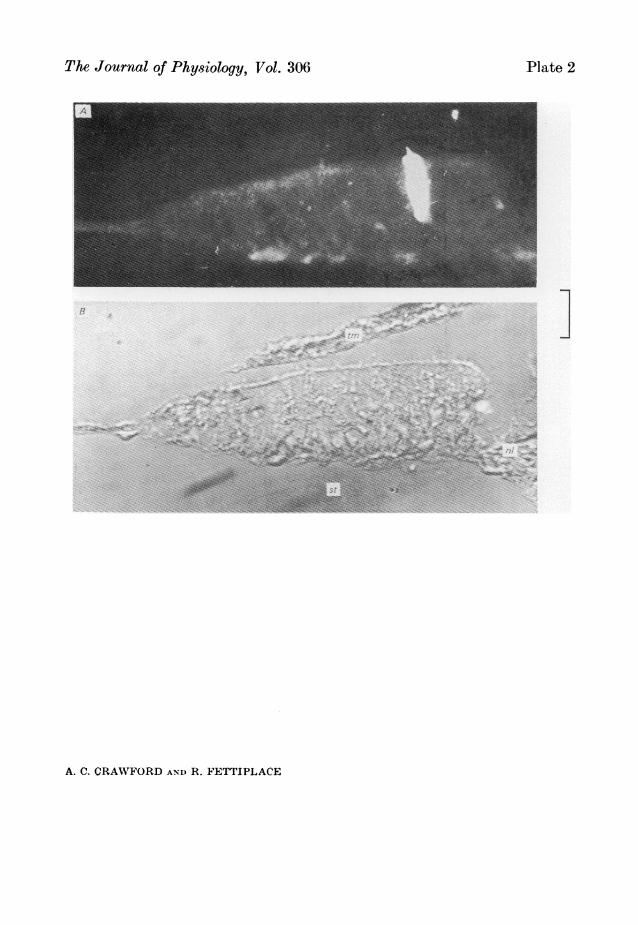
The Journal of Physiology, Vol. 306
Elfi;:;:.. .......w - 1. -r Jd * ; C At....
A. C. CRAWFORD AN'D R. FETTIPLACE
IA.A.......... ....
*-.41 ,:..... A.
Plate 2
RESPONSES OF TURTLE HAIR CELLS 125
WEISS, T. F., PEAKLE, W. T., LING, A. & HOLTON, T. (1978). Which structures determinefrequency selectivity and tonotopic organization of vertebrate cochlear nerve fibres? Evidencefrom the alligator lizard. In Evoked Electrical Activity in the Auditory Nervou8 Sy8tem, eds.NAUNTON, R. F. & FERNANDEZ, C., pp. 91-112. New York, San Francisco & London: AcademicPress.
WEVER, E. G. (1971). The mechanics of hair cell stimulation. Ann. Otol. Rhinol. Lar. 80, 786-804.
WEVER, E. G. (1978). The Reptile Ear: Its Structure and Function. Princeton University Press.WEVER, E. G. & VERNON, J. R. (1956). Sound transmission in the turtle's ear. Proc. natn. Acad.
Sci. U.S.A. 42, 292-299.WIEDERHOLD, M. L. (1978). Membrane voltage noise associated with ciliary beating in the
Aplysia statocyst. Brain Re8. 156, 369-374.
EXPLANATION OF PLATES
PLATE 1
Low power photomicrograph of a wholemount of the left cochlea of a juvenile Peeudemy88cripta elegant. The cochlea has been lightly stained with Heidenhain's haematoxylin. Themicrograph is focused at the plane of the hair cell nuclei in the basilar papilla (bp). The nervefibres in the neural limb (nl) are also in focus as they dive anteriorly after leaving the papilla.
Other abbreviations: a, apical end of cochlea; b, basal end; e, abneural edge of basilar mem-brane; 1, lagenar nerve; p, nerve to ampulla of posterior semicircular canal, nerve has been cut;VIII, auditory nerve. Calibration bar 100 j#m.
PLATE 2Photomicrographs of a transverse section of the basilar papilla to show localization of the
electrode position by dye injection. A, fluorescence illumination showing a hair cell stained withLucifer yellow. B, same section with Normarski optics. The histological preparation is des-cribed in the Methods; calibration bar 20 jum, the magnification is the same in both micrographs.tm, tectorial membrane; 8t, scala tympani; ni, neural limb. Note that the dye has diffused intothe cilia of the stained cell; ciliary bundles of other cells also visible in B.


![Joanne Crawford Triple jeopardy-crawford-ACFID-uts-2013[1]](https://img.pdfslide.us/doc/110x75/555128ddb4c905f1528b4a4b/joanne-crawford-triple-jeopardy-crawford-acfid-uts-20131.jpg)
