Embed Size (px)
Citation preview
Cranfield University
Alexander David Nind
A Technoeconomic Risk Assessment of Conventional Aero-
Gas Turbines: Technological Limits and Future Directions
School of Aerospace, Transport and Manufacturing
PhD Thesis
July 2016
Supervisors: Dr Vishal Sethi
Dr Devaiah Nalianda Karumbaiah
© Cranfield University, 2016 All rights reserved. No part of this publication may be
reproduced without the written permission of the copyright holder

i
Abstract
Increasing environmental awareness, uncertain economic climates and fluctuating fuel prices
have led to airlines investigating the means to lower aircraft fuel burn, emissions and noise,
while maintaining the highest possible safety standards. This is done in order to reduce
operating costs as well as a desire to offer customers more environmentally responsible
transport options.
The jet engine has been a fundamental part of passenger aircraft travel and has evolved to
become more efficient and quiet. With an aim to improve the overall efficiency of the gas
turbine, the industry has consistently sought to improve thermal and propulsive efficiency.
Higher thermal efficiencies have been achieved through increased overall pressure ratios and
the turbine entry temperatures, while higher propulsive efficiencies has been achieved through
increase in bypass ratios. Conventional technology is however reaching the limits of any further
improvements.
This study seeks to investigate these design limits for the conventional aero gas turbine and
focusses on the propulsion system of short to medium range jet aircraft, specifically catering to
low cost airline operations in Europe.
A techno-economic risk analysis approach was followed through the utilisation of a flexible
multi-disciplinary framework. This allows a multitude of critical parameters and factors to be
investigated and their effects established. Some of the key parameters investigated include the
effect of design optimisation on SFC, mission fuel burn, engine sizes and weights.
By first quantifying the current design parameters and associated constraints for the selected
conventional propulsion system, an optimisation study is carried out to identify the possible
design limits to which the conventional technology may be pushed. It is therefore possible to
then quantify the maximum benefit available to this mature technology and also to further
identify which future technologies may offer the most benefits for a particular airline market
strategy.
The key contribution to knowledge from this study is to therefore provide a techno-economic
risk assessment of an optimised conventional high bypass ratio turbofan and establish the design
limits that may be needed to achieve further benefits from conventional designs. The study is
undertaken from an operator/airline perspective and further quantifies the point at which the
investment opportunity of a novel technology justifies the risks associated with it.
This study has shown that there is still potential for fuel burn improvement from the evolution
of the conventional turbofan. This improvement could be up to 15-20% when compared to
technology of the year 2000. This is shown to be achieved through improvement material and
design of the high pressure compressor spool, aimed at essentially reducing weight and
diameters.
The study also includes a qualitative discussion on novel, disruptive technologies, and the risks
associated with their introduction as future propulsion systems.

ii

iii
Acknowledgments
Firstly I would like to express my thanks to easyJet, as well as the Engineering and
Physical Sciences Research Council (EPSRC) for providing the funding for this PhD.
At Cranfield University I would firstly like to thank Professor Pericles Pilidis for
offering the opportunity of studying for a PhD, and particular thanks to my two
supervisors: Dr Vishal Sethi and Dr Devaiah Nalianda for their help, understanding and
patience. Thanks also goes to Fran Radcliffe and Teresa Townsend, part of the
University's support network, for their help in getting me through a difficult last few
months.
There are many friends, office mates and colleagues who I have shared many
experiences over the years, offering insights and assistance, including Wanis
Mohammed, Peter Zhang, Lefteris Giakoumakis, Hasani Azamar Aguirre, Emmanuel
Osigwe, Alejandro Block, Joshua Sebastiampillai, Diana Guiomar San Benito Pastor
and Tala El Samad
My final acknowledgement is to my wife, Andrea, for her unconditional support and
understanding. I can now repay you by looking after the kids and giving you a break!

iv
v
Contents
Abstract .............................................................................................................................. i Acknowledgments ........................................................................................................... iii
Contents ............................................................................................................................ v List of Figures ................................................................................................................. vii List of Tables ................................................................................................................... ix Nomenclature.................................................................................................................... x
Acronyms and Abbreviations ........................................................................................ x
Letters and Symbols ..................................................................................................... xi
1.0 Introduction ................................................................................................................ 1
1.1 Objectives ............................................................................................................... 2 1.2 Contribution to Knowledge .................................................................................... 2 1.3 Thesis Structure ...................................................................................................... 4
2.0 Literature Review ....................................................................................................... 5 2.1 Aero-Engine Trends ............................................................................................... 5
2.2 Improving Fuel Consumption ................................................................................. 9 2.3 Recent Engine Research ....................................................................................... 11
2.4 The Gap ................................................................................................................ 16 2.5 TERA Overview ................................................................................................... 18
2.5.1 History of TERA ........................................................................................... 18 2.5.2 What is TERA? .............................................................................................. 20
2.6 Other Multi-Disciplinary Optimisation Tools ...................................................... 24 2.7 Environmental Policy and Targets Context .......................................................... 25
2.7.1 Global Policies ............................................................................................... 26
2.7.2 European Environmental Goals and Legislation ........................................... 26 2.8 Alternative Aircraft Engine Technologies ............................................................ 29
2.8.1 Pulse Detonation Engines (PDE) ................................................................... 29 2.8.2 Wave Rotor .................................................................................................... 34
2.8.3 Intercooled, Recuperated and Intercooled & Recuperated Cores ................. 39 2.8.4 Open Rotors/High Speed Propellers .............................................................. 44 2.8.5 Turboprops/Conventional Propellers ............................................................. 48
3.0 TERA Methodology and Models ............................................................................. 52 3.1 General TERA Methodology ............................................................................... 52
3.2 Engine Performance Module ................................................................................ 53 3.3 Aircraft Performance Module ............................................................................... 57
3.4 Engine Sizing Module - TETHYS ....................................................................... 63 3.4.1 Fan ................................................................................................................. 66 3.4.2 Compressors .................................................................................................. 68 3.4.3 Turbines ......................................................................................................... 72 3.4.5 Nacelle ........................................................................................................... 74
3.4.6 Ducts .............................................................................................................. 80 3.4.7 Combustor ..................................................................................................... 81 3.4.8 Verification .................................................................................................... 82 3.4.9 Model Limitations and Potential Improvements ........................................... 84
3.5 Weight Estimation Module ................................................................................... 84 3.5.1 Sargerser et al's Weight Estimation Method with Jackson’s Updates ........... 87
vi
3.5.2 Model Structure ............................................................................................. 91
3.5.3 Model Verification ........................................................................................ 92 4.0 Baseline model setup and discussion........................................................................ 93
4.1 TURBOMATCH Model of CFM56-5B/4 Type Engine (CUEJ56) ..................... 93 4.2 Aircraft Model .................................................................................................... 100 4.3 Model Limitations .............................................................................................. 103
5.0 Airbus A320 NEO Engines (Pratt and Whitney GTF & CFM Leap) .................... 104 5.1 New Engine Context ........................................................................................... 104
5.1.1 A320 NEO ................................................................................................... 104 5.1.2 CFM LEAP Very High Bypass Ratio Conventional Turbofan (“LEAP”) .. 105 5.1.3 Pratt and Whitney PurePower Geared Turbofan (“PPGTF”) ...................... 105
5.2 Engine Performance Modelling .......................................................................... 105 5.2.1 Gearbox Modelling in TURBOMATCH ..................................................... 109
5.3 New Engine Characteristics................................................................................ 110
5.4 Aircraft Mission Performance ............................................................................ 111 6.0 Optimisation ........................................................................................................... 116
6.1 Engines for Optimisation .................................................................................... 116 6.1.1 Engine Initial Parameters and Assumptions ................................................ 116
6.1.2 Parametric Study ......................................................................................... 119 The Effect of High Pressure Compressor Ratio ............................................... 119
The Effect of Fan Pressure Ratio ...................................................................... 123 The Effect of Booster Pressure Ratio ............................................................... 124 The Effect of Bypass Ratio ............................................................................... 126
6.1.3 Optimisation Setup ...................................................................................... 127
6.1.4 Optimisation Results ................................................................................... 129 6.1.5 Fuel Burn Savings ....................................................................................... 133 6.1.6 Limits to Achieving Gains ........................................................................... 135
6.1.7 Economic Analysis .................................................................................. 141 6.1.8 Discussion ................................................................................................ 148
7.0 Conclusions ............................................................................................................ 156
7.1 Recommendations for Future Work ................................................................... 160
8.0 References .............................................................................................................. 161 Appendix 1 - HERMES Input File ............................................................................... 173 Appendix 2 – Tethys Input File – CUEJ56 .................................................................. 178 Appendix 3 – Technology Readiness Level ................................................................. 182
vii
List of Figures
Figure 2.1: Aircraft Noise and Bypass Ratio Trends (Birch, 2000) ................................. 6 Figure 2.2: Turbine Entry Temperature Evolution (Kyprianidis, 2011) .......................... 6 Figure 2.3: THermal Efficiency Variation with Overall Pressure Ratio and Turbine
Entry Temperature (Birch, 2000) ..................................................................................... 7 Figure 2.4: ICAO Nox Emission Charactistic Regulations (Dickson, 2014) ................... 8 Figure 2.5: SFC Variation with OPR and TET (Birch, 2000) ........................................ 10
Figure 2.6: Propulsive Fuselage Concept (Seitze and Gologan, 2015) .......................... 15 Figure 2.7: Philosophy of TERA (Ogaji et al, 2007, p.4)............................................... 20 Figure 2.8: Flow Costs in an Operating Costs Model (Nalianda 2012, p.68) ................ 23 Figure 2.9: Pulse Detonation Cycle (Musielak, N.D.) ................................................... 30 Figure 2.10: Pulse Detonation Engine for Aerospace Applications Diagram ................ 30 Figure 2.11: T-S Diagram Comparison of Brayton Cycle (1-2-3’-4’) Against Humphrey
Cycle (1-2-3-4) (Akbari and Nalim, 2006, P.2) ............................................................. 31 Figure 2.12: Wave Rotor Drum showing cyclindrical channels (Akbari et al, 2006) .... 35 Figure 2.13: Wave rotor located within a gas turbine (Noppel, 2011) ........................... 36
Figure 2.14: T-S Diagram for Gas Turbine Topped Wave Rotor Cycle (Brayton Cycle
shown Dashed) (Welch et al, 1995)................................................................................ 37
Figure 2.15: Fuel burn Comparison of TurbOProp and TurboFan Equipped Aircraft
(Walsh and Bil, 2015, P.6) ............................................................................................. 50
Figure 3.16: TERA Framework ...................................................................................... 53 Figure 3.17: Brick Data Flow (Apostolidis et al, 2013 p.4) ........................................... 56 Figure 3.18: Typical Flight Mission Profile with Stepped Cruise (Laskaridis et al, 2005,
p4) ................................................................................................................................... 59 Figure 3.19: Tethys Structure.......................................................................................... 65
Figure 3.20: Turbine Velocity Triangles and Nomenclature (Ramsden et al. 2013) ..... 73 Figure 3.21: CFM56 Engine on Airbus A320 Aircraft (Collins 2006) .......................... 75 Figure 3.22: nacelle Design Component Split (Sun, 2012) ............................................ 76 Figure 3.23: Nacelle Intake Dimensions and Numbering(ENdara Mayorga 2015, p.43)
........................................................................................................................................ 77 Figure 3.24: Nacelle Afterbody Dimensions and Nomenclature (ENdara Mayorga 2015,
p.48) ................................................................................................................................ 79 Figure 3.25: CUEJ56 vs. CFM56-5B Layout (Endara Mayorga 2015, p.100) .............. 83 Figure 3.26: CUEJ56 Layout using Tethys Program ..................................................... 83 Figure 3.27: Nacelle Dimensions used for Weight Estimation (Jackson 2009, p. 107) . 90 Figure 3.28: Weight Model Structure ............................................................................. 91
Figure 4.29: Schematic of CUEJ56 ................................................................................ 93 Figure 4.30: Variation of Net Thrust with Altitude and Mach No for CUEJ56 Engine
Model .............................................................................................................................. 97 Figure 4.31: Variation of SFC with Altitude and Mach No for CUEJ56 Engine Model 97 Figure 4.32: Variation of Net Thrust with Ambient Temperature and Turbine Entry
Temperature for CUEJ56 Engine Model ........................................................................ 99 Figure 4.33: Variation of SFC with Ambient Temperature and Turbine Entry
Temperature for CUEJ56 Engine Model ...................................................................... 100
viii
Figure 4.34: Payload Range Diagram Comparing Cranbus EJ320 and Airbus A320 .. 103
Figure 5.35: CUEJ-LEAP Fan Pressure Ratio Optimisation ........................................ 108 Figure 5.36: CUEJ-PPGT Fan Pressure Ratio Optimisation ........................................ 109 Figure 5.37: Gearbox Losses Across Flight Range (Anderson et al, 1984, p.20) ........ 110 Figure 5.38: Payload-Range Diagram Comparison for the Baseline and Additional
Engines ......................................................................................................................... 113
Figure 5.39: CRANBUS EJ320 Cruise Mach Number Variation ................................ 115 Figure 6.40: HPC Pressure Ratio vs Block Fuel Burn ................................................. 120 Figure 6.41:HPC Pressure Ratio vs Hub-Tip Ratio ...................................................... 121 Figure 6.42: HPC Outlet Hub Radius vd Hub-Tip Ratio ............................................. 122 Figure 6.43: Fan pressure Ratio vs Block Fuel Burn ................................................... 123
Figure 6.44: Booster Pressure Ratio vs Block Fuel Burn ............................................. 125 Figure 6.45: Booster Pressure Ratio vs HPC Hub Radius ............................................ 125 Figure 6.46: Bypass Ratio vs Block Fuel Burn ............................................................ 127
Figure 6.47: Block Fuel Burn Comparison, Short Range Mission ............................... 130 Figure 6.48: Block Fuel Burn Comparison, Long Range Mission ............................... 131 Figure 6.49: Payload Range Diagram Comparison ...................................................... 134 Figure 6.50: CUEJ-DD1-SR Short Range Schematic .................................................. 139
Figure 6.51: CUEJ-DD1-LR Long Range Schematic .................................................. 139 Figure 6.52: CUEJ-GT1-SR Short Range Schematic ................................................... 140
Figure 6.53: CUEJ-GT1-LR Long Range Schematic ................................................... 140 Figure 6.54: Economic Sensitivity Analysis Model Structure ..................................... 141 Figure 6.55: Sensitivity analysis for Short Range CEUJ-DD1 and CUEJ-GT1 models at
a fuel price of $69 per barrel In Comparison to Baseline ............................................. 143
Figure 6.56: Sensitivity analysis for Short Range CEUJ-DD1 and CUEJ-GT1 models at
a fuel price of $140 per barrel In Comparison to Baseline ........................................... 145 Figure 6.57: Sensitivity analysis for Long Range CEUJ-DD1 and CUEJ-GT1 models at
a fuel price of $69 per barrel In Comparison to Baseline ............................................. 146 Figure 6.58: Sensitivity analysis for Long Range CEUJ-DD1 and CUEJ-GT1 models at
a fuel price of $140 per barrel In Comparison to Baseline ........................................... 146
Figure 6.59: Sensitivity analysis for Short Range CEUJ-DD1 and CUEJ-GT1 models at
a fuel price of $69 per barrel In Comparison to A320 NEO Engines .......................... 147 Figure 6.60: Sensitivity analysis for Short Range CEUJ-DD1 and CUEJ-GT1 models at
a fuel price of $140 per barrel In Comparison to A320 NEO Engines ........................ 147 Figure 6.61: Sensitivity analysis for Long Range CEUJ-DD1 and CUEJ-GT1 models at
a fuel price of $69 per barrel In Comparison to A320 NEO Engines .......................... 147 Figure 6.62: Sensitivity analysis for Long Range CEUJ-DD1 and CUEJ-GT1 models at
a fuel price of $140 per barrel In Comparison to A320 NEO Engines ........................ 148
Figure 7.63: Summary of Different Technologies – Fuel Burn vs Technology Readiness
Level Compared to Approximately Yr 2000 Baseline ................................................. 157
ix
List of Tables
Table 3.1: Weight Estimations Summary and Error (Lolis et al, 2014) ......................... 85
Table 3.2: Weight model component breakdown comparison ....................................... 92
Table 4.3: Parameters and Assumptions Used for CUEJ56 ........................................... 94
Table 4.4: Comparison of CUEJ56 with CFM56-5B/4 Data from Janes (2011 p. 177-
188) ................................................................................................................................. 96
Table 5.5: A320 NEO Engines Available Data ............................................................ 106
Table 5.6: Engine Parameters and Assumptions Comparison ...................................... 107
Table 5.7: Engine Performance Comparison ................................................................ 111
Table 5.8: CUEJ-LEAP and CUEJ-PPGT Weights and Dimensions .......................... 112
Table 5.9: Engine Mission Performance Comparison .................................................. 114
Table 6.10: Parameters and Assumptions for Engines for Optimisation ..................... 117
Table 6.11: Parameters altered for the study ................................................................ 119
Table 6.12: Upper and Lower Boundaries for the Optimisation Variables .................. 128
Table 6.13: Constraints applied in the Optimisation .................................................... 128
Table 6.14: Main Aircraft Mission Parameters ............................................................ 129
Table 6.15: Optimised Engines Physical Breakdown .................................................. 131
Table 6.16: Optimised Engines Performance .............................................................. 131
x
Nomenclature
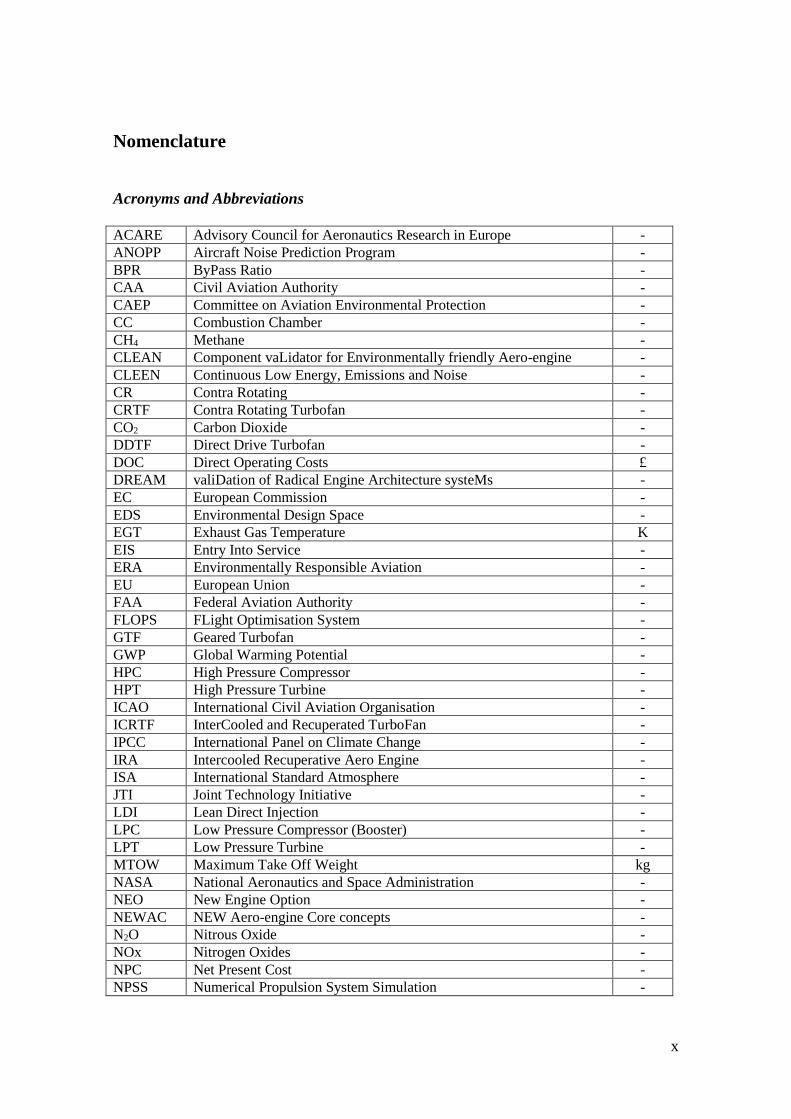
Acronyms and Abbreviations
ACARE Advisory Council for Aeronautics Research in Europe - ANOPP Aircraft Noise Prediction Program - BPR ByPass Ratio - CAA Civil Aviation Authority - CAEP Committee on Aviation Environmental Protection - CC Combustion Chamber - CH4 Methane - CLEAN Component vaLidator for Environmentally friendly Aero-engine - CLEEN Continuous Low Energy, Emissions and Noise - CR Contra Rotating - CRTF Contra Rotating Turbofan - CO2 Carbon Dioxide - DDTF Direct Drive Turbofan - DOC Direct Operating Costs £ DREAM valiDation of Radical Engine Architecture systeMs - EC European Commission - EDS Environmental Design Space - EGT Exhaust Gas Temperature K EIS Entry Into Service - ERA Environmentally Responsible Aviation - EU European Union - FAA Federal Aviation Authority - FLOPS FLight Optimisation System - GTF Geared Turbofan - GWP Global Warming Potential - HPC High Pressure Compressor - HPT High Pressure Turbine - ICAO International Civil Aviation Organisation - ICRTF InterCooled and Recuperated TurboFan - IPCC International Panel on Climate Change - IRA Intercooled Recuperative Aero Engine - ISA International Standard Atmosphere - JTI Joint Technology Initiative - LDI Lean Direct Injection - LPC Low Pressure Compressor (Booster) - LPT Low Pressure Turbine - MTOW Maximum Take Off Weight kg NASA National Aeronautics and Space Administration - NEO New Engine Option - NEWAC NEW Aero-engine Core concepts - N2O Nitrous Oxide - NOx Nitrogen Oxides - NPC Net Present Cost - NPSS Numerical Propulsion System Simulation -
xi
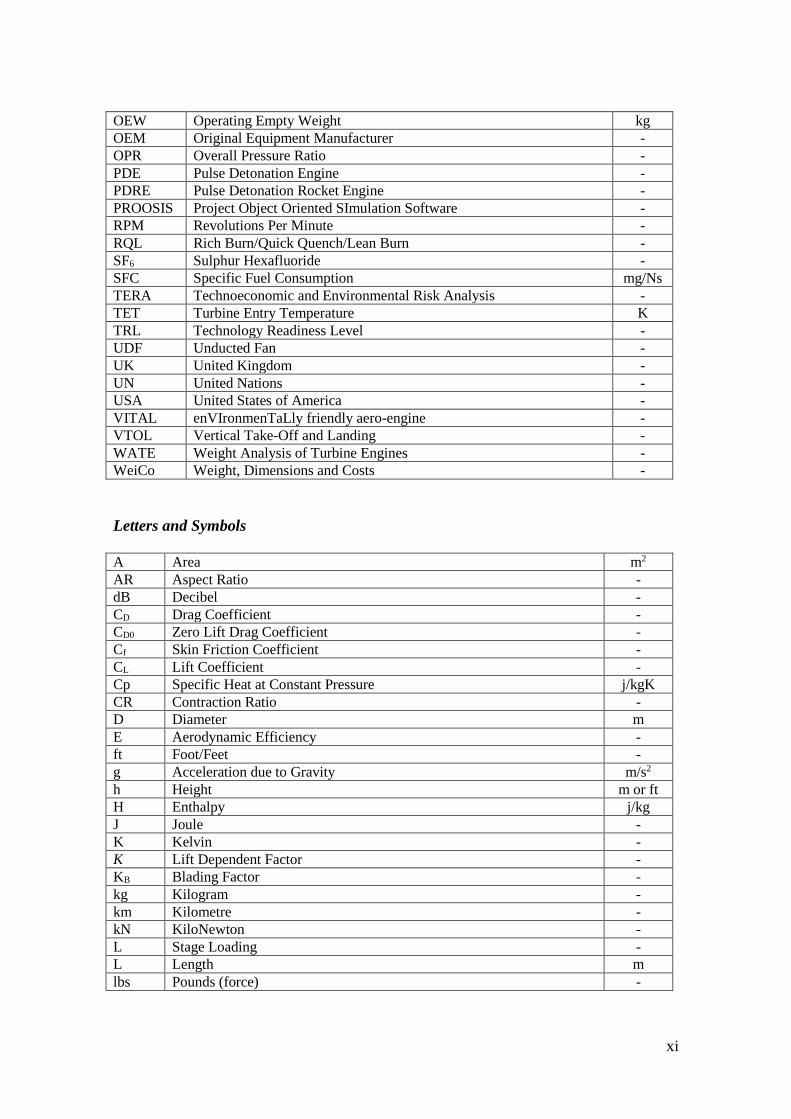
OEW Operating Empty Weight kg OEM Original Equipment Manufacturer - OPR Overall Pressure Ratio - PDE Pulse Detonation Engine - PDRE Pulse Detonation Rocket Engine - PROOSIS Project Object Oriented SImulation Software - RPM Revolutions Per Minute - RQL Rich Burn/Quick Quench/Lean Burn - SF6 Sulphur Hexafluoride - SFC Specific Fuel Consumption mg/Ns TERA Technoeconomic and Environmental Risk Analysis - TET Turbine Entry Temperature K TRL Technology Readiness Level - UDF Unducted Fan - UK United Kingdom - UN United Nations - USA United States of America - VITAL enVIronmenTaLly friendly aero-engine - VTOL Vertical Take-Off and Landing - WATE Weight Analysis of Turbine Engines - WeiCo Weight, Dimensions and Costs -
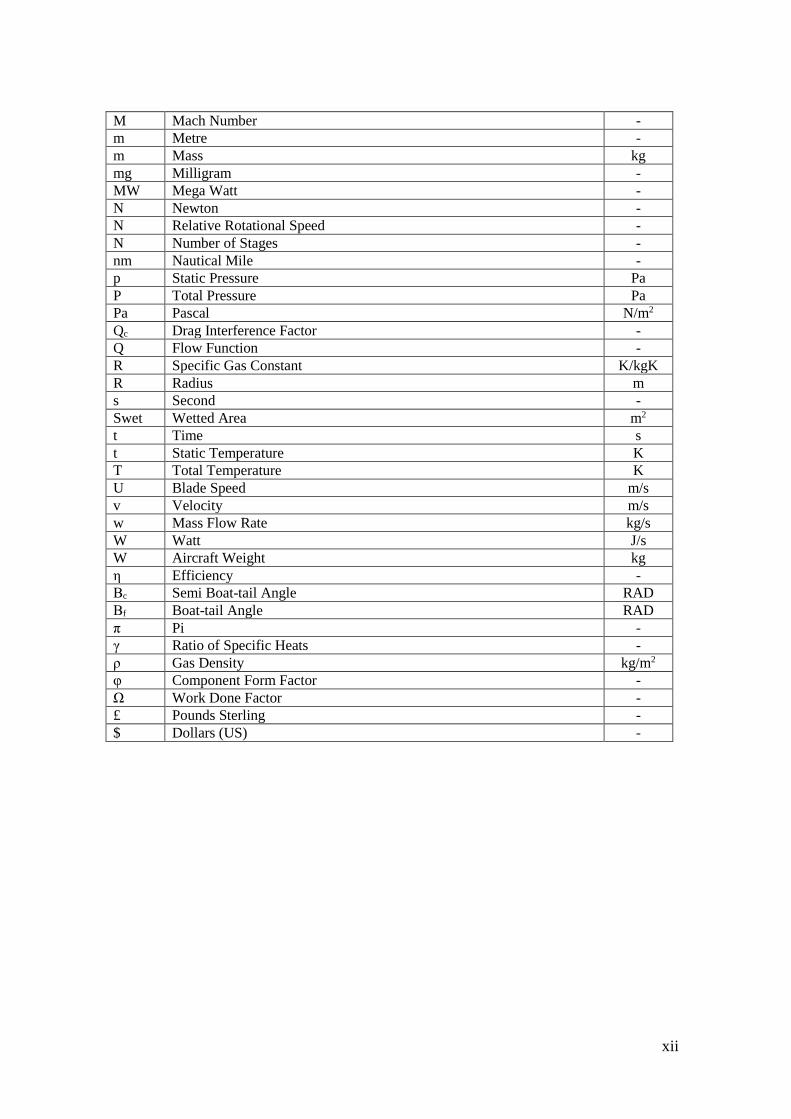
Letters and Symbols
A Area m2
AR Aspect Ratio - dB Decibel - CD Drag Coefficient - CD0 Zero Lift Drag Coefficient - Cf Skin Friction Coefficient - CL Lift Coefficient - Cp Specific Heat at Constant Pressure j/kgK CR Contraction Ratio - D Diameter m E Aerodynamic Efficiency - ft Foot/Feet - g Acceleration due to Gravity m/s2
h Height m or ft H Enthalpy j/kg J Joule - K Kelvin - K Lift Dependent Factor - KB Blading Factor - kg Kilogram - km Kilometre - kN KiloNewton - L Stage Loading - L Length m lbs Pounds (force) -
xii
M Mach Number - m Metre - m Mass kg mg Milligram - MW Mega Watt - N Newton - N Relative Rotational Speed - N Number of Stages - nm Nautical Mile - p Static Pressure Pa P Total Pressure Pa Pa Pascal N/m2
Qc Drag Interference Factor - Q Flow Function - R Specific Gas Constant K/kgK R Radius m s Second - Swet Wetted Area m2
t Time s t Static Temperature K T Total Temperature K U Blade Speed m/s v Velocity m/s w Mass Flow Rate kg/s W Watt J/s W Aircraft Weight kg η Efficiency - Βc Semi Boat-tail Angle RAD Βf Boat-tail Angle RAD π Pi - γ Ratio of Specific Heats - ρ Gas Density kg/m2 φ Component Form Factor - Ω Work Done Factor - £ Pounds Sterling - $ Dollars (US) -
1
1.0 Introduction
The airline industry is very competitive. Airlines are under pressure to offer quick,
reliable services at reasonable ticket prices. With an uncertain economic climate and an
uncertain price of jet fuel fluctuating from a high of around $140 per barrel between
2011 and 2013 and reaching a low of less than $50 now, there is a real interest within
the airline industry to reduce mission fuel burn considerably.
The overall aim of the project is to undertake a Techno-economic Environmental Risk
Analysis (TERA) analysis from an aircraft operator's perspective to enable them to
better understand the factors involved in the engine development process, to be able to
help bridge the gap between aircraft/engine manufacturer and operator. This may then
assist in any discussions between operators and original equipment manufacturers
(OEMs), to enable them to have more of an influence in the direction of development to
better suit the business model of the operator.
This project aims to do this by investigating the limit (in terms of turbine entry
temperature (TET), overall pressure ratio (OPR), bypass ratio (BPR)) of the current gas
turbine for use as aircraft propulsion in a conventional format (i.e. providing thrust for
the aircraft) for a short to medium range jet aircraft. By investigating the limit of a
conventional gas turbine, it is possible to not only see the maximum benefit available to
this mature technology, but also to determine which future technologies may offer the
most benefits for a particular airline market strategy. By focusing on finding the limit of
‘conventional’ technology, the aim is to find the point at which fuel burn/ direct
operating costs (DOC) becomes attractive for novel technologies in comparison to the
best conventional, albeit advanced, gas turbine. In other words, what fuel burn and
ultimately DOC benefit must come from new technology in order to beat the best of
conventional gas turbofans.
2
1.1 Objectives
Using an established airline operator as a case study, this project aims to quantify the
fuel burn and DOC benefits that can be achieved by taking conventional gas turbine
technology to its limit, based on key constraints such as suitable timeframe and airframe
size. A qualitative study on novel, disruptive technologies, and the risks associated with
these technologies was used to identify a potential pathway that is suitable for a short to
medium range aircraft operator.
The overall aim of the project was to undertake a TERA analysis from the point of view
of an aircraft operator to assess new aircraft and engine configurations and to
understand the risks and costs associated with these new technologies. The project
primarily focussed on different powerplant technologies. The following goals were
identified:
Establish a baseline centred on the current easyJet fleet aircraft using a 'Business
as Usual' approach;
To integrate engine performance, aircraft performance, engine sizing and weight
models into a TERA framework;
Undertake a sensitivity/parametric analysis to understand which factors are the
most important to the solution;
Design space optimisation to find a suitable engine configuration to meet the
aspirations of a short to medium range aircraft operator;
DOC analysis to determine at what point novel technologies could become
attractive compared to advanced conventional gas turbine engines under a range
of different fuel price scenarios.
1.2 Contribution to Knowledge
Having performed a review of the relevant literature, it is clear that although design
assessments have been performed on novel engine cycles previously, these have usually
been carried out on behalf of either international political organisations or OEMs to try
3
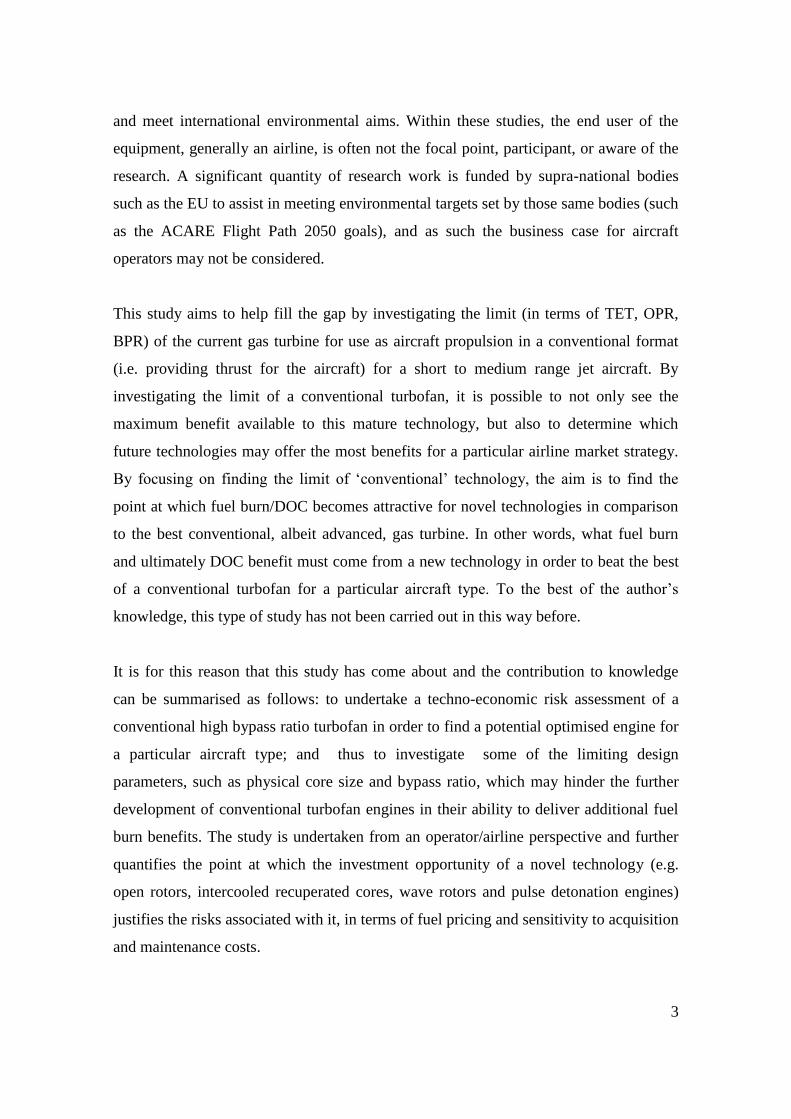
and meet international environmental aims. Within these studies, the end user of the
equipment, generally an airline, is often not the focal point, participant, or aware of the
research. A significant quantity of research work is funded by supra-national bodies
such as the EU to assist in meeting environmental targets set by those same bodies (such
as the ACARE Flight Path 2050 goals), and as such the business case for aircraft
operators may not be considered.
This study aims to help fill the gap by investigating the limit (in terms of TET, OPR,
BPR) of the current gas turbine for use as aircraft propulsion in a conventional format
(i.e. providing thrust for the aircraft) for a short to medium range jet aircraft. By
investigating the limit of a conventional turbofan, it is possible to not only see the
maximum benefit available to this mature technology, but also to determine which
future technologies may offer the most benefits for a particular airline market strategy.
By focusing on finding the limit of ‘conventional’ technology, the aim is to find the
point at which fuel burn/DOC becomes attractive for novel technologies in comparison
to the best conventional, albeit advanced, gas turbine. In other words, what fuel burn
and ultimately DOC benefit must come from a new technology in order to beat the best
of a conventional turbofan for a particular aircraft type. To the best of the author’s
knowledge, this type of study has not been carried out in this way before.
It is for this reason that this study has come about and the contribution to knowledge
can be summarised as follows: to undertake a techno-economic risk assessment of a
conventional high bypass ratio turbofan in order to find a potential optimised engine for
a particular aircraft type; and thus to investigate some of the limiting design
parameters, such as physical core size and bypass ratio, which may hinder the further
development of conventional turbofan engines in their ability to deliver additional fuel
burn benefits. The study is undertaken from an operator/airline perspective and further
quantifies the point at which the investment opportunity of a novel technology (e.g.
open rotors, intercooled recuperated cores, wave rotors and pulse detonation engines)
justifies the risks associated with it, in terms of fuel pricing and sensitivity to acquisition
and maintenance costs.
4
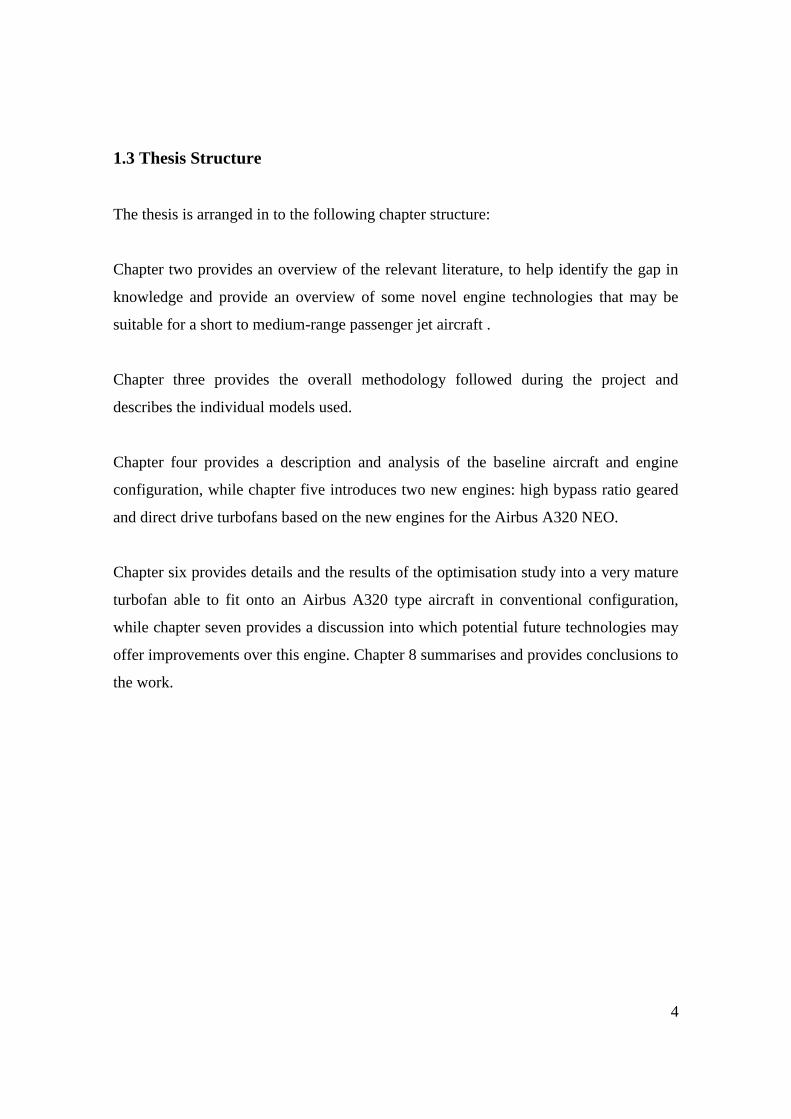
1.3 Thesis Structure
The thesis is arranged in to the following chapter structure:
Chapter two provides an overview of the relevant literature, to help identify the gap in
knowledge and provide an overview of some novel engine technologies that may be
suitable for a short to medium-range passenger jet aircraft .
Chapter three provides the overall methodology followed during the project and
describes the individual models used.
Chapter four provides a description and analysis of the baseline aircraft and engine
configuration, while chapter five introduces two new engines: high bypass ratio geared
and direct drive turbofans based on the new engines for the Airbus A320 NEO.
Chapter six provides details and the results of the optimisation study into a very mature
turbofan able to fit onto an Airbus A320 type aircraft in conventional configuration,
while chapter seven provides a discussion into which potential future technologies may
offer improvements over this engine. Chapter 8 summarises and provides conclusions to
the work.
5
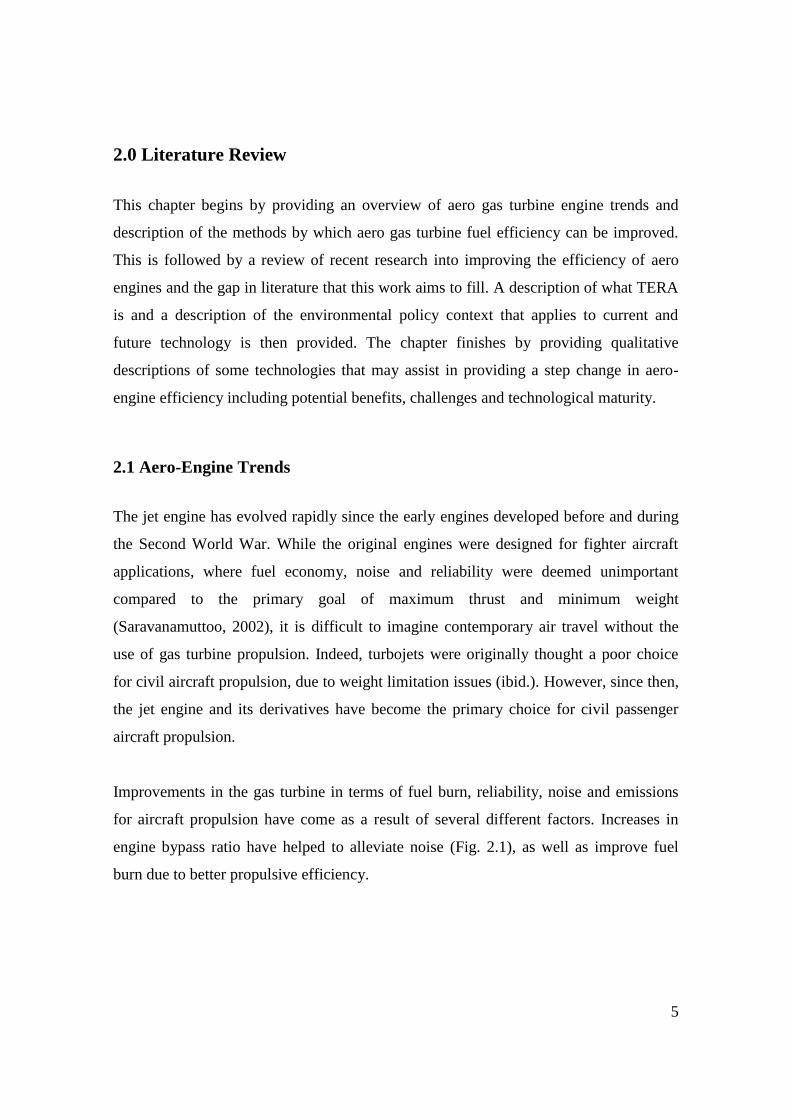
2.0 Literature Review
This chapter begins by providing an overview of aero gas turbine engine trends and
description of the methods by which aero gas turbine fuel efficiency can be improved.
This is followed by a review of recent research into improving the efficiency of aero
engines and the gap in literature that this work aims to fill. A description of what TERA
is and a description of the environmental policy context that applies to current and
future technology is then provided. The chapter finishes by providing qualitative
descriptions of some technologies that may assist in providing a step change in aero-
engine efficiency including potential benefits, challenges and technological maturity.
2.1 Aero-Engine Trends
The jet engine has evolved rapidly since the early engines developed before and during
the Second World War. While the original engines were designed for fighter aircraft
applications, where fuel economy, noise and reliability were deemed unimportant
compared to the primary goal of maximum thrust and minimum weight
(Saravanamuttoo, 2002), it is difficult to imagine contemporary air travel without the
use of gas turbine propulsion. Indeed, turbojets were originally thought a poor choice
for civil aircraft propulsion, due to weight limitation issues (ibid.). However, since then,
the jet engine and its derivatives have become the primary choice for civil passenger
aircraft propulsion.
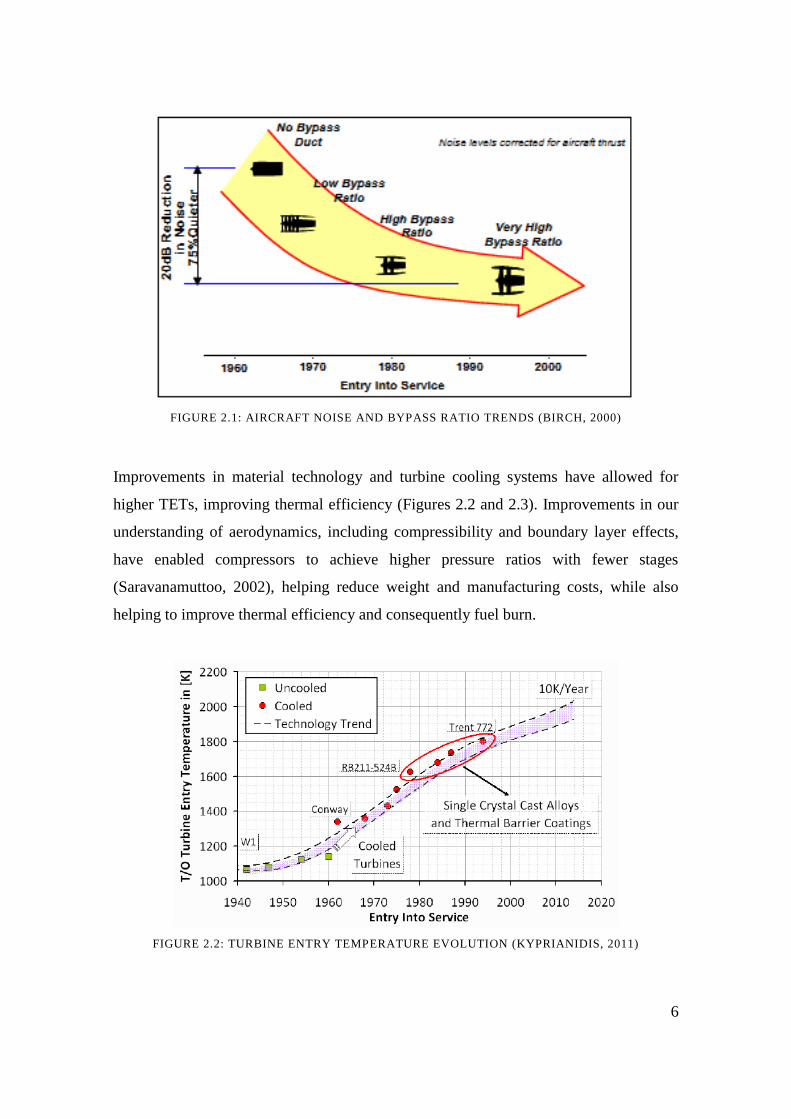
Improvements in the gas turbine in terms of fuel burn, reliability, noise and emissions
for aircraft propulsion have come as a result of several different factors. Increases in
engine bypass ratio have helped to alleviate noise (Fig. 2.1), as well as improve fuel
burn due to better propulsive efficiency.
6
FIGURE 2.1: AIRCRAFT NOISE AND BYPASS RATIO TRENDS (BIRCH, 2000)
Improvements in material technology and turbine cooling systems have allowed for
higher TETs, improving thermal efficiency (Figures 2.2 and 2.3). Improvements in our
understanding of aerodynamics, including compressibility and boundary layer effects,
have enabled compressors to achieve higher pressure ratios with fewer stages
(Saravanamuttoo, 2002), helping reduce weight and manufacturing costs, while also
helping to improve thermal efficiency and consequently fuel burn.
FIGURE 2.2: TURBINE ENTRY TEMPERATURE EVOLUTION (KYPRIANIDIS, 2011)
7
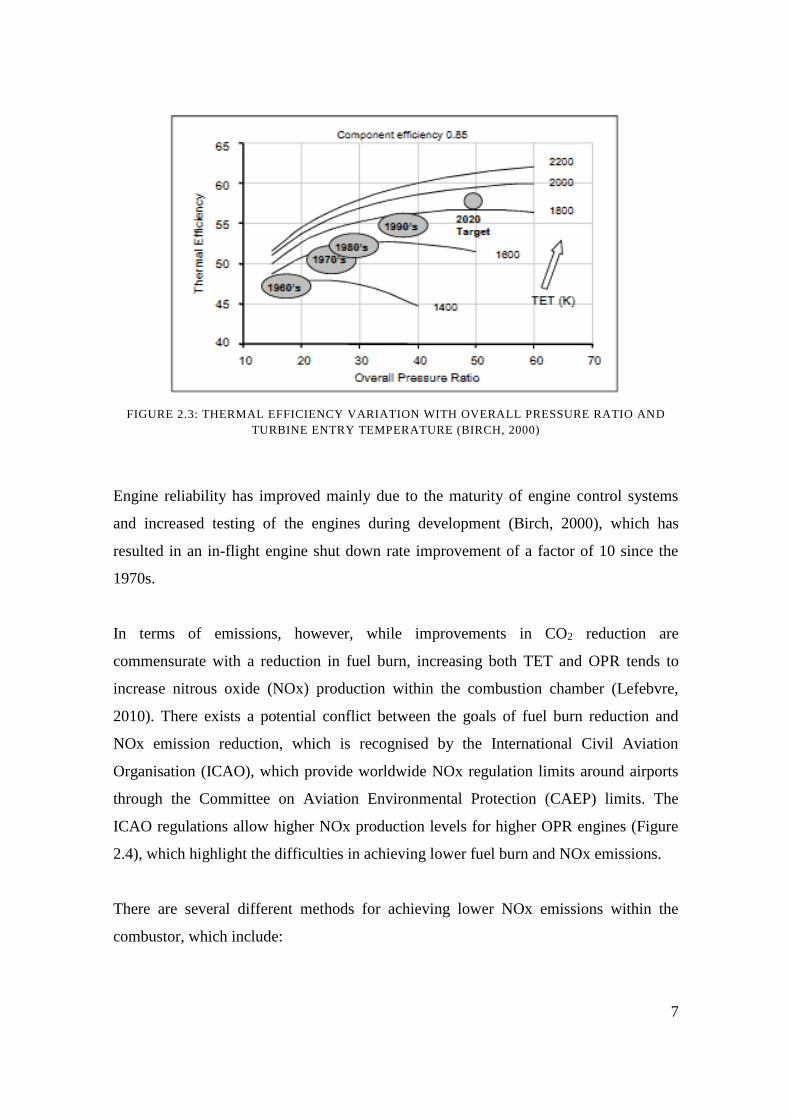
FIGURE 2.3: THERMAL EFFICIENCY VARIATION WITH OVERALL PRESSURE RATIO AND
TURBINE ENTRY TEMPERATURE (BIRCH, 2000)
Engine reliability has improved mainly due to the maturity of engine control systems
and increased testing of the engines during development (Birch, 2000), which has
resulted in an in-flight engine shut down rate improvement of a factor of 10 since the
1970s.
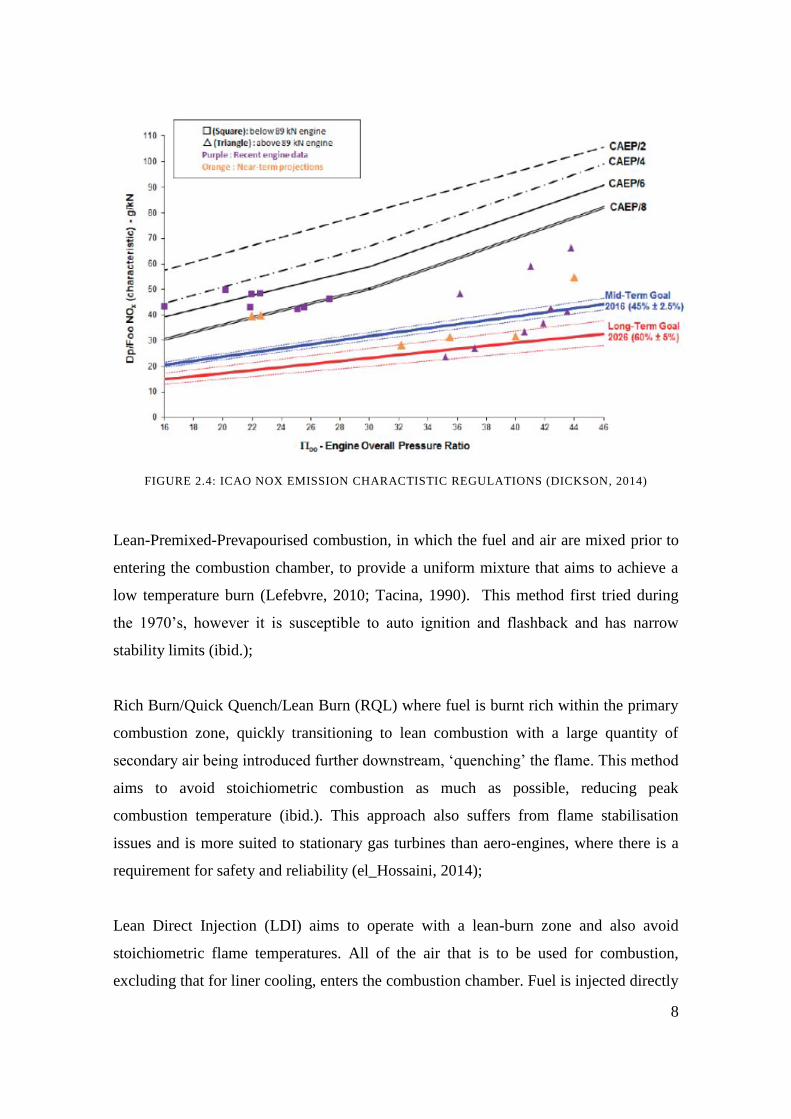
In terms of emissions, however, while improvements in CO2 reduction are
commensurate with a reduction in fuel burn, increasing both TET and OPR tends to
increase nitrous oxide (NOx) production within the combustion chamber (Lefebvre,
2010). There exists a potential conflict between the goals of fuel burn reduction and
NOx emission reduction, which is recognised by the International Civil Aviation
Organisation (ICAO), which provide worldwide NOx regulation limits around airports
through the Committee on Aviation Environmental Protection (CAEP) limits. The
ICAO regulations allow higher NOx production levels for higher OPR engines (Figure
2.4), which highlight the difficulties in achieving lower fuel burn and NOx emissions.
There are several different methods for achieving lower NOx emissions within the
combustor, which include:
8
FIGURE 2.4: ICAO NOX EMISSION CHARACTISTIC REGULATIONS (DICKSON, 2014)
Lean-Premixed-Prevapourised combustion, in which the fuel and air are mixed prior to
entering the combustion chamber, to provide a uniform mixture that aims to achieve a
low temperature burn (Lefebvre, 2010; Tacina, 1990). This method first tried during
the 1970’s, however it is susceptible to auto ignition and flashback and has narrow
stability limits (ibid.);
Rich Burn/Quick Quench/Lean Burn (RQL) where fuel is burnt rich within the primary
combustion zone, quickly transitioning to lean combustion with a large quantity of
secondary air being introduced further downstream, ‘quenching’ the flame. This method
aims to avoid stoichiometric combustion as much as possible, reducing peak
combustion temperature (ibid.). This approach also suffers from flame stabilisation
issues and is more suited to stationary gas turbines than aero-engines, where there is a
requirement for safety and reliability (el_Hossaini, 2014);
Lean Direct Injection (LDI) aims to operate with a lean-burn zone and also avoid
stoichiometric flame temperatures. All of the air that is to be used for combustion,
excluding that for liner cooling, enters the combustion chamber. Fuel is injected directly
9
into the stream of air. The key to avoiding hot spots is to have rapid fuel and air mixing,
to achieve uniformity in the fuel-air mixture. This is done by using a swirler to create a
vortical air flow and combined with a spray atomiser for the fuel (Tacina et al, 2014).
2.2 Improving Fuel Consumption
Given the advances and evolution of the gas turbine to near maturity, how can fuel
consumption be further lowered? A good starting point is to look at specific fuel
consumption (SFC). SFC is the fuel flow divided by the net thrust of the engine, but can
also be related to cycle efficiency parameters (Birch, 2000):
HVpropth FVSFC /0 equation 2.1
Where V0 is the flight speed, ηth is the thermal efficiency, ηprop is the propulsive
efficiency and FHV is the fuel calorific value. Given that flight speed has been remained
fairly steady for subsonic jet aircraft at about Mach 0.8 for the last 50 years and that
kerosene or equivalents are likely to remain as a fuel for the near future, further
improvements in SFC will come from improving propulsive and thermal efficiencies.
The thermal efficiency of an engine is how efficiently the engine can convert the
incoming energy from fuel in to useful work. It is a function of the OPR, TET and
individual component efficiency (ibid.). Figure 3 shows how thermal efficiency is
related to OPR and TET. The chart shows that improvements in efficiency come about
from a combined increase on both TET and OPR (ibid.). This has been achieved
through improved technology in terms of new materials able to withstand higher
temperatures and better turbine cooling. To increase TET and OPR further, these
technology improvements must continue to be made, otherwise the benefits from the
cycle improvement will be negated by the need for increased cooling flows. This is
demonstrated in Figure 2.5, which shows that SFC improvements can still be made with
constant component efficiency, but with improvements in cooling technology such that
the cooling flow requirement stays the same. If cooling technology remains constant,
such that an increased turbine cooling flow is required, the gains from further cycle
improvements is limited (Horlock et al, 2001,; Wilcock et al, 2005). Birch (2000)
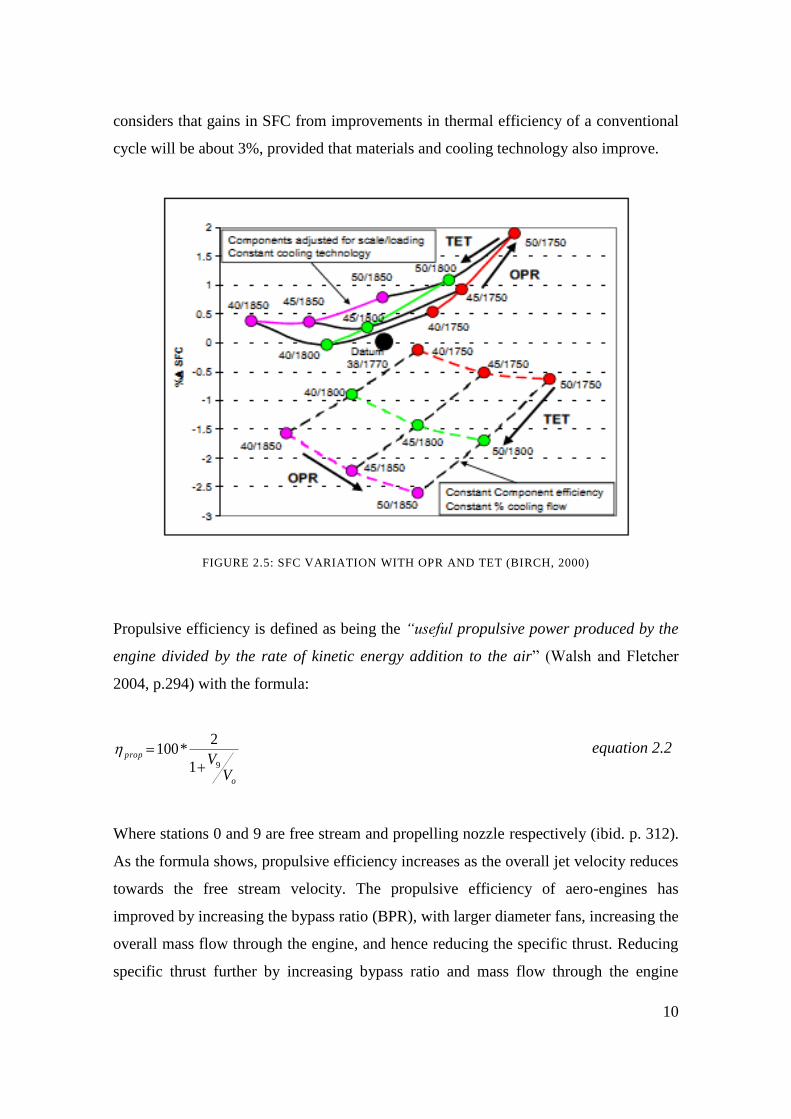
10
considers that gains in SFC from improvements in thermal efficiency of a conventional
cycle will be about 3%, provided that materials and cooling technology also improve.
FIGURE 2.5: SFC VARIATION WITH OPR AND TET (BIRCH, 2000)
Propulsive efficiency is defined as being the “useful propulsive power produced by the
engine divided by the rate of kinetic energy addition to the air” (Walsh and Fletcher
2004, p.294) with the formula:
o
prop
VV91
2*100
equation 2.2
Where stations 0 and 9 are free stream and propelling nozzle respectively (ibid. p. 312).
As the formula shows, propulsive efficiency increases as the overall jet velocity reduces
towards the free stream velocity. The propulsive efficiency of aero-engines has
improved by increasing the bypass ratio (BPR), with larger diameter fans, increasing the
overall mass flow through the engine, and hence reducing the specific thrust. Reducing
specific thrust further by increasing bypass ratio and mass flow through the engine
11
should reduce fuel burn further through increased propulsive efficiency, however, this
would result in larger engines, which would have the effect of increased weight and
drag, offsetting the potential gains (Birch, 2000).
2.3 Recent Engine Research
Improving fuel efficiency will therefore come about from an increase in thermal and/or
propulsive efficiencies. Several research projects have been undertaken to investigate
improving these efficiencies.
The enVIronmenTALly friendly aero engines (VITAL) project ran between 2005 and
2007 (EU, 2006) and sought to investigate new direct drive, geared and contra-rotating
turbofans to see if they could achieve the goals set out in the European Aeronautics: A
Vision for Europe 2020 (EC, 2001) document, which is now administered by the
Advisory Council for Aeronautical Research in Europe (ACARE). The project was
carried out by a group of different companies, manufacturers, universities and
organisations across Europe including Cranfield University, Rolls-Royce, MTU and
Snecma. Overall, this project aimed to improve the propulsive and noise efficiency of
gas turbine engines by concentrating on the low pressure sections of the engine. The
project focussed on lightweight technologies for the fans, compressors and turbines
including new polymer composite materials with improvements in manufacturing
processes, as well as improved aerodynamic design of the turbomachinery.
Three different configurations were investigated: a direct drive turbofan (DDTF), a
geared turbofan (GTF) and a counter-rotating turbofan (CRTF). The DDTF used low
weight technologies for the fan to find a new optimum trade-off between the rotational
speed of the fan and turbine. The GTF allows for the booster and low pressure turbine to
rotate at higher speeds than the fan, potentially allowing for fewer turbine stages and
saving weight and length on the engine. The CRTF has two counter rotating fans, which
allows for lower rotational speeds. Korsia and Guy (2007) and Korsia (2009) provide a
good description of the VITAL project.
12
As part of the VITAL project, a multi-disciplinary design space tool, TERA2020
(discussed later in this chapter), was developed by a number of Universities across
Europe, including Cranfield University in the UK, Chalmers University in Sweden, the
National Technical University of Athens, Aristotle University of Thessaloniki,
ISAE/SUPAERO and the University of Stuttgart (Kyprianidis, 2010). TERA2020 was
used to investigate the various benefits (fuel burn, lower DOC, lower noise, lower CO2
and NOx emissions) that the VITAL engines might potentially give.
Colmenares Quintero (2009) used a version of the TERA2020 framework to investigate
the engines created under the VITAL project and their feasibility for use on short range
civil aircraft (the Airbus A320 was used as the baseline aircraft). Colmenares Quintero
used a TERA framework consisting of engine and aircraft performance modules, NOx
emission, weight and noise emission estimation modules and a financial module to
assess both the proposed VITAL engines, but also versions of these engines optimised
for low fuel burn, noise, emissions and DOC by varying the bypass ratio and fan
pressure ratios. Colmenares Quintero then used a simpler version of TERA consisting of
engine, aircraft, economic and emissions module to investigate intercooled and
intercooled-recuperated, and constant volume combustion engines.
Although Colmenares Quintero investigated future engine designs suitable for a short-
range civil aircraft, a number of considerations were not included in the work.
Colmenares Quintero took into account the overall size of the engine to account for
weight and drag for the aircraft performance, no consideration could be seen in the work
that thought was given to being able to fit or install the engine on the aircraft. In
addition, only the fan pressure ratio and bypass ratio were altered for the optimised
cycles, leaving the overall pressure ratio and turbine entry temperatures the same,
mainly because he was looking at potential engines with a 2020 EIS. As such, the work
offered a snapshot of potential engines powering a short range civil aircraft in a 2020
timeframe, without considering the ultimate benefit that conventional engines could
achieve.
13
Kyprianidis (2010) also investigated the VITAL engines using the TERA2020 tool,
however instead of investigating any potential benefits these engines might offer, he
instead looked at what the impact might be in terms of noise and CO2 emissions should
individual technological advancements within the VITAL project fail to be delivered.
Further research into improving thermal efficiency was investigated in the validation of
Radical Engine Architecture systeMs (DREAM) project, also funded by the EU. It
consists of a consortium of the major European aero-engine manufacturers, led by
Rolls-Royce (DREAM, 2012a). The project looks solely at the engine, nacelle and
pylon of a typical civil passenger aircraft in isolation and is looking at two new open
rotor concepts (geared and direct drive), alternative fuels and innovative systems.
(DREAM, 2012). Bellocq et al (2014, 2015) provide a good overview of the modelling
and configurations in the DREAM project.
Bellocq et al (2014, 2015 & 2016) undertook preliminary multidisciplinary optimisation
studies using a modified version of the TERA2020 framework to investigate the effects
of controlling the propellers of a counter-rotating geared open rotor engine as part of the
DREAM project. A 2020 EIS was used as the technology date for the engines. The
engines were not compared to a baseline turbofan, but showed how control of the
propellers could affect fuel burn, noise and emissions of the engine.
The open rotor concept has seen a resurgence in interest in recent years in both the
DREAM project and also the Clean Sky Initiative. The Clean Sky project is a major EU
'Joint Technology Initiative' (JTI, Clean Sky, 2012) with leaders from the European
aerospace manufacturing industry (Clean Sky, 2012a) and other partners from across
the EU. Clean Sky seeks to "demonstrate and validate the technology breakthroughs
that are necessary to make major steps towards the environmental goals sets by ACARE
...to be reached in 2020" (Clean Sky, 2012b). The project is set to run from 2008 until
2017 and will investigate not only new airframe and engine technologies, but also
different ways of using existing aircraft to reduce their impact on the environment. An
example of this work is given by Pervier et al (2011), where an optimisation was
performed to optimise aircraft mission trajectories and shows the trade-offs between
14
mission time and fuel burn, and mission NOx generation for typical passenger jet
aircraft over different ranges. As part of the Clean Sky project, Snecma is planning to
test a counter-rotating double open-rotor engine in 2019 (Gubisch 2014), which claims
to have a noise level comparable lower than currently available CFM-56 engine with a
fuel burn up to 30% lower.
The interest in open rotor engine research has followed on from several research
projects carried out in the 1980’s such as the General Electric Unducted Fan and the
Pratt & Whitney, Allison, and Hamilton Standard 578-DX (Kyprianidis, 2011), which
both reached demonstrator stage. These programs garnered interest following the 1973
oil price shock, which saw the price of crude oil quadruple (Macalister, 2011) which
saw demand for more fuel efficient engines rise. Open rotor configurations allow for
high bypass ratios, with advanced propellers to allow higher flight speeds to be
achieved over normal propeller designs (Barnard & Philpott, 2004). Open rotor engines
can benefit from reduced nacelle drag and weight benefits compared to turbofans, but
noise is a particular issue (Kyprianidis, 2011).
Further research on improving the propulsive efficiency of aircraft and engine
configurations can be found in NASA’s N3-X program, which combines a blended
wing body with distributed propulsion. In this configuration, the power generator is
separated from the thrust producing unit. This could potentially allow for far higher
bypass ratios than are currently achievable, as a single gas turbine could power several
distributed fans around the fuselage. This configuration also allows for different power
sources to be used, potentially nuclear, although it also relies on several immature
technologies, such as superconducting wires, and is therefore a significant period of
time away from being fully realised. Kim et al (2014) provide a good introduction to the
NASA N3-X project.
Seitze and Gologan (2015) of Bauhaus Luftfahrt have investigated a ‘propulsive
fuselage’ aircraft, where a large engine is embedded in the rear of the fuselage (Figure
2.6). This concept aims to improve the synergy between the propulsion system and
airframe to provide an overall benefit in propulsive efficiency. The concept uses
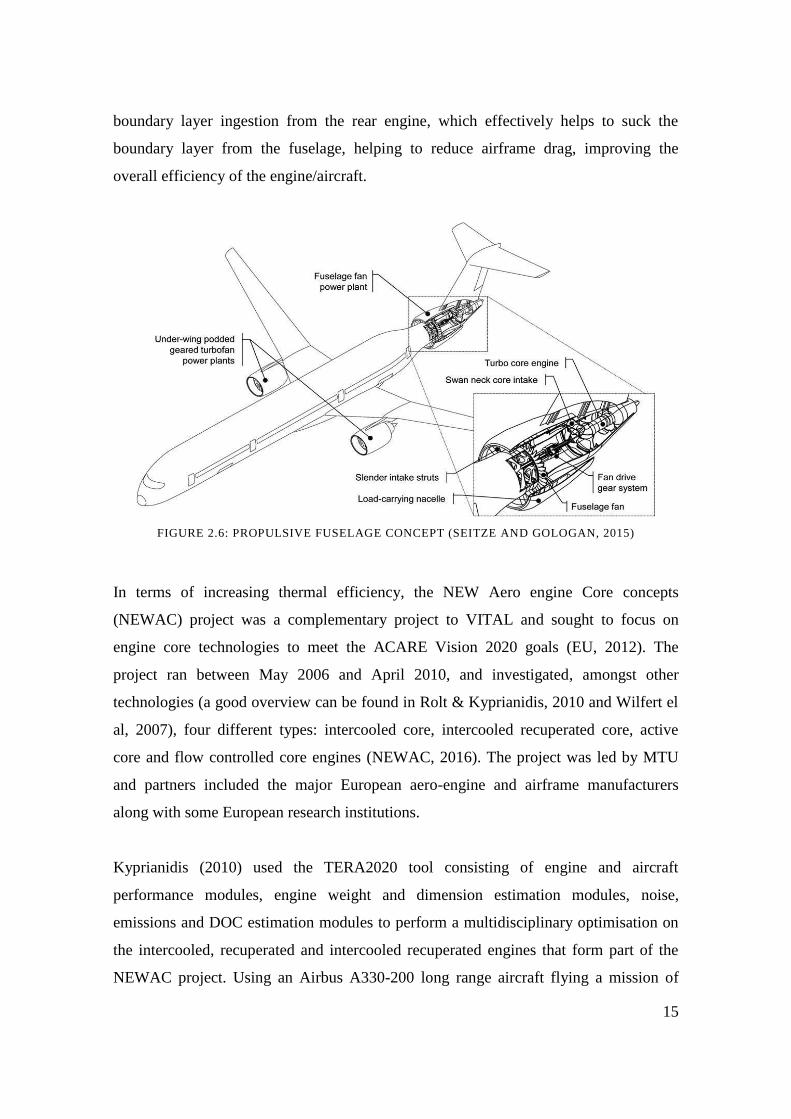
15
boundary layer ingestion from the rear engine, which effectively helps to suck the
boundary layer from the fuselage, helping to reduce airframe drag, improving the
overall efficiency of the engine/aircraft.
FIGURE 2.6: PROPULSIVE FUSELAGE CONCEPT (SEITZE AND GOLOGAN, 2015)
In terms of increasing thermal efficiency, the NEW Aero engine Core concepts
(NEWAC) project was a complementary project to VITAL and sought to focus on
engine core technologies to meet the ACARE Vision 2020 goals (EU, 2012). The
project ran between May 2006 and April 2010, and investigated, amongst other
technologies (a good overview can be found in Rolt & Kyprianidis, 2010 and Wilfert el
al, 2007), four different types: intercooled core, intercooled recuperated core, active
core and flow controlled core engines (NEWAC, 2016). The project was led by MTU
and partners included the major European aero-engine and airframe manufacturers
along with some European research institutions.
Kyprianidis (2010) used the TERA2020 tool consisting of engine and aircraft
performance modules, engine weight and dimension estimation modules, noise,
emissions and DOC estimation modules to perform a multidisciplinary optimisation on
the intercooled, recuperated and intercooled recuperated engines that form part of the
NEWAC project. Using an Airbus A330-200 long range aircraft flying a mission of
16
5,500km, Kyprianidis compared these engines to a 2020 EIS turbofan engine, and then
performed an optimisation study to find a potential optimal turbofan engine for a 2020
EIS which includes heat exchange technology. Similar to Colmenares Quintero,
although Kyprianidis investigated potential future engine designs, these were limited to
a 2020 EIS date and were therefore constrained by technology predictions for that time.
A comparison of several different unconventional core architectures, introduced into a
turbofan as part of a hybrid cycle, was carried out by Noppel (2011). A one dimensional
engine simulation code was created to investigate a baseline turbofan, as well as wave
rotor, pulse detonation and internal combustion engine hybrid turbofan cycles. An
estimation of weight and aircraft block fuel burn was carried out. Noppel concluded that
improvements in block fuel burn could be gained from both the pulse detonation and
internal combustion combined cycles, with the wave rotor hybrid cycle offering little
benefit. This study, however, failed to take into account any sizing considerations of the
aircraft or engines - indeed no specific aircraft was considered, just an estimation of
performance for a generic aircraft using the Breguet range equation. The study was
therefore an investigation as to whether there was any potential in these cycles, rather
than investigating the feasibility of them.
2.4 The Gap
Although much research has been carried out on new engine and airframe concepts in
recent years in order to meet increasingly stringent environmental goals, one important
stakeholder is not normally the focal point of the research - the airlines who operate the
aircraft and engines. This is not perhaps too surprising, there is a market for airframe
and engines, and all participants are competing within the same technology, so other
constraints, particularly environmental concerns, become more important. However,
there is demand from airlines, as evidenced by easyJet's 'ecoJet' proposal (easyJet,
2007), to push things on a little more than they appear to be (literally appearance - lots
of research is carried out to improve engine efficiency, although the latest passenger
aircraft to be released, the Boeing 787 Dreamliner, looks visually similar to a Boeing
707 released in the 1950's - a tube fuselage with engines mounted under the wings), to

17
have more radical designs entering the market. The author has not found a recent
example of an airline being involved in an engine research project. Watts (1978)
provided an airlines prediction of air travel and technology up to the year 2000, and was
correct in his view that the environment would become increasingly important.
Another gap that is apparent from reading the literature is that no work has been found
that investigates how much further a conventional gas turbine could go in terms of fuel
efficiency when applied to a specific case. When reading the literature from the recent
European Union funded projects investigating new engine technologies, the newer,
disruptive technologies are usually compared with conventional turbofans for a
particular entry into service date. This is not perhaps surprising. There is an underlying
assumption that conventional technology will continue to evolve as it has done over the
years, but to meet more challenging environmental goals, a step change in technology to
meet these goals is investigated. Accordingly, new technologies are compared to
conventional gas turbines for a specific EIS date. This is a sensible approach because it
enables two engines of similar technology level to be compared.
However, a different approach could be taken. From the point of view of an aircraft
operator who has to make purchasing decisions based on what is available in the market
at a particular time, it may be beneficial to instead look at what could potentially be the
best possible conventional engine for a particular aircraft configuration and market
strategy. By finding this potential end point, new technologies can be compared against
this and aircraft operators could make more informed choices when it comes to
purchasing, or having input into the direction that manufacturers take for developing the
new technology.
This study therefore aims to help fill the gap by investigating the limit (in terms of TET,
OPR, BPR) of the current gas turbine for use as aircraft propulsion in a conventional
format (i.e. providing thrust for the aircraft) for a short to medium range jet aircraft. By
investigating the limit of a conventional gas turbine, it is possible to not only see the
maximum benefit available to this mature technology, but also to determine which
future technologies may offer the most benefits for a particular airline market strategy.
18
By focusing on finding the limit of ‘conventional’ technology, the aim is to find the
point at which fuel burn/DOC becomes attractive for novel technologies in comparison
to the best conventional, albeit advanced, gas turbine. In other words, what fuel burn
and ultimately DOC benefit must come from new technology in order to beat the best of
conventional gas turbines.
2.5 TERA Overview
The focus of jet engine design has evolved over the years as our understanding of the
science and technology has improved. The traditional approach to jet engine design in
the 1960's was to focus on specific thrust and specific fuel consumption (SFC) for an
uninstalled engine (Hudson, 1999 cited in Whellens, 2002 p.10). This has moved on to
now consider a whole raft of issues including direct operating costs (DOC - fuel costs,
purchase costs, maintenance costs), environmental considerations (including CO2
emissions, NOx emissions and noise) as well as the performance of the engine (ibid.). In
order to design future generations of engines, a more 'front-loaded' approach is required
to design the engines effectively, taking into account all of the constraints, and reduce
overall design costs accordingly. This is where a Technoeconomic and Environmental
Risk Analysis (TERA) framework comes in.
2.5.1 History of TERA
A brief history of TERA is given in Kyprianidis et al (2008), which is expanded upon
here. TERA models have been developed at Cranfield University since the mid 1990's.
One of the first to use this kind of approach was Vincente (1994), who studied the
"effect of bypass ratio on long range subsonic engines" (ibid.). In the research, she
provided a comparison between two existing aero-engines - Rolls Royce Trent and
General Electric GE90 turbofans - and an 'imaginary' very high-bypass ratio engine. The
engines themselves were modelled in TURBOMATCH, Cranfield University's in-house
gas turbine performance code, while engine weight and drag were also modelled, to try
and assess the 'installed' thrust and SFC's of the engines.
19
Following on from this, and showing the versatility of the TERA approach, Gayraud
(1996) applied a technical and economic assessment to support the decision making
process for industrial gas turbines in an electricity generating plant. He used
TURBOMATCH to model a General Electric MS9001 FA engine and combined it with
an economics model, taking into account pay-back time, cash flow and discounted cash
flow. The ultimate result was to develop a 'Decision Support System' to aid in the
selection of industrial gas turbines for independent private companies in the privatised
electricity generation market.
Further work on TERA continued with Whellens et al (2003), who combined an engine
performance model, engine weight model, aircraft mission model with a genetic-
algorithm based optimiser, to study the benefits of an intercooled recuperated turbofan
(ICRTF) over existing turbofan engines for a long-distance passenger aircraft. The
objective of the optimisation was to reduce mission fuel burn by optimising various
cycle parameters of the engine (such as bypass ratio, fan pressure ratio, overall pressure
ratio and turbine entry temperature). The study found that the ICRTF engine could offer
lower mission fuel burn (up to 6% lower), but only for smaller aircraft with lower
thrust, with the example of long range business jets being given. The work also found,
however, that for these smaller aircraft, take-off NOx was considerably higher than the
optimum conventional turbo-fan by up to 1.7 times. It is worth noting that the models
used for engine performance and mission profile were simplified to speed up the
optimisation, i.e. the engine performance model didn't use any component maps and the
mission model only used the take-off and cruise segments of the profile.
The formalisation and coining of 'TERA' occurred during the European Union's (EU)
enVIronmenTALly friendly aero-engine (VITAL) project. This project ran between
2005 and 2007 (EU, 2006), and sought to investigate new direct drive, geared and
contra-rotating turbofans to see if they could achieve the goals set out in the European
Aeronautics: A Vision for Europe 2020 (EC, 2001) document, now administered by the
Advisory Council for Aeronautical Research in Europe (ACARE). The project was
carried out by a group of different companies, manufacturers, universities and
organisations across Europe and it fell to Cranfield University to develop the 'TERA
20
2020' architecture for this project (Ogaji et al, 2007). This was done in order that these
new technologies could be assessed to see if they meet the ACARE goals before any
prototypes were built, ultimately to help lower overall design costs.
2.5.2 What is TERA?
Up to now the history and the application of TERA within large scale projects have
been discussed, but what is TERA? The following section describes the TERA
framework in more detail and outlines a typical approach used for aero-engine
modelling.
TERA is a tool that can be used to assess mainly gas turbine engines (although there is
no reason why this couldn't be expanded to other areas) with "minimum global warming
impact and lowest cost of ownership in a variety of emission legislation scenarios,
emissions taxation policies, fiscal and air traffic management environments" (Ogaji et
al, 2007, p.1). TERA uses a modular, multi-disciplinary (in that several different
disciplines are used such as gas turbine performance, noise modelling, emission
modelling, aircraft performance e.t.c.) approach to optimise a particular 'goal' function,
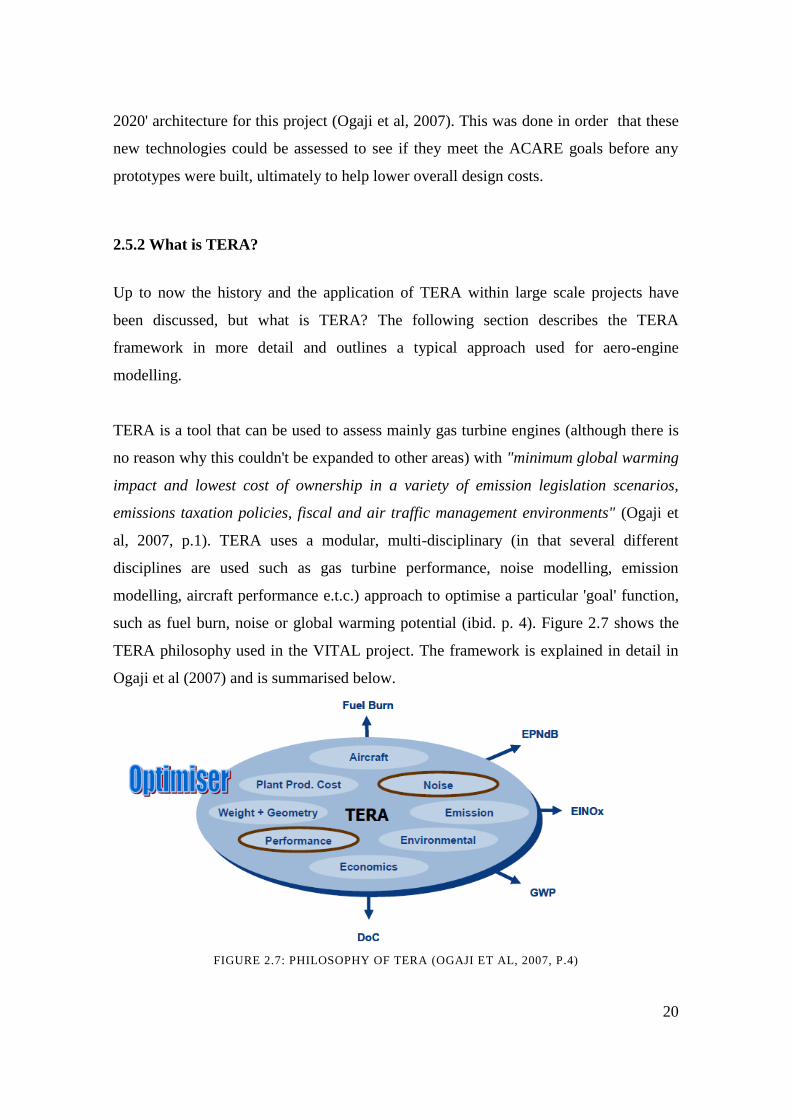
such as fuel burn, noise or global warming potential (ibid. p. 4). Figure 2.7 shows the
TERA philosophy used in the VITAL project. The framework is explained in detail in
Ogaji et al (2007) and is summarised below.
FIGURE 2.7: PHILOSOPHY OF TERA (OGAJI ET AL, 2007, P.4)
21
The TERA framework consists of several modules which are integrated together with an
optimiser. The optimiser used for VITAL was a commercial optimiser called iSIGHT,
although other user made genetic-algorithm optimisers have also been used, such as in
Whellens et al (2003). The different modules are individual models that perform a
specific function, such as an engine performance model or aircraft performance model.
These are brought together within the optimiser, which can then give the 'optimum'
result based on the end goal and individual parameters within the models that are set.
Typical modules used for evaluating aero-engines are explained below.
Engine Performance Module: This can perhaps be considered the heart of the TERA
framework, this is where the engine itself is modelled and simulated so as to give
realistic results. Results given include gross and net thrusts, SFC, and exhaust gas
temperatures (EGT). TURBOMATCH is Cranfield University's in-house code and was
used for the VITAL project, although other engine performance models can be used,
such as GasTurb (Colmenares Quintero, 2008 p.84).
TURBOMATCH was created at Cranfield University and uses 'bricks' to simulate
individual components within a gas turbine such as compressors, turbines and nozzles.
Bricks can also be used for arithmetic functions also. TURBOMATCH can and has
been used to simulate various gas turbine engines from a simple cycle single shaft
turbojets to more complex multi-shaft turbofan engines, to even more novel cycles such
as wave rotors.
Aircraft Performance Module: The aircraft performance module contains the aircraft
geometric and mission data. A programme such as Cranfield University's HERMES
code can be used for this.
HERMES originally came from a way to assess more electric civil aircraft (Laskaridis,
2005) and has been adapted to simulate nearly any aircraft type. The code calculates lift
and drag polars for the aircraft based on inputted geometric and empty aircraft weight
details from the user. The code also simulates high lift devices such as flaps and slats at
take-off and landing. The user inputs mission data such as taxiing time, take-off climb
22
rates, cruise altitude, cruise Mach number, diversion fuel, and descent data. The model
interacts with TURBOMATCH via a program called 'Turbomatchcalls', which 'runs' the
engine based on the thrust requirements and mission profile given by the user.
HERMES then calculates a range of performance indicators such as fuel used, time
taken and distance covered for the aircraft. HERMES can also give a maximum range
for the aircraft based on the amount of fuel it has on board. Another example of an
aircraft performance module used in TERA is given in Nalianda (2012).
Economics Module: The economics module used in VITAL comprises three different
models - a life estimation model, an economics model and a risk model. The life
estimation model is used to simulate the life of the hot section turbine discs and blades
through a creep and fatigue analysis. This is combined with the economics model which
utilises maintenance period, labour costs and capital costs of the engine to estimate the
engine maintenance costs. The risk model studies the effect of changes in some of the
input parameters on the net present cost (NPC) of the engine. Outputs of the module are
(Pascovici et al, 2007, p.9):
"Direct operating cost (DOC k€)
Engine maintenance cost (k€)
Net present cost
Cost of taxes
Cost of airframe maintenance
Stresses of the blades and disk
The cost of labour and materials used in the overhaul"
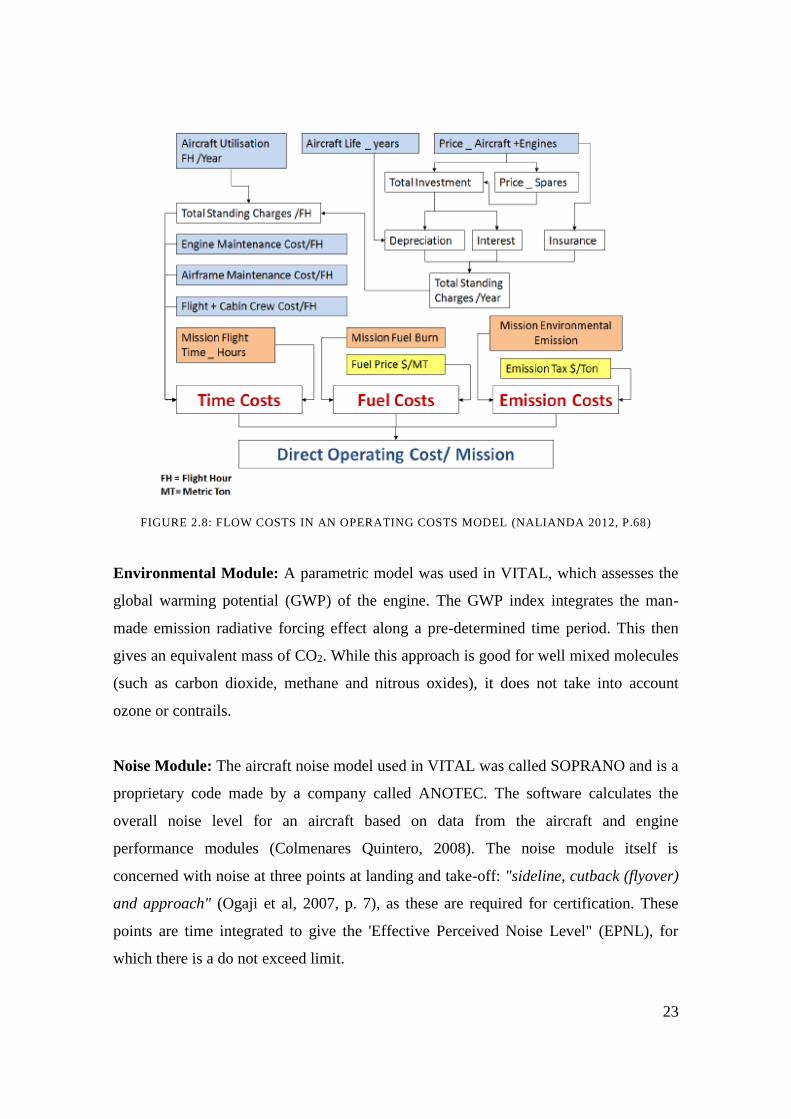
Further details of this economics module are given in Pascovici et al (2007). A further
economics model has been developed by Nalianda (2012) detailing operating costs over
an aircraft mission, shown in Figure 2.8 .
23
FIGURE 2.8: FLOW COSTS IN AN OPERATING COSTS MODEL (NALIANDA 2012, P.68)
Environmental Module: A parametric model was used in VITAL, which assesses the
global warming potential (GWP) of the engine. The GWP index integrates the man-
made emission radiative forcing effect along a pre-determined time period. This then
gives an equivalent mass of CO2. While this approach is good for well mixed molecules
(such as carbon dioxide, methane and nitrous oxides), it does not take into account
ozone or contrails.
Noise Module: The aircraft noise model used in VITAL was called SOPRANO and is a
proprietary code made by a company called ANOTEC. The software calculates the
overall noise level for an aircraft based on data from the aircraft and engine
performance modules (Colmenares Quintero, 2008). The noise module itself is
concerned with noise at three points at landing and take-off: "sideline, cutback (flyover)
and approach" (Ogaji et al, 2007, p. 7), as these are required for certification. These
points are time integrated to give the 'Effective Perceived Noise Level" (EPNL), for
which there is a do not exceed limit.
24
Emissions Module: The emissions module output is by the economic module to
estimate emission taxes, and the environmental module to provide the data for the
GWP. In VITAL, an empirical approach was used, which used the work of Rizk and
Mongia (1994, cited in Ogaji et al, 2007) to develop prediction equations to determine
the emissions index for pollutants such as NOx, carbon monoxide and unburned
hydrocarbons.
HEPHAESTUS, developed by Cranfield University, is another code that could also be
used for this task. This code assesses the environmental emission performance of
different combustor designs from a suite of different emission prediction software
(Celis, 2009). The software uses empirical, semi-empirical and a partially stirred reactor
model within the suite. HEPHAESTUS uses thermodynamic data from
TURBOMATCH to predict emissions for the landing and take-off phase and data from
HERMES to predict emissions during the flight.
Weight Module: The weight module is used to predict the weight of novel engines
which have yet to be built. The module used in VITAL called WeiCo (Weight,
Dimensions and Costs) has a catalogue of materials, component weights and geometries
that are used in the other modules such as the aircraft module to predict aircraft weight
and hence lift and drag, plant cost for the estimation of cost of the engine and the noise
module for the estimation of turbomachinery noise.
Plant Production Cost Module: This module estimates the production costs of
manufacturing the novel engine. It is a very complex module that has a large number of
factors affecting it such as materials availability, technology levels, varying wages,
production numbers e.t.c. The module reflects realistic cost trending.
2.6 Other Multi-Disciplinary Optimisation Tools
A similar concept to TERA has been developed independently in the USA called
'Environmental Design Space' (EDS). This has been developed by the FAA, Georgia
Institute of Technology and Michigan Institute of Technology (CAEP7, 2007). EDS has
25
been designed to assess noise, emissions and performance of current and future aircraft
and engine configurations, taking into account different economic and policy scenarios.
EDS uses five different modules, developed by NASA, to perform this.
The five modules are very similar to those used within TERA and consist of (Spindler,
2007):
Numerical Propulsion System Simulation (NPSS) - Engine simulation
software
Weight Analysis of Turbine Engines (WATE) - Engine weight model
Flight Optimisation System (FLOPS) - Aircraft mission and performance
simulation model
Aircraft Noise Prediction Program (ANOPP) - Noise prediction model
Empirical relations emissions module
The five modules would work together to help inform policy making and even to assess
the market for future aircraft. EDS has been assessed by Spindler (2007) using a current
Boeing 777 and found that despite a few minor problems with some models, overall the
EDS could perform with a relatively high level of confidence. It is unknown if EDS will
be publicly available, but it is interesting to see that a framework similar to TERA is
being developed independently to perform a similar function.
2.7 Environmental Policy and Targets Context
The issue of climate change is a topic with a lot of political impetus around the world
and because current commercial passenger aircraft use engines which burn fossil fuels,
aviation is an industry which is targeted for emission reduction. A report by the
Intergovernmental Panel on Climate Change (IPCC), Aviation and the Global
Atmosphere (IPCC, 1999), estimated that aviation contributes approximately 3.5% of
all radiative forcing (measured in W/m2, radiative forcing is a value of how important a
particular mechanism is to climate change (ibid, p.3)) from anthropogenic sources (ibid
p.8). This has recently been updated to approximately 3% (ICAO 2012). With a growth
26
in aviation, this contribution is expected to increase to about 5% in 2050 (IPCC,1999).
Within this context, it is clear that environmental policies will likely play a role in the
development of aircraft and engines. It is therefore necessary to examine some of these
policies to see what impact they may have on future aircraft and engine development.
2.7.1 Global Policies
The major international policy on climate change is the Kyoto Protocol (UN, 1998). The
protocol came into force on 16 February 2005 and requires the countries listed in
Annexe 1 (which includes the UK) to reduce their emissions of certain gasses (carbon
dioxide CO2, nitrous oxide N2O, methane CH4, sulphur hexafluoride SF6,
hydrofluorocarbons HFC’s and perfluorocarbons PFC’s) by 5% of 1990 levels by the
period 2008-2012 (ibid, Article 3, paragraph 1). Although international aviation is
excluded from the targets (ICAO 2012), Annexe 1 countries are expected to reduce
emissions from these sources, working with the International Civil Aviation
Organisation (ICAO - a United Nations organisation) (ibid.).
The Kyoto protocol notwithstanding, there are as yet no firm global policies to limit
aviation emissions. Instead, the ICAO is continuing with further research into aviation
emissions and is developing firmer policy proposals to put forward to the UN Council at
a later date (ibid.). The main policy proposals will likely be finding technical solutions
to the problem, with market based measures also being considered (ibid.).
2.7.2 European Environmental Goals and Legislation
The main aspirations and goals for Europe are set by the Advisory Council for Aviation
in Europe (ACARE). This organisation was set up in 2001 following the publication of
'European Aeronautics: A Vision for 2020' (EC, 2001) by the European Commission.
This document set the following goals to be met by 2020 (ibid, p.14):
A reduction in CO2 and fuel consumption of 50% of year 2000 levels;
A reduction of NOx emissions of 50% of 2000 year levels;
A perceived reduction in external noise of 50%.
27
These goals have recently been updated to more ambitious ones to be met by 2050 with
the publication of 'Flightpath 2050: Europe's Vision for Aviation' (ACARE, 2011 p. 15):
A reduction in CO2 and fuel consumption of 75% of year 2000 levels;
A reduction of NOx emissions of 90% of year 2000 levels;
A perceived reduction in external noise of 65%,
Emission free aircraft movements when taxiing.
These goals are particularly important when it comes to the design of aircraft and the
engines that power them. The normal approach of increasing the efficiency of jet
engines has been to increase both the propulsive efficiency (by increasing the BPR of
turbofans) and the thermal efficiency (by increasing the OPRTET). While these
approaches can bring about a reduction in SFC in an uninstalled engine, they may not
bring about the changes required to meet the ACARE goals. For example, by increasing
the diameter of the fan in a turbo-fan engine, the propulsive efficiency of the engine
may increase, however, this brings its own challenges: increasing the fan diameter also
increases the overall weight of the engine and also may cause installation problems if
the engine is installed under the wing. In addition, a bigger nacelle to house the engine
would likely be required, likely increasing the overall drag of the aircraft. These issues
may mean that the overall fuel burn of the aircraft is not reduced, despite an increase in
uninstalled SFC.
In terms of increasing the thermal efficiency of the engine, although this may also bring
a reduction in SFC (and hence CO2 emissions), this would likely have an adverse effect
on the production of NOx within the engine. Higher combustor temperatures encourage
the dissociation of nitrogen and oxygen molecules within the air, which in turn
encourage the formation of NOx molecules. There appears to be a slight paradox, then,
in increasing the thermal efficiency of the engine in that it reduces CO2 emissions, but
increases NOx emissions at the same time. These may be overcome by using a different
fuel (hydrogen, for example) or a better combustor design (such as a 'rich burn, quick
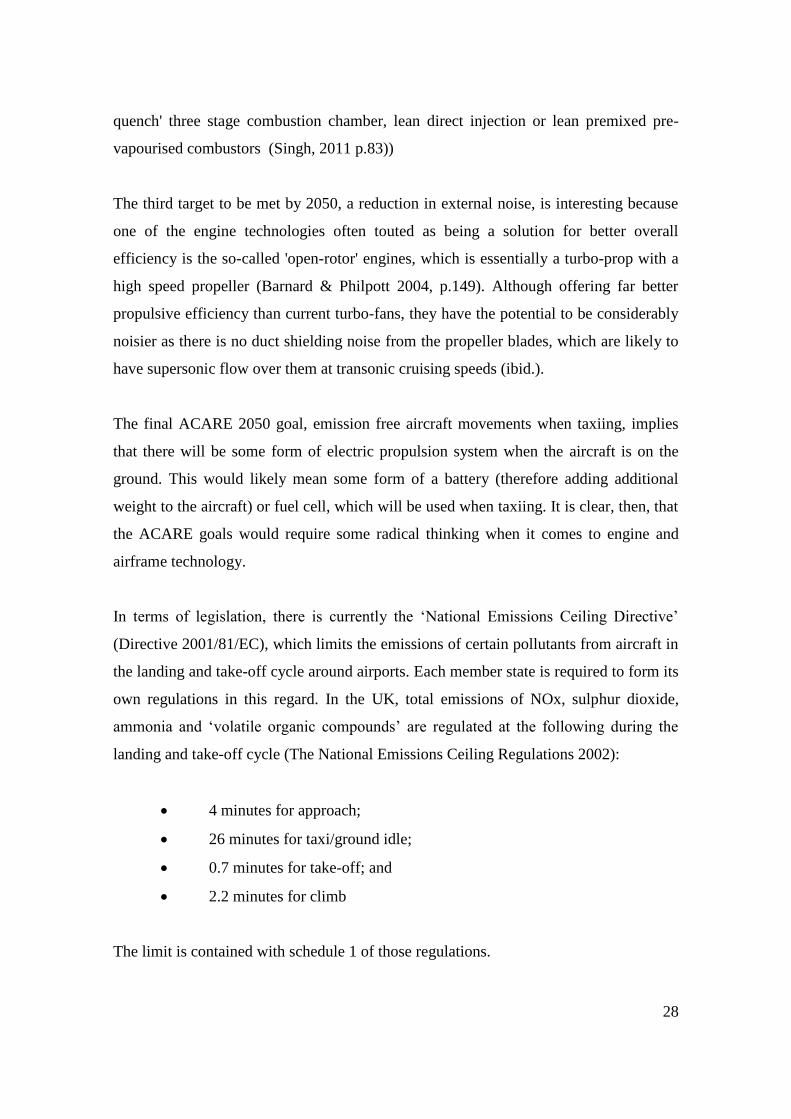
28
quench' three stage combustion chamber, lean direct injection or lean premixed pre-
vapourised combustors (Singh, 2011 p.83))
The third target to be met by 2050, a reduction in external noise, is interesting because
one of the engine technologies often touted as being a solution for better overall
efficiency is the so-called 'open-rotor' engines, which is essentially a turbo-prop with a
high speed propeller (Barnard & Philpott 2004, p.149). Although offering far better
propulsive efficiency than current turbo-fans, they have the potential to be considerably
noisier as there is no duct shielding noise from the propeller blades, which are likely to
have supersonic flow over them at transonic cruising speeds (ibid.).
The final ACARE 2050 goal, emission free aircraft movements when taxiing, implies
that there will be some form of electric propulsion system when the aircraft is on the
ground. This would likely mean some form of a battery (therefore adding additional
weight to the aircraft) or fuel cell, which will be used when taxiing. It is clear, then, that
the ACARE goals would require some radical thinking when it comes to engine and
airframe technology.
In terms of legislation, there is currently the ‘National Emissions Ceiling Directive’
(Directive 2001/81/EC), which limits the emissions of certain pollutants from aircraft in
the landing and take-off cycle around airports. Each member state is required to form its
own regulations in this regard. In the UK, total emissions of NOx, sulphur dioxide,
ammonia and ‘volatile organic compounds’ are regulated at the following during the
landing and take-off cycle (The National Emissions Ceiling Regulations 2002):
4 minutes for approach;
26 minutes for taxi/ground idle;
0.7 minutes for take-off; and
2.2 minutes for climb
The limit is contained with schedule 1 of those regulations.
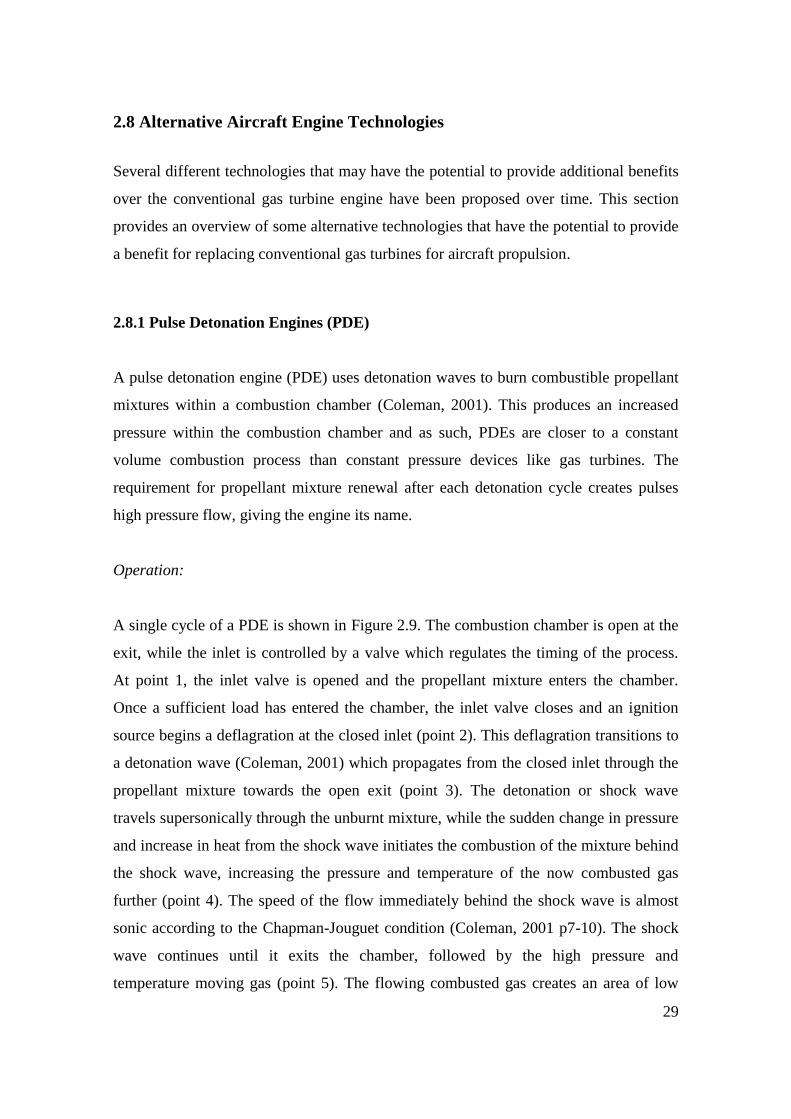
29
2.8 Alternative Aircraft Engine Technologies
Several different technologies that may have the potential to provide additional benefits
over the conventional gas turbine engine have been proposed over time. This section
provides an overview of some alternative technologies that have the potential to provide
a benefit for replacing conventional gas turbines for aircraft propulsion.
2.8.1 Pulse Detonation Engines (PDE)
A pulse detonation engine (PDE) uses detonation waves to burn combustible propellant
mixtures within a combustion chamber (Coleman, 2001). This produces an increased
pressure within the combustion chamber and as such, PDEs are closer to a constant
volume combustion process than constant pressure devices like gas turbines. The
requirement for propellant mixture renewal after each detonation cycle creates pulses
high pressure flow, giving the engine its name.
Operation:
A single cycle of a PDE is shown in Figure 2.9. The combustion chamber is open at the
exit, while the inlet is controlled by a valve which regulates the timing of the process.
At point 1, the inlet valve is opened and the propellant mixture enters the chamber.
Once a sufficient load has entered the chamber, the inlet valve closes and an ignition
source begins a deflagration at the closed inlet (point 2). This deflagration transitions to
a detonation wave (Coleman, 2001) which propagates from the closed inlet through the
propellant mixture towards the open exit (point 3). The detonation or shock wave
travels supersonically through the unburnt mixture, while the sudden change in pressure
and increase in heat from the shock wave initiates the combustion of the mixture behind
the shock wave, increasing the pressure and temperature of the now combusted gas
further (point 4). The speed of the flow immediately behind the shock wave is almost
sonic according to the Chapman-Jouguet condition (Coleman, 2001 p7-10). The shock
wave continues until it exits the chamber, followed by the high pressure and
temperature moving gas (point 5). The flowing combusted gas creates an area of low
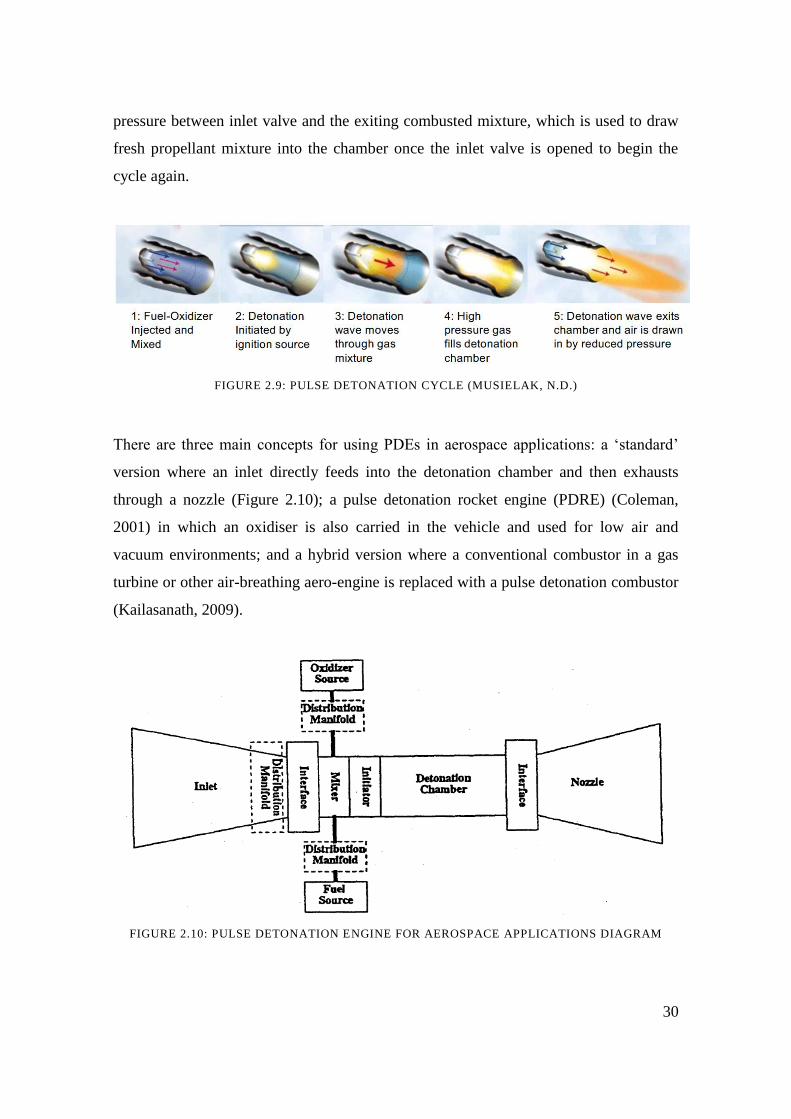
30
pressure between inlet valve and the exiting combusted mixture, which is used to draw
fresh propellant mixture into the chamber once the inlet valve is opened to begin the
cycle again.
FIGURE 2.9: PULSE DETONATION CYCLE (MUSIELAK, N.D.)
There are three main concepts for using PDEs in aerospace applications: a ‘standard’
version where an inlet directly feeds into the detonation chamber and then exhausts
through a nozzle (Figure 2.10); a pulse detonation rocket engine (PDRE) (Coleman,
2001) in which an oxidiser is also carried in the vehicle and used for low air and
vacuum environments; and a hybrid version where a conventional combustor in a gas
turbine or other air-breathing aero-engine is replaced with a pulse detonation combustor
(Kailasanath, 2009).
FIGURE 2.10: PULSE DETONATION ENGINE FOR AEROSPACE APPLICATIONS DIAGRAM
31
Potential benefits:
The interest in PDEs arises because of three main benefits they may have over other
engine systems: good thermodynamic efficiency from the constant volume combustion
cycle; the relative mechanical simplicity; and the potential ability to operate over a wide
range of flight Mach numbers (between 0 and 5) (Coleman, 2001). The potential for
PDEs to operate over a wide range of flight speeds is particularly useful for military
applications, such as land and air based missile systems, while the relative simplicity
which comes from not requiring pre-compression helps lower costs when used in such
roles. It is the fuel efficiency gains that could potentially be achievable which make it a
particularly interesting prospect for civil aerospace applications.
A PDE is based on the Humphrey cycle, which is more efficient than the Brayton cycle
of a conventional gas turbine engine (Akbari and Nalim, 2006). This is because the
combustion process in the Humphrey cycle also produces a pressure increase due to
volumetric confinement (ibid.). This is demonstrated in Figure 2.11, which compares
the two cycles on temperature-entropy chart with a fixed TET.
FIGURE 2.11: T-S DIAGRAM COMPARISON OF BRAYTON CYCLE (1-2-3’-4’) AGAINST
HUMPHREY CYCLE (1-2-3-4) (AKBARI AND NALIM, 2006, P.2)
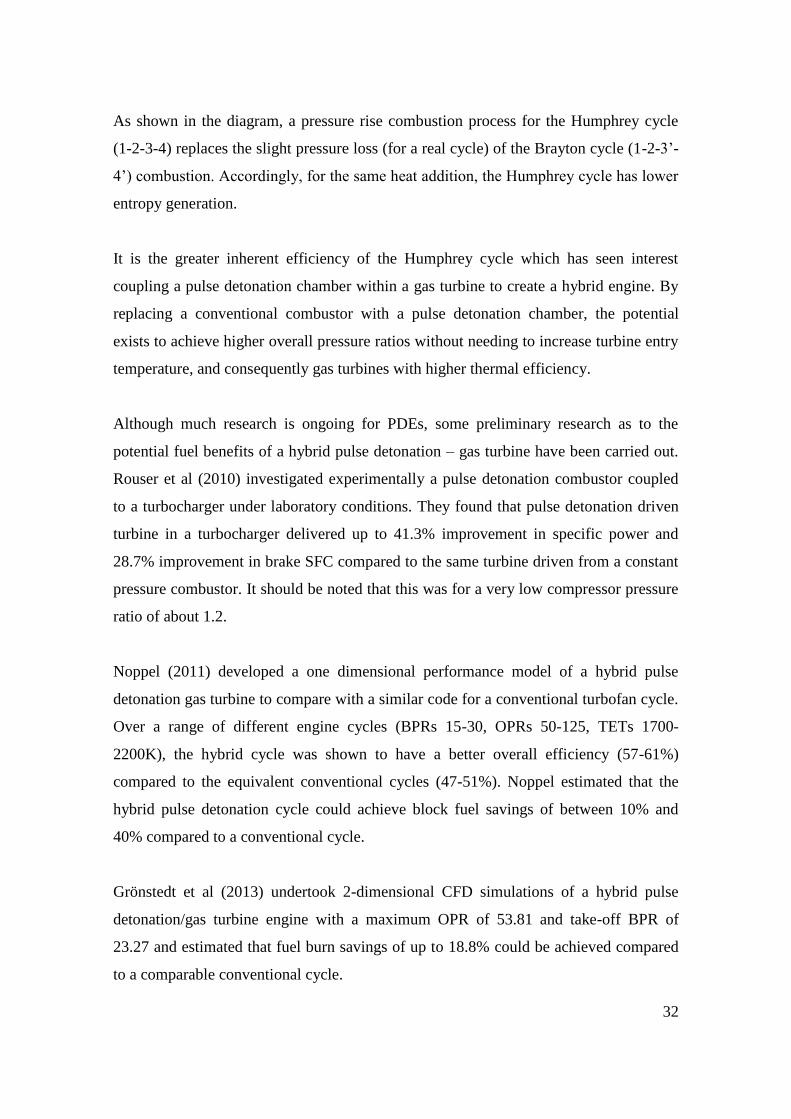
32
As shown in the diagram, a pressure rise combustion process for the Humphrey cycle
(1-2-3-4) replaces the slight pressure loss (for a real cycle) of the Brayton cycle (1-2-3’-
4’) combustion. Accordingly, for the same heat addition, the Humphrey cycle has lower
entropy generation.
It is the greater inherent efficiency of the Humphrey cycle which has seen interest
coupling a pulse detonation chamber within a gas turbine to create a hybrid engine. By
replacing a conventional combustor with a pulse detonation chamber, the potential
exists to achieve higher overall pressure ratios without needing to increase turbine entry
temperature, and consequently gas turbines with higher thermal efficiency.
Although much research is ongoing for PDEs, some preliminary research as to the
potential fuel benefits of a hybrid pulse detonation – gas turbine have been carried out.
Rouser et al (2010) investigated experimentally a pulse detonation combustor coupled
to a turbocharger under laboratory conditions. They found that pulse detonation driven
turbine in a turbocharger delivered up to 41.3% improvement in specific power and
28.7% improvement in brake SFC compared to the same turbine driven from a constant
pressure combustor. It should be noted that this was for a very low compressor pressure
ratio of about 1.2.
Noppel (2011) developed a one dimensional performance model of a hybrid pulse
detonation gas turbine to compare with a similar code for a conventional turbofan cycle.
Over a range of different engine cycles (BPRs 15-30, OPRs 50-125, TETs 1700-
2200K), the hybrid cycle was shown to have a better overall efficiency (57-61%)
compared to the equivalent conventional cycles (47-51%). Noppel estimated that the
hybrid pulse detonation cycle could achieve block fuel savings of between 10% and
40% compared to a conventional cycle.
Grönstedt et al (2013) undertook 2-dimensional CFD simulations of a hybrid pulse
detonation/gas turbine engine with a maximum OPR of 53.81 and take-off BPR of
23.27 and estimated that fuel burn savings of up to 18.8% could be achieved compared
to a comparable conventional cycle.
33
Challenges and difficulties:
There are several difficulties and challenges to overcome before PDEs and derivatives
are ready to enter service.
One of the main challenges to overcome is reliably initiating and repeating the
detonations (Roy et al, 2004). The ideal PDE performance is based on an assumption
that detonation and the Chapman-Jouguet condition for the flow behind the shock wave
occur quickly after ignition. However, the reality is that it takes some distance for the
detonation to accumulate after triggering (ibid.) and consequently performance differs
from the ideal cycle. Much research is ongoing to try and shorten the distance in which
detonation waves transition from deflagration (see Roy et al, 2004, Cooper et al, 2002
and Lee et al, 2004).
Another issue is that it is clear from the operation of a single pulse detonation cycle that
the timing of the inlet valve and ignition as well as the design of the combustion
chamber is crucial. The detonation wave and propellant mixture should reach the exit of
the chamber at the same time so that maximum energy can be extracted from one cycle
and that no unburnt mixture escapes, lowering efficiency (Coleman, 2001). Under
different flight conditions with different combustor entry temperatures and pressures, as
well as different combustor exit temperatures, the local speed of sound and propagation
rate of the detonation wave will change over these different conditions, so it is likely
that the detonation chamber would need to be optimised for a particular condition, and
other operating conditions may need to operate sub-optimally.
Several challenges would need to be overcome with respect to hybrid PDE-gas turbines.
Homogenous, steady state flow is typically what gas turbines are designed for and
introducing an unsteady, pulsed combustor would affect many components within the
engine, including the turbines as well as installation of the engine on the aircraft. The
cyclic nature of the PDE would introduce several new vibrations within the structure
and may influence and increase the rate of fatigue damage on individual components
34
within the engine, but also on pylons attaching the engine to the airframe. Fatigue issues
can be overcome by increasing the quantity of material in the affected components,
however this would increase engine weight and could therefore potentially negate any
performance gains.
Noise could pose a particular challenge to overcome, as a PDE would inherently create
a distinctive noise from the cyclical detonations. This may not be as much of an issue in
a hybrid engine as the bypass air and turbomachinery could help abate some of the
noise.
Other issues are likely to be application specific and have different solutions based on
how the engine would be used. These include heat transfer and cooling of the detonation
chamber, structural loading, and physical arrangement of the detonation chambers
within the engine.
Technology Maturity:
Aircraft have been flown using the pulse detonation concept in the 1940’s with the
German V1 flying bomb, while more recently in 2008 a manned Rutan Long-EZ
aircraft powered by a pulse detonation engine flew a short, low altitude demonstration
flight (Kailasanath, 2009). Despite these concepts, much research into the engines is
analytical and laboratory work (Noppel, 2011), especially for the hybrid PDE-gas
turbines and it is likely to be several decades before the challenges are overcome and
engines of this type enter service.
2.8.2 Wave Rotor
A wave rotor is a non-steady pressure exchange device located within a gas turbine that
consists of a rotating drum with a series of channels located within the circumference of
the drum. The wave rotor forms a figure-of-eight connection between the compressor,
combustor and turbine. The drum rotates between two stationary end plates that contain
a number of ports, which control flow through the channels in the drum (Akbari et al,
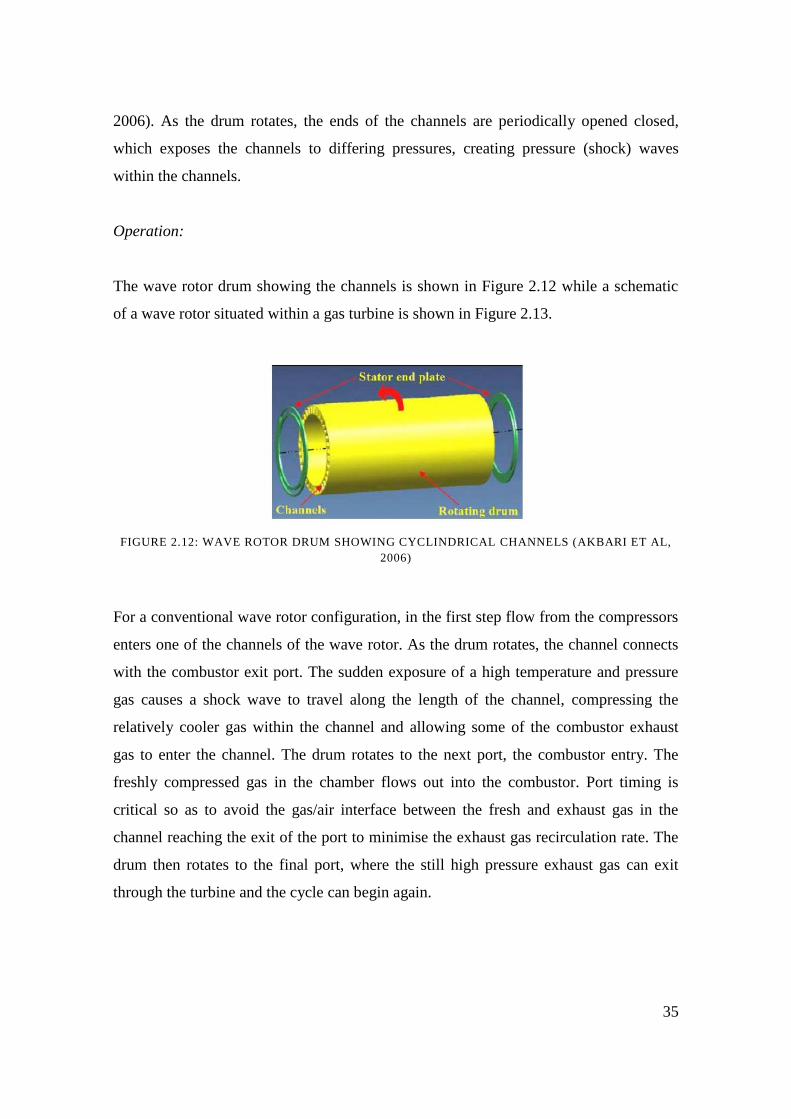
35
2006). As the drum rotates, the ends of the channels are periodically opened closed,
which exposes the channels to differing pressures, creating pressure (shock) waves
within the channels.
Operation:
The wave rotor drum showing the channels is shown in Figure 2.12 while a schematic
of a wave rotor situated within a gas turbine is shown in Figure 2.13.
FIGURE 2.12: WAVE ROTOR DRUM SHOWING CYCLINDRICAL CHANNELS (AKBARI ET AL,
2006)
For a conventional wave rotor configuration, in the first step flow from the compressors
enters one of the channels of the wave rotor. As the drum rotates, the channel connects
with the combustor exit port. The sudden exposure of a high temperature and pressure
gas causes a shock wave to travel along the length of the channel, compressing the
relatively cooler gas within the channel and allowing some of the combustor exhaust
gas to enter the channel. The drum rotates to the next port, the combustor entry. The
freshly compressed gas in the chamber flows out into the combustor. Port timing is
critical so as to avoid the gas/air interface between the fresh and exhaust gas in the
channel reaching the exit of the port to minimise the exhaust gas recirculation rate. The
drum then rotates to the final port, where the still high pressure exhaust gas can exit
through the turbine and the cycle can begin again.
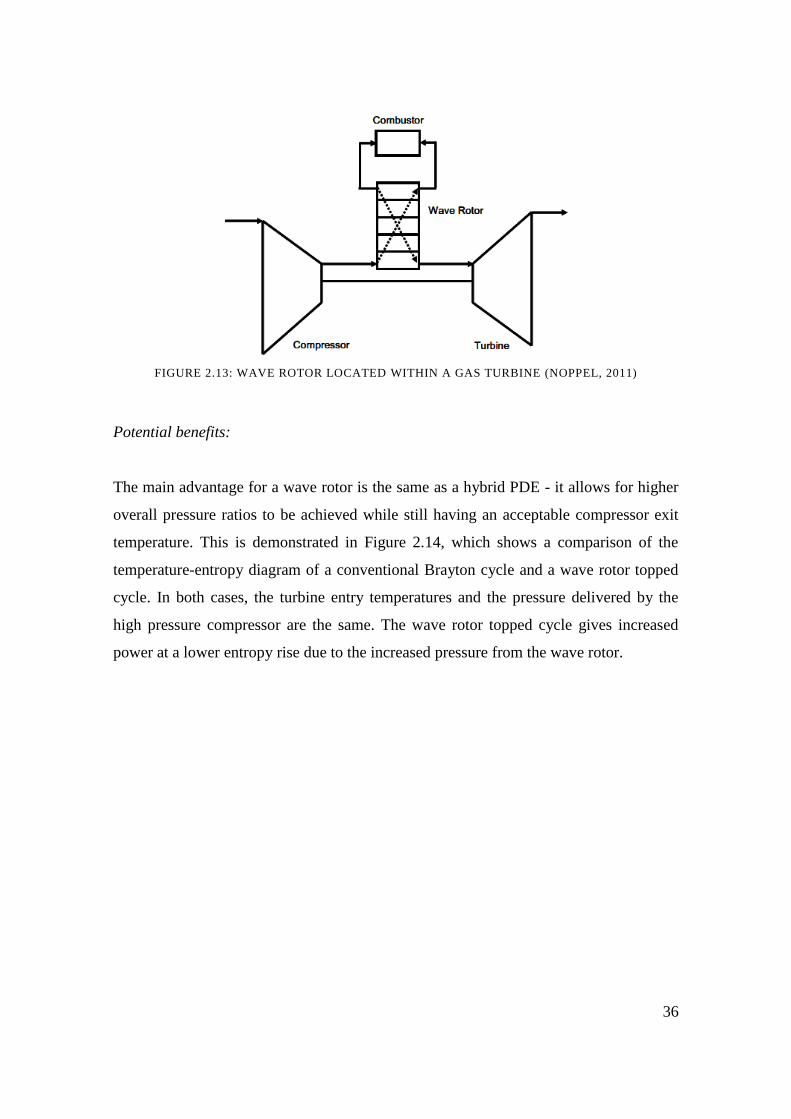
36
FIGURE 2.13: WAVE ROTOR LOCATED WITHIN A GAS TURBINE (NOPPEL, 2011)
Potential benefits:
The main advantage for a wave rotor is the same as a hybrid PDE - it allows for higher
overall pressure ratios to be achieved while still having an acceptable compressor exit
temperature. This is demonstrated in Figure 2.14, which shows a comparison of the
temperature-entropy diagram of a conventional Brayton cycle and a wave rotor topped
cycle. In both cases, the turbine entry temperatures and the pressure delivered by the
high pressure compressor are the same. The wave rotor topped cycle gives increased
power at a lower entropy rise due to the increased pressure from the wave rotor.
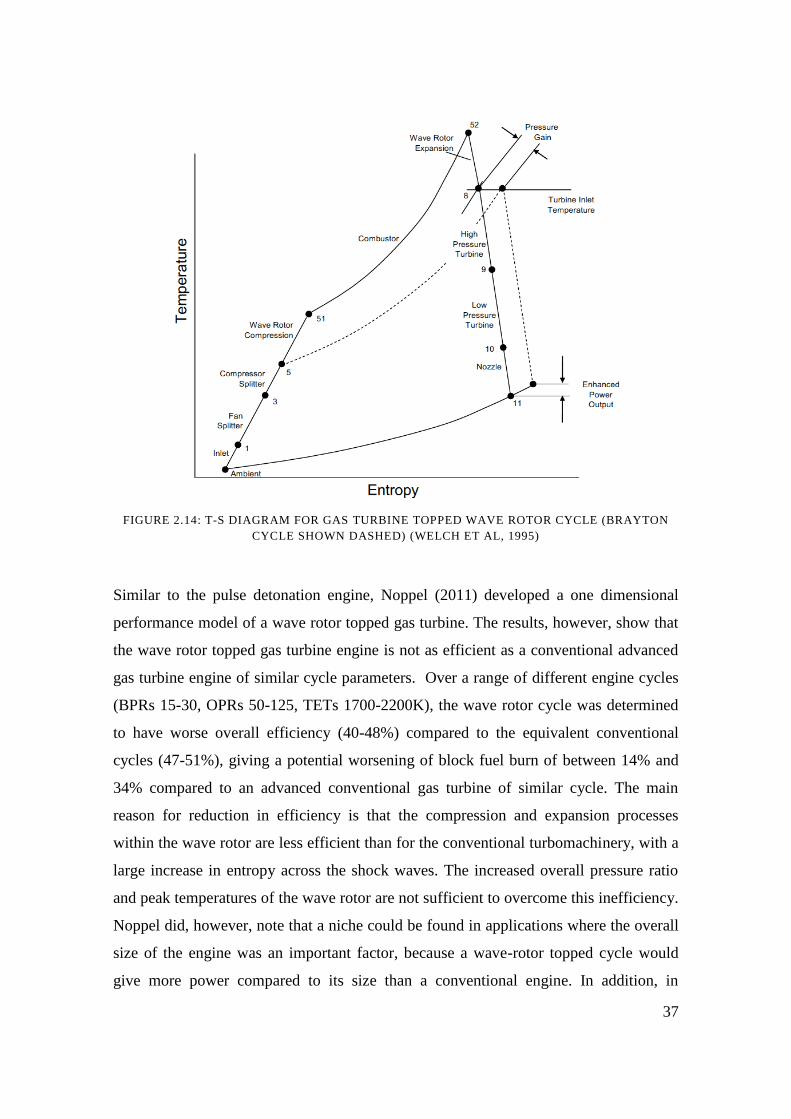
37
FIGURE 2.14: T-S DIAGRAM FOR GAS TURBINE TOPPED WAVE ROTOR CYCLE (BRAYTON
CYCLE SHOWN DASHED) (WELCH ET AL, 1995)
Similar to the pulse detonation engine, Noppel (2011) developed a one dimensional
performance model of a wave rotor topped gas turbine. The results, however, show that
the wave rotor topped gas turbine engine is not as efficient as a conventional advanced
gas turbine engine of similar cycle parameters. Over a range of different engine cycles
(BPRs 15-30, OPRs 50-125, TETs 1700-2200K), the wave rotor cycle was determined
to have worse overall efficiency (40-48%) compared to the equivalent conventional
cycles (47-51%), giving a potential worsening of block fuel burn of between 14% and
34% compared to an advanced conventional gas turbine of similar cycle. The main
reason for reduction in efficiency is that the compression and expansion processes
within the wave rotor are less efficient than for the conventional turbomachinery, with a
large increase in entropy across the shock waves. The increased overall pressure ratio
and peak temperatures of the wave rotor are not sufficient to overcome this inefficiency.
Noppel did, however, note that a niche could be found in applications where the overall
size of the engine was an important factor, because a wave-rotor topped cycle would
give more power compared to its size than a conventional engine. In addition, in
38
smaller, less efficient engines, with limited turbine cooling and lower efficiency
compressors, wave rotors could offer an advantage (ibid.).
Challenges and difficulties:
Several challenges need to be overcome in order for wave rotors to become
commercially available. The main issue is with sealing the plane between the rotor and
end plates, which becomes a particular problem due to the high differential in
temperature between the wave rotor and surrounding turbomachinery (Akbari et al,
2006). In addition, despite being largely self-cooling, with the hot gasses of the
combustor exit being cooled by the compressor exit air, axial and radial temperature
variations can still exist, which can cause thermal stresses and limit the strength of the
rotor (ibid.). The unsteady nature of the device makes design and prediction of selecting
an appropriate wave rotor configuration for a particular application difficult. Wave
rotors have higher combustor temperatures which mean that there are significant
challenges in developing material technologies for the combustor liner (ibid.).
Technology Maturity:
Much of the work carried out on wave rotors for aviation purposes has been laboratory
work with NASA carrying out and continuing with much of the research (Akbari et al,
2006). The recent NASA work has been on sealing technology, which is a critical
challenge. An experimental, prototype 36 channel wave rotor was built and operated by
Asea Brown Boveri between 1989 and 1994 which found several design challenges to
be overcome such as low pressures reached, inhomogeneous mixtures within each
channel, thermal stresses on the ignition ring as well as sealing issues and rotor support
bearing problems (ibid.).
Other research and simulation work has been carried out by Rolls-Royce Allison,
ONERA as well as several universities around the world. The benefits of wave rotors as
well as the challenges needed to be overcome to make wave rotors a reality are
39
understood, but it still needs serious research and will likely be a few decades before
wave rotors become operational.
2.8.3 Intercooled, Recuperated and Intercooled & Recuperated Cores
The thermal efficiency of a gas turbine engine can be improved in two main ways:
increasing the OPR and increasing the TET. In current conventional gas turbine cycles,
OPR is limited by compressor materials and HPC delivery temperature at take-off
(Kyprianidis, 2010), while a significant amount of heat is lost through the jet exhaust.
Using an intercooler between compression stages can allow higher OPRs to be reached
for a given high pressure compressor (HPC) delivery temperature, while a recuperator
can recover some of the heat that would be lost in the exhaust.
Operation:
Intercooling involves the splitting of the compression process into multiple stages
within the engine. Between the compression split(s), the air delivered by the first
compression stage is cooled using a heat exchanger. This then lowers the work required
for the second compression stage. For a given overall pressure ratio, the overall
compressor work will be reduced (increasing specific work of the engine), while for a
given HPC delivery temperature, the OPR will be higher.
A recuperated engine uses the hot gas temperature from the exhaust to preheat the
compressor delivery air prior to its entry into the combustion chamber using a heat
exchanger. For a given combustor exit temperature, less fuel would therefore be
required to heat the compressed gas in a recuperated cycle compared to a simple cycle,
thereby improving overall thermal efficiency.
Intercooled and recuperated cycles use a combination of both, combining the increased
specific work output of the intercooled cycle with the increased thermal efficiency of
the recuperated cycle. The combined cycle can also help to ameliorate the lower
compressor delivery air of the intercooled cycle (Walsh and Fletcher, 2004).
40
Potential benefits:
The primary benefit of intercooling is that it gives a higher specific thrust in comparison
to a similar sized engine without intercooling (ibid.). For modern aero-engine design
where compressor delivery temperatures are reaching compressor blade temperature
limits, it allows for the potential of higher OPRs than may be achievable through
conventional means. As the trend of increasing OPRs in aero-engines continues in order
to seek better thermal efficiencies, the gas delivery temperatures from the HPC are
increasing further. This gas temperature has an impact on the engine in a number of
ways.
For a given combustor exit temperature, there is an optimum OPR to give the best
efficiency (Colmenares et al, 2007). This is determined by materials used in the
construction of the HPC blades and the need for a cooling flow to the high pressure
turbine (HPT). The higher the HPC exit temperature, the bigger the thermal stresses on
the HPC blades and potential reduction in life; and the larger the quantity of air required
to cool the turbine blades meaning a reduction in cycle efficiency (ibid.). Intercooling
allows for higher OPRs to be achieved while at the same time giving an acceptable
combustor exit temperature. For a given technology level, intercooling on its own can
improve thermal efficiency compared to a simple cycle, with the losses from heat
exchanger pressure loss and additional fuel required to achieve the same TET recovered
from a significantly higher OPR (Walsh & Fletcher, 2004).
An intercooler also has the potential to help lower NOx emissions: a lower combustor
entry temperature can help to reduce NOx formation within the combustor (Colmenares
et al, 2007).
The primary benefit of recuperation is recovering normally lost heat from the exhaust
gas and reintroducing it at the entry to the combustor. For a given engine TET, this
reduces the fuel required and reduces the overall SFC of the engine. Recuperation in
aero-engine applications also has the side benefit of improving propulsive efficiency
41
(Walsh and Fletcher, 2004). This is caused by the pressure loss from the recuperator at
the low pressure turbine exit reducing core jet velocities.
Intercooled and recuperated cycles can provide both of the benefits of intercooling and
recuperation, namely a higher OPR and recovered exhaust heat, thereby providing a
significant increase in fuel efficiency (Colmenares et al, 2007). Kyprianidis et al (2010)
showed that NOx emissions for an intercooled-recuperated engine are similar to that of
a conventional engine of similar technology level. The significantly higher OPR means
that it is considerably better at meeting current landing take-off cycle legislation,
however.
In terms of fuel burn benefits, a number of studies have been carried out to quantify the
fuel burn benefits that heat exchanged cores could be able to give. MTU Aero engines
has undertaken significant research into heat exchanged cores both alone and under
different EU funded projects such as NEWAC, CLEAN and AEROHEX (Boggia and
Rüd, 2005). Using pre-design concept studies of a 3 shaft geared turbofan engine with
intercooling and recuperation, Boggia and Rüd (2005) estimated that up to 18.7%
reduction in SFC could be obtained from intercooling and recuperation compared to a
baseline 1995 engine. It should be noted, however, that this study did not necessarily
compare like with like – the proposed intercooled-recuperated engine had a much higher
bypass ratio – 26.5 compared to the baseline of 5.1 and a much higher TET of 1,944K
compared to the baseline of 1,600K. Boggia and Rüd did note that intercooling and
recuperation would be more suitable for long range aero applications, where the
additional weight associated with the heat exchangers would be offset with the better
cruise SFC. For shorter range applications where the aircraft spends a lower proportion
of its time at cruise, intercooled and recuperated engines may not offer as much, if any,
benefit.
Kyprianidis et al (2010) used the TERA 2020 optimisation tool to assess intercooled
and intercooled-recuperated aero-engine cores. 3-spool engines and a long-range aircraft
model with design range of 12,500km and able to carry 253 passengers were used for
the study. With an OPR of 80 for the two intercooled cores, block fuel benefits of
42
approximately 3.2% over a mission of 5,500 km were predicted for the intercooled core
and up to 22% for the intercooled recuperated core compared to a comparable
conventional turbofan of similar technology. More recently, Xu et al (2013) updated
this study of an intercooled-recuperated aero engine and found that an optimised
intercooled-recuperated engine could deliver and additional 5.56% fuel burn savings for
the same mission.
Challenges and difficulties:
Intercoolers and recuperators have been previously used for industrial and marine
purposes, however a number of challenges need to be overcome before they are suitable
for aerospace applications. These relate mainly to weight, installation and layout, and
heat exchanger effectiveness issues.
Intercooled engines are primarily useful for larger aero-engines on longer missions.
Although the additional weight of the heat exchangers can be overcome by improved
cruise efficiency, shorter range missions would not benefit as much due to the
proportionally shorter time spent at cruise for the whole mission. In addition, smaller
aircraft and engines are normally used for short range missions. One benefit of
intercooling is that higher OPRs can be achieved for a given HPC delivery temperature.
However, the higher the OPR, the smaller the HPC duct becomes, leading to increased
tip leakage losses and lowering component efficiency (Camilleri et al, 2015). Therefore
intercooled engines are only feasible for larger engines with a larger core flow.
Weight is a significant issue in aerospace applications. Any additional weight carried by
the aircraft requires additional thrust from the engine and results in an increase in fuel
burn. It is important therefore that any gains in thermal efficiency from heat exchanged
cores are not reduced by additional engine weight. In this regard, there is a relationship
between heat exchanger effectiveness and weight. The more effective the heat
exchanger, the heavier it is due to the additional cooling vanes. Rolt and Baker (2009)
found that an optimal effectiveness was between 60-70% to keep the weight and size of
the intercooler to an acceptable level.
43
Heat exchangers also introduce pressure losses within the main air flow, mainly through
the skin friction and boundary layer build up within the heat exchanger vanes, but also
through the additional ducts required to route the flow (Walker et al, 2009). Although in
practice this is not too much of a problem, as industrial and marine heat exchanged gas
turbines exist, in aero applications the installation of the heat exchangers and ducts is a
particular challenge. Ducts are required to diffuse the flow before it enters the heat
exchanger, as pressure losses are proportional to the square of flow velocity (ibid.),
however overall length of the engine is important for drag and weight considerations.
One way to overcome the length issue is with a reversed flow core (Camilleri et al,
2015).
Many of these challenges are being considered by various research programmes,
including NEWAC and LEMCOTEC, as well as engine companies such as Rolls-Royce
and MTU and research institutions such as Cranfield University and Chalmers
University.
Technology Maturity:
While these cycles have long been used for industrial and marine purposes - most
recently with the 25 MW Rolls-Royce WR-21 Intercooled Recuperated engine used on
the Type-45 Destroyer (English, 2003) - they have yet to be used in commercial aero
applications (Colmenares, 2009). In 1967, Allison used a Model 250-E3 recuperated gas
turbine engine powering a Hughes YOH-6A helicopter in a successful test flight
program to test the concept (Jensen and Leonard, 2002), which demonstrates that heat
exchanged cores are feasible for aero applications. The main considerations to
overcome are heat-exchanger pressure losses and weight. However, considering the
research being undertaken, the author’s opinion is that intercooled and intercooled
recuperated cores could become available for long range applications within 20 years.
44
2.8.4 Open Rotors/High Speed Propellers
During the fuel crisis In the 1970's, the increased propulsive efficiency offered by
propellers led many manufacturers to look at potential designs that were suitable at
higher flight Mach numbers (Barnard & Philpott, 2004, p. 148). Despite there being
interest in technology demonstrator 'propfans' being created by both General Electric
and a consortium led by NASA in the mid to late 1980's (Flightglobal, 2007), the
considerable reduction in the price of oil and concerns about noise stopped any further
development (Sweetman, 2005). Interest in open rotor engine configurations has been
rekindled in recent years due to more stringent emission regulations, and have been
investigated in the EU projects Clean Sky (Clean Sky, 2016) and DREAM (EC, 2016).
Operation:
The open rotor engine is similar to a turbo-prop in that it combines a gas turbine with a
propeller located externally on the engine. The propeller uses aerodynamically
advanced rotor blades which are a larger diameter than the blades of a conventional
turbofan engine, giving rise to higher BPRs and hence improved propulsive efficiency.
The open rotor differs from a turbo-prop as the highly swept rotor blades are designed
for higher flight velocities, approaching those of conventional turbofans (Barnard &
Philpott, 2004). Single rotating and counter rotating open rotor configurations with or
without gearboxes have been proposed (ibid.).
Potential Benefits:
The open rotor allows for much higher bypass ratios (BPR) while retaining the high
cruising speeds of conventional turbofan engines. At cruise conditions, contra-rotating
open rotors BPRs of up to 50 (Mikkelson, D. C et.al., 1984; Grieb, H. and Eckardt, D.,
1986) are possible. These higher bypass ratios allow for a much better propulsive
efficiency in comparison to conventional turbofans, without a significant increase in
mission time like conventional turbo-props. This allows the potential for lower mission
fuel burn and CO2 emissions without additional flight time DOCs.
45
Different configurations of open rotor have been considered, including pusher and
puller configurations, and single rotor and dual rotor counter-rotating configurations.
The benefit of a contra-rotating configuration over a single rotor is that it is able to
deliver an equivalent level of thrust using a reduced propeller diameter, which enables
reduced propeller tip speeds. This offers the important advantage of recovering the swirl
on the propellers exit flow (Bellocq, P., 2012), and keeping higher cruise speeds within
acceptable noise limits.
In terms of fuel burn advantages, Guynn et al (2012) undertook an a preliminary aircraft
system level study of an Airbus A320/Boeing 737 size aircraft with two open rotor
engines mounted on the rear of the aircraft. They estimated that block fuel burn savings
of 18% could be achieved over a 500 nm mission compared to an advanced geared
turbofan engine with a BPR of about 15 and OPR of 42, while savings of up to 12%
could be achieved over a 3,250 nm mission. They found that cruise fuel burn savings
were of the order of 10%, while superior fuel savings were found during the climb
phase.
Challenges and Difficulties:
Despite flying demonstrators of open rotors since the 1980s, there still remain several
challenges to overcome before open rotors become ready for certification. Bellocq et al
(2016 , p.2) list several of these challenges:
“At Aircraft Level
Cabin and community noise
Fuselage and structures fatigue (at proximity of engine)
Engine installation and weight
Aircraft aerodynamics (mainly for rear mounted CROR)
Public perception
46
At Engine Level
Small core, high impact of cooling flows on performance
Operation during thrust reverse
Mechanical design of the pitch control mechanism
Mechanical design of the blades
Gearbox reliability and oil-cooling technologies
Maintainability and acceptable maintenance cost
CRT [Counter Rotating Turbine] seals and blade containment”
However, since the global financial crisis and corresponding fuel price rises, engine
manufacturers in both Europe and the USA, as well as national and supranational bodies
such as the EU, NASA and the FAA, have created projects to address these issues. The
FAA and General Electric have researched aero-acoustic technology as part of the
Continuous Lower Energy, Emissions and Noise (CLEEN) program (Khalid et al,
2013), NASA are involved as part of the Environmentally Responsible Aviation (ERA)
project (Van Zante, 2013), while in the EU, the large Clean Sky (Clean Sky, 2016) and
DREAM (EC, 2016) projects have brought together engine and aircraft industry, as well
as research institutions from across Europe to research these challenges.
In the author’s opinion, the major problem faced with open rotors is the noise created
from the tips of the fan blades travelling at supersonic speeds, from the rotational speed
of the blades and the forward motion of the aircraft (Barnard & Philpott, 2004, p. 169).
This noise causes problems both for passengers in the cabin and the noise in and around
airports. In conventional turbofan engines, this noise is ameliorated to some degree
thanks to the engine nacelle shroud, but for open rotor engines, the installation of the
engine on the aircraft becomes more important.
To reduce cabin noise the General Electric UnDucted Fan (UDF) demonstrator in the
1980's, the engines were mounted at the rear of the fuselage of a McDonnell Douglass
MD-80 aircraft. The placement of the engines, however, potentially restricts the number
of engines available to be fitted on the aircraft, making this technology suitable for
47
shorter range aircraft rather than long range aircraft. Recent wind tunnel experiments
carried out by General Electric as part of the CLEEN project, show that open rotors are
capable of meeting current noise legislation while retaining good propeller efficiency
(Khalid et al, 2013). Safran Aircraft Engines carried out wind tunnel tests in 2013
focusing on noise emissions and was confident that noise levels would be 10dB lower
than current turbofan engines (Gubisch, 2014).
Additional challenges remain with the design of the engines themselves and their
integration, however. The contra rotating open rotor design, even though very beneficial
in terms of increased propulsive efficiency, is technically challenging. The blade pitch
of the contra rotating stages must be varied in order to optimally match the aircraft
speed and power/throttle setting through the flight envelope, similar to turbo-props. This
would require the application of a pitch change/control mechanism for actuation and
control of the blade pitch. The space available within the engine may also be
problematic - there would need to be a gearbox for the contra-rotation of one of the
rotors, another for the reduction from the turbine speed and also space for the pitch
control mechanism. This would also have an impact on the engine weight.
The integration of the engines on the aircraft may also necessitate a complete aircraft
redesign. The engines may not be able to be mounted under the wings for two reasons -
lack of space from the increase BPR that the engines offer and the potential for an
uncontained rotor blade-off severing the wing. To overcome this, rear mounted engines
would be a feasible option, however this restricts the number of engines that could be
carried, meaning that the aircraft would likely be more suitable for shorter range
missions.
Technology Maturity:
Open rotor flight demonstrators have been flown in the 1980s with the General
Electric/McDonnel Douglas UDF, while Safran Aircraft Engines is currently building a
prototype counter-rotating open rotor engine with flight tests scheduled to begin in 2019
(Gubisch, 2014). Much research (as described above) is being carried out to solve the
48
remaining issues with open rotors and in Europe, open rotors are expected to enter
service from 2030 (ibid.).
Open rotor engines are likely to be more suitable for short to medium range single aisle
aircraft (Larsson et al, 2014), as although they are capable of cruising speeds equivalent
to turbofans (about Mach 0.8), greater fuel saving benefits can be had at slightly lower
cruising speeds (ibid.). The open rotor also gives better fuel burn savings during the
climb phase of the mission, making them more attractive for shorter range missions
(Guynn et al, 2012).
2.8.5 Turboprops/Conventional Propellers
While novel engine cycles and new technologies can in some respects be seen as the
'future' of aero-engines, in order to achieve the goals of fuel burn reduction and lower
engine emissions, it can sometimes be beneficial to see if there any existing
technologies that could also meet those goals. Propeller driven aircraft have been
around since the inception of manned, powered fixed wing flight, and the better
efficiency of propeller driven aircraft compared to jet aircraft at lower flight speeds is
well known (Barnard & Philpott, 2004, p. 138). Combining a propeller with a gas
turbine engine produces a 'turbo-prop', which have been found on many aircraft since
the first such powerplant was tested on a Gloster Meteor in 1945 (James, 1987).
Operation:
The turboprop engine consists of a propeller which provides the main thrust of the
engine and a gas turbine which provides the power to drive the propeller. Barnard and
Philpott (2004) provide a good description of the operation of turboprops.
Potential benefits:
There may be scope, however, for turbo-props on slightly larger aircraft and longer
range missions. Because turbo-prop aircraft fly at an altitude of approximately 25,000ft
49
(Kirby, 2011) compared to a typical turbo-fan aircraft of approximately 35,000ft, the
time spent in the climb phase is comparatively less and the cruise phases begins earlier.
The overall mission block time may therefore be the same between the turbo-prop and
turbofan aircraft, dependent on mission length. Indeed, anecdotal comparisons (Kirby,
2011) between the Bombardier Dash 8 and Embraer ERJ-145 turbofan aircraft showed
that the total block time was the same for missions up to an hour and a half. The
Embraer ERJ-145 cruises at Mach 0.78 (Embraer, 2012), similar to that of the Airbus
A320 (0.78 - 0.82), while the Bombardier cruises at approximately Mach 0.63 (Kirby,
2011).
The implications are that, for missions of up to even three hours duration, a turbo-prop
powered aircraft may not significantly lag behind a turbofan aircraft. Indeed, the
currently in production Airbus A400m 'Atlas' military transport aircraft is designed to
cruise at Mach 0.72 at altitudes of up to 37,00ft (Airbus, 2012), which is much more
similar to conventional turbofan aircraft. Parzani (2012) carried out a comparison
between the A400m and a Boeing 737-800 and found that the A400m was less efficient
overall than the 737. However, it should be noted that the A400m carries considerable
extra weight not found in the 737 because of its application as a military transport, such
as armour, electronic counter measure systems and loading winches. If the aircraft was
optimised for passenger transportation like the 737, the result may well be different. The
engine that powers the A400m, the Europrop T400-D6, produces 8,200 kW (Rolls-
Royce, 2006) and four of them power the A400m. The A400m has a maximum take-off
weight (MTOW) of 141,000 kg (Hoyle, 2011), which is approximately twice the
MTOW of an Airbus A320 (73,500 - 77,000 kg, Airbus, 2010a). Two T400-D6 type
engines could potentially power an aircraft of Airbus A320 size.
In terms of fuel burn, turboprop equipped aircraft currently in service demonstrate better
fuel consumption characteristics than equivalent turbofan equipped aircraft. This is
demonstrated in Figure 2.15, which compares three similar size aircraft – the turboprop
equipped ATR 72 and Bombardier Q400, and the turbofan equipped Embraer CJ-700
regional aircraft used for Fly In/Fly Out operations for the mining sector in Australia
(Walsh and Bil, 2015). Up to 75% less fuel can be used for the shortest range missions
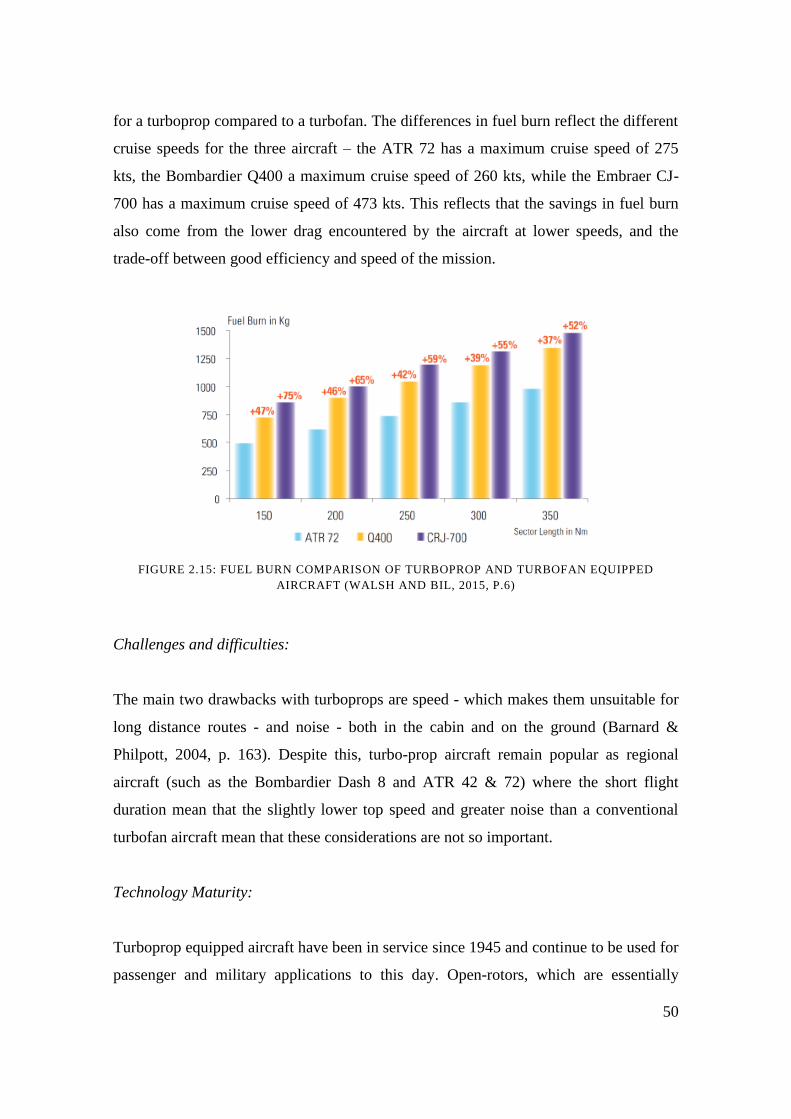
50
for a turboprop compared to a turbofan. The differences in fuel burn reflect the different
cruise speeds for the three aircraft – the ATR 72 has a maximum cruise speed of 275
kts, the Bombardier Q400 a maximum cruise speed of 260 kts, while the Embraer CJ-
700 has a maximum cruise speed of 473 kts. This reflects that the savings in fuel burn
also come from the lower drag encountered by the aircraft at lower speeds, and the
trade-off between good efficiency and speed of the mission.
FIGURE 2.15: FUEL BURN COMPARISON OF TURBOPROP AND TURBOFAN EQUIPPED
AIRCRAFT (WALSH AND BIL, 2015, P.6)
Challenges and difficulties:
The main two drawbacks with turboprops are speed - which makes them unsuitable for
long distance routes - and noise - both in the cabin and on the ground (Barnard &
Philpott, 2004, p. 163). Despite this, turbo-prop aircraft remain popular as regional
aircraft (such as the Bombardier Dash 8 and ATR 42 & 72) where the short flight
duration mean that the slightly lower top speed and greater noise than a conventional
turbofan aircraft mean that these considerations are not so important.
Technology Maturity:
Turboprop equipped aircraft have been in service since 1945 and continue to be used for
passenger and military applications to this day. Open-rotors, which are essentially

51
turboprops with higher flight speeds could be considered an evolution and next stage of
this technology.
52
3.0 TERA Methodology and Models
This chapter describes the overall methodology used to investigate the quantitative
element of the thesis, namely the search for an optimum conventional gas turbine
engine suitable for use on short to medium range passenger jet aircraft. The chapter
provides an overall description of the TERA methodology combined with the
constituent models.
3.1 General TERA Methodology
TERA is a tool that can be used to assess gas turbine engines with "minimum
[environmental] impact and lowest cost of ownership in a variety of emission
legislation scenarios, emissions taxation policies, fiscal and air traffic management
environments" (Ogaji et al, 2007). TERA uses a modular, multi-disciplinary (in that
several different disciplines are used such as gas turbine performance, noise modelling,
emission modelling, aircraft performance e.t.c.) approach to optimize a particular 'goal'
function, such as fuel burn, noise or global warming potential (ibid. p. 4).
The TERA framework consists of several modules which are integrated together with an
optimizer. The optimizer used for the EU VITAL project was a commercial optimiser
called iSight, although other user made genetic-algorithm optimizers have also been
used. The different modules are individual models that perform a specific function, such
as an engine performance model, aircraft performance model or weight estimation
model. These are brought together within the optimiser, which can then give a set of
optimum results for a number of different objectives.
Figure 3.16 shows the TERA framework used to study the optimisation of aircraft
engine technologies to reduce mission fuel burn. The figure shows the various models
used within the framework and how they interact.
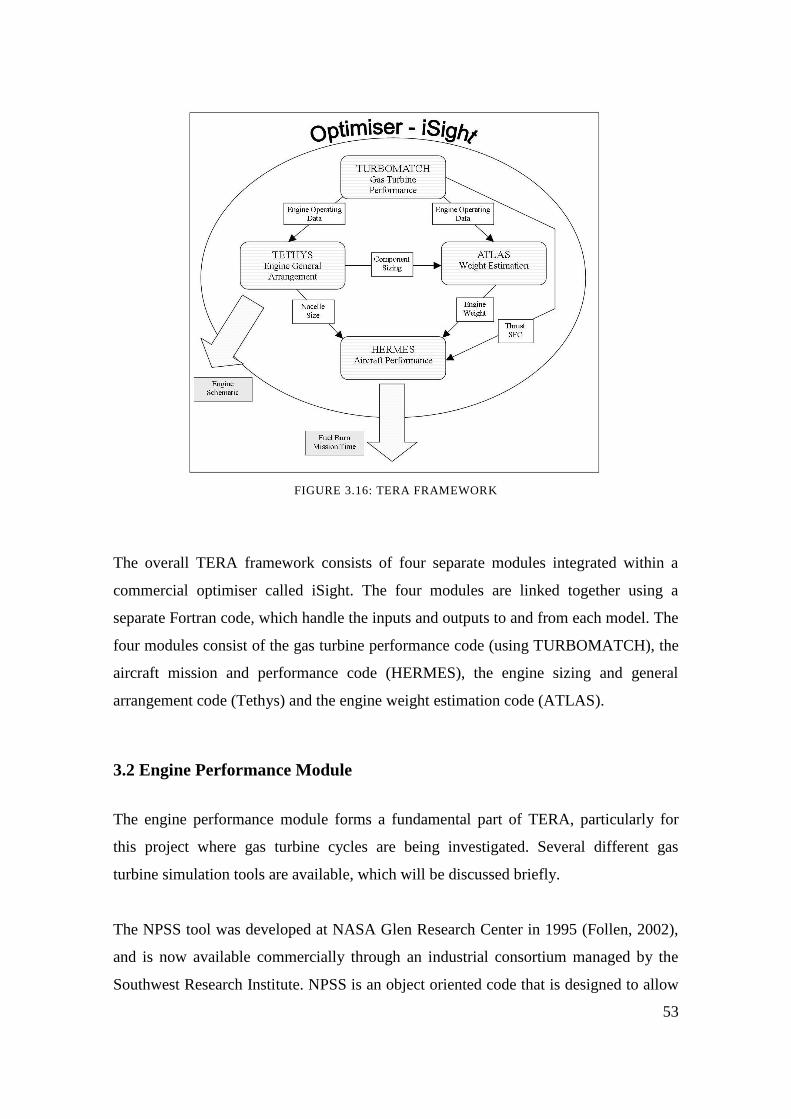
53
FIGURE 3.16: TERA FRAMEWORK
The overall TERA framework consists of four separate modules integrated within a
commercial optimiser called iSight. The four modules are linked together using a
separate Fortran code, which handle the inputs and outputs to and from each model. The
four modules consist of the gas turbine performance code (using TURBOMATCH), the
aircraft mission and performance code (HERMES), the engine sizing and general
arrangement code (Tethys) and the engine weight estimation code (ATLAS).
3.2 Engine Performance Module
The engine performance module forms a fundamental part of TERA, particularly for
this project where gas turbine cycles are being investigated. Several different gas
turbine simulation tools are available, which will be discussed briefly.
The NPSS tool was developed at NASA Glen Research Center in 1995 (Follen, 2002),
and is now available commercially through an industrial consortium managed by the
Southwest Research Institute. NPSS is an object oriented code that is designed to allow
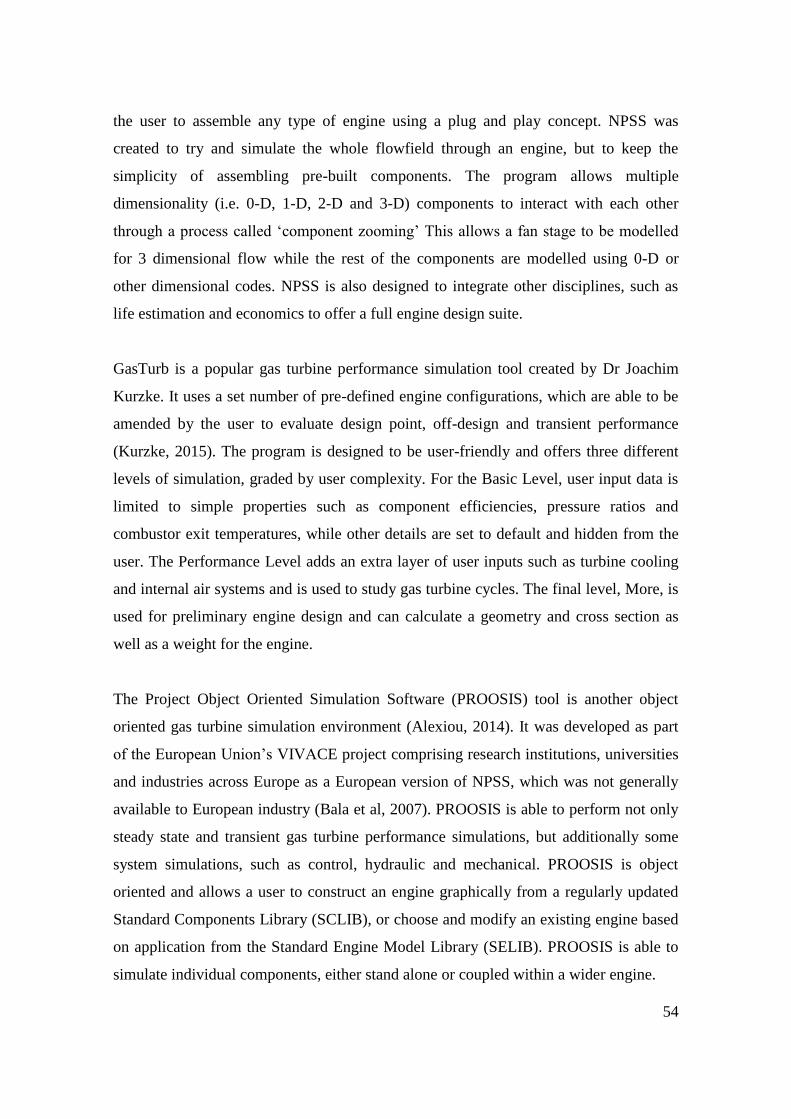
54
the user to assemble any type of engine using a plug and play concept. NPSS was
created to try and simulate the whole flowfield through an engine, but to keep the
simplicity of assembling pre-built components. The program allows multiple
dimensionality (i.e. 0-D, 1-D, 2-D and 3-D) components to interact with each other
through a process called ‘component zooming’ This allows a fan stage to be modelled
for 3 dimensional flow while the rest of the components are modelled using 0-D or
other dimensional codes. NPSS is also designed to integrate other disciplines, such as
life estimation and economics to offer a full engine design suite.
GasTurb is a popular gas turbine performance simulation tool created by Dr Joachim
Kurzke. It uses a set number of pre-defined engine configurations, which are able to be
amended by the user to evaluate design point, off-design and transient performance
(Kurzke, 2015). The program is designed to be user-friendly and offers three different
levels of simulation, graded by user complexity. For the Basic Level, user input data is
limited to simple properties such as component efficiencies, pressure ratios and
combustor exit temperatures, while other details are set to default and hidden from the
user. The Performance Level adds an extra layer of user inputs such as turbine cooling
and internal air systems and is used to study gas turbine cycles. The final level, More, is
used for preliminary engine design and can calculate a geometry and cross section as
well as a weight for the engine.
The Project Object Oriented Simulation Software (PROOSIS) tool is another object
oriented gas turbine simulation environment (Alexiou, 2014). It was developed as part
of the European Union’s VIVACE project comprising research institutions, universities
and industries across Europe as a European version of NPSS, which was not generally
available to European industry (Bala et al, 2007). PROOSIS is able to perform not only
steady state and transient gas turbine performance simulations, but additionally some
system simulations, such as control, hydraulic and mechanical. PROOSIS is object
oriented and allows a user to construct an engine graphically from a regularly updated
Standard Components Library (SCLIB), or choose and modify an existing engine based
on application from the Standard Engine Model Library (SELIB). PROOSIS is able to
simulate individual components, either stand alone or coupled within a wider engine.
55
For this project, Cranfield University’s own engine performance code,
TURBOMATCH, was used. TURBOMATCH was chosen for three main reasons:
Functionality – the code offers sufficient functionality for the project. The added
functionality of the other codes, such as transient performance modelling, was
not required for the project, where a large number of different cycles would be
run.
Availability – as TURBOMATCH is an in-house code, no licenses were
required to be purchased and the expertise for any troubleshooting was easily
available;
Suitability – TURBOMATCH has been used for TERA and other multi-
disciplinary optimisations in the past.
TURBOMATCH was created at Cranfield University by MacMillan (1974) and is a
modular, '0-D' code where 'bricks' are used to simulate individual components within a
gas turbine. These pre-programmed bricks, which mostly represent components in an
engine such as ducts, compressors, intakes and mixers can be assembled by the user to
create almost any type of gas turbine engine (Apostolidis et al, 2013). Other bricks are
available within the code, such as the PERFOR brick, which collates the outputs of the
other bricks to perform the overall cycle calculation. Each brick is a subroutine which
calculates the thermodynamic process in the relevant component. Each brick requires
specific user defined inputs, such as pressure ratio and isentropic efficiency for the
COMPRE brick, which define the design point of the engine.
The bricks are arranged serially and are connected together using an interface called a
station vector. Station vectors consist of eight different variables, although only five are
required to describe the gas state:
fuel to air ratio
mass flow
total pressure
56
static pressure
total temperature
static temperature
flow velocity
area
The user defines a station number for the input and output of each brick (or two inputs
in the case of a mixer, two outputs for a splitter) such that one station number is used for
the output of one brick and the input of the next sequential brick. In this way, the
individual components can be linked together to form a complete engine.
One other way of connecting components together which are not sequential in the flow
path, such as the low pressure compressor and turbine, is the engine vector. Engine
vector results, such as the compressor work can then be used as a brick data input into
another component, such as a turbine in this instance. Figure 3.17 shows
diagrammatically the flow to and from a brick.
FIGURE 3.17: BRICK DATA FLOW (APOSTOLIDIS ET AL, 2013 P.4)
The user constructs the brick data and station vector items in a text input file1, and then
specifies the design point combustor exit temperature and inlet mass flow, followed by
any off-design points. The design point calculation is the first to be determined, which
1 A version of TURBOMATCH called Pythia with a graphical user interface allows a user to assemble an
engine and generate the input text file automatically has also been created by Cranfield University.
57
sizes the engine, following the approach given in Walsh and Fletcher (2004). For off-
design, TURBOMATCH is currently able to use two parameters as a handle - the
combustor exit temperature and any shaft relative rotational speed (PCN).
TURBOMATCH uses a number of component maps to the model off-design behaviour
of the engine. Five pre-defined maps2 are available for each of the compressor and
turbine, while there is one default map for each of the combustion chamber, intercooler
and propeller bricks. The standard maps are based on real components and are derived
experimentally, while the functionality exists for the user to upload other maps. The
maps are scaled based during the design point operation. For off design cases, an in
iterative procedure takes place (up to 100 iterations in TURBOMATCH 2.0) to match
the performance of the components. A number of parameters are guessed initially, and
then the validity of those guesses checked. Checks are carried out on mass flow
compatibility, work compatibility, shaft rotational speed and the power law for driving
generators (Apostolidis, 2013).
The outputs from the engine module are used in most of the other modules. The aircraft
performance module uses thrust and SFC as its main inputs from the engine module, the
engine sizing module uses component total pressures and temperatures along with mass
flow values and splits which also feed into the weight model.
3.3 Aircraft Performance Module
The aircraft performance module is an important part of the TERA module when
investigating aircraft engines, as it allows for the investigation of fuel burn over a range
of different mission profiles rather than just looking at specific fuel consumption of an
uninstalled engine. This is useful because it allows further conclusions for novel
powerplants to be drawn, such as economic viability from mission fuel burn and CO2
emissions over the mission.
2 One map here refers to the correlated pressure ratio (enthalpy drop) vs efficiency and pressure ratio
(enthalpy drop) vs non dimensional mass flow maps for the compressor (and turbine in brackets).
58
For this project, HERMES, Cranfield University's in house aircraft performance code,
was used. HERMES was developed by Laskaridis in 2004 and was designed to be
integrated with TURBOMATCH for the engine performance data. HERMES has been
designed for use with passenger jet aircraft in conventional configuration (i.e. with
engines hung under the wings), although turbo-props have also been modelled.
HERMES assumes international standard atmosphere ISA conditions (although
deviations can be inputted manually) and assumes a typical take-off, cruise, land profile.
HERMES has been validated against published aircraft performance data with less than
1% deviation in the payload-range chart (Laskaridis et al, 2005).
A HERMES input file is given in Appendix 1. The input file is split into a number of
sections to make inputting the required data easier for the user. There are a wide range
of inputs to describe the aircraft geometry and mission profile including engine settings
for the whole mission. TURBOMATCH is integrated within HERMES, which uses the
mission profile data (such as altitude, Mach Number and engine settings) to create a
matrix covering the whole flight envelope.
The output file of HERMES gives details of mission fuel burn, block fuel burn (this also
includes taxiing at the airport), total mission and block ranges, mission time, HERMES
also gives details of fuel burn for each phase of the mission for deeper study.
HERMES has a modular form and consists of six different modules, although these are
hidden from the regular user. They are (ibid.):
Input data
Mission profile module
Atmospheric module
Engine data
Aerodynamic module
Aircraft performance module
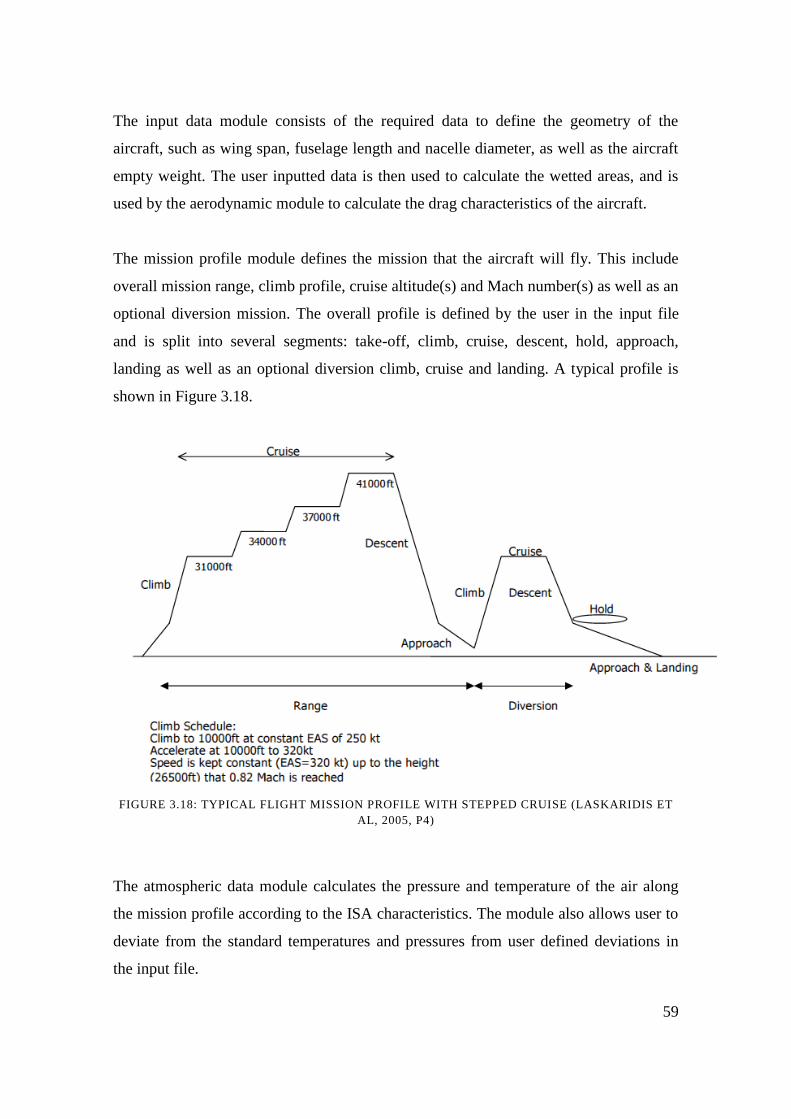
59
The input data module consists of the required data to define the geometry of the
aircraft, such as wing span, fuselage length and nacelle diameter, as well as the aircraft
empty weight. The user inputted data is then used to calculate the wetted areas, and is
used by the aerodynamic module to calculate the drag characteristics of the aircraft.
The mission profile module defines the mission that the aircraft will fly. This include
overall mission range, climb profile, cruise altitude(s) and Mach number(s) as well as an
optional diversion mission. The overall profile is defined by the user in the input file
and is split into several segments: take-off, climb, cruise, descent, hold, approach,
landing as well as an optional diversion climb, cruise and landing. A typical profile is
shown in Figure 3.18.
FIGURE 3.18: TYPICAL FLIGHT MISSION PROFILE WITH STEPPED CRUISE (LASKARIDIS ET
AL, 2005, P4)
The atmospheric data module calculates the pressure and temperature of the air along
the mission profile according to the ISA characteristics. The module also allows user to
deviate from the standard temperatures and pressures from user defined deviations in
the input file.
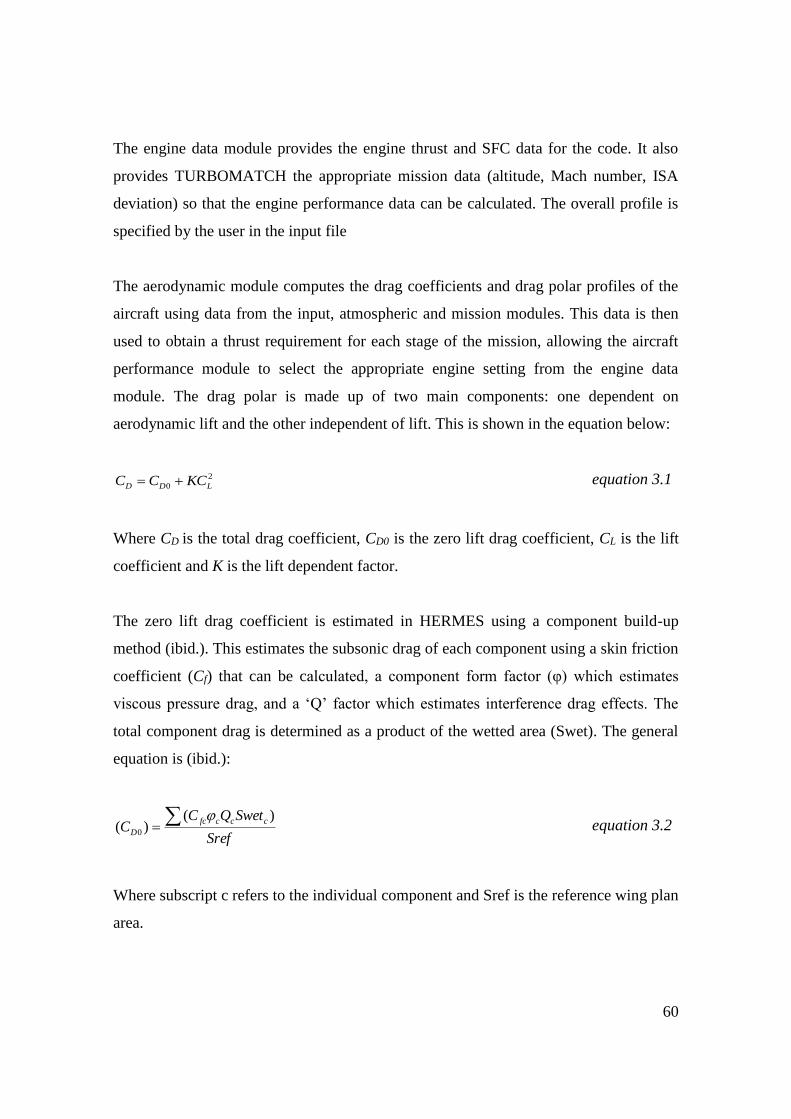
60
The engine data module provides the engine thrust and SFC data for the code. It also
provides TURBOMATCH the appropriate mission data (altitude, Mach number, ISA
deviation) so that the engine performance data can be calculated. The overall profile is
specified by the user in the input file
The aerodynamic module computes the drag coefficients and drag polar profiles of the
aircraft using data from the input, atmospheric and mission modules. This data is then
used to obtain a thrust requirement for each stage of the mission, allowing the aircraft
performance module to select the appropriate engine setting from the engine data
module. The drag polar is made up of two main components: one dependent on
aerodynamic lift and the other independent of lift. This is shown in the equation below:
2
0 LDD KCCC equation 3.1
Where CD is the total drag coefficient, CD0 is the zero lift drag coefficient, CL is the lift
coefficient and K is the lift dependent factor.
The zero lift drag coefficient is estimated in HERMES using a component build-up
method (ibid.). This estimates the subsonic drag of each component using a skin friction
coefficient (Cf) that can be calculated, a component form factor (φ) which estimates
viscous pressure drag, and a ‘Q’ factor which estimates interference drag effects. The
total component drag is determined as a product of the wetted area (Swet). The general
equation is (ibid.):
Sref
SwetQCC
cccfc
D
)()( 0
equation 3.2
Where subscript c refers to the individual component and Sref is the reference wing plan
area.
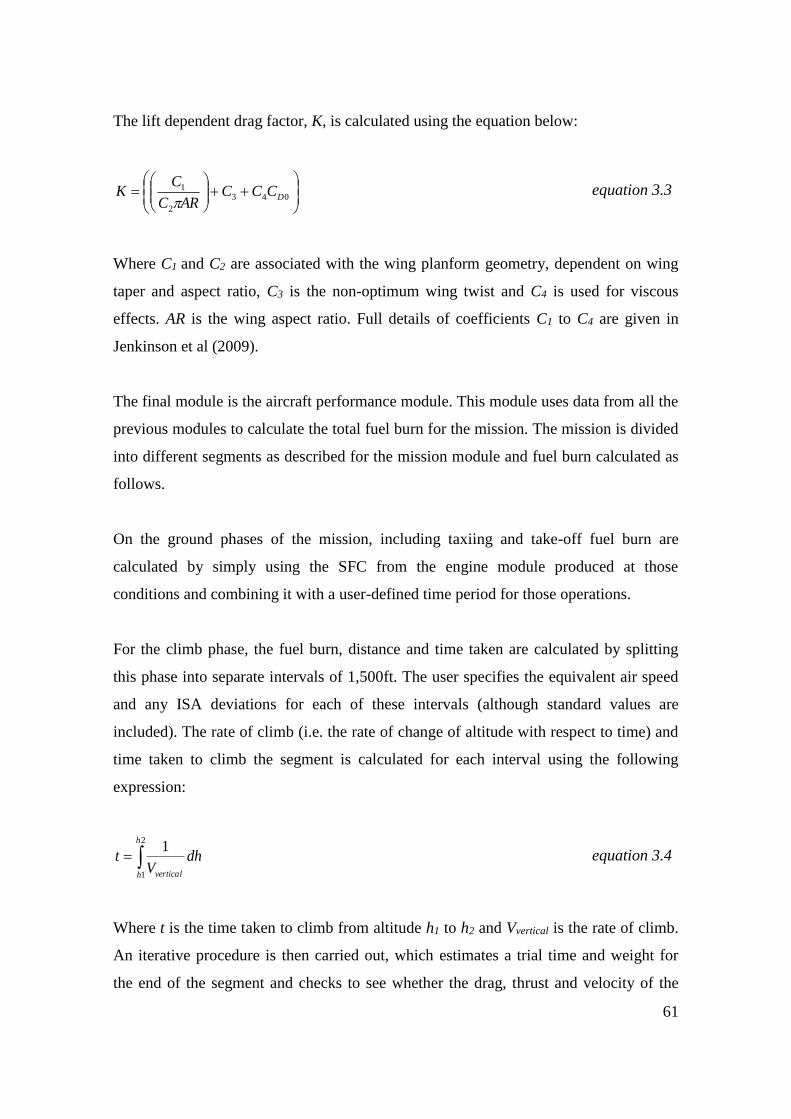
61
The lift dependent drag factor, K, is calculated using the equation below:
043
2
1DCCC
ARC
CK
equation 3.3
Where C1 and C2 are associated with the wing planform geometry, dependent on wing
taper and aspect ratio, C3 is the non-optimum wing twist and C4 is used for viscous
effects. AR is the wing aspect ratio. Full details of coefficients C1 to C4 are given in
Jenkinson et al (2009).
The final module is the aircraft performance module. This module uses data from all the
previous modules to calculate the total fuel burn for the mission. The mission is divided
into different segments as described for the mission module and fuel burn calculated as
follows.
On the ground phases of the mission, including taxiing and take-off fuel burn are
calculated by simply using the SFC from the engine module produced at those
conditions and combining it with a user-defined time period for those operations.
For the climb phase, the fuel burn, distance and time taken are calculated by splitting
this phase into separate intervals of 1,500ft. The user specifies the equivalent air speed
and any ISA deviations for each of these intervals (although standard values are
included). The rate of climb (i.e. the rate of change of altitude with respect to time) and
time taken to climb the segment is calculated for each interval using the following
expression:
2
1
1h
h vertical
dhV
t equation 3.4
Where t is the time taken to climb from altitude h1 to h2 and Vvertical is the rate of climb.
An iterative procedure is then carried out, which estimates a trial time and weight for
the end of the segment and checks to see whether the drag, thrust and velocity of the
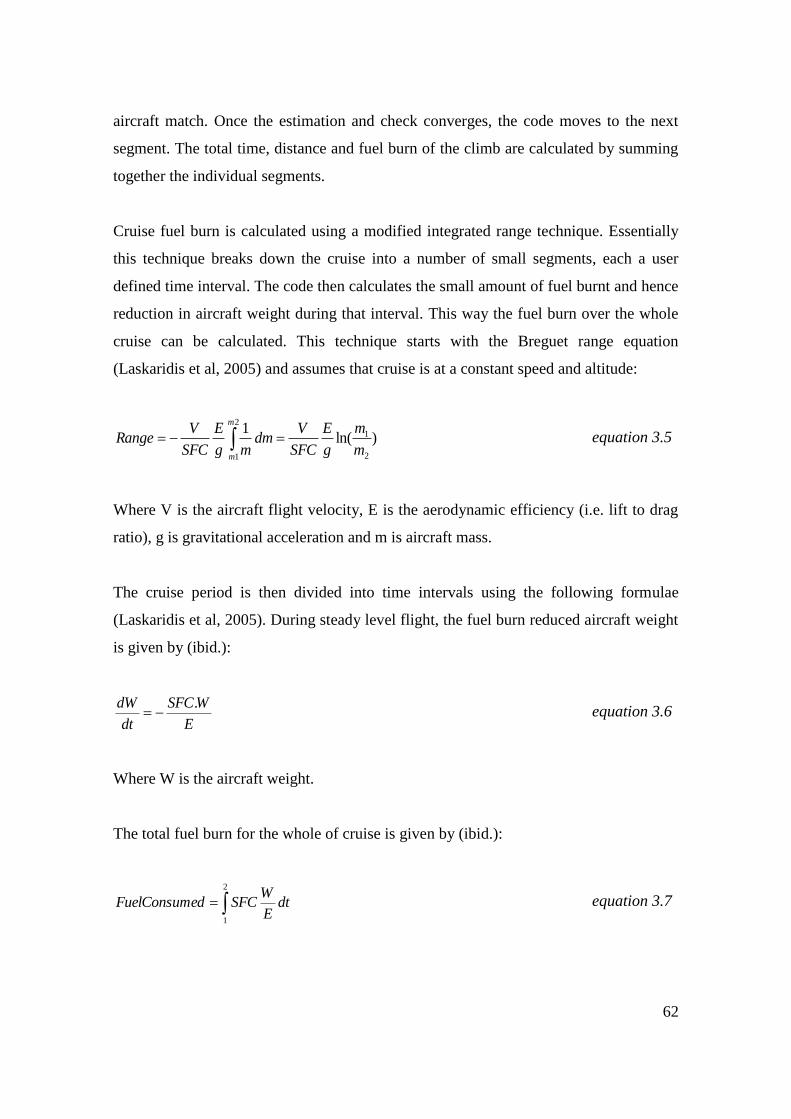
62
aircraft match. Once the estimation and check converges, the code moves to the next
segment. The total time, distance and fuel burn of the climb are calculated by summing
together the individual segments.
Cruise fuel burn is calculated using a modified integrated range technique. Essentially
this technique breaks down the cruise into a number of small segments, each a user
defined time interval. The code then calculates the small amount of fuel burnt and hence
reduction in aircraft weight during that interval. This way the fuel burn over the whole
cruise can be calculated. This technique starts with the Breguet range equation
(Laskaridis et al, 2005) and assumes that cruise is at a constant speed and altitude:
)ln(1
2
1 2
1
m
mm
m
g
E
SFC
Vdm
mg
E
SFC
VRange equation 3.5
Where V is the aircraft flight velocity, E is the aerodynamic efficiency (i.e. lift to drag
ratio), g is gravitational acceleration and m is aircraft mass.
The cruise period is then divided into time intervals using the following formulae
(Laskaridis et al, 2005). During steady level flight, the fuel burn reduced aircraft weight
is given by (ibid.):
E
WSFC
dt
dW . equation 3.6
Where W is the aircraft weight.
The total fuel burn for the whole of cruise is given by (ibid.):
dtE
WSFCedFuelConsum
2
1
equation 3.7
63
When the cruise time intervals are taken into account, the total fuel burn for cruise is
given by (ibid.):
E
ttWSFCedFuelConsum ii
n
i
)(. 1
1
equation 3.8
Descent fuel burn is calculated using a similar process to climb fuel burn. Descent is
split into a number of segments and rate of descent, horizontal distance and time taken
are iterated. The engines are assumed to be idle at these conditions as the aircraft trades
height for flight speed, therefore very low power settings are used in TURBOMATCH.
For holding calculations, where the aircraft may be required to circle in a holding
pattern prior to landing if the airfield is busy, a user inputted holding altitude and
duration is used to calculate the fuel burn. It is assumed that the aircraft flies at a speed
where fuel flow is minimised, i.e. its minimum drag speed. Using this information, the
fuel burn for holding can be calculated straightforwardly.
HERMES then sums the fuel burn, segment duration and ranges of each of the phases to
provide total results for the whole mission.
3.4 Engine Sizing Module - TETHYS
A vital step in the TERA framework is a way to estimate not only the overall size of a
future engine, but also to have some idea as to the internal arrangements including
number of component stages, component hub-tip ratios and internal sizing. This is
required at a preliminary stage because it gives an indication as to the feasibility of a
particular engine; that is whether it might be able to be built or used in the way
intended. Real physical constraints, such as sufficient space under a wing to mount an
engine, or the diameter of engine shaft limit possible engine designs.
Several methods are available that aim to predict the overall size and layout of an
engine, however the author couldn’t find a suitable existing method that could offer a
64
reasonable cross-section of a gas turbine engine using data from a gas turbine
performance code that isn’t based on correlations and doesn’t require several iterations
to check through detailed compressor and turbine aerodynamics to help keep
computational time down.
Sargerser et al’s (1971) method to determine the size and length of aero engines is based
on lightweight Vertical Take-Off and Landing (VTOL) engines that were available or in
development during the 1960’s and 1970’s. As such, many of the correlations may be
out of date (this is discussed in the weight module section) and without any
contemporary information to update the correlations, this method is unsuitable.
Lolis (2014a) created a gas turbine sizing tool as part of the development of ATLAS,
Cranfield University’s weight estimation tool. The method employed offers good
accuracy, with a gas path analysis to size not only the annulus, but also compressor and
turbine stages and blade count. The method employs an iterative process to check
component DeHaller numbers, velocities and pressures and as such requires some
amount of computational time.
The author was searching for a method that would give an overall size of an engine with
an idea of component stage count and critical parameters such as HPC exit hub-tip ratio
that didn’t require an iterative procedure or analysis of the compressor or turbine
aerodynamics. Essentially, a method to give a reasonable prediction of engine size and
layout that gave sufficient information to the other modules that could operate on a
single pass (i.e. without iterations), so that computational time could be kept low for
optimisation purposes.
Accordingly, a preliminary engine sizing and layout model called Tethys was created.
Tethys fills the gap between a correlation based method such as Sargerser et al’s and a
more detailed method such as employed in ATLAS (Lolis 2014a). It is designed to be
able to give an engine size from the outputs of a gas turbine performance code such as
TURBOMATCH, with appropriate assumptions for stage loading and
compressor/turbine stage length. Tethys is useful because it can predict the number of
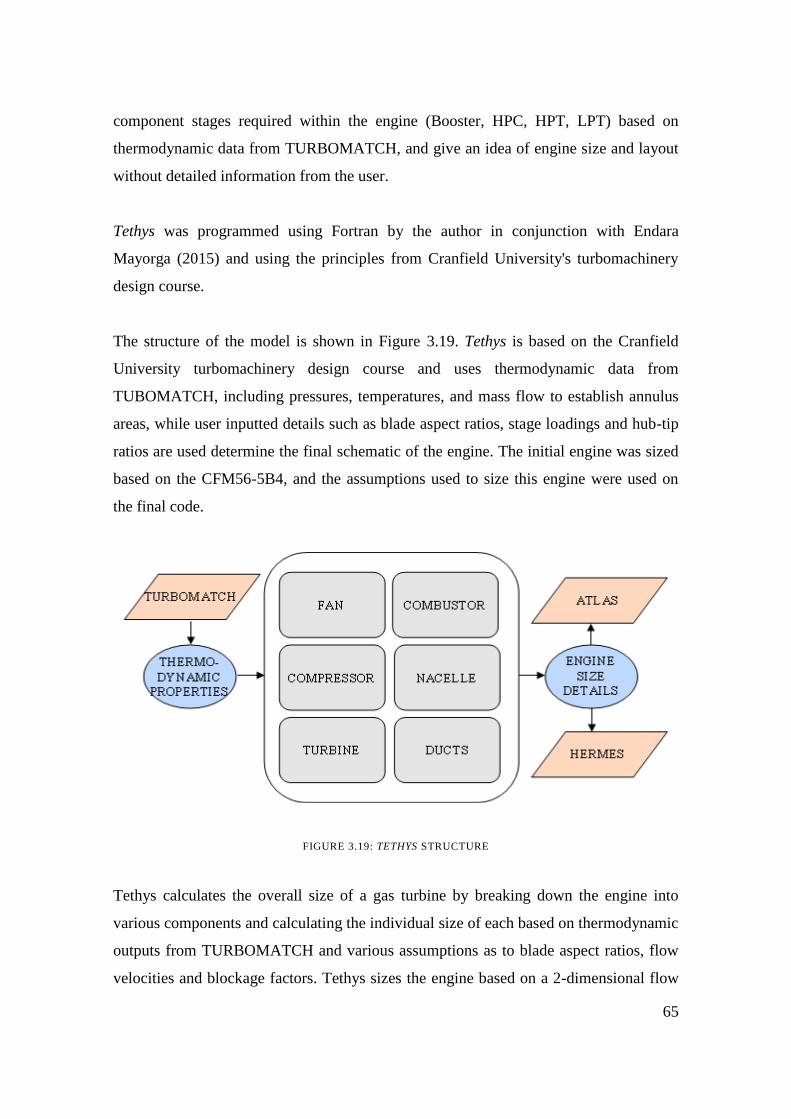
65
component stages required within the engine (Booster, HPC, HPT, LPT) based on
thermodynamic data from TURBOMATCH, and give an idea of engine size and layout
without detailed information from the user.
Tethys was programmed using Fortran by the author in conjunction with Endara
Mayorga (2015) and using the principles from Cranfield University's turbomachinery
design course.
The structure of the model is shown in Figure 3.19. Tethys is based on the Cranfield
University turbomachinery design course and uses thermodynamic data from
TUBOMATCH, including pressures, temperatures, and mass flow to establish annulus
areas, while user inputted details such as blade aspect ratios, stage loadings and hub-tip
ratios are used determine the final schematic of the engine. The initial engine was sized
based on the CFM56-5B4, and the assumptions used to size this engine were used on
the final code.
FIGURE 3.19: TETHYS STRUCTURE
Tethys calculates the overall size of a gas turbine by breaking down the engine into
various components and calculating the individual size of each based on thermodynamic
outputs from TURBOMATCH and various assumptions as to blade aspect ratios, flow
velocities and blockage factors. Tethys sizes the engine based on a 2-dimensional flow

66
using a mean-line. The code assumes steady state flow conditions. Cp and gamma
values stages are calculated according to the methodology in Walsh and Fletcher (2004)
for each stage within each component. The method for sizing each component is given
below.
3.4.1 Fan
The fan stage in Tethys consists of the fan rotor and stator, fan bypass duct and fan core
duct. Currently, Tethys can only calculate a single stage fan (i.e. one rotor and stator).
The first step in calculating the fan size is to determine the annulus area of the fan face.
The absolute diameter of the fan is known and is an input into the program, however the
actual flow area is smaller due to the spinner. The inlet temperature and mass flow are
known from the outputs of TURBOMATCH. An inlet axial velocity is chosen in order
to be able to calculate the fan face Mach number using equation 3.9.
11
2
2
11
aa
a MRMT
V equation 3.9
The values for component axial velocities are left to the user to input via the Tethys
input file. Next, the value for the flow function, Q, is calculated using equation 3.10.
)1(2
)1(
2
2
11
aa M
RMQ equation 3.10
The inlet area can then be calculated using equation 3.11.
PQK
TwA
B **
* equation 3.11
67
The fan exit annulus is then calculated using the same equations, updated with the fan
exit flow conditions from TURBOMATCH and a user input exit flow velocity.
Once the fan inlet and exit annulus areas have been calculated, the fan rotor can be
sized. The inlet diameter of the fan tip is an input into the program and is known, while
the fan outlet tip diameter is a user-defined reduction of the fan inlet tip. The hub
diameters are determined from the tip diameters and the inlet and outlet annulus areas.
The axial length of the fan rotor is determined by a user-input aspect ratio.
Next, the size and positioning of the fan stator is determined. The axial location of the
stator is determined to be two fan blade chord lengths behind the rotor trailing edge.
This value was chosen according to the guidance given in Sargerser et al (1971) for low
noise designs. The length of the stator is calculated using a user input aspect ratio. The
stator tip diameter is already known from the previous fan annulus sizing, while the hub
radius is calculated using the bypass mass flow split and scaling the bypass split area
accordingly.
The final part of the fan stage calculation in Tethys is to determine the location of the
first stage of the core compressor. The axial location of the first core compressor blade
is 0.5 fan blade chord lengths behind the fan blade trailing edge. This value has been
determined based on scaling the CFM56-5B/4 engine schematic from Janes Aero
Engines (Janes, 2011). The tip diameter of the first core compressor blade is determined
by assuming that there is a 10o slope from horizontal from the start of the splitter to the
first core compressor blade tip. This has once again been determined from the schematic
given in Janes (ibid.).
Main assumptions
Several assumptions have been made within the fan component calculation for
simplification of the problem, to speed up computational time and also because of the
limits of outputs from TURBOMATCH. The first major is assumption is that the
pressure ratio along the span of the fan blade is constant. In reality, this will not be the
68
case. The core of the fan blade travels at a slower speed in comparison to the tip, which
would generally result in lower pressure ratios at the core (McKenzie, 1997). This
results in designers changing the shape of the blade, further affecting spanwise pressure
ratio distribution. Ultimately this may mean that there are different flow pressures in the
bypass and core streams, however TURBOMATCH is unable at present to consider this
and therefore unable to be integrated into Tethys at this point.
Continuing with blade spanwise distribution assumptions, the isentropic efficiency and
temperature rise is also considered constant along the blade, which in reality it would
not be, however blading considerations are not considered in Tethys and in addition
they are not required to determine the weight in Sargerser's model.
A further assumption is that for annulus sizing purposes, the fan rotor and stator are
considered as one unit with no space between them, which are then split up later. This
may mean that annulus sizing between the rotor and stator may not be absolutely
accurate, however this approach has been used successfully before in Costi (2012).
Also included within the fan section is the spinner, which sits at the front of the engine.
The spinner has been sized based on the CFM56-5B schematic in Janes (2011) and is
the same for all further engines. For the purposes of this study this approach should be
adequate, as the spinner size does not feature in any performance or weight calculations
in any other models, and is included for the sake of completeness.
3.4.2 Compressors
Tethys assumes that the gas turbine engine is a two-spool engine with two sets of core
compressors. It first calculates the size of the low pressure compressor and then the high
pressure compressor. The user is able to input whether the each set of compressors
mean, rising or falling line.
The first step that Tethys carries out in respect of the compressors is to determine the
number of stages within each compressor set. This is done either by the user inputting
69
the number of stages in the input file, or calculating it based on an estimation of the
stage loading through the set.
Number of Stages Calculation
To calculate the number of stages within the compressor set, the stage loading
coefficient (equation 3.12) for the whole set is calculated based on the total temperature
rise across the whole compressor set (with inputs from TURBOMATCH), with Cp and
mean blade speed calculated for the compressor inlet. This stage loading for the whole
set is then divided by a user determined maximum stage loading to estimate the number
of stages required for the compressor set.
2U
TCpL
equation 3.12
A second approach to estimate the number of stages required was also trialled by the
author which was to divide to the total pressure ratio across the compressor set by a
maximum pressure rise per stage (this approach is also given in Walsh and Fletcher
(2004)), however, this approach fails to take into account differences in spool rotational
speeds and inlet temperatures, while using stage loading it is possible to have some
control on determining the number of stages based on efficiency.
Compressor Sizing
Once the required number of compressor stages has been estimated, Tethys sizes the
first stage of the compressor. The inlet annulus area is sized the same way as for the fan,
with user inputted inlet axial flow velocities required. The first stage of the low pressure
compressor (LPC) is sized using the LPC inlet tip diameter from the fan program and
using the annulus area, the LPC blade diameter can be determined. For the high
pressure compressor (HPC), a user inputted inlet hub-tip ratio is used to size the first
stage.
70
Once the first compressor stage has been sized, the mean blade speed can be determined
by using a user inputted rotational speed (in revolutions per minute, RPM) and using
equation 3.13.
M
M
r
UN
*2 equation 3.13
The next step is to determine the stage outlet annulus area. The total compressor set
temperature rise is known from the outputs of TURBOMATCH, as well as the set
pressure rise once efficiencies have been taken into account. The temperature rise per
stage is calculated by dividing the total set temperature rise by the number of stages,
while the pressure rise per stage is calculated using equation 3.14.
1
1
1
T
TP
Stage
StageStage equation 3.14
The stage polytropic efficiency is calculated by first determining the isentropic pressure
rise for the set using equation 3.14 and calculating TdTCp / using the fully rigorous
approach given in formula F3.28 and F3.29 given in Walsh & Fletcher (2004, p.116-
117). The polytropic efficiency is then calculated using formula F3.43 (ibid, p.118).
1
2lnP
PRdT
T
Cp equation 3.15
A stage outlet axial velocity is assumed (within Tethys, it is assumed to be 99% of the
stage inlet velocity - this figure was determined from experience of lecturers at
Cranfield University and during the sizing of the baseline engine given in Endara
Mayorga (2015)), which is then used to determine the stage outlet Mach number and
hence the stage outlet annulus area, following the methodology from the fan section.
Once the outlet annulus area has been calculated, the stage outlet radial dimensions can
be determined. The user can select whether the compressor set is mean, rising or falling
71
line. Depending on the choice, either the blade mid height, tip or hub is kept constant
from the first stage, meaning the rest of the annulus radial dimensions can be calculated.
This procedure is then looped by the number of stages within the compressor set.
There are two methods in Tethys to determine the axial dimensions within the
compressor. The first is to calculate blade and stator lengths, and separation using user
defined aspect ratios. As the blade heights are calculated during the annulus sizing
operation, the blade and stator lengths can be determined. Typical blade and stator
aspect ratios can be found in Saravanamuttoo et al (2008). The individual axial lengths
can be summed to determine the total compressor length.
The second method to determine axial distances is to input an absolute initial stage
length and subsequent stage length reduction factor. This was implemented in Tethys as
it was found during testing that as compressor pressure ratio was increased, the
reduction in annulus area was causing the compressor length to shrink. Subsequently,
increasing pressure ratio would cause a reduction and size and weight of the engine.
Main Assumptions
As with the fan, several assumptions have been made for the compressor to simplify the
problem and speed up calculation time. The first is that the annulus walls have straight
sides and that there is no curvature in the walls. In real engines, this may not be the
case, however for preliminary sizing purposes this simplification should be reasonable.
The flow is also assumed to be adiabatic (although inefficiencies are determined by the
engine performance module).
A major assumption made within the program is that no assessments are made with
respect to blading, and whether individual rotors are able to give an acceptable DeHaller
number. Tethys calculates the annulus inlet and outlet areas based on a user inputted
axial velocity and output velocity based on the number of stages. The number of
individual stages required within the compressor set is estimated based on the stage
loading of the inlet conditions and the users input of max loading per stage. There is no
72
iterative process within the program to then determine whether the number of stages is
acceptable. This assumption is in place because ultimately Tethys will be used to give
an estimation of the size of a large number of potential engines through an optimiser,
meaning computational time is important. Any potential optimal engine found could
then be taken for further study to determine the final design. Tethys does, however, give
the user an opportunity to input sensible values for inlet axial velocities and also able to
monitor outlet hub-tip ratios so likely unfeasible designs can be discounted. It is
dependent on the user, therefore, to perform a verification exercise prior to using the
program to ensure that sensible values are used.
The blockage factor, KB in equation 3.11, is an empirically derived correction used by
Ramsden et al (2013) to account for the reduction in effective annulus area cause by the
build-up of boundary layer along the annulus walls. The HPC is assumed to have a fully
developed boundary layer so the value is constant, while the value for the LPC
progressively increases. Values can be found in Ramsden et al (2013), Table 1, page
A1.4. In reality, the boundary layer build-up will be dependent on several factors such
as stage loading, pressure ratio, tip clearances and other flow features that cannot be
determined easily at the preliminary stages of engine design.
3.4.3 Turbines
The process for calculating the size of the turbines is similar to that of the compressors.
First, the inlet annulus area is calculated using thermodynamic inputs from the engine
performance code as well as a user defined axial velocity. The blade inlet radii are then
calculated using a hub-tip ratio defined by the user. An estimation of the required
number of stages is then carried out by dividing the stage loading based on inlet
conditions and turbine set exit temperature by a user defined max stage loading.
For the turbines, a slightly different approach is taken to calculate the inter-stage
annulus areas. The Euler equation shown in equation 3.16 is used to calculate the total
whirl of the stage, ΔVW (see Figure 3.20 for nomenclature), and by assuming a 50%
stage reaction and the same blade speeds at inlet and outlet (which are calculated from
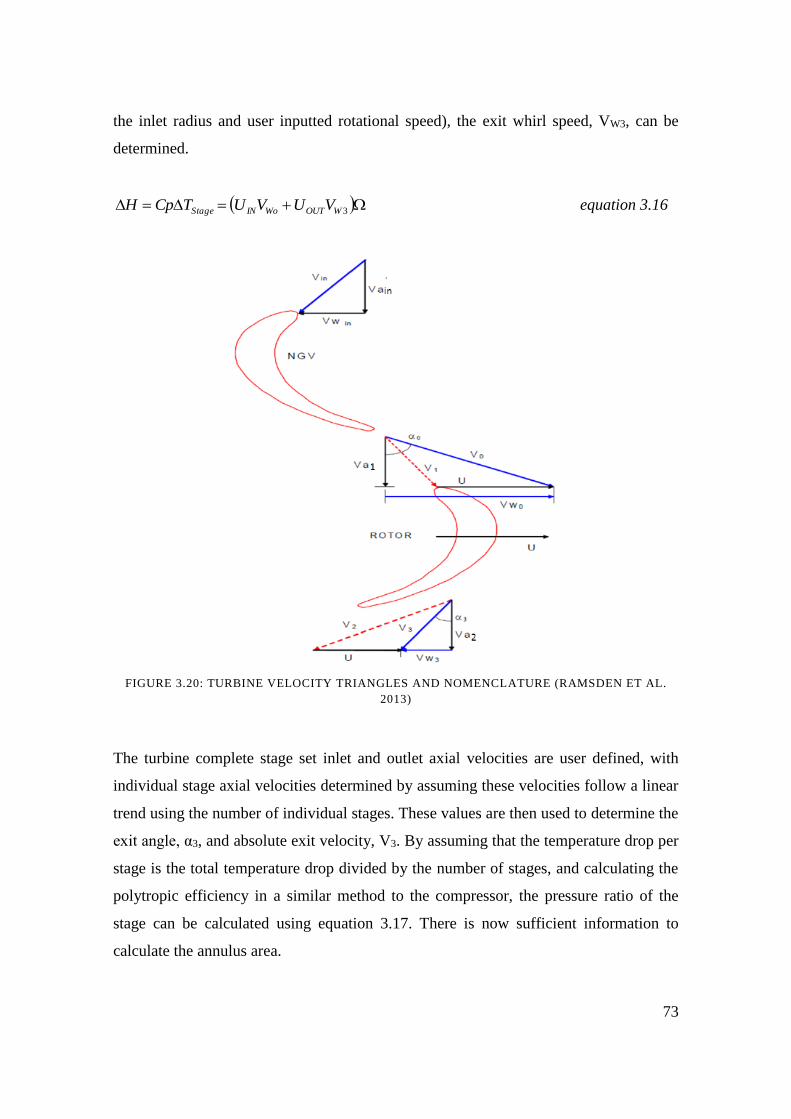
73
the inlet radius and user inputted rotational speed), the exit whirl speed, VW3, can be
determined.
3WOUTWoINStage VUVUTCpH equation 3.16
FIGURE 3.20: TURBINE VELOCITY TRIANGLES AND NOMENCLATURE (RAMSDEN ET AL.
2013)
The turbine complete stage set inlet and outlet axial velocities are user defined, with
individual stage axial velocities determined by assuming these velocities follow a linear
trend using the number of individual stages. These values are then used to determine the
exit angle, α3, and absolute exit velocity, V3. By assuming that the temperature drop per
stage is the total temperature drop divided by the number of stages, and calculating the
polytropic efficiency in a similar method to the compressor, the pressure ratio of the
stage can be calculated using equation 3.17. There is now sufficient information to
calculate the annulus area.
74
)1(
1
instage
stage
T
TPR equation 3.17
The turbine radial dimensions can the be determined by a user inputted mean, rising or
falling line option, the same as for the compressor.
The length of the turbine stages is calculated in the same way as the compressors, with a
choice of either specifying rotor and nozzle guide vane (NGV) aspect ratios, or an
absolute length for the initial stage with an increase factor.
Main Assumptions
As for the compressor, the turbine calculation assumes that the walls are straight and
that the flow is adiabatic. A work done factor, Ω, is used instead of a blockage factor to
take into account the boundary layer buildup. This corrects the specific work done by
the stage and takes into account the non uniform radial profile of the axial velocity,
rather than adjust the annulus area. A user inputted value of Ω, with a default of 0.98
given, is kept constant for all stages. This is because in the turbines, the flow faces a
favourable pressure gradient which helps to keep the boundary layer build-up small
3.4.5 Nacelle
The nacelle is an important part of the design of a modern jet aircraft and engine. The
main design criterion is a streamlined shape to reduce aerodynamic drag. The nacelle
design used in Tethys is based on a long-cowl design with separate exhausts, similar to
that of the CFM56 (Figure 3.21).
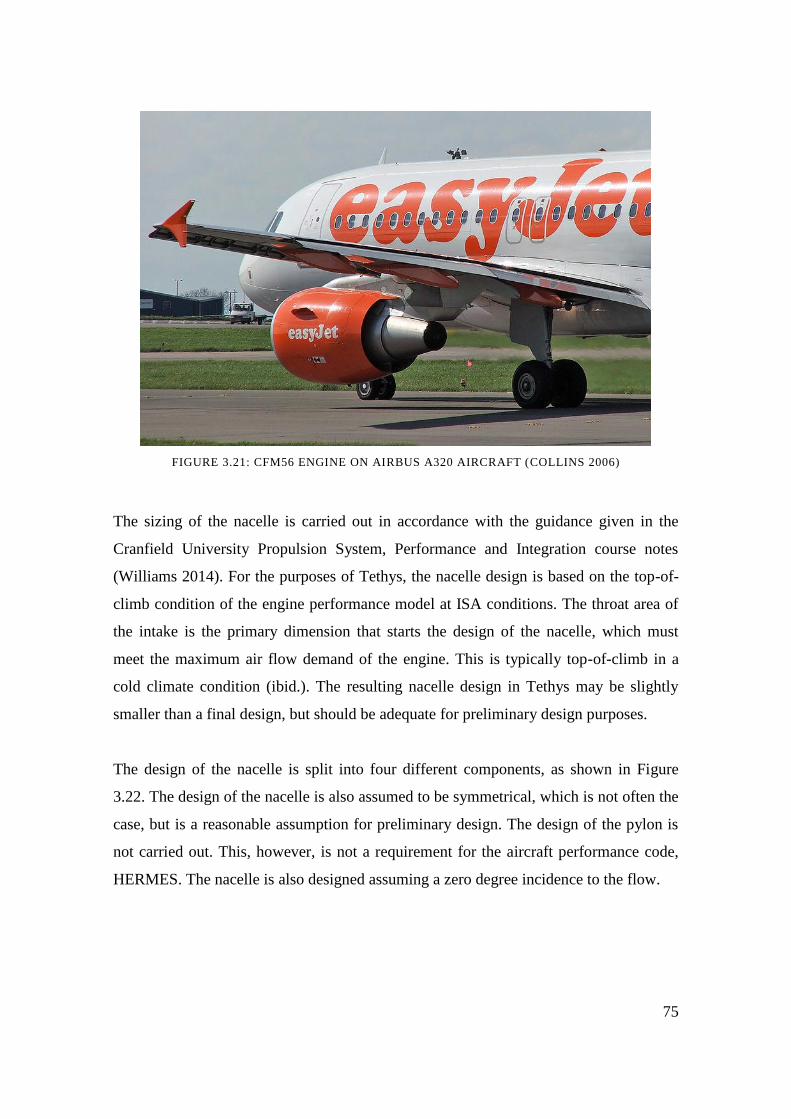
75
FIGURE 3.21: CFM56 ENGINE ON AIRBUS A320 AIRCRAFT (COLLINS 2006)
The sizing of the nacelle is carried out in accordance with the guidance given in the
Cranfield University Propulsion System, Performance and Integration course notes
(Williams 2014). For the purposes of Tethys, the nacelle design is based on the top-of-
climb condition of the engine performance model at ISA conditions. The throat area of
the intake is the primary dimension that starts the design of the nacelle, which must
meet the maximum air flow demand of the engine. This is typically top-of-climb in a
cold climate condition (ibid.). The resulting nacelle design in Tethys may be slightly
smaller than a final design, but should be adequate for preliminary design purposes.
The design of the nacelle is split into four different components, as shown in Figure
3.22. The design of the nacelle is also assumed to be symmetrical, which is not often the
case, but is a reasonable assumption for preliminary design. The design of the pylon is
not carried out. This, however, is not a requirement for the aircraft performance code,
HERMES. The nacelle is also designed assuming a zero degree incidence to the flow.
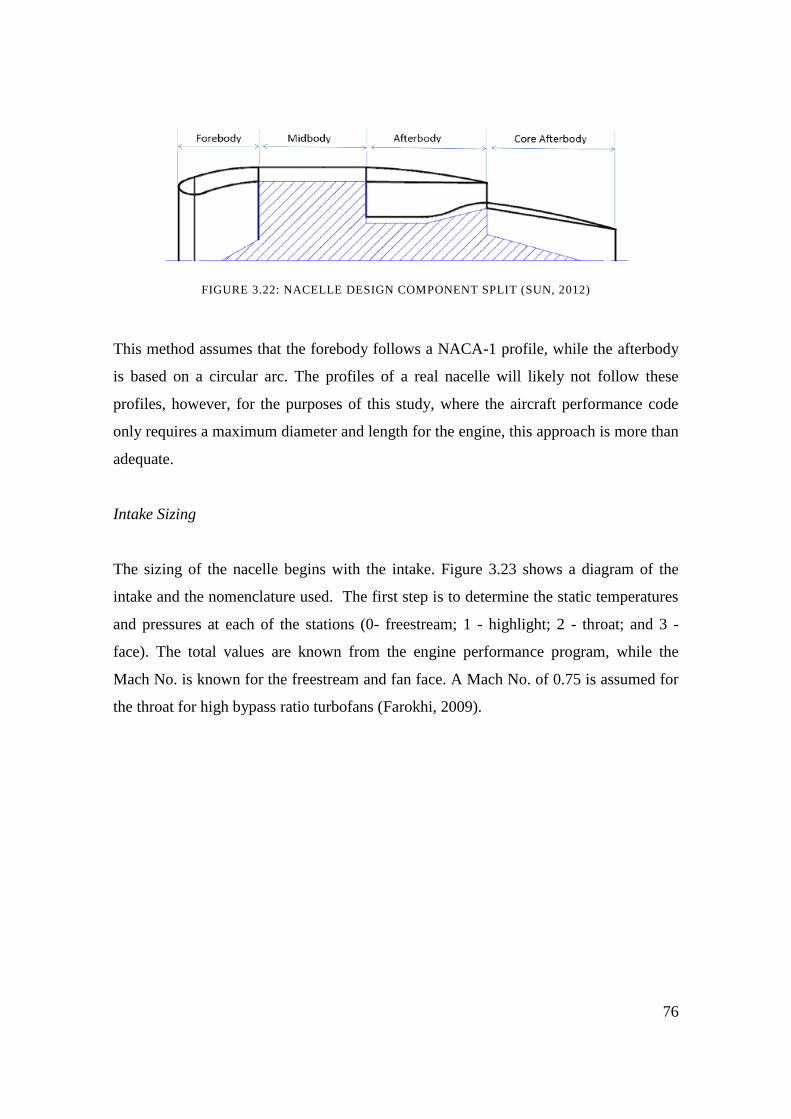
76
FIGURE 3.22: NACELLE DESIGN COMPONENT SPLIT (SUN, 2012)
This method assumes that the forebody follows a NACA-1 profile, while the afterbody
is based on a circular arc. The profiles of a real nacelle will likely not follow these
profiles, however, for the purposes of this study, where the aircraft performance code
only requires a maximum diameter and length for the engine, this approach is more than
adequate.
Intake Sizing
The sizing of the nacelle begins with the intake. Figure 3.23 shows a diagram of the
intake and the nomenclature used. The first step is to determine the static temperatures
and pressures at each of the stations (0- freestream; 1 - highlight; 2 - throat; and 3 -
face). The total values are known from the engine performance program, while the
Mach No. is known for the freestream and fan face. A Mach No. of 0.75 is assumed for
the throat for high bypass ratio turbofans (Farokhi, 2009).
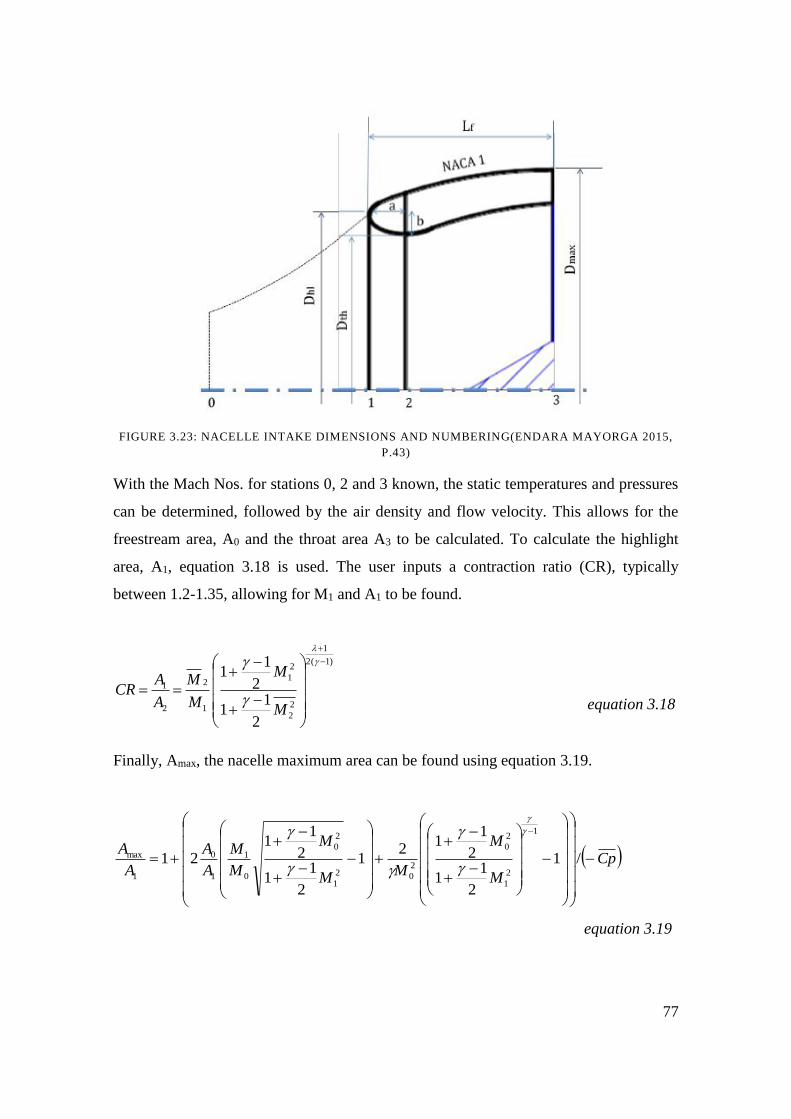
77
FIGURE 3.23: NACELLE INTAKE DIMENSIONS AND NUMBERING(ENDARA MAYORGA 2015,
P.43)
With the Mach Nos. for stations 0, 2 and 3 known, the static temperatures and pressures
can be determined, followed by the air density and flow velocity. This allows for the
freestream area, A0 and the throat area A3 to be calculated. To calculate the highlight
area, A1, equation 3.18 is used. The user inputs a contraction ratio (CR), typically
between 1.2-1.35, allowing for M1 and A1 to be found.
equation 3.18
Finally, Amax, the nacelle maximum area can be found using equation 3.19.
Cp
M
M
MM
M
M
M
A
A
A
A
/1
2
11
2
11
21
2
11
2
11
21
1
2
1
2
0
2
02
1
2
0
0
1
1
0
1
max
equation 3.19
)1(2
1
2
2
2
1
1
2
2
1
2
11
2
11
M
M
M
M
A
ACR
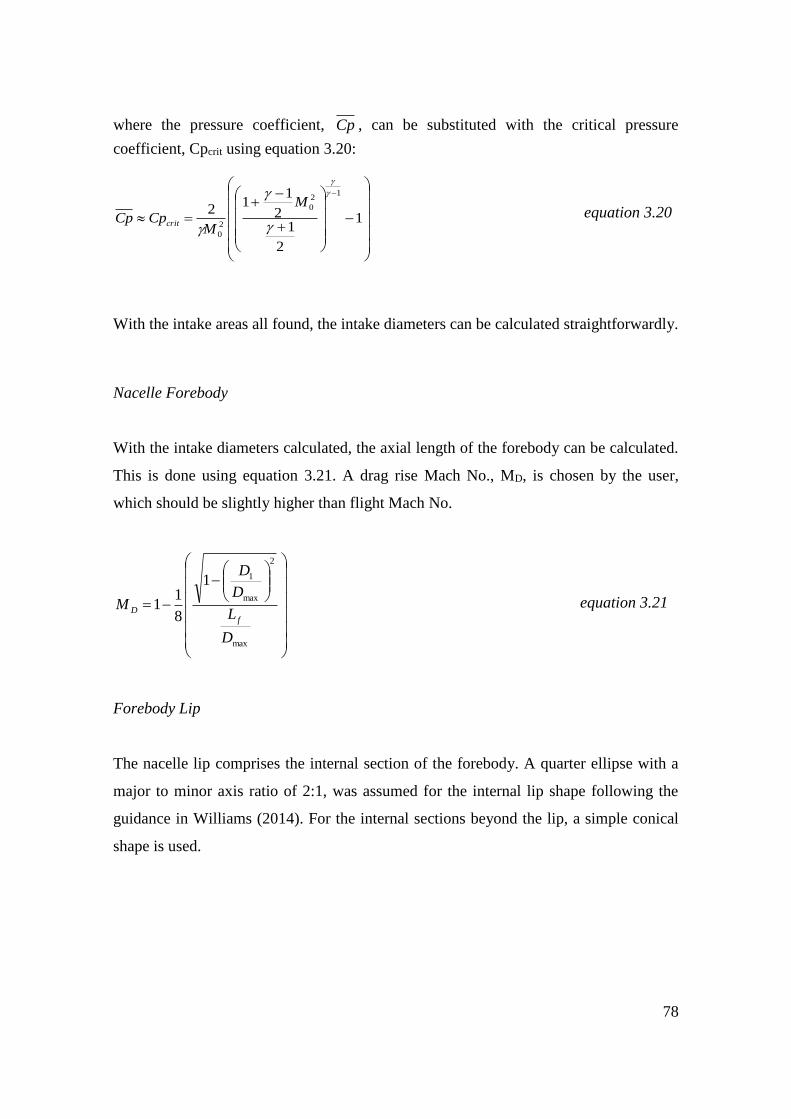
78
where the pressure coefficient, Cp , can be substituted with the critical pressure
coefficient, Cpcrit using equation 3.20:
1
2
12
11
2
12
0
2
0
M
MCpCp crit
equation 3.20
With the intake areas all found, the intake diameters can be calculated straightforwardly.
Nacelle Forebody
With the intake diameters calculated, the axial length of the forebody can be calculated.
This is done using equation 3.21. A drag rise Mach No., MD, is chosen by the user,
which should be slightly higher than flight Mach No.
max
2
max
11
8
11
D
L
D
D
Mf
D equation 3.21
Forebody Lip
The nacelle lip comprises the internal section of the forebody. A quarter ellipse with a
major to minor axis ratio of 2:1, was assumed for the internal lip shape following the
guidance in Williams (2014). For the internal sections beyond the lip, a simple conical
shape is used.
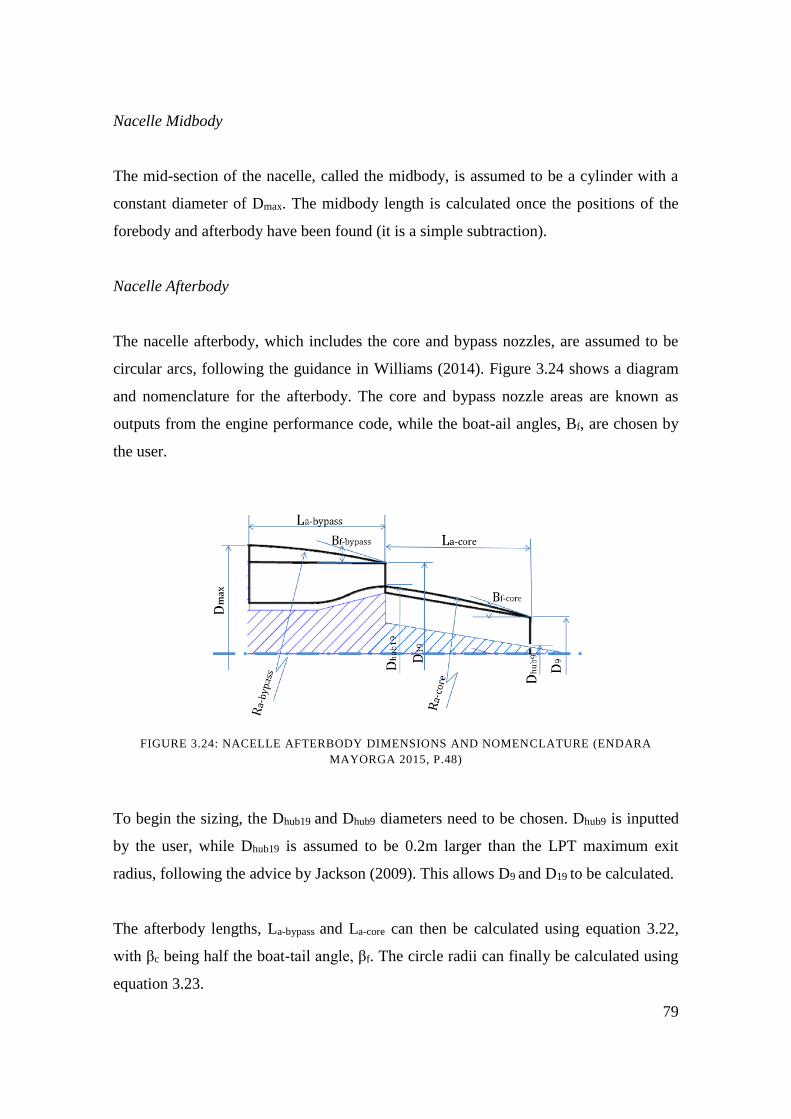
79
Nacelle Midbody
The mid-section of the nacelle, called the midbody, is assumed to be a cylinder with a
constant diameter of Dmax. The midbody length is calculated once the positions of the
forebody and afterbody have been found (it is a simple subtraction).
Nacelle Afterbody
The nacelle afterbody, which includes the core and bypass nozzles, are assumed to be
circular arcs, following the guidance in Williams (2014). Figure 3.24 shows a diagram
and nomenclature for the afterbody. The core and bypass nozzle areas are known as
outputs from the engine performance code, while the boat-ail angles, Bf, are chosen by
the user.
FIGURE 3.24: NACELLE AFTERBODY DIMENSIONS AND NOMENCLATURE (ENDARA
MAYORGA 2015, P.48)
To begin the sizing, the Dhub19 and Dhub9 diameters need to be chosen. Dhub9 is inputted
by the user, while Dhub19 is assumed to be 0.2m larger than the LPT maximum exit
radius, following the advice by Jackson (2009). This allows D9 and D19 to be calculated.
The afterbody lengths, La-bypass and La-core can then be calculated using equation 3.22,
with βc being half the boat-tail angle, βf. The circle radii can finally be calculated using
equation 3.23.
80
a
cL
DD
2tan 9max equation 3.22
f
aa
LR
sin equation 3.23
3.4.6 Ducts
Several inter-component ducts exist within a gas turbine engine, generally to overcome
differences in annulus radii between turbomachinery, which come about as a result of
trying to achieve good performance with differing rotational speeds, pressures and
temperatures. Ducts can be used to accelerate the flow by altering the cross-sectional
annulus area along the flow path, which would also affect the static temperatures and
pressures. Pressure losses from slowing the flow and increasing the static pressure
would ideally be minimised through a low duct angle, but in practice this is a
compromised due to overall weight and sizing concerns (Walsh and Fletcher, 2004).
Ducts are also a source of loss, due to boundary layer build up along the walls and heat
loss through the walls.
Within Tethys, however, the losses are not taken into account. The engine performance
program provides thermodynamic data for each engine section, therefore these factors
will have already been taken into account. There is no feedback loop between Tethys
and the engine performance program, Tethys provides the engine size based on the data
given. The duct inlet and outlet annulus areas and diameters are already calculated from
the components the ducts connect, so all that is required is a determination of duct axial
length.
The axial length of the ducts is determined from the user inputting an absolute value for
duct length. A default value scaled on the CFM56-5B engine schematic in Janes (2011)
is included within Tethys. A suggestion for further improvement to the model would be
to include a duct angle parameter. Duct angle usually has to be limited so that excessive
losses due to turning and slowing down of the flow are minimised, but as discussed
81
earlier, this is often a compromise in real engines due to size and weight constraints
(Walsh and Fletcher, 2004). With the duct angle, entry and exit velocities known and an
assumption that the duct is ‘straight’ (i.e. with no swan necks or reverse flow), the axial
length of the duct could be estimated.
3.4.7 Combustor
The combustor size is not currently calculated in Tethys mainly due to time constraints
of establishing a working model. An absolute value for combustor length is entered by
the user to provide an axial distance between the HPC and HPT. The default value in
Tethys is the same as for the CFM56-5B/4 schematic given in Janes Aero Engines
(2011), while the user can input any other value. According to Sargerser et al (1971)
and Jackson (2009) it is reasonable to assume that combustor length does not play a big
role in determining combustor weight, therefore given the time constraints, the author
did not consider it critical that combustor length was calculated. For the combustor
mean diameter, the mid blade radius of the HPT inlet is used.
In practice, however, the design of the combustor is an important consideration for gas
turbine engines. Combustors have evolved from the first self-contained tubular
combustor ‘cans’, to the tubular-annular design where ducts connect each of the
combustor cans to the modern annular design, which is essentially two concentric rings
of different dimeter producing an enclosed volume for the combustion process.
There are various factors that need to be considered for combustor design and sizing.
The first is combustor height, which is influenced by various factors including the
sufficient space to accommodate the mass flow, the speed of the flow (which is a
compromise between a slow enough flow to reduce hot losses, but not to have a
combustor that is too large and generates boundary layer losses) and sufficient space for
cooling flows. For combustor length, the main factors to consider are sufficient length
for flame stabilisation, mixing and residence time considerations for complete
combustion and NOx emission minimisation (Mellor, 1990).
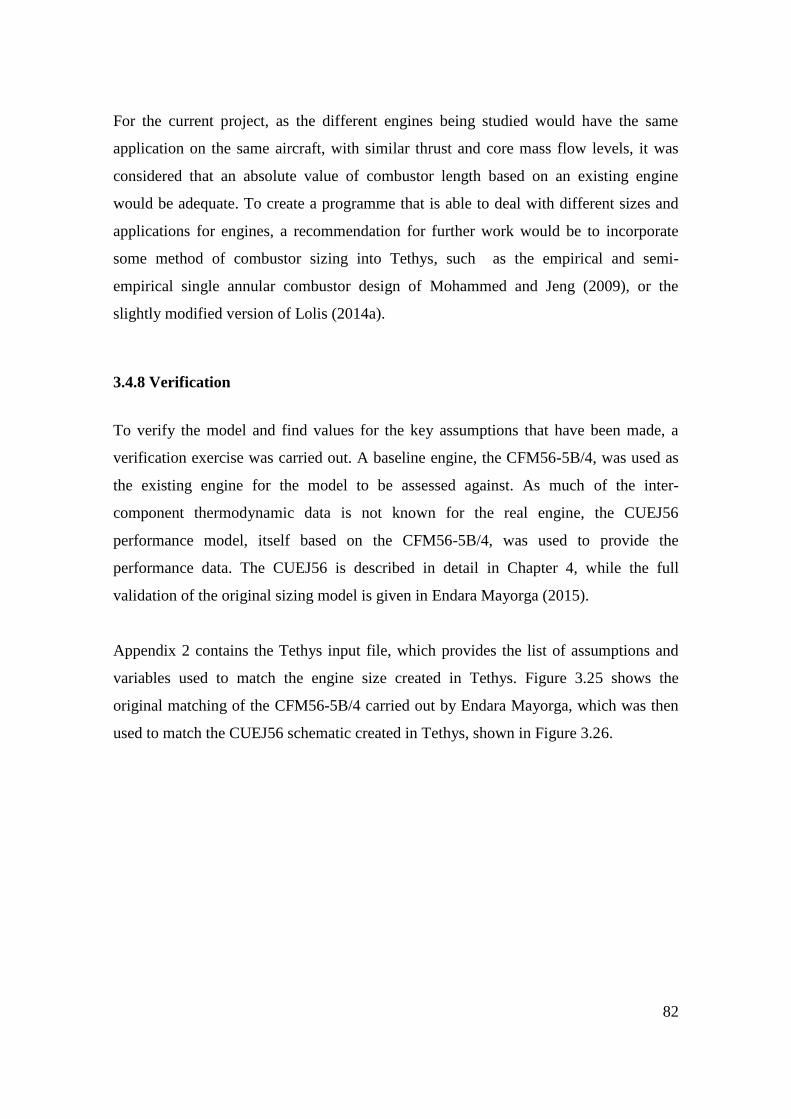
82
For the current project, as the different engines being studied would have the same
application on the same aircraft, with similar thrust and core mass flow levels, it was
considered that an absolute value of combustor length based on an existing engine
would be adequate. To create a programme that is able to deal with different sizes and
applications for engines, a recommendation for further work would be to incorporate
some method of combustor sizing into Tethys, such as the empirical and semi-
empirical single annular combustor design of Mohammed and Jeng (2009), or the
slightly modified version of Lolis (2014a).
3.4.8 Verification
To verify the model and find values for the key assumptions that have been made, a
verification exercise was carried out. A baseline engine, the CFM56-5B/4, was used as
the existing engine for the model to be assessed against. As much of the inter-
component thermodynamic data is not known for the real engine, the CUEJ56
performance model, itself based on the CFM56-5B/4, was used to provide the
performance data. The CUEJ56 is described in detail in Chapter 4, while the full
validation of the original sizing model is given in Endara Mayorga (2015).
Appendix 2 contains the Tethys input file, which provides the list of assumptions and
variables used to match the engine size created in Tethys. Figure 3.25 shows the
original matching of the CFM56-5B/4 carried out by Endara Mayorga, which was then
used to match the CUEJ56 schematic created in Tethys, shown in Figure 3.26.
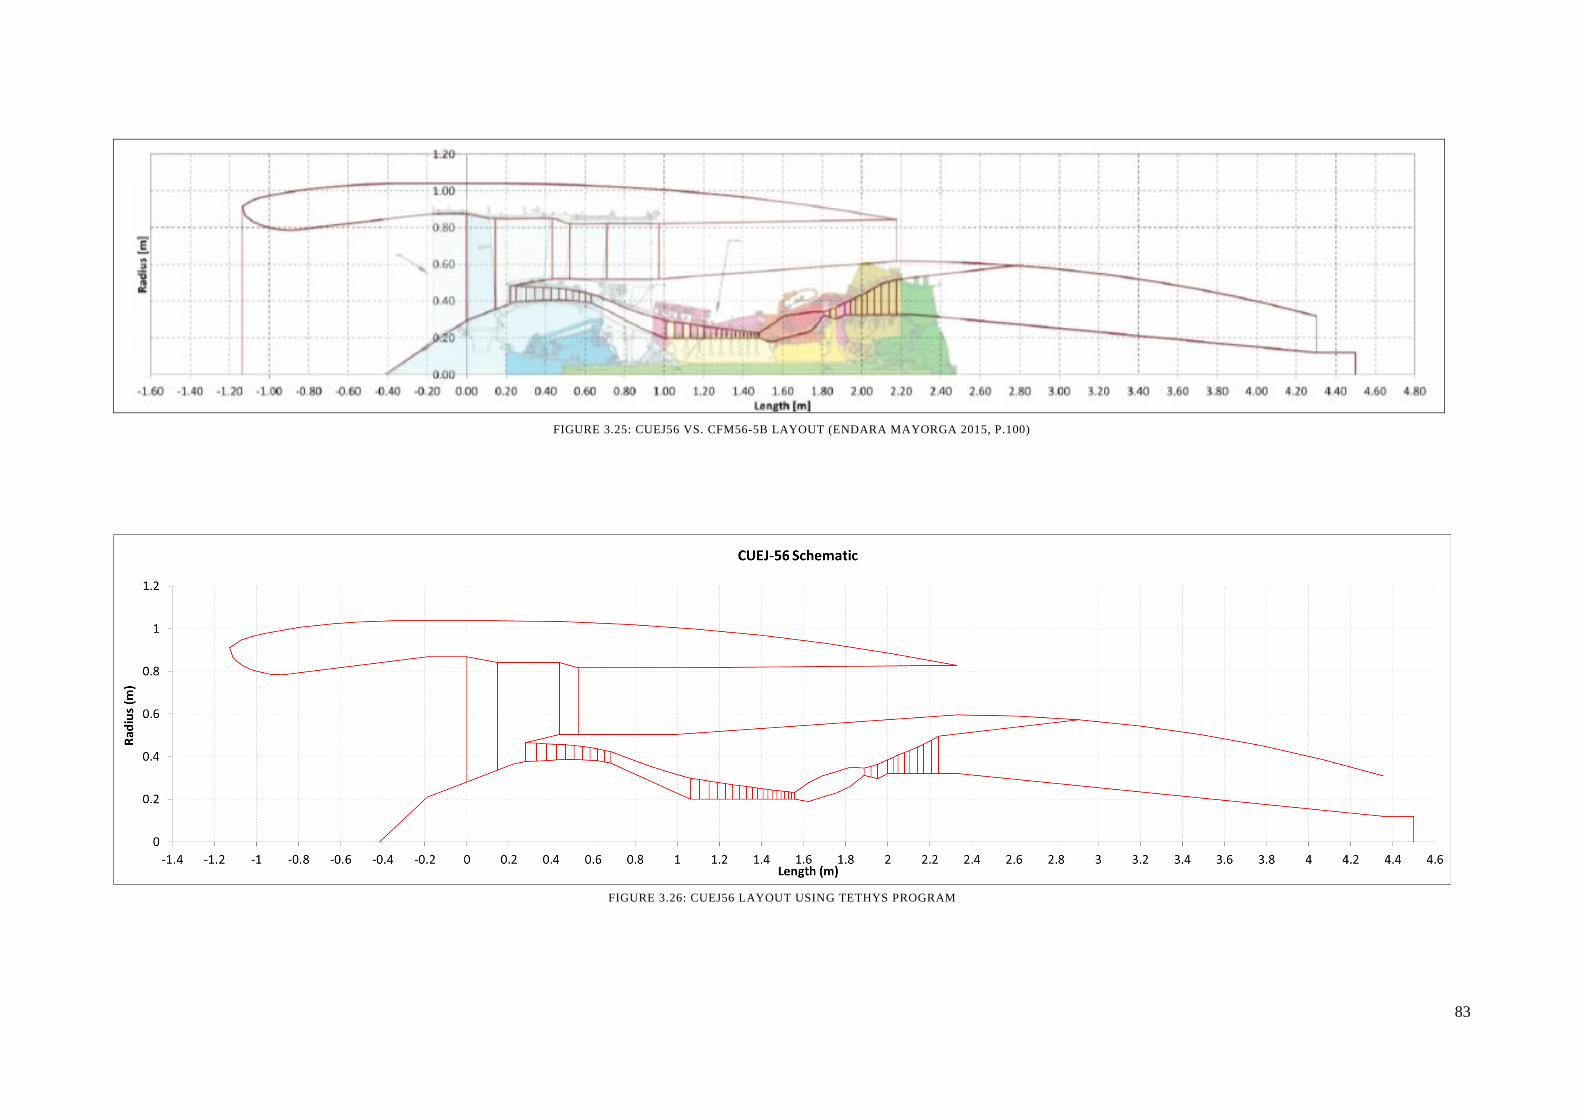
83
FIGURE 3.25: CUEJ56 VS. CFM56-5B LAYOUT (ENDARA MAYORGA 2015, P.100)
FIGURE 3.26: CUEJ56 LAYOUT USING TETHYS PROGRAM
84
3.4.9 Model Limitations and Potential Improvements
Tethys is a program that has been designed to predict the size and layout of a turbofan
engine based on component performance data from an engine performance code
combined with user defined variables and assumptions. The code has been designed to
give a quick solution over a first pass (i.e. with no iterations) and as such requires the
user to have some knowledge of gas turbine sizing to make reasonable assumptions.
Several improvements could be made to the code to improve the functionality, for
which there was not sufficient time to implement. These are to include a gearbox sizing
module, duct and combustor size modules, and a multi-stage fan module. Over the
longer term, a propeller or open rotor module could also be included.
3.5 Weight Estimation Module
Weight estimation is an important part of assessing the viability of a future powerplant.
An uninstalled powerplant may give a good SFC, however, once it is installed on an
aircraft, its weight could mean that the overall fuel burn may be worse than a lighter
engine with a worse SFC. A model that is able to provide an estimation of weight from
engine performance characteristics is therefore required.
A number of different models and techniques for engine weight prediction have been
developed over the years and can be split into two broad categories: whole engine based
methods and component based methods.
Whole engine based methods primarily estimate the weight of an engine using a few
easily obtainable variables, such as thrust or fan size and use statistical correlations from
a database of engines to link those variables into an estimation of the overall engine
weight (Lolis et al, 2014). The main advantages of this type of method are that they can
provide a very quick estimation of engine weight with very few variables. This means
that they are suitable at the very first stages of engine and/or aircraft development,
where a broad picture of the problem is required.
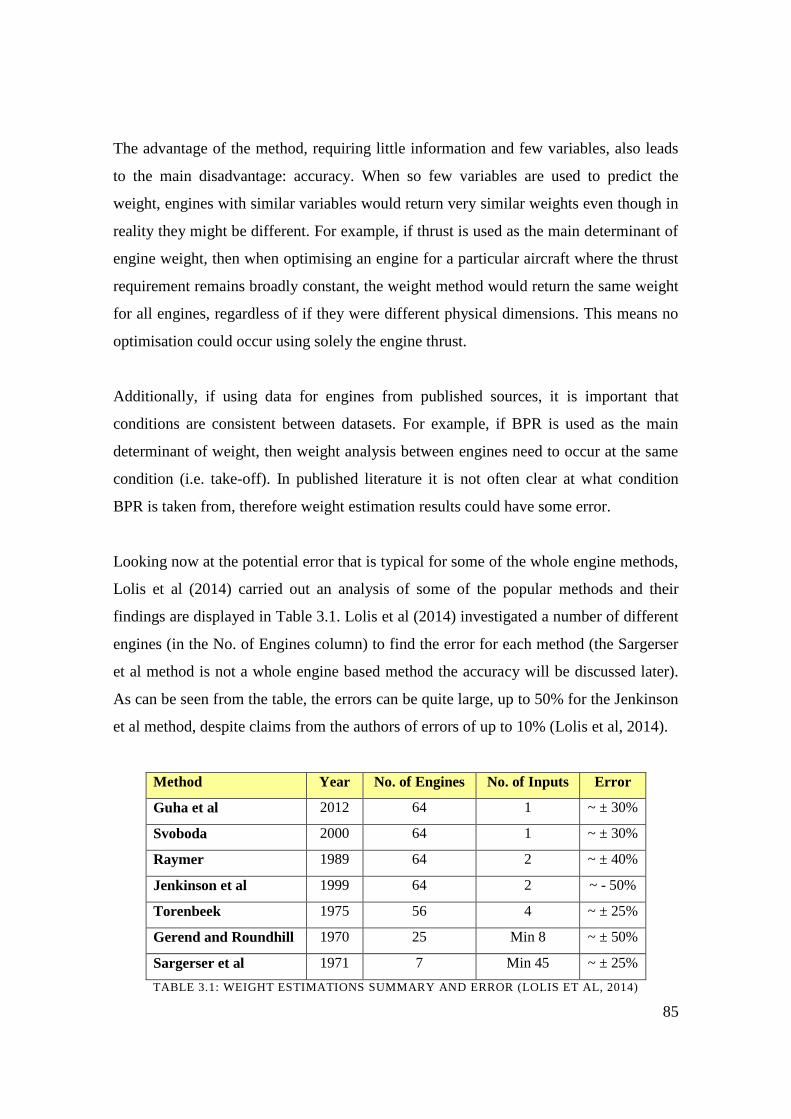
85
The advantage of the method, requiring little information and few variables, also leads
to the main disadvantage: accuracy. When so few variables are used to predict the
weight, engines with similar variables would return very similar weights even though in
reality they might be different. For example, if thrust is used as the main determinant of
engine weight, then when optimising an engine for a particular aircraft where the thrust
requirement remains broadly constant, the weight method would return the same weight
for all engines, regardless of if they were different physical dimensions. This means no
optimisation could occur using solely the engine thrust.
Additionally, if using data for engines from published sources, it is important that
conditions are consistent between datasets. For example, if BPR is used as the main
determinant of weight, then weight analysis between engines need to occur at the same
condition (i.e. take-off). In published literature it is not often clear at what condition
BPR is taken from, therefore weight estimation results could have some error.
Looking now at the potential error that is typical for some of the whole engine methods,
Lolis et al (2014) carried out an analysis of some of the popular methods and their
findings are displayed in Table 3.1. Lolis et al (2014) investigated a number of different
engines (in the No. of Engines column) to find the error for each method (the Sargerser
et al method is not a whole engine based method the accuracy will be discussed later).
As can be seen from the table, the errors can be quite large, up to 50% for the Jenkinson
et al method, despite claims from the authors of errors of up to 10% (Lolis et al, 2014).
Method Year No. of Engines No. of Inputs Error
Guha et al 2012 64 1 ~ ± 30%
Svoboda 2000 64 1 ~ ± 30%
Raymer 1989 64 2 ~ ± 40%
Jenkinson et al 1999 64 2 ~ - 50%
Torenbeek 1975 56 4 ~ ± 25%
Gerend and Roundhill 1970 25 Min 8 ~ ± 50%
Sargerser et al 1971 7 Min 45 ~ ± 25%
TABLE 3.1: WEIGHT ESTIMATIONS SUMMARY AND ERROR (LOLIS ET AL, 2014)
86
Accordingly, to achieve lower levels of error, a different method of weight estimation, a
component based method, may be more suitable, particularly for the type of work in this
project where having a greater degree of accuracy is important.
Component based weight estimation methods may offer greater accuracy than whole
engine methods due to the greater quantity of information and variables required. As the
name implies, component based methods estimate the individual weights of the main
components of the engine and sum them together to give the total engine weight.
Despite offering greater accuracy, these methods are more complex, requiring additional
information that might be difficult to obtain (such as compressor diameters and lengths)
and require greater computational time to calculate.
One of the early component based methods was developed by Sargerser et al (1971),
who investigated Vertical Take-Off and Landing (VTOL) engines and developed
correlations to estimate the size and weight of these engines, as well as ‘cruise’ engines
(i.e. jet engines designed for passenger aircraft), with certain limitations (the method
generally estimates these engines to be light). Sargerser et al developed correlations for
the main components of the engine, including fan & fan duct, compressor, combustor,
turbine, accessories and the main structure, while neglecting ducts and support struts.
Simple sizing parameters, such as length and diameter of the turbomachinery, as well as
some basic thermodynamic cycle parameters were used to create the correlations, while
different proportionality factors were used to differentiate between lightweight VTOL
and heavier cruise engines, reflecting the different materials used. While Sargerser et al
claimed an accuracy of ±10% for the weight estimation; they also stated that this could
increase over time with new materials. This was found by Lolis et al (2014) and
reflected in Table 3.1, with the error increasing accordingly. Jackson (2009) revisited
Sargerser et al’s correlations and thought that they were still the best correlations to use
for preliminary design, and updated some proportionality factors to improve the
accuracy.
87
Another component based tool is WATE (Weight Analysis of Turbine Engines)
developed by Pera et al (1977) at Boeing for NASA and has a reported accuracy of 5-
10%, confirmed by Lolis et al (2014). WATE is designed for use at a preliminary design
stage, but requires more information than Sargerser et al’s method. In addition to the
basic sizing parameters, the code also requires material characteristics and structural
loading information such as stress levels, shaft mechanical speed and material
temperatures.
The search for better accuracy inevitably leads to more complex methods being created.
Cranfield University is developing its own weight code called ATLAS, which is
designed to have the accuracy of WATE with the ability to estimate the weight of novel
engine configurations (Lolis 2014a)
For this project it was decided to use Jackson’s (2009) updated version of Sargerser et
al’s (1971) component based method. The reason for this was because it offers a good
balance of accuracy and complexity. Material information and stress levels which can
be difficult to get hold of are not required and ATLAS was not yet available during the
project period. Jackson’s updates have helped improve the accuracy of the method. To
update the method, Jackson re-evaluated Sargerser et al’s original method using modern
engines – a Rolls-Royce Trent 892 for large engines and a IAE V2500 for smaller
engines. In this way he was able to provide new scaling coefficients for the core of the
engine to match weights more accurately. Jackson also provided a method for
calculating the weight of the engine nacelle. The methodology is described below.
3.5.1 Sargerser et al's Weight Estimation Method with Jackson’s Updates
Fan
The equations for the fan are for a typical arrangement of a single rotor with
downstream stator. The weight comprises the rotor and stator blades, support structure,
casing and the front spinner. Two options for the equation are provided by Sargerser et
al, with the standard equation being used and shown below. The second option also
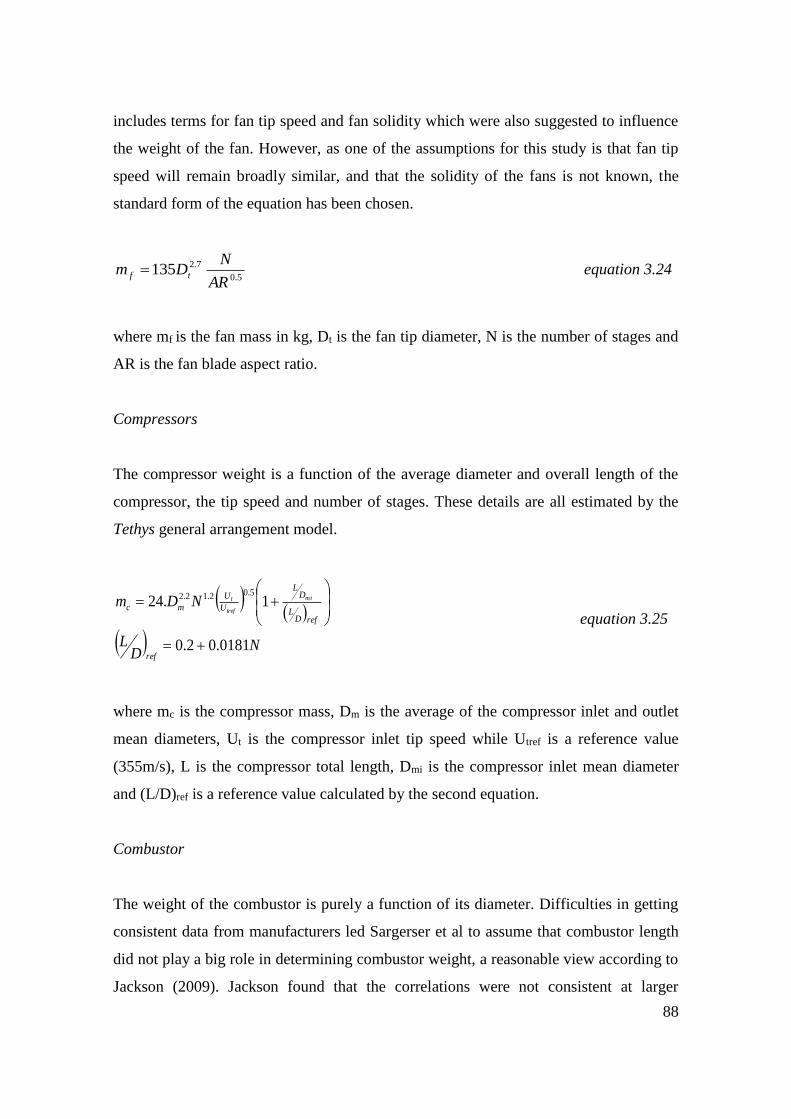
88
includes terms for fan tip speed and fan solidity which were also suggested to influence
the weight of the fan. However, as one of the assumptions for this study is that fan tip
speed will remain broadly similar, and that the solidity of the fans is not known, the
standard form of the equation has been chosen.
5.0
7.2135AR
NDm tf equation 3.24
where mf is the fan mass in kg, Dt is the fan tip diameter, N is the number of stages and
AR is the fan blade aspect ratio.
Compressors
The compressor weight is a function of the average diameter and overall length of the
compressor, the tip speed and number of stages. These details are all estimated by the
Tethys general arrangement model.
ND
L
NDm
ref
refDL
DL
U
U
mcmi
tref
t
0181.02.0
1.245.02.12.2
equation 3.25
where mc is the compressor mass, Dm is the average of the compressor inlet and outlet
mean diameters, Ut is the compressor inlet tip speed while Utref is a reference value
(355m/s), L is the compressor total length, Dmi is the compressor inlet mean diameter
and (L/D)ref is a reference value calculated by the second equation.
Combustor
The weight of the combustor is purely a function of its diameter. Difficulties in getting
consistent data from manufacturers led Sargerser et al to assume that combustor length
did not play a big role in determining combustor weight, a reasonable view according to
Jackson (2009). Jackson found that the correlations were not consistent at larger
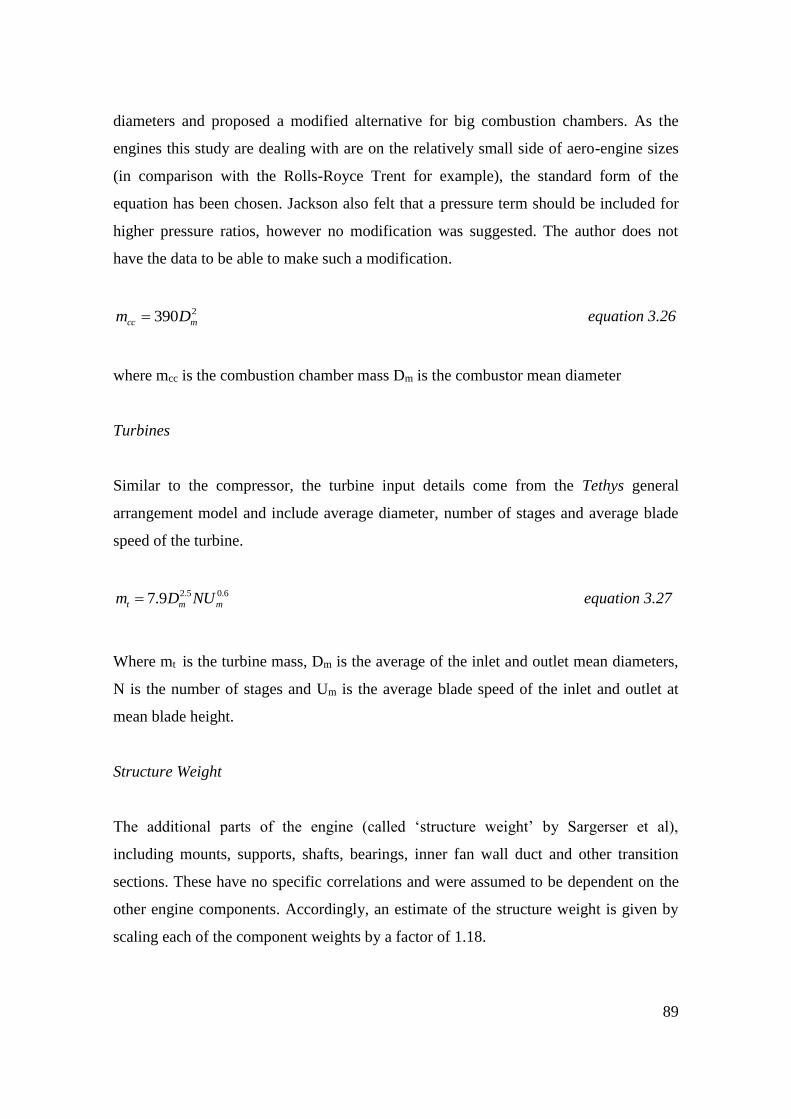
89
diameters and proposed a modified alternative for big combustion chambers. As the
engines this study are dealing with are on the relatively small side of aero-engine sizes
(in comparison with the Rolls-Royce Trent for example), the standard form of the
equation has been chosen. Jackson also felt that a pressure term should be included for
higher pressure ratios, however no modification was suggested. The author does not
have the data to be able to make such a modification.
2390 mcc Dm equation 3.26
where mcc is the combustion chamber mass Dm is the combustor mean diameter
Turbines
Similar to the compressor, the turbine input details come from the Tethys general
arrangement model and include average diameter, number of stages and average blade
speed of the turbine.
6.05.29.7 mmt NUDm equation 3.27
Where mt is the turbine mass, Dm is the average of the inlet and outlet mean diameters,
N is the number of stages and Um is the average blade speed of the inlet and outlet at
mean blade height.
Structure Weight
The additional parts of the engine (called ‘structure weight’ by Sargerser et al),
including mounts, supports, shafts, bearings, inner fan wall duct and other transition
sections. These have no specific correlations and were assumed to be dependent on the
other engine components. Accordingly, an estimate of the structure weight is given by
scaling each of the component weights by a factor of 1.18.
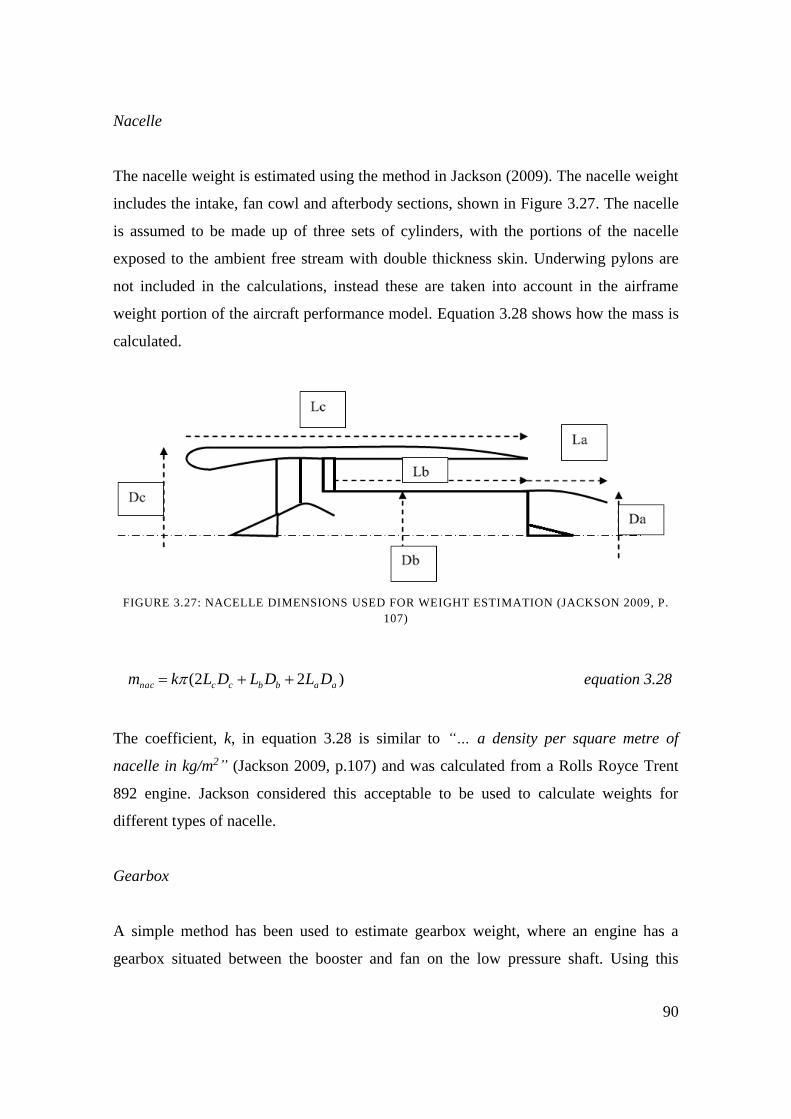
90
Nacelle
The nacelle weight is estimated using the method in Jackson (2009). The nacelle weight
includes the intake, fan cowl and afterbody sections, shown in Figure 3.27. The nacelle
is assumed to be made up of three sets of cylinders, with the portions of the nacelle
exposed to the ambient free stream with double thickness skin. Underwing pylons are
not included in the calculations, instead these are taken into account in the airframe
weight portion of the aircraft performance model. Equation 3.28 shows how the mass is
calculated.
FIGURE 3.27: NACELLE DIMENSIONS USED FOR WEIGHT ESTIMATION (JACKSON 2009, P.
107)
)22( aabbccnac DLDLDLkm equation 3.28
The coefficient, k, in equation 3.28 is similar to “… a density per square metre of
nacelle in kg/m2” (Jackson 2009, p.107) and was calculated from a Rolls Royce Trent
892 engine. Jackson considered this acceptable to be used to calculate weights for
different types of nacelle.
Gearbox
A simple method has been used to estimate gearbox weight, where an engine has a
gearbox situated between the booster and fan on the low pressure shaft. Using this
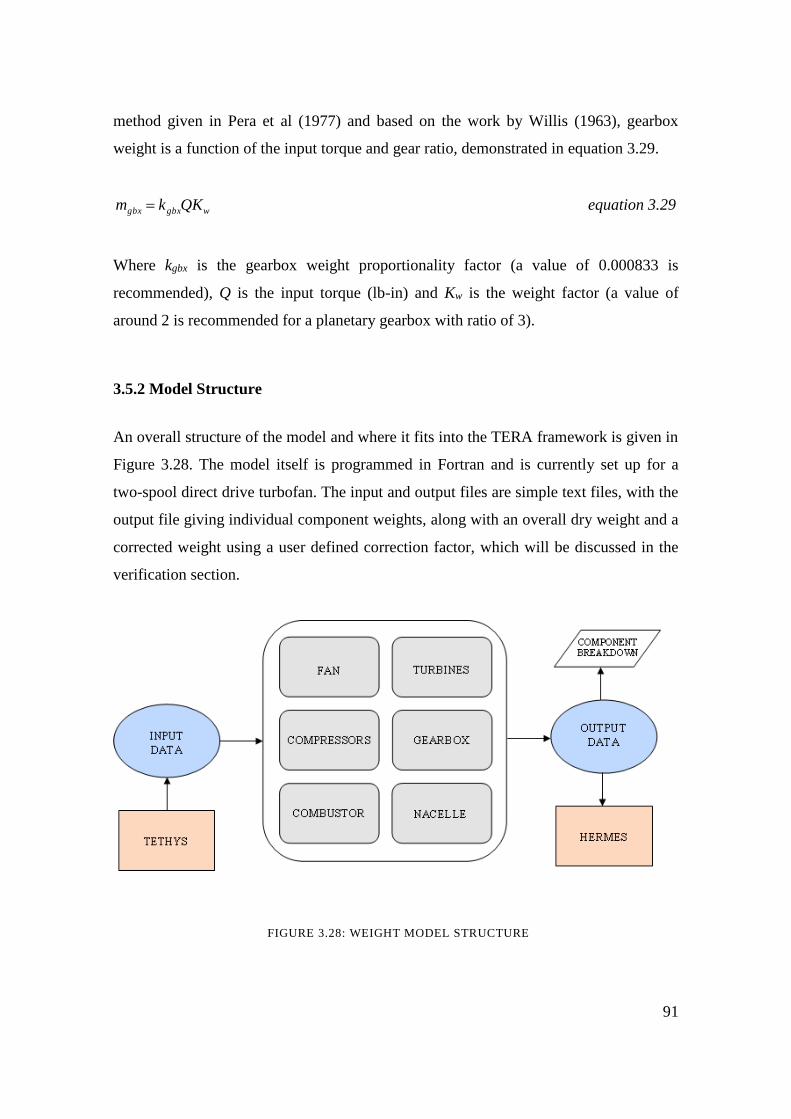
91
method given in Pera et al (1977) and based on the work by Willis (1963), gearbox
weight is a function of the input torque and gear ratio, demonstrated in equation 3.29.
wgbxgbx QKkm equation 3.29
Where kgbx is the gearbox weight proportionality factor (a value of 0.000833 is
recommended), Q is the input torque (lb-in) and Kw is the weight factor (a value of
around 2 is recommended for a planetary gearbox with ratio of 3).
3.5.2 Model Structure
An overall structure of the model and where it fits into the TERA framework is given in
Figure 3.28. The model itself is programmed in Fortran and is currently set up for a
two-spool direct drive turbofan. The input and output files are simple text files, with the
output file giving individual component weights, along with an overall dry weight and a
corrected weight using a user defined correction factor, which will be discussed in the
verification section.
FIGURE 3.28: WEIGHT MODEL STRUCTURE
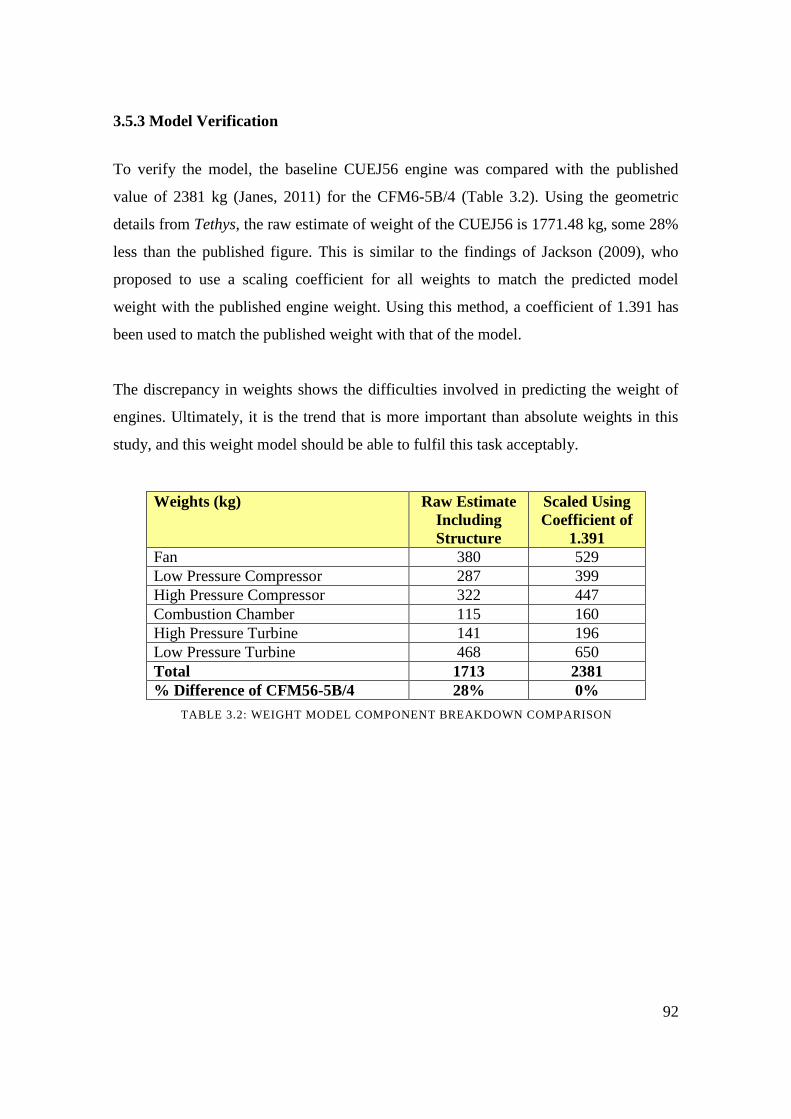
92
3.5.3 Model Verification
To verify the model, the baseline CUEJ56 engine was compared with the published
value of 2381 kg (Janes, 2011) for the CFM6-5B/4 (Table 3.2). Using the geometric
details from Tethys, the raw estimate of weight of the CUEJ56 is 1771.48 kg, some 28%
less than the published figure. This is similar to the findings of Jackson (2009), who
proposed to use a scaling coefficient for all weights to match the predicted model
weight with the published engine weight. Using this method, a coefficient of 1.391 has
been used to match the published weight with that of the model.
The discrepancy in weights shows the difficulties involved in predicting the weight of
engines. Ultimately, it is the trend that is more important than absolute weights in this
study, and this weight model should be able to fulfil this task acceptably.
Weights (kg) Raw Estimate
Including
Structure
Scaled Using
Coefficient of
1.391
Fan 380 529
Low Pressure Compressor 287 399
High Pressure Compressor 322 447
Combustion Chamber 115 160
High Pressure Turbine 141 196
Low Pressure Turbine 468 650
Total 1713 2381
% Difference of CFM56-5B/4 28% 0%
TABLE 3.2: WEIGHT MODEL COMPONENT BREAKDOWN COMPARISON
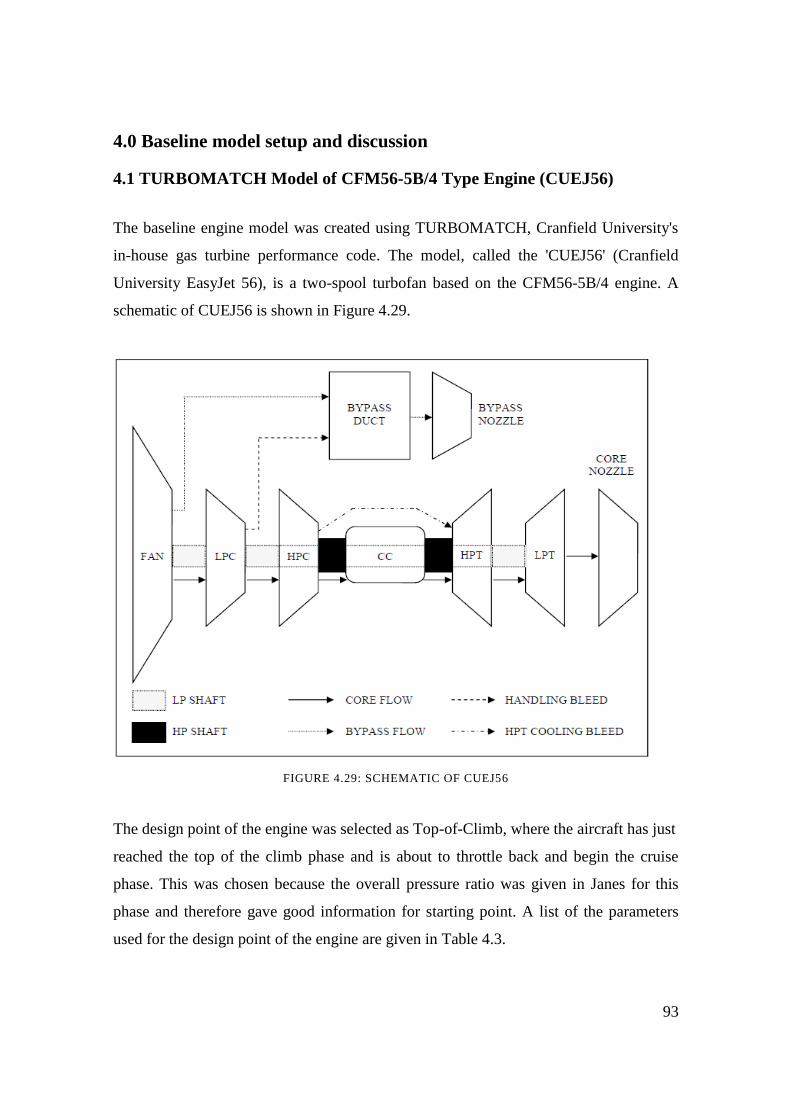
93
4.0 Baseline model setup and discussion
4.1 TURBOMATCH Model of CFM56-5B/4 Type Engine (CUEJ56)
The baseline engine model was created using TURBOMATCH, Cranfield University's
in-house gas turbine performance code. The model, called the 'CUEJ56' (Cranfield
University EasyJet 56), is a two-spool turbofan based on the CFM56-5B/4 engine. A
schematic of CUEJ56 is shown in Figure 4.29.
FIGURE 4.29: SCHEMATIC OF CUEJ56
The design point of the engine was selected as Top-of-Climb, where the aircraft has just
reached the top of the climb phase and is about to throttle back and begin the cruise
phase. This was chosen because the overall pressure ratio was given in Janes for this
phase and therefore gave good information for starting point. A list of the parameters
used for the design point of the engine are given in Table 4.3.
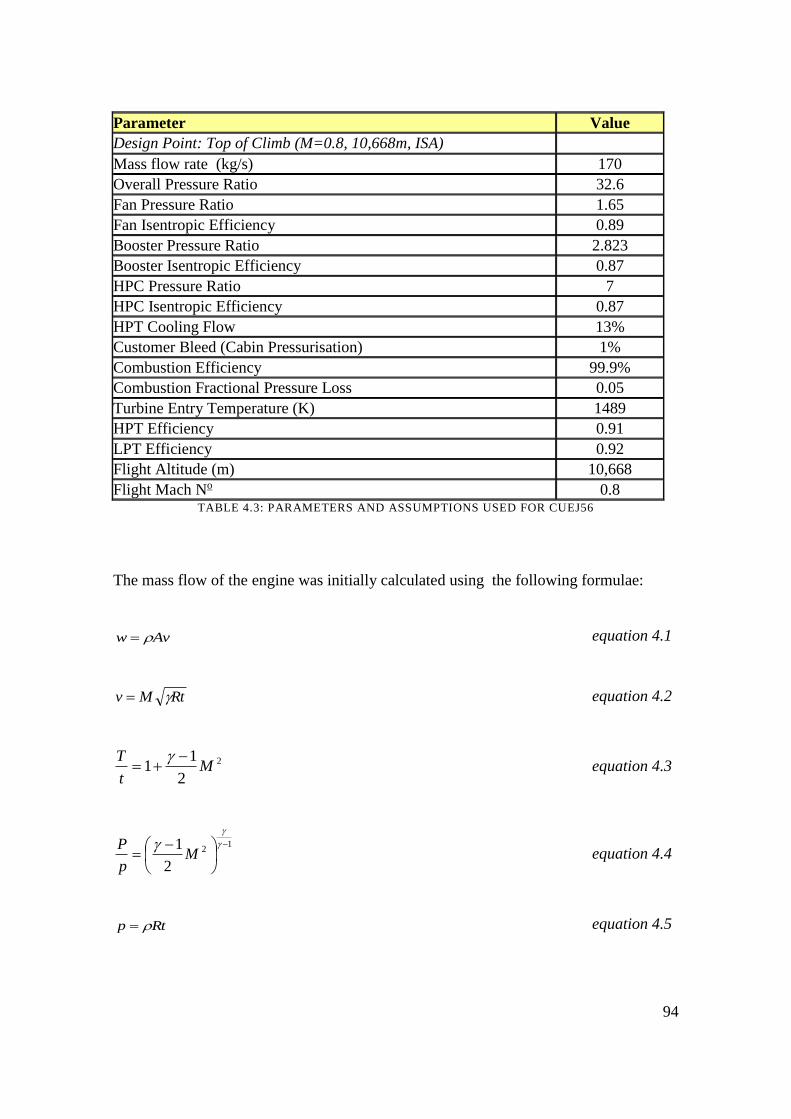
94
Parameter Value
Design Point: Top of Climb (M=0.8, 10,668m, ISA)
Mass flow rate (kg/s) 170
Overall Pressure Ratio 32.6
Fan Pressure Ratio 1.65
Fan Isentropic Efficiency 0.89
Booster Pressure Ratio 2.823
Booster Isentropic Efficiency 0.87
HPC Pressure Ratio 7
HPC Isentropic Efficiency 0.87
HPT Cooling Flow 13%
Customer Bleed (Cabin Pressurisation) 1%
Combustion Efficiency 99.9%
Combustion Fractional Pressure Loss 0.05
Turbine Entry Temperature (K) 1489
HPT Efficiency 0.91
LPT Efficiency 0.92
Flight Altitude (m) 10,668
Flight Mach No 0.8 TABLE 4.3: PARAMETERS AND ASSUMPTIONS USED FOR CUEJ56
The mass flow of the engine was initially calculated using the following formulae:
Avw equation 4.1
RtMv equation 4.2
2
2
11 M
t
T
equation 4.3
12
2
1
M
p
P equation 4.4
Rtp equation 4.5
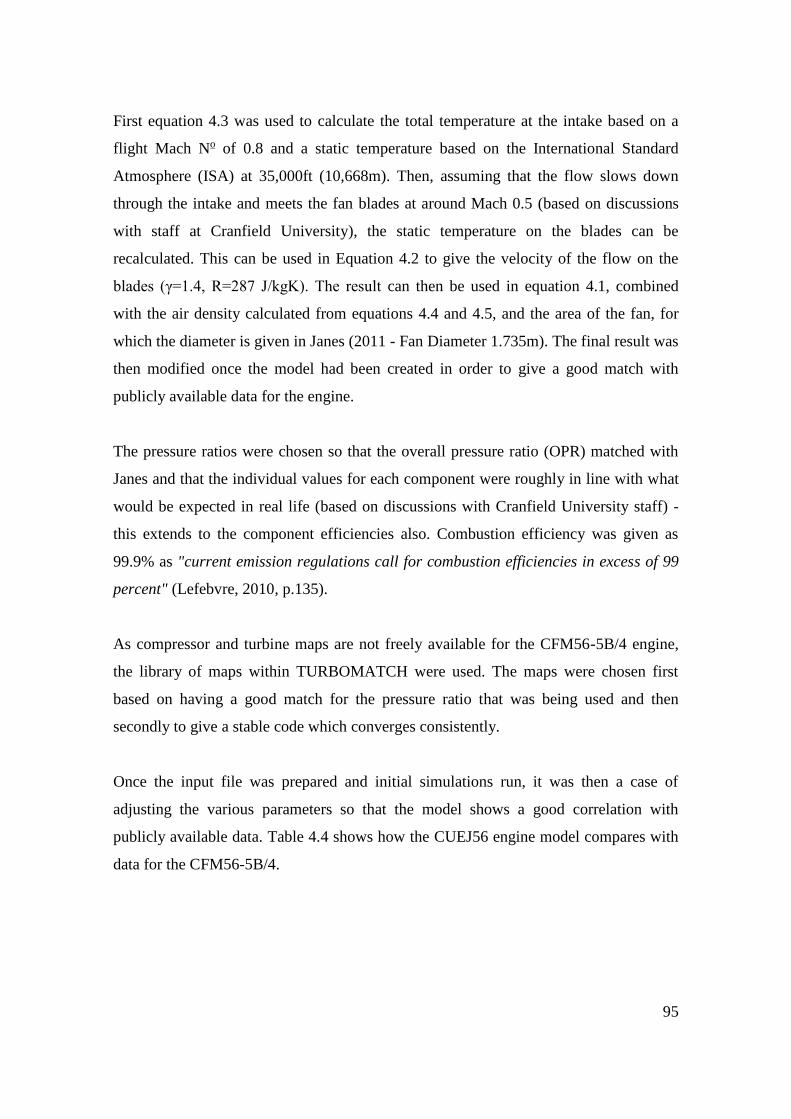
95
First equation 4.3 was used to calculate the total temperature at the intake based on a
flight Mach No of 0.8 and a static temperature based on the International Standard
Atmosphere (ISA) at 35,000ft (10,668m). Then, assuming that the flow slows down
through the intake and meets the fan blades at around Mach 0.5 (based on discussions
with staff at Cranfield University), the static temperature on the blades can be
recalculated. This can be used in Equation 4.2 to give the velocity of the flow on the
blades (γ=1.4, R=287 J/kgK). The result can then be used in equation 4.1, combined
with the air density calculated from equations 4.4 and 4.5, and the area of the fan, for
which the diameter is given in Janes (2011 - Fan Diameter 1.735m). The final result was
then modified once the model had been created in order to give a good match with
publicly available data for the engine.
The pressure ratios were chosen so that the overall pressure ratio (OPR) matched with
Janes and that the individual values for each component were roughly in line with what
would be expected in real life (based on discussions with Cranfield University staff) -
this extends to the component efficiencies also. Combustion efficiency was given as
99.9% as "current emission regulations call for combustion efficiencies in excess of 99
percent" (Lefebvre, 2010, p.135).
As compressor and turbine maps are not freely available for the CFM56-5B/4 engine,
the library of maps within TURBOMATCH were used. The maps were chosen first
based on having a good match for the pressure ratio that was being used and then
secondly to give a stable code which converges consistently.
Once the input file was prepared and initial simulations run, it was then a case of
adjusting the various parameters so that the model shows a good correlation with
publicly available data. Table 4.4 shows how the CUEJ56 engine model compares with
data for the CFM56-5B/4.
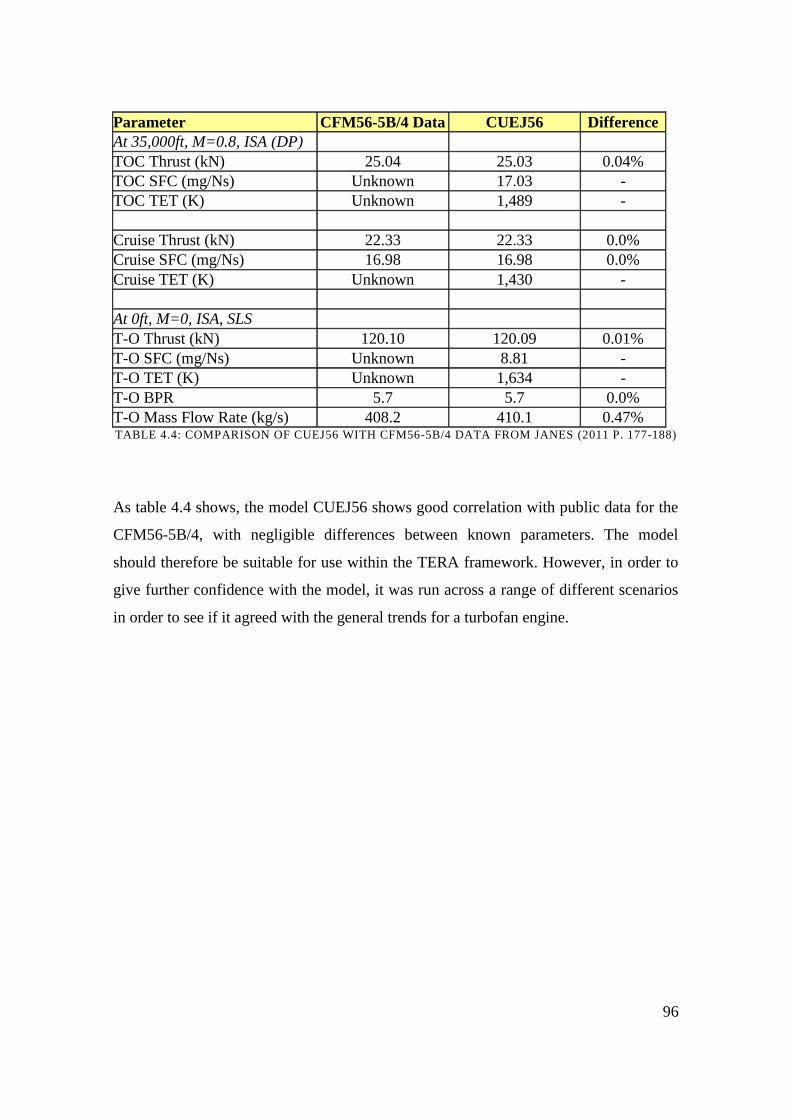
96
Parameter CFM56-5B/4 Data CUEJ56 Difference
At 35,000ft, M=0.8, ISA (DP)
TOC Thrust (kN) 25.04 25.03 0.04%
TOC SFC (mg/Ns) Unknown 17.03 -
TOC TET (K) Unknown 1,489 -
Cruise Thrust (kN) 22.33 22.33 0.0%
Cruise SFC (mg/Ns) 16.98 16.98 0.0%
Cruise TET (K) Unknown 1,430 -
At 0ft, M=0, ISA, SLS
T-O Thrust (kN) 120.10 120.09 0.01%
T-O SFC (mg/Ns) Unknown 8.81 -
T-O TET (K) Unknown 1,634 -
T-O BPR 5.7 5.7 0.0%
T-O Mass Flow Rate (kg/s) 408.2 410.1 0.47% TABLE 4.4: COMPARISON OF CUEJ56 WITH CFM56-5B/4 DATA FROM JANES (2011 P. 177-188)
As table 4.4 shows, the model CUEJ56 shows good correlation with public data for the
CFM56-5B/4, with negligible differences between known parameters. The model
should therefore be suitable for use within the TERA framework. However, in order to
give further confidence with the model, it was run across a range of different scenarios
in order to see if it agreed with the general trends for a turbofan engine.
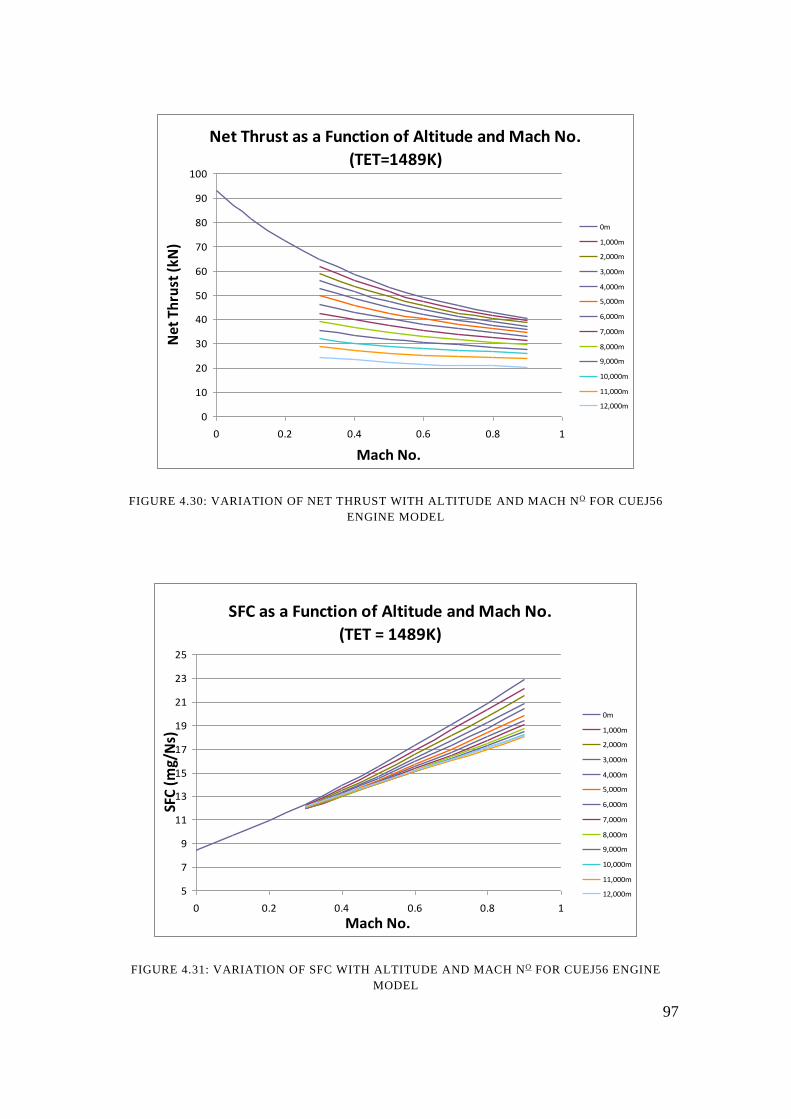
97
Net Thrust as a Function of Altitude and Mach No.
(TET=1489K)
0
10
20
30
40
50
60
70
80
90
100
0 0.2 0.4 0.6 0.8 1
Mach No.
Net
Th
rust
(kN
)
0m
1,000m
2,000m
3,000m
4,000m
5,000m
6,000m
7,000m
8,000m
9,000m
10,000m
11,000m
12,000m
FIGURE 4.30: VARIATION OF NET THRUST WITH ALTITUDE AND MACH NO FOR CUEJ56
ENGINE MODEL
SFC as a Function of Altitude and Mach No.
(TET = 1489K)
5
7
9
11
13
15
17
19
21
23
25
0 0.2 0.4 0.6 0.8 1
Mach No.
SFC
(m
g/N
s)
0m
1,000m
2,000m
3,000m
4,000m
5,000m
6,000m
7,000m
8,000m
9,000m
10,000m
11,000m
12,000m
FIGURE 4.31: VARIATION OF SFC WITH ALTITUDE AND MACH NO FOR CUEJ56 ENGINE
MODEL
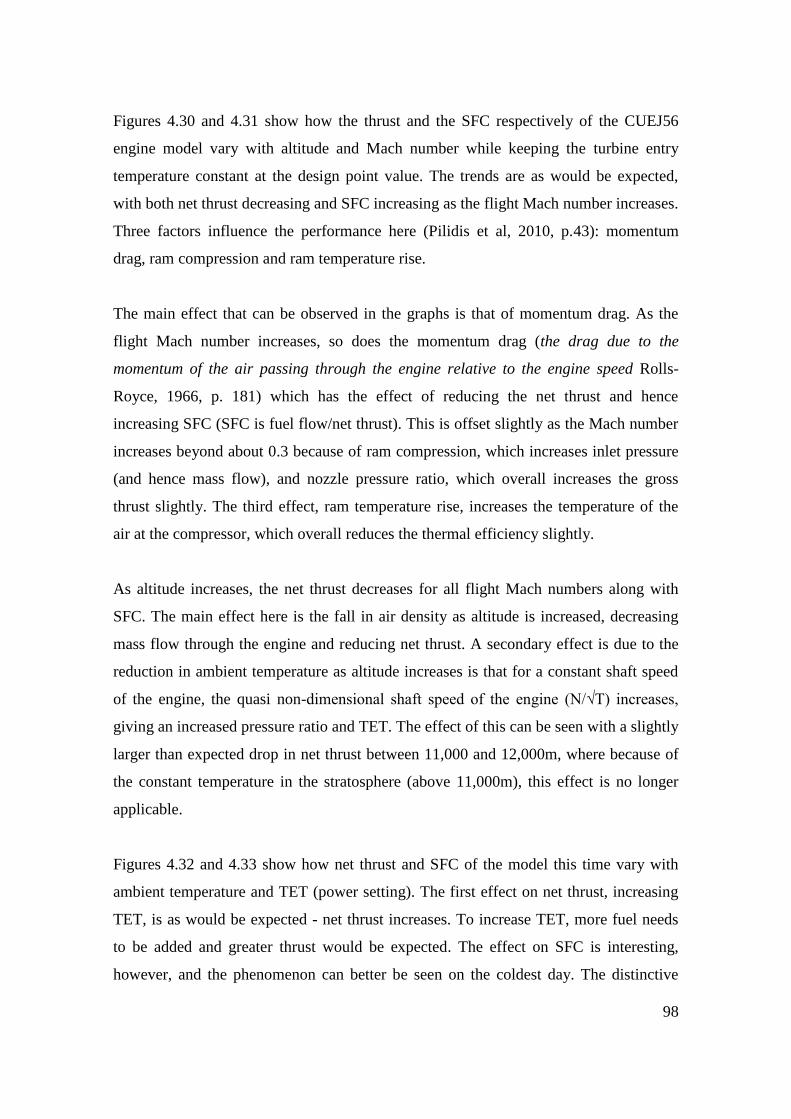
98
Figures 4.30 and 4.31 show how the thrust and the SFC respectively of the CUEJ56
engine model vary with altitude and Mach number while keeping the turbine entry
temperature constant at the design point value. The trends are as would be expected,
with both net thrust decreasing and SFC increasing as the flight Mach number increases.
Three factors influence the performance here (Pilidis et al, 2010, p.43): momentum
drag, ram compression and ram temperature rise.
The main effect that can be observed in the graphs is that of momentum drag. As the
flight Mach number increases, so does the momentum drag (the drag due to the
momentum of the air passing through the engine relative to the engine speed Rolls-
Royce, 1966, p. 181) which has the effect of reducing the net thrust and hence
increasing SFC (SFC is fuel flow/net thrust). This is offset slightly as the Mach number
increases beyond about 0.3 because of ram compression, which increases inlet pressure
(and hence mass flow), and nozzle pressure ratio, which overall increases the gross
thrust slightly. The third effect, ram temperature rise, increases the temperature of the
air at the compressor, which overall reduces the thermal efficiency slightly.
As altitude increases, the net thrust decreases for all flight Mach numbers along with
SFC. The main effect here is the fall in air density as altitude is increased, decreasing
mass flow through the engine and reducing net thrust. A secondary effect is due to the
reduction in ambient temperature as altitude increases is that for a constant shaft speed
of the engine, the quasi non-dimensional shaft speed of the engine (N/√T) increases,
giving an increased pressure ratio and TET. The effect of this can be seen with a slightly
larger than expected drop in net thrust between 11,000 and 12,000m, where because of
the constant temperature in the stratosphere (above 11,000m), this effect is no longer
applicable.
Figures 4.32 and 4.33 show how net thrust and SFC of the model this time vary with
ambient temperature and TET (power setting). The first effect on net thrust, increasing
TET, is as would be expected - net thrust increases. To increase TET, more fuel needs
to be added and greater thrust would be expected. The effect on SFC is interesting,
however, and the phenomenon can better be seen on the coldest day. The distinctive
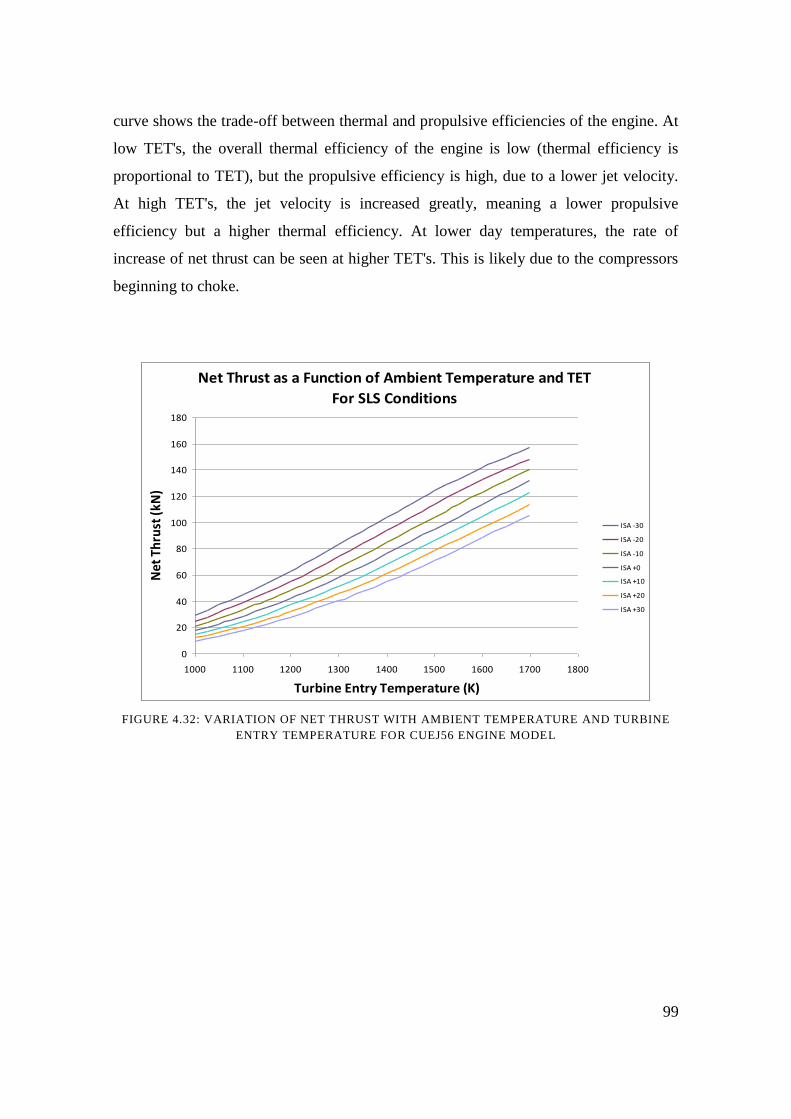
99
curve shows the trade-off between thermal and propulsive efficiencies of the engine. At
low TET's, the overall thermal efficiency of the engine is low (thermal efficiency is
proportional to TET), but the propulsive efficiency is high, due to a lower jet velocity.
At high TET's, the jet velocity is increased greatly, meaning a lower propulsive
efficiency but a higher thermal efficiency. At lower day temperatures, the rate of
increase of net thrust can be seen at higher TET's. This is likely due to the compressors
beginning to choke.
Net Thrust as a Function of Ambient Temperature and TET
For SLS Conditions
0
20
40
60
80
100
120
140
160
180
1000 1100 1200 1300 1400 1500 1600 1700 1800
Turbine Entry Temperature (K)
Net
Th
rust
(kN
)
ISA -30
ISA -20
ISA -10
ISA +0
ISA +10
ISA +20
ISA +30
FIGURE 4.32: VARIATION OF NET THRUST WITH AMBIENT TEMPERATURE AND TURBINE
ENTRY TEMPERATURE FOR CUEJ56 ENGINE MODEL
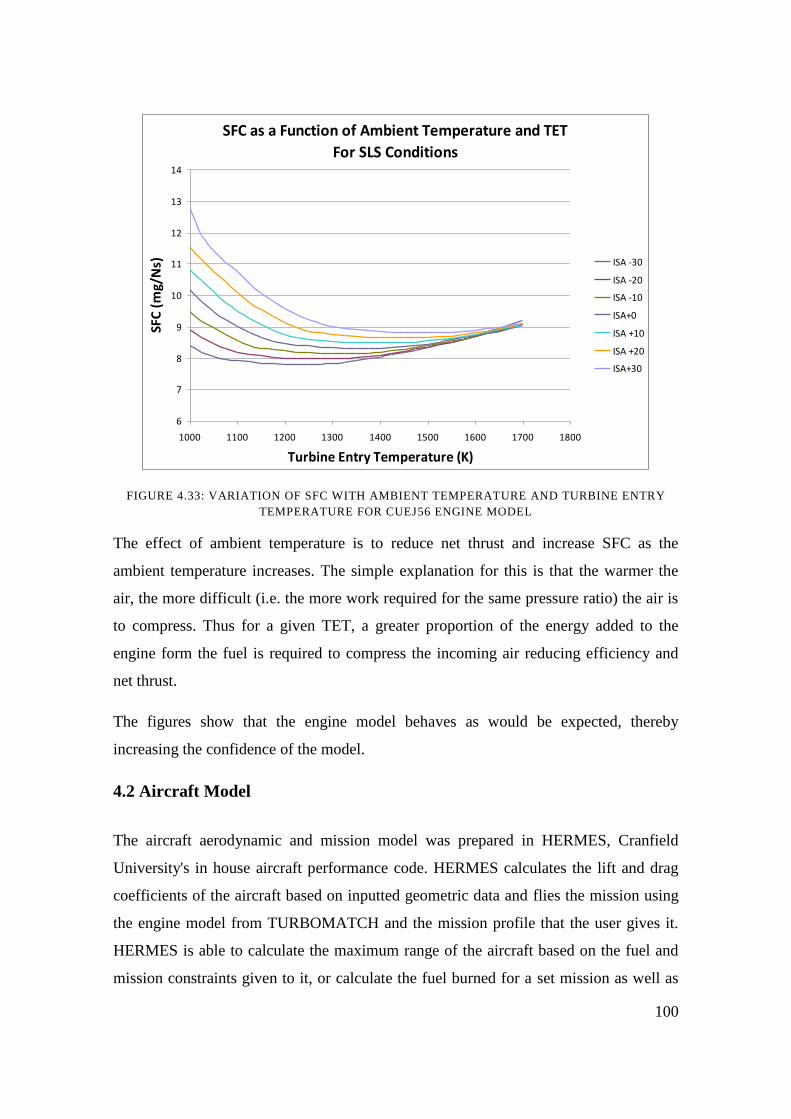
100
SFC as a Function of Ambient Temperature and TET
For SLS Conditions
6
7
8
9
10
11
12
13
14
1000 1100 1200 1300 1400 1500 1600 1700 1800
Turbine Entry Temperature (K)
SFC
(m
g/N
s) ISA -30
ISA -20
ISA -10
ISA+0
ISA +10
ISA +20
ISA+30
FIGURE 4.33: VARIATION OF SFC WITH AMBIENT TEMPERATURE AND TURBINE ENTRY
TEMPERATURE FOR CUEJ56 ENGINE MODEL
The effect of ambient temperature is to reduce net thrust and increase SFC as the
ambient temperature increases. The simple explanation for this is that the warmer the
air, the more difficult (i.e. the more work required for the same pressure ratio) the air is
to compress. Thus for a given TET, a greater proportion of the energy added to the
engine form the fuel is required to compress the incoming air reducing efficiency and
net thrust.
The figures show that the engine model behaves as would be expected, thereby
increasing the confidence of the model.
4.2 Aircraft Model
The aircraft aerodynamic and mission model was prepared in HERMES, Cranfield
University's in house aircraft performance code. HERMES calculates the lift and drag
coefficients of the aircraft based on inputted geometric data and flies the mission using
the engine model from TURBOMATCH and the mission profile that the user gives it.
HERMES is able to calculate the maximum range of the aircraft based on the fuel and
mission constraints given to it, or calculate the fuel burned for a set mission as well as
101
the flight duration (Cranfield University, 2009, p.18). The aircraft model is called the
'Cranbus EJ320'.
The first step was to find an appropriate aircraft to model. It had already been decided
that the Airbus A320 would be modelled, however there are several weight variants
available and the variant chosen should be the same as used in EasyJet's fleet. This was
accomplished by reading the aviation media and finding a newly registered EasyJet
Airbus A320. G-EZUL was an Airbus A320 registered in April 2012 (van der Mark,
2012). With the registration in hand, the variant of the aircraft and maximum take-off
weight (MTOW) could be found from the Civil Aviation Authority's (CAA) website
(CAA, 2012). The variant was given as an A3214 with a MTOW of 73,500kg. These
details were cross-checked with Airbus' own details to ensure accuracy (Airbus, 2010a).
Next, the aircraft geometric details were inputted. These were obtained from a scale
drawing from Airbus (ibid. 2-2-0 p.3.) using dimensions where specified. There would
be some inaccuracies when measuring, even using a computer tool, so these were
checked with published data for a Boeing 737 (Brady, 2012), which although is a
different aircraft, is similar to the A320 in many respects. The details such as thickness
to chord ratio and aspect ratio were of the same order as the 737, so further confidence
can be given to the model. The aircraft weights (operating empty weight (OEW),
MTOW, payload, fuel) were all obtained from Airbus (2010a, 2-1-1 p.2) for the
particular variant of the aircraft.
The aircraft mission profile used is the same as was used by Colmenares-Quintero
(2008, p. 88-89) and has the following segments (ibid.):
"Start-up and taxi-out
Take-off and initial climb to 1,500ft
Climb from 1,500 ft to cruise altitude
Cruise at selected speed and altitude including any stepped climb required
Descent to 1,500ft
Approach and landing
Taxi-in"
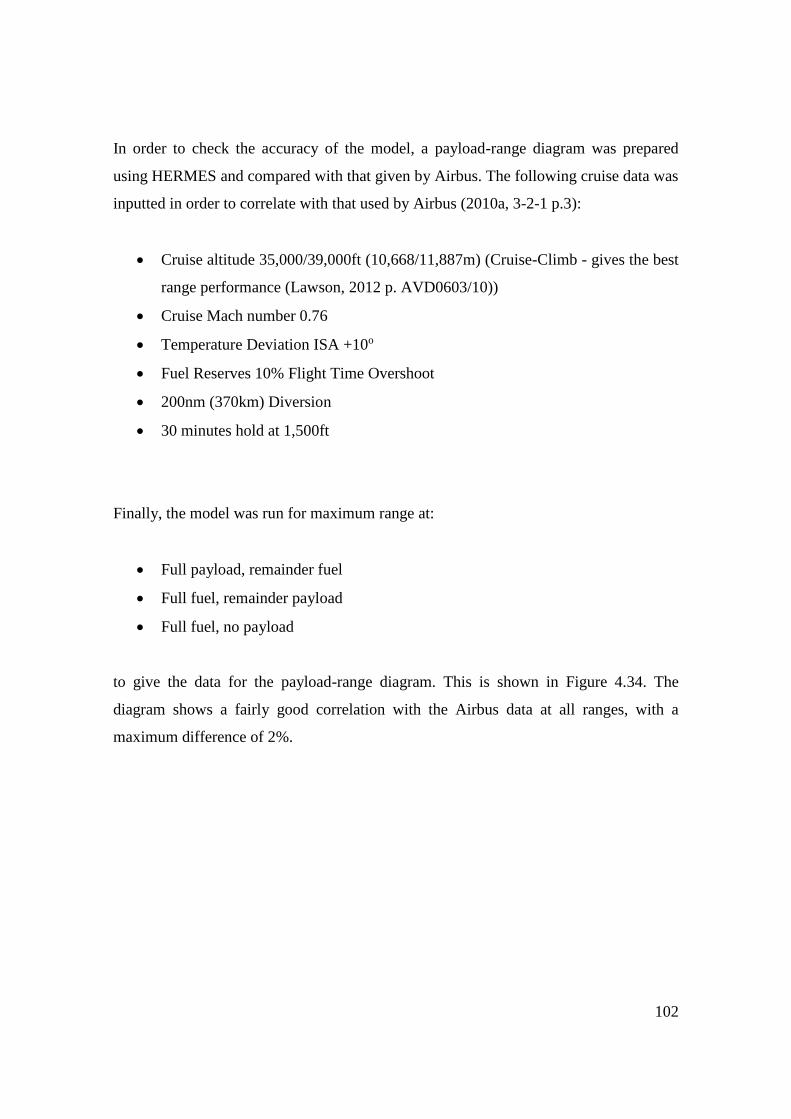
102
In order to check the accuracy of the model, a payload-range diagram was prepared
using HERMES and compared with that given by Airbus. The following cruise data was
inputted in order to correlate with that used by Airbus (2010a, 3-2-1 p.3):
Cruise altitude 35,000/39,000ft (10,668/11,887m) (Cruise-Climb - gives the best
range performance (Lawson, 2012 p. AVD0603/10))
Cruise Mach number 0.76
Temperature Deviation ISA +10o
Fuel Reserves 10% Flight Time Overshoot
200nm (370km) Diversion
30 minutes hold at 1,500ft
Finally, the model was run for maximum range at:
Full payload, remainder fuel
Full fuel, remainder payload
Full fuel, no payload
to give the data for the payload-range diagram. This is shown in Figure 4.34. The
diagram shows a fairly good correlation with the Airbus data at all ranges, with a
maximum difference of 2%.
103
Payload Range Diagram Comparison
Airbus A320 (MTOW 73.5t) and Cranbus EJ320
0
2
4
6
8
10
12
14
16
18
20
0 1000 2000 3000 4000 5000 6000 7000 8000
Range (km)
Pay
load
(t)
Airbus A320
Cranbus EJ320 (With CUEJ56 Engines)
FIGURE 4.34: PAYLOAD RANGE DIAGRAM COMPARING CRANBUS EJ320 AND AIRBUS A320
4.3 Model Limitations
As the models created offer representations and simplifications of real engines or
aircraft, there will inevitably be errors that mean they do not represent fully the real
equipment. This is compounded by not having a complete set of data for the engine or
aircraft, mostly because this data is proprietary and not released in to the public domain
for competitive reasons. It is important, however, to look at the limitations in the models
to see where they can be improved.
The engine model, although it shows good correlation with the performance data from
Janes and behaves realistically, suffers from a lack of available data. Firstly, the
component maps are from libraries within TURBOMATCH, which are very unlikely to
be the same as those for the CFM56. Secondly, the overall pressure ratio is given in
Janes, but not how this is distributed amongst each of the shafts, for which assumptions
and judgements have to be made. Finally, the TETs were chosen so that the required
thrust was met, however the real TETs may be different, which could affect overall
efficiency.
104
5.0 Airbus A320 NEO Engines (Pratt and Whitney GTF & CFM Leap)
This section describes the two additional engine models that were created for the PhD
project: the very high bypass ratio conventional turbo-fan based on the future CFM-
LEAP, and a very high bypass ratio geared turbo-fan based on the proposed Pratt and
Whitney PurePower engine. These two engines are proposed options on the Airbus
A320NEO aircraft, due to enter service during the course of 2016. The engines were
modelled based on information available during 2013 and 2014. The author is aware
that these engines are currently undergoing certification and as such some information
in this chapter may soon be out of date.
5.1 New Engine Context
5.1.1 A320 NEO
The A320NEO has been offered by Airbus to replace the A320 family of aircraft, as an
interim between the current A320 family and an all new short to medium range
narrowbody aircraft to be released sometime after 2030, once game-changing
technological developments are available (Goold, 2012). The A320NEO is essentially
an Airbus A320 with sharklets (wing-tip devices which help to lower drag by modifying
the spanwise trailing vorticity distribution (Barnard & Philpott, 2004, p. 107) and new,
more efficient, engines (Airbus, 2010), along with new, lighter, engine pylons
(BreakingTravelNews, 2012). Airbus claim an improvement in fuel burn of up to 15%,
resulting in either an additional 500 nm of range, or an extra 2 tonnes of payload
(Airbus, 2010). In addition, the new aircraft would give lower noise and reduced NOx
emissions.
Two engine manufacturers are offering engines for the A320 NEO: CFM with their
LEAP engine and Pratt and Whitney with their PurePower PW1127G, a geared turbofan
(Airbus, 2010).
105
5.1.2 CFM LEAP Very High Bypass Ratio Conventional Turbofan (“LEAP”)
The CFM-LEAP engine is a very high by-pass ratio 'advanced' turbofan engine
(M'Bengue, 2010) with an entry into service of 2016. The engine is an evolution of the
CFM56, with a bypass ratio of 11 (compared to the CFM56's 5.7 - Janes, 2011). The
manufacturer claims up to 16% lower fuel burn than current engines, achieved through
an increase in propulsive efficiency thanks to the increased bypass ratio; as well as an
increase in HPC pressure ratio to around 22, double that of the existing CFM56
(M'Bengue, 2010).
The higher bypass ratio would normally mean additional weight due to the increase fan
size, however the manufacturer claims that there would be no additional weight penalty
due to a composite fan blade set and casing, in addition to further materials
improvements (ibid.). It is also claimed that the engine would be quieter - up to 15
EPNdB lower cumulative margin against ICAO chapter 4; and lower NOx, with a 50-
60% NOX margin against CAEP6 (ibid.).
5.1.3 Pratt and Whitney PurePower Geared Turbofan (“PPGTF”)
The PW1100G engine is one of the other options on the Airbus A320NEO aircraft. The
engine uses a geared fan on a 2-shaft arrangement to try and optimise the fan speed,
which due to its size, normally needs a slower rotational speed than the booster. The
engine would deliver 27,000lbs of thrust, with a bypass ratio of around 12 (Pratt &
Whitney, 2012). Pratt and Whitney claim that the engine would also deliver 16% fuel
burn savings compared to current engines, with lower noise levels (15-20dB lower than
ICAO4) and lower NOx (50% improvement over CAEP6) (Pratt& Whitney, 2012a).
5.2 Engine Performance Modelling
The first step in creating these engines is to create performance models using
TURBOMATCH. Modelling these engines, which are still under development, can
present some challenges: the lack of certified data allows for a freedom in modelling as
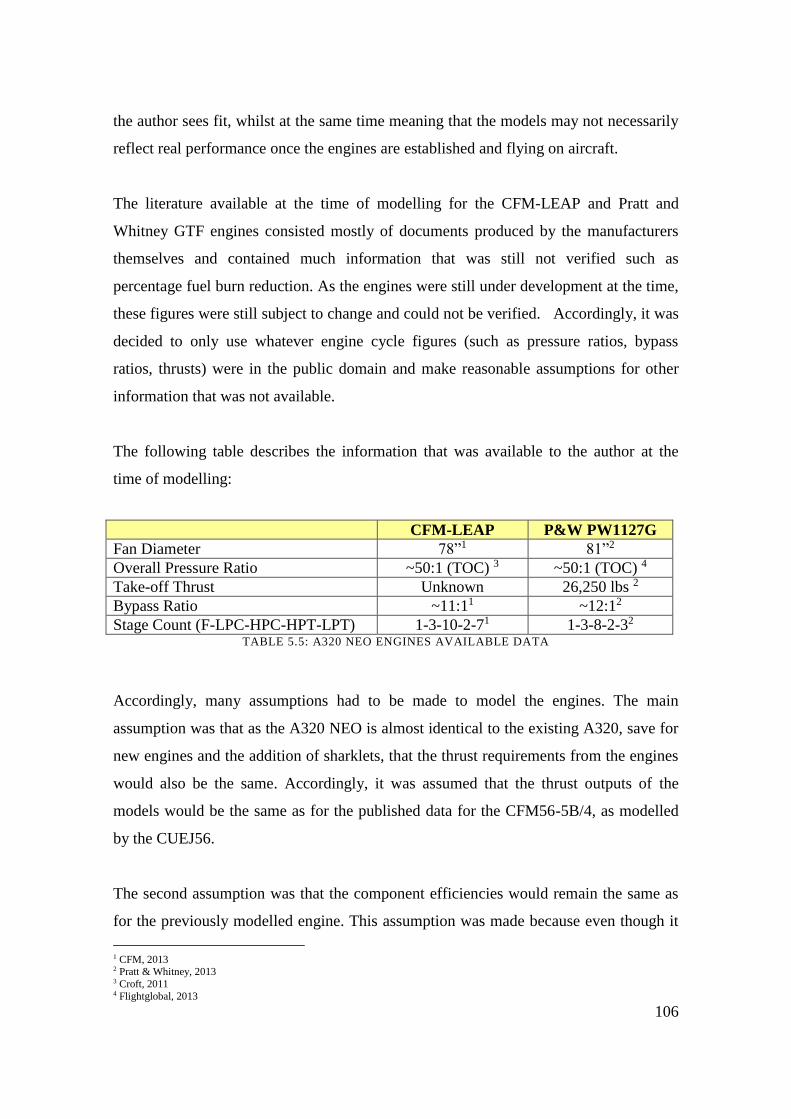
106
the author sees fit, whilst at the same time meaning that the models may not necessarily
reflect real performance once the engines are established and flying on aircraft.
The literature available at the time of modelling for the CFM-LEAP and Pratt and
Whitney GTF engines consisted mostly of documents produced by the manufacturers
themselves and contained much information that was still not verified such as
percentage fuel burn reduction. As the engines were still under development at the time,
these figures were still subject to change and could not be verified. Accordingly, it was
decided to only use whatever engine cycle figures (such as pressure ratios, bypass
ratios, thrusts) were in the public domain and make reasonable assumptions for other
information that was not available.
The following table describes the information that was available to the author at the
time of modelling:
CFM-LEAP P&W PW1127G
Fan Diameter 78”1 81”2
Overall Pressure Ratio ~50:1 (TOC) 3 ~50:1 (TOC) 4
Take-off Thrust Unknown 26,250 lbs 2
Bypass Ratio ~11:11 ~12:12
Stage Count (F-LPC-HPC-HPT-LPT) 1-3-10-2-71 1-3-8-2-32
TABLE 5.5: A320 NEO ENGINES AVAILABLE DATA
Accordingly, many assumptions had to be made to model the engines. The main
assumption was that as the A320 NEO is almost identical to the existing A320, save for
new engines and the addition of sharklets, that the thrust requirements from the engines
would also be the same. Accordingly, it was assumed that the thrust outputs of the
models would be the same as for the published data for the CFM56-5B/4, as modelled
by the CUEJ56.
The second assumption was that the component efficiencies would remain the same as
for the previously modelled engine. This assumption was made because even though it
1 CFM, 2013 2 Pratt & Whitney, 2013 3 Croft, 2011 4 Flightglobal, 2013
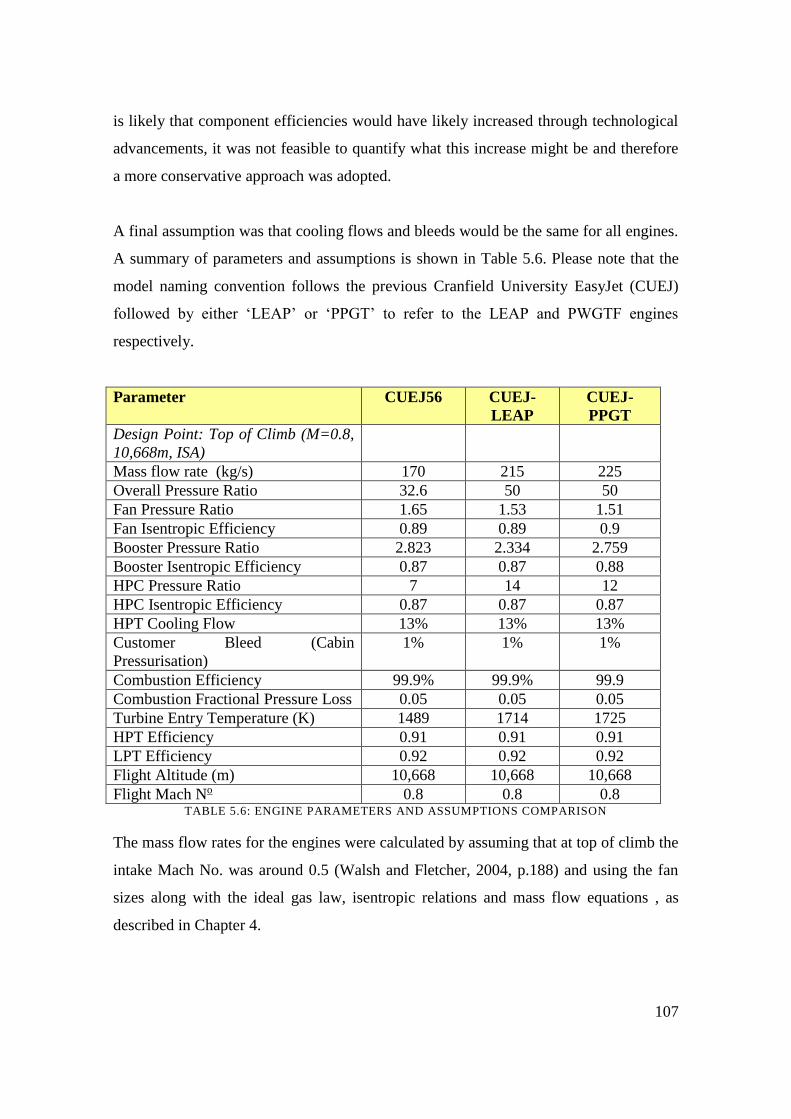
107
is likely that component efficiencies would have likely increased through technological
advancements, it was not feasible to quantify what this increase might be and therefore
a more conservative approach was adopted.
A final assumption was that cooling flows and bleeds would be the same for all engines.
A summary of parameters and assumptions is shown in Table 5.6. Please note that the
model naming convention follows the previous Cranfield University EasyJet (CUEJ)
followed by either ‘LEAP’ or ‘PPGT’ to refer to the LEAP and PWGTF engines
respectively.
Parameter CUEJ56 CUEJ-
LEAP
CUEJ-
PPGT
Design Point: Top of Climb (M=0.8,
10,668m, ISA)
Mass flow rate (kg/s) 170 215 225
Overall Pressure Ratio 32.6 50 50
Fan Pressure Ratio 1.65 1.53 1.51
Fan Isentropic Efficiency 0.89 0.89 0.9
Booster Pressure Ratio 2.823 2.334 2.759
Booster Isentropic Efficiency 0.87 0.87 0.88
HPC Pressure Ratio 7 14 12
HPC Isentropic Efficiency 0.87 0.87 0.87
HPT Cooling Flow 13% 13% 13%
Customer Bleed (Cabin
Pressurisation)
1% 1% 1%
Combustion Efficiency 99.9% 99.9% 99.9
Combustion Fractional Pressure Loss 0.05 0.05 0.05
Turbine Entry Temperature (K) 1489 1714 1725
HPT Efficiency 0.91 0.91 0.91
LPT Efficiency 0.92 0.92 0.92
Flight Altitude (m) 10,668 10,668 10,668
Flight Mach No 0.8 0.8 0.8 TABLE 5.6: ENGINE PARAMETERS AND ASSUMPTIONS COMPARISON
The mass flow rates for the engines were calculated by assuming that at top of climb the
intake Mach No. was around 0.5 (Walsh and Fletcher, 2004, p.188) and using the fan
sizes along with the ideal gas law, isentropic relations and mass flow equations , as
described in Chapter 4.
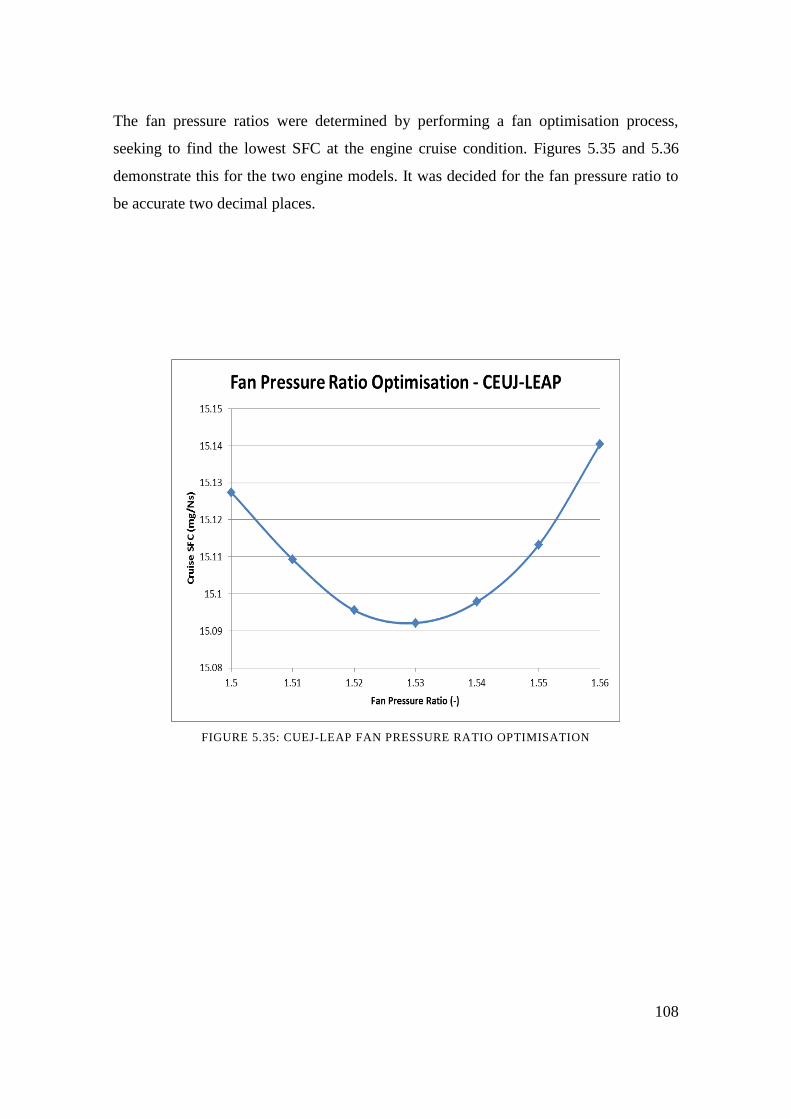
108
The fan pressure ratios were determined by performing a fan optimisation process,
seeking to find the lowest SFC at the engine cruise condition. Figures 5.35 and 5.36
demonstrate this for the two engine models. It was decided for the fan pressure ratio to
be accurate two decimal places.
FIGURE 5.35: CUEJ-LEAP FAN PRESSURE RATIO OPTIMISATION
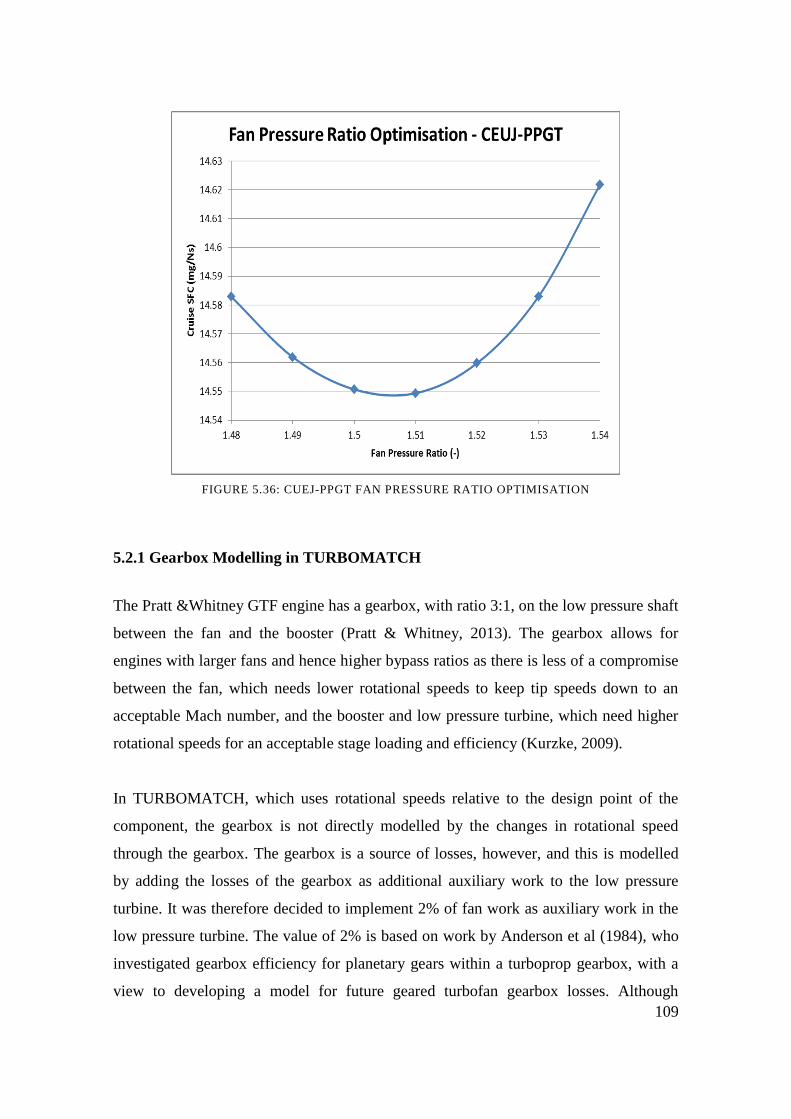
109
FIGURE 5.36: CUEJ-PPGT FAN PRESSURE RATIO OPTIMISATION
5.2.1 Gearbox Modelling in TURBOMATCH
The Pratt &Whitney GTF engine has a gearbox, with ratio 3:1, on the low pressure shaft
between the fan and the booster (Pratt & Whitney, 2013). The gearbox allows for
engines with larger fans and hence higher bypass ratios as there is less of a compromise
between the fan, which needs lower rotational speeds to keep tip speeds down to an
acceptable Mach number, and the booster and low pressure turbine, which need higher
rotational speeds for an acceptable stage loading and efficiency (Kurzke, 2009).
In TURBOMATCH, which uses rotational speeds relative to the design point of the
component, the gearbox is not directly modelled by the changes in rotational speed
through the gearbox. The gearbox is a source of losses, however, and this is modelled
by adding the losses of the gearbox as additional auxiliary work to the low pressure
turbine. It was therefore decided to implement 2% of fan work as auxiliary work in the
low pressure turbine. The value of 2% is based on work by Anderson et al (1984), who
investigated gearbox efficiency for planetary gears within a turboprop gearbox, with a
view to developing a model for future geared turbofan gearbox losses. Although
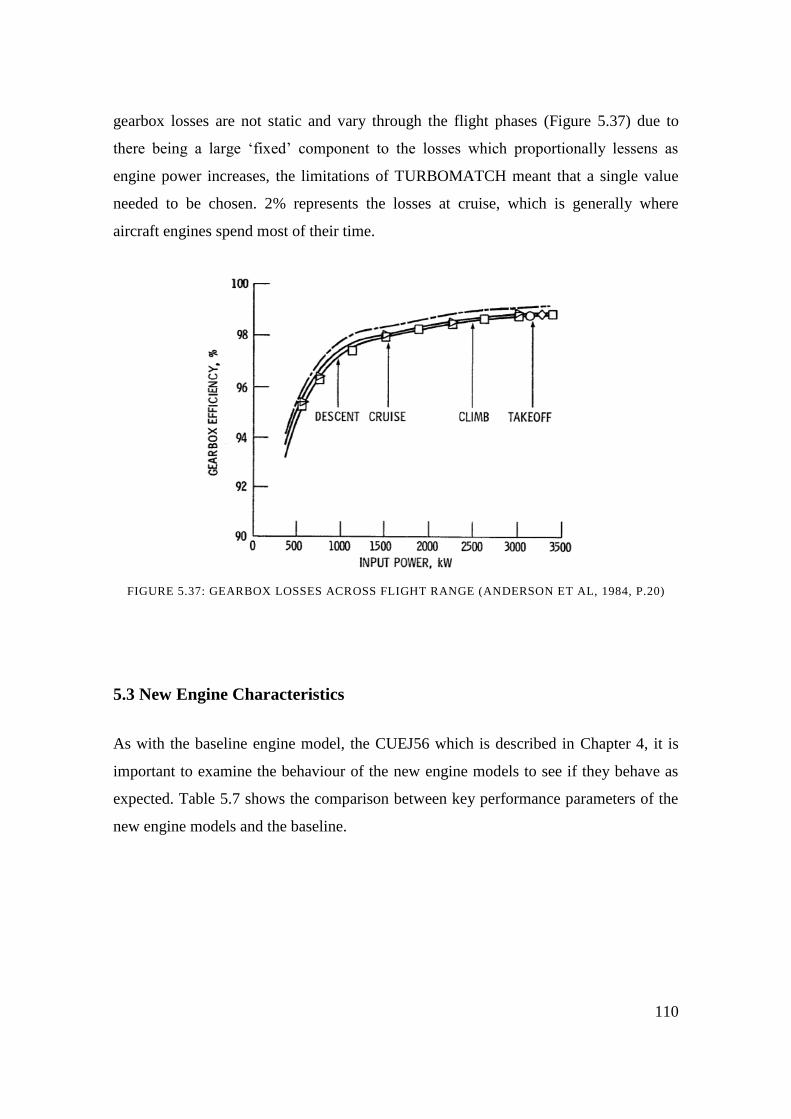
110
gearbox losses are not static and vary through the flight phases (Figure 5.37) due to
there being a large ‘fixed’ component to the losses which proportionally lessens as
engine power increases, the limitations of TURBOMATCH meant that a single value
needed to be chosen. 2% represents the losses at cruise, which is generally where
aircraft engines spend most of their time.
FIGURE 5.37: GEARBOX LOSSES ACROSS FLIGHT RANGE (ANDERSON ET AL, 1984, P.20)
5.3 New Engine Characteristics
As with the baseline engine model, the CUEJ56 which is described in Chapter 4, it is
important to examine the behaviour of the new engine models to see if they behave as
expected. Table 5.7 shows the comparison between key performance parameters of the
new engine models and the baseline.
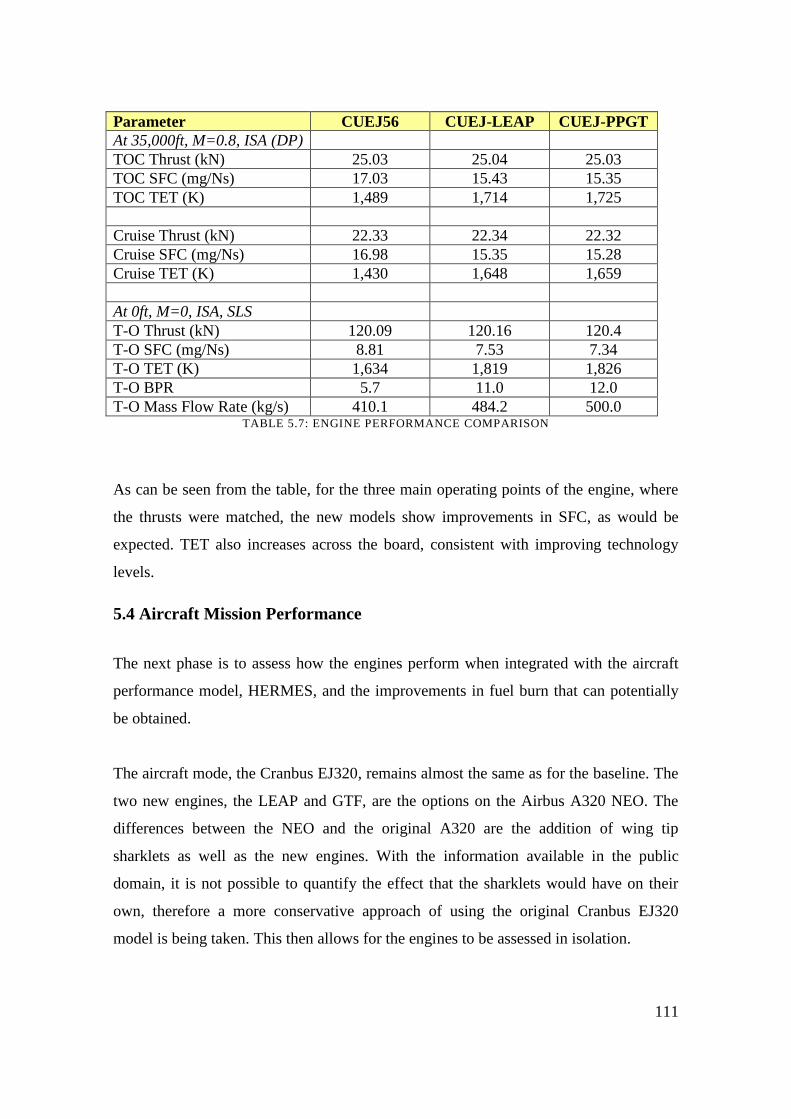
111
Parameter CUEJ56 CUEJ-LEAP CUEJ-PPGT
At 35,000ft, M=0.8, ISA (DP)
TOC Thrust (kN) 25.03 25.04 25.03
TOC SFC (mg/Ns) 17.03 15.43 15.35
TOC TET (K) 1,489 1,714 1,725
Cruise Thrust (kN) 22.33 22.34 22.32
Cruise SFC (mg/Ns) 16.98 15.35 15.28
Cruise TET (K) 1,430 1,648 1,659
At 0ft, M=0, ISA, SLS
T-O Thrust (kN) 120.09 120.16 120.4
T-O SFC (mg/Ns) 8.81 7.53 7.34
T-O TET (K) 1,634 1,819 1,826
T-O BPR 5.7 11.0 12.0
T-O Mass Flow Rate (kg/s) 410.1 484.2 500.0 TABLE 5.7: ENGINE PERFORMANCE COMPARISON
As can be seen from the table, for the three main operating points of the engine, where
the thrusts were matched, the new models show improvements in SFC, as would be
expected. TET also increases across the board, consistent with improving technology
levels.
5.4 Aircraft Mission Performance
The next phase is to assess how the engines perform when integrated with the aircraft
performance model, HERMES, and the improvements in fuel burn that can potentially
be obtained.
The aircraft mode, the Cranbus EJ320, remains almost the same as for the baseline. The
two new engines, the LEAP and GTF, are the options on the Airbus A320 NEO. The
differences between the NEO and the original A320 are the addition of wing tip
sharklets as well as the new engines. With the information available in the public
domain, it is not possible to quantify the effect that the sharklets would have on their
own, therefore a more conservative approach of using the original Cranbus EJ320
model is being taken. This then allows for the engines to be assessed in isolation.
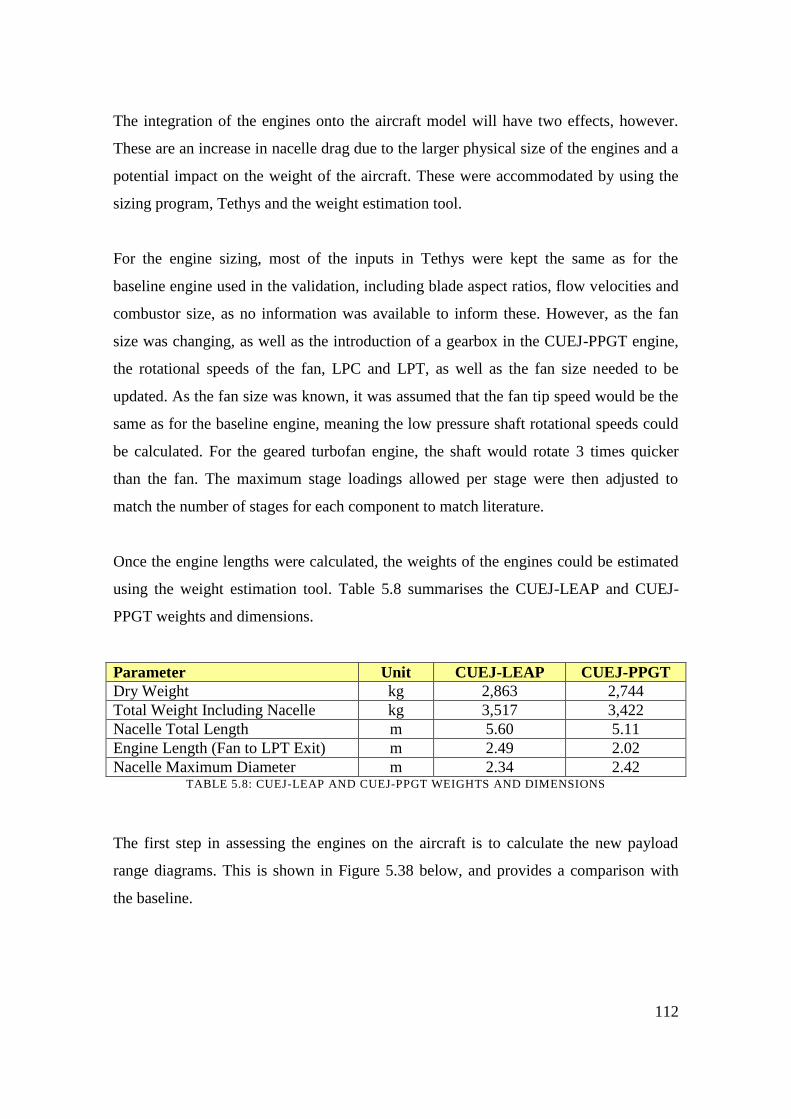
112
The integration of the engines onto the aircraft model will have two effects, however.
These are an increase in nacelle drag due to the larger physical size of the engines and a
potential impact on the weight of the aircraft. These were accommodated by using the
sizing program, Tethys and the weight estimation tool.
For the engine sizing, most of the inputs in Tethys were kept the same as for the
baseline engine used in the validation, including blade aspect ratios, flow velocities and
combustor size, as no information was available to inform these. However, as the fan
size was changing, as well as the introduction of a gearbox in the CUEJ-PPGT engine,
the rotational speeds of the fan, LPC and LPT, as well as the fan size needed to be
updated. As the fan size was known, it was assumed that the fan tip speed would be the
same as for the baseline engine, meaning the low pressure shaft rotational speeds could
be calculated. For the geared turbofan engine, the shaft would rotate 3 times quicker
than the fan. The maximum stage loadings allowed per stage were then adjusted to
match the number of stages for each component to match literature.
Once the engine lengths were calculated, the weights of the engines could be estimated
using the weight estimation tool. Table 5.8 summarises the CUEJ-LEAP and CUEJ-
PPGT weights and dimensions.
Parameter Unit CUEJ-LEAP CUEJ-PPGT
Dry Weight kg 2,863 2,744
Total Weight Including Nacelle kg 3,517 3,422
Nacelle Total Length m 5.60 5.11
Engine Length (Fan to LPT Exit) m 2.49 2.02
Nacelle Maximum Diameter m 2.34 2.42 TABLE 5.8: CUEJ-LEAP AND CUEJ-PPGT WEIGHTS AND DIMENSIONS
The first step in assessing the engines on the aircraft is to calculate the new payload
range diagrams. This is shown in Figure 5.38 below, and provides a comparison with
the baseline.
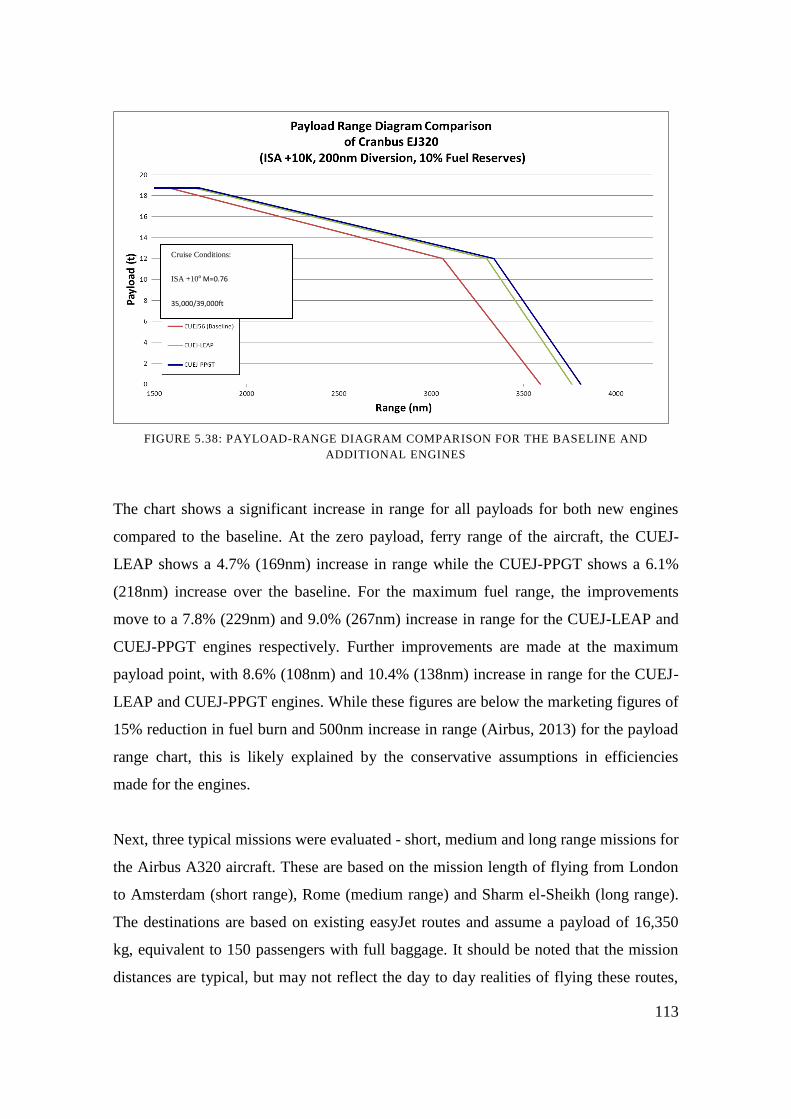
113
FIGURE 5.38: PAYLOAD-RANGE DIAGRAM COMPARISON FOR THE BASELINE AND
ADDITIONAL ENGINES
The chart shows a significant increase in range for all payloads for both new engines
compared to the baseline. At the zero payload, ferry range of the aircraft, the CUEJ-
LEAP shows a 4.7% (169nm) increase in range while the CUEJ-PPGT shows a 6.1%
(218nm) increase over the baseline. For the maximum fuel range, the improvements
move to a 7.8% (229nm) and 9.0% (267nm) increase in range for the CUEJ-LEAP and
CUEJ-PPGT engines respectively. Further improvements are made at the maximum
payload point, with 8.6% (108nm) and 10.4% (138nm) increase in range for the CUEJ-
LEAP and CUEJ-PPGT engines. While these figures are below the marketing figures of
15% reduction in fuel burn and 500nm increase in range (Airbus, 2013) for the payload
range chart, this is likely explained by the conservative assumptions in efficiencies
made for the engines.
Next, three typical missions were evaluated - short, medium and long range missions for
the Airbus A320 aircraft. These are based on the mission length of flying from London
to Amsterdam (short range), Rome (medium range) and Sharm el-Sheikh (long range).
The destinations are based on existing easyJet routes and assume a payload of 16,350
kg, equivalent to 150 passengers with full baggage. It should be noted that the mission
distances are typical, but may not reflect the day to day realities of flying these routes,
Cruise Conditions:
ISA +10o M=0.76
35,000/39,000ft
International Reserves: En-Route
10% Flight Time Overshoot
200 nm diversion
30 minutes hold at 1,500ft
Approach and Landing
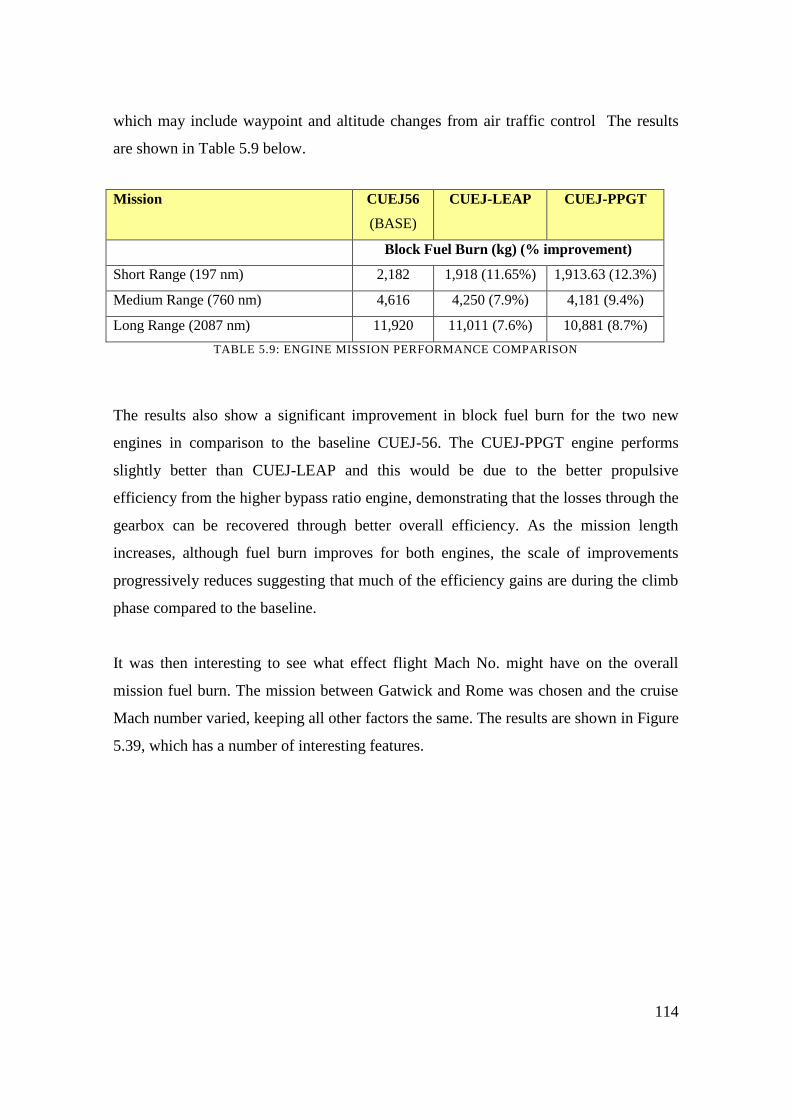
114
which may include waypoint and altitude changes from air traffic control The results
are shown in Table 5.9 below.
Mission CUEJ56
(BASE)
CUEJ-LEAP CUEJ-PPGT
Block Fuel Burn (kg) (% improvement)
Short Range (197 nm) 2,182 1,918 (11.65%) 1,913.63 (12.3%)
Medium Range (760 nm) 4,616 4,250 (7.9%) 4,181 (9.4%)
Long Range (2087 nm) 11,920 11,011 (7.6%) 10,881 (8.7%)
TABLE 5.9: ENGINE MISSION PERFORMANCE COMPARISON
The results also show a significant improvement in block fuel burn for the two new
engines in comparison to the baseline CUEJ-56. The CUEJ-PPGT engine performs
slightly better than CUEJ-LEAP and this would be due to the better propulsive
efficiency from the higher bypass ratio engine, demonstrating that the losses through the
gearbox can be recovered through better overall efficiency. As the mission length
increases, although fuel burn improves for both engines, the scale of improvements
progressively reduces suggesting that much of the efficiency gains are during the climb
phase compared to the baseline.
It was then interesting to see what effect flight Mach No. might have on the overall
mission fuel burn. The mission between Gatwick and Rome was chosen and the cruise
Mach number varied, keeping all other factors the same. The results are shown in Figure
5.39, which has a number of interesting features.
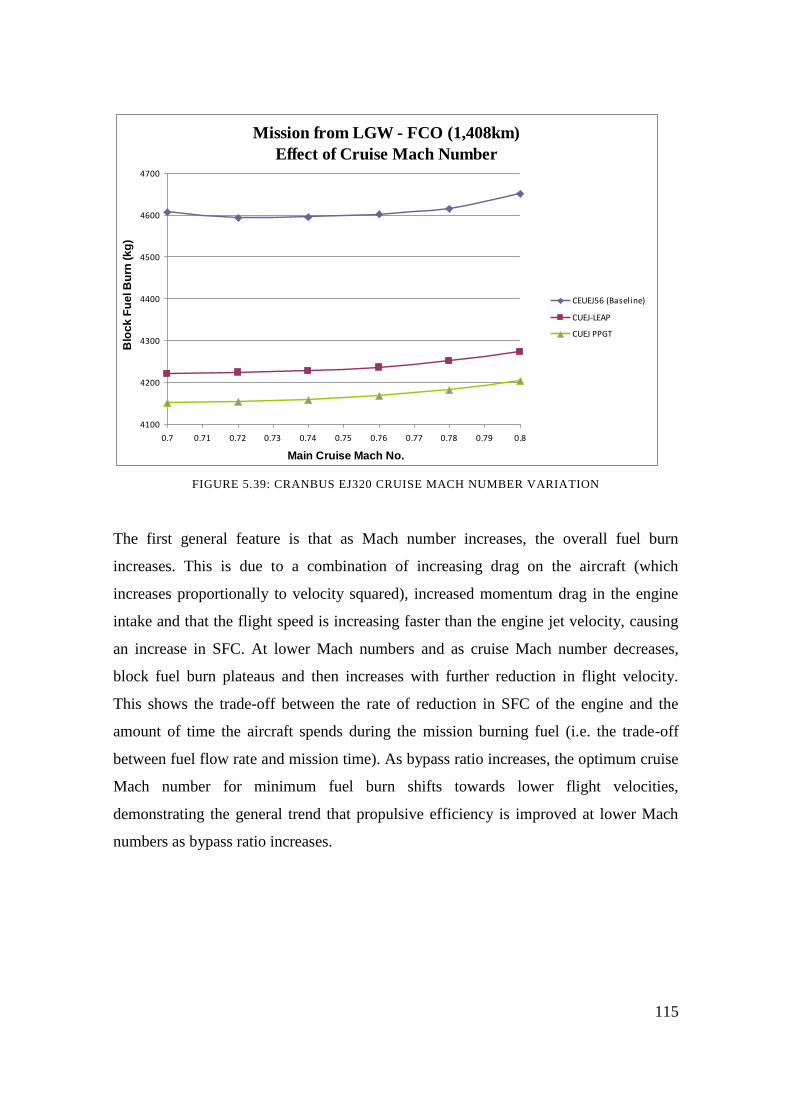
115
Mission from LGW - FCO (1,408km)
Effect of Cruise Mach Number
4100
4200
4300
4400
4500
4600
4700
0.7 0.71 0.72 0.73 0.74 0.75 0.76 0.77 0.78 0.79 0.8
Main Cruise Mach No.
Blo
ck
Fu
el B
urn
(k
g)
CEUEJ56 (Baseline)
CUEJ-LEAP
CUEJ PPGT
FIGURE 5.39: CRANBUS EJ320 CRUISE MACH NUMBER VARIATION
The first general feature is that as Mach number increases, the overall fuel burn
increases. This is due to a combination of increasing drag on the aircraft (which
increases proportionally to velocity squared), increased momentum drag in the engine
intake and that the flight speed is increasing faster than the engine jet velocity, causing
an increase in SFC. At lower Mach numbers and as cruise Mach number decreases,
block fuel burn plateaus and then increases with further reduction in flight velocity.
This shows the trade-off between the rate of reduction in SFC of the engine and the
amount of time the aircraft spends during the mission burning fuel (i.e. the trade-off
between fuel flow rate and mission time). As bypass ratio increases, the optimum cruise
Mach number for minimum fuel burn shifts towards lower flight velocities,
demonstrating the general trend that propulsive efficiency is improved at lower Mach
numbers as bypass ratio increases.
116
6.0 Optimisation
This chapter describes the two engine models that were created for the purpose of
finding mature conventional turbofans that would represent an upper limit in efficiency,
which are able to fit on an Airbus A320 type aircraft in the typical configuration (an
engine mounted under each wing); the optimisation method used and the results of the
optimisation.
6.1 Engines for Optimisation
Two types of conventional turbofan were chosen for the optimisation. Conventional in
this sense means a turbofan where the power and thrust are produced within the same
unit (i.e. no distributed propulsion); the engine consists of a fan and bypass splitter, one
or more axial or centrifugal compression stages, a constant pressure combustor, some
turbine stages, and one or two expanding nozzles. In essence, the type of turbofan
engines that have been available on passenger jet aircraft since around the 1960s. The
two types of engine chosen were a direct drive turbofan, the CUEJ-DD1 with the fan
attached directly on the low pressure shaft; and a geared turbofan, the CUEJ-GT1, with
a 3:1 reduction gearbox between the fan and low pressure shaft. These types of engine
were chosen because they represent a continuation of types currently available for
purchase as part of the Airbus A320 NEO programme.
The CUEJ-DD1 direct drive engine is a two spool turbofan based on an updated version
of the CUEJ-LEAP engine described in the previous chapter, while the CUEJ-GT1
shares the same basic performance model as the CUEJ-DD1, but with 2% of the fan
work added to the low pressure turbine to account for gearbox losses, as described in
Chapter 5.
6.1.1 Engine Initial Parameters and Assumptions
A number of assumptions need to be made in order to create models of hypothetical
engines which would represent a limit in terms of fuel efficiency able to be
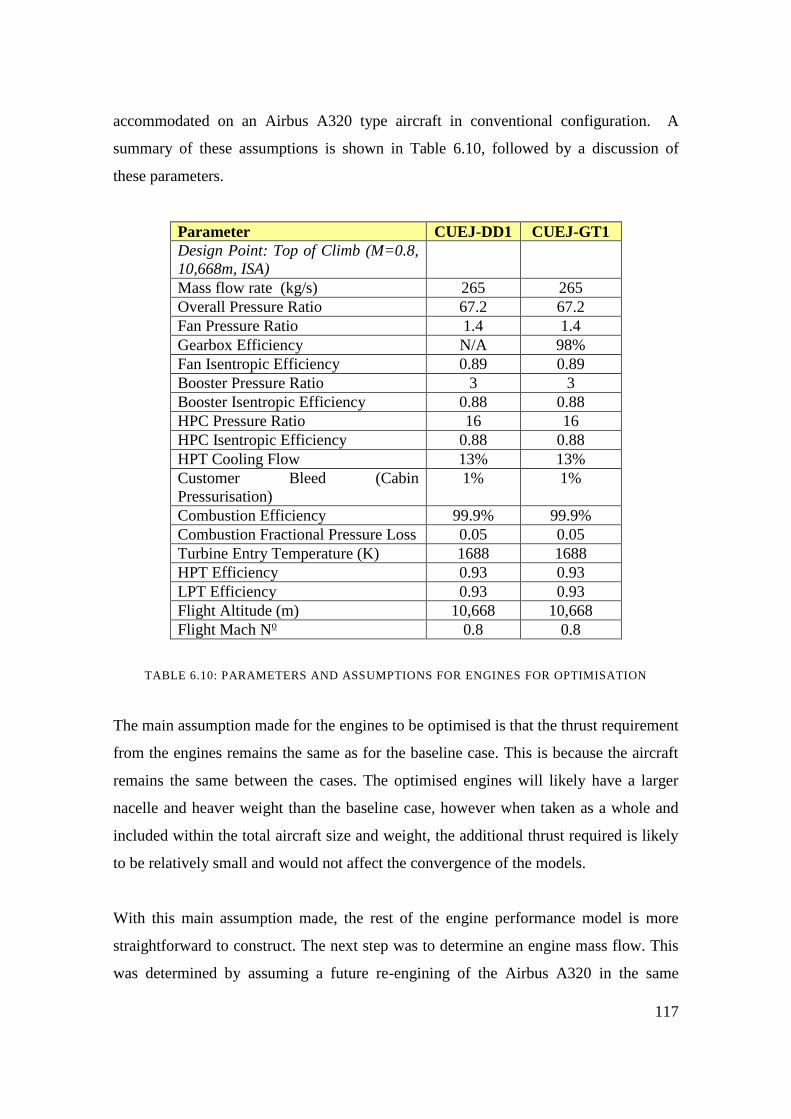
117
accommodated on an Airbus A320 type aircraft in conventional configuration. A
summary of these assumptions is shown in Table 6.10, followed by a discussion of
these parameters.
Parameter CUEJ-DD1 CUEJ-GT1
Design Point: Top of Climb (M=0.8,
10,668m, ISA)
Mass flow rate (kg/s) 265 265
Overall Pressure Ratio 67.2 67.2
Fan Pressure Ratio 1.4 1.4
Gearbox Efficiency N/A 98%
Fan Isentropic Efficiency 0.89 0.89
Booster Pressure Ratio 3 3
Booster Isentropic Efficiency 0.88 0.88
HPC Pressure Ratio 16 16
HPC Isentropic Efficiency 0.88 0.88
HPT Cooling Flow 13% 13%
Customer Bleed (Cabin
Pressurisation)
1% 1%
Combustion Efficiency 99.9% 99.9%
Combustion Fractional Pressure Loss 0.05 0.05
Turbine Entry Temperature (K) 1688 1688
HPT Efficiency 0.93 0.93
LPT Efficiency 0.93 0.93
Flight Altitude (m) 10,668 10,668
Flight Mach No 0.8 0.8
TABLE 6.10: PARAMETERS AND ASSUMPTIONS FOR ENGINES FOR OPTIMISATION
The main assumption made for the engines to be optimised is that the thrust requirement
from the engines remains the same as for the baseline case. This is because the aircraft
remains the same between the cases. The optimised engines will likely have a larger
nacelle and heaver weight than the baseline case, however when taken as a whole and
included within the total aircraft size and weight, the additional thrust required is likely
to be relatively small and would not affect the convergence of the models.
With this main assumption made, the rest of the engine performance model is more
straightforward to construct. The next step was to determine an engine mass flow. This
was determined by assuming a future re-engining of the Airbus A320 in the same
118
configuration. There is a limited amount of space under the wings to fit the engines,
therefore a maximum fan diameter that can be accommodated without re-configuring
the aircraft. Using the drawing of the Airbus A320 (Airbus 2015a), a fan diameter of
2.2m has been assumed. Using the same method to determine mass flow as in Chapter
4, a value of 265 kg/s was calculated.
It was assumed that component efficiencies remain unchanged. This is a conservative
assumption given the large amount of aerodynamic research into improving component
efficiencies; however, by assuming these remain unchanged, a pessimistic view as to
the cycle improvements can be gained, meaning that any potential improvements should
be greater. It was also assumed that blade cooling flows remain at the same level as the
baseline case, which assumes an improvement in blade cooling technology as per Birch
(2000).
The rest of the engine cycle parameters such as bypass ratio; fan, booster and HPC
pressure ratios, and turbine entry temperature are opened up during the optimisation,
therefore broadly representative numbers are required in order for the optimisation to
have a starting point. The OPR (and hence the individual FPR, Booster PR and HPC
PR) is ultimately limited by the HPC delivery temperature, which is determined by the
compressor material technology (Kyprianidis, 2011). Kyprianidis (ibid.) found that
intercooling (which reduces the HPC delivery temperature) increases in benefit above
an OPR of 50, and investigated OPR’s of up to 80. It was decided, therefore to have an
starting OPR of less than 80. The final choice of OPR was then reached after stability
testing of the models. The starting BPR was chosen at slightly above that of the Airbus
A320 NEO engines, while the TET was chosen to give the required thrust once the
other assumptions had been made.
For the engine sizing model, the rotational speeds and stage loadings for the direct drive
and geared engines were the same as used for the CUEJ-LEAP and CUEJ-GTF
respectively.
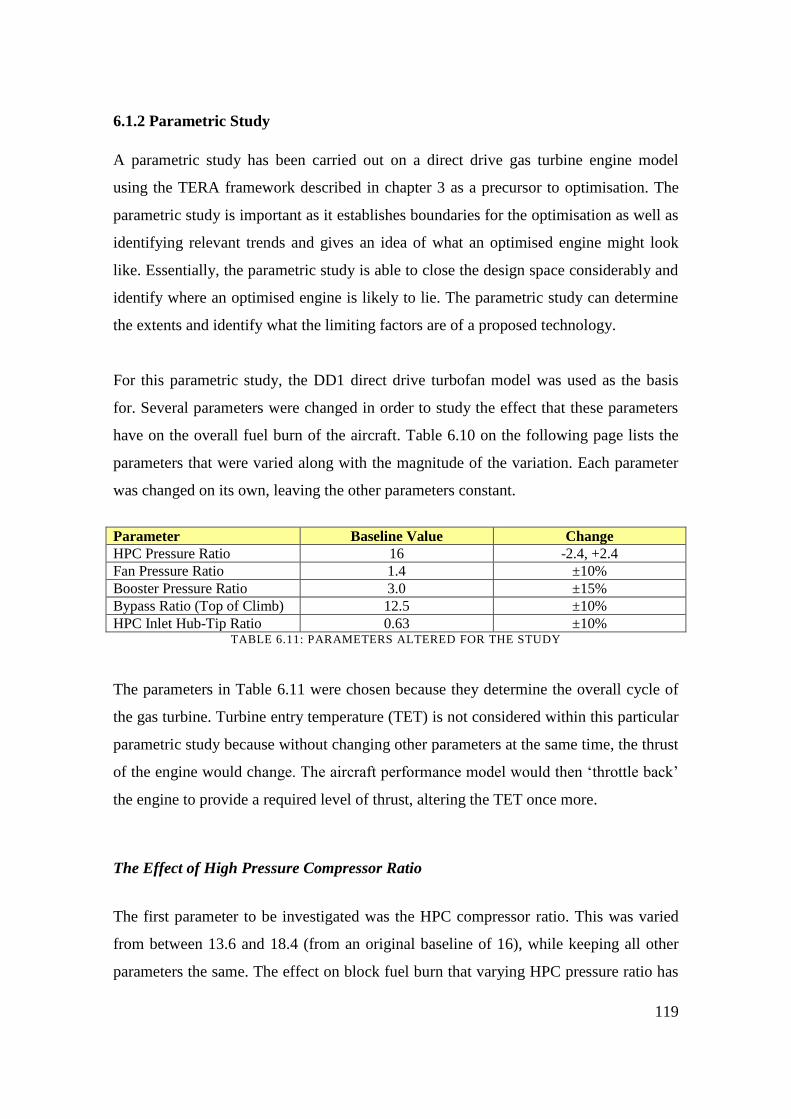
119
6.1.2 Parametric Study
A parametric study has been carried out on a direct drive gas turbine engine model
using the TERA framework described in chapter 3 as a precursor to optimisation. The
parametric study is important as it establishes boundaries for the optimisation as well as
identifying relevant trends and gives an idea of what an optimised engine might look
like. Essentially, the parametric study is able to close the design space considerably and
identify where an optimised engine is likely to lie. The parametric study can determine
the extents and identify what the limiting factors are of a proposed technology.
For this parametric study, the DD1 direct drive turbofan model was used as the basis
for. Several parameters were changed in order to study the effect that these parameters
have on the overall fuel burn of the aircraft. Table 6.10 on the following page lists the
parameters that were varied along with the magnitude of the variation. Each parameter
was changed on its own, leaving the other parameters constant.
Parameter Baseline Value Change HPC Pressure Ratio 16 -2.4, +2.4 Fan Pressure Ratio 1.4 ±10% Booster Pressure Ratio 3.0 ±15% Bypass Ratio (Top of Climb) 12.5 ±10% HPC Inlet Hub-Tip Ratio 0.63 ±10%
TABLE 6.11: PARAMETERS ALTERED FOR THE STUDY
The parameters in Table 6.11 were chosen because they determine the overall cycle of
the gas turbine. Turbine entry temperature (TET) is not considered within this particular
parametric study because without changing other parameters at the same time, the thrust
of the engine would change. The aircraft performance model would then ‘throttle back’
the engine to provide a required level of thrust, altering the TET once more.
The Effect of High Pressure Compressor Ratio
The first parameter to be investigated was the HPC compressor ratio. This was varied
from between 13.6 and 18.4 (from an original baseline of 16), while keeping all other
parameters the same. The effect on block fuel burn that varying HPC pressure ratio has
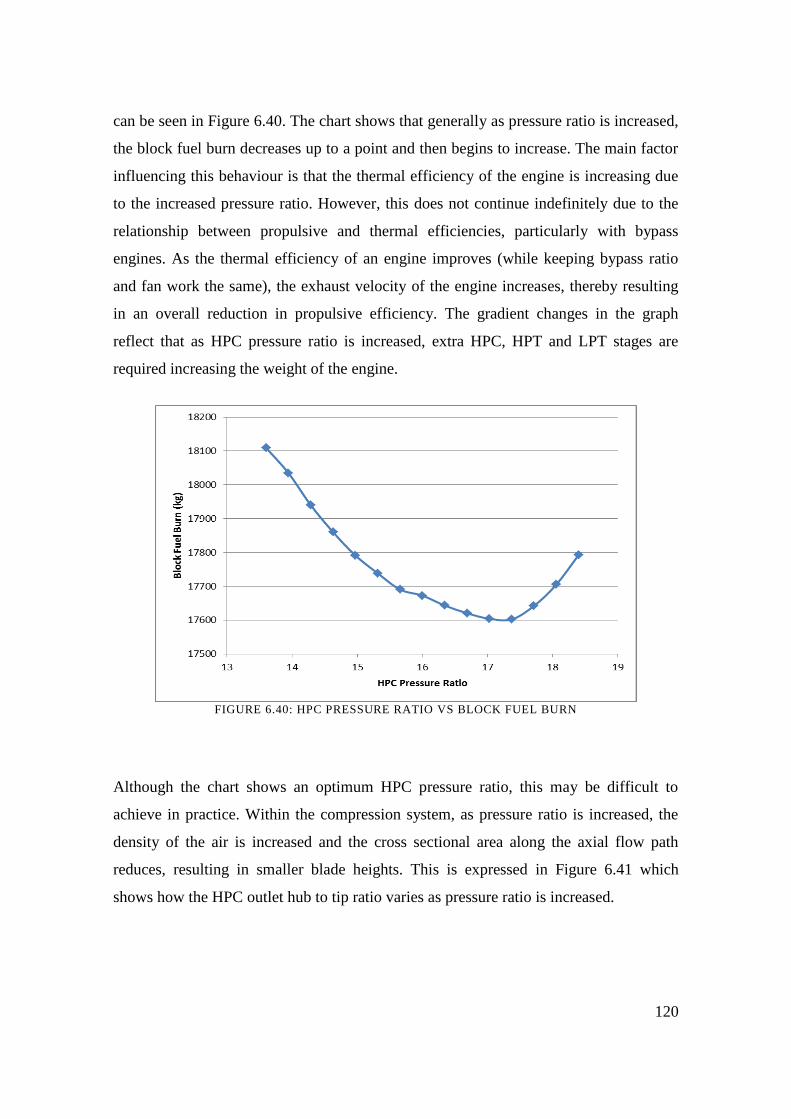
120
can be seen in Figure 6.40. The chart shows that generally as pressure ratio is increased,
the block fuel burn decreases up to a point and then begins to increase. The main factor
influencing this behaviour is that the thermal efficiency of the engine is increasing due
to the increased pressure ratio. However, this does not continue indefinitely due to the
relationship between propulsive and thermal efficiencies, particularly with bypass
engines. As the thermal efficiency of an engine improves (while keeping bypass ratio
and fan work the same), the exhaust velocity of the engine increases, thereby resulting
in an overall reduction in propulsive efficiency. The gradient changes in the graph
reflect that as HPC pressure ratio is increased, extra HPC, HPT and LPT stages are
required increasing the weight of the engine.
FIGURE 6.40: HPC PRESSURE RATIO VS BLOCK FUEL BURN
Although the chart shows an optimum HPC pressure ratio, this may be difficult to
achieve in practice. Within the compression system, as pressure ratio is increased, the
density of the air is increased and the cross sectional area along the axial flow path
reduces, resulting in smaller blade heights. This is expressed in Figure 6.41 which
shows how the HPC outlet hub to tip ratio varies as pressure ratio is increased.
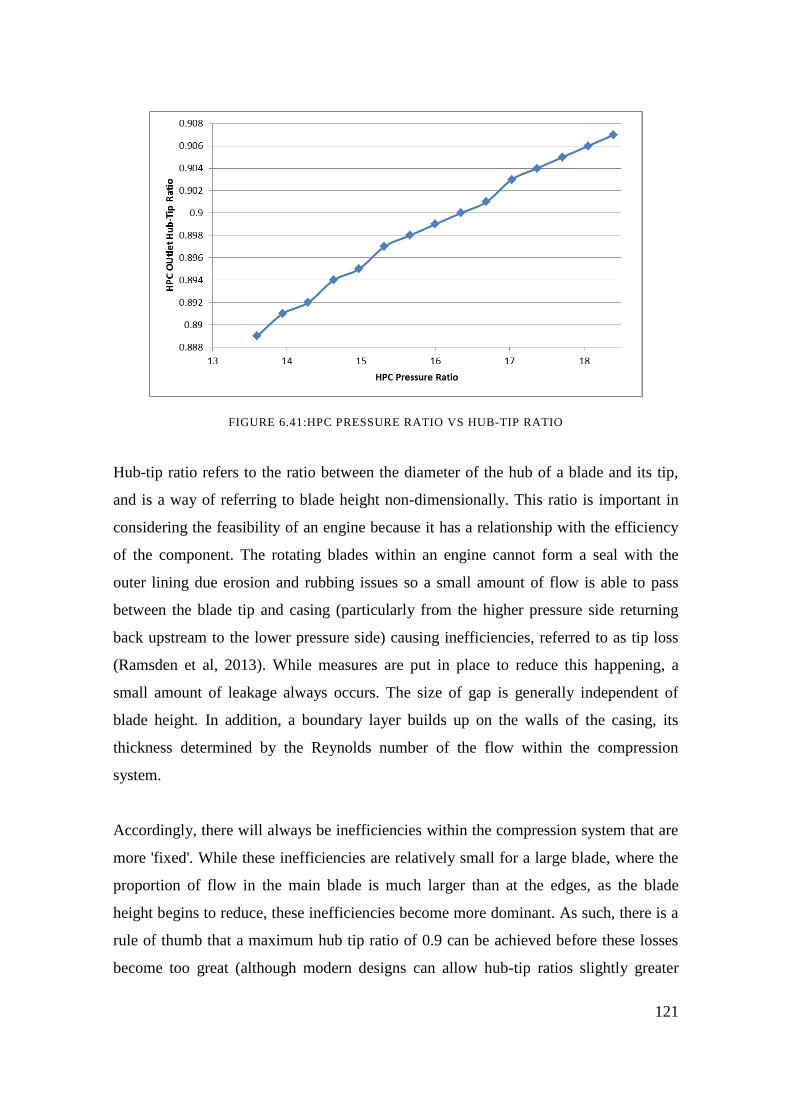
121
FIGURE 6.41:HPC PRESSURE RATIO VS HUB-TIP RATIO
Hub-tip ratio refers to the ratio between the diameter of the hub of a blade and its tip,
and is a way of referring to blade height non-dimensionally. This ratio is important in
considering the feasibility of an engine because it has a relationship with the efficiency
of the component. The rotating blades within an engine cannot form a seal with the
outer lining due erosion and rubbing issues so a small amount of flow is able to pass
between the blade tip and casing (particularly from the higher pressure side returning
back upstream to the lower pressure side) causing inefficiencies, referred to as tip loss
(Ramsden et al, 2013). While measures are put in place to reduce this happening, a
small amount of leakage always occurs. The size of gap is generally independent of
blade height. In addition, a boundary layer builds up on the walls of the casing, its
thickness determined by the Reynolds number of the flow within the compression
system.
Accordingly, there will always be inefficiencies within the compression system that are
more 'fixed'. While these inefficiencies are relatively small for a large blade, where the
proportion of flow in the main blade is much larger than at the edges, as the blade
height begins to reduce, these inefficiencies become more dominant. As such, there is a
rule of thumb that a maximum hub tip ratio of 0.9 can be achieved before these losses
become too great (although modern designs can allow hub-tip ratios slightly greater
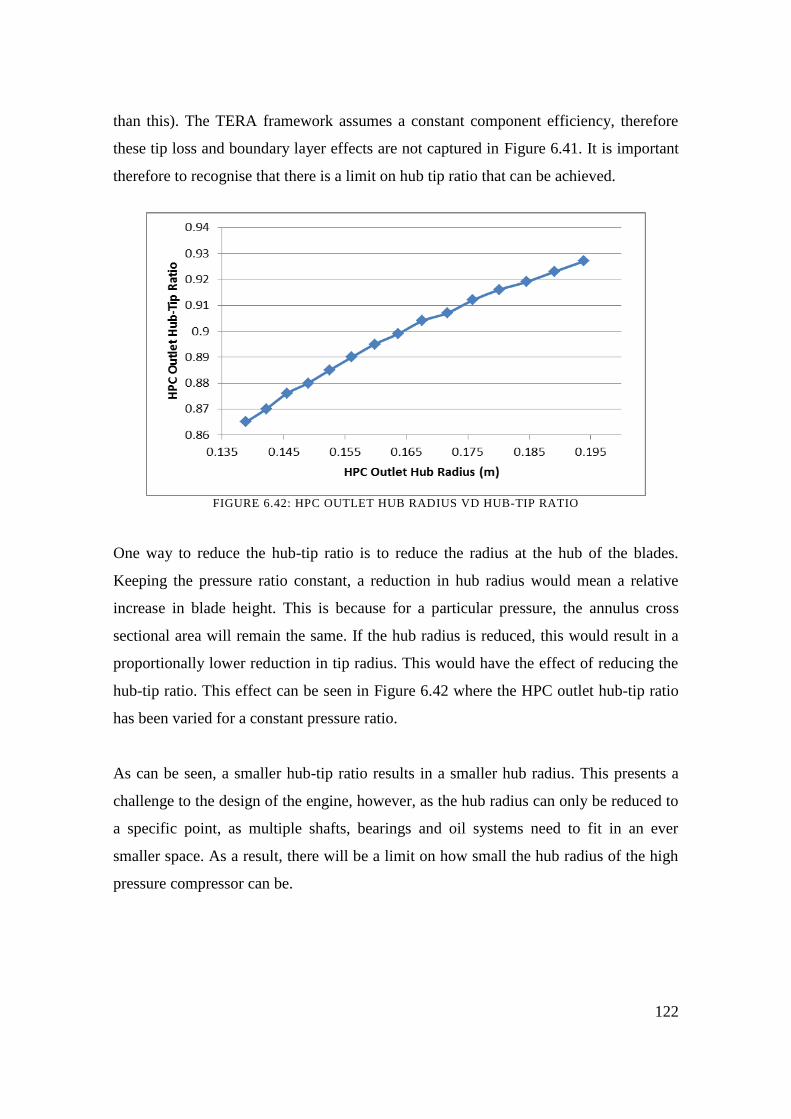
122
than this). The TERA framework assumes a constant component efficiency, therefore
these tip loss and boundary layer effects are not captured in Figure 6.41. It is important
therefore to recognise that there is a limit on hub tip ratio that can be achieved.
FIGURE 6.42: HPC OUTLET HUB RADIUS VD HUB-TIP RATIO
One way to reduce the hub-tip ratio is to reduce the radius at the hub of the blades.
Keeping the pressure ratio constant, a reduction in hub radius would mean a relative
increase in blade height. This is because for a particular pressure, the annulus cross
sectional area will remain the same. If the hub radius is reduced, this would result in a
proportionally lower reduction in tip radius. This would have the effect of reducing the
hub-tip ratio. This effect can be seen in Figure 6.42 where the HPC outlet hub-tip ratio
has been varied for a constant pressure ratio.
As can be seen, a smaller hub-tip ratio results in a smaller hub radius. This presents a
challenge to the design of the engine, however, as the hub radius can only be reduced to
a specific point, as multiple shafts, bearings and oil systems need to fit in an ever
smaller space. As a result, there will be a limit on how small the hub radius of the high
pressure compressor can be.
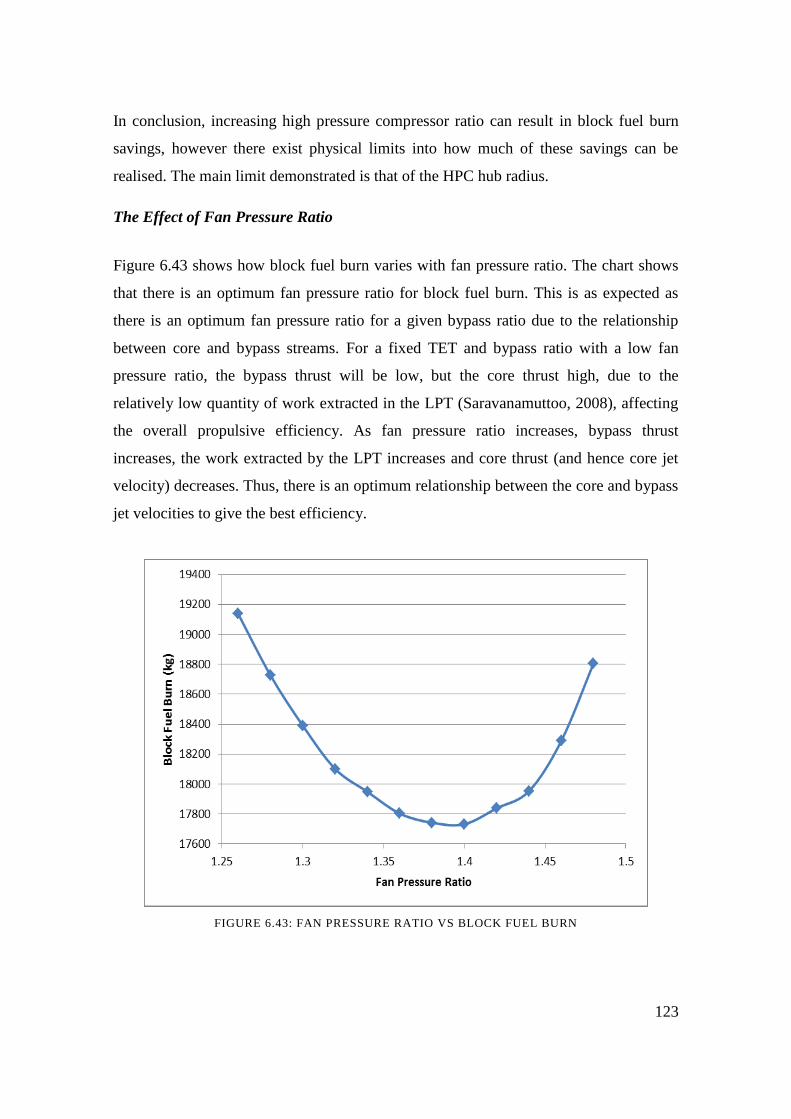
123
In conclusion, increasing high pressure compressor ratio can result in block fuel burn
savings, however there exist physical limits into how much of these savings can be
realised. The main limit demonstrated is that of the HPC hub radius.
The Effect of Fan Pressure Ratio
Figure 6.43 shows how block fuel burn varies with fan pressure ratio. The chart shows
that there is an optimum fan pressure ratio for block fuel burn. This is as expected as
there is an optimum fan pressure ratio for a given bypass ratio due to the relationship
between core and bypass streams. For a fixed TET and bypass ratio with a low fan
pressure ratio, the bypass thrust will be low, but the core thrust high, due to the
relatively low quantity of work extracted in the LPT (Saravanamuttoo, 2008), affecting
the overall propulsive efficiency. As fan pressure ratio increases, bypass thrust
increases, the work extracted by the LPT increases and core thrust (and hence core jet
velocity) decreases. Thus, there is an optimum relationship between the core and bypass
jet velocities to give the best efficiency.
FIGURE 6.43: FAN PRESSURE RATIO VS BLOCK FUEL BURN
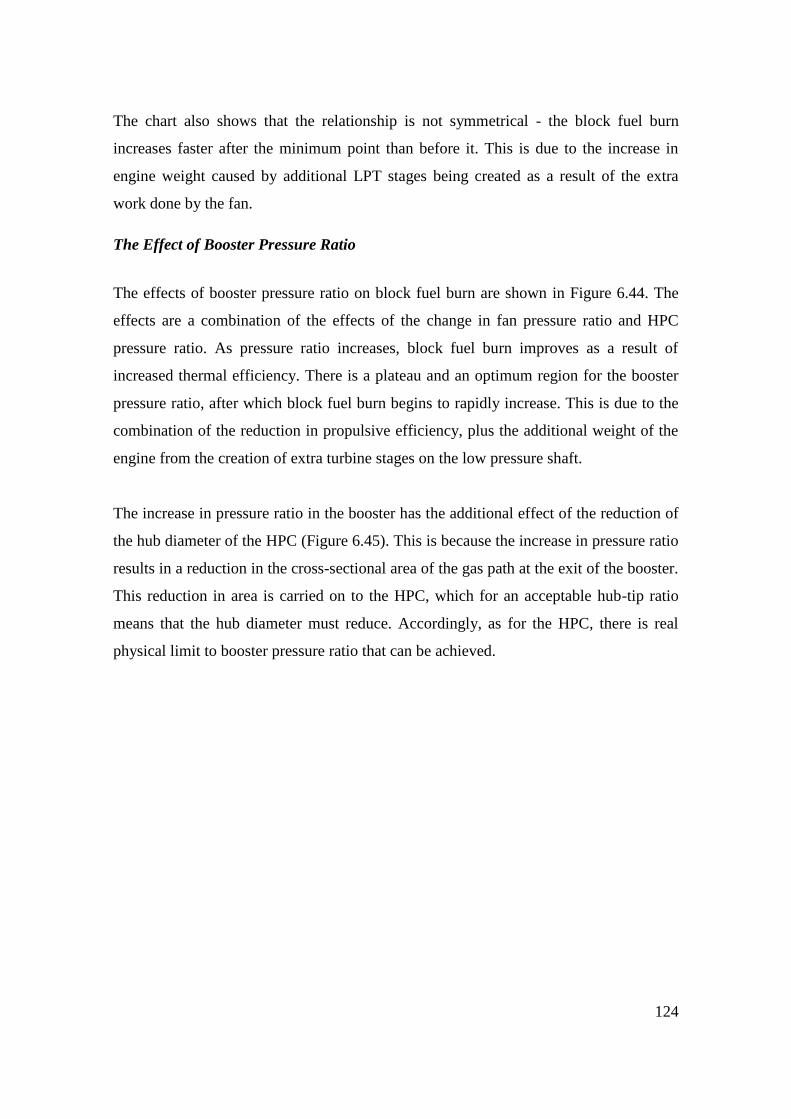
124
The chart also shows that the relationship is not symmetrical - the block fuel burn
increases faster after the minimum point than before it. This is due to the increase in
engine weight caused by additional LPT stages being created as a result of the extra
work done by the fan.
The Effect of Booster Pressure Ratio
The effects of booster pressure ratio on block fuel burn are shown in Figure 6.44. The
effects are a combination of the effects of the change in fan pressure ratio and HPC
pressure ratio. As pressure ratio increases, block fuel burn improves as a result of
increased thermal efficiency. There is a plateau and an optimum region for the booster
pressure ratio, after which block fuel burn begins to rapidly increase. This is due to the
combination of the reduction in propulsive efficiency, plus the additional weight of the
engine from the creation of extra turbine stages on the low pressure shaft.
The increase in pressure ratio in the booster has the additional effect of the reduction of
the hub diameter of the HPC (Figure 6.45). This is because the increase in pressure ratio
results in a reduction in the cross-sectional area of the gas path at the exit of the booster.
This reduction in area is carried on to the HPC, which for an acceptable hub-tip ratio
means that the hub diameter must reduce. Accordingly, as for the HPC, there is real
physical limit to booster pressure ratio that can be achieved.
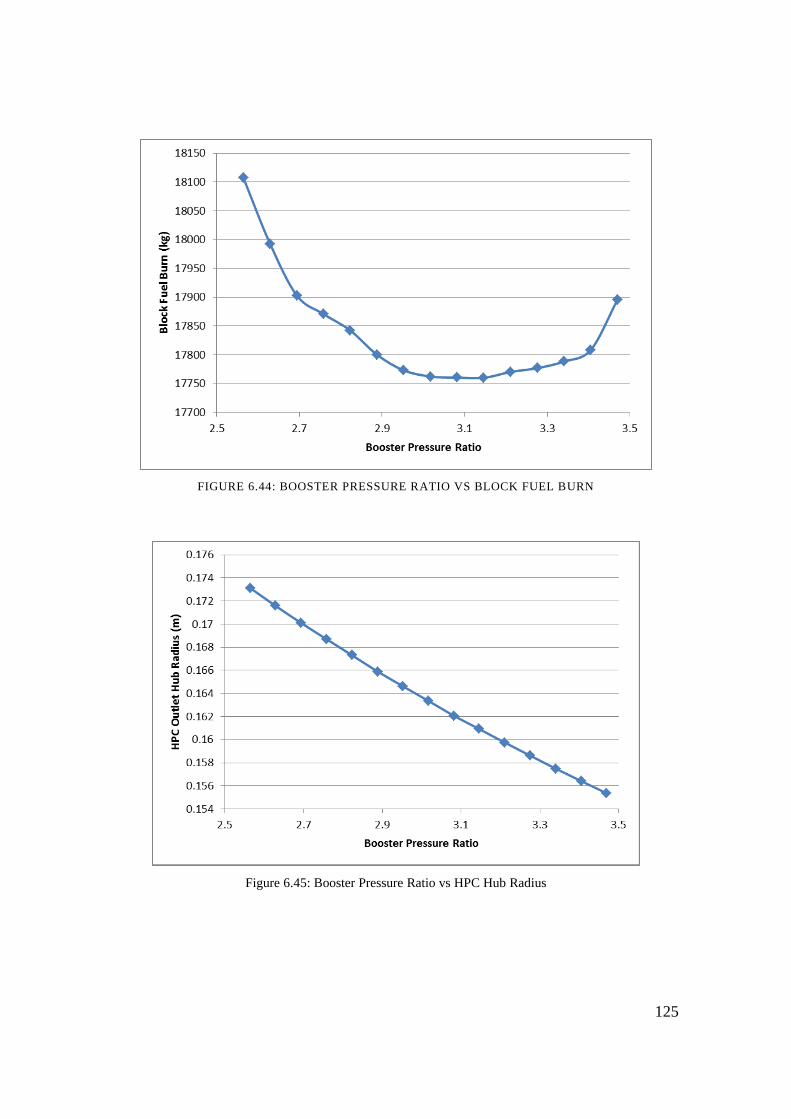
125
FIGURE 6.44: BOOSTER PRESSURE RATIO VS BLOCK FUEL BURN
Figure 6.45: Booster Pressure Ratio vs HPC Hub Radius
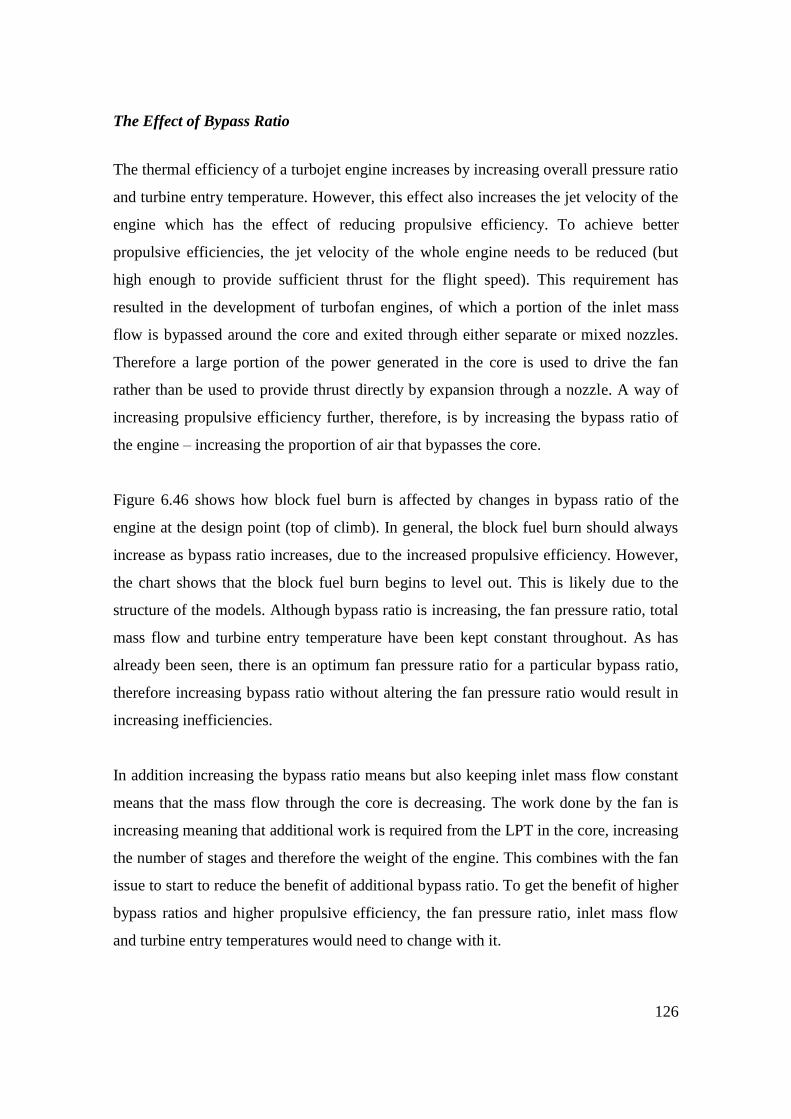
126
The Effect of Bypass Ratio
The thermal efficiency of a turbojet engine increases by increasing overall pressure ratio
and turbine entry temperature. However, this effect also increases the jet velocity of the
engine which has the effect of reducing propulsive efficiency. To achieve better
propulsive efficiencies, the jet velocity of the whole engine needs to be reduced (but
high enough to provide sufficient thrust for the flight speed). This requirement has
resulted in the development of turbofan engines, of which a portion of the inlet mass
flow is bypassed around the core and exited through either separate or mixed nozzles.
Therefore a large portion of the power generated in the core is used to drive the fan
rather than be used to provide thrust directly by expansion through a nozzle. A way of
increasing propulsive efficiency further, therefore, is by increasing the bypass ratio of
the engine – increasing the proportion of air that bypasses the core.
Figure 6.46 shows how block fuel burn is affected by changes in bypass ratio of the
engine at the design point (top of climb). In general, the block fuel burn should always
increase as bypass ratio increases, due to the increased propulsive efficiency. However,
the chart shows that the block fuel burn begins to level out. This is likely due to the
structure of the models. Although bypass ratio is increasing, the fan pressure ratio, total
mass flow and turbine entry temperature have been kept constant throughout. As has
already been seen, there is an optimum fan pressure ratio for a particular bypass ratio,
therefore increasing bypass ratio without altering the fan pressure ratio would result in
increasing inefficiencies.
In addition increasing the bypass ratio means but also keeping inlet mass flow constant
means that the mass flow through the core is decreasing. The work done by the fan is
increasing meaning that additional work is required from the LPT in the core, increasing
the number of stages and therefore the weight of the engine. This combines with the fan
issue to start to reduce the benefit of additional bypass ratio. To get the benefit of higher
bypass ratios and higher propulsive efficiency, the fan pressure ratio, inlet mass flow
and turbine entry temperatures would need to change with it.
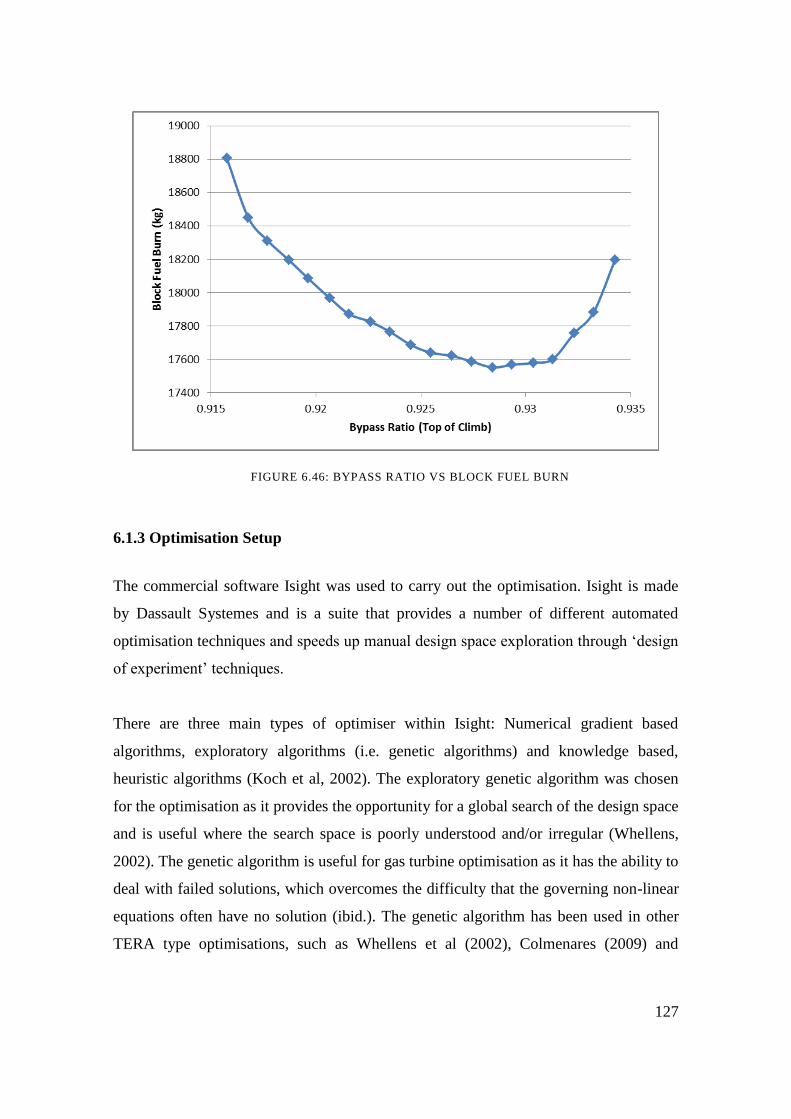
127
6.1.3 Optimisation Setup
The commercial software Isight was used to carry out the optimisation. Isight is made
by Dassault Systemes and is a suite that provides a number of different automated
optimisation techniques and speeds up manual design space exploration through ‘design
of experiment’ techniques.
There are three main types of optimiser within Isight: Numerical gradient based
algorithms, exploratory algorithms (i.e. genetic algorithms) and knowledge based,
heuristic algorithms (Koch et al, 2002). The exploratory genetic algorithm was chosen
for the optimisation as it provides the opportunity for a global search of the design space
and is useful where the search space is poorly understood and/or irregular (Whellens,
2002). The genetic algorithm is useful for gas turbine optimisation as it has the ability to
deal with failed solutions, which overcomes the difficulty that the governing non-linear
equations often have no solution (ibid.). The genetic algorithm has been used in other
TERA type optimisations, such as Whellens et al (2002), Colmenares (2009) and
FIGURE 6.46: BYPASS RATIO VS BLOCK FUEL BURN
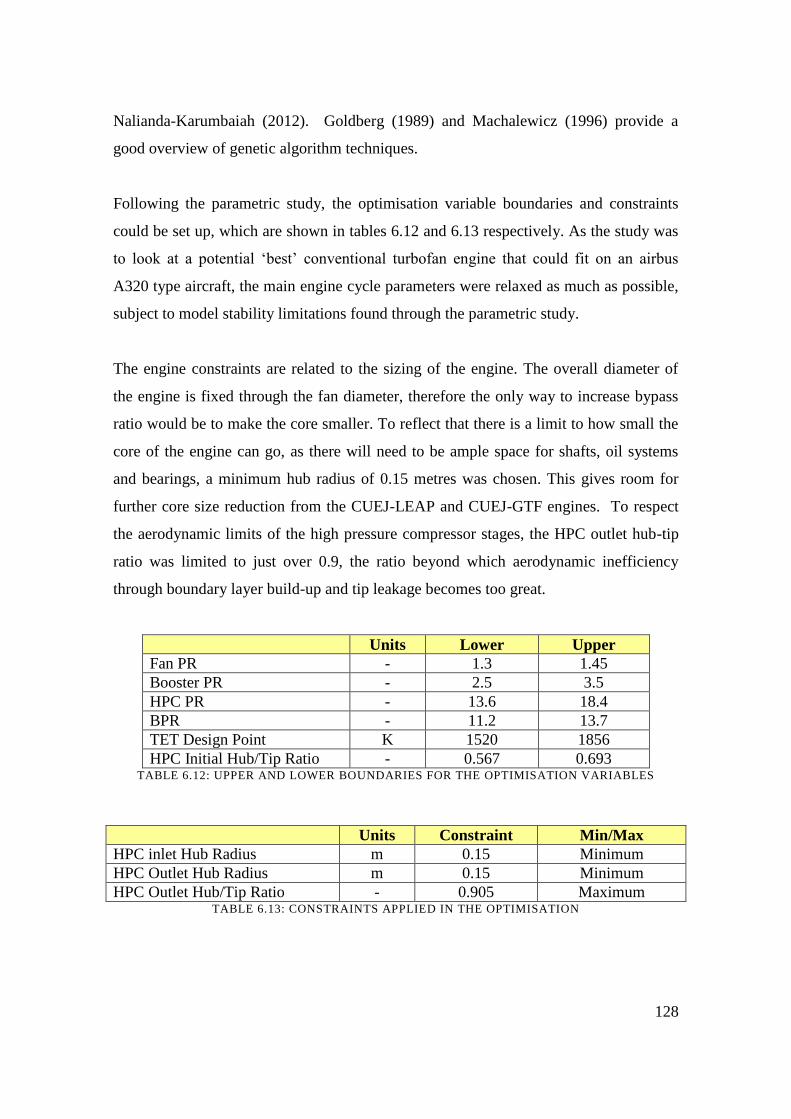
128
Nalianda-Karumbaiah (2012). Goldberg (1989) and Machalewicz (1996) provide a
good overview of genetic algorithm techniques.
Following the parametric study, the optimisation variable boundaries and constraints
could be set up, which are shown in tables 6.12 and 6.13 respectively. As the study was
to look at a potential ‘best’ conventional turbofan engine that could fit on an airbus
A320 type aircraft, the main engine cycle parameters were relaxed as much as possible,
subject to model stability limitations found through the parametric study.
The engine constraints are related to the sizing of the engine. The overall diameter of
the engine is fixed through the fan diameter, therefore the only way to increase bypass
ratio would be to make the core smaller. To reflect that there is a limit to how small the
core of the engine can go, as there will need to be ample space for shafts, oil systems
and bearings, a minimum hub radius of 0.15 metres was chosen. This gives room for
further core size reduction from the CUEJ-LEAP and CUEJ-GTF engines. To respect
the aerodynamic limits of the high pressure compressor stages, the HPC outlet hub-tip
ratio was limited to just over 0.9, the ratio beyond which aerodynamic inefficiency
through boundary layer build-up and tip leakage becomes too great.
Units Lower Upper
Fan PR - 1.3 1.45
Booster PR - 2.5 3.5
HPC PR - 13.6 18.4
BPR - 11.2 13.7
TET Design Point K 1520 1856
HPC Initial Hub/Tip Ratio - 0.567 0.693 TABLE 6.12: UPPER AND LOWER BOUNDARIES FOR THE OPTIMISATION VARIABLES
Units Constraint Min/Max
HPC inlet Hub Radius m 0.15 Minimum
HPC Outlet Hub Radius m 0.15 Minimum
HPC Outlet Hub/Tip Ratio - 0.905 Maximum TABLE 6.13: CONSTRAINTS APPLIED IN THE OPTIMISATION
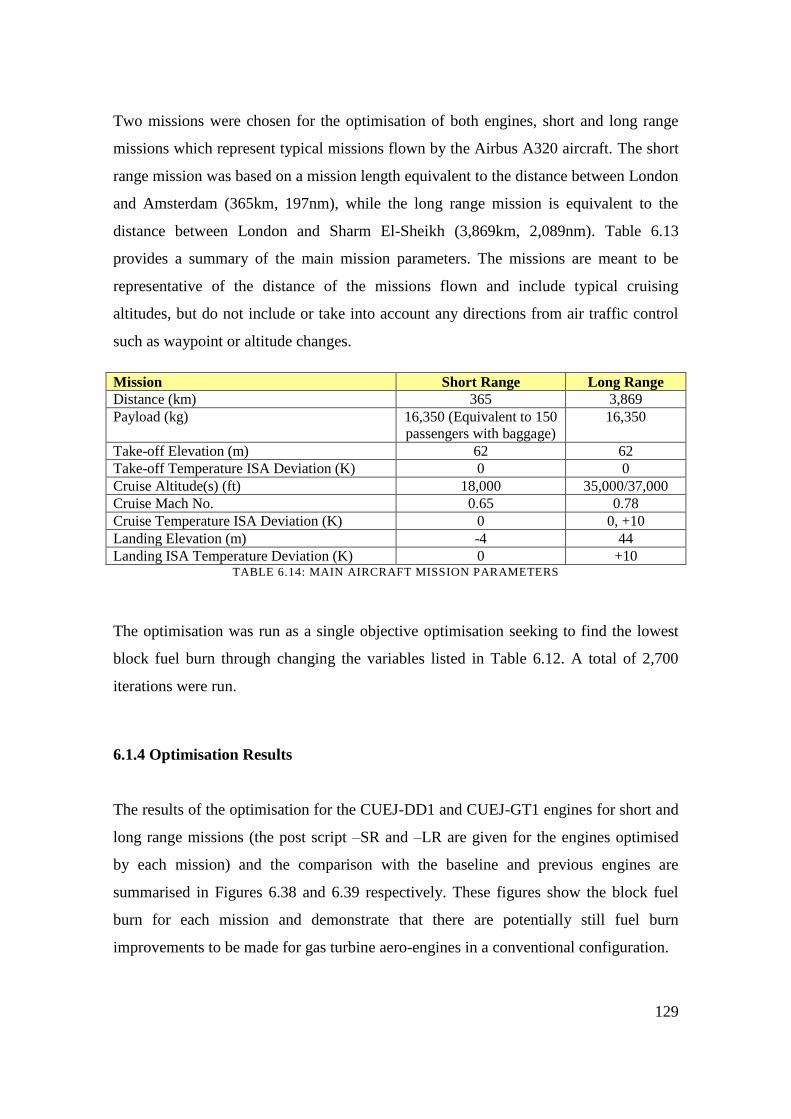
129
Two missions were chosen for the optimisation of both engines, short and long range
missions which represent typical missions flown by the Airbus A320 aircraft. The short
range mission was based on a mission length equivalent to the distance between London
and Amsterdam (365km, 197nm), while the long range mission is equivalent to the
distance between London and Sharm El-Sheikh (3,869km, 2,089nm). Table 6.13
provides a summary of the main mission parameters. The missions are meant to be
representative of the distance of the missions flown and include typical cruising
altitudes, but do not include or take into account any directions from air traffic control
such as waypoint or altitude changes.
Mission Short Range Long Range Distance (km) 365 3,869 Payload (kg) 16,350 (Equivalent to 150
passengers with baggage) 16,350
Take-off Elevation (m) 62 62 Take-off Temperature ISA Deviation (K) 0 0 Cruise Altitude(s) (ft) 18,000 35,000/37,000 Cruise Mach No. 0.65 0.78 Cruise Temperature ISA Deviation (K) 0 0, +10 Landing Elevation (m) -4 44 Landing ISA Temperature Deviation (K) 0 +10
TABLE 6.14: MAIN AIRCRAFT MISSION PARAMETERS
The optimisation was run as a single objective optimisation seeking to find the lowest
block fuel burn through changing the variables listed in Table 6.12. A total of 2,700
iterations were run.
6.1.4 Optimisation Results
The results of the optimisation for the CUEJ-DD1 and CUEJ-GT1 engines for short and
long range missions (the post script –SR and –LR are given for the engines optimised
by each mission) and the comparison with the baseline and previous engines are
summarised in Figures 6.38 and 6.39 respectively. These figures show the block fuel
burn for each mission and demonstrate that there are potentially still fuel burn
improvements to be made for gas turbine aero-engines in a conventional configuration.
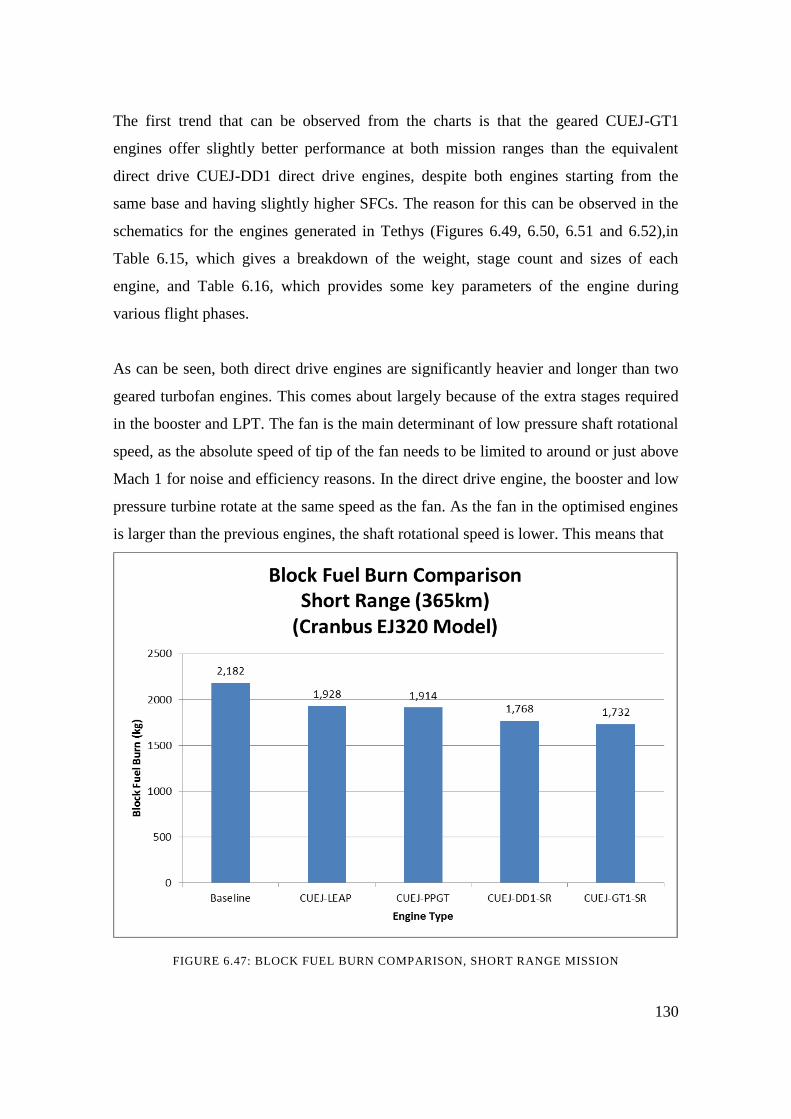
130
The first trend that can be observed from the charts is that the geared CUEJ-GT1
engines offer slightly better performance at both mission ranges than the equivalent
direct drive CUEJ-DD1 direct drive engines, despite both engines starting from the
same base and having slightly higher SFCs. The reason for this can be observed in the
schematics for the engines generated in Tethys (Figures 6.49, 6.50, 6.51 and 6.52),in
Table 6.15, which gives a breakdown of the weight, stage count and sizes of each
engine, and Table 6.16, which provides some key parameters of the engine during
various flight phases.
As can be seen, both direct drive engines are significantly heavier and longer than two
geared turbofan engines. This comes about largely because of the extra stages required
in the booster and LPT. The fan is the main determinant of low pressure shaft rotational
speed, as the absolute speed of tip of the fan needs to be limited to around or just above
Mach 1 for noise and efficiency reasons. In the direct drive engine, the booster and low
pressure turbine rotate at the same speed as the fan. As the fan in the optimised engines
is larger than the previous engines, the shaft rotational speed is lower. This means that
FIGURE 6.47: BLOCK FUEL BURN COMPARISON, SHORT RANGE MISSION
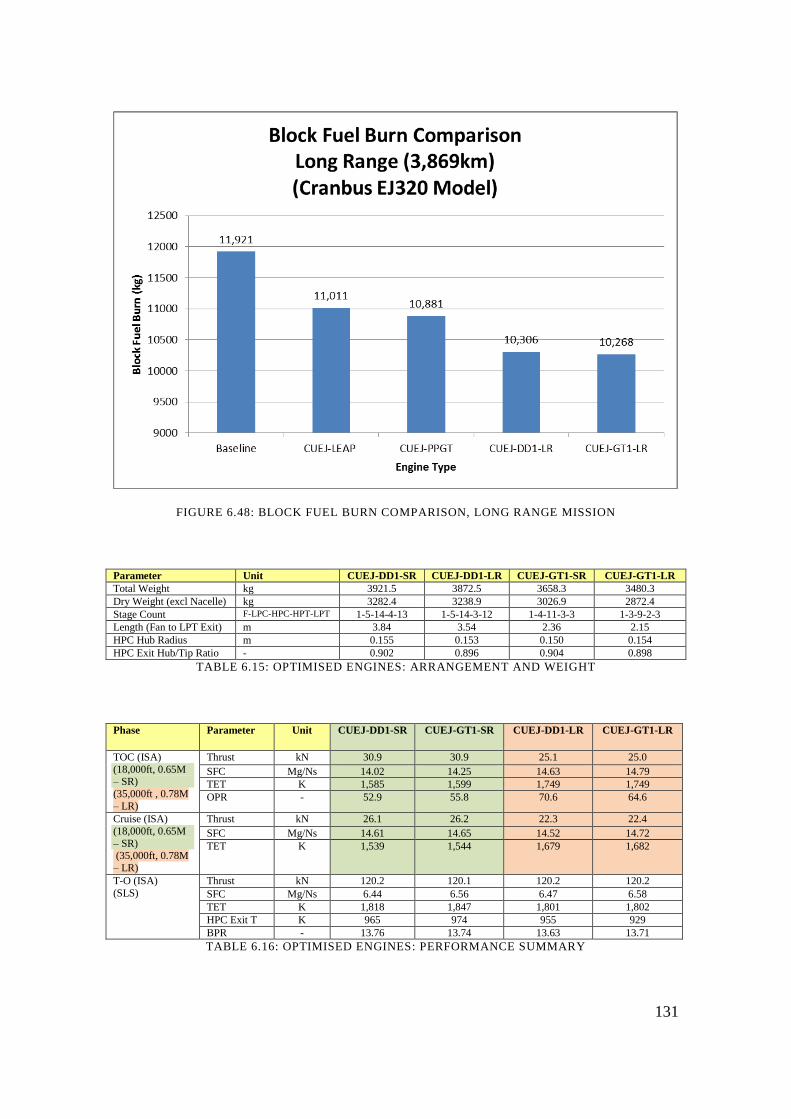
131
FIGURE 6.48: BLOCK FUEL BURN COMPARISON, LONG RANGE MISSION
Parameter Unit CUEJ-DD1-SR CUEJ-DD1-LR CUEJ-GT1-SR CUEJ-GT1-LR
Total Weight kg 3921.5 3872.5 3658.3 3480.3
Dry Weight (excl Nacelle) kg 3282.4 3238.9 3026.9 2872.4
Stage Count F-LPC-HPC-HPT-LPT 1-5-14-4-13 1-5-14-3-12 1-4-11-3-3 1-3-9-2-3
Length (Fan to LPT Exit) m 3.84 3.54 2.36 2.15
HPC Hub Radius m 0.155 0.153 0.150 0.154
HPC Exit Hub/Tip Ratio - 0.902 0.896 0.904 0.898
TABLE 6.15: OPTIMISED ENGINES: ARRANGEMENT AND WEIGHT
Phase Parameter Unit CUEJ-DD1-SR CUEJ-GT1-SR CUEJ-DD1-LR CUEJ-GT1-LR
TOC (ISA)
(18,000ft, 0.65M – SR)
(35,000ft , 0.78M
– LR)
Thrust kN 30.9 30.9 25.1 25.0
SFC Mg/Ns 14.02 14.25 14.63 14.79
TET K 1,585 1,599 1,749 1,749
OPR - 52.9 55.8 70.6 64.6
Cruise (ISA)
(18,000ft, 0.65M
– SR) (35,000ft, 0.78M
– LR)
Thrust kN 26.1 26.2 22.3 22.4
SFC Mg/Ns 14.61 14.65 14.52 14.72
TET K 1,539 1,544 1,679 1,682
T-O (ISA)
(SLS)
Thrust kN 120.2 120.1 120.2 120.2
SFC Mg/Ns 6.44 6.56 6.47 6.58
TET K 1,818 1,847 1,801 1,802
HPC Exit T K 965 974 955 929
BPR - 13.76 13.74 13.63 13.71
TABLE 6.16: OPTIMISED ENGINES: PERFORMANCE SUMMARY
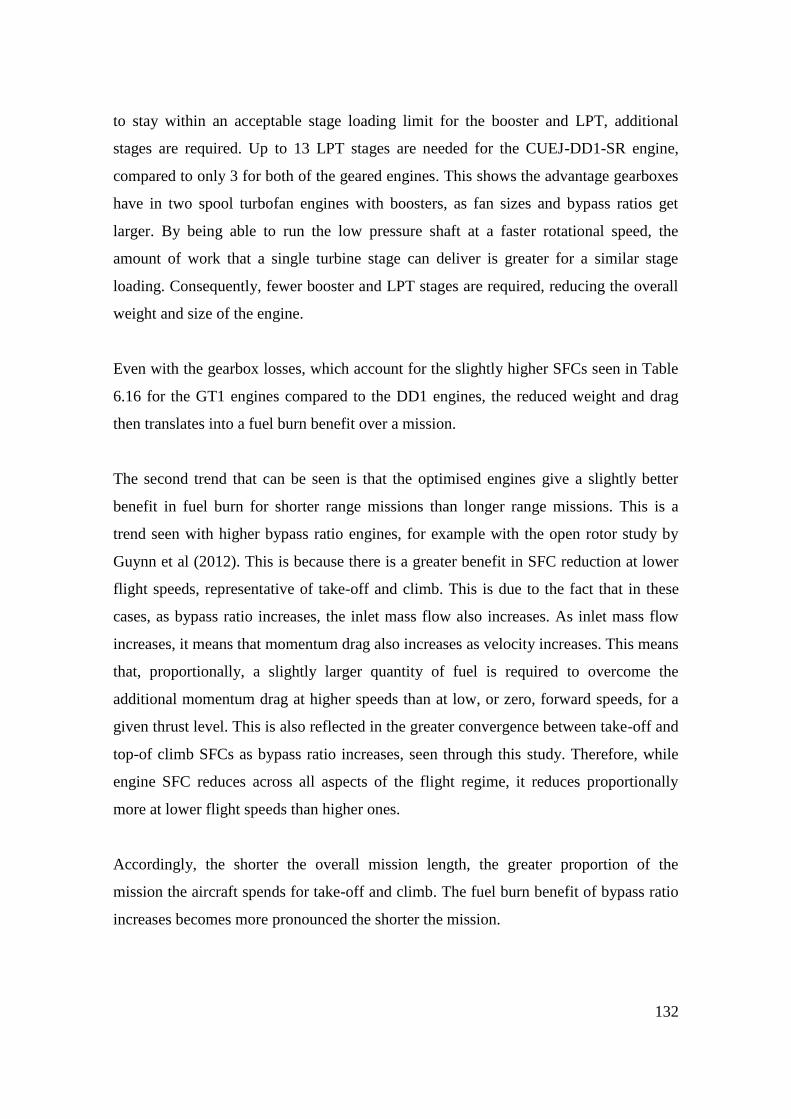
132
to stay within an acceptable stage loading limit for the booster and LPT, additional
stages are required. Up to 13 LPT stages are needed for the CUEJ-DD1-SR engine,
compared to only 3 for both of the geared engines. This shows the advantage gearboxes
have in two spool turbofan engines with boosters, as fan sizes and bypass ratios get
larger. By being able to run the low pressure shaft at a faster rotational speed, the
amount of work that a single turbine stage can deliver is greater for a similar stage
loading. Consequently, fewer booster and LPT stages are required, reducing the overall
weight and size of the engine.
Even with the gearbox losses, which account for the slightly higher SFCs seen in Table
6.16 for the GT1 engines compared to the DD1 engines, the reduced weight and drag
then translates into a fuel burn benefit over a mission.
The second trend that can be seen is that the optimised engines give a slightly better
benefit in fuel burn for shorter range missions than longer range missions. This is a
trend seen with higher bypass ratio engines, for example with the open rotor study by
Guynn et al (2012). This is because there is a greater benefit in SFC reduction at lower
flight speeds, representative of take-off and climb. This is due to the fact that in these
cases, as bypass ratio increases, the inlet mass flow also increases. As inlet mass flow
increases, it means that momentum drag also increases as velocity increases. This means
that, proportionally, a slightly larger quantity of fuel is required to overcome the
additional momentum drag at higher speeds than at low, or zero, forward speeds, for a
given thrust level. This is also reflected in the greater convergence between take-off and
top-of climb SFCs as bypass ratio increases, seen through this study. Therefore, while
engine SFC reduces across all aspects of the flight regime, it reduces proportionally
more at lower flight speeds than higher ones.
Accordingly, the shorter the overall mission length, the greater proportion of the
mission the aircraft spends for take-off and climb. The fuel burn benefit of bypass ratio
increases becomes more pronounced the shorter the mission.
133
An interesting trend is observed when comparing the results of the optimisation
between the short and long range missions - the engines optimised for short range
missions are heavier than their long range equivalents. At first glance this seems
surprising - it may be expected that the trend should be the other way round as weight
would likely be a considerable penalty during the climb phase for which the short range
engines have as a proportionally greater length of their missions. However, the answer
lies with the size of the engine. The longer range engines are shorter than the equivalent
short range engines. The short range mission has a cruising altitude of 18,000ft and a
cruise Mach number of 0.65, but due to the length of the mission, the cruise phase is
very short. By contrast, the engines optimised for the longer range mission have cruise
altitudes of 35,000/37,000ft with a cruise Mach number of 0.78 and spends a far greater
proportion of its time at cruise. These higher speeds mean that aerodynamic drag, which
increases with the square of flight velocity, becomes a much more influential factor.
Thus, an engine with a shorter nacelle would be more beneficial to an aircraft with
higher flight speeds, due to having a lower wetted area and smaller skin friction drag
component.
By comparing the take-off data in Table 6.15, it can be seen that the engines optimised
for the short range mission have slightly higher TET's and overall pressure ratios
(inferred from the HPC delivery temperature) than the equivalent engines optimised for
the longer range mission. Accordingly it can be seen that there is a trade of between
better engine cycle efficiency and sacrificing some of that efficiency if it means a
smaller engine, depending on the overall type of mission involved.
6.1.5 Fuel Burn Savings
Figures 6.47 and 6.48 show that potential fuel burn savings may be achievable for
future conventional turbofan engines compared to the engines that are currently being
released as part of the Airbus A320 NEO programme. The gains shown on those charts
are between 5% and 9% for the best case scenario and reduce as mission length
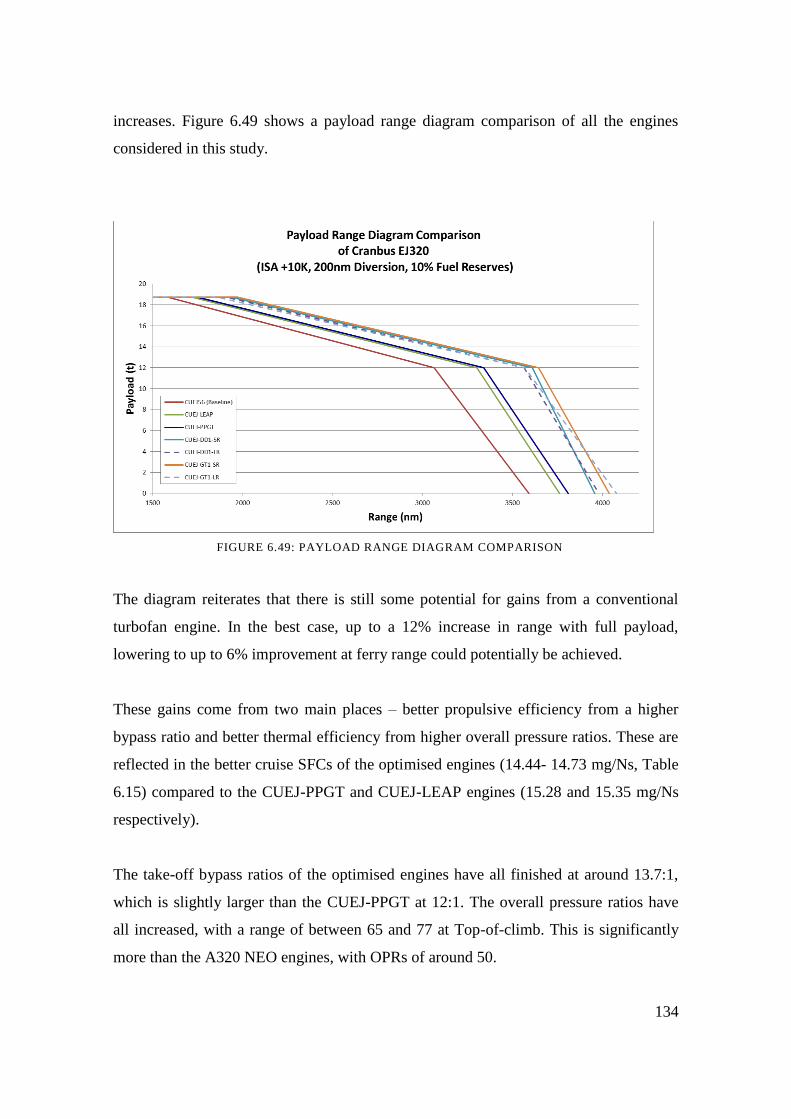
134
increases. Figure 6.49 shows a payload range diagram comparison of all the engines
considered in this study.
The diagram reiterates that there is still some potential for gains from a conventional
turbofan engine. In the best case, up to a 12% increase in range with full payload,
lowering to up to 6% improvement at ferry range could potentially be achieved.
These gains come from two main places – better propulsive efficiency from a higher
bypass ratio and better thermal efficiency from higher overall pressure ratios. These are
reflected in the better cruise SFCs of the optimised engines (14.44- 14.73 mg/Ns, Table
6.15) compared to the CUEJ-PPGT and CUEJ-LEAP engines (15.28 and 15.35 mg/Ns
respectively).
The take-off bypass ratios of the optimised engines have all finished at around 13.7:1,
which is slightly larger than the CUEJ-PPGT at 12:1. The overall pressure ratios have
all increased, with a range of between 65 and 77 at Top-of-climb. This is significantly
more than the A320 NEO engines, with OPRs of around 50.
FIGURE 6.49: PAYLOAD RANGE DIAGRAM COMPARISON
135
6.1.6 Limits to Achieving Gains
There are three main reasons why the potential fuel burn gains may not be realised.
These are:
1. Core size
2. HPC delivery temperature
3. Turbine cooling requirements
The bypass ratio of a turbofan engine can be increased either by increasing the size of
the fan, decreasing the size of the core or a combination of the two. For the optimised
engines, the fan diameter was fixed to the size of engine that could potentially fit under
a current Airbus A320 aircraft. To allow for an increase in bypass ratio, the allowable
size of the high pressure shaft hub diameter was reduced to 0.15m. This was to allow
for higher pressure ratios to be achieved with an acceptable hub-tip ratio. If this hub size
reduction cannot be achieved, perhaps because of material stress limits, then it is
unlikely that the bypass ratio and pressure ratios achieved could be met, unless a larger
engine could be accommodated elsewhere on the aircraft.
As per Kyprianidis (2010), the interest in intercooling engines comes about because it
allows for higher pressure ratios to be achieved due to HPC material considerations. As
pressure ratios get higher, the HPC delivery temperature increases. This creates
potential problems for the last few rows of HPC blades and discs, as these components
are not cooled. Typically, titanium alloys used in compressor blades have a temperature
limit of 540oC (813K) (Leyens, 2004), which means that if temperatures higher than this
are reached, Nickel based superalloys (with a limit of about 1,000oC, 1273K), which are
much heavier, need to be used. If temperatures higher than about 1,250K are used, then
cooling would be required, which would be difficult to achieve.
The HPC delivery temperatures of the optimised engines at take-off are up to 973K,
which is significantly hotter than the limit for current titanium alloys, although this
temperature could be withstood by Nickel superalloys. Titanium aluminides are being
136
researched that have the potential to withstand temperatures of up to 800oC (1,073K),
which would help in achieving higher HPC delivery temperatures.
Turbine cooling requirements are always an item of consideration for new engine
designs. The trend towards better thermal efficiency means higher OPRs and TETs.
This places a double effect on the turbines. Firstly, higher TETs mean that turbines may
require more cooling to keep the blades, as well as discs and annulus walls, at an
acceptable temperature for creep and fatigue life, as well as oxidation requirements. The
higher pressure ratios also result in higher HPC delivery temperatures, which is where
turbine cooling flows are normally extracted from. A higher HPC delivery temperature
would likely mean a greater turbine cooling flow is required, which would further
impinge on efficiency.
For this study, it was assumed that turbine cooling flows remains the same as for the
previous engines, which would therefore mean that turbine cooling technology
advances. Although the absolute TET at take-off remains broadly consistent across the
optimised engines compared to the A320 NEO engines, TETs have risen at top-of-climb
and cruise, due to the larger engines requiring more fuel to overcome momentum drag
for a given thrust. This could affect creep life as the engine spends proportionally more
time at cruise than take-off. In addition, the higher OPRs and consequently higher HPC
delivery temperatures could affect turbine cooling flows. Turbine cooling is a
significant area of gas turbine research, and treatments such as thermal barrier coatings
are seen as way to ameliorate the effects of high temperatures in the shorter term, with
ceramic matrix composite blades over the longer term (Li et al, 2014), although
significant challenges in fabrication, oxidation, corrosion and high stress region design
need to be overcome. Accordingly, there remains some uncertainty as to whether the
potential fuel benefits could be reached. TURBOMATCH does not currently have the
capability to study the effects of turbine cooling flows, so this uncertainty could not be
analysed. A recommendation for further research would be to analyse the effects of
turbine cooling flows.
137
The issue of NOx formation should also be considered. NOx is an important issue for
aviation, as it has effects both on the ground, where NOx emissions can cause adverse
health effects, and higher up in the atmosphere where they can contribute to global
warming and have an impact on the ozone layer (Schumann, 1997).
NOx is formed within an engine in four main ways: “thermal NO, nitrous oxide
mechanism, prompt NO, and fuel NO” (Lefebvre, 2010, p.374). Thermal NO is
produced within high temperature regions in the combustion chamber, through the
oxidation of nitrogen within the air using the Zeldovich mechanism (ibid.). Thermal NO
formation is generally low at temperatures below 1850K and is controlled mostly by
flame temperature with an exponential relationship between NO formation and
temperature. Residence time within the combustor is also important, with thermal NO
production increasing with for a larger residence time, unless the fuel-air ratio is very
lean. Increasing combustor inlet pressure and temperature also have an effect on
increasing thermal NO production. Nitrous oxide mechanism refers to the reaction
between N2 in the air through to NO via nitrous oxide, N2O.
Prompt NO can be found under some conditions in the very early flame region and can
be a significant contributor to NOx emissions under lean premix conditions (ibid.). The
role of inlet pressure on Prompt NO production is uncertain (ibid.). Fuel NO is formed
through organically bonded nitrogen that exists is some fuels, and thus the quantity
formed is largely dependent on the fuel used.
Current NOx legislation focuses primarily on local air quality issues and as such
restricts NOx emissions around airports. It is determined by way of the ICAO landing
and take-off (LTO) cycle. The LTO cycle is determined by running a test engine at
different power settings to reflect different phases of the LTO cycle for different periods
of time and measuring the total amount of gaseous emissions. The result is then divided
by the gross thrust at sea level to give the so called 'NOx characteristic' (DP/Foo) which
means that different engines can be compared. The components that make up the LTO
cycle are:
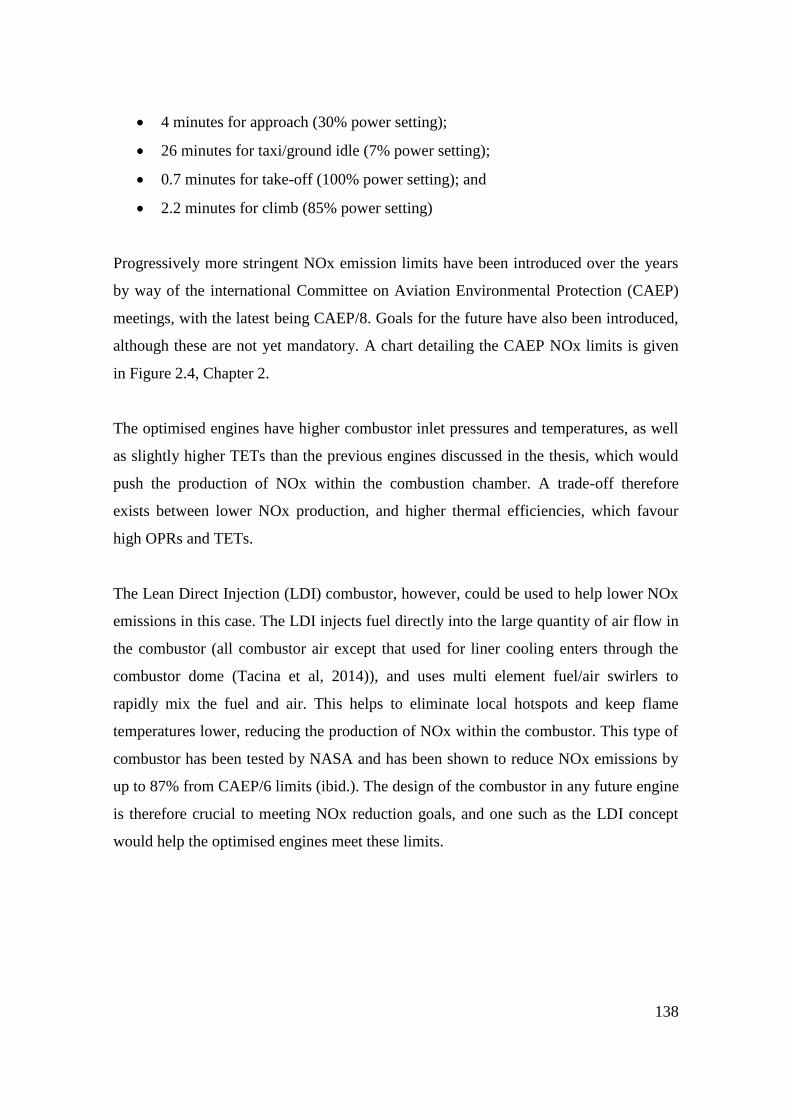
138
4 minutes for approach (30% power setting);
26 minutes for taxi/ground idle (7% power setting);
0.7 minutes for take-off (100% power setting); and
2.2 minutes for climb (85% power setting)
Progressively more stringent NOx emission limits have been introduced over the years
by way of the international Committee on Aviation Environmental Protection (CAEP)
meetings, with the latest being CAEP/8. Goals for the future have also been introduced,
although these are not yet mandatory. A chart detailing the CAEP NOx limits is given
in Figure 2.4, Chapter 2.
The optimised engines have higher combustor inlet pressures and temperatures, as well
as slightly higher TETs than the previous engines discussed in the thesis, which would
push the production of NOx within the combustion chamber. A trade-off therefore
exists between lower NOx production, and higher thermal efficiencies, which favour
high OPRs and TETs.
The Lean Direct Injection (LDI) combustor, however, could be used to help lower NOx
emissions in this case. The LDI injects fuel directly into the large quantity of air flow in
the combustor (all combustor air except that used for liner cooling enters through the
combustor dome (Tacina et al, 2014)), and uses multi element fuel/air swirlers to
rapidly mix the fuel and air. This helps to eliminate local hotspots and keep flame
temperatures lower, reducing the production of NOx within the combustor. This type of
combustor has been tested by NASA and has been shown to reduce NOx emissions by
up to 87% from CAEP/6 limits (ibid.). The design of the combustor in any future engine
is therefore crucial to meeting NOx reduction goals, and one such as the LDI concept
would help the optimised engines meet these limits.
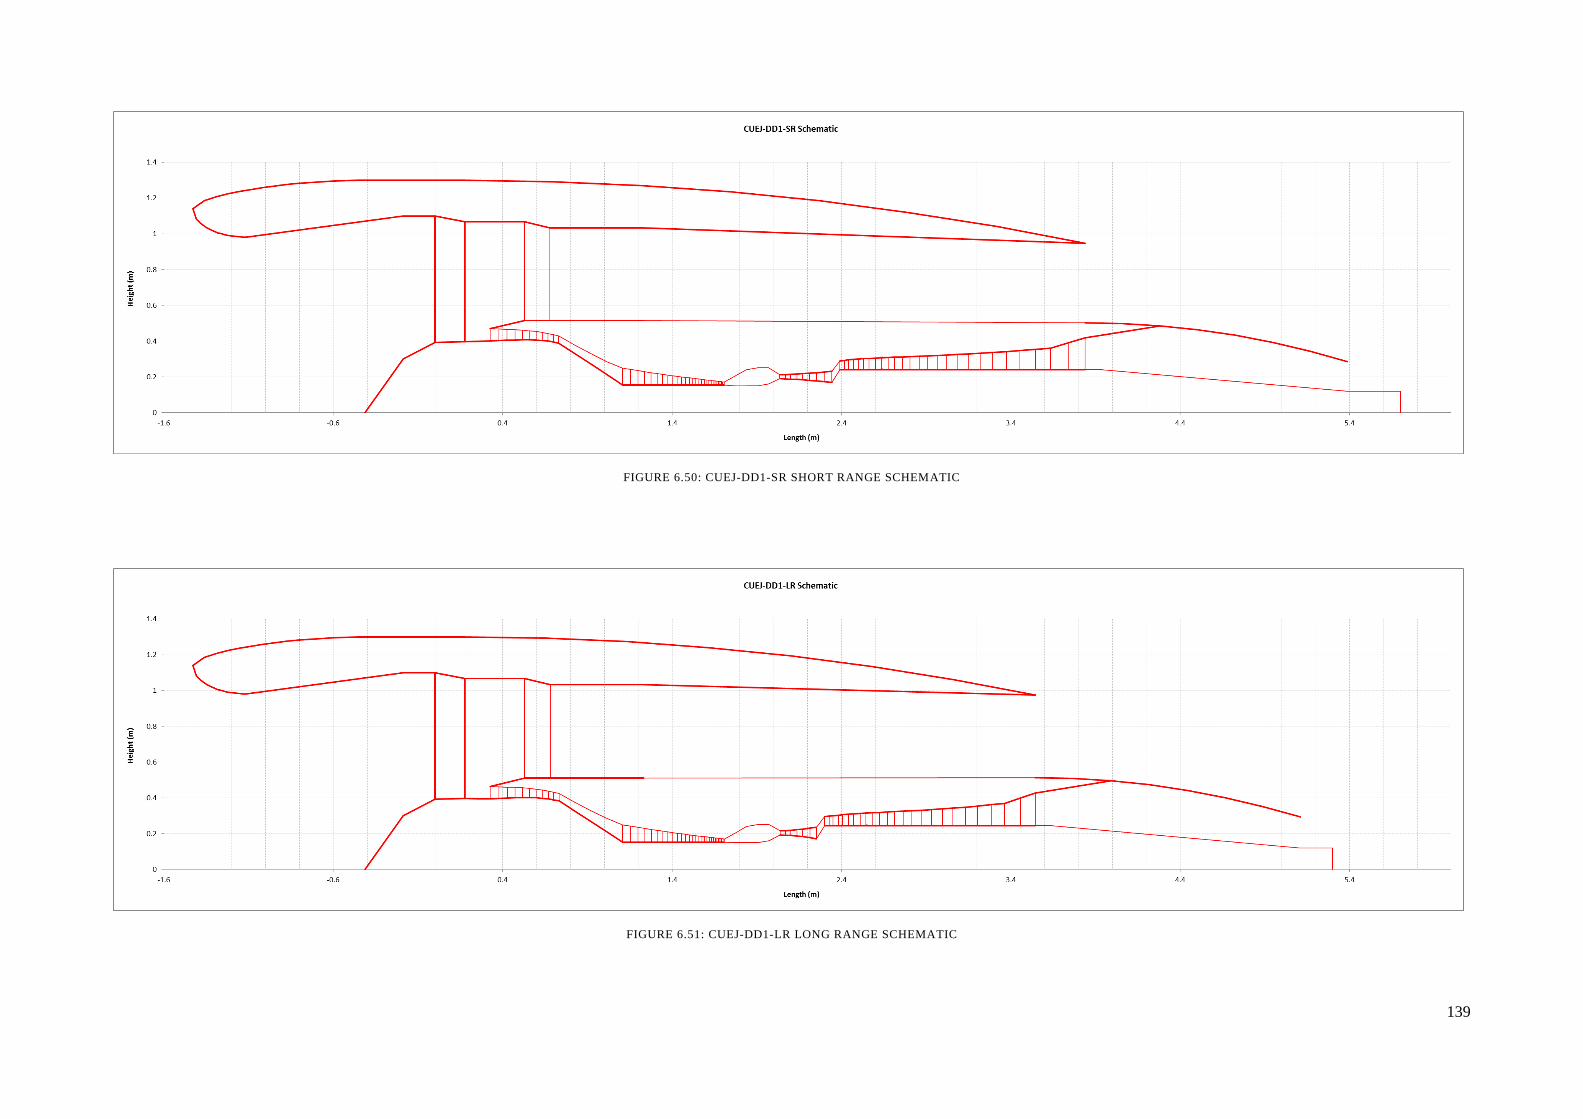
139
FIGURE 6.50: CUEJ-DD1-SR SHORT RANGE SCHEMATIC
FIGURE 6.51: CUEJ-DD1-LR LONG RANGE SCHEMATIC
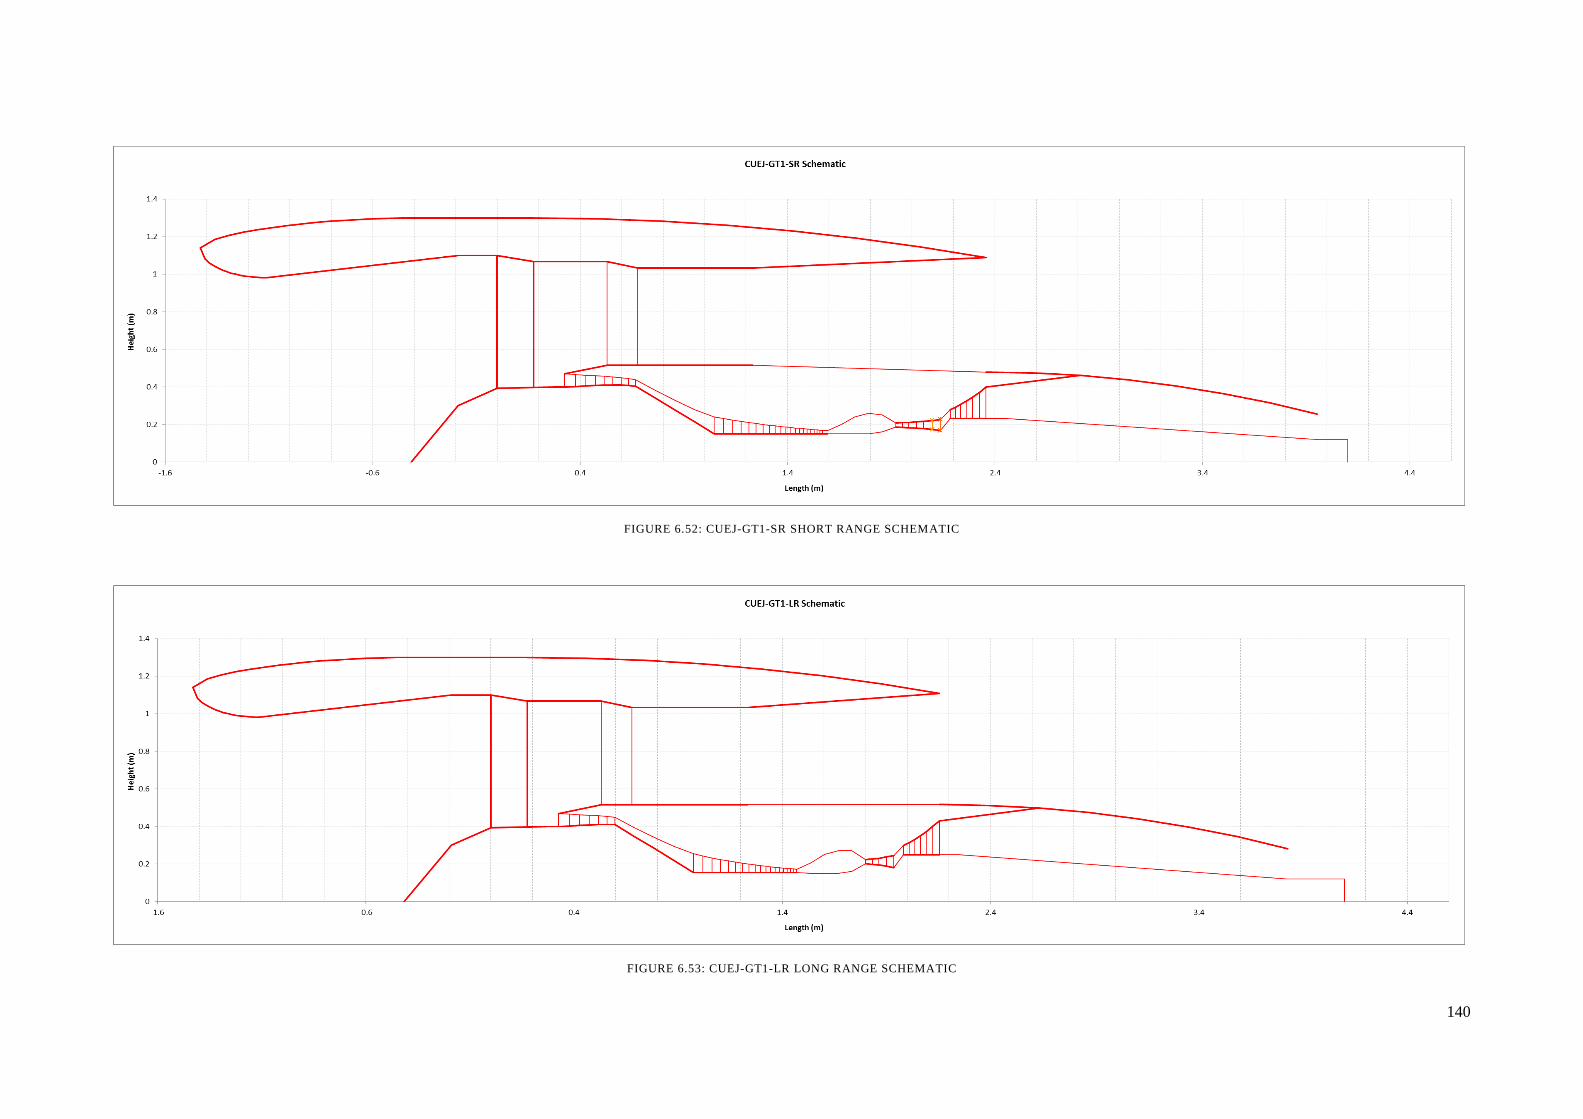
140
FIGURE 6.52: CUEJ-GT1-SR SHORT RANGE SCHEMATIC
FIGURE 6.53: CUEJ-GT1-LR LONG RANGE SCHEMATIC
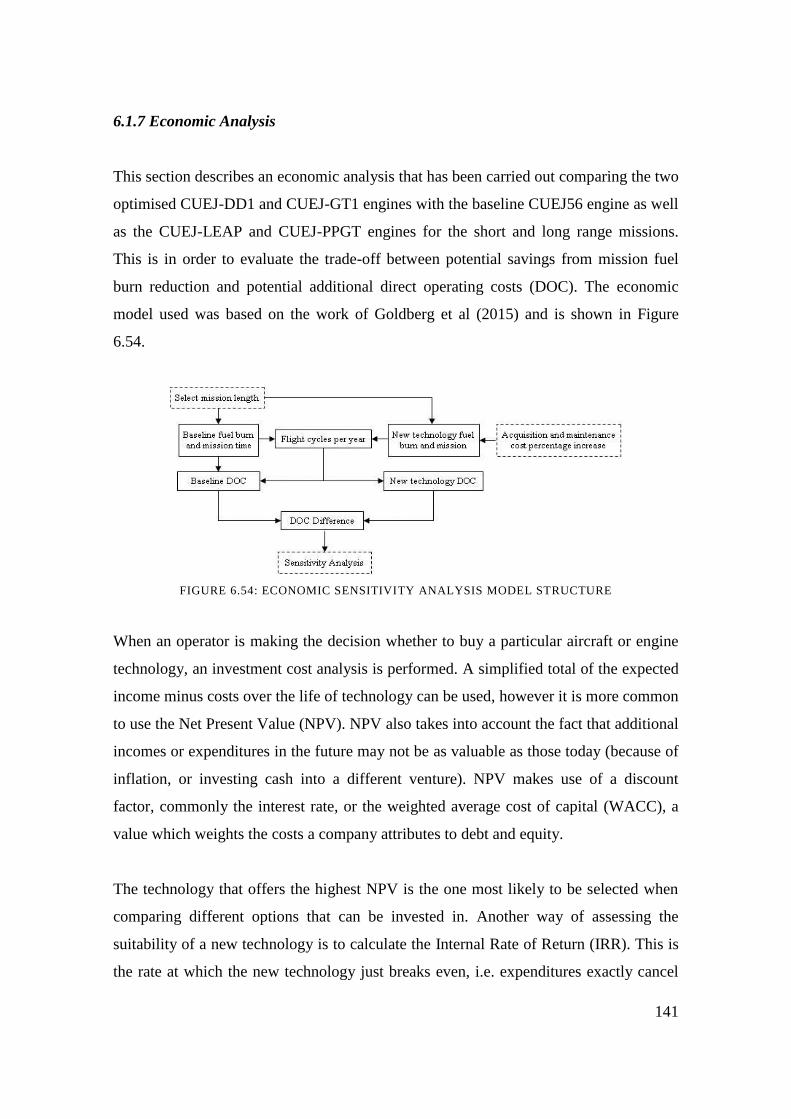
141
6.1.7 Economic Analysis
This section describes an economic analysis that has been carried out comparing the two
optimised CUEJ-DD1 and CUEJ-GT1 engines with the baseline CUEJ56 engine as well
as the CUEJ-LEAP and CUEJ-PPGT engines for the short and long range missions.
This is in order to evaluate the trade-off between potential savings from mission fuel
burn reduction and potential additional direct operating costs (DOC). The economic
model used was based on the work of Goldberg et al (2015) and is shown in Figure
6.54.
FIGURE 6.54: ECONOMIC SENSITIVITY ANALYSIS MODEL STRUCTURE
When an operator is making the decision whether to buy a particular aircraft or engine
technology, an investment cost analysis is performed. A simplified total of the expected
income minus costs over the life of technology can be used, however it is more common
to use the Net Present Value (NPV). NPV also takes into account the fact that additional
incomes or expenditures in the future may not be as valuable as those today (because of
inflation, or investing cash into a different venture). NPV makes use of a discount
factor, commonly the interest rate, or the weighted average cost of capital (WACC), a
value which weights the costs a company attributes to debt and equity.
The technology that offers the highest NPV is the one most likely to be selected when
comparing different options that can be invested in. Another way of assessing the
suitability of a new technology is to calculate the Internal Rate of Return (IRR). This is
the rate at which the new technology just breaks even, i.e. expenditures exactly cancel
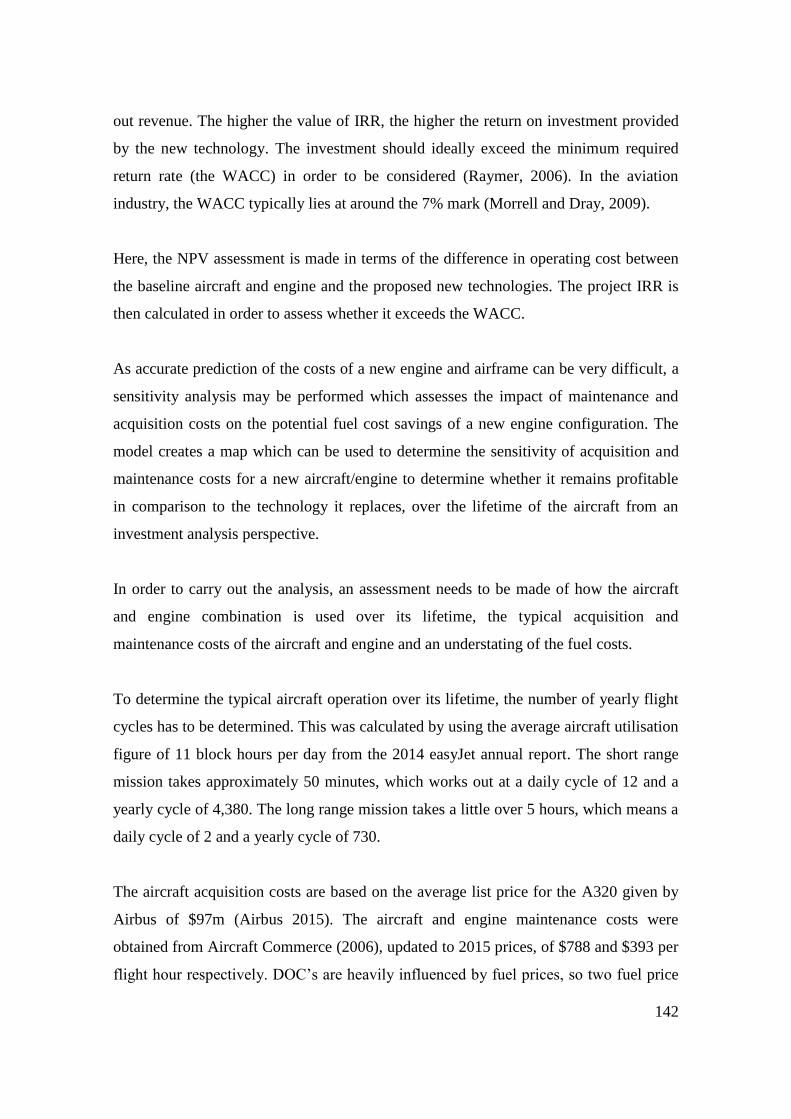
142
out revenue. The higher the value of IRR, the higher the return on investment provided
by the new technology. The investment should ideally exceed the minimum required
return rate (the WACC) in order to be considered (Raymer, 2006). In the aviation
industry, the WACC typically lies at around the 7% mark (Morrell and Dray, 2009).
Here, the NPV assessment is made in terms of the difference in operating cost between
the baseline aircraft and engine and the proposed new technologies. The project IRR is
then calculated in order to assess whether it exceeds the WACC.
As accurate prediction of the costs of a new engine and airframe can be very difficult, a
sensitivity analysis may be performed which assesses the impact of maintenance and
acquisition costs on the potential fuel cost savings of a new engine configuration. The
model creates a map which can be used to determine the sensitivity of acquisition and
maintenance costs for a new aircraft/engine to determine whether it remains profitable
in comparison to the technology it replaces, over the lifetime of the aircraft from an
investment analysis perspective.
In order to carry out the analysis, an assessment needs to be made of how the aircraft
and engine combination is used over its lifetime, the typical acquisition and
maintenance costs of the aircraft and engine and an understating of the fuel costs.
To determine the typical aircraft operation over its lifetime, the number of yearly flight
cycles has to be determined. This was calculated by using the average aircraft utilisation
figure of 11 block hours per day from the 2014 easyJet annual report. The short range
mission takes approximately 50 minutes, which works out at a daily cycle of 12 and a
yearly cycle of 4,380. The long range mission takes a little over 5 hours, which means a
daily cycle of 2 and a yearly cycle of 730.
The aircraft acquisition costs are based on the average list price for the A320 given by
Airbus of $97m (Airbus 2015). The aircraft and engine maintenance costs were
obtained from Aircraft Commerce (2006), updated to 2015 prices, of $788 and $393 per
flight hour respectively. DOC’s are heavily influenced by fuel prices, so two fuel price
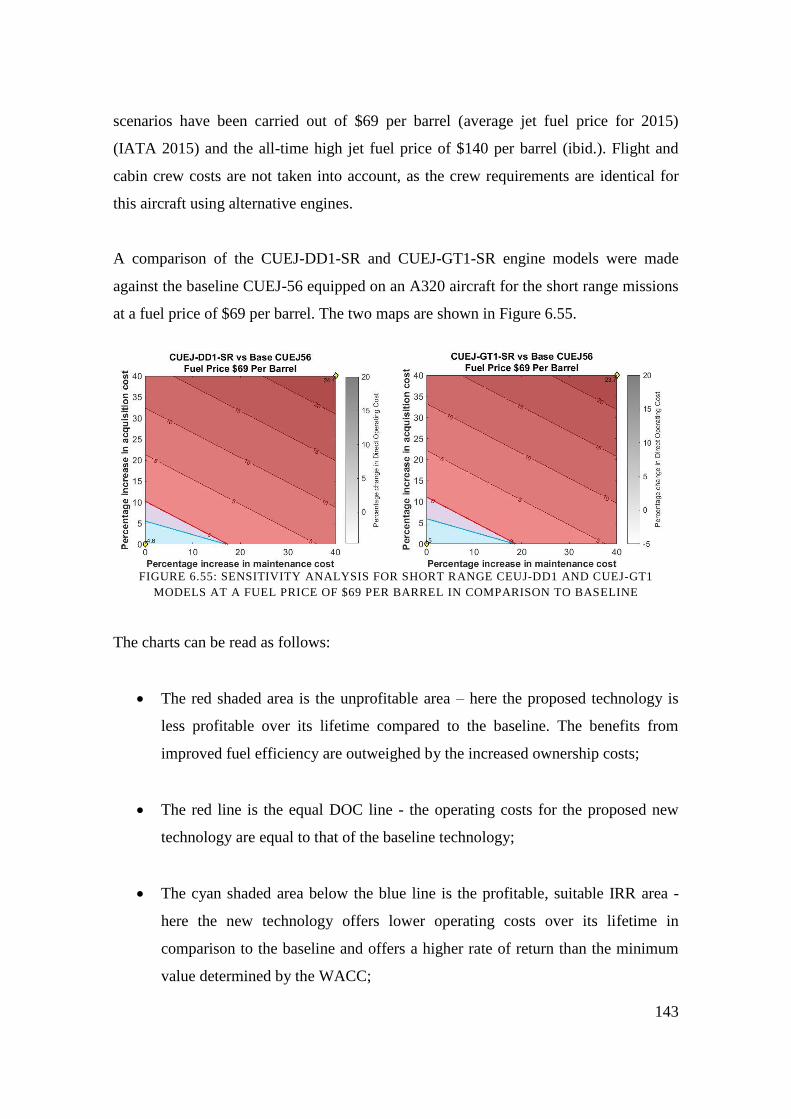
143
scenarios have been carried out of $69 per barrel (average jet fuel price for 2015)
(IATA 2015) and the all-time high jet fuel price of $140 per barrel (ibid.). Flight and
cabin crew costs are not taken into account, as the crew requirements are identical for
this aircraft using alternative engines.
A comparison of the CUEJ-DD1-SR and CUEJ-GT1-SR engine models were made
against the baseline CUEJ-56 equipped on an A320 aircraft for the short range missions
at a fuel price of $69 per barrel. The two maps are shown in Figure 6.55.
FIGURE 6.55: SENSITIVITY ANALYSIS FOR SHORT RANGE CEUJ-DD1 AND CUEJ-GT1
MODELS AT A FUEL PRICE OF $69 PER BARREL IN COMPARISON TO BASELINE
The charts can be read as follows:
The red shaded area is the unprofitable area – here the proposed technology is
less profitable over its lifetime compared to the baseline. The benefits from
improved fuel efficiency are outweighed by the increased ownership costs;
The red line is the equal DOC line - the operating costs for the proposed new
technology are equal to that of the baseline technology;
The cyan shaded area below the blue line is the profitable, suitable IRR area -
here the new technology offers lower operating costs over its lifetime in
comparison to the baseline and offers a higher rate of return than the minimum
value determined by the WACC;
144
The small grey wedge between the cyan and red lines is the profitable,
inadequate IRR area – although the DOC’s of the new technologies are lower
than the baseline, the technology does not offer a suitable rate of return;
On the axes, a value of 0 represents aircraft and engine acquisition and
maintenance costs that are the same as the baseline. Moving away from the
origin represents percentage increases in maintenance and acquisition costs of
the new technology compared to the baseline.
The maps show that for a $69 per barrel fuel price, there is a significant profitable
margin for both engines, compared to the baseline. To be economically attractive (i.e.
offer a better rate of return than the baseline and the WACC of 7%), the combined
acquisition costs of aircraft and engine need to be up to approximately 5% more
expensive than the baseline engine. If maintenance costs also increase from the base
level, then the acceptable acquisition costs reduces. The maintenance costs can increase
to approximately 16-17% from the base level for the new technologies to be attractive,
for no increase in acquisition costs. Comparing the two engines, the CUEJ-GT1-SR
offers slightly increased margins due to the slightly better fuel burn for the short range
mission.
If fuel costs increase, however, then the margins increase. Figure 6.56 shows the same
maps using a fuel price of $140 per barrel, which is the all-time high for a barrel of jet
fuel and approximately 100% higher than the average 2015 jet fuel price.
145
FIGURE 6.56: SENSITIVITY ANALYSIS FOR SHORT RANGE CEUJ-DD1 AND CUEJ-GT1
MODELS AT A FUEL PRICE OF $140 PER BARREL IN COMPARISON TO BASELINE
The maps show that an increase in fuel price means a significant increase in the
profitable area for both engines. For the CUEJ-DD1-SR, it can accommodate an
approximately 11% rise in aircraft and engine acquisition costs to remain economically
attractive, while maintenance costs can increase to approximately 35%. Once again the
CUEJ-GT1-SR shows a slightly better margin to 12% acquisition and 36% maintenance
costs.
For the long range cases, shown in Figures 6.57 and 6.58, the same general trends are
followed; larger acquisition and maintenance costs can be absorbed as the fuel price
increases. This reinforces what was seen during the 1970’s and 1980’s during the fuel
price shock, which saw increased demand and interest in developing more fuel efficient
aero-engines. Once the price reduced, interest in these new technologies waned. As the
charts show, an increase in the fuel price allows room for acquisition costs to increase
(allowing manufacturers to invest in research and development) and maintenance costs
to increase (to allow for the potential of more difficult or expensive to maintain
technologies) and still provide an acceptable rate of return for the airline.
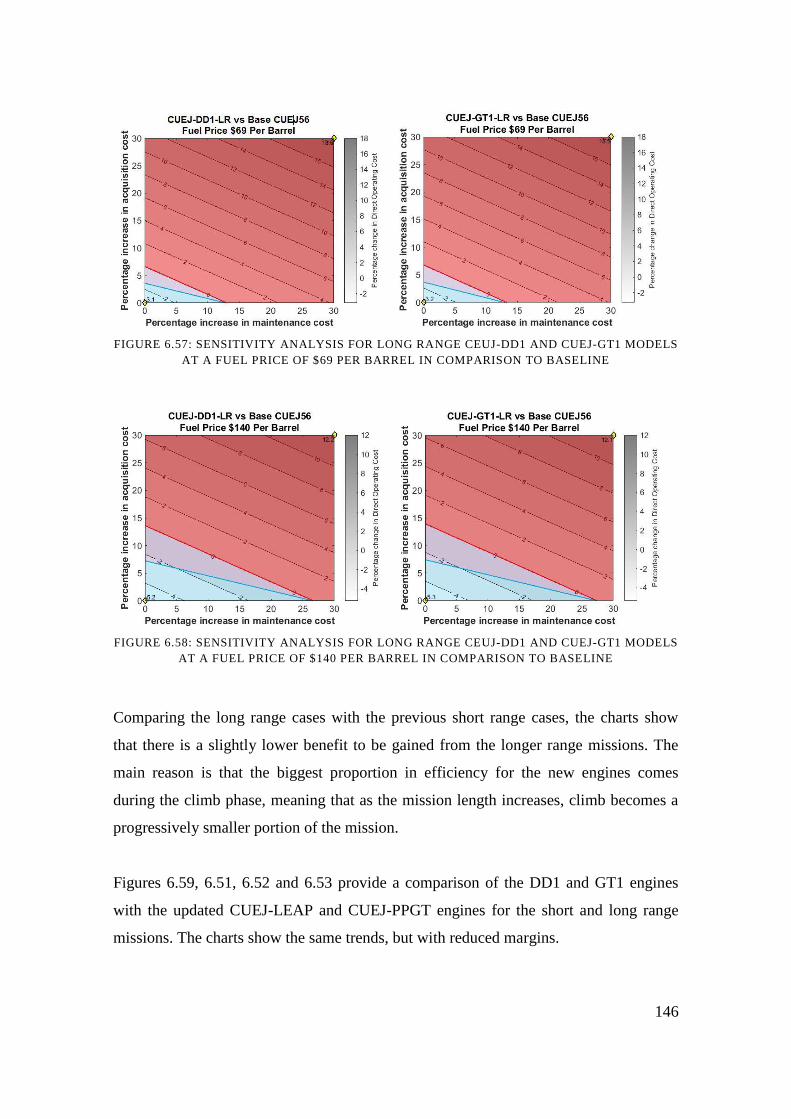
146
FIGURE 6.57: SENSITIVITY ANALYSIS FOR LONG RANGE CEUJ-DD1 AND CUEJ-GT1 MODELS
AT A FUEL PRICE OF $69 PER BARREL IN COMPARISON TO BASELINE
FIGURE 6.58: SENSITIVITY ANALYSIS FOR LONG RANGE CEUJ-DD1 AND CUEJ-GT1 MODELS
AT A FUEL PRICE OF $140 PER BARREL IN COMPARISON TO BASELINE
Comparing the long range cases with the previous short range cases, the charts show
that there is a slightly lower benefit to be gained from the longer range missions. The
main reason is that the biggest proportion in efficiency for the new engines comes
during the climb phase, meaning that as the mission length increases, climb becomes a
progressively smaller portion of the mission.
Figures 6.59, 6.51, 6.52 and 6.53 provide a comparison of the DD1 and GT1 engines
with the updated CUEJ-LEAP and CUEJ-PPGT engines for the short and long range
missions. The charts show the same trends, but with reduced margins.
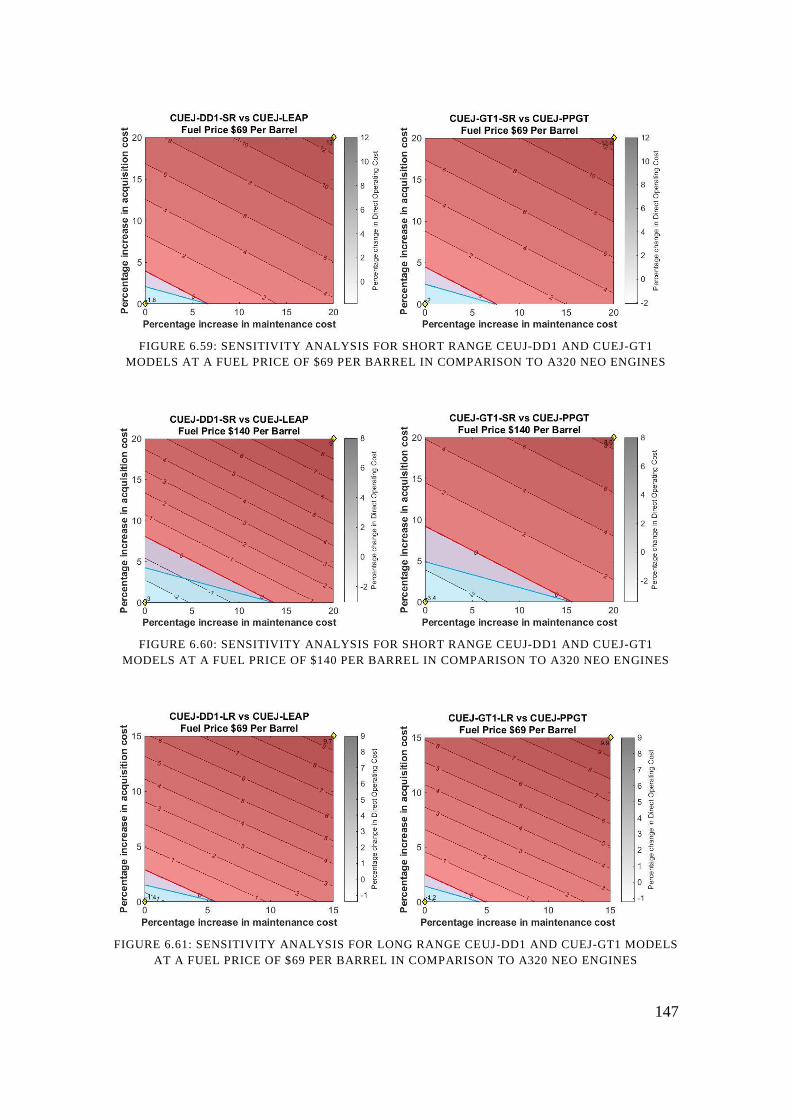
147
FIGURE 6.59: SENSITIVITY ANALYSIS FOR SHORT RANGE CEUJ-DD1 AND CUEJ-GT1
MODELS AT A FUEL PRICE OF $69 PER BARREL IN COMPARISON TO A320 NEO ENGINES
FIGURE 6.60: SENSITIVITY ANALYSIS FOR SHORT RANGE CEUJ-DD1 AND CUEJ-GT1
MODELS AT A FUEL PRICE OF $140 PER BARREL IN COMPARISON TO A320 NEO ENGINES
FIGURE 6.61: SENSITIVITY ANALYSIS FOR LONG RANGE CEUJ-DD1 AND CUEJ-GT1 MODELS
AT A FUEL PRICE OF $69 PER BARREL IN COMPARISON TO A320 NEO ENGINES
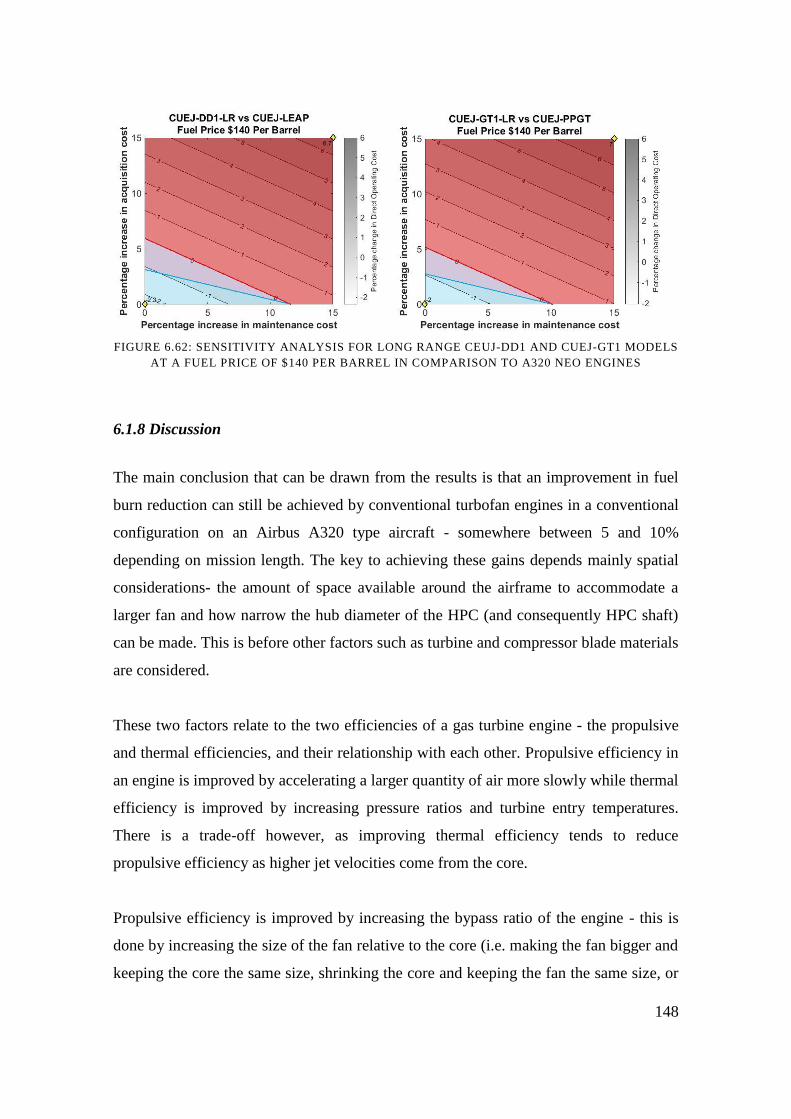
148
FIGURE 6.62: SENSITIVITY ANALYSIS FOR LONG RANGE CEUJ-DD1 AND CUEJ-GT1 MODELS
AT A FUEL PRICE OF $140 PER BARREL IN COMPARISON TO A320 NEO ENGINES
6.1.8 Discussion
The main conclusion that can be drawn from the results is that an improvement in fuel
burn reduction can still be achieved by conventional turbofan engines in a conventional
configuration on an Airbus A320 type aircraft - somewhere between 5 and 10%
depending on mission length. The key to achieving these gains depends mainly spatial
considerations- the amount of space available around the airframe to accommodate a
larger fan and how narrow the hub diameter of the HPC (and consequently HPC shaft)
can be made. This is before other factors such as turbine and compressor blade materials
are considered.
These two factors relate to the two efficiencies of a gas turbine engine - the propulsive
and thermal efficiencies, and their relationship with each other. Propulsive efficiency in
an engine is improved by accelerating a larger quantity of air more slowly while thermal
efficiency is improved by increasing pressure ratios and turbine entry temperatures.
There is a trade-off however, as improving thermal efficiency tends to reduce
propulsive efficiency as higher jet velocities come from the core.
Propulsive efficiency is improved by increasing the bypass ratio of the engine - this is
done by increasing the size of the fan relative to the core (i.e. making the fan bigger and
keeping the core the same size, shrinking the core and keeping the fan the same size, or
149
combinations of the two). A thrust requirement exists for the airframe and engine
combination in order for the aircraft to carry out its mission which means that the
overall engine will have to be of a sufficient size to provide the required thrust.
Ultimately the limit to the bypass ratio for an engine on a conventional airframe will be
the amount of space available to accommodate a larger bypass ratio and fan. Current jet
aircraft designs mount the engines under the wing, limiting the amount of space
available for the engine - the Boeing 737 suffers from this with a modified nacelle
design and a smaller bypass ratio for the 737 MAX engines compared to the A320
NEO. Increasing the fan diameter further will eventually require the engine being
mounted elsewhere upon the airframe, necessitating a whole new aircraft design.
Thermal efficiency is improved by increasing the pressure ratio and/or the combustion
temperature of the engine, although these will also be linked to the thrust required by
the engine and bypass ratio of the engine. As pressure ratio increases, this has the effect
of reducing the hub radius of the HPC in particular, due to the shrinking annulus area
and the requirement to have acceptable blade hub-tip ratios for good component
efficiency. There will also be a limit to how small the HPC hub radius can be, as
multiple shafts, oil systems, bearings and cooling systems will have to fit into a smaller
and smaller spaces. This can be offset to some degree, by designing turbomachinery
blades having larger hub-tip ratios or altering the axial flow velocity profile within the
core of the engine so that the annulus cross sectional area shrinks at a smaller rate.
However there also limits to this and these changes would have an impact on
efficiencies within the components.
Ultimately, there will be a limit for a conventional turbofan engine on how big the fan
can be and how small the core can be, which then places limits on the propulsive and
thermal efficiencies achievable by the engine.
Other considerations such as HPC blade and disc materials and turbine cooling flows
determine whether extra gains can be made by conventional turbofans for short to
medium range passenger aircraft. HPC delivery temperature would increase up to 970K
for these engines. Although current nickel superalloys are capable of withstanding this
150
temperature, lighter titanium based alloys would be preferable for weight
considerations, although not critical for delivering performance benefits. Turbine
cooling technology, including cooling flows, materials and thermal barrier coatings
would need to improve so that the same level of turbine cooling could be used, given
higher HPC delivery temperatures.
The study has also shown the advantages that geared turbofans can bring, particularly as
fan sizes and bypass ratios get larger. Although the gearbox itself results in an
additional weight, both from itself and additional oil cooling, as well as its own set of
inefficiencies, the significant reduction in number of LPT stages required and
consequent reduction in overall weight and size mean that overall mission fuel burn is
reduced.
The question then becomes, which technologies could conceivably be used to offer
better fuel burn consumption than the advanced conventional turbofan engines
considered. To start we can consider the use of heat exchangers used for intercooled and
recuperated engines. Although these have the potential to offer significant benefits for
larger, long range engines and aircraft through an increase in thermal efficiency, they
would not be suitable for the short to medium range passenger aircraft of Airbus A320
size. Intercooling is useful because it offers the opportunity for much higher overall
pressure ratios to be achieved by keeping HPC delivery temperatures at low enough
temperatures for HPC material limits. However, as has been seen with the optimised
engines in this study, increasing overall pressure ratio shrinks the size of the core for a
given mass flow, meaning that HPC hub diameters in particular need to shrink. There is
a limit to how narrow the hubs can be made, due to stress limits and the fact that
multiple shafts, bearings and oil systems run inside this space. This constraint could not
be overcome by intercooling, meaning it offers little benefit in this regard.
While recuperation offers the potential to recover some energy that would otherwise be
lost in the exhaust, overall it probably would not be too useful for short to medium
range aircraft. Boggia and Rud (2005) found that minimal benefit could be gained
through intercooled and recuperated engines for short to medium range passenger
151
aircraft. This is because the main fuel benefit is offered in cruise, while for the climb
phase, where shorter range aircraft spend proportionally more of their time than long
range aircraft, the additional weight penalty of the heat exchangers could potentially
result in a lower fuel burn.
Even if the use of heat exchangers offered some small fuel burn benefit compared to
conventional engines, it is likely that the additional purchase and maintenance costs of
these engines would mean that an economic advantage could not be gained, unless the
fuel price were significantly higher. Overall, the use of intercooled and recuperated
engines are unlikely to offer enough of a benefit to be appealing for short to medium
range passenger aircraft.
Continuing with increasing thermal efficiency of the engine, we can next consider
another technology - the wave rotor. Although the wave rotor topped turbofan was
found by Noppel (2011) to be less efficient than a conventional turbofan with equivalent
cycle parameters, he also saw potential in the arrangement where size was limited. As
already discussed, it is difficult to increase overall pressure ratio through the use of axial
flow compressors due hub diameter considerations. Although wave rotors are less
efficient at compression than axial flow compressors, if an increase in pressure ratio is
sought and conventional compressors cannot be used, then additional compression,
albeit not quite as efficiently, may be of benefit. Wave rotors also offer a benefit by
keeping turbine entry temperatures down, which would affect the life of the HPT and
help lower maintenance costs, although the cost of purchase and maintenance of the
wave rotor itself would need to be considered.
However, one major drawback of the wave rotor cycle is that the pressure of the flow
entering the first row of turbine blades would be higher than that of the HPC outlet. This
would cause a problem with turbine cooling, as the cooling flow would normally come
from the HPC. With a higher pressure in the first set of turbine stages, no flow could
come directly from the HPC without the use of additional compression for the cooling
flow. This necessarily begs the question, if axial compression is more efficient than
compression from a wave rotor, why not axially compress to achieve the higher
152
pressure ratios? Ultimately it would need to be studied how narrow the high pressure
hub can be made, what acceptable hub-tip ratios could be achieved to deliver acceptable
tip losses, and whether the benefits gained from wave rotor compression outweigh the
additional work required and losses generated from the additional, but smaller mass
flow compression if a separate compressor is used for the turbine cooling flow.
Despite turbine entry temperatures being kept lower with a wave rotor, NOx formation
could still be an issue as higher temperature and pressures are reached inside the
combustion chamber, therefore the design of the combustor chamber would be
important.
Overall, the wave rotor has the potential to offer some benefit for short to medium range
aircraft turbofans over the longer term, as it offers the potential for increased pressure
ratios which may be otherwise difficult to achieve due to space constraints. However,
whether the wave rotor sealing challenges can be overcome is an uncertainty. In
addition, a potential better solution to increasing overall pressure ratio may exist by the
use of pulse detonation.
Another way to increase the overall pressure ratio is through the use of a pulse
detonation cycle within the turbofan in place of the combustor. Similar to the wave
rotor, the pulse detonation engine allows for higher overall pressure ratios to be reached
without increasing turbine entry temperatures, assisting with turbine life, however the
pulse detonation engine achieves the pressure rise through a more efficient combustion
at constant volume process, meaning the potential fuel burn benefits are better for the
pulse detonation hybrid cycle. The pulse detonation engine also has the advantage of
providing higher pressure ratios without the need to reduce hub diameters or alter hub
tip ratios to less acceptable levels.
Similar to the wave rotor, the turbine cooling would become an issue, as the cooling
flow would require additional compression to meet the turbine entry pressure. There
would be more scope to do this with the pulse detonation cycle due to the inherently
better compression achieved although a study would be required to quantify this.

153
NOx formation would perhaps be a greater issue with a hybrid pulse detonation cycle
than with the wave rotor, as the wave rotor cycle would still have a conventional
constant pressure combustor, of which research is continuing to provide lower NOx
emission combustors. In the case of the pulse detonation cycle, which is essentially a
cylinder, NOx formation would likely be more difficult to control, especially as current
research is focussed on increasing the reliability of the detonations.
An issue with both wave rotors and pulse detonation engines is that they introduce
unsteady flows into engines designed for steady flows. Accordingly, to accommodate
the additional vibrations generated, extra strengthening would likely be required
throughout the engine, adding extra weight, which could override any performance
benefits gained. Weight would likely be more of an issue for the wave rotor compared
to the pulse detonation engine, as the wave rotor would be added to an engine, while the
pulse detonation cycle would replace the combustor in an engine.
Overall, the pulse detonation has the potential to offer a greater fuel benefit than the
wave rotor through the more efficient compression process and likely lower overall
weight. Both engines, however, are still in the very early stages of development and
have many challenges to overcome. Therefore, it appears that significant near term
gains in thermal efficiency for short to medium range aircraft will be difficult to
achieve. Accordingly, could propulsive efficiency gains offer a better solution?
The two technologies considered earlier in the thesis that offer improvements in
propulsive efficiency, open rotors and turbo-props, are very similar. They both produce
thrust in the same way, with the use of a propeller, the difference being that an open
rotor is designed for higher flight speeds, similar to that of current turbofan engines.
Turboprops have been in service for several decades and are still used on small, regional
aircraft. While turboprops offer better fuel burn benefits than current turbofan aircraft,
they suffer from an image problem, being seen as unsafe and old fashioned (Brancatelli,
2009), largely due to the loud noise and lower flight speeds. The fact that despite the
fuel benefits turboprops bring they haven’t seen service on larger passenger aircraft in
154
recent years, shows that unless there is no other option, turboprops are unlikely to be a
serious consideration for future larger passenger aircraft, especially in Europe and
America.
However, the open rotor may offer the solution. The open rotor is essentially a
turboprop with a high speed propeller. By calling it an open rotor, or unducted fan, a
differential exists to the turboprop from a marketing perspective. The higher flight
speeds and cruise altitude offered by the open rotor also makes the flight experience
more similar to a conventional turbofan aircraft.
Open rotors have the potential to offer significant fuel benefits from increased
propulsive efficiency due to a much higher bypass ratio than turbofans - up to about 50.
In terms of fuel burn advantages, Guynn et al (2012) undertook an a preliminary aircraft
system level study of an Airbus A320/Boeing 737 size aircraft with two open rotor
engines mounted on the rear of the aircraft. They estimated that block fuel burn savings
of 18% could be achieved over a 500 nm mission compared to an advanced geared
turbofan engine with a BPR of about 15 and OPR of 42, while savings of up to 12%
could be achieved over a 3,250 nm mission.
These projected fuel burn savings appear better than for the optimised turbofan engines
analysed in this study. These very mature conventional turbofan engines could offer fuel
burn benefits of up to 9% for a short range mission and 5% for a longer range mission
when compared to a geared turbofan of similar technology level as that examined by
Guynn et al (2012) (BPR 12 and OPR 50). This demonstrates the superior propulsive
efficiency of the open rotor due to the much higher bypass ratio.
Several issues need to be considered with open rotors, however. The first is noise, both
in the cabin and around airports. Recent studies by SAFRAN and General Electric show
that noise levels can be kept to acceptable levels through the use of effective rotor
designs. In addition, mounting the engines to the rear of the fuselage can help mitigate
cabin noise. This rear mounting of the engine also helps with another issue – rotor blade
failure. With no duct to contain the failure of the main rotor blades, the potential for
155
aircraft damage increases. By mounting the engines further to the rear and away from
the wings, the potential damage caused by a failure can be reduced. While mounting the
engines elsewhere on the aircraft than under the wings would require a complete
airframe redesign, as has been seen in the study, there is already limited space under the
wings for future engines. It is likely that any future engine options for Airbus A320 size
aircraft would require a new airframe. Other issues to be resolved are rotor gearbox and
pitch control mechanisms, although much research is being carried out to solve these
issues, and SAFRAN is confident in carrying out flight testing trials in the near future.
Overall, the open rotor seems the logical choice for engine options for short to medium
range passenger aircraft, as they offer superior fuel efficiency due to a significantly
higher overall pressure ratio and a similar flight experience to existing aircraft. In
addition, the thermal efficiency of these engines could conceivably be increased over
the longer term through the use of pressure rise combustion devices such as pulse
detonation or wave rotors.
156
7.0 Conclusions
Uncertain economic climates, fluctuating fuel prices, increasing environmental
awareness and greater competition mean that airlines are looking to lower their aircraft
fuel burn, both to reduce their own costs and a desire to offer customers more
environmentally responsible transport options. Since the beginning of manned flight,
the jet engine has come to represent a defining feature of modern passenger air travel. In
the 1940s and 50s, the jet engine was a disruptive technology that allowed for higher,
faster flight. Since that time, the jet engine has evolved to become more powerful,
quieter and more efficient through the use of higher bypass ratio fans, higher pressure
ratios and higher turbine entry temperatures. However, the evolution of the conventional
turbofan over the last 60 years appears to be approaching its limits and new
technologies will likely be required to take aviation propulsion to the next stage.
This thesis uses a short to medium range passenger aircraft and mission and profile to
try and explore what the limit of conventional turbofan technology might be and to
assess what different technologies may offer an improvement in this specific case.
A TERA approach was used to investigate this limit. TERA is a flexible multi-
disciplinary framework that allows for factors other than engine SFC to be investigated,
such as fuel burn over different types of missions, as well as engine sizes and weights.
The TERA framework in this study consisted of engine and aircraft performance
models, and engine size and weight models. This allowed the fuel burn effects of
potential mature turbofan engines to be investigated.
A baseline aircraft and engine configuration was modelled, based on the Airbus A320
aircraft with CFM56-5B/4 engines. Thrust and SFC was validated against publically
available data. Two additional engines based on the Airbus A320 NEO re-engining
were then modelled to estimate the potential fuel burn benefits these engines could give.
A design space exploration was then carried out using the TERA framework. Assuming
another potential re-engining of the A320 aircraft, two different types of conventional
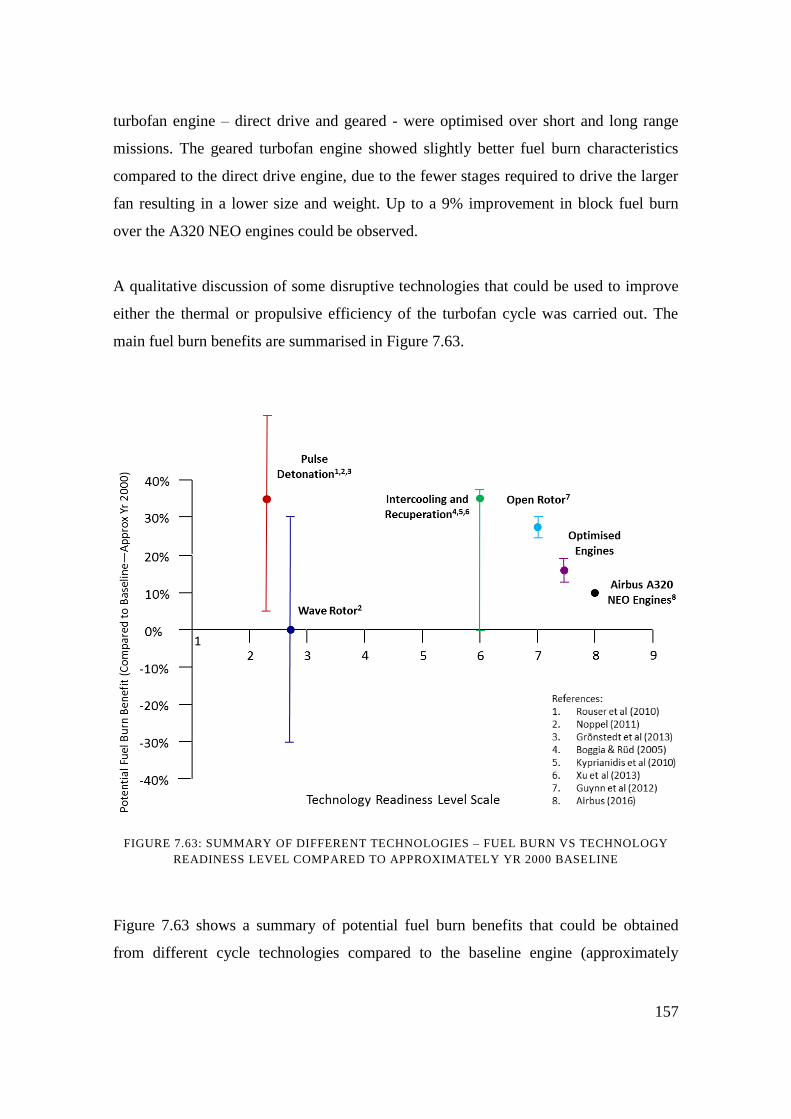
157
turbofan engine – direct drive and geared - were optimised over short and long range
missions. The geared turbofan engine showed slightly better fuel burn characteristics
compared to the direct drive engine, due to the fewer stages required to drive the larger
fan resulting in a lower size and weight. Up to a 9% improvement in block fuel burn
over the A320 NEO engines could be observed.
A qualitative discussion of some disruptive technologies that could be used to improve
either the thermal or propulsive efficiency of the turbofan cycle was carried out. The
main fuel burn benefits are summarised in Figure 7.63.
FIGURE 7.63: SUMMARY OF DIFFERENT TECHNOLOGIES – FUEL BURN VS TECHNOLOGY
READINESS LEVEL COMPARED TO APPROXIMATELY YR 2000 BASELINE
Figure 7.63 shows a summary of potential fuel burn benefits that could be obtained
from different cycle technologies compared to the baseline engine (approximately
158
technology that was available in the year 2000), against an opinion of technology
readiness level (please see Appendix 3 for a description of technology readiness level).
The potential fuel burn benefit either comes from within this study, or within literature
discussed in Chapter 2. The error bars represent the fuel burn benefit depending on
mission length for the open rotor and advance very mature turbofan points. For the
intercooled recuperated engines, the error bar represents that although they can offer the
potential for significant fuel burn gains, this is mainly for larger, longer range aircraft
which can accommodate the smaller core sizes for higher overall pressure ratios. For the
short to medium range aircraft in this study, they may not offer much, if any, benefit,
due to the extra weight and difficulty in physically achieving the higher overall pressure
ratios.
For the wave rotor and pulse detonation engines, the error bars are function of the very
early stages of development that these technologies are at, with some research work
carried out in the laboratory. As such, it is difficult to assess the benefits of these
technologies when applied to a short to medium range passenger jet aircraft.
This study shows that there is still potential for some fuel burn benefit to be gained from
the evolution of the conventional turbofan, up to 9% improvement compared to the
A320 NEO engines, or between 15-20% compared to year 2000 levels. This assumes
that HPC material technology improves to help keep weight down and a narrow enough
high pressure shaft diameter can be accommodated.
In terms of economics, the financial viability of the engines depends on fuel price. For a
relatively low fuel price of $69 per barrel, the mature turbofans could accommodate
between a 5-6% increase in purchase price for constant maintenance cost or 16-18%
increase in maintenance cost for the same purchase cost, compared to the baseline
engine. This rises significantly to 10-12% purchase price and up to 35% maintenance
cost increase when the fuel prices rises to $140 per barrel. Compared to the A320 NEO
engines, 1-2% increases in purchase price and 8-10% increases in maintenance costs for
a fuel price of $69 per barrel, and 3-4% increases in purchase price and 15-20% in
159
maintenance costs for a fuel price of $140 per barrel could potentially be
accommodated. What this means is that development and material costs of any potential
new engine needs to be kept low enough by the manufacturer to offer a potential benefit
or advantage to an operator compared to existing technology. As fuel price increases, or
uncertainty about fuel prices increases, the scope to develop new engines increases, as
was seen for the initial development and then abandonment of the UDF engine in the
1980s, when fuel prices lowered. Accordingly, a manufacturer would need to weigh up
whether developing and offering an evolutionary turbofan could be carried out for an
increase in purchase price of maybe one or two percent.
However, while a new technology such as the open rotor has the potential for a
significant step change in fuel burn, it is likely that the airframe to accommodate it
would require a complete redesign, needing far more development time and costs, as
well as certification costs. If the fuel price lowers, it may be more attractive and indeed
may even have scope for another re-engining of the airframe similar to the A320 NEO.
If, however, fuel prices increase, or physical constraints mean that an open rotor
becomes attractive to develop a new aircraft, then although there would be more scope
for more space for a better conventional turbofan, any such engine would likely be
outclassed by the open rotor due to the significantly higher bypass ratio and hence
propulsive efficiency that it offers. Any thermal efficiency gains that could be
developed for the turbofan would likely also be included in an open rotor. Development
costs would therefore likely be better spent on developing the new technology.
Accordingly, while there is some scope for another evolution of the conventional
turbofan engine along the lines of the Airbus A320 NEO program for short to medium
range passenger aircraft, this would be limited by the narrowness of the high pressure
shaft hub. If this could not be accommodated, or larger improvements in efficiency are
sought, then a new aircraft development would be required. In this case, the most
promising new technology would be the open rotor, as it appears to be sufficiently along
its development path and offers enough of an improvement to be viable. Over a much
longer timescale, improvements in thermal efficiency are likely to be sought. While
intercooling and recuperation may not be suitable for a short to medium range aircraft,
160
increased pressure ratios through the use of pulse detonation could potentially be
incorporated.
7.1 Recommendations for Future Work
Further work could include:
Further development of the Tethys sizing code: The code could become more
useful for additional engine types and configurations with the addition of
gearbox, combustor and duct sizing methods, as well as introducing multi-stage
fan and propeller sizing. Adding an option for a mixed flow nozzle would also
be useful. Perhaps moving the sizing code to a more modular arrangement, such
as that used in TURBOMATCH, could be investigated.
Introducing a feedback mechanism between the Tethys and TURBOMATCH
codes, so that the effect of hub-tip ratios on component efficiencies (and vice-
versa) could be investigated.
Investigation of the turbine cooling flow and secondary air system to see what
effect on the potential fuel burn gains these flows have.
Addition of bricks within the TURBOMATCH code that could be used to model
pressure rise combustion, such as for pulse detonation, wave rotors and
potentially internal combustion engines.
161
8.0 References
ACARE, 2011, Flightpath 2050: Europe's Vision for Aviation, European Union:
Luxembourg
Airbus, 2010, Airbus offers new fuel saving engine options for new A320 family,
Airbus.com 1 December 2010,
http://www.airbus.com/presscentre/pressreleases/press-release-
detail/detail/airbus-offers-new-fuel-saving-engine-options-for-a320-family/
Airbus, 2010a, Airbus A320 Airplane Characteristics, Airbus: Blagnac Cedex, France
Airbus, 2015, Airbus Price List 2015, http://www.airbus.com/presscentre/pressreleases/
press-release-detail/detail/new-airbus-aircraft-list-prices-for-2015/
Airbus, 2015a, AutoCAD 3-View Drawings of Airbus Aircraft,
http://www.airbus.com/support/maintenance-engineering/technical-
data/autocad-3-view-drawings-of-airbus-aircraft/
Airbus, 2016, A320 Family, Spotlight on… A320 NEO,
http://www.airbus.com/aircraftfamilies/passengeraircraft/a320family/spotlight-
on-a320neo/
Aircraft Commerce, 2006, Aircraft Owner's & Operator's Guide: A320 Family, Aircraft
Commerce Issue No. 44, February/March 2006
Akbari, P., Nalim, R., 2006, Analysis of Flow Processes in Detonative Wave Rotors and
Pulse Detonation Engines, 44th AIAA Aerospace Sciences Meeting and Exhibit,
9-12 January 2006, Reno, Nevada, AIAA 2006-1236
Akbari, P., Nalim, R., Mueller, N., 2006, A Review of Wave Rotor Technology and Its
Applications, Journal of Engineering for Gas Turbines and Power, October
2006, Vol. 128, p. 717-735
Alexiou, A, 2014, Introduction to Gas Turbine Modelling with PROOSIS, Empresarios
Agrupados Internacional (EAI) S.A., Madrid, Spain
Anderson, N.E., Loewenthal, S.H., Black, J.D., 1984, An Analytical Method to Predict
Efficiency of Aircraft Gearboxes
Apostolidis, A., Sampath, S., Laskaridis, P., Singh, R., 2013, Webengine – A Web Based
Gas Turbine Performance Simulation Tool, Proceedings of the ASME
TurboExpo 2013, June 3-7 2013, San Antonio, Texas, GT2013-95296
Barnard, R.H., Philpott, D.R., 2004, Aircraft Flight: A Description of the Physical
Principles of Aircraft Flight, Pearson Education Ltd, Edinburgh
162
Bala, A., Sethi, V., Lo Gatto, E., Pachidis, V., Pilidis, P., 2007, PROOSIS - A
Collaborative Venture for Gas Turbine Performance Simulation using an Object
Oriented Programming Schema, 18th ISABE Conference, ISABE-2007-1357,
Beijing, China
Bellocq, P., 2012, Multi-Disciplinary Preliminary Design Assessments of Pusher
Counter-Rotating Open Rotors for Civil Aviation, Ph.D. thesis, Department of
Power and Propulsion, School of Engineering, Cranfield University, Bedford,
UK.
Bellocq, P., Sethi, V., Capodanno, S., Patin, A., Rodriguez Lucas, F., 2014, Advanced
0-D Performance Modelling of Counter Rotating Propellers for Multi-
Disciplinary Preliminary Design Assessments of Open Rotors, ASME
TurboExpo 2014, June 16-20th, Dusseldorf, Germany, GT2014-27141
Bellocq, P., Garmendia, I., Sethi, V., 2015, Multidisciplinary Assessment of the Control
of the Propellers of a Pusher Geared Open Rotor – Part I: Low Pressure System
Design Choices, Engine Preliminary Design Phiosophyand Modelling
Methodology, ASME TurboExpo, June 15-19, Montreal, Canada, GT2015-
43812
Bellocq, P., Garmendia, I., Sethi, V., Patin, A., Capodanno, S., Rodriguez Lucas, F.,
2016, Multidisciplinary Assessment of the Control of the Propellers of a Pusher
Geared Open Rotor – Part II: Impact on Fuel Consumption, Engine Weight,
Certification Noise and NOx Emissions, Journal of Engineering for Gas
Turbines and Power, July 2016, Vol. 138, 072603-1 - 8
Birch, N., 2000, 2020 Vision: The Prospects for Large Civil Aircraft Propulsion, RAeS
Aeronautical Journal, p.347-352
Boggia, S., Rüd, K., 2005, Intercooled Recuperated Gas Turbine Concept, 41st
AIAA/ASME/SAE/ASEE Joint Propulsion Conference and Exhibit, 10-13 July
2005, Tucson, Arizona, AIAA 2005-4192
Brady C., 2012, The Boeing 737 Technical Guide, Tech Pilot Services Ltd: Cheshire
Brancatelli, J., 2009, Commuter Hell, Turbo-prop planes, regional jets crucial, but road
warriors hate flying them, Business Travel on NBC News, 25 February 2009
BreakingTravelNews, 2012, Airbus begins A320NEO production, 10 July 2012,
http://www.breakingtravelnews.com/news/article/airbus-begins-a320neo-
production/
Camillieri, W., Anselmi, E., Sethi, V., Laskaridis, P., Rolt, A., Cobas, P., 2015,
Performance Characteristics and Optimisation of a Geared Intercooled
Reversed Flow Core Engine, Proceedings of the Institution of Mechanical
Engineers, Part G: Journal of Aerospace Engineering, February 2015, Vol. 229,
No. 2 p. 269-279
163
CAA, 2012, Civil Aviation Authority Database Search
http://www.caa.co.uk/application.aspx?catid=60&pagetype=65&appid=1
CAEP7, 2007, Environmental Design Space (EDS) Progress, Committee on
Environmental Protection (CAEP) Seventh Meeting, 5-16 February 2007,
Montreal, Canada, CAEP/7-IP/23
Celis C., Moss B., Pilidis P., 2009, Emissions Modelling for the Optimisation of
Greener Aircraft Operations, Proceedings of ASME Turbo Expo 2009, June 8-
12 Orlando, Florida, GT2009-59211
CFM, 2013, ‘LEAP – The Power of the Future’, CFM LEAP Brochure 2013, CFM
Clean Sky, 2016, Clean Sky, Innovation Takes Off, http://www.cleansky.eu/
Clean Sky, 2012, About Us, http://www.cleansky.eu/content/homepage/about-us
Clean Sky, 2012a, ITD Leaders and Associates,
http://www.cleansky.eu/content/page/itd-leaders-and-associates
Clean Sky, 2012b, Mission and Objectives,
http://www.cleansky.eu/content/article/mission-objectives
Coleman, M.L., 2001, Overview of Pulse Detonation Propulsion Technology, Chemical
Propulsion Information Agency, The John Hopkins University, Whiting School
of Engineering, Columbia, Maryland, 20010517 003
Colmenares, F., Pascovici, D., Ogaji, S., Pilidis, P., 2007, A Preliminary Parametric
Study for Geared, Intercooled and/or Recuperated Turbofan for Short Range
Civil Aircrafts, ASME TurboExpo 2007, May 14-17, Montreal, Canada,
GT2007-27234
Colmenares, F., 2009, Techno-economic and Environmental Risk Assessment of
Innovative Propulsion Systems for Short-Range Civil Aircraft, PhD Thesis,
Cranfield University, Cranfield
Cooper, M., Jackson, S., Austin, J., Wintenberger, E., Shepherd, J.E., 2002, Direct
Experimental Impulse Measurements for Detonations and Deflagrations,
Journal of Propulsion and Power, Vol. 18, No. 5, p 1033-1041
Costi, F., 2012, Investigation on Boundary Layer Ingestion Effects on a Ducted Axial
Fan for a Distributed Propulsion System, MSc Thesis, Cranfield University,
Cranfield
Cranfield University, 1999, The TURBOMATCH Scheme, Cranfield University
Cranfield University, 2009, HERMES v5 and TURBOMATCH Calls: User Manual
Cranfield University
164
Croft, J., 2012, "Open Rotor Noise not a Barrier to Entry: GE", Flight Global 5, July
2012, https://www.flightglobal.com/news/articles/open-rotor-noise-not-a-
barrier-to-entry-ge-373817/
Dickson, N., 2014, Local Air Quality and ICAO Engine Emissions Standards,
Powerpoint Presentation, http://www.icao.int/SAM/Documents/2014-
ENV/4.1LAQ%20TechnologyV2.pdf
DREAM, 2012, Cranfield University and Dream, http://www.dream-
project.eu/cranfield-university.aspx
DREAM, 2012a, DREAM Introduction, http://www.dream-project.eu/
easyJet, 2007, The "easyJet ecoJet": to cut CO2 emissions by 50% by 2015,
http://corporate.easyjet.com/latest-news-archive/news-year-2007/14-06-07a-
en.aspx?sc_lang=en
easyJet, 2014, easyJet 2014 Annual Report,
http://corporate.easyjet.com/~/media/Files/E/ Easyjet-Plc-
V2/pdf/investors/result-center-investor/annual-report-2014.pdf
EC, 2001, European Aeronautics: A Vision for 2020,
http://ec.europa.eu/research/transport/publications/items/european_aeronautics_
_a_vision_for_2020_en.htm
EC, 2016, validation of Radical Engine Architecture systeMs,
http://ec.europa.eu/research/transport/projects/items/dream_en.htm
el_Hossaini, M.K., 2014, Review of the New Combustion Technologies in Modern Gas
Turbines, Progress in Gas Turbine Performance, Chapter 6, IntechOpen
Endara Mayorga, C., 2015, Development of a Component Based Preliminary Weight
Estimation Method for Mission Level Assessment of a Geared Turbofan, MSc
Thesis, Cranfield University, Cranfield
English, Cdr C.R., 2003, The WR-21 Intercooled Recuperated Gas Turbine Engine –
Integration into Future Warships, Proceedings of the International Gas Turbine
Congress, 2003, Tokyo, November 2-7, IGTC2003Tokyo OS-203
EC, 2001, European Aeronautics: A Vision for Europe 2020, European Commission:
Luxembourg
EU, 2006, 'VITAL' Workshop Promotes Cleaner Air Transport,
http://ec.europa.eu/research/transport/news/items/_vital__workshop_promotes_c
leaner_air_transport_en.htm
Farokhi, S., 2009, Aircraft Propulsion, John Wiley & Sons, Hoboken, N.J.
Flight Global, 2007, Whatever happened to propfans?, Flight Global, 12 June 2007
165
Follen, G.J., 2002, An Object Oriented Extensible Architecture for Affordable
Aerospace Propulsion Systems, RTO AVT Symposium on Reduction of Military
Vehicle Acquisition Time and Cost through Advanced Modelling and Virtual
Simulation, 22-25 April 2002, Paris, France, RTO-MP-089
Gayraud, S., 1996, Technical and Economic Assessments for Industrial Gas Turbines
Selection, MSc Thesis, Cranfield University: Cranfield
Goldberg, C., Nalianda, D., Singh, R., 2015, Techno-economic and Environmental Risk
Assessment of a Blended Wing Body with Distributed Propulsion,
AIAA/SAE/ASEE Joint Propulsion Conference, 27-29 July 2015, Orlando, Fl,
AIAA 2015-4024
Goldberg, D., 1989, Genetic Algorithms in Search, Optimization and Machine
Learning, Addison-Wesley Longman Publishing Co., Boston, MA
Goold, I, 2012, Airbus A320NEO Design Frozen, First Flight in 2014, AINOnline 9
July 2012, http://www.ainonline.com/aviation-news/2012-07-08/airbus-
a320neo-design-frozen-first-flight-2014
Grönstedt, T., Irannezhad, M., Lei, X., Thulin, O., Lundblah, A., 2013, First and
Second Law Analysis of Future Aircraft Engines, Proceedings of ASME Turbo
Expo 2013, June 3-7, San Antonio, Texas, GT2013-95516
Grieb, H., Eckardt, D., 1986, Turbofan and Propfan as Basis for Future Economic
Propulsion Concepts, 22nd Joint Propulsion Conference, Huntsville, Alabama,
AIAA 1986-1474
Gubisch, M., 2014, Snecma plans 2019 open-rotor flights, Flight International, 14-20
January 2014
Guynn, M.D., Berton, J.J., Hendricks, E.S., Tong, M.T., Haller, W.J., Thurman, D.R.,
2011, Initial Assessment of Open Rotor Propulsion Applied to an Advanced
Single-Aisle Aircraft, 11th AIAA Aviation Technology, Integration, and
Operations (ATIO) Conference, including the AIAA 20-22 September 2011,
Virginia Beach, VA, AIAA 2011-7058
Guynn, M.D., Berton, J.J., Haller, W.J., Hendricks, E.S., Tong, M.T., 2012,
Performance and Environmental Assessment of an Advanced Aircraft with Open
Rotor Propulsion, NASA Report TM-2012-217772
Horlock, J., Watson, D. & Jones, T., 2001, Limitations on Gas Turbine Performance
Imposed by Large Turbine Cooling Flows, ASME Journal of Engineering for
Gas Turbines and Power 123(3): 487–494
House of Commons, 2011, Science and Technology Committee – Second Report:
Technology and Innovation Centres, The Stationary Office, 9 February 2011
166
Hudson, M., 1999, The Foundation of Propulsion Products, Proceedings of the 14th
ISABE Conference, Florence, Italy, September 1999
IATA, 2015, Jet Fuel Price Analysis, http://www.iata.org/publications/economics/fuel-
monitor/Pages/price-analysis.aspx
ICAO, 2012, Aircraft Engine Emissions: Definition of the Problem,
http://www.icao.int/environmental-protection/Pages/aircraft-engine-
emissions.aspx
IPCC, 1999, Aviation and the Global Atmosphere: A Summary for Policy Makers,
http://www.ipcc.ch/pdf/special-reports/spm/av-en.pdf
Jackson, A.J.B, 2009, Optimisation of Aero and Industrial Gas Turbine Design for the
Environment, PhD Thesis, Cranfield University, Cranfield
Janes, 2011, Janes Aero Engines Issue 29, Daly M. Ed. & Gunson B. Assoc Ed., IHS
Janes: Surrey
Jenkinson, L.R., Simpkin, P., Rhodes, D., 1999, Civil Jet Aircraft Design, Arnold,
London
Jensen, D.T., Leonard, J.M., 2002, The Forgotten Allison Engines, 38th
AIAA/ASME/SAE/ASEE Joint Propulsion Conference and Exhibit, 7-10 July
2002, Indianapolis, Indiana, AIAA 2002-3566
Joyce, I., 2011, Flightglobal Engine Directory: CFM,
http://www.flightglobal.com/directory/searchresults.aspx?manufacturerType=En
gine&searchMode=Manufacturer&keyword=&manufacturer=3279&navigationI
temId=382
Kailasanath, L., 2009, Research on Pulse Detonation Combustion Systems – A Status
Report, 47th AIAA Aerospace Sciences Meeting Including The New Horizons
Forum and Aerospace Exposition, 5-8 January 2009, Orlando, Florida, AIAA
2009-631
Kim, H.J., Felder, J.L., Tong, M., T., Berton, J.J., Haller, W.J., 2014, Turboelectric
Distributed Propulsion Benefits on the N3-X Vehicle, Aircraft Engineering and
Aerospace Technology: An International Journal, Vol 86, Issue 6, p. 558-561
Khalid, S.A., Lurie, D., Breeze-Stringfellow, A., Wood, T., Ramakrishnan, K., Pliath,
U., Wojno, J., Janardan, B., Goering, T., Opalski, A., Barrett, J., 2013, FAA
CLEEN Program Open Rotor Aeroacoustic Technology Non-Proprietary
Report, GE Aviation, Evandale, Ohio, DOT/FAA/AEE/2014-03
Koch, P.N., Evans, J.P., Powell, D., 2002, Interdigitation for Effective Design Space
Exploration using iSIGHT, Journal of Structural and Multidisciplinary
Optimization, Vol 23, Issue 2, p. 111-126
167
Korsia, J.J., 2009, VITAL – European R&D Programme for Greener Aero-Engines,
ISABE 2009 Proceedings, ISABE-2009-1114 , Montreal, Canada.
Korsia, J.J. & Guy, S, 2007, VITAL – European R&D Programme for Greener Aero-
Engines, ISABE 2007 Proceedings, ISABE-2007-1118 , Beijing, China.
Kurzke, J., 2015, GasTurb 12- Design and Off Design Performance of Gas Turbine
Engines, GasTurb GmbH, Germany
Kyprianidis K.G., Colmenares Quintero R.F., Pascovici D.S., Ogaji S.O.T., Pilidis P.,
2008, EVA - A Tool for Environmental Assessment of Novel Propulsion Cycles,
ASME Turbo Expo 2008, June 9-13 2008 Berlin, Germany, GT2008-50602
Kyprianidis, K.G., Grönstedt, T., Ogaji, S.O.T., Pilidis, P., Singh, R., 2010, Assessment
of Future Aero Engine Designs with Intercooled and Intercooled Recuperated
Cores, Journal of Engineering for Gas Turbines and Power, 133(1), 011701
Kyprianidis, K.G., 2010, Multi-disciplinary Conceptual Design of Future Jet Engine
Systems, PhD Thesis, Cranfield University, Cranfield
Kyprianidis, K.G., 2011, Future Aero Engine Designs: An Evolving Vision, Advances
in Gas Turbine Technology ISBN: 978-953-307-611-9
Larsson, L., Lundbladh, A., Grönstedt, T., 2014, A Conceptual Design Study of an Open
Rotor Powered Regional Aircraft, ASME TurboExpo 2014, June 16-20,
Dusseldorf, Germany, GT2014-26091
Laskaridis, P., 2004, Performance Investigations and Systems Architectures for More
Electric Aircraft, PhD Thesis, Cranfield University, Cranfield
Laskaridis, P., Pilidis, P., Kotsiopoulos, P., 2005, An Integrated Engine – Aircraft
Performance Platform for Assessing New Technologies in Aeronautics,
ISABE2005-1165, Proceedings of 17th International Symposium on Air
Breathing Engines, Munich, 2005
Lee, S.Y., Watts, J., Saretto, S., Pal, S., Conrad, C., Woodward, R., Santoro, R.J., 2004,
Deflagration to Detonation Transition Processes by Turbulence-Generating
Obstacles in Pulse Detonation Engines, Journal of Propulsion and Power, Vol.
20, No. 6, p.1026-1036
Lefebvre, A., 2010, Gas Turbine Combustion, 3rd Ed., Taylor & Francis, PA, USA
Leyens, C., 2004, Advanced Materials and Coatings for Future Gas Turbine
Applications, 24th Congress of the International Council of the Aeronautical
Sciences, 29 August – 3 September 2004, Yokohama, Japan, ICASE 2004-5.5.1
Li, X., Sun Bo., You, H., Wang, L., 2014, Evolution of Rolls-Royce Air-Cooled Turbine
Blades and Feature Analysis, APOSAT2014, Aisa-Pacific International
Symposium on Aerospace Technology,
168
Lolis, P., Giannakis, P., Sethi, V., Jackson, A.J.B., Pilidis, P., 2014, Evaluation of Aero
Gas Turbine Preliminary Weight Estimation Methods, Aeronautical Journal,
Vol. 118, No. 1204, p.625-641
Lolis, P., 2014a, Development of a Preliminary Weight Estimation Method for
Advanced Turbofan Engines, PhD Thesis, Cranfield University, Cranfield
Macalister, T., 2011, Background: What Caused the 1970's Oil Price Shock, Guardian,
3 March 2011
Mankins, J.C., 1995, Technology Readiness Levels – A White Paper, Office of Space
and Technology, Advance Concepts Office, NASA, 1995
M'Bengue, L, 2010, Towards Acare 2020: Innovative Engine Architectures to Achieve
Environmental Goals? ICAS 2010: 27th International Congress of the
Aeronautical Sciences
McKenzie, A.B., 1997, Axial Flow Fans and Compressors: Aerodynamic Design and
Performance, Ashgate, Aldershot
Mellor, A.M., 1990, Design of Modern Turbine Combustors, Academic Press: San
Diego
Michalewicz, Z., 1996, Genetic Algorithms + Data Structures = Evolution Programs
(3rd ed.), Springer-Verlag, London
Mikkelson, D.C., Mitchell, G.A., and Bober, L.J., 1984, Summary of Recent NASA
Propeller Research, NASA Lewis Research Center, Cleveland, Ohio, NASA-
TM-83733.
Mohammad, B.S., Jeng, S.M., 2009, Design Procedures and a Developed Computer
Code for Preliminary Single Annular Combustor Design, 45th
AIAA/ASME/SAE/ASEE Join Propulsion Conference and Exhibit, 2-5 August
2009, Denver, Colorado, AIAA 2009-5208
Morrell, P., & Dray, L., 2009, Environmental Aspects of Fleet Turnover, Retirement
and Lifecycle, Final Report for the Omega Consortium 2009
Musielak, D.E., ND, Fundamentals of Pulse Detonation (PDE) and Related Propulsion
Technology, PowerPoint Presentation, Aerospace Engineering Consulting,
Arlinton, Texas
MacMillan, W.L., 1974, Development of a Modular Type Computer Program for the
Calculation of Gas Turbin Off-Design Performance, PhD Thesis, Cranfield
University, Cranfield
Nalianda D., 2012, Impact of Environmental Taxation Policies on Civil Aviation - A
Technoeconomic and Environmental Risk Assessment, PhD Thesis, Cranfield
University
169
NEWAC, 2016, Project Home Page, http://www.newac.eu/12.0.html
Noppel, F.G., 2011, Comparison of Unconventional Aero Engine Architectures, PhD
Thesis, Cranfield University, Cranfield
Ogaji S., Pilidis P., Hales R., 2007, TERA - A Tool for Aero-Engine Modelling and
Management, 2nd World Congress on Engineering Asset Management and the
Fourth International Conference on Condition Monitoring, 11-14 June 2007,
Harrogate, UK
Pachidis V., No Date, Gas Turbine Performance Simulation MSc Thermal Power
Lecture Notes, Cranfield University
Pascovici D.S., Colmenares F., Ogaji S.O.T., Pilidis P., 2007, An Economic and Risk
Analysis Model for Aircrafts and Engines, Proceedings of ASME TurboExpo
2007: Power for Land, Sea and Air, May 14-17 2007, Montreal, Canada,
GT2007-27236
Pera R.J., Onat, E., Klees, G.W., Tjonneland, E., 1977, A Method to Estimate Weight
and Dimensions of Aircraft Gas Turbine Engines, NASA Report, NASA-CR-
135170, Vol. 1
Pervier, H., Nalianda, D., Espi, R., Sethi, V., Pilidis, P., Zammit-Mangion, D., Rogero,
J-M., Entz, R., 2011, Application of Genetic Algorithm for Preliminary
Trajectory Optimization, SAE Int. J. Aerosp. 4(2):973-987
Pilidis P., Palmer J.R., Gullia A., Jackson A.J.B., Janikovic J., Gas Turbine Theory and
Performance, MSc Lecture Notes, Cranfield University
Pratt & Whitney, 2012, PurePower PW1000G Engine,
http://www.purepowerengine.com/technology.html
Pratt & Whitney, 2012a, PurePower Family of Engines Brochure,
http://www.purepowerengine.com/pdf/purepower_brochure_2012.pdf
Pratt & Whitney, 2013, PurePower Engine Family Specs Chart,
https://www.pw.utc.com/Content/PurePowerPW1000G_Engine/pdf/B-1-
1_PurePowerEngineFamily_SpecsChart.pdf
Ramsden, K.W., MacManus, D., Zachos, P., 2013, Aerodynamic Design of Axial
Compressors and Turbines, Cranfield University Course Notes
Raymer, D.P., 2006, Aircraft Design: A Conceptual Approach, AIAA 2006
Rizk N.K., Mongia H.C., 1994, Emissions predictions of different gas turbine
combustors, AIAA 94-0118, 1994
Rolls-Royce, 1966, The Jet Engine, Rolls-Royce Ltd: Derby
170
Rolt, A.M., Baker, N.J., 2009, Intercooled Turbofan Engine Design and Technology
Research in the EU Framework 6 NEWAC Programme, ISABE 2009-1278
Rolt, A. & Kyprianidis, K., 2010, Assessment of New Aero Engine Core Concepts and
Technologies in the EU Framework 6 NEWAC Programme, ICAS 2010
Congress Proceedings, Paper No. 408, Nice, France
Rouser, K.P., King, P.I., Schauer, F.R., Sondergaard, R., Hoke, J.L., 2010, Unsteady
Performance of a Turbine Driven by a Pulse Detonation Engine, 48th AIAA
Aerospace Sciences Meeting Including The New Horizons Forum and
Aerospace Exposition, 4-7 January 2010, Orlando, Florida, AIAA 2010-1116
Roy, G.D., Frolov, S.M., Borisov, A.A., Netzer, D.W., 2004, Pulse Detonation
Propulsion Challenges, Current Status and Future Perspective, Progress in
Energy and Combustion Science, Vol. 30, No. 6 p.545-672
Saravanamuttoo, H.I.H., 2002, The Daniel and Florence Guggenheim Memorial Lecture
- Civil Propulsion; The Last 50 Years, ICAS 2002 Congress Proceedings,
Toronto, Canada
Saravanamuttoo, H.I.H., (ed.) 2008, Gas Turbine Theory, 6th ed. Pearson Prentice Hall,
Upper Saddle River, N.J.
Sargerser D.A., Lieblein, S., Krebs, R.P., 1971, Empirical Expressions for Estimating
Length and Weight of Axial Flow Components of VTOL Powerplants, NASA
Technical Report TM X-2406
Schumann, U. 1997, The Impact of Nitrogen Oxides Emissions from Aircraft upon the
Atmosphere at Flight Altitudes – Results from the AERONOX Poject,
Atmospheric Environment, Vol. 31, No.12, p.1723-1733
Seitz, A., Gologan, C., 2015, Parametric Design Studies for Propulsive Fuselage
Aircraft Concepts, CEAS Aeronautical Journal, Vol 6, Issue 1, p.69-82
Singh R., 2011, Gas Turbine Combustors Volume 1, MSc Thermal Power Lecture
Notes, Cranfield University: Cranfield
Spindler P.M., 2007, Environmental Design Space Model Assessment, MSc Thesis,
Massachusetts Institute of Technology, Massachusetts
Sweetman, B., 2005, The Short, Happy Life of the Prop-Fan, Air & Space Magazine,
September 2005
Tacina, K.M., Chang, C.T., Zhuohui J.E., Lee, P., Dam, B., Mongia, H., 2014, A Second
Generation Swirl-Venturi Lean Direct Injection Combustion Concept, 50th
AIAA/ASME/SAE/ASEE Joint Propulsion Conference, AIAA 2014-3434
Tacina, R.R., 1990, Combustor Technology for Future Aircraft, 26th Joint Propulsion
Conference cosponsored by the AIAA, SAE, ASME and ASEE, Orlando,
Florida, July16-18, AIAA-90-2400
171
United Nations, 1998, Kyoto Protocol to the United Nations Framework Convention on
Climate Change, http://unfccc.int/resource/docs/convkp/kpeng.pdf
Van Zante, D.E., 2013, The NASA Environmentally Responsible Aviation
Project/General Electric Open Rotor Test Campaign, 5st AIAA Aerospace
Sciences Meeting, 7-10 January, Grapevine (Dallas Ft Worth Region), Texas,
AIAA 2013-0415
Walker, A.D., Carrotte, J.F., Rolt, A.M., 2009, Duct Aerodynamics for Intercooled Aero
Gas Turbines: Constraints ,Concepts and Design Methodology, ASME
TurboExpo 2009, June 8-12, Orlando, Florida, GT2009-59612
Walsh, P.P., Fletcher, P., 2004, Gas Turbine Performance, 2nd ed., Blackwell Science,
Oxford
Watts, R., 1978, European air transport up to the year 2000, RAeS Aeronautical
Journal pp. 300–312
Welch, G.E., Jones, S.M., Paxson, D.E., 1995, Wave Rotor Enhanced Engine, NASA
Technical Memorandum, 106998, AIAA-95-2799
Wilcock, R., Young, J. & Horlock, J., 2005, The Effect of Turbine Blade Cooling on the
Cycle Efficiency of Gas Turbine Power Cycles, ASME Journal of Engineering
for Gas Turbines and Power 127(1): 109–120.
Wilfert, G., Sieber, J., Rolt, A., Baker, N., Touyeras, A. & Colantuoni, S., 2007, New
Environmental Friendly Aero Engine Core Concepts, ISABE 2007 Proceedings,
ISABE-2007-1120, Beijing, China
Williams, D., 2014, Propulsion Systems, Performance and Integration, Cranfield
University Course Notes
Willis R.J. Jr, 1963, New Equations and Charts Pick Off Lightest Weight Gears,
Product Engineering, January 21 1963
van der Mark K., 2012, Register Review Aviation News May 2012, KeyPublishing:
Stamford, Lincs.
Vicente, E., 1994, Effect of Bypass Ratio on Long Range Subsonic Engines, MSc
Thesis, Cranfield University: Cranfield
Whellens M.W., 2002, Multidisciplinary Optimisation of Aero-Engines using Genetic
Algorithms and Preliminary Design Tools, PhD Thesis, Cranfield University:
Cranfield
Whellens M.W., Singh R., Pilidis P., Taguchi, H., 2003, Genetic Algorithm Based
Optimisation of Intercooled Recuperated Turbofan Design, 41st Aerospace
Sciences Meeting and Exhibit 6-9 January 2003, Reno, Nevada, AIAA 2003-
1210

172
Xu, L., Kyprianidis, K.G., Grönstedt, T.U.J., 2013, Optimization Study of an
Intercooled Recuperated Aero-Engine, Journal of Propulsion and Power, March-
April 2013, Vol. 29, No. 2

173
Appendix 1 - HERMES Input File

174
175
176
177

178
Appendix 2 – Tethys Input File – CUEJ56

179

180

181

182
Appendix 3 – Technology Readiness Level
The Technology Readiness Level (TRL) is a classification system that aims to provide a
logical measure of the maturity of a particular technology, which then allows for the
consistent comparison of the maturity of different types of technology (Mankins, 1995).
TRLs were used by NASA during their space programs (ibid.) and have since been
widely used in research programs across the world. TRLs use a scale from 1 to 9, with 1
being the earliest stages of development, with basic principles observed to 9, which is a
fully mature technology that has been proven over several operations. Different
organisations can have different definitions for each of the levels. The UK Parliament
uses the following scale (House of Commons, 2011, Annexe 1):
“TRL 1: Basic principles observed and reported
TRL 2: Technology concept and/or application formulated
TRL 3: Analytical and experimental critical function and/or characteristic proof-of-
concept
TRL 4: Technology basic validation in a laboratory environment
TRL 5: Technology basic validation in a relevant environment
TRL 6: Technology model or prototype demonstration in a relevant environment
TRL 7: Technology prototype demonstration in an operational environment
TRL 8: Actual technology completed and qualified through test and demonstration
TRL 9: Actual technology qualified through successful mission operations”


![Design and Fabrication of Tilt -Hexacopter with Image ... · pentacopter [ five propellers], hexacopter [ six propellers], octocopter [ eight propellers], etc. Here , the design methodologies,](https://img.pdfslide.us/doc/110x75/5e21c800611caa04ab6d729c/design-and-fabrication-of-tilt-hexacopter-with-image-pentacopter-five-propellers.jpg)