Embed Size (px)
Citation preview
Annual Report 2015
Craigmore South Primary School
Annual Report
2015
Annual Report 2015
Page 1
1. CONTEXT
School Name: Craigmore South Primary School Number: 1449
Principal: Sharon Rich/Nathan Taylor Partnership Uleybury
Craigmore South Primary School is a Category 3 school situated approximately 25km north of Adelaide. This has been the first year of amalgamation between the former primary school and junior primary school. We have a combined enrolment of 290 with approximately 137 students as school card recipients. The general student population consists of Anglo Saxon students, with 9% ATSI students and 5% EALD students. Approximately 20% of our students are identified as having disabilities ranging from intellectual, speech and physical. Craigmore South Primary School is committed to all students achieving success in literacy. Teachers, leadership and support staff are committed to delivering a daily Literacy block including a one hour reading group session where students are grouped in accordance to their specific needs. Our school grounds include several grassed ovals and shaded play areas. We are well equipped with classrooms including specifically designed technology and ICT rooms. Through the Federal Government’s Building the Education Revolution program (BER) we have a new library, refurbished teaching areas and improved play areas. In 2014, the building of a new administration block was completed and is being utilized by all staff.
2. REPORT FROM GOVERNING COUNCIL
I have great pleasure in preparing the Annual Report from the Governing Council to the School
Community of Craigmore South Primary School.
The Governing Council met twice each term last year. The Governing council is a small but hard
working group who has an important voice and decision making role, within the school. Each meeting
has shared information regarding current student and staff learning.
This year being the first year as Chairperson on this school’s Governing Council has been a large
learning curve for this site. It has also been a very demanding year, in which the school has operated.
During the first term of 2015 we had as Principal, Sharon Rich (who is currently on Leave). Our new
Acting Principal, Nathan Taylor has taken over since the start of Term 2 and will continue on until at
least the end of Term 1 2016 (when this was written), a very big thank you for your guidance
throughout 2015.
A school does not operate without leadership, so a very big thank you to the leadership group for your
fantastic efforts, the teaching staff and ancillary staff for all your ongoing support throughout 2015,
and of course the members of the Governing Council.
The school Canteen also played a vital role in the operation of student’s needs and the quality of the
food and beverages being of a healthy nature. Under the operation of Fiona Coleman a person who
“delivers the Goods”. Fiona’s efforts also played a big part in the Fundraising $$$$$. The Governing
Council is also the Sponsor of the Canteen.
The Mothers and Fathers Day stalls were a huge success with the students purchasing items with
much enthusiasm.
Annual Report 2015
Page 2
Sports Day was a fantastic day with all students in a competitive nature, supported by parents, care
givers and grandparents attending in large numbers on the day.
World Teachers’ Day Proudly sponsored by the Governing Council showing support for Teachers
here at the school.
Bunning’s Sausage Sizzle First kicked off in 2015 (under the organisation of Hannah Elphick) turned
out a huge success and was an integral part of Fundraising Calendar. A big thank you to all who
helped out on the day, there will be another day planned for the 2016 year.
School Banners You may have noticed during the latter half of 2015 two large colour banners just
inside the entrance of the Administration building. These banners were created to show pride in the
school community and to show achievements of students. These Banners will be taken out and
placed on show at certain events (such as Sporting and Community).
2015 saw the introduction of Year 7 Student Voice reporting to council at our meetings with verbal
and PowerPoint presentations to show what they have been up to during each term.
In 2015 the Governing Council voted for the introduction of a “Community Service Award” aimed at a
Year 7 student or students voted by the Year 7 staff, which will be presented each year at the Year 7
Graduation.
The YMCA Sports complex (in the adjacent shopping centre) is a DECD building. In 2016 the building
will have brand new roof, guttering and down piping replaced, so the students’ of the school will be
able to enjoy all year round school activities.
A huge 2016 is on the cards and expects to be another busy school year. Once again, thank you to
everyone who got involved in making this school “A PLACE TO BE”.
Geoff Casbolt
Chairperson
3. 2015 HIGHLIGHTS
Students and teachers at Craigmore South PS continued to work hard to strengthen the learning and our school community. There were many special events throughout the year to support learning and celebrate our school culture. We started the year with a fantastic ‘Yellow Brick Road’ night where students and their families moved around to each classroom to meet the teachers. This was followed by the Governing Council AGM. Whole school events saw students celebrate their diverse range of backgrounds during Harmony Week and Harmony Day. Once again there was strong participation in Book Week events and the Premier’s Reading Challenge. A successful School Concert was held at the end of the year with each class performing an item. It was well attended by our school community. We participated in events to make closer links with the community to focus on students’ roles and responsibilities as local and global citizens. Pancake Day resulted in over two hundred dollars being donated to Uniting Care. Two classes held a cake stall and casual clothes day with over five hundred dollars being raised for the victims of the Nepal Earthquake. Participating in Canteen Bandanna Day raised over seven hundred dollars for young people living with cancer. Again this year the choir visited local aged care homes and the Craigmore Childcare Centre to perform carols.
Annual Report 2015
Page 3
The school continued to participate in SAPSASA sporting events, such as the Summer and Winter carnival, and girls and boys teams entered in rugby tag. After winning at District Day the girls’ team went to become division winners in the State Rugby tackle championships. Students from Reception to Year five participated in swimming lessons at Starplex Gawler and Year 6/7 students went to camp at Victor Harbor. We engaged with the school community to organize an after school sport program at the local YMCA. The indigenous students and their buddies under the guidance of Mr. Scott Rathman brightened up the grounds man’s shed with a bright, colorful mural. The mural signifies the coming together of all members of our community. This year teachers have worked together on the Australian Curriculum and the Teaching for Effective Learning Framework. We have also further developed our knowledge and skills in literacy teaching, particularly in reading comprehension and the explicit teaching of writing. We are continuing to build a strong collaborative culture through teacher learning teams and regularly sharing and reflecting on our practice.
4. SITE IMPROVEMENT PLANNING AND TARGETS
1. Site Priority: Literacy
At Craigmore South Primary School we are establishing a whole school approach in Literacy focusing
on data, pedagogy, assessment and professional development, ensuring our students are engaged in
a balanced and challenging literacy program.
ACTIONS:
Data: Whole school data collection and analysis to establish targets and focus areas.
Use a data wall to track student progress and visualise student growth across the school.
Teachers closely examine student data to plan learning goals for individual students.
Analyse whole school data to determine targets and focus areas across the school and particular cohorts.
Pedagogy: Shared practice to promote engagement, collaboration and higher order thinking.
Learning teams have been established to enable teacher collaboration, planning and learning.
Staff developed and shared resources for literacy teaching.
Continue reading groups for four hours per week supported by the leadership team and SSOs.
Staff using TfEL framework as planning tool and Aus. Curriculum to inform their teaching.
Commitment of all staff to a daily two hour literacy block.
Jolly phonics taught in reading groups below level 10.
Whole school commitment to using comprehension strategies with a focus on question/answer relationships and the 4H strategy.
Whole school commitment to using the Seven Steps to Writing Success resource to support the explicit teaching of the craft of writing.
Assessment: Collaborative moderation and consistency in assessment.
Regular sessions for staff to look at individual student reading assessments.
Teachers collaborate to assess and moderate student writing samples.
Teachers using assessment to inform planning for individuals, groups and whole class.
Teachers embedding formative assessment and explicit feedback into their daily literacy teaching.
Professional Learning: Rigorous and ongoing professional learning.
Regular and ongoing staff professional development in literacy including high expectations of staff to trial, reflect and share new learning.
Teachers read, reflect and revisit the whole school literacy agreement to ensure a whole school approach to literacy.
Professional learning in using reading comprehension strategies of Question/Answer relationships and the 4H strategy.
Annual Report 2015
Page 4
Professional learning in using the Seven Steps to Writing Success resource.
Literacy and TfEL focus in staff performance management. OUR TARGETS IN 2015: NAPLAN
All students (except NEP) will achieve National Minimum Standards in NAPLAN.
Year 3, 5 and 7 mean scores to be equal or above similar schools.
Year 5 – Greater than 25% of students in the higher growth band.
Year 7 – Greater than 25% of students in the higher growth band. PAT-R
All students show greater than 12 months growth between each test. Running Records End of year:
Reception: level 10
Year 1: level 20
Year 2: level 26 +
Year 3-7: level 30 + OUTCOMES FOR 2015:
Please refer to Achievement data section of the report for detailed reflections of student achievement in literacy.
Regular staff meeting time for professional development and team planning focussed on literacy led by the literacy coach and assistant principal.
Continued focus on the explicit teaching of reading comprehension skills using the 4H strategy in term one.
Whole school professional development, planning time, sharing and reflection on the use of the Seven Steps to Writing Success resource.
Whole school implementation and use of a data wall in reading to track student progress and achievement.
All staff were led through the process of locating and analysing PAT-R data online, including looking at the supporting teaching resources. Staff chose two students to look at in detail and plan teaching points based on their PAT data.
The literacy coach worked intensively with three classes in planning and implementing the literacy block.
Reading groups were resourced throughout the year to allow for smaller group sizes and targeted teaching.
Further development of the Whole School Literacy Agreement as a way of documenting our practice and commitment to literacy learning.
RECOMMENDATIONS FOR 2016:
Literacy will continue to be a focus in the 2016 Site Improvement Plan with a particular emphasis on writing.
Reading groups will continue for four hours a week in 2016 to consolidate the work we have done in this area. This requires drawing on better schools funding as well as leadership and SSO support to allow for smaller group sizes for targeted teaching.
A literacy working team will be established in 2016 to drive the site improvement plan. This team will consist of the assistant principal (curriculum), literacy coach and other staff members.
The data wall will be extended this year to include PAT, Probe and writing data. The wall will be used for staff to gain a more holistic view of student progress and achievement and to plan targeted teaching points for their students.
Professional development in literacy will focus on the Seven Steps to Writing Success resource and transforming tasks. Professional development will continue to emphasize collaborative planning, sharing and reflection.
The literacy coach will continue in the role in 2016.
Annual Report 2015
Page 5
2. Site Priority: Attendance
At Craigmore South Primary School we are establishing a culture of good attendance in the
community while establishing an effective process to monitor attendance.
ACTIONS 2015:
Ensure all staff are aware of their responsibilities for attendance, including using a staff meeting to go through process.
Ensure processes are in place for attendance that meet audit requirements.
Contact all parents where absence is above 20% in Term 1.
Provide capacity building to teachers and staff. OUR TARGETS IN 2015:
Increase school attendance to 93%
Increase school attendance to 95% by 2016 OUTCOMES FOR 2015:
Staff provided with the Attendance Policy and Procedure
In 2015 we have seen a slight improvement on 2014 data by 1.0% to 90%, which is below our target of 93%
We increased communication by staff to parents
Intervention occurred by the Partnership Attendance Officer targeting chronic and habitual non-attendees
Increased our information by regularly including attendance data in fortnightly newsletters and at governing council meetings.
RECOMMENDATIONS FOR 2016:
Review Attendance Policy
Increase school community awareness regarding the impact of non-attendance on student achievement
Continue to target habitual and chronic non-attendances with assistance of Partnership Attendance Officer
Investigate student engagement programs
Regularly monitor behaviour and attendance data as a staff
Research school engagement assessment models
Continue regular attendance information in newsletters
Implement a site improvement team focused on student and community engagement
4.1 Junior Primary and Early Years Scheme Funding
The Government implemented its Early Years Funding initiatives to reduce class sizes in the early years of schooling. Therefore, wherever practicable, schools must use the funding to employ
additional teaching staff to improve staff to student ratios for R‐3 students. In 2015 we received $100, 548 which enabled us to reduce class sizes below 26 in our Junior Primary. Of the 6 classes, 2 Reception classes began on 16, our two Year 1/2 classes began on 22 and 23 and our 2/3 classes began on 23 and 24. These numbers did fluctuate due to enrolments throughout the year however remained below 26 students in each class.
Annual Report 2015
Page 6
4.2 Better Schools Funding
The Better Schools funding of $94,024 was used with some addition school directed funding to continue our whole school reading program as part of the site priority focus on Literacy. The program involved all teachers, some SSO’s, specialist teachers and our Assistant Principals teaching reading for one hour per day 4 days a week. We have also utilised some of funding to continue our Literacy Coach role, supporting teachers with reading and writing pedagogy. Over the past 2 years we have seen an improvement in students’ growth as indicated in NAPLAN and PAT R results.
5. STUDENT ACHIEVEMENT
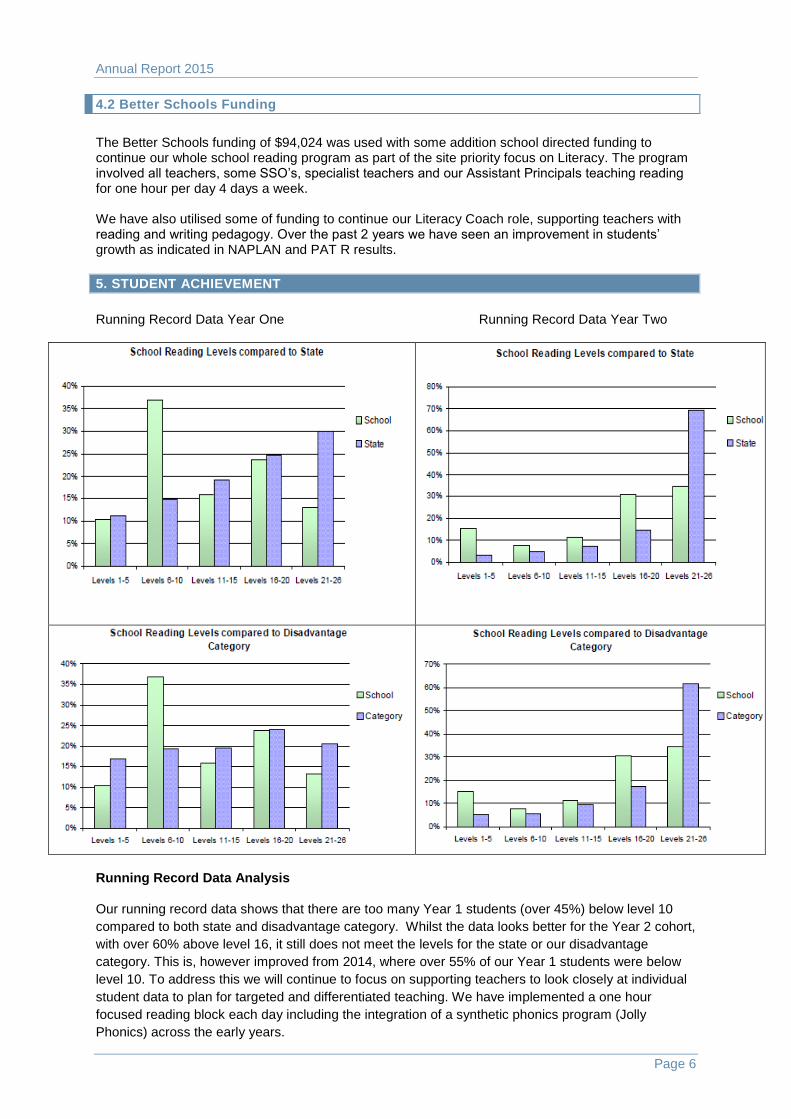
Running Record Data Year One Running Record Data Year Two
Running Record Data Analysis
Our running record data shows that there are too many Year 1 students (over 45%) below level 10
compared to both state and disadvantage category. Whilst the data looks better for the Year 2 cohort,
with over 60% above level 16, it still does not meet the levels for the state or our disadvantage
category. This is, however improved from 2014, where over 55% of our Year 1 students were below
level 10. To address this we will continue to focus on supporting teachers to look closely at individual
student data to plan for targeted and differentiated teaching. We have implemented a one hour
focused reading block each day including the integration of a synthetic phonics program (Jolly
Phonics) across the early years.
Annual Report 2015
Page 7
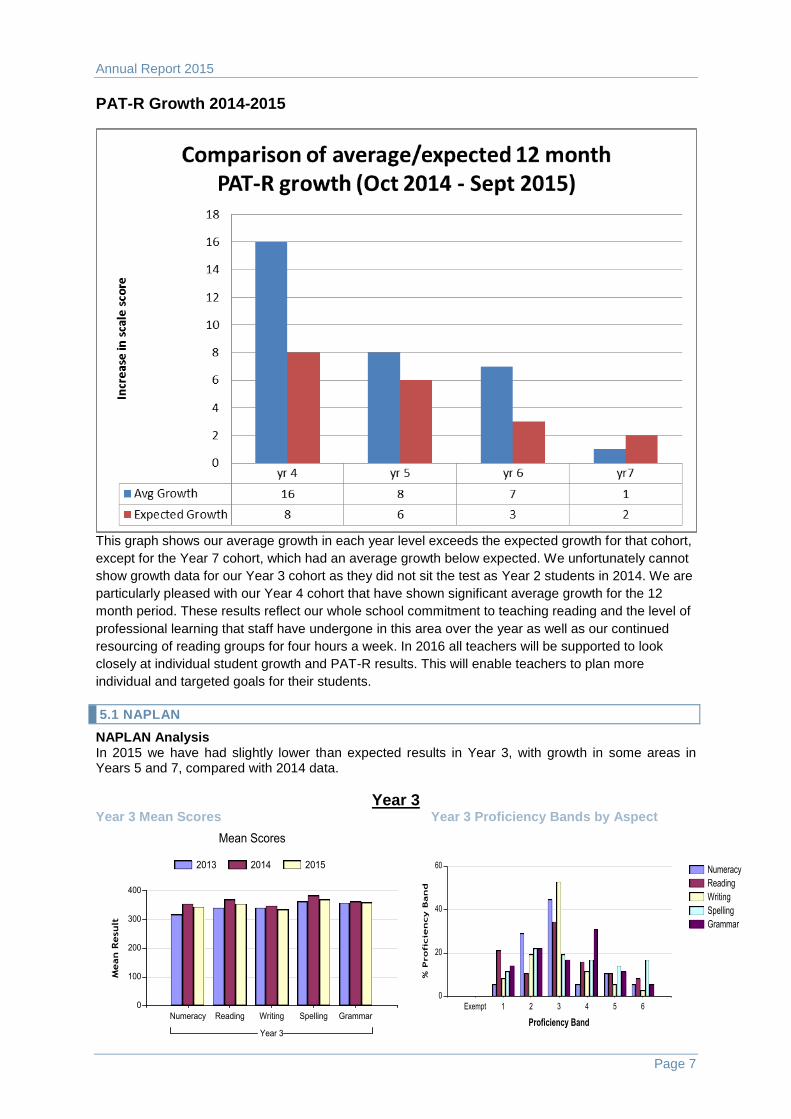
PAT-R Growth 2014-2015
This graph shows our average growth in each year level exceeds the expected growth for that cohort,
except for the Year 7 cohort, which had an average growth below expected. We unfortunately cannot
show growth data for our Year 3 cohort as they did not sit the test as Year 2 students in 2014. We are
particularly pleased with our Year 4 cohort that have shown significant average growth for the 12
month period. These results reflect our whole school commitment to teaching reading and the level of
professional learning that staff have undergone in this area over the year as well as our continued
resourcing of reading groups for four hours a week. In 2016 all teachers will be supported to look
closely at individual student growth and PAT-R results. This will enable teachers to plan more
individual and targeted goals for their students.
5.1 NAPLAN
NAPLAN Analysis In 2015 we have had slightly lower than expected results in Year 3, with growth in some areas in Years 5 and 7, compared with 2014 data.
Year 3 Year 3 Mean Scores Year 3 Proficiency Bands by Aspect
Annual Report 2015
Page 8
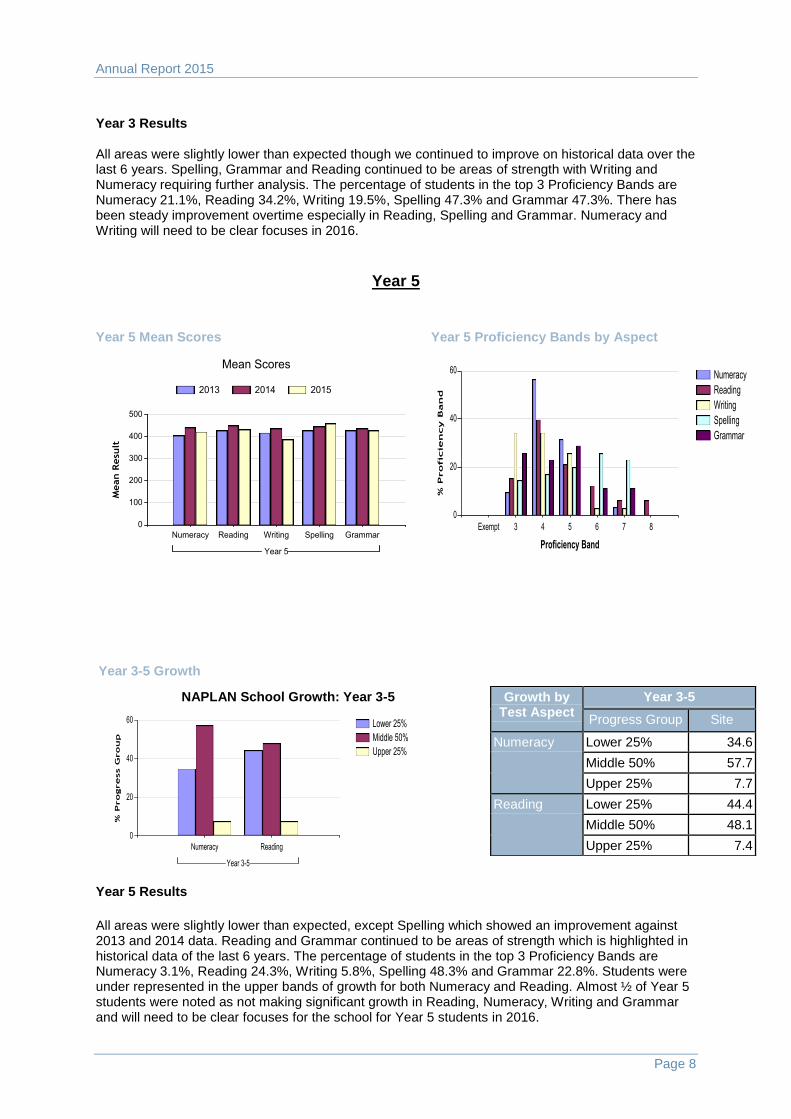
Year 3 Results All areas were slightly lower than expected though we continued to improve on historical data over the last 6 years. Spelling, Grammar and Reading continued to be areas of strength with Writing and Numeracy requiring further analysis. The percentage of students in the top 3 Proficiency Bands are Numeracy 21.1%, Reading 34.2%, Writing 19.5%, Spelling 47.3% and Grammar 47.3%. There has been steady improvement overtime especially in Reading, Spelling and Grammar. Numeracy and Writing will need to be clear focuses in 2016.
Year 5
Year 5 Mean Scores Year 5 Proficiency Bands by Aspect
Year 3-5 Growth
NAPLAN School Growth: Year 3-5
Year 5 Results All areas were slightly lower than expected, except Spelling which showed an improvement against 2013 and 2014 data. Reading and Grammar continued to be areas of strength which is highlighted in historical data of the last 6 years. The percentage of students in the top 3 Proficiency Bands are Numeracy 3.1%, Reading 24.3%, Writing 5.8%, Spelling 48.3% and Grammar 22.8%. Students were under represented in the upper bands of growth for both Numeracy and Reading. Almost ½ of Year 5 students were noted as not making significant growth in Reading, Numeracy, Writing and Grammar and will need to be clear focuses for the school for Year 5 students in 2016.
Growth by Test Aspect
Year 3-5
Progress Group Site
Numeracy Lower 25% 34.6
Middle 50% 57.7
Upper 25% 7.7
Reading Lower 25% 44.4
Middle 50% 48.1
Upper 25% 7.4
Annual Report 2015
Page 9
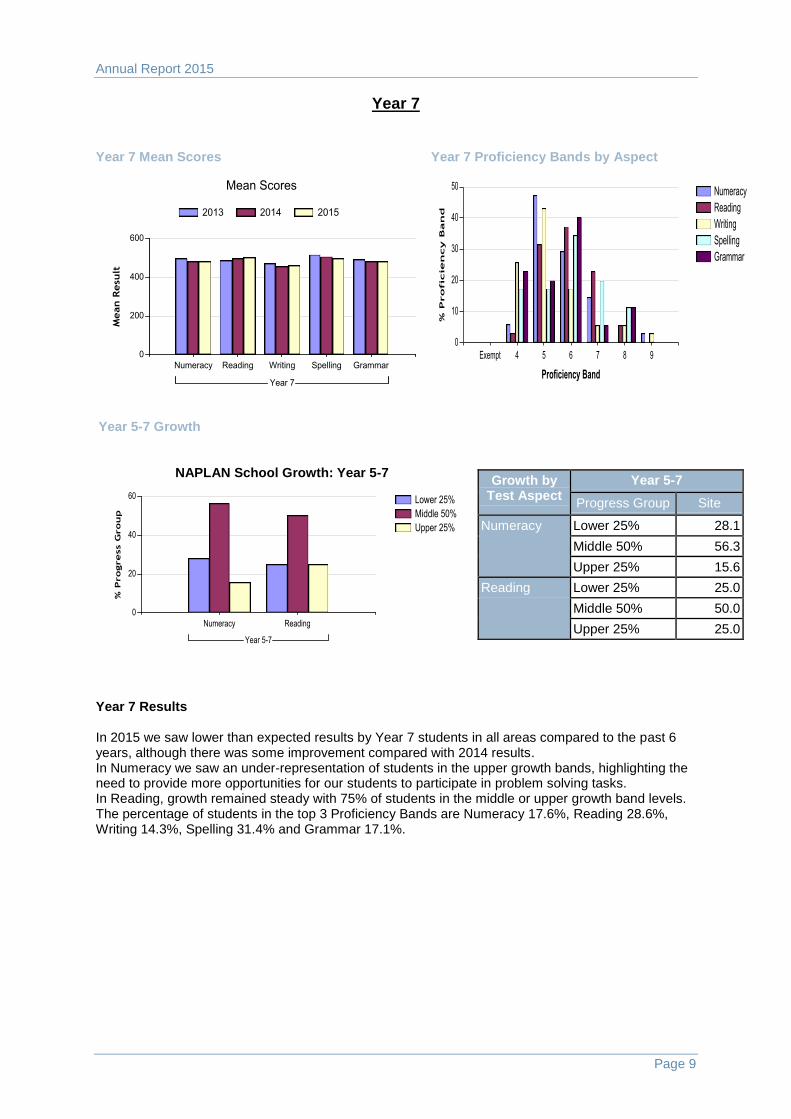
Year 7
Year 7 Mean Scores Year 7 Proficiency Bands by Aspect
Year 5-7 Growth
NAPLAN School Growth: Year 5-7
Year 7 Results
In 2015 we saw lower than expected results by Year 7 students in all areas compared to the past 6 years, although there was some improvement compared with 2014 results. In Numeracy we saw an under-representation of students in the upper growth bands, highlighting the need to provide more opportunities for our students to participate in problem solving tasks. In Reading, growth remained steady with 75% of students in the middle or upper growth band levels. The percentage of students in the top 3 Proficiency Bands are Numeracy 17.6%, Reading 28.6%, Writing 14.3%, Spelling 31.4% and Grammar 17.1%.
Growth by Test Aspect
Year 5-7
Progress Group Site
Numeracy Lower 25% 28.1
Middle 50% 56.3
Upper 25% 15.6
Reading Lower 25% 25.0
Middle 50% 50.0
Upper 25% 25.0
Annual Report 2015
Page 10
6. STUDENT DATA
6.1 Attendance
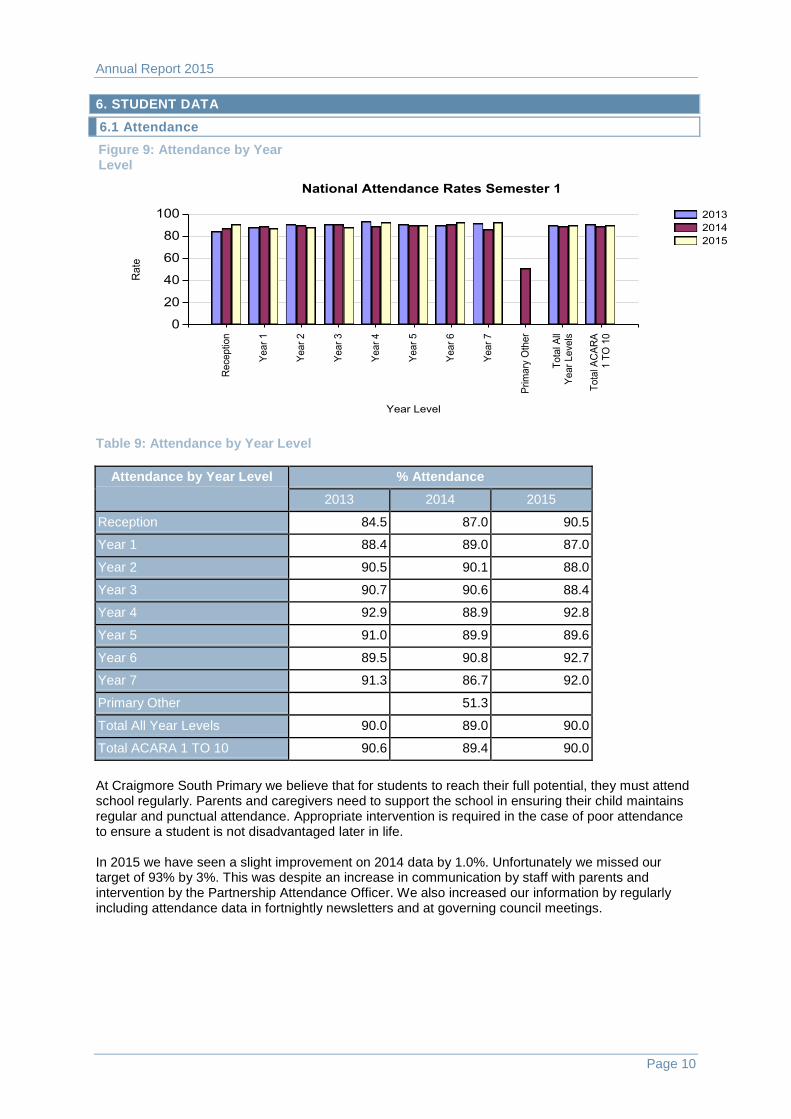
Figure 9: Attendance by Year Level
Table 9: Attendance by Year Level
Attendance by Year Level % Attendance
2013 2014 2015
Reception 84.5 87.0 90.5
Year 1 88.4 89.0 87.0
Year 2 90.5 90.1 88.0
Year 3 90.7 90.6 88.4
Year 4 92.9 88.9 92.8
Year 5 91.0 89.9 89.6
Year 6 89.5 90.8 92.7
Year 7 91.3 86.7 92.0
Primary Other 51.3
Total All Year Levels 90.0 89.0 90.0
Total ACARA 1 TO 10 90.6 89.4 90.0
At Craigmore South Primary we believe that for students to reach their full potential, they must attend school regularly. Parents and caregivers need to support the school in ensuring their child maintains regular and punctual attendance. Appropriate intervention is required in the case of poor attendance to ensure a student is not disadvantaged later in life. In 2015 we have seen a slight improvement on 2014 data by 1.0%. Unfortunately we missed our target of 93% by 3%. This was despite an increase in communication by staff with parents and intervention by the Partnership Attendance Officer. We also increased our information by regularly including attendance data in fortnightly newsletters and at governing council meetings.
Annual Report 2015
Page 11
6.2 Destination
Table 10: Intended Destination
Leave Reason 2014
School Index DECD
No % % %
Employment 4.8% 2.9%
Interstate/Overseas 5 7.2% 7.4% 9.5%
Other 1.7% 1.4%
Seeking Employment 5.7% 3.8%
Tertiary/TAFE/Training 3.8% 3.6%
Transfer to Non-Govt Schl 5 7.2% 6.6% 9.8%
Transfer to SA Govt Schl 59 85.5% 48.5% 48.8%
Unknown 21.6% 20.3%
Unknown (TG - Not Found) 0.0%
7. CLIENT OPINION
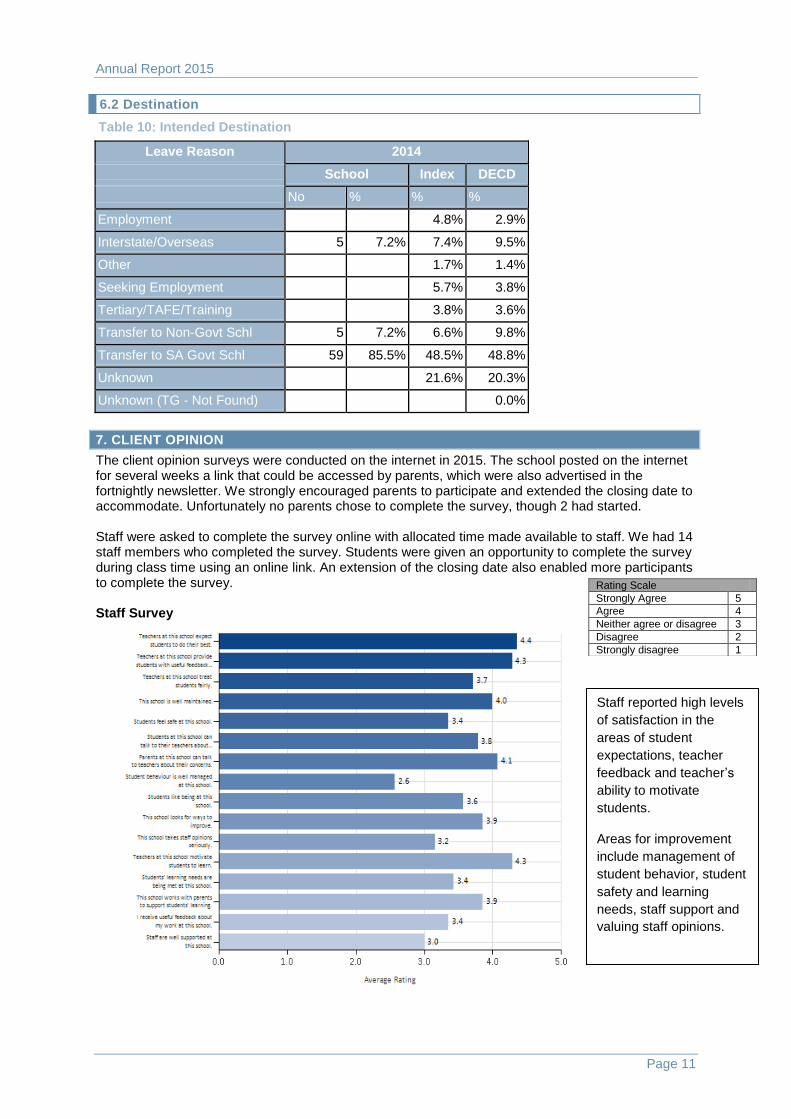
The client opinion surveys were conducted on the internet in 2015. The school posted on the internet for several weeks a link that could be accessed by parents, which were also advertised in the fortnightly newsletter. We strongly encouraged parents to participate and extended the closing date to accommodate. Unfortunately no parents chose to complete the survey, though 2 had started. Staff were asked to complete the survey online with allocated time made available to staff. We had 14 staff members who completed the survey. Students were given an opportunity to complete the survey during class time using an online link. An extension of the closing date also enabled more participants to complete the survey. Staff Survey
Rating Scale
Strongly Agree 5
Agree 4
Neither agree or disagree 3
Disagree 2
Strongly disagree 1
Staff reported high levels
of satisfaction in the
areas of student
expectations, teacher
feedback and teacher’s
ability to motivate
students.
Areas for improvement
include management of
student behavior, student
safety and learning
needs, staff support and
valuing staff opinions.
Annual Report 2015
Page 12
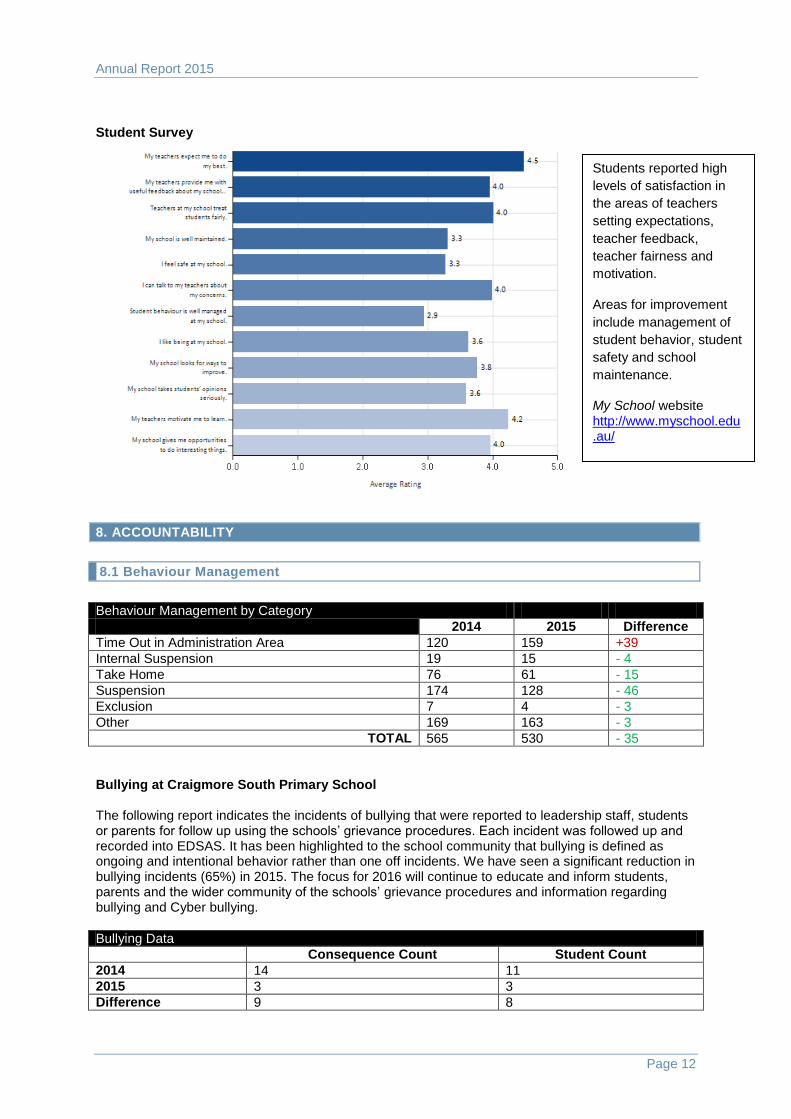
Student Survey
8. ACCOUNTABILITY
8.1 Behaviour Management
Behaviour Management by Category
2014 2015 Difference
Time Out in Administration Area 120 159 +39
Internal Suspension 19 15 - 4
Take Home 76 61 - 15
Suspension 174 128 - 46
Exclusion 7 4 - 3
Other 169 163 - 3
TOTAL 565 530 - 35
Bullying at Craigmore South Primary School The following report indicates the incidents of bullying that were reported to leadership staff, students or parents for follow up using the schools’ grievance procedures. Each incident was followed up and recorded into EDSAS. It has been highlighted to the school community that bullying is defined as ongoing and intentional behavior rather than one off incidents. We have seen a significant reduction in bullying incidents (65%) in 2015. The focus for 2016 will continue to educate and inform students, parents and the wider community of the schools’ grievance procedures and information regarding bullying and Cyber bullying.
Bullying Data
Consequence Count Student Count
2014 14 11
2015 3 3
Difference 9 8
Students reported high
levels of satisfaction in
the areas of teachers
setting expectations,
teacher feedback,
teacher fairness and
motivation.
Areas for improvement
include management of
student behavior, student
safety and school
maintenance.
My School website
http://www.myschool.edu.au/
Annual Report 2015
Page 13
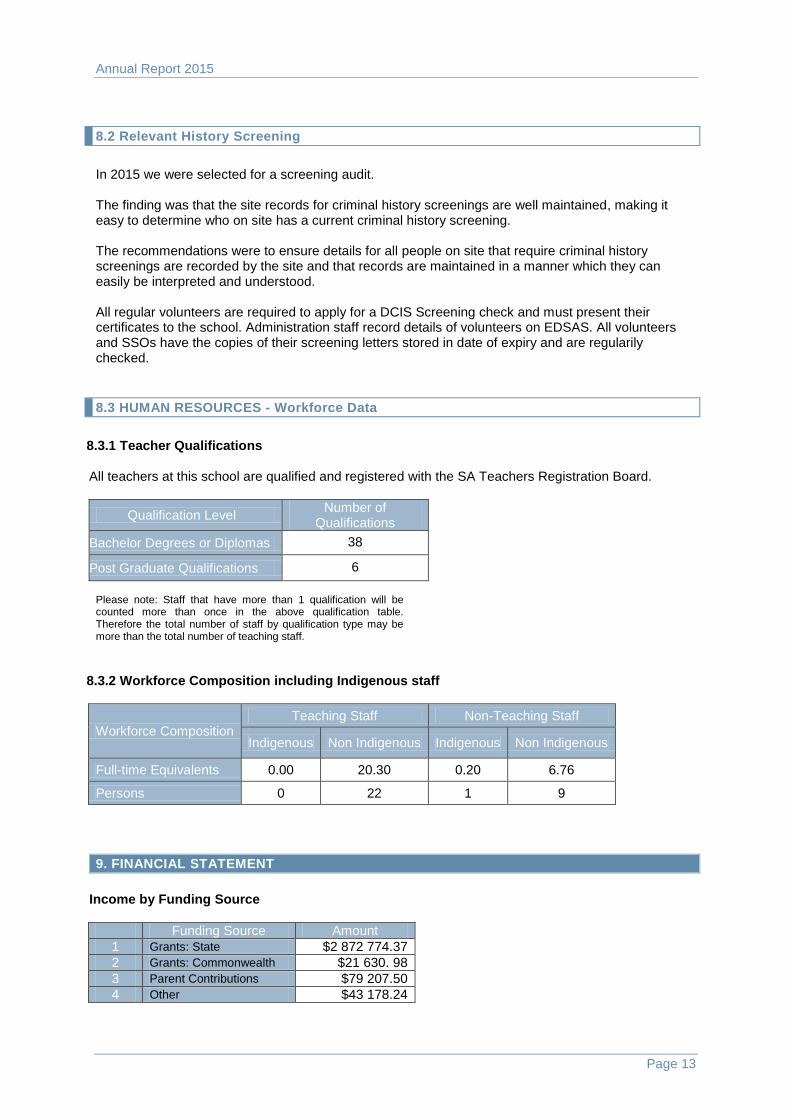
8.2 Relevant History Screening
In 2015 we were selected for a screening audit. The finding was that the site records for criminal history screenings are well maintained, making it easy to determine who on site has a current criminal history screening. The recommendations were to ensure details for all people on site that require criminal history screenings are recorded by the site and that records are maintained in a manner which they can easily be interpreted and understood. All regular volunteers are required to apply for a DCIS Screening check and must present their certificates to the school. Administration staff record details of volunteers on EDSAS. All volunteers and SSOs have the copies of their screening letters stored in date of expiry and are regularily checked.
8.3 HUMAN RESOURCES - Workforce Data
8.3.1 Teacher Qualifications All teachers at this school are qualified and registered with the SA Teachers Registration Board.
Qualification Level Number of
Qualifications
Bachelor Degrees or Diplomas 38
Post Graduate Qualifications 6
Please note: Staff that have more than 1 qualification will be counted more than once in the above qualification table. Therefore the total number of staff by qualification type may be more than the total number of teaching staff.
8.3.2 Workforce Composition including Indigenous staff
Workforce Composition Teaching Staff Non-Teaching Staff
Indigenous Non Indigenous Indigenous Non Indigenous
Full-time Equivalents 0.00 20.30 0.20 6.76
Persons 0 22 1 9
9. FINANCIAL STATEMENT
Income by Funding Source
Funding Source Amount
1 Grants: State $2 872 774.37
2 Grants: Commonwealth $21 630. 98
3 Parent Contributions $79 207.50
4 Other $43 178.24
Annual Report 2015
Page 14
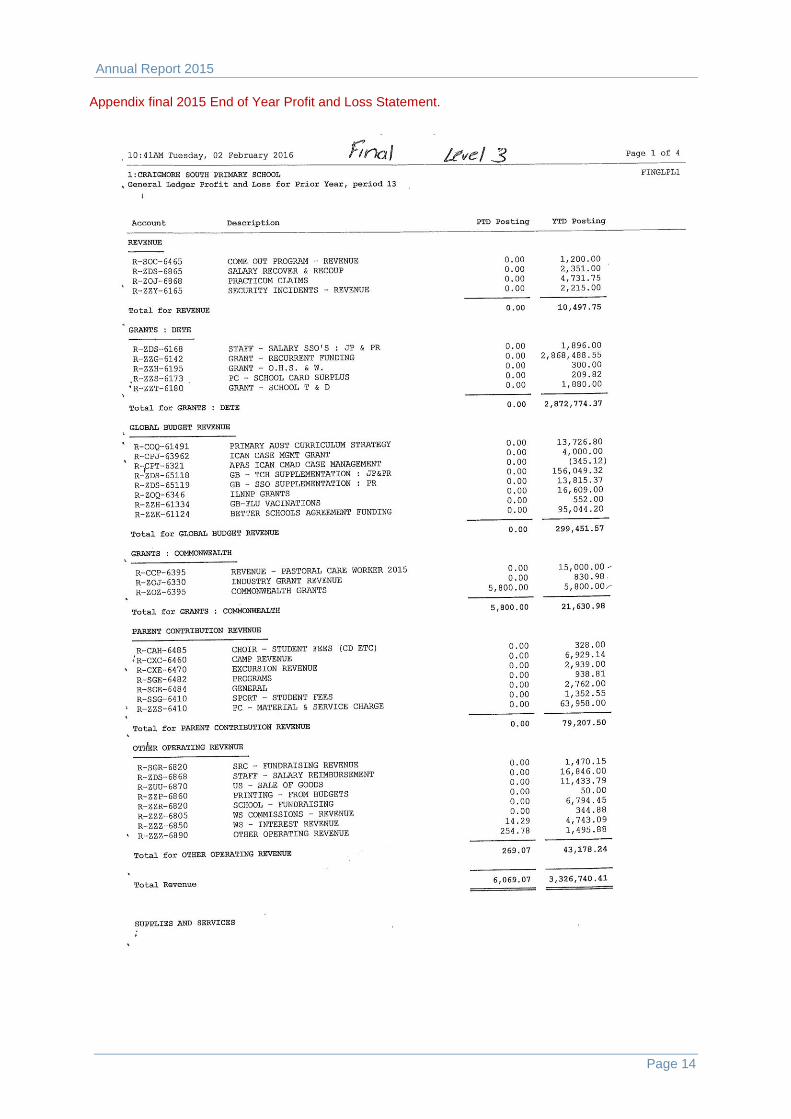
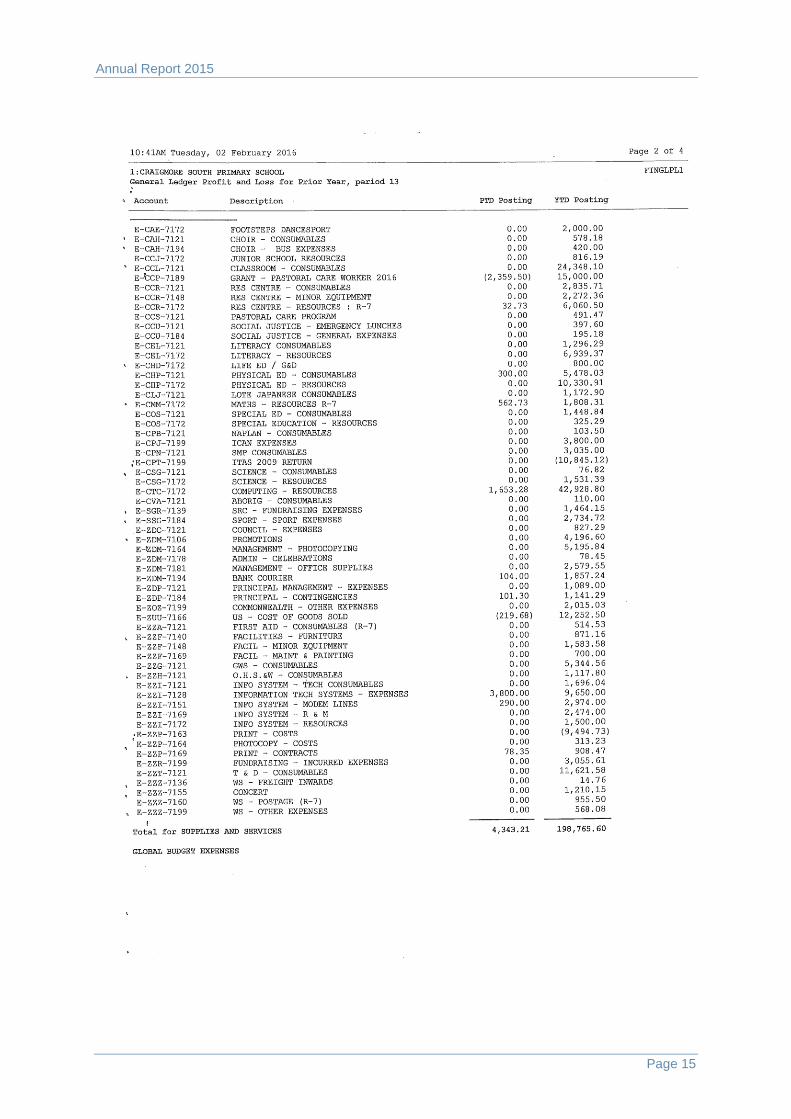
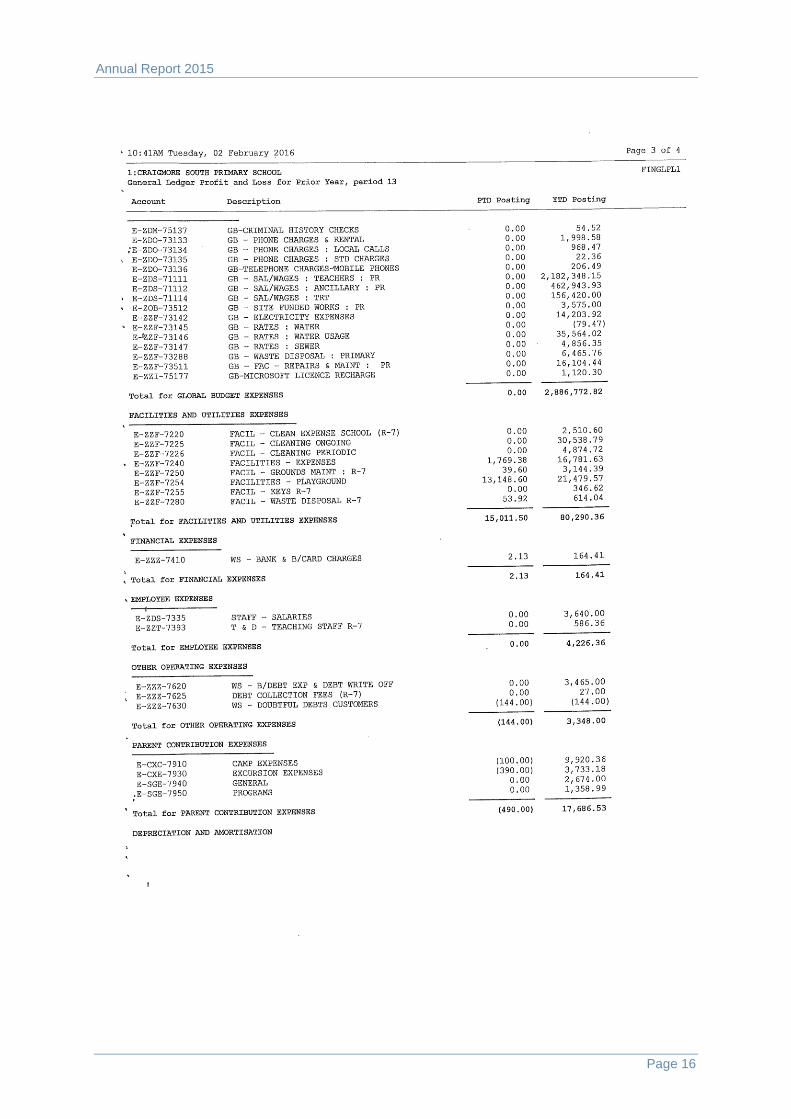
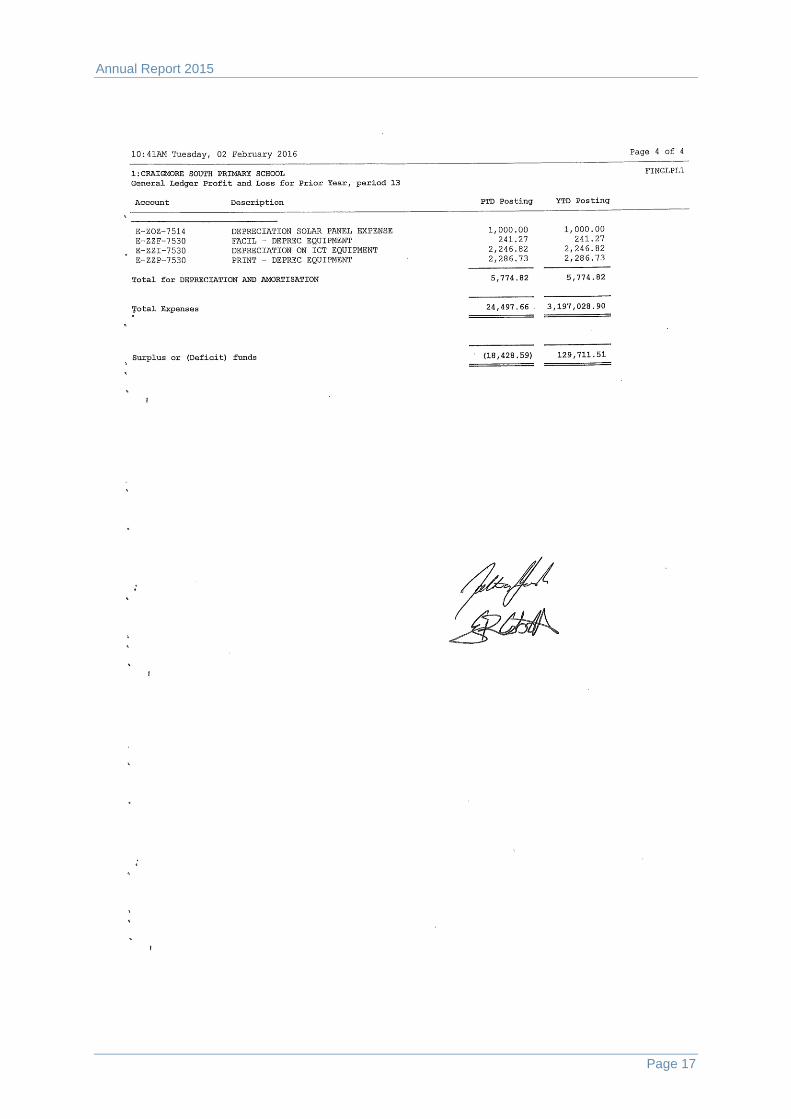
Appendix final 2015 End of Year Profit and Loss Statement.
Annual Report 2015
Page 15
Annual Report 2015
Page 16
Annual Report 2015
Page 17