Embed Size (px)
Citation preview

CENTER FOR INTERNATIONAL STUDIES
Mario Einaudi
OCTOBER 2021
-2.0%
0.0%
2.0%
4.0%
6.0%
8.0%
10.0%
12.0%
14.0%
2018201420102006200219981994199019861982197819741970
ANNUAL CPI INFLATION 10 YEAR TREASURY YIELD
Inflation in the 21st Century
Taking Down the Inflationary Straw Man of the 1970s
DANIEL ALPERT
Cornell Research Academy of Development, Law, and Economics
(CRADLE)
i
Inflation in the 21st CenturyTaking Down the Inflationary Straw Man of the 1970s
Daniel Alpert
AbstractThis overview of the history of, and future prospects for, undesirable levels of price inflation in the U.S. economy concludes that concerns raised in 2021 by several well-known economists and analysts – regarding the pros-pects for accelerating levels of inflation as a result of pandemic-era and post-pandemic fiscal and monetary policy (enacted and proposed) – is misplaced. The wisdom of continuing expanded fiscal policy from late 2021 onwards is supported by an analysis of the prospects for future inflation in terms of both (i) the shortfall in aggregate domestic demand relative to existing endogenous and exogenous supply; and (ii) the metrics of untapped existing sources of additional supply of labor, capital and resulting production to offset incremental demand. To eliminate the issue from comparative association, the paper draws a multi-pronged distinction between the conditions of the early 21st century and those of the latter half of the 20th century that yielded the painful inflation crises of the 1970s. The analysis also includes a comparison of earlier periods dominated by cyclical core goods inflation, to the 21st century history of below-target inflation being supported primarily by service sector inflation in contract rents related to cap-ital assets and in service sectors heavily influenced by third-party payment systems. The conclusion reached is that the four decades of relative fiscal austerity in the United States, coupled with accelerating globalization and tech-nological development, have produced a disinflationary-to-deflationary tendency – extending from prices to labor incomes – that only substantial amounts of targeted federal spending can restore to equilibrium. With sustained levels of accelerating inflation being very unlikely.
The paper is written in a style designed to be accessible to those who are not necessarily practicing economists, avoids complex mathematics in favor of graphic explanations, and eschews (or explains) terms that are not familiar to those with only a basic understanding of macroeconomic issues.
AcknowledgementsThe author wishes to acknowledge the assistance and advice of his Cornell colleagues and writing partners Robert C. Hockett, Edward Cornell Professor of Law and Financial Regulation, and Paul Allen McCulley, senior fellow at Cornell’s Jack G. Clarke Business Law Institute, adjunct professor at Georgetown University’s McDonough School of Business, and former Chief Economist at Pacific Investment Management Company LLC (PIMCO). The author also wishes to thank Steven Blitz, Chief U.S. Economist and Managing Director of TSLombard, who has contributed so much excellent analysis over the years. Thanks are also due to the leadership and academic participants at the Levy Economics Institute of Bard College who were instrumental in the author’s appreciation of the work of the late Hyman Minsky and post-Keynesian economic analysis; and to the author’s colleagues – from many schools of economic thought – in the International Club of Business Economists.

ii
Inflation in the 21st CenturyTaking Down the Inflationary Straw Man of the 1970s
Daniel Alpert
TABLE OF CONTENTS
Forward – Paul Allen McCulley iii
Introduction 1
“Good” Inflation and “Bad” Inflation 1
Stepping Back from the Trees to see the Forest 3
Determining What to Spend – How to Pay for it Should be Obvious 3
Section I – The 21st Century U.S. Economy is Not Wired to Produce Sustained Demand-pull Inflation in the prices of Goods and Services 5
The Effective Underemployment of American Labor 5
The Declining Effectiveness of Monetary Stimulus 6
The Pandemic Reveals one of the Economy’s Dirty Secrets 7
Section II – The “Non-accelerating Inflation” Capacity of the Domestic and Global Economy to Fulfill U.S. Demand Remains Extraordinarily High 10
Capacity and Potential 10
The Importance of Imports 12
Section III – The Shifting Drivers of Core Inflation – 1990 to Present 16
Section IV – What is the Relevance of 1970s Inflation to Present Day? 19
Section V – Inflation, Debt and Assets – Dilemmas and Answers 25
Let Them Eat Debt 25
A Tale of Two Price Systems 26
Distorted Equity and Other Asset Marketsare not a Sign of Future Inflation 30
Section VI - Conclusion 32

iii
Foreword
Paul Allen McCulley
In 1970, Milton Friedman famously declared: “Inflation is always and everywhere a monetary phenomenon in the sense that it is and can be produced only by a more rapid increase in the quantity of money than in output.”
To this day, that putative verity is regularly trotted out by economist and politicians, whenever inflation accelerates, usually summarized in the cliche that inflation is “too much money chasing too few goods.” Implying, of course, that our government needs to rein in the amount of money doing the chasing.
This pithy conclusion ignores two critical issues:
1. Who owns the money that is doing (or, increasingly, not doing) the chasing; and
2. What could the government do to increase the supply of goods (and services) that are being chased?
Both questions deserve rigorous examination, both to understand the history of inflation, as well as its prospective path. This is especially so at present, when inflation is accelerating, after a decade of running too low, not too high.
We need to understand why it has been secularly too low, not just observe that it is presently cyclically elevated.
We also need accept that while inflation may always and everywhere be a monetary phenomenon (subject to the effectiveness of monetary transmission), it is not always and everywhere a bad thing. Quite to the contrary, inflation can very much be a good thing, if and when it reflects a reordering of pricing power from capital to labor, increasing labor’s share of the fruits of its production, while incentivizing capital to increase the productivity of the nation’s output.
Put simply, a combination of a tight labor markets and robust investment in productive capacity is exactly what America needs, to both redress a manifestly unjust distribution of national income and wealth, while also generating sufficient growth in aggregate demand to cut off the fat-tail risk of continued too-low inflation, on a secular basis.
Fear of inflation, in and of itself, is not virtue, but an anti-democratic vice. Likewise, fear of aggressive use of fiscal policy for public investment, in both tangible and human capital, is not an act of prudence, but one of collective defeatism.
I heartedly recommend a thorough read of my colleague, Daniel Alpert’s, deep dive into these existential questions about the underlying dynamics of inflation, away from current headline hysteria.
After a decade of too-low inflation on Main Street, and too-high inflation on Wall Street, the time is ripe for a shift to fiscal policy leadership in our nation’s policy mix.

INFLATION IN THE 21ST CENTURY
1DANIEL ALPERT
Inflation in the 21st CenturyTaking Down the Inflationary Straw Man of the 1970s
Daniel Alpert1
1 Daniel Alpert is founder and managing partner of the New York-based investment bank, Westwood Capital, LLC, an adjunct professor at Cornell Law School, and a senior fellow in macroeconomics and finance in the Program on the Law and Regulation of Financial Institutions and Markets of the school’s Jack G. Clarke Business Law Institute. Alpert is also a member of the research team of the Cornell Research Academy of Development, Law, and Economics (CRADLE) at the university’s Mario Einaudi Center for International Studies.
2 It should be noted that there is another political constituency objecting to the president’s policy proposals on ideological grounds related to philosophical objections to having government play an increased role in the U.S. economy. Such parties have – over the past decades – repeatedly raised contrivances, including inflation fears, currency debasement and so-called “fiscal crises” to oppose the type of govern-ment-generated economic stimulus that was more commonplace prior to the 1980s. No change in the opposition exerted by this group can be reasonably expected, regardless of the clarity of any argument that is contrary to their mission
IntroductionIn February of 2021, a coterie of academic and business economists and commentators (see, e.g., Summers, Blanchard, El-Erian, Rattner) began to express views ranging from apprehension to outright alarm that the expan-sionary fiscal plans put forth by the Biden administration would likely result in sustained - and possibly difficult to control - levels of U.S. price and wage inflation. Joined by others, the chorus of concern has been heard from repeatedly since.
As of this writing, a principal component of the administration’s program – the $550 billion Infrastructure Investment and Jobs Act - has already been passed in the U.S. Senate with bipartisan support and, while the subject of a leg-islative tussle in the U.S. House of Representatives, is likely to be enacted. Obtaining a legislative majority via the senate’s reconciliation procedures (without support from the Republican minority) for the administration-backed $3.5 trillion budget resolution including substantially more fiscal support for the U.S. economy, is presently far less certain as there are lingering concerns among several centrists in the Democratic majority. And chief among such concerns appears to be the ability of the U.S. economy to absorb the resulting stimulus without undesirable inflationary effects.
This paper directly addresses these concerns by evaluating the vulnerability of the U.S. economy to inflationary pressures as it emerges from the global pandemic that began in the first quarter of 2020. In short, the substantial preponderance of evidence indicates that the hand-wringing of some economists writing earlier this year is substan-tially unfounded2. Yet this paper is also intended to be a lasting commentary on very nature of inflationary forces on the U.S. economy in the present century. And of how those forces have departed from economic observations wit-nessed in earlier eras, thus requiring a reassessment of elements of theory on which those same economists rely.
“Good” Inflation and “Bad” Inflation
Let’s begin by level setting what is meant by undesirable inflation – and what, it is safe to assume, those who are excessively concerned by the prospect of same are referring to. In one long sentence, that would be demand-pull inflation emanating from a greater government fiscal role in the economy that produces an accelerating tendency for the prices of goods and services to rise, eventually proving detrimental to growth by virtue of the need for the monetary authority (the Federal Reserve) to take aggressive action to rein-in accelerating price growth via raising interest rates.
And who could argue? That would be most undesirable
Yet, as this paper will demonstrate, it is also an extraordinarily difficult condition to create under the present state of domestic and global macroeconomic conditions (including conditions having little to do with the pandemic).
That is not to say that this paper takes a uniformly anti-inflation position. In fact, inflation that is generated by plac-ing more purchasing power broadly in the hands of households by offering more workers better paying jobs is not remotely undesirable. And unlike previous eras government (in both its fiscal and monetary capacities) – working in

INFLATION IN THE 21ST CENTURY
2DANIEL ALPERT
conjunction with the private sector – today has the tools and mechanisms today to grow capacity and production in a manner that moderates such inflation to tolerable and non-accelerating levels.3
Because while moderate inflation targeting may sound an awful lot like Fed policy during this century to date, the methods used (and, more importantly, not used) to achieve that target have mostly failed to the downside. And this is in large part because in the Federal Reserve’s multi-decade effort to avoid accelerating inflation at all costs, the U.S. has produced an accelerating concentration of GDP in the hands of an ever-fewer number of households with a low propensity to spend most of what they obtain.
The excessive concerns regarding inflation that again rear their head today are not only misplaced because of the changed circumstances in which the U.S. economy has become mired in this century, but because the effects of the past forty years of U.S. economic history have resulted in the deflation in the price paid for U.S. labor, relative to the value of total production.
And while prices of goods, and many services, have proven extraordinarily resistant to inflationary pressures for decades, downward pressures on labor incomes, relative to returns to capital – for most all except the narrowest upper strata – has been unrelenting.
In short, labor share of production is in desperate need of reflation – “good” inflation – and the U.S. economy has enormous headroom for that to happen without experiencing anything on the order of the harmful economic effects of inflation associated with the 1970s – admittedly a very painful period of the 1970s, during which the growth (and expectations of future growth) in prices of all types advanced at a pace that outran the pace of household income growth for a protracted period of time (“bad” inflation, for sure).
Yet today, as detailed here, the U.S. economy have the ability to absorb sturdy, broad, and expectations-anchored growth in household incomes – and thus obtain a somewhat more equitable diffusion of the nation’s aggregate wealth – with moderate inflation. And this combination will not yield the experience of the 1970s but rather some-thing far more like that of the 1950s and 1960s before the unique disruptions experienced during the decade that followed led the United States down a path to increasing economic polarization, and eventually to the severe political instability of the past thirteen years that in large part has resulted therefrom.
So while reflation of labor incomes would necessarily result in demand-induced price pressures, the question should be what is the capacity of an economy to absorb such pressures without giving way to accelerating inflation.
Yet those who focus on the currently proposed fiscal spending itself as generating a substantial risk of undesir-able inflationary pressures, assume away the ability of the supply side – with all of its global reach – to adjust to increased demand.
This is a critical oversight (if not an intentional one) because on a global level, with the emergence of the post-social-ist and other developing nations, final consumption demand expenditures grew from $21.8 trillion to $64.1 trillion over the twenty years from 1999 (130%) to 20194 – with U.S. inflation averaging 2.6% per annum across that period and only 1.9% per annum over the second half of that period (54% cumulatively)5.
Nominal expenditures up 130% and cumulative price inflation up only 54%? That’s an awful lot of supply side absorp-tion – the source of which is addressed in Section II. And there is no reason to conclude that the global supply side has reached any practical limits in its ability to absorb a steady rise in U.S. demand (and especially no conclusion to be drawn from price spikes resulting from transitory post-pandemic supply chain bottlenecks).
It is therefore not unreasonable – however lacking in politesse – to put to those who have presented arguments to the contrary that they are, either knowingly or carelessly, advancing the interests of those who wish to maintain the status quo relative to the distribution of the fruits of production in the U.S. as between labor and capital.
The author of this paper, in addition to being an academic, is a dedicated capitalist with decades of experience in the financial markets and enjoying its economic bounty as much as any other in the trade. But when it comes to sup-porting the reflation in the incomes of workers – especially when we have the opportunity to shift a failed forty-year
3 Generally speaking, between 2% and 3% on average over time.4 World Bank and OECD national accounts data.5 Bureau of Labor Statistics

INFLATION IN THE 21ST CENTURY
3DANIEL ALPERT
paradigm and do so at a rate that can exceed any resulting increase in the prices of goods and services – taking a temporary hit to growth in capital returns is the exactly the right thing to do.
Why? Because we know that higher aggregate household demand, obtained not by households taking on debt but by earning higher incomes and met by increased unit output at prices that remain affordable, is the surest generator of sustainable wealth creation for both the holders of substantial amounts of capital, as well as those – especially those – seeking to amass capital via their labor.
The U.S. economy – that of the now-faded American dream – has been here before. And if we truly “follow the eco-nomics,” as opposed to remaining slaves to outdated ideologies spurred by a combination of misplaced fears and cynical avarice, there is tremendous opportunity ahead.
Stepping Back from the Trees to see the Forest
While the following is detailed and, as such, may cover several issues that those with only a passing understanding of economics may be less familiar with, this paper endeavors to describe and illustrate as clearly as possible (with-out going all the way back to the very basics of economic theory) the complex and tangled forest of price movements in the 21st Century.
The content herein avoids, or at least simplifies, mathematical proofs in favor of clear graphical presentations of historical data that supports its arguments. Although a number of footnotes have been inserted for those interested in more technical background. The author’s intention was to produce a document that is readable and understand-able by the vast majority of those in the markets, in the media, in congress and on congressional staffs, in the administration, and by his fellow citizens – as well as those in the academe.
It should be clear to all who read this that it is seeking to challenge and influence current fast-moving policy making activities. For good reason. At this point in a fragile recovery from the second great economic crisis in as many decades policy missteps that are the outcome of either incorrect analysis or misunderstanding would be nothing short of tragic.
For one of the deficiencies in the opposing viewpoint is can be described as an absence of effort to separate pun-gently-aged academic theory from the empirical evidence obtained over the past thirty or so years.
It is precisely that deficiency that this paper works to remedy. And there is no time to waste in doing so.
Determining What to Spend – How to Pay for it Should be Obvious
The issue of how to pay for the infrastructure and social spending advocated by the administration tends to dominate conversations in the halls of government, regarding the appropriateness of the spending itself. It is unfortunate, if not foolish on its face to be seeking to identify short- or medium-term “payfors” in connection with government’s making capital and systemic investments that will have economic benefits accruing over generations. It is only common sense that the cost of such investments be amortized over time as they would be in the private sector.
Moreover, the U.S. government is, of course, not the private sector. It has the ability to issue and borrow in the currency it uses to pay for what it buys. Writing at a time when the bond market has been almost begging the gov-ernment to recycle excess capital by offering it the lowest interest rates in history to do so, all signs point to one of the most auspicious moments in history to avoid any contractionary payfors.
But what is most alarming about the arguments coming from inflation hawks is that if they were right about height-ened risks of undesirable levels of accelerating inflation over the long term (which they are not), whatever debt taken on to finance the spending currently being proposed would thereafter be paid off with far cheaper dollars. Or, in other words, inflation would do what it always does for borrowers – lightens the load of liabilities.
To that extent, it is worth noting that the Infrastructure Investment and Jobs Act passed the Senate, and will undoubtedly be eventually enacted into law, despite the fact that on the eve of is senatorial passage the Congres-sional Budget Office “scored” the legislation as likely to require $256 in additional borrowing. As noted above, that is the right way to finance intergenerational investment – and the legislation passed with bipartisan support, notwithstanding.

INFLATION IN THE 21ST CENTURY
4DANIEL ALPERT
While the withdrawal of money from the economy via taxation or for that matter, government bond issuance, are both likely to be disinflationary, the timing of spending and payment can be, and generally is, asynchronous. And therein lies the principal fiscal mechanism for encouraging or tempering inflation at any given level of spending. Because global capital is so copiously accessible, and/because inflation has been low for so long6, it is just common sense to put it to better use by crowding in such capital for useful and expansionary collective purposes.
But those who fear inflation may counter: “Crowding in capital? Tut-tut. What you propose runs the risk of crowding out private sector access to capital as we have been warning you7 about for decades. No, sirs, what your spending program will deliver is the reversal of the capital glut that has brought us historically low interest rates and – with them – long periods of growth and high asset values. We will see the worst of all worlds – stagflation!”
To them one can point not only to the multiple economic crises, related asset bubbles, and the grinding polarization of income and wealth, that have transpired “on their watch” – but to the contents of rest of this paper.
Nevertheless, it is important to acknowledge that an economy being run principally by the monetary authority to attenuate inflation is inherently more disinflationary than one in which the fiscal agent of government is actively attempting to spur more equitable growth.
It is precisely such equitable growth that has been missing from the past 40 years of U.S. economic history, the absence of which has yielded both economic and political turmoil. So much so that the very plumbing of the U.S. economy, and is place in the global economy, is so skewed against inflationary outcomes that the panicked tones of those warning of debilitating inflation are seriously off key.
~~~~~
The balance of this paper takes stock of the case for aggressive spending, versus hand-wringing about accelerating inflation, by examining:
I. inflationary attributes of U.S. demand for goods and services;
II. the non-inflationary capacity of the domestic and foreign economies to meet U.S. aggregate demand8;
III. the dramatic changes to the drivers of core inflation over the past three decades;
IV. oft-cited comparisons of this post-pandemic period to the extraordinary inflation experienced from 1969 – 1979; and
V. inflation in the prices of financial and real property assets over the past several decades; and finally offering.
Section VI, sets forth concluding thoughts.
6 Section I of this paper addresses the transient inflation spikes associated with the pandemic reopening.7 Incorrectly8 Note that this paper does not specifically address the impact of technological advances and their applications on price inflation. If for no
other reason than simply because, while major technological advances tend to occur in fits and starts, the applications thereof throughout economic activity (i.e. in both goods production and services) are relatively consistent over time. It is true that the substitution of technology solutions for labor tends to be disinflationary over time, just as it is true that there is a difficult-to-measure form of deflation that accompanies substitution – at equivalent prices – of products and services offering greater utility for those offering lesser utility, over time.

INFLATION IN THE 21ST CENTURY
5DANIEL ALPERT
I. The 21st Century U.S. Economy is Not Wired to Produce Sustained Demand-pull Inflation in the prices of Goods and Services
Regardless of how much monetary easing central banks provide, or how much governments spend directly to stimulate the economy, the success of any stimulative policy depends on the transmission of same to aggregate demand. The same is true of inflation – which is always and everywhere (to refute Friedman9) a phenomenon of demand running ahead of supply.
All other correlations with inflation are ultimately dependent on transmission to demand. Whether unemployment, income growth, or cheaper and more plentiful money, there can be no inflation unless consumption increases rela-tive to more limited supply.
“Supply-side” economic theory postulates that easier monetary policy can produce higher levels of investment, therefore increasing supply and thus modulating inflationary pressures and permitting higher levels of non-infla-tionary growth. Putting aside that the past quarter century of history has left that theory without legs, even in that instance a stable inflationary environment is dependent upon increased demand by households and firms – in the absence of which additional supply would result in deflation.
The foregoing is, of course, the basis of pretty much every flavor of Keynesian economic thought that dominates mainstream economics.
Accordingly, there can be growth without inflationary pressures. Growth is measured by economists in positive changes in economic production. All you need to do to avoid inflation amidst steadily, or even rapidly, growing production is to ensure (i) that such growth is the outcome of substantial improvements in economic productivity, or (ii) that little of the bounty from such increased growth is transmitted to those likely to spend it. The first has been absent from the past two decades economic performance, so it follows that the weak inflation of the past decades follows from the latter.
The Declining Labor Share of Growth
Another way of saying the above is if increased growth flows to returns to capital (owners) who are either too rich to be inclined to spend more, or not inclined to make new investments with it (meaning build new productive “stuff,” not just buy existing stuff from others), then all the monetary or fiscal stimulative policy known to man will not mate-rially increase aggregate demand or inflation.
And that pretty much describes the U.S. (and many other advanced economies) over the past quarter century. The modern U.S. economy, between globalization that has seen the loss of 4.24 million high quality U.S. goods producing jobs this century (the equivalent of 5.25 million when accounting for population growth), and the advancement of technologies that harvest fat returns without requiring much in the way of labor, is teed up to channel growth to capital. In fact, labor share of production has been declining, on and off, over the past 50 years and the U.S. economy now transmits less than 60% of what it produces in consideration of its inhabitants’ toil and sweat (Figure 1).
Figure 19 Friedman, Milton, “Inflation is always and everywhere a monetary phenomenon in the sense that it is and can be produced only by a more rap-
id increase in the quantity of money than in output,” from article in Journal of Money, Credit, and Banking, Princeton University Press, 1963.

INFLATION IN THE 21ST CENTURY
6DANIEL ALPERT
But “labor’s share” of production has itself become somewhat exaggerated, as a chuck of that goes to what have become an increasingly wealthy cohort of households with a low propensity to spend what they get, and are often being compensated well in excess of the conventional notion of one’s labor value alone.
As of 2017, the Congressional Budget Office reported that the share of income before transfers and taxes among households in the top 1 percent in the U.S. (those making an average of $2 million per year) was 17%. That share had increased by 8 per-centage points in just under 40 years. Meanwhile, the share of income among the middle three quintiles fell by 7 percentage points, and the lowest quintile’s share fell by 1 percentage point.
Economic literature indicates that basically none of that eight percentage points of growth in the share of the 1%, (which eight percentage points equated to an aggregate of $1.13 trillion in 2017, or just under half of an average 1% household’s $2 million in income) flowed to either increased consumption or to primary investment in “new stuff” on the part of the wealthy. After all, they were making plenty of money already, so all the better to save that excess, loan it to the federal, state or local governments, or mess around in some already existing stocks and corporate bonds.
$1.13 trillion was about 5.75% of 2017 GDP. So when comparing labor share of GDP over the period reflected in the above graph, keep in mind that the increasing polarization of incomes in the U.S. has effectively reduced the consumption, and therefore inflationary pressures that would otherwise materialize from that chunk of GDP.
Why is this so?
The Effective Underemployment of American Labor
One important reason is that the U.S. economy has not only became progressively more dominated by service employ-ment – as opposed to goods production – through 2008, but it has literally reached a state of “apparent peak service employment (Figure 2).” In other words, only the goods pro-duction that absolutely must be done here (mainly construc-tion, heavy manufacturing, food processing) is still offering gainful employment to Americans. The rest are in a combina-tion of (i) a relatively small number of super-well-paying per-sonal services positions in the traditional professions and technology; and (ii) an ever-expanding majority of lower-wage/lower hours positions in less productive industries. The U.S. Private Sector Job Quality Index (Figure 3) demonstrates that
the ratio of the number of higher paying production and non-supervisory jobs to lower paying ones deteriorated by over 16% over the 30 years prior to the Great Pandemic.
Figure 3 – U.S. Private Sector Job Quality Index (derived from Bureau of Labor Statistics data)
Figure 2 – Source: Bureau of Labor Statistics

INFLATION IN THE 21ST CENTURY
7DANIEL ALPERT
With an increasingly higher percentage of workers working just to live, and so much of production flowing to either capital or to “labor” that saves and does not spend it, the U.S. economy is simply not currently wired to transmit growth to inflation-producing aggregate consumption demand. Indeed, it has been doing just the opposite for decades, prior to the recent distortions attributable to this post-pandemic period.
Even as overall consumption as a percentage of GDP rose dramatically from 1980 to 2000 from the ~60% where it had been since the end of World War II to the roughly 67.5%10 where it has remained through this century, that elevated con-sumption percentage has come principally by forcing those in the lower quintiles to spend all or most of what they earn, while those in the top quintile have amassed wealth.
The Declining Effectiveness of Monetary Stimulus
On the monetary side of things, the transmission story is just as bleak.
Since the Global Financial Crisis and Great Recession, the U.S. Federal Reserve system has almost continuously been buying U.S. Treasury and Agency securities in order to ensure market liquidity and to manage sudden moves in market interest rates for the purpose of stimulating growth (or preventing contraction) in the private sector. In addition to Quantitative Easing (QE), as such policy is known by economists, the Fed’s overnight rate target has been set at or near zero for over nine of the past fourteen years, and has declined massively from its 6%+ level at the turn of the century (Figure 4).
Figure 4
One would think, of course, that actions on the part of the world’s largest central bank – especially inasmuch as many of the Fed’s actions have been mirrored by central banks around the world – to flood the economy with cash in exchange for bonds and to ensure near-zero costs of funds, would have sent businesses and households on a rabid and inflationary spending spree. But that has not come to pass, in large part due to the fact that most of the money churned out by the Fed’s much-derided “printing press” never really made it out of the Fed at all.
At least not until quite recently – and then not via the private sector (about that further below).
As the red line in Figure 5 (following page) illustrates, banks that sold the Fed their Treasury and Agency securities over the past decade have, for the most part, simply deposited the proceeds received from selling them back into their accounts at the Fed. Other, non-bank, sellers – such as foreign holders – are not reflected in the above graph but close a further portion of the gap between Fed assets (securities owned) and what are essentially unutilized deposits on which banks earn a small amount of interest11.
10 U.S. Bureau of Economic Analysis, Shares of gross domestic product: Personal consumption expenditures [DPCERE1Q156NBEA]11 This “small amount of interest” or Interest on Excess Reserves as it is known in central banking, has become one of the few remaining mon-
etary policy levers (together with overnight repurchase agreements) available to the Fed as the policy rate remains pinned to at or near zero.

INFLATION IN THE 21ST CENTURY
8DANIEL ALPERT
Figure 5
And this is critical when it comes to inflation. Monetary stimulus is generally only effective to the extent that it results in increased net lending demand (new loans, less new deposits). With a lag, the core CPI rate traces changes in net lending fairly accurately – an indicator that has been pretty much consistent for half a century. Figure 6 shows this relationship from 2006 to date. And despite the unprecedented levels of accommodative monetary policy over the past 13 years the pace of net lending has never recovered to its pre-Great Recession levels.
The depressed pace of net lending as we exit the pandemic is yet another reason that the recent spike in inflation is already proving to have been transitory.
The Pandemic Reveals one of the Economy’s Dirty Secrets
Ironically, it took a very non-economic event, a global viral pandemic, to illustrate just how resistant to inflation the U.S. economy is, and how much additional flows to households are necessary to ignite higher levels of prices for goods and services, however transitory.
Figure 7 illustrates that during the depths of the pandemic in the U.S., in the second and third quarters of 2020, gov-
ernment transfers to the private sector increased to then-historic levels, roughly offsetting the calamitous decline in personal incomes, excluding such transfers12.
Figure 7 – Source: Bureau of Economic Analysis
12 We note that the drop in personal incomes above is somewhat understated in that the U.S. system of national accounting booked hundreds of billions of dollars in subsidies to businesses under the Payroll Protection Program as a direct offset to income reductions, as opposed to a transfer payment.
Figure 6 – Sources: Bureau of Labor Statistics; Federal Reserve, (courtesy of Steven Blitz, TSLombard)

INFLATION IN THE 21ST CENTURY
9DANIEL ALPERT
The job losses resulting from the pandemic were more than they nation had ever experienced, and their concentration in low-wage, low-hour, consumer-facing positions revealed the wounded state of the U.S. employment situation – as average hourly wages and weekly incomes actually rose during the period, even as aggregates plummeted. That the government stepped up to plug the resulting hole was the only thing that avoided lasting disaster.
Yet the truly startling thing to be drawn from the above did not occur in 2020, but during the first quarter of 2021, in which a resumption in high levels of government transfers – along with the recovered level of personal incomes net of transfers – injected some $785 billion of “found money” ($3.1 trillion on an annualized basis) into the economy relative to immediately pre-pandemic levels of aggregate household income. About 16.6% more personal income, spun out of the blue for all intents and purposes, during the first quarter of 2021 in comparison to the three months preceding the 2020 pandemic lockdown (December 2019 – February 2020), about 16.6% more personal income, spun out of the blue for all intents and purposes, notwithstanding clear inequities in distribution of same.
Thus, a total of $785 billion of additional cash flowed to Compared to the first eight months of the last full pre-pan-demic year of 2019, over $1.8 trillion of additional cash flowed to households in the first eight months of 2021 (+15%), which households had previously been made – in the aggregate – almost entirely whole (actually 4.75% more than whole in the aggregate, but for the above inequities) on an annualized basis via increased government transfers from March through December 2020.
And with all the supply bottlenecks attendant to the restarting of a pandemic-addled global economy – and they were many – all that $1.8 trillion, in what was essentially extra cash, could do was to create an inflation spike that has already faded as of this writing in late-Q3 2021.
It was not been surprising then, that inflation began to temper as bottlenecks slowly resolved themselves beginning in August 2021. Continued reversion to pre-pandemic levels of inflation will likely accompany the currently ongoing restoration of government transfers to normal levels.
Thus the U.S. economy of the 21st century is not wired to effectively transmit growth to inflation-producing aggregate demand. Recent extraordinary circumstances illustrate that even when government short-circuits the transmission mechanism by putting enormous amounts of money directly into the pockets of households experiencing 15 months of pent-up demand, inflation is not sustained.
But the demand side only tells us part of the story as to why this is so. To appreciate the rest, we must flip over to the supply side of the economy.

INFLATION IN THE 21ST CENTURY
10DANIEL ALPERT
II. The “Non-accelerating Inflation” Capacity of the Domestic and Global Economy to Fulfill U.S. Demand Remains Extraordinarily High
In the calculus of inflationary pressures along the intersection of supply and demand, the least understood of the two is the potential of the endogenous and exogenous economic resources available to satisfy demand without generating undesirable price pressures. This has been made an especially complicated matter to forecast in the U.S. in the present era of high levels of imports of tradable goods from nations with difficult-to-calculate levels of price elasticity13.
Yet there are two things that are hard to argue with. First, forecasts of the U.S. economy’s non-inflationary potential growth have historically been declining for years without the occurrence of any episodes that challenge those fore-casts, but with the economy repeatedly undershooting inflation targets set by policymakers. Second, the degree to which elasticity in prices of imported tradable goods has served to buffer otherwise potentially inflationary pres-sures on the prices of goods in the U.S., and the prices of services that import and distribute those goods, has defied perennial predictions to the contrary.
Accordingly, the supply-side of the inflation issue – or more properly put, the capacity of the economy to deliver goods and services that are the subject of internal aggregate demand – is discussed below along the above two lines:
Capacity and Potential
Section I presented the under-employment issue in terms of the deterioration in the percentage of jobs paying more than the mean weekly income for all jobs (production and non-supervisory). Some of that is, indeed, an increase in the relative number of jobs paying low hourly wages. But the other factor affecting deteriorated incomes – and the one that most directly impacts the issue of underutilized capacity – are the combination of the shift of employment to over 85% service jobs and the dramatic reduction in the hours offered in the U.S. service sector to an average of under 32.5 hours of work per week just prior to the pandemic, from 37.5 hours in the mid-1960s (Figure 8).
Two if the largest services sectors, collectively providing 30% of all service jobs in the U.S., offer hours lower than the above average. The retail sector (15.6 million jobs on the eve of the pandemic) offers fewer than 31 hours of work per week. And the leisure and hospitality sector (16.8 mil-lion jobs) offer fewer than 26 hours of work per week.
It is tempting to regard the decline in average hours worked as merely a change in the mix of the type of ser-vice jobs available in the 21st Century economy, and that is certainly a large part of it. But the truth is that hours of work offered on jobs within the retail sector and the leisure and hospitality sector have themselves declined.
What used to be known as an honest week’s work is no longer so for many workers. But that is a cloud with a
silver lining in terms of the economic potential of the aggregate labor pool. As is the more often discussed reduction in the labor force participation rate for prime-aged (25–54-year-old) workers from 84.4% in the mid-1990s to 82.8 pre-pandemic (and 81.2% more recently). Such workers appear to indicate a so-called “reservation wage” (which should be more aptly called a “reservation income”) – that which they feel the need to earn in order to justify working at all – that has grown to exceed that which is available at the margins of the jobs market.
All of these are forms of (not all that) hidden labor slack. Hidden insofar as the standard measure of unemployment (the U-3 rate) and its historical relationship to inflation does not accommodate the foregoing factors. So were we even able to magically rapidly restore employment to pre-pandemic levels, the foregoing would still be the case unless we make material improvements to the jobs made available to Americans.
13 Low price elasticity, in this context, being the ability of suppliers to fill incremental orders without needing to (or needing to) change output prices in order to accommodate same.
Figure 8 – Source: Bureau of Labor Statistics

INFLATION IN THE 21ST CENTURY
11DANIEL ALPERT
Figure 9
There is a related metric, however, that is not “hidden” in any sense. And that is capacity utilization of the goods production side of the economy. Unlike the collapsed relationship between the unemployment and inflation rates, this one has held up pretty darn well. Capacity utilization, like labor share of production, has been on a downward slope for half a century (Figure 9). But interim fluctuations in utilization, as well as its overall decline, have had a shockingly accurate correlation with movements in core inflation since the 1970s. (The data diverges during the 1990s, however, as the productivity boom known as the internet revolution corresponded – relatively unrelatedly – with an increasing volume of cheaper imports from low-wage countries to yield disinflation).
The supply side of an economy with (what remains of) its goods producing sector mired at low 70% utilization of available capacity will have a very hard time generating inflationary pressures.
Which brings us to the issue of attempting to forecast the non-inflationary potential of the U.S. economy altogether.
Those who have been loudest in voicing concerns about sustained inflation at levels that would prove unattractive have based almost all of their analysis on what they regard as accepted models of the economy’s potential in the absence of undesirable inflation. They know however – although perhaps some in the media, more in politics and even more in the general public likely do not know – that estimates of production potential of economies are subject to wide debate. More critically, such estimates are subject to frequent downward revision, especially following major economic crises or longer periods of underperformance.
One must of course accept the essential truth that a sustained period of economic demand in excess of an econo-my’s ability to fulfill that demand will produce price, and eventually wage, inflation. And that the ability of an economy to fulfill demand in the absence of high levels of inflation is dependent on quite a number of factors including, among others, the availability of labor, sources of increased productivity, more rapid exploitation of existing technological capacity to enhance the latter two factors, capital availability and cost, and – as discussed more fully below – over the past decades, exogenous inflation-resistant supply sources.
Nevertheless, over the course of the present century – following the substantial boost in economic productivity that characterized the end of the 1900s – forecasts of the production potential of the U.S. economy have been almost continuously revised downwards by the Congres-sional Budget Office (CBO) and other groups, as illus-trated by Figure 1014. Needless to say, the U.S. economy has – for the most part – cooperated with those fore-casts by massively underperforming them since the advent of the Great Recession in 2008. The nearly perennial “output gap” has served for many economists as the most convenient explanation for the very low
14 Mason, J.W., What Do Changing Estimates of Potential Output Tell Us?, WordPress, July 2016, https://i1.wp.com/jwmason.org/wp-con-tent/uploads/2016/07/potentialGDP.png
Figure 10 – J.W. Mason

INFLATION IN THE 21ST CENTURY
12DANIEL ALPERT
levels of inflation experienced throughout the period – although there are quite a number of additional explanations
So it would be entirely within reason to regard fore-casts of economic potential as little more than an educated guess – a point that is generally under-stood in the economics profession. Accordingly, models that claim to demonstrate that stimulus-in-duced growth that may come from the present administration’s fiscal proposals, are likely to vault economic demand to a level exceeding the econo-my’s potential not only deserve scrutiny with regard to their projection of resulting growth but, more par-ticularly, to which estimate of economic potential such projected growth models claim to exceed. Here’s an example:
As shown in Figure 11, the present CBO forecast of the economy’s theoretical potential is only slightly in excess of its recovered performance to as we have reopened from the pandemic. Yet the trend growth that would have been expected prior to the Great Recession (the dotted green line) – assuming the economy is still capable of same
– would yield a very different conclusion: that we still have a long way to go.
So we are left with an economy with ample excess labor and material capacity that, as shown in Section I, really doesn’t transmit growth to inflation-producing demand all that well. But there is one last element to the story, which is poorly factored into most economic models and also serves to attenuate non-household demand (i.e. business investment) that might otherwise result in sustained price pressures: the global supply chain underlying final sales of domestic product.
The Importance of Imports
While most of us are distracted by capital account and trade balances (for decades, deficits in the case of the U.S.) in discussions of trade, when it comes to the impact of trade on inflation, one need only look at the import side of the equation. At least that is certainly the case when those goods that the U.S. exports are only those which it has in such abundance that they clear low prices for which they can be sold abroad (think agriculture) or maintains a technological near-monopoly for in terms of global pricing power. And when it comes to imports less food and energy, as Figure 12 illustrates, but for the downturn during the pandemic, the U.S. economy appears to have plateaued at a level – relative to total goods consumption – that far exceeds that when inflation last reared its ugly head15.
As discussed further below, to the extent that the price of imports is not materially responsive to the level of demand from U.S. consumers (both households and firms) it is axiomatic that increases in that demand will not yield sustained price inflation for goods so imported. 15 Figure 12 ignores petroleum products in comparisons of goods inflation over the past half-century, not only to focus on core inflation, but to
eliminate the large inter-temporal changes in U.S. demand for foreign oil, now negative, as well as the impact of the oil crisis of the 1970s.
Figure 11 – Bureau of Economic Analysis and CBO
Figure 12 – Source: Bureau of Economic Analysis

INFLATION IN THE 21ST CENTURY
13DANIEL ALPERT
But why would foreign exporters not be responsive, price-wise, to increased orders from the U.S.? Certainly such a situation is not consistent with the expectations of most mainstream supporters of new neo-classical synthesis economic thinking and may result in significant blind-spots in the interpretation of trade impacts. The conundrum can be described as follows.
In a sense, the blindness is the result of absence of generally understood alternative metrics. Export price responsiveness of U.S. trading partners – and the impact thereof on U.S. prices – is incredibly difficult to model empirically. After all, to do a proper job one would have to first reach consensus on how export economies as different as, say, China’s and Germany’s actually operate today and develop predictive metrics regarding endogenous resource capacity limits that would give rise to a desire to raise prices rather than to maximize output measured in unit volume (the latter, as seen in China, being the natural result of being in state of chronic excess capacity relative to domestic demand16).
With core imports constituting 40% to 45% of core U.S. consumption, the existence of relatively quantity-indifferent exogenous sources of supply really matters.
So we are left with looking at the impact of trade on inflation in the importing economy (in this case the U.S.) – which does have enough data to properly evaluate, provided we do so without the confirmation bias that tends to impact mainstream conclusions on the subject.
Figure 13 – Sources: Bureau of Economic Analysis; Federal Reserve
First let’s look at something rather simple to understand (Figure 13): Domestic private sector investment in the U.S., as a percentage of final sales of domestic product has declined by over half over the past 50+ years (mostly since the mid-1980s). That should not be at all surprising inasmuch as amid increasing imports of goods, fewer endogenous plants are required to make goods. But it should be equally obvious that this is itself disinflationary as well, as busi-ness demand declines for the goods and services required to develop new productive investments in the U.S.
Overlayed with the data in Figure 12, the continuing decline in domestic investment to final sales during this century is an indicium of low-price elasticity on the part of exporters. As it stands to reason that if prices abroad had begun to rise in the face of rising U.S. demand for foreign goods, U.S. producers would have been induced to manufacture more domestically. We know, from raw data, prior to pandemic-related disruptions, that there has been little pressure on import prices amid surging domestic demand and the substitution of imported for domestically produced goods has generally led to overall core-goods deflation over the past ten years.
And this is a particularly important metric when considering the present efforts to increase levels of public investment in domestically sourced goods and services. Because the low level of inflation that has persisted throughout this century, and
16 For example, U.S. industrial capacity utilization during the period of America’s rapid post-World War II growth was typically between 80% and 90% (Federal Reserve Board of Governors), while capacity utilization in today’s fast-growing Chinese economy has averaged up to ten percentage points lower, hitting its all-time high of 78.4% only in the second quarter of 2021 as a result of pandemic reopening-related demand surges (China National Bureau of Statistics).

INFLATION IN THE 21ST CENTURY
14DANIEL ALPERT
is reverting to its pre-pandemic mean at this writing, is – as discussed thus far – directly connected to (i) underinvestment, underutilization of labor and capital resources, and (ii) the loss of jobs that, in earlier times, successfully transmitted more equitable growth to households.
Having made the above general point, let’s again look at something that illustrates how the pandemic era “economic laboratory” has served to shine additional light on a macroeconomic puzzle.
Figure 14 shows a basket of tradable goods drawn from CPI data, along with as average for that basket weighted for each component’s relative contribution to the CPI. The values are indexed to 100 as of December 2018.
Figure 14 – Source: Bureau of Labor Statistics
As was typical prior to the pandemic, the weighted average of U.S. prices for goods in this basket declined throughout 2019. Unsurprisingly, given the collapse in demand during the global lockdowns of the first half of 2020, prices fell at an accelerated rate and did not begin to materially recover from their lows until Q4 2020. It was only in May 2021 that the weighted average price of goods in this basket recovered to its December 2018 level. In August of 2021, that weighted average stood only 2.13% above its December 2018 levels.
While that in itself is quite interesting and may account for the relative complacence of consumers in the face of recent price spikes (after all import prices, as shown in Figure 15, are even now only 2.7% higher than they were in March 2014 even having rocketed by 7.0% since spring of 2020), the really fascinating thing is to look at the headwinds that should have resulted in much higher pressure on prices during the pandemic period – but did not.
Figure 15

INFLATION IN THE 21ST CENTURY
15DANIEL ALPERT
Because of transportation, supply chain and financial market disruptions associated with the pandemic, the cost of imports in dollar terms delivered to U.S. shores has been under a great deal of pressure.
For example, the cost of shipping containers has risen nearly tenfold since Asian factories began to resume shipments in spring of 2020 (Figure 16). This was due to multiple factors initially, including the positioning of ships temporarily taken out of service, availability of crews, etc. But it soon became a matter of overwhelming demand for exports by mostly U.S. consumers benefiting from the unprecedented levels of income support from govern-ment, discussed earlier. Were this to be passed through to importers, based on an average contents of approxi-mately $250,000 in cargo value per shipping container, a $9,000 increase in container costs would, by itself, have added 3.6% to freight-on-board pricing.
Figure 16 – Source: Freightos Limited
And during period from spring 2020 to summer 2021, as import prices spurted higher, the U.S. dollar decline in value against major currencies by ~4.9%. Relative to the Chinese yuan, the dollar lost 7.0% of its value, as shown in Figure 17.
Increased shipping costs and exchange losses themselves could thus have accounted for – ceteris paribus – between an 8.5% and an 10.6% rise in the price of goods delivered to the U.S. So the 7.0% increase in import prices, to the extent it is even sustained, indicates that nations exporting goods to the U.S. either experienced no internal pricing pressures as a result of the pandemic (and they are just passing through their trade-related costs) or they in fact saw pandemic-related endoge-nous inflation and – to use a non-technical term – “ate it” for the privilege of being able to fulfill vastly higher order volumes17
Figure 17
We shall see what transpires over coming months in the above regard, but after twenty-plus years of seeing the U.S. fill an increasing portion of domestic final sales (and, hence, aggregate demand) from exogenous sources that appear far more inflation resistant than models would hold for supply sourced domestically, it would appear that the dominant U.S. econometric models forecasting a high degree of connection between increased demand and inflation are underweighting demand “leakage.”
17 To get a bit more technical, however, consider prices for goods (and services) as effectively consisting of cost of production plus a mark-up (profit) sufficient to induce the investment in the capital assets necessary for production. In the west, we are quite focused on the profit component and when we want to stimulate production work to lower the cost of money (one of the costs of production, because it is nec-essary to produce those capital assets. And, whether intentionally or not, we seek to maintain a buffer stock of labor to ensure that wage pressures do not rise rapidly on producers. But imagine a country (China?), in which you have a multi-decade buffer stock of labor and are more concerned with avoiding social unrest that might destabilize government. And that the same (imaginary?) country has total sover-eignty over its monetary system and a steady stream of foreign currency flows from exports. Here is where the above-mentioned low-price elasticity appears, because in such a country you will, and should logically, continue to seek to increase employment by increasing unit exports at the expense of true profit (or even potentially experiencing net losses in some periods) using government subsidies and other supports to plug the gaps and provide the necessary incentives. More about this in Section V.

INFLATION IN THE 21ST CENTURY
16DANIEL ALPERT
III. The Shifting Drivers of Core Inflation – 1990 to PresentEach of the two economic crises of this century – the Global Financial Crisis/Great Recession, and the COVID-19 Pandemic – have seen inflation hawks take extremely aggressive positions in response to government assistance to counteract them, both monetary and fiscal. In connection with the first of the two crises, those warning of high risks of inflation turned out to be dramatically wrong in their assessments. And while the verdict cannot be certain with regard to the present crisis, it should be amply clear to readers that this author believes they will prove wrong again.
One of the ways in which inflation hawks attempt to shape policy debates is with reference to the only period of extraordinarily high inflation that the U.S. has seen since the end of World War I, over a century ago – that of the 1970s. That will be addressed in the next section. But the other key error (perhaps intentional) made by those connecting government intervention in aid of households and enterprises to the risk of hyperinflation is a ignoring the changes to the drivers of inflation that have occurred as we moved from the 20th and into the 21st centuries.
In order to assess the risk of reignition of demand-pull inflation today, however, it is critical to appreciate to channels through which the interplay of supply and demand has resulted in pricing pressure (however modest that pressure has been) in the economic climate of oversupply of labor and production that preceded the pandemic and is reas-serting itself at this writing.
Figure 18 – Source: Bureau of Labor Statistics
With regard to the above, figure 18 provides an easy guide to understanding what has transpired from 1990 to date. During the 1990s, core inflation generally continued the decline that began with the Fed’s aggressive efforts to rope in the high inflation of the 1970s, which actions precipitated a lengthy recession ending in the fourth quarter of 1982. From that point through 1991, core inflation generally ranged from 3.5% to 5.5% and was composed of a mix of price increases in goods and services pretty much across the board (excluding, as we are talking about core here, food and energy).
Yet something pretty startling began to happen in the 1990s, and grew in importance to present day: core goods inflation slowed and then – in the 2010s – turned decidedly negative. While some of this can be chalked up to ongoing technological improvements in goods production and demographic shifts (mostly aging) in population impacting demand, it would seem hard to ignore the correlation between this phenomenon and accelerating levels of economic globalization and related domestic polarization of income and wealth18. Particularly the price effects of imports, as discussed in Section II.
The collapse in the inflation rate of core goods was responsible for most – but not all – of the reduction in the annual rate of core inflation to less than 2% during the century to date, on average. The inflation rate of core services, and the composition thereof, shifted substantially as well.18 See particularly Mian, Straub and Sufi’s analysis discounting demographic shifts in the decline in r* (the so-called “natural rate of interest,
a reflection of inflation expectations): https://www.kansascityfed.org/documents/8364/mss_jh_word.pdf

INFLATION IN THE 21ST CENTURY
17DANIEL ALPERT
Since the turn of the current century, housing costs – and to a lesser extent, medical services costs – the two largest contributors to core CPI by relative size of expenditures, have driven practically all of service inflation. Given the absence of meaningful goods inflation for most of that time, those two sectors have driven overall core inflation as well.
When speaking of housing here, however, the focus – as it is in Figure 18 – is specifically on the rent of primary residences and owners’ equivalent rent of primary residences (i.e. rent that is imputed to homeowners, marking what their homes would be valued at as rental housing). Together, these expenditures today constitute 31.6% of overall CPI and, as shown in the above figure, about 40.0% of core CPI. Medical care services are 7.2% of overall CPI and about 9.1% of core CPI.
Ironically, rent of residences and medical services costs – while prone to longer term and often persistent inflation across and within cycles – are among expenditures least correlated with changes in aggregate household demand19. More about that in Section V.
Medical services cost inflation over the period shown in the above figure slowed from an average of approximately 5%, year-over-year, during the first decade of the century, to below 3%. And but for disturbances related to the pan-demic, medical services inflation has been contained within a band of 2.0% to 2.5% since mid-2017. Much of this cost containment has been attributed to the success of the Affordable Care Act of 2010 (Obamacare).
As a result, prior to the pandemic, the rental or rental-equivalent cost of housing really became the whole show when it came to consumer price inflation.
Figure 19 – Bureau of Labor Statistics and authors’ calculations
Yet neither of these two sectors are responsible for the spiking price inflation that coincided with the early post-pan-demic reopening of the U.S. economy in 2021. As Figure 19 illustrates, what was experienced beginning in April 2021 was a re-emergence of old-fashioned core goods inflation as supply bottlenecks and pent-up demand by households loaded with the spending power referenced in Section I came to bear for the time being. As noted earlier, not to last20.
19 Rent being correlated ultimately with land costs, itself correlated almost exclusively with the cost of capital (the lower the cost of capital, the more expensive land becomes). Construction costs of actual homes or apartments do not vary much with the price of homes or multi-family residential properties. Most medical services costs in the U.S. are borne substantially by third-party private payees and government in America’s convoluted payment system – and are not driven by end demand.
20 As of August 2021, the month-over-month spikes in core CPI inflation seen in the spring and early summer of the year had fallen to 0.10% (as compared with 0.83% M/M in the second quarter of the year).

INFLATION IN THE 21ST CENTURY
18DANIEL ALPERT
Figure 20
Extraordinarily high, and sustained, levels of core goods inflation were – as shown in Figure 20 – the hallmark of the 1970s. This is especially important to note given that the popular mythology of the era conflates that inflation with the twin energy crises of the decade – for fairly obvious temporal reasons. Yet the above diagram excludes energy costs and nevertheless evidences corresponding inflation peaks. Was this all related to energy as an input? Or was something else going on?
And what of some of the more ideologically spurred explanations for inflation in the 1970s from the right – too much federal spending, or regulatory and tax constraints on production (supply-side arguments)?
A potentially better answer to these questions is offered in the next section. And it is an answer that has a great deal of relevance to the present day.

INFLATION IN THE 21ST CENTURY
19DANIEL ALPERT
IV. What is the Relevance of 1970s Inflation to Present Day?The causes of near-hyperinflation during the 1970s remain a matter of continuing dispute within the economics profession. It is senseless to assert that the below settles that dispute, but hopefully it may serve to narrow the discussion of comparisons between that era and today’s circumstances.
In short, the two periods are, for the most part, wholly incomparable to each other.
Figure 21
For convenience, let’s first sort the conventional rationale for extraordinarily spikes in price inflation during the 1970s into three camps. Conservative politicians and supply-side/monetarist economists tend to focus on increased levels of federal deficit spending throughout the decade coupled with accommodative monetary policy from 1969 through 1971 for igniting the firestorm. Institutionalists, monetarists, and moderates may raise the so-called “Nixon Shock” of 1971 (ending the dollar’s convertibility to gold and ultimately, by 1973, ending the 1944 Bretton Woods System21, and ushering in the present era of fiat currency issuance), as leading to the inflation-producing devaluation of the dollar relative to other currencies. More liberal and traditionally Keynesian economic types tend to be more comfort-able pointing to the twin oil price shocks that followed, and rippled through the economy, as the proximate culprits. None of the explanations by itself is entirely satisfying as a comprehensive description of the period. And all of them in combination still miss the mark in contrast with the present era.
For starters, the correlation between large government fiscal deficits and high levels of inflation has, quite simply and clearly, been blown apart by history, as shown in Figure 21, above. While it is true that the effective Federal Funds Rate was engineered down from 9.75% in mid-1969 to as low as 3.00% at the end of 1971, we have been living with a funds rate at or near zero for the better part of the present century with inflation sustained at one of its lowest levels in history. The postulated relationships, popular in the 1970s, between government deficits and easy money, on the one hand, and inflation on the other, have simply not stood the test of time22.
As to the Milton Friedman’s Quantity Theory of Money, which drove much of the macroeconomic debate during the late 1960s and through the 1970s (as well as actual Fed policy for a short while at the end of that decade, with fairly disastrous results) – the problem has not so much been with his formulation, but with one of its variables. Famously, Friedman taught that by targeting money supply one could regulate inflation using the below, fairly simple relationship:
(M)oney Supply * (V)elocity of Money = (P)rice Level * (Q)uantity of Goods and Services
There was nothing explicitly wrong about the math above, but at the time the formula was advanced, V had been more-or-less constant (averaging around 1.7) for decades. So assuming that held true, one could look to M (M2 being the measure used for this purpose) as the control variable on the left side of the equation and, therefore,
21 So-named after the mountain resort in Bretton Woods, New Hampshire at which negotiations among the World War II allied nations took place to establish the post-war global monetary system.
22 Nor for that matter have intermediated relationships as that between unemployment, wages and inflation – as in the Phillips Curve.

INFLATION IN THE 21ST CENTURY
20DANIEL ALPERT
for any fixed quantity of goods and services, ultimately dictating prices. So that an increase in M would therefore produce inflation, and vice versa.
To the world’s detriment, the conclusion in the above paragraph became pretty deeply burrowed into economics for a time and, even as the relationship that spawned it has become better understood by economists of all persua-sions over the past decades, it remains a knee-jerk response of many others to accelerated monetary expansion – even spawning its own 21st Century meme, Money printer go brrr, implying the certainty of calamitous inflation and currency debasement resulting therefrom.
Yet, almost humorously at this point, it turns out that V – money velocity – was not an anchored variable at all. As Figure 22 illustrates, while money supply grew at an accelerated rate (about 142%) during the inflationary 1970s when “Friedman-omics” was at its apogee (versus about 98% the decade prior), since 1990, when money supply growth almost halted and velocity spiked to its modern historic high, and the turn of the present century – when the growth in money supply began to accelerate to the point at which it has now expanded 10 fold in two decades – the level of M2 has ceased to determine the level of inflation (see Figure 21 again)23. The pandem-ic-era enormous spike in M2 (of over 25%) and decline in
velocity to an historic low merely underscores the absence of inflation-producing transmission channels in today’s economy.
The Nixon Shock provides a much more compelling narra-tive for the inflation spikes of the 1970s, as well as much of what has happened since in terms of global macroeco-nomics. Simply put, by suspending the U.S. dollar’s con-vertibility into gold in 1971 and, in 1973, floating it against all other currencies and initiating the modern fiat currency era, the Nixon administration set off a major devaluation in the U.S. dollar. Over the course of the 1970’s the dollar lost around one-third of its value at the end of the Bretton Woods era (Figure 23). This devaluation was, at least to the extent of the U.S. reliance on exports, massively infla-tionary in that it thereafter cost more in dollars to buy the same quantity of goods from abroad.
Now, harken back to Figure 12 and note that the U.S. was nowhere near as dependent on imports as it is today – a fact which may lead some to suggest that dollar devaluation should not have been that much of a problem at the time24. But the U.S. did import one thing in abundance – oil, the price of which had traditionally been, as it is to this day, denominated in U.S. dollars.
Before moving on to the twin oil crises of the 1970s, let’s bring this discussion back to the core argument of this section: The Nixon Shock (collapse of the Bretton Woods system) as well as the massive inflation in the price of oil that followed, were connected economic events to be sure – but they were also sui generis to the period. There remains no international currency fixing system to be dismantled and cause similar disrup-tion today. While the U.S. is even more heavily dependent on imports in the 21st century, there is no event25
23 Economists typically refer to this condition as a “liquidity trap.” The problem with such a characterization (not that it is being used incor-rectly) is that it is rooted in definitions regarding fear-based preferences of those with capital towards hoarding. As explained in Sections I and II, circumstantial impediments are more the cause of depleted velocity. In other words, if those with capital were not faced with global oversupply, their “preference” would be very much to find ways they could invest their capital at reasonable risk for respectable returns.
24 Especially inasmuch as the Nixon introduced wage and price controls at the time, in an (unsuccessful) attempt to stabilize domestic prices.25 Short of war or other deliberate political hostilities, say between China and the U.S., a subject outside the scope of this paper.
Figure 22
Figure 23
INFLATION IN THE 21ST CENTURY
21DANIEL ALPERT
that would force the U.S. to act in a manner similar to the actions of 1971 – 1973. At least not to a sufficient a degree that such actions would offset the enormous disinflationary pressures embedded in the economy, as out-lined previously26.
Bretton Woods was forced to an end under exogenous pressure from foreign trading partners and competitors who were indisputably being harmed by the “exorbitant privilege” that the U.S. enjoyed as issuer of the global reserve currency (a privilege it still enjoys, albeit with its own downsides), to which the currencies of those nations were fixed to their detriment. Arguably, our trading partners today strongly benefit from the status quo of a strong U.S. dollar. The ultimate implosion Bretton Woods system and the persistent trade imbalances of the past three decades are very much two sides of the same coin. A coin that John Maynard Keynes warned us about before, during and after the negotiations in New Hampshire in 194427.
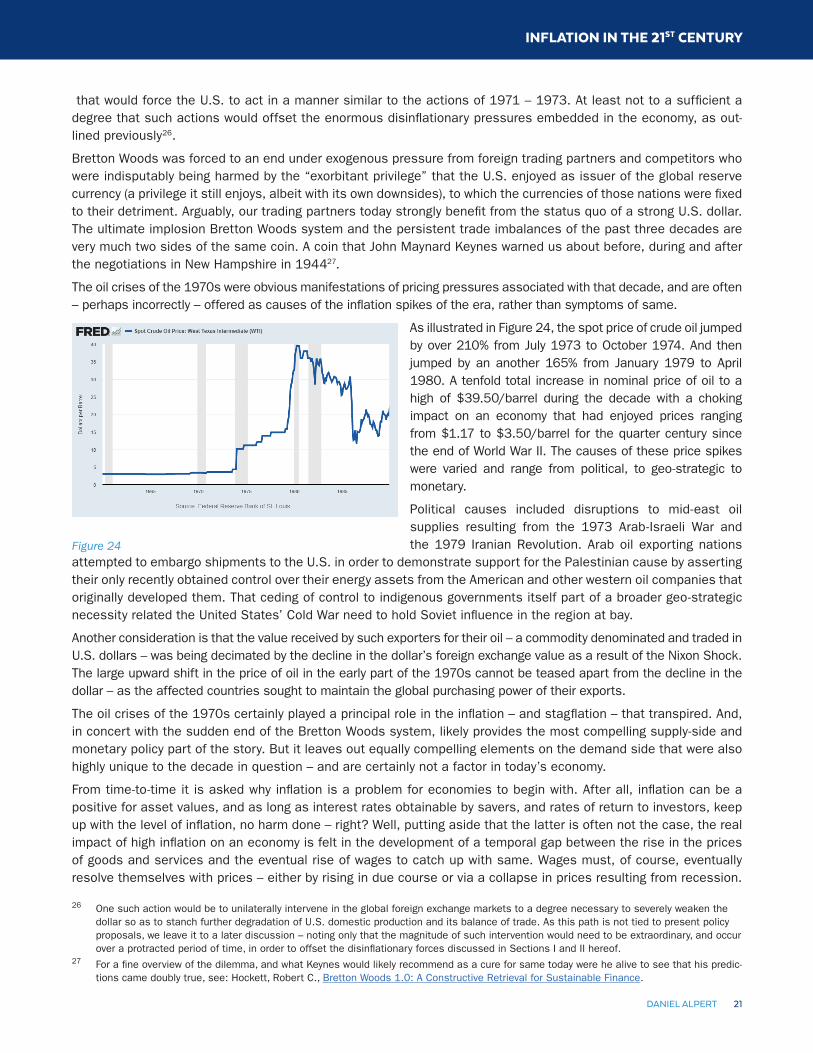
The oil crises of the 1970s were obvious manifestations of pricing pressures associated with that decade, and are often – perhaps incorrectly – offered as causes of the inflation spikes of the era, rather than symptoms of same.
As illustrated in Figure 24, the spot price of crude oil jumped by over 210% from July 1973 to October 1974. And then jumped by an another 165% from January 1979 to April 1980. A tenfold total increase in nominal price of oil to a high of $39.50/barrel during the decade with a choking impact on an economy that had enjoyed prices ranging from $1.17 to $3.50/barrel for the quarter century since the end of World War II. The causes of these price spikes were varied and range from political, to geo-strategic to monetary.
Political causes included disruptions to mid-east oil supplies resulting from the 1973 Arab-Israeli War and the 1979 Iranian Revolution. Arab oil exporting nations
attempted to embargo shipments to the U.S. in order to demonstrate support for the Palestinian cause by asserting their only recently obtained control over their energy assets from the American and other western oil companies that originally developed them. That ceding of control to indigenous governments itself part of a broader geo-strategic necessity related the United States’ Cold War need to hold Soviet influence in the region at bay.
Another consideration is that the value received by such exporters for their oil – a commodity denominated and traded in U.S. dollars – was being decimated by the decline in the dollar’s foreign exchange value as a result of the Nixon Shock. The large upward shift in the price of oil in the early part of the 1970s cannot be teased apart from the decline in the dollar – as the affected countries sought to maintain the global purchasing power of their exports.
The oil crises of the 1970s certainly played a principal role in the inflation – and stagflation – that transpired. And, in concert with the sudden end of the Bretton Woods system, likely provides the most compelling supply-side and monetary policy part of the story. But it leaves out equally compelling elements on the demand side that were also highly unique to the decade in question – and are certainly not a factor in today’s economy.
From time-to-time it is asked why inflation is a problem for economies to begin with. After all, inflation can be a positive for asset values, and as long as interest rates obtainable by savers, and rates of return to investors, keep up with the level of inflation, no harm done – right? Well, putting aside that the latter is often not the case, the real impact of high inflation on an economy is felt in the development of a temporal gap between the rise in the prices of goods and services and the eventual rise of wages to catch up with same. Wages must, of course, eventually resolve themselves with prices – either by rising in due course or via a collapse in prices resulting from recession.
26 One such action would be to unilaterally intervene in the global foreign exchange markets to a degree necessary to severely weaken the dollar so as to stanch further degradation of U.S. domestic production and its balance of trade. As this path is not tied to present policy proposals, we leave it to a later discussion – noting only that the magnitude of such intervention would need to be extraordinary, and occur over a protracted period of time, in order to offset the disinflationary forces discussed in Sections I and II hereof.
27 For a fine overview of the dilemma, and what Keynes would likely recommend as a cure for same today were he alive to see that his predic-tions came doubly true, see: Hockett, Robert C., Bretton Woods 1.0: A Constructive Retrieval for Sustainable Finance.
Figure 24

INFLATION IN THE 21ST CENTURY
22DANIEL ALPERT
Or a little bit of both.
Figure 25 – Source: Bureau of Labor Statistics
But that temporal gap and the adjustments necessary to resolve it – given sudden price inflations of the type seen in the 1970s – produced what came to be called “stagflation,” the real and very much perceptible pain associated with the era. And that pain, and gap, is illustrated in Figure 25.
It is often thought that inflation, once ignited during the 1970s, had the additional effect of pulling forward demand in anticipation of higher future inflation. Such acceleration of demand out of fear of higher future prices (inflation expectations) placed additional strain on then-existing supply and created an acceleration of the price inflation itself until the recessionary (or stagnation) element of stagflation took hold.
Expectations theories may or may not have relevance to the period (or at all28) but the activity reflected in Figure 25, particularly the associated lags between price and earnings growth, is likely not unfamiliar to students of the period, including the squelching of inflation during the Volcker Fed years and the realignment of price and wage growth during the 1980s that permitted the long, if increasingly uneven, economic expansions associated with the decades to come.
But what has been missing from much of the discussion concerning the 1970s is what is going on at the left side of Figure 25 (and even farther left were sufficiently granular data available to readily extend it back in time): the long period during which the rate of growth in earnings of ordinary Americans well exceeded the rate of CPI growth. For this was a period in which a vast swath of middle-and-upper-income U.S. households were able to amass wealth at a very rapid rate. In short, U.S. consumers entered the decade of the 1970s, in the aggregate, at full throttle – able and willing to buy all that 25 years of post-war investment and dominance had brought forth.
From January 1964 through December of 1972, cumulative weekly income growth was 112% of CPI growth during that period. This was such a head start that despite the extraordinary levels of inflation during the 1970s, it took until September of 1979 for aggregate gains in prices from 1964 onwards – including the enormous spikes begin-ning in 1973 and early 1979, of to offset aggregate gains in the weekly incomes of production and non-supervisory workers from 1964 to 1979.
28 A recent paper by the Federal Reserve Board economist, Jeremy B. Rudd, speaks to why inflation expectations theories should be largely disregarded – as they are in this paper: Rudd, Jeremy B. (2021). “Why Do We Think That Inflation Expectations Matter for Inflation? (And Should We?),” Finance and Economics Discussion Series 2021-062. Washington: Board of Governors of the Federal Reserve System, https://doi.org/10.17016/FEDS.2021.062

INFLATION IN THE 21ST CENTURY
23DANIEL ALPERT
The same phenomenon can be seen in the growth rates of the inflation adjusted net worth (wealth) of households which accelerated mightily beginning around 1965 (Figure 26). This is a phenomenon never before seen in modern history and, as Figure 27 illustrates, unseen since29. In every respect, the 1970s experienced a positive demand shock to the economy.
Much of this was certainly fueled by a quarter century of hard work by the Greatest Generation (and Silent Genera-tion) and the enormous real income gains they experienced through 1972. But there was another tailwind building. The growth in the U.S. labor force, particularly the hyper-con-suming 25-to-34-year-old demographic, was accelerated by the entry of the enormous Baby Boom generation in 1970 (Figure 28) who very much benefitted from the income levels established by their parents.
Can the pattern develop now that the Generation X and even larger Millennial Generation are well ensconced in the workforce? This is doubtful at best. Baby Boomers controlled nearly 20% of the nation’s wealth by the time the average member turned 30, and controlled about 53% in 2020. At the same age, Gen Xers controlled just under 6% of wealth and Millennials barely 4%. Is there more of a hope for Generation Z, the first of whom hits 25 next year? Well, for now they don’t even rate inclusion in the Fed’s distributional accounts calculations!
Although, of necessity, this section makes refer-ence to data aggregates – a brief overriding com-ment regarding distributional effects is very much in order. For aggregates of any metric to broadly transmit to changes in prices, changes in aggregates must disperse widely throughout the economy. In an imaginary economy in which one individual received 99% of GDP and all the rest received 1%, even the most gargantuan growth would not yield much in the way of price changes inasmuch as the recipient of such largesse would be unlikely to spend more than a tiny fraction of his or her winnings and the remainder of house-holds would, of course, starve.
Economists have a handy measure of the dis-tribution of income across a population, the Gini Ratio (or Gini Coefficient) developed by the
Italian statistician Corrado Gini in 1912. A Gini ratio of 1 (or 100%) would be reflective of something akin to the imaginary economy described in the previous paragraph. A ratio of 0 (or 0%) would represent perfect equality. Thus, in considering the proclivity of an any economy to transmit growth to spending, and thus potentially inflation, comparisons of one period to another must consider the extent to which this distribution has materially changed.
29 Although data for this immediate post-pandemic period will likely produce a blip of government transfer-related (not private income based) similar, albeit fleeting, wealth growth rates.
Figure 26 – Source: Federal Reserve
Figure 27 – Source: Federal Reserve
Figure 28 – Source: Bureau of Labor Statistics
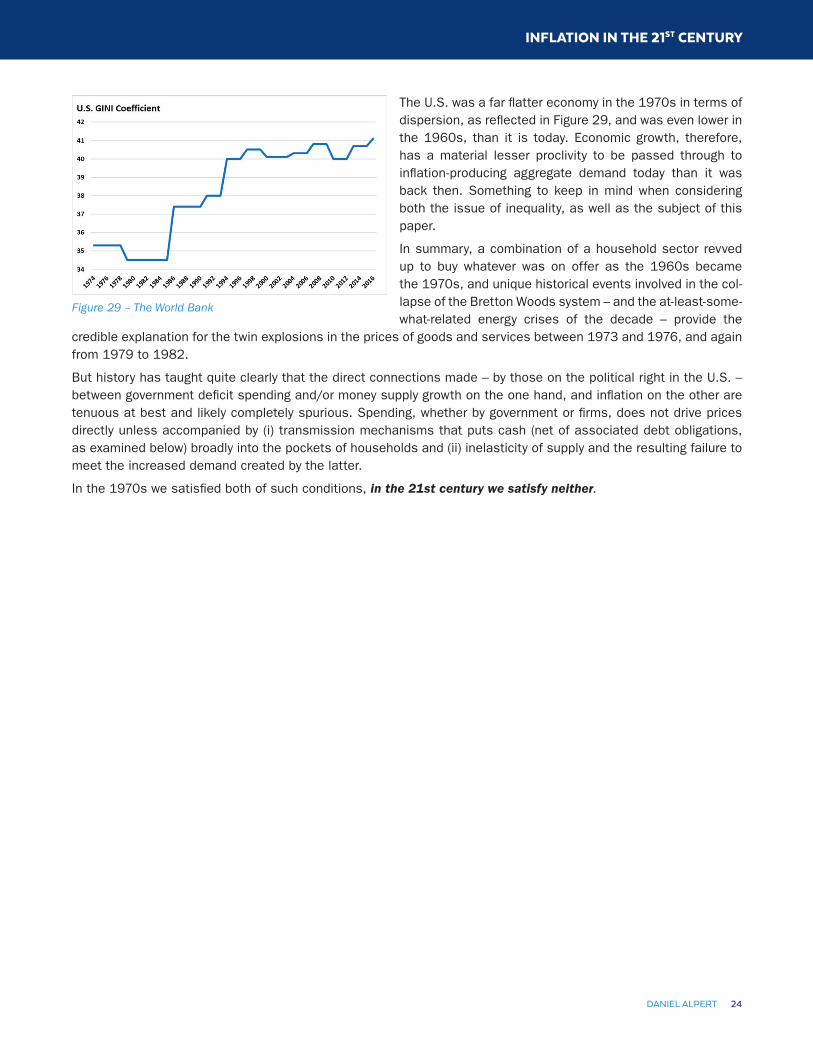
INFLATION IN THE 21ST CENTURY
24DANIEL ALPERT
The U.S. was a far flatter economy in the 1970s in terms of dispersion, as reflected in Figure 29, and was even lower in the 1960s, than it is today. Economic growth, therefore, has a material lesser proclivity to be passed through to inflation-producing aggregate demand today than it was back then. Something to keep in mind when considering both the issue of inequality, as well as the subject of this paper.
In summary, a combination of a household sector revved up to buy whatever was on offer as the 1960s became the 1970s, and unique historical events involved in the col-lapse of the Bretton Woods system – and the at-least-some-what-related energy crises of the decade – provide the
credible explanation for the twin explosions in the prices of goods and services between 1973 and 1976, and again from 1979 to 1982.
But history has taught quite clearly that the direct connections made – by those on the political right in the U.S. – between government deficit spending and/or money supply growth on the one hand, and inflation on the other are tenuous at best and likely completely spurious. Spending, whether by government or firms, does not drive prices directly unless accompanied by (i) transmission mechanisms that puts cash (net of associated debt obligations, as examined below) broadly into the pockets of households and (ii) inelasticity of supply and the resulting failure to meet the increased demand created by the latter.
In the 1970s we satisfied both of such conditions, in the 21st century we satisfy neither.
Figure 29 – The World Bank

INFLATION IN THE 21ST CENTURY
25DANIEL ALPERT
V. Inflation, Debt and Assets – Dilemmas and AnswersThis section addresses several remaining loose threads from the above, which can be put in the form of the follow-ing two questions:
1. If growth in economic production has increasingly failed, as described in Sections I and IV, to be transmitted broadly to households, what has supported the high levels of U.S. consumption for the past several decades?
2. While pre-pandemic inflation in the prices of goods and services – as well as labor incomes – has been low for many years, what accounts for the high inflation in the prices of assets such as real estate, stocks and collect-ibles (such as artwork), as well as the emergence of high-flying “alternative assets” such as cryptocurrencies and various other digital tokens?
After answering the above two questions, the below addresses some of the connections between asset inflation and ordinary inflation.
Let Them Eat Debt
The answer to the first question is actually quite simple. If the holders of capital are not compelled by market forces to offer labor a larger share of the production pie, and if they have no good alternative primary investment use for their money (in new production capacity), they will seek ordinary financial returns thereon – interest, dividends and capital gains in market value. Mostly, they will seek to lend it.
Without getting too much into the details, the traditional repository of excess capital by those seeking very safe positive real returns, has been hard currency sovereign debt. In other words, if you had too much cash laying around and nothing to do with it, your government or one of its agencies would be happy to borrow it back at an interest rate in excess of the expected inflation rate. Perhaps you also might want to lend some of it to extremely creditworthy private companies as well, and earn a little more interest.
But over the past three decades the U.S. has been sending copious amounts of dollars abroad in exchange for exports, that end up in the hands of holders – mostly in the official (central banking) sector – that truly have no desire other than to store the excess capital somewhere. And they are not return driven in the least – in fact, to some extent, they are willing to pay for storage30.
This phenomenon has forced both nominal and real risk-free yields (along with a panoply of other investment returns) downwards on a relatively consistent basis over the same period.
Figure 30 – Source: Federal Reserve
30 It is important to note that this pattern began well before the U.S. Federal Reserve ever seriously contemplated quantitative easing and other policies aimed at directly impacting U.S. Treasury Note and Bond rates.
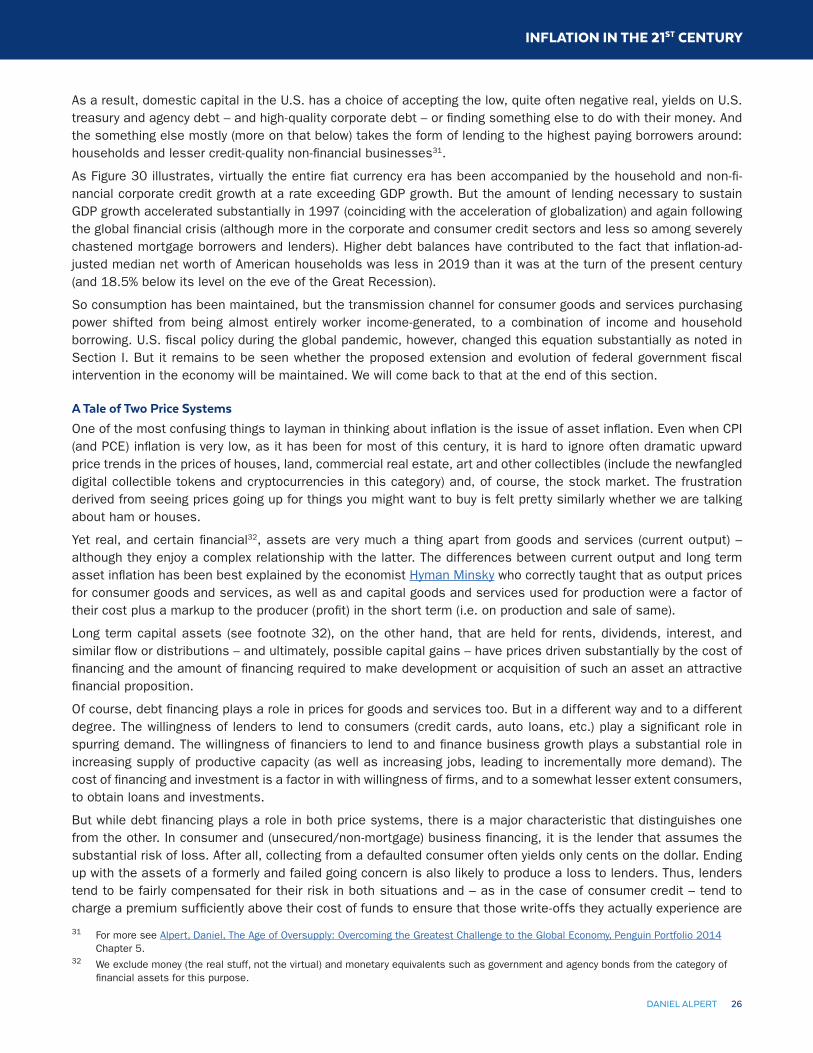
INFLATION IN THE 21ST CENTURY
26DANIEL ALPERT
As a result, domestic capital in the U.S. has a choice of accepting the low, quite often negative real, yields on U.S. treasury and agency debt – and high-quality corporate debt – or finding something else to do with their money. And the something else mostly (more on that below) takes the form of lending to the highest paying borrowers around: households and lesser credit-quality non-financial businesses31.
As Figure 30 illustrates, virtually the entire fiat currency era has been accompanied by the household and non-fi-nancial corporate credit growth at a rate exceeding GDP growth. But the amount of lending necessary to sustain GDP growth accelerated substantially in 1997 (coinciding with the acceleration of globalization) and again following the global financial crisis (although more in the corporate and consumer credit sectors and less so among severely chastened mortgage borrowers and lenders). Higher debt balances have contributed to the fact that inflation-ad-justed median net worth of American households was less in 2019 than it was at the turn of the present century (and 18.5% below its level on the eve of the Great Recession).
So consumption has been maintained, but the transmission channel for consumer goods and services purchasing power shifted from being almost entirely worker income-generated, to a combination of income and household borrowing. U.S. fiscal policy during the global pandemic, however, changed this equation substantially as noted in Section I. But it remains to be seen whether the proposed extension and evolution of federal government fiscal intervention in the economy will be maintained. We will come back to that at the end of this section.
A Tale of Two Price Systems
One of the most confusing things to layman in thinking about inflation is the issue of asset inflation. Even when CPI (and PCE) inflation is very low, as it has been for most of this century, it is hard to ignore often dramatic upward price trends in the prices of houses, land, commercial real estate, art and other collectibles (include the newfangled digital collectible tokens and cryptocurrencies in this category) and, of course, the stock market. The frustration derived from seeing prices going up for things you might want to buy is felt pretty similarly whether we are talking about ham or houses.
Yet real, and certain financial32, assets are very much a thing apart from goods and services (current output) – although they enjoy a complex relationship with the latter. The differences between current output and long term asset inflation has been best explained by the economist Hyman Minsky who correctly taught that as output prices for consumer goods and services, as well as and capital goods and services used for production were a factor of their cost plus a markup to the producer (profit) in the short term (i.e. on production and sale of same).
Long term capital assets (see footnote 32), on the other hand, that are held for rents, dividends, interest, and similar flow or distributions – and ultimately, possible capital gains – have prices driven substantially by the cost of financing and the amount of financing required to make development or acquisition of such an asset an attractive financial proposition.
Of course, debt financing plays a role in prices for goods and services too. But in a different way and to a different degree. The willingness of lenders to lend to consumers (credit cards, auto loans, etc.) play a significant role in spurring demand. The willingness of financiers to lend to and finance business growth plays a substantial role in increasing supply of productive capacity (as well as increasing jobs, leading to incrementally more demand). The cost of financing and investment is a factor in with willingness of firms, and to a somewhat lesser extent consumers, to obtain loans and investments.
But while debt financing plays a role in both price systems, there is a major characteristic that distinguishes one from the other. In consumer and (unsecured/non-mortgage) business financing, it is the lender that assumes the substantial risk of loss. After all, collecting from a defaulted consumer often yields only cents on the dollar. Ending up with the assets of a formerly and failed going concern is also likely to produce a loss to lenders. Thus, lenders tend to be fairly compensated for their risk in both situations and – as in the case of consumer credit – tend to charge a premium sufficiently above their cost of funds to ensure that those write-offs they actually experience are
31 For more see Alpert, Daniel, The Age of Oversupply: Overcoming the Greatest Challenge to the Global Economy, Penguin Portfolio 2014 Chapter 5.
32 We exclude money (the real stuff, not the virtual) and monetary equivalents such as government and agency bonds from the category of financial assets for this purpose.

INFLATION IN THE 21ST CENTURY
27DANIEL ALPERT
covered by profits from other borrowers. If the supply price of capital to businesses rises, they will attempt to pass increased cost on to consumers or will suffer a loss of profits (and, eventually, the economy will enter recession). Likewise, if the cost of borrowing by consumers increases, (and is not met with offsetting increases in incomes) marginal demand will fall at the margin, and prices with it.
The above relationship is pretty much turned on its head when it comes to long term capital assets. While not all capital assets are funded with debt (collectibles and those oddball digital assets are an example), many tend to be at least somewhat leveraged to their market value. And that leverage is key to price determination – independent of conventionally measured inflation. Yet in secured lending on many long-term capital assets – residential and commercial real estate33 being the prime example, the risk tends to shift from lender to borrower, at least if lending is done wisely with the borrower placing a meaningful amount of equity at risk of first loss. This is because the lender receives something of value as security and can liquidate it to recoup its loan principal – and often much of its interest owed – on a default. The borrower, on the other hand, stands substantial risk of loss if his expectations for the financial performance of the asset (rental value, for example) are materially off.
Therefore, prices for long term capital assets will rise as (i) the cost of financing falls and (ii) the willingness of lenders to advance more (require less equity from borrowers) increases – often having nothing much to do with the real-world utility of the capital asset (what it can be used and rented for). And certainly having little to do with the conventional supply and demand relationships that determine ordinary inflation. Little, but not nothing – which point will be addressed shortly.
Figure 31
A classic illustration of the dis-connect between long-term capital asset prices and those of goods and services is what we have learned this century in connection with owner-occupied residential real estate. The red line in Figure 31 shows growth in Owners’ Equivalent Rent, the largest single component of CPI (presently 23.7% of all items, 30.0% of core). This is the figure that the government uses to reflect the cost of shelter to consumers who own their own home and is based on what consumers believe they would pay in rent (or other would pay them in rent) for the home they occupy – a service price. The blue line is the Case Shiller 20-city Index of home prices – what people actually pay for homes. The two series are indexed to 100 above, for convenience.
One of the creators of the above eponymous index, Robert J. Shiller, demonstrated earlier this century that – with some spike for short term booms and longer term busts - housing prices from the 1890s through to 1997 have gen-erally trended at the same rate as general inflation. Yet as seen in Figure 31, that relationship has been materially disrupted in this century.
While the housing and mortgage debt collapse associated with the Great Recession returned owner-occupied home prices to their utility (rent-equivalent) related price trend, the present cycle, beginning in 2012 – although exacerbated34 by household migratory trends associated with the pandemic – has seen a similar disconnect.
33 N.B. As we will illustrate shortly, “real estate” has really come to mean the speculative value of land and location, more than the value of improvements (buildings) thereon. Land being the quintessential long term capital asset.
34 If you are a home buyer – vice versa if you are a seller.
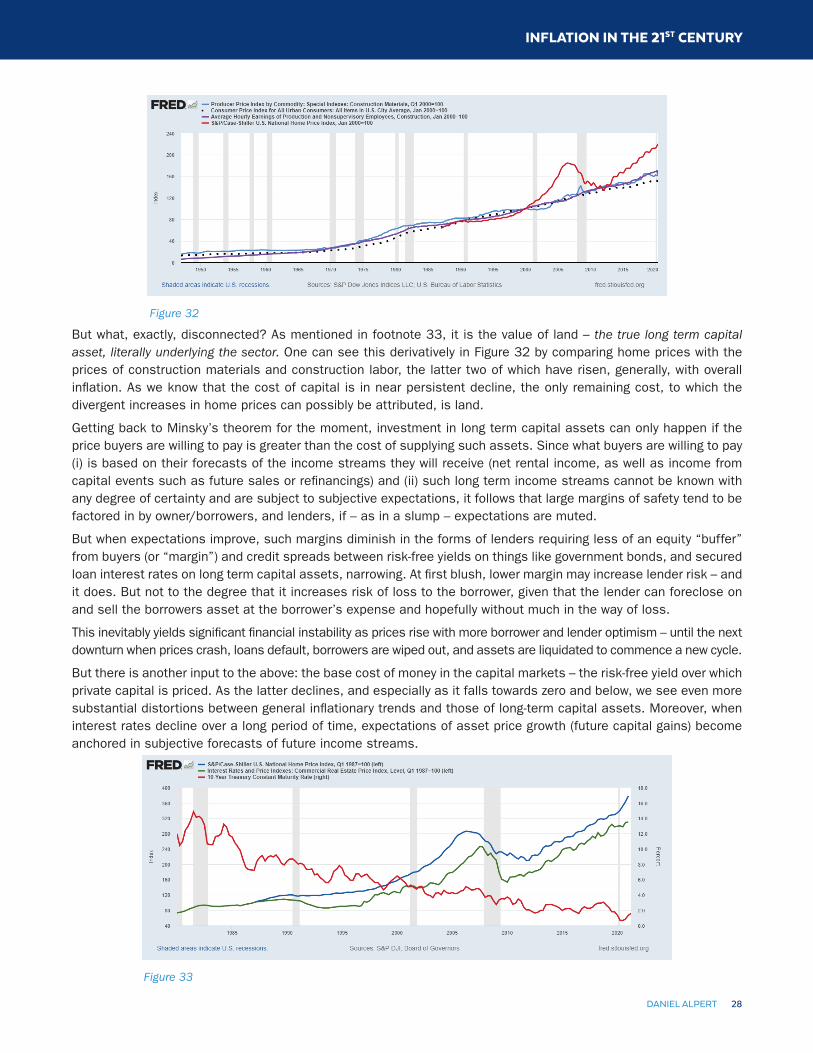
INFLATION IN THE 21ST CENTURY
28DANIEL ALPERT
Figure 32
But what, exactly, disconnected? As mentioned in footnote 33, it is the value of land – the true long term capital asset, literally underlying the sector. One can see this derivatively in Figure 32 by comparing home prices with the prices of construction materials and construction labor, the latter two of which have risen, generally, with overall inflation. As we know that the cost of capital is in near persistent decline, the only remaining cost, to which the divergent increases in home prices can possibly be attributed, is land.
Getting back to Minsky’s theorem for the moment, investment in long term capital assets can only happen if the price buyers are willing to pay is greater than the cost of supplying such assets. Since what buyers are willing to pay (i) is based on their forecasts of the income streams they will receive (net rental income, as well as income from capital events such as future sales or refinancings) and (ii) such long term income streams cannot be known with any degree of certainty and are subject to subjective expectations, it follows that large margins of safety tend to be factored in by owner/borrowers, and lenders, if – as in a slump – expectations are muted.
But when expectations improve, such margins diminish in the forms of lenders requiring less of an equity “buffer” from buyers (or “margin”) and credit spreads between risk-free yields on things like government bonds, and secured loan interest rates on long term capital assets, narrowing. At first blush, lower margin may increase lender risk – and it does. But not to the degree that it increases risk of loss to the borrower, given that the lender can foreclose on and sell the borrowers asset at the borrower’s expense and hopefully without much in the way of loss.
This inevitably yields significant financial instability as prices rise with more borrower and lender optimism – until the next downturn when prices crash, loans default, borrowers are wiped out, and assets are liquidated to commence a new cycle.
But there is another input to the above: the base cost of money in the capital markets – the risk-free yield over which private capital is priced. As the latter declines, and especially as it falls towards zero and below, we see even more substantial distortions between general inflationary trends and those of long-term capital assets. Moreover, when interest rates decline over a long period of time, expectations of asset price growth (future capital gains) become anchored in subjective forecasts of future income streams.
Figure 33
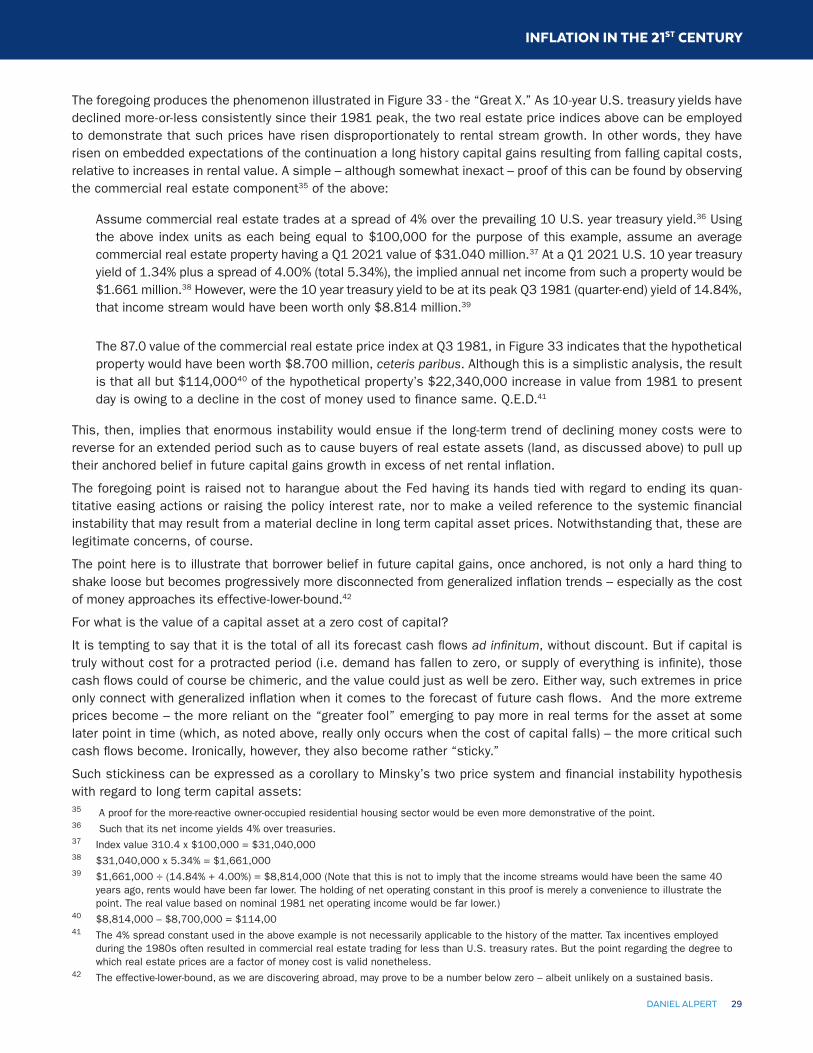
INFLATION IN THE 21ST CENTURY
29DANIEL ALPERT
The foregoing produces the phenomenon illustrated in Figure 33 - the “Great X.” As 10-year U.S. treasury yields have declined more-or-less consistently since their 1981 peak, the two real estate price indices above can be employed to demonstrate that such prices have risen disproportionately to rental stream growth. In other words, they have risen on embedded expectations of the continuation a long history capital gains resulting from falling capital costs, relative to increases in rental value. A simple – although somewhat inexact – proof of this can be found by observing the commercial real estate component35 of the above:
Assume commercial real estate trades at a spread of 4% over the prevailing 10 U.S. year treasury yield.36 Using the above index units as each being equal to $100,000 for the purpose of this example, assume an average commercial real estate property having a Q1 2021 value of $31.040 million.37 At a Q1 2021 U.S. 10 year treasury yield of 1.34% plus a spread of 4.00% (total 5.34%), the implied annual net income from such a property would be $1.661 million.38 However, were the 10 year treasury yield to be at its peak Q3 1981 (quarter-end) yield of 14.84%, that income stream would have been worth only $8.814 million.39
The 87.0 value of the commercial real estate price index at Q3 1981, in Figure 33 indicates that the hypothetical property would have been worth $8.700 million, ceteris paribus. Although this is a simplistic analysis, the result is that all but $114,00040 of the hypothetical property’s $22,340,000 increase in value from 1981 to present day is owing to a decline in the cost of money used to finance same. Q.E.D.41
This, then, implies that enormous instability would ensue if the long-term trend of declining money costs were to reverse for an extended period such as to cause buyers of real estate assets (land, as discussed above) to pull up their anchored belief in future capital gains growth in excess of net rental inflation.
The foregoing point is raised not to harangue about the Fed having its hands tied with regard to ending its quan-titative easing actions or raising the policy interest rate, nor to make a veiled reference to the systemic financial instability that may result from a material decline in long term capital asset prices. Notwithstanding that, these are legitimate concerns, of course.
The point here is to illustrate that borrower belief in future capital gains, once anchored, is not only a hard thing to shake loose but becomes progressively more disconnected from generalized inflation trends – especially as the cost of money approaches its effective-lower-bound.42
For what is the value of a capital asset at a zero cost of capital?
It is tempting to say that it is the total of all its forecast cash flows ad infinitum, without discount. But if capital is truly without cost for a protracted period (i.e. demand has fallen to zero, or supply of everything is infinite), those cash flows could of course be chimeric, and the value could just as well be zero. Either way, such extremes in price only connect with generalized inflation when it comes to the forecast of future cash flows. And the more extreme prices become – the more reliant on the “greater fool” emerging to pay more in real terms for the asset at some later point in time (which, as noted above, really only occurs when the cost of capital falls) – the more critical such cash flows become. Ironically, however, they also become rather “sticky.”
Such stickiness can be expressed as a corollary to Minsky’s two price system and financial instability hypothesis with regard to long term capital assets:35 A proof for the more-reactive owner-occupied residential housing sector would be even more demonstrative of the point.36 Such that its net income yields 4% over treasuries.37 Index value 310.4 x $100,000 = $31,040,00038 $31,040,000 x 5.34% = $1,661,00039 $1,661,000 ÷ (14.84% + 4.00%) = $8,814,000 (Note that this is not to imply that the income streams would have been the same 40
years ago, rents would have been far lower. The holding of net operating constant in this proof is merely a convenience to illustrate the point. The real value based on nominal 1981 net operating income would be far lower.)
40 $8,814,000 – $8,700,000 = $114,0041 The 4% spread constant used in the above example is not necessarily applicable to the history of the matter. Tax incentives employed
during the 1980s often resulted in commercial real estate trading for less than U.S. treasury rates. But the point regarding the degree to which real estate prices are a factor of money cost is valid nonetheless.
42 The effective-lower-bound, as we are discovering abroad, may prove to be a number below zero – albeit unlikely on a sustained basis.

INFLATION IN THE 21ST CENTURY
30DANIEL ALPERT
As the carrying cost of assets approaches zero there is correspondingly less pressure placed upon owner/borrowers to earn any net operating income at all, and prices (rents) become therefore progressively more unresponsive to a falloff in demand.
In other words, as the cost of capital approaches zero, owners become more concerned with the franchise value of a property or business than with current income, as long as income is sufficient to cover basic operating costs and maintain a going concern43. Because in the absence of possibility for future capital gain resulting from a lower market cost of funds, as illustrated above, it is the (perception of) franchise value that prevents capital loss.
So a landlord will accept substantial vacancy rather than reducing rents. A factory will operate at well below capacity rather than reduce unit pricing to drive demand. Such actors, at zero cost of carry, see themselves as incurring little to no immediate cost in doing so, but believe they would incur a long-run future cost in repricing their rents/goods/services.
Just as a ‘liquidity trap” is the cash hording outcome of low interest rates, so does a “capacity trap” result in hording of capacity of non-money long term assets.
And therein lies the connection – albeit tenuous and appearing most visibly in the presence of disinflation and very low capital costs – between long term asset prices and current period general inflation. The supply/demand imbalance, that produced the disinflation to begin with, is resisted, and often even reversed, by holders of long-term capital assets, via the withholding or slow expansion of capacity. The market does not clear,44 and long-term capital asset prices exert a greater impact on conventional measures of inflation.
This is somewhat easier to take in when it comes to the housing sector and rents/owner equivalent rents. After all, everyone needs a place to rest their head at night so demand for one form of housing or another is pretty steady. But even the availability of housing, as population grows, is dependent on the availability of buildable land – the longest of long-term assets. And as the carrying cost of land falls (especially raw land – which is often owned inter-generationally) the cost (or opportunity cost) of holding it in anticipation of greater gain increases – again, the market does not clear and artificial shortages ensue.
Yet the situation is often far more extreme when it comes to clearing excess capacity, in a low-to-zero capital cost and disinflationary environment, in other forms of real estate (retail, office and hotel properties), factory production, and even collectibles such as art and antiques.
In all of these instances, shortages – even in a distressed economy – can result in positive price changes in the fore-going sectors even as all other prices are falling. Of course, price increases in these sectors are limited to the ability of the end user to pay. And when that point is exceeded, especially if such ability was enhanced by large increases in household and business liabilities (debt), the result can be truly catastrophic as was seen beginning in 2008.
The sectors of long-term capital assets discussed above – and particularly their ability to sustain artificial shortages that lead to price increases during generally disinflationary periods – all have two other things in common: informa-tional asymmetries and low turnover. The true dimensions of available supply are never fully known to the buyside. And the percentage of total assets that trade (are sold or rented) in any period is relatively low.
So what of distortions in public equity and other financial asset markets? Read on.
Distorted Equity and Other Asset Markets are not a Sign of Future Inflation
Available “capacity” is more difficult45 to hide on publicly quoted trading markets for long term capital assets representing various claims on future production and hard assets (both real and, now, virtual).46 The breadth and depth of sell-side and buy-side interest is more readily determinable. Further, the annual turnover (trading volume)
43 Accordingly, high margin businesses can exhibit greater stickiness to the downside, low margin businesses less so.44 A good – albeit unique – modern example of this is one of the few remaining international “guilds” – the Organization of Petroleum Export-
ing Counties (OPEC). When it can hold its guild together, OPEC’s first response to precipitous declines in market prices is to literally slow pumping and withhold capacity from the market.
45 Although not impossible, see Dark Pools. 46 Again, we explicitly exclude risk-free sovereign and agency obligations denominated in the issuer’s currency as these are money substi-
tutes (indisputably so, at or below zero nominal rates of interest).

INFLATION IN THE 21ST CENTURY
31DANIEL ALPERT
of such assets often reaches or exceeds some sectors’ entire market capitalization. In theory, in a weak economy characterized by disinflation, low growth and capital oversupply, public market prices of claims on long term capital assets should fall.
Yet, during this century we have experienced the opposite. A booming stock market has gone up three-fold since the turn of the century47, which is 330% the rate of inflation and 163% the rate of nominal GDP growth. A good portion of that is represents increasing concentration of earnings in the S&P 500 which now represents about 14% of all U.S. public companies, compared with fewer than 7% in 199948, and are collectively much larger companies by aggregate market capitalization in comparison to the total of all U.S. public companies. And some is the result of those companies de-equitizing (buying back shares) to make their remaining shares more valuable.
Corporate and structured bond spreads – the yield accepted by investors in excess of what they could be earning on absolutely risk-free U.S. government and agency debt – have hit historic lows throughout this century to date. More-over, real yields on corporate bonds – adjusted for inflation – are at this writing negative all the way through the credit spectrum to what is now somewhat surprisingly still known as “high yield” (aka. junk) debt.
Then we see the phenomenon of sovereign bonds (mostly European) trading at nominal negative yields – bondhold-ers actually paying issuing nations to store their excess capital.
As LongTail Alpha’s Vineer Bhansali noted in a recent white paper49, the reasons for investors holding bonds that are priced to lose money relative to inflation or even nominally are many, but few of them seem concerned about a resumption of high levels of inflation and some are directly betting on the resumption of deflation.
The prices of non-yielding assets such as cryptocurrencies, most credit derivatives, non-perishable commodity futures contracts (gold, oil, etc.) have also been massively impacted by protracted low inflation and correspondingly low carrying costs in anticipation of capital gains. While speculation in certain of these assets (such as oil futures and metals used in industry – to say nothing of perishables (food)) can have a short or even medium-term impact on goods inflation, real world demand – generally the absence thereof – eventually comes into play and speculators retreat. Distortive, but not something in which inflation can anchor itself.
Why does all this speculation emerge? Who would risk loss when inflation is low and risk taking is less of an impera-tive to preserve purchasing power of capital? That, sadly, must remain the subject of a future paper. For now, it can be observed that there appears to be a minimum nominal return in excess of inflation that those with capital will be quite persistent in pursuing. Perhaps because so much money today is professionally managed and managers compete with each other for assets and must at least keep pace with other managers’ returns, as Minsky noted decades ago50. Or perhaps something fairly comprehensively described by the acronym, FOMO: Fear of Missing Out, appears to drive the bullish behavior of retail (non-professional) investors.
But when it comes to all investors, the willingness to pile in to assets moving higher, only on desperation for some-thing that might produce passive gain meeting outsized expectations, seems to be better summed up in another popular market acronym – TINA: There Is No Alternative. A perception that may constitute the n’est plus ultra of distortive behavior.
These distortions in markets, however, all have their roots in the disinflationary path the global economy (and many advanced economies, particularly, with policy-driven, long-term declines in labor share of production) has been on for 40 years.
That prices of long-term capital assets are heavily influenced by private sector capital glut is – as addressed in the conclusion – more an issue of capital misallocation and the failure of markets to clear, than it is of feedback into inflation in the prices of goods and services – to say nothing of the absence of such feedback into incomes.
47 Measured by the S&P 50048 https://www.investors.com/news/publicly-traded-companies-fewer-winners-huge-despite-stock-market-trend/ 49 Bhansali, Vineer, The Incredible Upside-Down Fixed-Income Market: Negative Rates and Their Implications, CFA Institute Research Founda-
tion, 2021, sections 4 and 650 Whalen, C.J., Money Manager Capitalism, The Handbook of Critical Issues in Finance, June 2010 https://www.levyinstitute.org/pubs/
conf_june10/Whalen.pdf

INFLATION IN THE 21ST CENTURY
32DANIEL ALPERT
VI. ConclusionTo counter what has become an almost inexorably sustained tendency towards disinflation and deflation, for the reasons outlined in Sections I and II, a counterforce of equal power and continuity is required. It should be obvious from recent past experiences with inadequate recoveries from economic crises, as well as the nature of the extraor-dinary fiscal response to the pandemic, that short-term measures are inadequate.
Just as a one-time helicopter drop of retardant will do little to harness a raging forest fire, a short-term drop of “helicopter money” will do nothing to extinguish the secular problems that have remained woefully unaddressed for decades. Yet, the power of the enormous fiscal aid unleashed in response to the pandemic – and the reaction of the economy and markets to same – has already proven to be highly instructive.
Sections I and II of this paper focused on the existing structural impediments to a condition of accelerating inflation, on both the demand side and the supply side, respectively, of the U.S. economy. Section III explained not only why those impediments pose an enormous obstacle to a 1970s-like inflationary condition, but why conditions unique to that period that served to ignite accelerating inflation are simply not present today. None of the foregoing consti-tutes a claim that the possibility of price inflation is gone forever. There can be no doubt that an era of sustained increases in income-driven aggregate demand in the absence of commensurate increases in supply would result in an undesirable acceleration of price pressures.
Yet the dramatically higher levels of federal government infrastructure and social spending both enacted and pro-posed in response to the Great Pandemic – much of it building on a modern progressive movement that came to flower after the Great Recession – are likely to considerably offset early-stage aggregate demand surges. The capacity expansion elements proposed by the White House as of this writing are an example.
It is splitting hairs to argue about the degree to which fiscal austerity, on the one hand, or a combination of global-ization and technological shifts, on the other hand, have placed the U.S. economy in its present position. But 40 years of conscious domestic fiscal policy choices have at the very least exacerbated – and, at worst, unnecessarily blocked – measures to offset the negative impacts of globalization and technology on the financial wellbeing and security of most households. Policy that was conducted in the name of preventing precisely the sort of inflation that general conditions increasing rendered impossible to begin with.
That the unique historical and economic circumstances of the 1970s gave rise to a near cultish obsession with changes in price levels, shunting aside the importance of equitable growth, is a tragedy. But that it occurred almost precisely at a time that exogenous supplies of global labor and productive capacity were showered upon the mer-chants and consumers of advanced nations (to the enormous detriment to their domestic labor forces), is nothing short of a perfect storm in the world of policy disasters.
The distortive monetary policy that has proven to keep the U.S. economic ship sailing as best it could through this tempest of our own creation, has resulted in high (although perhaps tenuous) asset prices – and related liabilities – for those with capital, but has deprived around 50 million U.S. households of any measure of financial security, with low levels of savings for the slightly better off middle class51.
As noted in the introduction, an economy being run principally by the monetary authority to attenuate inflation is inherently more disinflationary than one in which the fiscal agent of government is actively attempting to spur more equitable growth. So if, as discussed above, we are going to exercise the collective fiscal muscle to that end, what is the amount of headroom existing in the economy to absorb either low or high fiscal inputs without undesirable distortions to the prices of conventional goods and services, the prices of long-term capital assets and, ultimately, the price of labor?
Post-Keynesian economists, among whom this author includes himself, have focused for years on understanding the full array of resources that can be brought to bear on both the demand and supply side of an economy to opti-mize production and its distribution all within the rubric of a democratic capitalism that acknowledges equally (i) the social imperatives necessary for democracy to endure, and (ii) the incentives necessary for capitalism to spur growth and innovation. Yet those twin endeavors are quite often in conflict and require continuing rebalancing to
51 Although this has improved somewhat during the pandemic era as a result of government transfers.
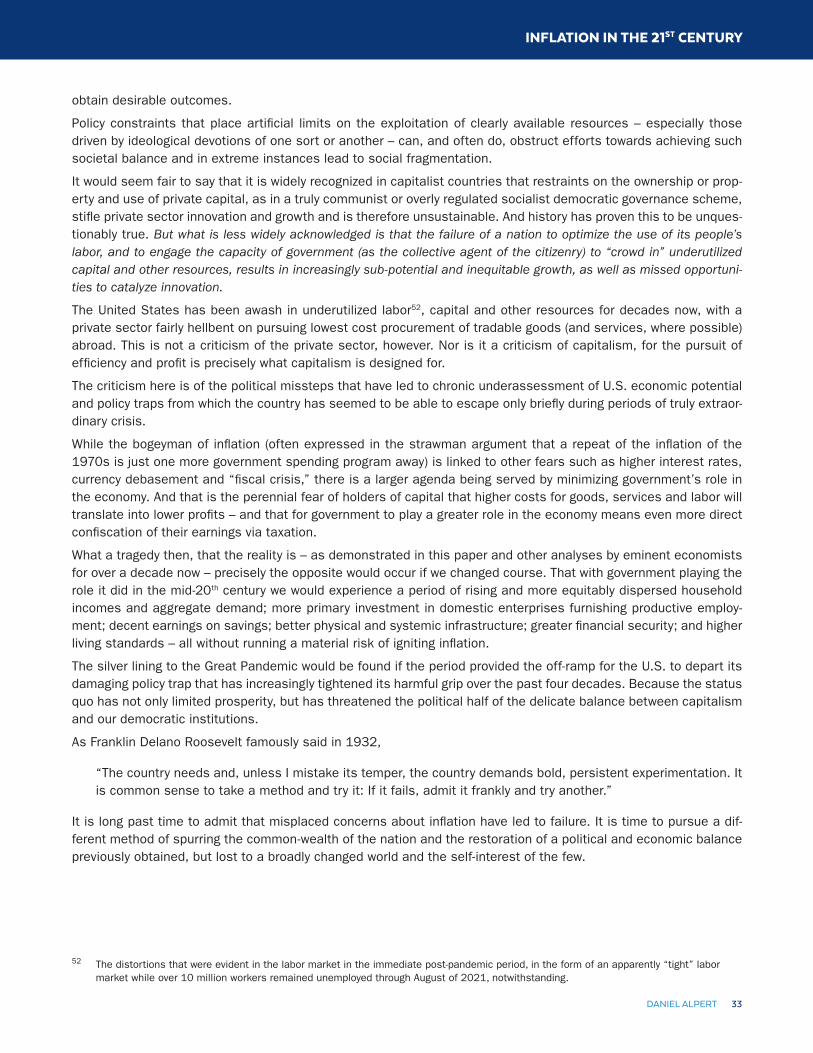
INFLATION IN THE 21ST CENTURY
33DANIEL ALPERT
obtain desirable outcomes.
Policy constraints that place artificial limits on the exploitation of clearly available resources – especially those driven by ideological devotions of one sort or another – can, and often do, obstruct efforts towards achieving such societal balance and in extreme instances lead to social fragmentation.
It would seem fair to say that it is widely recognized in capitalist countries that restraints on the ownership or prop-erty and use of private capital, as in a truly communist or overly regulated socialist democratic governance scheme, stifle private sector innovation and growth and is therefore unsustainable. And history has proven this to be unques-tionably true. But what is less widely acknowledged is that the failure of a nation to optimize the use of its people’s labor, and to engage the capacity of government (as the collective agent of the citizenry) to “crowd in” underutilized capital and other resources, results in increasingly sub-potential and inequitable growth, as well as missed opportuni-ties to catalyze innovation.
The United States has been awash in underutilized labor52, capital and other resources for decades now, with a private sector fairly hellbent on pursuing lowest cost procurement of tradable goods (and services, where possible) abroad. This is not a criticism of the private sector, however. Nor is it a criticism of capitalism, for the pursuit of efficiency and profit is precisely what capitalism is designed for.
The criticism here is of the political missteps that have led to chronic underassessment of U.S. economic potential and policy traps from which the country has seemed to be able to escape only briefly during periods of truly extraor-dinary crisis.
While the bogeyman of inflation (often expressed in the strawman argument that a repeat of the inflation of the 1970s is just one more government spending program away) is linked to other fears such as higher interest rates, currency debasement and “fiscal crisis,” there is a larger agenda being served by minimizing government’s role in the economy. And that is the perennial fear of holders of capital that higher costs for goods, services and labor will translate into lower profits – and that for government to play a greater role in the economy means even more direct confiscation of their earnings via taxation.
What a tragedy then, that the reality is – as demonstrated in this paper and other analyses by eminent economists for over a decade now – precisely the opposite would occur if we changed course. That with government playing the role it did in the mid-20th century we would experience a period of rising and more equitably dispersed household incomes and aggregate demand; more primary investment in domestic enterprises furnishing productive employ-ment; decent earnings on savings; better physical and systemic infrastructure; greater financial security; and higher living standards – all without running a material risk of igniting inflation.
The silver lining to the Great Pandemic would be found if the period provided the off-ramp for the U.S. to depart its damaging policy trap that has increasingly tightened its harmful grip over the past four decades. Because the status quo has not only limited prosperity, but has threatened the political half of the delicate balance between capitalism and our democratic institutions.
As Franklin Delano Roosevelt famously said in 1932,
“The country needs and, unless I mistake its temper, the country demands bold, persistent experimentation. It is common sense to take a method and try it: If it fails, admit it frankly and try another.”
It is long past time to admit that misplaced concerns about inflation have led to failure. It is time to pursue a dif-ferent method of spurring the common-wealth of the nation and the restoration of a political and economic balance previously obtained, but lost to a broadly changed world and the self-interest of the few.
52 The distortions that were evident in the labor market in the immediate post-pandemic period, in the form of an apparently “tight” labor market while over 10 million workers remained unemployed through August of 2021, notwithstanding.