Embed Size (px)
Citation preview

Crack Development in Ternary Mix Concrete Utilizing Various Saw Depths
Final ReportFebruary 2009
Sponsored bythe Iowa Highway Research Board (IHRB Project TR-587)and the Iowa Department of Transportation (CTRE Project 08-317)
Iowa State University’s Center for Transportation Research and Education is the umbrella organization for the following centers and programs: Bridge Engineering Center • Center for Weather Impacts on Mobility
and Safety • Construction Management & Technology • Iowa Local Technical Assistance Program • Iowa Traffi c Safety Data Service • Midwest Transportation Consortium • National Concrete Pavement
Technology Center • Partnership for Geotechnical Advancement • Roadway Infrastructure Management and Operations Systems • Statewide Urban Design and Specifications • Traffic Safety and Operations

About the National Concrete Pavement Technology Center
The mission of the National Concrete Pavement Technology Center is to unite key transportation stakeholders around the central goal of advancing concrete pavement technology through research, tech transfer, and technology implementation.
Disclaimer Notice
The contents of this report refl ect the views of the authors, who are responsible for the facts and the accuracy of the information presented herein. The opinions, fi ndings and conclusions expressed in this publication are those of the authors and not necessarily those of the sponsors.
The sponsors assume no liability for the contents or use of the information contained in this document. This report does not constitute a standard, specifi cation, or regulation.
The sponsors do not endorse products or manufacturers. Trademarks or manufacturers’ names appear in this report only because they are considered essential to the objective of the document.
Nondiscrimination Statement
Iowa State University does not discriminate on the basis of race, color, age, religion, national origin, sexual orientation, gender identity, sex, marital status, disability, or status as a U.S. veteran. Inquiries can be directed to the Director of Equal Opportunity and Diversity, (515) 294-7612.

Technical Report Documentation Page
1. Report No. IHRB Project TR-587
2. Government
Accession No. 3. Recipient’s Catalog No.
4. Title and Subtitle Crack Development in Ternary Mix Concrete Utilizing Various Saw Depths
5. Report Date February 2009 6. Performing Organization Code
7. Author(s) Kejin Wang, Jiong Hu, Fatih Bektas, Peter Taylor, and Halil Ceylan
8. Performing Organization Report No. CTRE Project 08-317
9. Performing Organization Name and Address National Concrete Pavement Technology Center
10. Work Unit No. (TRAIS)
Iowa State University 2711 South Loop Drive, Suite 4700 Ames, IA 50010-8664
11. Contract or Grant No.
12. Sponsoring Organization Name and Address Iowa Highway Research Board
13. Type of Report and Period Final Report
Covered
Iowa Department of Transportation 800 Lincoln Way Ames, IA 50010
14. Sponsoring Agency Code
15. Supplementary Notes Visit www.cptechcenter.org for color PDF files of this and other research reports. 16. Abstract Early entry sawing applies sawing earlier and more shallowly than conventional sawing and is believed to increase sawing productivity and reduce the cost of the joint sawing operations. However, some early entry sawing joints (transverse joints) in Iowa were found to experience delayed cracking, sometimes up to 30 days. A concern is whether early entry sawing can lead to late-age random cracking.
The present study investigated the effects of different sawing methods on random cracking in portland cement concrete (PCC) pavements. The approach was to assess the cracking potential at sawing joints by measuring the strain development of the concrete at the joints using concrete embedment strain gages. Ten joints were made with the early entry sawing method to a depth of 1.5 in., and two strain gages were installed in each of the joints. Another ten joints were made with the conventional sawing method, five of which were sawed to a depth of one-third of the pavement thickness (3.3 in.), and the other five of which were sawed to a depth of one-quarter of the pavement thickness (2.5 in.). One strain gage was installed in each joint made using conventional sawing. In total, 30 strain gages were installed in 20 joints.
The results from the present study indicate that all 30 joints cracked within 25 days after paving, though most joints made using early entry sawing cracked later than the joints made using conventional sawing. No random cracking was observed in the early entry sawing test sections two months after construction. Additionally, it was found that the strain gages used were capable of monitoring the deformations at the joints. The joint crack times (or crack initiation time) measured by the strain gages were generally consistent with the visual observations.
17. Key Words early entry sawing—Iowa—portland cement concrete pavement—strain development—transverse joints
18. Distribution Statement No restrictions.
19. Security Classification (of this report) Unclassified.
20. Security Classification (of this page)
Unclassified.
21. No. of Pages
50
22. Price
NA
Form DOT F 1700.7 (8-72)
Reproduction of completed page authorized

CRACK DEVELOPMENT IN TERNARY MIX CONCRETE UTILIZING VARIOUS SAW DEPTHS
Final Report
February 2009
Principal Investigator Kejin Wang
Associate Professor Department of Civil, Construction, and Environmental Engineering, Iowa State University
Consultants Peter Taylor
Associate Director National Concrete Pavement Technology Center, Iowa State University
Halil Ceylan
Assistant Professor Department of Civil, Construction, and Environmental Engineering, Iowa State University
Research Assistant
Jiong Hu and Fatih Bektas
Authors Kejin Wang, Jiong Hu, Fatih Bektas, Peter Taylor, and Halil Ceylan
Sponsored by
the Iowa Highway Research Board (IHRB Project TR-587)
Preparation of this report was financed in part
through funds provided by the Iowa Department of Transportation through its research management agreement with the Center for Transportation Research and Education,
CTRE Project 08-317.
A report from National Concrete Pavement Technology Center
Center for Transportation Research and Education, Iowa State University 2711 South Loop Drive, Suite 4700
Ames, IA 50010-8664 Phone: 515-294-8103 Fax: 515-294-0467
www.ctre.iastate.edu

v
TABLE OF CONTENTS
ACKNOWLEDGMENTS ............................................................................................................ IX
EXECUTIVE SUMMARY .......................................................................................................... XI
1. INTRODUCTION .......................................................................................................................1
1.1 Background ....................................................................................................................1 1.2 Objectives ......................................................................................................................2
2. RESEARCH APPROACH ..........................................................................................................3
2.1 Task 1: Equipment Selection .........................................................................................3 2.2 Task 2: Field Project Preparation ...................................................................................3 2.3 Task 3: Field Testing (Strain Gage Installation and Data Collection) ...........................3 2.4 Task 4: Data Analysis ....................................................................................................3
3. EQUIPMENT AND PROCEDURES ..........................................................................................4
3.1 Equipment ......................................................................................................................4 3.2 Paving Profile and Concrete Mix Design ......................................................................7 3.3 Test Setup.......................................................................................................................9
4. TEST RESULTS ........................................................................................................................17
4.1 Mechanical Properties ..................................................................................................17 4.2 Environmental Profile ..................................................................................................17 4.3 Joint Cracking and Strain Development ......................................................................19
5. CONCLUSIONS........................................................................................................................30
REFERENCES ..............................................................................................................................31
APPENDIX A. SUPPLEMENTAL INFORMATION ............................................................... A-1

vii
LIST OF FIGURES
Figure 1. Contrast in joints with different saw cut depths ...............................................................1 Figure 2. Geokon 4200 vibrating wire strain gage ..........................................................................4 Figure 3. Internal view of 4200 vibrating wire strain gage ..............................................................5 Figure 4. LC-2 4-channel and 16-channel data logger ....................................................................6 Figure 5. Site map of selected field site ...........................................................................................7 Figure 6. Plan and cross-section of pavement .................................................................................8 Figure 7. Floor plan of strain gage setup .......................................................................................10 Figure 8. Installation of vibrating wire embedment strain gage ....................................................11 Figure 9. CK-404 vibrating wire readout .......................................................................................11 Figure 10. Setup of cables for strain gage ......................................................................................12 Figure 11. Setup of data loggers ....................................................................................................13 Figure 12. Strain gages during paving ...........................................................................................14 Figure 13. Weather condition during paving and sawing ..............................................................14 Figure 14. Sawing equipment ........................................................................................................15 Figure 16. Joints with different sawing depths in the test sections ................................................16 Figure 17. Weather profile of paving site ......................................................................................18 Figure 18. Example of strain calculation (Joint 7) .........................................................................20 Figure 19. Example of strain calculation (Joint 7).........................................................................21 Figure 20. Example of pavement strain and deformation calculation ...........................................22 Figure 21. Calculated length change of 20 ft PCC slab due to thermal effect ...............................23 Figure 22. Examples of stress development of early entry sawing................................................24 Figure 23. Example of stress development of early entry sawing .................................................25 Figure 24. Percentage of joint cracking at different ages ..............................................................28 Figure 25. Relation between crack time, initiation time, and deformation at the joints ................28
LIST OF TABLES Table 1. Specification of strain gages ..............................................................................................5 Table 2. Concrete mix proportion ....................................................................................................8 Table 3. Sawing information ..........................................................................................................16 Table 4. Mechanical properties of the concrete .............................................................................17 Table 5. Simple prediction of strain and deformation level for cracking ......................................19 Table 6. Early entry sawing joint crack time and strain deformation resulting from strain gage
measurements .....................................................................................................................26 Table 7. Conventional sawing joint crack time and strain deformation resulting from strain gage
measurements .....................................................................................................................27 Table 8. Comparison of observed and measured joint crack time .................................................29 Table A.1. Concrete raw material properties and mix design ..................................................... A-1 Table A.2. Concrete mix design worksheet ................................................................................ A-2 Table A.3. Record of cable lengths and strain gages .................................................................. A-3 Table A.4. Paving and sawing time on individual joints ............................................................ A-4 Table A.5. Visual inspection of joint cracking ........................................................................... A-5 Table A.6. Inspection of sawing depth and width ...................................................................... A-6

ix
ACKNOWLEDGMENTS
The authors sincerely thank the Iowa Department of Transportation (Iowa DOT) and Iowa Highway Research Board for their sponsorship of this research. Earnest thanks are given to Kevin Merryman and Todd Hanson at the Iowa DOT for their assistance in selecting the construction site, contacting the contractor, advising on field tests, and monitoring the entire project. Special appreciation also goes to Mark Gorton, Jeff Flynn, and the paving crew from Flynn Company Inc. for their extra time and special effort in setting up the field testing section, conducting different sawing methods, and documenting the pavement cracks.
The authors would also like to acknowledge the following people at Iowa State University (ISU): Dr. Jim Cable provided constructive suggestions for the field instrumentation. Mr. Bob Steffes assisted in the field test preparation and setup. Mr. Doug Wood provided valuable information on the selection and installation of the data logger and strain gages. Students John Kevern and Gilson Lomboy participated in the field tests. Mr. Daryl Herzmann from the Iowa Environmental Mesonet (IEM), Department of Agronomy, ISU, provided the weather data to the research team. The project would not have been completed without all of the above-mentioned support and help.

EXECUTIVE SUMMARY
The purpose of sawing in a pavement construction project is to produce weak cross-sections and allow portland cement concrete (PCC) to crack at the designed/sawed locations, thus reducing random cracks caused by concrete shrinkage. Early entry sawing, a relatively new technique that applies sawing earlier and more shallowly than conventional sawing, is believed to increase sawing productivity and reduce the cost of the joint sawing operations. However, in some instances early entry sawing joints (transverse joints) in the state of Iowa were found to experience delayed cracking, including lengthy delays greater than 30 days. A concern is whether the early entry sawing technique would lead to late-age random cracking.
The present study investigated the effects of different sawing methods on random cracking in PCC pavements. The approach was to assess the cracking potential at sawing joints by measuring the strain development of the concrete at the joints using concrete embedment strain gages. In the present study, ten joints were made with the early entry sawing method to a depth of 1.5 in., and two strain gages were installed in each of the joints. Another ten joints were made with the conventional sawing method, five of which were sawed to a depth of one-third of the pavement thickness (3.3 in.), and the other five of which were sawed to a depth of one-quarter of the pavement thickness (2.5 in.). One strain gage was installed in each of the joints made with the conventional sawing method. In total, 30 strain gages were installed in 20 joints.
The results from the present study indicate the following:
1. All 30 joints cracked within 25 days after paving. No random cracking was observed in the test section two months after construction.
2. Most joints made with the early entry sawing method cracked later than the joints made with the conventional sawing method. The average joint cracking time for early entry sawing was 12.3 days, while the average joint cracking time for the joints made with the conventional sawing method was 2.2 days for joints sawed to a depth of one-quarter of the pavement thickness and 0.6 days for joints sawed to a depth of one-third of the pavement thickness. The joint crack times (or crack initiation time) measured by the strain gages were generally consistent with the visual observations.
3. The strain gages used were capable of monitoring the deformations at the joints. The deformations were in the ranges of 0.0055–0.0622 in., 0.0012–0.0410 in. and 0.042–0.0458 in., respectively, for the early entry, one-quarter pavement thickness, and one-third pavement thickness sawings.
4. After the joints cracked, the pavement expanded or shrank according to the daily ambient temperature. The average length change of a 20 ft long concrete slab was 0.025 in. due to the ambient temperature effect.
5. Although the tested pavement section was closed to traffic during the project, it was reported by the Iowa Department of Transportation inspection staff that the test sections were prematurely loaded by the contractor’s equipment. It was uncertain how this premature loading affected the joint cracking.
xi

xii
Only one concrete mix was studied in the present project, and the shrinkage behavior of the concrete prior to cracking was not evaluated. These shall be considered in future studies of pavement strain development and cracking potential.

1. INTRODUCTION
1.1 Background
Random cracking in portland cement concrete (PCC) pavement is primarily controlled by two important factors: (1) concrete shrinkage behavior and (1) restraint condition. Saw cutting is the most effective way to reduce the random cracking of concrete because saw cuts or joints allow concrete segments to deform or move freely, thus lowering the level of stresses built up in the concrete. Depending on sawing time, space, and depth, the sawing operation may or may not reduce or eliminate random cracking. Most engineers believe that the saw cutting time should be neither too soon, which may cause concrete raveling, nor too late, which may lead to residual stress development in the concrete. The sawing space commonly varies from 15 to 20 ft (18 ft is the common practice in the state of Iowa). For a conventional sawing operation, the depth of saw cuts is one-third or one-fourth of the pavement thickness. For early entry sawing, the depth is about one inch or slightly deeper (Zollinger et al. 1994; Zollinger 2001).
Early entry sawing is commonly operated with a lightweight sawing machine that can get onto the pavement at a very early age (1 to 4 hours after paving) and cut the concrete to a shallow notch, 1.0 to 1.5 in. (Taylor et al. 2006). Compared to a sawing depth of approximately one-third to one-quarter of the pavement thickness and a joint sawing window between 4 to 12 hours (see Figure 1, adopted from Rasoulian et al. 2006), this new technique is believed to increase sawing productivity and reduce the cost of the joint sawing operation.
(a) Conventional (b) Early entry sawing
Figure 1. Contrast in joints with different saw cut depths
Since early entry sawing is conducted at a very early age, usually 1 to 4 hours after paving, when the concrete is relatively soft and weak, the sawing operation is expected to proceed rapidly and the requirements for manpower and blade wearing resistance are low. Early entry sawing was commercially introduced to the pavement industry in 1988 (Concrete Construction 1988), and it has been increasingly used in the state of Iowa since 1995. Early entry sawing has been proved to be successful in Texas (Zollinger et al. 1994), Missouri (Chojnacki 2001), Iowa (Steffes and
1

Siljenberg 2003), and Sweden (Lofsogard 2004). Some post-construction evaluations have indicated that early entry sawing joints generally crack and that no random cracking is observed. Only recently, a study conducted by the Louisiana Transportation Research Center (Rasoulian et al. 2006) revealed that crack development at the early entry sawing joints was very slow. The researchers believed that the slow crack development was due to the use of slag in the concrete mixes. Then, in order to ensure the joint cracking, the early entry sawing joint depth was increased from 1.0 in. to 1.5 and 2.5 in.; as a result, all the joints were cracked approximately after one month.
Generally, the objective of pavement sawing is to produce a plane of weakness that allows concrete to crack at the desired (sawed) location, thus reducing the random cracks caused by concrete shrinkage. Joint cracking is generally observed within several days after sawing, when conventional sawing, which is one-quarter to one-third of the pavement thickness, is applied. Unexpectedly, in the state of Iowa, many early entry sawing joints (transverse joints) in PCC pavement do not crack for a long time, in some cases for months, after sawing. In a project constructed late October 2004 on US 34 (District 5), early entry sawing was employed for a pavement made with a ternary mix (20% slag, 20% fly ash, 60% portland cement). Only a few joint cracks (approximately 1 per every 20 joints) were found nine months after the paving and sawing operations. It is not clear whether the uncracked joints resulted from the reduced drying shrinkage of the concrete mix (i.e., ternary cementitious materials and well-graded aggregate) or from the insufficient depth of the saw cuts. An urgent concern is whether there will be late-age random cracking in these early entry sawing pavements or not. In some early entry sawing projects, the contractors had to repeat the sawing a few weeks after the construction because they did not see cracks at the sawing joints.
Apparently, most of the reported concrete research and practice until now still implies that early entry sawing joints should and do crack. However, no study has addressed whether delayed random cracking occurs in early entry sawing pavements when few or no joint cracks form several months after construction.
1.2 Objectives
The goal of the present study is to investigate whether delayed random cracking may occur in early entry sawing pavements. Since cracking is related to stress development in concrete, the specific objective of this study is to examine the levels of stress that develop at the early entry sawing joints of pavements. The results of the study, therefore, will help assess the risk of late-age random cracking in early entry sawed pavements.
The results of the present study can be used by the Iowa Department of Transportation (Iowa DOT) and the paving industry to identify potential late-age random cracking problems (if any) in pavements constructed using an early entry sawing operation. The results can also provide the Iowa DOT and paving contractors with insight about modifications for the current early entry operations, such as changing the sawing depth and joint spacing for low-shrinkage concrete mix pavements.
2

2. RESEARCH APPROACH
A pavement project located in Fairfield, Iowa, was selected, and a side-by-side comparison of two different concrete sawing methods (early entry sawing and conventional sawing) was performed. Strain gages were installed at the sawing joints, and strain developments in the concrete and visual evidence of joint cracking were monitored. The results from the early entry sawing and conventional sawing pavement segments were compared and used to assess the risk of random cracking in the pavement. The study included four major tasks, as described below.
2.1 Task 1: Equipment Selection
An investigation was performed to choose the appropriate type of strain gage and data logger for the study. A concrete embedment Geokon 4200 vibrating wire (VW) strain gage and LC-2 4-channel and 16-channel data loggers were selected based on performance and cost.
2.2 Task 2: Field Project Preparation
A full-depth PCC paving project on a US 34 bypass in Fairfield, Iowa, was chosen for the present study. The investigators worked closely with the Iowa DOT and the project contractor on the issues related to sawing operations, strain gage installation, and data collection. An appropriate method for installing the strain gages was also determined. The contractor used its common practice (i.e., equipment and operation methods) for the early entry and conventional sawing applications. The investigators were in charge of strain gage installation and data collection.
2.3 Task 3: Field Testing (Strain Gage Installation and Data Collection)
In order to monitor the strain development and joint cracking formation, strain gages were installed at the joints formed using different sawing techniques. A total of 30 gages were installed: 20 gages for the 10 early entry sawing joints, and 10 gages for the conventional sawing joints. Three data loggers were used to collect the strain data from the gages. Furthermore, basic concrete data (i.e., mix proportion, strength, and modulus of elasticity) were also collected to supplement the strain data analysis.
2.4 Task 4: Data Analysis
The strain data collected in Task 3 was analyzed to assess the risk of random cracking development in early entry sawing pavements.
3
3. EQUIPMENT AND PROCEDURES
3.1 Equipment
3.3.1 Strain Gages
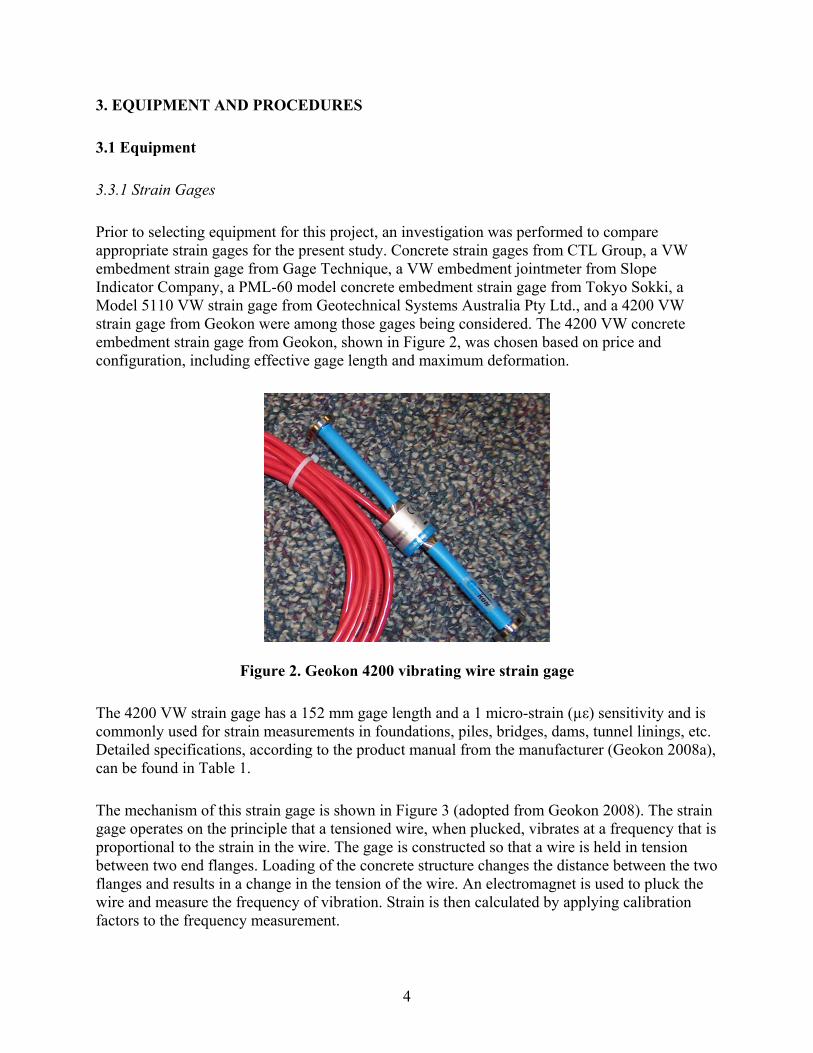
Prior to selecting equipment for this project, an investigation was performed to compare appropriate strain gages for the present study. Concrete strain gages from CTL Group, a VW embedment strain gage from Gage Technique, a VW embedment jointmeter from Slope Indicator Company, a PML-60 model concrete embedment strain gage from Tokyo Sokki, a Model 5110 VW strain gage from Geotechnical Systems Australia Pty Ltd., and a 4200 VW strain gage from Geokon were among those gages being considered. The 4200 VW concrete embedment strain gage from Geokon, shown in Figure 2, was chosen based on price and configuration, including effective gage length and maximum deformation.
Figure 2. Geokon 4200 vibrating wire strain gage
The 4200 VW strain gage has a 152 mm gage length and a 1 micro-strain (µε) sensitivity and is commonly used for strain measurements in foundations, piles, bridges, dams, tunnel linings, etc. Detailed specifications, according to the product manual from the manufacturer (Geokon 2008a), can be found in Table 1.
The mechanism of this strain gage is shown in Figure 3 (adopted from Geokon 2008). The strain gage operates on the principle that a tensioned wire, when plucked, vibrates at a frequency that is proportional to the strain in the wire. The gage is constructed so that a wire is held in tension between two end flanges. Loading of the concrete structure changes the distance between the two flanges and results in a change in the tension of the wire. An electromagnet is used to pluck the wire and measure the frequency of vibration. Strain is then calculated by applying calibration factors to the frequency measurement.
4

Table 1. Specification of strain gages
Specification Values Range (nominal) 3000 µε Resolution 1.0 µε Active Gage Length 153 mm Calibration Accuracy 0.1%FSR Batch Factor Accuracy 0.5%FSR System Accuracy 2.0%FSR Stability 0.1%FS/yr Linearity 2.0%FSR Thermal Coefficient 12.2 µε /oC Frequency Range 450-1200Hz Dimensions (gage), Length x Diameter 6.125×0.750” (155×19mm) Dimensions (coil) 0.875×0.875” (22×22mm) Coil Resistance 150Ω Temperature Range -20 to + 80 oC
Figure 3. Internal view of 4200 vibrating wire strain gage
The primary means of gage placement is direct embedment in concrete by pre-attaching the gage to rebar or tensioning cables, pre-casting the gage into a concrete briquette that is subsequently cast into the structure, or grouting the gage into boreholes in the concrete. Strains are measured using the vibrating wire principle: a length of steel wire is tensioned between two end blocks that are firmly in contact with the mass concrete. Deformations in the concrete cause the two end blocks to move relative to one another, altering the tension in the steel wire. This change in tension is measured as a change in the resonant frequency of vibration of the wire. Electromagnetic coils that are located close to the wire accomplish excitation and the readout of the gage frequency. The strain gage is designed to be embedded inside concrete, and, since the strain was measured through the frequency of the vibrating wire, no calibration is needed for different cable lengths.
5
3.3.2 Data Logger
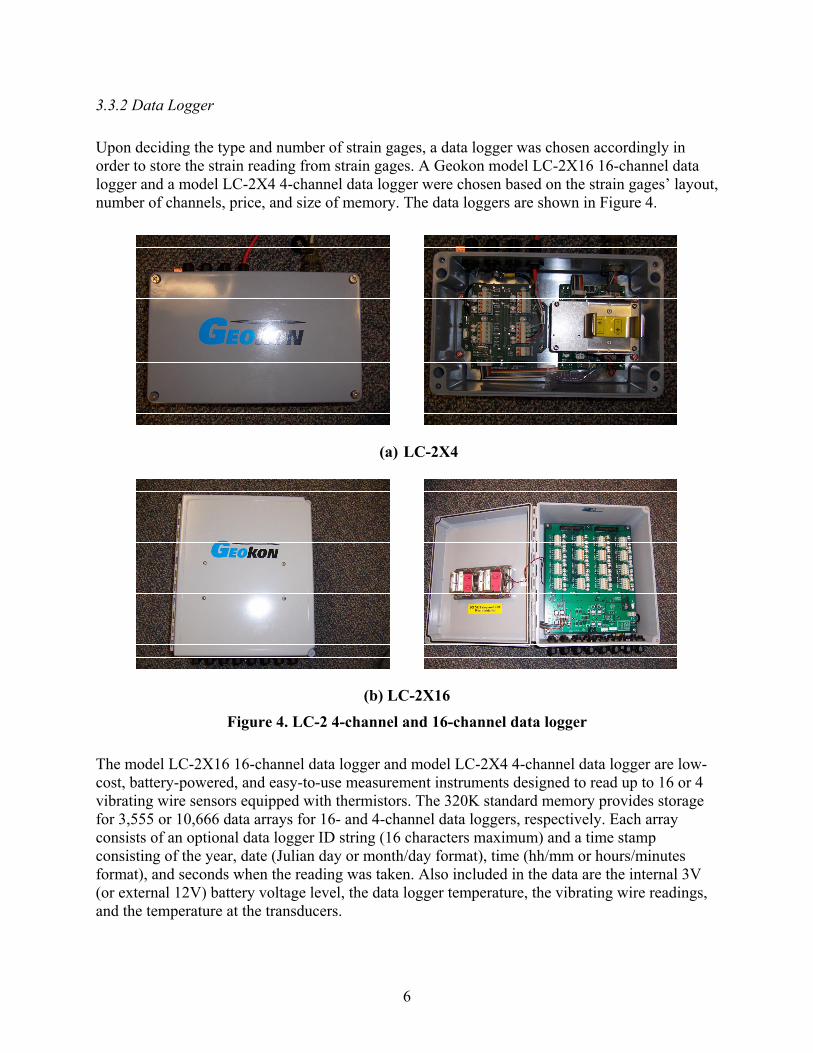
Upon deciding the type and number of strain gages, a data logger was chosen accordingly in order to store the strain reading from strain gages. A Geokon model LC-2X16 16-channel data logger and a model LC-2X4 4-channel data logger were chosen based on the strain gages’ layout, number of channels, price, and size of memory. The data loggers are shown in Figure 4.
(a) LC-2X4
(b) LC-2X16
Figure 4. LC-2 4-channel and 16-channel data logger
The model LC-2X16 16-channel data logger and model LC-2X4 4-channel data logger are low-cost, battery-powered, and easy-to-use measurement instruments designed to read up to 16 or 4 vibrating wire sensors equipped with thermistors. The 320K standard memory provides storage for 3,555 or 10,666 data arrays for 16- and 4-channel data loggers, respectively. Each array consists of an optional data logger ID string (16 characters maximum) and a time stamp consisting of the year, date (Julian day or month/day format), time (hh/mm or hours/minutes format), and seconds when the reading was taken. Also included in the data are the internal 3V (or external 12V) battery voltage level, the data logger temperature, the vibrating wire readings, and the temperature at the transducers.
6

3.2 Paving Profile and Concrete Mix Design
A full-depth PCC paving project (Iowa DOT project number NHSN-34-8(80)-2R-51) on a US 34 bypass in Fairfield, Jefferson County, Iowa, was chosen for the present study. The pavement section from the beginning of the paving project (station number 19+00) to Filbert Avenue (station number 30+00), as shown in Figure 5, was chosen as the test section. The test section was paved on June 23, 2008.
Figure 5. Site map of selected field site
The pavement design is based on plans from the Iowa DOT’s Office of Design Standards, “Road Plans RH-53: Four-Lane Divided Roadway 26 ft. P.C. Concrete Pavement,” as shown in Figure 6. The pavement thickness at the testing section is 10 in. (260 mm), and the width of the pavement is 12 ft + 14 ft (3.6 m + 4.2 m), with a typical joint space of 20 ft (~6 m).
7
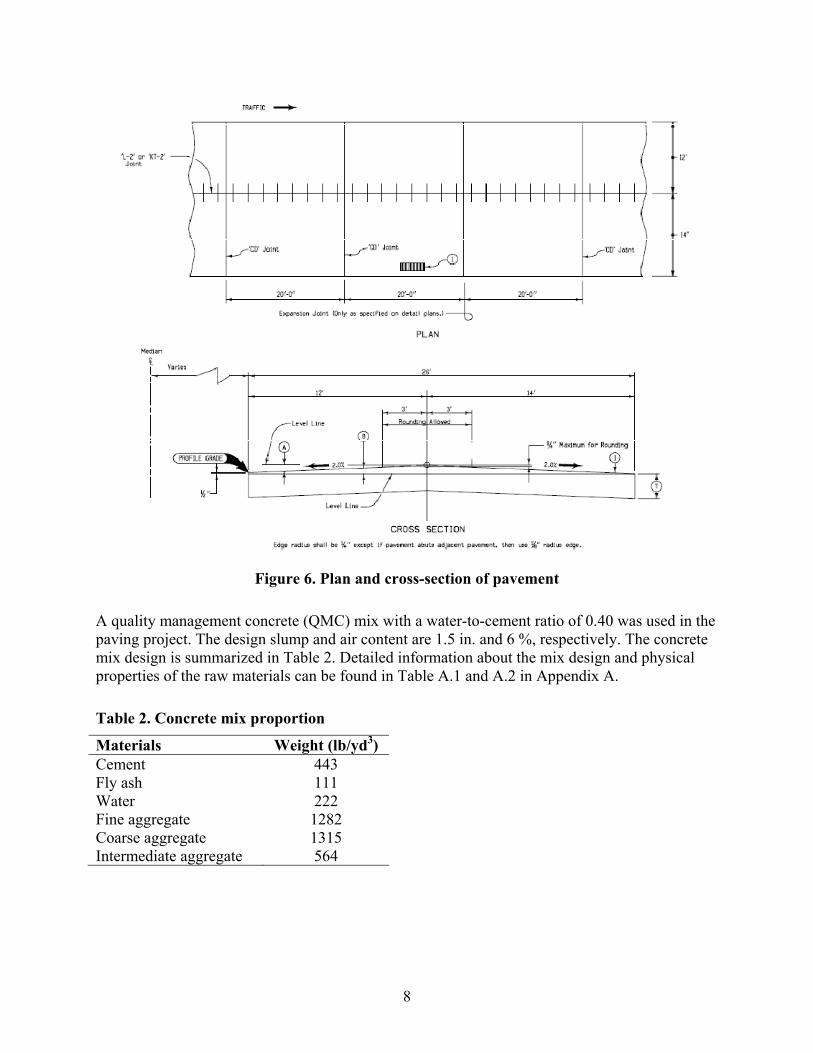
Figure 6. Plan and cross-section of pavement
A quality management concrete (QMC) mix with a water-to-cement ratio of 0.40 was used in the paving project. The design slump and air content are 1.5 in. and 6 %, respectively. The concrete mix design is summarized in Table 2. Detailed information about the mix design and physical properties of the raw materials can be found in Table A.1 and A.2 in Appendix A.
Table 2. Concrete mix proportion
Materials Weight (lb/yd3) Cement 443 Fly ash 111 Water 222 Fine aggregate 1282 Coarse aggregate 1315 Intermediate aggregate 564
8

3.3 Test Setup
3.3.1 Equipment layout
In order to compare the performance of joints cut with different sawing methods, a testing section that included 35 joints, out of which 20 were instrumented for strain measurement, was selected for the present study. The instrumentation order in the direction of paving is 5 one-third conventional sawing, 5 blank (no strain gage), 5 one-fourth conventional sawing, 5 blank, and 10 early entry sawing. The blanks were left to minimize the edge effect. The layout of the instrumentation is shown in Figure 7. As shown in Figure 7(a), Part I of the testing section included 10 early entry sawing joints; 20 embedded VW strain gages were installed, two for each joint (one at approximately 1 ft away from the edge and another in the middle approximately 11 ft away from the edge). All 20 strain gages were connected to two data loggers (Logger A with 16 channels and Logger B with 4 channels) through cables. In Part II of the test section, two depths of conventional joint sawing (one-third and one-quarter of the pavement thickness) were utilized in order to compare the performance of conventional sawing. The arrangement of strain gages are shown in Figure 7(b). One gage, which is located at approximately 1 ft away from the pavement edge, was put in the conventional sawing joints.
3.3.2 Installation of Strain Gages
In order to avoid disturbance/damage from possible external forces during concrete paving and to ensure the correct orientation, the concrete embedment strain gages were installed prior to the concrete placement. As shown in Figure 8, two short pieces of steel rebar were tied to the existing dowel bars using nylon tie-wraps. The strain gages were then tied to the short pieces of rebar, again using nylon tie-wraps. The gages were located approximately at the middle height of pavement thickness (4 ⅜ in.). Special care was paid to ensure that the strain gages are located across the joints and lined up perpendicular to the joints.
Prior to connecting the strain gages to the data loggers, an initial strain reading, a “zero reading,” was taken using the CK-404 vibrating wire readout on each of the gages in order to ensure the proper functioning of the gages (Figure 9). The readings provide necessary voltage pulses to pluck the wire and convert the measured frequencies so as to display the reading directly in micro-strain units (με). The results indicated that all gages but one were working properly after installation.
9

Dowel bar
VW embedded strain gage
Strain gage wire (1” down, covered w/ concrete) Data logger inside
steel barrel
1.5” PVC pipe (1 foot down)
1a
1b
2a
2b
3a
3b 4b
5a
5b
6a
6b 7b
7a4a 8a 9a 10a
8b 9b 10b
Joint w/ early entry sawing
15’
1’
10’
15’
End of testing section
A&B
(a) Part I – Early entry sawing
Dowel bar
VW embedded strain gage
Strain gage wire (1” down, covered w/ concrete)
Data logger inside steel barrel
1.5” PVC pipe (1 foot down)
11b 12b 13b 14b 15b 20b 16b 17b 18b 19b
Joint w/ ¼ depth conventional sawing
Joint w/ 1/3 depth conventional sawing
15’
1’
15’
Start of testing section
C
(b) Part II - Conventional sawing
Figure 7. Floor plan of strain gage setup
10

Figure 8. Installation of vibrating wire embedment strain gage
Figure 9. CK-404 vibrating wire readout
Depending on the location of the strain gages, the length of the cable for wiring the gages to the logger ranges from 35 to 175 ft. The information about lengths of cable for individual strain gages can be found in Table A.3 in Appendix A. In order to protect the cable from damage during concrete paving, all cables running underneath the pavement, as shown in Figure 7, were buried inside small trenches approximately one inch deep. The cable from the strain gages located 11 ft away from the pavement edge were run inside the dowel baskets and met with the cable over the edge of the pavement. The trenches were then backfilled so that the cables were completely buried. Pictures of the cable setup can be found in Figure 10. It appeared that there was no obvious disturbance on the base surface caused by the installation of the strain gages and cables.
11

(a) Arrangement of strain gages and cables
(b) Cables after installation
Figure 10. Setup of cables for strain gage
3.3.3 Setup of Data Loggers
Two LC-2X16 16-channel data loggers and one LC-2X4 4-channel data logger were used to collect strain and temperature readings from the 30 gages. The layout of the arrangement of strain gages and the corresponding data logger are shown in Figure 7. In order to protect the data loggers from weathering and water, the investigators developed a setup for the data loggers’ storage. As shown earlier, the testing section was basically divided into two parts: Part I with 20 strain gages on 15 early entry joints, as shown in Figure 7(a), and Part II with 10 strain gages on 10 conventional joints (5 with one-third of the pavement thickness and 5 with one-quarter of the pavement thickness), as shown in Figure 7(b). In each of these two parts, all cables were run together and met at about the middle point, and the cables were then bound together and run toward a 50 gallon steel barrel approximately 15 ft away from the pavement edge. The cables were buried approximately 1 ft deep and enclosed by 1.5 in. PVC pipe so as to prevent damage during construction. The cables were then run into the steel barrels through a specially designed
12

“U shape” tube to protect them from damage and prevent water getting inside the barrels. Both steel barrels were half-buried and locked for security reasons (Figure 11).
All strain gages were lightning protected through a ground connection made possible by the earth grounding of the data loggers (as shown in the green cables in Figure 11). Grounding cable was used to divert the energy from a lightning strike safely to ground. The grounding rod was driven as close to the data logger as possible and to a depth of approximately three feet. A copper grounding lug was supplied on the exterior of the LC-2X16 and LC-2X4 enclosure to provide connection to this wire from the grounding cable.
Figure 11. Setup of data loggers
3.3.4 Paving and Sawing
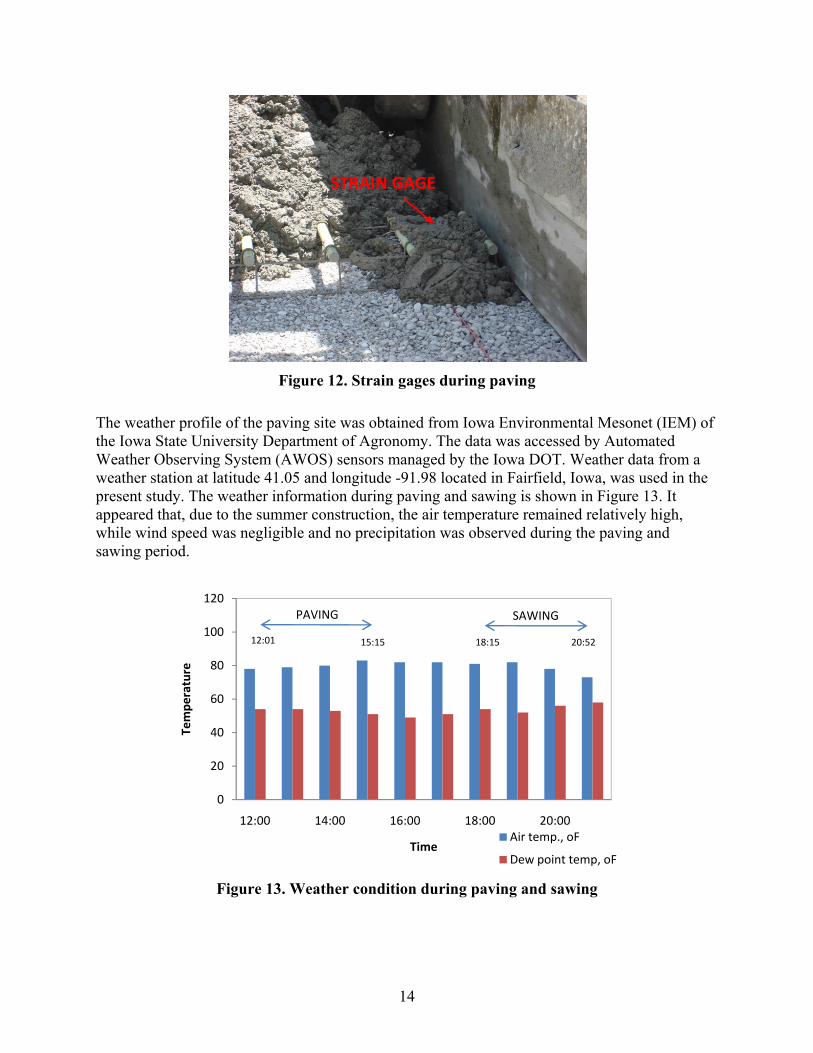
The test section was paved on June 23, 2008 in the afternoon. The paving time through each joint was recorded and is shown in Table A.4 in Appendix A. The strain gages and cables during paving are shown in Figure 12. It appeared that both strain gages and cables were well protected against the paving process. The air content was also measured on site during paving: air contents of 9.6% and 6.9% were recorded before and after paving, respectively.
13
STRAIN GAGE
Figure 12. Strain gages during paving
The weather profile of the paving site was obtained from Iowa Environmental Mesonet (IEM) of the Iowa State University Department of Agronomy. The data was accessed by Automated Weather Observing System (AWOS) sensors managed by the Iowa DOT. Weather data from a weather station at latitude 41.05 and longitude -91.98 located in Fairfield, Iowa, was used in the present study. The weather information during paving and sawing is shown in Figure 13. It appeared that, due to the summer construction, the air temperature remained relatively high, while wind speed was negligible and no precipitation was observed during the paving and sawing period.
0
20
40
60
80
12:00 14:00 16:00 18:00 20:00
Tem
pera
ture
Time
100
120
Air temp., oF
Dew point temp, oF
SAWINGPAVING
12:01 15:15 18:15 20:52
Figure 13. Weather condition during paving and sawing
14

0
1
2
3
4
5
6
7
12:00 14:00 16:00 18:00 20:00
Tem
pera
ture
TimeWind speed, knots
Hourly precipitation, in.
PAVING SAWING
12:01 15:15 18:15 20:52
Figure 13. Weather condition during paving and sawing (continued)
In order to compare the effect of different sawing types and depths, two different types of sawing equipment were used in this study. A GX-4200 Soff-Cut was used for early entry sawing (see Figure 14[a]) and conventional sawing with the depth of one-quarter of pavement thickness (T/4). A Diesel conventional sawing machine (Figure 14[b]) was used for conventional sawing with the depth of one-third of the pavement thickness (T/3). The sawing information regarding blade types and joint depths were provided by the contractor and are summarized in Table 3. The pavement joints with three different kinds of saw cut are shown in Figure 16.
(a) Early entry sawing
Figure 14. Sawing equipment
15

(b) Conventional sawing
Figure 15. Sawing equipment (continued)
Table 3. Sawing information
Sawing Type Saw Type Blade Type Joint Depth (in.) Joint Width (in.) Early entry Soff-Cut Diamond 1.5 0.25 T/4 Soff-Cut Diamond 2.5 0.25 T/3 Diesel Abrasive 3.3 0.25
Due to the differences in joints and sawing machines, joints were sawed at different periods after paving. The early entry sawing was performed at approximately 5.1 hours after paving, and the conventional sawing was performed a little later, at approximately 6.6 hours after paving. More detailed sawing information can be found in Table A.4 in Appendix A.
(a) T/3 (b) T/4 (c) Early entry
Figure 16. Joints with different sawing depths in the test sections
16

4. TEST RESULTS
4.1 Mechanical Properties
In order to study the mechanical properties of the concrete mix used in the present study, 4×8 in. cylinders were cast at the site producing the job mixture. The 3- and 7-day specimens were brought back and cured at the laboratory (in plastic molds), whereas the 28- and 56-day cylinders were left at the site for curing and collected at the time of testing. Compressive strength, splitting tensile strength, and modulus of elasticity were measured at different ages. The results are summarized in Table 4.
Table 4. Mechanical properties of the concrete
Specimen f’c (psi) E’c (ksi) f’sp (psi) 3-day 3241 - - 7-day 4575 4125 - 28-day 6155 5322 495 56-day 6759 5210 -
The results show that the compressive strength, splitting tensile strength, and modulus of elasticity are consistent with the database of PCC pavement mechanical tests in the state of Iowa (Wang et al. 2008a).
4.2 Environmental Profile
As mentioned above, the weather profile of the paving site was obtained from IEM of the Iowa State University Department of Agronomy. The weather profiles of the first 30 days after paving are shown in Figure 17. The daily high and low temperature profiles for the first 30 days after paving show that the temperatures were in a band of 55 oF to 95 oF and were cycling between daytime and nighttime relatively constantly. The difference between the low and high peaks of a cycle can be up to 30oF, which might have significantly affected the joint cracking development and pavement deformation, while a relatively low wind speed and precipitation accumulation should not have had a major effect.
17

TEST SECTION PAVED
Figure 17. Weather profile of paving site
18

4.3 Joint Cracking and Strain Development
Based on the database of Iowa PCC pavement mechanical properties (Wang et al. 2008a), the following two equations were used to predict splitting tensile strength and modulus of elasticity of concrete at different ages:
Ec=80,811×f’c0.4659 (1)
f’sp=1.019×f’c0.7068 (2)
The results, as shown in Table 5, indicate that the predicted splitting tensile strength and modulus of elasticity at different ages are consistent with the available measured data shown in Table 4.
Table 5. Simple prediction of strain and deformation level for cracking
Measured Predicted f'c (psi) f'sp (psi) E'c (ksi) Max. Strain (µε) Max. Deformation (in.)
3-day 3241 309 3492 88.4 0.0212 7-day 4575 394 4101 96.0 0.0230
28-day 6155 486 4708 103.2 0.0248 56-day 6759 519 4918 105.5 0.0253
The maximum strain level inside the concrete under tension stress was indirectly estimated based on the calculated splitting tensile strength and elastic modulus:
Maximum Strain = f’sp/E’c (3)
The corresponding deformations of a 20 ft. concrete slab under different stress levels at different ages were calculated accordingly. The results of the estimated splitting tensile strength, modulus of elasticity, strain, and deformation level in terms of initial cracking at different ages are summarized in Table 5. The results show that, depending on the age of the concrete, the pavement might start to crack when the strain reaches approximately 88.4 µε with a deformation of 0.0212 in.
According to the calibration factor from the strain gage manufacturer (Geokon, 2008a), the theoretical strain can be calculated based on the following:
µε theory=G×R (4)
19

where G is the theoretical gage factor (equal to gage factor times batch factor, or “3.304 x 0.96 = 3.1718” for strain gages used in the present study) and R is the direct reading from the Geokon data logger.
A corrected strain can be calculated based on the difference between the current reading and the zero reading before the strain gage is embedded in the concrete:
µε corrected=G×(R1-R0) (5)
Since the temperature will affect the strain reading from the strain gages due to the difference in thermal expansion between the concrete and the steel wire, as shown in Figure 3, the following equation was used to calculate the true strain inside the gage based on the temperature-corrected strain:
µε true=G×(R1-R0)+(T1-T0)×(C1-C2) (6)
where T1 and T0 are the current temperature (oC) and temperature at zero reading (oC), respectively, C1 is the CTE of steel (microstrain/oC), and C2 is the CTE of concrete. According to the database of the thermal properties of Iowa PCC pavement (Wang et al. 2008b), a CTE value of 10.25 microstrain/oC was used based on the coarse aggregate type.
By using Equation 6, the true strain of the strain gages can be calculated. An example of the difference between the direct strain gage reading and the calculated strain in the gage (Joint 7, logger number B1) for 30 days after paving is shown in Figure 19(a) and (b). A zero reading of 862.0 and a temperature of 17.2 oC at zero reading was used in Equation 6 for the calculation of true strain in this strain gage.
Joint crack initiation
(a) Direct reading from strain gage
Figure 18. Example of strain calculation (Joint 7)
20

(b) Calculated strain in strain gage
Figure 19. Example of strain calculation (Joint 7)
The deformation of the 20 ft concrete slab was calculated accordingly based on the effective strain gage length of 152 mm (see Figure 3). Since the deformation of the strain gage is caused by the expansion or shrinkage of the concrete pavement, the deformation of the concrete pavement and the strain level inside the pavement can be calculated accordingly. Figure 20 presents an example (Joint 7, logger number B1) of the deformation calculation for the strain gage (pavement) and the strain inside the pavement.
The dramatic increase of the strain and deformation indicated that the strain level increases significantly during a very short period of time after paving, usually within hours. This first dramatic increase of strain and deformation inside the pavement was considered to be the initiation of joint cracking. The periodic decrease and increase of the deformation after cracking, however, is considered to be caused by the thermal deformation of the concrete slab due to daily temperature variation, which includes approximately one cycle per day. The maximum daily length change of a 20 ft long concrete slab due to thermal effect is calculated based on the temperature data, as shown in Figure 21. Based on the available temperature data, the theoretical free expansion due to the daily temperature differences can range between 0.011 and 0.033 in. The values calculated from the strain gage measurements fall in this range, as shown in Figure 20.
21

(a) Calculated deformation
-10
0
10
20
30
40
50
0 5 10 15 20 25
Stra
in in
pav
emen
t, mε
Time after paving, day
60
(b) Calculated strain in pavement
Figure 20. Example of pavement strain and deformation calculation
22

0.00
0.01
0.01
0.02
0.02
0.03
0.03
0.04
6/21/2008 7/1/2008 7/11/2008 7/21/2008
Calc
ulat
ed le
ngth
cha
nge
(20-
ft s
lab)
, in.
Time
Figure 21. Calculated length change of 20 ft PCC slab due to thermal effect
Based on the same procedure presented in Figure 20, the strain and deformation levels for all 30 strain gages and the corresponding pavement deformation and strain level were calculated. Examples of the deformation of a 20 ft PCC pavement slab with early entry sawing (Joint 7, logger number B1, and Joint 6, logger number A6) and conventional sawing (T/4 – Joint 13, logger number C3, and T/3 – Joint 20, logger number C10) under different periods are presented in Figure 22 and Figure 23. Results show that the strain (deformation) development generally showed two different styles: a few of the strain gages stopped taking readings after a drastic increase in strain, and most of the gages showed a cycling strain development with periodic increases and decreases. The former situation probably indicates that the crack width falls out of the strain gage measurement range, and the latter shows that the crack width fluctuation due to temperature cycling occurs in the measurement range.
23

(a) Joint 7, logger number B1
(b) Joint 6, logger number A6
Figure 22. Examples of stress development of early entry sawing
24

(a) Joint 13, logger number C3
(b) Joint 20, logger number C10
Figure 23. Example of stress development of early entry sawing
In the present study, the time at which the first significant peak observed from the strain gage readings (with a deformation larger than 0.005 in.) was considered to be the joint cracking time (or crack initiation time). Table 6 shows the joint crack times for all the joints studied with early entry sawing. The table illustrates that the crack times measured from the two strain gages installed at a given early entry sawing joint are the same or very close, indicating a good reliability for the strain gages. The average time is 12.3 days, and the range is 1.4 to 24.1 days.
25

The table also shows that 2 out of 10 joints cracked much earlier than others. If these joints are excluded, the average crack time is 15 days. The joints that cracked early also have much larger deformation (up to 0.0622 in.) than the joints that cracked later (as low as 0.0055 in.). However, the average deformation or strain value measured is close to those estimated in Table 5.
Table 6. Early entry sawing joint crack time and strain deformation resulting from strain gage measurements
Joint Joint crack time, day
Strain from gage reading, µε
Deformation at the crack time, in.
Strain in concrete at the crack time, µε
1* 17.5 17.6 1434 1487 0.0086 0.0089 35.8 37.12* 24.0 24.1 1659 1815 0.0099 0.0109 41.4 45.33* 17.6 17.6 1414 1671 0.0085 0.0100 35.3 41.74 10.6 10.6 5705 5107 0.0341 0.0306 142.3 127.3
5* 17.6 17.6 1200 1662 0.0072 0.0099 29.9 41.46 1.4 1.4 9692 10177 0.0580 0.0609 241.7 253.87 11.6 11.6 988 1095 0.0059 0.0066 24.6 27.38 10.5 10.5 1210 1337 0.0072 0.0080 30.2 33.39 10.5 10.5 914 1435 0.0055 0.0086 22.8 35.8
10 2.1 2.2 10393 10096 0.0622 0.0604 259.2 251.7Range 1.4 - 24.1 914 - 10393 0.0055 - 0.0622 22.8 – 259.2 Avg. 12.3 3525 0.0211 87.9
* Due to an unknown reason, probably a malfunction of the data logger, discontinuities were observed in the data and some of the joint crack initiations occurred in these intervals. Joint crack times are considered as the mid-point of this no-data logging period.
Table 7 demonstrates the joint crack time and deformations resulting from the conventional sawing method. As expected, the conventional sawing generally resulted in much earlier joint cracking: for the sawing to one-third of the pavement thickness, the average crack time is 0.6 days and the corresponding range is 0.2 to 2.2 days. The average crack time for the sawing to one-quarter of the pavement thickness is 2.2 days with a range of 0.2 to 6.5 days. Similarly, the variation in the strain gage measurements of the five joints made with the same sawing method was also large. The large variations may be attributed to various factors, such as time and location of sawing, uniformity of the concrete slab, etc. However, the data is consistent with the common knowledge that the deeper the cut, the earlier the joint cracking.
26
Table 7. Conventional sawing joint crack time and strain deformation resulting from strain gage measurements
Joint
# Time start
cracking, day Strain from
gage reading, µε Deformation at
the crack time, in. Strain in concrete at
the crack time, µε
T/4
11 6.5 6125 0.0372 206.6 12 0.2 340 0.0020 11.3 13 0.4 5999 0.0359 199.4 14 2.0 680 0.0041 22.6 15 2.0 200 0.0012 6.6
Range 0.2 - 6.5 200 - 6125 0.0012 - 0.0410 6.6 - 206.6 Avg. 2.2 2687 0.0161 89.3
T/3
16 0.2 2687 0.0042 23.5 17 1.1 706 0.0091 50.4 18 1.1 1516 0.0342 189.7 19 0.2 5707 0.0070 38.9 20 0.2 7653 0.0458 23.5
Range 0.2 - 2.2 706 - 7653 0.0042 - 0.0458 23.5 - 189.7 Avg. 0.6 3350 0.0200 254.4
* Due to an unknown reason, probably a malfunction of the data logger, discontinuities were observed in the data and some of the joint crack initiations occurred in these intervals. Joint crack times are considered as the mid-point of this no-data logging period.
Table 7 demonstrates the joint crack time and deformations resulting from the conventional sawing method. As expected, the conventional sawing generally resulted in much earlier joint cracking: for the sawing to one-third of the pavement thickness, the average crack time is 0.6 days and the corresponding range is 0.2 to 2.2 days. The average crack time for the sawing to one-quarter of the pavement thickness is 2.2 days with a range of 0.2 to 6.5 days. Similarly, the variation in the strain gage measurements of the five joints made with the same sawing method was also large. The large variations may be attributed to various factors, such as time and location of sawing, uniformity of the concrete slab, etc. However, the data is consistent with the common knowledge that the deeper the cut, the earlier the joint cracking.
Based on the estimation of cracking data, as shown in Table 6 and Table 7, the percentage of cracked joints at different ages was calculated by dividing the number of cracked joints by the total number of joints with certain types of sawing (5 joints with conventional sawing or 10 joints with early entry sawing). For example, two out of five joints (40%) with T/4 conventional sawing cracked within one day and two more joints cracked between one to two days, which means four out of five joints (80%) cracked within two days, and all five (100%) cracked with seven days. The results are summarized in Figure 24, which shows that most of the joints formed with conventional sawing cracked within 5 days and that the percentage reaches to 100% at less than 10 days. The figure also shows that only approximately 20% of the joints formed with early entry sawing cracked at the age of 10 days and that the percentage reaches 100% by approximately 25 days.
27
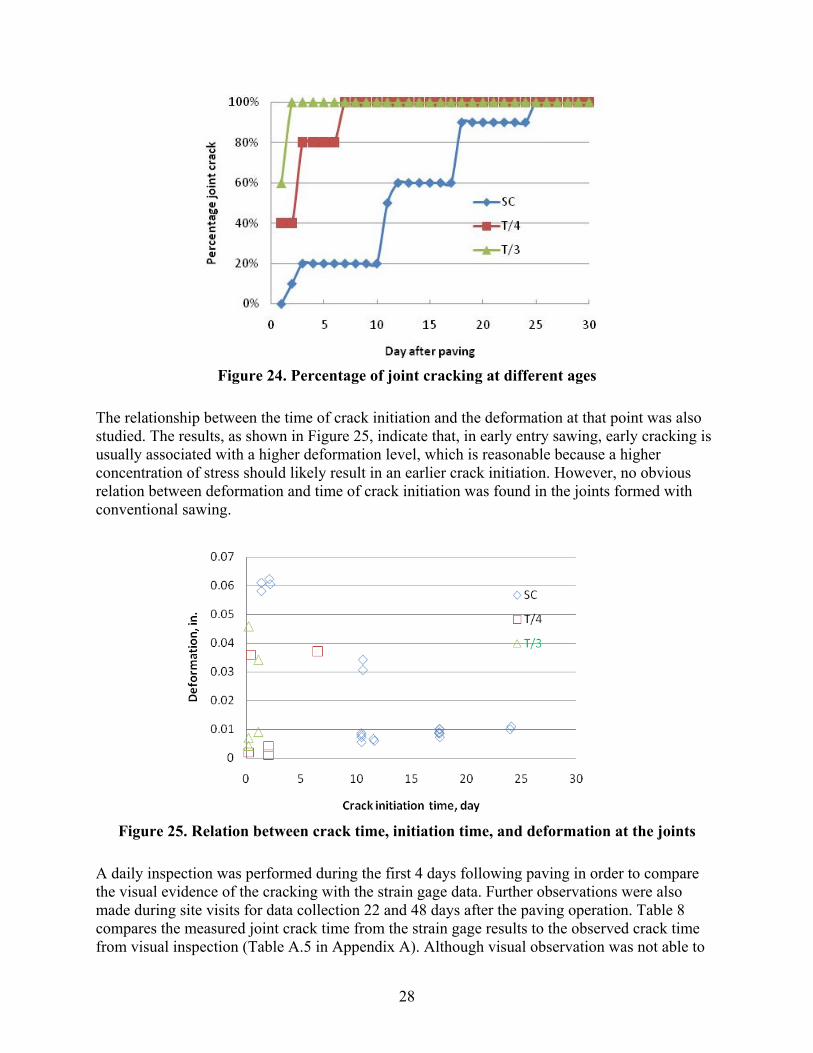
Figure 24. Percentage of joint cracking at different ages
The relationship between the time of crack initiation and the deformation at that point was also studied. The results, as shown in Figure 25, indicate that, in early entry sawing, early cracking is usually associated with a higher deformation level, which is reasonable because a higher concentration of stress should likely result in an earlier crack initiation. However, no obvious relation between deformation and time of crack initiation was found in the joints formed with conventional sawing.
Figure 25. Relation between crack time, initiation time, and deformation at the joints
A daily inspection was performed during the first 4 days following paving in order to compare the visual evidence of the cracking with the strain gage data. Further observations were also made during site visits for data collection 22 and 48 days after the paving operation. Table 8 compares the measured joint crack time from the strain gage results to the observed crack time from visual inspection (Table A.5 in Appendix A). Although visual observation was not able to
28

be performed daily after 4 days of paving, a very good match was found between observed and measured joint crack time on most of the joints, which indicates good consistency between visual observation and strain gage measurement.
Table 7. Comparison of observed and measured joint crack time Early Entry Sawing
Joint # 1 2 3 4 5 6 7 8 9 10 Observed crack time, day 4-22 22-48 4-22 4-22 4-22 1-2 4-22 4-22 4-22 2-3 Measured crack time, day 17.5 24.1 17.6 10.6 17.6 1.4 11.6 10.5 10.5 2.1
Conventional Sawing (T/4) Conventional Sawing (T/3) Joint # 11 12 13 14 15 16 17 18 19 20 Observed crack time, day 4-22 0-1 0-1 0-1 1-2 0-1 0-1 0-1 0-1 0-1 Measured crack time, day 6.5 0.2 0.4 2.0 2.0 0.2 1.1 1.1 0.2 0.2
Sawing depths and widths were also measured on June 27, 2008, four days after paving. More detailed information about all three joint types after sawing is shown in Table A.6 in Appendix A. Based on the measurements, the average depth of early entry sawing is 1.5370 in., with an average joint width of 0.3023 in.. The average depths of conventional sawing methods are 2.6729 in, and 2.9381 in., with average sawing widths of 0.3305 in. and 0.3213 in. for one-quarter sawing and one-third sawing, respectively. The measured joint depth and width are consistent with the information about sawing provided by the contractor, shown in Table 3. Furthermore, there was no observation of random cracking approximately two months after construction when the investigators visited the site to remove the instrumentation.
29

5. CONCLUSIONS
Based on the results of the present study, the following conclusions can be drawn:
1. All 30 joints cracked within 25 days after paving. No random cracking was observed in the test section 2 months after construction.
2. Most joints made with the early entry sawing method cracked later than the joints made with the conventional sawing method. The average joint cracking time for early entry sawing was 12.3 days, while it is 2.2 days for the conventional sawing method sawed to one-quarter of the pavement thickness and 0.6 days for the conventional sawing method sawed to one-third of the pavement thickness. The joint crack times (or crack initiation times) measured by the strain gages were generally consistent with those from visual observations.
3. The strain gages used were capable of monitoring the deformations at the joints. The deformations were in the ranges of 0.0055–0.0622 in., 0.0012–0.0410 in., and 0.042–0.0458 in. for the early entry, one-quarter pavement thickness, and one-third pavement thickness sawings, respectively.
4. After the joints cracked, the pavement expanded or shrank according to the daily ambient temperature. The average length change of the 20 ft long concrete slab was 0.025 in. due to the ambient temperature effect.
5. Although the tested pavement section was closed to traffic during the project, it was reported by the Iowa DOT inspection staff that the test sections were prematurely loaded by the contractor’s equipment. It was uncertain how this premature loading affected the joint cracking.
6. Only one concrete mix was studied in the present project, and the shrinkage behavior of the concrete prior to cracking was not evaluated. These shall be considered in future studies of pavement strain development and cracking potential.
30

31
REFERENCES
American Association of State Highway and Transportation Officials (AASHTO). 1993. Guide for Design of Pavement Structures. Washington, DC: AASHTO.
American Concrete Pavement Association (ACPA). 1991. Design and Construction of Joints for Concrete Highways. TB-010.0D. Arlington Heights, IL: ACPA.
Chojnacki, T. 2001. Evaluation of Early Entry Sawing of PCC Pavement. Report RDT 01-010. Jefferson City, MO: Missouri Department of Transportation.
Concrete Construction. 1988. Saw Cuts Concrete Immediately After Finishing. Concrete Construction 33.3.
Geokon. 2008a. Instruction Manual, Model 4200/4202/4204/4210 Vibrating Wire Strain Gages. Lebanon, NH: Geokon.
Geokon. 2008b. Instruction Manual, Model LC-2x4, 4 Channel VW Datalogger. Lebanon, NH: Geokon.
Geokon. 2008c. Instruction Manual, Model LC-2x16, 16 Channel VW Datalogger. Lebanon, NH: Geokon.
Iowa Department of Transportation, Office of Design Standard Road Plans. Standard Road Plan RH 53. Four-Lane Divided Roadway 26' P.C. Concrete Pavement (RH-53). ftp://165.206.203.34/design/stdrdpln/english/erh53.pdf
Löfsögård, M. 2004. Documentation of Sawing in Concrete Pavement with Soff-Cut Dry Cutting Saw. Report No. 2004-50. Stockholm: Swedish Cement and Concrete Institute.
Rasoulian, M., H. Titi, and M. Martinez. 2006. Evaluation of Narrow Transverse Contraction Joints in Jointed Plain Concrete Pavements. LADOTD/FHWA/06-411. Baton Rouge, LA: Louisiana Department of Transportation and Development.
Steffes, R., and B. J. Siljenberg. 2003. Early Entry Sawed PCC Transverse Joint Ends. Report MLR-97-5. Ames, IA: Iowa Department of Transportation.
Taylor, P. C., S. H. Kosmatka, G. F. Voigt, M. E. Ayers, A. Davis, G. J. Fick, J. Gajda, J. Grove, D. Harrington, B. Kerkhoff, C. Ozyildirim, J. M. Shilstone, K. Smith, S. M. Tarr, P. D. Tennis, T. J. Van Dam, and S. Waalkes. 2006. Integrated Materials and Construction Practices for Concrete Pavement: A State of the Practice Manual. FHWA HIF-07-004. Washington, DC: Federal Highway Administration.
Wang, K., J. Hu, and Z. Ge. 2008a. Task 4: Testing Iowa Portland Cement Concrete Mixtures for the AASHTO Mechanistic-Empirical Pavement Design Procedure. http://www.ctre.iastate.edu/reports/mepdg_testing.pdf.
Wang, K., J. Hu, and Z. Ge. 2008b. Task 6: Material Thermal Input for Iowa Materials. http://www.ctre.iastate.edu/reports/mepdg-task6.pdf.
Zollinger, D. G., T. Tang, and D. Xin. 1994. Sawcut Depth Considerations for Jointed Concrete Pavement Based on Fracture Mechanics Analysis. Transportation Research Record 1449.
Zollinger, D. G. 2001. The Case for Early-Entry Saws. Concrete Construction 46.2.

APPENDIX A. SUPPLEMENTAL INFORMATION
Table A.1. Concrete raw material properties and mix design
A-1

Table A.2. Concrete mix design worksheet
A-2

Table A.3. Record of cable lengths and strain gages
ID Cable length (ft) Data Logger Channel 1a 125 A 1 2a 105 A 2 3a 85 A 3 4a 65 A 4 5a 45 A 5 6a 45 A 6 7a 65 A 7 8a 85 A 8 9a 105 A 9 10a 125 A 10 1b 115 A 11 2b 95 A 12 3b 75 A 13 4b 55 A 14 5b 35 A 15 6b 35 A 16 7b 55 B 1 8b 75 B 2 9b 95 B 3
10b 115 B 4 11b 175 C 1 12b 155 C 2 13b 135 C 3 14b 115 C 4 15b 95 C 5 16b 95 C 6 17b 115 C 7 18b 135 C 8 19b 155 C 9 20b 175 C 10
A-3

Table A.4. Paving and sawing time on individual joints
Joint #
Concrete Dumping
Time Paving Time
Start Sawing Time
End Sawing Time
Time period between paving
and sawing (hours)
Early
Ent
ry S
awin
g
1 2:49 PM 3:15 PM
6:28 PM 8:52 PM 5.1
2 2:39 PM 2:48 PM
3 2:34 PM 2:44 PM
4 2:31 PM 2:40 PM
5 2:17 PM 2:36 PM
6 2:16 PM 2:25 PM
7 2:12 PM 2:20 PM
8 2:07 PM 2:17 PM
9 2:05 PM 2:13 PM
10 2:02 PM 2:09 PM
Con
vent
iona
l Sa
win
g (T
/4)
11 1:22 PM 1:35 PM
6:15 PM 8:38 PM 6.6
12 1:20 PM 1:32 PM
13 1:12 PM 1:27 PM
14 1:09 PM 1:19 PM
15 12:54 PM 1:02 PM
Con
vent
iona
l Sa
win
g (T
/3)
16 12:18 PM 12:26 PM
17 12:13 PM 12:23 PM
18 12:12 PM 12:19 PM
19 12:04 PM 12:14 PM
20 12:01 PM 12:11 PM
A-4

Table A.5. Visual inspection of joint cracking
Visual Inspection Crack Width (in.)
Day 4 Joint # Day 1
(6/24/2008) Day 2
(6/25/2008) Day 3
(6/26/2008) Day 4
(6/27/2008)
Early
Ent
ry S
awin
g (S
C)
1 N N N N NA 2 N N N N NA 3 N N N N NA 4 N N N N NA 5 N N N N NA 6 N Y Y Y 0.1085 7 N N N N NA 8 N N N N NA 9 N N N N NA 10 N N Y Y 0.0700
Con
vent
iona
l Sa
win
g (T
/4) 11 N N N N NA
12 Y Y Y Y hairline 13 Y Y Y Y 0.0830 14 Y Y Y Y hairline 15 N Y Y Y hairline
Con
vent
iona
l Sa
win
g (T
/3) 16 Y Y Y Y 0.0810
17 Y Y Y Y hairline 18 Y Y Y Y hairline 19 Y Y Y Y 0.0890 20 Y Y Y Y hairline
SC % Crack 0% 10% 20% 20% 0.0893 T/4 % Crack 60% 80% 80% 80% 0.0830 T/3 % Crack 100% 100% 100% 100% 0.0850
A-5

A-6
Table A.6. Inspection of sawing depth and width
Joint Measurement (6/27/2008) Joint # Joint Depth (in.) Joint Width (in.)
Early
Ent
ry S
awin
g (S
C)
1 1.4575 0.2895 2 1.4410 0.2905 3 1.5020 0.2790 4 1.5700 0.2745 5 1.5710 0.2840 6 1.5365 0.4090 7 1.5440 0.2795 8 1.5720 0.2860 9 1.5880 0.2730 10 1.5875 0.3575
Con
vent
iona
l Sa
win
g (T
/4) 11 2.7400 0.3330
12 2.9700 0.3640 13 2.6680 0.3620 14 2.6745 0.3050 15 2.3120 0.2885
Con
vent
iona
l Sa
win
g (T
/3) 16 2.7580 0.3105
17 3.0190 0.2905 18 2.8980 0.3135 19 3.0360 0.3115 20 2.9795 0.3805
SC Avg. 1.5370 0.3023 T/4 Avg. 2.6729 0.3305 T/3 Avg. 2.9381 0.3213


![Ternary Logic Gates and Ternary SRAM Cell ….pdf · According to blueprint of Weste & Harris in [4] for design of a binary SRAM, a ternary SRAM is constructed similarly. A ternary](https://img.pdfslide.us/doc/110x75/5a8290bb7f8b9aa24f8e2227/ternary-logic-gates-and-ternary-sram-cell-pdfaccording-to-blueprint-of-weste.jpg)