Embed Size (px)
Citation preview
Contents CPWF Project Report
Page | 1
CPWF Project Report Managing Water and Land Resources for Sustainable Livelihoods at the Interface between Fresh and Saline Water Environments in Vietnam and Bangladesh
To Phuc Tuong International Rice Research Institute (IRRI) Chu Thai Hoanh International Water Management Institute (IWMI) and the Project Number 10 Project Team for submission to the
October, 2009
Contents CPWF Project Report
2
Acknowledgments The project team would like to express its sincere thanks to the International Rice Research Institute (IRRI), International Water Management Institute (IWMI), WorldFish Center, Bangladesh Rural Advancement Committee (BRAC), Bangladesh Rice Research Institute (BRRI), Bangladesh Fisheries Research Institute (BFRI), Bangladesh Water Development Board (BWDB), Local Government Engineering Department (LGED) of Bangladesh, Education and Economic Development of Bangladesh, SocioConsult Limited of Bangladesh, Bangladesh Academy for Rural Development, Hoa An Biodiversity Research and Training Center-Vietnam, Can Tho University (CTU)-Vietnam, Nong Lam University (UAF)-Vietnam, An Giang University (AGU)-Vietnam, Integrated Resource Mapping Center (IRMC), Sub-National Institute for Agricultural Planning and Projection (Sub-NIAPP)-Vietnam, Southern Institute for Water Resources Planning (SIWRP)-Vietnam, Aquaculture Research Institute No. 2 (RIA2)-Vietnam, Minh Hai Sub-Institute for Fishery Research-Vietnam, Bac Lieu Provincial People’s Committee (BLPC)-Vietnam, Department of Agriculture and Rural Development (DARD) of Bac Lieu Province-Vietnam, Agricultural and Fisheries Extension Centers of Bac Lieu Province-Vietnam, and Inland Fisheries Research and Development Institute (IFRDI), Cambodia, for their excellent collaboration throughout the entire project. Special thanks are also due to all farmers and local officers in Bangladesh and Vietnam who were interviewed for the surveys and contributed to the experiments conducted under the project. Program Preface:
The Challenge Program on Water and Food (CPWF) contributes to efforts of the international community to ensure that global diversions of water to agriculture are maintained at the level of year 2000. It is a multi-institutional research initiative that aims to increase the resilience of social and ecological systems through better water management for food production. Through its broad partnerships, it conducts research thatleads to impact on the poor and to policy change. The CPWF conducts action-oriented research in nine river basins in Africa, Asia, and Latin America, focusing on crop water productivity, fisheries and aquatic ecosystems, community arrangements for sharing water, integrated river basin management, and institutions and policies for successful implementation of developments in the water-food-environment nexus. Project Preface:
Managing Water and Land Resources for Sustainable Livelihoods at the
Interface between Fresh and Saline Water Environments in Vietnam and
Bangladesh.
The main project findings are the improved production systems that integrate agriculture, aquaculture, and fisheries in the coastal zones of Bangladesh and Vietnam for enhancing livelihoods in a sustainable manner. To achieve strong impacts in these production systems, the project provided methodologies, tools, and techniques for integrated resource management at different scales: from the farm level to the water control system level and regional and national levels.
CPWF Project Report series: Each report in the CPWF Project Report series is reviewed internally by CPWF staff and researchers. The reports are published and distributed both as a hard copy and electronically at www.waterandfood.org. Reports may be copied freely and cited with due
Contents CPWF Project Report
3
acknowledgment. Before taking any action based on the information in this publication, readers are advised to seek expert professional, scientific, and technical advice. Recommended citation: Tuong TP, Hoanh CT, PN10 Project team. 2009. Managing Water and Land Resources for Sustainable Livelihoods at the Interface between Fresh and Saline Water Environments in Vietnam and Bangladesh. CPWF Project Report submitted to the Challenge Program on Water and Food (CPWF). Los Baños, Laguna, Philippines: International Rice Research Institute and Partner Organizations.
Contents CPWF Project Report
4
CONTENTS
RESEARCH HIGHLIGHTS ............................................................... 9 EXECUTIVE SUMMARY ................................................................ 11
INTRODUCTION.......................................................................... 16
Part I: PROJECT OBJECTIVES...................................................... 19
Objective 1: Enhance our understanding of livelihood changes resulting from
regional resource management and farm-level technological
interventions..........................................................................................19 1.1 Assessing socioeconomic impact of regional resource management and farm-
level technological interventions in Vietnam............................................. 19 1.2 Assessing socioeconomic impact of regional resource management and farm-
level technological interventions in Bangladesh ........................................ 26
Objective 2: Assess the impacts of agricultural and aquacultural land and
water uses on water quality, aquatic biodiversity, and inland fisheries .33 2.1 Monitoring water quality in Vietnam ....................................................... 33 2.2 Assessing aquatic biodiversity and fisheries in Vietnam ............................ 37 2.3 Assessing water quality in Bangladesh.................................................... 44
Objective 3: Develop ecologically friendly and socially acceptable techniques
for rice and rice-aquaculture production systems for domains with
different soil and water quality characteristics ......................................48 3.1 Testing and outscaling farming technologies in Vietnam ........................... 48 3.2 Testing farming technologies in Bangladesh ............................................ 52
Objective 4: Develop decision-support tools and an institutional framework
for integrated multipurpose management of a dual freshwater and
brackish-water regime ...........................................................................56 4.1 Developing a new acidity module for water quality modeling ..................... 56 4.2 Developing a Bayesian model for integrated management of aquatic resources
in Vietnam .......................................................................................... 61 4.3 Develop an institutional framework for integrated multipurpose management
of a dual freshwater and brackish-water regime in Vietnam....................... 65
Objective 5: Enhance human resource capacity and develop
recommendations for resource management at the farm and regional
level. ......................................................................................................66 5.1 Recommendations at the farm level in Vietnam and Bangladesh ................ 66 5.2 Delineating the resource management domain at regional level in Vietnam.66
Part II: OUTCOMES AND IMPACTS .............................................. 72
2.1 Summary Description of the Project’s Main Impact Pathways...............72 2.2 International Public Goods ...................................................................75
2.2.1 Methodologies and tools................................................................... 75 2.2.2 Project insights ............................................................................... 76
2.3 Partnership Achievements.....................................................................77 2.3.1 Strengthen partnership among Bangladeshi partners ........................... 77 2.3.2 Strengthen partnership among Vietnamese partners ........................... 77 2.3.3 Establish partnership between Bangladeshi and Vietnamese partners .... 77
2.4 Recommendations.................................................................................78 2.5 Publications...........................................................................................79

Contents CPWF Project Report
5
PROJECT PARTICIPANTS ............................................................ 85 BIBLIOGRAPHY .......................................................................... 88
APPENDIX: KEY PUBLICATIONS ................................................. 93
Contents CPWF Project Report
Page | 6
LIST OF TABLES
Table 1.1. Household surveys in 2000, 2003, and 2006 ........................................... 21
Table 1.2. Historical timeline of major events based on PRA ..................................... 21
Table 1.3. Profile of farm households ..................................................................... 24
Table 1.4: Distribution of working members by occupation (%) ................................ 28
Table 1.5 Costs and returns in rice cultivation in lowland (in taka)............................. 30
Table 1.6 Costs and returns in shrimp cultivation: project vs control area (Tk/ha) ....... 31
Table 2.1 Average daily acidity of runoff and seepage at different canal embankments 34
Table 3.1: Community ratings and recommendations, and profit of the tested cropping systems in the demonstration (demo) compared with farmers’ cropping systems and technologies (control) .......................................................................................... 50
Table 3.2. Yield, harvest index (HI), total irrigation water, and irrigation from canal storage for two rice varieties seeded on different dates in a 2006-07 DS crop. The 2005-06 DS crop had similar results .............................................................................. 53
Table 3.3. Production (mean±sd) of GIFT and prawn (M. rosenbergii) cultured with rice......................................................................................................................... 55
Table 4.1 Food production according to the different scenarios. Results in probability units (varying between 0 and 100%; focus on state “Good” of each variable) ............. 63
Table 4.2: Results of the model fisheries characteristics with sluice gate operation scenarios. Results in probability units varying between 0 and 100% .......................... 64
Contents CPWF Project Report
Page | 7
LIST OF FIGURES
Figure 1.2. Income sources overtime as perceived by farmers in EIZ, RIZ and MIZ. (Household income in 1996 was used as base 100%) .............................................. 22 Figure 1.3. Using diagrammatic presentation for discussion with farmers.................. 23 Figure 1.4. Location of the project and the study area in Bangladesh ....................... 27 Figure 2.1. Zoning and roving measurement site (with AS soil map is by courtesy of IRMC, (2002)...................................................................................................... 33 Figure 2.2. Runoff and bypass water collection on canal embankment ...................... 34 Figure 2.3. Variation of pH a): before rainfall (29 or 30 April); b): at the beginning of rainy season (30 May) & c): 30 June ..................................................................... 35 Figure 2.4. The average values of salinity (lines) and pH (bars) in dry season and beginning of rainy season (from 15 December to 30 June) and rainy season (15/7 to 15/11) at different zones in the study area. The pH at 30/6 is marked to discipline between two seasons. Standard Errors were calculated using pH and salinity data from 2001 to 2006...................................................................................................... 36 Figure 2.5. Location of the study area in Bac Lieu province and sampling sites .......... 37 Figure 2.6. Choreme depicting the seasonal variation of water quality factors in the study area.......................................................................................................... 39 Figure 2.7. Factorial maps of the PCA on environmental and biodiversity variables. Sites are identified by Campaign, then Month, then Zone (e.g. C2.Oct.C8000 = 2005-2006, October, Canal 8000) .......................................................................................... 41 Figure 2.8. Relationships between major environmental factors and aquatic resources in space and time ................................................................................................... 42 Figure 2.9. Factorial map of the correspondence analysis combining sites, environmental factors and species associated. Sites are identified by Campaign, then Month, then Zone, and species names are preceded by F for Fish, S for Shrimps and C for Crabs............................................................................................................ 43 Figure 2.10. Schematic map of Batiaghata upazila showing the river water and groundwater salinity monitoring sites .................................................................... 45 Figure 2.11. Schematic map of Jetua-Kanaidia polder in Tala upazila showing the river water and groundwater salinity monitoring sites ..................................................... 46 Figure 2.12. Elevation (in cm above Mean Sea Level) of the phreatic surface at drawdown (April) and recharge (August) periods as a function of the distance from the Kobadak river at Jetua-Kanaidia polder in Tala upazila of Satkhira district, Bangladesh 47 Figure 2.13. Electrical conductivity (EC) of groundwater as a function of the distance from the adjacent river at Jetua-Kanaidia polder in Tala sub-district, Bangladesh ........ 48 Figure 3.1. Irrigation water requirement from canal storage (diamond, in mm); the expected area of boro rice (x, in ha) that can be irrigated when canals are dredged according to the plan of BWDB; total boro rice production (rectangle, in tons) when canals are dredged; and boro rice production (triangle, in tons) in the present (i.e. silted) canal condition. All values correspond to the probability of exceedence of 50%, using 20-year simulation...................................................................................... 54 Figure 4.1. Simulated distribution of pHs (representing acidity propagation) on 30 June 2003, under the scenarios: (a) Control scenario: No opening of HP and GR sluices in June. (b) Opening HP and GR for the first two successive days of the week every two weeks in May and June ........................................................................................ 58 Figure 4.2. Simulated distribution of pHs (representing acidity propagation) on 30 June 2003, under the different scenarios of sluice operation in June: a. Opening the HP and GR sluices in/out for 1 day with tide every week; b. Opening the sluices along the fresh water zone (F) for drainage one day a week at the ebb tide...................................... 59 Figure 4.3. Simulated distribution of pHs (representing acidity propagation) on 30 June 2003, under the scenarios of effect of widening canals with opening HP and GR on 1 day at highest difference in tide amplitudes each week in May and June: a. scenario (W1) widening canals connected to the HP & GR sluices; b. scenario (W2) widening canals
Contents CPWF Project Report
8
connected to the HP, GR sluices and the West Sea; and c. Scenario (Wo) is the control scenario: no widening canals ................................................................................ 60 Figure 4.4. Main variables and structure of the BayFish – Bac Lieu model ................. 62 Figure 4.5. Star graph comparing the outcomes of four sluice gates management scenarios in the economic, food security and environmental dimensions. Results in probability units varying between 0 and 100%........................................................ 64 Figure 5.1. Process of RMD study........................................................................ 67 Figure 5.2. Hamlet clusters within Bac Lieu Province, based on hydrological, soil, and land-use characteristics ....................................................................................... 68 Figure 5.3. Example of 7 clusters from two variables............................................. 69 Figure 5.4. Comparison of RMD 10 clusters with different factor combinations in 2000 and 2005 ........................................................................................................... 70 Figure 5.5. Locations of experimental sites on the RMD clusters based on bio-physical factors ............................................................................................................... 71
Research Highlights CPWF Project Report
Page | 9
RESEARCH HIGHLIGHTS The project provided a wide range of findings that include an assessment of socioeconomic impacts due to regional resource management to farm-level technological interventions; assessment of impacts on water quality, aquatic biodiversity, and fisheries; establishing a regional water management framework; improved ecologically friendly and socially acceptable farming technologies; analyzing the effects of conjunctive use of groundwater and surface water; and modeling tools and techniques to analyze options in water management for diversification of farming production systems.
In Bangladesh, the project assessed the positive impact of engineering structures (embankments and polders) built by the government for salinity and flood control. Among the benefits, new high-yielding rice varieties (HYV) could be grown in the rainy season (aman). The project tested and promoted water management options and high-yielding, short-duration rice varieties for increasing rice cropping intensity. The technology increased annual rice yield more than 100% and almost doubled farmers’ benefits compared with farmers’ common practices. In more saline environments, the project has successfully improved rice-aquaculture integration in rice-shrimp systems. Salinity-tolerant rice varieties and genetically improved farm tilapia (GIFT) freshwater prawns were grown together in rice fields. The new cropping systems and appropriate technologies (water level management, pond shape and design, time and stocking densities of shrimp and prawns) could increase farmers’ net return three times compared with that of farmers cultivating monocropped rice with traditional varieties. The project also highlighted the possible use of groundwater in some areas as a source of water for sustainable irrigation. However, spatial variation in groundwater quality was large.
Aman-boro rice cropping has been adopted by thousands of farmers on a large scale. The Bangladesh Water Development Board has used the project water management technology as the cornerstone of its water management strategy for the coastal zones of Bangladesh. A paper presenting rice-aquaculture integration technologies was awarded the National Prize 2009 given by the Honorable Prime Minister at "National Fish Week 2009."
In Vietnam, the project introduced a number of improved, diversified production systems and farming practices, including rice, upland crops, fish, shrimp, and crab for different zones characterized by their land and water quality. The project also successfully promoted poly-culture technologies (raising two or more commodities in the same field and at the same time) to increase income and reduce economic risk to farmers. The project also provided options for sluice operation to control salinity and acidity to provide suitable water conditions that would enable diversified production systems (agriculture as well as brackish-water aquaculture) in different zones. The impacts of different water management options on water quality and fishery resources were investigated. A hydraulic and water quality model was refined and improved with a new module for acidity simulation, and a Bayesian model was developed to analyze the consequences of sluice-gate management for encompassing income, food security, and environmental indicators, and to highlight trade-offs among management outcomes.
The diversified and poly-culture production systems were widely disseminated by Bac Lieu provincial extension workers, and adopted by 9,000 farmers. Based on the project findings, the Bac Lieu provincial government modified its land-use plan and managed the
Research Highlights CPWF Project Report
10
water control sluices as proposed by the project. With the research findings and outcomes provided to the provinces, the project team received two awards (2005 and 2007) and many citations from the People’s Committee of Bac Lieu Province.
Executive Summary CPWF Project Report
Page | 11
EXECUTIVE SUMMARY Millions of people living in the tidal ecosystem in South and Southeast Asia are among the poorest and most food-insecure because agricultural production is hindered by seawater intrusion during the dry season. Most common management interventions fail to recognize the diversity of rural livelihoods in coastal zones, and the environmental consequences for water quality and aquatic biodiversity. By taking into account diverse stakeholder interests and complex multiscale interactions, this project carried out integrated natural resource management (INRM) research for a development program to increase land and water productivity for improved food security and livelihoods, in a manner that is environmentally sustainable and socially acceptable to various resource users at two coastal sites in the Mekong River Delta (Vietnam) and Gangetic Delta (Bangladesh). The project had five specific objectives: 1. To enhance our understanding of livelihood changes resulting from regional
resource management and farm-level technological interventions. 2. To assess the impacts of agricultural and aquacultural land and water uses on
water quality, aquatic biodiversity, and inland fisheries. 3. To develop ecologically friendly and socially acceptable techniques for rice and
rice-aquaculture production systems. 4. To develop decision-support tools and an institutional framework for integrated
multipurpose management of a dual fresh- and brackish-water regime to meet the needs of diverse water users, without an adverse impact on users and the environment outside.
5. To enhance human resource capacity and develop recommendations for resource management at the farm and regional level.
A series of multidisciplinary activities at different scales (field to regional) and with multilevel stakeholder (farmers to policymakers) participation were carried out. The outputs of the project improved food security and livelihood (higher incomes, better water quality, less conflict) for farmers, fishers, and especially poor women and children at the study sites; supplied district and provincial resource management and extension personnel with decision-making tools to better manage water resources; and provided options for land-use planning and resource management policy to policymakers at regional/national levels in Vietnam and Bangladesh. In Bangladesh, one of the most important measures to protect agricultural land from salinity intrusion and tidal flooding is the construction of polders. But the impacts of such structures have not been assessed. The project compared production systems and farmers’ economic returns inside a polder recently built by LGED with those outside the polders (control). The project found that the polders protected the environment and facilitated a change from shrimp to rice cultivation with improved high-yielding rice varieties during the dry season. This has contributed to an increase in rice production and halted the long-term negative effect of shrimp farming on the buildup of soil salinity and on livestock and forestry cultivation. With reduced flooding and overflowing during the aman season, farmers in the polder have started practicing rice-fish and rice-prawn mixed farming as an additional benefit. This project found that this shift in farming practices has occurred within the protected area but is also taking place in the control area, without protection from the embankment. Earlier, brackish-water shrimp proved immensely profitable in areas exposed to salinity, especially in comparison with returns in the alternative rice-fallow system for low-lying land. However, recent drops in shrimp prices in addition to higher mortality rates, and the experience of boro rice cultivation with groundwater irrigation, have led to a change in the system from shrimp farming to boro cultivation for such land.
Executive Summary CPWF Project Report
12
The project provided an estimate that the polder increased rice production by 44% over the benchmark level. The polder has yielded a high return to investment even under conservative assumptions of no effect of the polder on dry-season boro rice cultivation. The benefit, however, has accrued more to land-owning households than to the land-poor, leading to an increase in inequality in the distribution of rice income. The overall positive assessment of polders has influenced LGED strategies to invest more on the construction of small polders. Polder 30, located in Batiaghata Upazila in Khulna District of southwestern Bangladesh, was selected as a study site for a systems approach comprising field experiments, monitoring at different scales, and crop modeling to assess water supply and demand to outscale the aman-boro rice cropping pattern. River-water salinity of less than 4.0 dS/m from July to February in Batiaghata and Tala offers opportunities for surface-water use during aman and the first part of boro rice An experiment was carried out in the 2005-06 and 2006-07 dry seasons (DS) to quantify water required in the latter part (March and April) of boro rice when irrigation water had to be stored in the canal network within the polder. Field experiment results were used to parameterize and evaluate the crop model ORYZA2000 Simulation using 20-year climate data that showed that rice yield increased steadily as the seeding date was delayed from 15 October to 10 November at all probabilities of exceedence. The area that can be brought into boro rice cultivation declined steadily as the seeding date was delayed. The optimal seeding date, from the point of view of water productivity with respect to irrigation from storage water, is 5 November. With this seeding date, the boro rice area that can be irrigated from the storage of the present canals (i.e., silted) is 740 ha (15% of the rice area). The latter would bring an additional 9,600 t of rice to Polder 30 compared with 13,000 t now produced by the aman rice crop. This project finding was used as the basis for BWDB to invest in dredging the canals in Polder 30. For improved rice-aquaculture integration in Bangladesh, the project identified BR-23 and BRRIdhan-41 as the most suitable varieties in the shrimp-rice system. The net returns from cultivation of HYV of rice were Tk. 30,110/ha (US$1 = Tk. 68), compared with Tk. 11,690/ha from commonly used rice varieties in farmers’ fields. Integrating GIFT and prawns in rice fields further increased net returns markedly. With early prawn PL (postlarvae) stocking times (in June, before rice transplanting), net returns can be three times those of mono-rice cultivation. In Vietnam, socioeconomic surveys were carried out to assess the impact of the government’s intervention in water management with salinity control sluices. The intervention indeed succeeded in controlling saline water intrusion, and was found to have both positive and negative effects on the livelihoods of farmers. The introduction of fresh water has supported diversification of farming systems in the early intervention zone. The higher value and higher profitability of shrimp production indicate that the brackish water in coastal areas is an important resource. The most drastic changes in land use and also in livelihood outcome were observed in the recent intervention zone. As a result of saline water control regimes, farming systems in this zone shifted from a saline water–based rice-aquaculture system to intensive rice, and then shifted back to brackish-water shrimp farming. However, shifting from rice-shrimp to shrimp monoculture and then back to rice-shrimp was observed in the marginal intervention zone. The low variability of shrimp yield under the rice-shrimp system in the marginal intervention zone was much lower compared to the recent intervention and no-intervention zones. However, although the use of brackish water for shrimp farming in Bac Lieu Province has generated household income, it poses a risk and environmental hazards in both recent and marginal intervention zones. Farmers still face several problems, in particular the low yield of shrimp under present cultivation practices, and the degradation of irrigation canals. The low yield of shrimp suggests that the productivity of saline-water resources
Executive Summary CPWF Project Report
13
could be further improved by transferring suitable technologies and cultivation practices. According to farmers, most of the secondary canals need to be dredged and water management should be based on the community. Despite positive impacts, through discussions, farmers also recognized that the water management scheme in the area still follows a top-down approach. Sometimes, the sluice operation schedule did not farmers' requirement; hence, farmers suggested implementing a community-based water management practice. For the whole project area, the freshwater zone on nonacid soils, the current strategy of double-cropped rice appears to be favored by local stakeholders and no major sustainability concerns have been identified. Elsewhere, an integrated rice-shrimp system offers the best prospects for balanced and sustainable development. The net effect of government intervention in the construction of a water control system was a substantial reduction in water use at the transitional stage. The situation has improved over time as farmers and water managers gain experience with the new land-use and cropping patterns. Limited accumulation of physical capital was observed in the study areas as a result of income growth. However, improvement in the quality of human capital is limited, implying the need for more investment in education, extension, and infrastructure in these coastal areas. The monitoring data in Bac Lieu Province showed that acid pollution in the canal networks varied seasonally. The pH of the water was lowest (from 3 to 4.5) at the beginning of the rainy season and highest (from 7 to 7.5) at the end of the rainy season and during the dry season. The area of low pH (<4) was largest in 2004 (42,400 ha) and smallest in 2006, with some minor areas of acidity. The lowest pH occurred in saline areas of severe acid soil and where canal dredging/excavation occurred during the past two to three years. Dredged acid deposits on canal embankments in the study area imply a potentially dangerous source of acidity along the canals. This acidity could pollute canal water by runoff and seepage from canal embankments at the beginning of the rainy season, especially in canals 2–3 years after dredging. The aquatic resources sampled with 78 species (including 53 fish species, 16 shrimp species, and 6 crab species) show that the study site is relatively rich considering its surface area, and this biodiversity results from a succession and overlap of marine, estuarine, and freshwater faunas depending upon environmental conditions. Species richness is highest in March during the period of peak salinity when marine species make incursions into the estuarine zone. In contrast to the high species richness, our study shows that the abundance is poor, with an average catch of 55 grams in gillnets and 373 grams in trawls after 2 hours. Individual weight of fish is also low (46 grams), whereas that of shrimp is 39 grams; this indicates that shrimp are in fact mainly large prawns escaped from the aquaculture sector. Interannual variation is substantial in the study area, with a 60% difference in fish catches from year to year. Seasonal variation is also high, with a 67% difference between the months of least abundance (June and October) and the month of highest abundance (March). Spatially, there is little variation in abundance among the different sites. There is a high correlation between species richness and salinity and/or the concentration of dissolved solids, that is, with the marine influence, which is often the case in a tropical estuarine environment, where tolerant species from the rich marine realm make incursions. A clear negative correlation can also be noted between pollution (in particular in the populated and rice-growing areas) and the abundance and diversity of aquatic resources. Results also show that the Mekong flood itself does not suffice to dissolve or eliminate the pollution. In fact, it is the marine influence that is most beneficial to the abundance and diversity of aquatic resources in that area. It was clear from interviews with the local fishermen that pollution and acidity were two important factors driving fish abundance, and that pollution becomes a problem when the sluice gates remain closed for extended periods of time.
Executive Summary CPWF Project Report
14
Field studies were carried out in Vietnam to test the hypotheses that diversification and poly-culture (growing more than one crop/commodity at the same time in the same field) could contribute greatly to increased profitability and reduced risk for both rice-based and shrimp-based production systems in the coastal zone. A rice–rice&fish (in all cropping systems, the first crop refers to the dry-season crop, followed by (–) wet-season crops; “&” refers to “together with,” i.e., poly-culture) system was successfully tested and recommended for freshwater zones, and a shrimp&crab–fish system for saline-water zones. For the intermediate water quality zone, shrimp–rice&fish was recommended only for areas near the freshwater zone. Through the participation of farmers in the project experimental and demonstration farms, from May 2004 to the end of 2006, 4,300 farmers adopted the shrimp&crab–fish systems, with recommended component technologies. Approximately 3,200 farmers used rice–rice&fish in the freshwater zone. Another 1,200 farmers adopted new rice varieties, and seeding by drum seeders in other cropping systems where rice was a component. These farmers cultivated a total area of 11,500 ha. The provincial government also took into account the study’s findings and participatory recommendation in revising land-use planning for the province. The fast rate of farmers’ adoption of the tested technologies was attributed to the multilevel stakeholders’ (farmers, extension workers, local authorities, mass media) participation from the beginning (site selection) to implementation and evaluation. Wide publicity by mass media and endorsement by district and provincial authorities were pivotal in enabling extension workers to obtain adequate resources for disseminating the recommended cropping systems and component technologies. With an aim to reduce acidic pollution caused by acid sulfate soils and to manage its propagation, systems approaches integrating large-scale water quality monitoring, multisite field experiments, process-based laboratory studies, GIS-based analysis, and modeling were used to quantify acid loading from land to the environment and to develop a model that can simulate the temporal and spatial changes in pH (as an indicator of acidity) at a regional scale. The simulation results agreed well with monitoring data. The model was used to assess the impact of different water management and canal-dredging scenarios on acidic pollution of the study area. The results helped the provincial government in its decisions on water management developments. As a tool allowing the integration of expert knowledge, databases, and model output data, BayFish–Bac Lieu has proved to be a platform illustrating the usefulness of a Bayesian approach in planning and managing natural resources. Unlike dynamic environmental models, Bayesian networks allow the analysis of the consequences of sluice-gate management to encompass income, food security, or environmental dimensions. In conclusion, the modeling approach presented also highlights the trade-offs between management outcomes, highlighting the need for clear identification of the political choices driving environmental management. A need to formulate a regional water management alliance for the coordination of salinity control in the region was identified and the project helped the provinces to initiate this alliance. It operated smoothly during 2002-06, when water management policy was changed from only support to rice production to diversification with brackish-water resources. However, when this operational alliance was converted into an official government body of the region, it became a river basin organization imposed and controlled by the central government that does not work well. However, it still operates in a certain form, at both provincial and department levels, because of the real need for cooperation for salinity control while waiting for government solutions. Finally, resource management domain analysis provides a means of organizing relevant information for some natural resource use and management purposes. This concept lended itself well to delineating domains that reflected the influence of key environmental factors on land-use changes in the part of Bac Lieu Province that was
Executive Summary CPWF Project Report
15
targeted for salinity protection. The results, interpreted at a broader scale, supported the identification of land-use and water management zones to accommodate rice-based, combined shrimp- and rice-based, and shrimp-based production systems in the area, thereby reversing an earlier policy of intensifying rice cultivation through full salinity exclusion. In summary, the project findings improved production systems that integrate agriculture, aquaculture, and fisheries in the coastal zones of Bangladesh and Vietnam for enhancing livelihoods in a sustainable manner. To achieve the great impacts of these production systems, the project provided methodologies, decision-support tools for analyzing the interactions among different components, and different spatial and temporal scales to ensure stakeholders’ full participation.
Introduction CPWF Project Report
16
INTRODUCTION
Millions of people living in the tidal ecosystem in South and Southeast Asia are among the poorest and most food-insecure. Because agricultural production is hindered by seawater intrusion during the dry season, one common strategy is to construct embankments and install sluice gates to keep out saline water. This strategy, however, fails to recognize the diversity of rural livelihoods in coastal zones and the environmental consequences for water quality and aquatic biodiversity. Farmers who rely on brackish-water resources resent the strategy. In some cases, farmers destroy the embankments and sluices to get saline water for shrimp (Penaeus monodon) farming, which, in turn, leads to social and environmental disruptions (Government of Bangladesh 1997). The conflict among different resource uses at the interface between fresh and saline water is common in deltaic coastal areas of Asia (Brown 1997). The magnitude, severity, and complexity of the conflict can be represented by examples from Vietnam and Bangladesh. In the Mekong River Delta (MRD) of Vietnam, the emphasis on rice in the 1990s created an imperative to control saline intrusion into the coastal zone, which was realized through the construction of major engineering works over an extended period (1994-2000). This, as shown by the DFID-R7467c project (Kam et al 2001, Tuong et al 2003), increased rice production, but at the cost of environmental degradation and livelihood deterioration for many poor people in Bac Lieu Province. This province covers approximately 160,000 hectares in the Quan Lo Phung Hiep water control project. The first sluice of the project became operational in 1994 and the area protected from saltwater intrusion gradually expanded westward as successive sluices were completed up to 2000. Within the protected area, the duration of freshwater conditions was extended in line with the policy to promote double or triple cropping of rice. The policy can be criticized (with the benefit of hindsight) because it failed to recognize the diversity of livelihoods of the population within the project area and did not give adequate consideration to the environmental impact. In particular, the importance of fisheries and aquaculture was neglected. The problem was exacerbated by the presence of extensive deposits of acid-sulfate soils (ASS), particularly in the western part of the project area. Changes in water chemistry due to excavation of canals (Tuong et al 1998, 2003) and exploitation of fallow land for agriculture (Xuan 1993) then resulted in reduced aquatic biodiversity, including fish and shrimp (Chairuddin et al 1990), which constitute important protein sources as well as an income source for the rural poor. Nevertheless, the original policy was that these problem soils would be developed for rice farming. However, as the freshwater zone spread gradually westward, the local economy was undergoing rapid change. Profitability of the rice crop fell sharply and at the same time aquaculture was experiencing a dramatic boom fueled by technical innovations and the high local and export price of tiger shrimp (Penaeus monodon). Traditional extensive systems of shrimp production based on natural recruitment of shrimp larvae were being replaced by semi-intensive monoculture production systems (Brennan et al 2000). By 1998, tiger shrimp culture was widespread in the western part of the project area and this was consistent with the official policy adopted in that year, which explicitly encouraged production for export using more intensive methods. Despite the apparent success and popularity of shrimp farming and its endorsement in the 2001-06 Fisheries Five-Year Plan, tidal sluices continued to be built and the freshwater zone continued to spread westward. When the supply of brackish water required for shrimp production was cut off, many farmers were forced to abandon aquaculture and to convert to less profitable rice farming. Some shrimp farmers resisted and attempted to maintain
Introduction CPWF Project Report
17
favorable conditions by blocking secondary canals and pumping brackish water into their fields, but this created conflict with rice farmers, who depended on fresh water to irrigate their fields. The conflict reached a peak in February 2001 when shrimp farmers destroyed a major dam at the Lang Tram sluice to let salt water flow into the region. This event prompted the government to re-examine the original policy emphasizing rice production and to explore alternative land-use plans that would accommodate shrimp cultivation in the western part while maintaining the areas of intensive rice production in the eastern part. An urgent question raised by the local authorities was how to operate the sluice system to simultaneously maintain both brackish-water and freshwater conditions in different parts of the project area. A review of alternatives was conducted following an Analytical Process to Support Water Policy Changes (APWPC) under the DFID-R7467c project implemented by IRRI, IWMI, WorldFish Center, and the Vietnamese collaborators in 2000-03. Provincial authorities have used the DFID project findings to adjust land-use plans, moving away from monoculture rice production to shrimp and rice-shrimp culture (Hoanh et al 2003). Stakeholders attending the DFID-R7467c project review workshop in Vietnam in 2002, while acknowledging that project’s contribution, requested that further research be done to achieve sustainable rural development in the coastal zone. In the Gangetic Delta (GD) of Bangladesh, coastal polder projects (started in the 1960s and completed in the ‘70s) improved the productivity and stability of rice-based agriculture in the coastal lands. The need for brackish water was realized in the early 1980s with the introduction of commercial shrimp cultivation. The shrimp industry brought much-needed foreign currency to the country. But it was also widely believed to have created social conflicts among the rich gher owners who rented land for shrimp culture and the poor small and marginal landowners of adjacent areas who were often forced to rent out land. It also had adverse effects on social forestry, livestock holdings, and employment opportunities for the landless and poor women (Rahman 1995). Though evidence of those alleged negative effects is qualitative in nature, government organizations and civil groups (including NGOs) felt the need to improve resource-poor farmers’ livelihood through intensification of agricultural land uses and to halt the alienation of their land for shrimp farming. The PETRRA (Poverty Elimination Through Rice Research Assistance 2000) Project and LGED (Local Government Engineering Department) started investigating some technologies to increase agricultural production. The Jethua-Kanaidia FCDI subproject, in Khulna Division of Southwestern Bangladesh, was purposely selected as a representative case of small polders constructed by the LGED. A polder was constructed during 2000-01, encompassing an area of 1,005 ha with a benefited area of 689 ha. The project involved constructing an embankment of 14.13 km, irrigation and drainage canals of 2.89 km, and four regulators. The total cost of the project was Taka 19.8 million (US$0.29 million), of which 45% was for the construction of embankments and canals, which involved mostly earth work. It was projected that 595 out of 1,055 households within the project command area would benefit from the project. These examples show that the environment and resource use in coastal lands are very sensitive to external interventions, of which economics is one of the main driving forces. The effects of resource-use intervention on farmers’ livelihoods may vary with soil and water characteristics that influence resource endowment and farming activities. We hypothesize that, to achieve sustainable rural development in coastal zones, it is essential to take into account diverse stakeholder interests and complex upstream-downstream interactions, within and outside the saline-protected area. An in-depth analysis of environmental and
Introduction CPWF Project Report
18
socioeconomic impacts of land and water resource interventions, taking into account these interactions, is needed. Our project proposes to test the above hypothesis with a systematic research program to enhance livelihood via sustainable land and water resource management in the MRD and GD coastal areas. The project aims at benefiting (1) farmers and fishers, especially the poor at the study sites and in other coastal zones of Vietnam and Bangladesh; (2) local (district and provincial) resource management and extension personnel; (3) land-use planners and policymakers at regional/national levels in Vietnam and Bangladesh; and (4) national and international researchers, as will be described in later sections.
Objectives CPWF Project Report
19
Part I: PROJECT OBJECTIVES The project had five specific objectives:
1. To enhance our understanding of livelihood changes resulting from regional resource management and farm-level technological interventions.
2. To assess the impacts of agricultural and aquacultural land and water uses on water quality, aquatic biodiversity, and inland fisheries.
3. To develop ecologically friendly and socially acceptable techniques for rice and rice-aquaculture production systems for domains with different soil and water quality characteristics.
4. To develop decision-support tools and an institutional framework for integrated multipurpose management of a dual freshwater and brackish-water regime to meet the needs of diverse water users, without an adverse impact on users and the environment outside.
5. To enhance human resource capacity and develop recommendations for resource management at the farm and regional level.
Objective 1: Enhance our understanding of livelihood changes
resulting from regional resource management and farm-level
technological interventions
1.1 Assessing socioeconomic impact of regional resource management and
farm-level technological interventions in Vietnam
Methodology
Two groups of methods were applied in socioeconomic impact assessment in Vietnam:
(i) The participatory rural appraisal (PRA) (or focus group discussion, FGD) method and the community identified significant change (CISC) tool were employed. CISC is a method to engage community people in identifying and analyzing significant changes in their lives and how these changes are linked to development interventions from within and/or outside their community. This method was introduced by the International Institute of Rural Reconstruction (Shayamal and Orly 2006).
(ii) The sustainable livelihoods framework (SLF) was used as the framework to study the change in livelihood systems and dynamics of poverty. This study extends the scope of time by using data generated from repeated surveys in 2000, 2003, and 2006 of the same set of households selected in 2000 under the previous DFID-R7467c project. Household physical capacity was represented by land ownership and size of landholding, and value of and access to assets such as TV, radio, rowboat, motorboat, and tiller/pump/thresher. Human capital was represented by the number of workers available per household, and age and main occupation of the household head. Livelihood system dynamics and strategies were represented as total and changes in household income; contribution to total household income from rice, shrimp, other aquaculture, livestock, employment, and capture fisheries; and remittances from relatives and other funds.
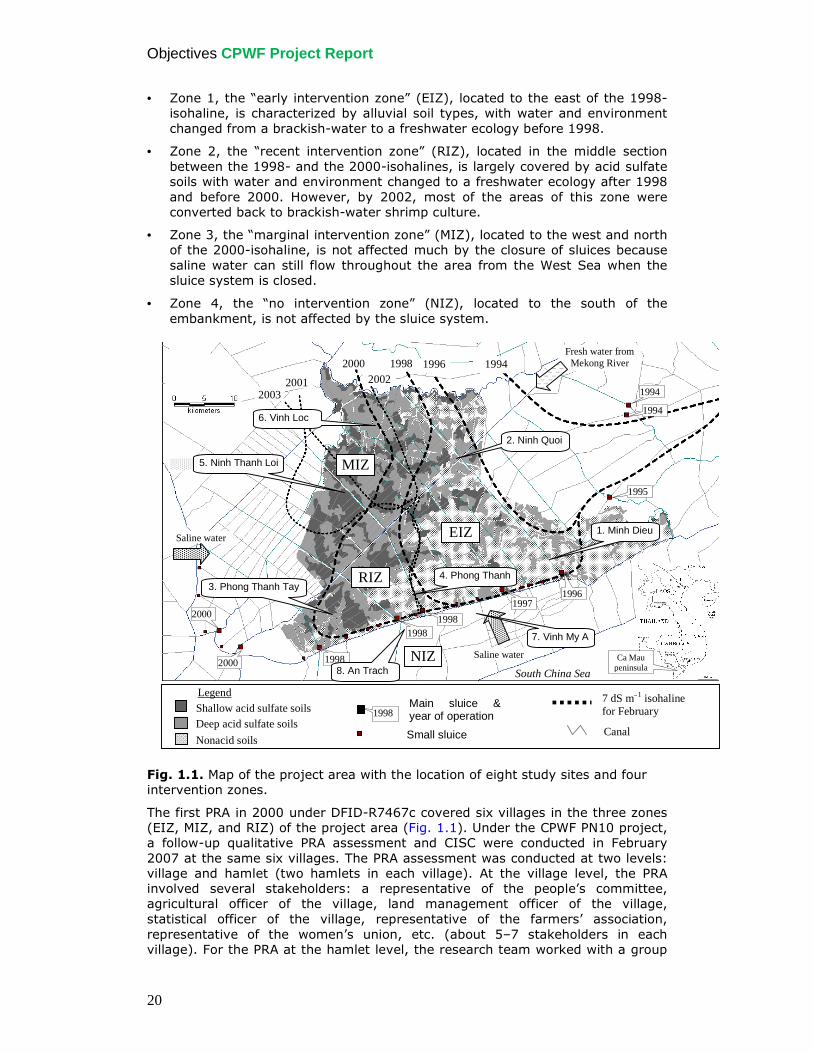
Based on soil types and the time since canal water has become fresh, the project area was classified into four zones (Hossain et al 2006) (Fig. 1.1):
Objectives CPWF Project Report
20
• Zone 1, the “early intervention zone” (EIZ), located to the east of the 1998-isohaline, is characterized by alluvial soil types, with water and environment changed from a brackish-water to a freshwater ecology before 1998.
• Zone 2, the “recent intervention zone” (RIZ), located in the middle section between the 1998- and the 2000-isohalines, is largely covered by acid sulfate soils with water and environment changed to a freshwater ecology after 1998 and before 2000. However, by 2002, most of the areas of this zone were converted back to brackish-water shrimp culture.
• Zone 3, the “marginal intervention zone” (MIZ), located to the west and north of the 2000-isohaline, is not affected much by the closure of sluices because saline water can still flow throughout the area from the West Sea when the sluice system is closed.
• Zone 4, the “no intervention zone” (NIZ), located to the south of the embankment, is not affected by the sluice system.
Fig. 1.1. Map of the project area with the location of eight study sites and four intervention zones.
The first PRA in 2000 under DFID-R7467c covered six villages in the three zones (EIZ, MIZ, and RIZ) of the project area (Fig. 1.1). Under the CPWF PN10 project, a follow-up qualitative PRA assessment and CISC were conducted in February 2007 at the same six villages. The PRA assessment was conducted at two levels: village and hamlet (two hamlets in each village). At the village level, the PRA involved several stakeholders: a representative of the people’s committee, agricultural officer of the village, land management officer of the village, statistical officer of the village, representative of the farmers’ association, representative of the women’s union, etc. (about 5–7 stakeholders in each village). For the PRA at the hamlet level, the research team worked with a group
Fresh water from Mekong River
1994
1995
1996 1997
2000
2000
1998
2000 1998 1996 1994
1998 1998
South China Sea
Saline water
Saline water
1994
2001 2002 2003
Ca Mau peninsula
Legend
Canal
1998
7 dS m–1 isohaline for February Deep acid sulfate soils
Nonacid soils
Shallow acid sulfate soils Main sluice & year of operation Small sluice
EIZ
MIZ
RIZ
NIZ
6. Vinh Loc
1. Minh Dieu
2. Ninh Quoi
4. Phong Thanh 3. Phong Thanh Tay
5. Ninh Thanh Loi
7. Vinh My A
8. An Trach
Objectives CPWF Project Report
21
of key informant panel (KIP) members, about 10–15 stakeholders, including the hamlet leader, farmers, shrimp seed producers, etc.
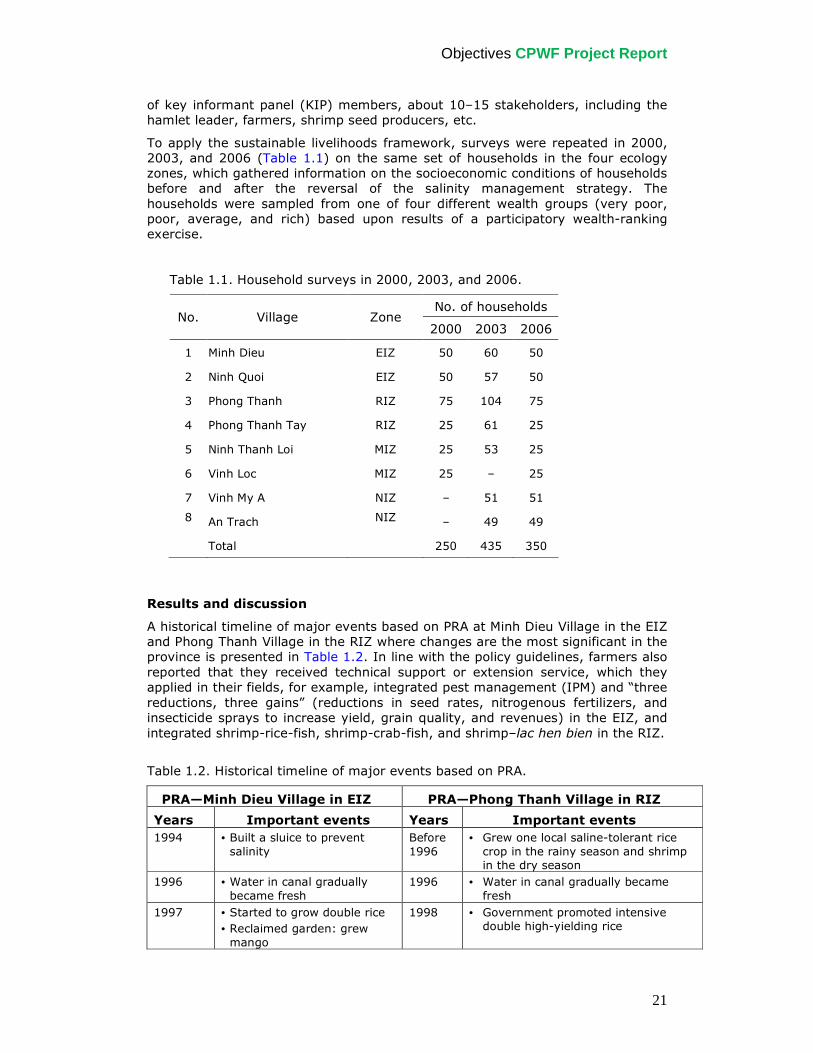
To apply the sustainable livelihoods framework, surveys were repeated in 2000, 2003, and 2006 (Table 1.1) on the same set of households in the four ecology zones, which gathered information on the socioeconomic conditions of households before and after the reversal of the salinity management strategy. The households were sampled from one of four different wealth groups (very poor, poor, average, and rich) based upon results of a participatory wealth-ranking exercise.
Table 1.1. Household surveys in 2000, 2003, and 2006.
No. of households No. Village Zone
2000 2003 2006
1 Minh Dieu EIZ 50 60 50
2 Ninh Quoi EIZ 50 57 50
3 Phong Thanh RIZ 75 104 75
4 Phong Thanh Tay RIZ 25 61 25
5 Ninh Thanh Loi MIZ 25 53 25
6 Vinh Loc MIZ 25 – 25
7 Vinh My A NIZ – 51 51
8 An Trach NIZ – 49 49
Total 250 435 350
Results and discussion
A historical timeline of major events based on PRA at Minh Dieu Village in the EIZ and Phong Thanh Village in the RIZ where changes are the most significant in the province is presented in Table 1.2. In line with the policy guidelines, farmers also reported that they received technical support or extension service, which they applied in their fields, for example, integrated pest management (IPM) and “three reductions, three gains” (reductions in seed rates, nitrogenous fertilizers, and insecticide sprays to increase yield, grain quality, and revenues) in the EIZ, and integrated shrimp-rice-fish, shrimp-crab-fish, and shrimp–lac hen bien in the RIZ.
Table 1.2. Historical timeline of major events based on PRA.
PRA—Minh Dieu Village in EIZ PRA—Phong Thanh Village in RIZ
Years Important events Years Important events
1994 • Built a sluice to prevent salinity
Before 1996
• Grew one local saline-tolerant rice crop in the rainy season and shrimp in the dry season
1996 • Water in canal gradually became fresh
1996 • Water in canal gradually became fresh
1997 • Started to grow double rice • Reclaimed garden: grew mango
1998 • Government promoted intensive double high-yielding rice
Objectives CPWF Project Report
22
• Grew upland crop: maize, cucumber, watermelon
1999 • Started to grow triple rice 2001 • Shrimp farmers destroyed Lang Tram dam to get salt water for shrimp farming
• Policy revised to accommodate extensive shrimp cultivation in RIZ and MIZ and intensive rice in EIZ
2001 • Applied integrated pest management on rice
2002 • Applied semi-intensive tiger shrimp rearing
2002-2003
• Applied row seeding • Applied 3 reductions, 3 gains (ba giam, ba tang) technique
2002-2003
• Applied reduced stocking density and improved pond management for tiger shrimp cultivation
2004 • Practiced rice-fish system 2004 • Applied integrated shrimp-rice plus fish, shrimp plus crab and fish, shrimp–lac hen bien (Scirpus littoralis Schrab) for handicraft making
2006 • Some damage by brown planthopper and diseases to rice crop
2006-07 • Good harvest of rice
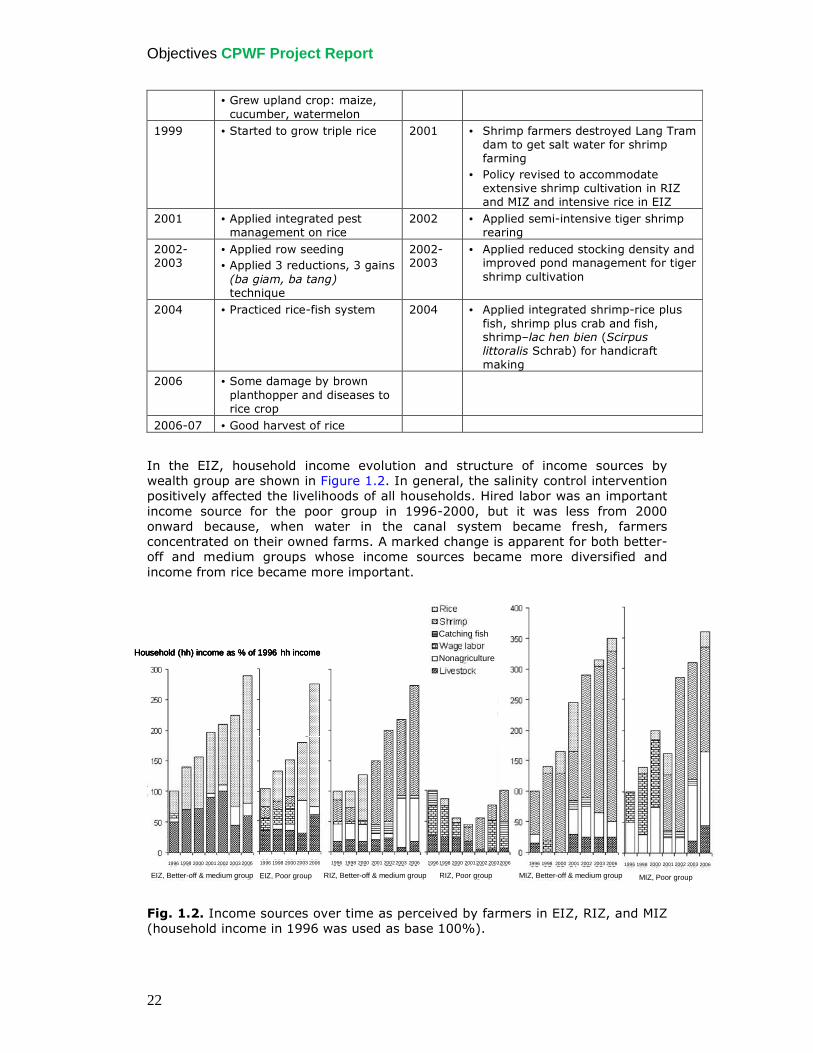
In the EIZ, household income evolution and structure of income sources by wealth group are shown in Figure 1.2. In general, the salinity control intervention positively affected the livelihoods of all households. Hired labor was an important income source for the poor group in 1996-2000, but it was less from 2000 onward because, when water in the canal system became fresh, farmers concentrated on their owned farms. A marked change is apparent for both better-off and medium groups whose income sources became more diversified and income from rice became more important.
Fig. 1.2. Income sources over time as perceived by farmers in EIZ, RIZ, and MIZ (household income in 1996 was used as base 100%).
NonagricultureHousehold (hh) income as % of 1996 hh income
EIZ, Better-ff & medium group EIZ, Poor group RIZ, Better-ff & medium group RIZ, Poor group MIZ, Better-ff & medium group MIZ, Poor group
1996 1998 2000 2001 2002 2003 2006 1996 1998 2000 2003 2006 1996 1998 2000 2001 2002 2003 2006 1996 1998 2000 2001 2002 20032006 1996 1998 2000 2001 2002 2003 2006 1996 1998 2000 2001 2002 2003 2006
NonagricultureNonagricultureHousehold (hh) income as % of 1996 hh income
EIZ, Better-off & medium group EIZ, Poor group RIZ, Better-off & medium group RIZ, Poor group MIZ, Better-off & medium group MIZ, Poor group
1996 1998 2000 2001 2002 2003 2006 1996 1998 2000 2003 2006 1996 1998 2000 2001 2002 2003 2006 1996 1998 2000 2001 2002 20032006 1996 1998 2000 2001 2002 2003 2006 1996 1998 2000 2001 2002 2003 2006
Catching fish
Objectives CPWF Project Report
23
In the RIZ, farmers claimed that the salinity control intervention had a negative impact on the livelihood of poor households in this area. The poor often lacked access to land and their livelihoods were heavily dependent upon wage labor and catching natural fish and shrimp in the saline canal water. The poor group reported that they could not keep up with new technologies and lacked money to invest in appropriate technologies of new rice varieties or shrimp cultivation. In contrast, the medium and better-off farmers indicated that the intervention had a positive effect because they could apply new technologies and invest in adopting technologies of shrimp growing. Rearing of shrimp became the most important source of income for medium farmers, resulting in increased income generation for the household. However, farmers also argued that rearing shrimp in this area had a high risk factor associated with it and there were environmental consequences.
In the MIZ, many farmers practiced one or two shrimp crops in the dry season, rotated with one traditional rice crop in the rainy season, and this shrimp-rice system proved to be sustainable. Farmers also successfully practiced integrated shrimp production with crab and fish. Household income increased in both the medium and poor groups from 1996 to 2006 (Fig. 1.2). Shrimp rearing became the most important source of household income, particularly for the medium group. Farmers also acknowledged that brackish-water aquaculture generated an opportunity for farmers to diversify their incomes with less investment.
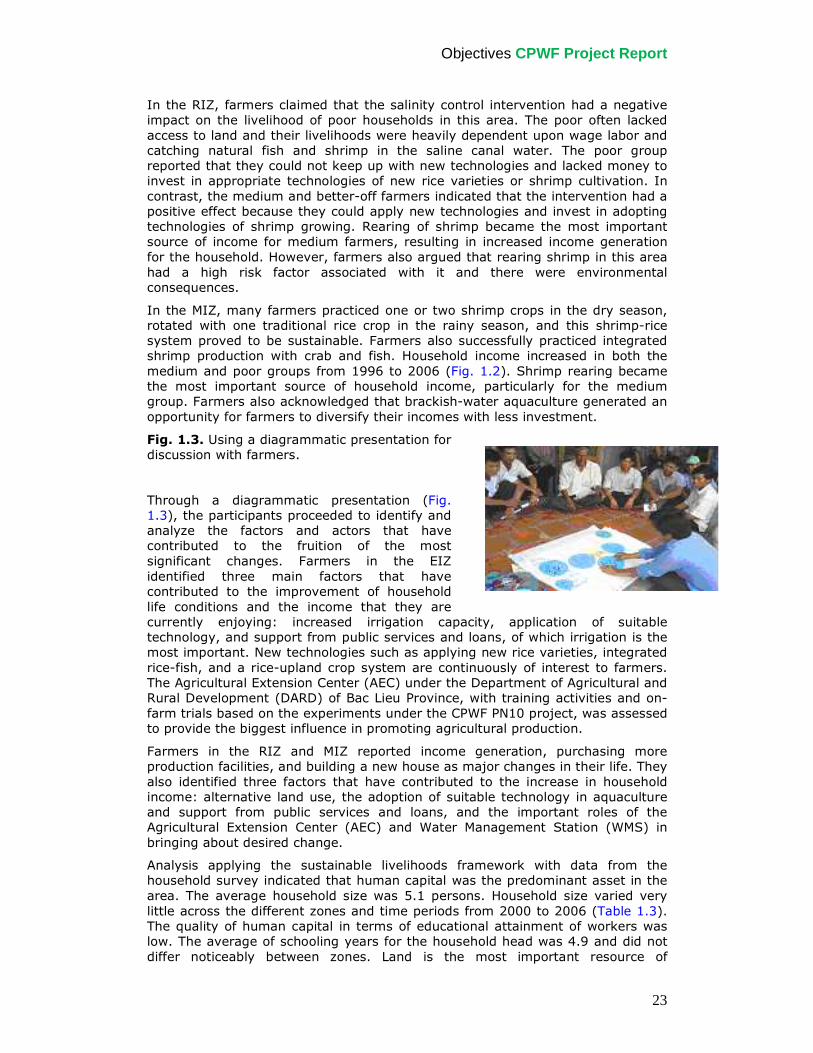
Fig. 1.3. Using a diagrammatic presentation for discussion with farmers.
Through a diagrammatic presentation (Fig. 1.3), the participants proceeded to identify and analyze the factors and actors that have contributed to the fruition of the most significant changes. Farmers in the EIZ identified three main factors that have contributed to the improvement of household life conditions and the income that they are currently enjoying: increased irrigation capacity, application of suitable technology, and support from public services and loans, of which irrigation is the most important. New technologies such as applying new rice varieties, integrated rice-fish, and a rice-upland crop system are continuously of interest to farmers. The Agricultural Extension Center (AEC) under the Department of Agricultural and Rural Development (DARD) of Bac Lieu Province, with training activities and on-farm trials based on the experiments under the CPWF PN10 project, was assessed to provide the biggest influence in promoting agricultural production.
Farmers in the RIZ and MIZ reported income generation, purchasing more production facilities, and building a new house as major changes in their life. They also identified three factors that have contributed to the increase in household income: alternative land use, the adoption of suitable technology in aquaculture and support from public services and loans, and the important roles of the Agricultural Extension Center (AEC) and Water Management Station (WMS) in bringing about desired change.
Analysis applying the sustainable livelihoods framework with data from the household survey indicated that human capital was the predominant asset in the area. The average household size was 5.1 persons. Household size varied very little across the different zones and time periods from 2000 to 2006 (Table 1.3). The quality of human capital in terms of educational attainment of workers was low. The average of schooling years for the household head was 4.9 and did not differ noticeably between zones. Land is the most important resource of
Objectives CPWF Project Report
24
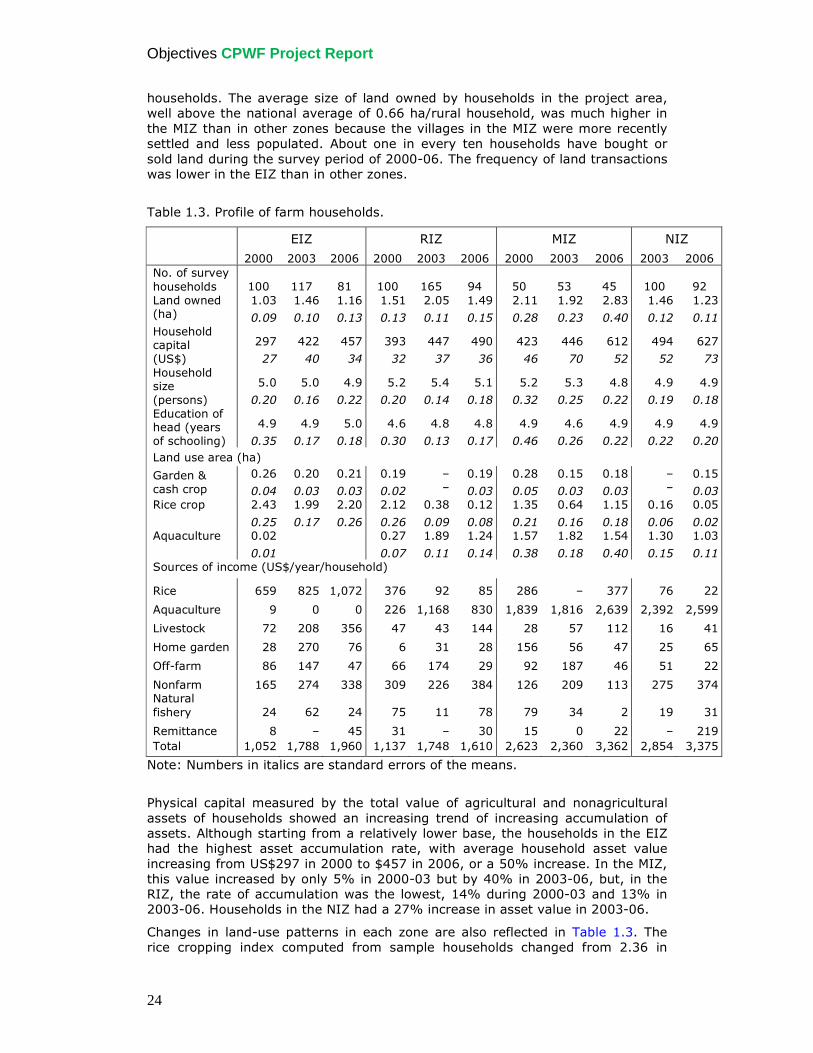
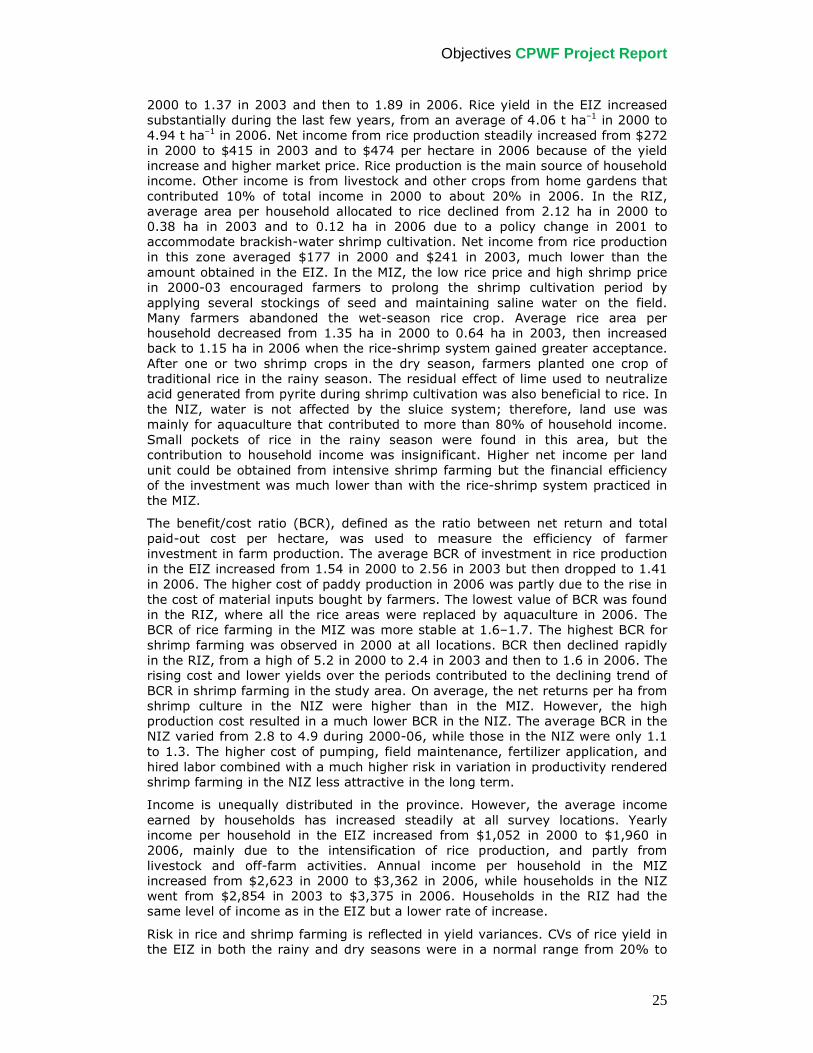
households. The average size of land owned by households in the project area, well above the national average of 0.66 ha/rural household, was much higher in the MIZ than in other zones because the villages in the MIZ were more recently settled and less populated. About one in every ten households have bought or sold land during the survey period of 2000-06. The frequency of land transactions was lower in the EIZ than in other zones.
Table 1.3. Profile of farm households.
EIZ RIZ MIZ NIZ
2000 2003 2006 2000 2003 2006 2000 2003 2006 2003 2006 No. of survey households 100 117 81 100 165 94 50 53 45 100 92 Land owned (ha)
1.03
0.09
1.46
0.10
1.16
0.13
1.51
0.13
2.05
0.11
1.49
0.15
2.11
0.28
1.92
0.23
2.83
0.40
1.46
0.12
1.23
0.11 Household capital (US$)
297
27
422
40
457
34
393
32
447
37
490
36
423
46
446
70
612
52
494
52
627
73 Household size (persons)
5.0
0.20
5.0
0.16
4.9
0.22
5.2
0.20
5.4
0.14
5.1
0.18
5.2
0.32
5.3
0.25
4.8
0.22
4.9
0.19
4.9
0.18 Education of head (years of schooling)
4.9
0.35
4.9
0.17
5.0
0.18
4.6
0.30
4.8
0.13
4.8
0.17
4.9
0.46
4.6
0.26
4.9
0.22
4.9
0.22
4.9
0.20
Land use area (ha)
Garden & cash crop
0.26
0.04
0.20
0.03
0.21
0.03
0.19
0.02
– –
0.19
0.03
0.28
0.05
0.15
0.03
0.18
0.03
– –
0.15
0.03 Rice crop 2.43
0.25
1.99
0.17
2.20
0.26
2.12
0.26
0.38
0.09
0.12
0.08
1.35
0.21
0.64
0.16
1.15
0.18
0.16
0.06
0.05
0.02 Aquaculture 0.02
0.01
0.27
0.07
1.89
0.11
1.24
0.14
1.57
0.38
1.82
0.18
1.54
0.40
1.30
0.15
1.03
0.11 Sources of income (US$/year/household)
Rice 659 825 1,072 376 92 85 286 – 377 76 22
Aquaculture 9 0 0 226 1,168 830 1,839 1,816 2,639 2,392 2,599
Livestock 72 208 356 47 43 144 28 57 112 16 41
Home garden 28 270 76 6 31 28 156 56 47 25 65
Off-farm 86 147 47 66 174 29 92 187 46 51 22
Nonfarm 165 274 338 309 226 384 126 209 113 275 374 Natural fishery 24 62 24 75 11 78 79 34 2 19 31
Remittance 8 – 45 31 – 30 15 0 22 – 219 Total 1,052 1,788 1,960 1,137 1,748 1,610 2,623 2,360 3,362 2,854 3,375
Note: Numbers in italics are standard errors of the means.
Physical capital measured by the total value of agricultural and nonagricultural assets of households showed an increasing trend of increasing accumulation of assets. Although starting from a relatively lower base, the households in the EIZ had the highest asset accumulation rate, with average household asset value increasing from US$297 in 2000 to $457 in 2006, or a 50% increase. In the MIZ, this value increased by only 5% in 2000-03 but by 40% in 2003-06, but, in the RIZ, the rate of accumulation was the lowest, 14% during 2000-03 and 13% in 2003-06. Households in the NIZ had a 27% increase in asset value in 2003-06.
Changes in land-use patterns in each zone are also reflected in Table 1.3. The rice cropping index computed from sample households changed from 2.36 in
Objectives CPWF Project Report
25
2000 to 1.37 in 2003 and then to 1.89 in 2006. Rice yield in the EIZ increased substantially during the last few years, from an average of 4.06 t ha–1 in 2000 to 4.94 t ha–1 in 2006. Net income from rice production steadily increased from $272 in 2000 to $415 in 2003 and to $474 per hectare in 2006 because of the yield increase and higher market price. Rice production is the main source of household income. Other income is from livestock and other crops from home gardens that contributed 10% of total income in 2000 to about 20% in 2006. In the RIZ, average area per household allocated to rice declined from 2.12 ha in 2000 to 0.38 ha in 2003 and to 0.12 ha in 2006 due to a policy change in 2001 to accommodate brackish-water shrimp cultivation. Net income from rice production in this zone averaged $177 in 2000 and $241 in 2003, much lower than the amount obtained in the EIZ. In the MIZ, the low rice price and high shrimp price in 2000-03 encouraged farmers to prolong the shrimp cultivation period by applying several stockings of seed and maintaining saline water on the field. Many farmers abandoned the wet-season rice crop. Average rice area per household decreased from 1.35 ha in 2000 to 0.64 ha in 2003, then increased back to 1.15 ha in 2006 when the rice-shrimp system gained greater acceptance. After one or two shrimp crops in the dry season, farmers planted one crop of traditional rice in the rainy season. The residual effect of lime used to neutralize acid generated from pyrite during shrimp cultivation was also beneficial to rice. In the NIZ, water is not affected by the sluice system; therefore, land use was mainly for aquaculture that contributed to more than 80% of household income. Small pockets of rice in the rainy season were found in this area, but the contribution to household income was insignificant. Higher net income per land unit could be obtained from intensive shrimp farming but the financial efficiency of the investment was much lower than with the rice-shrimp system practiced in the MIZ.
The benefit/cost ratio (BCR), defined as the ratio between net return and total paid-out cost per hectare, was used to measure the efficiency of farmer investment in farm production. The average BCR of investment in rice production in the EIZ increased from 1.54 in 2000 to 2.56 in 2003 but then dropped to 1.41 in 2006. The higher cost of paddy production in 2006 was partly due to the rise in the cost of material inputs bought by farmers. The lowest value of BCR was found in the RIZ, where all the rice areas were replaced by aquaculture in 2006. The BCR of rice farming in the MIZ was more stable at 1.6–1.7. The highest BCR for shrimp farming was observed in 2000 at all locations. BCR then declined rapidly in the RIZ, from a high of 5.2 in 2000 to 2.4 in 2003 and then to 1.6 in 2006. The rising cost and lower yields over the periods contributed to the declining trend of BCR in shrimp farming in the study area. On average, the net returns per ha from shrimp culture in the NIZ were higher than in the MIZ. However, the high production cost resulted in a much lower BCR in the NIZ. The average BCR in the NIZ varied from 2.8 to 4.9 during 2000-06, while those in the NIZ were only 1.1 to 1.3. The higher cost of pumping, field maintenance, fertilizer application, and hired labor combined with a much higher risk in variation in productivity rendered shrimp farming in the NIZ less attractive in the long term.
Income is unequally distributed in the province. However, the average income earned by households has increased steadily at all survey locations. Yearly income per household in the EIZ increased from $1,052 in 2000 to $1,960 in 2006, mainly due to the intensification of rice production, and partly from livestock and off-farm activities. Annual income per household in the MIZ increased from $2,623 in 2000 to $3,362 in 2006, while households in the NIZ went from $2,854 in 2003 to $3,375 in 2006. Households in the RIZ had the same level of income as in the EIZ but a lower rate of increase.
Risk in rice and shrimp farming is reflected in yield variances. CVs of rice yield in the EIZ in both the rainy and dry seasons were in a normal range from 20% to
Objectives CPWF Project Report
26
30%. Extremely high variations, 110–120% in rice yield, were noted in the RIZ, where conditions of acid sulfate soils negatively affected the rice crop. CVs of shrimp yield were much larger in the NIZ (180–340%) and the RIZ (180–190%) than in the MIZ (80–90%).
Conclusions
The government intervention in water management succeeded in controlling saline-water intrusion. Such salinity control had both positive and negative effects on the livelihoods of farmers. The introduction of fresh water has supported diversification of farming systems in the EIZ. The higher value and higher profitability of shrimp production indicate that the brackish water in the coastal area is an important resource. The most drastic changes in land use and also in livelihood outcomes were observed in the RIZ. As a result of saline-water control regimes, farming systems in this zone shifted from a saline water–based rice-aquaculture system to intensive rice and then shifted back to brackish-water shrimp farming. However, shifting from rice-shrimp to shrimp monoculture, and then back to rice-shrimp, was observed in the MIZ. The low variability of shrimp yield under the rice-shrimp system in the MIZ was much lower than in the RIZ and NIZ.
The use of brackish water for shrimp farming has generated household income but it poses a risk and environmental hazards in both the RIZ and MIZ. Farmers still face several problems, in particular the low yield of shrimp under present cultivation practices and the degradation of irrigation canals. The low yield of shrimp suggests that the productivity of saline water resources could be further improved by transferring suitable technologies and cultivation practices. According to farmers, most of the secondary canals need to be dredged and the management of water resources should be based on the community. Despite positive impacts, through the discussions, farmers also recognized that the water management scheme in the area still uses a top-down approach. Sometimes, the sluice operation schedule did not fit the farmers’ requirement; hence, farmers suggested implementing community-based water management practices.
For the whole project area, the freshwater zone on nonacid soils, the current strategy of double-cropped rice appears to be favored by local stakeholders and no major sustainability concerns have been identified. Elsewhere, an integrated rice-shrimp system offers the best prospects for balanced and sustainable development (Gowing et al 2006b). The net effect of the government intervention in the construction of a water control system was a substantial reduction at the transitional stage. The situation has improved over time as farmers and water managers gain experience with the new land-use and cropping patterns. Limited accumulation of physical capital was observed in the study areas as a result of income growth. However, improvement in the quality of human capital is limited, implying a need for more investment in education, extension, and infrastructure in these coastal areas.
1.2 Assessing socioeconomic impact of regional resource management and
farm-level technological interventions in Bangladesh
Methodologies
The ideal methodology for socioeconomic assessment of the Jethua-Kanaidia FCDI subproject would be comparisons between the “before” and “after” situations for both the polder project and the control area (“with-without”) in order to (a) dissociate autonomous changes that occur over time and to (b) identify possible differences between the polder project and control area before the intervention.
Objectives CPWF Project Report
27
However, no preproject benchmark data were available for either the polder project or control areas in this study. Consequentially, there was no alternative but to assess the effects of the polder by comparing the two areas during the period of evaluation, that is, through “with-without” comparisons.
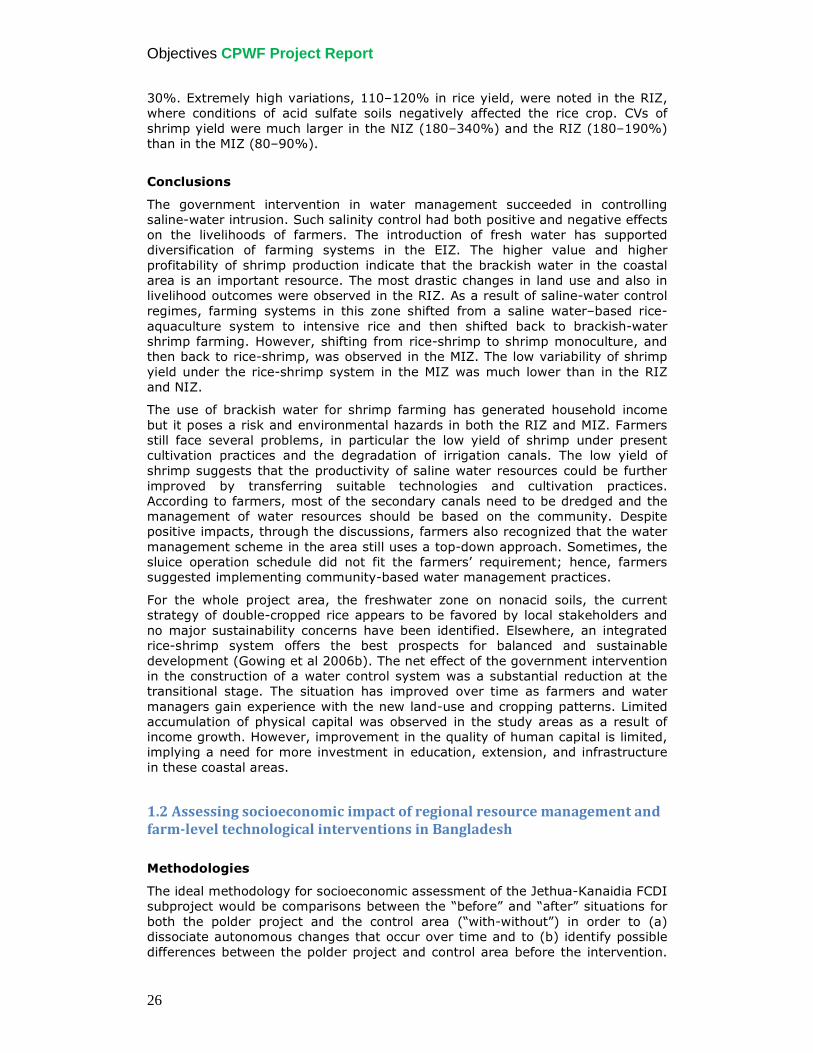
An area similar to the polder but not yet protected was selected as the “control” area for comparisons in order to assess the changes due to the polder. Four villages representing different land elevations were purposively selected from each of the polder project and control areas. It is in the low-level lands that the polder is supposed to have maximum impact as these are highly exposed to soil salinity when unprotected. The location of the project and the study area can be seen in Figure 1.4.
Fig. 1.4. Location of the project and study area in Bangladesh.
The data in this study were drawn from a sample survey conducted in 2005-06 using a combination of purposely selected villages and a random selection of households within these villages by stratifying all households by the wealth-ranking method. A census of all households was conducted in the selected villages using participatory rural appraisal (PRA) methods, allowing households to be allocated into “poor” and “nonpoor” groupings. Based on these wealth classifications, 50 households from each of the eight villages were selected using the proportionate random sampling method. Thus, the sample size should consist of 400 households. However, one household from each area failed to present sufficient information; therefore, the sample size was 398 households.
Using a pretested structured questionnaire, the selected households were interviewed to generate data on the demographic characteristics of all household members, operations on all owned and rented land used by the households, all
Objectives CPWF Project Report
28
nonland assets owned, costs and returns of major crop cultivation, costs of marketing and inputs, income and employment of working members from nonagricultural activities, and the economic standing of the household within the village and changes in its economic conditions as perceived by the respondent. Additional qualitative data were gathered using a PRA methodology through 16 focus group discussions (FGDs) with both “poor” and “nonpoor” groups in all eight villages in order to ensure an overall understanding of the socioeconomic circumstances in the survey area.
The validity of this methodology is critically dependent on the assumption that the project and control areas are similar in the preproject conditions. Although in practice it was virtually impossible to select a control area similar in all aspects to the polder project area before the polder was constructed, below several factors are compared in order to judge the validity of the selected control area. The findings of the sample survey revealed that the control area had an average farm size of 3.3 ha compared with 2.3 ha in the polder project. Only 35% of the households in the control area were functionally landless compared with 55% in the polder project. The control villages had a significantly larger proportion of land under clay soil than the project villages. Thus, the control areas have better land endowment and superior quality land and should have higher agricultural incomes on account of this. These findings on land endowment indicate that households in the command area of the polder were economically worse off than households in the control area. So, not all impacts can be accurately assessed through the “with-without” comparison used in this study.
Results and discussion
Differences between responding households in both polder project and control areas regarding basic age (average age of males and females over 16 are approximately 36 and 33 years old, respectively) and gender composition (50–52% males and 50–48% females) are minor. Both areas had few female earning members, a little over 2% in each compared with 31% of males. However, only about 33% of the household members reported being earning members, indicating a very high dependency ratio.
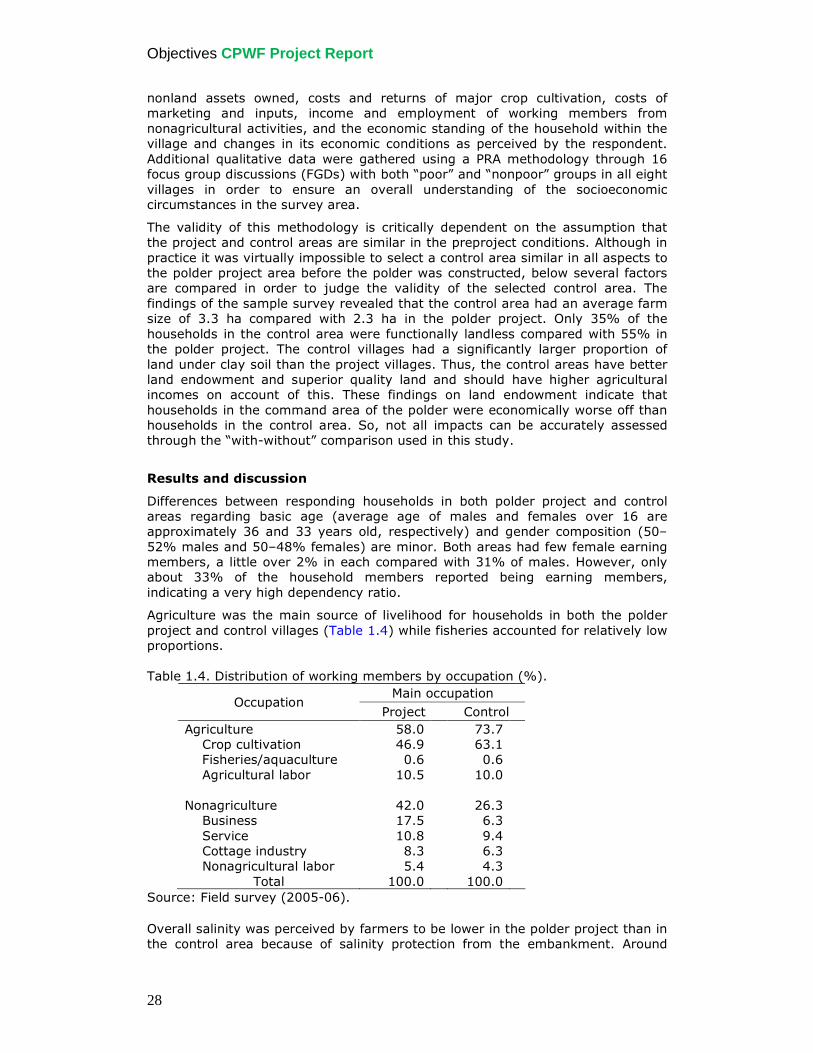
Agriculture was the main source of livelihood for households in both the polder project and control villages (Table 1.4) while fisheries accounted for relatively low proportions. Table 1.4. Distribution of working members by occupation (%).
Main occupation Occupation
Project Control Agriculture 58.0 73.7 Crop cultivation 46.9 63.1 Fisheries/aquaculture 0.6 0.6 Agricultural labor 10.5 10.0 Nonagriculture 42.0 26.3 Business 17.5 6.3 Service 10.8 9.4 Cottage industry 8.3 6.3 Nonagricultural labor 5.4 4.3
Total 100.0 100.0 Source: Field survey (2005-06).
Overall salinity was perceived by farmers to be lower in the polder project than in the control area because of salinity protection from the embankment. Around
Objectives CPWF Project Report
29
43% of the polder project area was classified as nonsaline, around 9% higher than the equivalent number for the control villages (34%). Lands suffering from high salinity were rare in both the polder project and control area. As a main objective of the embankment, the polder did give households more protection against flooding than those in the control area outside. Around 42% of the polder project area was not flooded at all, whereas the corresponding figure in the control area was 32%. However, because of different elevation distribution, 43% of the project area was flooded up to half a meter, whereas approximately 38% of the control land was flooded to this level. At a flooding depth between 50 and 100 cm, the proportion of land was 14.3% in the polder project, only half of that (29.6%) in the control area. Shallow tubewells (STWs) were the main sources of irrigation water but were more prevalent in the polder project than in the control area, a difference of almost 10% because of lower salinity in the polder project area resulting in a high amount of nonsaline water available at shallow depths. This is considered to be a major impact of the embankment. However, even in the absence of the polder, farmers in the locality are going for the installation of STWs for the cultivation of boro rice in the dry season.
The polder was constructed to shift cultivation away from shrimp and back toward rice by creating a rice-friendly environment inside the polder. The vast majority of shrimp farms were located outside the polder. Ghers are used to cultivate brackish-water shrimp in the control area, whereas, in the project area, they are used for the farming of freshwater prawns. However, it was found that land was used more intensively for crop cultivation in the unprotected area, whereas the reverse was expected. Farm households accounted for 77% of the total in both polder project and control areas, despite the expectation of a higher proportion of rice farmers within the polder project. The average farm size was found to be larger in the control area (0.47 ha) than in the polder project (0.36 ha). This is the outcome of the larger endowment of land in the control villages as noted earlier. The average size of a rice cultivation area was notably higher in the control area (0.56 ha) than in the project area (0.35 ha). Nonrice crop cultivation was conducted on similar sizes of land in both areas, around 0.15 ha in each. However, this value shows a positive effect of the polder, since, in terms of proportion, a larger percentage of land area was devoted to high-value nonrice crops within the polder project compared with the control. Obviously, the area used for a shrimp/prawn–rice cropping system was insignificant within the project area but was substantial in the control area. It was expected that the incidence of crop cultivation and cropping intensity would be higher in the polder project. The survey data, however, showed that both were considerably higher in the control area, despite higher salinity. Total cropped land per farm was 0.52 ha in the polder project, whereas it was 0.84 ha in the control area. Cropping intensity in the control area was around 180%, whereas the corresponding project figure was 144%. Despite higher salinity, more land was used seasonally for crop cultivation in the control area than in the project area.
As expected, shrimp/prawn cultivation was more prevalent in the control (unprotected) area in all aspects. Around 21% of the households took part in shrimp farming in the control area, more than five times those in the polder project. The average gher size was also larger, 0.91 ha compared with 0.67 ha, indicating large-scale shrimp farming outside the polder where larger land was rented due to the perception that large shrimp farms are more productive. Close to 30% of the households in the control area were engaged in a rice-shrimp/prawn cropping system, whereas only 3% were in the polder project. It appears that the project has influenced agricultural practices more toward rice-based systems than aquaculture systems.
Aman (wet-season) rice produced considerably greater returns in the polder project than in the control area. However, the yield of aman rice was higher in
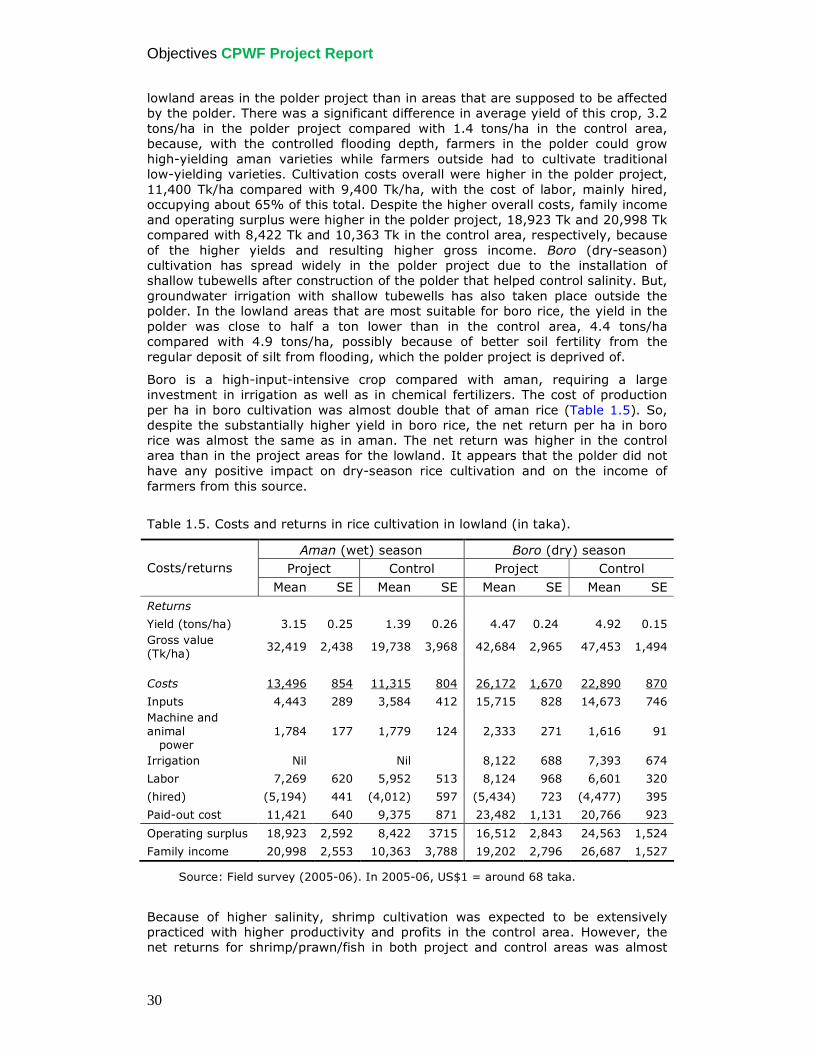
Objectives CPWF Project Report
30
lowland areas in the polder project than in areas that are supposed to be affected by the polder. There was a significant difference in average yield of this crop, 3.2 tons/ha in the polder project compared with 1.4 tons/ha in the control area, because, with the controlled flooding depth, farmers in the polder could grow high-yielding aman varieties while farmers outside had to cultivate traditional low-yielding varieties. Cultivation costs overall were higher in the polder project, 11,400 Tk/ha compared with 9,400 Tk/ha, with the cost of labor, mainly hired, occupying about 65% of this total. Despite the higher overall costs, family income and operating surplus were higher in the polder project, 18,923 Tk and 20,998 Tk compared with 8,422 Tk and 10,363 Tk in the control area, respectively, because of the higher yields and resulting higher gross income. Boro (dry-season) cultivation has spread widely in the polder project due to the installation of shallow tubewells after construction of the polder that helped control salinity. But, groundwater irrigation with shallow tubewells has also taken place outside the polder. In the lowland areas that are most suitable for boro rice, the yield in the polder was close to half a ton lower than in the control area, 4.4 tons/ha compared with 4.9 tons/ha, possibly because of better soil fertility from the regular deposit of silt from flooding, which the polder project is deprived of.
Boro is a high-input-intensive crop compared with aman, requiring a large investment in irrigation as well as in chemical fertilizers. The cost of production per ha in boro cultivation was almost double that of aman rice (Table 1.5). So, despite the substantially higher yield in boro rice, the net return per ha in boro rice was almost the same as in aman. The net return was higher in the control area than in the project areas for the lowland. It appears that the polder did not have any positive impact on dry-season rice cultivation and on the income of farmers from this source.
Table 1.5. Costs and returns in rice cultivation in lowland (in taka).
Aman (wet) season Boro (dry) season Project Control Project Control Costs/returns
Mean SE Mean SE Mean SE Mean SE Returns
Yield (tons/ha) 3.15 0.25 1.39 0.26 4.47 0.24 4.92 0.15 Gross value (Tk/ha)
32,419 2,438 19,738 3,968 42,684 2,965 47,453 1,494
Costs 13,496 854 11,315 804 26,172 1,670 22,890 870
Inputs 4,443 289 3,584 412 15,715 828 14,673 746 Machine and animal power
1,784 177 1,779 124 2,333 271 1,616 91
Irrigation Nil Nil 8,122 688 7,393 674
Labor 7,269 620 5,952 513 8,124 968 6,601 320
(hired) (5,194) 441 (4,012) 597 (5,434) 723 (4,477) 395
Paid-out cost 11,421 640 9,375 871 23,482 1,131 20,766 923
Operating surplus 18,923 2,592 8,422 3715 16,512 2,843 24,563 1,524
Family income 20,998 2,553 10,363 3,788 19,202 2,796 26,687 1,527
Source: Field survey (2005-06). In 2005-06, US$1 = around 68 taka.
Because of higher salinity, shrimp cultivation was expected to be extensively practiced with higher productivity and profits in the control area. However, the net returns for shrimp/prawn/fish in both project and control areas was almost
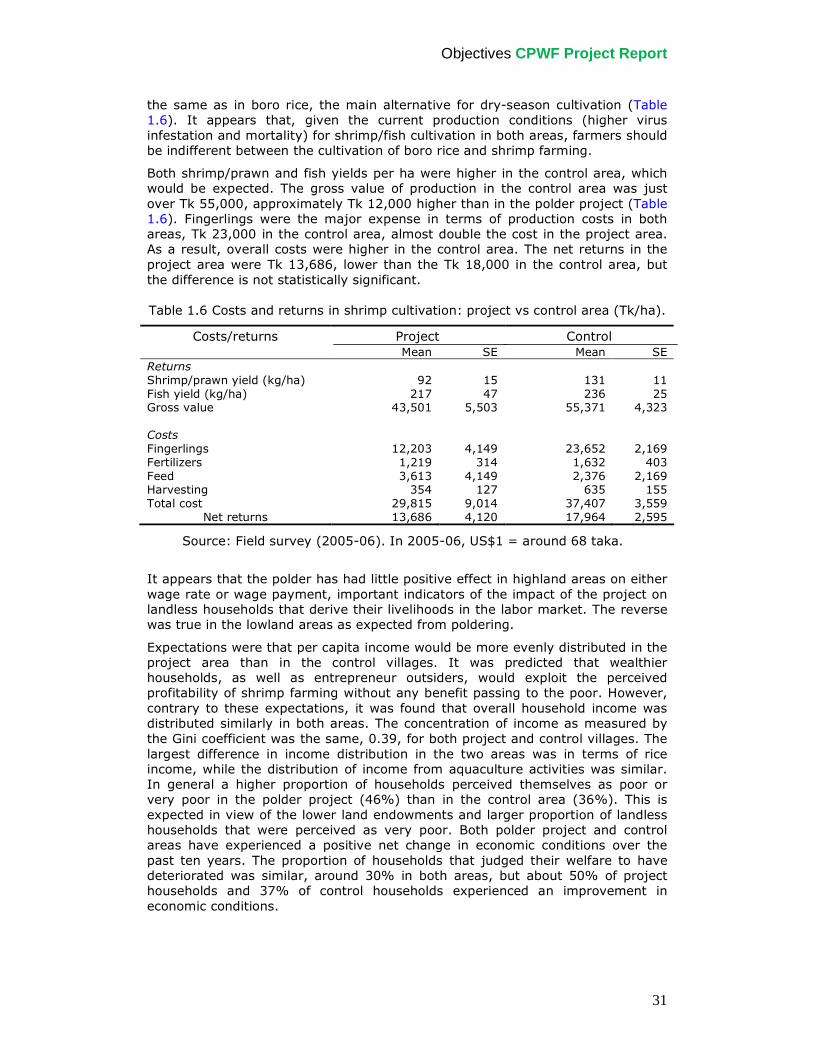
Objectives CPWF Project Report
31
the same as in boro rice, the main alternative for dry-season cultivation (Table 1.6). It appears that, given the current production conditions (higher virus infestation and mortality) for shrimp/fish cultivation in both areas, farmers should be indifferent between the cultivation of boro rice and shrimp farming.
Both shrimp/prawn and fish yields per ha were higher in the control area, which would be expected. The gross value of production in the control area was just over Tk 55,000, approximately Tk 12,000 higher than in the polder project (Table 1.6). Fingerlings were the major expense in terms of production costs in both areas, Tk 23,000 in the control area, almost double the cost in the project area. As a result, overall costs were higher in the control area. The net returns in the project area were Tk 13,686, lower than the Tk 18,000 in the control area, but the difference is not statistically significant. Table 1.6 Costs and returns in shrimp cultivation: project vs control area (Tk/ha).
Costs/returns Project Control Mean SE Mean SE Returns Shrimp/prawn yield (kg/ha) 92 15 131 11 Fish yield (kg/ha) 217 47 236 25 Gross value 43,501 5,503 55,371 4,323 Costs Fingerlings 12,203 4,149 23,652 2,169 Fertilizers 1,219 314 1,632 403 Feed 3,613 4,149 2,376 2,169 Harvesting 354 127 635 155 Total cost 29,815 9,014 37,407 3,559
Net returns 13,686 4,120 17,964 2,595
Source: Field survey (2005-06). In 2005-06, US$1 = around 68 taka.
It appears that the polder has had little positive effect in highland areas on either wage rate or wage payment, important indicators of the impact of the project on landless households that derive their livelihoods in the labor market. The reverse was true in the lowland areas as expected from poldering.
Expectations were that per capita income would be more evenly distributed in the project area than in the control villages. It was predicted that wealthier households, as well as entrepreneur outsiders, would exploit the perceived profitability of shrimp farming without any benefit passing to the poor. However, contrary to these expectations, it was found that overall household income was distributed similarly in both areas. The concentration of income as measured by the Gini coefficient was the same, 0.39, for both project and control villages. The largest difference in income distribution in the two areas was in terms of rice income, while the distribution of income from aquaculture activities was similar. In general a higher proportion of households perceived themselves as poor or very poor in the polder project (46%) than in the control area (36%). This is expected in view of the lower land endowments and larger proportion of landless households that were perceived as very poor. Both polder project and control areas have experienced a positive net change in economic conditions over the past ten years. The proportion of households that judged their welfare to have deteriorated was similar, around 30% in both areas, but about 50% of project households and 37% of control households experienced an improvement in economic conditions.
Objectives CPWF Project Report
32
Conclusions on the polder impacts
The primary aim of the LGED polder was to protect agricultural land from salinity intrusion and tidal flooding in order to protect the environment and facilitate a change from shrimp to rice cultivation with improved high-yielding rice varieties during the dry season. This has not only contributed to an increase in rice production but has also halted the long-term negative effect of shrimp farming on the buildup of soil salinity and on livestock and forestry cultivation. With reduced flooding and overflowing during the aman season, farmers in the polder have started practicing rice-fish and rice-prawn mixed farming as an additional benefit. This study found that this shift in farming practices has occurred within the protected area but is also taking place in the control area, without protection from the embankment. Earlier, the brackish-water shrimp had proved immensely profitable in salinity-exposed areas, especially in comparison with returns from the alternative rice-fallow system for low-lying land. However, recent declines in shrimp prices in addition to higher mortality rates, and the experience of boro rice cultivation with groundwater irrigation, have led to a change in the system from shrimp farming to boro cultivation for such land.
The project document reports an estimated cereal production at 2,456 tons at the time of the construction of the project. From the data obtained from the survey, we estimate rice production at 2,170 tons in the aman season and 1,354 tons in the boro season. Thus, total rice production has increased to 3,524 tons per year, 44% higher than the benchmark level. Although there has been substantial expansion of area under boro rice, it would be improper to attribute this change to the project because the boro area has also expanded in the control area at almost the same rate. So, the main impact of the polder has been on the cultivation of aman rice in the wet season in terms of the adoption of modern varieties due to reduced flooding.
The difference in net family income from aman rice cultivation between the polder project and the control areas is estimated from the survey to be Tk 10,635 per hectare, which we assume represents the financial return of the polder project. With assumptions of a subsidy on fertilizer at 25% of the market price, a shadow wage rate of 90% of the market wage, and border price of rice (import-parity price) 5% higher than the market price, the economic return is estimated to be Tk 11,654 per ha. A yearly O&M and depreciation charge of 7.5% of the investment on embankment and canals and 2.5% of the investment on regulators is deducted from this return. The polder project is assumed to have a two-year investment phase, a 20-year life, and a discount rate of 10% per year. On the basis of these assumptions, the benefit-cost ratio of the project was estimated at 3.75. The internal rate of return is estimated at 38% at the prevailing market prices, and 41% at the economic prices. Thus, the project has yielded a high return on investment even under a conservative assumption of no effect of the polder on dry-season boro rice cultivation. The benefit, however, has accrued more to the land-owning households than to the land-poor, leading to an increase in inequality in the distribution of rice income.
It is felt that polders such as the one assessed in this study would have the greatest impact in areas where high salinity is found even in groundwater, thus preventing any possibility of boro rice cultivation. Households in such areas have no choice but to either leave their land fallow or farm brackish-water fish and shrimp during the dry season, a practice that appears to produce diminishing returns and is perceived to be environmentally unsustainable.
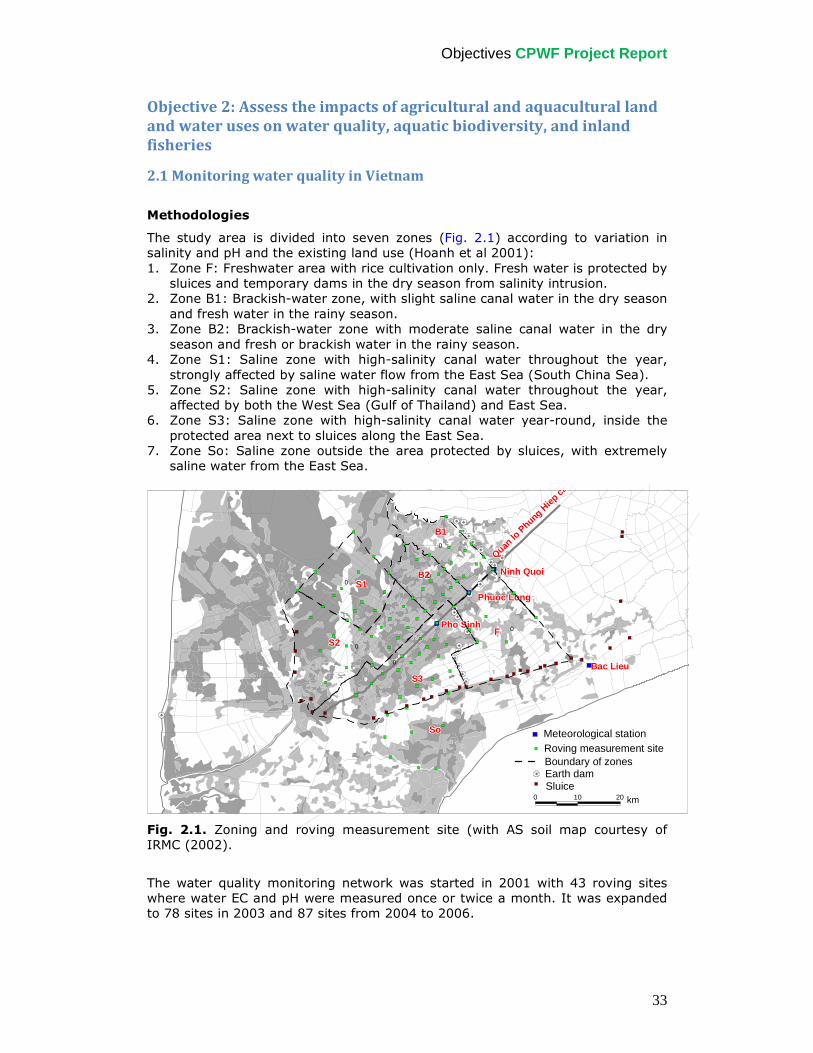
Objectives CPWF Project Report
33
Objective 2: Assess the impacts of agricultural and aquacultural land
and water uses on water quality, aquatic biodiversity, and inland
fisheries
2.1 Monitoring water quality in Vietnam
Methodologies
The study area is divided into seven zones (Fig. 2.1) according to variation in salinity and pH and the existing land use (Hoanh et al 2001): 1. Zone F: Freshwater area with rice cultivation only. Fresh water is protected by
sluices and temporary dams in the dry season from salinity intrusion. 2. Zone B1: Brackish-water zone, with slight saline canal water in the dry season
and fresh water in the rainy season. 3. Zone B2: Brackish-water zone with moderate saline canal water in the dry
season and fresh or brackish water in the rainy season. 4. Zone S1: Saline zone with high-salinity canal water throughout the year,
strongly affected by saline water flow from the East Sea (South China Sea). 5. Zone S2: Saline zone with high-salinity canal water throughout the year,
affected by both the West Sea (Gulf of Thailand) and East Sea. 6. Zone S3: Saline zone with high-salinity canal water year-round, inside the
protected area next to sluices along the East Sea. 7. Zone So: Saline zone outside the area protected by sluices, with extremely
saline water from the East Sea.
Bac LieuBac LieuBac LieuBac LieuBac LieuBac LieuBac LieuBac LieuBac Lieu
Meteorological stationRoving measurement siteBoundary of zones
Phuoc LongPhuoc LongPhuoc LongPhuoc LongPhuoc LongPhuoc LongPhuoc LongPhuoc LongPhuoc Long
Quan lo
Phung H
iep ca
nal
Quan lo
Phung H
iep ca
nal
Quan lo
Phung H
iep ca
nal
Quan lo
Phung H
iep can
al
Quan lo
Phung H
iep can
al
Quan lo
Phung H
iep ca
nal
Quan lo
Phung H
iep ca
nal
Quan lo
Phung H
iep ca
nal
Quan lo
Phung H
iep can
al
Ninh QuoiNinh QuoiNinh QuoiNinh QuoiNinh QuoiNinh QuoiNinh QuoiNinh QuoiNinh Quoi
FFFFFFFFF
SoSoSoSoSoSoSoSoSo
S1S1S1S1S1S1S1S1S1
B1B1B1B1B1B1B1B1B1
B2B2B2B2B2B2B2B2B2
S2S2S2S2S2S2S2S2S2
S3S3S3S3S3S3S3S3S3
Pho SinhPho SinhPho SinhPho SinhPho SinhPho SinhPho SinhPho SinhPho Sinh
10 20 km
Earth damSluice
0
0
0
0
0
0
0
Fig. 2.1. Zoning and roving measurement site (with AS soil map courtesy of IRMC (2002).
The water quality monitoring network was started in 2001 with 43 roving sites where water EC and pH were measured once or twice a month. It was expanded to 78 sites in 2003 and 87 sites from 2004 to 2006.
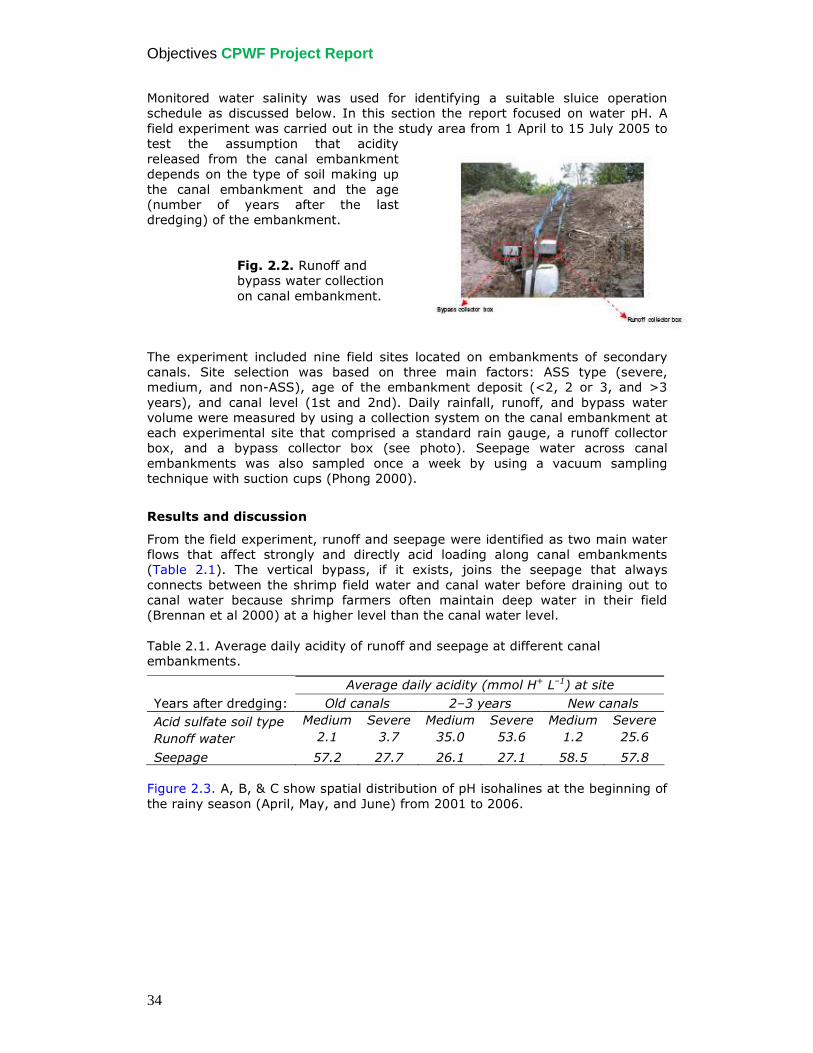
Objectives CPWF Project Report
34
Monitored water salinity was used for identifying a suitable sluice operation schedule as discussed below. In this section the report focused on water pH. A field experiment was carried out in the study area from 1 April to 15 July 2005 to test the assumption that acidity released from the canal embankment depends on the type of soil making up the canal embankment and the age (number of years after the last dredging) of the embankment.
Fig. 2.2. Runoff and bypass water collection on canal embankment.
The experiment included nine field sites located on embankments of secondary canals. Site selection was based on three main factors: ASS type (severe, medium, and non-ASS), age of the embankment deposit (<2, 2 or 3, and >3 years), and canal level (1st and 2nd). Daily rainfall, runoff, and bypass water volume were measured by using a collection system on the canal embankment at each experimental site that comprised a standard rain gauge, a runoff collector box, and a bypass collector box (see photo). Seepage water across canal embankments was also sampled once a week by using a vacuum sampling technique with suction cups (Phong 2000).
Results and discussion
From the field experiment, runoff and seepage were identified as two main water flows that affect strongly and directly acid loading along canal embankments (Table 2.1). The vertical bypass, if it exists, joins the seepage that always connects between the shrimp field water and canal water before draining out to canal water because shrimp farmers often maintain deep water in their field (Brennan et al 2000) at a higher level than the canal water level. Table 2.1. Average daily acidity of runoff and seepage at different canal embankments.
Average daily acidity (mmol H+ L–1) at site
Years after dredging: Old canals 2–3 years New canals
Acid sulfate soil type Medium Severe Medium Severe Medium Severe
Runoff water 2.1 3.7 35.0 53.6 1.2 25.6
Seepage 57.2 27.7 26.1 27.1 58.5 57.8 Figure 2.3. A, B, & C show spatial distribution of pH isohalines at the beginning of the rainy season (April, May, and June) from 2001 to 2006.
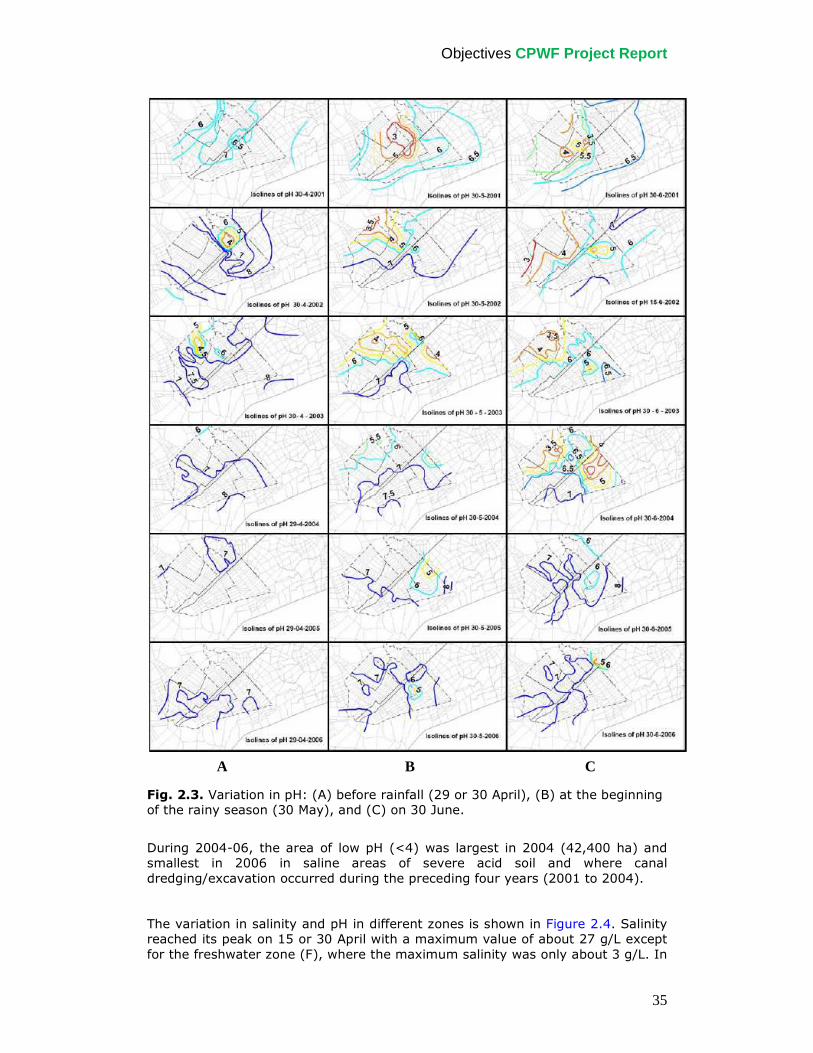
Objectives CPWF Project Report
35
Fig. 2.3. Variation in pH: (A) before rainfall (29 or 30 April), (B) at the beginning of the rainy season (30 May), and (C) on 30 June.
During 2004-06, the area of low pH (<4) was largest in 2004 (42,400 ha) and smallest in 2006 in saline areas of severe acid soil and where canal dredging/excavation occurred during the preceding four years (2001 to 2004).
The variation in salinity and pH in different zones is shown in Figure 2.4. Salinity reached its peak on 15 or 30 April with a maximum value of about 27 g/L except for the freshwater zone (F), where the maximum salinity was only about 3 g/L. In
A B C
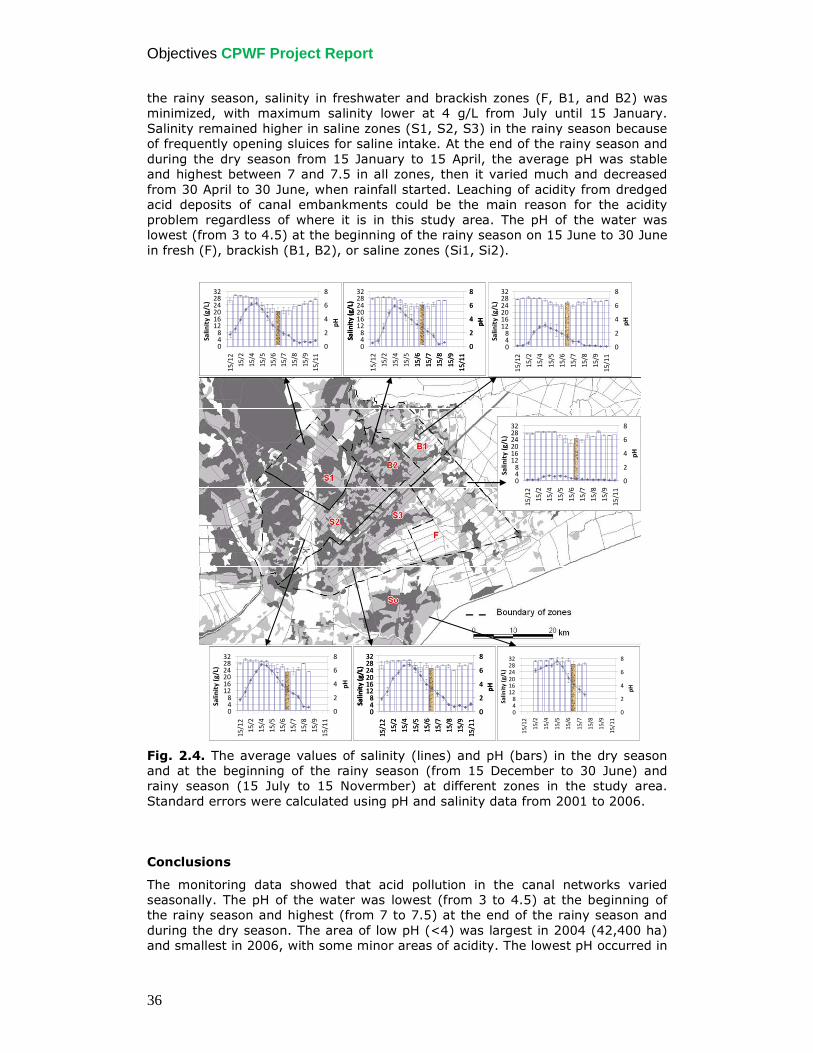
Objectives CPWF Project Report
36
the rainy season, salinity in freshwater and brackish zones (F, B1, and B2) was minimized, with maximum salinity lower at 4 g/L from July until 15 January. Salinity remained higher in saline zones (S1, S2, S3) in the rainy season because of frequently opening sluices for saline intake. At the end of the rainy season and during the dry season from 15 January to 15 April, the average pH was stable and highest between 7 and 7.5 in all zones, then it varied much and decreased from 30 April to 30 June, when rainfall started. Leaching of acidity from dredged acid deposits of canal embankments could be the main reason for the acidity problem regardless of where it is in this study area. The pH of the water was lowest (from 3 to 4.5) at the beginning of the rainy season on 15 June to 30 June in fresh (F), brackish (B1, B2), or saline zones (Si1, Si2).
Fig. 2.4. The average values of salinity (lines) and pH (bars) in the dry season and at the beginning of the rainy season (from 15 December to 30 June) and rainy season (15 July to 15 Novermber) at different zones in the study area. Standard errors were calculated using pH and salinity data from 2001 to 2006.
Conclusions
The monitoring data showed that acid pollution in the canal networks varied seasonally. The pH of the water was lowest (from 3 to 4.5) at the beginning of the rainy season and highest (from 7 to 7.5) at the end of the rainy season and during the dry season. The area of low pH (<4) was largest in 2004 (42,400 ha) and smallest in 2006, with some minor areas of acidity. The lowest pH occurred in
048
121620242832
15/12
15/2
15/4
15/5
15/6
15/7
15/8
15/9
15/11
Sali
nit
y (
g/L
)
0
2
4
6
8
pH
048
121620242832
15/12
15/2
15/4
15/5
15/6
15/7
15/8
15/9
15/11
Sali
nit
y (
g/L
)0
2
4
6
8
pH
048
121620242832
15/12
15/2
15/4
15/5
15/6
15/7
15/8
15/9
15/11
Sali
nit
y (
g/L
)
0
2
4
6
8
pH
048
121620242832
15/12
15/2
15/4
15/5
15/6
15/7
15/8
15/9
15/11
Sali
nit
y (
g/L
)
0
2
4
6
8
pH
048
121620
242832
15/12
15/2
15/4
15/5
15/6
15/7
15/8
15/9
15/11
Sa
lin
ity
(g
/L)
0
2
4
6
8
pH
048
121620242832
15/12
15/2
15/4
15/5
15/6
15/7
15/8
15/9
15/11
Sa
lin
ity
(g
/L)
0
2
4
6
8
pH
048
121620242832
15/12
15/2
15/4
15/5
15/6
15/7
15/8
15/9
15/11
Sa
lin
ity
(g
/L)
0
2
4
6
8
pH
048
121620242832
15/12
15/2
15/4
15/5
15/6
15/7
15/8
15/9
15/11
Sali
nit
y (
g/L
)
0
2
4
6
8
pH
048
121620242832
15/12
15/2
15/4
15/5
15/6
15/7
15/8
15/9
15/11
Sali
nit
y (
g/L
)
0
2
4
6
8
pH
048
121620242832
15/12
15/2
15/4
15/5
048
121620242832
15/12
15/2
15/4
15/5
15/6
15/7
15/8
15/9
15/11
Sali
nit
y (
g/L
)0
2
4
6
8
pH
15/6
15/7
15/8
15/9
15/11
Sali
nit
y (
g/L
)0
2
4
6
8
pH
048
121620242832
15/12
15/2
15/4
15/5
15/6
15/7
15/8
15/9
15/11
Sali
nit
y (
g/L
)
0
2
4
6
8
pH
048
121620242832
15/12
15/2
15/4
15/5
15/6
15/7
15/8
15/9
15/11
Sali
nit
y (
g/L
)
0
2
4
6
8
pH
048
121620242832
15/12
15/2
15/4
15/5
15/6
15/7
15/8
15/9
15/11
Sali
nit
y (
g/L
)
0
2
4
6
8
pH
048
121620242832
15/12
15/2
15/4
15/5
15/6
15/7
15/8
15/9
15/11
Sali
nit
y (
g/L
)
0
2
4
6
8
pH
048
121620
242832
15/12
15/2
15/4
15/5
15/6
15/7
15/8
15/9
15/11
Sa
lin
ity
(g
/L)
0
2
4
6
8
pH
048
121620
242832
15/12
15/2
15/4
15/5
15/6
15/7
15/8
15/9
15/11
Sa
lin
ity
(g
/L)
0
2
4
6
8
pH
048
121620242832
15/12
15/2
15/4
15/5
15/6
15/7
15/8
15/9
15/11
Sa
lin
ity
(g
/L)
0
2
4
6
8
pH
048
121620242832
15/12
15/2
15/4
15/5
15/6
15/7
15/8
15/9
15/11
Sa
lin
ity
(g
/L)
0
2
4
6
8
pH
048
121620242832
15/12
15/2
15/4
15/5
15/6
15/7
15/8
15/9
15/11
Sa
lin
ity
(g
/L)
0
2
4
6
8
pH
048
121620242832
15/12
15/2
15/4
15/5
048
121620242832
15/12
15/2
15/4
15/5
15/6
15/7
15/8
15/9
15/11
Sa
lin
ity
(g
/L)
0
2
4
6
8
pH
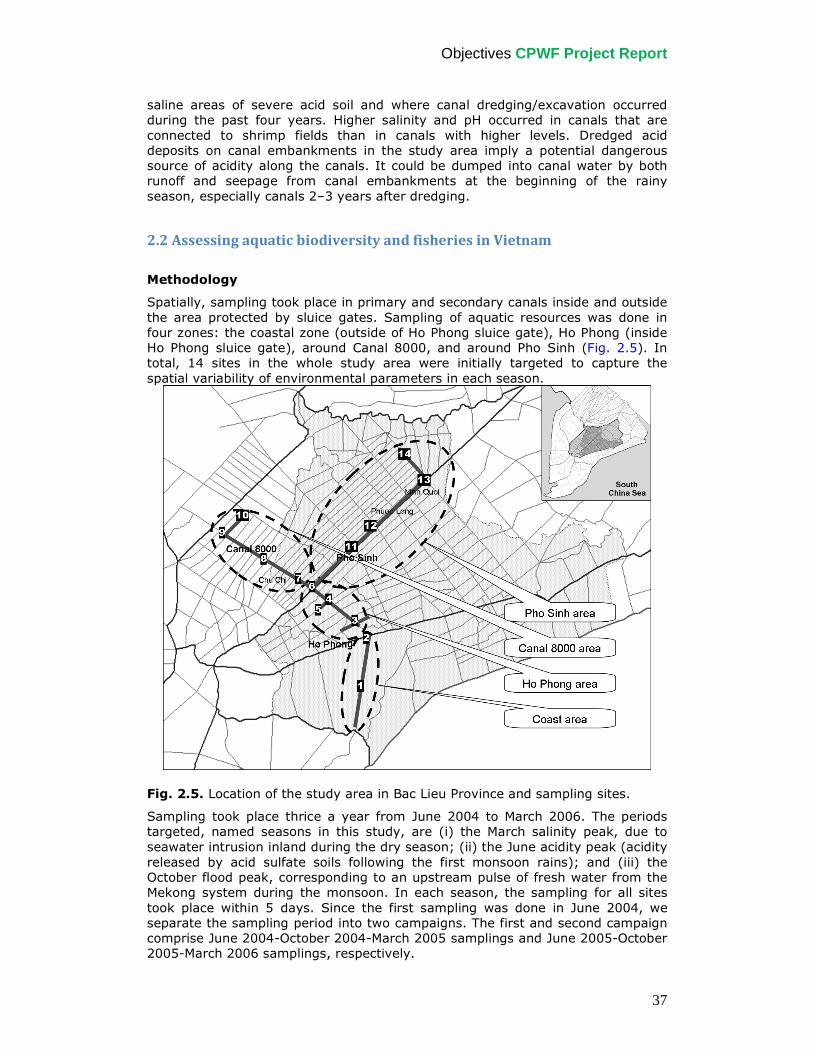
Objectives CPWF Project Report
37
saline areas of severe acid soil and where canal dredging/excavation occurred during the past four years. Higher salinity and pH occurred in canals that are connected to shrimp fields than in canals with higher levels. Dredged acid deposits on canal embankments in the study area imply a potential dangerous source of acidity along the canals. It could be dumped into canal water by both runoff and seepage from canal embankments at the beginning of the rainy season, especially canals 2–3 years after dredging.
2.2 Assessing aquatic biodiversity and fisheries in Vietnam
Methodology
Spatially, sampling took place in primary and secondary canals inside and outside the area protected by sluice gates. Sampling of aquatic resources was done in four zones: the coastal zone (outside of Ho Phong sluice gate), Ho Phong (inside Ho Phong sluice gate), around Canal 8000, and around Pho Sinh (Fig. 2.5). In total, 14 sites in the whole study area were initially targeted to capture the spatial variability of environmental parameters in each season.
Fig. 2.5. Location of the study area in Bac Lieu Province and sampling sites.
Sampling took place thrice a year from June 2004 to March 2006. The periods targeted, named seasons in this study, are (i) the March salinity peak, due to seawater intrusion inland during the dry season; (ii) the June acidity peak (acidity released by acid sulfate soils following the first monsoon rains); and (iii) the October flood peak, corresponding to an upstream pulse of fresh water from the Mekong system during the monsoon. In each season, the sampling for all sites took place within 5 days. Since the first sampling was done in June 2004, we separate the sampling period into two campaigns. The first and second campaign comprise June 2004-October 2004-March 2005 samplings and June 2005-October 2005-March 2006 samplings, respectively.
Objectives CPWF Project Report
38
Sampling information was supplemented by interviewing local fishermen. Questions were asked about details of their fishing activities, variability in water quality, variability in aquatic resources, and relationships between water quality and aquatic resources. Emphasis was placed on differences before and after construction of the sluice gates and differences when the gates were open and closed.
Eight variables describing water quality were measured: water temperature (oC), pH, salinity (g L–1; field probe), total dissolved solids (TDS; mg L–1; weighting), dissolved oxygen (DO) concentration (mg L–1; Winkler method), hydrogen sulfide (H2S) concentration (mg L
–1; standard iodine method), ammonium (NH4+)
concentration (mg L–1; indo-phenol blue method), and phosphate (PO43–)
concentration (mg L–1; molybdate-ascorbic acid method).
Aquatic resources were sampled with two complementary methods: trawling and gillnet fishing. Trawling is the dominant fishing method in the study area, and was recommended as the best sampling approach by most fishermen during interviews (Baran et al 2010a). Sampling was done with a local traditional bottom trawl on skates (1 × 4 m mouth and 25-mm mesh size), dragged for approximately 120 minutes along the canal. GPS was used to determine the geographic position of the boat as well as ground speed and trawling distance. These trawl parameters were used to estimate the volume of sampled water required for calculating catch per unit effort (CPUE). Gillnet fishing is commonly applied in estuarine zones (e.g., Fagade and Olaniyan 1973, Dorr et al 1985) and is a standard in ichthyological studies (Levêque et al 1988). Sampling was done three times in each season in the Ho Phong zone and two times in the other sampling zones, using two sets of nets made of three monofilament panels of different mesh sizes (10 mm, 20 mm, and 40 mm). Each of these nets is 20 m long and 1 m high. At each site, these two sets were used simultaneously across canals (primary as well as secondary canals), between 0400 and 1000.
The method used to analyze simultaneously environmental and faunal data is principal components analysis (PCA). This multivariate method has proven very efficient for extracting and synthesizing information from chemical or environmental data (e.g., Wold et al 1987) and for analyzing animal/habitat relationships (e.g., Rottenberry and Wiens 1981). This method consists of searching for a synthetic variable (the first factorial coordinates) that maximizes the sum of the square correlation within the variables analyzed (Hotelling 1933). The result of the analysis is a “factorial map” that consists of the projection of the multidimensional space onto an optimal plane, where correlations can be visually interpreted (Carrel et al 1986). The nature of data analyzed here (variables of different nature, multiple units) prompted us to use the centered and normalized option of PCA. The software “Analyse de Données de l’Environnement” ADE-4 (Thioulouse et al 1997) available free at http://pbil.univ-lyon1.fr is used for this analysis.
Beyond standard factorial maps, results have been presented in the form of choremes—the conceptual maps allowing information to be expressed in a spatial context (Brunet 1980, 1993). Choremes have been recommended to facilitate the communication of notions in a complex spatio-temporal context (Klippel 2003, Klippel et al 2005) and have been employed in this paper to summarize the processes and patterns influencing water quality and nekton parameters among sites, seasons, and years.
Results and discussion
Water environmental parameters show that water quality parameters were clearly affected by the operation of sluice gates, that is, whether they were opened or closed before sampling. Rapid influxes of saline water when sluice gates were
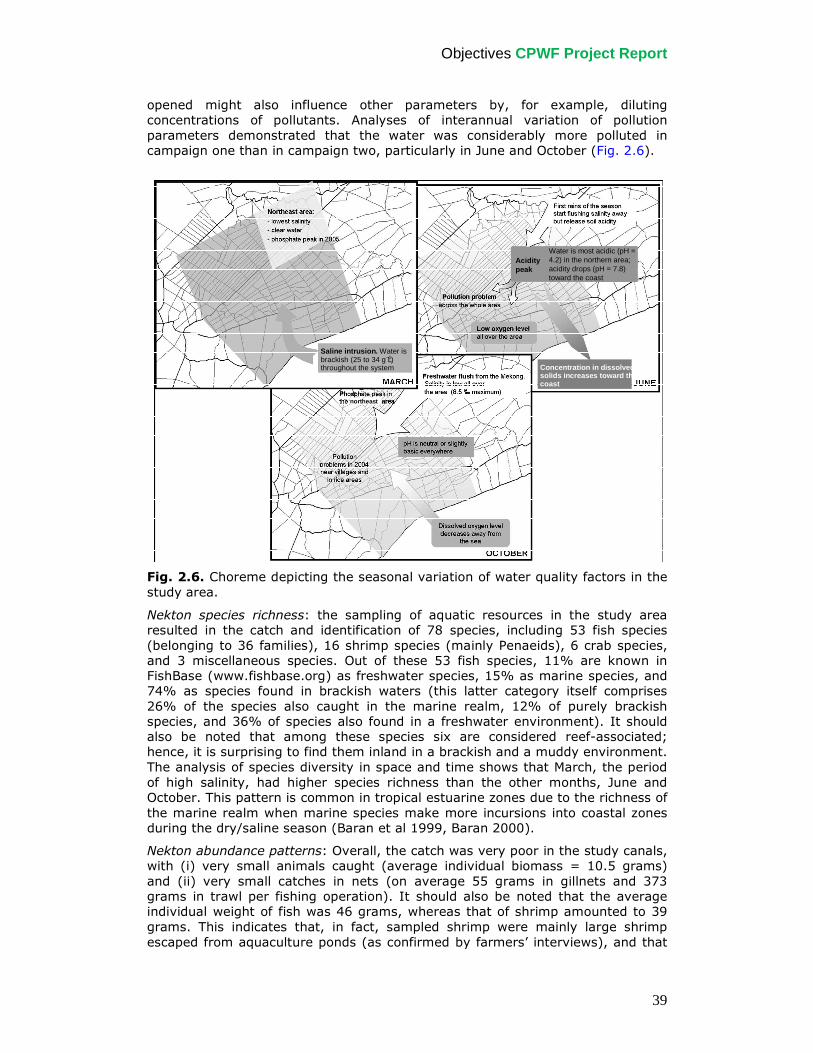
Objectives CPWF Project Report
39
opened might also influence other parameters by, for example, diluting concentrations of pollutants. Analyses of interannual variation of pollution parameters demonstrated that the water was considerably more polluted in campaign one than in campaign two, particularly in June and October (Fig. 2.6).
Fig. 2.6. Choreme depicting the seasonal variation of water quality factors in the study area.
Nekton species richness: the sampling of aquatic resources in the study area resulted in the catch and identification of 78 species, including 53 fish species (belonging to 36 families), 16 shrimp species (mainly Penaeids), 6 crab species, and 3 miscellaneous species. Out of these 53 fish species, 11% are known in FishBase (www.fishbase.org) as freshwater species, 15% as marine species, and 74% as species found in brackish waters (this latter category itself comprises 26% of the species also caught in the marine realm, 12% of purely brackish species, and 36% of species also found in a freshwater environment). It should also be noted that among these species six are considered reef-associated; hence, it is surprising to find them inland in a brackish and a muddy environment. The analysis of species diversity in space and time shows that March, the period of high salinity, had higher species richness than the other months, June and October. This pattern is common in tropical estuarine zones due to the richness of the marine realm when marine species make more incursions into coastal zones during the dry/saline season (Baran et al 1999, Baran 2000).
Nekton abundance patterns: Overall, the catch was very poor in the study canals, with (i) very small animals caught (average individual biomass = 10.5 grams) and (ii) very small catches in nets (on average 55 grams in gillnets and 373 grams in trawl per fishing operation). It should also be noted that the average individual weight of fish was 46 grams, whereas that of shrimp amounted to 39 grams. This indicates that, in fact, sampled shrimp were mainly large shrimp escaped from aquaculture ponds (as confirmed by farmers’ interviews), and that
Saline intrusion. Water is brackish (25 to 34 g L–1) throughout the system Concentration in dissolved
solids increases toward the coast
Saline intrusion. Water is brackish (25 to 34 g L–1) throughout the system Concentration in dissolved
solids increases toward the coast
Acidity peak
Water is most acidic (pH = 4.2) in the northern area; acidity drops (pH = 7.8) toward the coast
northeast
Saline intrusion. Water is brackish (25 to 34 g L–1) throughout the system Concentration in dissolved
solids increases toward the coast
Saline intrusion. Water is brackish (25 to 34 g L–1) throughout the system Concentration in dissolved
solids increases toward the coast
Acidity peak
Water is most acidic (pH = 4.2) in the northern area; acidity drops (pH = 7.8) toward the coast
northeast
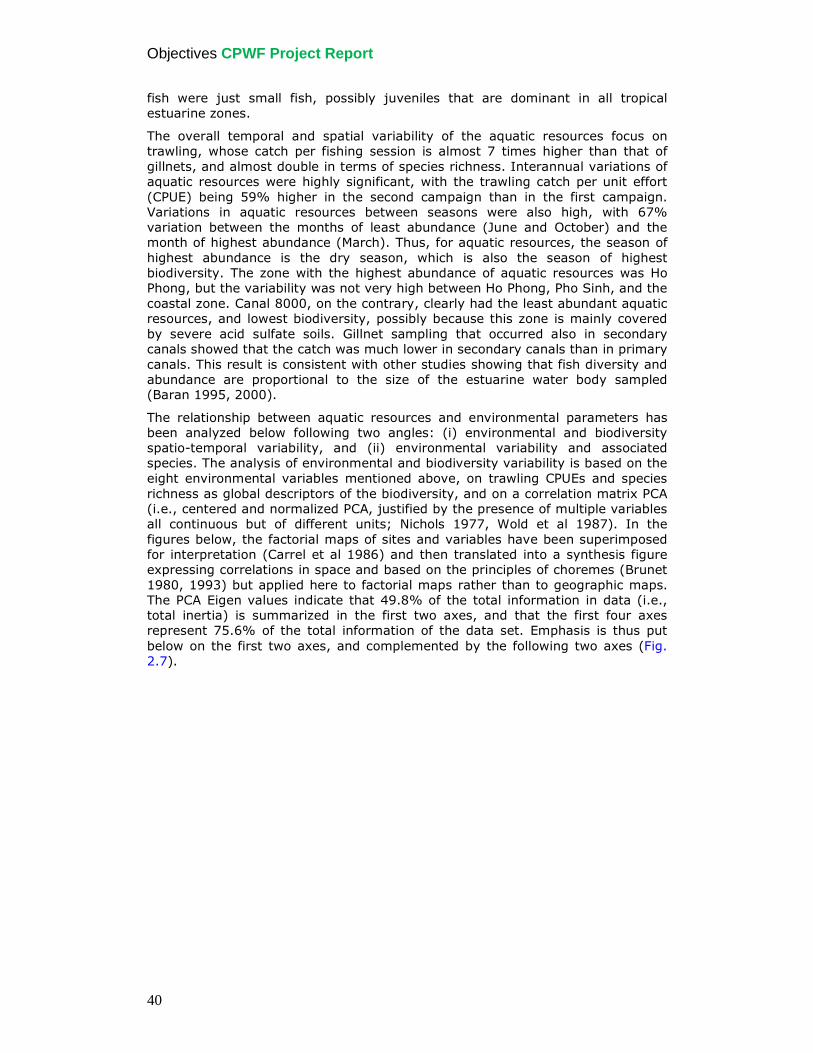
Objectives CPWF Project Report
40
fish were just small fish, possibly juveniles that are dominant in all tropical estuarine zones.
The overall temporal and spatial variability of the aquatic resources focus on trawling, whose catch per fishing session is almost 7 times higher than that of gillnets, and almost double in terms of species richness. Interannual variations of aquatic resources were highly significant, with the trawling catch per unit effort (CPUE) being 59% higher in the second campaign than in the first campaign. Variations in aquatic resources between seasons were also high, with 67% variation between the months of least abundance (June and October) and the month of highest abundance (March). Thus, for aquatic resources, the season of highest abundance is the dry season, which is also the season of highest biodiversity. The zone with the highest abundance of aquatic resources was Ho Phong, but the variability was not very high between Ho Phong, Pho Sinh, and the coastal zone. Canal 8000, on the contrary, clearly had the least abundant aquatic resources, and lowest biodiversity, possibly because this zone is mainly covered by severe acid sulfate soils. Gillnet sampling that occurred also in secondary canals showed that the catch was much lower in secondary canals than in primary canals. This result is consistent with other studies showing that fish diversity and abundance are proportional to the size of the estuarine water body sampled (Baran 1995, 2000).
The relationship between aquatic resources and environmental parameters has been analyzed below following two angles: (i) environmental and biodiversity spatio-temporal variability, and (ii) environmental variability and associated species. The analysis of environmental and biodiversity variability is based on the eight environmental variables mentioned above, on trawling CPUEs and species richness as global descriptors of the biodiversity, and on a correlation matrix PCA (i.e., centered and normalized PCA, justified by the presence of multiple variables all continuous but of different units; Nichols 1977, Wold et al 1987). In the figures below, the factorial maps of sites and variables have been superimposed for interpretation (Carrel et al 1986) and then translated into a synthesis figure expressing correlations in space and based on the principles of choremes (Brunet 1980, 1993) but applied here to factorial maps rather than to geographic maps. The PCA Eigen values indicate that 49.8% of the total information in data (i.e., total inertia) is summarized in the first two axes, and that the first four axes represent 75.6% of the total information of the data set. Emphasis is thus put below on the first two axes, and complemented by the following two axes (Fig. 2.7).
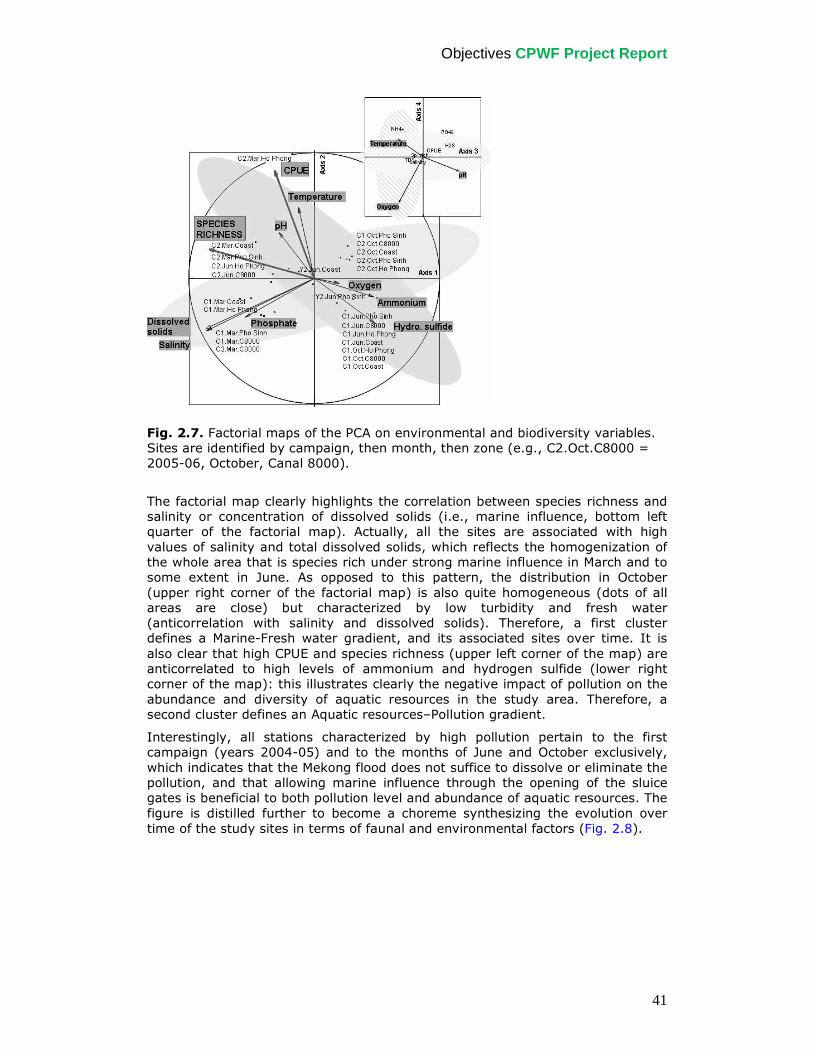
Objectives CPWF Project Report
41
Fig. 2.7. Factorial maps of the PCA on environmental and biodiversity variables. Sites are identified by campaign, then month, then zone (e.g., C2.Oct.C8000 = 2005-06, October, Canal 8000).
The factorial map clearly highlights the correlation between species richness and salinity or concentration of dissolved solids (i.e., marine influence, bottom left quarter of the factorial map). Actually, all the sites are associated with high values of salinity and total dissolved solids, which reflects the homogenization of the whole area that is species rich under strong marine influence in March and to some extent in June. As opposed to this pattern, the distribution in October (upper right corner of the factorial map) is also quite homogeneous (dots of all areas are close) but characterized by low turbidity and fresh water (anticorrelation with salinity and dissolved solids). Therefore, a first cluster defines a Marine-Fresh water gradient, and its associated sites over time. It is also clear that high CPUE and species richness (upper left corner of the map) are anticorrelated to high levels of ammonium and hydrogen sulfide (lower right corner of the map): this illustrates clearly the negative impact of pollution on the abundance and diversity of aquatic resources in the study area. Therefore, a second cluster defines an Aquatic resources–Pollution gradient.
Interestingly, all stations characterized by high pollution pertain to the first campaign (years 2004-05) and to the months of June and October exclusively, which indicates that the Mekong flood does not suffice to dissolve or eliminate the pollution, and that allowing marine influence through the opening of the sluice gates is beneficial to both pollution level and abundance of aquatic resources. The figure is distilled further to become a choreme synthesizing the evolution over time of the study sites in terms of faunal and environmental factors (Fig. 2.8).
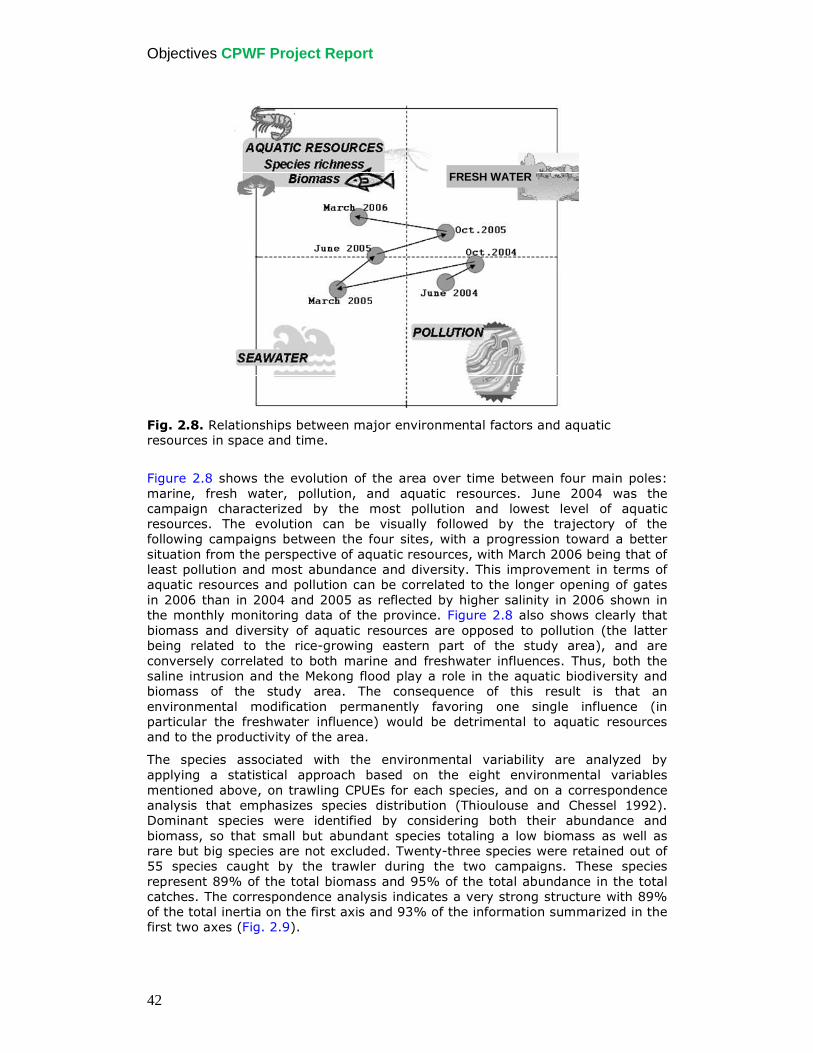
Objectives CPWF Project Report
42
Fig. 2.8. Relationships between major environmental factors and aquatic resources in space and time.
Figure 2.8 shows the evolution of the area over time between four main poles: marine, fresh water, pollution, and aquatic resources. June 2004 was the campaign characterized by the most pollution and lowest level of aquatic resources. The evolution can be visually followed by the trajectory of the following campaigns between the four sites, with a progression toward a better situation from the perspective of aquatic resources, with March 2006 being that of least pollution and most abundance and diversity. This improvement in terms of aquatic resources and pollution can be correlated to the longer opening of gates in 2006 than in 2004 and 2005 as reflected by higher salinity in 2006 shown in the monthly monitoring data of the province. Figure 2.8 also shows clearly that biomass and diversity of aquatic resources are opposed to pollution (the latter being related to the rice-growing eastern part of the study area), and are conversely correlated to both marine and freshwater influences. Thus, both the saline intrusion and the Mekong flood play a role in the aquatic biodiversity and biomass of the study area. The consequence of this result is that an environmental modification permanently favoring one single influence (in particular the freshwater influence) would be detrimental to aquatic resources and to the productivity of the area.
The species associated with the environmental variability are analyzed by applying a statistical approach based on the eight environmental variables mentioned above, on trawling CPUEs for each species, and on a correspondence analysis that emphasizes species distribution (Thioulouse and Chessel 1992). Dominant species were identified by considering both their abundance and biomass, so that small but abundant species totaling a low biomass as well as rare but big species are not excluded. Twenty-three species were retained out of 55 species caught by the trawler during the two campaigns. These species represent 89% of the total biomass and 95% of the total abundance in the total catches. The correspondence analysis indicates a very strong structure with 89% of the total inertia on the first axis and 93% of the information summarized in the first two axes (Fig. 2.9).
FRESH WATERFRESH WATER
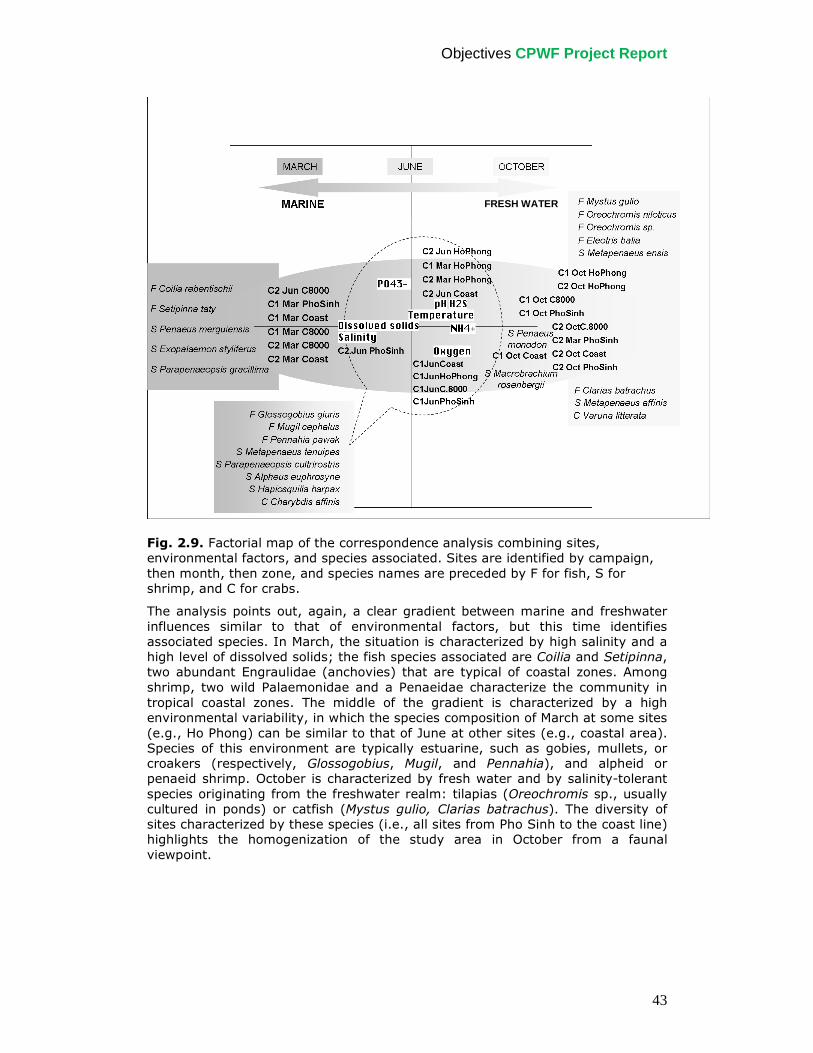
Objectives CPWF Project Report
43
Fig. 2.9. Factorial map of the correspondence analysis combining sites, environmental factors, and species associated. Sites are identified by campaign, then month, then zone, and species names are preceded by F for fish, S for shrimp, and C for crabs.
The analysis points out, again, a clear gradient between marine and freshwater influences similar to that of environmental factors, but this time identifies associated species. In March, the situation is characterized by high salinity and a high level of dissolved solids; the fish species associated are Coilia and Setipinna, two abundant Engraulidae (anchovies) that are typical of coastal zones. Among shrimp, two wild Palaemonidae and a Penaeidae characterize the community in tropical coastal zones. The middle of the gradient is characterized by a high environmental variability, in which the species composition of March at some sites (e.g., Ho Phong) can be similar to that of June at other sites (e.g., coastal area). Species of this environment are typically estuarine, such as gobies, mullets, or croakers (respectively, Glossogobius, Mugil, and Pennahia), and alpheid or penaeid shrimp. October is characterized by fresh water and by salinity-tolerant species originating from the freshwater realm: tilapias (Oreochromis sp., usually cultured in ponds) or catfish (Mystus gulio, Clarias batrachus). The diversity of sites characterized by these species (i.e., all sites from Pho Sinh to the coast line) highlights the homogenization of the study area in October from a faunal viewpoint.
FRESH WATER
Objectives CPWF Project Report
44
Conclusions
• The aquatic resources sampled with 78 species, including 53 fish species, 16
shrimp species, and 6 crab species, show that the study site is relatively rich considering its surface area, and this biodiversity results from a succession and overlap of marine, estuarine, and freshwater faunas depending upon environmental conditions. Species richness is highest in March during the period of peak salinity when marine species make incursions into the estuarine zone.
• In contrast to a high species richness, our study shows that the abundance is poor, with an average catch of 55 grams in gillnets and 373 grams in trawls after two hours. Individual weight of fish is also small (46 grams), whereas that of shrimp amounts to 39 grams; this indicates that shrimp are in fact mainly large prawns escaped from the aquaculture sector.
• Interannual variation is substantial in the study area, with a 60% difference in fish catches from year to year. Seasonal variation is also high, with a 67% difference between the months of least abundance (June and October) and the month of highest abundance (March). Spatially, there is little variation in abundance among the different sites, with the exception of Canal 8000, where abundance is less; abundance is also lower in secondary canals than in primary canals.
• There is a high correlation between species richness and salinity and/or the concentration of dissolved solids, that is, with the marine influence, which is often the case in tropical estuarine environments, where tolerant species from the rich marine realm make incursions.
• A clear negative correlation can also be noted between pollution (in particular in the populated and rice-growing areas) and the abundance and diversity of aquatic resources. Results also show that the Mekong flood itself does not suffice to dissolve or eliminate the pollution. In fact, it is the marine influence that is most beneficial to the abundance and diversity of aquatic resources in that area.
• It was clear from the local fishermen interviews that pollution and acidity were two important factors driving fish abundance, and that pollution becomes a problem when the sluice gates remain closed for extended periods of time.
2.3 Assessing water quality in Bangladesh
Methodology
Two sites, Batiaghata in Khulna District and Tala in Satkhira District, were chosen for this study. In Batiaghata, farmers mostly cultivate a single rice crop in the wet season under rainfed conditions but in Tala many farmers cultivate dry-season rice by using groundwater in addition to rainfed rice in the wet season. Two rivers, the Kazibachha (Fig. 2.10) in Batiaghata and the Kobadak (Fig. 2.11) in Tala, were selected for monitoring salinity dynamics. The EC of river water was measured twice a day during flood and ebb-tide periods at the Birat ferry on the Kazibachha and at the Jetua and Gonali ferries on the Kobadak.
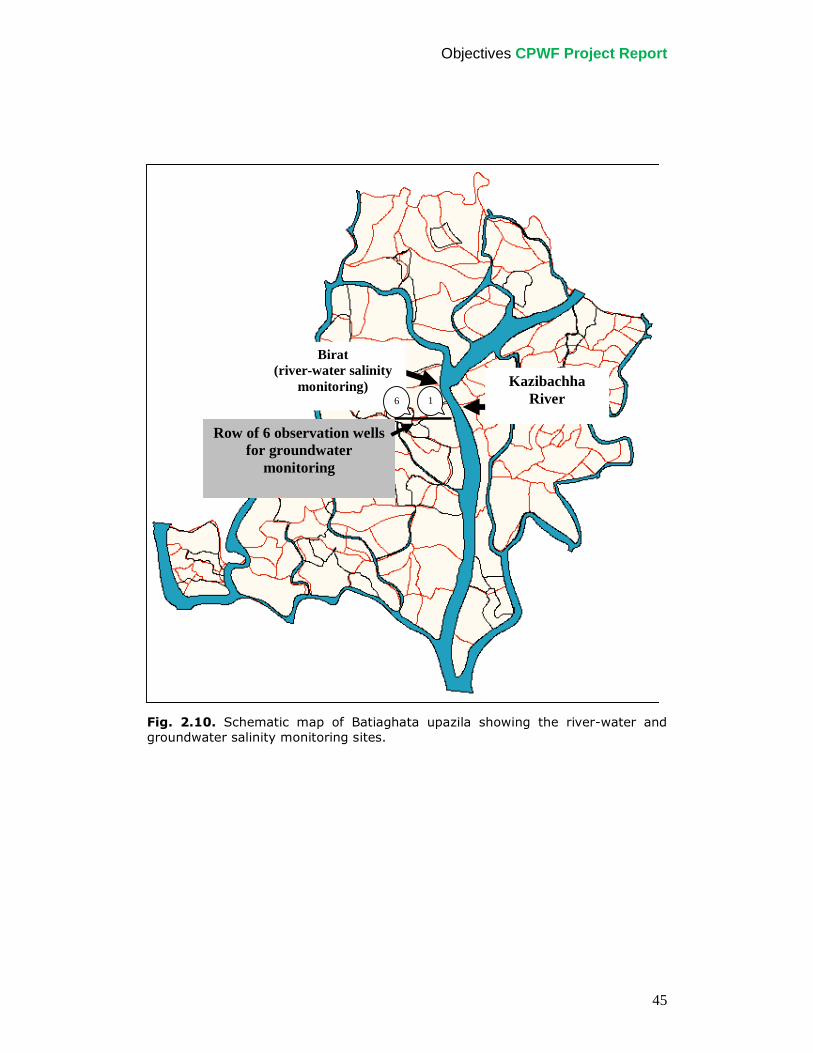
Objectives CPWF Project Report
45
Fig. 2.10. Schematic map of Batiaghata upazila showing the river-water and groundwater salinity monitoring sites.
Kazibachha River
Birat (river-water salinity
monitoring)
Row of 6 observation wells for groundwater
monitoring
1 6
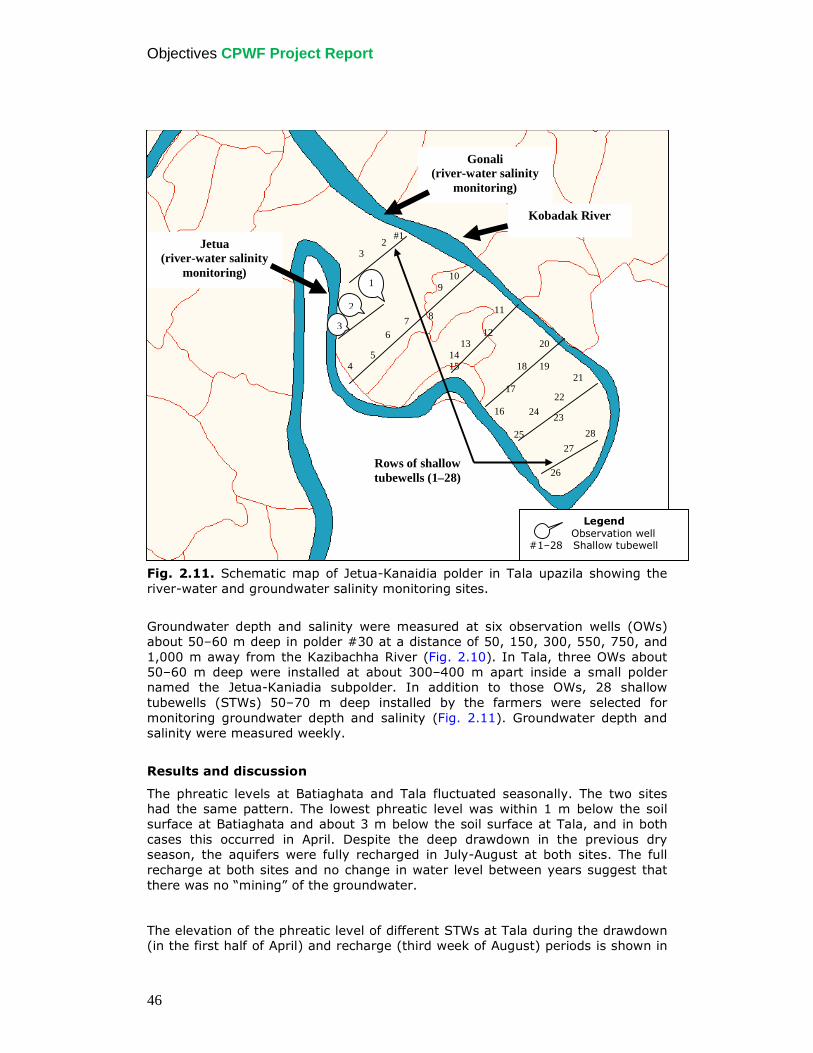
Objectives CPWF Project Report
46
Fig. 2.11. Schematic map of Jetua-Kanaidia polder in Tala upazila showing the river-water and groundwater salinity monitoring sites.
Groundwater depth and salinity were measured at six observation wells (OWs) about 50–60 m deep in polder #30 at a distance of 50, 150, 300, 550, 750, and 1,000 m away from the Kazibachha River (Fig. 2.10). In Tala, three OWs about 50–60 m deep were installed at about 300–400 m apart inside a small polder named the Jetua-Kaniadia subpolder. In addition to those OWs, 28 shallow tubewells (STWs) 50–70 m deep installed by the farmers were selected for monitoring groundwater depth and salinity (Fig. 2.11). Groundwater depth and salinity were measured weekly.
Results and discussion
The phreatic levels at Batiaghata and Tala fluctuated seasonally. The two sites had the same pattern. The lowest phreatic level was within 1 m below the soil surface at Batiaghata and about 3 m below the soil surface at Tala, and in both cases this occurred in April. Despite the deep drawdown in the previous dry season, the aquifers were fully recharged in July-August at both sites. The full recharge at both sites and no change in water level between years suggest that there was no “mining” of the groundwater.
The elevation of the phreatic level of different STWs at Tala during the drawdown (in the first half of April) and recharge (third week of August) periods is shown in
Kobadak River
Gonali (river-water salinity
monitoring)
Jetua (river-water salinity
monitoring)
Rows of shallow tubewells (1–28)
#1 2
3
4 5
6 7 8
9 10
11
12 13
14 15
16
17
18 19
20
21
23 24
25
26
27
28
22
1
2
3
Legend
Observation well #1–28 Shallow tubewell
3
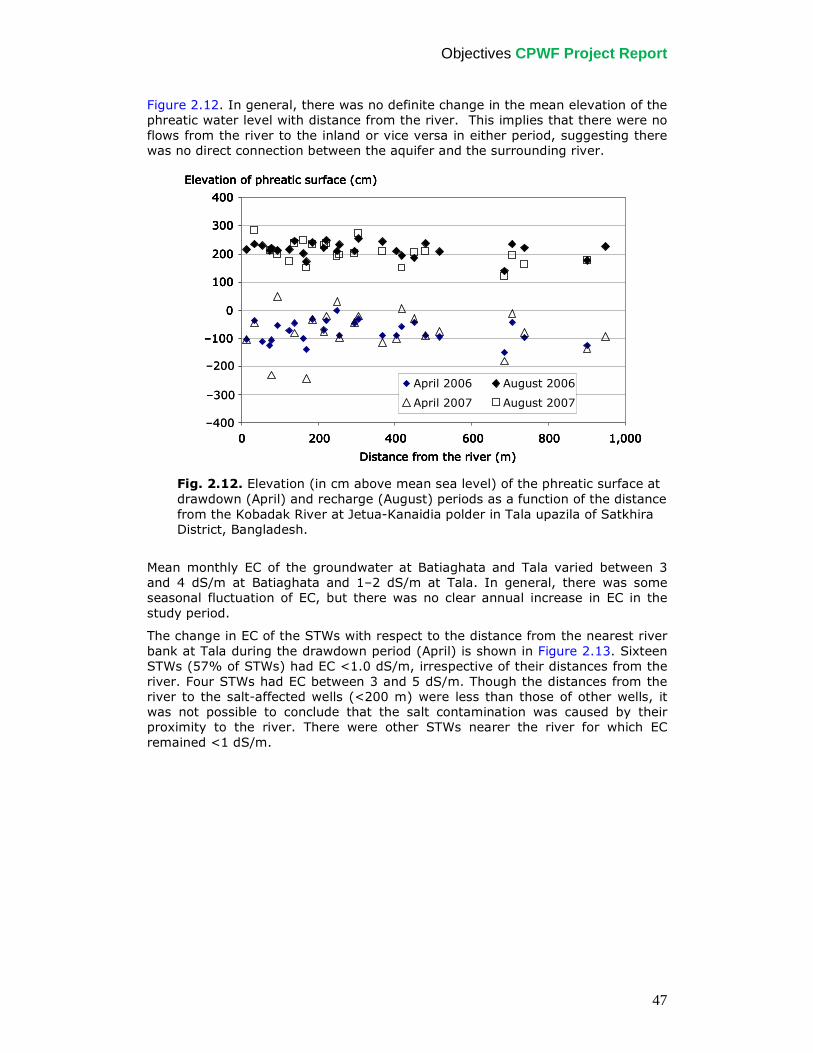
Objectives CPWF Project Report
47
Figure 2.12. In general, there was no definite change in the mean elevation of the phreatic water level with distance from the river. This implies that there were no flows from the river to the inland or vice versa in either period, suggesting there was no direct connection between the aquifer and the surrounding river.
Fig. 2.12. Elevation (in cm above mean sea level) of the phreatic surface at drawdown (April) and recharge (August) periods as a function of the distance from the Kobadak River at Jetua-Kanaidia polder in Tala upazila of Satkhira District, Bangladesh.
Mean monthly EC of the groundwater at Batiaghata and Tala varied between 3 and 4 dS/m at Batiaghata and 1–2 dS/m at Tala. In general, there was some seasonal fluctuation of EC, but there was no clear annual increase in EC in the study period.
The change in EC of the STWs with respect to the distance from the nearest river bank at Tala during the drawdown period (April) is shown in Figure 2.13. Sixteen STWs (57% of STWs) had EC <1.0 dS/m, irrespective of their distances from the river. Four STWs had EC between 3 and 5 dS/m. Though the distances from the river to the salt-affected wells (<200 m) were less than those of other wells, it was not possible to conclude that the salt contamination was caused by their proximity to the river. There were other STWs nearer the river for which EC remained <1 dS/m.
–400
–300
–100
0
100
200
300
400
0 200 400 600 800 1,000
Distance from the river (m)
Elevation of phreatic surface (cm)
April 2006 August 2006
April 2007 August 2007
–200
–100
0
100
200
300
400
0 200 400 600 800 1,000
Distance from the river (m)
Elevation of phreatic surface (cm)
April 2006 August 2006
April 2007 August 2007
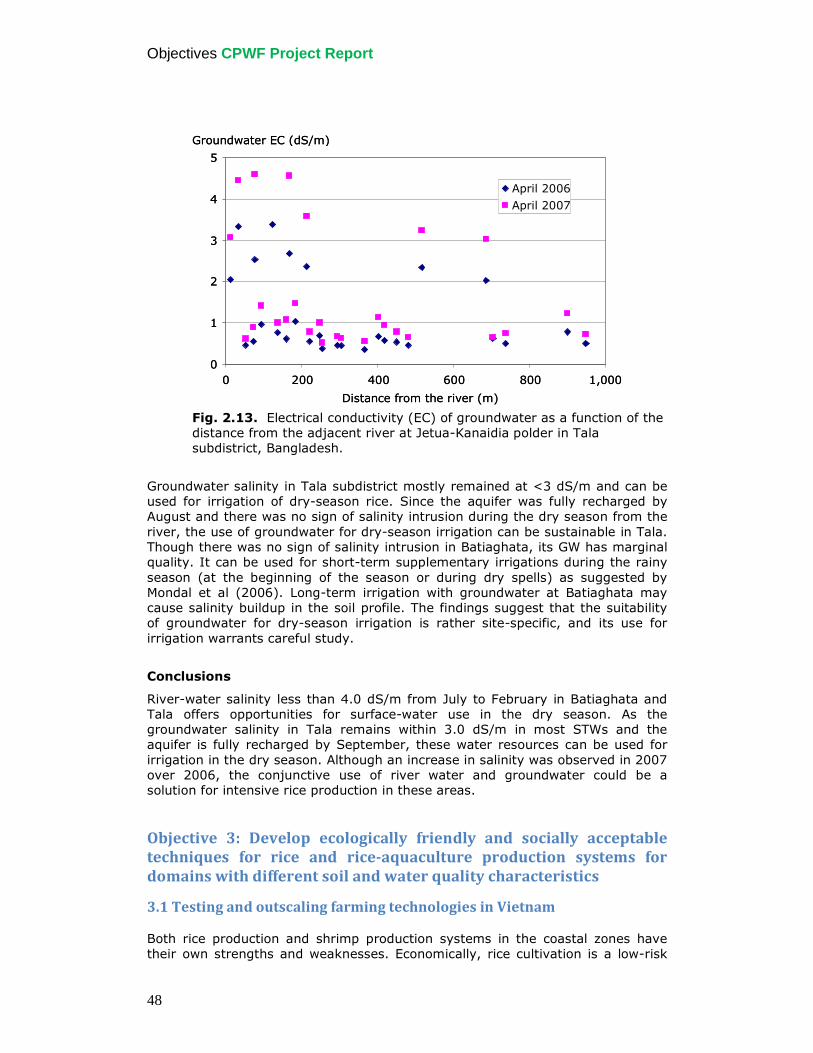
Objectives CPWF Project Report
48
Fig. 2.13. Electrical conductivity (EC) of groundwater as a function of the distance from the adjacent river at Jetua-Kanaidia polder in Tala subdistrict, Bangladesh.
Groundwater salinity in Tala subdistrict mostly remained at <3 dS/m and can be used for irrigation of dry-season rice. Since the aquifer was fully recharged by August and there was no sign of salinity intrusion during the dry season from the river, the use of groundwater for dry-season irrigation can be sustainable in Tala. Though there was no sign of salinity intrusion in Batiaghata, its GW has marginal quality. It can be used for short-term supplementary irrigations during the rainy season (at the beginning of the season or during dry spells) as suggested by Mondal et al (2006). Long-term irrigation with groundwater at Batiaghata may cause salinity buildup in the soil profile. The findings suggest that the suitability of groundwater for dry-season irrigation is rather site-specific, and its use for irrigation warrants careful study.
Conclusions
River-water salinity less than 4.0 dS/m from July to February in Batiaghata and Tala offers opportunities for surface-water use in the dry season. As the groundwater salinity in Tala remains within 3.0 dS/m in most STWs and the aquifer is fully recharged by September, these water resources can be used for irrigation in the dry season. Although an increase in salinity was observed in 2007 over 2006, the conjunctive use of river water and groundwater could be a solution for intensive rice production in these areas. Objective 3: Develop ecologically friendly and socially acceptable
techniques for rice and rice-aquaculture production systems for
domains with different soil and water quality characteristics
3.1 Testing and outscaling farming technologies in Vietnam Both rice production and shrimp production systems in the coastal zones have their own strengths and weaknesses. Economically, rice cultivation is a low-risk
0
1
2
3
4
5
0 200 400 600 800 1,000
Distance from the river (m)
Groundwater EC (dS/m)
April 2006April 2007
0
1
2
3
4
5
0 200 400 600 800 1,000
Distance from the river (m)
Groundwater EC (dS/m)
April 2006April 2007
Objectives CPWF Project Report
49
enterprise, but it brings low income. Shrimp cultivation, on the other hand, can be very profitable but is subject to market fluctuations and very high risk of mass mortality due to diseases. The challenge is to find production systems and technologies that enhance economic profitability and reduce the risk. We hypothesized that diversification and poly-culture (i.e., growing more than one crop/commodity at the same time in the same field) with suitable technologies can contribute greatly to increased profitability and reduced risk for both rice-based and shrimp-based production systems in the coastal zone. The objective of this study was to test the above hypothesis by comparing selected diversified and poly-culture production systems and improved technologies with farmers’ traditional ones in the coastal Bac Lieu Province. It also aimed at using a participatory approach in field-evaluating the new systems and improved technologies and outscaling those that proved to generate more benefits for farmers.
Methodology
The cropping systems were tested in Bac Lieu Province, located at the southern part of the Mekong River Delta of Vietnam, at the interface between saline-water sources from the surrounding seas and fresh water of the Mekong River. The area was divided into seven land-use zones (LUZ, Hoanh et al 2003): three of them (LUZs 1–3) have freshwater ecologies, two (LUZs 6 and 7) saline-water ecologies, and two (LUZs 4 and 5) intermediate types between freshwater and saline-water ecologies. Local authorities, extension workers, and representatives of farmers selected one or two “testing sites.” At each testing site, the farmer community selected one demonstration farm (demo) and five nearby farms (controls) where farming activities were managed under current practices. The demos tested new diversified cropping systems, poly-culture, and new improved technologies, which were agreed upon by the participating farmers, researchers, and extension workers (REW).
Compared with the controls, the tested cropping system in freshwater zones had an additional upland crop after the DS rice crop or stocking of genetically modified farm tilapia (GIFT) in the rice field, that is, poly-culture of rice and fish (R&F), in the wet season. The new elements in the cropping systems at the saline sites were poly-culture of shrimp and crab (S&C—by stocking crabs during the shrimp-raising periods) and an additional brackish-water fish (GIFT or elongated goby, Pseudapocryptes elongates) during the wet season, after the shrimp harvest. The new elements in the intermediate water quality zone were the stocking of GIFT in the rice field in the shrimp-rice system. Farmers also tested the component technologies: sowing rice seeds with drum seeders (www.knowledgebank.irri.org/PlantEstablish/WebHelp/Plant_lesson06.htm) and site-specific management of nitrogen fertilizer using a leaf color chart (LCC; www.irri.org/irrc/ssnm/index.asp), high-quality yet high-yielding varieties of rice (for freshwater zones), or varieties that had better tolerance of salinity (for intermediate water quality zones).
Participating farmer families implemented the demos with technical support from REW. At the end of each cropping season, farmer-managed on-farm workshops—attended by local authorities, community associations, press, farmers—compared the ease of implementation, yield, profit, and benefit-cost of the demos vs. farmers’ common practices. At the end of the three-year study, final on-farm workshops gave final ratings and recommendations for the tested cropping systems and their component technologies. The superior cropping systems and technologies were endorsed by local authorities for wide dissemination throughout the respective LUZs. The authorities also gave directives and support
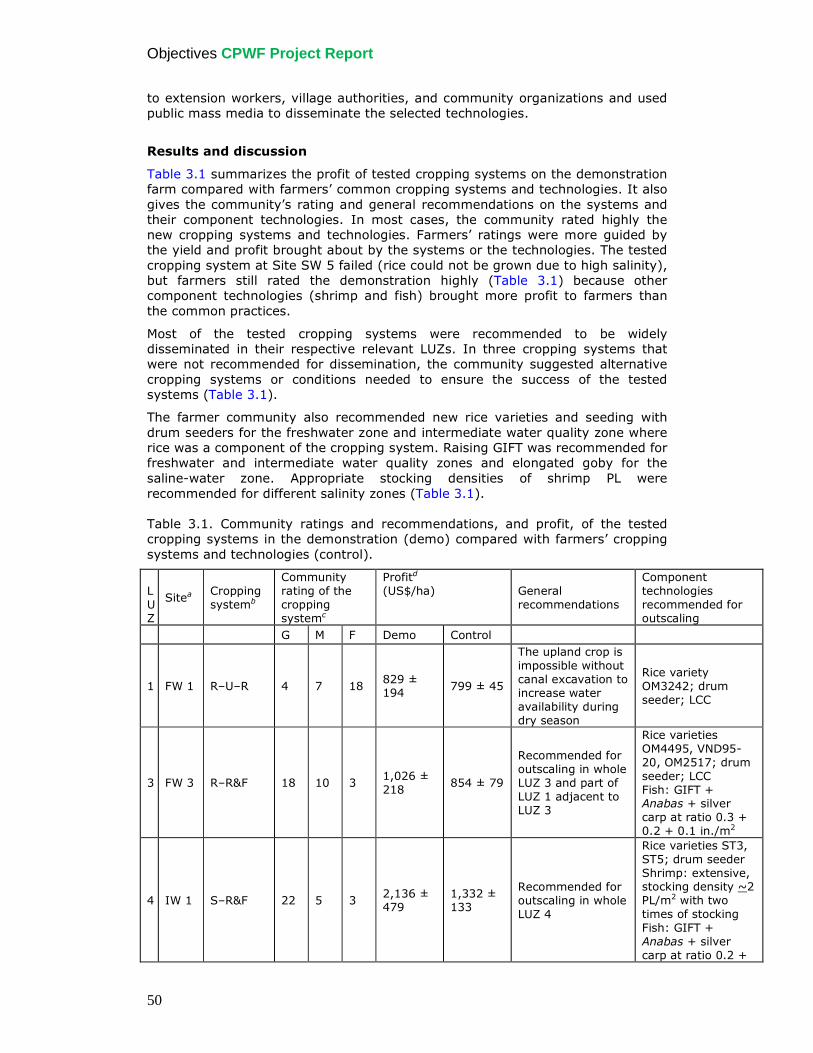
Objectives CPWF Project Report
50
to extension workers, village authorities, and community organizations and used public mass media to disseminate the selected technologies.
Results and discussion
Table 3.1 summarizes the profit of tested cropping systems on the demonstration farm compared with farmers’ common cropping systems and technologies. It also gives the community’s rating and general recommendations on the systems and their component technologies. In most cases, the community rated highly the new cropping systems and technologies. Farmers’ ratings were more guided by the yield and profit brought about by the systems or the technologies. The tested cropping system at Site SW 5 failed (rice could not be grown due to high salinity), but farmers still rated the demonstration highly (Table 3.1) because other component technologies (shrimp and fish) brought more profit to farmers than the common practices.
Most of the tested cropping systems were recommended to be widely disseminated in their respective relevant LUZs. In three cropping systems that were not recommended for dissemination, the community suggested alternative cropping systems or conditions needed to ensure the success of the tested systems (Table 3.1).
The farmer community also recommended new rice varieties and seeding with drum seeders for the freshwater zone and intermediate water quality zone where rice was a component of the cropping system. Raising GIFT was recommended for freshwater and intermediate water quality zones and elongated goby for the saline-water zone. Appropriate stocking densities of shrimp PL were recommended for different salinity zones (Table 3.1). Table 3.1. Community ratings and recommendations, and profit, of the tested cropping systems in the demonstration (demo) compared with farmers’ cropping systems and technologies (control).
LUZ
Sitea Cropping systemb
Community rating of the cropping systemc
Profitd (US$/ha) General
recommendations
Component technologies recommended for outscaling
G M F Demo Control
1
FW 1 R–U–R 4 7 18 829 ± 194 799 ± 45
The upland crop is impossible without canal excavation to increase water availability during dry season
Rice variety OM3242; drum seeder; LCC
3
FW 3 R–R&F 18 10 3 1,026 ± 218
854 ± 79
Recommended for outscaling in whole LUZ 3 and part of LUZ 1 adjacent to LUZ 3
Rice varieties OM4495, VND95-20, OM2517; drum seeder; LCC Fish: GIFT + Anabas + silver carp at ratio 0.3 + 0.2 + 0.1 in./m2
4
IW 1 S–R&F 22 5 3 2,136 ± 479
1,332 ± 133
Recommended for outscaling in whole LUZ 4
Rice varieties ST3, ST5; drum seeder Shrimp: extensive, stocking density ~2 PL/m2 with two times of stocking Fish: GIFT + Anabas + silver carp at ratio 0.2 +
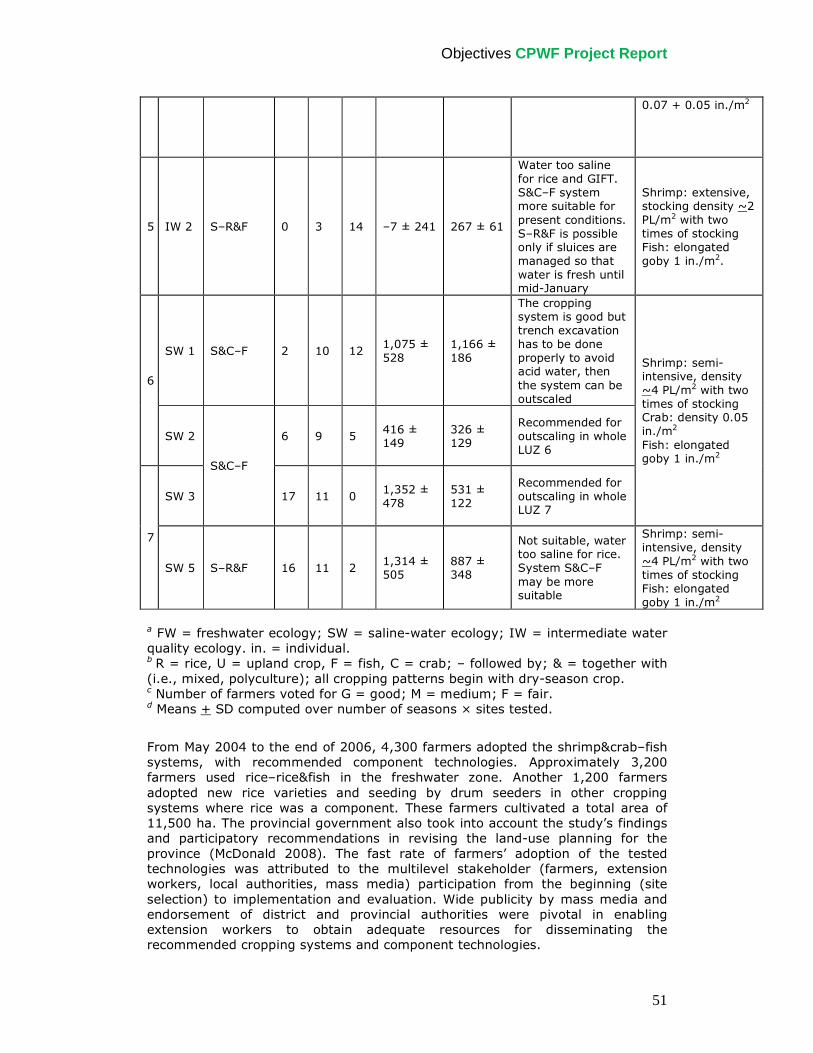
Objectives CPWF Project Report
51
0.07 + 0.05 in./m2
5
IW 2 S–R&F 0 3 14 –7 ± 241 267 ± 61
Water too saline for rice and GIFT. S&C–F system more suitable for present conditions. S–R&F is possible only if sluices are managed so that water is fresh until mid-January
Shrimp: extensive, stocking density ~2 PL/m2 with two times of stocking Fish: elongated goby 1 in./m2.
SW 1 S&C–F 2 10 12 1,075 ± 528
1,166 ± 186
The cropping system is good but trench excavation has to be done properly to avoid acid water, then the system can be outscaled
6
SW 2 6 9 5 416 ± 149
326 ± 129
Recommended for outscaling in whole LUZ 6
SW 3
S&C–F
17 11 0 1,352 ± 478
531 ± 122
Recommended for outscaling in whole LUZ 7
Shrimp: semi-intensive, density ~4 PL/m2 with two times of stocking Crab: density 0.05 in./m2 Fish: elongated goby 1 in./m2
7 SW 5 S–R&F 16 11 2
1,314 ± 505
887 ± 348
Not suitable, water too saline for rice. System S&C–F may be more suitable
Shrimp: semi-intensive, density ~4 PL/m2 with two times of stocking Fish: elongated goby 1 in./m2
a FW = freshwater ecology; SW = saline-water ecology; IW = intermediate water quality ecology. in. = individual. b R = rice, U = upland crop, F = fish, C = crab; – followed by; & = together with (i.e., mixed, polyculture); all cropping patterns begin with dry-season crop. c Number of farmers voted for G = good; M = medium; F = fair. d Means + SD computed over number of seasons × sites tested.
From May 2004 to the end of 2006, 4,300 farmers adopted the shrimp&crab–fish systems, with recommended component technologies. Approximately 3,200 farmers used rice–rice&fish in the freshwater zone. Another 1,200 farmers adopted new rice varieties and seeding by drum seeders in other cropping systems where rice was a component. These farmers cultivated a total area of 11,500 ha. The provincial government also took into account the study’s findings and participatory recommendations in revising the land-use planning for the province (McDonald 2008). The fast rate of farmers’ adoption of the tested technologies was attributed to the multilevel stakeholder (farmers, extension workers, local authorities, mass media) participation from the beginning (site selection) to implementation and evaluation. Wide publicity by mass media and endorsement of district and provincial authorities were pivotal in enabling extension workers to obtain adequate resources for disseminating the recommended cropping systems and component technologies.
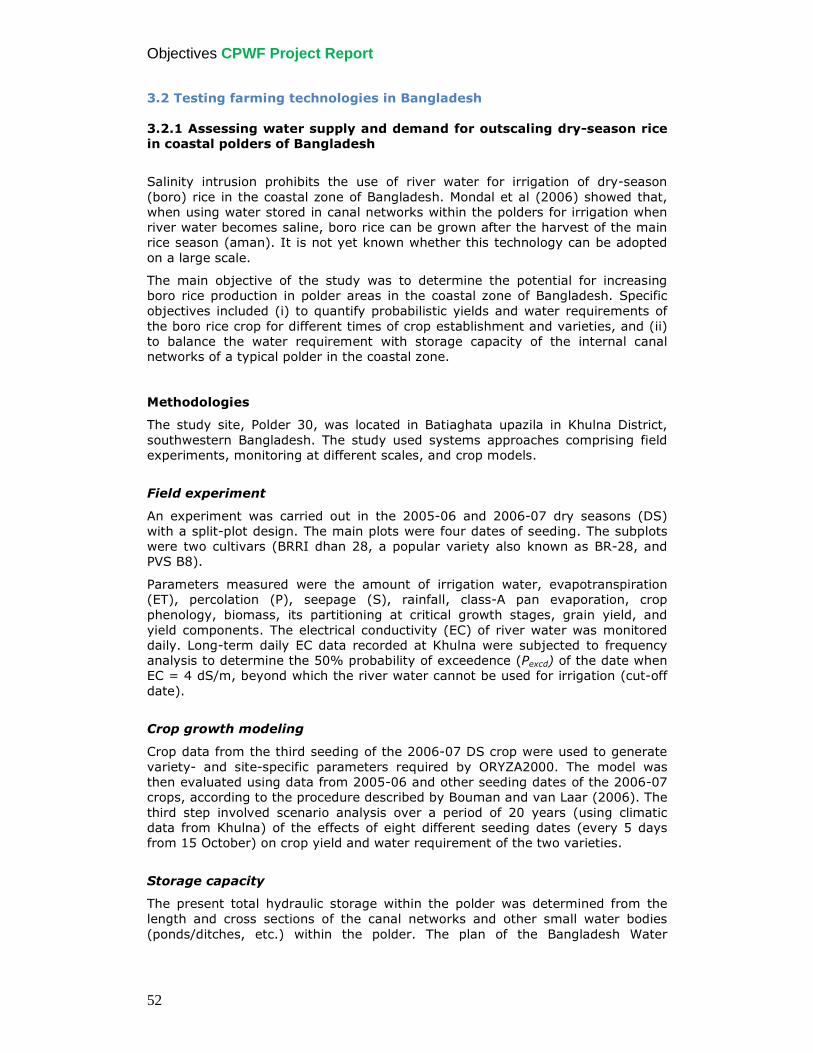
Objectives CPWF Project Report
52
3.2 Testing farming technologies in Bangladesh
3.2.1 Assessing water supply and demand for outscaling dry-season rice
in coastal polders of Bangladesh
Salinity intrusion prohibits the use of river water for irrigation of dry-season (boro) rice in the coastal zone of Bangladesh. Mondal et al (2006) showed that, when using water stored in canal networks within the polders for irrigation when river water becomes saline, boro rice can be grown after the harvest of the main rice season (aman). It is not yet known whether this technology can be adopted on a large scale.
The main objective of the study was to determine the potential for increasing boro rice production in polder areas in the coastal zone of Bangladesh. Specific objectives included (i) to quantify probabilistic yields and water requirements of the boro rice crop for different times of crop establishment and varieties, and (ii) to balance the water requirement with storage capacity of the internal canal networks of a typical polder in the coastal zone.
Methodologies
The study site, Polder 30, was located in Batiaghata upazila in Khulna District, southwestern Bangladesh. The study used systems approaches comprising field experiments, monitoring at different scales, and crop models.
Field experiment
An experiment was carried out in the 2005-06 and 2006-07 dry seasons (DS) with a split-plot design. The main plots were four dates of seeding. The subplots were two cultivars (BRRI dhan 28, a popular variety also known as BR-28, and PVS B8).
Parameters measured were the amount of irrigation water, evapotranspiration (ET), percolation (P), seepage (S), rainfall, class-A pan evaporation, crop phenology, biomass, its partitioning at critical growth stages, grain yield, and yield components. The electrical conductivity (EC) of river water was monitored daily. Long-term daily EC data recorded at Khulna were subjected to frequency analysis to determine the 50% probability of exceedence (Pexcd) of the date when EC = 4 dS/m, beyond which the river water cannot be used for irrigation (cut-off date).
Crop growth modeling
Crop data from the third seeding of the 2006-07 DS crop were used to generate variety- and site-specific parameters required by ORYZA2000. The model was then evaluated using data from 2005-06 and other seeding dates of the 2006-07 crops, according to the procedure described by Bouman and van Laar (2006). The third step involved scenario analysis over a period of 20 years (using climatic data from Khulna) of the effects of eight different seeding dates (every 5 days from 15 October) on crop yield and water requirement of the two varieties.
Storage capacity
The present total hydraulic storage within the polder was determined from the length and cross sections of the canal networks and other small water bodies (ponds/ditches, etc.) within the polder. The plan of the Bangladesh Water
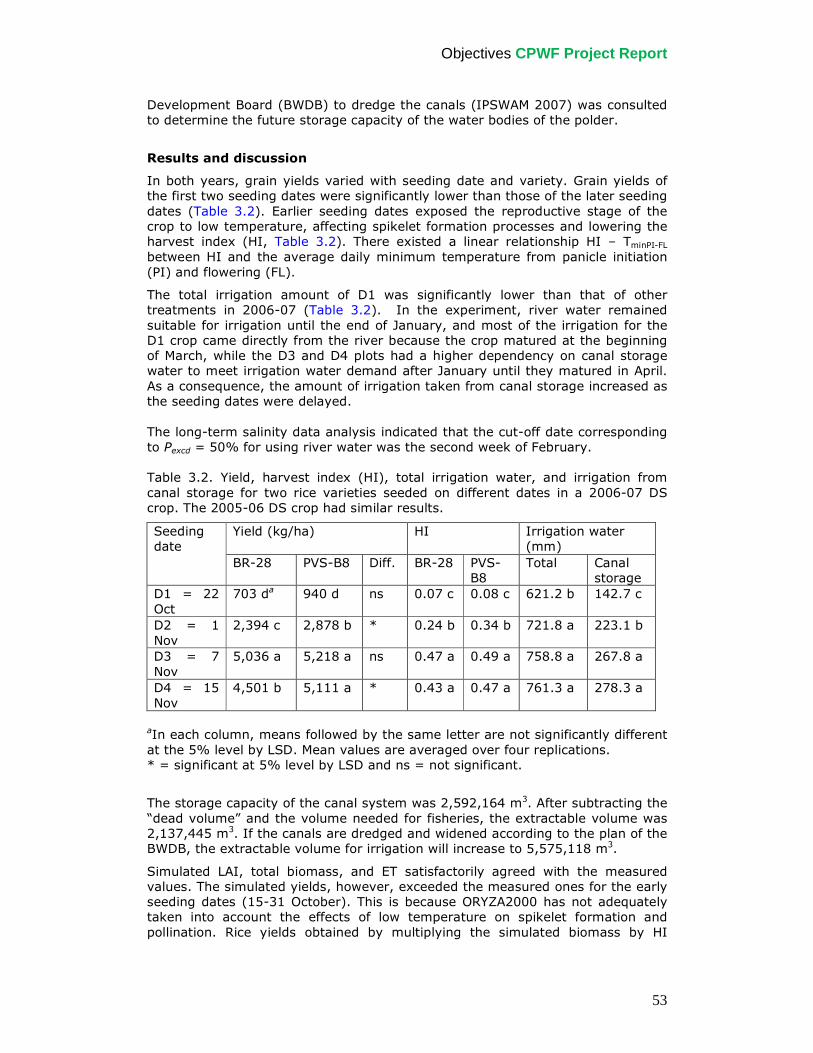
Objectives CPWF Project Report
53
Development Board (BWDB) to dredge the canals (IPSWAM 2007) was consulted to determine the future storage capacity of the water bodies of the polder.
Results and discussion
In both years, grain yields varied with seeding date and variety. Grain yields of the first two seeding dates were significantly lower than those of the later seeding dates (Table 3.2). Earlier seeding dates exposed the reproductive stage of the crop to low temperature, affecting spikelet formation processes and lowering the harvest index (HI, Table 3.2). There existed a linear relationship HI – TminPI-FL between HI and the average daily minimum temperature from panicle initiation (PI) and flowering (FL).
The total irrigation amount of D1 was significantly lower than that of other treatments in 2006-07 (Table 3.2). In the experiment, river water remained suitable for irrigation until the end of January, and most of the irrigation for the D1 crop came directly from the river because the crop matured at the beginning of March, while the D3 and D4 plots had a higher dependency on canal storage water to meet irrigation water demand after January until they matured in April. As a consequence, the amount of irrigation taken from canal storage increased as the seeding dates were delayed. The long-term salinity data analysis indicated that the cut-off date corresponding to Pexcd = 50% for using river water was the second week of February. Table 3.2. Yield, harvest index (HI), total irrigation water, and irrigation from canal storage for two rice varieties seeded on different dates in a 2006-07 DS crop. The 2005-06 DS crop had similar results.
Yield (kg/ha) HI Irrigation water (mm)
Seeding date
BR-28 PVS-B8 Diff. BR-28 PVS-B8
Total Canal storage
D1 = 22 Oct
703 da 940 d ns 0.07 c 0.08 c 621.2 b 142.7 c
D2 = 1 Nov
2,394 c 2,878 b * 0.24 b 0.34 b 721.8 a 223.1 b
D3 = 7 Nov
5,036 a 5,218 a ns 0.47 a 0.49 a 758.8 a 267.8 a
D4 = 15 Nov
4,501 b 5,111 a * 0.43 a 0.47 a 761.3 a 278.3 a
aIn each column, means followed by the same letter are not significantly different at the 5% level by LSD. Mean values are averaged over four replications. * = significant at 5% level by LSD and ns = not significant.
The storage capacity of the canal system was 2,592,164 m3. After subtracting the “dead volume” and the volume needed for fisheries, the extractable volume was 2,137,445 m3. If the canals are dredged and widened according to the plan of the BWDB, the extractable volume for irrigation will increase to 5,575,118 m3.
Simulated LAI, total biomass, and ET satisfactorily agreed with the measured values. The simulated yields, however, exceeded the measured ones for the early seeding dates (15-31 October). This is because ORYZA2000 has not adequately taken into account the effects of low temperature on spikelet formation and pollination. Rice yields obtained by multiplying the simulated biomass by HI
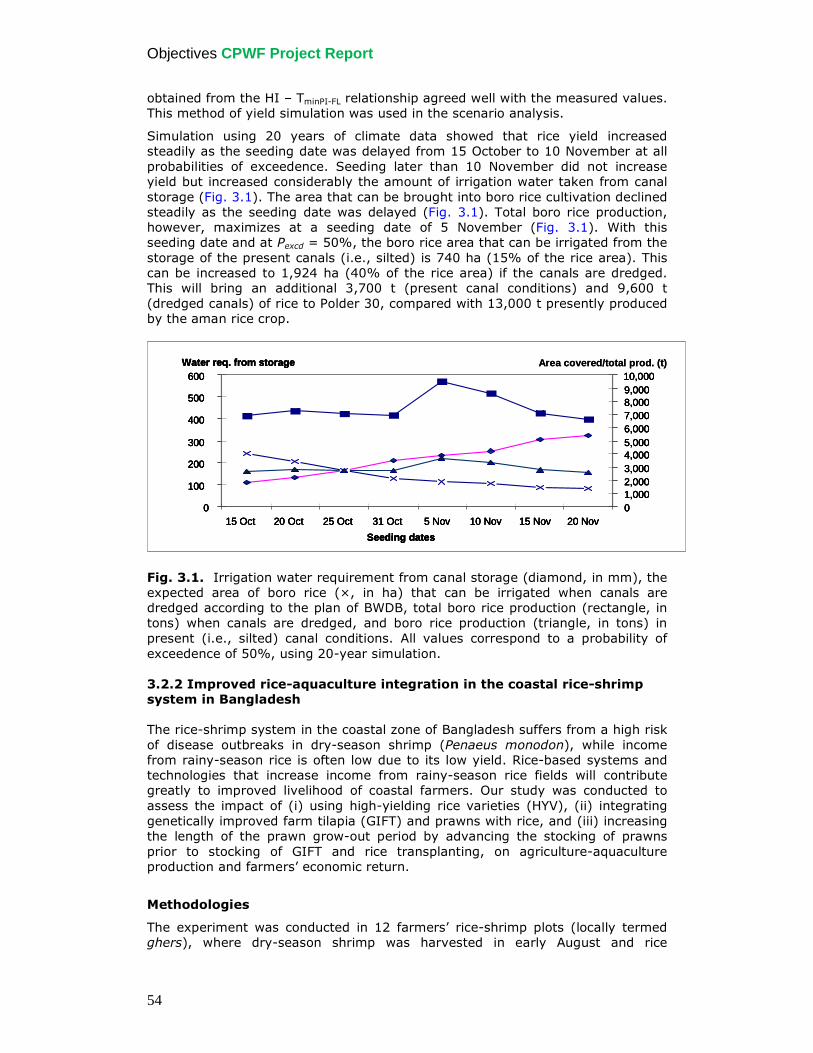
Objectives CPWF Project Report
54
obtained from the HI – TminPI-FL relationship agreed well with the measured values. This method of yield simulation was used in the scenario analysis.
Simulation using 20 years of climate data showed that rice yield increased steadily as the seeding date was delayed from 15 October to 10 November at all probabilities of exceedence. Seeding later than 10 November did not increase yield but increased considerably the amount of irrigation water taken from canal storage (Fig. 3.1). The area that can be brought into boro rice cultivation declined steadily as the seeding date was delayed (Fig. 3.1). Total boro rice production, however, maximizes at a seeding date of 5 November (Fig. 3.1). With this seeding date and at Pexcd = 50%, the boro rice area that can be irrigated from the storage of the present canals (i.e., silted) is 740 ha (15% of the rice area). This can be increased to 1,924 ha (40% of the rice area) if the canals are dredged. This will bring an additional 3,700 t (present canal conditions) and 9,600 t (dredged canals) of rice to Polder 30, compared with 13,000 t presently produced by the aman rice crop. Fig. 3.1. Irrigation water requirement from canal storage (diamond, in mm), the expected area of boro rice (×, in ha) that can be irrigated when canals are dredged according to the plan of BWDB, total boro rice production (rectangle, in tons) when canals are dredged, and boro rice production (triangle, in tons) in present (i.e., silted) canal conditions. All values correspond to a probability of exceedence of 50%, using 20-year simulation. 3.2.2 Improved rice-aquaculture integration in the coastal rice-shrimp
system in Bangladesh
The rice-shrimp system in the coastal zone of Bangladesh suffers from a high risk of disease outbreaks in dry-season shrimp (Penaeus monodon), while income from rainy-season rice is often low due to its low yield. Rice-based systems and technologies that increase income from rainy-season rice fields will contribute greatly to improved livelihood of coastal farmers. Our study was conducted to assess the impact of (i) using high-yielding rice varieties (HYV), (ii) integrating genetically improved farm tilapia (GIFT) and prawns with rice, and (iii) increasing the length of the prawn grow-out period by advancing the stocking of prawns prior to stocking of GIFT and rice transplanting, on agriculture-aquaculture production and farmers’ economic return.
Methodologies
The experiment was conducted in 12 farmers’ rice-shrimp plots (locally termed ghers), where dry-season shrimp was harvested in early August and rice
0
100
200
300
400
500
600
15 Oct 20 Oct 25 Oct 31 Oct 5 Nov 10 Nov 15 Nov 20 Nov
Seeding dates
Water req. from storage
01,0002,0003,0004,0005,0006,0007,0008,0009,00010,000
0
100
200
300
400
500
600
15 Oct 20 Oct 25 Oct 31 Oct 5 Nov 10 Nov 15 Nov 20 Nov
Seeding dates
Water req. from storage
01,0002,0003,0004,0005,0006,0007,0008,0009,00010,000
Area covered/total prod. (t)
0
100
200
300
400
500
600
15 Oct 20 Oct 25 Oct 31 Oct 5 Nov 10 Nov 15 Nov 20 Nov
Seeding dates
Water req. from storage
01,0002,0003,0004,0005,0006,0007,0008,0009,00010,000
0
100
200
300
400
500
600
15 Oct 20 Oct 25 Oct 31 Oct 5 Nov 10 Nov 15 Nov 20 Nov
Seeding dates
Water req. from storage
01,0002,0003,0004,0005,0006,0007,0008,0009,00010,000
Area covered/total prod. (t)
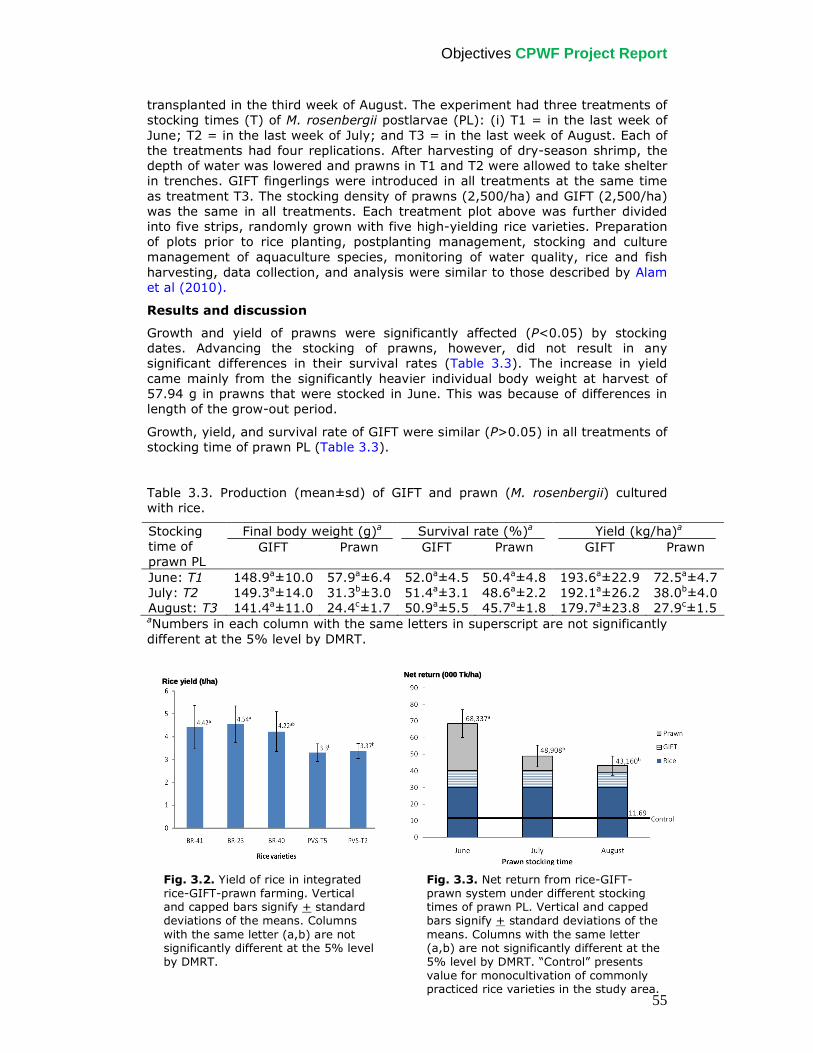
Objectives CPWF Project Report
55
transplanted in the third week of August. The experiment had three treatments of stocking times (T) of M. rosenbergii postlarvae (PL): (i) T1 = in the last week of June; T2 = in the last week of July; and T3 = in the last week of August. Each of the treatments had four replications. After harvesting of dry-season shrimp, the depth of water was lowered and prawns in T1 and T2 were allowed to take shelter in trenches. GIFT fingerlings were introduced in all treatments at the same time as treatment T3. The stocking density of prawns (2,500/ha) and GIFT (2,500/ha) was the same in all treatments. Each treatment plot above was further divided into five strips, randomly grown with five high-yielding rice varieties. Preparation of plots prior to rice planting, postplanting management, stocking and culture management of aquaculture species, monitoring of water quality, rice and fish harvesting, data collection, and analysis were similar to those described by Alam et al (2010).
Results and discussion
Growth and yield of prawns were significantly affected (P<0.05) by stocking dates. Advancing the stocking of prawns, however, did not result in any significant differences in their survival rates (Table 3.3). The increase in yield came mainly from the significantly heavier individual body weight at harvest of 57.94 g in prawns that were stocked in June. This was because of differences in length of the grow-out period.
Growth, yield, and survival rate of GIFT were similar (P>0.05) in all treatments of stocking time of prawn PL (Table 3.3). Table 3.3. Production (mean±sd) of GIFT and prawn (M. rosenbergii) cultured with rice.
Final body weight (g)a Survival rate (%)a Yield (kg/ha)a Stocking time of prawn PL
GIFT Prawn GIFT Prawn GIFT Prawn
June: T1 148.9a±10.0 57.9a±6.4 52.0a±4.5 50.4a±4.8 193.6a±22.9 72.5a±4.7 July: T2 149.3a±14.0 31.3b±3.0 51.4a±3.1 48.6a±2.2 192.1a±26.2 38.0b±4.0 August: T3 141.4a±11.0 24.4c±1.7 50.9a±5.5 45.7a±1.8 179.7a±23.8 27.9c±1.5 aNumbers in each column with the same letters in superscript are not significantly different at the 5% level by DMRT.
Rice yield (t/ha)Rice yield (t/ha)Net return (000 Tk/ha)Net return (000 Tk/ha)
Fig. 3.2. Yield of rice in integrated rice-GIFT-prawn farming. Vertical and capped bars signify + standard deviations of the means. Columns with the same letter (a,b) are not significantly different at the 5% level by DMRT.
Fig. 3.3. Net return from rice-GIFT-prawn system under different stocking times of prawn PL. Vertical and capped bars signify + standard deviations of the means. Columns with the same letter (a,b) are not significantly different at the 5% level by DMRT. “Control” presents value for monocultivation of commonly practiced rice varieties in the study area.
Objectives CPWF Project Report
56
There was no significant interaction between times of PL stocking and rice varieties. Yields of BR-23 and BRRIdhan-41 were significantly higher than those of PVS-T5 and PVS-T2 (Fig. 3.2). All tested varieties yielded higher than the yield range of 1.83–2.59 t/ha (Anon. 2007) that the farmers currently harvest from local varieties grown in the rice-shrimp system. For all varieties, the average net return from cultivation of HYV of rice was Tk 30,110/ha (US$1 = Tk 68), with a benefit-cost ratio of 2.40. The equivalent value for monocultivation of the commonly used rice varieties in farmers’ fields in the study area has been reported as Tk 11,690/ha (Anon. 2007). The total net return from the rice-GIFT-prawn system varied significantly (P<0.05) with prawn PL stocking times (Fig. 3.3). The difference came from a higher return from prawns in T1 than from those in T3. This demonstrates that stocking of PL together with the increase in prawn grow-out period can yield considerably higher economic returns.
Objective 4: Develop decision-support tools and an institutional
framework for integrated multipurpose management of a dual
freshwater and brackish-water regime
4.1 Developing a new acidity module for water quality modeling
Methodologies
Hydraulic and salinity models have been developed and applied previously to simulate tidal propagation and salinity intrusion, and to analyze the effects of water management on hydrological conditions that control land use in coastal zones. The DFID-R7467c project demonstrated the effective use of the Vietnam River Systems and Plains (VRSAP) hydro-salinity model to support water management decisions within the salinity-protected area (Hoanh et al 2001). In this study, the VRSAP model (Khue 1986, NEDECO 1991) was used to analyze the hydraulic and salinity dynamics of the study region. Water interchange between any canal segment and the adjoining land area is simulated by indicating the nature of flow between them as either uncontrolled or controlled by structures. VRSAP aggregates water interchanges in a scheme of 372 nodes, 455 segments, and 190 fields to compute water level and salinity for each node and each field, and discharge for each segment. A segment can also be a hydraulic structure, such as a sluice, operated in various ways: completely closed, open for one-direction flow, or open for two-direction flows. More details about the algorithms of the model and its performance are given by Halcrow (2001) and Hoanh et al (2003).
In this project, the model has been upgraded with an acidity module to simulate the propagation of acid water in the canal network, a main constraint for agriculture and fisheries in the acid sulfate soil areas of Bac Lieu Province.
This study uses a systems approach, with a series of field and laboratory studies, in combination with statistical and GIS-based analyses and simulation modeling. Field and laboratory studies were carried out during 2001-06 in Ca Mau Peninsula, Mekong Delta, Vietnam, to fill in knowledge gaps on the source and amount of acidic loads from soil to the water surroundings, their interaction with saline water, and their propagation in the canal network.
Knowledge generated from this study was used in developing and validating a new ACIDITY module that couples to the existing VRSAP hydraulic and salinity model. The new model is applied to simulate the propagation of acidity in the tidal canal network with brackish water.
Objectives CPWF Project Report
57
The ASS area has four sources of acidity for water drained into canals at the beginning of the rainy season: (a) surface runoff after rainfall on the canal bank; (b) horizontal bypass flow through the canal bank; (c) seepage flow (with the addition of percolation) across the canal bank; and (d) inflow into the canal from connected fields. The source of pollutants could be a point source such as an outlet from a field or a linear-distributed source such as runoff or seepage along the canal bank.
In modeling, the acidity transport processes into canals at each time step are simulated as follows: • First, acidity is leached into canals from the canal embankment by runoff, horizontal bypass and seepage, and water drainage from small outlets of connected fields.
• Second, the leached acidity mixes and reacts with saline water in each canal segment and creates a new acidity.
• Third, the new acidity at a considered canal segment propagates to neighboring canal segments by transport (flow) and acidic dispersion; since the nodes in the canal network are the intersections or connection points of canal segments, the acidity balances for nodes are established.
• Finally, at the considered time step, the new acidities at nodes are computed by solving the equations of acidity balance at nodes simultaneously. With these results, the acidity at each segment is recalculated from the acidities at the two ends.
• Acidity propagation in the canal network was analyzed under three main scenarios: different sluice operation schedules, canal widening, and dredging canals in different zones.
Results and discussion
The experiment confirmed that the brackish recipient water with its high alkalinity concentration has the ability to neutralize the acidity. Results show that the same amount of acid load from runoff and seepage flows would reduce the pH of canal brackish water more slowly than its effect on fresh water in the canals. The rate of change in pH of the recipient water, however, was also shown to depend greatly on the acidity of the titrants. The established titration curves allow the determination of pH, and hence the acidity of the brackish canal water when it is mixed with acid pollutants with a known amount of total acidity. Such buffering capacity had been described only qualitatively by previous researchers.
Measured data showed that the acidic pollution in the canal network varies seasonally. The pH of the canal water was lowest (3–4.5) at the beginning of the rainy season and highest (7–7.5) at the end of the rainy season and during the dry season. The reduced dredging activities in 2005 and 2006 may explain why the acidic pollution decreased in 2005-06 compared with 2001-04. The most serious acidic pollution occurs when the two following conditions are present simultaneously: (i) the existence of newly dredged canals (and hence the deposition of the excavated spoils on the canal embankments) in areas with ASS (especially with severe ASS), and (ii) little or a lack of water exchange from tidal flows. Field experiments showed that ASS embankments within 2–3 years after dredging represent a high acidity hazard because they can release into the canal a total acidity, mainly from runoff and seepage water, of up to 2.7 mol H+ per day per meter length of canal embankment. Functional relationships were established allowing quantification of the daily acid load transferred from fields and canal embankments to the canal network.
The ACIDITY module was applied to simulate the propagation of acidic pollutants in the canal network. It confirmed that the most severe pollution occurs where there is a concentration of newly dredged canals in areas with ASS (especially
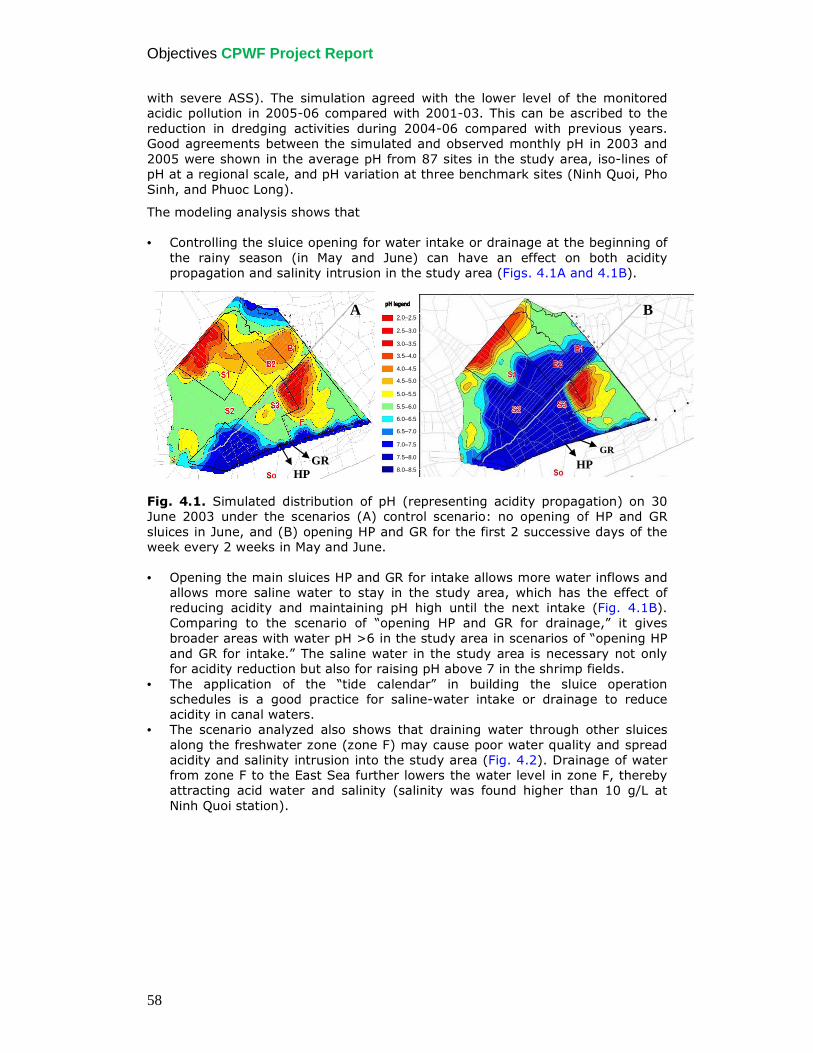
Objectives CPWF Project Report
58
with severe ASS). The simulation agreed with the lower level of the monitored acidic pollution in 2005-06 compared with 2001-03. This can be ascribed to the reduction in dredging activities during 2004-06 compared with previous years. Good agreements between the simulated and observed monthly pH in 2003 and 2005 were shown in the average pH from 87 sites in the study area, iso-lines of pH at a regional scale, and pH variation at three benchmark sites (Ninh Quoi, Pho Sinh, and Phuoc Long).
The modeling analysis shows that • Controlling the sluice opening for water intake or drainage at the beginning of
the rainy season (in May and June) can have an effect on both acidity propagation and salinity intrusion in the study area (Figs. 4.1A and 4.1B).
Fig. 4.1. Simulated distribution of pH (representing acidity propagation) on 30 June 2003 under the scenarios (A) control scenario: no opening of HP and GR sluices in June, and (B) opening HP and GR for the first 2 successive days of the week every 2 weeks in May and June. • Opening the main sluices HP and GR for intake allows more water inflows and
allows more saline water to stay in the study area, which has the effect of reducing acidity and maintaining pH high until the next intake (Fig. 4.1B). Comparing to the scenario of “opening HP and GR for drainage,” it gives broader areas with water pH >6 in the study area in scenarios of “opening HP and GR for intake.” The saline water in the study area is necessary not only for acidity reduction but also for raising pH above 7 in the shrimp fields.
• The application of the “tide calendar” in building the sluice operation schedules is a good practice for saline-water intake or drainage to reduce acidity in canal waters.
• The scenario analyzed also shows that draining water through other sluices along the freshwater zone (zone F) may cause poor water quality and spread acidity and salinity intrusion into the study area (Fig. 4.2). Drainage of water from zone F to the East Sea further lowers the water level in zone F, thereby attracting acid water and salinity (salinity was found higher than 10 g/L at Ninh Quoi station).
HPGR
HPGR
2.0–2.5
2.5–3.0
3.0–3.5
3.5–4.0
4.0–4.5
4.5–5.0
5.0–5.5
5.5–6.0
6.0–6.5
6.5–7.0
7.0–7.5
7.5–8.0
8.0–8.5 HPGR
HPGR
2.0–2.5
2.5–3.0
3.0–3.5
3.5–4.0
4.0–4.5
4.5–5.0
5.0–5.5
5.5–6.0
6.0–6.5
6.5–7.0
7.0–7.5
7.5–8.0
8.0–8.5
2.0–2.5
2.5–3.0
3.0–3.5
3.5–4.0
4.0–4.5
4.5–5.0
5.0–5.5
5.5–6.0
6.0–6.5
6.5–7.0
7.0–7.5
7.5–8.0
8.0–8.5
A B
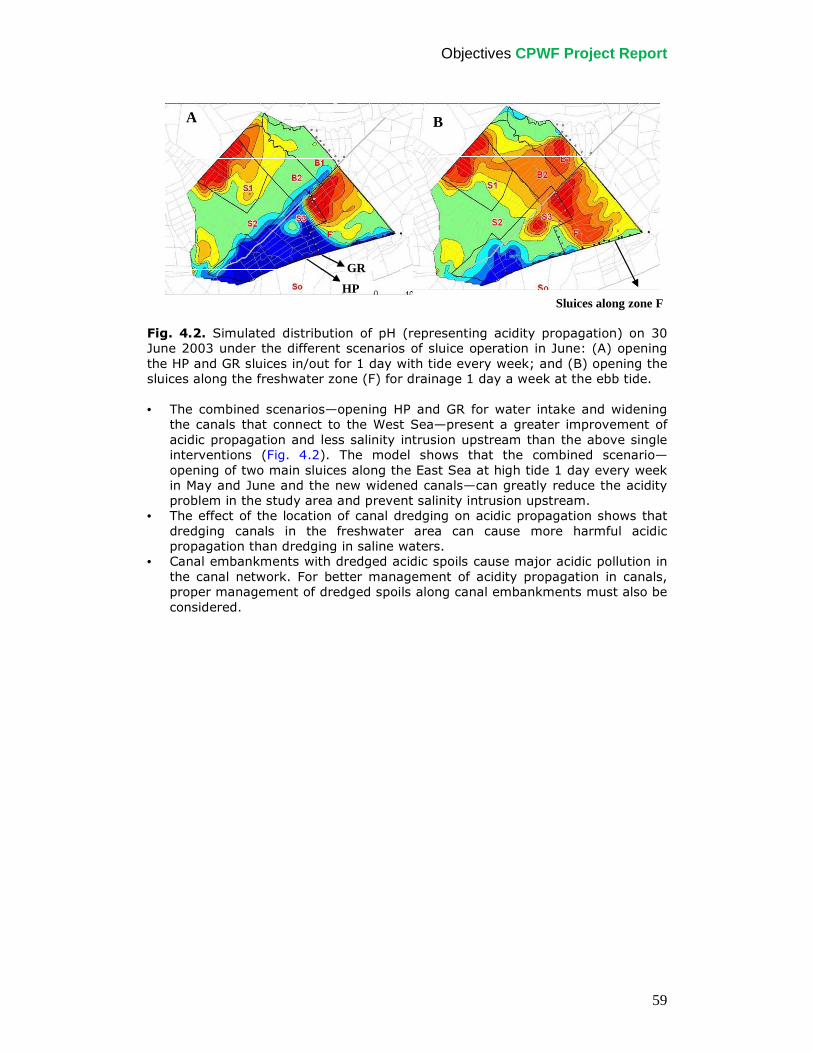
Objectives CPWF Project Report
59
Fig. 4.2. Simulated distribution of pH (representing acidity propagation) on 30 June 2003 under the different scenarios of sluice operation in June: (A) opening the HP and GR sluices in/out for 1 day with tide every week; and (B) opening the sluices along the freshwater zone (F) for drainage 1 day a week at the ebb tide. • The combined scenarios—opening HP and GR for water intake and widening
the canals that connect to the West Sea—present a greater improvement of acidic propagation and less salinity intrusion upstream than the above single interventions (Fig. 4.2). The model shows that the combined scenario—opening of two main sluices along the East Sea at high tide 1 day every week in May and June and the new widened canals—can greatly reduce the acidity problem in the study area and prevent salinity intrusion upstream.
• The effect of the location of canal dredging on acidic propagation shows that dredging canals in the freshwater area can cause more harmful acidic propagation than dredging in saline waters.
• Canal embankments with dredged acidic spoils cause major acidic pollution in the canal network. For better management of acidity propagation in canals, proper management of dredged spoils along canal embankments must also be considered.
Sluices along zone F
BA
HP
GR
Sluices along zone F
BA
HP
GR
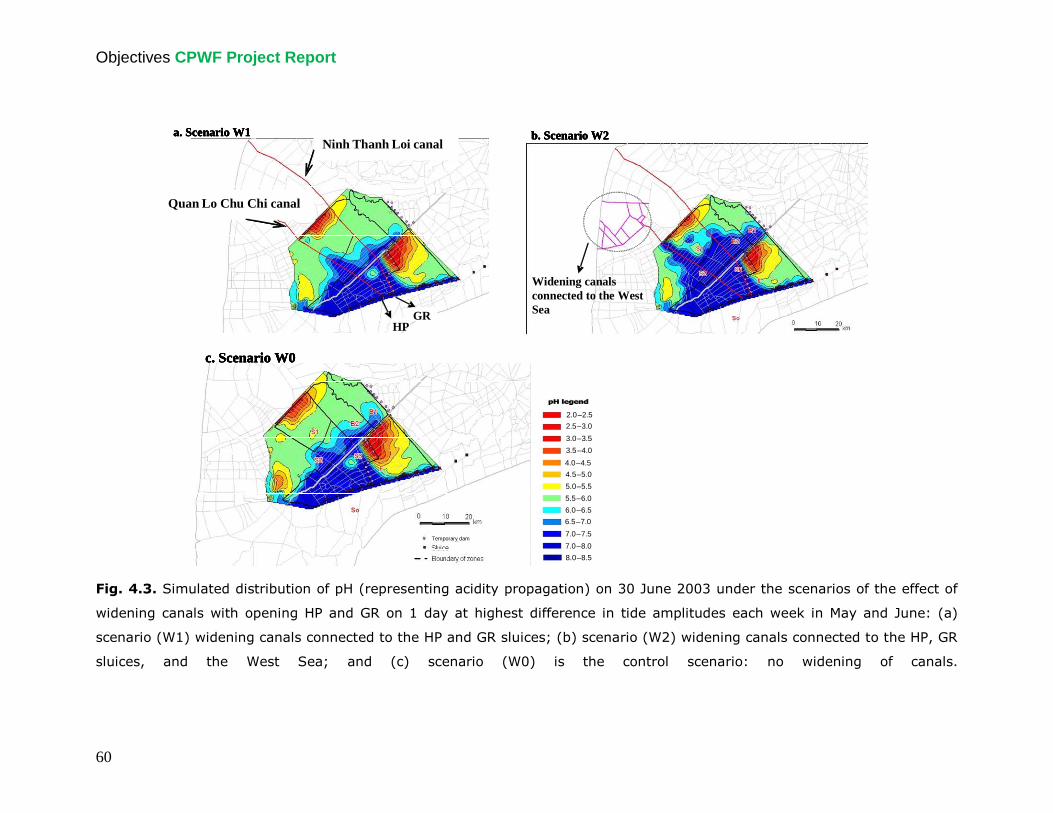
Objectives CPWF Project Report
60
Fig. 4.3. Simulated distribution of pH (representing acidity propagation) on 30 June 2003 under the scenarios of the effect of
widening canals with opening HP and GR on 1 day at highest difference in tide amplitudes each week in May and June: (a)
scenario (W1) widening canals connected to the HP and GR sluices; (b) scenario (W2) widening canals connected to the HP, GR
sluices, and the West Sea; and (c) scenario (W0) is the control scenario: no widening of canals.
c. Scenario W0
Ninh Thanh Loi canal
Quan Lo Chu Chi canal
HPGR
a. Scenario W1
Widening canals connected to the West Sea?
b. Scenario W2
Temporary dam
2.0–2.5
2.5–3.0
3.0–3.5
3.5–4.0
4.0–4.5
4.5–5.0
5.0–5.5
5.5–6.0
6.0–6.5
6.5–7.0
7.0–7.5
7.0–8.0
8.0–8.5
c. Scenario W0
Ninh Thanh Loi canal
Quan Lo Chu Chi canal
Ninh Thanh Loi canal
Quan Lo Chu Chi canal
HPGR
a. Scenario W1
Widening canals connected to the West Sea
b. Scenario W2
Temporary dam
2.0–2.5
2.5–3.0
3.0–3.5
3.5–4.0
4.0–4.5
4.5–5.0
5.0–5.5
5.5–6.0
6.0–6.5
6.5–7.0
7.0–7.5
7.0–8.0
8.0–8.5
c. Scenario W0
Ninh Thanh Loi canal
Quan Lo Chu Chi canal
HPGR
a. Scenario W1
Widening canals connected to the West Sea?
b. Scenario W2
Temporary dam
2.0–2.5
2.5–3.0
3.0–3.5
3.5–4.0
4.0–4.5
4.5–5.0
5.0–5.5
5.5–6.0
6.0–6.5
6.5–7.0
7.0–7.5
7.0–8.0
8.0–8.5
c. Scenario W0
Ninh Thanh Loi canal
Quan Lo Chu Chi canal
Ninh Thanh Loi canal
Quan Lo Chu Chi canal
HPGR
a. Scenario W1
Widening canals connected to the West Sea
b. Scenario W2
Temporary dam
2.0–2.5
2.5–3.0
3.0–3.5
3.5–4.0
4.0–4.5
4.5–5.0
5.0–5.5
5.5–6.0
6.0–6.5
6.5–7.0
7.0–7.5
7.0–8.0
8.0–8.5
Objectives CPWF Project Report
Page | 61
Conclusions
A new approach for modeling acidity has been developed by integrating large-scale water quality monitoring, multisite field experiments, process-based laboratory studies, GIS-based analysis, and modeling. The new module is able to simulate the temporal and spatial dynamics of changes in pH (as an indicator of acidity) at a regional scale, together with salinity and water flow characteristics, in a tidal canal network with brackish water. The model can be used to assist in managing and mitigating the negative environmental impacts of acidity.
4.2 Developing a Bayesian model for integrated management of aquatic resources
in Vietnam
Methodologies
Bayesian networks (also called Bayes’ nets or Bayesian Belief Networks, BBN) consist of a set of variables linked by probabilistic interactions (Charniak 1991, Jensen 1996, Cain 2001). These variables can be quantitative or qualitative, and for each of them a small number of classes are defined (e.g., “Rice farming area,” <1,000 ha or >1,000 ha). Then probabilities, originating from data analysis or from consultation with experts, are attached to each class of each variable. When variables are linked (e.g., “Rice farming area” and “Rice yield” being combined into “Rice production”), resulting probabilities are calculated throughout the network using Bayes’ formula. For computation, we used Norsys’ Netica software since it is widely recognized, user-friendly, and freely available on the Internet (www.norsys.com) for users to run the models developed.
In the case of the BayFish–Bac Lieu model, the structure is entirely based on stakeholder consultations held at the commune and provincial level. During the process, stakeholders identified the dominant factors (model variables) determining food production in the province, and their cause-effect relationships (model linkages). Stakeholders also gave respective weights to factors at each level (probability elicitation). The model structure is shown in Figure 4.4.
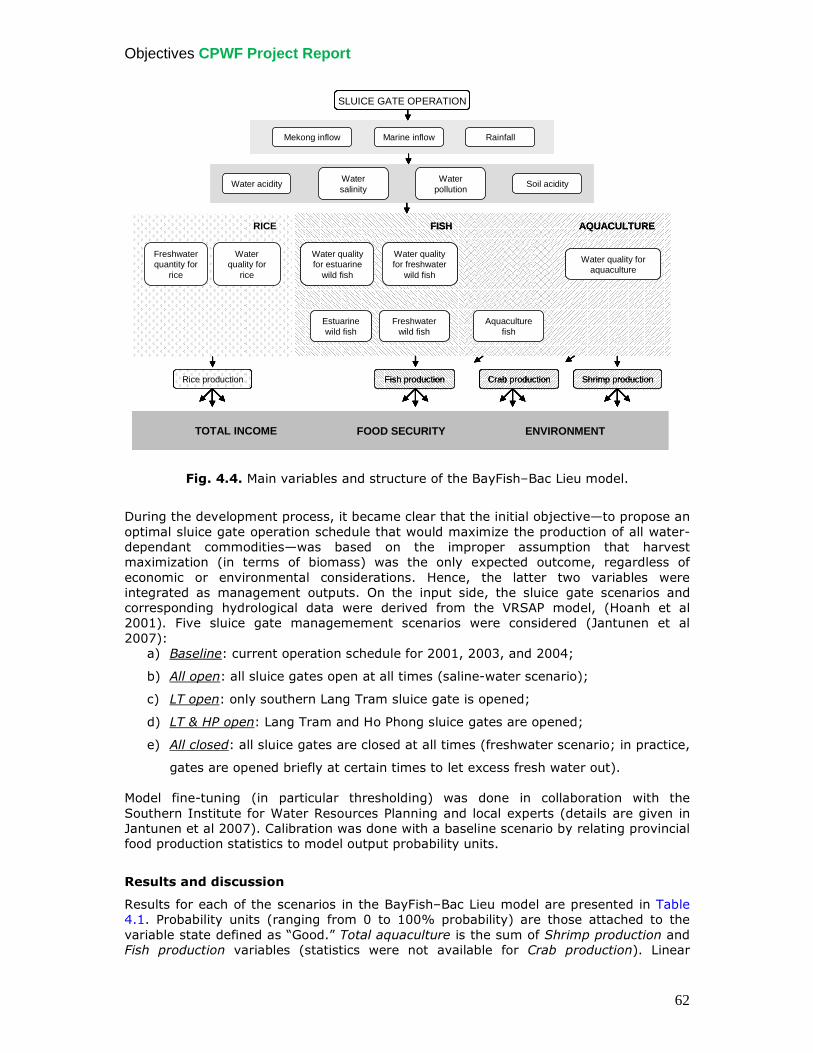
Objectives CPWF Project Report
62
Fig. 4.4. Main variables and structure of the BayFish–Bac Lieu model.
During the development process, it became clear that the initial objective—to propose an optimal sluice gate operation schedule that would maximize the production of all water-dependant commodities—was based on the improper assumption that harvest maximization (in terms of biomass) was the only expected outcome, regardless of economic or environmental considerations. Hence, the latter two variables were integrated as management outputs. On the input side, the sluice gate scenarios and corresponding hydrological data were derived from the VRSAP model, (Hoanh et al 2001). Five sluice gate managemement scenarios were considered (Jantunen et al 2007):
a) Baseline: current operation schedule for 2001, 2003, and 2004;
b) All open: all sluice gates open at all times (saline-water scenario);
c) LT open: only southern Lang Tram sluice gate is opened;
d) LT & HP open: Lang Tram and Ho Phong sluice gates are opened;
e) All closed: all sluice gates are closed at all times (freshwater scenario; in practice,
gates are opened briefly at certain times to let excess fresh water out).
Model fine-tuning (in particular thresholding) was done in collaboration with the Southern Institute for Water Resources Planning and local experts (details are given in Jantunen et al 2007). Calibration was done with a baseline scenario by relating provincial food production statistics to model output probability units.
Results and discussion
Results for each of the scenarios in the BayFish–Bac Lieu model are presented in Table 4.1. Probability units (ranging from 0 to 100% probability) are those attached to the variable state defined as “Good.” Total aquaculture is the sum of Shrimp production and Fish production variables (statistics were not available for Crab production). Linear
SLUICE GATES OPERATION
Mekong inflow Marine inflow Rainfall
Water acidityWater salinity
Water pollution
Soil acidity
Rice production Fish production Crab production Shrimp production
Freshwater quantity for
rice
Water quality for
rice
Water quality for estuarine
wild fish
Water quality for freshwater
wild fish
Freshwater wild fish
Estuarine wild fish
Aquaculture fish
Water quality for aquaculture
RICE FISH AQUACULTURE
TOTAL INCOME FOOD SECURITY ENVIRONMENT
SLUICE GATES OPERATION
Mekong inflow Marine inflow RainfallMekong inflow Marine inflow Rainfall
Water acidityWater salinity
Water pollution
Soil acidityWater acidityWater salinity
Water pollution
Soil acidity
Rice production Fish production Crab production Shrimp productionRice production Fish production Crab production Shrimp production
Freshwater quantity for
rice
Water quality for
rice
Water quality for estuarine
wild fish
Water quality for freshwater
wild fish
Freshwater wild fish
Estuarine wild fish
Aquaculture fish
Water quality for aquaculture
RICE FISH AQUACULTURE
TOTAL INCOME FOOD SECURITY ENVIRONMENT
SLUICE GATE OPERATIONSLUICE GATES OPERATION
Mekong inflow Marine inflow Rainfall
Water acidityWater salinity
Water pollution
Soil acidity
Rice production Fish production Crab production Shrimp production
Freshwater quantity for
rice
Water quality for
rice
Water quality for estuarine
wild fish
Water quality for freshwater
wild fish
Freshwater wild fish
Estuarine wild fish
Aquaculture fish
Water quality for aquaculture
RICE FISH AQUACULTURE
TOTAL INCOME FOOD SECURITY ENVIRONMENT
SLUICE GATES OPERATION
Mekong inflow Marine inflow RainfallMekong inflow Marine inflow Rainfall
Water acidityWater salinity
Water pollution
Soil acidityWater acidityWater salinity
Water pollution
Soil acidity
Rice production Fish production Crab production Shrimp productionRice production Fish production Crab production Shrimp production
Freshwater quantity for
rice
Water quality for
rice
Water quality for estuarine
wild fish
Water quality for freshwater
wild fish
Freshwater wild fish
Estuarine wild fish
Aquaculture fish
Water quality for aquaculture
RICE FISH AQUACULTURE
TOTAL INCOME FOOD SECURITY ENVIRONMENT
SLUICE GATE OPERATION
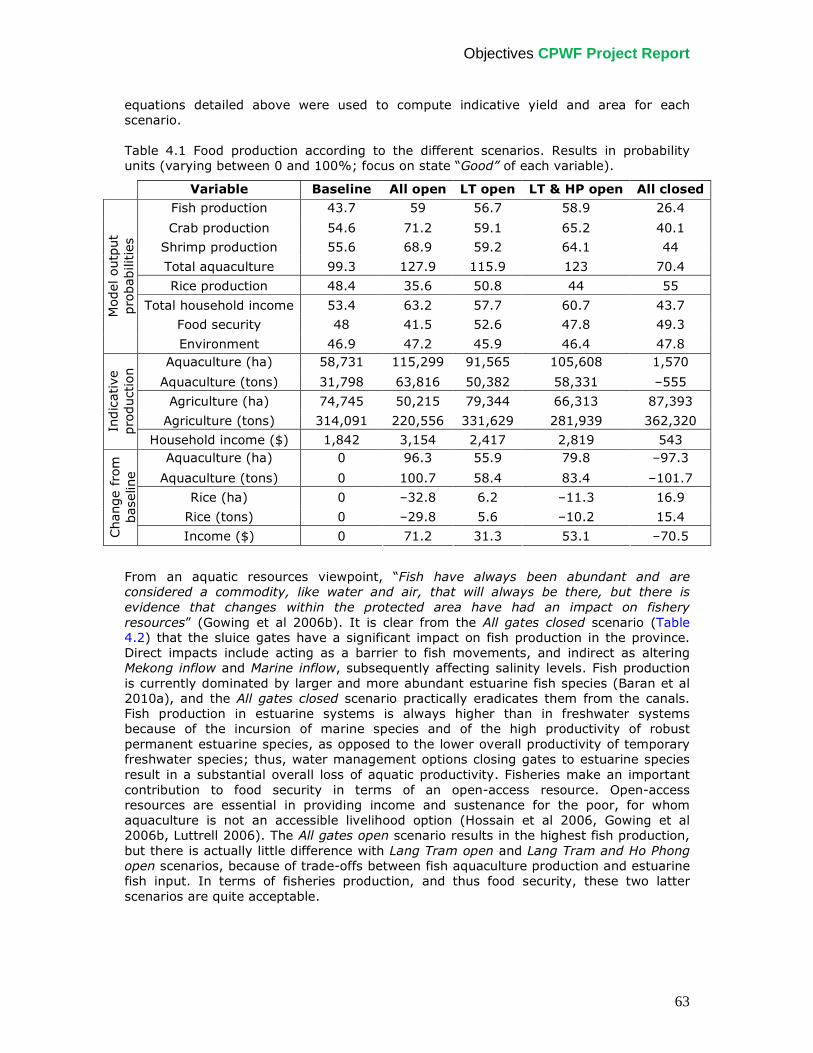
Objectives CPWF Project Report
63
equations detailed above were used to compute indicative yield and area for each scenario.
Table 4.1 Food production according to the different scenarios. Results in probability units (varying between 0 and 100%; focus on state “Good” of each variable).
Variable Baseline All open LT open LT & HP open All closed
Fish production 43.7 59 56.7 58.9 26.4
Crab production 54.6 71.2 59.1 65.2 40.1
Shrimp production 55.6 68.9 59.2 64.1 44
Total aquaculture 99.3 127.9 115.9 123 70.4
Rice production 48.4 35.6 50.8 44 55
Total household income 53.4 63.2 57.7 60.7 43.7
Food security 48 41.5 52.6 47.8 49.3
Model output
probabilities
Environment 46.9 47.2 45.9 46.4 47.8 Aquaculture (ha) 58,731 115,299 91,565 105,608 1,570
Aquaculture (tons) 31,798 63,816 50,382 58,331 –555
Agriculture (ha) 74,745 50,215 79,344 66,313 87,393
Agriculture (tons) 314,091 220,556 331,629 281,939 362,320 Indicative
production
Household income ($) 1,842 3,154 2,417 2,819 543 Aquaculture (ha) 0 96.3 55.9 79.8 –97.3
Aquaculture (tons) 0 100.7 58.4 83.4 –101.7
Rice (ha) 0 –32.8 6.2 –11.3 16.9
Rice (tons) 0 –29.8 5.6 –10.2 15.4
Change from
baseline
Income ($) 0 71.2 31.3 53.1 –70.5
From an aquatic resources viewpoint, “Fish have always been abundant and are considered a commodity, like water and air, that will always be there, but there is evidence that changes within the protected area have had an impact on fishery resources” (Gowing et al 2006b). It is clear from the All gates closed scenario (Table 4.2) that the sluice gates have a significant impact on fish production in the province. Direct impacts include acting as a barrier to fish movements, and indirect as altering Mekong inflow and Marine inflow, subsequently affecting salinity levels. Fish production is currently dominated by larger and more abundant estuarine fish species (Baran et al 2010a), and the All gates closed scenario practically eradicates them from the canals. Fish production in estuarine systems is always higher than in freshwater systems because of the incursion of marine species and of the high productivity of robust permanent estuarine species, as opposed to the lower overall productivity of temporary freshwater species; thus, water management options closing gates to estuarine species result in a substantial overall loss of aquatic productivity. Fisheries make an important contribution to food security in terms of an open-access resource. Open-access resources are essential in providing income and sustenance for the poor, for whom aquaculture is not an accessible livelihood option (Hossain et al 2006, Gowing et al 2006b, Luttrell 2006). The All gates open scenario results in the highest fish production, but there is actually little difference with Lang Tram open and Lang Tram and Ho Phong open scenarios, because of trade-offs between fish aquaculture production and estuarine fish input. In terms of fisheries production, and thus food security, these two latter scenarios are quite acceptable.
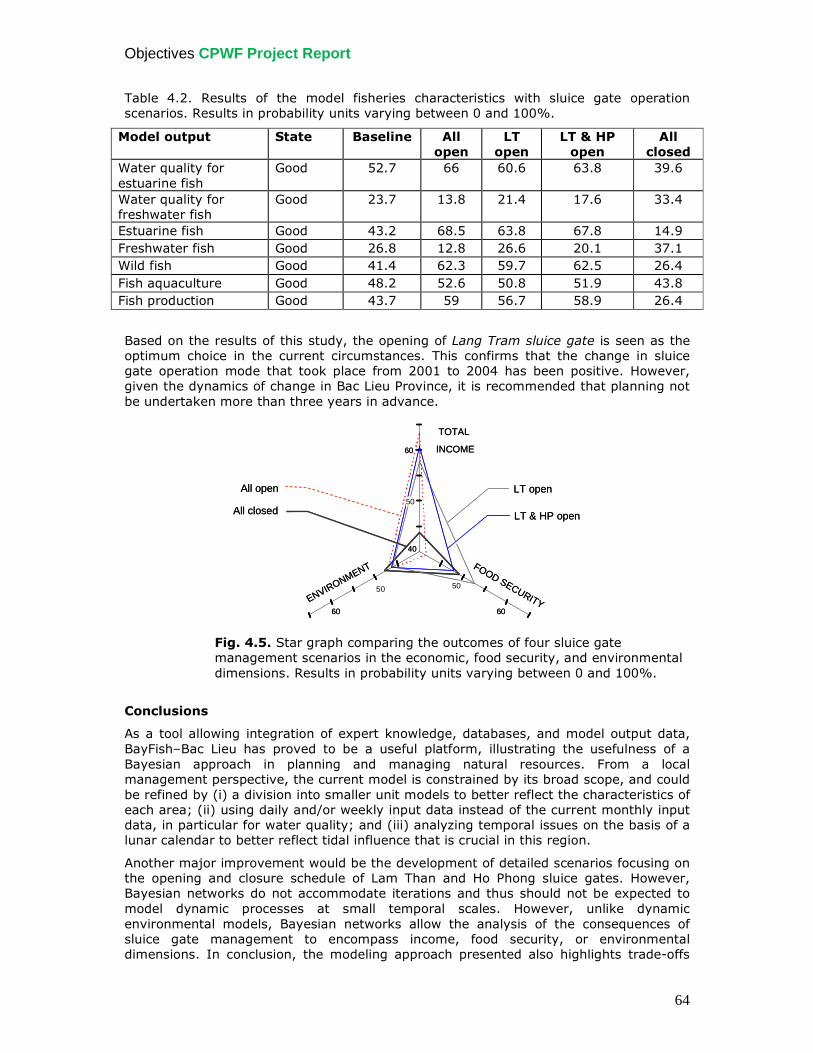
Objectives CPWF Project Report
64
Table 4.2. Results of the model fisheries characteristics with sluice gate operation scenarios. Results in probability units varying between 0 and 100%.
Model output State Baseline All
open
LT
open
LT & HP
open
All
closed
Water quality for estuarine fish
Good 52.7 66 60.6 63.8 39.6
Water quality for freshwater fish
Good 23.7 13.8 21.4 17.6 33.4
Estuarine fish Good 43.2 68.5 63.8 67.8 14.9 Freshwater fish Good 26.8 12.8 26.6 20.1 37.1 Wild fish Good 41.4 62.3 59.7 62.5 26.4 Fish aquaculture Good 48.2 52.6 50.8 51.9 43.8 Fish production Good 43.7 59 56.7 58.9 26.4
Based on the results of this study, the opening of Lang Tram sluice gate is seen as the optimum choice in the current circumstances. This confirms that the change in sluice gate operation mode that took place from 2001 to 2004 has been positive. However, given the dynamics of change in Bac Lieu Province, it is recommended that planning not be undertaken more than three years in advance.
TOTAL
INCOME
FOOD SECURITYENVIRONMENT
All open
All closed
LT open
LT & HP open
40
50
60
50
60
50
60
TOTAL
INCOME
FOOD SECURITYENVIRONMENT
All open
All closed
LT open
LT & HP open
40
50
60
50
60
50
60
Fig. 4.5. Star graph comparing the outcomes of four sluice gate management scenarios in the economic, food security, and environmental dimensions. Results in probability units varying between 0 and 100%.
Conclusions
As a tool allowing integration of expert knowledge, databases, and model output data, BayFish–Bac Lieu has proved to be a useful platform, illustrating the usefulness of a Bayesian approach in planning and managing natural resources. From a local management perspective, the current model is constrained by its broad scope, and could be refined by (i) a division into smaller unit models to better reflect the characteristics of each area; (ii) using daily and/or weekly input data instead of the current monthly input data, in particular for water quality; and (iii) analyzing temporal issues on the basis of a lunar calendar to better reflect tidal influence that is crucial in this region.
Another major improvement would be the development of detailed scenarios focusing on the opening and closure schedule of Lam Than and Ho Phong sluice gates. However, Bayesian networks do not accommodate iterations and thus should not be expected to model dynamic processes at small temporal scales. However, unlike dynamic environmental models, Bayesian networks allow the analysis of the consequences of sluice gate management to encompass income, food security, or environmental dimensions. In conclusion, the modeling approach presented also highlights trade-offs
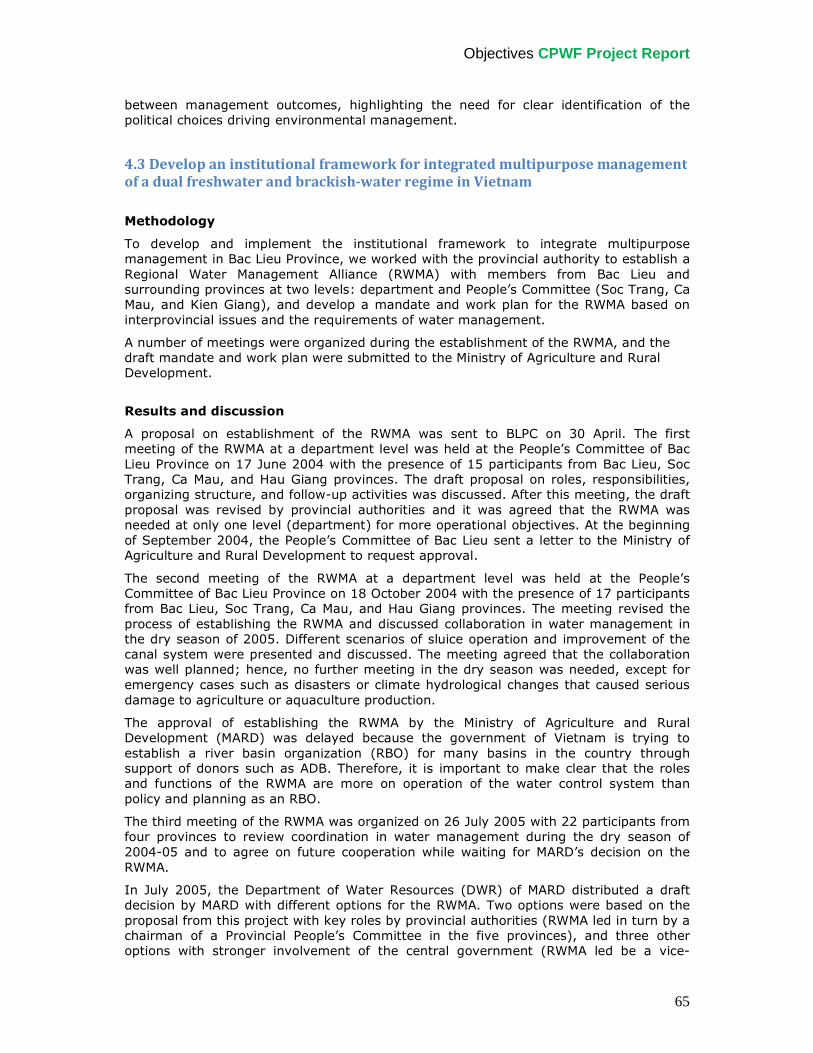
Objectives CPWF Project Report
65
between management outcomes, highlighting the need for clear identification of the political choices driving environmental management.
4.3 Develop an institutional framework for integrated multipurpose management
of a dual freshwater and brackish-water regime in Vietnam
Methodology
To develop and implement the institutional framework to integrate multipurpose management in Bac Lieu Province, we worked with the provincial authority to establish a Regional Water Management Alliance (RWMA) with members from Bac Lieu and surrounding provinces at two levels: department and People’s Committee (Soc Trang, Ca Mau, and Kien Giang), and develop a mandate and work plan for the RWMA based on interprovincial issues and the requirements of water management.
A number of meetings were organized during the establishment of the RWMA, and the draft mandate and work plan were submitted to the Ministry of Agriculture and Rural Development.
Results and discussion
A proposal on establishment of the RWMA was sent to BLPC on 30 April. The first meeting of the RWMA at a department level was held at the People’s Committee of Bac Lieu Province on 17 June 2004 with the presence of 15 participants from Bac Lieu, Soc Trang, Ca Mau, and Hau Giang provinces. The draft proposal on roles, responsibilities, organizing structure, and follow-up activities was discussed. After this meeting, the draft proposal was revised by provincial authorities and it was agreed that the RWMA was needed at only one level (department) for more operational objectives. At the beginning of September 2004, the People’s Committee of Bac Lieu sent a letter to the Ministry of Agriculture and Rural Development to request approval.
The second meeting of the RWMA at a department level was held at the People’s Committee of Bac Lieu Province on 18 October 2004 with the presence of 17 participants from Bac Lieu, Soc Trang, Ca Mau, and Hau Giang provinces. The meeting revised the process of establishing the RWMA and discussed collaboration in water management in the dry season of 2005. Different scenarios of sluice operation and improvement of the canal system were presented and discussed. The meeting agreed that the collaboration was well planned; hence, no further meeting in the dry season was needed, except for emergency cases such as disasters or climate hydrological changes that caused serious damage to agriculture or aquaculture production.
The approval of establishing the RWMA by the Ministry of Agriculture and Rural Development (MARD) was delayed because the government of Vietnam is trying to establish a river basin organization (RBO) for many basins in the country through support of donors such as ADB. Therefore, it is important to make clear that the roles and functions of the RWMA are more on operation of the water control system than policy and planning as an RBO.
The third meeting of the RWMA was organized on 26 July 2005 with 22 participants from four provinces to review coordination in water management during the dry season of 2004-05 and to agree on future cooperation while waiting for MARD’s decision on the RWMA.
In July 2005, the Department of Water Resources (DWR) of MARD distributed a draft decision by MARD with different options for the RWMA. Two options were based on the proposal from this project with key roles by provincial authorities (RWMA led in turn by a chairman of a Provincial People’s Committee in the five provinces), and three other options with stronger involvement of the central government (RWMA led be a vice-
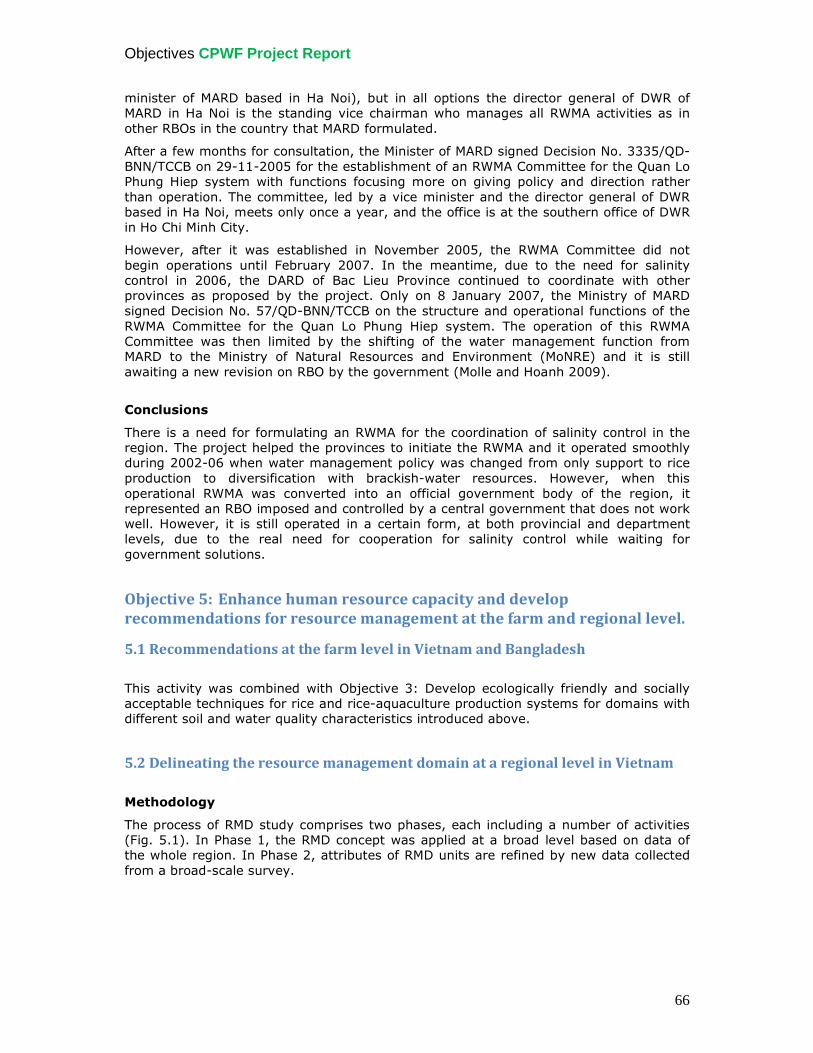
Objectives CPWF Project Report
66
minister of MARD based in Ha Noi), but in all options the director general of DWR of MARD in Ha Noi is the standing vice chairman who manages all RWMA activities as in other RBOs in the country that MARD formulated.
After a few months for consultation, the Minister of MARD signed Decision No. 3335/QD-BNN/TCCB on 29-11-2005 for the establishment of an RWMA Committee for the Quan Lo Phung Hiep system with functions focusing more on giving policy and direction rather than operation. The committee, led by a vice minister and the director general of DWR based in Ha Noi, meets only once a year, and the office is at the southern office of DWR in Ho Chi Minh City.
However, after it was established in November 2005, the RWMA Committee did not begin operations until February 2007. In the meantime, due to the need for salinity control in 2006, the DARD of Bac Lieu Province continued to coordinate with other provinces as proposed by the project. Only on 8 January 2007, the Ministry of MARD signed Decision No. 57/QD-BNN/TCCB on the structure and operational functions of the RWMA Committee for the Quan Lo Phung Hiep system. The operation of this RWMA Committee was then limited by the shifting of the water management function from MARD to the Ministry of Natural Resources and Environment (MoNRE) and it is still awaiting a new revision on RBO by the government (Molle and Hoanh 2009).
Conclusions
There is a need for formulating an RWMA for the coordination of salinity control in the region. The project helped the provinces to initiate the RWMA and it operated smoothly during 2002-06 when water management policy was changed from only support to rice production to diversification with brackish-water resources. However, when this operational RWMA was converted into an official government body of the region, it represented an RBO imposed and controlled by a central government that does not work well. However, it is still operated in a certain form, at both provincial and department levels, due to the real need for cooperation for salinity control while waiting for government solutions.
Objective 5: Enhance human resource capacity and develop
recommendations for resource management at the farm and regional level.
5.1 Recommendations at the farm level in Vietnam and Bangladesh
This activity was combined with Objective 3: Develop ecologically friendly and socially acceptable techniques for rice and rice-aquaculture production systems for domains with different soil and water quality characteristics introduced above.
5.2 Delineating the resource management domain at a regional level in Vietnam
Methodology
The process of RMD study comprises two phases, each including a number of activities (Fig. 5.1). In Phase 1, the RMD concept was applied at a broad level based on data of the whole region. In Phase 2, attributes of RMD units are refined by new data collected from a broad-scale survey.
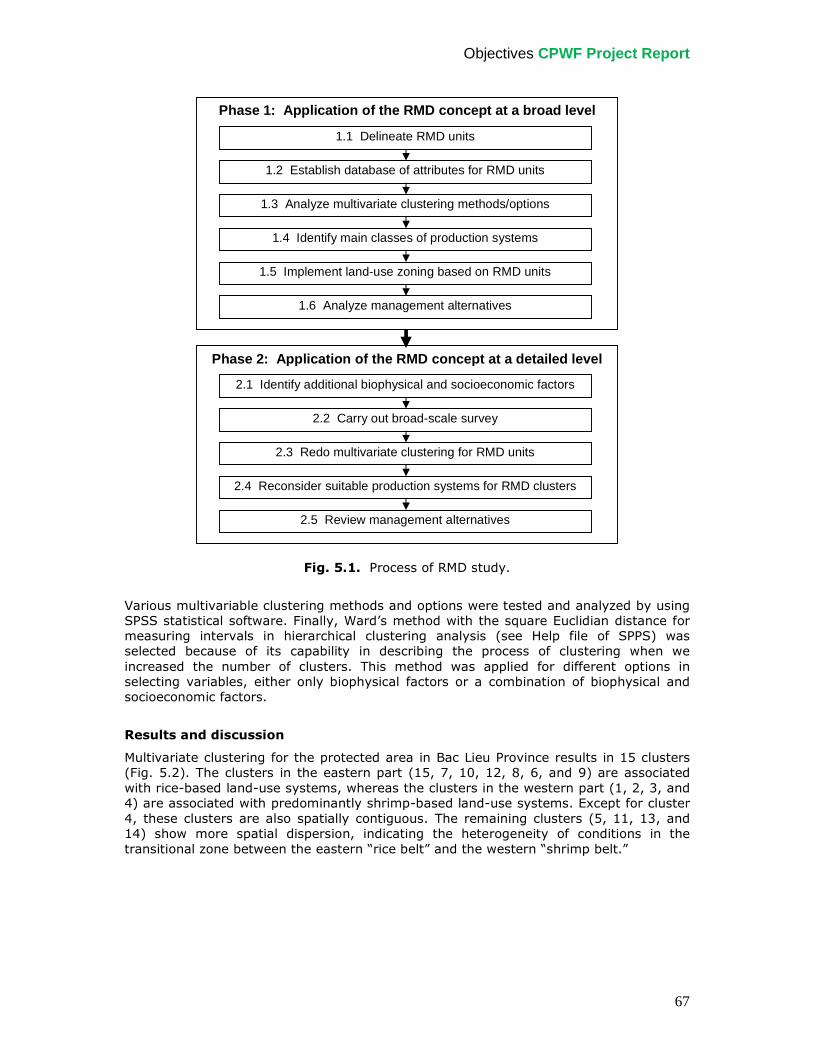
Objectives CPWF Project Report
67
Fig. 5.1. Process of RMD study.
Various multivariable clustering methods and options were tested and analyzed by using SPSS statistical software. Finally, Ward’s method with the square Euclidian distance for measuring intervals in hierarchical clustering analysis (see Help file of SPPS) was selected because of its capability in describing the process of clustering when we increased the number of clusters. This method was applied for different options in selecting variables, either only biophysical factors or a combination of biophysical and socioeconomic factors.
Results and discussion
Multivariate clustering for the protected area in Bac Lieu Province results in 15 clusters (Fig. 5.2). The clusters in the eastern part (15, 7, 10, 12, 8, 6, and 9) are associated with rice-based land-use systems, whereas the clusters in the western part (1, 2, 3, and 4) are associated with predominantly shrimp-based land-use systems. Except for cluster 4, these clusters are also spatially contiguous. The remaining clusters (5, 11, 13, and 14) show more spatial dispersion, indicating the heterogeneity of conditions in the transitional zone between the eastern “rice belt” and the western “shrimp belt.”
Phase 2: Application of the RMD concept at a detailed level
Phase 1: Application of the RMD concept at a broad level
1.1 Delineate RMD units
1.2 Establish database of attributes for RMD units
1.3 Analyze multivariate clustering methods/options
1.4 Identify main classes of production systems
1.5 Implement land-use zoning based on RMD units
1.6 Analyze management alternatives
2.1 Identify additional biophysical and socioeconomic factors
2.2 Carry out broad-scale survey
2.3 Redo multivariate clustering for RMD units
2.4 Reconsider suitable production systems for RMD clusters
2.5 Review management alternatives
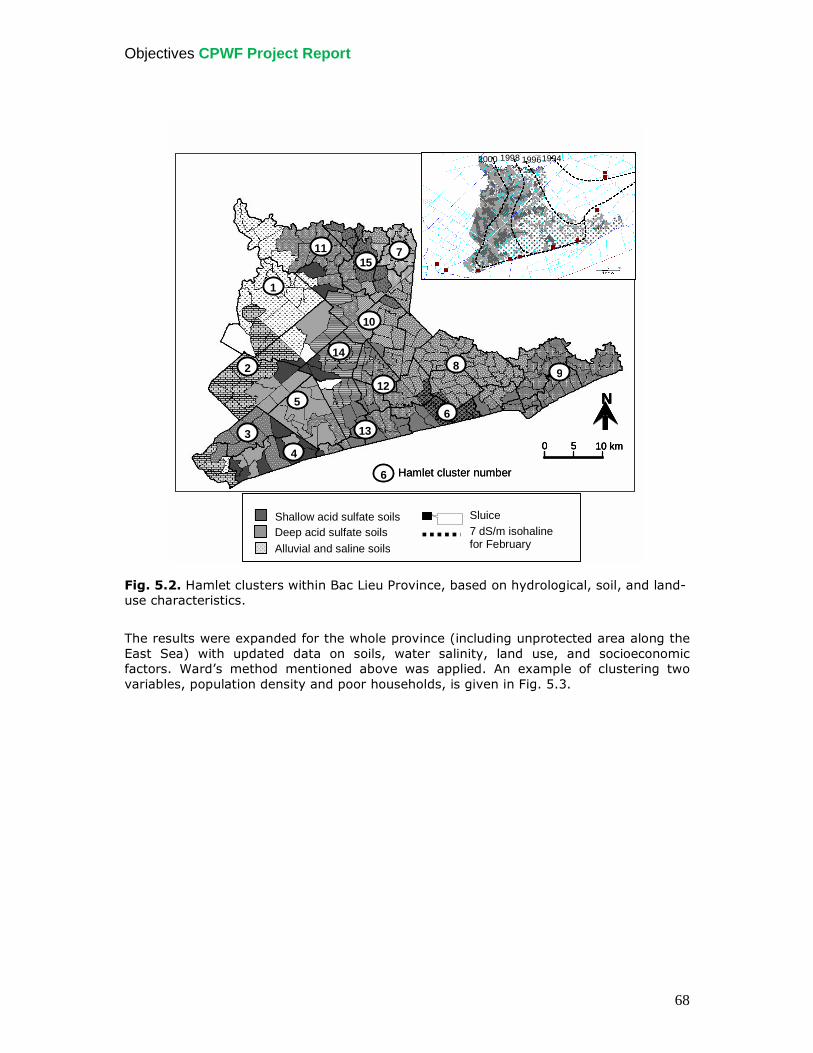
Objectives CPWF Project Report
68
Fig. 5.2. Hamlet clusters within Bac Lieu Province, based on hydrological, soil, and land-use characteristics.
The results were expanded for the whole province (including unprotected area along the East Sea) with updated data on soils, water salinity, land use, and socioeconomic factors. Ward’s method mentioned above was applied. An example of clustering two variables, population density and poor households, is given in Fig. 5.3.
-
1
2
3 4
5 6
7
8 9
10
11
12
13
14
15
6 Hamlet cluster number
0 5 10 km
N
1
2
3 4
5 6
7
8 9
10
11
12
13
14
15
6 Hamlet cluster number
0 5 10 km
N
1
2
3 4
5 6
7
8 9
10
11
12
13
14
15
6 Hamlet cluster number
0 5 10 km
N
1
2
3 4
5 6
7
8 9
10
11
12
13
14
15
1
2
3 4
5 6
7
8 9
10
11
12
13
14
15
1
2
3 4
5 6
7
8 9
10
11
12
13
14
15
6 Hamlet cluster number 6 Hamlet cluster number
0 5 10 km
N
0 5 10 km0 5 10 km
N N
2000 1998 1996 1994
Deep acid sulfate soils Alluvial and saline soils
Shallow acid sulfate soils 7 dS/m isohaline for February
Sluice
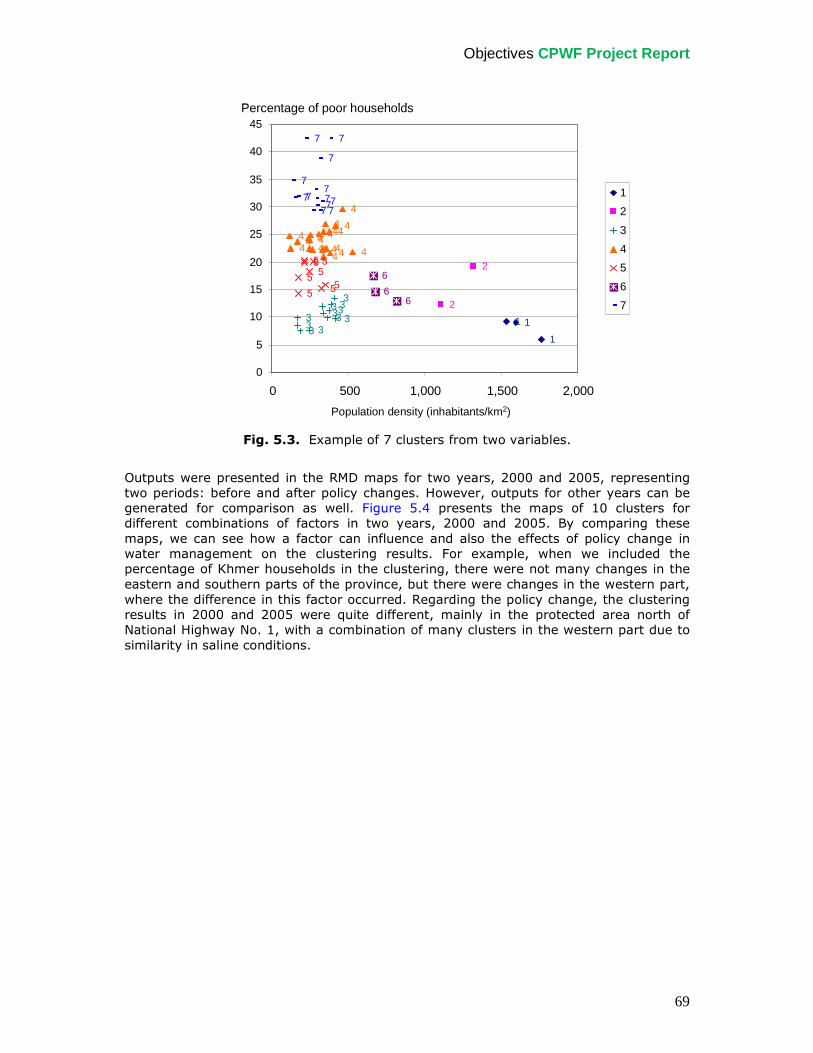
Objectives CPWF Project Report
69
Fig. 5.3. Example of 7 clusters from two variables.
Outputs were presented in the RMD maps for two years, 2000 and 2005, representing two periods: before and after policy changes. However, outputs for other years can be generated for comparison as well. Figure 5.4 presents the maps of 10 clusters for different combinations of factors in two years, 2000 and 2005. By comparing these maps, we can see how a factor can influence and also the effects of policy change in water management on the clustering results. For example, when we included the percentage of Khmer households in the clustering, there were not many changes in the eastern and southern parts of the province, but there were changes in the western part, where the difference in this factor occurred. Regarding the policy change, the clustering results in 2000 and 2005 were quite different, mainly in the protected area north of National Highway No. 1, with a combination of many clusters in the western part due to similarity in saline conditions.
1
1
1
2
2
3
33
33
33 3
333
4 4444
4
44
44
4
44
4
44
4 4
4
5
55
555
556
6
6
7
7
77
7
77
7
77
7
7
0
5
10
15
20
25
30
35
40
45
0 500 1,000 1,500 2,000
Population density (inhabitants/km2)
Percentage of poor households
1
2
3
4
5
6
71
1
1
2
2
3
33
33
33 3
333
4 44
1
1
1
2
2
3
33
33
33 3
333
4 4444
4
44
44
4
44
4
44
4 4
4
5
55
555
556
6
6
7
7
77
7
77
7
77
7
7
0
5
10
15
20
25
30
35
40
45
0 500 1,000 1,500 2,000
Population density (inhabitants/km2)
Percentage of poor households
1
2
3
4
5
6
7
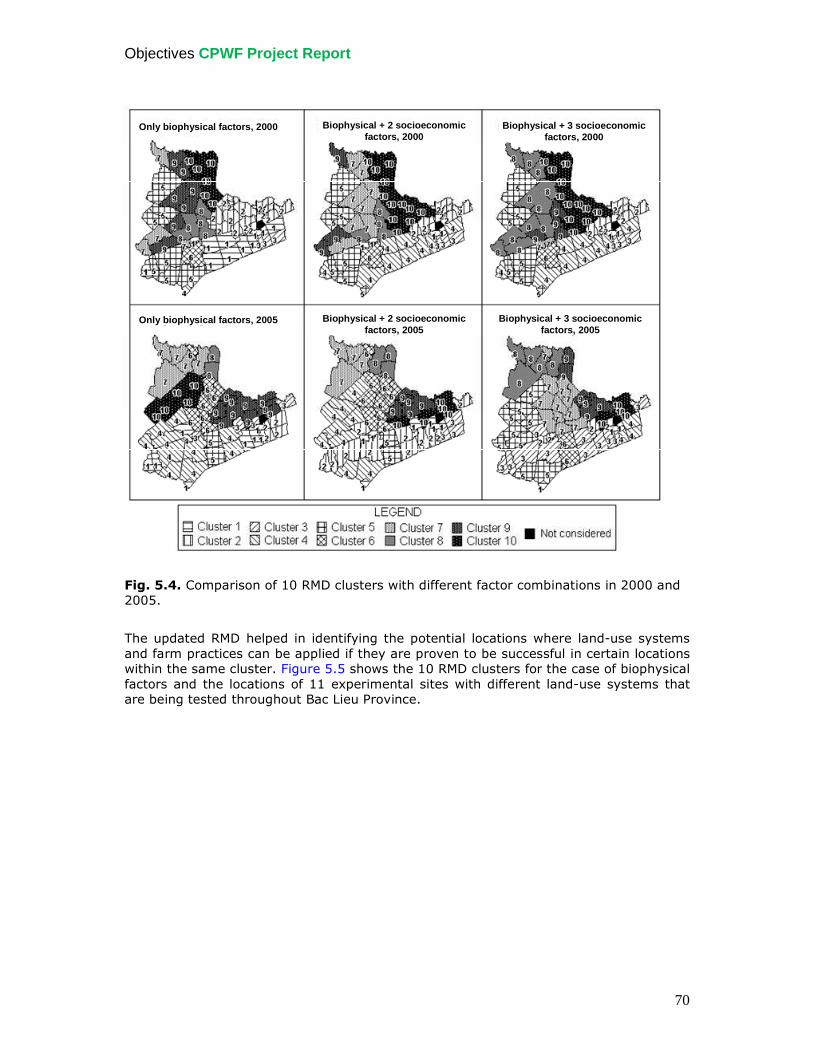
Objectives CPWF Project Report
70
Fig. 5.4. Comparison of 10 RMD clusters with different factor combinations in 2000 and 2005.
The updated RMD helped in identifying the potential locations where land-use systems and farm practices can be applied if they are proven to be successful in certain locations within the same cluster. Figure 5.5 shows the 10 RMD clusters for the case of biophysical factors and the locations of 11 experimental sites with different land-use systems that are being tested throughout Bac Lieu Province.
Only biophysical factors, 2000 Biophysical + 2 socioeconomic factors, 2000
Biophysical + 3 socioeconomic factors, 2000
Only biophysical factors, 2005 Biophysical + 2 socioeconomic factors, 2005
Biophysical + 3 socioeconomic factors, 2005
Only biophysical factors, 2000 Biophysical + 2 socioeconomic factors, 2000
Biophysical + 3 socioeconomic factors, 2000
Only biophysical factors, 2005 Biophysical + 2 socioeconomic factors, 2005
Biophysical + 3 socioeconomic factors, 2005
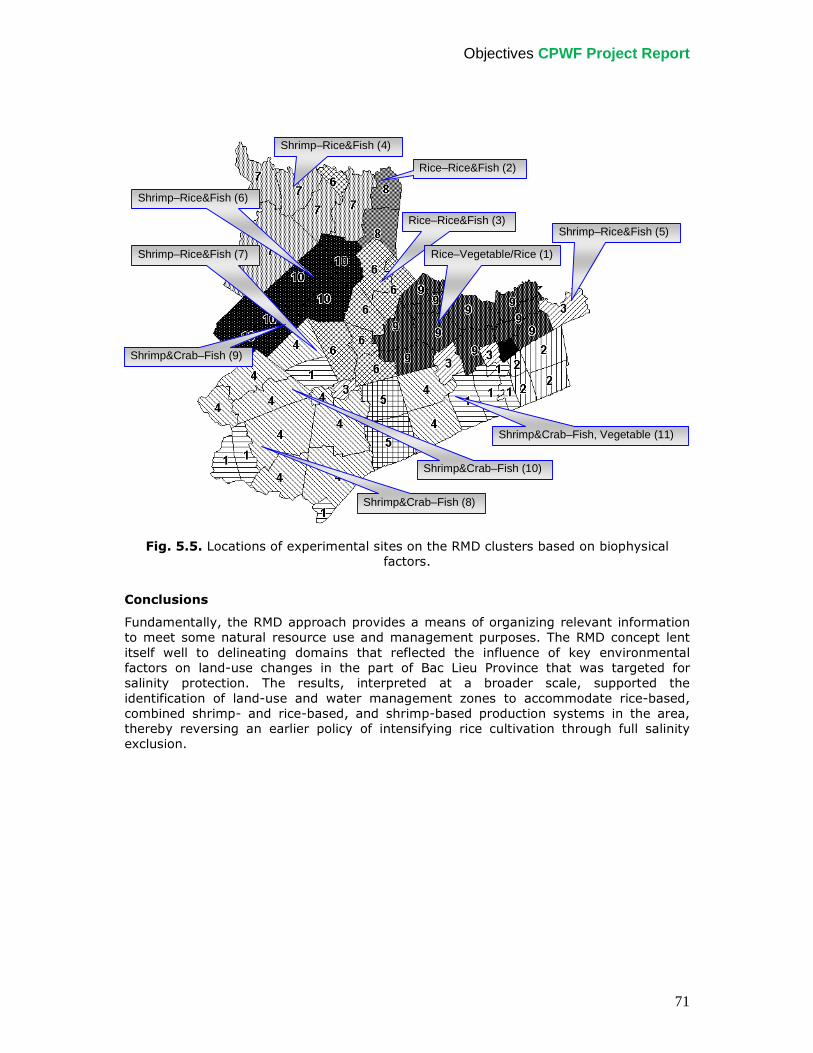
Objectives CPWF Project Report
71
Fig. 5.5. Locations of experimental sites on the RMD clusters based on biophysical factors.
Conclusions
Fundamentally, the RMD approach provides a means of organizing relevant information to meet some natural resource use and management purposes. The RMD concept lent itself well to delineating domains that reflected the influence of key environmental factors on land-use changes in the part of Bac Lieu Province that was targeted for salinity protection. The results, interpreted at a broader scale, supported the identification of land-use and water management zones to accommodate rice-based, combined shrimp- and rice-based, and shrimp-based production systems in the area, thereby reversing an earlier policy of intensifying rice cultivation through full salinity exclusion.
Rice–Rice&Fish (3)
Rice–Rice&Fish (2)
Shrimp–Rice&Fish (5)
Shrimp–Rice&Fish (4)
Rice–Vegetable/Rice (1)
Shrimp–Rice&Fish (6)
Shrimp–Rice&Fish (7)
Shrimp&Crab–Fish (8)
Shrimp&Crab–Fish (10)
Shrimp&Crab–Fish (9)
Shrimp&Crab–Fish, Vegetable (11)
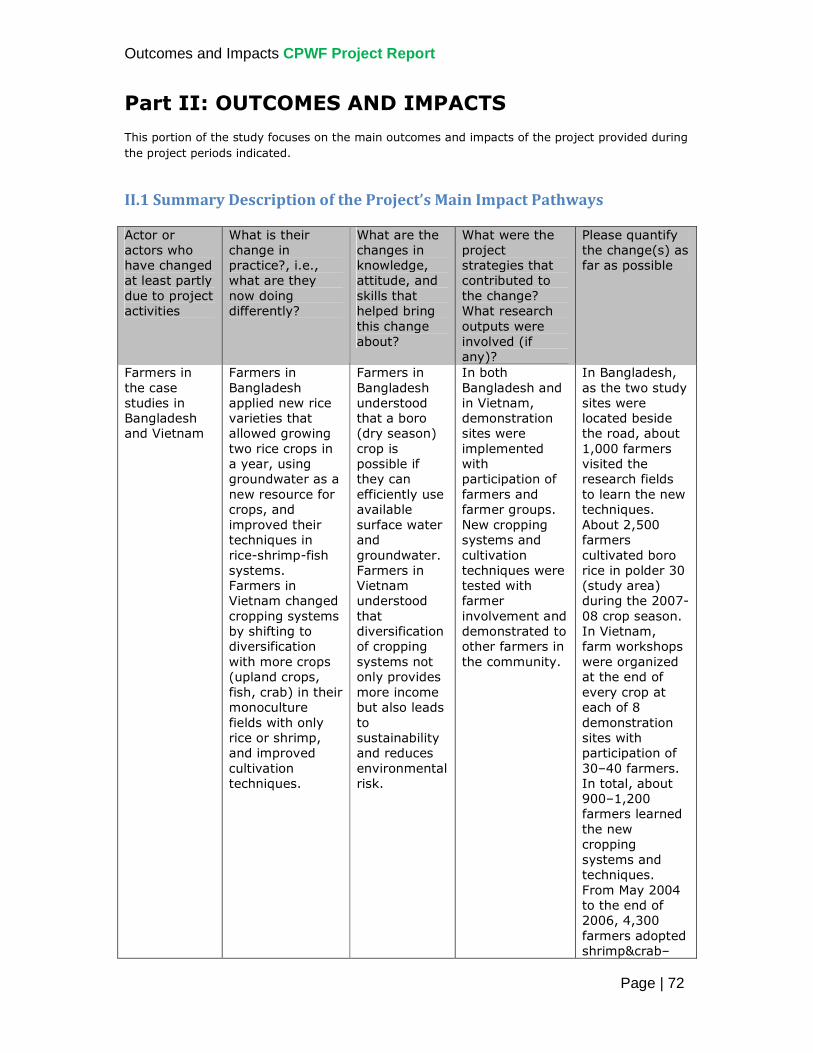
Outcomes and Impacts CPWF Project Report
Page | 72
Part II: OUTCOMES AND IMPACTS This portion of the study focuses on the main outcomes and impacts of the project provided during the project periods indicated.
II.1 Summary Description of the Project’s Main Impact Pathways Actor or actors who have changed at least partly due to project activities
What is their change in practice?, i.e., what are they now doing differently?
What are the changes in knowledge, attitude, and skills that helped bring this change about?
What were the project strategies that contributed to the change? What research outputs were involved (if any)?
Please quantify the change(s) as far as possible
Farmers in the case studies in Bangladesh and Vietnam
Farmers in Bangladesh applied new rice varieties that allowed growing two rice crops in a year, using groundwater as a new resource for crops, and improved their techniques in rice-shrimp-fish systems. Farmers in Vietnam changed cropping systems by shifting to diversification with more crops (upland crops, fish, crab) in their monoculture fields with only rice or shrimp, and improved cultivation techniques.
Farmers in Bangladesh understood that a boro (dry season) crop is possible if they can efficiently use available surface water and groundwater. Farmers in Vietnam understood that diversification of cropping systems not only provides more income but also leads to sustainability and reduces environmental risk.
In both Bangladesh and in Vietnam, demonstration sites were implemented with participation of farmers and farmer groups. New cropping systems and cultivation techniques were tested with farmer involvement and demonstrated to other farmers in the community.
In Bangladesh, as the two study sites were located beside the road, about 1,000 farmers visited the research fields to learn the new techniques. About 2,500 farmers cultivated boro rice in polder 30 (study area) during the 2007-08 crop season. In Vietnam, farm workshops were organized at the end of every crop at each of 8 demonstration sites with participation of 30–40 farmers. In total, about 900–1,200 farmers learned the new cropping systems and techniques. From May 2004 to the end of 2006, 4,300 farmers adopted shrimp&crab–
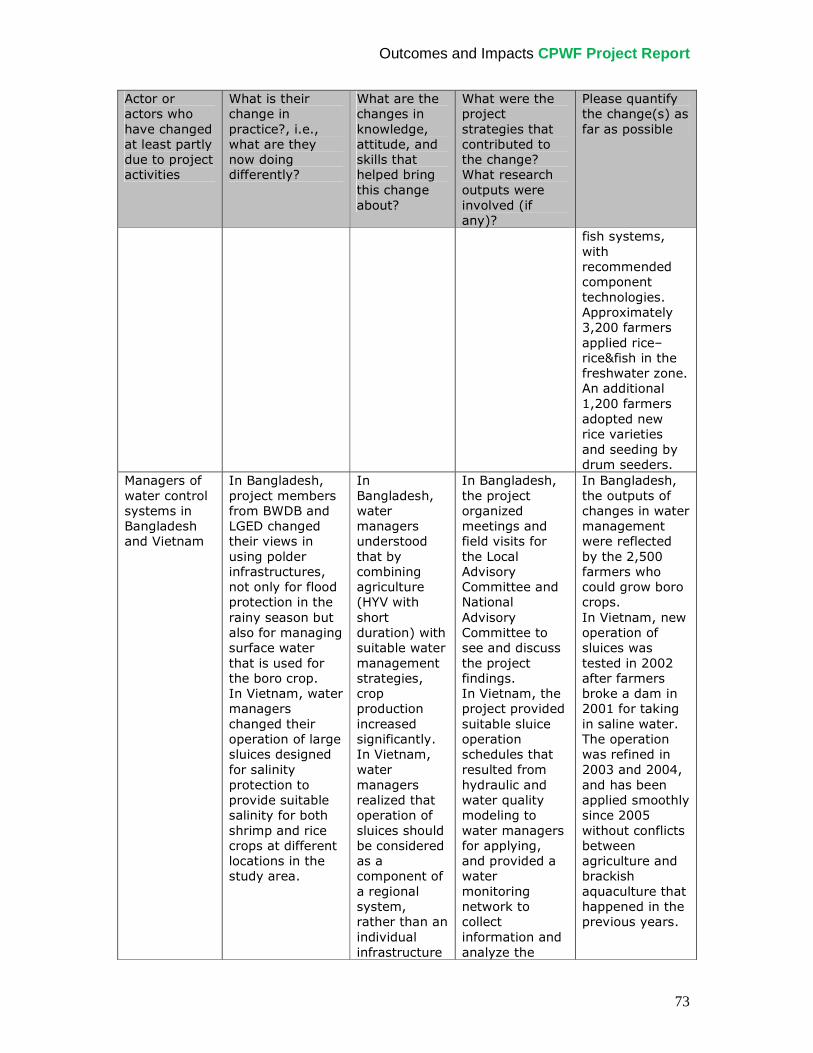
Outcomes and Impacts CPWF Project Report
73
Actor or actors who have changed at least partly due to project activities
What is their change in practice?, i.e., what are they now doing differently?
What are the changes in knowledge, attitude, and skills that helped bring this change about?
What were the project strategies that contributed to the change? What research outputs were involved (if any)?
Please quantify the change(s) as far as possible
fish systems, with recommended component technologies. Approximately 3,200 farmers applied rice–rice&fish in the freshwater zone. An additional 1,200 farmers adopted new rice varieties and seeding by drum seeders.
Managers of water control systems in Bangladesh and Vietnam
In Bangladesh, project members from BWDB and LGED changed their views in using polder infrastructures, not only for flood protection in the rainy season but also for managing surface water that is used for the boro crop. In Vietnam, water managers changed their operation of large sluices designed for salinity protection to provide suitable salinity for both shrimp and rice crops at different locations in the study area.
In Bangladesh, water managers understood that by combining agriculture (HYV with short duration) with suitable water management strategies, crop production increased significantly. In Vietnam, water managers realized that operation of sluices should be considered as a component of a regional system, rather than an individual infrastructure
In Bangladesh, the project organized meetings and field visits for the Local Advisory Committee and National Advisory Committee to see and discuss the project findings. In Vietnam, the project provided suitable sluice operation schedules that resulted from hydraulic and water quality modeling to water managers for applying, and provided a water monitoring network to collect information and analyze the
In Bangladesh, the outputs of changes in water management were reflected by the 2,500 farmers who could grow boro crops. In Vietnam, new operation of sluices was tested in 2002 after farmers broke a dam in 2001 for taking in saline water. The operation was refined in 2003 and 2004, and has been applied smoothly since 2005 without conflicts between agriculture and brackish aquaculture that happened in the previous years.
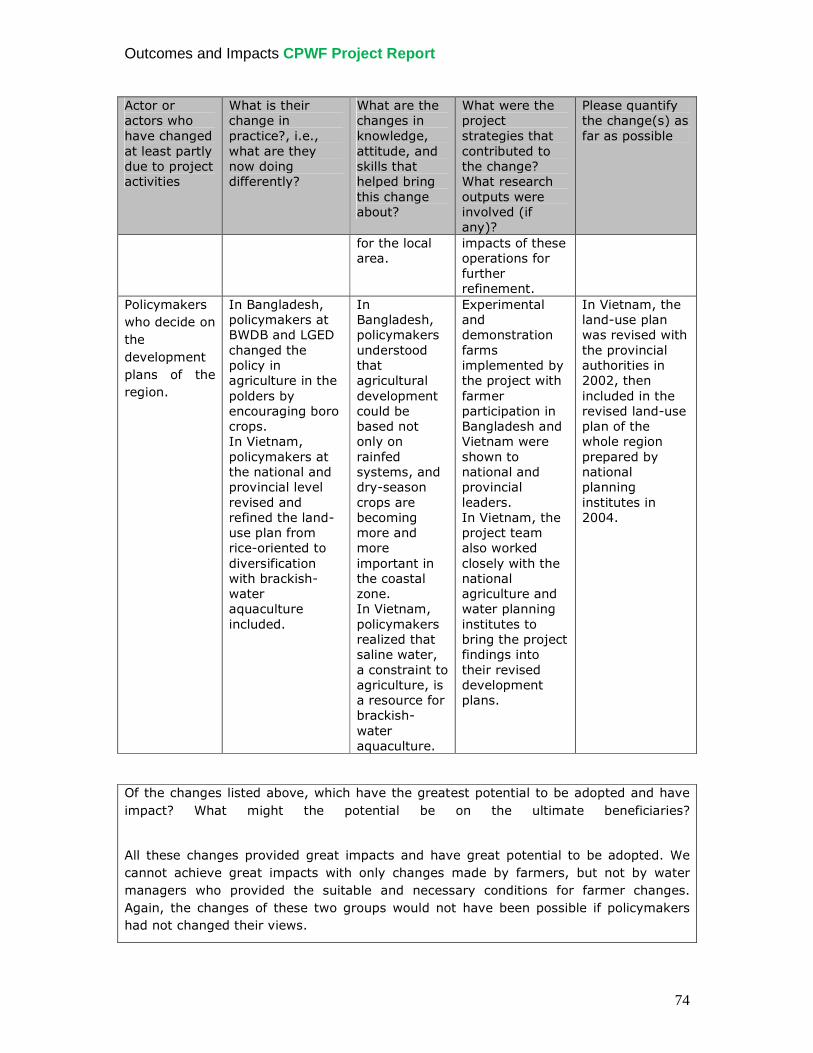
Outcomes and Impacts CPWF Project Report
74
Actor or actors who have changed at least partly due to project activities
What is their change in practice?, i.e., what are they now doing differently?
What are the changes in knowledge, attitude, and skills that helped bring this change about?
What were the project strategies that contributed to the change? What research outputs were involved (if any)?
Please quantify the change(s) as far as possible
for the local area.
impacts of these operations for further refinement.
Policymakers who decide on the development plans of the region.
In Bangladesh, policymakers at BWDB and LGED changed the policy in agriculture in the polders by encouraging boro crops. In Vietnam, policymakers at the national and provincial level revised and refined the land-use plan from rice-oriented to diversification with brackish-water aquaculture included.
In Bangladesh, policymakers understood that agricultural development could be based not only on rainfed systems, and dry-season crops are becoming more and more important in the coastal zone. In Vietnam, policymakers realized that saline water, a constraint to agriculture, is a resource for brackish-water aquaculture.
Experimental and demonstration farms implemented by the project with farmer participation in Bangladesh and Vietnam were shown to national and provincial leaders. In Vietnam, the project team also worked closely with the national agriculture and water planning institutes to bring the project findings into their revised development plans.
In Vietnam, the land-use plan was revised with the provincial authorities in 2002, then included in the revised land-use plan of the whole region prepared by national planning institutes in 2004.
Of the changes listed above, which have the greatest potential to be adopted and have impact? What might the potential be on the ultimate beneficiaries?
All these changes provided great impacts and have great potential to be adopted. We cannot achieve great impacts with only changes made by farmers, but not by water managers who provided the suitable and necessary conditions for farmer changes. Again, the changes of these two groups would not have been possible if policymakers had not changed their views.
Outcomes and Impacts CPWF Project Report
75
What still needs to be done to achieve this potential? Are measures in place (e.g., a new project, ongoing commitments) to achieve this potential? Please describe what will happen when the project ends.
To achieve the potential impacts, a new project is needed to
- continue the experimental and demonstration farms with participation of farmers that were only implemented and disseminated during a short period of 2–3 years under the project.
- continue to help water managers to refine their water management plans and operations to provide more stable water conditions for farmers who still face climate variations and risks.
- continue to support national and provincial authorities in setting their policy and strategy in the development of coastal zones, in particular under climate change and sea-level rise, other changes as food and fuel prices soar, and the financial crisis.
Each row of the table above is an impact pathway describing how the project contributed to outcomes in a particular actor or actors. Which of these impact pathways were unexpected (compared to expectations at the beginning of the project?) The project was designed based on these impact pathways, but we did not expect excellent responses and full participation from all three groups of actors. We also planned to create impacts from the farm level up to the regional level, but we found that the impacts were more significant when we created an integrated impact at all levels. Why were they unexpected? How was the project able to take advantage of them? These impacts at higher levels than the farm level were not highly expected because of bureaucratic systems in these countries, but the project was implemented at the time when changes in resource management were needed under pressure of development. The project took advantage of this by analyzing the needs of stakeholders at different levels and tried to implement an integrated resource management strategy that combined actions at different levels. What would you do differently next time to better achieve outcomes (i.e., changes in stakeholder knowledge, attitudes, skills, and practice)? If we redid the project, we would improve the participatory approach to allow better and faster involvement of different groups of stakeholders. We would also extend the project period to 5 years rather than 3 years (with a 1-year no-cost extension) to provide refined farm technologies and updated water management strategies, and have more time for the dissemination of project findings.
II.2 International Public Goods
II.2.1 Methodologies and tools In Vietnam, the Vietnam River Systems and Plains (VRSAP) hydraulic and salinity model developed by the SIWRP and applied in many projects in the Mekong Delta was refined
Outcomes and Impacts CPWF Project Report
76
and improved with new functions on sluice operations and simulation of water exchange between rice and shrimp fields and canal systems. A new acidity module was developed and embedded into this model to simulate the adicity in the river and canal system in the acid sulfate soil areas. These refinements and improvements in the model were made by the project team in cooperation with the staff of SIWRP and a PhD student of UAF who did his PhD at Melbourne University in Australia under the project framework. The Bayfish–Bac Lieu model developed under the project is a Bayesian model that aims to identify optimal water control regimes and trade-offs between water uses in order to improve the management of water-dependent resources in the inland coastal area of Bac Lieu Province. The model was developed between 2004 and 2007 to integrate local databases, outputs from the VRSAP model, and stakeholder consultations. The model facilitates analyses of the consequences of different water management scenarios (quantity and quality) for rice, fish, crab, and shrimp production in the province. Beyond production, trade-offs between household income, food security, or environmental protection were also identified during the model development process. The BayFish–Bac Lieu model allows detailing of (1) annual production probabilities in the case of a baseline scenario, (2) outcomes of four different sluice-gate operational modes, and (3) trade-offs between household income, food security, and environment outcomes for each scenario. The participatory approach used in the Mekong Delta resulted in a fast rate of farmers’ adoption of the tested technologies. It comprised multilevel stakeholder (farmers, extension workers, local authorities, mass media) participation from the beginning (site selection) to implementation and evaluation of the technologies. Wide publicity by mass media and endorsement of district and provincial authorities were pivotal in enabling extension workers to obtain adequate resources for disseminating the recommended cropping systems and component technologies. Involving the press, local authorities, and policymakers at every step was essential.
II.2.2 Project insights In both Bangladesh and Vietnam, farming practices with new production systems and technologies were documented and distributed. In Bangladesh, a leaflet on “Irrigation and water management”; training handouts on “Water-saving technologies for rice production,” “River water utilization for dry-season rice cultivation and adoption of boro-aman pattern for increasing productivity of the coastal regions of Bangladesh,” “Integrated management of available water resources for pre-monsoon rice cultivation and adoption of aus-aman pattern for increasing productivity of coastal regions of Bangladesh”; and an extension booklet on “Improved production techniques in rotational rice-shrimp system in coastal ghers” were prepared in Bangla language and distributed to farmers, extension agencies, and NGOs. In Vietnam, eight newspaper articles (six at the provincial level and two at the national level) and six television broadcasts (four on the Bac Lieu station and two on the national channel) were presented to the public.
Outcomes and Impacts CPWF Project Report
77
2.3 Partnership Achievements
2.3.1 Strengthen partnership among Bangladeshi partners Partnerships among Bangladeshi partners were strengthened through the project activities. BRRI and BFRI coordinated in the rice-shrimp-fish experiments. Technology findings by BRRI were distributed to farmers’ groups by an NGO, Education and Economic Development. Besides this direct collaboration by project partners under the project, the establishment of a National Advisory Committee and Local Advisory Committee also provided opportunities for other institutions and stakeholders to interact and exchange their ideas for other collaboration beyond the project.
2.3.2 Strengthen partnership among Vietnamese partners
In Vietnam, partnerships of three groups of partners, the research and education institutes (CTU, RIA2), the local and provincial authorities (BLPPC and provincial department such as BLDARD, BL AEC), and the national management institutes (SIWRP, IRMC), were strengthened significantly through the project activities. Findings from the research and education group (CTU and RIA2) were incorporated by the SIWRP and IRMC into the revised land-use plan and water development plan, and used by provincial and local authorities to direct the production systems in the province. Comments and suggestions by the provincial authorities, in particular the RWMA, were considered and incorporated carefully into the land- and water-use plans by SIWRP and IRMC. CTU and RIA2 also cooperated closely with BLPPC and its departments, and district and village authorities in implementing experiments to respond to the requirements by these provincial and local agencies. In addition, the RWMA created an excellent opportunity for the provinces in the region to coordinate in salinity control, and also in the exchange of plans on management of production systems.
2.3.3 Establish partnership between Bangladeshi and Vietnamese partners
The Bangladeshi and Vietnamese partners established a partnership from the beginning of the project when the Inception Workshop was organized in 2004. The Vietnamese team, led by the vice-governor of the People’s Committee of Bac Lieu Province, participated in that workshop and visited the Bangladeshi institutes and the study sites where rice and shrimp experiments were implemented. On the other hand, the Bangladeshi team participated in the International Conference on “Environment and Livelihoods in Coastal Zones: Managing Agriculture-Fishery-Aquaculture Conflicts” held in Bac Lieu Province in 2005 and visited the diversification experiments implemented by the Vietnamese team. Through this new partnership established by the project, high-yielding rice varieties with short duration were transferred from the Vietnamese partners to the Bangladeshi partners, and were successfully tested and introduced to farmers in the study area in Bangladesh. This partnership is now going beyond the project: after the project finished, a team of researchers/managers from BWDB was planning (in October 2009) to visit the Mekong Delta for a continuing exchange of experiences in delta management and research.
Outcomes and Impacts CPWF Project Report
78
2.4 Recommendations
Rice-based systems in Bangladesh
The aman-boro rice cropping system has high potential for increasing rice production and enhancing farmers’ livelihood in the coastal zones of Bangladesh. Investment in water management infrastructure to improve the storage capacity of the internal canal network is recommended. This investment will also improve drainage of the polders during the rainy season, thus facilitating the cultivation of short-duration HYVs in the aman season. Developing cold-tolerant varieties that can be planted early, hence reducing the water required from canal storage, can also increase the area of boro rice. Developing community management of water resource infrastructure is crucial in harmonizing different water users who may have conflicting demand, for example, between storing water for boro rice, and for fish, and drainage to facilitate the establishment of upland crops at the beginning of the dry season. Another potential cropping system for the coastal zones is aus-aman. Both seasons are rainfed. This cropping pattern would need short-duration, non-photoperiod-sensitive varieties. The shrimp-rice system in Bangladesh The use of HYVs of salt-tolerant T. aman rice and the integration of GIFT and prawns into rice fields increased net income by about 300% over that of the current wet-season monorice crop practice in rotational coastal rice-shrimp systems in Bangladesh. This wet-season farming system would not only provide strategies for overall risk reduction in dry-season shrimp farming, but would also provide economic farm sustainability and household food security. This integrated rice-aquaculture system, however, requires improvement of water management structures that would allow high water depth (>50 cm) for shrimp culture in the dry season, but could effectively drain rice fields in the wet season to avoid waterlogging and lodging of rice caused by heavy and prolonged monsoon rain. Participatory evaluation and dissemination of technologies
We strongly recommend multilevel stakeholder participation in every step of the testing-delivery pathway. The method used in this study required participation from different stakeholders (from farmers to local authorities and policymakers) in every step from site selection to outscaling. Involving the whole family of the participating farmers in decision making and training them on the technologies tested were important steps to avoid the often-cited mistake that “the ones who go to meetings and get trained (usually men) are not the ones who actually make decisions and carry out farming activities at home.” Farmer-managed on-farm workshops, with presentations from farmers rather than researchers or extension workers, had been very effective in creating lively debates and an atmosphere conducive to the farmer participants contributing ideas and inputs. Publicity given by the media (press), reporting their first-hand experiences with the technologies via the on-farm workshops, was important in technology dissemination. The endorsements from local authorities, who were also involved in every step from site selection to community evaluation, were crucial in the formulation of a cohesive program from the provincial to district and village levels to disseminate the new cropping systems and technologies. The study used participatory evaluation in the comparison between the tested systems and technologies and the controls, instead of rigid statistical designs and analyses. The endorsement and support of local authorities for out-scaling the recommended technologies and the widespread adaptation of the study results and recommendations support the choice of the approaches used. Vigorous statistical designs and analyses for
Outcomes and Impacts CPWF Project Report
79
complex systems at a regional scale, in which many parameters vary in space and time as illustrated in this study, would be prohibitively complicated and expensive. Involving policymakers and development agencies in research for development
projects
The project has achieved high impact in a relatively short time, at the farm as well as the policy level (McDonald 2008). The project attributed this short “turnaround” time to the involvement of development agencies (LGED, BWDB, BL Water Resource Bureau) and local governments from the beginning of the project. They were both project partners and clients. They ensured that research activities were relevant and they were the first ones to adapt the findings. Meetings with the Project National Advisory Committee (in Bangladesh) and with leaders of district and provincial People’s Committees (in Vietnam) were important conduits for research findings to reach policymakers. Water management at the regional level
At the regional level, the project recommended a participatory water management approach with the participation of farmers, local communities, and district and provincial authorities, together with the national agricultural and water planning institutes, to regularly (every 5 years) revise the development plan to take into account new changes in the region, in the country, and at a global level, and also new findings from long-term changes such as climate change and sea-level rise. The project also recommended the establishment of a regional water management alliance with members of all provinces related to the same water control system for discussing and deciding on the best option for operations of the system. This alliance should be led by the provincial and local authorities and operated to adapt the daily requirement of water management, and not only to give general direction and guidance as a river basin organization led by the central government and located far from the region.
2.5 Publications All publications listed below are available in digital form, unless stated otherwise, and are included in a DVD accompanying this report.
CATEGORY I: Books/monographs
1. Hoanh CT, Tuong TP, Gowing JW, Hardy B, editors. 2006. Environment and livelihoods in tropical coastal zones: managing agriculture-fishery-aquaculture conflicts. Comprehensive Assessment of Water Management in Agriculture Series No. 2. CABI Publishing, UK. 336 p.
2. Hoanh CT, Szuster B, Kam SP, Noble A, Ismail AM, editors. 2010. Tropical deltas and coastal zones community, environment, and food production at the land-water interface. Comprehensive Assessment of Water Management in Agriculture Series. CABI Publishing, UK (in press).
CATEGORY II: Refereed journal articles
1. Alam MJ, Saha SB, Islam ML, Tuong TP. 2006. Potential of rice-fish integration in
southwest coastal environment of Bangladesh. Progressive Agric. 17(1) ISSN 1017-8139:189-199.
2. Alam MJ, Islam ML, Tuong TP. 2008. Introducing tilapia (GIFT) with shrimp
(Penaeus monodon) in brackish-water rice-shrimp system: impact on water quality and production. Bangladesh J. Fisheries Res. 12(2):187-195.
Outcomes and Impacts CPWF Project Report
80
3. Hoanh CT, Phong ND, Gowing JW, Tuong TP, Ngoc NV, Hien NX. 2009. Hydraulic and water quality modeling: a tool for managing land use conflicts in inland coastal zones. Water Policy 11:106-120.
4. Joffre OM, Bosma RH. 2009. Typology of shrimp farming in Bac Lieu Province,
Mekong Delta, using multivariate statistics. Agric. Ecosyst. Environ. 132(1-2):153-159.
CATEGORY III: Refereed proceeding articles and book chapters
1. Baran E, Jantunen T, Chheng P. 2006. Developing a consultative Bayesian model
for integrated management of aquatic resources: an inland coastal zone case study. In: Hoanh CT, Tuong TP, Gowing JW, Hardy B, editors. Environment and livelihoods in tropical coastal zones: managing agriculture-fishery-aquaculture conflicts. Comprehensive Assessment of Water Management in Agriculture Series No. 2. CABI Publishing, UK. p 206-218.
2. Gowing JW, Tuong TP, Hoanh CT. 2006. Land and water management in coastal
zones: dealing with agriculture-aquaculture-fishery conflicts. In: Hoanh CT, Tuong TP, Gowing JW, Hardy B, editors. Environment and livelihoods in tropical coastal zones: managing agriculture-fishery-aquaculture conflicts. Comprehensive Assessment of Water Management in Agriculture Series No. 2. CABI Publishing, UK. p 1-16.
3. Gowing JW, Tuong TP, Hoanh CT, Khiem NT. 2006. Social and environmental
impact of rapid change in the coastal zone of Vietnam: an assessment of sustainability issues. In: Hoanh CT, Tuong TP, Gowing JW, Hardy B, editors. Environment and livelihoods in tropical coastal zones: managing agriculture-fishery-aquaculture conflicts. Comprehensive Assessment of Water Management in Agriculture Series No. 2. CABI Publishing, UK. p 48-60.
4. Hossain M, Ut TT, Bose ML. 2006. Livelihood systems and dynamics of poverty in
a coastal province of Vietnam. In: Hoanh CT, Tuong TP, Gowing JW, Hardy B, editors. Environment and livelihoods in tropical coastal zones: managing agriculture-fishery-aquaculture conflicts. Comprehensive Assessment of Water Management in Agriculture Series No. 2. CABI Publishing, UK. p 30-47.
5. Kam SP, Nhan NV, Tuong TP, Hoanh CT, Be Nam VT, Maunahan A. 2006.
Applying the resource management domain (RMD) concept to land and water use and management in the coastal zone: case study of Bac Lieu Province, Vietnam. In: Hoanh CT, Tuong TP, Gowing JW, Hardy B, editors. Environment and livelihoods in tropical coastal zones: managing agriculture-fishery-aquaculture conflicts. Comprehensive Assessment of Water Management in Agriculture Series No. 2. CABI Publishing, UK. p 193-205.
6. Mondal MK, Tuong TP, Ritu SP, Choudhury MHK, Chasi AM, Majumder PK, Islam
MM, Adhikary SK. 2006. Coastal water resource use for higher productivity: participatory research for increasing cropping intensity in Bangladesh. In: Hoanh CT, Tuong TP, Gowing JW, Hardy B, editors. Environment and livelihoods in tropical coastal zones: managing agriculture-fishery-aquaculture conflicts. Comprehensive Assessment of Water Management in Agriculture Series No. 2. CABI Publishing, UK. p 72-85.
7. Alam MJ, Islam ML, Saha SB, Tuong TP, Joffre O. 2010. Improving the
Productivity of the Rice-Shrimp System in the Southwest Coastal Region of
Outcomes and Impacts CPWF Project Report
81
Bangladesh. In: Hoanh CT, Szuster B, Kam SP, Noble A, Ismail AM, editors. Tropical deltas and coastal zones community, environment and food production at the land-water interface. Comprehensive Assessment of Water Management in Agriculture Series. CABI Publishing, UK (in press).
8. Baran E, Jantunen T, Chheng P, Hoanh CT. 2010. Integrated management of
aquatic resources: a Bayesian approach to water control and trade-offs in Southern Vietnam. Improving the productivity of the rice-shrimp system in the southwest coastal region of Bangladesh. In: Hoanh CT, Szuster B, Kam SP, Noble A, Ismail AM, editors. Tropical deltas and coastal zones community, environment and food production at the land-water interface. Comprehensive Assessment of Water Management in Agriculture Series. CABI Publishing, UK (in press).
9. Baran E, Chheng P, Warry F, Toan VT, Hung HP, Hoanh CT. 2010. Aquatic
resources and environmental variability in Bac Lieu Province (Southern Vietnam). In: Hoanh CT, Szuster B, Kam SP, Noble A, Ismail AM, editors. Tropical deltas and coastal zones community, environment and food production at the land-water interface. Comprehensive Assessment of Water Management in Agriculture Series. CABI Publishing, UK (in press).
10. Can ND, Khiem NT, Hossain M, Tuong TP. 2010. Farmers’ assessment of resource
management and farm level technological interventions. In: Hoanh CT, Szuster B, Kam SP, Noble A, Ismail AM, editors. Tropical deltas and coastal zones community, environment and food production at the land-water interface. Comprehensive Assessment of Water Management in Agriculture Series. CABI Publishing, UK (in press).
11. Chowdhury AKM, Jenkins SAM, Hossain M. 2010. Assessing the impact of small
scale coastal embankments: a case study of an LGED polder. In: Hoanh CT, Szuster B, Kam SP, Noble A, Ismail AM, editors. Tropical deltas and coastal zones community, environment and food production at the land-water interface. Comprehensive Assessment of Water Management in Agriculture Series. CABI Publishing, UK (in press).
12. Joffre O, Prein M, Tung PBV, Saha SB, Hao NV, Alam MJ. 2010. Evolution of
shrimp aquaculture systems in coastal zones of Bangladesh and Vietnam: a comparison. In: Hoanh CT, Szuster B, Kam SP, Noble A, Ismail AM, editors. Tropical deltas and coastal zones community, environment and food production at the land-water interface. Comprehensive Assessment of Water Management in Agriculture Series. CABI Publishing, UK (in press).
13. Khiem NT, Hossain M. 2010. Dynamics of livelihoods and resource use strategies
in different ecosystems of the coastal zones of Bac Lieu. In: Hoanh CT, Szuster B, Kam SP, Noble A, Ismail AM, editors. Tropical deltas and coastal zones community, environment and food production at the land-water interface. Comprehensive Assessment of Water Management in Agriculture Series. CABI Publishing, UK (in press).
14. Mondal MK, Tuong TP, Sharifullah AKM, Sattar MA. 2010. Water supply and
demand for dry season rice in the coastal polders of Bangladesh. In: Hoanh CT, Szuster B, Kam SP, Noble A, Ismail AM, editors. Tropical deltas and coastal zones community, environment and food production at the land-water interface. Comprehensive Assessment of Water Management in Agriculture Series. CABI Publishing, UK (in press).
Outcomes and Impacts CPWF Project Report
82
15. Ni DV, Phat TD, Lu T, Tung PBV, Ben DC, Vu DH, Thai PH, Giang PH, Tuong TP. 2010. Diversified cropping systems in a coastal province of the Mekong Delta, Vietnam: from testing to out-scaling. In: Hoanh CT, Szuster B, Kam SP, Noble A, Ismail AM, editors. Tropical deltas and coastal zones community, environment and food production at the land-water interface. Comprehensive Assessment of Water Management in Agriculture Series. CABI Publishing, UK (in press).
16. Baran E, Jantunen T. 2004. Stakeholder consultation for Bayesian Decision
Support Systems in environmental management. In: Ahmad Izani Md. Ismail, Koh Hock Lye, Yahya Abu Hasan, editors. Proceedings of the Regional Conference on Ecological and Environmental Modeling (ECOMOD 2004). Universiti Sains Malaysia, 15-16 December 2004, Penang, Malaysia. p 331-341.
17. Hoanh CT, Tuong TP, Khiem NT, Nhan NV. 2004. Management of conflicts in rice-
fishery production inthe coastal zone of the Mekong Delta and impacts on livelihood. In: Proceedings on Rice: Environment and Livelihood for the Poor. Mekong Rice Conference. p 138-148.
18. Hoanh CT, Phong ND, Gowing JW, Tuong TP, Hien NX, Dat ND. 2006. Predicting
impacts of water management in coastal zones by hydraulic and salinity modeling. In: Voinov A, Jakeman A, Rizzoli A, editors. Proceedings of the iEMSs third biennial meeting: summit on environmental modeling and software. International Environmental Modeling and Software Society, Burlington, Vermont (USA). CD. www.jemss.org/iemss2006/sessions/all.html.
19. Phong ND, Hoanh CT, Tuong TP, Malano H, Weaver T. 2007. Modelling acidity
propagation in a coastal zone with acid sulfate soils. In: Oxley L, Kulasiri D, editors. Proceedings of International Congress on Modelling and Simulation, Land, Water and Environmental Management: Integrated Systems for Sustainability (MODSIM07). 2006. Christchurch, New Zealand. p 170-176.
20. Sharifullah AK, Tuong TP, Mondal MK, Franco DT. 2008. Increasing crop water productivity through optimizing the use of scarce irrigation water resources. In: Humphreys E, Bayot RS, van Brakel M, Gichuki F, Svendsen M, Wester P, Huber-Lee A, Cook S, Douthwaite B, Hoanh CT, Johnson N, Nguyen-Khoa S, Vidal A, MacIntyre I, MacIntyre R, editors. Fighting Poverty Through Sustainable Water Use: Proceedings of the CGIAR Challenge Program on Water and Food 2nd International Forum on Water and Food, Volume 2. The CGIAR Challenge Program on Water and Food, Colombo, Sri Lanka. p 1-6. www.ifwf2.org/.
21. Mondal MK, Tuong TP, Sattar MA. 2008. Quality and groundwater level dynamics
at two coastal sites of Bangladesh: implications for irrigation development. In: Humphreys E, Bayot RS, van Brakel M, Gichuki F, Svendsen M, Wester P, Huber-Lee A, Cook S, Douthwaite B, Hoanh CT, Johnson N, Nguyen-Khoa S, Vidal A, MacIntyre I, MacIntyre R, editors. Fighting Poverty Through Sustainable Water Use: Proceedings of the CGIAR Challenge Program on Water and Food 2nd International Forum on Water and Food Volume 2. The CGIAR Challenge Program on Water and Food, Colombo, Sri Lanka. p 7-11. www.ifwf2.org/.
22. Alam MJ, Islam ML, Tuong TP, Olivier J. 2008. Improved rice-aquaculture integration in coastal rice-shrimp system in Bangladesh. In: Humphreys E, Bayot RS, van Brakel M, Gichuki F, Svendsen M, Wester P, Huber-Lee A, Cook
Outcomes and Impacts CPWF Project Report
83
S, Douthwaite B, Hoanh CT, Johnson N, Nguyen-Khoa S, Vidal A, MacIntyre I, MacIntyre R, editors. Fighting Poverty Through Sustainable Water Use: Proceedings of the CGIAR Challenge Program on Water and Food 2nd International Forum on Water and Food Volume 3. The CGIAR Challenge Program on Water and Food, Colombo, Sri Lanka. p 103-106. www.ifwf2.org/.
23. Tuong TP, Ismail AM. 2006. Coastal saline zones of the monsoon tropics: problems and prospects. In: Proceedings of the Special Workshop on Natural Resource Management for Poverty Reduction and Environmental Sustainability in Fragile Rice-based Systems, 8-9 March 2006, Dhaka, Bangladesh. Los Baños (Philippines): International Rice Research Institute.
CATEGORY IV: Others (posters, abstracts etc.)
1. Write-up about the work of Dr. Mondal in Bangladesh. May 2005. In: Agriculturist
online. www.new-agri.co.uk/05-3/focuson/focuson3.html. 2. Alam MJ, Islam ML. 2007. Improved culture techniques in shrimp (Penaeus
monodon) and rice system in coastal ghers. Extension Booklet # 31. Bangladesh Fisheries Research Institute, Brackishwater Station, Paikgacha, Khulna, Bangladesh. 20 p.
3. Managing water and land resources for sustainable livelihoods at the interface
between fresh and saline water environments in Vietnam and Bangladesh. Project poster presented at the CGIAR Challenge Program on Water and Food 2nd International Forum on Water and Food, 10-14 November 2008, Addis Ababa, Ethiopia.
Conference Presentations/Papers (International)—those not published in the
categories above
1. Angeles O, Tuong TP, Ismail AM, Castillo E, Cabangon R. 2008. Responses of three contrasting rice cultivars to salt stress and water deficit imposed at two physiological stages. Paper presented at the 2008 Joint Annual Meeting of the Geological Society of America (GSA), Soil Science Society of America (SSSA), American Society of Agronomy (ASA), Crop Science Society of America (CSSA), Gulf Coast Association of Geological Societies (GCAGS), and Houston Geological Society (HGS), 5-9 October, at George R. Brown Convention Center, Houston, Texas, USA.
2. Mondal MK, Tuong TP. 2006. Managing water and land resources for sustainable
livelihoods at the interface between fresh and saline water environments in Vietnam and Bangladesh. Progress report presented at the CPWF Annual Stakeholders Workshop for Indo-Gangetic Basin, 30 June-4 July, in Kathmandu, Nepal.
Conference and Seminar Presentations/Papers (National)
1. Alam MJ, Saha SB, Islam ML, Tuong TP. 2006. Integrated rice-fish farming in
saline and freshwater interface in coastal region of Bangladesh (abstract). In: Shah MS, editor. 2nd Fisheries Conference and Research Fair 2006, Bangladesh Fisheries Research Forum, 18-19 January, at BARC, Dhaka, Bangladesh. p 86.
Outcomes and Impacts CPWF Project Report
84
2. Alam MJ, Islam ML, Shah SB, Tuong TP. 2008. Rice-shrimp system at fresh and saline water interface: approach to increasing productivity for sustainable livelihoods (abstract). In: Wahab MA, editor. 3rd Fisheries Conference and Research Fair 2008, Bangladesh Fisheries Research Forum, 16-17 January, at BARC, Dhaka, Bangladesh. p 157-158.
3. Alam MJ. 2008. Eco-friendly improved shrimp culture and production technique in
coastal ghers. Keynote paper presented at the National Seminar on Eco-friendly Shrimp Culture, 10 June, at BARC, Dhaka, Bangladesh. Ministry of Fisheries & Livestock and Bangladesh Fisheries Research Institute, Bangladesh.
4. Mondal MK, Tuong TP. 2006. Water management strategy for improving land
productivity of the coastal saline environments in Bangladesh. Paper presented at the Climate Change Meeting, 18 July, at CEGIS, Dhaka, Bangladesh.
5. Mondal MK, Tuong TP, Sattar MA. 2006. Salinity dynamics of river and
groundwater for irrigation development in the southwest coastal region of Bangladesh. Paper presented at the Annual Review of Bangladesh Rice Research Institute, 17-21 December, in Gazipur, Bangladesh.
MSc. Thesis
1. Debbrata Das. 2008. Yield performance of six Vietnam rice varieties in the coastal
saline environments of Khulna district. Khulna University, Bangladesh. (Repository: Khulna University)
2. Tripti Baidya. 2008. Performance of salt tolerant rice genotypes in coastal saline
soil of Khulna district. Khulna University, Bangladesh. (Repository: Khulna University)
3. Nguyen Xuan Hien. 2006. Water management for changing land use systems in
Quan Lo Phung Hiep project. University of Water Resources, Hanoi, Vietnam. (Repository: Southern Institute of Water Resources Planning, Ho Chi Minh City, Vietnam)
4. Nguyen Dinh Dat. 2008. Application of VRSAP model for sluice operations in the
Quan Lo Phung Hiep project. University of Water Resources, Hanoi, Vietnam. (Repository: Southern Institute of Water Resources Planning, Ho Chi Minh City, Vietnam)
PhD Thesis
1. Sharifullah AKM. 2008. Assessing water availability and irrigation requirement for
increasing dry season rice production in coastal polder areas of Bangladesh. University of the Philippines Los Baños, Philippines. (Repository: Library, IRRI, Los Baños, Philippines)
2. Phong ND. 2008. Water acid modeling for effective water management: a case
study in Ca Mau peninsula, Mekong Delta, Vietnam. Melbourne University, Australia. http://dtl.unimelb.edu.au/R/CQHT2V4I13G2C71DIHV4682MKMPD3HQE6J26N6QYQQ95L5B276-01274?func=dbin-jump-full&object_id=111807&pds_handle=GUEST.
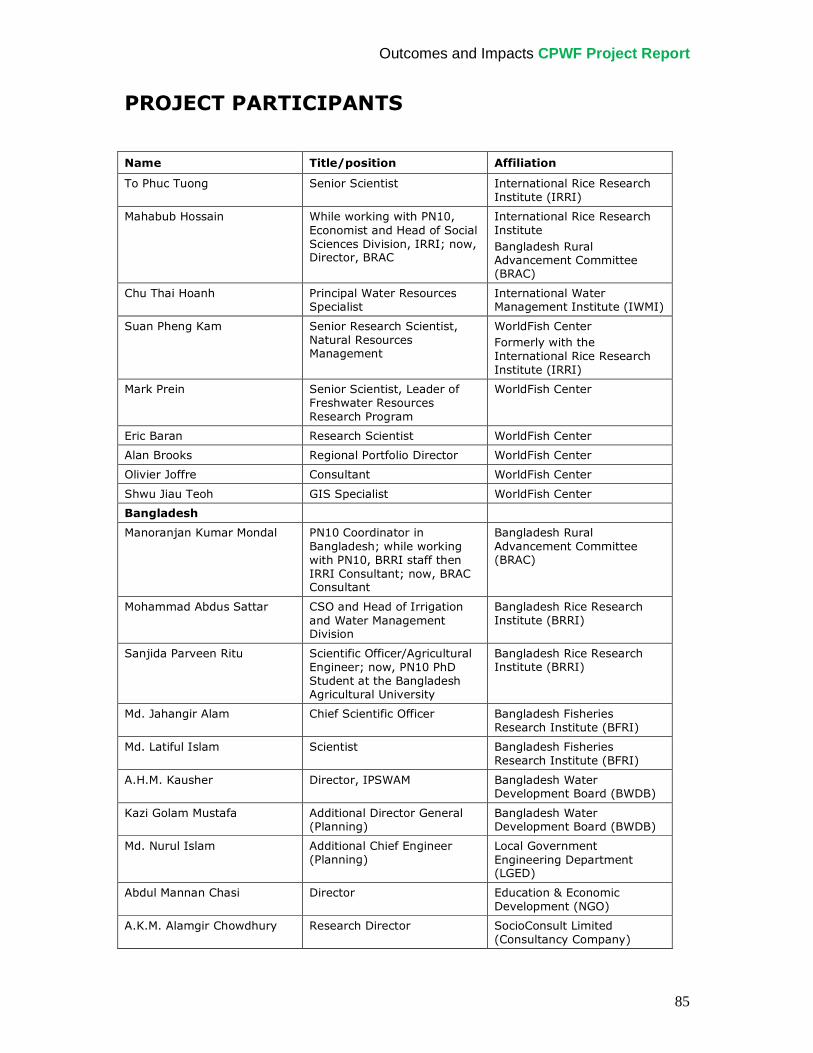
Outcomes and Impacts CPWF Project Report
85
PROJECT PARTICIPANTS
Name Title/position Affiliation
To Phuc Tuong Senior Scientist International Rice Research Institute (IRRI)
Mahabub Hossain While working with PN10, Economist and Head of Social Sciences Division, IRRI; now, Director, BRAC
International Rice Research Institute Bangladesh Rural Advancement Committee (BRAC)
Chu Thai Hoanh Principal Water Resources Specialist
International Water Management Institute (IWMI)
Suan Pheng Kam Senior Research Scientist, Natural Resources Management
WorldFish Center Formerly with the International Rice Research Institute (IRRI)
Mark Prein Senior Scientist, Leader of Freshwater Resources Research Program
WorldFish Center
Eric Baran Research Scientist WorldFish Center
Alan Brooks Regional Portfolio Director WorldFish Center
Olivier Joffre Consultant WorldFish Center
Shwu Jiau Teoh GIS Specialist WorldFish Center
Bangladesh
Manoranjan Kumar Mondal PN10 Coordinator in Bangladesh; while working with PN10, BRRI staff then IRRI Consultant; now, BRAC Consultant
Bangladesh Rural Advancement Committee (BRAC)
Mohammad Abdus Sattar CSO and Head of Irrigation and Water Management Division
Bangladesh Rice Research Institute (BRRI)
Sanjida Parveen Ritu Scientific Officer/Agricultural Engineer; now, PN10 PhD Student at the Bangladesh Agricultural University
Bangladesh Rice Research Institute (BRRI)
Md. Jahangir Alam Chief Scientific Officer Bangladesh Fisheries Research Institute (BFRI)
Md. Latiful Islam Scientist Bangladesh Fisheries Research Institute (BFRI)
A.H.M. Kausher Director, IPSWAM Bangladesh Water Development Board (BWDB)
Kazi Golam Mustafa Additional Director General (Planning)
Bangladesh Water Development Board (BWDB)
Md. Nurul Islam Additional Chief Engineer (Planning)
Local Government Engineering Department (LGED)
Abdul Mannan Chasi Director Education & Economic Development (NGO)
A.K.M. Alamgir Chowdhury Research Director SocioConsult Limited (Consultancy Company)
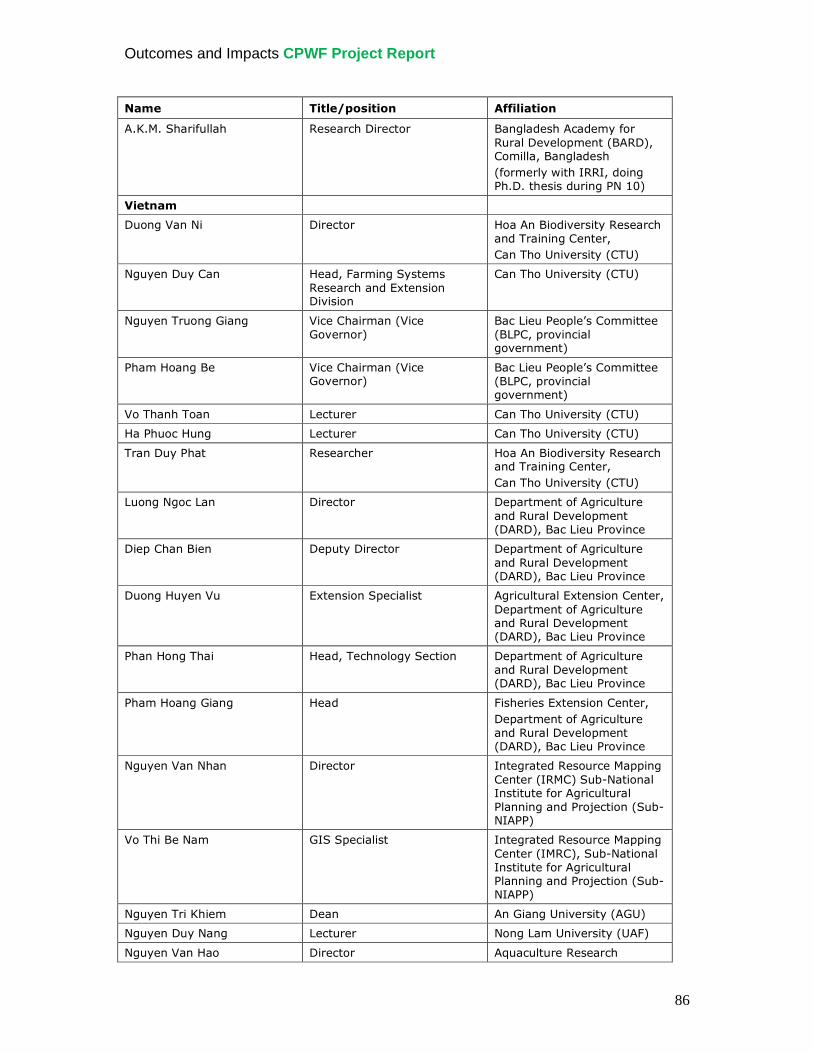
Outcomes and Impacts CPWF Project Report
86
Name Title/position Affiliation
A.K.M. Sharifullah Research Director Bangladesh Academy for Rural Development (BARD), Comilla, Bangladesh (formerly with IRRI, doing Ph.D. thesis during PN 10)
Vietnam
Duong Van Ni Director Hoa An Biodiversity Research and Training Center, Can Tho University (CTU)
Nguyen Duy Can Head, Farming Systems Research and Extension Division
Can Tho University (CTU)
Nguyen Truong Giang Vice Chairman (Vice Governor)
Bac Lieu People’s Committee (BLPC, provincial government)
Pham Hoang Be Vice Chairman (Vice Governor)
Bac Lieu People’s Committee (BLPC, provincial government)
Vo Thanh Toan Lecturer Can Tho University (CTU)
Ha Phuoc Hung Lecturer Can Tho University (CTU)
Tran Duy Phat Researcher Hoa An Biodiversity Research and Training Center, Can Tho University (CTU)
Luong Ngoc Lan Director Department of Agriculture and Rural Development (DARD), Bac Lieu Province
Diep Chan Bien Deputy Director Department of Agriculture and Rural Development (DARD), Bac Lieu Province
Duong Huyen Vu Extension Specialist Agricultural Extension Center, Department of Agriculture and Rural Development (DARD), Bac Lieu Province
Phan Hong Thai Head, Technology Section Department of Agriculture and Rural Development (DARD), Bac Lieu Province
Pham Hoang Giang Head Fisheries Extension Center, Department of Agriculture and Rural Development (DARD), Bac Lieu Province
Nguyen Van Nhan Director Integrated Resource Mapping Center (IRMC) Sub-National Institute for Agricultural Planning and Projection (Sub-NIAPP)
Vo Thi Be Nam GIS Specialist Integrated Resource Mapping Center (IMRC), Sub-National Institute for Agricultural Planning and Projection (Sub-NIAPP)
Nguyen Tri Khiem Dean An Giang University (AGU)
Nguyen Duy Nang Lecturer Nong Lam University (UAF)
Nguyen Van Hao Director Aquaculture Research
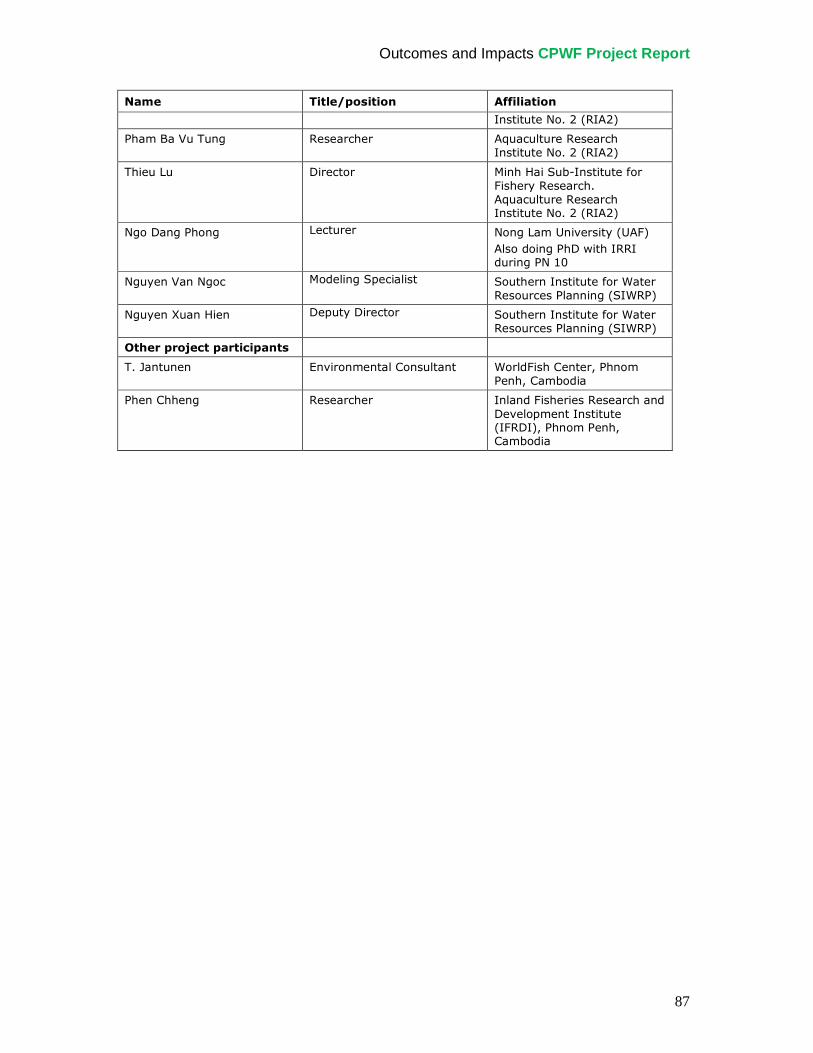
Outcomes and Impacts CPWF Project Report
87
Name Title/position Affiliation
Institute No. 2 (RIA2)
Pham Ba Vu Tung Researcher Aquaculture Research Institute No. 2 (RIA2)
Thieu Lu Director Minh Hai Sub-Institute for Fishery Research. Aquaculture Research Institute No. 2 (RIA2)
Ngo Dang Phong Lecturer Nong Lam University (UAF) Also doing PhD with IRRI during PN 10
Nguyen Van Ngoc Modeling Specialist Southern Institute for Water Resources Planning (SIWRP)
Nguyen Xuan Hien Deputy Director Southern Institute for Water Resources Planning (SIWRP)
Other project participants
T. Jantunen Environmental Consultant WorldFish Center, Phnom Penh, Cambodia
Phen Chheng Researcher Inland Fisheries Research and Development Institute (IFRDI), Phnom Penh, Cambodia
Bibliography CPWF Project Report
88
BIBLIOGRAPHY Alam MJ, Islam ML, Saha SB, Tuong TP, Joffre O. 2010. Improving the productivity of the
rice-shrimp system in the southwest coastal region of Bangladesh. In: Hoanh CT, Szuster B, Kam SP, Noble A, Ismail AM, editors. Tropical deltas and coastal zones community, environment and food production at the land-water interface. Comprehensive Assessment of Water Management in Agriculture Series. CABI Publishing, UK (in press).
Anonymous. 2007. New advances in rice-aquaculture production systems for deltaic
plains – key findings from a project funded by the CGIAR Challenge Program on Water and Food. World Fish Center-Bangladesh and South Asia Office, Dhaka, Bangladesh. 15 p.
Baran E, Jantunen T, Chheng P, Hoanh CT. 2010a. Integrated management of aquatic
resources: a Bayesian approach to water control and trade-offs in Southern Vietnam. Improving the Productivity of the Rice-Shrimp System in the Southwest Coastal Region of Bangladesh. In: Hoanh CT, Szuster B, Kam SP, Noble A, Ismail AM, editors. Tropical deltas and coastal zones community, environment and food production at the land-water interface. Comprehensive Assessment of Water Management in Agriculture Series. CABI Publishing, UK (in press).
Baran E, Chheng P, Warry F, Toan VT, Hung HP, Hoanh CT. 2010b. Aquatic resources
and environmental variability in Bac Lieu Province (Southern Vietnam). In: Hoanh CT, Szuster B, Kam SP, Noble A, Ismail AM, editors. Tropical deltas and coastal zones community, environment and food production at the land-water interface. Comprehensive Assessment of Water Management in Agriculture Series. CABI Publishing, UK (in press).
Baran E. 2000. Biodiversity of estuarine fish faunas in West Africa. Naga, The ICLARM
Quarterly 23(4):4-9. Baran E, Albaret JJ, Diouf PS. 1999. Mangrove fish communities in West Africa. In:
Cormier-Salem M-C, editor. Rivières du Sud - Sociétés et Mangroves Ouest-africaines. IRD Éditions, Paris, France. p 98-117.
Baran E. 1995. Spatio-temporal dynamics of estuarine fish assemblages in Guinea:
relationships with abiotic factors. TDM vol. 142. Éditions ORSTOM, Paris, France. Bouman BAM, Van Laar HH. 2006. Description and evaluation of the rice growth model
ORYZA2000 under nitrogen-limited conditions. Agric. Syst. 87:249-273. Brennan D, Clayton H, Be TT. 2000. Economic characteristics of extensive shrimp farms
in the Mekong Delta. Aquacult. Econ. Manage. 4(3/4):127-140. Brown BE. 1997. Integrated coastal management: South Asia. Department of Marine
Sciences and Coastal Management, University of Newcastle, Newcastle upon Tyne, UK.
Brunet R. 1993. Building models for spatial analysis. In: Gip-Reclus, editor. Two decades
of l'Espace Geographique. Montpellier, France. p 109-123. Brunet R. 1980. La composition des modèles dans l’analyse spatiale. L’Espace
Géographique. 4:253-265.
Bibliography CPWF Project Report
89
Cain J. 2001. Planning improvements in natural resources management. Guidelines for
using Bayesian networks to support the planning and management of development programmes in the water sector and beyond. Centre for Ecology and Hydrology (CEH), Wallingford, UK.
Carrel G, Barthelemy D, Auda Y, Chessel D. 1986. Approche graphique de l'analyse en
composantes principales normée: utilisation en hydrobiologie. Acta Oecol., Oecol. Gen. 7(2):189-203.
Chairuddin G, Iriansyah, Kleppler O. 1990. Survey report of fisheries study in Pulau
Petak Area. Fisheries Faculty, University of Lambung Mangkurat, Banjarbaru, Indonesia.
Charniak E. 1991. Bayesian networks without tears. Artificial Intelligence 12(4):50-63.
Available at www-psych.stanford.edu/~jbt/224/Charniak_91.pdf (accessed 31 August 2009).
Dorr III JA, Schneeberger PJ, Tin HT, Flath LE. 1985. Studies on adult, juvenile, and
larval fishes of the Gambia River, West Africa, 1983-1984. Great Lakes and Marine Waters Center International Programs. The University of Michigan, Ann Arbor, Michigan, USA.
Fagade SO, Olaniyan CIO. 1973. Seasonal distribution of the fish fauna of the Lagos
Lagoon. Bull. l'IFAN 34A(1):244–252. Government of Bangladesh. 1997. Flood Action Plan 16: Environment Study.
Government of Bangladesh. Gowing JW, Tuong TP, Hoanh CT. 2006a. Land and water management in coastal zones:
dealing with agriculture-aquaculture-fishery conflicts. In: Hoanh CT, Tuong TP, Gowing JW, Hardy B, editors. Environment and livelihoods in tropical coastal zones: managing agriculture-fishery-aquaculture conflicts. Comprehensive Assessment of Water Management in Agriculture Series No. 2. CABI Publishing, UK. p 1-16.
Gowing JW, Tuong TP, Hoanh CT, Khiem NT. 2006b. Social and environmental impact of
rapid change in the coastal zone of Vietnam: an assessment of sustainability issues. In: Hoanh CT, Tuong TP, Gowing JW, Hardy B, editors. Environment and livelihoods in tropical coastal zones: managing agriculture-fishery-aquaculture conflicts. Comprehensive Assessment of Water Management in Agriculture Series No. 2. CABI Publishing, UK. p 48-60.
Halcrow Group Limited. 2001. Working Paper No. 4 – Review of Available Models. In:
Mekong River Commission Water Utilisation Project Component A: Development of Basin Modeling Package and Knowledge Base. December 2001.
Hoanh CT, Tuong TP, Gallop KM, Gowing JW, Kam SP, Khiem NT, Phong ND. 2003.
Livelihood impacts of water policy changes: evidence from a coastal area of the Mekong River Delta. J. Water Policy 5(5):475-488.
Hoanh CT, Tuong TP, Kam SP, Phong ND, Ngoc NV, Lehmann E. 2001. Using GIS-linked
hydraulic model for managing water quality conflict for shrimp and rice production in the Mekong River Delta, Vietnam. In: Ghassemi F, Post D, Sivapalan M, Vertessy R, editors. Proceedings of MODSIM 2001, International Congress on Modelling and Simulation. Canberra, Australia, 10-13 December 2001. Volume 1: Natural Systems (part one). p 221-226.
Bibliography CPWF Project Report
90
Hossain M, Ut TT, Bose ML. 2006. Livelihood systems and dynamics of poverty in a
coastal province of Vietnam. In: Hoanh CT, Tuong TP, Gowing JW, Hardy B, editors. Environment and livelihoods in tropical coastal zones: managing agriculture-fishery-aquaculture conflicts. Comprehensive Assessment of Water Management in Agriculture Series No. 2. CABI Publishing, UK. p 30-47.
Hotelling H. 1933. Analysis of a complex of statistical variables into principal
components. J. Educ. Psychol. 24:417-441, 498-520. Integrated Planning for Sustainable Water Management (IPSWAM). 2007. Integrated
water management planning study in polder 30. Technical Report number 7 (draft). IPSWAM and BWDB, Dhaka, Bangladesh.
Integrated Coastal Zone Management Plan (ICZMP). 2004. Concept note on groundwater
management in coastal zone of Bangladesh. Water Resources Planning Organization, Dhaka, Bangladesh.
Jantunen T, Baran E, Chheng P, Warry F, Hoanh CT, Binh NT. 2007. Sluice gate
operation, outcomes and trade-offs: BayFish–Bac Lieu, a model for integrated management of inland coastal resources in southern Vietnam. Final report. CGIAR Water and Food Challenge Program project PN 10 “Managing Water and Land Resources for Sustainable Livelihoods at the Interface Between Fresh and Saline Water Environments in Vietnam and Bangladesh.” WorldFish Center, Phnom Penh, Cambodia.
Jensen FV. 1996. An introduction to Bayesian networks. UCL Press, London, UK.
Kam SP, Hoanh CT, Tuong TP, Khiem NT, Dung LC, Phong ND, Barr J, Ben DC. 2001.
Managing water and land resources under conflicting demands of shrimp and rice production for sustainable livelihoods in the Mekong River Delta, Vietnam. Paper presented at the INRM-2001 Workshop on Integrated Management for Sustainable Agriculture, Forestry and Fisheries, 28-31 August at CIAT, Cali, Colombia.
Khue NN. 1986. Modeling of tidal propagation and salinity intrusion in the Mekong main
estuarine system. In: Report of the Mekong Delta salinity intrusion studies. Mekong Secretariat, Bangkok, Thailand.
Klippel A, Tappe H, Kulik L, Lee PU. 2005. Wayfinding choremes: a language for
modeling conceptual route knowledge. J. Visual Lang. Computing 16(4):311-329. Klippel A. 2003. Wayfinding choremes. In: Kuhn W, Worboys M, Timpf S, editors. Spatial
information theory: foundations of geographic information science. Springer-Verlag, Berlin. p 349-361.
Lévêque C, Fairhurst CP, Abban K, Paugy D, Curtis MS, Traore K. 1988. Onchoceriasis
control program in West Africa: ten years’ monitoring of fish populations. Chemosphere 17(2):421-440.
Luttrell C. 2006. Adapting to aquaculture in Vietnam: securing livelihoods in a context of
change in two coastal communities. In: Hoanh CT, Tuong TP, Gowing JW, Hardy B, editors. Environment and livelihoods in tropical coastal zones: managing agriculture-fishery-aquaculture conflicts. Comprehensive Assessment of Water Management in Agriculture Series No. 2. CABI Publishing, UK. p 17-29.
Bibliography CPWF Project Report
91
McDonald B. 2008. Managing water and land resources for sustainable livelihoods at the interface between fresh and saline water environments in Vietnam and Bangladesh – a project funded by the Challenge Program on Water and Food – impact evaluation of the Vietnam Component. Challenge Program on Water and Food, Sri Lanka.
Minh LQ, Tuong TP, Booltink HWG, van Mensvoort MEF, Bouma J. 1997a. Bypass flow
and its role in leaching of raised beds under different land use types on an acid sulphate soil. Agric. Water Manage. 32(2):131-145.
Minh LQ, Tuong TP, van Mensvoort MEF, Bouma J. 1997b. Contamination of surface
water as affected by land use in acid sulfate soils in the Mekong River Delta, Vietnam. Agric. Ecosyst. Environ. 61(1):19-27.
Minh LQ, Tuong TP, vanMensvoort MEF, Bouma J. 1997c. Tillage and water management
for riceland productivity in acid sulfate soils of the Mekong Delta, Vietnam. Soil Tillage Res. 42(1-2):1-14.
Molle F, Hoanh CT. 2009. Implementing integrated river basin management: lessons
from the Red River Basin, Vietnam. IWMI Research Report 131. Colombo, Sri Lanka: International Water Management Institute. 33 p.
Mondal MK, Tuong TP, Ritu SP, Choudhury MHK, Chasi AM, Majumder PK, Islam MM,
Adhikary SK. 2006. Coastal water resource use for higher productivity: participatory research for increasing cropping intensity in Bangladesh. In: Hoanh CT, Tuong TP, Gowing JW, Hardy B, editors. Environment and livelihoods in tropical coastal zones: managing agriculture-fishery-aquaculture conflicts. Comprehensive Assessment of Water Management in Agriculture Series No. 2. CABI Publishing, UK. p 72-85.
Nichols S. 1977. On the interpretation of principal components analysis in ecological
contexts. Vegetatio 34:191-197. NEDECO. 1991. Surface water resources and hydraulic modeling. Working paper No. 2,
Mekong Delta Master Plan Project. State Planning Committee of Vietnam, World Bank, Mekong Secretariat, and UNDP.
PETRRA (Poverty Elimination Through Rice Research Assistance). 2000. Strategic
document. www.eudelbangladesh.org/new/02%2001%20Jan%2031%20Petrra%20Strategy%20Final.doc.
Phong ND. 2000. Dynamics of salinity and salinity effects on rice production of rice-
shrimp system in the Mekong Delta, Vietnam. MSc thesis at the University of the Philippines Los Baños (UPLB), Los Baños, Philippines.
Rahman A. 1995. Shrimp and environment in the coastal region. Working Paper of
Bangladesh Institute of Development Studies. Rottenberry JT, Wiens JA. 1981. A synthetic approach to principal component analysis of
bird/habitat relationships. In: Capen DE, editor. The use of multivariate statistics in studies of wildlife habitat. USDA Forest Service General Technical Report, RM-87. Rocky Mountain Forest and Range Experiment Station, Fort Collins, Colorado, USA. p 197-208.
Bibliography CPWF Project Report
92
Shayamal S, Orly B. 2006. Community identified significant change. A facilitator's guide (revised version 2006). International Institute of Rural Reconstruction (IIRR), Silang, Cavite, Philippines.
Thioulouse J, Chessel D, Dolédec S, Olivier JM. 1997. ADE-4: a multivariate analysis and
graphical display software. Statistics and Computing 7(1):75-83.
Thioulouse J, Chessel D. 1992. A method for reciprocal scaling of species tolerance and sample diversity. Ecology 73:670-680. http://pbil.univ-lyon1.fr/R/articles/arti071.pdf.
Tuong TP, Kam SP, Hoanh CT, Dung LC, Khiem NT, Barr J, Ben DC. 2003. Impact of
seawater intrusion control on the environment, land use and household incomes in a coastal area. Paddy Water Environ. 1:65-73.
Tuong TP, Minh LQ, Ni DV, van Mensvoort MEF. 1998. Reducing acid pollution from
reclaimed acid sulphate soils: experiences from the Mekong Delta, Vietnam. Pereira LS, Gowing JW, editors. In: Water and the environment: innovative issues in irrigation and drainage. E&FN Spon, Routledge, London. p 75-83.
Wold S, Esbensen K, Geladi P. 1987. Principal component analysis. Chemometrics and
Intelligent Laboratory Systems 2:37-52. Xuan VT. 1993. Recent advances in integrated land use on acid sulfate soils. In: Dent D,
van Mensvoort MEF, editors. Selected papers of the Ho Chi Minh City Symposium on acid sulfate soils. ILRI Publ. 53, ILRI, Wageningen, Netherlands. p 129-136.

Appendices CPWF Project Report
Page | 93
APPENDIX: KEY PUBLICATIONS (in digital files
included in a DVD accompanying this report)