Embed Size (px)
Citation preview
CPUC Self-Generation
Incentive Program
In-Depth Analysis of Useful Waste Heat Recovery and
Performance of Level 3/3N Systems
Final Report
Submitted to:
The Self-Generation Incentive Program Working Group
Prepared by:
Itron, Inc. 601 Officers Row
Vancouver, WA 98661
February, 2007
Table of Contents i
Table of Contents
Executive Summary........................................................................................... ES-1
ES.1 Approach ................................................................................................ ES-1 ES.2 Findings .................................................................................................. ES-2
Design Approach Issues ........................................................................................................ ES-3 Technical Operating Issues.................................................................................................... ES-3 Economic Issues .................................................................................................................... ES-4
ES.3 Recommendations .................................................................................. ES-4
1 Introduction........................................................................................................ 1-1
1.1 Purpose ........................................................................................................ 1-1 1.2 Background .................................................................................................. 1-1
Overview of the Self-Generation Incentive Program (SGIP) ....................................................1-1 Current Status ...........................................................................................................................1-4 Microturbines.............................................................................................................................1-6 Internal Combustion Engines....................................................................................................1-8 Waste Heat Recovery and Efficiency Goals for Cogeneration Projects .................................1-10 State Guidelines/Requirements ..............................................................................................1-11
1.3 Scope of Study ........................................................................................... 1-12
2 Approach ............................................................................................................ 2-1
2.1 Overview....................................................................................................... 2-1 2.2 Obtaining Actual Performance from SGIP Projects ...................................... 2-1
Electric Net Generator Output...................................................................................................2-2 Converting Raw Data to a Common Format.............................................................................2-3 Fuel ...........................................................................................................................................2-4 Useful Thermal Energy Recovery: ............................................................................................2-5 Review of the Processed Data..................................................................................................2-7
2.3 Isolating Possible Problems and Solutions: Identification of “Outlier” Facilities ....................................................................................................... 2-7
“Good” and “Poor” Performers ..................................................................................................2-7 2.4 Evaluation of Performance and Possible Problems...................................... 2-8
Electrical and Overall System Efficiencies................................................................................2-8 Useful Thermal Energy Recovery .............................................................................................2-9
2.5 Interviews and Site Visits............................................................................ 2-10 Site Interviews.........................................................................................................................2-10 Site Visits.................................................................................................................................2-10
3 Findings.............................................................................................................. 3-1
3.1 Useful Waste Heat Recovery........................................................................ 3-1 Microturbines.............................................................................................................................3-2 Internal Combustion Engines....................................................................................................3-7

CPUC Self-Generation Incentive Program – Thermal Analysis Report
ii Table of Contents
3.2 Electrical and Overall System Efficiency..................................................... 3-10 Microturbines...........................................................................................................................3-10 Internal Combustion Engines..................................................................................................3-13
3.3 Manufacturer Comparative Results ............................................................ 3-16 Comparison of Microturbine Systems .....................................................................................3-16 Comparison of ICE Systems ...................................................................................................3-17
3.4 Comparative Results (Microturbines and ICEs).......................................... 3-18
Appendix A Reciprocating Engines ................................................................... A-1
Appendix B Microturbines .................................................................................. B-1
Appendix C Suggested Modifications to the Waste Heat Utilization Worksheet ................................................................................................... C-1
List of Tables
Table ES-1: CPUC Program Goals versus Actual Performance......................... ES-3 Table 1-1: Major SGIP Milestones by Key Party..................................................... 1-2 Table 1-2: Summary of SGIP Design for Projects On-Line as of
12/31/2005....................................................................................................... 1-3 Table 1-3: Summary of SGIP Program Applicants On-Line as of
12/31/2005....................................................................................................... 1-4 Table 1-4: Typical Fuel Cell Characteristics........................................................... 1-5 Table 1-5: Number of Sites and Capacity of Fuel Cells Through 2005 ................... 1-6 Table 1-6: Fuel Cell Suppliers................................................................................. 1-6 Table 1-7: Typical Microturbine Characteristics ..................................................... 1-7 Table 1-8: Number of Sites and Capacity of Microturbines Through
2005................................................................................................................. 1-7 Table 1-9: Microturbine Suppliers .......................................................................... 1-8 Table 1-10: Typical ICE Characteristics................................................................. 1-9 Table 1-11: Number of Sites and Capacity of ICEs Through 2005 ...................... 1-10 Table 1-12: ICE Suppliers.................................................................................... 1-10 Table 2-1: Sources of Meter Installers and Data Providers..................................... 2-2 Table 2-2: Sample ENGO raw data format ............................................................. 2-3 Table 2-3: Sample of Processed ENGO Data......................................................... 2-3 Table 2-4: ENGO Common Data File Format ......................................................... 2-4 Table 2-5: Sample Utility Raw Fuel Data Format .................................................... 2-4 Table 2-6: Sample of Processed Fuel Data Format ................................................ 2-5 Table 2-7: FUEL Common Data File Format .......................................................... 2-5 Table 2-8: Sample Raw Thermal Data Format ....................................................... 2-6 Table 2-9: Sample of Processed Thermal Data Format.......................................... 2-6 Table 2-10: HEAT Common Data File Format ........................................................ 2-7 Table 2-11: Distribution of Performance by Technology ......................................... 2-8 Table 2-12: Installed Capacity by Performance and Technology............................ 2-8 Table 3-1: Useful Waste Heat Recovery at SGIP Microturbine
Facilities (n=18) ............................................................................................... 3-2

CPUC Self-Generation Incentive Program – Thermal Analysis Report
Table of Contents iii
Table 3-2: Program Required PUC 218.5 Minimum Performance ......................... 3-4 Table 3-3: Summary Statistics for Microturbine PUC 218.5(a)
Efficiencies....................................................................................................... 3-4 Table 3-4: Useful Waste Heat Recovery at SGIP ICE Facilities (n=27) ................. 3-7 Table 3-5: Summary Statistics for ICE PUC 218.5(a) Efficiencies ......................... 3-8 Table 3-6: Electrical and Overall System Efficiencies at SGIP
Microturbine Facilities .................................................................................... 3-11 Table 3-7: PUC 218.5(b) Summary Statistics for Microturbines........................... 3-12 Table 3-8: Breakout of Electrical and Thermal Components of PUC
218.5(b) for Microturbines.............................................................................. 3-12 Table 3-9: Electrical and Overall System Efficiencies at SGIP ICE
Facilities......................................................................................................... 3-14 Table 3-10: PCU 218.5(b) Summary Statistics for ICEs ...................................... 3-15 Table 3-11: Breakout of Electrical and Thermal Components of PUC
218.5(b) for ICEs ........................................................................................... 3-15 Table 3-12: Capacity Factor by Technology ........................................................ 3-19
List of Figures
Figure 3-1: Useful Waste Heat Recovery Per Unit Capacity by Site for
Microturbines ................................................................................................... 3-3 Figure 3-2: Microturbine Useful Heat Recovery Per Unit Fuel Input
Versus System Size......................................................................................... 3-3 Figure 3-3: Microturbine PUC 218.5(a) Efficiencies Versus System
Size.................................................................................................................. 3-5 Figure 3-4: Thermal Efficiency by Site for ICEs (n=14).......................................... 3-7 Figure 3-5: ICE Useful Heat Recovery Per Unit Fuel Input Versus
System Size..................................................................................................... 3-8 Figure 3-6: ICE PUC 218.5(a) Efficiencies Versus System Size............................ 3-9 Figure 3-7: Microturbine Electrical and Overall System Efficiencies by
System Size................................................................................................... 3-11 Figure 3-8: ICE Electrical and Overall System Efficiencies by System
Size................................................................................................................ 3-14 Figure 3-9: Comparative Statistics for Microturbines ........................................... 3-17 Figure 3-10: Comparative Statistics for ICEs ....................................................... 3-18 Figure 3-11: Comparison of 218.5(b) Efficiency by Technology .......................... 3-19 Figure 3-12: Comparative Parameters for Microturbines and ICEs...................... 3-20
Executive Summary ES-1
Executive Summary
The Self-Generation Incentive Program (SGIP) was initiated in March 2001 by the California Public Utilities Commission (CPUC). The intent of the SGIP is to help promote the development of distributed generation facilities located at utility customer sites that partially or completely offset their energy needs. The SGIP reflects energy policies stemming from the original enactment of the Public Utility Regulatory Policies Act (PURPA) of 1978. A primary focus of PURPA was to help improve the overall efficiency of the electricity system by expanding the use of cogeneration facilities that could generate both power and heat for beneficial purposes. In order to be eligible for special power purchase provisions established under PURPA, qualifying cogeneration facilities had to achieve specified levels of energy efficiency and useful waste heat recovery. In a ruling on June 14, 2001, the CPUC adopted waste heat recovery and efficiency standards as set forth in Public Utility Code (PUC) Section 218.5 for non-renewable qualifying facilities implemented under the SGIP. Cogeneration facilities represent a very important component of the SGIP. As of the end of 2005, cogeneration facilities made up nearly 60% of the installed generating capacity of the SGIP. However, questions have been raised about levels of energy efficiency and useful waste heat recovery being achieved at SGIP cogeneration facilities. Impact evaluations conducted by Itron in 2005 indicated that a number of cogeneration facilities were not achieving the requirements established under PUC 218.5. In December 2005, the SGIP Working Group directed Itron to investigate the levels of energy efficiency and useful waste heat recovery being achieved at SGIP Level 3/3N cogeneration facilities. If Itron found that SGIP cogeneration facilities were having problems meeting PUC 218.5 requirements, probable causes of the problems were to be identified and, where feasible, possible solutions recommended to promote better ways to achieve improved system efficiencies and useful waste heat recovery. ES.1 Approach On behalf of the SGIP Working Group, Itron conducts periodic measurement and evaluation (M&E) of distributed generation facilities installed under the SGIP. As a result, a certain amount of directly metered data is available on the amount of electricity generated, heat recovered, and fuel used at each site. In addition, Itron has access to electricity, fuel use, or recovered waste heat data monitored by the utilities, Itron, or third-party providers. Based on this information, Itron estimated actual achieved efficiencies and useful waste heat recovery levels for each facility and compared them against the PUC 218.5 requirements. The M&E
CPUC Self-Generation Incentive Program – Thermal Analysis Report
ES-2 Executive Summary
team then identified those facilities that had significant problems complying with the requirements (i.e., the “poor” performers) and identified the facilities that exceeded the requirements (i.e., the “good” performers). By comparing the design and operational aspects of the “good” performers against the “poor” performers, the Itron M&E team was able to isolate possible causes of problems in achieving PUC 218.5 requirements. In-depth analyses, surveys, and site visits were then used to develop recommendations on ways in which to obtain improved efficiencies and better useful waste heat recovery. ES.2 Findings Incentive Level 3/3N cogeneration facilities implemented under the SGIP to date use two different systems for power generation and heat recovery: 1) reciprocating internal combustion engines (ICEs) and 2) microturbines. Based on the evaluation of these two cogeneration technologies, Itron developed the following findings:
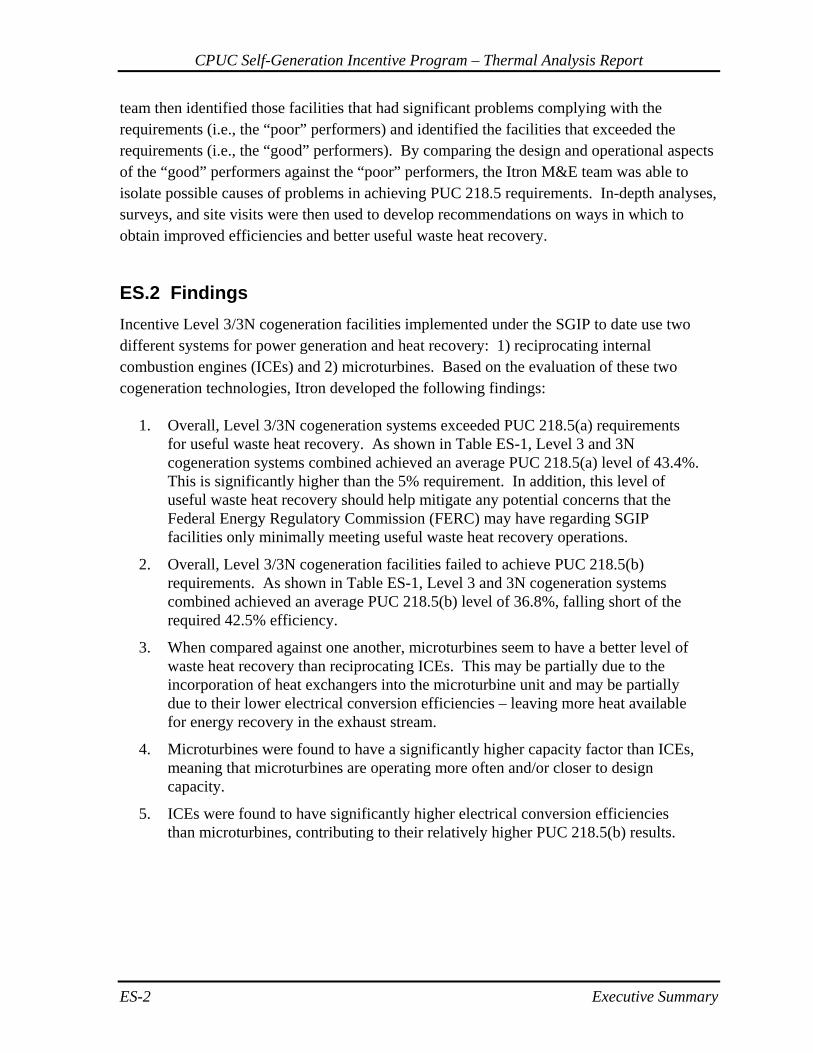
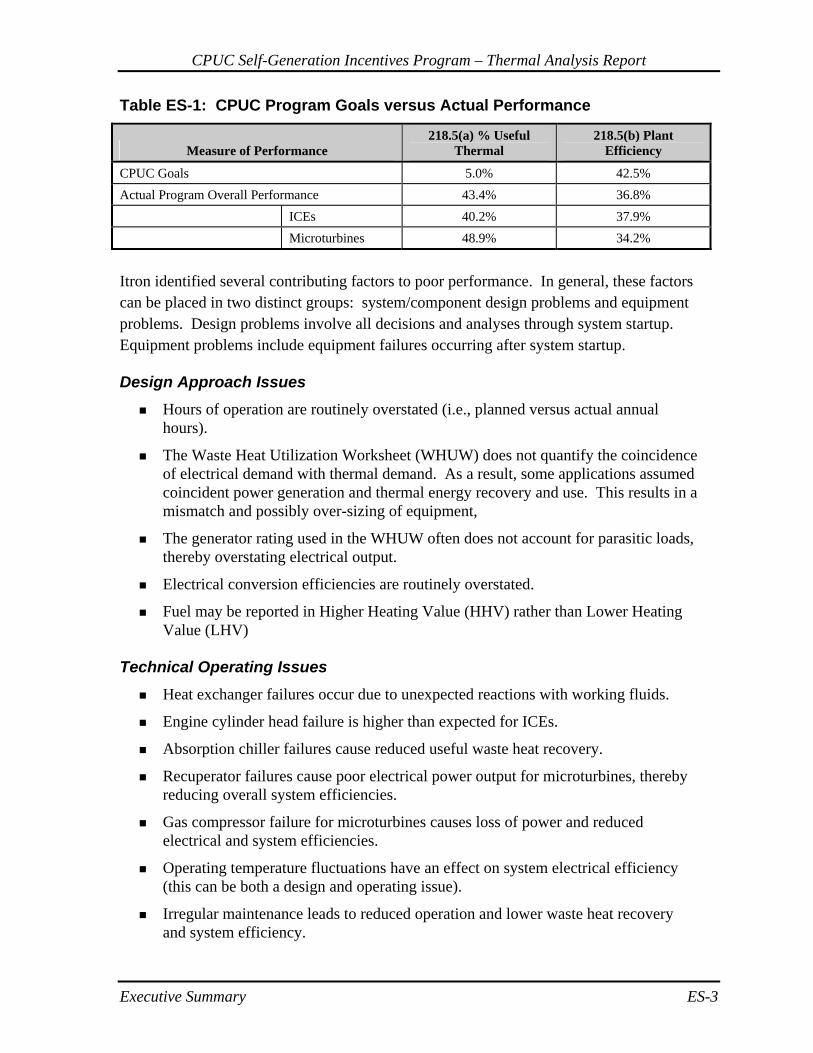
1. Overall, Level 3/3N cogeneration systems exceeded PUC 218.5(a) requirements for useful waste heat recovery. As shown in Table ES-1, Level 3 and 3N cogeneration systems combined achieved an average PUC 218.5(a) level of 43.4%. This is significantly higher than the 5% requirement. In addition, this level of useful waste heat recovery should help mitigate any potential concerns that the Federal Energy Regulatory Commission (FERC) may have regarding SGIP facilities only minimally meeting useful waste heat recovery operations.
2. Overall, Level 3/3N cogeneration facilities failed to achieve PUC 218.5(b) requirements. As shown in Table ES-1, Level 3 and 3N cogeneration systems combined achieved an average PUC 218.5(b) level of 36.8%, falling short of the required 42.5% efficiency.
3. When compared against one another, microturbines seem to have a better level of waste heat recovery than reciprocating ICEs. This may be partially due to the incorporation of heat exchangers into the microturbine unit and may be partially due to their lower electrical conversion efficiencies – leaving more heat available for energy recovery in the exhaust stream.
4. Microturbines were found to have a significantly higher capacity factor than ICEs, meaning that microturbines are operating more often and/or closer to design capacity.
5. ICEs were found to have significantly higher electrical conversion efficiencies than microturbines, contributing to their relatively higher PUC 218.5(b) results.
CPUC Self-Generation Incentives Program – Thermal Analysis Report
Executive Summary ES-3
Table ES-1: CPUC Program Goals versus Actual Performance
Measure of Performance 218.5(a) % Useful
Thermal 218.5(b) Plant
Efficiency
CPUC Goals 5.0% 42.5% Actual Program Overall Performance 43.4% 36.8% ICEs 40.2% 37.9% Microturbines 48.9% 34.2%
Itron identified several contributing factors to poor performance. In general, these factors can be placed in two distinct groups: system/component design problems and equipment problems. Design problems involve all decisions and analyses through system startup. Equipment problems include equipment failures occurring after system startup. Design Approach Issues
Hours of operation are routinely overstated (i.e., planned versus actual annual hours).
The Waste Heat Utilization Worksheet (WHUW) does not quantify the coincidence of electrical demand with thermal demand. As a result, some applications assumed coincident power generation and thermal energy recovery and use. This results in a mismatch and possibly over-sizing of equipment,
The generator rating used in the WHUW often does not account for parasitic loads,
thereby overstating electrical output.
Electrical conversion efficiencies are routinely overstated. Fuel may be reported in Higher Heating Value (HHV) rather than Lower Heating
Value (LHV) Technical Operating Issues
Heat exchanger failures occur due to unexpected reactions with working fluids.
Engine cylinder head failure is higher than expected for ICEs.
Absorption chiller failures cause reduced useful waste heat recovery.
Recuperator failures cause poor electrical power output for microturbines, thereby reducing overall system efficiencies.
Gas compressor failure for microturbines causes loss of power and reduced
electrical and system efficiencies.
Operating temperature fluctuations have an effect on system electrical efficiency (this can be both a design and operating issue).
Irregular maintenance leads to reduced operation and lower waste heat recovery
and system efficiency.
CPUC Self-Generation Incentive Program – Thermal Analysis Report
ES-4 Executive Summary
Economic Issues
“Spark gap” caused many cogeneration systems to shut down from October 2005 until very recently
ES.3 Recommendations Design to Minimum of Electrical and Thermal Loads. Coincident electrical and thermal loads are imperative for successful cogeneration system performance. Without a coincident electric and thermal load, the cogeneration system should be downsized to meet the minimum of the electric or thermal load. This would ensure full-load operation of the cogeneration system. Require Actual Electrical Efficiency. To date, most prime mover efficiency data entries involve a nameplate value that does not adequately account for parasitic loads or part-load operation. Require Documentation for Load Profile and Hours of Operation. Electric and thermal load profiles should be developed as part of the application process. These are key indicators of the success of the cogeneration system but are often times estimated using assumptions and estimates without empirically based documentation.
Introduction 1-1
1 Introduction
1.1 Purpose Cogeneration systems offer the hope of providing two or more energy uses from one fuel source, resulting in higher energy utilization, lower overall emissions rates, and a more cost-effective operating strategy for the facility. Realization of these goals requires the optimized design of the system to take advantage of both the facility heat and power requirements, as well as optimizing the operations of the installed equipment. Recent process and impact evaluation results of the Self Generation Incentive Program (SGIP) suggest that there may be systematic issues with the design and/or the operational strategies of many rebated cogeneration systems that are resulting in “lower than expected” efficiency. The SGIP Working Group requested that the program evaluation team investigate these issues and identify potential solutions. The purpose of this study is to identify the amount of useful waste heat recovered and the resulting PUC 218.5 efficiency of Incentive Level 3/3N cogeneration projects implemented under the SGIP. Through a combination of in-depth surveys and detailed analysis, this study identifies probable reasons for lower than expected useful waste heat recovery and low overall plant efficiencies. The results of this study include a set of recommendations of possible ways to promote better cogeneration system design and operation, thereby increasing useful waste heat recovery and operating cogeneration plant efficiency. 1.2 Background Overview of the Self-Generation Incentive Program (SGIP)
Purpose and Enabling Legislation
In response to Assembly Bill 970, which required the California Public Utilities Commission (CPUC) to initiate certain load control and distributed generation program activities, the CPUC issued Decision 01-03-073 (D.01-03-073) on March 27, 2001. This Decision mandated implementation across the service territories of California’s investor-owned utilities (IOUs) of a self-generation program designed to produce significant public (e.g., environmental and energy distribution system) benefits for all ratepayers, including gas ratepayers. To meet this mandate, the California Self-Generation Incentive Program (SGIP)
CPUC Self-Generation Incentive Program – Thermal Analysis Report
1-2 Introduction
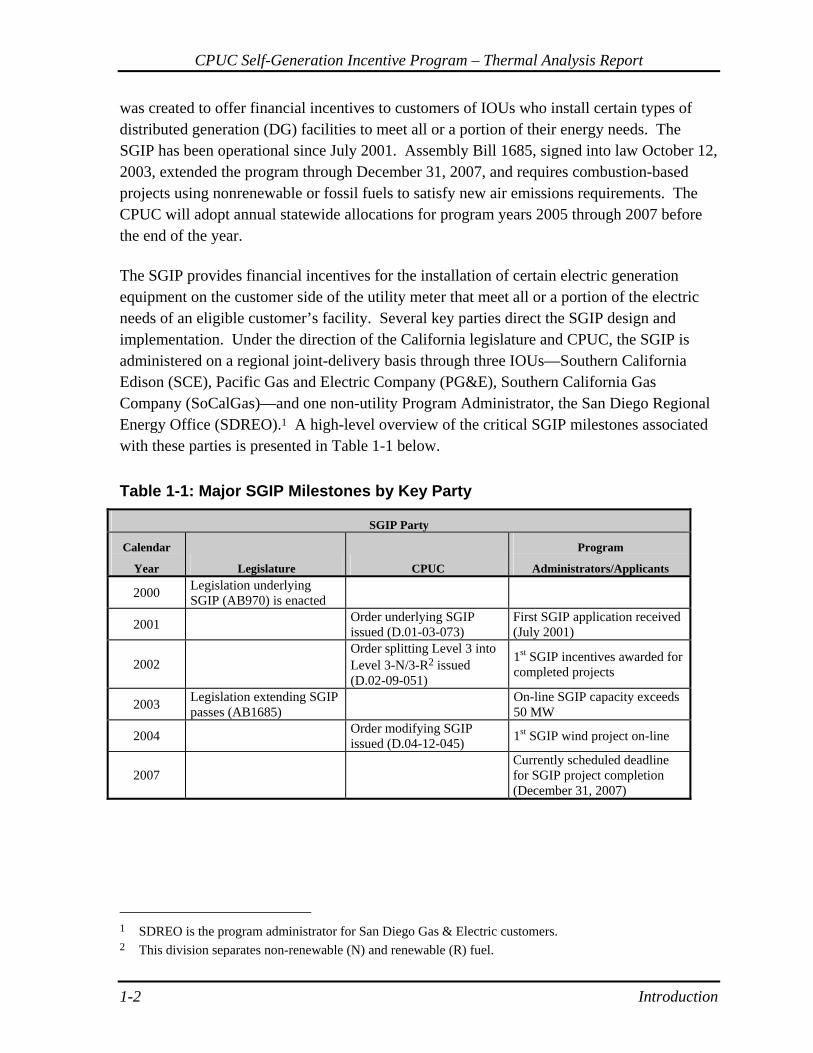
was created to offer financial incentives to customers of IOUs who install certain types of distributed generation (DG) facilities to meet all or a portion of their energy needs. The SGIP has been operational since July 2001. Assembly Bill 1685, signed into law October 12, 2003, extended the program through December 31, 2007, and requires combustion-based projects using nonrenewable or fossil fuels to satisfy new air emissions requirements. The CPUC will adopt annual statewide allocations for program years 2005 through 2007 before the end of the year. The SGIP provides financial incentives for the installation of certain electric generation equipment on the customer side of the utility meter that meet all or a portion of the electric needs of an eligible customer’s facility. Several key parties direct the SGIP design and implementation. Under the direction of the California legislature and CPUC, the SGIP is administered on a regional joint-delivery basis through three IOUs—Southern California Edison (SCE), Pacific Gas and Electric Company (PG&E), Southern California Gas Company (SoCalGas)—and one non-utility Program Administrator, the San Diego Regional Energy Office (SDREO).1 A high-level overview of the critical SGIP milestones associated with these parties is presented in Table 1-1 below.
Table 1-1: Major SGIP Milestones by Key Party
SGIP Party
Calendar
Year Legislature CPUC
Program
Administrators/Applicants
2000 Legislation underlying SGIP (AB970) is enacted
2001 Order underlying SGIP issued (D.01-03-073)
First SGIP application received (July 2001)
2002 Order splitting Level 3 into Level 3-N/3-R2 issued (D.02-09-051)
1st SGIP incentives awarded for completed projects
2003 Legislation extending SGIP passes (AB1685) On-line SGIP capacity exceeds
50 MW
2004 Order modifying SGIP issued (D.04-12-045) 1st SGIP wind project on-line
2007 Currently scheduled deadline for SGIP project completion (December 31, 2007)
1 SDREO is the program administrator for San Diego Gas & Electric customers. 2 This division separates non-renewable (N) and renewable (R) fuel.
CPUC Self-Generation Incentive Program – Thermal Analysis Report
Introduction 1-3
Allocated Funding and Eligible Technologies
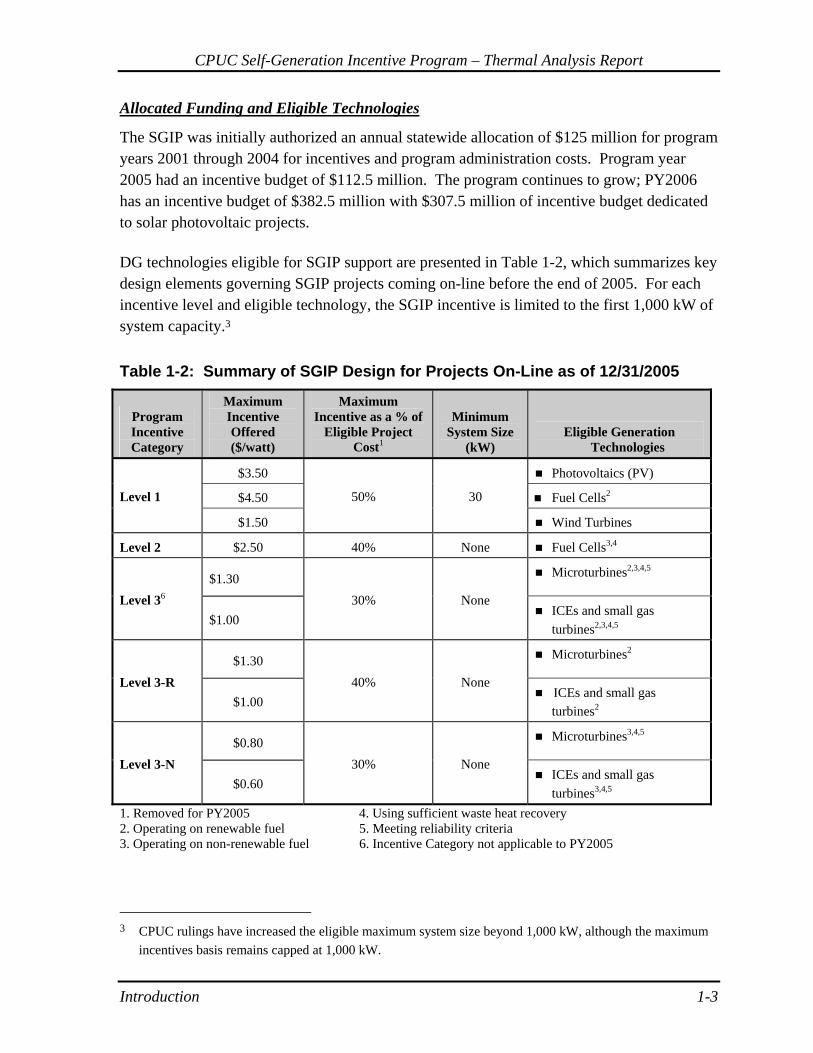
The SGIP was initially authorized an annual statewide allocation of $125 million for program years 2001 through 2004 for incentives and program administration costs. Program year 2005 had an incentive budget of $112.5 million. The program continues to grow; PY2006 has an incentive budget of $382.5 million with $307.5 million of incentive budget dedicated to solar photovoltaic projects. DG technologies eligible for SGIP support are presented in Table 1-2, which summarizes key design elements governing SGIP projects coming on-line before the end of 2005. For each incentive level and eligible technology, the SGIP incentive is limited to the first 1,000 kW of system capacity.3
Table 1-2: Summary of SGIP Design for Projects On-Line as of 12/31/2005
Program Incentive Category
Maximum Incentive Offered ($/watt)
Maximum Incentive as a % of
Eligible Project Cost1
Minimum System Size
(kW) Eligible Generation
Technologies
$3.50 Photovoltaics (PV)
$4.50 Fuel Cells2 Level 1
$1.50
50% 30
Wind Turbines
Level 2 $2.50 40% None Fuel Cells3,4
$1.30 Microturbines2,3,4,5
Level 36 $1.00
30% None ICEs and small gas
turbines2,3,4,5
$1.30 Microturbines2
Level 3-R $1.00
40% None ICEs and small gas
turbines2
$0.80 Microturbines3,4,5
Level 3-N $0.60
30% None ICEs and small gas
turbines3,4,5
1. Removed for PY2005 4. Using sufficient waste heat recovery 2. Operating on renewable fuel 5. Meeting reliability criteria 3. Operating on non-renewable fuel 6. Incentive Category not applicable to PY2005
3 CPUC rulings have increased the eligible maximum system size beyond 1,000 kW, although the maximum
incentives basis remains capped at 1,000 kW.
CPUC Self-Generation Incentive Program – Thermal Analysis Report
1-4 Introduction
As suggested by the timeline presented in Table 1-1, the SGIP has evolved. Its term and eligibility criteria have been modified, new incentive levels have been created (i.e., Levels 3-R and 3-N), and other incentive levels have been retired (i.e., Level 3). New for PY2005 was the elimination of the maximum incentive level as a percent of eligible project cost. The variety of SGIP terms and conditions affecting on-line projects has increased over time and will continue to increase in the future. For example, beginning January 1, 2005, combustion-based projects using non-renewable or fossil fuels were required to satisfy certain new air pollutant emissions requirements stipulated in Assembly Bill 1685.4 Current Status
Numbers and Installed Capacities of Projects
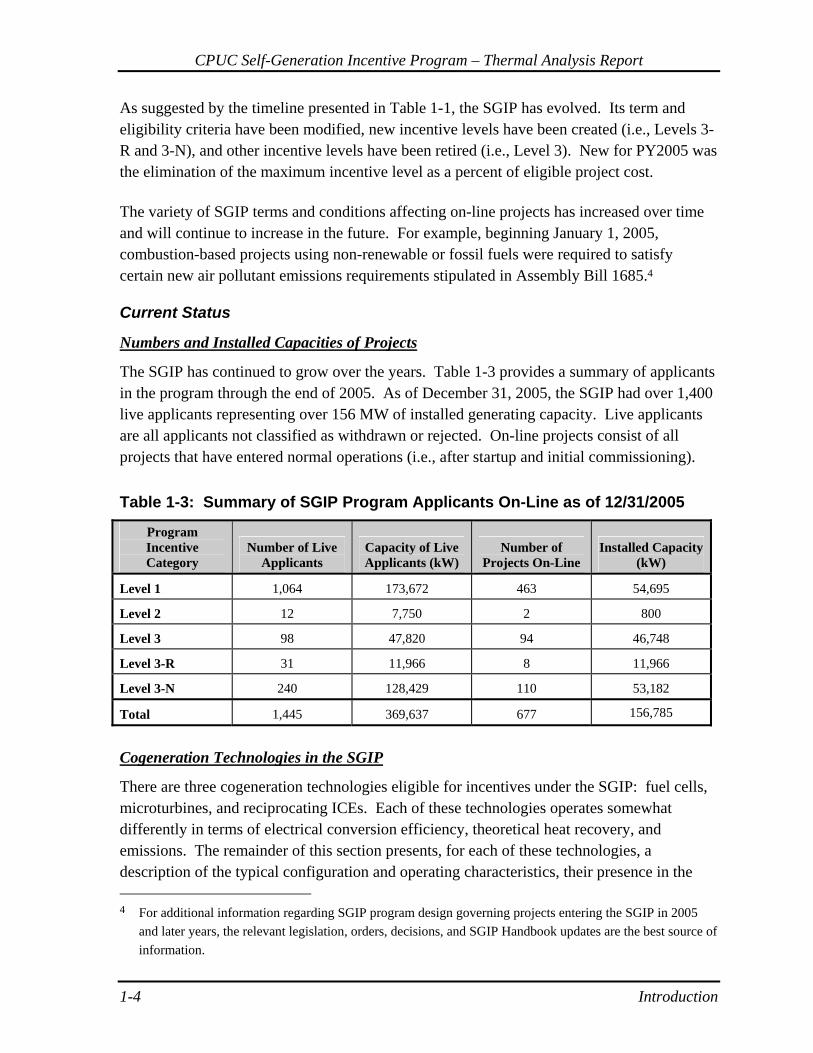
The SGIP has continued to grow over the years. Table 1-3 provides a summary of applicants in the program through the end of 2005. As of December 31, 2005, the SGIP had over 1,400 live applicants representing over 156 MW of installed generating capacity. Live applicants are all applicants not classified as withdrawn or rejected. On-line projects consist of all projects that have entered normal operations (i.e., after startup and initial commissioning).
Table 1-3: Summary of SGIP Program Applicants On-Line as of 12/31/2005
Program Incentive Category
Number of Live Applicants
Capacity of Live Applicants (kW)
Number of Projects On-Line
Installed Capacity (kW)
Level 1 1,064 173,672 463 54,695
Level 2 12 7,750 2 800
Level 3 98 47,820 94 46,748
Level 3-R 31 11,966 8 11,966
Level 3-N 240 128,429 110 53,182
Total 1,445 369,637 677 156,785
Cogeneration Technologies in the SGIP
There are three cogeneration technologies eligible for incentives under the SGIP: fuel cells, microturbines, and reciprocating ICEs. Each of these technologies operates somewhat differently in terms of electrical conversion efficiency, theoretical heat recovery, and emissions. The remainder of this section presents, for each of these technologies, a description of the typical configuration and operating characteristics, their presence in the 4 For additional information regarding SGIP program design governing projects entering the SGIP in 2005
and later years, the relevant legislation, orders, decisions, and SGIP Handbook updates are the best source of information.

CPUC Self-Generation Incentive Program – Thermal Analysis Report
Introduction 1-5
program in terms of number of applicants as well as capacity, and some of the more common suppliers of the technology. Fuel Cells
Typical Configuration and Operating Characteristics
Fuel cells hold great promise of delivering high electrical conversion efficiencies with little or no emissions. This is achieved by combining two gases, such as hydrogen and oxygen, which undergo an electrochemical reaction producing electricity, heat, and water. Oxygen is readily available in the atmosphere and hydrogen is typically obtained by reforming natural gas or methane. Heat is typically recovered via a heat exchanger and generally used for process heating at the site where the fuel cell is installed. Table 1-4 is a summary of typical operating characteristics, efficiencies, and capacities of various types of fuel cells.
Table 1-4: Typical Fuel Cell Characteristics
Source: fuelcellsworks.com Numbers and Installed/Operating Capacities
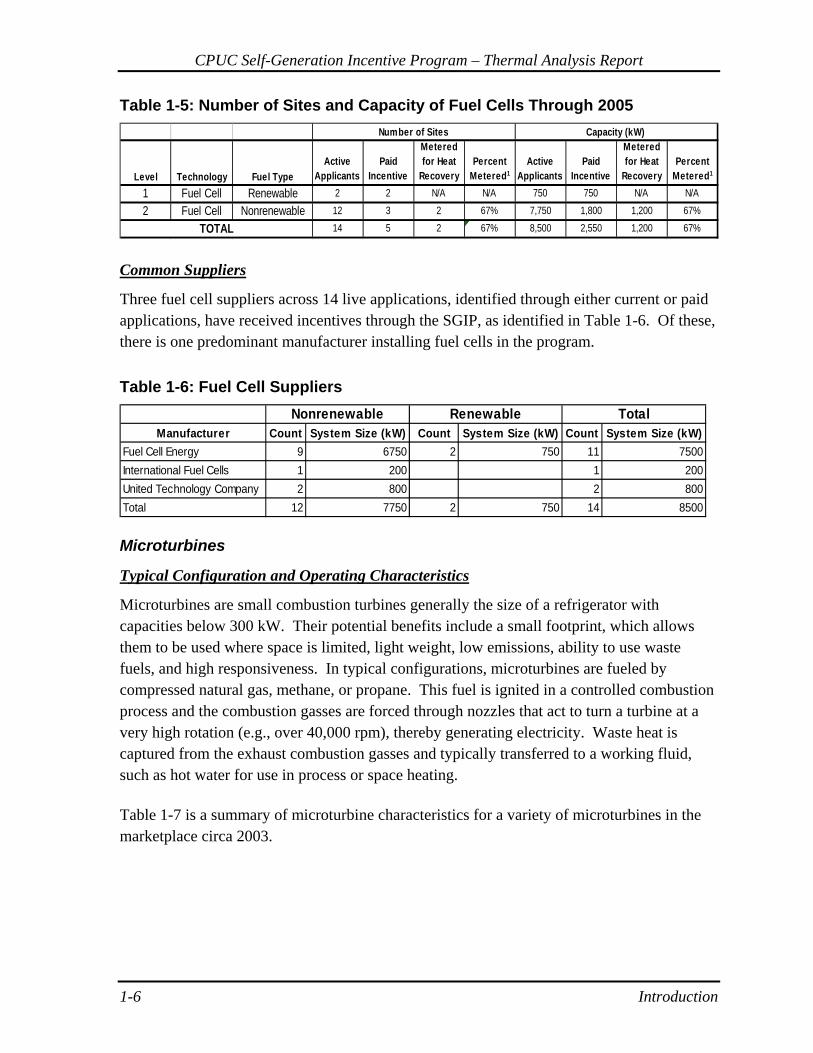
As of the end of 2005, there were 14 active fuel cell applications in the SGIP, two Level 1 fuel cells using renewable fuel, and 12 Level 2 fuel cells using nonrenewable fuel. Table 1-5 provides a breakdown of the status of these applicants. As the table shows, both renewable-fueled projects are completed. Per program guidelines, renewable-fueled projects are not subject to heat recovery requirements and, therefore, are not metered for heat recovery.
CPUC Self-Generation Incentive Program – Thermal Analysis Report
1-6 Introduction
Table 1-5: Number of Sites and Capacity of Fuel Cells Through 2005
Level Technology Fuel TypeActive
ApplicantsPaid
Incentive
Metered for Heat
RecoveryPercent
Metered1Active
ApplicantsPaid
Incentive
Metered for Heat
RecoveryPercent
Metered1
1 Fuel Cell Renewable 2 2 N/A N/A 750 750 N/A N/A
2 Fuel Cell Nonrenewable 12 3 2 67% 7,750 1,800 1,200 67%
TOTAL 14 5 2 67% 8,500 2,550 1,200 67%
Number of Sites Capacity (kW)
Common Suppliers
Three fuel cell suppliers across 14 live applications, identified through either current or paid applications, have received incentives through the SGIP, as identified in Table 1-6. Of these, there is one predominant manufacturer installing fuel cells in the program.
Table 1-6: Fuel Cell Suppliers Nonrenewable Renewable Total
Manufacturer Count System Size (kW) Count System Size (kW) Count System Size (kW)Fuel Cell Energy 9 6750 2 750 11 7500International Fuel Cells 1 200 1 200United Technology Company 2 800 2 800Total 12 7750 2 750 14 8500 Microturbines
Typical Configuration and Operating Characteristics
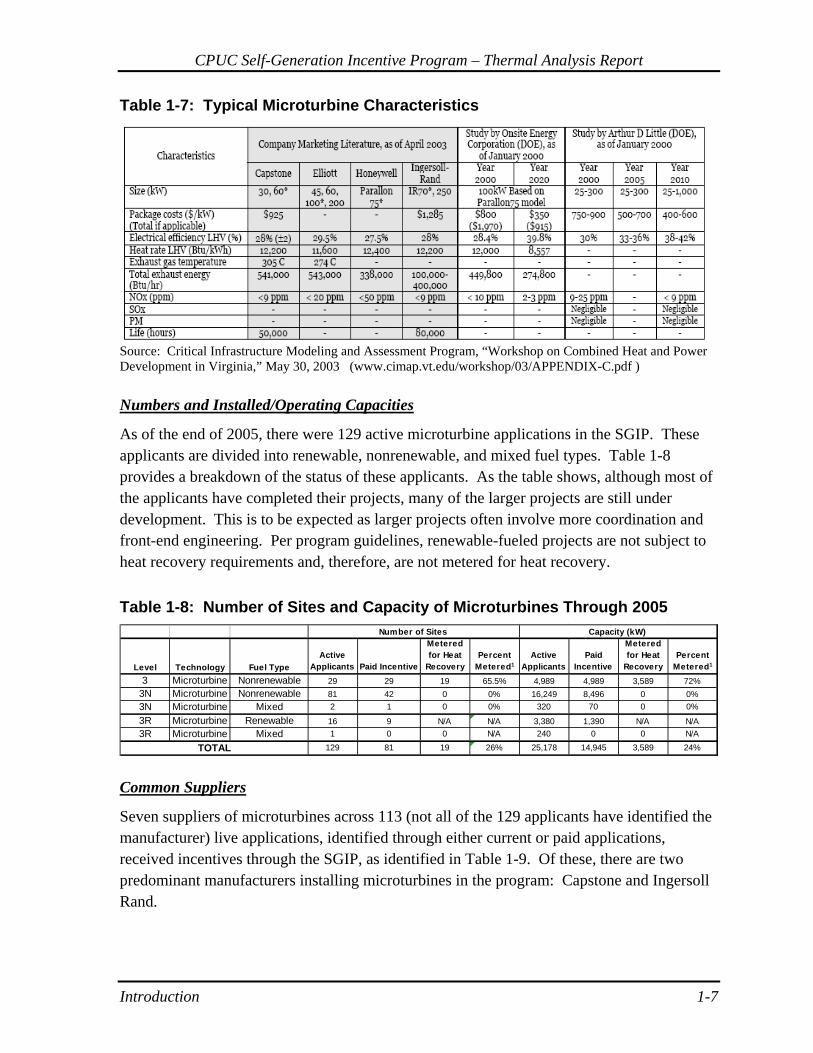
Microturbines are small combustion turbines generally the size of a refrigerator with capacities below 300 kW. Their potential benefits include a small footprint, which allows them to be used where space is limited, light weight, low emissions, ability to use waste fuels, and high responsiveness. In typical configurations, microturbines are fueled by compressed natural gas, methane, or propane. This fuel is ignited in a controlled combustion process and the combustion gasses are forced through nozzles that act to turn a turbine at a very high rotation (e.g., over 40,000 rpm), thereby generating electricity. Waste heat is captured from the exhaust combustion gasses and typically transferred to a working fluid, such as hot water for use in process or space heating. Table 1-7 is a summary of microturbine characteristics for a variety of microturbines in the marketplace circa 2003.
CPUC Self-Generation Incentive Program – Thermal Analysis Report
Introduction 1-7
Table 1-7: Typical Microturbine Characteristics
Source: Critical Infrastructure Modeling and Assessment Program, “Workshop on Combined Heat and Power Development in Virginia,” May 30, 2003 (www.cimap.vt.edu/workshop/03/APPENDIX-C.pdf ) Numbers and Installed/Operating Capacities
As of the end of 2005, there were 129 active microturbine applications in the SGIP. These applicants are divided into renewable, nonrenewable, and mixed fuel types. Table 1-8 provides a breakdown of the status of these applicants. As the table shows, although most of the applicants have completed their projects, many of the larger projects are still under development. This is to be expected as larger projects often involve more coordination and front-end engineering. Per program guidelines, renewable-fueled projects are not subject to heat recovery requirements and, therefore, are not metered for heat recovery.
Table 1-8: Number of Sites and Capacity of Microturbines Through 2005
Level Technology Fuel TypeActive
Applicants Paid Incentive
Metered for Heat
RecoveryPercent
Metered1Active
ApplicantsPaid
Incentive
Metered for Heat
RecoveryPercent
Metered1
3 Microturbine Nonrenewable 29 29 19 65.5% 4,989 4,989 3,589 72%3N Microturbine Nonrenewable 81 42 0 0% 16,249 8,496 0 0%3N Microturbine Mixed 2 1 0 0% 320 70 0 0%
3R Microturbine Renewable 16 9 N/A N/A 3,380 1,390 N/A N/A3R Microturbine Mixed 1 0 0 N/A 240 0 0 N/A
TOTAL 129 81 19 26% 25,178 14,945 3,589 24%
Number of Sites Capacity (kW)
Common Suppliers
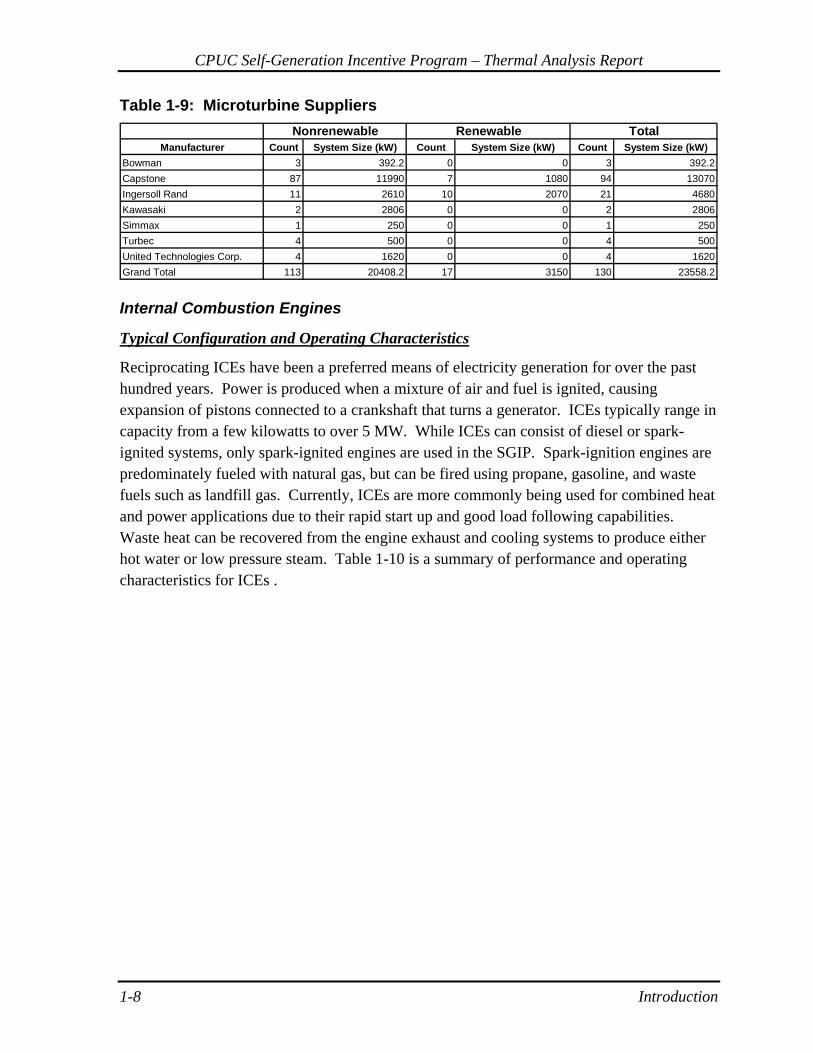
Seven suppliers of microturbines across 113 (not all of the 129 applicants have identified the manufacturer) live applications, identified through either current or paid applications, received incentives through the SGIP, as identified in Table 1-9. Of these, there are two predominant manufacturers installing microturbines in the program: Capstone and Ingersoll Rand.
CPUC Self-Generation Incentive Program – Thermal Analysis Report
1-8 Introduction
Table 1-9: Microturbine Suppliers Nonrenewable Renewable Total
Manufacturer Count System Size (kW) Count System Size (kW) Count System Size (kW)Bowman 3 392.2 0 0 3 392.2Capstone 87 11990 7 1080 94 13070Ingersoll Rand 11 2610 10 2070 21 4680Kawasaki 2 2806 0 0 2 2806Simmax 1 250 0 0 1 250Turbec 4 500 0 0 4 500United Technologies Corp. 4 1620 0 0 4 1620Grand Total 113 20408.2 17 3150 130 23558.2 Internal Combustion Engines
Typical Configuration and Operating Characteristics
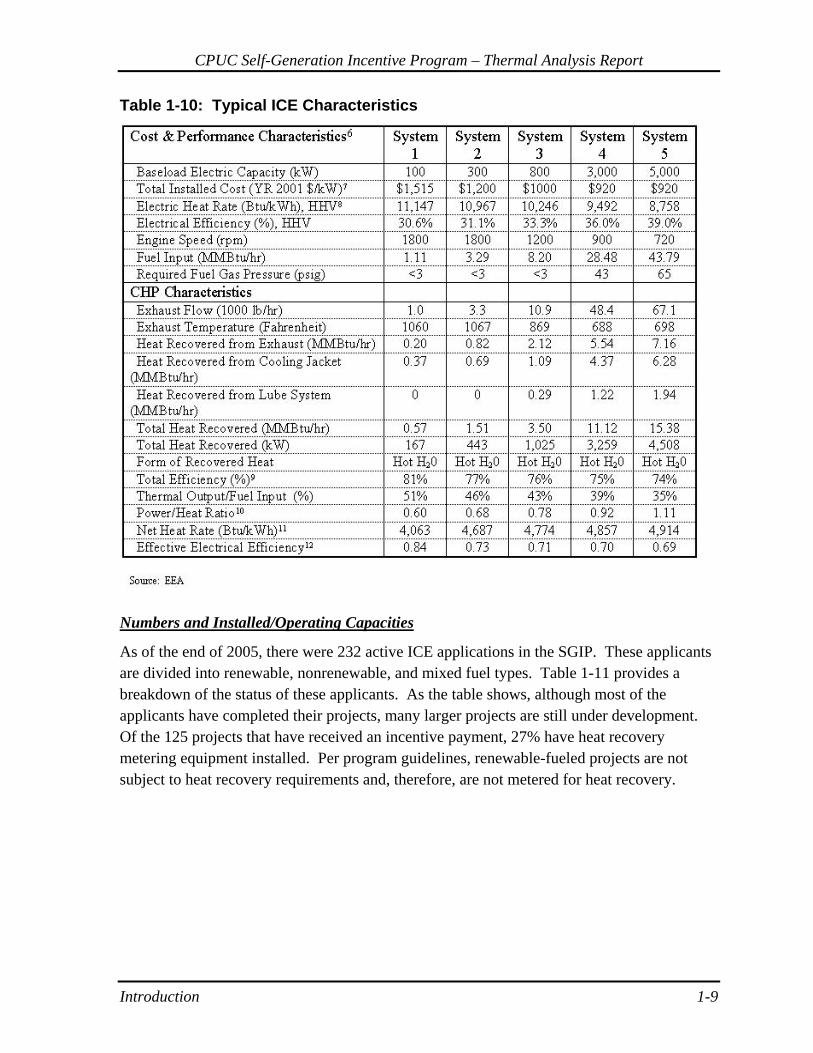
Reciprocating ICEs have been a preferred means of electricity generation for over the past hundred years. Power is produced when a mixture of air and fuel is ignited, causing expansion of pistons connected to a crankshaft that turns a generator. ICEs typically range in capacity from a few kilowatts to over 5 MW. While ICEs can consist of diesel or spark-ignited systems, only spark-ignited engines are used in the SGIP. Spark-ignition engines are predominately fueled with natural gas, but can be fired using propane, gasoline, and waste fuels such as landfill gas. Currently, ICEs are more commonly being used for combined heat and power applications due to their rapid start up and good load following capabilities. Waste heat can be recovered from the engine exhaust and cooling systems to produce either hot water or low pressure steam. Table 1-10 is a summary of performance and operating characteristics for ICEs .
CPUC Self-Generation Incentive Program – Thermal Analysis Report
Introduction 1-9
Table 1-10: Typical ICE Characteristics
Numbers and Installed/Operating Capacities
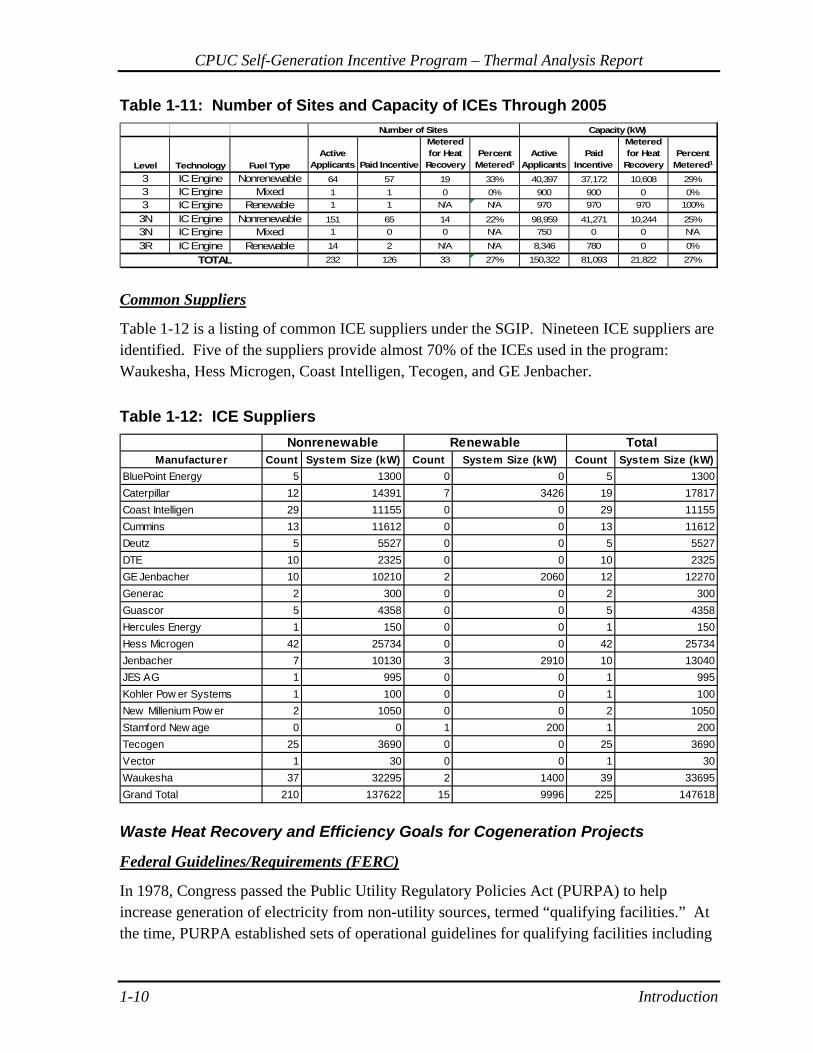
As of the end of 2005, there were 232 active ICE applications in the SGIP. These applicants are divided into renewable, nonrenewable, and mixed fuel types. Table 1-11 provides a breakdown of the status of these applicants. As the table shows, although most of the applicants have completed their projects, many larger projects are still under development. Of the 125 projects that have received an incentive payment, 27% have heat recovery metering equipment installed. Per program guidelines, renewable-fueled projects are not subject to heat recovery requirements and, therefore, are not metered for heat recovery.
CPUC Self-Generation Incentive Program – Thermal Analysis Report
1-10 Introduction
Table 1-11: Number of Sites and Capacity of ICEs Through 2005
Level Technology Fuel TypeActive
Applicants Paid Incentive
Metered for Heat
RecoveryPercent
Metered1Active
ApplicantsPaid
Incentive
Metered for Heat
RecoveryPercent
Metered1
3 IC Engine Nonrenewable 64 57 19 33% 40,397 37,172 10,608 29%3 IC Engine Mixed 1 1 0 0% 900 900 0 0%3 IC Engine Renewable 1 1 N/A N/A 970 970 970 100%
3N IC Engine Nonrenewable 151 65 14 22% 98,959 41,271 10,244 25%3N IC Engine Mixed 1 0 0 N/A 750 0 0 N/A
3R IC Engine Renewable 14 2 N/A N/A 8,346 780 0 0%
TOTAL 232 126 33 27% 150,322 81,093 21,822 27%
Number of Sites Capacity (kW)
Common Suppliers
Table 1-12 is a listing of common ICE suppliers under the SGIP. Nineteen ICE suppliers are identified. Five of the suppliers provide almost 70% of the ICEs used in the program: Waukesha, Hess Microgen, Coast Intelligen, Tecogen, and GE Jenbacher.
Table 1-12: ICE Suppliers Nonrenewable Renewable Total
Manufacturer Count System Size (kW) Count System Size (kW) Count System Size (kW)BluePoint Energy 5 1300 0 0 5 1300Caterpillar 12 14391 7 3426 19 17817Coast Intelligen 29 11155 0 0 29 11155Cummins 13 11612 0 0 13 11612Deutz 5 5527 0 0 5 5527DTE 10 2325 0 0 10 2325GE Jenbacher 10 10210 2 2060 12 12270Generac 2 300 0 0 2 300Guascor 5 4358 0 0 5 4358Hercules Energy 1 150 0 0 1 150Hess Microgen 42 25734 0 0 42 25734Jenbacher 7 10130 3 2910 10 13040JES AG 1 995 0 0 1 995Kohler Pow er Systems 1 100 0 0 1 100New Millenium Pow er 2 1050 0 0 2 1050Stamford New age 0 0 1 200 1 200Tecogen 25 3690 0 0 25 3690Vector 1 30 0 0 1 30Waukesha 37 32295 2 1400 39 33695Grand Total 210 137622 15 9996 225 147618 Waste Heat Recovery and Efficiency Goals for Cogeneration Projects
Federal Guidelines/Requirements (FERC)
In 1978, Congress passed the Public Utility Regulatory Policies Act (PURPA) to help increase generation of electricity from non-utility sources, termed “qualifying facilities.” At the time, PURPA established sets of operational guidelines for qualifying facilities including
CPUC Self-Generation Incentive Program – Thermal Analysis Report
Introduction 1-11
fuel use, size, fuel efficiency, and reliability. Under the efficiency guidelines, qualifying cogeneration facilities are required to have the useful power output of the facility plus one-half of the useful thermal energy output equal to no less than 42.5% of their total energy input. PURPA became the guiding set of requirements for cogeneration systems installed across the nation. The Federal Energy Regulatory Commission (FERC) is currently considering modifying PURPA. Among the proposed changes is increased emphasis on ensuring that recovered waste heat is used for “productive and beneficial” purposes at industrial, commercial, or institutional facilities.5 In particular, FERC proposes to examine individual qualifying facilities to make certain that recovered waste heat usage is “productive and beneficial” and not a “sham.” FERC is considering similar provisions to ensure that electricity production from qualifying facilities helps offset the electrical needs of the industrial, commercial, or institutional facilities at which they are located. Within this context, FERC intends to critically examine facilities where the thermal output only minimally meets the 5% of thermal input requirements. In these instances, FERC is concerned that such facilities are essentially designed to provide most of their electrical output to the utilities rather than meeting the intent of PURPA. State Guidelines/Requirements
California Public Utilities Code Section 218.5 covers efficiency and useful waste heat recovery from cogeneration facilities installed under the SGIP as follows:
“218.5. "Cogeneration" means the sequential use of energy for the production of electrical and useful thermal energy. The sequence can be thermal use followed by power production or the reverse, subject to the following standards: (a) At least 5 percent of the facility's total annual energy output shall be in the form of useful thermal energy. (b) Where useful thermal energy follows power production, the useful annual power output plus one-half the useful annual thermal energy output equals not less than 42.5 percent of any natural gas and oil energy input.”
5 Federal Energy Regulatory Commission. Notice of Proposed Rulemaking, Revised Regulations Governing
Small Power Producers and Cogeneration Facilities. Docket No. RM05-36-000, October 11, 2005
CPUC Self-Generation Incentive Program – Thermal Analysis Report
1-12 Introduction
1.3 Scope of Study The scope of this study is confined to the useful waste heat recovery and system efficiency performance of Incentive Level 3 and 3N6 cogeneration facilities implemented under the SGIP. On June 14, 2001, the CPUC, under Decision D.01-06-035, adopted the waste heat and efficiency standards for qualifying cogeneration facilities implemented under the SGIP.7 In that ruling, the CPUC adopted the waste heat and efficiency standards set forth in California Public Utility Code Section 218.5 as follows:
a) Waste Heat Recovery: At least 5% of the facility’s total energy output must be in the form of useful heat recovery, and
b) System Efficiency: The annual electric output plus one-half of the useful thermal output must be greater than or equal to 42.5% of the total annual fuel input of the system.
Within the SGIP, Incentive Level 2, 3, and 3N systems are considered qualifying cogeneration facilities. Incentive Level 3R (i.e., renewable-fueled cogeneration units or prime movers/electric generators) are not required to meet the above heat recovery or system efficiency requirements. Incentive Level 2 fuel cells are excluded from the scope of this study. Accurate estimates of waste heat and system efficiency require monitored data on fuel consumption, thermal energy recovery, and electrical energy production. More complete performance data sets are primarily available for the operating years of 2004 and 2005. For these reasons, Itron has further refined the scope of this study to the assessment of waste heat and system efficiency performance of Level 3 and 3N SGIP facilities operating under calendar years 2004 and 2005.
6 Incentive Level 3 facilities include both eligible non-renewable-fueled and renewable-fueled cogeneration
systems prior to the CPUC establishing Incentive Levels 3R and 3N under Decision D.02-09-051. 7 D.01-06-035, “Interim Opinion: Waste Heat Recovery and Reliability for Section 3999.15(b) Distributed
Generation Incentives,” June 14, 2001

Approach 2-1
2 Approach
2.1 Overview The overall purpose of this report is to investigate the level of success to which SGIP nonrenewable fueled cogeneration facilities are 1) achieving the required levels of efficiency and useful waste heat recovery, 2) where appropriate, identify known causes of failures to meet the required levels, and 3) recommend possible ways to promote better system efficiency and useful waste heat recovery. This section describes the approach used in meeting these study objectives. In general, Itron employed four steps. First, metered electricity, heat and fuel use interval data were retrieved to identify facility efficiencies and useful waste heat recovery levels. Second, by comparing the achieved levels of efficiency and useful waste heat recovery against the required levels, “outliers,” were isolated, i.e., those facilities which either significantly failed to meet the required levels or those that tended to exceed the requirements. Third, by examining poor versus good performing outliers, we could identify possible causes of low system efficiency and/or low useful waste heat recovery. Lastly, through interviews and site visits we could confirm design or operational practices that lead to facilities either being good or poor performers. 2.2 Obtaining Actual Performance from SGIP Projects One of the challenges in identifying actual efficiencies and useful waste heat recovery at SGIP facilities involves obtaining reliable metered data on a consistent basis. A defining characteristic of the program-level monitoring approach is the reliance on various diverse meter installers and data providers. The range of meter installers and data providers encountered to date is summarized in Table 2-1. In some cases, utilities as well as program applicants and /or host costumers may be undertaking electric, fuel or heat metering and monitoring activities for their own purposes. In these instances, the metering and monitoring team is pursuing opportunities available for utilizing the diverse set of existing metering and monitoring capabilities, thereby minimizing overall program data collection costs.

CPUC Self-Generation Incentive Program – Thermal Analysis Report
2-2 Approach
Table 2-1: Sources of Meter Installers and Data Providers
ENGO FUEL HEAT PG&E PG&E Itron Team SCE SoCalGas Applicants SDG&E Long Beach Energy Hosts LADWP Itron Team Itron Team Applicants Applicants Hosts Hosts
While utilization of existing data collected by applicants and/or host customers offers the advantage of decreasing the program’s overall M&E metering acquisition and installation costs, it does so at the additional costs of increasing data collection coordination costs, data collection and schedule risk, and data validation costs. Electric Net Generator Output
Electric net generator output (ENGO) refers to a measure of system output that includes effects of the prime mover/generator electric parasitic loads (EPL) (e.g., onsite controls, pumps, fans, compressors, prime movers, generators and heat recovery systems). ENGO data is critical in assessing system and electrical efficiencies from the SGIP facilities. The basis of ENGO measurements is illustrated with the following equation:
ENGO = EGGO – EPL
Where: ENGO = Electric net generator output EGGO = Gross generator output EPL = System Electric parasitic load.
Sometimes it is not possible to measure ENGO directly with a single meter. In those cases, EGGO (only) is measured and EPL is either metered separately or estimated. ENGO is then calculated using the above mentioned equation. Electric net generator output metered data in 15-minute intervals is required to achieve the objectives of the program evaluation. Due to the wide variety of formats in which data is received, conversion of raw data to a common format is essential in order to ensure that all data received is treated consistently. There are two major steps involved to process the data and to ensure data quality. These steps include:
Converting raw data to a common format Review of the processed data
CPUC Self-Generation Incentives Program – Thermal Analysis Report
Approach 2-3
Converting Raw Data to a Common Format
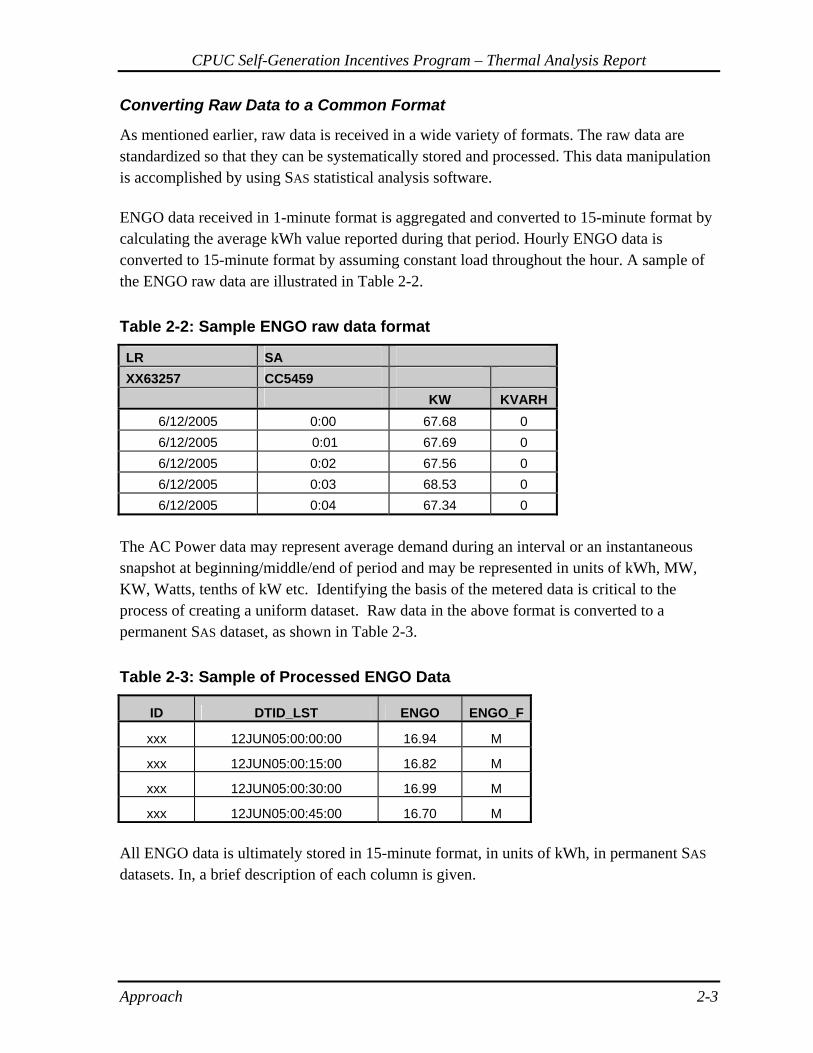
As mentioned earlier, raw data is received in a wide variety of formats. The raw data are standardized so that they can be systematically stored and processed. This data manipulation is accomplished by using SAS statistical analysis software. ENGO data received in 1-minute format is aggregated and converted to 15-minute format by calculating the average kWh value reported during that period. Hourly ENGO data is converted to 15-minute format by assuming constant load throughout the hour. A sample of the ENGO raw data are illustrated in Table 2-2.
Table 2-2: Sample ENGO raw data format
LR SA XX63257 CC5459
KW KVARH 6/12/2005 0:00 67.68 0 6/12/2005 0:01 67.69 0 6/12/2005 0:02 67.56 0 6/12/2005 0:03 68.53 0 6/12/2005 0:04 67.34 0
The AC Power data may represent average demand during an interval or an instantaneous snapshot at beginning/middle/end of period and may be represented in units of kWh, MW, KW, Watts, tenths of kW etc. Identifying the basis of the metered data is critical to the process of creating a uniform dataset. Raw data in the above format is converted to a permanent SAS dataset, as shown in Table 2-3.
Table 2-3: Sample of Processed ENGO Data
All ENGO data is ultimately stored in 15-minute format, in units of kWh, in permanent SAS datasets. In, a brief description of each column is given.
ID DTID_LST ENGO ENGO_F
xxx 12JUN05:00:00:00 16.94 M
xxx 12JUN05:00:15:00 16.82 M
xxx 12JUN05:00:30:00 16.99 M
xxx 12JUN05:00:45:00 16.70 M

CPUC Self-Generation Incentive Program – Thermal Analysis Report
2-4 Approach
Table 2-4: ENGO Common Data File Format
Field Name Data Element Data Basis ID Unique Project Identifier Application ID DTID_LST Date and time
corresponding to energy value
SAS date time value representing the beginning of a 15-minute period
ENGO Electric net generator output
Electric energy produced, expressed in terms of kWh
ENGO_F Data flag for field ENGO ‘M’ = Metered directly (including cases where interval of raw data is <15 minutes) ‘R’ = Ratio using other metered data collected at this site (e.g., hourly or monthly ENGO data) ‘E’ = Estimated (e.g., from heat rate)
Fuel
The two main sources of raw fuel data for Level 3 and 3N projects are natural gas utilities and Itron M&E metering. As an initial step, Itron investigates whether a dedicated fuel meter has been installed and data are available. If possible, Itron obtains data from the gas utility responsible for the dedicated fuel meter. In cases where a gas meter is not present, Itron installs a pulse output gas meter with data logging capability at 15-minute intervals. If the data comes from Itron data loggers, the processing time is minimal because the raw data is already in 15-minute time interval. However, if the raw data is provided by utilities then the data is typically reported in monthly or billing cycle intervals. In Table 2-5, a sample of raw fuel from utility is provided.
Table 2-5: Sample Utility Raw Fuel Data Format
MO
NTH
USE
D
YEA
R U
SED
TAR
IFF
TOTA
L TH
ERM
S
TOTA
L R
EVEN
UE
GN
N_I
D
BA
_ID
TITL
E
NEG
O_C
ON
TRA
CT
1 2004 AB-00 17517 1136 0017662600 0007662612 As Used 0 2 2004 AB-01 14981 978.5 0027662600 1107662612 As Used 0 3 2004 AB-02 5560 394.6 0037662600 2207662612 As Used 0
Fuel data is ultimately stored in 15-minute data, in units of kBtu, in permanent Sas datasets. The transformation of monthly or billing cycle fuel data into 15-minute interval data is accomplished by assuming a constant electrical efficiency rate for each billing cycle and dividing the ENGO data by this efficiency. In more explicit terms, ENGO data are summed
CPUC Self-Generation Incentives Program – Thermal Analysis Report
Approach 2-5
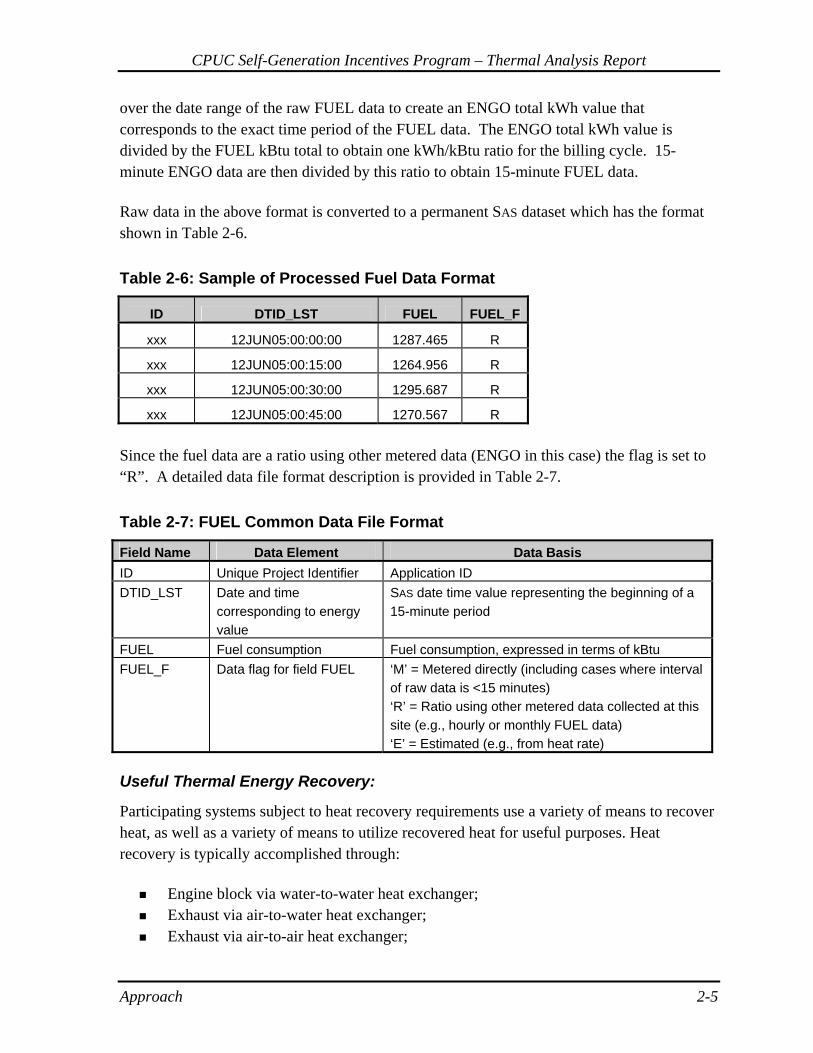
over the date range of the raw FUEL data to create an ENGO total kWh value that corresponds to the exact time period of the FUEL data. The ENGO total kWh value is divided by the FUEL kBtu total to obtain one kWh/kBtu ratio for the billing cycle. 15-minute ENGO data are then divided by this ratio to obtain 15-minute FUEL data. Raw data in the above format is converted to a permanent SAS dataset which has the format shown in Table 2-6.
Table 2-6: Sample of Processed Fuel Data Format
ID DTID_LST FUEL FUEL_F
xxx 12JUN05:00:00:00 1287.465 R
xxx 12JUN05:00:15:00 1264.956 R
xxx 12JUN05:00:30:00 1295.687 R
xxx 12JUN05:00:45:00 1270.567 R Since the fuel data are a ratio using other metered data (ENGO in this case) the flag is set to “R”. A detailed data file format description is provided in Table 2-7.
Table 2-7: FUEL Common Data File Format
Field Name Data Element Data Basis ID Unique Project Identifier Application ID DTID_LST Date and time
corresponding to energy value
SAS date time value representing the beginning of a 15-minute period
FUEL Fuel consumption Fuel consumption, expressed in terms of kBtu FUEL_F Data flag for field FUEL ‘M’ = Metered directly (including cases where interval
of raw data is <15 minutes) ‘R’ = Ratio using other metered data collected at this site (e.g., hourly or monthly FUEL data) ‘E’ = Estimated (e.g., from heat rate)
Useful Thermal Energy Recovery:
Participating systems subject to heat recovery requirements use a variety of means to recover heat, as well as a variety of means to utilize recovered heat for useful purposes. Heat recovery is typically accomplished through:
Engine block via water-to-water heat exchanger; Exhaust via air-to-water heat exchanger; Exhaust via air-to-air heat exchanger;

CPUC Self-Generation Incentive Program – Thermal Analysis Report
2-6 Approach
Exhaust via heat recovery steam boiler; or Exhaust directly.
Recovered heat must be applied to a useful purpose to be credited to PUC 218.5 and other efficiency measures. Heat utilization is typically accomplished via:
Use of recovered heat for space heating, water heating, or process heating; and/or Use of recovered heat to operate a heat recovery absorption chiller (HRAC);
Thermal data is ultimately stored in 15-minute data, in units of kBtu, in permanent SAS datasets. As discussed earlier, main sources of raw thermal data are Applicants and Itron data loggers. If the data comes from Itron data loggers, the processing time is minimal because the raw data is already stored in 15-minute time intervals. However, if the raw data comes from Applicants then the data may be reported in monthly or billing cycle intervals. In Table 2-8, a sample of raw thermal data from an Applicant is provided.
Table 2-8: Sample Raw Thermal Data Format
Local Time timestamp BTUdelHHW1 TONhdelCW1 fallback 31Dec04 23:00:00
2005-Jan-01 07:00:00.000 379240000 123387.5 0
31Dec04 23:15:00
2005-Jan-01 07:15:00.000 379240000 123387.5 0
31Dec04 23:30:00
2005-Jan-01 07:30:00.000 379240000 123387.5 0
Raw data in the above format is converted to a permanent SAS dataset which has the following format, as presented in Table 2-9. When data are received from an Applicant, a Host, or some other party, extensive validation steps must be passed before the data are incorporated into the analysis.
Table 2-9: Sample of Processed Thermal Data Format
ID DTID_LST HEAT HEAT_F
xxx 12JUN05:00:00:00 0 M
xxx 12JUN05:00:15:00 0 M
xxx 12JUN05:00:30:00 0 M
xxx 12JUN05:00:45:00 0 M Since the heat data in this example are metered directly, the flag is set to “M”. A detailed data file format description is provided in Table 2-10.

CPUC Self-Generation Incentives Program – Thermal Analysis Report
Approach 2-7
Table 2-10: HEAT Common Data File Format
Field Name Data Element Data Basis ID Unique Project Identifier Application ID DTID_LST Date and time
corresponding to energy value
SAS date time value representing the beginning of a 15-minute period
HEAT Fuel consumption Fuel consumption, expressed in terms of kBtu HEAT_F Data flag for field HEAT ‘M’ = Metered directly (including cases where interval
of raw data is <15 minutes) ‘R’ = Ratio using other metered data collected at this site (e.g., hourly or monthly HEAT data) ‘E’ = Estimated (e.g., from heat rate)
Review of the Processed Data
All data files are reviewed to identify any periods of time where data are suspicious (e.g., net electric power generated is greater than the system size) or where trends suggested abrupt data change. In cases where suspicious data or abrupt changes are observed, Itron checks with the provider of the data to see if the behavior can be explained. In cases where anomalous behavior cannot be explained, the metered data are not included in the analysis. For all the cogenerations systems, ENGO, fuel, and thermal data are aggregated to calculate monthly, annual, and overall electrical conversion efficiencies, total system efficiencies, and PUC 218.5 efficiencies for all months where data are available. Cases where theses efficiencies are outside reasonable bounds are flagged for further examination. 2.3 Isolating Possible Problems and Solutions: Identification of “Outlier” Facilities “Good” and “Poor” Performers
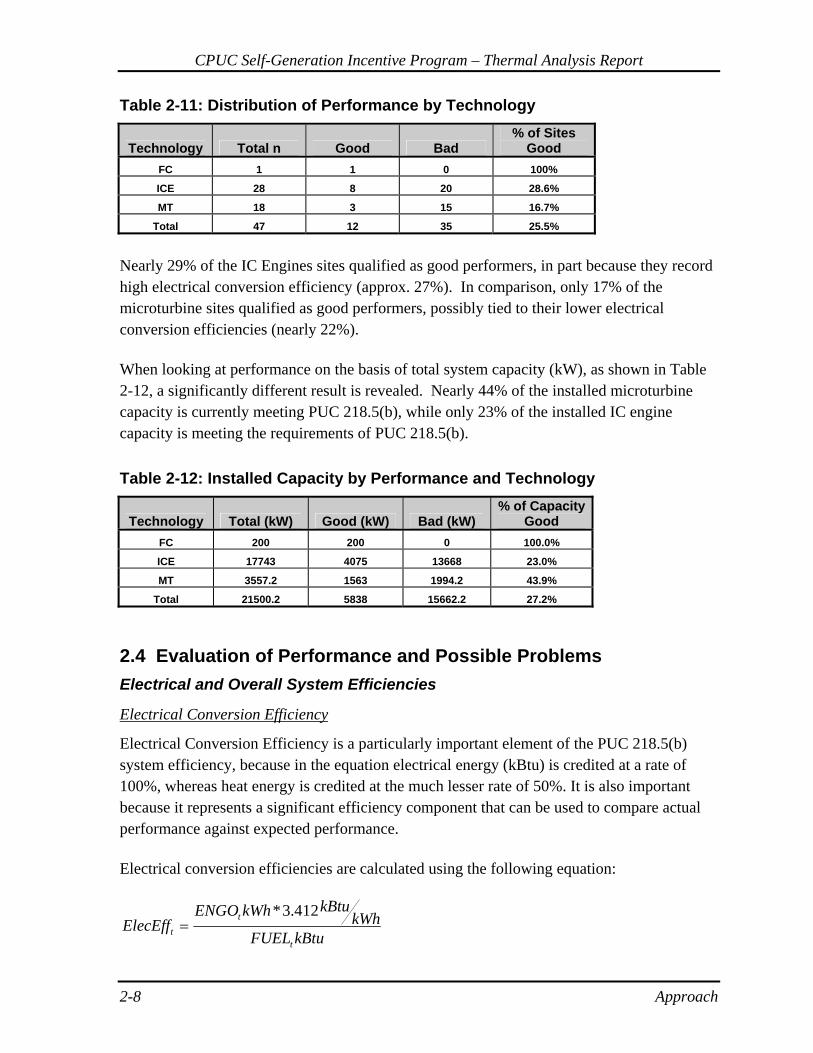
All the sites which record PUC 218.5(b) efficiency greater than 42.5% are considered as good performers. Similarly, sites with PUC 218.5(b) efficiency less than 42.5% are considered as bad performers. Itron analyzed 47 sites for system efficiency analysis and out of these only 12 sites are good performers and the remaining 35 are bad performers.
CPUC Self-Generation Incentive Program – Thermal Analysis Report
2-8 Approach
Table 2-11: Distribution of Performance by Technology
Technology Total n Good Bad % of Sites
Good FC 1 1 0 100%
ICE 28 8 20 28.6%
MT 18 3 15 16.7%
Total 47 12 35 25.5%
Nearly 29% of the IC Engines sites qualified as good performers, in part because they record high electrical conversion efficiency (approx. 27%). In comparison, only 17% of the microturbine sites qualified as good performers, possibly tied to their lower electrical conversion efficiencies (nearly 22%). When looking at performance on the basis of total system capacity (kW), as shown in Table 2-12, a significantly different result is revealed. Nearly 44% of the installed microturbine capacity is currently meeting PUC 218.5(b), while only 23% of the installed IC engine capacity is meeting the requirements of PUC 218.5(b).
Table 2-12: Installed Capacity by Performance and Technology
Technology Total (kW) Good (kW) Bad (kW) % of Capacity
Good FC 200 200 0 100.0%
ICE 17743 4075 13668 23.0%
MT 3557.2 1563 1994.2 43.9%
Total 21500.2 5838 15662.2 27.2%
2.4 Evaluation of Performance and Possible Problems Electrical and Overall System Efficiencies
Electrical Conversion Efficiency
Electrical Conversion Efficiency is a particularly important element of the PUC 218.5(b) system efficiency, because in the equation electrical energy (kBtu) is credited at a rate of 100%, whereas heat energy is credited at the much lesser rate of 50%. It is also important because it represents a significant efficiency component that can be used to compare actual performance against expected performance. Electrical conversion efficiencies are calculated using the following equation:
kBtuFUELkWh
kBtukWhENGOElecEff
t
tt
412.3*=
CPUC Self-Generation Incentives Program – Thermal Analysis Report
Approach 2-9
Where:
ElecEff = Electrical Efficiency t = time period of interest ENGO = Electric net generator output, in kWh FUEL = Fuel input, in kBtu
Overall System Efficiency
Overall system efficiency is the sum of electrical conversion efficiency and rate of useful thermal energy recovered by the system. This measure is important because it represents a significant performance benchmark that can be used to compare cogeneration system performance against the performance of alternative technologies. Overall system efficiencies are calculated using the following equation:
kBtuFUELkBtuHEAT
ElecEffOverallEfft
ttt +=
Where:
HEAT = Useful thermal energy recovered, in kBtu FUEL = Fuel input, in kBtu
Useful Thermal Energy Recovery
Level 2 fuel cells and Level 3/3-N engines/turbines are subject to certain heat recovery and system efficiency requirements during the implementation stage of the Self-Generation Incentive Program. A variety of means are used to recover heat for useful purposes, and to apply that heat to provide various forms of onsite heating and cooling services. The evaluation of the performance and identification of possible problems involves an investigation into why the system was designed as it was, how the host is using the heat recovered, and what technologies or situations are present to maximize (or minimize) thermal energy recovery. Each installation has a unique story to tell in this regard. Itron’s approach to this aspect of the evaluation is to analyze all available program materials, such as the Waste Heat Utilization Worksheet, the applicants Inspection Report, metered data, and anecdotal information obtained through years of collecting data and speaking with hosts and applicants.
CPUC Self-Generation Incentive Program – Thermal Analysis Report
2-10 Approach
2.5 Interviews and Site Visits After sites were identified as either poor performers or good performers, each site was thoroughly examined using all available information, including system owner interview results from the PY2004 impact evaluation. Most performance issues could be sufficiently described by investigating monitoring system data in detail. In some cases, questions were identified that could not be answered by the available data on a site-specific basis. In other cases, site visits were conducted to further investigate operational characteristics that may compromise cogeneration system performance. Site Interviews
The interview guide from PY2004 was modified and fielded to all Applicants to provide an element of consistency over time as well as to cross-check earlier findings, if available. In some cases, questions were answered this year that were not previously answered. Interviews were completed for four (4) Applicants accounting for 19 installed systems. Two of the Applicants were also interviewed during PY2004 impact evaluation. For these interviews, contact notes were thoroughly reviewed prior to conducting the interview. Site Visits
Site visits were deemed necessary for three (3) systems to further investigate causes for performance issues. In these cases, there was either insufficient evidence to form a conclusion, or there was some doubt that the metered data was accurate. Site visits included an interview with the Applicant (or the most qualified on-site personnel available), spot checks of the monitoring system, and a walk-thru of the facility to uncover sources of inefficiencies.
Findings 3-1
3 Findings
This section presents a summary of findings of our analysis with respect to useful waste heat recovery, electrical efficiency, and overall system efficiency. An effort was made to develop consistent metrics for each site to facilitate comparison across all sites and technologies, and across manufacturers within technologies. At the end of each subsection, possible remedies for common problems are provided. These suggestions are two fold. First, there are systematic improvements that can be made at the time of application to the program that would result in a more realistic estimate of system operation. Second, there are some suggestions that can be implemented for existing systems to improve their operational efficiency. The winter of 2005 provided an interesting phenomenon for cogeneration systems. Natural gas prices experienced substantial increases to the point where it was not economically feasible to operate cogeneration systems in facilities paying market prices for natural gas. This “spark gap” issue complicated the analysis because applicants and hosts often were only capable of speaking about recent operational issues and unable to separate thermal efficiency from operational status. Applicants with long-term natural gas contracts were insulated from this issue and typically operated through the winter. 3.1 Useful Waste Heat Recovery Useful waste heat recovery is defined as heat that is recovered from the cogeneration system for some useful purpose. That purpose could include supplying process heat or cooling (usually through equipment like absorption chillers), thereby offsetting the purchase of natural gas or electricity that otherwise would have been required to provide heating or cooling. In application, recovered waste heat is typically the heat contained in the engine cooling jacket water and/or the hot exhaust gases released from the combustion process. The heat is transferred from the jacket water and/or exhaust gas into a working fluid (usually water) via a heat exchanger and then routed through other equipment to provide the necessary heating or cooling. The amount of heat captured and harnessed for useful purposes is measured by the flow of the fluid through the heat exchanger and the temperature drop of that fluid across the heat exchanger. There are two important metrics used to describe useful waste heat recovery: heat recovery per unit capacity and heat recovery per unit of fuel input.
CPUC Self-Generation Incentive Program – Thermal Analysis Report
3-2 Findings
Heat recovery per unit of capacity provides the amount of waste heat harnessed for every kilowatt of installed electricity generating capacity. This metric allows for comparisons between different cogeneration systems on their ability to provide useful heat. Heat recovery per unit of fuel input essentially represents the thermal efficiency of the installed system in capturing and harnessing useful heat recovery. Both of these metrics are presented below by technology. Microturbines
Range of Useful Waste Heat Recovery at SGIP Microturbine Facilities
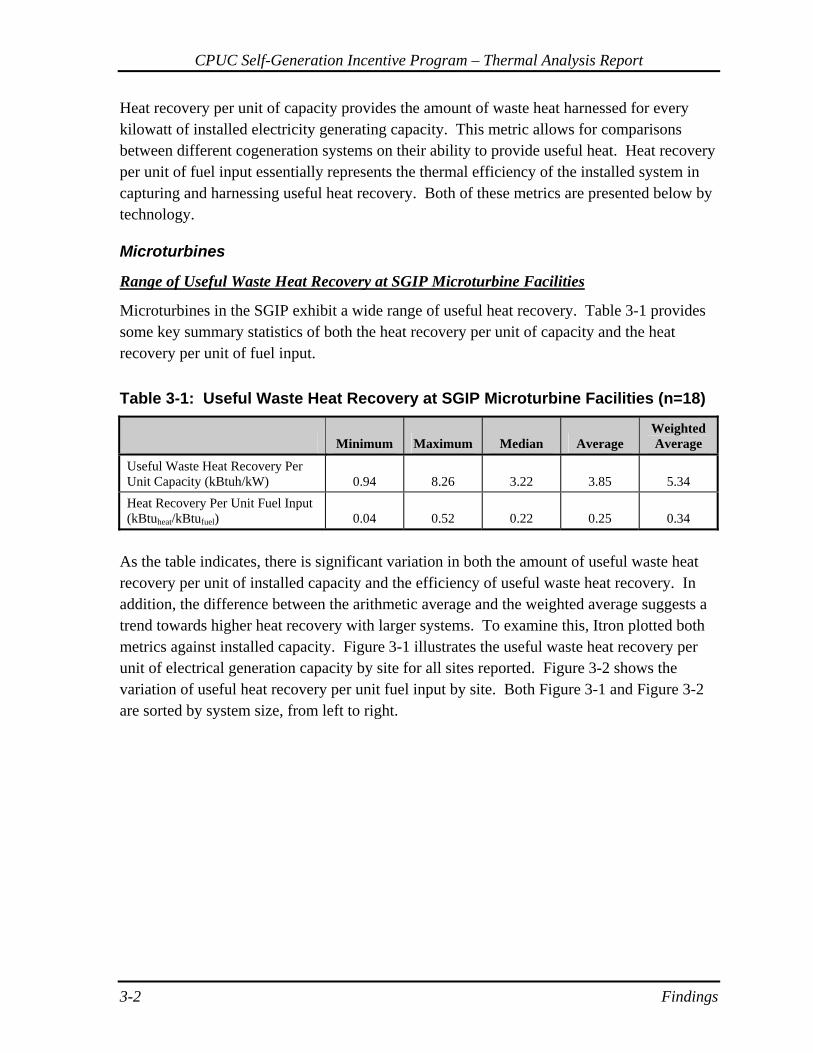
Microturbines in the SGIP exhibit a wide range of useful heat recovery. Table 3-1 provides some key summary statistics of both the heat recovery per unit of capacity and the heat recovery per unit of fuel input.
Table 3-1: Useful Waste Heat Recovery at SGIP Microturbine Facilities (n=18)
Minimum Maximum Median Average Weighted Average
Useful Waste Heat Recovery Per Unit Capacity (kBtuh/kW) 0.94 8.26 3.22 3.85 5.34 Heat Recovery Per Unit Fuel Input (kBtuheat/kBtufuel) 0.04 0.52 0.22 0.25 0.34
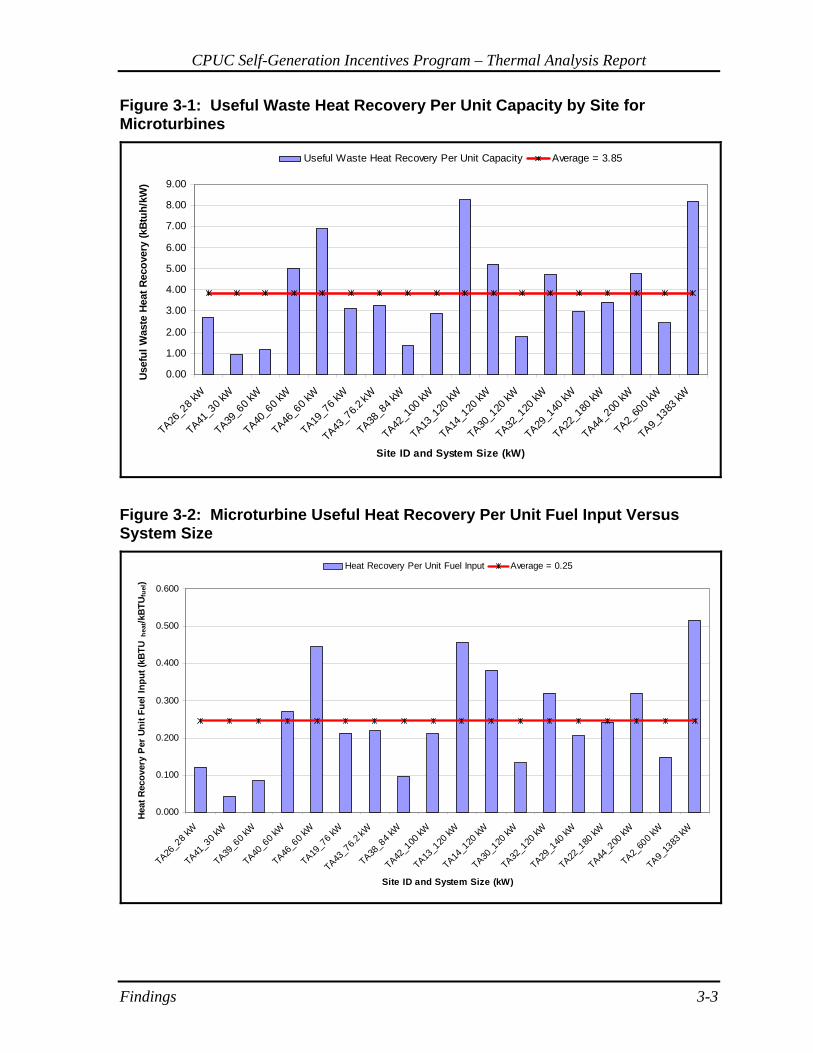
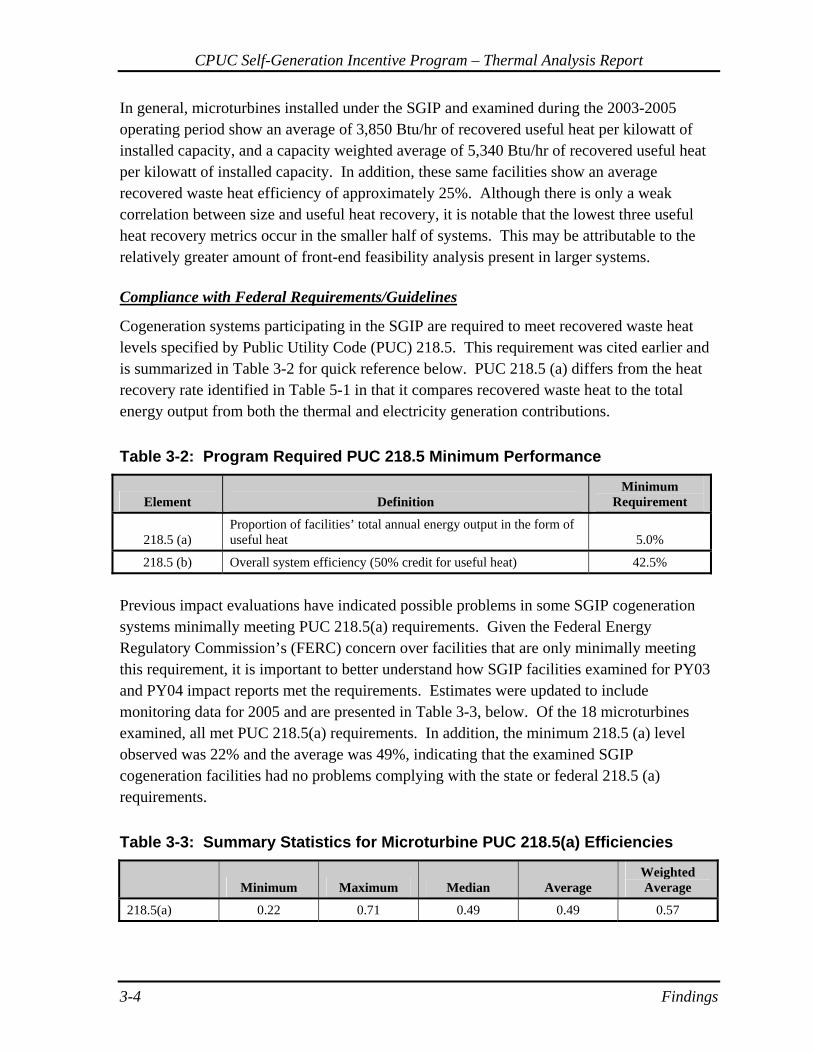
As the table indicates, there is significant variation in both the amount of useful waste heat recovery per unit of installed capacity and the efficiency of useful waste heat recovery. In addition, the difference between the arithmetic average and the weighted average suggests a trend towards higher heat recovery with larger systems. To examine this, Itron plotted both metrics against installed capacity. Figure 3-1 illustrates the useful waste heat recovery per unit of electrical generation capacity by site for all sites reported. Figure 3-2 shows the variation of useful heat recovery per unit fuel input by site. Both Figure 3-1 and Figure 3-2 are sorted by system size, from left to right.
CPUC Self-Generation Incentives Program – Thermal Analysis Report
Findings 3-3
Figure 3-1: Useful Waste Heat Recovery Per Unit Capacity by Site for Microturbines
0.00
1.00
2.00
3.00
4.00
5.00
6.00
7.00
8.00
9.00
TA26_2
8 kW
TA41_3
0 kW
TA39_6
0 kW
TA40_6
0 kW
TA46_6
0 kW
TA19_7
6 kW
TA43_7
6.2 kW
TA38_8
4 kW
TA42_1
00 kW
TA13_1
20 kW
TA14_1
20 kW
TA30_1
20 kW
TA32_1
20 kW
TA29_1
40 kW
TA22_1
80 kW
TA44_2
00 kW
TA2_60
0 kW
TA9_13
83 kW
Site ID and System Size (kW)
Use
ful W
aste
Hea
t Rec
over
y (k
Btuh
/kW
)Useful Waste Heat Recovery Per Unit Capacity Average = 3.85
Figure 3-2: Microturbine Useful Heat Recovery Per Unit Fuel Input Versus System Size
0.000
0.100
0.200
0.300
0.400
0.500
0.600
TA26_2
8 kW
TA41_3
0 kW
TA39_6
0 kW
TA40_6
0 kW
TA46_6
0 kW
TA19_7
6 kW
TA43_7
6.2 kW
TA38_8
4 kW
TA42_1
00 kW
TA13_1
20 kW
TA14_1
20 kW
TA30_1
20 kW
TA32_1
20 kW
TA29_1
40 kW
TA22_1
80 kW
TA44_2
00 kW
TA2_60
0 kW
TA9_13
83 kW
Site ID and System Size (kW)
Hea
t Rec
over
y P
er U
nit F
uel I
nput
(kBT
Uhe
at/k
BTU f
uel)
Heat Recovery Per Unit Fuel Input Average = 0.25
CPUC Self-Generation Incentive Program – Thermal Analysis Report
3-4 Findings
In general, microturbines installed under the SGIP and examined during the 2003-2005 operating period show an average of 3,850 Btu/hr of recovered useful heat per kilowatt of installed capacity, and a capacity weighted average of 5,340 Btu/hr of recovered useful heat per kilowatt of installed capacity. In addition, these same facilities show an average recovered waste heat efficiency of approximately 25%. Although there is only a weak correlation between size and useful heat recovery, it is notable that the lowest three useful heat recovery metrics occur in the smaller half of systems. This may be attributable to the relatively greater amount of front-end feasibility analysis present in larger systems. Compliance with Federal Requirements/Guidelines
Cogeneration systems participating in the SGIP are required to meet recovered waste heat levels specified by Public Utility Code (PUC) 218.5. This requirement was cited earlier and is summarized in Table 3-2 for quick reference below. PUC 218.5 (a) differs from the heat recovery rate identified in Table 5-1 in that it compares recovered waste heat to the total energy output from both the thermal and electricity generation contributions.
Table 3-2: Program Required PUC 218.5 Minimum Performance
Element Definition Minimum
Requirement
218.5 (a) Proportion of facilities’ total annual energy output in the form of useful heat 5.0%
218.5 (b) Overall system efficiency (50% credit for useful heat) 42.5%
Previous impact evaluations have indicated possible problems in some SGIP cogeneration systems minimally meeting PUC 218.5(a) requirements. Given the Federal Energy Regulatory Commission’s (FERC) concern over facilities that are only minimally meeting this requirement, it is important to better understand how SGIP facilities examined for PY03 and PY04 impact reports met the requirements. Estimates were updated to include monitoring data for 2005 and are presented in Table 3-3, below. Of the 18 microturbines examined, all met PUC 218.5(a) requirements. In addition, the minimum 218.5 (a) level observed was 22% and the average was 49%, indicating that the examined SGIP cogeneration facilities had no problems complying with the state or federal 218.5 (a) requirements.
Table 3-3: Summary Statistics for Microturbine PUC 218.5(a) Efficiencies
Minimum Maximum Median Average Weighted Average
218.5(a) 0.22 0.71 0.49 0.49 0.57

CPUC Self-Generation Incentives Program – Thermal Analysis Report
Findings 3-5
As the difference between the arithmetic and weighted averages in the above table suggests, there is a slight improvement in efficiency with system size. This is caused by the largest project having the highest PUC 218.5(a) result and may be explained by the additional design-stage engineering involved in larger (both in capacity and financially) projects. Figure 3-3 illustrates the variation of 218.5(a) efficiencies by system size.
Figure 3-3: Microturbine PUC 218.5(a) Efficiencies Versus System Size
0
0.1
0.2
0.3
0.4
0.5
0.6
0.7
0.8
TA26_2
8 kW
TA41_3
0 kW
TA39_6
0 kW
TA40_6
0 kW
TA46_6
0 kW
TA19_7
6 kW
TA43_7
6.2 kW
TA38_8
4 kW
TA42_1
00 kW
TA13_1
20 kW
TA14_1
20 kW
TA30_1
20 kW
TA32_1
20 kW
TA29_1
40 kW
TA22_1
80 kW
TA44_2
00 kW
TA2_60
0 kW
TA9_13
83 kW
Site ID and System Size (kW)
PUC
218.
5(a)
218.5(a) 49% Average 218.5(a)
Problems Encountered with Waste Heat Recovery
Although all systems achieved PUC 218.5 (a) requirements, evaluation of waste heat recovery showed that some systems had significantly lower waste heat recovery than others. A detailed analysis of these “poorer” performing systems was conducted to explore why they were exhibiting lower waste heat recovery efficiencies. It was discovered that many of these poorer performing systems’ calculations used at the design stage had significant flaws in assumptions that overstated the achievable efficiency. To better identify the types of incorrect assumptions that could be impacting PUC 218.5 (a) and (b) efficiencies, Itron analyzed the Waste Heat Utilization Worksheet (WHUW). This worksheet is used by SGIP project developers in the SGIP application process to demonstrate that their proposed projects comply with PUC 218 requirements. The following are some examples of “bad” assumptions that had significant impacts on the PUC efficiencies and which were more commonly made.

CPUC Self-Generation Incentive Program – Thermal Analysis Report
3-6 Findings
Hours of operation of the proposed SGIP system were routinely overstated, and Information provided in the WHUW did not quantify the coincidence of electrical
demand with thermal demand. As a result, some applications assumed coincident power generation and thermal energy recovery and use. This resulted in a mismatch of load and generation and possibly resulted in over-sizing of equipment.
In addition to flawed design assumptions, there are cases of equipment failures that contributed to poor performance. In some cases, the failure causes complete system shutdown, which does not impact PUC 218.5 calculations. Other times, only part of the system is disabled (e.g., the heat recovery loop) and the generator continues to produce electricity without recovering heat, causing PUC 218.5 efficiencies to plummet. Some examples of mechanical equipment problems are presented below.
The heat exchanger fails due to unexpected reactions with working fluids. The gas compressor fails. The absorption chiller fails.
Possible Ways to Promote Improved Useful Waste Heat Recovery
Possible improvements are divided into SGIP process improvements that affect future applicants and site-specific improvements that affect past applicants. Both require careful thought before implementation and the suggestions here are only a starting point for further investigation. Site-specific suggestions are in no way intended to be actionable items without further engineering. Process Improvements to the SGIP Application
Documentation for Load Profile and Hours of Operation. Electric and thermal load profiles should be developed as part of the application process and used in the WHUW. These are key indicators of the success of the cogeneration system but are often times estimated using assumptions and estimates without documentation. Design to Minimum of Electrical and Thermal Loads. Coincident electrical and thermal loads are imperative for successful cogeneration system performance. Without a coincident electric and thermal load, the cogeneration system should be downsized to meet the minimum of the electric or thermal load. This would ensure full-load operation of the microturbine.

CPUC Self-Generation Incentives Program – Thermal Analysis Report
Findings 3-7
Internal Combustion Engines
Internal combustion engines (ICEs) in the SGIP exhibit a more predicable and consistent range of useful heat recovery than microturbines. Table 3-4 provides some key summary statistics of both the heat recovery per unit of capacity and the heat recovery per unit of fuel input.
Table 3-4: Useful Waste Heat Recovery at SGIP ICE Facilities (n=27)
Minimum Maximum Median Average Weighted Average
Useful Waste Heat Recovery Per Unit Capacity (kBtuh/kW) 0.58 7.36 2.10 2.77 2.61 Heat Recovery Per Unit Fuel Input (kBtuheat/kBtufuel) 0.05 0.45 0.21 0.23 0.20
As the table indicates, there is significant variation in both the amount of useful waste heat recovery per unit of installed capacity and the efficiency of useful waste heat recovery. Figure 3-4 illustrates this variation by site for all sites reported.1
Figure 3-4: Thermal Efficiency by Site for ICEs (n=14)
0.00
1.00
2.00
3.00
4.00
5.00
6.00
7.00
8.00
TA5_
60 kW
TA31
_150
kW
TA51
_150
kW
TA12
_250
kW
TA35
_300
kW
TA23
_395
kW
TA45
_400
kW
TA8_
800 k
W
TA18
_100
0 kW
TA49
_106
3 kW
TA11
_110
0 kW
TA47
_110
0 kW
TA6_
1100
kW
TA28
_150
0 kW
Site ID and System Size (kW)
Usef
ul W
aste
Hea
t Rec
over
y (k
Btu
h/kW
)
Useful Waste Heat Recovery Per Unit Capacity Average = 2.77
1 There are 13 sites for which monitoring data exists but confidentiality agreements with data providers prevent
releasing site-specific data. Data for these sites is reported in all summary statistics but removed from site-specific statistics.
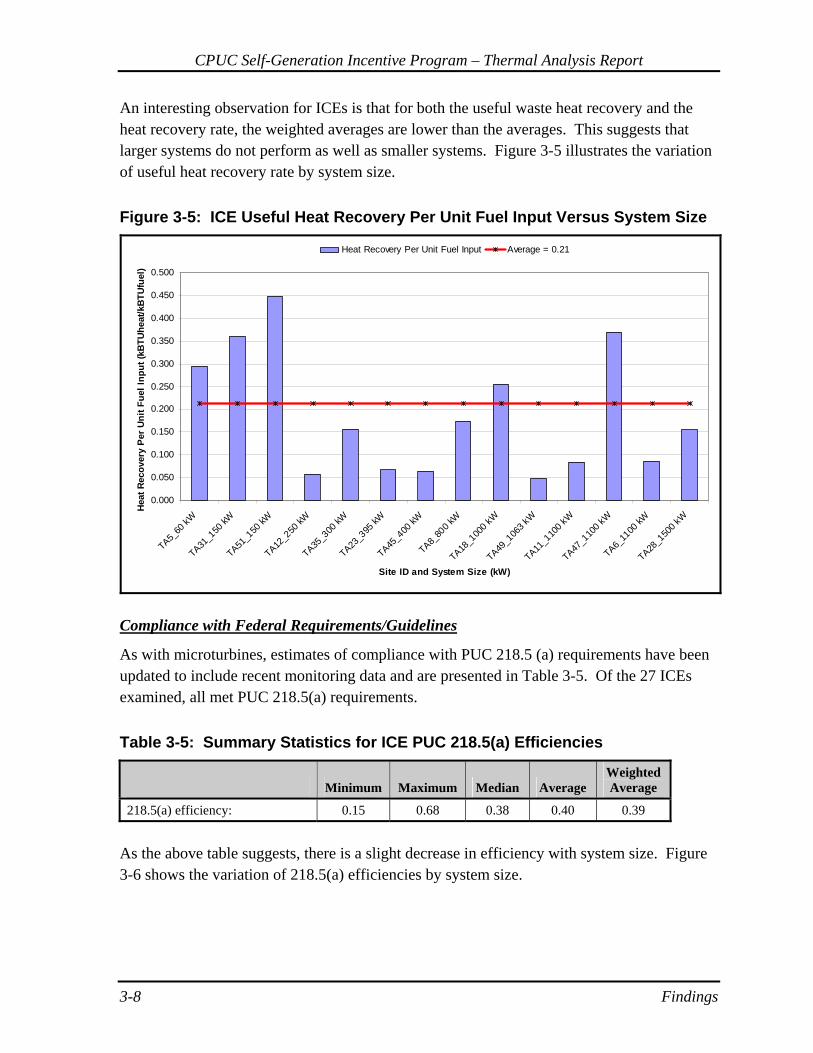
CPUC Self-Generation Incentive Program – Thermal Analysis Report
3-8 Findings
An interesting observation for ICEs is that for both the useful waste heat recovery and the heat recovery rate, the weighted averages are lower than the averages. This suggests that larger systems do not perform as well as smaller systems. Figure 3-5 illustrates the variation of useful heat recovery rate by system size.
Figure 3-5: ICE Useful Heat Recovery Per Unit Fuel Input Versus System Size
0.000
0.050
0.100
0.150
0.200
0.250
0.300
0.350
0.400
0.450
0.500
TA5_60
kW
TA31_1
50 kW
TA51_1
50 kW
TA12_2
50 kW
TA35_3
00 kW
TA23_3
95 kW
TA45_4
00 kW
TA8_80
0 kW
TA18_1
000 k
W
TA49_1
063 k
W
TA11_1
100 k
W
TA47_1
100 k
W
TA6_11
00 kW
TA28_1
500 k
W
Site ID and System Size (kW)
Hea
t Rec
over
y Pe
r Uni
t Fue
l Inp
ut (k
BTU
heat
/kBT
Ufu
el)
Heat Recovery Per Unit Fuel Input Average = 0.21
Compliance with Federal Requirements/Guidelines
As with microturbines, estimates of compliance with PUC 218.5 (a) requirements have been updated to include recent monitoring data and are presented in Table 3-5. Of the 27 ICEs examined, all met PUC 218.5(a) requirements.
Table 3-5: Summary Statistics for ICE PUC 218.5(a) Efficiencies
Minimum Maximum Median Average Weighted Average
218.5(a) efficiency: 0.15 0.68 0.38 0.40 0.39
As the above table suggests, there is a slight decrease in efficiency with system size. Figure 3-6 shows the variation of 218.5(a) efficiencies by system size.
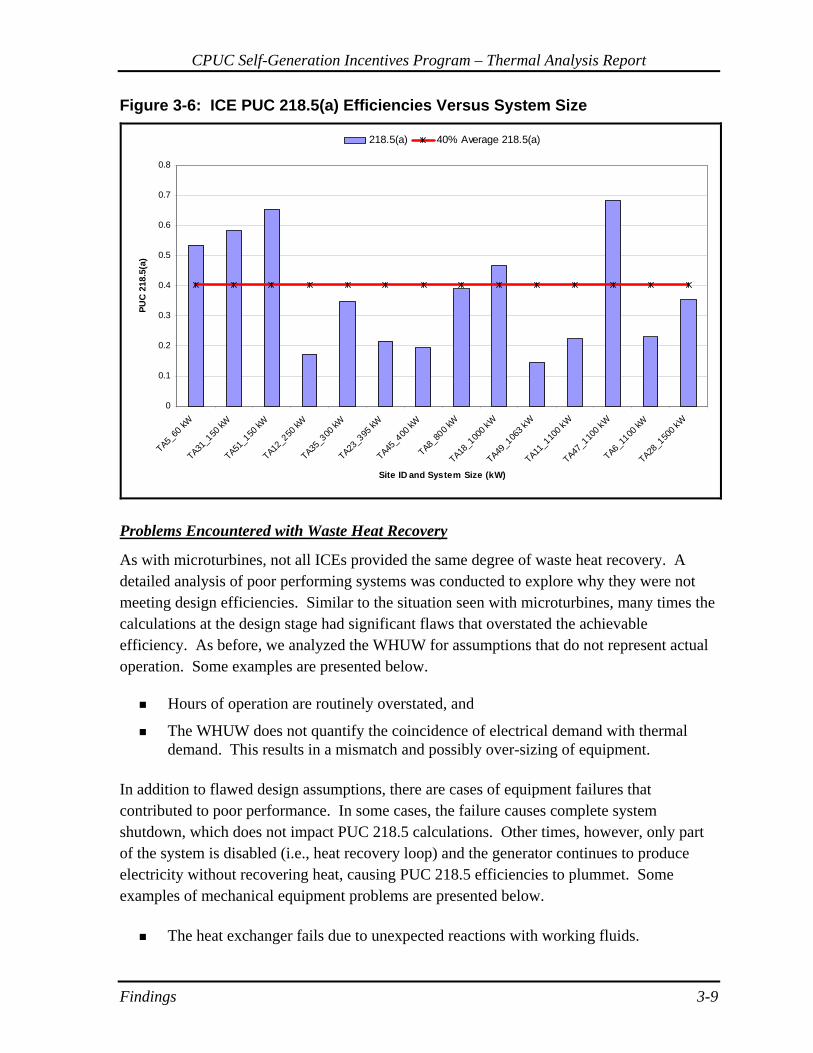
CPUC Self-Generation Incentives Program – Thermal Analysis Report
Findings 3-9
Figure 3-6: ICE PUC 218.5(a) Efficiencies Versus System Size
0
0.1
0.2
0.3
0.4
0.5
0.6
0.7
0.8
TA5_60
kW
TA31_1
50 kW
TA51_1
50 kW
TA12_2
50 kW
TA35_3
00 kW
TA23_3
95 kW
TA45_4
00 kW
TA8_80
0 kW
TA18_1
000 k
W
TA49_1
063 k
W
TA11_1
100 k
W
TA47_1
100 k
W
TA6_11
00 kW
TA28_1
500 k
W
Site ID and System Size (kW)
PUC
218
.5(a
)218.5(a) 40% Average 218.5(a)
Problems Encountered with Waste Heat Recovery
As with microturbines, not all ICEs provided the same degree of waste heat recovery. A detailed analysis of poor performing systems was conducted to explore why they were not meeting design efficiencies. Similar to the situation seen with microturbines, many times the calculations at the design stage had significant flaws that overstated the achievable efficiency. As before, we analyzed the WHUW for assumptions that do not represent actual operation. Some examples are presented below.
Hours of operation are routinely overstated, and The WHUW does not quantify the coincidence of electrical demand with thermal
demand. This results in a mismatch and possibly over-sizing of equipment. In addition to flawed design assumptions, there are cases of equipment failures that contributed to poor performance. In some cases, the failure causes complete system shutdown, which does not impact PUC 218.5 calculations. Other times, however, only part of the system is disabled (i.e., heat recovery loop) and the generator continues to produce electricity without recovering heat, causing PUC 218.5 efficiencies to plummet. Some examples of mechanical equipment problems are presented below.
The heat exchanger fails due to unexpected reactions with working fluids.
CPUC Self-Generation Incentive Program – Thermal Analysis Report
3-10 Findings
The engine cylinder head fails. The absorption chiller fails.
Possible Ways to Promote Improved Useful Waste Heat Recovery
Possible improvements are divided into SGIP process improvements that affect future applicants and site-specific improvements that affect past applicants. Both require careful thought before implementation and the suggestions here are only a starting point for further investigation. Site-specific suggestions are in no way intended to be actionable items without further engineering. Process Improvements to the SGIP Application
Documentation for Load Profile and Hours of Operation. Electric and thermal load profiles should be developed as part of the application process. These are key indicators of the success of the cogeneration system but are often times estimated using assumptions and estimates without documentation. Design to Minimum of Electrical and Thermal Loads. Coincident electrical and thermal loads are imperative for successful cogeneration system performance. Without a coincident electric and thermal load, the cogeneration system should be downsized to meet the minimum of the electric or thermal load. This would ensure full-load operation of the ICE. 3.2 Electrical and Overall System Efficiency Electrical system efficiency is defined as electrical output divided by fuel input. Overall system efficiency is the sum of the electrical output and the useful waste heat recovery divided by the fuel input. Various technologies in the SGIP have trends in operational efficiencies as presented in Section 2. Data collected for this evaluation yield a different result as presented below. Microturbines
Range of Electrical and Overall System Efficiencies at SGIP Microturbine Facilities
Electrical system efficiencies for microturbines are significantly below manufacturer claims but are very consistent. Table 3-6 presents summary statistics for electrical and overall system efficiencies. The results of this evaluation are significantly lower than manufacturer’s claims of approximately 30%.
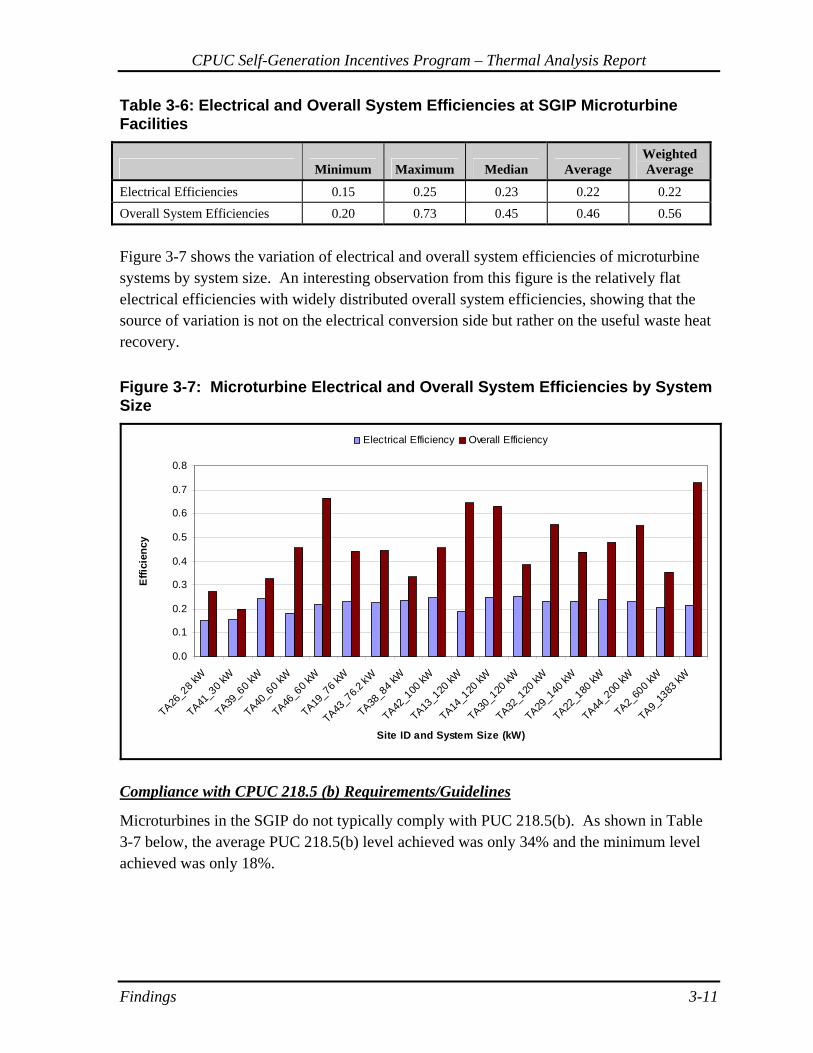
CPUC Self-Generation Incentives Program – Thermal Analysis Report
Findings 3-11
Table 3-6: Electrical and Overall System Efficiencies at SGIP Microturbine Facilities
Minimum Maximum Median Average Weighted Average
Electrical Efficiencies 0.15 0.25 0.23 0.22 0.22 Overall System Efficiencies 0.20 0.73 0.45 0.46 0.56
Figure 3-7 shows the variation of electrical and overall system efficiencies of microturbine systems by system size. An interesting observation from this figure is the relatively flat electrical efficiencies with widely distributed overall system efficiencies, showing that the source of variation is not on the electrical conversion side but rather on the useful waste heat recovery.
Figure 3-7: Microturbine Electrical and Overall System Efficiencies by System Size
0.0
0.1
0.2
0.3
0.4
0.5
0.6
0.7
0.8
TA26_2
8 kW
TA41_3
0 kW
TA39_6
0 kW
TA40_6
0 kW
TA46_6
0 kW
TA19_7
6 kW
TA43_7
6.2 kW
TA38_8
4 kW
TA42_1
00 kW
TA13_1
20 kW
TA14_1
20 kW
TA30_1
20 kW
TA32_1
20 kW
TA29_1
40 kW
TA22_1
80 kW
TA44_2
00 kW
TA2_60
0 kW
TA9_13
83 kW
Site ID and System Size (kW)
Effi
cien
cy
Electrical Efficiency Overall Efficiency
Compliance with CPUC 218.5 (b) Requirements/Guidelines
Microturbines in the SGIP do not typically comply with PUC 218.5(b). As shown in Table 3-7 below, the average PUC 218.5(b) level achieved was only 34% and the minimum level achieved was only 18%.

CPUC Self-Generation Incentive Program – Thermal Analysis Report
3-12 Findings
Table 3-7: PUC 218.5(b) Summary Statistics for Microturbines
Minimum Maximum Median Average Weighted Average
218.5(b) efficiency: 0.18 0.47 0.34 0.34 0.39
Examination of the two components of the PUC 218.5(b) calculation is provided in Table 3-8. Even if the electrical efficiencies were increased to manufacturer’s claims, our analyses indicate many systems would fall below the required 42.5% levels required by PUC 218.5(b). This indicates that there are operational issues on both sides of the cogeneration system.
Table 3-8: Breakout of Electrical and Thermal Components of PUC 218.5(b) for Microturbines
Elec. Eff Waste Heat 218.5(b)
21.90% 12.28% 34.18%
Problems Encountered with Engine Electrical Efficiencies
A detailed analysis of poor performing systems was conducted to explore why they were not meeting design efficiencies. Many times the calculations at the design stage had significant flaws that overstated the achievable efficiency. The WHUW, the tool for demonstrating compliance, was analyzed for assumptions that do not represent actual operation. Several examples are presented below.
Generator output often does not account for parasitic loads, thereby overstating electrical output.
Electrical conversion efficiencies are routinely overstated.
Fuel may be reported in HHV rather than LHV.
Hours of operation are routinely overstated. The WHUW does not quantify the coincidence of electrical demand with thermal
demand. This results in a mismatch and possibly over-sizing of equipment. In addition to flawed design assumptions, many cases of equipment failures are contributed to poor performance. In some cases, the failure causes complete system shutdown, which does not impact overall efficiency calculations. Other times, however, only part of the system is disabled (i.e., heat recovery loop) and the generator continues to produce electricity without recovering heat, causing overall system efficiencies to plummet. Some examples of mechanical equipment problems are presented below.
The heat exchanger fails due to unexpected reactions with working fluids. The recuperator fails causing poor electrical power output.

CPUC Self-Generation Incentives Program – Thermal Analysis Report
Findings 3-13
The gas compressor fails.
The absorption chiller fails.
Poor fuel quality leads to part-load operation (this applies to renewable-fueled
projects but has a significant negative impact on operations).
Operating temperature has an effect on system electrical efficiency.
Regular maintenance is required to maintain good efficiency. Possible ways to Promote Improved Electrical and Overall System Efficiencies
Possible improvements are divided into SGIP process improvements that affect future applicants and site-specific improvements that affect past applicants. Both require careful thought before implementation and the suggestions here are only a starting point for further investigation. Site-specific suggestions are in no way intended to be actionable items without further engineering. Process Improvements to the SGIP Application
Require Actual Electrical Efficiency. To date, many entries involve a nameplate value that does not adequately account for parasitic loads or part-load operation. Require Documentation for Load Profile and Hours of Operation. Electric and thermal load profiles should be developed as part of the application process. These are key indicators of the success of the cogeneration system but are often times estimated using assumptions and estimates without documentation. Design to Minimum of Electrical and Thermal Loads. Coincident electrical and thermal loads are imperative for successful cogeneration system performance. Without a coincident electric and thermal load, the cogeneration system should be downsized to meet the minimum of the electric or thermal load. This would ensure full-load operation of the Microturbine. Internal Combustion Engines
Range of Electrical and Overall System Efficiencies at SGIP ICE Facilities
ICE cogeneration systems generally have higher electrical efficiencies than microturbine systems. This may be attributable to the relative longer history of ICEs as many of the issues discovered during product development have been encountered and resolved prior to the SGIP. Unexpectedly, there is a wider range of electrical efficiencies present in the program, as indicated in Table 3-9.
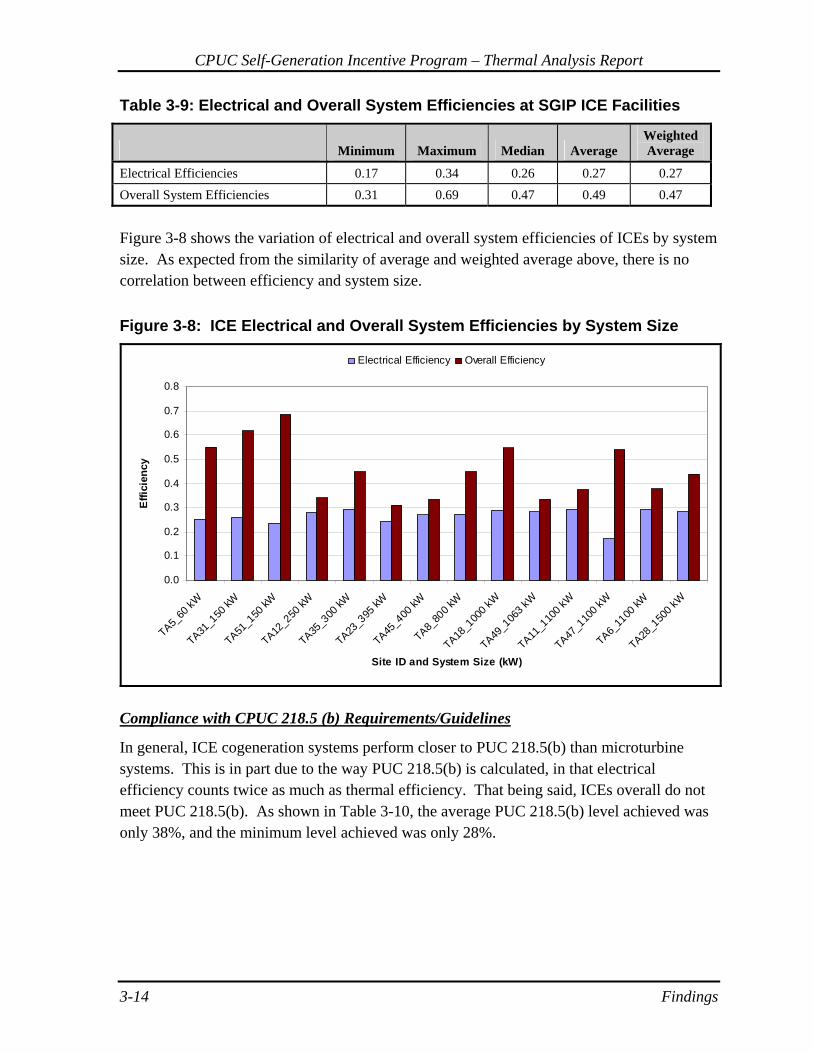
CPUC Self-Generation Incentive Program – Thermal Analysis Report
3-14 Findings
Table 3-9: Electrical and Overall System Efficiencies at SGIP ICE Facilities
Minimum Maximum Median Average Weighted Average
Electrical Efficiencies 0.17 0.34 0.26 0.27 0.27 Overall System Efficiencies 0.31 0.69 0.47 0.49 0.47
Figure 3-8 shows the variation of electrical and overall system efficiencies of ICEs by system size. As expected from the similarity of average and weighted average above, there is no correlation between efficiency and system size.
Figure 3-8: ICE Electrical and Overall System Efficiencies by System Size
0.0
0.1
0.2
0.3
0.4
0.5
0.6
0.7
0.8
TA5_60
kW
TA31_1
50 kW
TA51_1
50 kW
TA12_2
50 kW
TA35_3
00 kW
TA23_3
95 kW
TA45_4
00 kW
TA8_80
0 kW
TA18_1
000 k
W
TA49_1
063 k
W
TA11_1
100 k
W
TA47_1
100 k
W
TA6_11
00 kW
TA28_1
500 k
W
Site ID and System Size (kW)
Effic
ienc
y
Electrical Efficiency Overall Efficiency
Compliance with CPUC 218.5 (b) Requirements/Guidelines
In general, ICE cogeneration systems perform closer to PUC 218.5(b) than microturbine systems. This is in part due to the way PUC 218.5(b) is calculated, in that electrical efficiency counts twice as much as thermal efficiency. That being said, ICEs overall do not meet PUC 218.5(b). As shown in Table 3-10, the average PUC 218.5(b) level achieved was only 38%, and the minimum level achieved was only 28%.

CPUC Self-Generation Incentives Program – Thermal Analysis Report
Findings 3-15
Table 3-10: PCU 218.5(b) Summary Statistics for ICEs
Minimum Maximum Median Average Weighted Average
218.5(b) efficiency: 0.28 0.48 0.37 0.38 0.37
Table 3-11 provides the components that make up PUC 218.5(b) for ICEs.
Table 3-11: Breakout of Electrical and Thermal Components of PUC 218.5(b) for ICEs
Elec. Eff Waste Heat 218.5(b)
27.25% 10.63% 37.88%
Problems Encountered with Engine Electrical Efficiencies
A detailed analysis of poor performing systems was conducted to explore why they were not meeting design efficiencies. Many times, the calculations at the design stage had significant flaws that overstated the achievable efficiency. The WHUW was analyzed for assumptions that do not represent actual operation. Several examples are presented below.
Generator output often does not account for parasitic loads, thereby overstating electrical output.
Electrical conversion efficiencies are routinely overstated.
Fuel may be reported in HHV rather than LHV.
Hours of operation are routinely overstated.
The WHUW does not quantify the coincidence of electrical demand with thermal demand. This results in a mismatch and possibly over-sizing of equipment.
In addition to flawed design assumptions, there are many cases of equipment failures that contributed to poor performance. In some cases, the failure causes complete system shutdown, which does not impact overall efficiency calculations. Other times, however, only part of the system is disabled (i.e., heat recovery loop) and the generator continues to produce electricity without recovering heat, causing overall system efficiencies to plummet. Some examples of mechanical equipment problems are presented below.
The heat exchanger fails due to unexpected reactions with working fluids.
The recuperator fails causing poor electrical power output.
The gas compressor fails.
The absorption chiller fails.
CPUC Self-Generation Incentive Program – Thermal Analysis Report
3-16 Findings
Poor fuel quality leads to part-load operation (this applies to renewable-fueled projects but has a significant negative impact on operations).
Operating temperature has an effect on system electrical efficiency.
Regular maintenance is required to maintain good efficiency.
Possible ways to Promote Improved Electrical and Overall System Efficiencies
Possible improvements are divided into SGIP process improvements that affect future applicants and site-specific improvements that affect past applicants. Both require careful thought before implementation and the suggestions here are only a starting point for further investigation. Site-specific suggestions are in no way intended to be actionable items without further engineering. Process Improvements to the SGIP Application
Require Actual Electrical Efficiency. To date, many entries involve a nameplate value that does not adequately account for parasitic loads or part-load operation. Require Documentation for Load Profile and Hours of Operation. Electric and thermal load profiles should be developed as part of the application process. These are key indicators of the success of the cogeneration system but are often times estimated using assumptions and estimates without documentation. Design to Minimum of Electrical and Thermal Loads. Coincident electrical and thermal loads are imperative for successful cogeneration system performance. Without a coincident electric and thermal load, the cogeneration system should be downsized to meet the minimum of the electric or thermal load. This would ensure full-load operation of the ICE.. 3.3 Manufacturer Comparative Results Within each technology, two to three manufacturers represent most of the microturbine or ICE capacity within the SGIP. For microturbines, Capstone and Ingersoll Rand systems represent over 70% of the installed capacity. Similarly, Waukesha, Hess Microgen, and GE Jenbacher represent over 48% of the installed capacity for ICEs within the SGIP. Summary statistics were developed to examine performance by manufacturer. Due to the nature of participation, the most prevalent manufacturers were compared to the combination of all other manufacturers in the program. Comparison of Microturbine Systems
Figure 3-9 compares the key efficiency metrics for Capstone and Ingersoll Rand against all other microturbine manufacturers. In general, there appear to be only marginal differences in
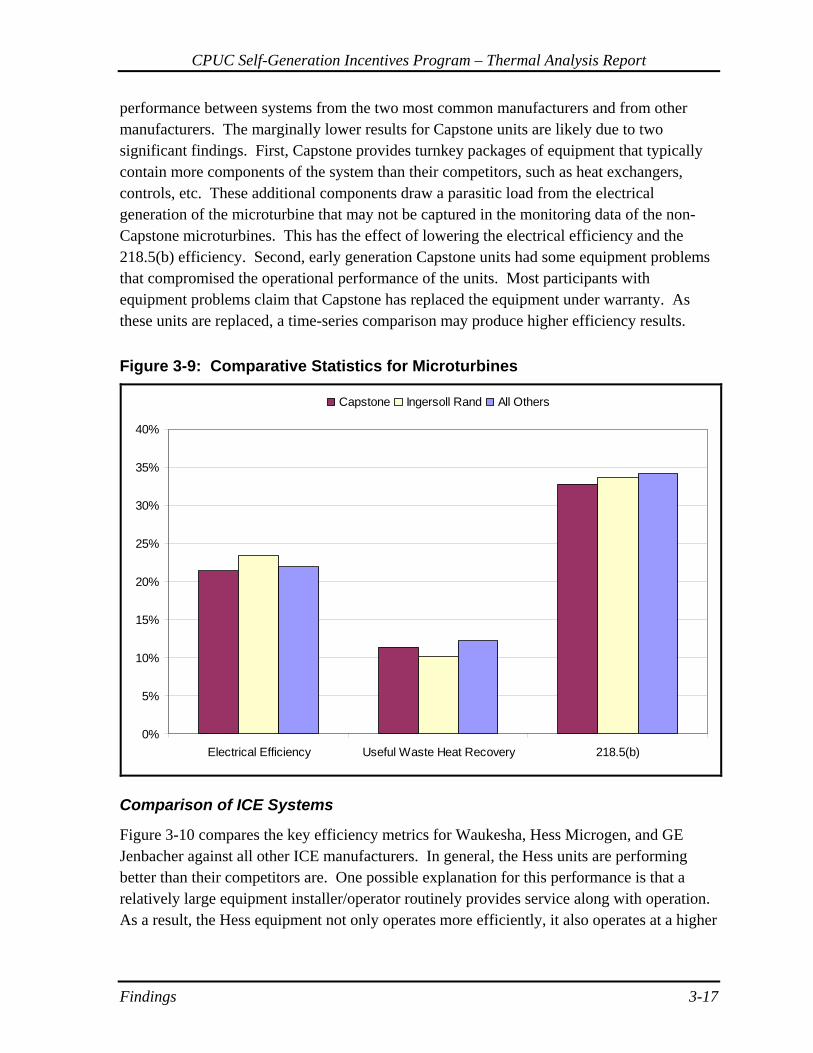
CPUC Self-Generation Incentives Program – Thermal Analysis Report
Findings 3-17
performance between systems from the two most common manufacturers and from other manufacturers. The marginally lower results for Capstone units are likely due to two significant findings. First, Capstone provides turnkey packages of equipment that typically contain more components of the system than their competitors, such as heat exchangers, controls, etc. These additional components draw a parasitic load from the electrical generation of the microturbine that may not be captured in the monitoring data of the non-Capstone microturbines. This has the effect of lowering the electrical efficiency and the 218.5(b) efficiency. Second, early generation Capstone units had some equipment problems that compromised the operational performance of the units. Most participants with equipment problems claim that Capstone has replaced the equipment under warranty. As these units are replaced, a time-series comparison may produce higher efficiency results.
Figure 3-9: Comparative Statistics for Microturbines
0%
5%
10%
15%
20%
25%
30%
35%
40%
Electrical Efficiency Useful Waste Heat Recovery 218.5(b)
Capstone Ingersoll Rand All Others
Comparison of ICE Systems
Figure 3-10 compares the key efficiency metrics for Waukesha, Hess Microgen, and GE Jenbacher against all other ICE manufacturers. In general, the Hess units are performing better than their competitors are. One possible explanation for this performance is that a relatively large equipment installer/operator routinely provides service along with operation. As a result, the Hess equipment not only operates more efficiently, it also operates at a higher
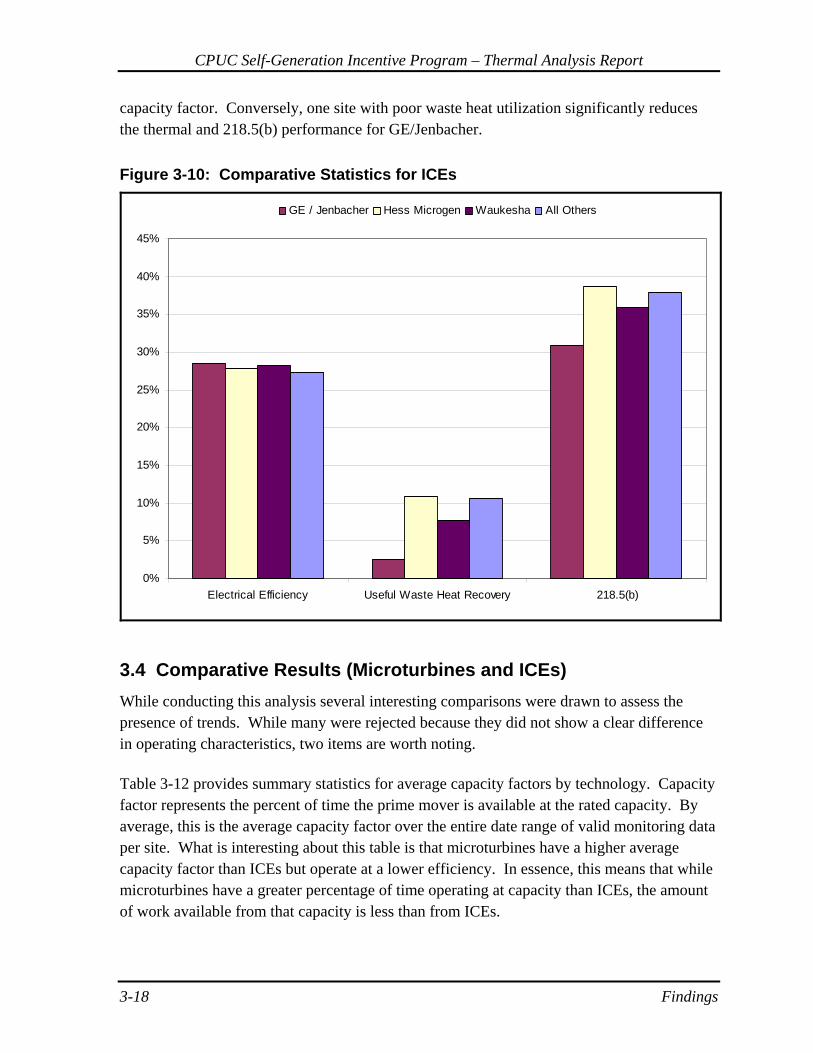
CPUC Self-Generation Incentive Program – Thermal Analysis Report
3-18 Findings
capacity factor. Conversely, one site with poor waste heat utilization significantly reduces the thermal and 218.5(b) performance for GE/Jenbacher.
Figure 3-10: Comparative Statistics for ICEs
0%
5%
10%
15%
20%
25%
30%
35%
40%
45%
Electrical Efficiency Useful Waste Heat Recovery 218.5(b)
GE / Jenbacher Hess Microgen Waukesha All Others
3.4 Comparative Results (Microturbines and ICEs) While conducting this analysis several interesting comparisons were drawn to assess the presence of trends. While many were rejected because they did not show a clear difference in operating characteristics, two items are worth noting. Table 3-12 provides summary statistics for average capacity factors by technology. Capacity factor represents the percent of time the prime mover is available at the rated capacity. By average, this is the average capacity factor over the entire date range of valid monitoring data per site. What is interesting about this table is that microturbines have a higher average capacity factor than ICEs but operate at a lower efficiency. In essence, this means that while microturbines have a greater percentage of time operating at capacity than ICEs, the amount of work available from that capacity is less than from ICEs.
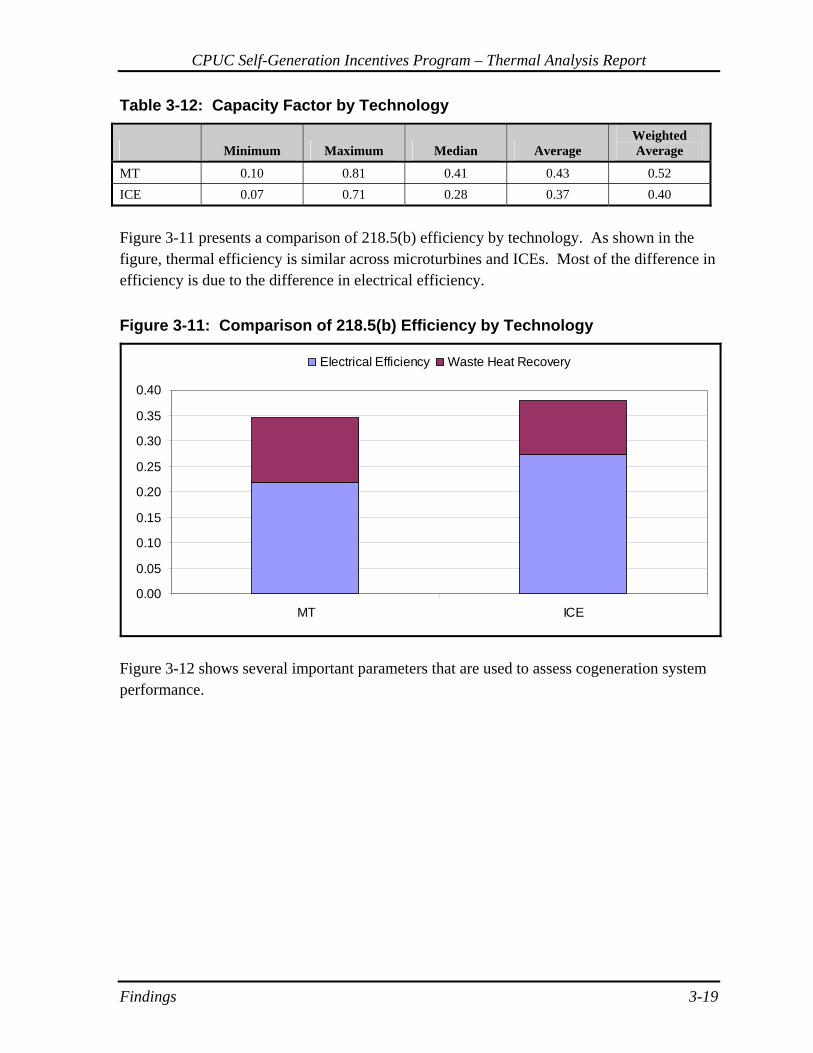
CPUC Self-Generation Incentives Program – Thermal Analysis Report
Findings 3-19
Table 3-12: Capacity Factor by Technology
Minimum Maximum Median Average Weighted Average
MT 0.10 0.81 0.41 0.43 0.52 ICE 0.07 0.71 0.28 0.37 0.40
Figure 3-11 presents a comparison of 218.5(b) efficiency by technology. As shown in the figure, thermal efficiency is similar across microturbines and ICEs. Most of the difference in efficiency is due to the difference in electrical efficiency.
Figure 3-11: Comparison of 218.5(b) Efficiency by Technology
0.00
0.05
0.10
0.15
0.20
0.25
0.30
0.35
0.40
MT ICE
Electrical Efficiency Waste Heat Recovery
Figure 3-12 shows several important parameters that are used to assess cogeneration system performance.
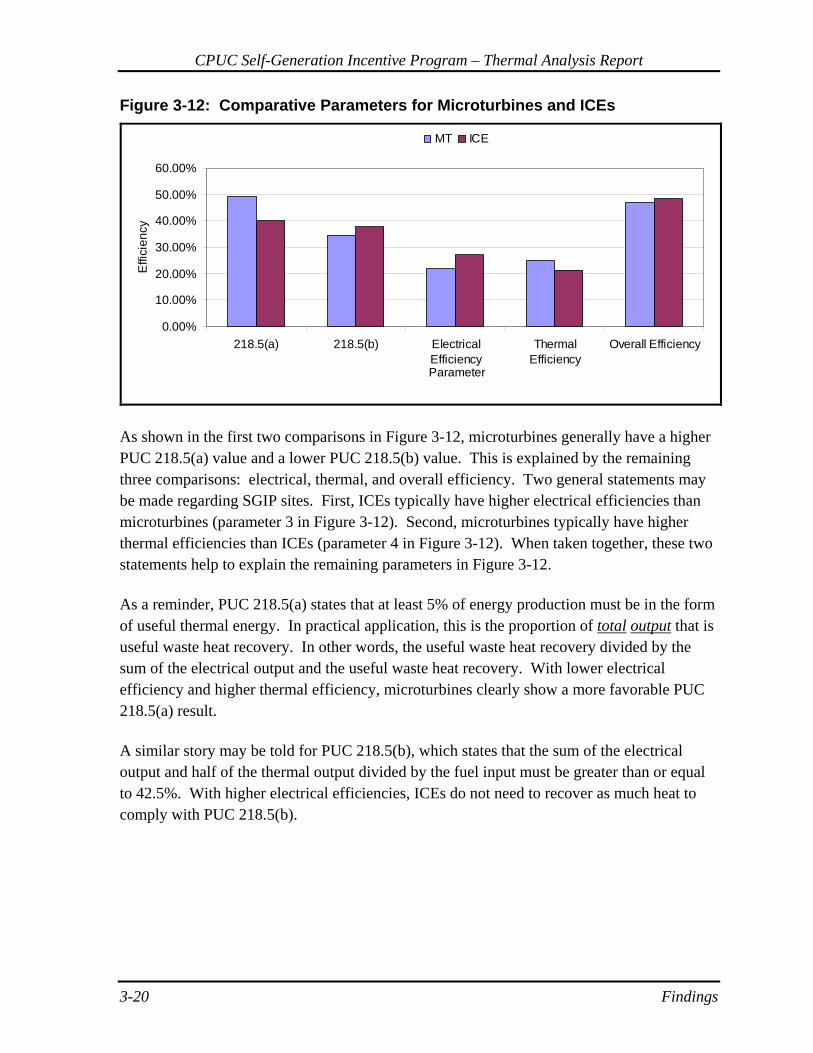
CPUC Self-Generation Incentive Program – Thermal Analysis Report
3-20 Findings
Figure 3-12: Comparative Parameters for Microturbines and ICEs
0.00%
10.00%
20.00%
30.00%
40.00%
50.00%
60.00%
218.5(a) 218.5(b) ElectricalEfficiency
ThermalEfficiency
Overall Efficiency
Parameter
Effi
cien
cyMT ICE
As shown in the first two comparisons in Figure 3-12, microturbines generally have a higher PUC 218.5(a) value and a lower PUC 218.5(b) value. This is explained by the remaining three comparisons: electrical, thermal, and overall efficiency. Two general statements may be made regarding SGIP sites. First, ICEs typically have higher electrical efficiencies than microturbines (parameter 3 in Figure 3-12). Second, microturbines typically have higher thermal efficiencies than ICEs (parameter 4 in Figure 3-12). When taken together, these two statements help to explain the remaining parameters in Figure 3-12. As a reminder, PUC 218.5(a) states that at least 5% of energy production must be in the form of useful thermal energy. In practical application, this is the proportion of total output that is useful waste heat recovery. In other words, the useful waste heat recovery divided by the sum of the electrical output and the useful waste heat recovery. With lower electrical efficiency and higher thermal efficiency, microturbines clearly show a more favorable PUC 218.5(a) result. A similar story may be told for PUC 218.5(b), which states that the sum of the electrical output and half of the thermal output divided by the fuel input must be greater than or equal to 42.5%. With higher electrical efficiencies, ICEs do not need to recover as much heat to comply with PUC 218.5(b).

Reciprocating Engines A-1
Appendix A Reciprocating Engines

Internal Combustion Engines
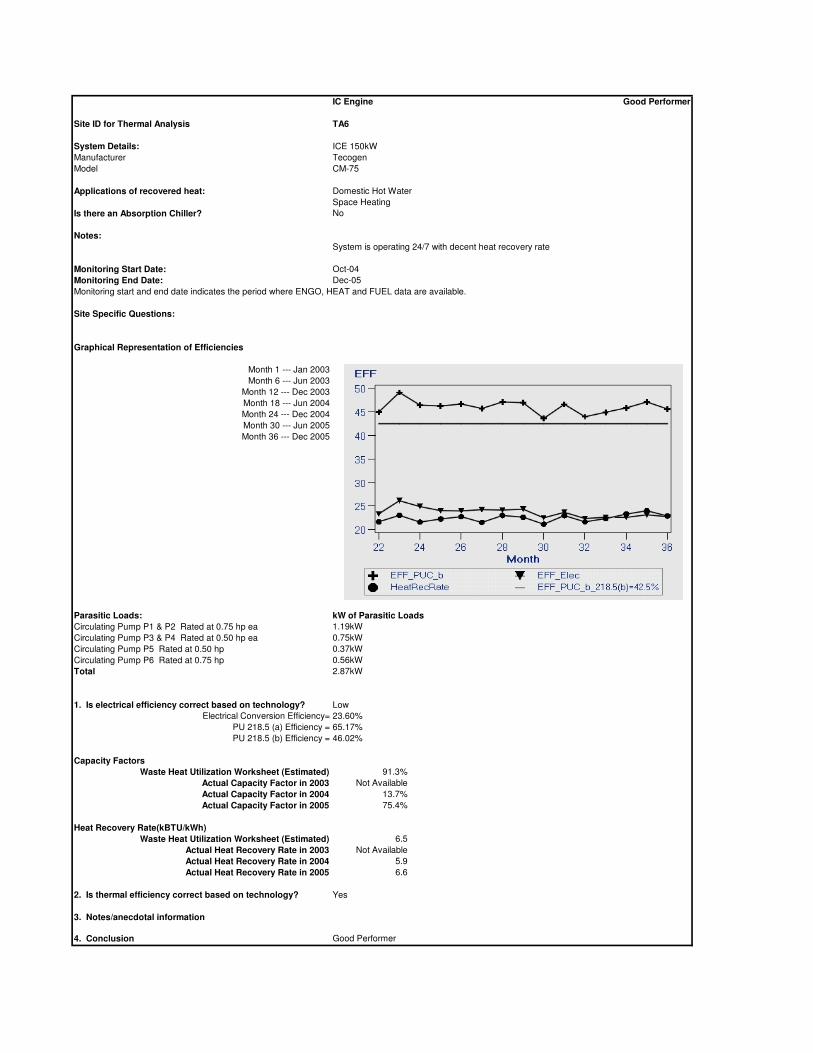
IC Engine Good Performer
Site ID for Thermal Analysis TA6
System Details: ICE 150kW
Manufacturer Tecogen
Model CM-75
Applications of recovered heat:
Space Heating
Is there an Absorption Chiller? No
Notes:
Monitoring Start Date: Oct-04
Monitoring End Date: Dec-05
Monitoring start and end date indicates the period where ENGO, HEAT and FUEL data are available.
Site Specific Questions:
Graphical Representation of Efficiencies
Month 1 --- Jan 2003
Month 6 --- Jun 2003
Month 12 --- Dec 2003
Month 18 --- Jun 2004
Month 24 --- Dec 2004
Month 30 --- Jun 2005
Month 36 --- Dec 2005
Parasitic Loads: kW of Parasitic Loads
Circulating Pump P1 & P2 Rated at 0.75 hp ea 1.19kW
Circulating Pump P3 & P4 Rated at 0.50 hp ea 0.75kW
Circulating Pump P5 Rated at 0.50 hp 0.37kW
Circulating Pump P6 Rated at 0.75 hp 0.56kW
Total 2.87kW
1. Is electrical efficiency correct based on technology?
Electrical Conversion Efficiency= 23.60%
PU 218.5 (a) Efficiency = 65.17%
PU 218.5 (b) Efficiency = 46.02%
Capacity Factors
Waste Heat Utilization Worksheet (Estimated) 91.3%
Actual Capacity Factor in 2003 Not Available
Actual Capacity Factor in 2004 13.7%
Actual Capacity Factor in 2005 75.4%
Heat Recovery Rate(kBTU/kWh)
Waste Heat Utilization Worksheet (Estimated) 6.5
Actual Heat Recovery Rate in 2003 Not Available
Actual Heat Recovery Rate in 2004 5.9
Actual Heat Recovery Rate in 2005 6.6
2. Is thermal efficiency correct based on technology? Yes
3. Notes/anecdotal information
4. Conclusion Good Performer
Domestic Hot Water
System is operating 24/7 with decent heat recovery rate
Low

IC Engine Good Performer
Site ID for Thermal Analysis TA16
System Details:
Manufacturer Hess Microgen
Model 200i
Applications of recovered heat:
Is there an Absorption Chiller? Yes
Notes:
Monitoring Start Date: Jan-04
Monitoring End Date: Dec-04
Monitoring start and end date indicates the period where ENGO, HEAT and FUEL data are available.
Site Specific Questions:
Graphical Representation of Efficiencies
Month 1 --- Jan 2003
Month 6 --- Jun 2003
Month 12 --- Dec 2003
Month 18 --- Jun 2004
Month 24 --- Dec 2004
Month 30 --- Jun 2005
Month 36 --- Dec 2005
Parasitic Loads:
1. Is electrical efficiency correct based on technology? Yes
Electrical Conversion Efficiency= 26.55%
PU 218.5 (a) Efficiency = 47.84%
PU 218.5 (b) Efficiency = 42.43%
Capacity Factors
Waste Heat Utilization Worksheet (Estimated) 39.7%
Actual Capacity Factor in 2003 38.3%
Actual Capacity Factor in 2004 11.1%
Actual Capacity Factor in 2005 5.5%
Heat Recovery Rate(kBTU/kWh)
Waste Heat Utilization Worksheet (Estimated) 2.0
Actual Heat Recovery Rate in 2003 3.9
Actual Heat Recovery Rate in 2004 4.1
Actual Heat Recovery Rate in 2005 5.2
2. Is thermal efficiency correct based on technology? Yes
3. Notes/anecdotal information
4. Conclusion Good Performer
Host has changed ownership. Future of cogen operation is uncertain. System may be
decomissioned.
When the heat recovery is low, they are unable to meet the 218.5(b) efficiency standards
Are there specific circumstances that lead to poor heat recovery?
Host has changed ownership since data receipt.
Operational information from Applicant is not site-specific.
ICE Hess Microgen 400kW
Recovered heat is used to run absorption chiller.
We do not have fuel data from Jan 2005. Assumed electrical efficiency for this period.
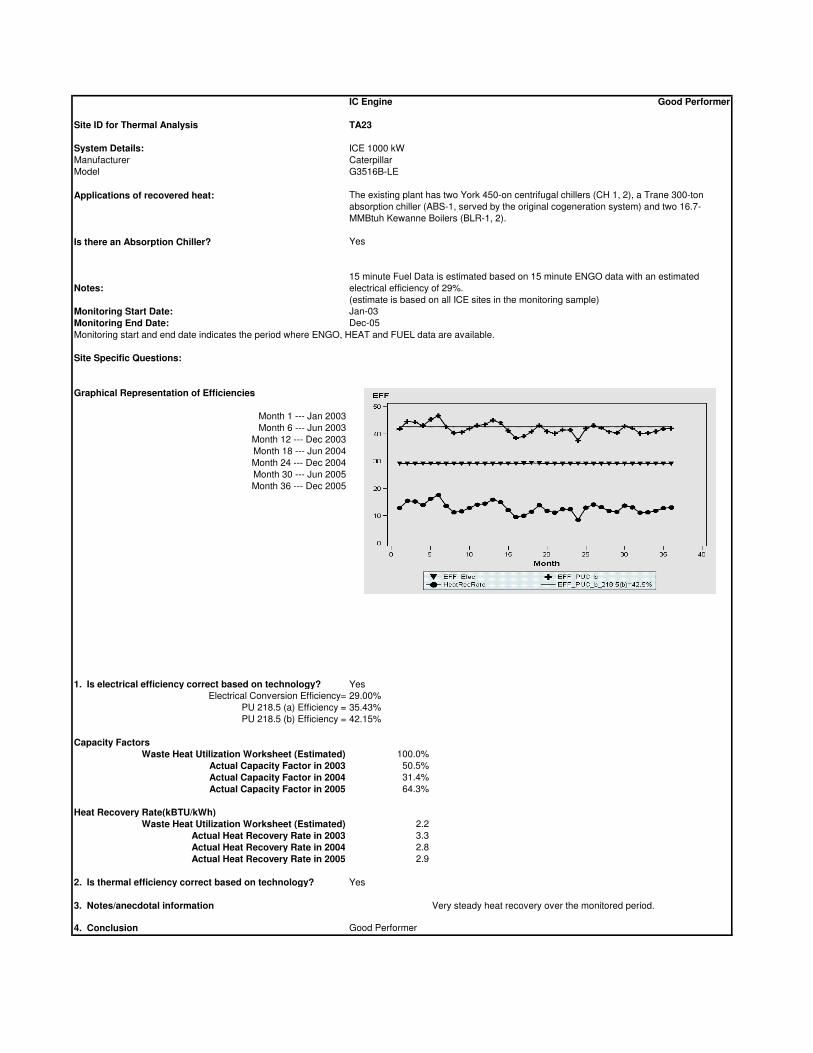
IC Engine Good Performer
Site ID for Thermal Analysis TA23
System Details: ICE 1000 kW
Manufacturer Caterpillar
Model G3516B-LE
Applications of recovered heat:
Is there an Absorption Chiller? Yes
Notes:
Monitoring Start Date: Jan-03
Monitoring End Date: Dec-05
Monitoring start and end date indicates the period where ENGO, HEAT and FUEL data are available.
Site Specific Questions:
Graphical Representation of Efficiencies
Month 1 --- Jan 2003
Month 6 --- Jun 2003
Month 12 --- Dec 2003
Month 18 --- Jun 2004
Month 24 --- Dec 2004
Month 30 --- Jun 2005
Month 36 --- Dec 2005
1. Is electrical efficiency correct based on technology?
Electrical Conversion Efficiency= 29.00%
PU 218.5 (a) Efficiency = 35.43%
PU 218.5 (b) Efficiency = 42.15%
Capacity Factors
Waste Heat Utilization Worksheet (Estimated) 100.0%
Actual Capacity Factor in 2003 50.5%
Actual Capacity Factor in 2004 31.4%
Actual Capacity Factor in 2005 64.3%
Heat Recovery Rate(kBTU/kWh)
Waste Heat Utilization Worksheet (Estimated) 2.2
Actual Heat Recovery Rate in 2003 3.3
Actual Heat Recovery Rate in 2004 2.8
Actual Heat Recovery Rate in 2005 2.9
2. Is thermal efficiency correct based on technology? Yes
3. Notes/anecdotal information Very steady heat recovery over the monitored period.
4. Conclusion Good Performer
15 minute Fuel Data is estimated based on 15 minute ENGO data with an estimated
electrical efficiency of 29%.
Yes
The existing plant has two York 450-on centrifugal chillers (CH 1, 2), a Trane 300-ton
absorption chiller (ABS-1, served by the original cogeneration system) and two 16.7-
MMBtuh Kewanne Boilers (BLR-1, 2).
(estimate is based on all ICE sites in the monitoring sample)

IC Engine Good Performer
Site ID for Thermal Analysis TA35
System Details:
Manufacturer Generac
Model Utility DG50
Applications of recovered heat:
Is there an Absorption Chiller? No
Monitoring Start Date: Jun-03
Monitoring End Date: Nov-05
Monitoring start and end date indicates the period where ENGO, HEAT and FUEL data are available.
Site Specific Questions:
Graphical Representation of Efficiencies
Month 1 --- Jan 2003
Month 6 --- Jun 2003
Month 12 --- Dec 2003
Month 18 --- Jun 2004
Month 24 --- Dec 2004
Month 30 --- Jun 2005
Month 36 --- Dec 2005
Parasitic Loads:
1. Is electrical efficiency correct based on technology? Yes
Electrical Conversion Efficiency= 25.84%
PU 218.5 (a) Efficiency = 57.76%
PU 218.5 (b) Efficiency = 43.51%
Capacity Factors
Waste Heat Utilization Worksheet (Estimated) 74.2%
Actual Capacity Factor in 2003 7.0%
Actual Capacity Factor in 2004 6.4%
Actual Capacity Factor in 2005 4.7%
Heat Recovery Rate(kBTU/kWh)
Waste Heat Utilization Worksheet (Estimated) 3.3
Actual Heat Recovery Rate in 2003 3.7
Actual Heat Recovery Rate in 2004 5.1
Actual Heat Recovery Rate in 2005 5.5
2. Is thermal efficiency correct based on technology? Yes
3. Notes/anecdotal information
4. Conclusion
System is shut down in Nov 2005. Operations resumed in early 2006.
The system has a very good heat recovery rate when running.
Why was the system shut down? Is it because of the high gas prices or some kind of repairs?
Good Performer
Generac Utility DG50 ICN 150kW
1.Space temperature is maintained by bare pipes running the length of the greenhouse buildings. The
2.Dirt is sterilized in a Van Dijk soil sterilizer that requires water temperature over 190°F

IC Engine Good Performer
Site ID for Thermal Analysis TA50
System Details: Hess Microgen ICE 800kW
Manufacturer Hess Microgen
Model Hess 200
Applications of recovered heat: 190ton Absorption Chiller
Supplement the existing hot water boiler for each building.
Is there an Absorption Chiller? Yes
Notes:
Monitoring Start Date: Jan-04
Monitoring End Date: Dec-04
Monitoring start and end date indicates the period where ENGO, HEAT and FUEL data are available.
Site Specific Questions:
Graphical Representation of Efficiencies
Month 1 --- Jan 2003
Month 6 --- Jun 2003
Month 12 --- Dec 2003
Month 18 --- Jun 2004
Month 24 --- Dec 2004
Month 30 --- Jun 2005
Month 36 --- Dec 2005
1. Is electrical efficiency correct based on technology? Yes
Electrical Conversion Efficiency= 27.76%
PU 218.5 (a) Efficiency = 54%
PU 218.5 (b) Efficiency = 44.2%
Capacity Factors
Waste Heat Utilization Worksheet (Estimated) 60.7%
Actual Capacity Factor in 2003 Not Available
Actual Capacity Factor in 2004 17.3%
Actual Capacity Factor in 2005 12.3%
Heat Recovery Rate(kBTU/kWh)
Waste Heat Utilization Worksheet (Estimated) 2.7
Actual Heat Recovery Rate in 2003 Not Available
Actual Heat Recovery Rate in 2004 4.5
Actual Heat Recovery Rate in 2005 5.7
2. Is thermal efficiency correct based on technology? Yes
4. Conclusion
Site was shut down from Aug 1 due to high natural gas prices.
System has good heat recovery rate while operating.
Good Performer
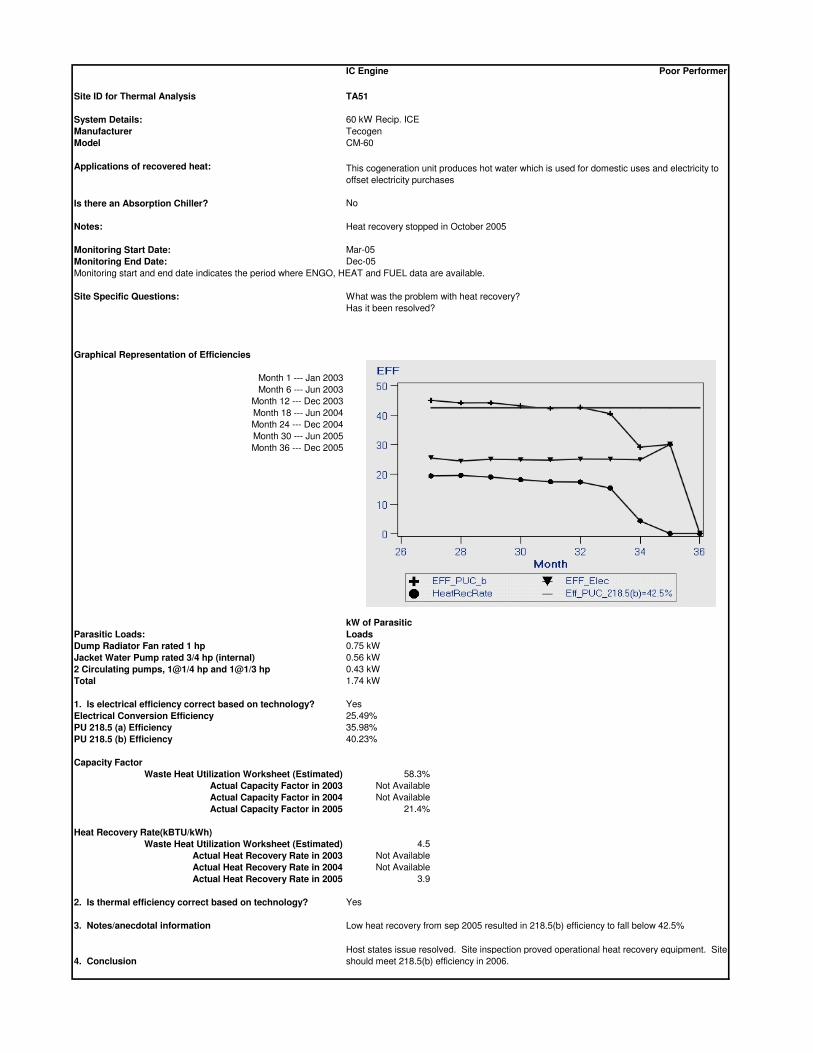
IC Engine Poor Performer
Site ID for Thermal Analysis TA51
System Details: 60 kW Recip. ICE
Manufacturer Tecogen
Model CM-60
Applications of recovered heat:
Is there an Absorption Chiller? No
Notes:
Monitoring Start Date: Mar-05
Monitoring End Date: Dec-05
Monitoring start and end date indicates the period where ENGO, HEAT and FUEL data are available.
Site Specific Questions:
Graphical Representation of Efficiencies
Month 1 --- Jan 2003
Month 6 --- Jun 2003
Month 12 --- Dec 2003
Month 18 --- Jun 2004
Month 24 --- Dec 2004
Month 30 --- Jun 2005
Month 36 --- Dec 2005
Parasitic Loads:
kW of Parasitic
Loads
Dump Radiator Fan rated 1 hp 0.75 kW
Jacket Water Pump rated 3/4 hp (internal) 0.56 kW
2 Circulating pumps, 1@1/4 hp and 1@1/3 hp 0.43 kW
Total 1.74 kW
1. Is electrical efficiency correct based on technology? Yes
Electrical Conversion Efficiency 25.49%
PU 218.5 (a) Efficiency 35.98%
PU 218.5 (b) Efficiency 40.23%
Capacity Factor
Waste Heat Utilization Worksheet (Estimated) 58.3%
Actual Capacity Factor in 2003 Not Available
Actual Capacity Factor in 2004 Not Available
Actual Capacity Factor in 2005 21.4%
Heat Recovery Rate(kBTU/kWh)
Waste Heat Utilization Worksheet (Estimated) 4.5
Actual Heat Recovery Rate in 2003 Not Available
Actual Heat Recovery Rate in 2004 Not Available
Actual Heat Recovery Rate in 2005 3.9
2. Is thermal efficiency correct based on technology? Yes
3. Notes/anecdotal information
4. Conclusion
Host states issue resolved. Site inspection proved operational heat recovery equipment. Site
should meet 218.5(b) efficiency in 2006.
Heat recovery stopped in October 2005
This cogeneration unit produces hot water which is used for domestic uses and electricity to
offset electricity purchases
What was the problem with heat recovery?
Has it been resolved?
Low heat recovery from sep 2005 resulted in 218.5(b) efficiency to fall below 42.5%
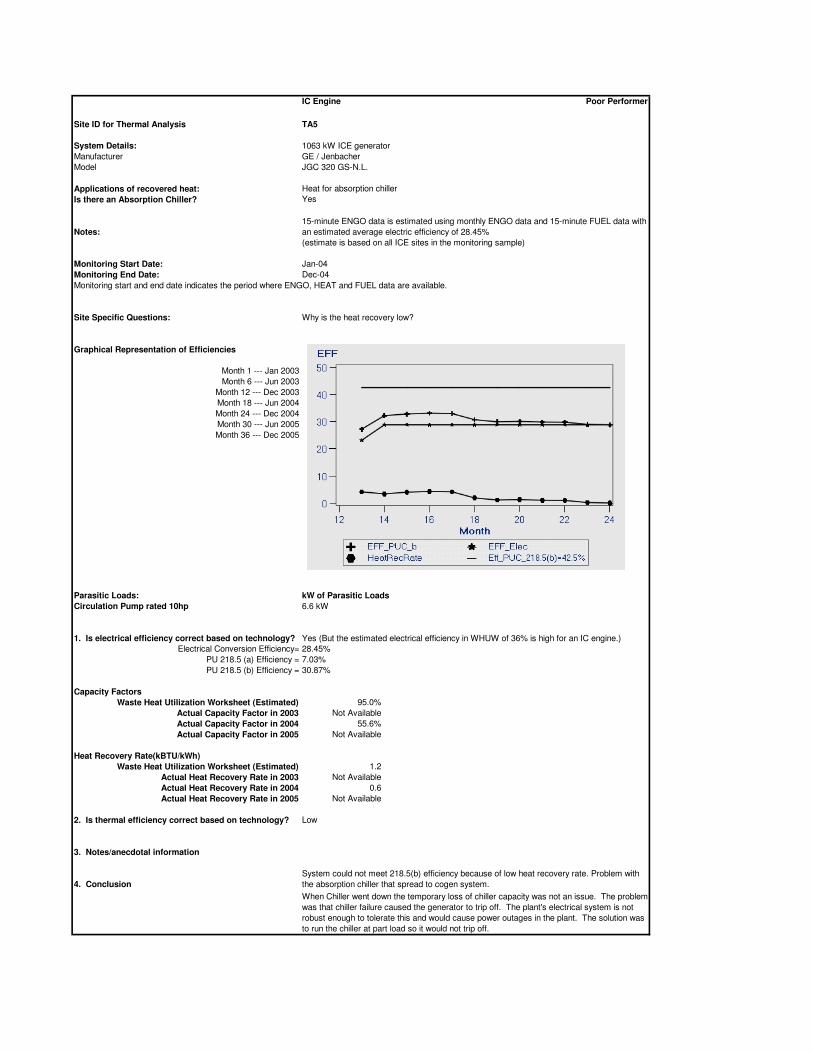
IC Engine Poor Performer
Site ID for Thermal Analysis TA5
System Details:
Manufacturer GE / Jenbacher
Model JGC 320 GS-N.L.
Applications of recovered heat:
Is there an Absorption Chiller? Yes
Notes:
Monitoring Start Date: Jan-04
Monitoring End Date: Dec-04
Monitoring start and end date indicates the period where ENGO, HEAT and FUEL data are available.
Site Specific Questions:
Graphical Representation of Efficiencies
Month 1 --- Jan 2003
Month 6 --- Jun 2003
Month 12 --- Dec 2003
Month 18 --- Jun 2004
Month 24 --- Dec 2004
Month 30 --- Jun 2005
Month 36 --- Dec 2005
Parasitic Loads: kW of Parasitic Loads
Circulation Pump rated 10hp 6.6 kW
1. Is electrical efficiency correct based on technology?
Electrical Conversion Efficiency= 28.45%
PU 218.5 (a) Efficiency = 7.03%
PU 218.5 (b) Efficiency = 30.87%
Capacity Factors
Waste Heat Utilization Worksheet (Estimated) 95.0%
Actual Capacity Factor in 2003 Not Available
Actual Capacity Factor in 2004 55.6%
Actual Capacity Factor in 2005 Not Available
Heat Recovery Rate(kBTU/kWh)
Waste Heat Utilization Worksheet (Estimated) 1.2
Actual Heat Recovery Rate in 2003 Not Available
Actual Heat Recovery Rate in 2004 0.6
Actual Heat Recovery Rate in 2005 Not Available
2. Is thermal efficiency correct based on technology? Low
3. Notes/anecdotal information
4. Conclusion
1063 kW ICE generator
Heat for absorption chiller
15-minute ENGO data is estimated using monthly ENGO data and 15-minute FUEL data with
an estimated average electric efficiency of 28.45%
(estimate is based on all ICE sites in the monitoring sample)
When Chiller went down the temporary loss of chiller capacity was not an issue. The problem
was that chiller failure caused the generator to trip off. The plant's electrical system is not
robust enough to tolerate this and would cause power outages in the plant. The solution was
to run the chiller at part load so it would not trip off.
Why is the heat recovery low?
Yes (But the estimated electrical efficiency in WHUW of 36% is high for an IC engine.)
System could not meet 218.5(b) efficiency because of low heat recovery rate. Problem with
the absorption chiller that spread to cogen system.
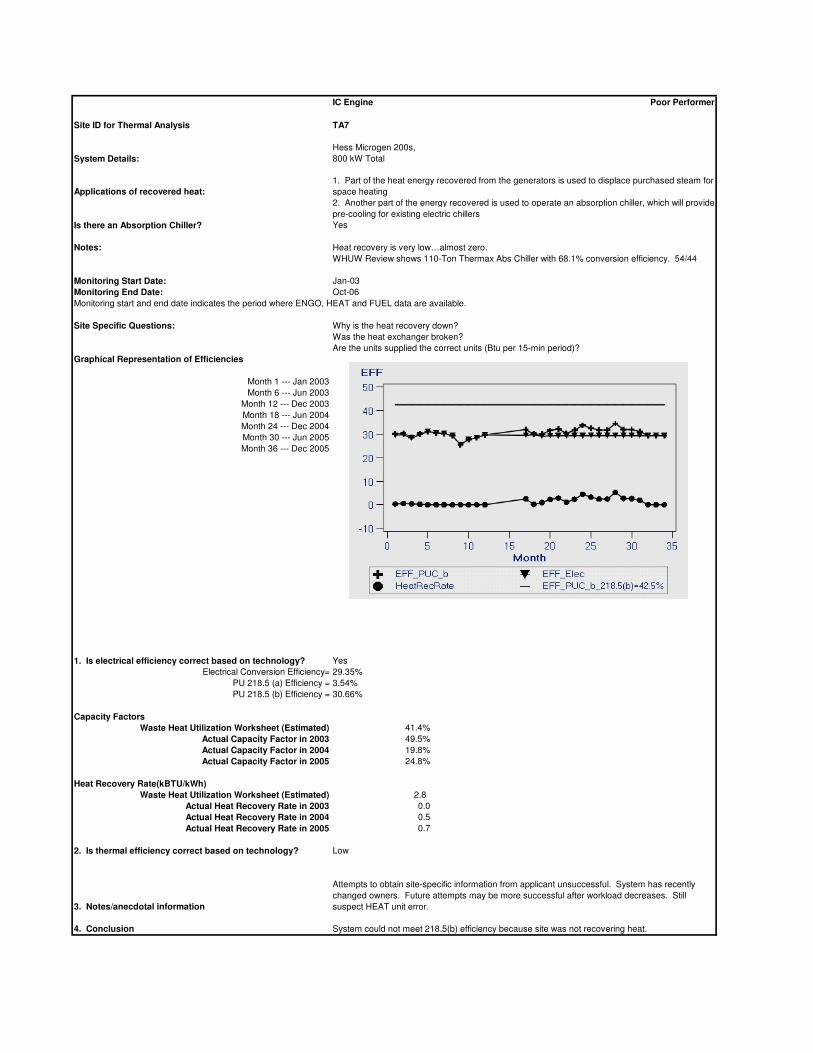
IC Engine Poor Performer
Site ID for Thermal Analysis TA7
System Details:
Hess Microgen 200s,
800 kW Total
Applications of recovered heat:
Is there an Absorption Chiller? Yes
Notes:
Monitoring Start Date: Jan-03
Monitoring End Date: Oct-06
Monitoring start and end date indicates the period where ENGO, HEAT and FUEL data are available.
Site Specific Questions:
Graphical Representation of Efficiencies
Month 1 --- Jan 2003
Month 6 --- Jun 2003
Month 12 --- Dec 2003
Month 18 --- Jun 2004
Month 24 --- Dec 2004
Month 30 --- Jun 2005
Month 36 --- Dec 2005
1. Is electrical efficiency correct based on technology? Yes
Electrical Conversion Efficiency= 29.35%
PU 218.5 (a) Efficiency = 3.54%
PU 218.5 (b) Efficiency = 30.66%
Capacity Factors
Waste Heat Utilization Worksheet (Estimated) 41.4%
Actual Capacity Factor in 2003 49.5%
Actual Capacity Factor in 2004 19.8%
Actual Capacity Factor in 2005 24.8%
Heat Recovery Rate(kBTU/kWh)
Waste Heat Utilization Worksheet (Estimated) 2.8
Actual Heat Recovery Rate in 2003 0.0
Actual Heat Recovery Rate in 2004 0.5
Actual Heat Recovery Rate in 2005 0.7
2. Is thermal efficiency correct based on technology? Low
3. Notes/anecdotal information
4. Conclusion
1. Part of the heat energy recovered from the generators is used to displace purchased steam for
space heating
2. Another part of the energy recovered is used to operate an absorption chiller, which will provide
pre-cooling for existing electric chillers
Why is the heat recovery down?
Are the units supplied the correct units (Btu per 15-min period)?
System could not meet 218.5(b) efficiency because site was not recovering heat.
Was the heat exchanger broken?
WHUW Review shows 110-Ton Thermax Abs Chiller with 68.1% conversion efficiency. 54/44
Heat recovery is very low…almost zero.
Attempts to obtain site-specific information from applicant unsuccessful. System has recently
changed owners. Future attempts may be more successful after workload decreases. Still
suspect HEAT unit error.

IC Engine Poor Performer
Site ID for Thermal Analysis TA28
System Details: ICN Caterpillar 395kW
Manufacturer Caterpillar
Model 63412 SITA
Applications of recovered heat: Reciprocating engine used to provide hot water to an absorption chiller.
Used for process heating.
Is there an Absorption Chiller? Yes
Notes: Aquamar is unable to meet 218.5(b) efficiency because of low heat recovery.
They recover 28% of the total heat that is available.
They dump excess heat through heat dump radiator.
From Dec 2005, Heat recovery rate is zero.
Monitoring Start Date: Jun-05
Monitoring End Date: Jan-06
Monitoring start and end date indicates the period where ENGO, HEAT and FUEL data are available.
Site Specific Questions:
Graphical Representation of Efficiencies
Month 1 --- Jan 2003
Month 6 --- Jun 2003
Month 12 --- Dec 2003
Month 18 --- Jun 2004
Month 24 --- Dec 2004
Month 30 --- Jun 2005
Month 36 --- Dec 2005
1. Is electrical efficiency correct based on technology? Yes(Little low)
Electrical Conversion Efficiency= 24.42%
PU 218.5 (a) Efficiency = 5.49%
PU 218.5 (b) Efficiency = 27.77%
Capacity Factors
Waste Heat Utilization Worksheet (Estimated) 85.8%
Actual Capacity Factor in 2003 Not Available
Actual Capacity Factor in 2004 Not Available
Actual Capacity Factor in 2005 32.1%
Heat Recovery Rate(kBTU/kWh)
Waste Heat Utilization Worksheet (Estimated) 6.4
Actual Heat Recovery Rate in 2003 Not Available
Actual Heat Recovery Rate in 2004 Not Available
Actual Heat Recovery Rate in 2005 0.9
2. Is thermal efficiency correct based on technology? Low
3. Notes/anecdotal information
4. Conclusion
Why is the heat recovery low compared to the estimated thermal load.
Was the heat exchanger broken?
System was recently repiped and per HOST should perform better in future. This should be verified.
System could not meet 218.5(b) efficiency because of low heat recovery. They recover only 28% of the
total waste heat available.
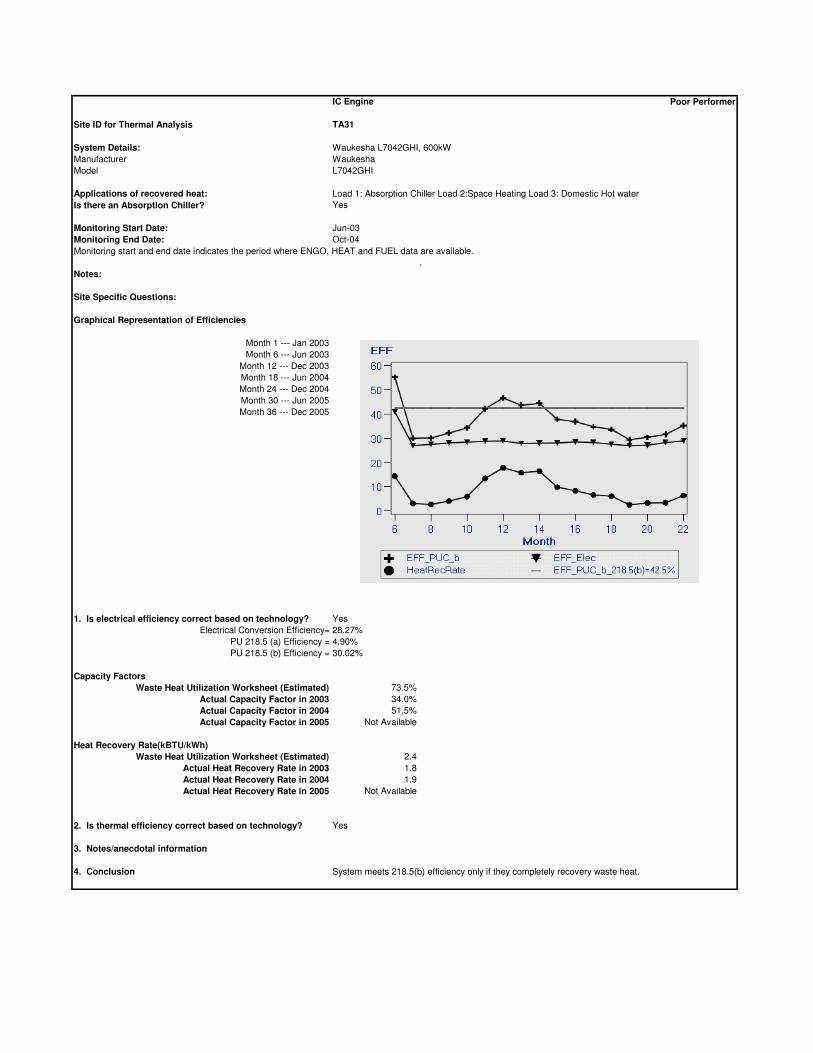
IC Engine Poor Performer
Site ID for Thermal Analysis TA31
System Details:
Manufacturer Waukesha
Model L7042GHI
Applications of recovered heat:
Is there an Absorption Chiller? Yes
Monitoring Start Date: Jun-03
Monitoring End Date: Oct-04
Monitoring start and end date indicates the period where ENGO, HEAT and FUEL data are available.
.
Notes:
Site Specific Questions:
Graphical Representation of Efficiencies
Month 1 --- Jan 2003
Month 6 --- Jun 2003
Month 12 --- Dec 2003
Month 18 --- Jun 2004
Month 24 --- Dec 2004
Month 30 --- Jun 2005
Month 36 --- Dec 2005
1. Is electrical efficiency correct based on technology? Yes
Electrical Conversion Efficiency= 28.27%
PU 218.5 (a) Efficiency = 4.90%
PU 218.5 (b) Efficiency = 30.02%
Capacity Factors
Waste Heat Utilization Worksheet (Estimated) 73.5%
Actual Capacity Factor in 2003 34.0%
Actual Capacity Factor in 2004 51.5%
Actual Capacity Factor in 2005 Not Available
Heat Recovery Rate(kBTU/kWh)
Waste Heat Utilization Worksheet (Estimated) 2.4
Actual Heat Recovery Rate in 2003 1.8
Actual Heat Recovery Rate in 2004 1.9
Actual Heat Recovery Rate in 2005 Not Available
2. Is thermal efficiency correct based on technology? Yes
3. Notes/anecdotal information
4. Conclusion
Load 1: Absorption Chiller Load 2:Space Heating Load 3: Domestic Hot water
System meets 218.5(b) efficiency only if they completely recovery waste heat.
Waukesha L7042GHI, 600kW
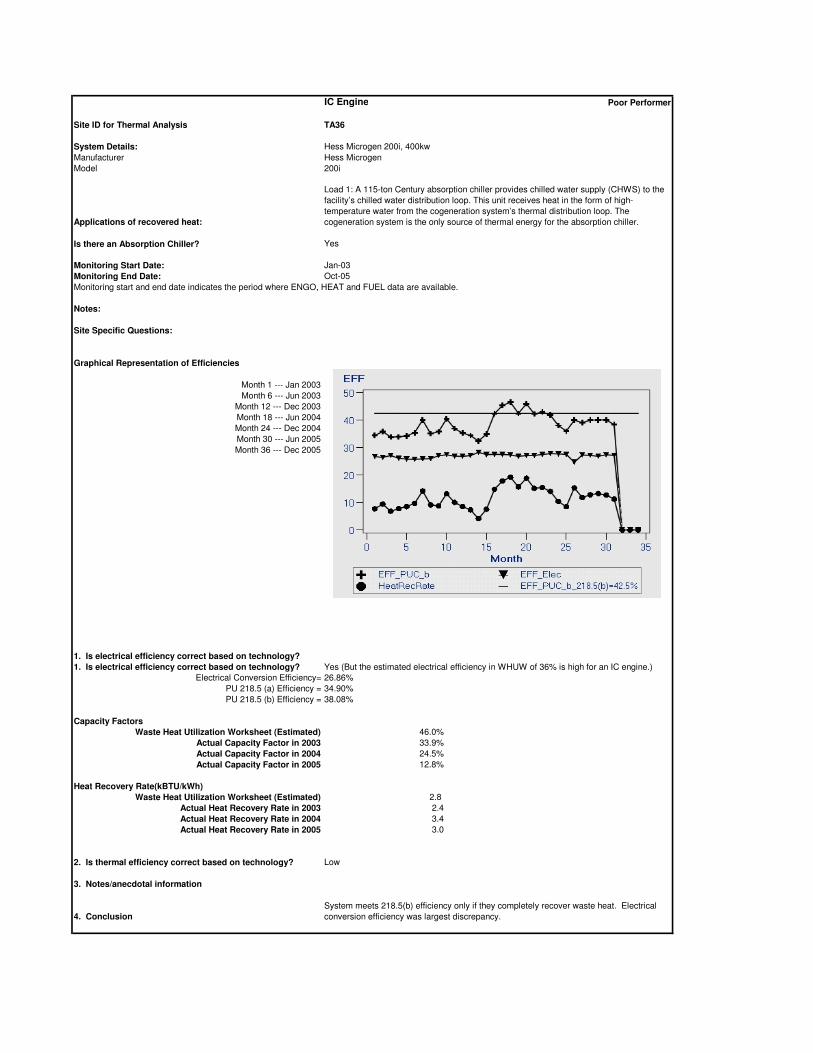
IC Engine Poor Performer
Site ID for Thermal Analysis TA36
System Details: Hess Microgen 200i, 400kw
Manufacturer Hess Microgen
Model 200i
Applications of recovered heat:
Is there an Absorption Chiller? Yes
Monitoring Start Date: Jan-03
Monitoring End Date: Oct-05
Monitoring start and end date indicates the period where ENGO, HEAT and FUEL data are available.
Notes:
Site Specific Questions:
Graphical Representation of Efficiencies
Month 1 --- Jan 2003
Month 6 --- Jun 2003
Month 12 --- Dec 2003
Month 18 --- Jun 2004
Month 24 --- Dec 2004
Month 30 --- Jun 2005
Month 36 --- Dec 2005
1. Is electrical efficiency correct based on technology?
1. Is electrical efficiency correct based on technology?
Electrical Conversion Efficiency= 26.86%
PU 218.5 (a) Efficiency = 34.90%
PU 218.5 (b) Efficiency = 38.08%
Capacity Factors
Waste Heat Utilization Worksheet (Estimated) 46.0%
Actual Capacity Factor in 2003 33.9%
Actual Capacity Factor in 2004 24.5%
Actual Capacity Factor in 2005 12.8%
Heat Recovery Rate(kBTU/kWh)
Waste Heat Utilization Worksheet (Estimated) 2.8
Actual Heat Recovery Rate in 2003 2.4
Actual Heat Recovery Rate in 2004 3.4
Actual Heat Recovery Rate in 2005 3.0
2. Is thermal efficiency correct based on technology? Low
3. Notes/anecdotal information
4. Conclusion
Load 1: A 115-ton Century absorption chiller provides chilled water supply (CHWS) to the
facility’s chilled water distribution loop. This unit receives heat in the form of high-
temperature water from the cogeneration system’s thermal distribution loop. The
cogeneration system is the only source of thermal energy for the absorption chiller.
System meets 218.5(b) efficiency only if they completely recover waste heat. Electrical
conversion efficiency was largest discrepancy.
Yes (But the estimated electrical efficiency in WHUW of 36% is high for an IC engine.)
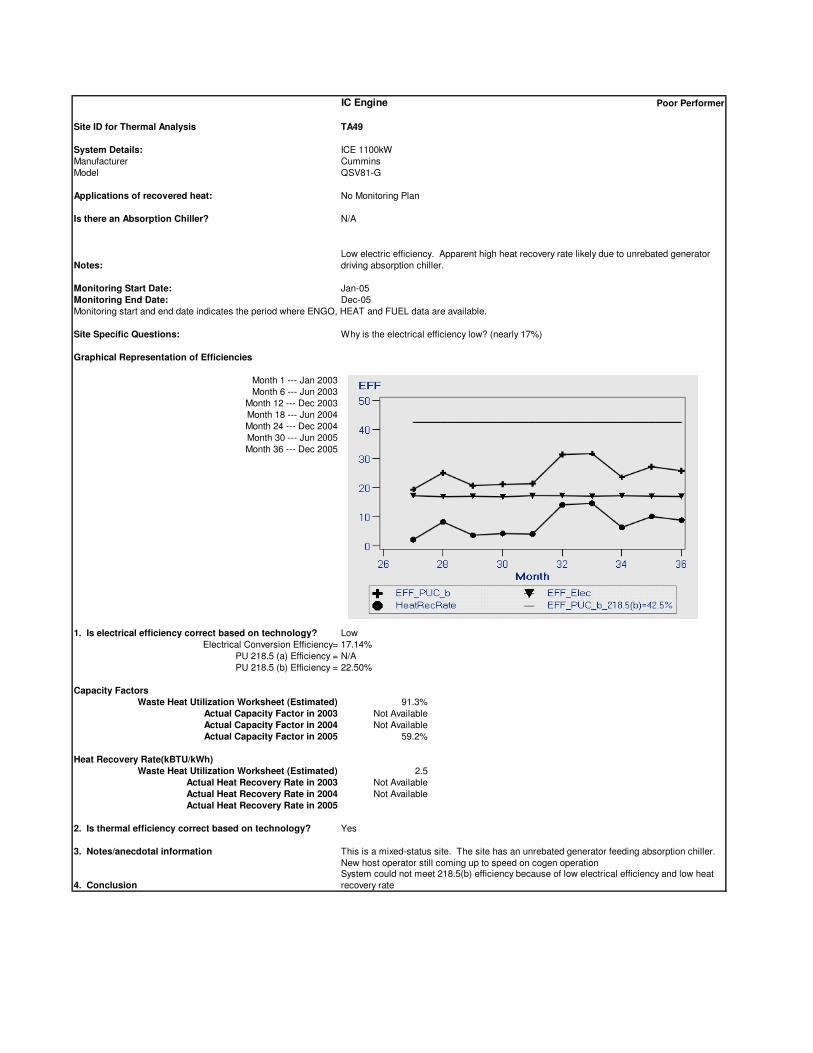
IC Engine Poor Performer
Site ID for Thermal Analysis TA49
System Details: ICE 1100kW
Manufacturer Cummins
Model QSV81-G
Applications of recovered heat:
Is there an Absorption Chiller? N/A
Notes:
Monitoring Start Date: Jan-05
Monitoring End Date: Dec-05
Monitoring start and end date indicates the period where ENGO, HEAT and FUEL data are available.
Site Specific Questions:
Graphical Representation of Efficiencies
Month 1 --- Jan 2003
Month 6 --- Jun 2003
Month 12 --- Dec 2003
Month 18 --- Jun 2004
Month 24 --- Dec 2004
Month 30 --- Jun 2005
Month 36 --- Dec 2005
1. Is electrical efficiency correct based on technology? Low
Electrical Conversion Efficiency= 17.14%
PU 218.5 (a) Efficiency = N/A
PU 218.5 (b) Efficiency = 22.50%
Capacity Factors
Waste Heat Utilization Worksheet (Estimated) 91.3%
Actual Capacity Factor in 2003 Not Available
Actual Capacity Factor in 2004 Not Available
Actual Capacity Factor in 2005 59.2%
Heat Recovery Rate(kBTU/kWh)
Waste Heat Utilization Worksheet (Estimated) 2.5
Actual Heat Recovery Rate in 2003 Not Available
Actual Heat Recovery Rate in 2004 Not Available
Actual Heat Recovery Rate in 2005
2. Is thermal efficiency correct based on technology? Yes
3. Notes/anecdotal information
4. Conclusion
Why is the electrical efficiency low? (nearly 17%)
System could not meet 218.5(b) efficiency because of low electrical efficiency and low heat
recovery rate
No Monitoring Plan
Low electric efficiency. Apparent high heat recovery rate likely due to unrebated generator
driving absorption chiller.
This is a mixed-status site. The site has an unrebated generator feeding absorption chiller.
New host operator still coming up to speed on cogen operation

Microturbines
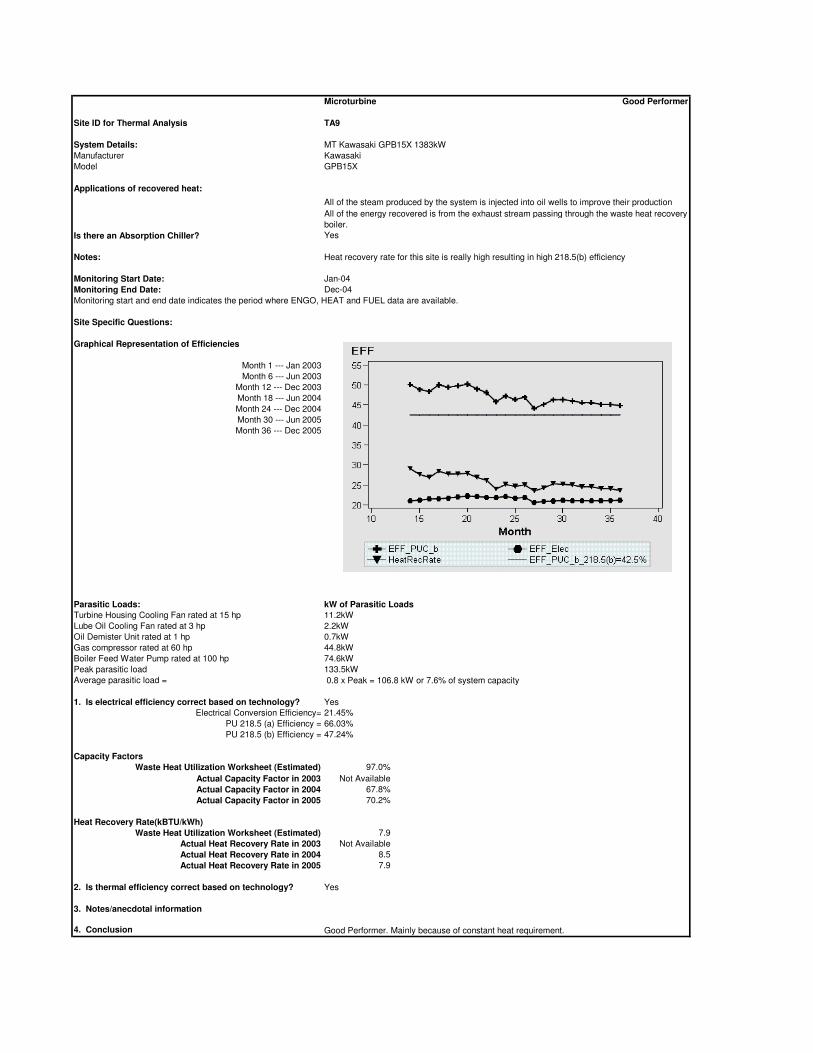
Microturbine Good Performer
Site ID for Thermal Analysis TA9
System Details:
Manufacturer Kawasaki
Model GPB15X
Applications of recovered heat:
Is there an Absorption Chiller? Yes
Notes:
Monitoring Start Date: Jan-04
Monitoring End Date: Dec-04
Monitoring start and end date indicates the period where ENGO, HEAT and FUEL data are available.
Site Specific Questions:
Graphical Representation of Efficiencies
Month 1 --- Jan 2003
Month 6 --- Jun 2003
Month 12 --- Dec 2003
Month 18 --- Jun 2004
Month 24 --- Dec 2004
Month 30 --- Jun 2005
Month 36 --- Dec 2005
Parasitic Loads: kW of Parasitic Loads
Turbine Housing Cooling Fan rated at 15 hp 11.2kW
Lube Oil Cooling Fan rated at 3 hp 2.2kW
Oil Demister Unit rated at 1 hp 0.7kW
Gas compressor rated at 60 hp 44.8kW
Boiler Feed Water Pump rated at 100 hp 74.6kW
Peak parasitic load 133.5kW
Average parasitic load =
1. Is electrical efficiency correct based on technology? Yes
Electrical Conversion Efficiency= 21.45%
PU 218.5 (a) Efficiency = 66.03%
PU 218.5 (b) Efficiency = 47.24%
Capacity Factors
Waste Heat Utilization Worksheet (Estimated) 97.0%
Actual Capacity Factor in 2003 Not Available
Actual Capacity Factor in 2004 67.8%
Actual Capacity Factor in 2005 70.2%
Heat Recovery Rate(kBTU/kWh)
Waste Heat Utilization Worksheet (Estimated) 7.9
Actual Heat Recovery Rate in 2003 Not Available
Actual Heat Recovery Rate in 2004 8.5
Actual Heat Recovery Rate in 2005 7.9
2. Is thermal efficiency correct based on technology? Yes
3. Notes/anecdotal information
4. Conclusion Good Performer. Mainly because of constant heat requirement.
0.8 x Peak = 106.8 kW or 7.6% of system capacity
MT Kawasaki GPB15X 1383kW
All of the steam produced by the system is injected into oil wells to improve their production
All of the energy recovered is from the exhaust stream passing through the waste heat recovery
boiler.
Heat recovery rate for this site is really high resulting in high 218.5(b) efficiency
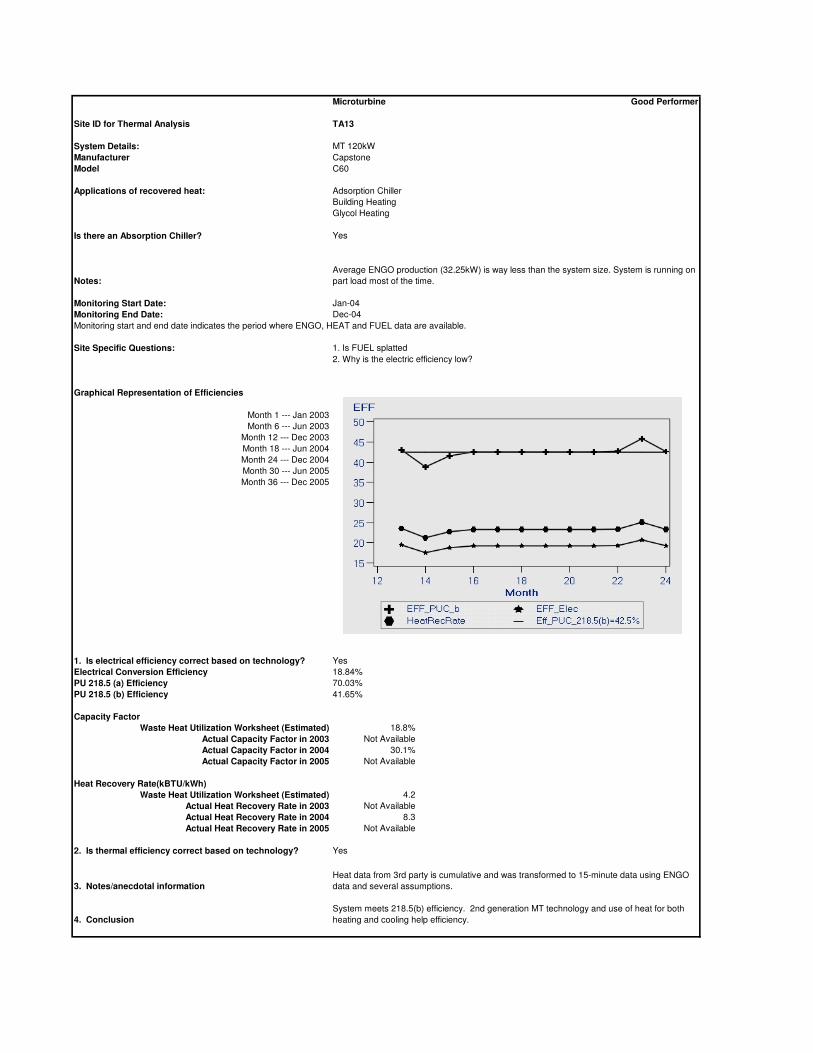
Microturbine Good Performer
Site ID for Thermal Analysis TA13
System Details: MT 120kW
Manufacturer Capstone
Model C60
Applications of recovered heat: Adsorption Chiller
Building Heating
Glycol Heating
Is there an Absorption Chiller? Yes
Notes:
Monitoring Start Date: Jan-04
Monitoring End Date: Dec-04
Monitoring start and end date indicates the period where ENGO, HEAT and FUEL data are available.
Site Specific Questions: 1. Is FUEL splatted
Graphical Representation of Efficiencies
Month 1 --- Jan 2003
Month 6 --- Jun 2003
Month 12 --- Dec 2003
Month 18 --- Jun 2004
Month 24 --- Dec 2004
Month 30 --- Jun 2005
Month 36 --- Dec 2005
1. Is electrical efficiency correct based on technology? Yes
Electrical Conversion Efficiency 18.84%
PU 218.5 (a) Efficiency 70.03%
PU 218.5 (b) Efficiency 41.65%
Capacity Factor
Waste Heat Utilization Worksheet (Estimated) 18.8%
Actual Capacity Factor in 2003 Not Available
Actual Capacity Factor in 2004 30.1%
Actual Capacity Factor in 2005 Not Available
Heat Recovery Rate(kBTU/kWh)
Waste Heat Utilization Worksheet (Estimated) 4.2
Actual Heat Recovery Rate in 2003 Not Available
Actual Heat Recovery Rate in 2004 8.3
Actual Heat Recovery Rate in 2005 Not Available
2. Is thermal efficiency correct based on technology? Yes
3. Notes/anecdotal information
4. Conclusion
Average ENGO production (32.25kW) is way less than the system size. System is running on
part load most of the time.
2. Why is the electric efficiency low?
System meets 218.5(b) efficiency. 2nd generation MT technology and use of heat for both
heating and cooling help efficiency.
Heat data from 3rd party is cumulative and was transformed to 15-minute data using ENGO
data and several assumptions.
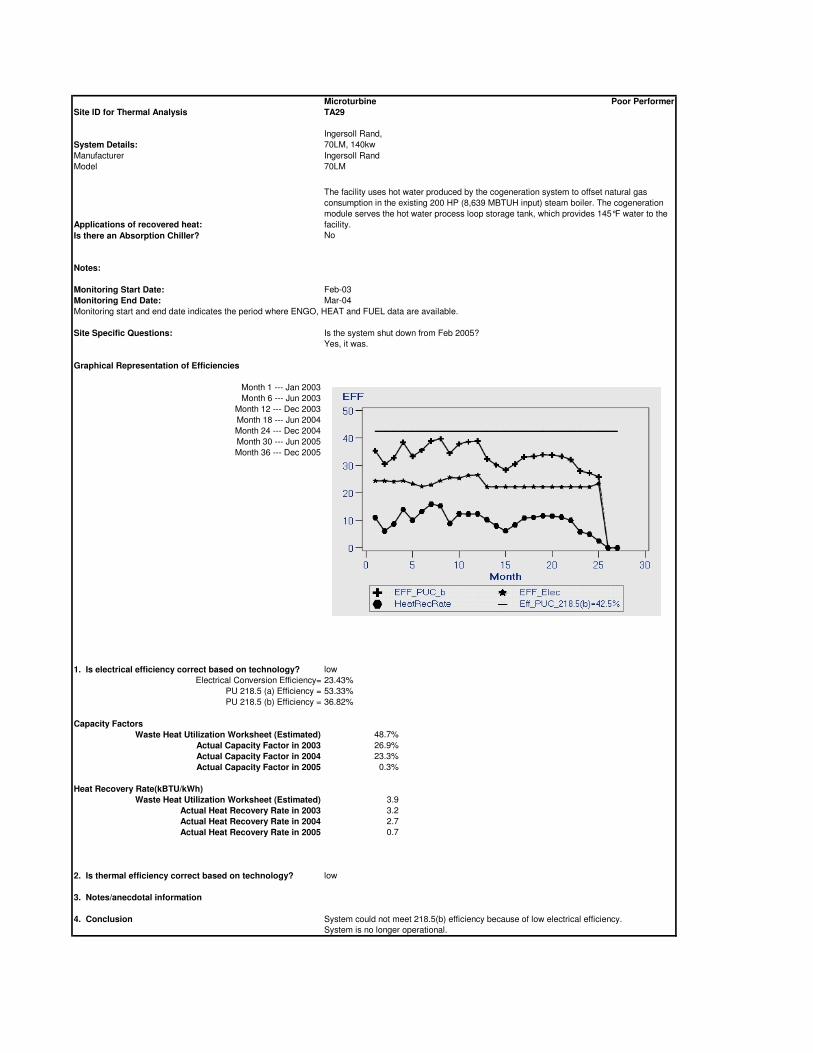
Microturbine Poor Performer
Site ID for Thermal Analysis TA29
System Details:
Ingersoll Rand,
70LM, 140kw
Manufacturer Ingersoll Rand
Model 70LM
Applications of recovered heat:
Is there an Absorption Chiller? No
Notes:
Monitoring Start Date: Feb-03
Monitoring End Date: Mar-04
Monitoring start and end date indicates the period where ENGO, HEAT and FUEL data are available.
Site Specific Questions:
Yes, it was.
Graphical Representation of Efficiencies
Month 1 --- Jan 2003
Month 6 --- Jun 2003
Month 12 --- Dec 2003
Month 18 --- Jun 2004
Month 24 --- Dec 2004
Month 30 --- Jun 2005
Month 36 --- Dec 2005
1. Is electrical efficiency correct based on technology? low
Electrical Conversion Efficiency= 23.43%
PU 218.5 (a) Efficiency = 53.33%
PU 218.5 (b) Efficiency = 36.82%
Capacity Factors
Waste Heat Utilization Worksheet (Estimated) 48.7%
Actual Capacity Factor in 2003 26.9%
Actual Capacity Factor in 2004 23.3%
Actual Capacity Factor in 2005 0.3%
Heat Recovery Rate(kBTU/kWh)
Waste Heat Utilization Worksheet (Estimated) 3.9
Actual Heat Recovery Rate in 2003 3.2
Actual Heat Recovery Rate in 2004 2.7
Actual Heat Recovery Rate in 2005 0.7
2. Is thermal efficiency correct based on technology? low
3. Notes/anecdotal information
4. Conclusion
The facility uses hot water produced by the cogeneration system to offset natural gas
consumption in the existing 200 HP (8,639 MBTUH input) steam boiler. The cogeneration
module serves the hot water process loop storage tank, which provides 145°F water to the
facility.
System could not meet 218.5(b) efficiency because of low electrical efficiency.
Is the system shut down from Feb 2005?
System is no longer operational.
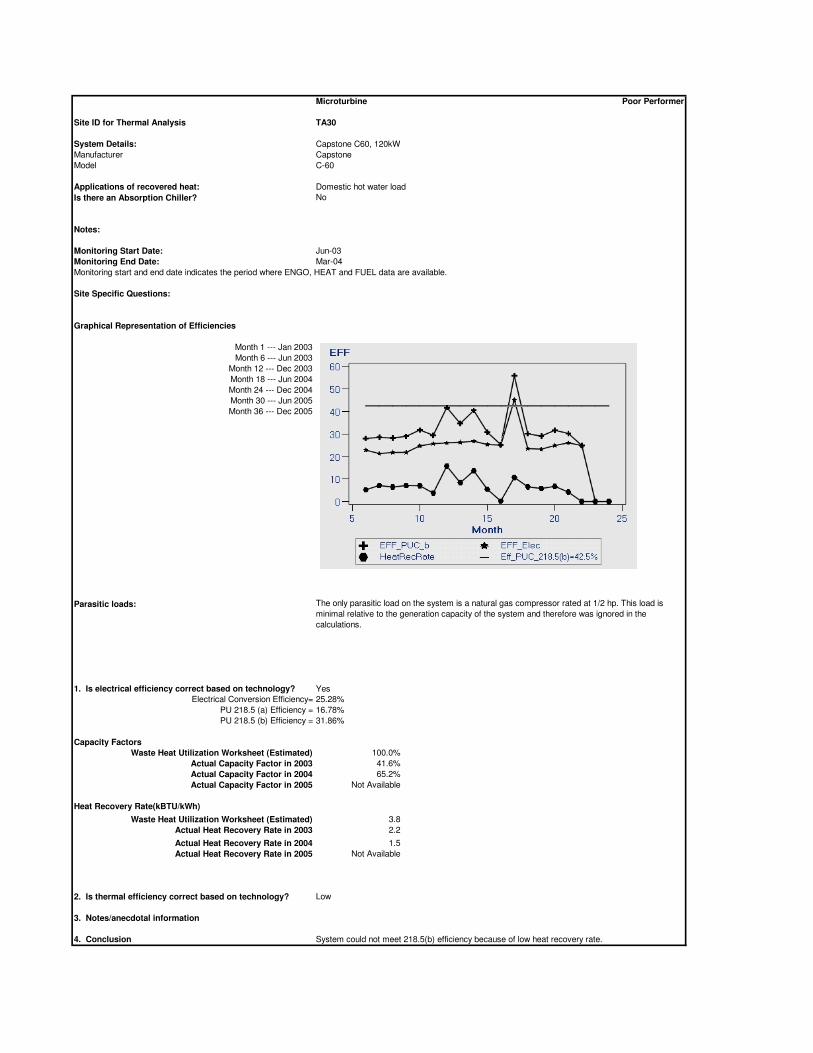
Microturbine Poor Performer
Site ID for Thermal Analysis TA30
System Details:
Manufacturer Capstone
Model C-60
Applications of recovered heat:
Is there an Absorption Chiller? No
Notes:
Monitoring Start Date: Jun-03
Monitoring End Date: Mar-04
Monitoring start and end date indicates the period where ENGO, HEAT and FUEL data are available.
Site Specific Questions:
Graphical Representation of Efficiencies
Month 1 --- Jan 2003
Month 6 --- Jun 2003
Month 12 --- Dec 2003
Month 18 --- Jun 2004
Month 24 --- Dec 2004
Month 30 --- Jun 2005
Month 36 --- Dec 2005
Parasitic loads:
1. Is electrical efficiency correct based on technology?
Electrical Conversion Efficiency= 25.28%
PU 218.5 (a) Efficiency = 16.78%
PU 218.5 (b) Efficiency = 31.86%
Capacity Factors
Waste Heat Utilization Worksheet (Estimated) 100.0%
Actual Capacity Factor in 2003 41.6%
Actual Capacity Factor in 2004 65.2%
Actual Capacity Factor in 2005 Not Available
Heat Recovery Rate(kBTU/kWh)
Waste Heat Utilization Worksheet (Estimated) 3.8
Actual Heat Recovery Rate in 2003 2.2
Actual Heat Recovery Rate in 2004 1.5
Actual Heat Recovery Rate in 2005 Not Available
2. Is thermal efficiency correct based on technology? Low
3. Notes/anecdotal information
4. Conclusion System could not meet 218.5(b) efficiency because of low heat recovery rate.
Capstone C60, 120kW
Domestic hot water load
The only parasitic load on the system is a natural gas compressor rated at 1/2 hp. This load is
minimal relative to the generation capacity of the system and therefore was ignored in the
calculations.
Yes

Microturbine Poor Performer
Site ID for Thermal Analysis TA32
System Details: 120kW Micro Turbine
Applications of recovered heat: Absorption chiller
Is there an Absorption Chiller? Yes
Notes:
ENGO
HEAT
FUEL
Monitoring Start Date: Dec-05
Monitoring End Date: Dec-04
Monitoring start and end date indicates the period where ENGO, HEAT and FUEL data are available.
Site Specific Questions:
Graphical Representation of Efficiencies
Month 1 --- Jan 2003
Month 6 --- Jun 2003
Month 12 --- Dec 2003
Month 18 --- Jun 2004
Month 24 --- Dec 2004
Month 30 --- Jun 2005
Month 36 --- Dec 2005
Parasitic Loads:
2 Natural Gas compressors 480 Volts / 3 phase 4 kW
1. Is electrical efficiency correct based on technology? Low
Electrical Conversion Efficiency= 23.22%
PU 218.5 (a) Efficiency = 48.99%
PU 218.5 (b) Efficiency = 39.25%
Capacity Factors
Waste Heat Utilization Worksheet (Estimated) 100.0%
Actual Capacity Factor in 2003 Not Available
Actual Capacity Factor in 2004 3.0%
Actual Capacity Factor in 2005 58.1%
Heat Recovery Rate(kBTU/kWh)
Waste Heat Utilization Worksheet (Estimated) 5.7
Actual Heat Recovery Rate in 2003 Not Available
Actual Heat Recovery Rate in 2004 0.1
Actual Heat Recovery Rate in 2005 5.0
2. Is thermal efficiency correct based on technology? Yes
3. Notes/anecdotal information
4. Conclusion
System meets 218.5(b) efficiency only if they completely recover waste heat. Heat recovery
was low in Jan and Feb 2005 because of failed refrigerator pump in absorption chiller.
System is running 24 hours and is recovering heat all the time.
Applicant and utility data are similar…we are using utility data
Reasonable heat recovery rate……lines up with system capacity
Utility fuel data did not pass validation checks. Secondary fuel data from applicant passed
validation checks and was utilized.
Note: The natural gas compressors are considered integral components of the “microturbines” rather than electric parasitic loads that would cause net generator
output to be different from gross generator output..
Why was the heat recovery low in Jan and Feb 2005?
Was the system broken?
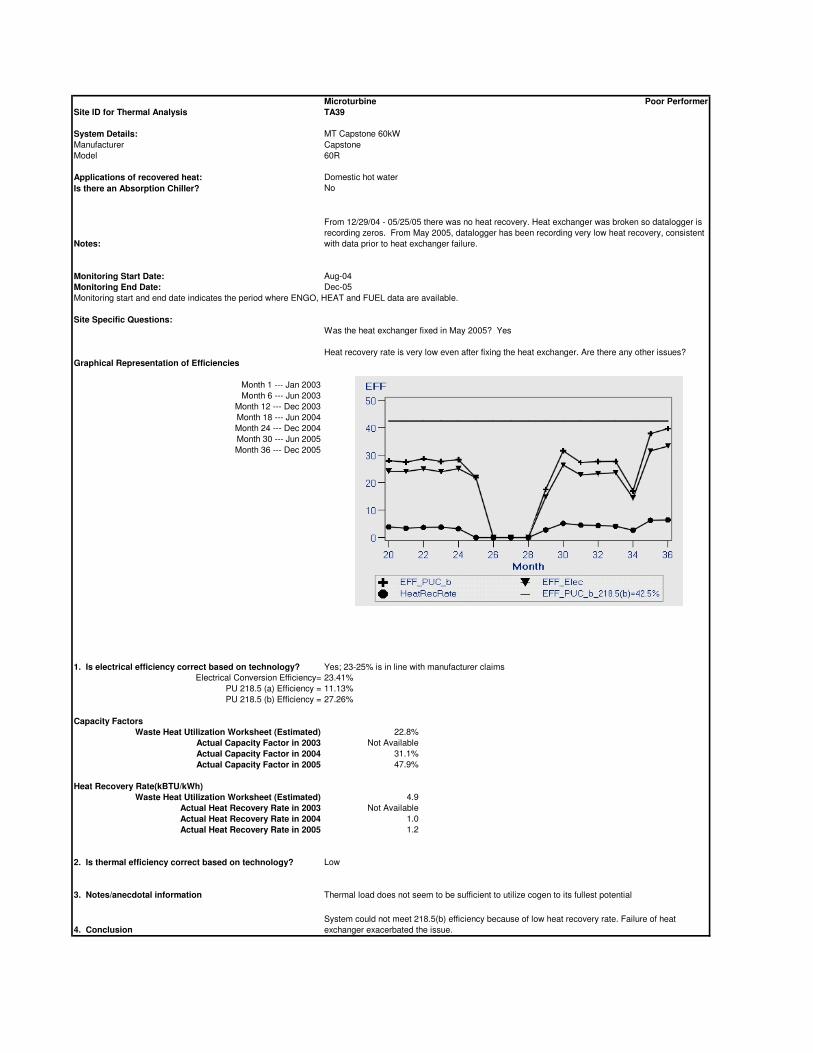
Microturbine Poor Performer
Site ID for Thermal Analysis TA39
System Details: MT Capstone 60kW
Manufacturer Capstone
Model 60R
Applications of recovered heat: Domestic hot water
Is there an Absorption Chiller? No
Notes:
Monitoring Start Date: Aug-04
Monitoring End Date: Dec-05
Monitoring start and end date indicates the period where ENGO, HEAT and FUEL data are available.
Site Specific Questions:
Graphical Representation of Efficiencies
Month 1 --- Jan 2003
Month 6 --- Jun 2003
Month 12 --- Dec 2003
Month 18 --- Jun 2004
Month 24 --- Dec 2004
Month 30 --- Jun 2005
Month 36 --- Dec 2005
1. Is electrical efficiency correct based on technology?
Electrical Conversion Efficiency= 23.41%
PU 218.5 (a) Efficiency = 11.13%
PU 218.5 (b) Efficiency = 27.26%
Capacity Factors
Waste Heat Utilization Worksheet (Estimated) 22.8%
Actual Capacity Factor in 2003 Not Available
Actual Capacity Factor in 2004 31.1%
Actual Capacity Factor in 2005 47.9%
Heat Recovery Rate(kBTU/kWh)
Waste Heat Utilization Worksheet (Estimated) 4.9
Actual Heat Recovery Rate in 2003 Not Available
Actual Heat Recovery Rate in 2004 1.0
Actual Heat Recovery Rate in 2005 1.2
2. Is thermal efficiency correct based on technology? Low
3. Notes/anecdotal information
4. Conclusion
From 12/29/04 - 05/25/05 there was no heat recovery. Heat exchanger was broken so datalogger is
recording zeros. From May 2005, datalogger has been recording very low heat recovery, consistent
with data prior to heat exchanger failure.
System could not meet 218.5(b) efficiency because of low heat recovery rate. Failure of heat
exchanger exacerbated the issue.
Yes; 23-25% is in line with manufacturer claims
Heat recovery rate is very low even after fixing the heat exchanger. Are there any other issues?
Was the heat exchanger fixed in May 2005? Yes
Thermal load does not seem to be sufficient to utilize cogen to its fullest potential

Microturbine Poor Performer
Site ID for Thermal Analysis TA40
System Details: 60kW MicroTurbine
Manufacturer Tecogen
Model CM-60
Applications of recovered heat:
Is there an Absorption Chiller? No
Notes:
Monitoring Start Date: Jan-05
Monitoring End Date: Dec-06
Monitoring start and end date indicates the period where ENGO, HEAT and FUEL data are available.
Site Specific Questions:
Graphical Representation of Efficiencies
Month 1 --- Jan 2003
Month 6 --- Jun 2003
Month 12 --- Dec 2003
Month 18 --- Jun 2004
Month 24 --- Dec 2004
Month 30 --- Jun 2005
Month 36 --- Dec 2005
1. Is electrical efficiency correct based on technology?
Electrical Conversion Efficiency= 18.37%
PU 218.5 (a) Efficiency = 47.44%
PU 218.5 (b) Efficiency = 31.91%
Capacity Factors
Waste Heat Utilization Worksheet (Estimated) 45.7%
Actual Capacity Factor in 2003 Not Available
Actual Capacity Factor in 2004 Not Available
Actual Capacity Factor in 2005 Not Available
2. Is thermal efficiency correct based on technology?
Thermal Efficiency (kBTU/kWh)
Waste Heat Utilization Worksheet (Estimated) 4.3
Actual Heat Recovery Rate in 2003 Not Available
Actual Heat Recovery Rate in 2004 Not Available
Actual Heat Recovery Rate in 2005 Not Available
2. Is thermal efficiency correct based on technology? Yes
3. Notes/anecdotal information
4. Conclusion
Heat exchanger is in repair frequently. Issue may be chemicals from pool water.
Hot water from the Unifin heat exchanger is used to heat the swimming pool.
System could not meet 218.5(b) efficiency because of low electrical efficiency.
Recent discussion with host revealed that ENGO data may be inaccurate. Resolution from
host is pending. Data will be revisited once issue is resolved.
Has the heat exchanger been fixed?
Low
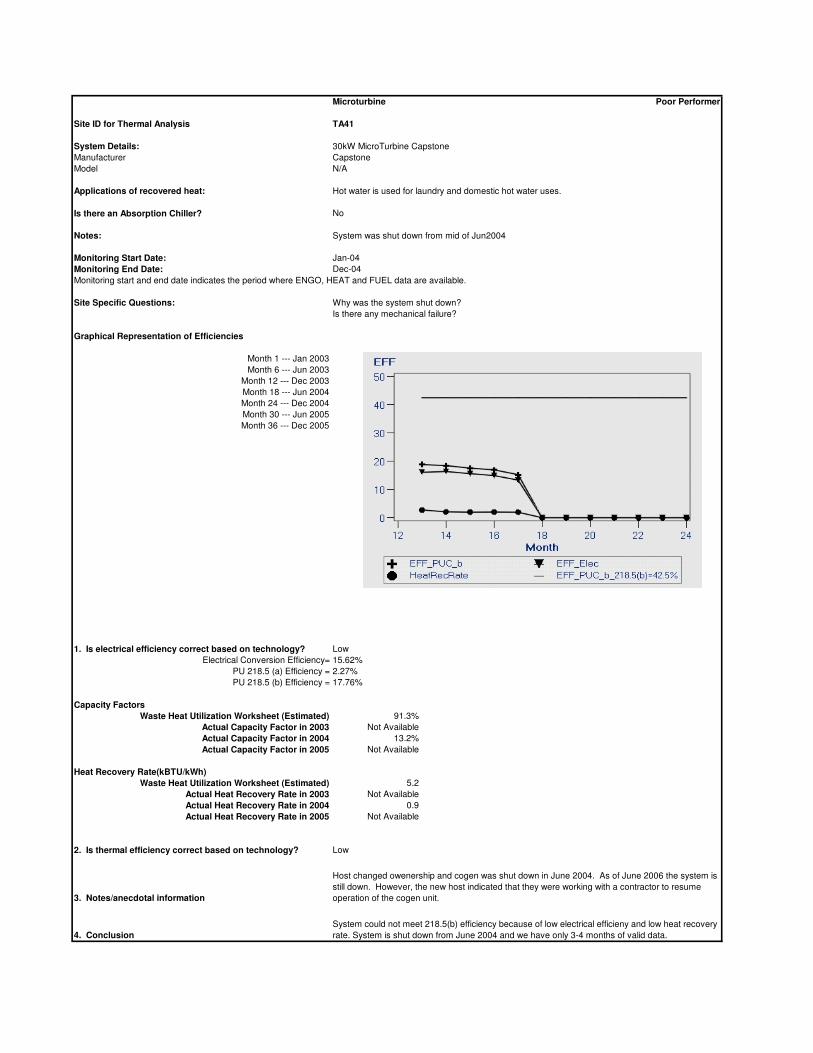
Microturbine Poor Performer
Site ID for Thermal Analysis TA41
System Details:
Manufacturer Capstone
Model N/A
Applications of recovered heat:
Is there an Absorption Chiller? No
Notes:
Monitoring Start Date: Jan-04
Monitoring End Date: Dec-04
Monitoring start and end date indicates the period where ENGO, HEAT and FUEL data are available.
Site Specific Questions:
Graphical Representation of Efficiencies
Month 1 --- Jan 2003
Month 6 --- Jun 2003
Month 12 --- Dec 2003
Month 18 --- Jun 2004
Month 24 --- Dec 2004
Month 30 --- Jun 2005
Month 36 --- Dec 2005
1. Is electrical efficiency correct based on technology? Low
Electrical Conversion Efficiency= 15.62%
PU 218.5 (a) Efficiency = 2.27%
PU 218.5 (b) Efficiency = 17.76%
Capacity Factors
Waste Heat Utilization Worksheet (Estimated) 91.3%
Actual Capacity Factor in 2003 Not Available
Actual Capacity Factor in 2004 13.2%
Actual Capacity Factor in 2005 Not Available
Heat Recovery Rate(kBTU/kWh)
Waste Heat Utilization Worksheet (Estimated) 5.2
Actual Heat Recovery Rate in 2003 Not Available
Actual Heat Recovery Rate in 2004 0.9
Actual Heat Recovery Rate in 2005 Not Available
2. Is thermal efficiency correct based on technology? Low
3. Notes/anecdotal information
4. Conclusion
System could not meet 218.5(b) efficiency because of low electrical efficieny and low heat recovery
rate. System is shut down from June 2004 and we have only 3-4 months of valid data.
Host changed owenership and cogen was shut down in June 2004. As of June 2006 the system is
still down. However, the new host indicated that they were working with a contractor to resume
operation of the cogen unit.
Hot water is used for laundry and domestic hot water uses.
30kW MicroTurbine Capstone
System was shut down from mid of Jun2004
Why was the system shut down?
Is there any mechanical failure?

Microturbine Poor Performer
Site ID for Thermal Analysis TA42
System Details:
Manufacturer Turbec
Model T100 CHP system
Applications of recovered heat:
Is there an Absorption Chiller? No
Notes:
Monitoring Start Date: Jan-03
Monitoring End Date: Jul-05
Monitoring start and end date indicates the period where ENGO, HEAT and FUEL data are available.
Graphical Representation of Efficiencies
Month 1 --- Jan 2003
Month 6 --- Jun 2003
Month 12 --- Dec 2003
Month 18 --- Jun 2004
Month 24 --- Dec 2004
Month 30 --- Jun 2005
Month 36 --- Dec 2005
1. Is electrical efficiency correct based on technology? Low
Electrical Conversion Efficiency= 24.68%
PU 218.5 (a) Efficiency = 19.68%
PU 218.5 (b) Efficiency = 35.20%
Capacity Factors
Waste Heat Utilization Worksheet (Estimated) 91.3%
Actual Capacity Factor in 2003 38.6%
Actual Capacity Factor in 2004 10.1%
Actual Capacity Factor in 2005 Not Available
Heat Recovery Rate(kBTU/kWh)
Waste Heat Utilization Worksheet (Estimated) 3.20625
Actual Heat Recovery Rate in 2003 2.8
Actual Heat Recovery Rate in 2004 2.9
Actual Heat Recovery Rate in 2005 Not Available
2. Is thermal efficiency correct based on technology? Low
3. Notes/anecdotal information
4. Conclusion
100kW Micro Turbine
During operating periods, system could not meet 218.5(b) efficiency because of low
electrical efficieny and low heat recovery rate.
Domestic Hot Water
System is shut down from 2005. It was shut down for some part of 2004.

Microturbine Poor Performer
Site ID for Thermal Analysis TA43
System Details: Bowman Turbogen TG80CG MTN 76.2kW
Manufacturer Bowman
Model Turbogen TG80CG
Applications of recovered heat: The system provides hot water to the laundry boiler
The system provides hot water to the domestic hot water system.
Is there an Absorption Chiller? No
Notes:
Monitoring Start Date: Feb-03
Monitoring End Date: Dec-05
Monitoring start and end date indicates the period where ENGO, HEAT and FUEL data are available.
Site Specific Questions:
Graphical Representation of Efficiencies
Month 1 --- Jan 2003
Month 6 --- Jun 2003
Month 12 --- Dec 2003
Month 18 --- Jun 2004
Month 24 --- Dec 2004
Month 30 --- Jun 2005
Month 36 --- Dec 2005
1. Is electrical efficiency correct based on technology? Yes(Little low)
Electrical Conversion Efficiency= 22.67%
PU 218.5 (a) Efficiency = 21.17%
PU 218.5 (b) Efficiency = 33.60%
Capacity Factors
Waste Heat Utilization Worksheet (Estimated) 91.3%
Actual Capacity Factor in 2003 69.7%
Actual Capacity Factor in 2004 52.6%
Actual Capacity Factor in 2005 26.9%
Heat Recovery Rate(kBTU/kWh)
Waste Heat Utilization Worksheet (Estimated) 6.1
Actual Heat Recovery Rate in 2003 3.0
Actual Heat Recovery Rate in 2004 3.4
Actual Heat Recovery Rate in 2005 3.8
2. Is thermal efficiency correct based on technology? Low
3. Notes/anecdotal information
4. Conclusion
System could not meet 218.5(b) efficiency because of low electrical efficieny and low
heat recovery rate. Low heat recovery rate is due to system design problem.
They have thermal load for around 4380 hrs annually whereas the cogen system
operates 8000 hrs.
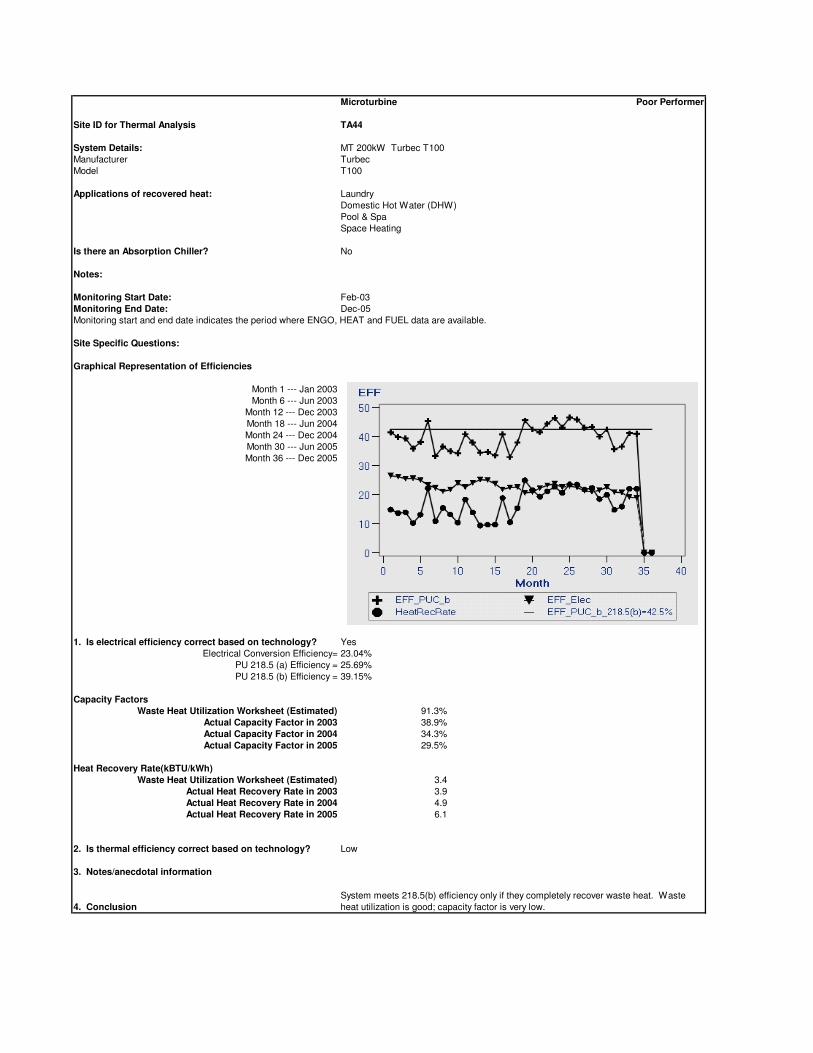
Microturbine Poor Performer
Site ID for Thermal Analysis TA44
System Details: MT 200kW Turbec T100
Manufacturer Turbec
Model T100
Applications of recovered heat: Laundry
Domestic Hot Water (DHW)
Pool & Spa
Space Heating
Is there an Absorption Chiller? No
Notes:
Monitoring Start Date: Feb-03
Monitoring End Date: Dec-05
Monitoring start and end date indicates the period where ENGO, HEAT and FUEL data are available.
Site Specific Questions:
Graphical Representation of Efficiencies
Month 1 --- Jan 2003
Month 6 --- Jun 2003
Month 12 --- Dec 2003
Month 18 --- Jun 2004
Month 24 --- Dec 2004
Month 30 --- Jun 2005
Month 36 --- Dec 2005
1. Is electrical efficiency correct based on technology? Yes
Electrical Conversion Efficiency= 23.04%
PU 218.5 (a) Efficiency = 25.69%
PU 218.5 (b) Efficiency = 39.15%
Capacity Factors
Waste Heat Utilization Worksheet (Estimated) 91.3%
Actual Capacity Factor in 2003 38.9%
Actual Capacity Factor in 2004 34.3%
Actual Capacity Factor in 2005 29.5%
Heat Recovery Rate(kBTU/kWh)
Waste Heat Utilization Worksheet (Estimated) 3.4
Actual Heat Recovery Rate in 2003 3.9
Actual Heat Recovery Rate in 2004 4.9
Actual Heat Recovery Rate in 2005 6.1
2. Is thermal efficiency correct based on technology? Low
3. Notes/anecdotal information
4. Conclusion
System meets 218.5(b) efficiency only if they completely recover waste heat. Waste
heat utilization is good; capacity factor is very low.


![Kinetic depth images: flexible generation of depth perceptionvarshney/papers/Bista_KineticDepth... · [11,26]. Another effect that gives the perception of depth is thestereokineticeffect(SKE).AlthoughSKEandKDEboth](https://img.pdfslide.us/doc/110x75/5f0f5b857e708231d443c26c/kinetic-depth-images-flexible-generation-of-depth-varshneypapersbistakineticdepth.jpg)