Embed Size (px)
Citation preview
Method for the generation of depth images for view-based shape retrieval of 3D CAD
model from partial point cloud
Hyungki Kim1,a, Moohyun Cha1,b, Duhwan Mun2,c*
1 Division of Computer Science and Engineering, Jeonbuk National University, 567 Baekje-
daero, Deokjin-gu, Jeonju-si, Jeollabuk-do 54896, Republic of Korea
2 Dept. of Precision Mechanical Engineering, Kyungpook National University,
2559, Gyeongsang-daero, Sangju, Gyeongsangbuk-do 37224, South Korea
[email protected], [email protected], [email protected]
* Corresponding Author, Tel: +82-54-530-1271, Fax: +82-54-530-1278
Abstract
A laser scanner can easily acquire the geometric data of physical environments in the form of
a point cloud. Recognizing objects from a point cloud is often required for industrial 3D
reconstruction, which should include not only geometry information but also semantic
information. However, recognition process is often a bottleneck in 3D reconstruction because
it requires expertise on domain knowledge and intensive labor. To address this problem, various
methods have been developed to recognize objects by retrieving the corresponding model in
the database from an input geometry query. In recent years, the technique of converting
geometric data into an image and applying view-based 3D shape retrieval has demonstrated
high accuracy. Depth image which encodes depth value as intensity of pixel is frequently used
for view-based 3D shape retrieval. However, geometric data collected from objects is often
incomplete due to the occlusions and the limit of line of sight. Image generated by occluded
point clouds lowers the performance of view-based 3D object retrieval due to loss of
information. In this paper, we propose a method of viewpoint and image resolution estimation
method for view-based 3D shape retrieval from point cloud query. Automatic selection of
viewpoint and image resolution by calculating the data acquisition rate and density from the
sampled viewpoints and image resolutions are proposed. The retrieval performance from the
images generated by the proposed method is experimented and compared for various dataset.
Additionally, view-based 3D shape retrieval performance with deep convolutional neural
network has been experimented with the proposed method.
Key words: Depth image; Image resolution selection; Point cloud; View-based 3D shape
retrieval; View point selection.
1. Introduction
Laser scanners has become a popular instrument for the 3D reconstruction of a large-scale
facility, process plant, cultural heritage building or in-door environment [1] in the as-built
condition. A 3D model is generated from the scanned data by collecting, pre-processing, and
3D shape modeling [2]. In the collection process, we obtain scanned data from different
locations on-site to acquire point clouds. Point clouds are filtered and registered in a single
coordinate system via pre-processing [3]. In the 3D shape modeling process, a 3D model with
high-level semantic information such as a building information model (BIM) [4] or 3D
computer-aided design (CAD) [5] is generated.
The aforementioned 3D model is generated as follows. First, points that share similar properties
are separated from the point cloud. We refer to the points as a segmented point cloud [6].
Subsequently, the segmented point cloud is compared with an information object such as a door,
window, or wall in the BIM or a pipe, valve, or flange in a plant 3D CAD system. The most
similar information object is selected to represent the segmented point cloud and the
information object itself is aligned and located in the 3D coordinate system.
As the point cloud consists of a list of 3D coordinates for points, we compare the segmented
point cloud with an information object in the BIM or the catalog library of plant 3D CAD
system from the viewpoint of similarity of shape and select the information object
corresponding to the segmented point cloud. Thus, a 3D shape retrieval method [7, 8] is
necessary such that, when the segmented point cloud is input as a query, the object that is the
most similar shape is retrieved.
The characteristics of a point cloud obtained from a large-scale facility such as a building or
process plant are as follows. First, it is difficult to acquire a point cloud for all the areas of the
facility owing to the limitation of line of sight (LOS), even though 3D scanning is performed
at multiple locations. Second, the density of points in the point cloud decreases as the distance
from the 3D scanner increases.
It is very likely that the segmented point cloud of a large-scale facility does not have the overall
shape of the object but only has a partial shape. Therefore, it is effective to apply a partial shape
descriptor-based method [11] rather than a global shape descriptor-based method [9,10] when
a segmented point cloud is input as a query and shape-based retrieval is performed to retrieve
information objects from a library database (database).
Recently, among various 3D object retrieval methods based on partial shape descriptors, the
view-based partial 3D shape retrieval such as [12], has achieved high retrieval accuracy. This
method extracts local image features from a 2D image obtained by rendering a 3D object and
compares the similarities of the extracted local features.
In view-based partial 3D shape retrieval, the viewpoint and image resolution should be known
when rendering a 2D image from a segmented point cloud. Depending on the viewpoint and
image resolution, the completeness of the 2D image varies. In general, the closer the rendering
viewpoint is to the scanning location, loss of geometry information in rendered image decreases.
However, as the information on the location of the 3D scanner is lost during processing,
registering, and segmenting point clouds acquired by scanning a large-scale facility, a method
for the automatic selection of viewpoint and image resolution is required.

In this paper, we propose a method for selecting the viewpoint and image resolution required
to apply view-based partial 3D object retrieval to the segmented point cloud obtained from
scanning a large-scale facility. In the proposed method, several depth images are rendered from
the sampled viewpoints and resolutions to calculate the acquisition rate and density for each
image. Subsequently, the method automatically selects the viewpoint and image resolution to
achieve a high-quality depth image for view-based partial object retrieval.
The remainder of the paper is organized as follows. Section 2 reviews the related literature and
studies. Section 3 describes the view-based partial shape retrieval method. In Section 4, we
analyze the effectiveness of viewpoint and image resolution on the view-based partial shape
retrieval and propose our method for the selection of the viewpoint and image resolution using
the quantity and density measure. In Section 5, the proposed method is verified via the
implementation of a prototype retrieval system and deep-learning-based retrieval experiments
with CAD data sets. Section 6 concludes our study and presents future works.
2. Review of related literature and studies
In the comparison of shapes of 3D objects, shape descriptors representing compact features of
3D shapes are extracted from 3D objects, and the similarities between them are calculated. In
[8], the shape comparison methods were classified into feature-based, graph-based, and
geometry-based methods according to the approach of expressing shape descriptors.
In the feature-based method, features representing the geometrical properties of 3D shapes are
calculated and compared. The representative features include global features such as volume
[13] and moment [14], spatial maps such as spherical harmonics [15] or 3D Zernike [16], and
local features such as point signature [17] or persistent feature histogram [18].
In the graph-based method, the graph representing the relationship among the components of
3D shapes is used to extract the geometric meanings of 3D shapes and the extracted geometric
meanings are compared to calculate the similarity between 3D shapes. Model graph [19], Reeb
graph [20], and skeleton [21] are representative types of graphs.
Geometry-based methods are classified as view-based method [12,22], volumetric-error-based
method [23], weight-point-set-based method [24], and deformation-based method [25]. In the
view-based method, a target 2D image set is generated from each model in the database in
advance. The 2D image set generated from the input 3D model or a 2D sketch is used as the
query model; the query model is thereafter compared to the target 2D image sets generated
from the models stored in the database.
View-based methods can be applied for global and partial retrieval [8]. In global retrieval, the
sum of the distances between the view pairs in the two models is used as the dissimilarity
measure. In partial retrieval, the minimum of the distances between the view pairs is used as
the dissimilarity measure.
In the view-based method, 3D objects in the database have a complete shape and 2D images
can be directly generated by rendering 3D shapes in various predefined directions. However,
when the query is a segmented point cloud extracted from the entire point cloud of a large
facility, the position and direction of the viewpoint at which the segmented point cloud is
rendered, along with the resolution of the 2D image, influence the quality of the 2D image.
Therefore, a method for automatically selecting the optimal rendering viewpoint and image
resolution for the input point cloud is required. However, there are few studies on the methods
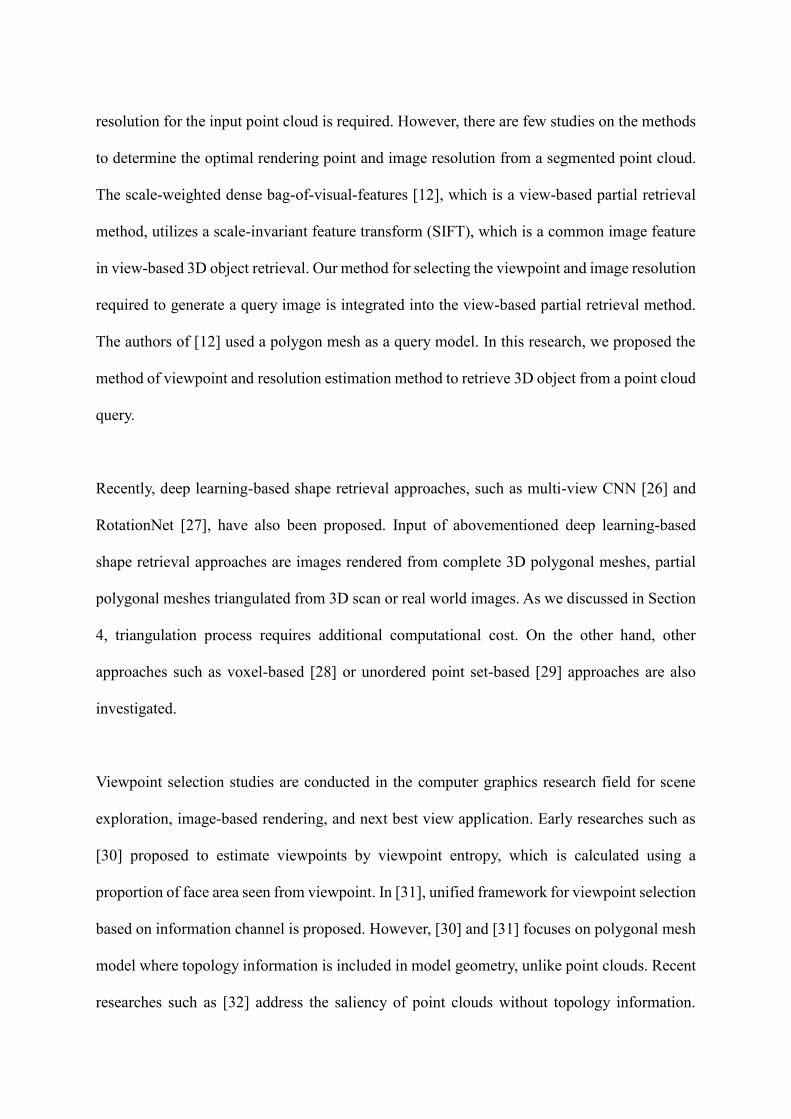
to determine the optimal rendering point and image resolution from a segmented point cloud.
The scale-weighted dense bag-of-visual-features [12], which is a view-based partial retrieval
method, utilizes a scale-invariant feature transform (SIFT), which is a common image feature
in view-based 3D object retrieval. Our method for selecting the viewpoint and image resolution
required to generate a query image is integrated into the view-based partial retrieval method.
The authors of [12] used a polygon mesh as a query model. In this research, we proposed the
method of viewpoint and resolution estimation method to retrieve 3D object from a point cloud
query.
Recently, deep learning-based shape retrieval approaches, such as multi-view CNN [26] and
RotationNet [27], have also been proposed. Input of abovementioned deep learning-based
shape retrieval approaches are images rendered from complete 3D polygonal meshes, partial
polygonal meshes triangulated from 3D scan or real world images. As we discussed in Section
4, triangulation process requires additional computational cost. On the other hand, other
approaches such as voxel-based [28] or unordered point set-based [29] approaches are also
investigated.
Viewpoint selection studies are conducted in the computer graphics research field for scene
exploration, image-based rendering, and next best view application. Early researches such as
[30] proposed to estimate viewpoints by viewpoint entropy, which is calculated using a
proportion of face area seen from viewpoint. In [31], unified framework for viewpoint selection
based on information channel is proposed. However, [30] and [31] focuses on polygonal mesh
model where topology information is included in model geometry, unlike point clouds. Recent
researches such as [32] address the saliency of point clouds without topology information.
However, to the best of our knowledge, adopting saliency of point clouds to viewpoint selection
problem has not been studied yet. Moreover, the effectiveness of selected viewpoint on view-
based shape retrieval should be further investigated.
3. View-based partial shape retrieval
In our research, the view-based partial shape retrieval method of [12] has been mainly selected
and improved to experiment the effect of proposed viewpoint and resolution estimation
selection method. In [12], depth images are rendered at various angles and a SIFT [30] feature
is extracted from each image to generate a descriptor from 3D models in DB. In order to
improve the accuracy of the retrieval, keypoints are extracted randomly in the foreground
region where an object exists, in contrast to the conventional keypoint detection of SIFT.
Moreover, in order to perform robust retrieval from a query model that may have discontinuous
geometry owing to incomplete scanning or noise, keypoints are detected from a multiresolution
image pyramid with a similar density to obtain a low-pass filtering effect. The experiments in
[12] demonstrate that extracting 3,600 keypoints based on 256 × 256 depth images yields the
best retrieval performance.
View based partial shape retrieval approach compares 3D objects using rendered images. To
compare the two images, image descriptor is encoded from obtained features. In [12], authors
adopted hard assignment encoding of bag-of-visual-words method. However, the expression
power of descriptor can be increased by using soft assignment, vector of locally aggregated
descriptors (VLAD) [34] or Fisher vector [35]. We adopted Fisher vector method for descriptor
encoding, which encodes the difference between the Gaussian Mixture Model (GMM)
constructed from the feature set of database and a set of features from an image. Constructed
GMM is represented by 𝐾 number of weight, mean and variance parameters λ =
{𝑤𝑘, 𝜇𝑘, 𝜎𝑘, 𝑘 = 1, … , 𝐾}. For each image has n number of features where each feature is D-
dimensional, gradient with respect to μ and σ can be expressed as Equation (1) and (2)
𝒖𝑘 =
1
𝑛√𝑤𝑘
∑ 𝑞𝑘(𝒙𝑖)𝒙𝑖 − 𝜇𝑘
𝜎𝑘
𝑛
𝑖=1
(1)
𝒗𝑘 =1
𝑛√𝑤𝑘∑ 𝑞𝑘(𝒙𝑖)
1
√2[
(𝒙𝑖−𝜇𝑘)2
𝜎𝑘2 − 1]𝑛
𝑖=1 , (2)
where 𝒙𝑖 is a D-dimensional features of image and 𝑞𝑘(𝒙𝑖) is the soft assignment of 𝒙𝑖 to
Gaussian k . The final descriptor of an image is d = [𝑢1, 𝑣1, … , 𝑢𝐾 , 𝑣𝐾] , which is 2DK -
dimensional vector. The retrieval is conducted by calculating the distance between descriptor
of the query image with the descriptors of the database images where smaller distance indicates
similar image.
Figure 1 shows a process designed based on the abovementioned approach, where we
considered a segmented point cloud as the input query and output is descriptors using Fisher
vector encoding. The segmented point clouds in database are pre-processed in offline to
generate descriptor database. Note that in case of large facilities such as process plants, most
of the objects are defined in a catalog. The standardized catalog is a data model that stores CAD
models for common reusable parts. Thus, the execution of the offline process does not require
frequent updates. In reconstruction process when point cloud is captured and segmented, user
needs to find corresponding model type in database. The retrieval is an online process that
generates a descriptor from a segmented point cloud input as a query, determines the most
similar model by comparing the query descriptor with the descriptor database, and returns the
model as a retrieval result. Note that Gaussian Mixture model estimation is performed only in
offline process and estimated GMM parameters are reused in online retrieval process.
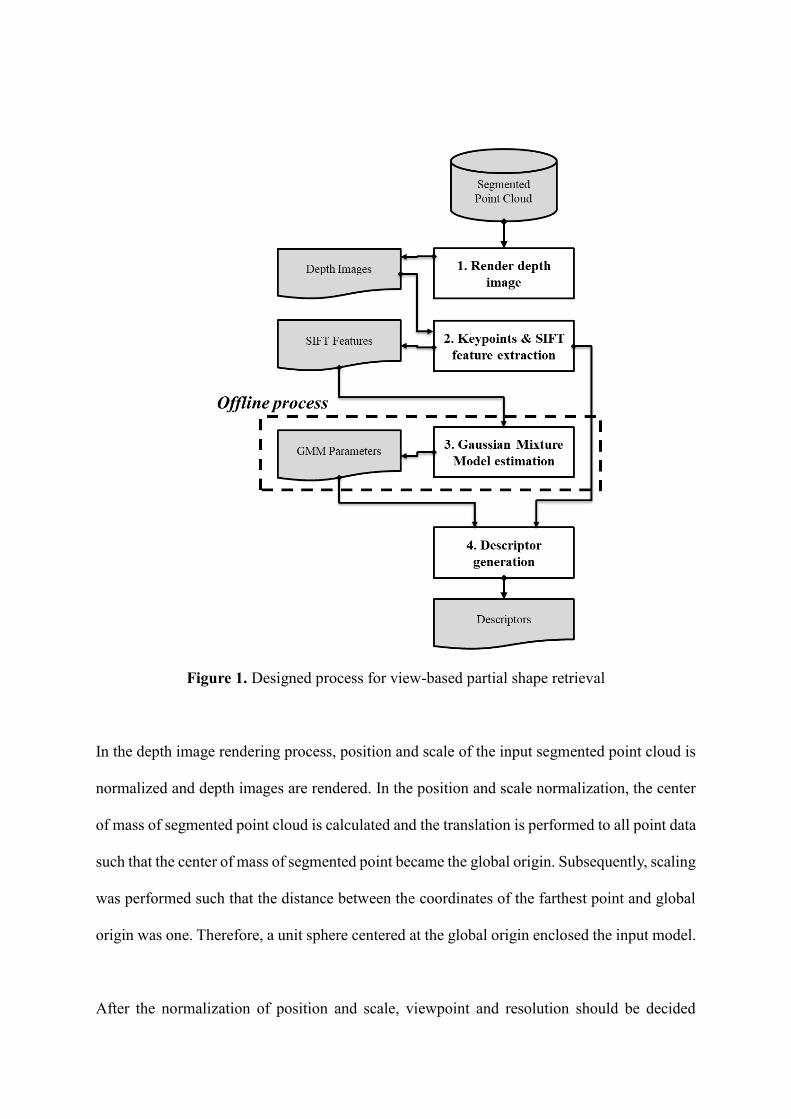
Figure 1. Designed process for view-based partial shape retrieval
In the depth image rendering process, position and scale of the input segmented point cloud is
normalized and depth images are rendered. In the position and scale normalization, the center
of mass of segmented point cloud is calculated and the translation is performed to all point data
such that the center of mass of segmented point became the global origin. Subsequently, scaling
was performed such that the distance between the coordinates of the farthest point and global
origin was one. Therefore, a unit sphere centered at the global origin enclosed the input model.
After the normalization of position and scale, viewpoint and resolution should be decided
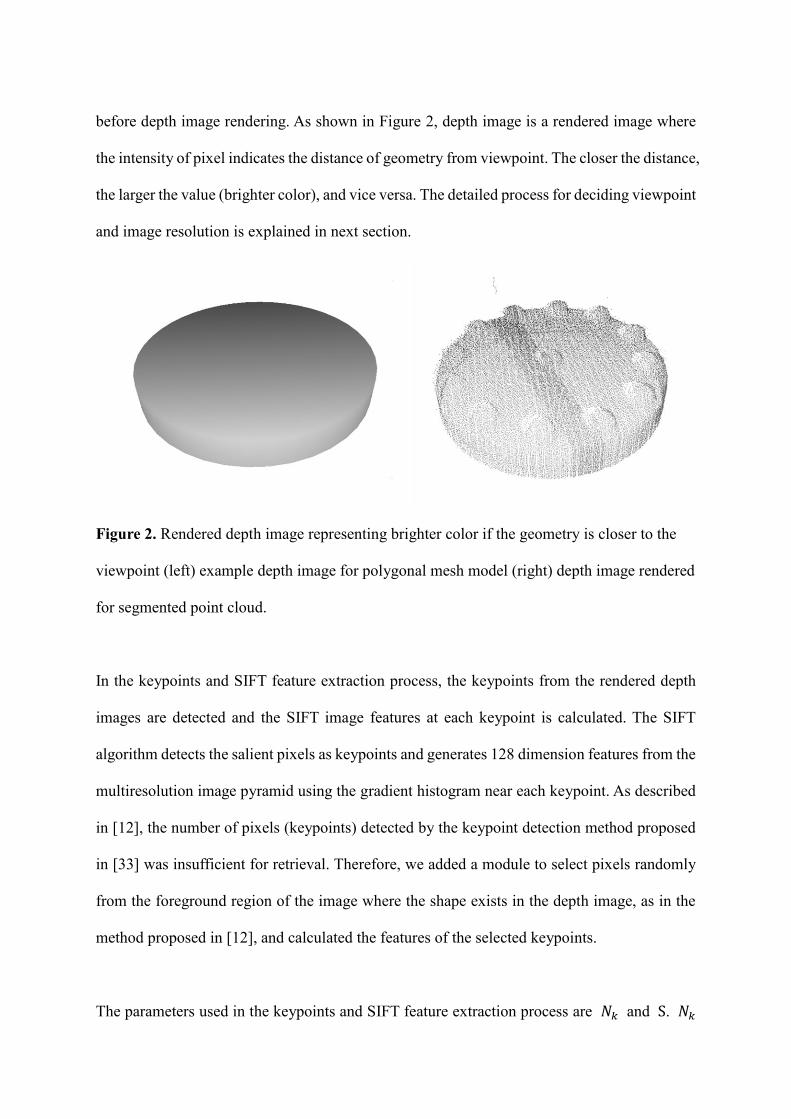
before depth image rendering. As shown in Figure 2, depth image is a rendered image where
the intensity of pixel indicates the distance of geometry from viewpoint. The closer the distance,
the larger the value (brighter color), and vice versa. The detailed process for deciding viewpoint
and image resolution is explained in next section.
Figure 2. Rendered depth image representing brighter color if the geometry is closer to the
viewpoint (left) example depth image for polygonal mesh model (right) depth image rendered
for segmented point cloud.
In the keypoints and SIFT feature extraction process, the keypoints from the rendered depth
images are detected and the SIFT image features at each keypoint is calculated. The SIFT
algorithm detects the salient pixels as keypoints and generates 128 dimension features from the
multiresolution image pyramid using the gradient histogram near each keypoint. As described
in [12], the number of pixels (keypoints) detected by the keypoint detection method proposed
in [33] was insufficient for retrieval. Therefore, we added a module to select pixels randomly
from the foreground region of the image where the shape exists in the depth image, as in the
method proposed in [12], and calculated the features of the selected keypoints.
The parameters used in the keypoints and SIFT feature extraction process are 𝑁𝑘 and S. 𝑁𝑘
is the number of pixels randomly sampled from the rendered depth image. S is the reduction
ratio of the pixels to be sampled as the size of the images in the multiresolution image pyramid
decreases. In the multiresolution image pyramid, when the size of the image is reduced to half
in width and height, the number of pixels to be sampled is reduced to 𝑁𝑘/𝑆. In our retrieval
system, 𝑁𝑘 was selected as 1200 and 𝑆 was selected as 1.5, as these values demonstrated the
best results in the experiment performed in [12].
In the Gaussian mixture model estimation process, entire SIFT features detected from the
rendered depth images of point clouds in the database is considered. As described before,
descriptor encoding using Fisher vector results 2DK -dimensional descriptor where D
indicates feature dimension, which is fixed as 128 since we adopted SIFT image feature.
Therefore K is a user-provided parameter for Gaussian mixture model estimation. To refer
parameters obtained from Gaussian mixture model estimation process in offline, λ =
{𝑤𝑘, 𝜇𝑘, 𝜎𝑘, 𝑘 = 1, … , 𝐾} values are stored as GMM parameters. GMM parameters are reused
in online process to encode descriptor from an image. The descriptor generation process is a
process of encoding SIFT features obtained from the depth image into a single descriptor using
the GMM parameter. Using Equation (1) and (2), one 2DK-dimensional descriptor is obtained
for each depth image.
In online process where segmented point cloud is given to retrieve corresponding type, the
same process is performed to query. For query point cloud, descriptors are generated for each
rendered depth image. Then the distance between descriptors from query point cloud and each
descriptor in descriptor database is calculated. The distance metric is the standard cosine
distance between two descriptors.
4. Generation of depth image from segmented point cloud
4.1 Problem of selection of viewpoint and image resolution for rendering
As mentioned above, the purpose of this study is to retrieve a type existing in the database by
segmented point cloud query obtained from scanning large-scale facilities as the query. The
query model assumed in our research has the following problems related to the view-based
partial shape retrieval.
1) Using point cloud as a query: The scan data are discrete data having a smaller amount
of information than the original shape because a point cloud is the sampling result from
the surface. Converting a discrete point cloud into a continuous surface is possible by
performing surface reconstruction [36] as a post-process. However, the computational
cost of surface reconstruction is high and the error owing to the reconstruction is incurred
in addition to the error owing to the scanner noise.
2) Point cloud without information on scanner locations: Scanners that encode the global
location of a device are very limited. Therefore, a retrieval system must provide
viewpoint information manually, which is a limitation on the usability and scalability of
the retrieval system. If the scan data contain the result of a single scan frame, it can be
assumed that the origin of the scan data is the position of the scanner. However, as our
query is a segmented point cloud separated from the entire point cloud, which is the
registered point cloud from multiple scan locations, there is no information about the
locations of scanners.
3) Point cloud without normal: Only structural light or stereo vision-based scanning has a
possibility to provide additional information for normal estimation. In the case of a long-
range scanner such as LiDAR, the normal of each point should be estimated via
additional post-processing. Furthermore, most point normal estimation methods require
the approximate location of the scanner.
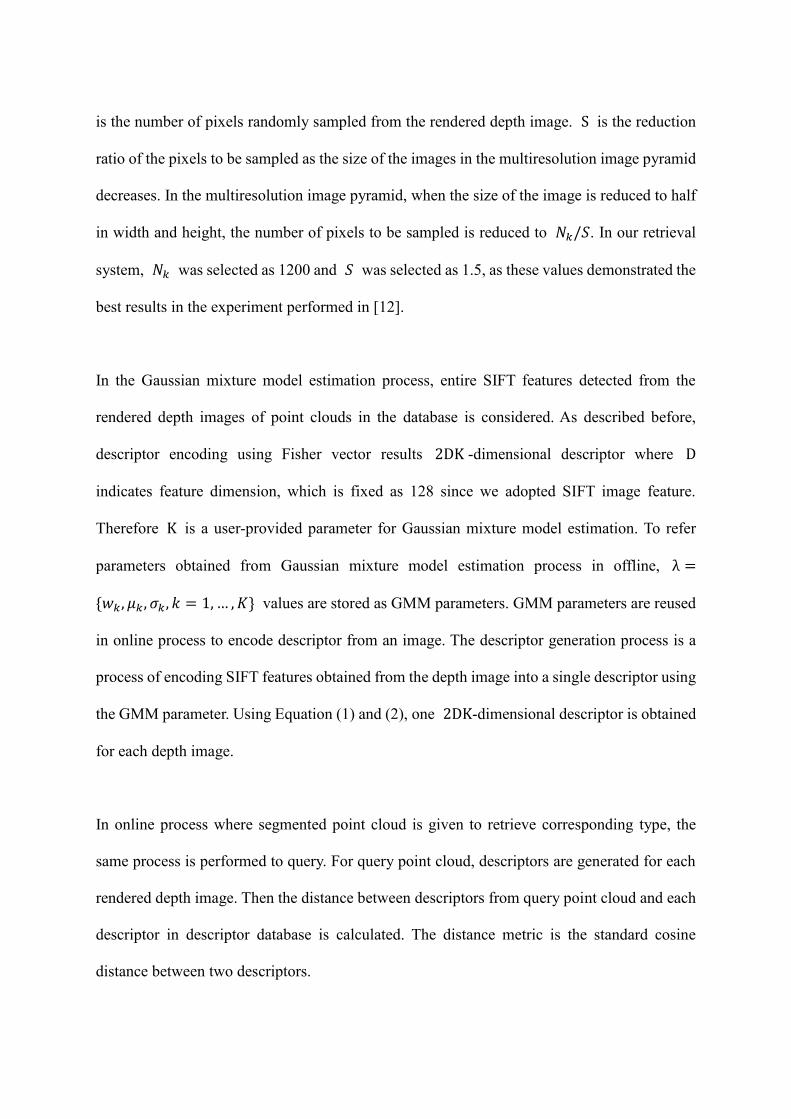
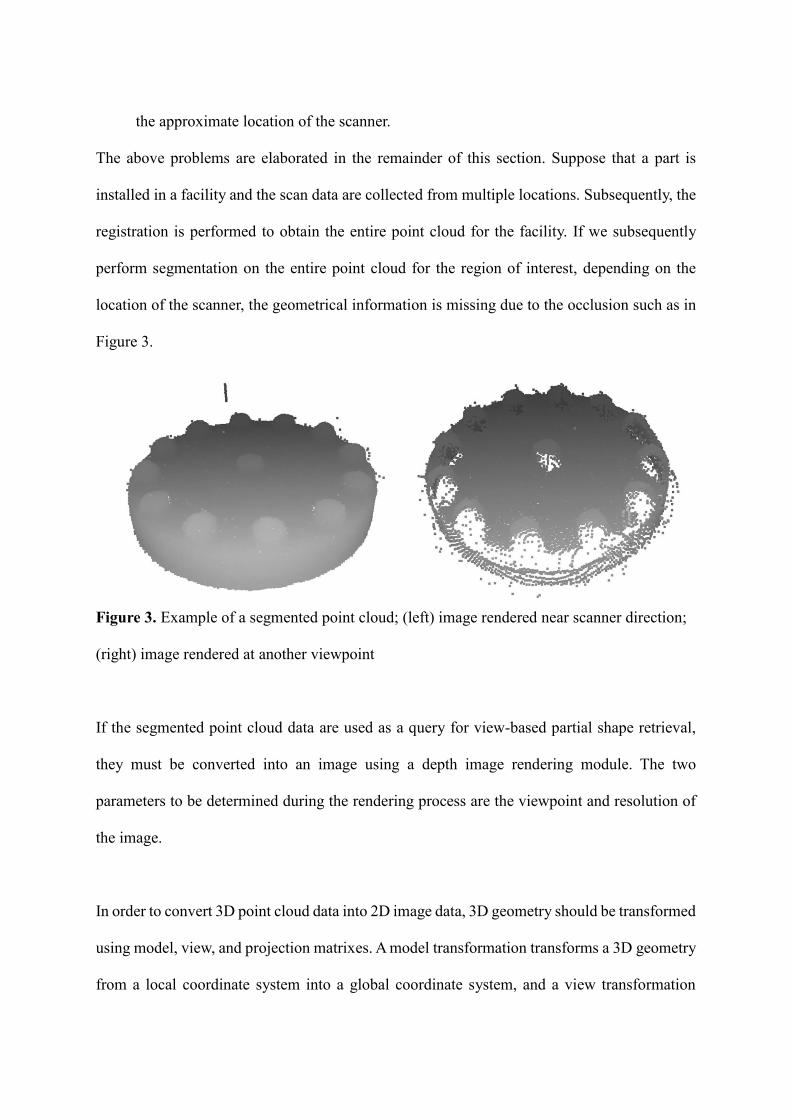
The above problems are elaborated in the remainder of this section. Suppose that a part is
installed in a facility and the scan data are collected from multiple locations. Subsequently, the
registration is performed to obtain the entire point cloud for the facility. If we subsequently
perform segmentation on the entire point cloud for the region of interest, depending on the
location of the scanner, the geometrical information is missing due to the occlusion such as in
Figure 3.
Figure 3. Example of a segmented point cloud; (left) image rendered near scanner direction;
(right) image rendered at another viewpoint
If the segmented point cloud data are used as a query for view-based partial shape retrieval,
they must be converted into an image using a depth image rendering module. The two
parameters to be determined during the rendering process are the viewpoint and resolution of
the image.
In order to convert 3D point cloud data into 2D image data, 3D geometry should be transformed
using model, view, and projection matrixes. A model transformation transforms a 3D geometry
from a local coordinate system into a global coordinate system, and a view transformation
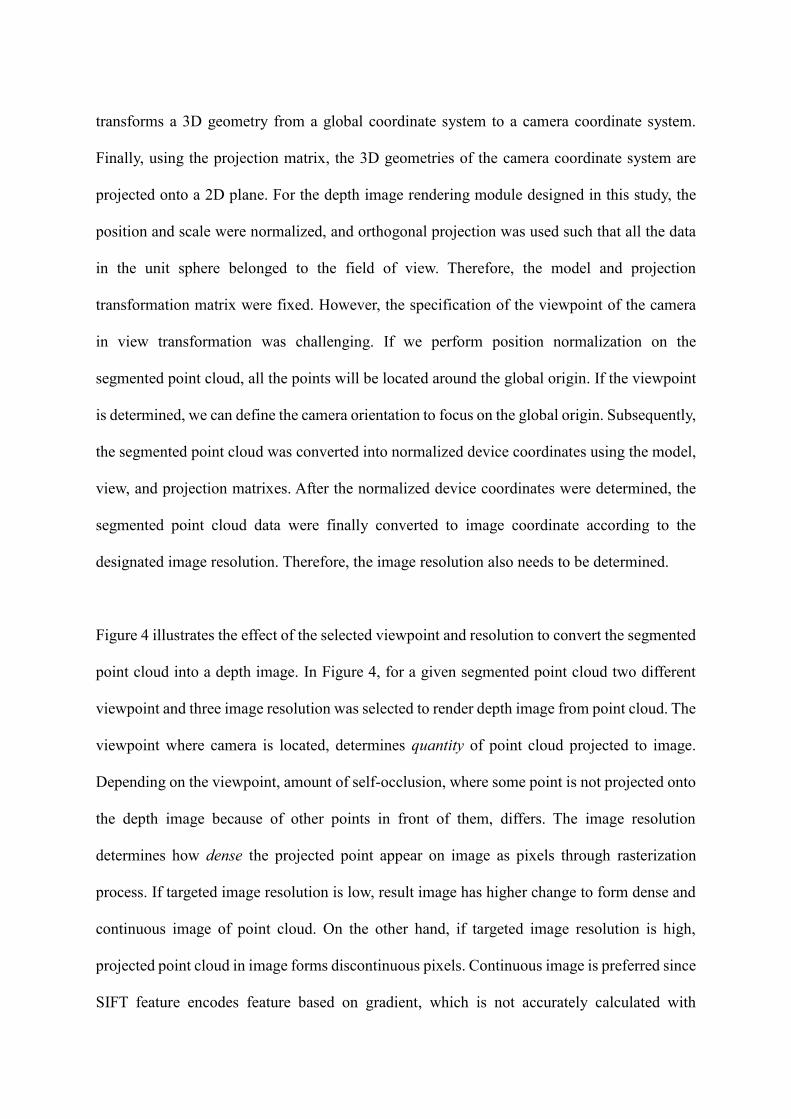
transforms a 3D geometry from a global coordinate system to a camera coordinate system.
Finally, using the projection matrix, the 3D geometries of the camera coordinate system are
projected onto a 2D plane. For the depth image rendering module designed in this study, the
position and scale were normalized, and orthogonal projection was used such that all the data
in the unit sphere belonged to the field of view. Therefore, the model and projection
transformation matrix were fixed. However, the specification of the viewpoint of the camera
in view transformation was challenging. If we perform position normalization on the
segmented point cloud, all the points will be located around the global origin. If the viewpoint
is determined, we can define the camera orientation to focus on the global origin. Subsequently,
the segmented point cloud was converted into normalized device coordinates using the model,
view, and projection matrixes. After the normalized device coordinates were determined, the
segmented point cloud data were finally converted to image coordinate according to the
designated image resolution. Therefore, the image resolution also needs to be determined.
Figure 4 illustrates the effect of the selected viewpoint and resolution to convert the segmented
point cloud into a depth image. In Figure 4, for a given segmented point cloud two different
viewpoint and three image resolution was selected to render depth image from point cloud. The
viewpoint where camera is located, determines quantity of point cloud projected to image.
Depending on the viewpoint, amount of self-occlusion, where some point is not projected onto
the depth image because of other points in front of them, differs. The image resolution
determines how dense the projected point appear on image as pixels through rasterization
process. If targeted image resolution is low, result image has higher change to form dense and
continuous image of point cloud. On the other hand, if targeted image resolution is high,
projected point cloud in image forms discontinuous pixels. Continuous image is preferred since
SIFT feature encodes feature based on gradient, which is not accurately calculated with
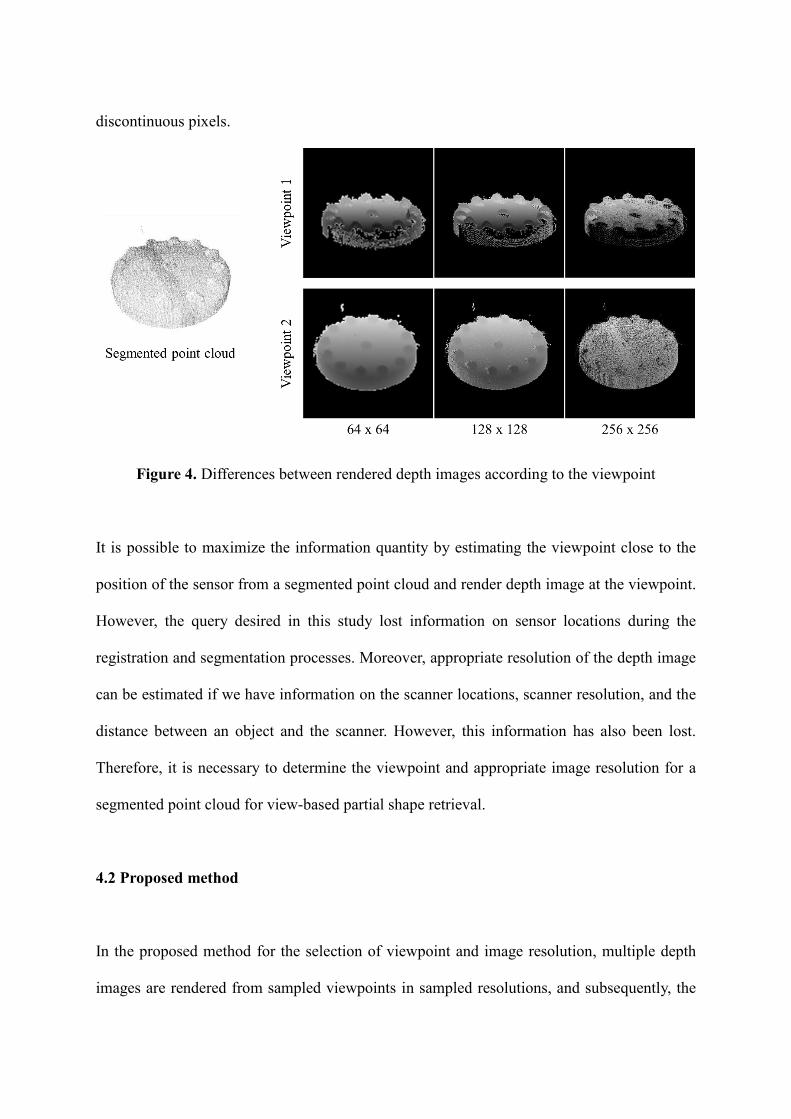
discontinuous pixels.
Figure 4. Differences between rendered depth images according to the viewpoint
It is possible to maximize the information quantity by estimating the viewpoint close to the
position of the sensor from a segmented point cloud and render depth image at the viewpoint.
However, the query desired in this study lost information on sensor locations during the
registration and segmentation processes. Moreover, appropriate resolution of the depth image
can be estimated if we have information on the scanner locations, scanner resolution, and the
distance between an object and the scanner. However, this information has also been lost.
Therefore, it is necessary to determine the viewpoint and appropriate image resolution for a
segmented point cloud for view-based partial shape retrieval.
4.2 Proposed method
In the proposed method for the selection of viewpoint and image resolution, multiple depth
images are rendered from sampled viewpoints in sampled resolutions, and subsequently, the
quantity Q and density D are calculated for each image. The best viewpoint and image
resolution are determined based on the information quantity and density of depth image. The
proposed method is designed to estimate the viewpoint such that maximum possible point of
the segmented point cloud is projected into the pixels of the image. The image resolution is
also determined such that pixels of projected point cloud is densely positioned.
For a segmented point cloud P, the quantity Q and density D are functions of viewpoint v
and resolution r.
𝑄(𝑣, 𝑟) =
𝑁𝑝𝑖𝑥𝑒𝑙
|𝑃| , where 𝑁𝑝𝑖𝑥𝑒𝑙 = |𝐼(𝑣, 𝑟) > 0| 𝑎𝑛𝑑
𝐼(𝑣, 𝑟) = 𝑀𝑉𝑃(𝑣, 𝑟) ∗ 𝑃,
(3)
𝐷(𝑣, 𝑟) =
𝑁8−𝑐𝑜𝑛𝑛𝑒𝑐𝑡𝑒𝑑
𝑁𝑝𝑖𝑥𝑒𝑙 , 𝑤ℎ𝑒𝑟𝑒 𝑁8−𝑐𝑜𝑛𝑛𝑒𝑐𝑡𝑒𝑑 = |𝐼𝐵(𝑣, 𝑟)⨂ [
11
11
11
1 1 1] = 9|, (4)
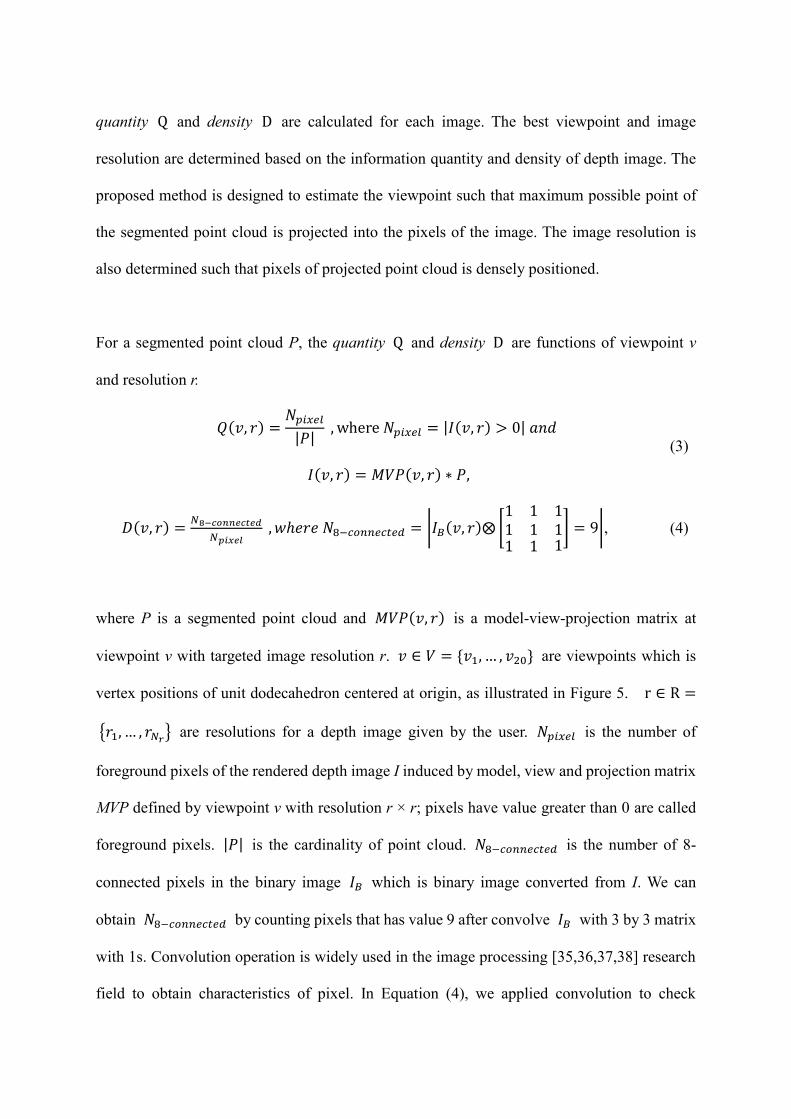
where P is a segmented point cloud and 𝑀𝑉𝑃(𝑣, 𝑟) is a model-view-projection matrix at
viewpoint v with targeted image resolution r. 𝑣 ∈ 𝑉 = {𝑣1, … , 𝑣20} are viewpoints which is
vertex positions of unit dodecahedron centered at origin, as illustrated in Figure 5. r ∈ R =
{𝑟1, … , 𝑟𝑁𝑟} are resolutions for a depth image given by the user. 𝑁𝑝𝑖𝑥𝑒𝑙 is the number of
foreground pixels of the rendered depth image I induced by model, view and projection matrix
MVP defined by viewpoint v with resolution r × r; pixels have value greater than 0 are called
foreground pixels. |𝑃| is the cardinality of point cloud. 𝑁8−𝑐𝑜𝑛𝑛𝑒𝑐𝑡𝑒𝑑 is the number of 8-
connected pixels in the binary image 𝐼𝐵 which is binary image converted from I. We can
obtain 𝑁8−𝑐𝑜𝑛𝑛𝑒𝑐𝑡𝑒𝑑 by counting pixels that has value 9 after convolve 𝐼𝐵 with 3 by 3 matrix
with 1s. Convolution operation is widely used in the image processing [35,36,37,38] research
field to obtain characteristics of pixel. In Equation (4), we applied convolution to check
whether a point cloud is continuous under given projection. In summary, Equation (3)
represents the number of pixels onto which a segmented point cloud is projected. Equation (4)
is the ratio of dense points to pixels (8-connected pixels) projected onto the depth image.
Figure 5. Unit dodecahedron centered at origin with normalized segmented point cloud
Figure 6 illustrates the general tendency of quantity Q according to the viewpoints and
resolutions. When lower the resolution, the more the quantity tends to decrease. This is because,
as shown in Figure 7, the lower the resolution of the image, the more likely nearby points are
projected onto the same pixel position, which results in aliasing. As each pixel can encode a
single depth value, when multiple points in a point cloud correspond to the same pixel position,
only the depth value of the nearest (minimum depth) point is reflected as the pixel intensity. If
the resolution of the depth image is high, there is a higher possibility that depth values for
nearby points are recorded into the pixels. However, at low resolution, only the depth value of
a specific point among the nearby points is reflected, and the depth values for the remaining
points are ignored. Therefore, the number of points to be projected is generally reduced at low
resolution.
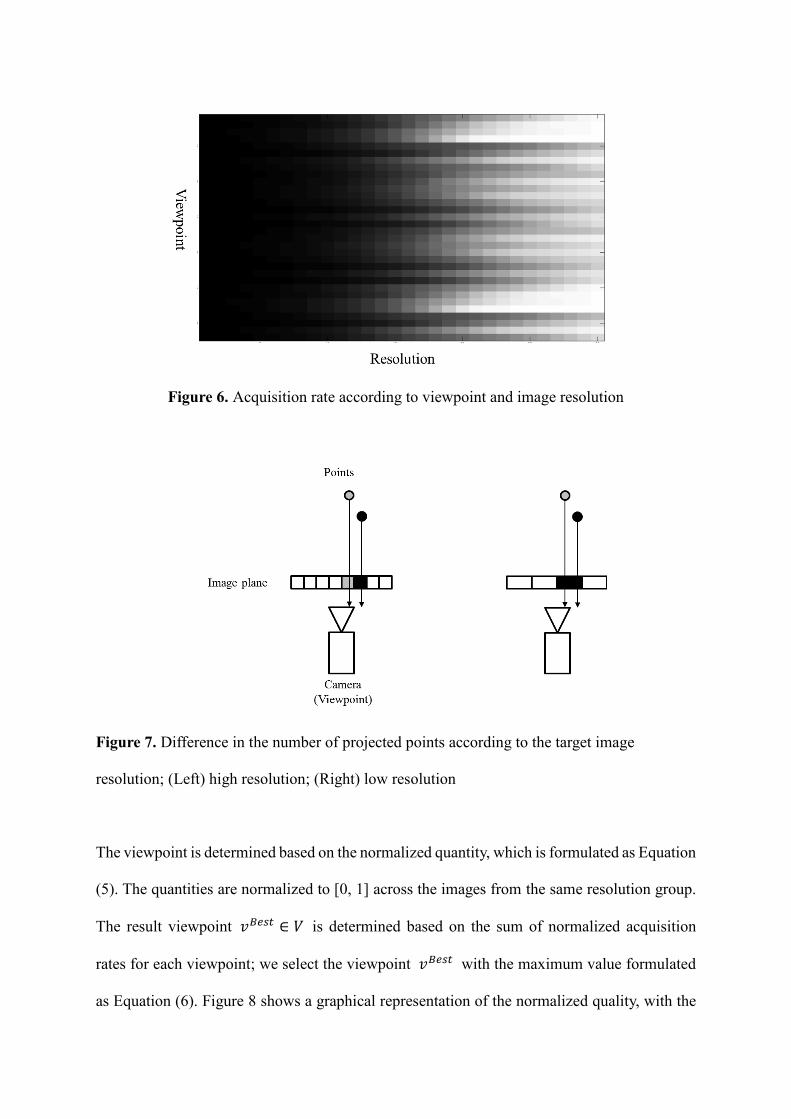
Figure 6. Acquisition rate according to viewpoint and image resolution
Figure 7. Difference in the number of projected points according to the target image
resolution; (Left) high resolution; (Right) low resolution
The viewpoint is determined based on the normalized quantity, which is formulated as Equation
(5). The quantities are normalized to [0, 1] across the images from the same resolution group.
The result viewpoint 𝑣𝐵𝑒𝑠𝑡 ∈ 𝑉 is determined based on the sum of normalized acquisition
rates for each viewpoint; we select the viewpoint 𝑣𝐵𝑒𝑠𝑡 with the maximum value formulated
as Equation (6). Figure 8 shows a graphical representation of the normalized quality, with the
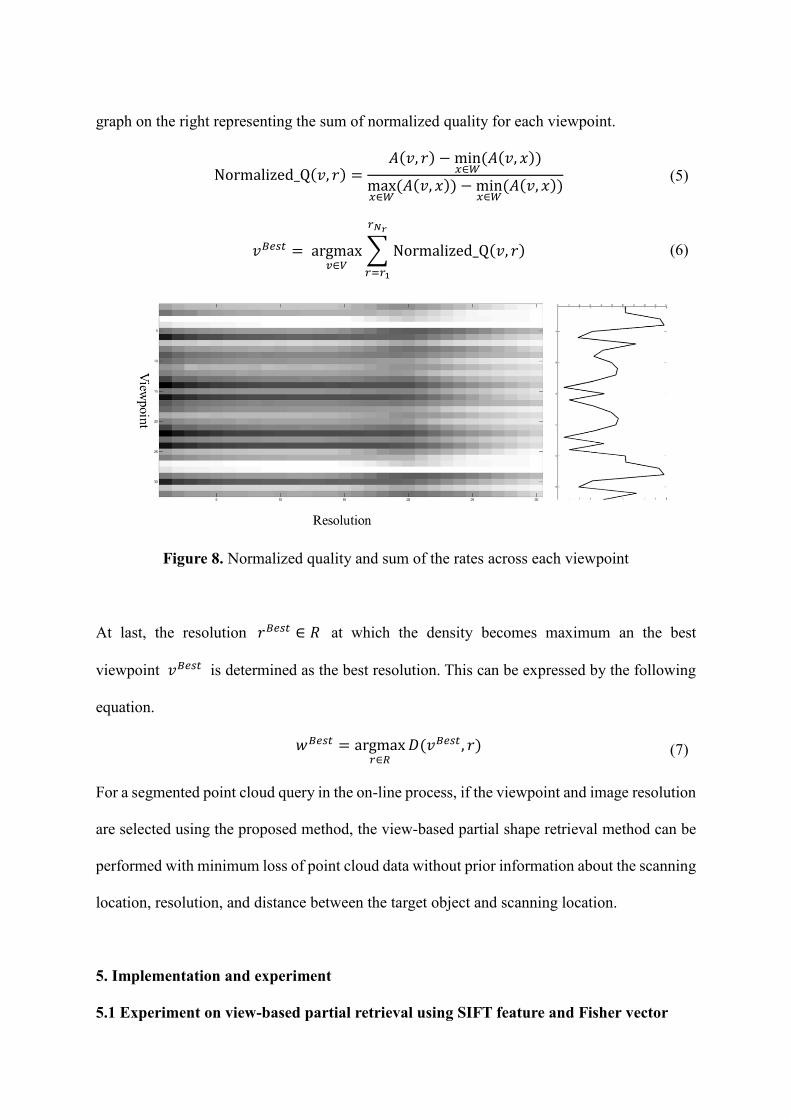
graph on the right representing the sum of normalized quality for each viewpoint.
Normalized_Q(𝑣, 𝑟) =
𝐴(𝑣, 𝑟) − min𝑥∈𝑊
(𝐴(𝑣, 𝑥))
max𝑥∈𝑊
(𝐴(𝑣, 𝑥)) − min𝑥∈𝑊
(𝐴(𝑣, 𝑥)) (5)
𝑣𝐵𝑒𝑠𝑡 = argmax𝑣∈𝑉
∑ Normalized_Q(𝑣, 𝑟)
𝑟𝑁𝑟
𝑟=𝑟1
(6)
Figure 8. Normalized quality and sum of the rates across each viewpoint
At last, the resolution 𝑟𝐵𝑒𝑠𝑡 ∈ 𝑅 at which the density becomes maximum an the best
viewpoint 𝑣𝐵𝑒𝑠𝑡 is determined as the best resolution. This can be expressed by the following
equation.
𝑤𝐵𝑒𝑠𝑡 = argmax𝑟∈𝑅
𝐷(𝑣𝐵𝑒𝑠𝑡, 𝑟) (7)
For a segmented point cloud query in the on-line process, if the viewpoint and image resolution
are selected using the proposed method, the view-based partial shape retrieval method can be
performed with minimum loss of point cloud data without prior information about the scanning
location, resolution, and distance between the target object and scanning location.
5. Implementation and experiment
5.1 Experiment on view-based partial retrieval using SIFT feature and Fisher vector
We implemented the retrieval system and conducted an experiment to observe the performance
of the view-based partial shape retrieval method and the proposed method using a segmented
point cloud as a query. Each of the modules described in Section 3 for view-based partial shape
retrieval was implemented based on C ++ and OpenGL graphics API was used for rendering.
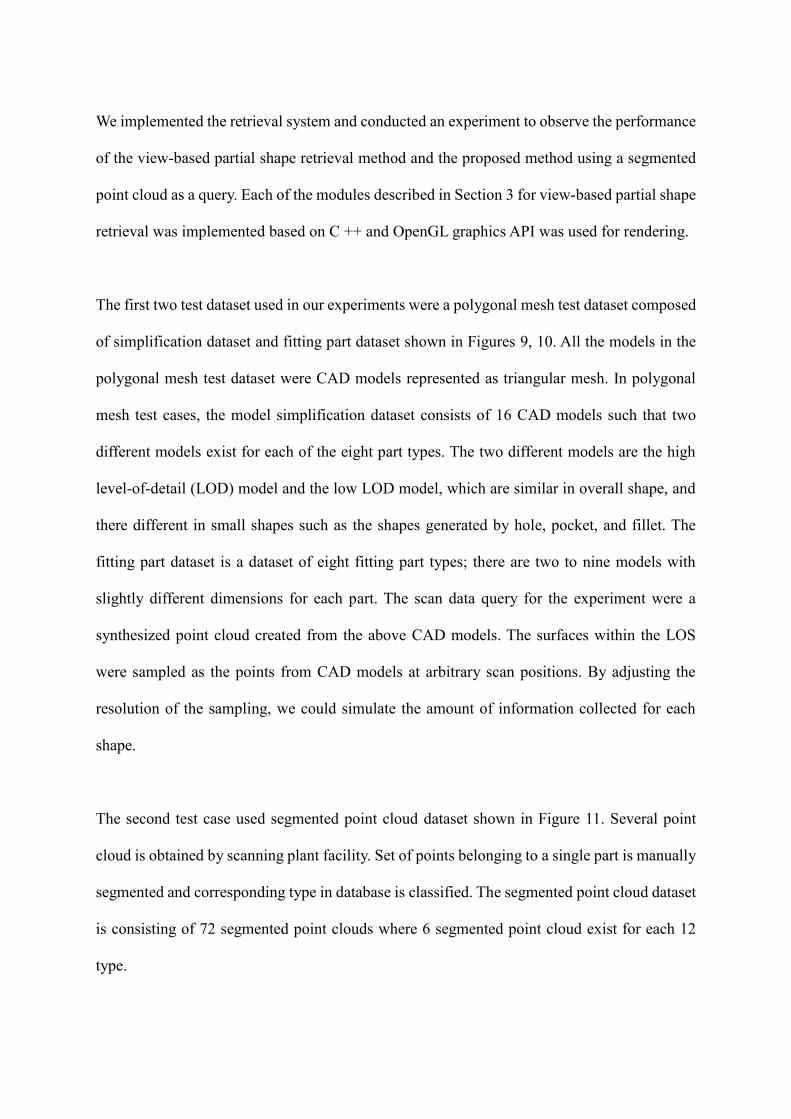
The first two test dataset used in our experiments were a polygonal mesh test dataset composed
of simplification dataset and fitting part dataset shown in Figures 9, 10. All the models in the
polygonal mesh test dataset were CAD models represented as triangular mesh. In polygonal
mesh test cases, the model simplification dataset consists of 16 CAD models such that two
different models exist for each of the eight part types. The two different models are the high
level-of-detail (LOD) model and the low LOD model, which are similar in overall shape, and
there different in small shapes such as the shapes generated by hole, pocket, and fillet. The
fitting part dataset is a dataset of eight fitting part types; there are two to nine models with
slightly different dimensions for each part. The scan data query for the experiment were a
synthesized point cloud created from the above CAD models. The surfaces within the LOS
were sampled as the points from CAD models at arbitrary scan positions. By adjusting the
resolution of the sampling, we could simulate the amount of information collected for each
shape.
The second test case used segmented point cloud dataset shown in Figure 11. Several point
cloud is obtained by scanning plant facility. Set of points belonging to a single part is manually
segmented and corresponding type in database is classified. The segmented point cloud dataset
is consisting of 72 segmented point clouds where 6 segmented point cloud exist for each 12
type.
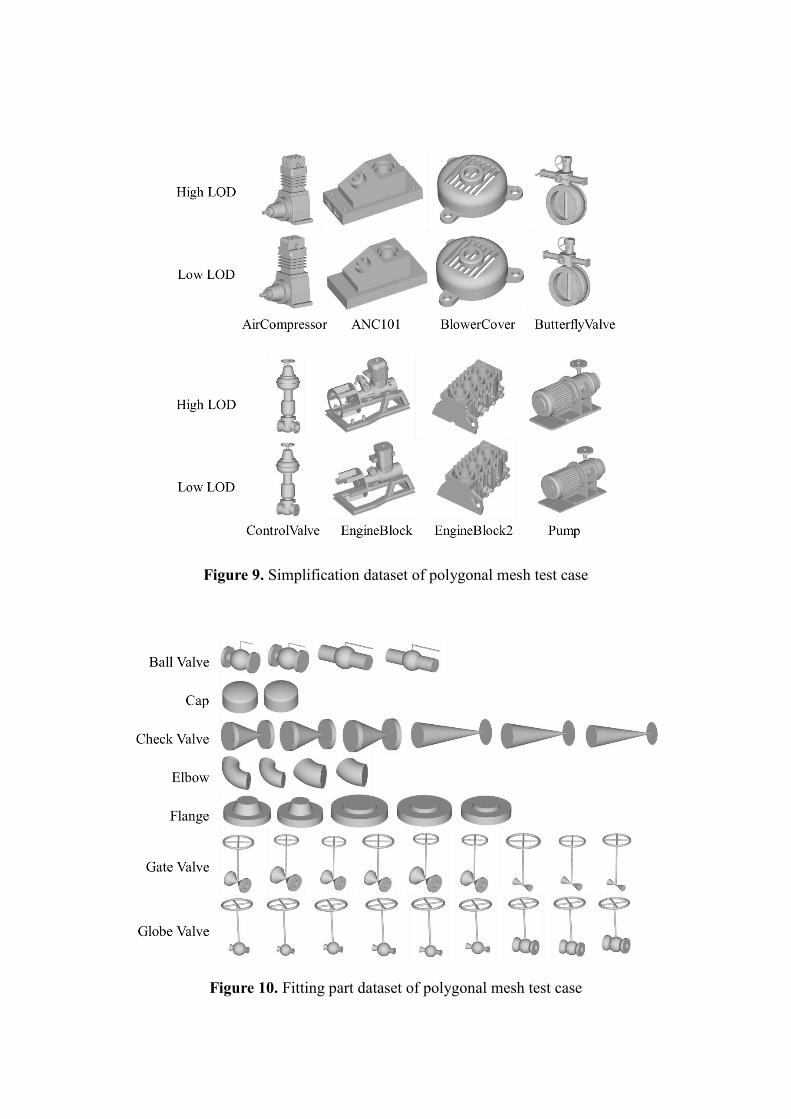
Figure 9. Simplification dataset of polygonal mesh test case
Figure 10. Fitting part dataset of polygonal mesh test case
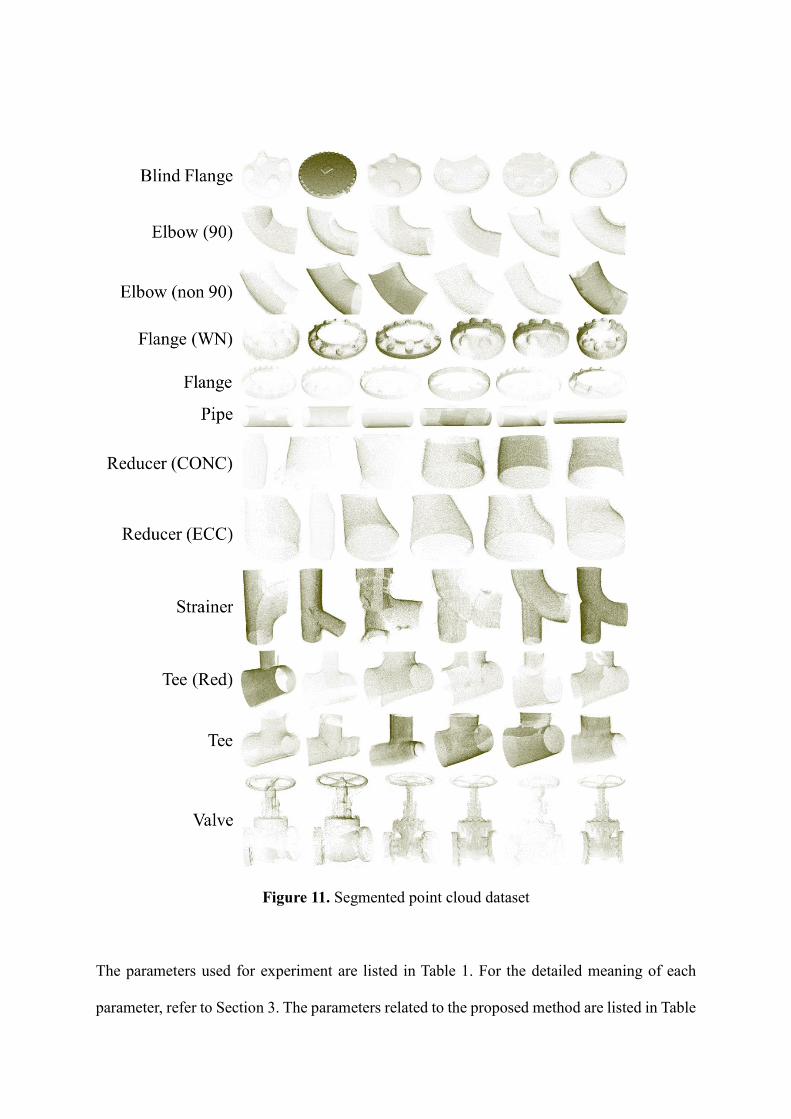
Figure 11. Segmented point cloud dataset
The parameters used for experiment are listed in Table 1. For the detailed meaning of each
parameter, refer to Section 3. The parameters related to the proposed method are listed in Table
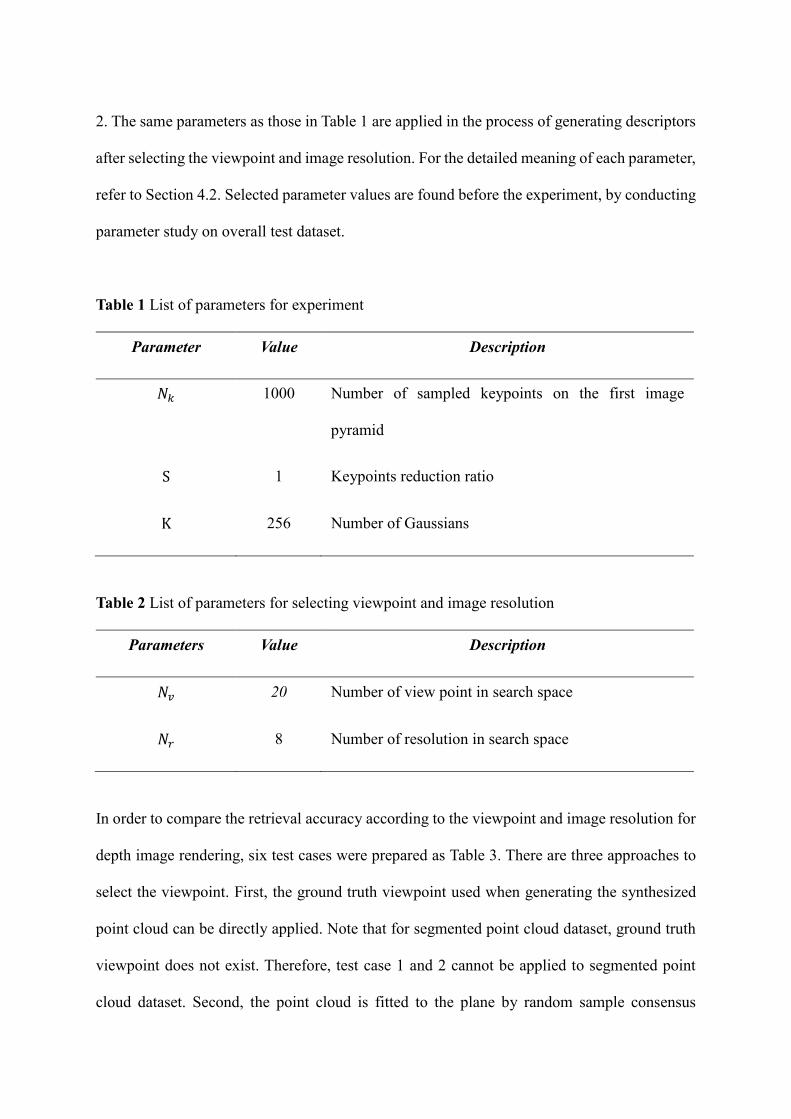
2. The same parameters as those in Table 1 are applied in the process of generating descriptors
after selecting the viewpoint and image resolution. For the detailed meaning of each parameter,
refer to Section 4.2. Selected parameter values are found before the experiment, by conducting
parameter study on overall test dataset.
Table 1 List of parameters for experiment
Parameter Value Description
𝑁𝑘 1000 Number of sampled keypoints on the first image
pyramid
S 1 Keypoints reduction ratio
K 256 Number of Gaussians
Table 2 List of parameters for selecting viewpoint and image resolution
Parameters Value Description
𝑁𝑣 20 Number of view point in search space
𝑁𝑟 8 Number of resolution in search space
In order to compare the retrieval accuracy according to the viewpoint and image resolution for
depth image rendering, six test cases were prepared as Table 3. There are three approaches to
select the viewpoint. First, the ground truth viewpoint used when generating the synthesized
point cloud can be directly applied. Note that for segmented point cloud dataset, ground truth
viewpoint does not exist. Therefore, test case 1 and 2 cannot be applied to segmented point
cloud dataset. Second, the point cloud is fitted to the plane by random sample consensus
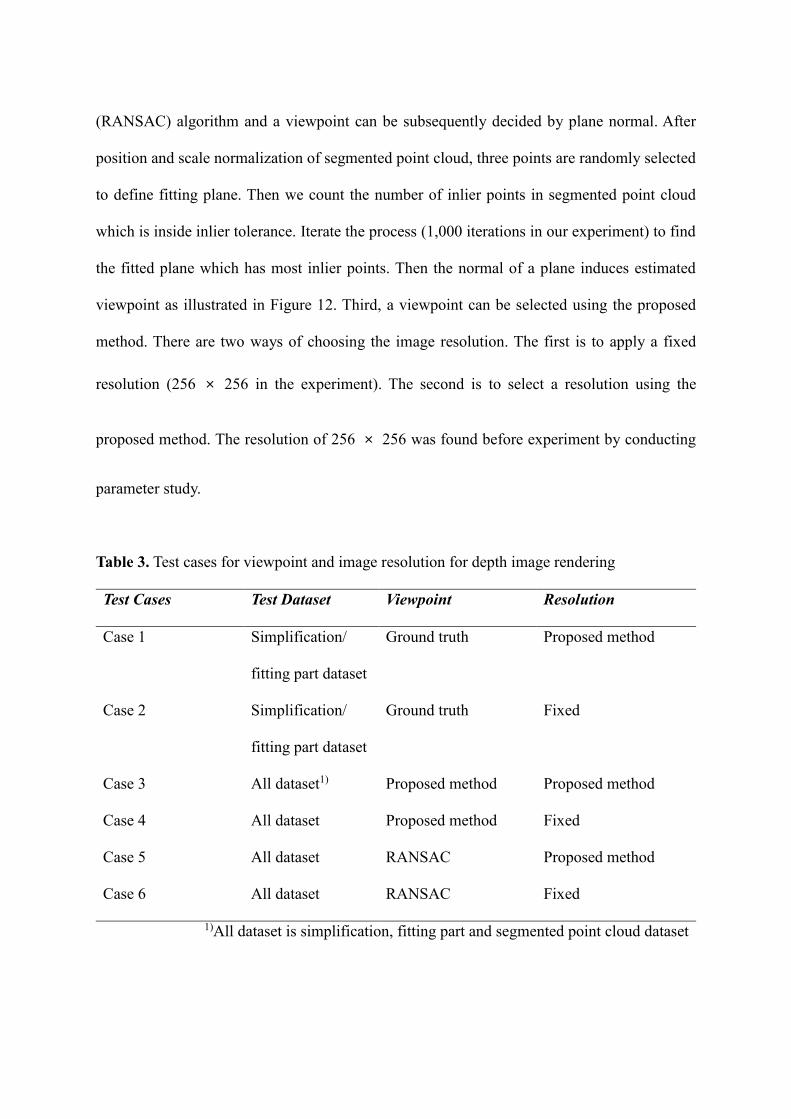
(RANSAC) algorithm and a viewpoint can be subsequently decided by plane normal. After
position and scale normalization of segmented point cloud, three points are randomly selected
to define fitting plane. Then we count the number of inlier points in segmented point cloud
which is inside inlier tolerance. Iterate the process (1,000 iterations in our experiment) to find
the fitted plane which has most inlier points. Then the normal of a plane induces estimated
viewpoint as illustrated in Figure 12. Third, a viewpoint can be selected using the proposed
method. There are two ways of choosing the image resolution. The first is to apply a fixed
resolution (256 × 256 in the experiment). The second is to select a resolution using the
proposed method. The resolution of 256 × 256 was found before experiment by conducting
parameter study.
Table 3. Test cases for viewpoint and image resolution for depth image rendering
Test Cases Test Dataset Viewpoint Resolution
Case 1 Simplification/
fitting part dataset
Ground truth Proposed method
Case 2 Simplification/
fitting part dataset
Ground truth Fixed
Case 3 All dataset1) Proposed method Proposed method
Case 4 All dataset Proposed method Fixed
Case 5 All dataset RANSAC Proposed method
Case 6 All dataset RANSAC Fixed
1)All dataset is simplification, fitting part and segmented point cloud dataset
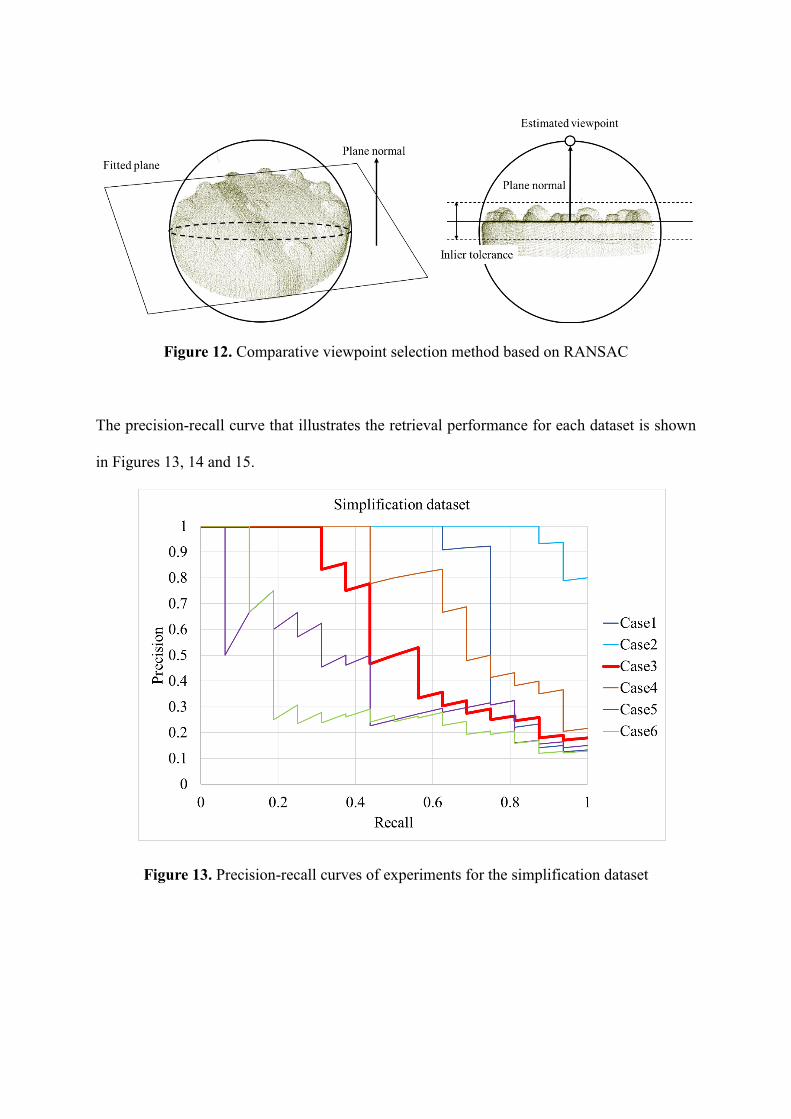
Figure 12. Comparative viewpoint selection method based on RANSAC
The precision-recall curve that illustrates the retrieval performance for each dataset is shown
in Figures 13, 14 and 15.
Figure 13. Precision-recall curves of experiments for the simplification dataset
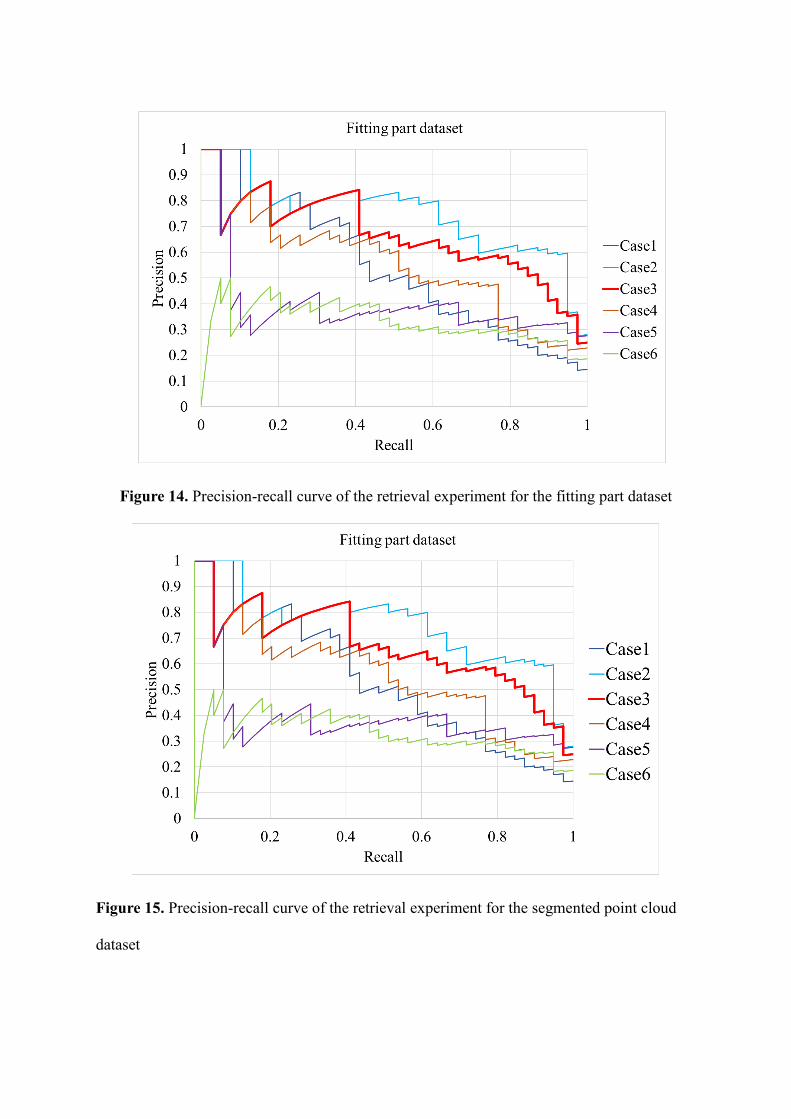
Figure 14. Precision-recall curve of the retrieval experiment for the fitting part dataset
Figure 15. Precision-recall curve of the retrieval experiment for the segmented point cloud
dataset
In the case of model simplification dataset, Case 1 demonstrated the highest performance and
Cases 5 and 6 demonstrated relatively lower performances. Cases 2, 3, and 4 demonstrated
similar performances. In the case of fitting part dataset, Case 3, which is the proposed method,
demonstrated the highest performance after Case 2. The remaining cases demonstrated lower
performance on retrieval. For both datasets, the view selection method using the RANSAC
yielded the lowest performance, which indicates that the selection of viewpoint is an important
factor in view-based partial shape retrieval. In the case of segmented point cloud dataset, Case
3 demonstrated the highest precision when recall was low while Case 5 showed better
performance in overall.
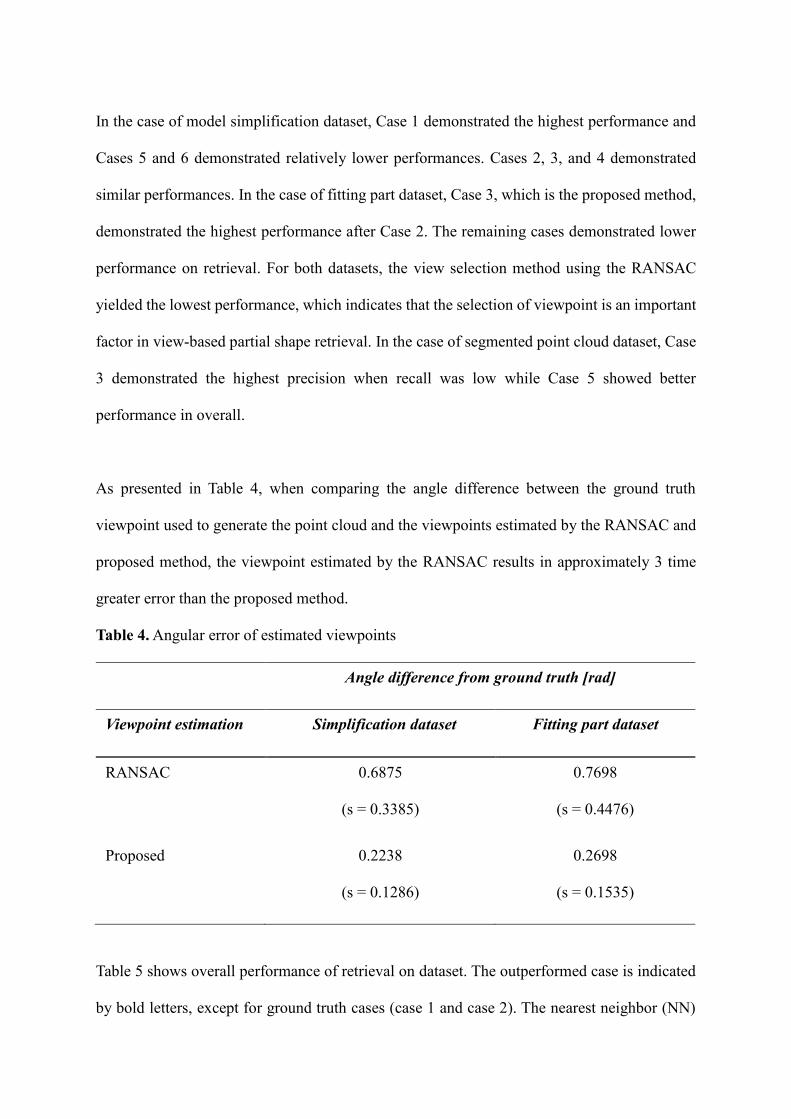
As presented in Table 4, when comparing the angle difference between the ground truth
viewpoint used to generate the point cloud and the viewpoints estimated by the RANSAC and
proposed method, the viewpoint estimated by the RANSAC results in approximately 3 time
greater error than the proposed method.
Table 4. Angular error of estimated viewpoints
Angle difference from ground truth [rad]
Viewpoint estimation Simplification dataset Fitting part dataset
RANSAC 0.6875
(s = 0.3385)
0.7698
(s = 0.4476)
Proposed 0.2238
(s = 0.1286)
0.2698
(s = 0.1535)
Table 5 shows overall performance of retrieval on dataset. The outperformed case is indicated
by bold letters, except for ground truth cases (case 1 and case 2). The nearest neighbor (NN)
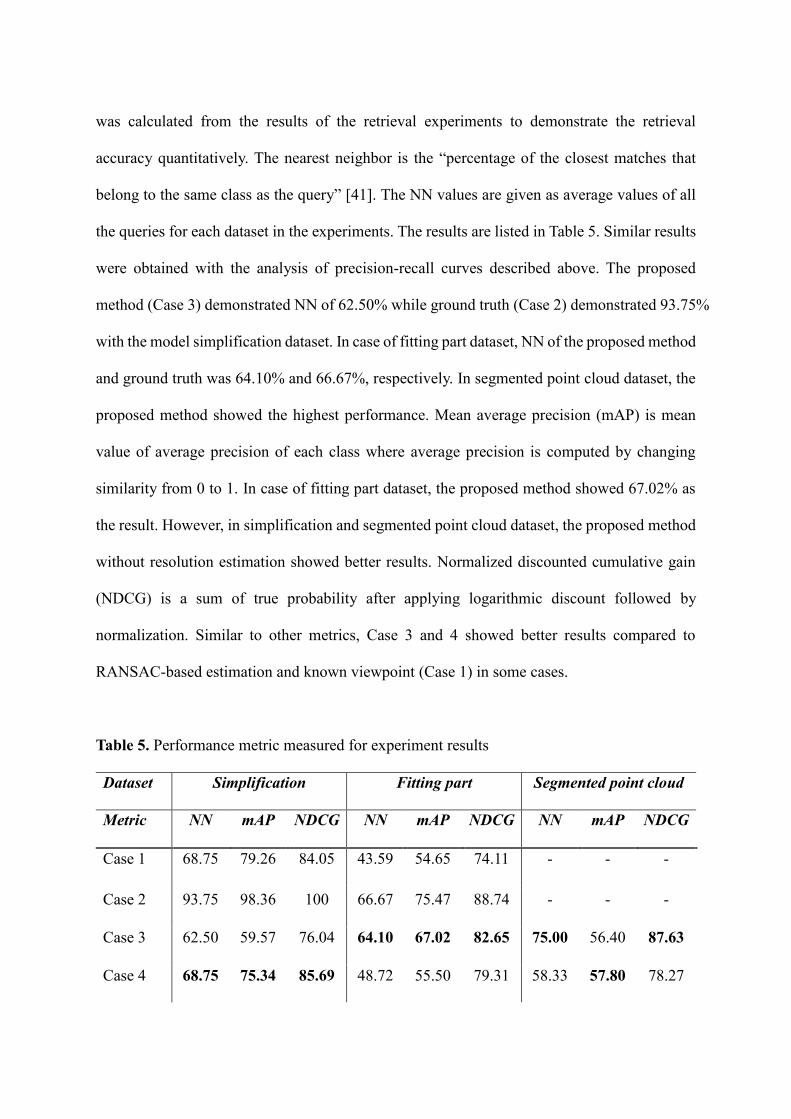
was calculated from the results of the retrieval experiments to demonstrate the retrieval
accuracy quantitatively. The nearest neighbor is the “percentage of the closest matches that
belong to the same class as the query” [41]. The NN values are given as average values of all
the queries for each dataset in the experiments. The results are listed in Table 5. Similar results
were obtained with the analysis of precision-recall curves described above. The proposed
method (Case 3) demonstrated NN of 62.50% while ground truth (Case 2) demonstrated 93.75%
with the model simplification dataset. In case of fitting part dataset, NN of the proposed method
and ground truth was 64.10% and 66.67%, respectively. In segmented point cloud dataset, the
proposed method showed the highest performance. Mean average precision (mAP) is mean
value of average precision of each class where average precision is computed by changing
similarity from 0 to 1. In case of fitting part dataset, the proposed method showed 67.02% as
the result. However, in simplification and segmented point cloud dataset, the proposed method
without resolution estimation showed better results. Normalized discounted cumulative gain
(NDCG) is a sum of true probability after applying logarithmic discount followed by
normalization. Similar to other metrics, Case 3 and 4 showed better results compared to
RANSAC-based estimation and known viewpoint (Case 1) in some cases.
Table 5. Performance metric measured for experiment results
Dataset Simplification Fitting part Segmented point cloud
Metric NN mAP NDCG NN mAP NDCG NN mAP NDCG
Case 1 68.75 79.26 84.05 43.59 54.65 74.11 - - -
Case 2 93.75 98.36 100 66.67 75.47 88.74 - - -
Case 3 62.50 59.57 76.04 64.10 67.02 82.65 75.00 56.40 87.63
Case 4 68.75 75.34 85.69 48.72 55.50 79.31 58.33 57.80 78.27
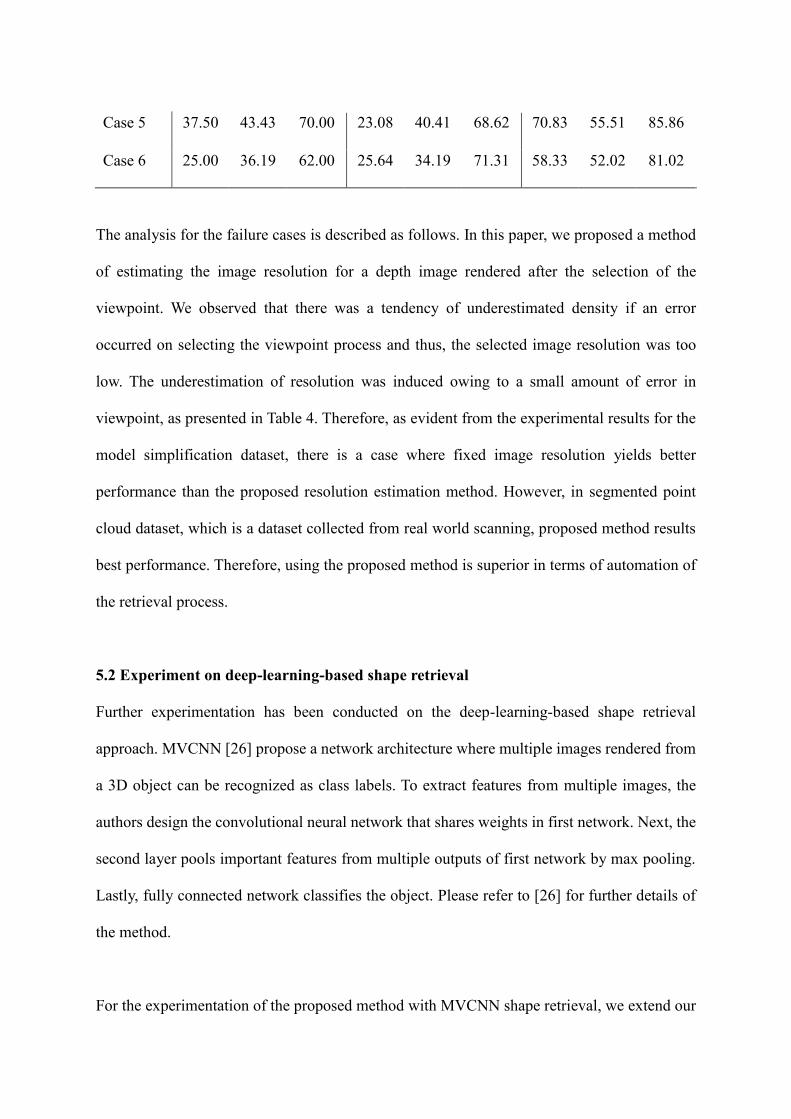
Case 5 37.50 43.43 70.00 23.08 40.41 68.62 70.83 55.51 85.86
Case 6 25.00 36.19 62.00 25.64 34.19 71.31 58.33 52.02 81.02
The analysis for the failure cases is described as follows. In this paper, we proposed a method
of estimating the image resolution for a depth image rendered after the selection of the
viewpoint. We observed that there was a tendency of underestimated density if an error
occurred on selecting the viewpoint process and thus, the selected image resolution was too
low. The underestimation of resolution was induced owing to a small amount of error in
viewpoint, as presented in Table 4. Therefore, as evident from the experimental results for the
model simplification dataset, there is a case where fixed image resolution yields better
performance than the proposed resolution estimation method. However, in segmented point
cloud dataset, which is a dataset collected from real world scanning, proposed method results
best performance. Therefore, using the proposed method is superior in terms of automation of
the retrieval process.
5.2 Experiment on deep-learning-based shape retrieval
Further experimentation has been conducted on the deep-learning-based shape retrieval
approach. MVCNN [26] propose a network architecture where multiple images rendered from
a 3D object can be recognized as class labels. To extract features from multiple images, the
authors design the convolutional neural network that shares weights in first network. Next, the
second layer pools important features from multiple outputs of first network by max pooling.
Lastly, fully connected network classifies the object. Please refer to [26] for further details of
the method.
For the experimentation of the proposed method with MVCNN shape retrieval, we extend our
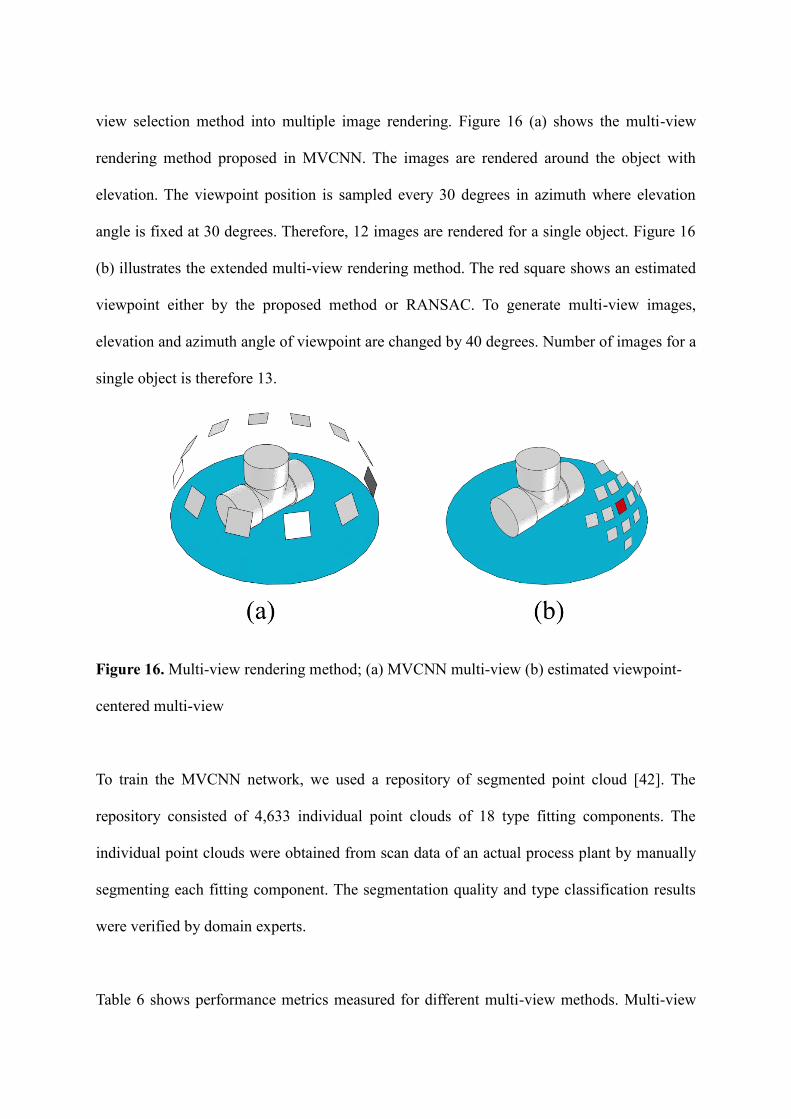
view selection method into multiple image rendering. Figure 16 (a) shows the multi-view
rendering method proposed in MVCNN. The images are rendered around the object with
elevation. The viewpoint position is sampled every 30 degrees in azimuth where elevation
angle is fixed at 30 degrees. Therefore, 12 images are rendered for a single object. Figure 16
(b) illustrates the extended multi-view rendering method. The red square shows an estimated
viewpoint either by the proposed method or RANSAC. To generate multi-view images,
elevation and azimuth angle of viewpoint are changed by 40 degrees. Number of images for a
single object is therefore 13.
Figure 16. Multi-view rendering method; (a) MVCNN multi-view (b) estimated viewpoint-
centered multi-view
To train the MVCNN network, we used a repository of segmented point cloud [42]. The
repository consisted of 4,633 individual point clouds of 18 type fitting components. The
individual point clouds were obtained from scan data of an actual process plant by manually
segmenting each fitting component. The segmentation quality and type classification results
were verified by domain experts.
Table 6 shows performance metrics measured for different multi-view methods. Multi-view
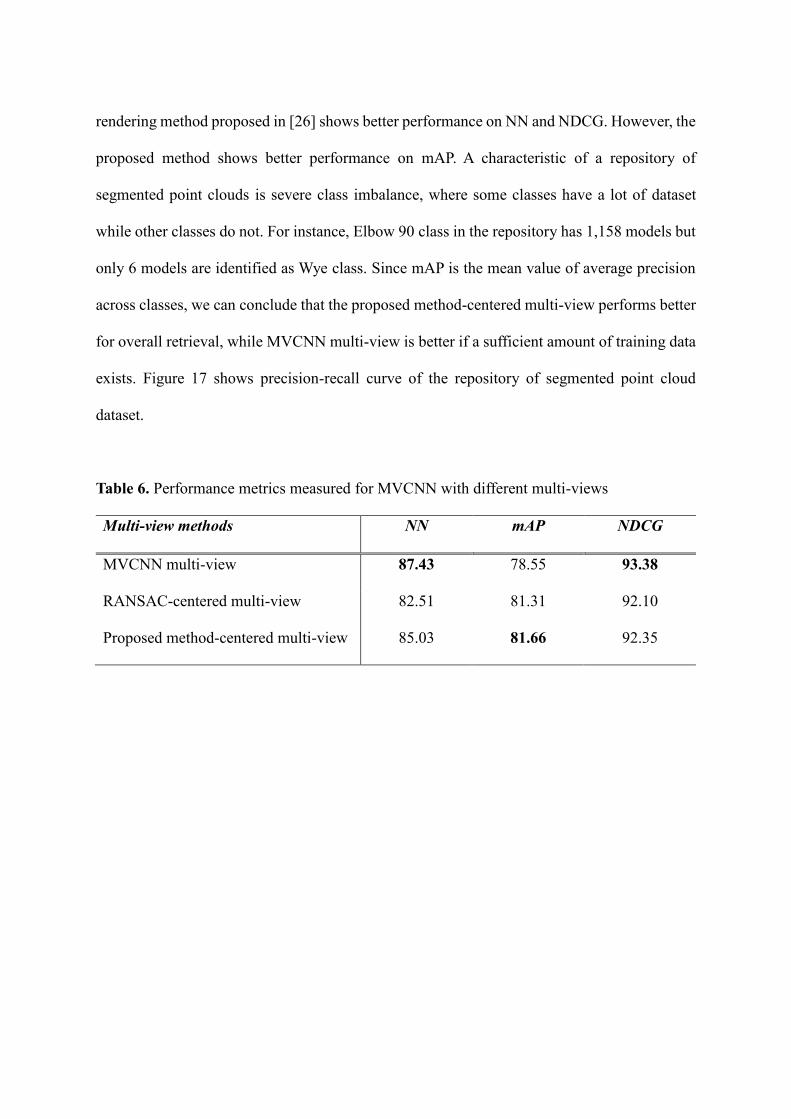
rendering method proposed in [26] shows better performance on NN and NDCG. However, the
proposed method shows better performance on mAP. A characteristic of a repository of
segmented point clouds is severe class imbalance, where some classes have a lot of dataset
while other classes do not. For instance, Elbow 90 class in the repository has 1,158 models but
only 6 models are identified as Wye class. Since mAP is the mean value of average precision
across classes, we can conclude that the proposed method-centered multi-view performs better
for overall retrieval, while MVCNN multi-view is better if a sufficient amount of training data
exists. Figure 17 shows precision-recall curve of the repository of segmented point cloud
dataset.
Table 6. Performance metrics measured for MVCNN with different multi-views
Multi-view methods NN mAP NDCG
MVCNN multi-view 87.43 78.55 93.38
RANSAC-centered multi-view 82.51 81.31 92.10
Proposed method-centered multi-view 85.03 81.66 92.35
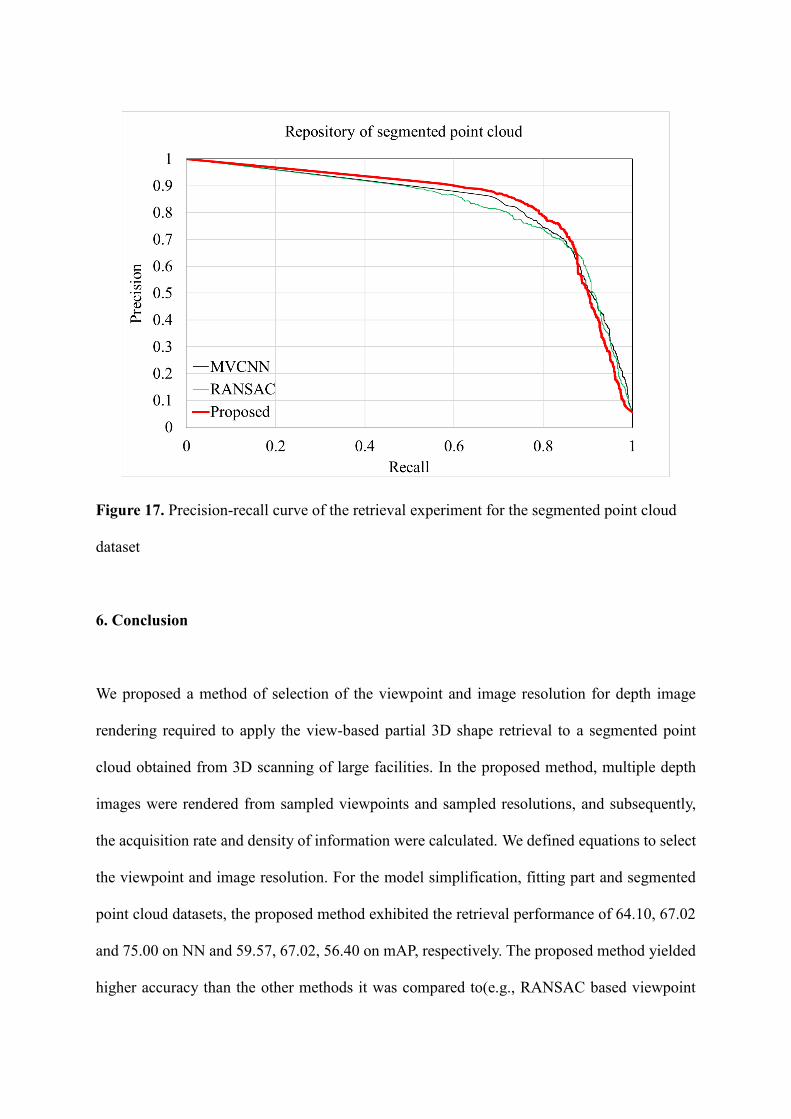
Figure 17. Precision-recall curve of the retrieval experiment for the segmented point cloud
dataset
6. Conclusion
We proposed a method of selection of the viewpoint and image resolution for depth image
rendering required to apply the view-based partial 3D shape retrieval to a segmented point
cloud obtained from 3D scanning of large facilities. In the proposed method, multiple depth
images were rendered from sampled viewpoints and sampled resolutions, and subsequently,
the acquisition rate and density of information were calculated. We defined equations to select
the viewpoint and image resolution. For the model simplification, fitting part and segmented
point cloud datasets, the proposed method exhibited the retrieval performance of 64.10, 67.02
and 75.00 on NN and 59.57, 67.02, 56.40 on mAP, respectively. The proposed method yielded
higher accuracy than the other methods it was compared to(e.g., RANSAC based viewpoint
selection). In the experiment on deep-learning-based shape retrieval, the proposed method
showed best performance on mAP metric. The performance showed a competitive advantage
to multi-view rendering method proposed in MVCNN considering the severe class imbalance
of experiment dataset. It is advantageous from the perspective of automation of the retrieval
process because the proposed method does not require any input from the user when applying
the view-based partial shape retrieval to a segmented point cloud of a large-scale facility.
However, the retrieval accuracy of the experiment shows a difference according to the
characteristics of datasets. Therefore, further research on the robustness of retrieval is required
with the improvement of retrieval accuracy.
Acknowledgment
This research was supported by the Industrial Core Technology Development Program (Project
ID: 20000725) funded by the Korea government (MOTIE), by the Basic Science Research
Program (Project ID: NRF-2019R1F1A1053542 and 2020R1G1A1008932) through the
National Research Foundation of Korea (NRF) funded by the Korea government (MSIT) .
References
[1] Maruyame, T., Kanai, S., Date, H., & Tada, M. (2016). Motion-capture-based walking
simulation of digital human adapted to laser-scanned 3D as-is environments for accessibility
evaluation. Journal of Computational Design and Engineering, 3(3), 250-265
[2] Tang, P., Huber, D., Akinci, B., Lipman, R., & Lytle, A. (2010). Automatic reconstruction
of as-built building information models from laser-scanned point clouds: A review of related
techniques. Automation in construction, 19(7), 829-843.
[3] Makadia, A., Patterson, A., & Daniilidis, K. (2006, June). Fully automatic registration of
3D point clouds. In Computer Vision and Pattern Recognition, 2006 IEEE Computer
Society Conference on (Vol. 1, pp. 1297-1304). IEEE.
[4] Anil, E. B., Akinci, B., & Huber, D. (2011, June). Representation requirements of as-is
building information models generated from laser scanned point cloud data. In Proceedings
of the International Symposium on Automation and Robotics in Construction (ISARC),
Seoul, Korea (Vol. 29).
[5] Son, H., Kim, C., & Kim, C. (2013). Fully automated as-built 3D pipeline segmentation
based on curvature computation from laser-scanned data. In Computing in Civil Engineering
(2013) (pp. 765-772).
[6] Woo, H., Kang, E., Wang, S., & Lee, K. H. (2002). A new segmentation method for point
cloud data. International Journal of Machine Tools and Manufacture, 42(2), 167-178.
[7] Zehtaban, L., Elazhary, O., & Roller, D. (2016). A framework for similarity recognition of
CAD models. Journal of Computational Design and Engineering, 3(3), 274-285.
[8] Tangelder, J. W., & Veltkamp, R. C. (2008). A survey of content based 3D shape retrieval
methods. Multimedia tools and applications, 39(3), 441.
[9] Osada, R., Funkhouser, T., Chazelle, B., & Dobkin, D. (2002). Shape distributions. ACM
Transactions on Graphics (TOG), 21(4), 807-832.
[10] Ohbuchi, R., Minamitani, T., & Takei, T. (2005). Shape-similarity search of 3D models
by using enhanced shape functions. International Journal of Computer Applications in
Technology, 23(2-4), 70-85.
[11] Savelonas, M. A., Pratikakis, I., & Sfikas, K. (2015). An overview of partial 3D object
retrieval methodologies. Multimedia Tools and Applications, 74(24), 11783-11808.
[12] Ohbuchi, R., & Furuya, T. (2009, September). Scale-weighted dense bag of visual features
for 3D model retrieval from a partial view 3D model. In Computer Vision Workshops
(ICCV Workshops), 2009 IEEE 12th International Conference on (pp. 63-70). IEEE.
[13] Zhang, C., & Chen, T. (2001). Efficient feature extraction for 2D/3D objects in mesh
representation. In Image Processing, 2001. Proceedings. 2001 International Conference on
(Vol. 3, pp. 935-938). IEEE.
[14] Paquet, E., Rioux, M., Murching, A., Naveen, T., & Tabatabai, A. (2000). Description of
shape information for 2-D and 3-D objects. Signal processing: Image communication, 16(1),
103-122.
[15] Kazhdan, M., Funkhouser, T., & Rusinkiewicz, S. (2003, June). Rotation invariant
spherical harmonic representation of 3 d shape descriptors. In Symposium on geometry
processing (Vol. 6, pp. 156-164).
[16] Novotni, M., & Klein, R. (2003, June). 3D Zernike descriptors for content based shape
retrieval. In Proceedings of the eighth ACM symposium on Solid modeling and applications
(pp. 216-225). ACM.
[17] Chua, C. S., & Jarvis, R. (1997). Point signatures: A new representation for 3d object
recognition. International Journal of Computer Vision, 25(1), 63-85.
[18] Rusu, R. B., Blodow, N., Marton, Z. C., & Beetz, M. (2008, September). Aligning point
cloud views using persistent feature histograms. In Intelligent Robots and Systems, 2008.
IROS 2008. IEEE/RSJ International Conference on (pp. 3384-3391). IEEE.
[19] McWherter, D., Peabody, M., Shokoufandeh, A. C., & Regli, W. (2001, May). Database
techniques for archival of solid models. In Proceedings of the sixth ACM symposium on
Solid modeling and applications (pp. 78-87). ACM.
[20] Biasotti, S., Marini, S., Mortara, M., Patane, G., Spagnuolo, M., & Falcidieno, B. (2003,
November). 3D shape matching through topological structures. In International Conference
on Discrete Geometry for Computer Imagery (pp. 194-203). Springer, Berlin, Heidelberg.
[21] Sundar, H., Silver, D., Gagvani, N., & Dickinson, S. (2003, May). Skeleton based shape
matching and retrieval. In Shape Modeling International, 2003 (pp. 130-139). IEEE.
[22] Liu, Y. J., Luo, X., Joneja, A., Ma, C. X., Fu, X. L., & Song, D. (2013). User-adaptive
sketch-based 3-D CAD model retrieval. IEEE Transactions on Automation Science and
Engineering, 10(3), 783-795.
[23] Sánchez-Cruz, H., & Bribiesca, E. (2003). A method of optimum transformation of 3D
objects used as a measure of shape dissimilarity. Image and Vision Computing, 21(12),
1027-1036.
[24] Dey, T. K., Giesen, J., & Goswami, S. (2003, January). Shape segmentation and matching
with flow discretization. In WADS (Vol. 3, pp. 25-36).
[25] Cohen, I., Ayache, N., & Sulger, P. (1992). Tracking points on deformable objects using
curvature information. In Computer Vision—ECCV'92 (pp. 458-466). Springer
Berlin/Heidelberg.
[26] Su, H., Maji, S., Kalogerakis, E., & Learned-Miller, E. (2015). Multi-view convolutional
neural networks for 3d shape recognition. In Proceedings of the IEEE international
conference on computer vision (pp. 945-953).
[27] Kanezaki, A., Matsushita, Y., & Nishida, Y. (2016). RotationNet: Joint Object
Categorization and Pose Estimation Using Multiviews from Unsupervised Viewpoints.
arXiv preprint arXiv:1603.06208.
[28] Maturana, D. & Scherer, S. (2015). VoxNet: A 3D Convolutional Neural Network for
real-time object recognition, IROS 2015, 922-928.
[29] Qi, C.R., Su, H., Mo, K. & Guibas, L.J. (2016). PointNet: Deep Learning on Point Sets
for 3D Classification and Segmentation. arXiv preprint arXiv:1612.00593.
[30] Vazquez, P., Feixas, M., Sbert, M. and Heidrich, W. (2001) Viewpoint Selection using
Viewpoint Entropy, Proceedings of the Vision Modeling and Visualization Conference
2001, pp.273-280.
[31] Feixas, M., Sbert, M. and Gonzalez F. (2009) A unified information-theoretic framework
for viewpoint selection and mesh saliency, ACM Transactions on Applied Perception, 6(1),
pp.1-23.
[32] Tasse, F. P., Kosinka, J. and Dodgson, N. (2015) Cluster-based point set saliency, 2015
IEEE International Conference on Computer Vision(ICCV) 2015, pp.163-171.
[33] Lowe, D. G. (1999). Object recognition from local scale-invariant features. In Computer
vision, 1999. The proceedings of the seventh IEEE international conference on (Vol. 2, pp.
1150-1157). IEEE.
[34] Jegou, H., Perronnin, F., Douze, M., Sanchez, J., Perez, P. & Schmid C. (2012).
Aggregating Local Image Descriptors into Compact Codes, IEEE Transactions on Pattern
Analysis and Machine Intelligence, 34(9), pp.1704-1716.
[35] Sanchez, J., Perronnin, F., Mensink, T. & Verbeek, J. (2013). Image Classifi cation with
the Fisher Vector: Theory and Practice, International Journal of Computer Vision, 105(3),
pp.222-245.
[36] Marton, Z. C., Rusu, R. B., & Beetz, M. (2009, May). On fast surface reconstruction
methods for large and noisy point clouds. In Robotics and Automation, 2009. ICRA'09.
IEEE International Conference on (pp. 3218-3223). IEEE.
[37] Kanmani, M. & Narsimhan, V. (2018), An image contrast enhancement algorithm for
grayscale images using particle swarm optimization, Multimedia Tools and Applications,
77, pp.23371-23387.
[38] Kanmani, M. & Narsimhan, V. (2016), Swarm intelligence based optimisation in thermal
image fusion using dual tree discrete wavelet transform, Quantitative Infrared
Thermography Journal, 14(1), pp.24-43.
[39] Kanmani, M. & Narsimhan, V. (2018), Swarm intelligent based contrast enhancement

algorithm with improved visual perception for color images, Multimedia Tools and
Applications, 77, pp.12701-12724.
[40] Kanmani, M. & Narsimhan, V. (2017), An optimal weighted averaging fusion strategy for
thermal and visible images using dual tree discrete wavelet transform and self tunning
particle swarm optimization, Multimedia Tools and Applications, 77, pp.20989-21010.
[41] Shilane, P., Min, P., Kazhdan, M., & Funkhouser, T. (2004, June), The Princeton Shape
Benchmark, Proceedings of the Shape Modeling International 2004, 167-178.
[42] Yeo, C., Kim, S., Kim, H., Kim, S. & Mun, D (2020) Deep learning applications in an
industrial process plant: Repository of segmented point clouds for pipework components,
JMST Advances, 2(1), pp.15-24.