Embed Size (px)
Citation preview

COX PROPORTIONAL HAZARDS MODEL AND
ITS CHARACTERISTICS
March 11, 2011 1Cox Proportional Hazards Model

OUTLINE
Introduction to Linear Regression
The Formula for the Cox PH Model
Example
Why the Cox PH Model is Popular
Computing the Hazard Ratio
ML Estimation of the Cox PH Model
Adjusted Survival Curves
The Meaning of the PH Assumption
Summary
March 11, 2011 2Cox Proportional Hazards Model

INTRODUCTION TO LINEAR REGRESSION
March 11, 2011 3Cox Proportional Hazards Model

Linear Regression
Describes a relation between some explanatory (predictor) variables and a variable of special interest, called the response variable
Example: response var.: apartment rent
predictor vars.: size, location, furnishing,…
Goals with regression Understanding the relation between explanatory and response vars.
Prediction of the value of the response var. for new explanatory vars.
March 11, 2011 4Cox Proportional Hazards Model

Simple Linear Regression
Only 1 predictor
Model:
Where:
ji
iεVar
iE
x
Y
ji
i
i
if 0,Cov
allfor
allfor 0 s.t. ,error terman is
tscoefficien regression and
predictor theis
response theis
2
10
nixY iii ,...,1 , 10
March 11, 2011 5Cox Proportional Hazards Model

Simple Linear Regression
Parameter estimation Estimates of denoted by
Determined by least square approach
Interpretation: increases by 1 unit increases by
Inference on parameters Is there a statistically significant relation btw. and ?
Is signifficantly different from 0 ?
Prediction
x 1
Yx
*
10
* ˆˆˆ xY
10ˆ and ˆ
10 and
1
Y
March 11, 2011 6Cox Proportional Hazards Model

Multiple Linear Regression
p predictors, p > 1
Model:
Where:
before as sassumption same with the,error terman is
tscoefficien regression are ,...,
predictors are ,...,
response theis
0
1
p
pxx
Y
nixxxY iippiii ,...,1 , ...22110
March 11, 2011 7Cox Proportional Hazards Model
Multiple Linear Regression
j
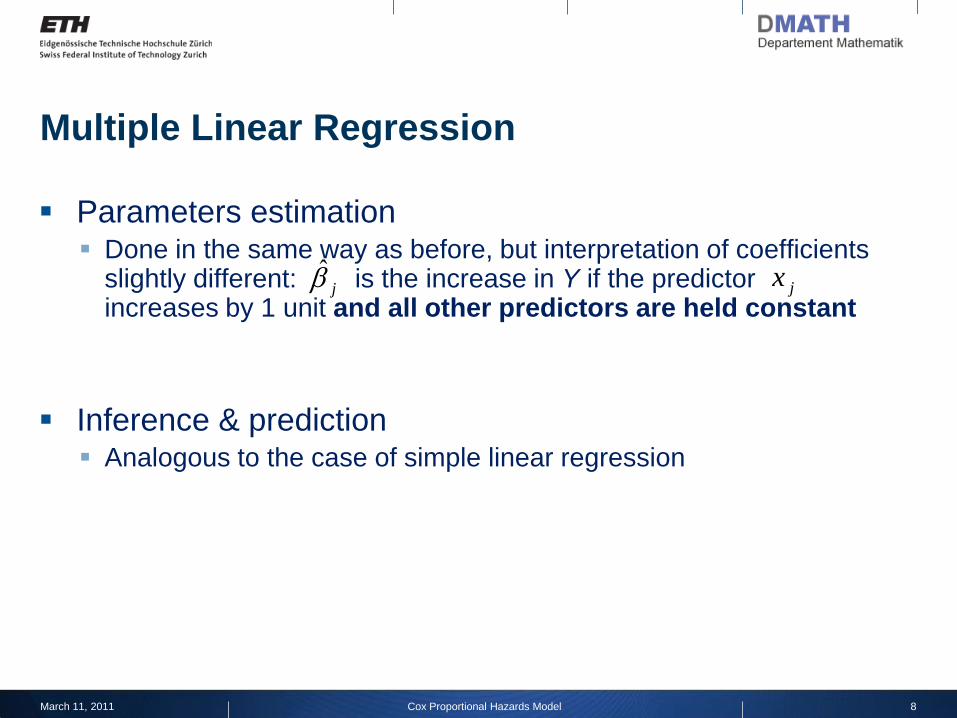
Parameters estimation Done in the same way as before, but interpretation of coefficients
slightly different: is the increase in Y if the predictor increases by 1 unit and all other predictors are held constant
Inference & prediction Analogous to the case of simple linear regression
jx
March 11, 2011 8Cox Proportional Hazards Model

Can a Multiple Regression be Substituted by
Many Simple Regressions?
Consider the following models:
Assume are correlated and are
significantly different from zero. Then if we use model (2),
a part of the effect of will be mistakenly attributed to .
Hence in general. Similarly,
iii
iii
iiii
xY
xY
xxY
220
110
22110
)3(
)2(
)1(
21 and xx 21ˆ and ˆ
2x1x
11ˆˆ
March 11, 2011 9Cox Proportional Hazards Model
.ˆˆ22

Confounding and Interaction
Confounding: Extraneous variable correlated with both dependent and
independent variable
May lead to wrong conclusions about causal relationship of independent and dependent variable
Interaction: Independent variables combine to affect a dependent variable
Not to be confused with correlation
March 11, 2011 10Cox Proportional Hazards Model

Example of Confounding
11March 11, 2011 11Cox Proportional Hazards Model

Example of Interaction
March 11, 2011 12Cox Proportional Hazards Model

Precision gain
Assume a multiple regression with two regressors X1 and
X2
X1 is the variable of interest and X2 is not statistically
significant
Yet confidence interval for X1 is narrower when X2 is
present
We prefer to keep X2 in the model to have a better estimate
for X1
March 11, 2011 13Cox Proportional Hazards Model

THE FORMULA FOR THE COX PH MODEL
March 11, 2011 14Cox Proportional Hazards Model

The Formula for the Cox PH Model
p
i
ii Xthth1
0 exp, X
March 11, 2011 15Cox Proportional Hazards Model
pXXX ,,, 21 X
The formula for the Cox PH model is
where
are the explanatory/predictor variables.

Explanation of the Formula
Product of two quantities: is called the baseline hazard
Exponential of the sum of and
‟s zero (no ‟s): reduces to baseline hazard
Baseline hazard is an unspecified function Semi-parametric model
Reason for Cox model being popular
March 11, 2011 16Cox Proportional Hazards Model
th0
i iX
X X
p
i
ii Xthth1
0 exp, X
Parametric Models
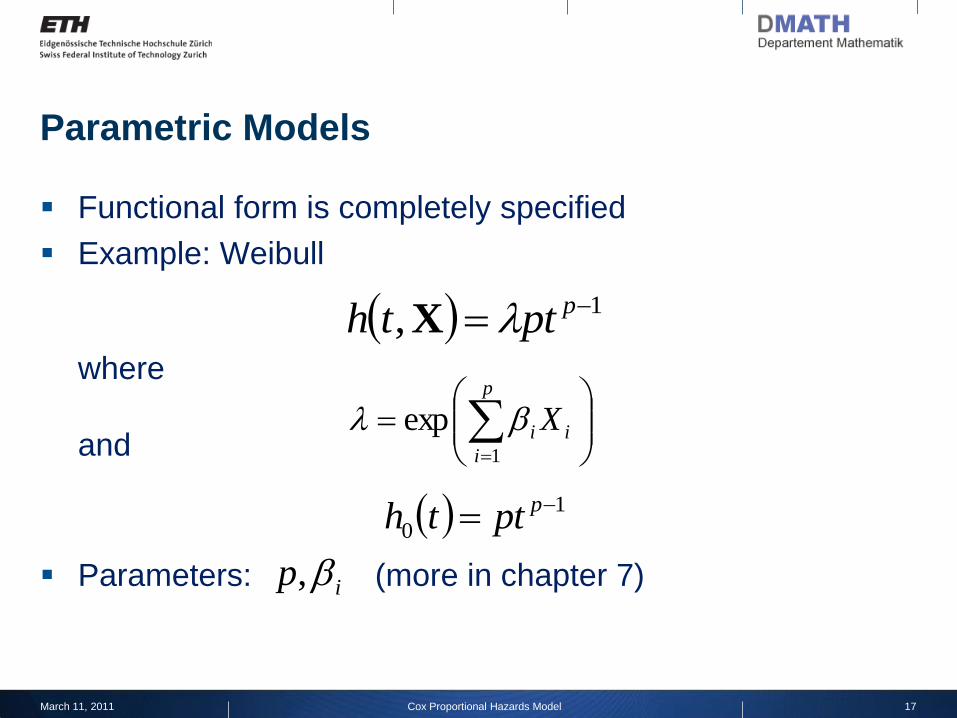
Functional form is completely specified
Example: Weibull
where
and
Parameters: (more in chapter 7)
March 11, 2011 17Cox Proportional Hazards Model
1, pptth X
p
i
ii X1
exp
1
0
pptth
ip ,

Important Properties of the Cox PH Formula
The baseline hazard does not depend on but only
on .
The exponential involves the ‟s but not .
The are time-independent
Proportional Hazard assumption follows
March 11, 2011 18Cox Proportional Hazards Model
th0 Xt
tX
X
p
i
ii Xthth1
0 exp, X

Time Independent Variables
Not changing over time Example: sex
Values are set at time
Variables unlikely to change are often considered time
independent Example: smoking status
Also other variables are sometimes treated as time
independent Examples: age, weight
March 11, 2011 19Cox Proportional Hazards Model
0t

Extension to Time Dependent X
Doesn‟t satisfy PH assumption
Need extended Cox model (chapter 6)
March 11, 2011 20Cox Proportional Hazards Model

NUMERICAL EXAMPLE
March 11, 2011 21Cox Proportional Hazards Model
March 11, 2011 22Cox Proportional Hazards Model
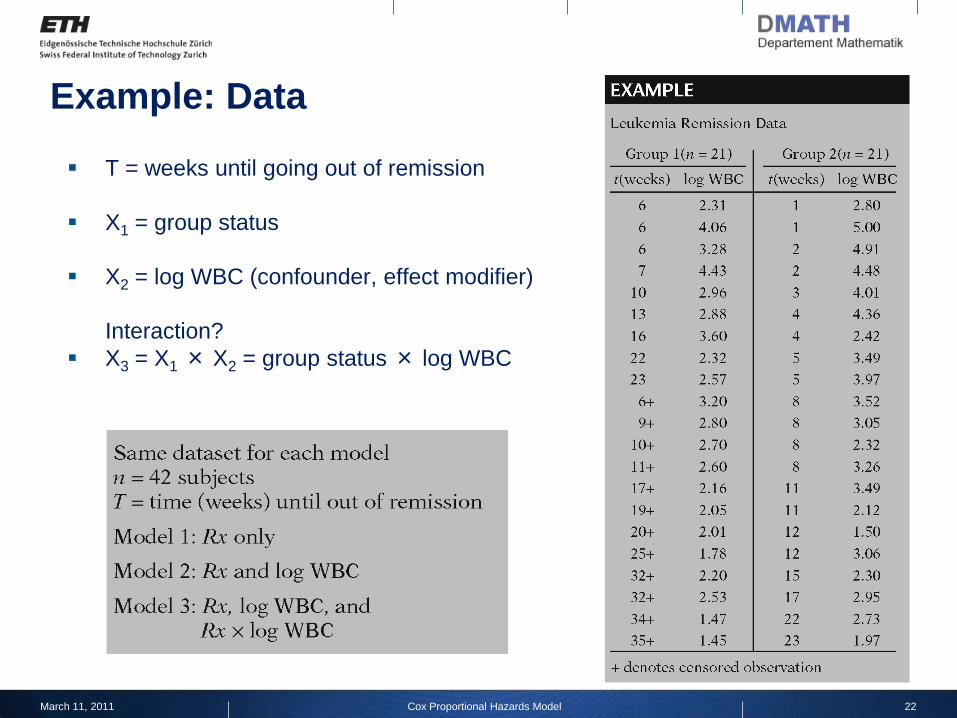
Example: Data
T = weeks until going out of remission
X1 = group status
X2 = log WBC (confounder, effect modifier)
Interaction?
X3 = X1× X2 = group status× log WBC

n= 42
coef exp(coef) se(coef) z Pr(>|z|) Rx 1.5092 4.5231 0.4096 3.685 0.000229 ***---Signif. codes: 0 ‘***’ 0.001 ‘**’ 0.01 ‘*’ 0.05 ‘.’ 0.1 ‘ ’ 1
exp(coef) exp(-coef) lower .95 upper .95Rx 4.523 0.2211 2.027 10.09
Rsquare= 0.304 (max possible= 0.989 )Likelihood ratio test = 15.21 on 1 df, p=9.615e-05Wald test = 13.58 on 1 df, p=0.0002288Score (logrank) test = 15.93 on 1 df, p=6.571e-05
> model1$loglik[2][1] -86.37962
Example: R Output Model 1
March 11, 2011 23Cox Proportional Hazards Model
Call:
coxph(formula = Surv(time, event) ~ Rx, data = Data, method = "breslow")

n= 42
coef exp(coef)se(coef) z Pr(>|z|) Rx 2.3549 10.5375 1.6810 1.401 0.161 logWBC 1.8028 6.0665 0.4467 4.036 5.45e-05 ***Rx:logWBC -0.3422 0.7102 0.5197 -0.658 0.510 ---
exp(coef) exp(-coef)lower .95 upper .95Rx 10.5375 0.0949 0.3907 284.201logWBC 6.0665 0.1648 2.5275 14.561Rx:logWBC 0.7102 1.4080 0.2564 1.967
Rsquare= 0.648 (max possible= 0.989 )Likelihood ratio test= 43.8 on 3 df, p=1.633e-09Wald test = 30.6 on 3 df, p=1.030e-06Score (logrank) test = 45.9 on 3 df, p=5.95e-10
> model3$loglik[2][1] -72.06572
Example: R Output Model 3
March 11, 2011 24Cox Proportional Hazards Model
Call:coxph(formula = Surv(time, event) ~ Rx * logWBC, data = Data, method = "breslow")

n= 42
coef exp(coef)se(coef)z Pr(>|z|) Rx 1.2941 3.6476 0.4221 3.066 0.00217 ** logWBC 1.6043 4.9746 0.3293 4.872 1.11e-06 ***---
exp(coef) exp(-coef) lower .95 upper .95Rx 3.648 0.2742 1.595 8.343logWBC 4.975 0.2010 2.609 9.486
Rsquare= 0.644 (max possible= 0.989 )Likelihood ratio test= 43.41 on 2 df, p=3.744e-10Wald test = 31.78 on 2 df, p=1.254e-07Score (logrank) test = 42.94 on 2 df, p=4.743e-10
> model2$loglik[2][1] -72.27926
Example: R Output Model 2
March 11, 2011 25Cox Proportional Hazards Model
Call:coxph(formula = Surv(time, event) ~ Rx + logWBC, data = Data, method = "breslow")

March 11, 2011 26Cox Proportional Hazards Model
Example: Continued
Reasons to include logWBC in the
model
Precision of confidence
intervals: even if no
confounding we might
prefer to keep logWBC if
CI is smaller
Confounding: crude versus
adjusted HR are
meaningfully different
▬►must control for logWBC

WHY IS THE COX PH MODEL POPULAR?
March 11, 2011 27Cox Proportional Hazards Model

Reasons for the Popularity of the Model
0
10
0 exp)(),(
p
i
ii Xthth X
Robustness Cox model is a “safe” choice of a model in many situations
Because of the model form:
the estimated hazards are always non-negative.
Even though is unspecified we can estimate
and thus compute the hazard ratio.
th0 si '
March 11, 2011 28Cox Proportional Hazards Model

Reasons for the Popularity of the Model
and can be estimated for a Cox model using
a minimum of assumptions.
In survival analysis the Cox model is preferred to a
logistic model, since the latter one ignores survival times
and censoring information.
X,th X,tS
March 11, 2011 29Cox Proportional Hazards Model

COMPUTING THE HAZARD RATIO
March 11, 2011 30Cox Proportional Hazards Model

Definition of the Hazard Ratio
The Hazard Ratio is defined as
where
and
March 11, 2011 31Cox Proportional Hazards Model
X
X
,ˆ
,ˆ *
th
thHR
**
2
*
1
* ,,, pXXX X
pXXX ,,, 21 X

Interpretation of the Hazard Ratio
Hazard for one individual divided by the hazard for a
different individual
For sake of interpretation we usually want i.e.
We thus typically take : group with larger hazard (e.g. placebo group)
: group with smaller hazard (e.g. treatment group)
March 11, 2011 32Cox Proportional Hazards Model
1HR
XX ,ˆ,ˆ * thth
*XX

Simplification of the Hazard Ratio
Baseline hazard cancels out
March 11, 2011 33Cox Proportional Hazards Model
p
i
iiip
i
ii
p
i
ii
XX
Xth
Xth
th
thHR
1
*
1
0
1
*
0*
ˆexp
ˆexpˆ
ˆexpˆ
,ˆ
,ˆ
X
X

Example: Remission Data, Model 1
Only one variable of interest: exposure status Placebo group:
Treatment group:
Hazard Ratio simplifies to
Since
we have
March 11, 2011 34Cox Proportional Hazards Model
1*
1 X
01 X
ˆ
1
*
11ˆexp eXXHR
509.1ˆ
523.4HR

Example: Remission Data, Model 2
Two variables of interest: exposure status and logWBC Placebo group:
Treatment group:
logWBC is held constant
No product terms
March 11, 2011 35Cox Proportional Hazards Model
ˆ
21
2
*
221
*
11
loglogˆ01ˆexp
ˆˆexp
e
WBCWBC
XXXXHR
1*
1 X
01 X

Example: Remission Data, Model 2
Since
we have
Hazard Ratio is independent of logWBC
Hazard Ratio different from model 1 because estimates
change
March 11, 2011 36Cox Proportional Hazards Model
294.1ˆ
648.3HR

Example: Remission Data, Model 3
Three variables of interest
Product terms
Hazard Ratio depends on logWBC
March 11, 2011 37Cox Proportional Hazards Model
WBC
WBCWBC
XXHRi
iii
logˆˆexp
log0log1ˆˆexp
ˆexp
31
3
3
1
*

ML ESTIMATION OF THE COX PH MODEL
March 11, 2011 38Cox Proportional Hazards Model
Full Likelihood and Baseline Hazard Estimation
March 11, 2011 39Cox Proportional Hazards Model
jjjj
n
j
jjjj
n
j
n
j
jjn
XTHXTh
XTSXTh
TFTfFL
jj
j
jj
'exp)(exp'exp)(
)|()|(
))(1()()(
0
1
0
1
1
1
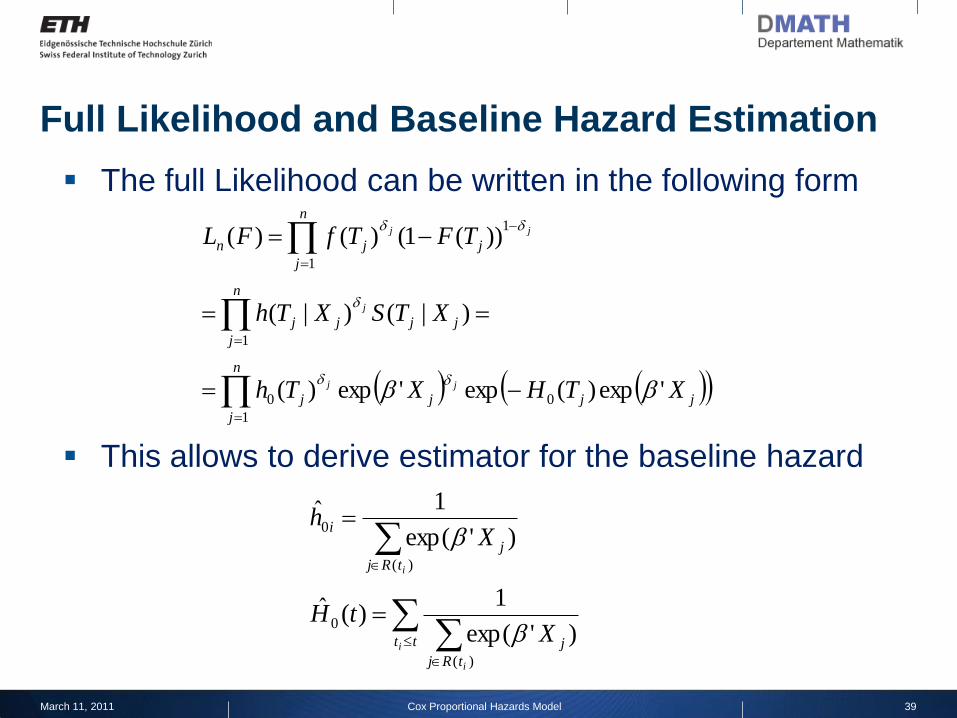
The full Likelihood can be written in the following form
This allows to derive estimator for the baseline hazard
tt
tRj
j
tRj
j
i
i
i
i
XtH
Xh
)(
0
)(
0
)'exp(
1)(ˆ
)'exp(
1ˆ

The Cox Likelihood
Assume k different failure times s.t. there is
exactly one failure at each
Let denote the subject with an event at time and
the risk set at time t
The Cox likelihood is given by
)()2()1( ... kttt
.,...,1,)( kit i
][i )(it tR
March 11, 2011 40Cox Proportional Hazards Model
k
j
tRl
p
i
lii
p
i
iji
j
X
X
L1
1
1
][
exp
exp
β

The Cox Likelihood
L is also called “partial” likelihood Considers probabilities for subject who fail
Does not consider probabilities for censored subjects explicitly
Censored subjects are taken into account in the risk set
Estimates of denoted by
i.e. maximize the Cox likelihood
si ' si '
piL
i
i ,...,1 ,0log
solves ˆ
si '
March 11, 2011 41Cox Proportional Hazards Model

Properties of the Estimates
is asymptotically normal
kp as ˆ ββ
bygiven matrix n informatio -Fisher theis whereˆ 1 IIVar β
ββ LLEI
ji
ji loglog,
β
March 11, 2011 42Cox Proportional Hazards Model

Gary, Larry, Barry have lottery tickets
Winning tickets chosen at times t1, t2, . . .
Each person ultimately chosen
Can be chosen only once
What is the probability that the order chosen is as follows:
Barry, Gary, Larry?
March 11, 2011 43Cox Proportional Hazards Model
The Cox Likelihood: Example

New scenario: Barry has 4 tickets, Gary has 1 ticket, Larry
has 2 tickets
What is the probability that the order chosen is again:
Barry, Gary, Larry?
March 11, 2011 44Cox Proportional Hazards Model
The Cox Likelihood: Example
Subject„s number of tickets affects probability
For Cox model subject‟s pattern of covariates affects
likelihood of ordered events

March 11, 2011 45Cox Proportional Hazards Model
The Cox Likelihood: Example
Data
Cox PH Model

March 11, 2011 46Cox Proportional Hazards Model
The Cox Likelihood: Example
𝐿 = ℎ0 𝑡 𝑒
𝛽1
ℎ0 𝑡 𝑒𝛽1 + ℎ0 𝑡 𝑒
0 + ℎ0 𝑡 𝑒0 + ℎ0 𝑡 𝑒
𝛽1
× ℎ0 𝑡 𝑒
0
ℎ0 𝑡 𝑒0 + ℎ0 𝑡 𝑒
0 + ℎ0 𝑡 𝑒𝛽1
× ℎ0(𝑡)𝑒𝛽1
ℎ0 𝑡 𝑒𝛽1
The likelihood
The baseline hazard cancels out and does not play
any role in estimation
Likelihood determined only by the order of events

ADJUSTED SURVIVAL CURVES USING THE COX
PH MODEL
March 11, 2011 47Cox Proportional Hazards Model

Estimation of Survival Curves
No Model: Kaplan-Meier method (chapter 2)
Cox model: adjusted survival curves Adjust for explanatory variables used as predictors
Like KM curves plotted as step functions
March 11, 2011 48Cox Proportional Hazards Model

Converting Hazard Functions to Survival
Functions
Hazard Function:
Survival Function:
March 11, 2011 49Cox Proportional Hazards Model
p
i
ii Xthth1
0 exp, X
tStS
p
iii X
0, 1
exp
X

Estimated Survival Function
Estimated survival function:
Estimated quantities:
March 11, 2011 50Cox Proportional Hazards Model
tStS
p
iii X
0ˆ,ˆ 1
ˆexp
X
itS ,ˆ0

Example: Remission Data
### R Code
## Read the data
[…]
## Fit model 2 and plot
model2 <- coxph(Surv(time,event)
~ Rx + logWBC,
method="breslow", data=Data)
plot(survfit(model2,
newdata=data.frame(Rx=c(0,1),
logWBC=rep(mean(logWBC),2))),
lty=c(1,2), xlab="Time",
ylab="Estimated S(t)",
main="Adjusted Survival Curves")
March 11, 2011 51Cox Proportional Hazards Model

MEANING OF THE PROPORTIONAL HAZARDS
ASSUMPTION
March 11, 2011 52Cox Proportional Hazards Model

p
i
iii XXHR1
*ˆexp
March 11, 2011 53Cox Proportional Hazards Model
Meaning of the PH Assumption
Remember that the PH assumption requires that the HR is
constant over time

A study in which cancer patients are randomized to either
surgery or radiation therapy without surgery
(0,1) exposure variable denoting surgery status, with 0 if a
patient receives surgery and 1 if not
exposure variable is the only variable of interest
Is this model appropriate?
No. Why?
March 11, 2011 54Cox Proportional Hazards Model
Meaning of the PH Assumption: Example

March 11, 2011 55Cox Proportional Hazards Model
Meaning of the PH Assumption: Example
High risk for complications from surgery or perhaps even death early
in the recovery process
We expect to see hazard functions for each group that cross
It is therefore inappropriate to use a CoxPH model for this situation
General rule: If the hazards
cross, then a Cox
PH model is not appropriate
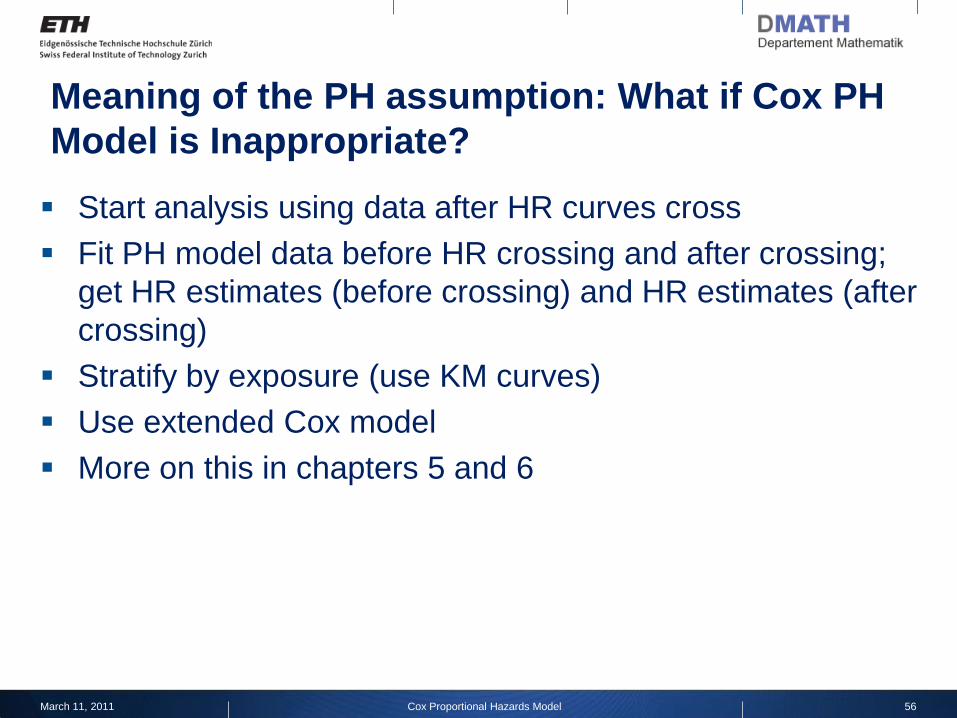
Start analysis using data after HR curves cross
Fit PH model data before HR crossing and after crossing;
get HR estimates (before crossing) and HR estimates (after
crossing)
Stratify by exposure (use KM curves)
Use extended Cox model
More on this in chapters 5 and 6
March 11, 2011 56Cox Proportional Hazards Model
Meaning of the PH assumption: What if Cox PH
Model is Inappropriate?

SUMMARY
March 11, 2011 57Cox Proportional Hazards Model

Summary
Introduction to Linear Regression
Simple vs. multiple
Confounding and interaction
Precision gain
The Formula for the Cox PH Model
Formula:
Semi-parametric model
Leukemia example
p
i
ii Xthth1
0 exp)(),( X
March 11, 2011 58Cox Proportional Hazards Model
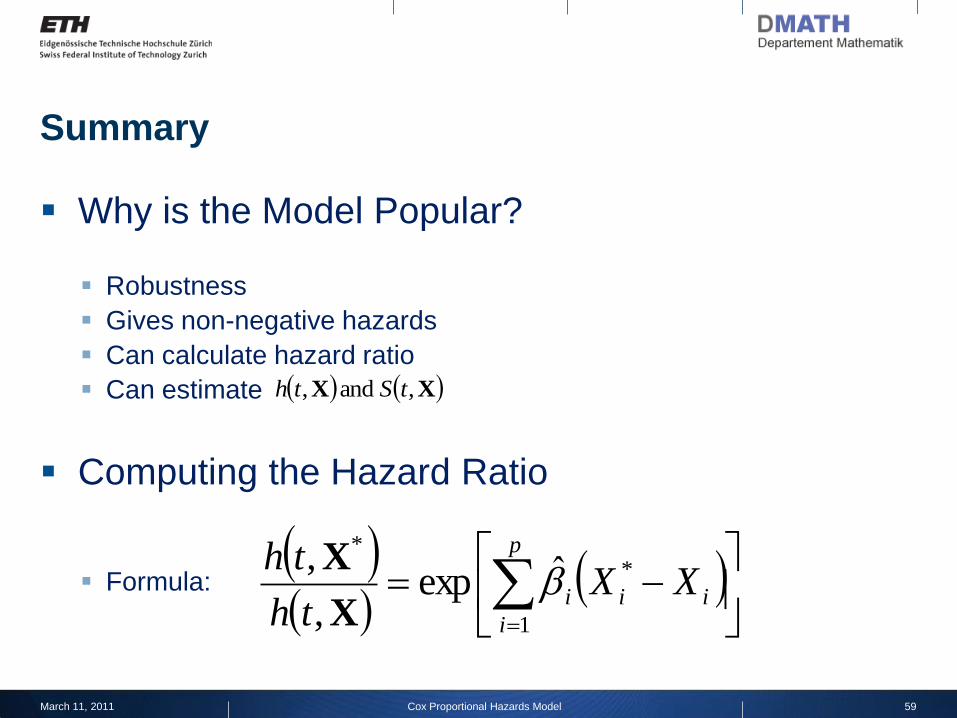
Summary
Why is the Model Popular?
Robustness
Gives non-negative hazards
Can calculate hazard ratio
Can estimate
Computing the Hazard Ratio
Formula:
XX , and , tSth
p
i
iii XXth
th
1
**
ˆexp,
,
X
X
March 11, 2011 59Cox Proportional Hazards Model

Summary
Adjusted Survival Curves Using the Cox PH Model
Survival curve formula obtained from hazard function
To get adjusted curve usually use mean values for the covariates
i
XitStS
exp
0,X
March 11, 2011 60Cox Proportional Hazards Model
ML Estimation for Cox PH Model
Full likelihood
Partial likelihood
Example

Summary
The Meaning of the PH Assumptions
Hazard ratio independent of time
Baseline hazard not involved in the HR formula
An example when PH assumption does not hold (crossing hazards)
March 11, 2011 61Cox Proportional Hazards Model

March 11, 2011 62Cox Proportional Hazards Model
References
[1] D. G. Kleinbaum & M. Klein, Survival Analysis - A Self-Learning Text.
Springer, Second Edition, 2005.
[2] D. R. Cox, Regression Models and Life-Tables. Imperial College, London,
1972.
[3] J. Fox, Applied Regression Analysis, Linear Models, and Related Methods.
Sage Publications, 1997.
[4] M. Dettling, Lecture Notes on Applied Statistical Regression. ETH Zurich,
2010. Available at http://stat.ethz.ch/education/semesters/as2010/asr/ASR-
HS10-Scriptum.pdf
[5] J. P. Klein & M. L. Moeschberger, Survival Analysis: Techniques for
Censored and Truncated Data. Springer, Second Edition, 2003.


![Blood Pressure Prediction via Recurrent Models with ...papers.… · regression model [9], predicting coronary heart disease with cox proportional hazards regression model [34], etc](https://img.pdfslide.us/doc/110x75/5f41c6a2efc43403d05b8e1c/blood-pressure-prediction-via-recurrent-models-with-regression-model-9.jpg)