Embed Size (px)
Citation preview
COVID-19 IN CANADA
Page | 1 Public Health Agency of Canada
WEEKLY EPIDEMIOLOGY UPDATE (1-7 JULY 2020)
Published: 10 July 2020
a Source: Provincial and Territorial MOH websites as of 7 July. b Difference in percentage points. c Data for laboratory analyses are as of 5 July.
KEY UPDATES
From 1 to 7 July 2020, 1 963 cases and 120 deaths were reported in Canada.
o Quebec and Ontario continue to drive the epidemic in Canada accounting for 1 531 (78%)
total cases and 106 (88%) total deaths this week.
o Nunavut reported its first probable case of COVID-19 and investigation is ongoing.
o Alberta has the highest age-standardized incidence rate at 12.6 cases per 100 000
population.
o Alberta, Nova Scotia, Prince Edward Island and Nunavut reported increases in the number
of new cases.
o Prince Edward Island reported five new cases after reporting no new cases since April 28.
The number of new cases within Canada continues to decrease (-13%) despite persistent community
transmission observed within high-density areas.
Since 24 May 2020, a decreasing rate of cases has been observed among all age groups,
particularly among those over 80 years of age (males and females).
o This week, the highest incidence rate among males in younger age groups is within cases
aged 20-29 years (8.5 per 100 000 population) and among females is within the older age
groups, specifically those over the age of 80 (10 per 100 000 population).
The median time from symptom onset to lab specimen collection over the course of the pandemic
has improved over time and is currently at 3.5 days.
The average number of people tested daily over the last week has remained high at 37 647 people
per day. The percent positivity remains low and stable at 0.8%.
Forecasting shows 106 015 to 111 260 cumulative reported cases and 8 560 to 8 900 cumulative
number of deaths are predicted by 17 July 2020.
25% (-2b) PERCENT OF ACTIVE CASES a
67% (+1 b) RECOVERED CASES a
0.8% (0 b) PERCENT POSITIVEc
37 647 (-1 270) AVERAGE PEOPLE TESTED PER DAYc
1 963 (-289) NEW CASES REPORTEDa
120 (-17) NEW DEATHS REPORTED a
COVID-19 IN CANADA
Page | 2 Public Health Agency of Canada
NATIONAL TRENDS IN CASES AND DEATHS
As of 7 July 2020, a decrease in the weekly number of new cases was observed nationally (Table 1).
Decreases in the weekly number of new cases per day were seen in British Columbia,
Saskatchewan, Manitoba, Ontario, and Quebec.
Increases in the weekly number of new cases per day were seen in Alberta, Nova Scotia,
Prince Edward Island and Nunavut.
o Prince Edward Island reported five new cases after reporting no new cases since April 28.
o Nunavut reported its first probable case of COVID-19 and investigation is ongoing.
New Brunswick, Newfoundland, Yukon, and Northwest Territories have not reported any
new cases in over two weeks.
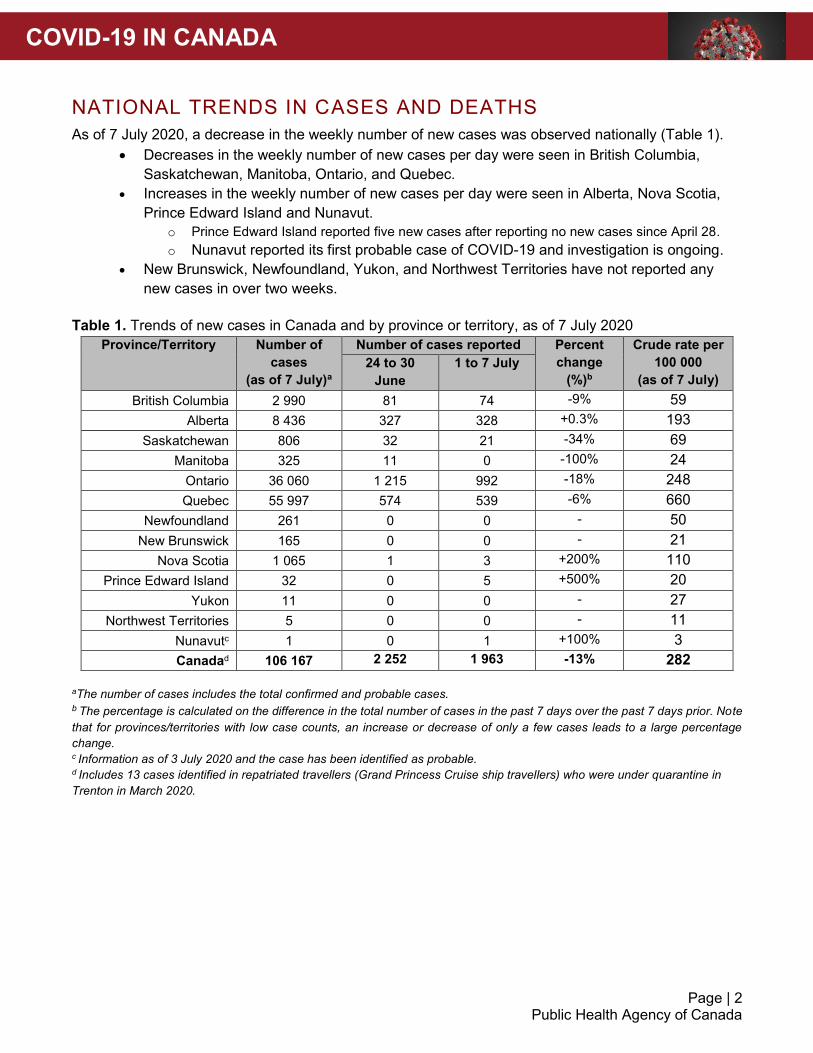
Table 1. Trends of new cases in Canada and by province or territory, as of 7 July 2020
Province/Territory Number of
cases
(as of 7 July)a
Number of cases reported Percent
change
(%)b
Crude rate per
100 000
(as of 7 July)
24 to 30
June
1 to 7 July
British Columbia 2 990 81 74 -9% 59
Alberta 8 436 327 328 +0.3% 193
Saskatchewan 806 32 21 -34% 69
Manitoba 325 11 0 -100% 24
Ontario 36 060 1 215 992 -18% 248
Quebec 55 997 574 539 -6% 660
Newfoundland 261 0 0 - 50
New Brunswick 165 0 0 - 21
Nova Scotia 1 065 1 3 +200% 110
Prince Edward Island 32 0 5 +500% 20
Yukon 11 0 0 - 27
Northwest Territories 5 0 0 - 11
Nunavutc 1 0 1 +100% 3
Canadad 106 167 2 252 1 963 -13% 282
aThe number of cases includes the total confirmed and probable cases. b The percentage is calculated on the difference in the total number of cases in the past 7 days over the past 7 days prior. Note
that for provinces/territories with low case counts, an increase or decrease of only a few cases leads to a large percentage
change.
c Information as of 3 July 2020 and the case has been identified as probable. d Includes 13 cases identified in repatriated travellers (Grand Princess Cruise ship travellers) who were under quarantine in
Trenton in March 2020.
COVID-19 IN CANADA
Page | 3 Public Health Agency of Canada
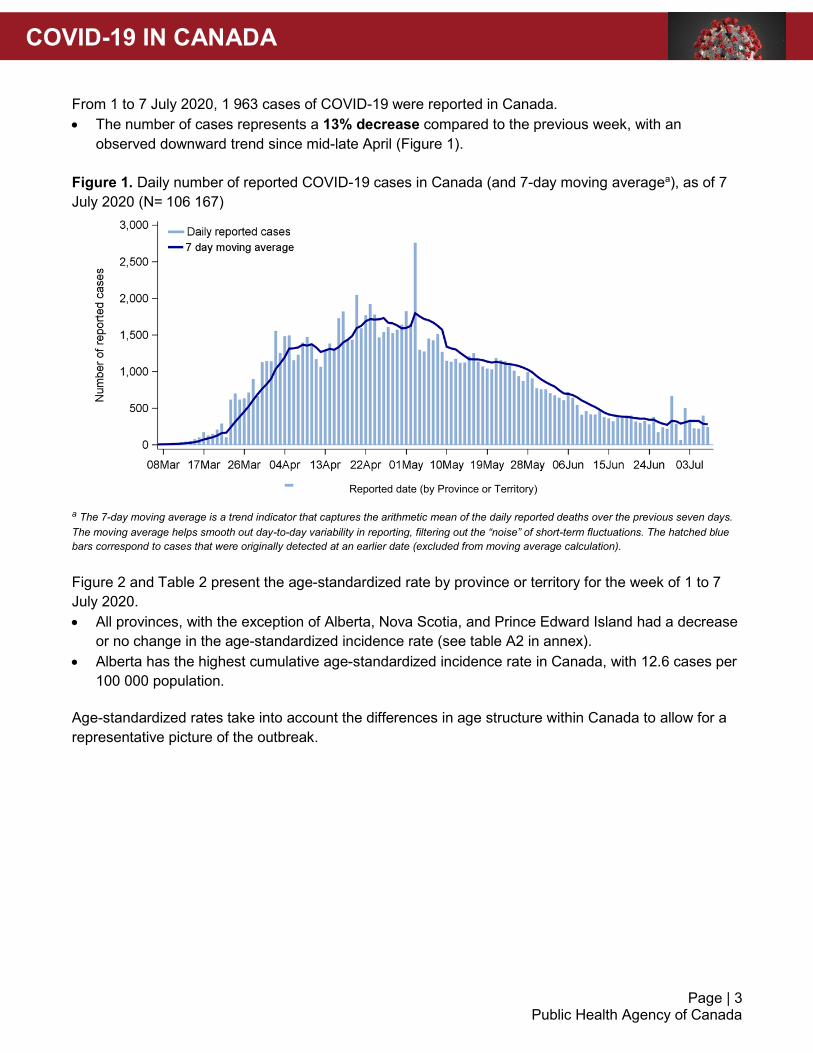
From 1 to 7 July 2020, 1 963 cases of COVID-19 were reported in Canada.
The number of cases represents a 13% decrease compared to the previous week, with an
observed downward trend since mid-late April (Figure 1).
Figure 1. Daily number of reported COVID-19 cases in Canada (and 7-day moving averagea), as of 7
July 2020 (N= 106 167)
a The 7-day moving average is a trend indicator that captures the arithmetic mean of the daily reported deaths over the previous seven days.
The moving average helps smooth out day-to-day variability in reporting, filtering out the “noise” of short-term fluctuations. The hatched blue
bars correspond to cases that were originally detected at an earlier date (excluded from moving average calculation).
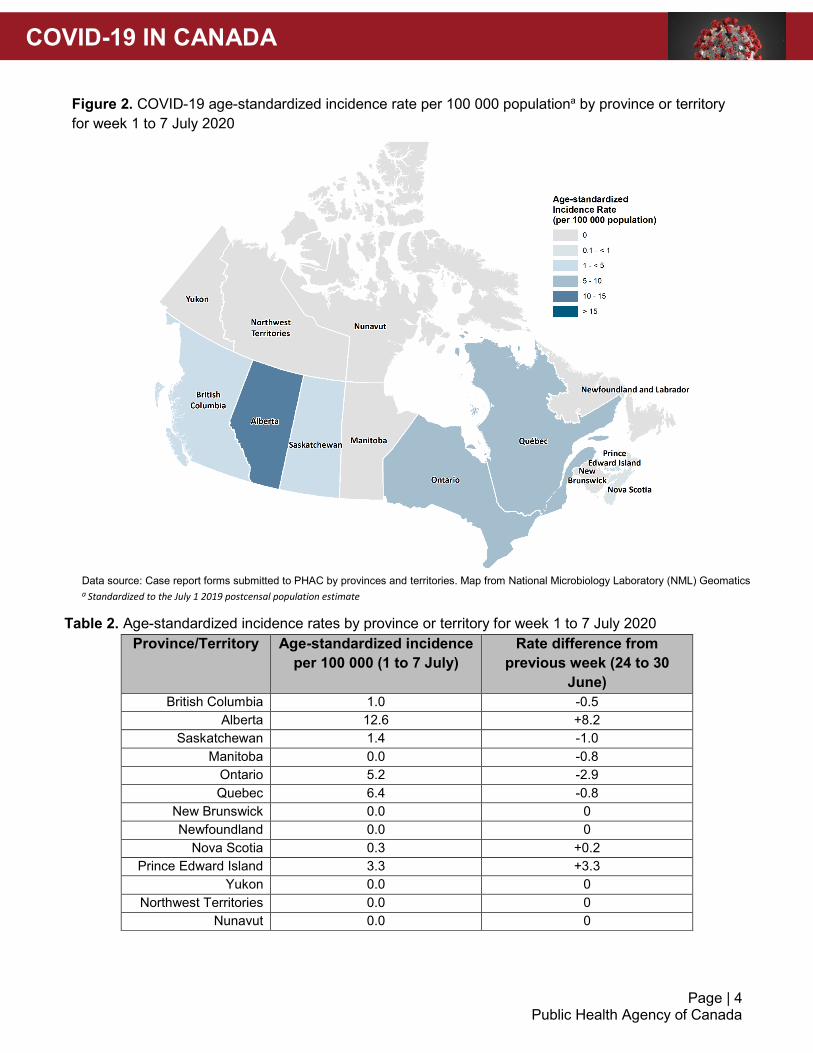
Figure 2 and Table 2 present the age-standardized rate by province or territory for the week of 1 to 7
July 2020.
All provinces, with the exception of Alberta, Nova Scotia, and Prince Edward Island had a decrease
or no change in the age-standardized incidence rate (see table A2 in annex).
Alberta has the highest cumulative age-standardized incidence rate in Canada, with 12.6 cases per
100 000 population.
Age-standardized rates take into account the differences in age structure within Canada to allow for a
representative picture of the outbreak.
Reported date (by Province or Territory)
COVID-19 IN CANADA
Page | 4 Public Health Agency of Canada
Figure 2. COVID-19 age-standardized incidence rate per 100 000 populationa by province or territory
for week 1 to 7 July 2020
Table 2. Age-standardized incidence rates by province or territory for week 1 to 7 July 2020
Province/Territory Age-standardized incidence
per 100 000 (1 to 7 July)
Rate difference from
previous week (24 to 30
June)
British Columbia 1.0 -0.5
Alberta 12.6 +8.2
Saskatchewan 1.4 -1.0
Manitoba 0.0 -0.8
Ontario 5.2 -2.9
Quebec 6.4 -0.8
New Brunswick 0.0 0
Newfoundland 0.0 0
Nova Scotia 0.3 +0.2
Prince Edward Island 3.3 +3.3
Yukon 0.0 0
Northwest Territories 0.0 0
Nunavut 0.0 0
Data source: Case report forms submitted to PHAC by provinces and territories. Map from National Microbiology Laboratory (NML) Geomatics a Standardized to the July 1 2019 postcensal population estimate
COVID-19 IN CANADA
Page | 5 Public Health Agency of Canada
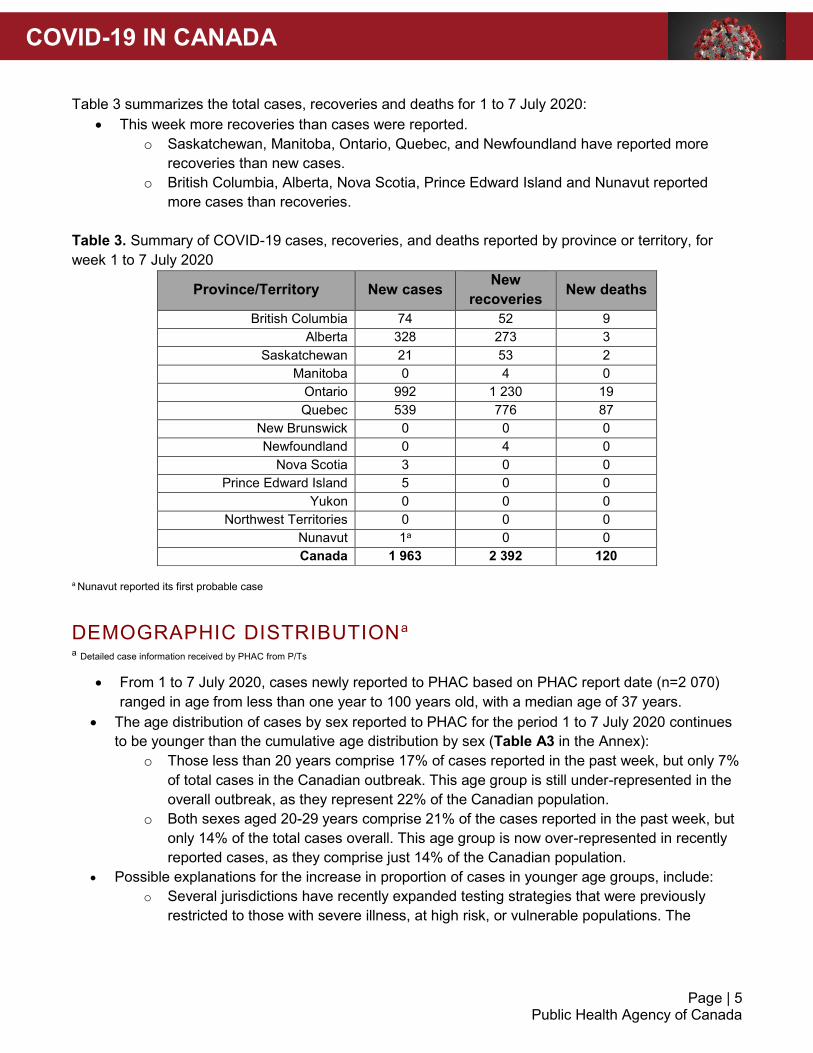
Table 3 summarizes the total cases, recoveries and deaths for 1 to 7 July 2020:
This week more recoveries than cases were reported.
o Saskatchewan, Manitoba, Ontario, Quebec, and Newfoundland have reported more
recoveries than new cases.
o British Columbia, Alberta, Nova Scotia, Prince Edward Island and Nunavut reported
more cases than recoveries.
Table 3. Summary of COVID-19 cases, recoveries, and deaths reported by province or territory, for
week 1 to 7 July 2020
Province/Territory New cases New
recoveries New deaths
British Columbia 74 52 9
Alberta 328 273 3
Saskatchewan 21 53 2
Manitoba 0 4 0
Ontario 992 1 230 19
Quebec 539 776 87
New Brunswick 0 0 0
Newfoundland 0 4 0
Nova Scotia 3 0 0
Prince Edward Island 5 0 0
Yukon 0 0 0
Northwest Territories 0 0 0
Nunavut 1a 0 0
Canada 1 963 2 392 120
a Nunavut reported its first probable case
DEMOGRAPHIC DISTRIBUTIONa
a Detailed case information received by PHAC from P/Ts
From 1 to 7 July 2020, cases newly reported to PHAC based on PHAC report date (n=2 070)
ranged in age from less than one year to 100 years old, with a median age of 37 years.
The age distribution of cases by sex reported to PHAC for the period 1 to 7 July 2020 continues
to be younger than the cumulative age distribution by sex (Table A3 in the Annex):
o Those less than 20 years comprise 17% of cases reported in the past week, but only 7%
of total cases in the Canadian outbreak. This age group is still under-represented in the
overall outbreak, as they represent 22% of the Canadian population.
o Both sexes aged 20-29 years comprise 21% of the cases reported in the past week, but
only 14% of the total cases overall. This age group is now over-represented in recently
reported cases, as they comprise just 14% of the Canadian population.
Possible explanations for the increase in proportion of cases in younger age groups, include:
o Several jurisdictions have recently expanded testing strategies that were previously
restricted to those with severe illness, at high risk, or vulnerable populations. The
COVID-19 IN CANADA
Page | 6 Public Health Agency of Canada
expansion of testing strategies may be detecting cases in individuals who would not
have been tested earlier in the outbreak.
o Younger individuals may be having increased in-person physical connections, either as
a result of return to workplaces and associated activities (i.e., commuting) or due to
reduced adherence to physical distancing measures.
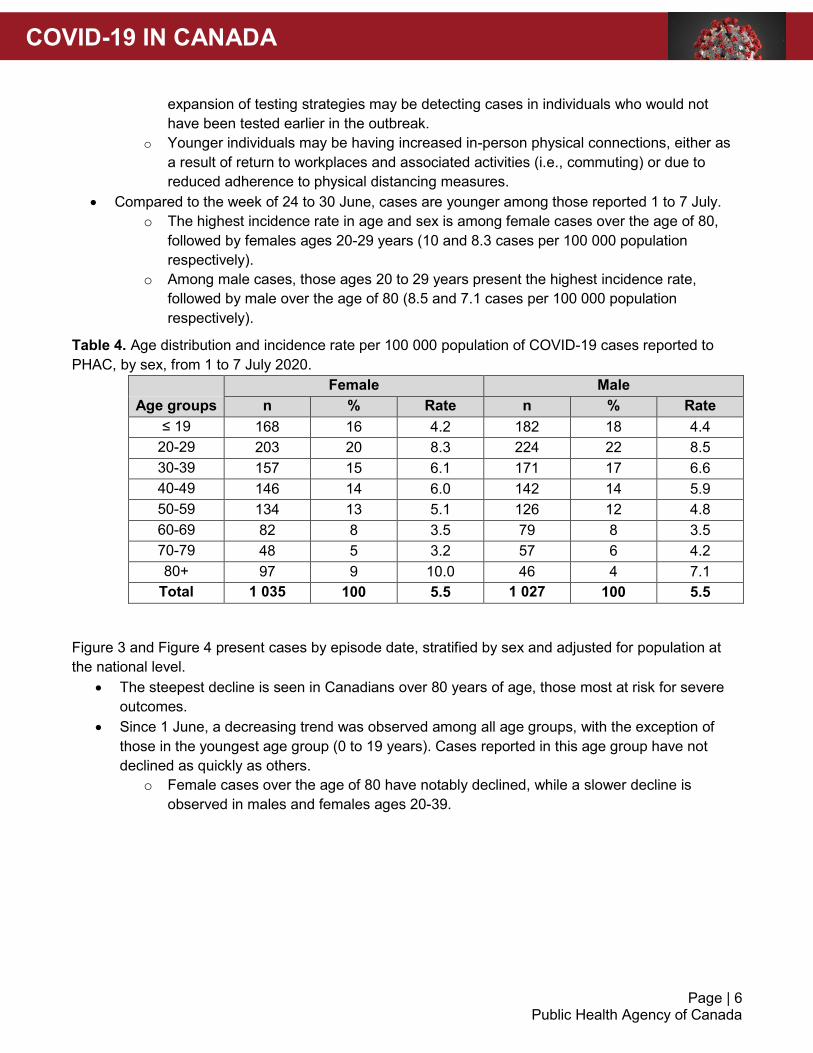
Compared to the week of 24 to 30 June, cases are younger among those reported 1 to 7 July.
o The highest incidence rate in age and sex is among female cases over the age of 80,
followed by females ages 20-29 years (10 and 8.3 cases per 100 000 population
respectively).
o Among male cases, those ages 20 to 29 years present the highest incidence rate,
followed by male over the age of 80 (8.5 and 7.1 cases per 100 000 population
respectively).
Table 4. Age distribution and incidence rate per 100 000 population of COVID-19 cases reported to
PHAC, by sex, from 1 to 7 July 2020.
Female Male
Age groups n % Rate n % Rate
≤ 19 168 16 4.2 182 18 4.4
20-29 203 20 8.3 224 22 8.5
30-39 157 15 6.1 171 17 6.6
40-49 146 14 6.0 142 14 5.9
50-59 134 13 5.1 126 12 4.8
60-69 82 8 3.5 79 8 3.5
70-79 48 5 3.2 57 6 4.2
80+ 97 9 10.0 46 4 7.1
Total 1 035 100 5.5 1 027 100 5.5
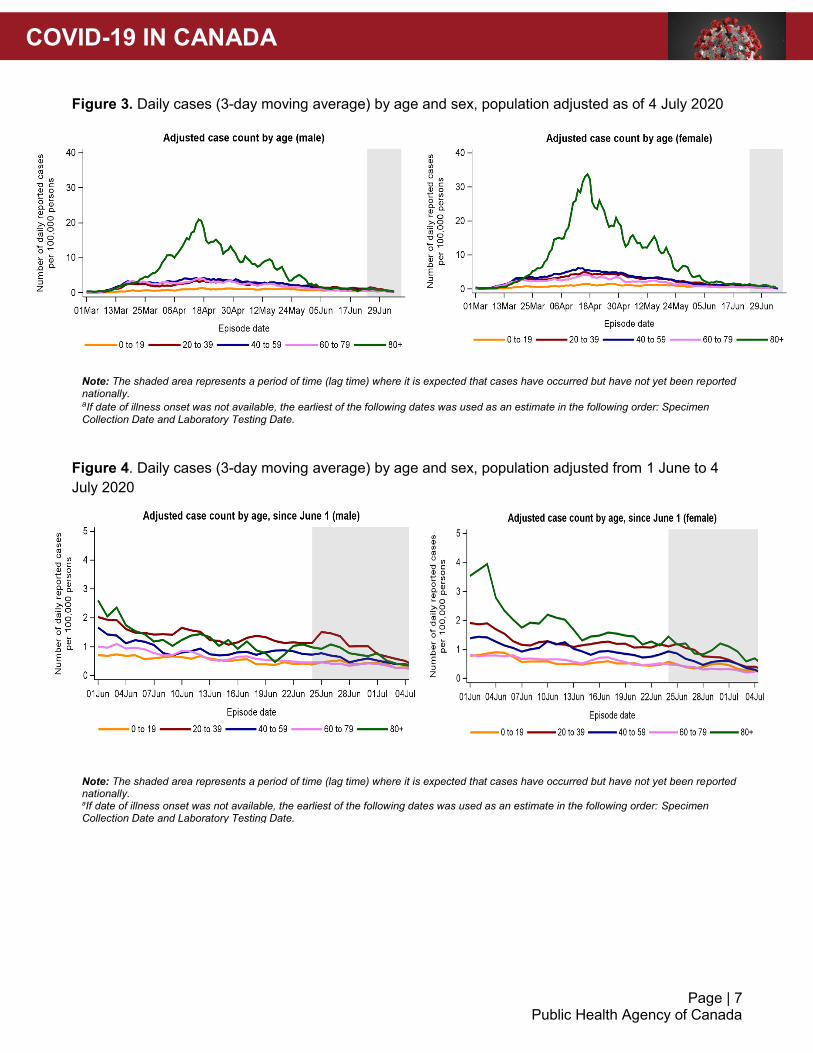
Figure 3 and Figure 4 present cases by episode date, stratified by sex and adjusted for population at
the national level.
The steepest decline is seen in Canadians over 80 years of age, those most at risk for severe
outcomes.
Since 1 June, a decreasing trend was observed among all age groups, with the exception of
those in the youngest age group (0 to 19 years). Cases reported in this age group have not
declined as quickly as others.
o Female cases over the age of 80 have notably declined, while a slower decline is
observed in males and females ages 20-39.
COVID-19 IN CANADA
Page | 7 Public Health Agency of Canada
Figure 3. Daily cases (3-day moving average) by age and sex, population adjusted as of 4 July 2020
Figure 4. Daily cases (3-day moving average) by age and sex, population adjusted from 1 June to 4
July 2020
Note: The shaded area represents a period of time (lag time) where it is expected that cases have occurred but have not yet been reported nationally. aIf date of illness onset was not available, the earliest of the following dates was used as an estimate in the following order: Specimen Collection Date and Laboratory Testing Date. Episode
Note: The shaded area represents a period of time (lag time) where it is expected that cases have occurred but have not yet been reported nationally. aIf date of illness onset was not available, the earliest of the following dates was used as an estimate in the following order: Specimen Collection Date and Laboratory Testing Date. Episode
COVID-19 IN CANADA
Page | 8 Public Health Agency of Canada
OUTCOMES AND SEVERITY
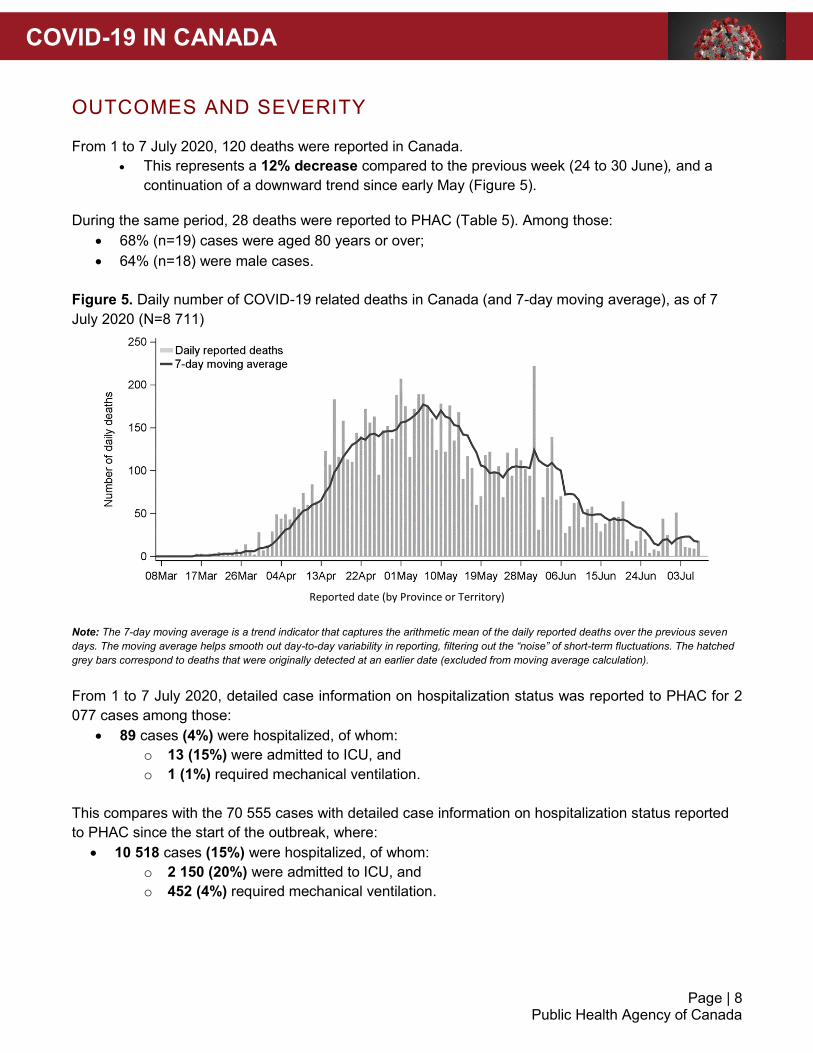
From 1 to 7 July 2020, 120 deaths were reported in Canada.
This represents a 12% decrease compared to the previous week (24 to 30 June), and a
continuation of a downward trend since early May (Figure 5).
During the same period, 28 deaths were reported to PHAC (Table 5). Among those:
68% (n=19) cases were aged 80 years or over;
64% (n=18) were male cases.
Figure 5. Daily number of COVID-19 related deaths in Canada (and 7-day moving average), as of 7
July 2020 (N=8 711)
Note: The 7-day moving average is a trend indicator that captures the arithmetic mean of the daily reported deaths over the previous seven
days. The moving average helps smooth out day-to-day variability in reporting, filtering out the “noise” of short-term fluctuations. The hatched
grey bars correspond to deaths that were originally detected at an earlier date (excluded from moving average calculation).
From 1 to 7 July 2020, detailed case information on hospitalization status was reported to PHAC for 2
077 cases among those:
89 cases (4%) were hospitalized, of whom:
o 13 (15%) were admitted to ICU, and
o 1 (1%) required mechanical ventilation.
This compares with the 70 555 cases with detailed case information on hospitalization status reported
to PHAC since the start of the outbreak, where:
10 518 cases (15%) were hospitalized, of whom:
o 2 150 (20%) were admitted to ICU, and
o 452 (4%) required mechanical ventilation.
Reported date (by Province or Territory)
COVID-19 IN CANADA
Page | 9 Public Health Agency of Canada
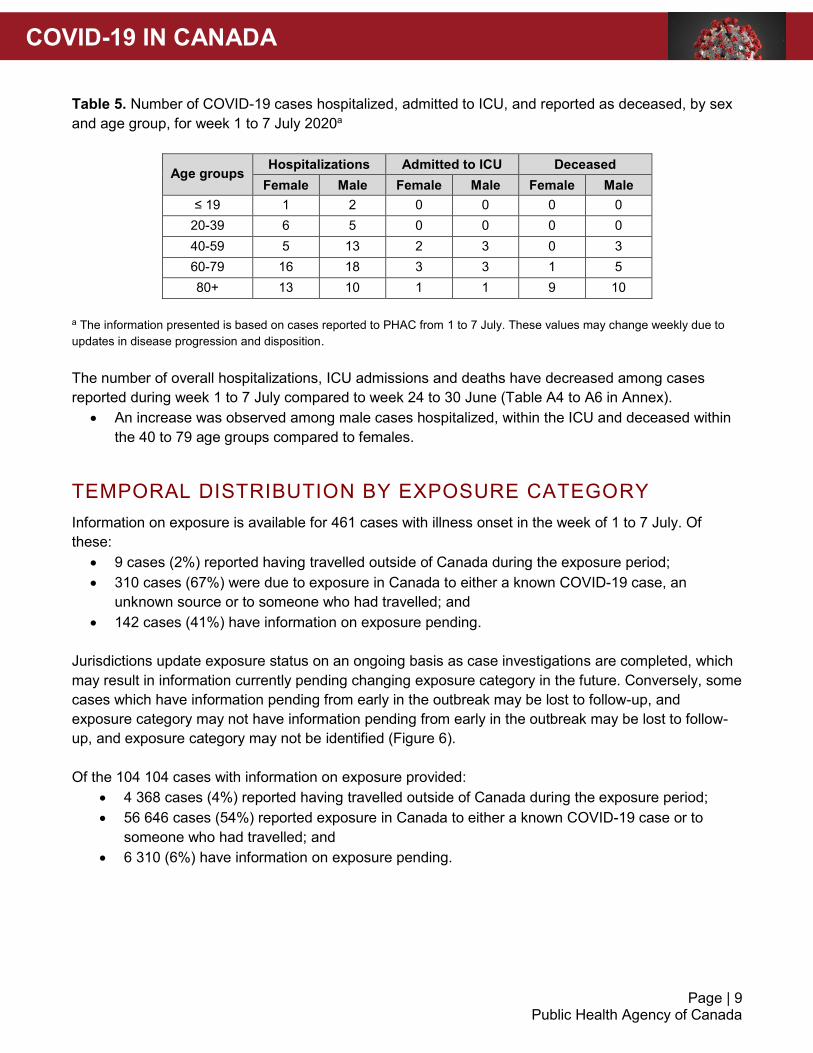
Table 5. Number of COVID-19 cases hospitalized, admitted to ICU, and reported as deceased, by sex
and age group, for week 1 to 7 July 2020a
Age groups Hospitalizations Admitted to ICU Deceased
Female Male Female Male Female Male
≤ 19 1 2 0 0 0 0
20-39 6 5 0 0 0 0
40-59 5 13 2 3 0 3
60-79 16 18 3 3 1 5
80+ 13 10 1 1 9 10
a The information presented is based on cases reported to PHAC from 1 to 7 July. These values may change weekly due to
updates in disease progression and disposition.
The number of overall hospitalizations, ICU admissions and deaths have decreased among cases
reported during week 1 to 7 July compared to week 24 to 30 June (Table A4 to A6 in Annex).
An increase was observed among male cases hospitalized, within the ICU and deceased within
the 40 to 79 age groups compared to females.
TEMPORAL DISTRIBUTION BY EXPOSURE CATEGORY
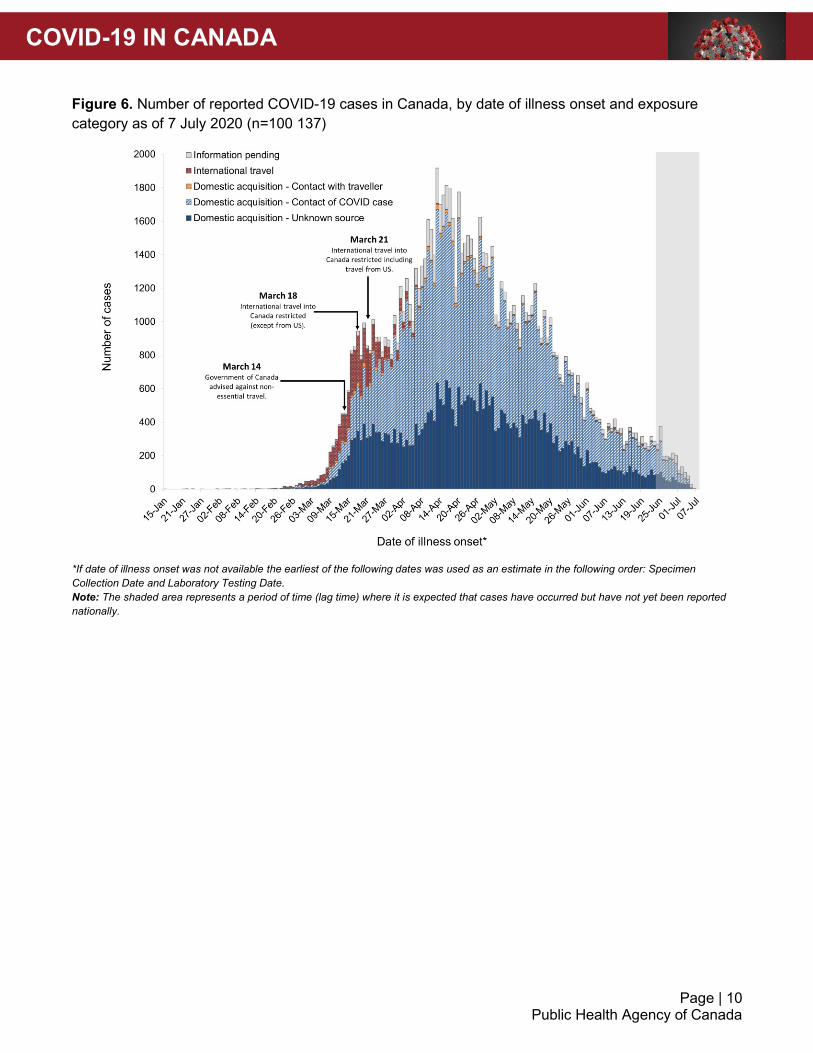
Information on exposure is available for 461 cases with illness onset in the week of 1 to 7 July. Of
these:
9 cases (2%) reported having travelled outside of Canada during the exposure period;
310 cases (67%) were due to exposure in Canada to either a known COVID-19 case, an
unknown source or to someone who had travelled; and
142 cases (41%) have information on exposure pending.
Jurisdictions update exposure status on an ongoing basis as case investigations are completed, which
may result in information currently pending changing exposure category in the future. Conversely, some
cases which have information pending from early in the outbreak may be lost to follow-up, and
exposure category may not have information pending from early in the outbreak may be lost to follow-
up, and exposure category may not be identified (Figure 6).
Of the 104 104 cases with information on exposure provided:
4 368 cases (4%) reported having travelled outside of Canada during the exposure period;
56 646 cases (54%) reported exposure in Canada to either a known COVID-19 case or to
someone who had travelled; and
6 310 (6%) have information on exposure pending.
COVID-19 IN CANADA
Page | 10 Public Health Agency of Canada
Figure 6. Number of reported COVID-19 cases in Canada, by date of illness onset and exposure
category as of 7 July 2020 (n=100 137)
*If date of illness onset was not available the earliest of the following dates was used as an estimate in the following order: Specimen
Collection Date and Laboratory Testing Date.
Note: The shaded area represents a period of time (lag time) where it is expected that cases have occurred but have not yet been reported
nationally.
COVID-19 IN CANADA
Page | 11 Public Health Agency of Canada
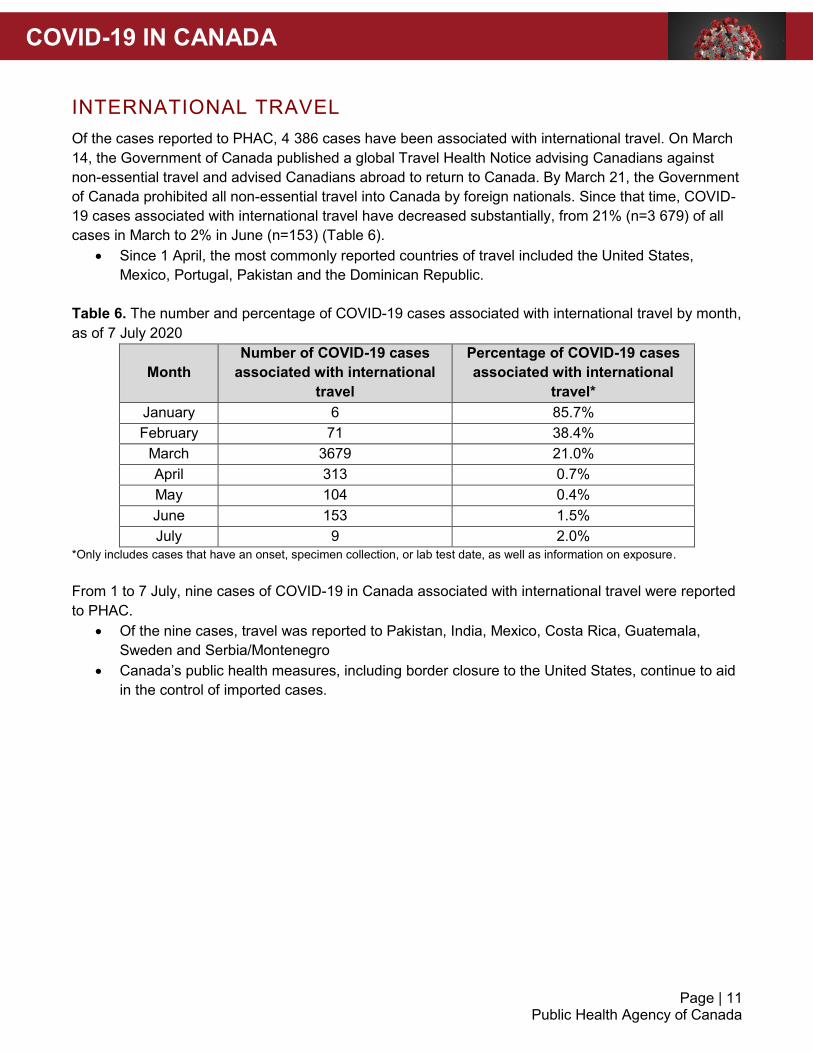
INTERNATIONAL TRAVEL
Of the cases reported to PHAC, 4 386 cases have been associated with international travel. On March
14, the Government of Canada published a global Travel Health Notice advising Canadians against
non-essential travel and advised Canadians abroad to return to Canada. By March 21, the Government
of Canada prohibited all non-essential travel into Canada by foreign nationals. Since that time, COVID-
19 cases associated with international travel have decreased substantially, from 21% (n=3 679) of all
cases in March to 2% in June (n=153) (Table 6).
Since 1 April, the most commonly reported countries of travel included the United States,
Mexico, Portugal, Pakistan and the Dominican Republic.
Table 6. The number and percentage of COVID-19 cases associated with international travel by month,
as of 7 July 2020
Month
Number of COVID-19 cases
associated with international
travel
Percentage of COVID-19 cases
associated with international
travel*
January 6 85.7%
February 71 38.4%
March 3679 21.0%
April 313 0.7%
May 104 0.4%
June 153 1.5%
July 9 2.0%
*Only includes cases that have an onset, specimen collection, or lab test date, as well as information on exposure.
From 1 to 7 July, nine cases of COVID-19 in Canada associated with international travel were reported
to PHAC.
Of the nine cases, travel was reported to Pakistan, India, Mexico, Costa Rica, Guatemala,
Sweden and Serbia/Montenegro
Canada’s public health measures, including border closure to the United States, continue to aid
in the control of imported cases.
COVID-19 IN CANADA
Page | 12 Public Health Agency of Canada
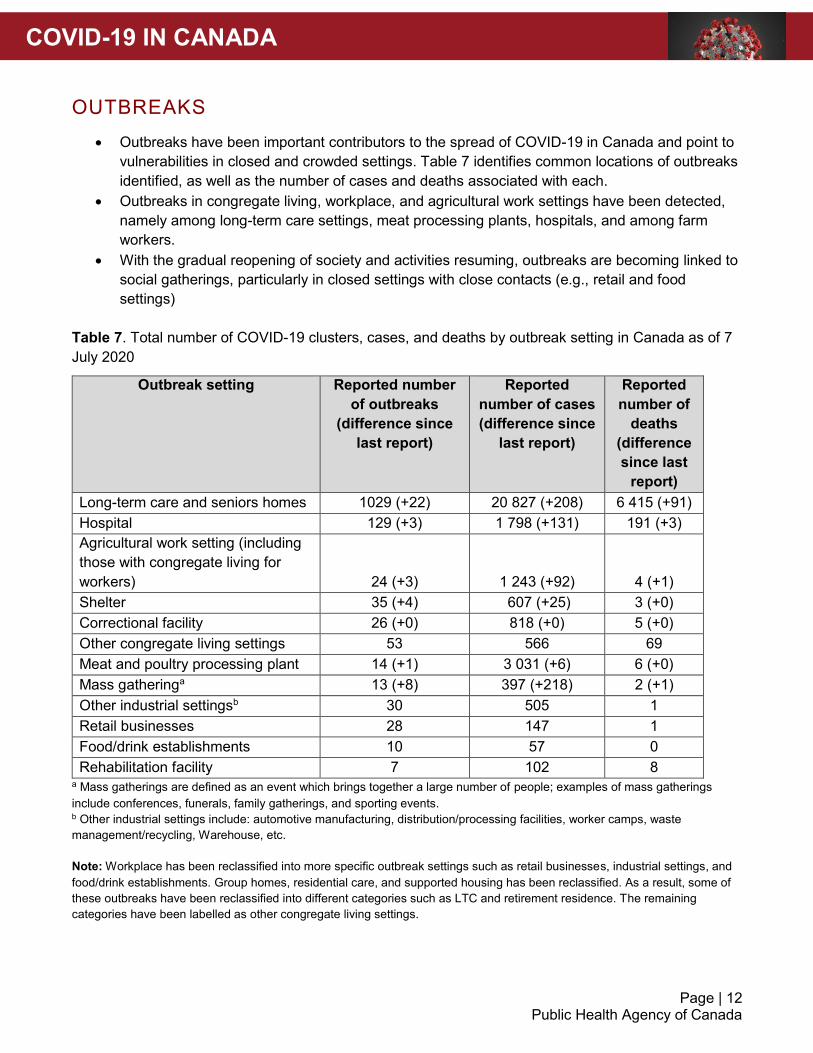
OUTBREAKS
Outbreaks have been important contributors to the spread of COVID-19 in Canada and point to
vulnerabilities in closed and crowded settings. Table 7 identifies common locations of outbreaks
identified, as well as the number of cases and deaths associated with each.
Outbreaks in congregate living, workplace, and agricultural work settings have been detected,
namely among long-term care settings, meat processing plants, hospitals, and among farm
workers.
With the gradual reopening of society and activities resuming, outbreaks are becoming linked to
social gatherings, particularly in closed settings with close contacts (e.g., retail and food
settings)
Table 7. Total number of COVID-19 clusters, cases, and deaths by outbreak setting in Canada as of 7
July 2020
Outbreak setting Reported number
of outbreaks
(difference since
last report)
Reported
number of cases
(difference since
last report)
Reported
number of
deaths
(difference
since last
report)
Long-term care and seniors homes 1029 (+22) 20 827 (+208) 6 415 (+91)
Hospital 129 (+3) 1 798 (+131) 191 (+3)
Agricultural work setting (including
those with congregate living for
workers) 24 (+3) 1 243 (+92) 4 (+1)
Shelter 35 (+4) 607 (+25) 3 (+0)
Correctional facility 26 (+0) 818 (+0) 5 (+0)
Other congregate living settings 53 566 69
Meat and poultry processing plant 14 (+1) 3 031 (+6) 6 (+0)
Mass gatheringa 13 (+8) 397 (+218) 2 (+1)
Other industrial settingsb 30 505 1
Retail businesses 28 147 1
Food/drink establishments 10 57 0
Rehabilitation facility 7 102 8 a Mass gatherings are defined as an event which brings together a large number of people; examples of mass gatherings
include conferences, funerals, family gatherings, and sporting events. b Other industrial settings include: automotive manufacturing, distribution/processing facilities, worker camps, waste
management/recycling, Warehouse, etc.
Note: Workplace has been reclassified into more specific outbreak settings such as retail businesses, industrial settings, and
food/drink establishments. Group homes, residential care, and supported housing has been reclassified. As a result, some of
these outbreaks have been reclassified into different categories such as LTC and retirement residence. The remaining
categories have been labelled as other congregate living settings.
COVID-19 IN CANADA
Page | 13 Public Health Agency of Canada
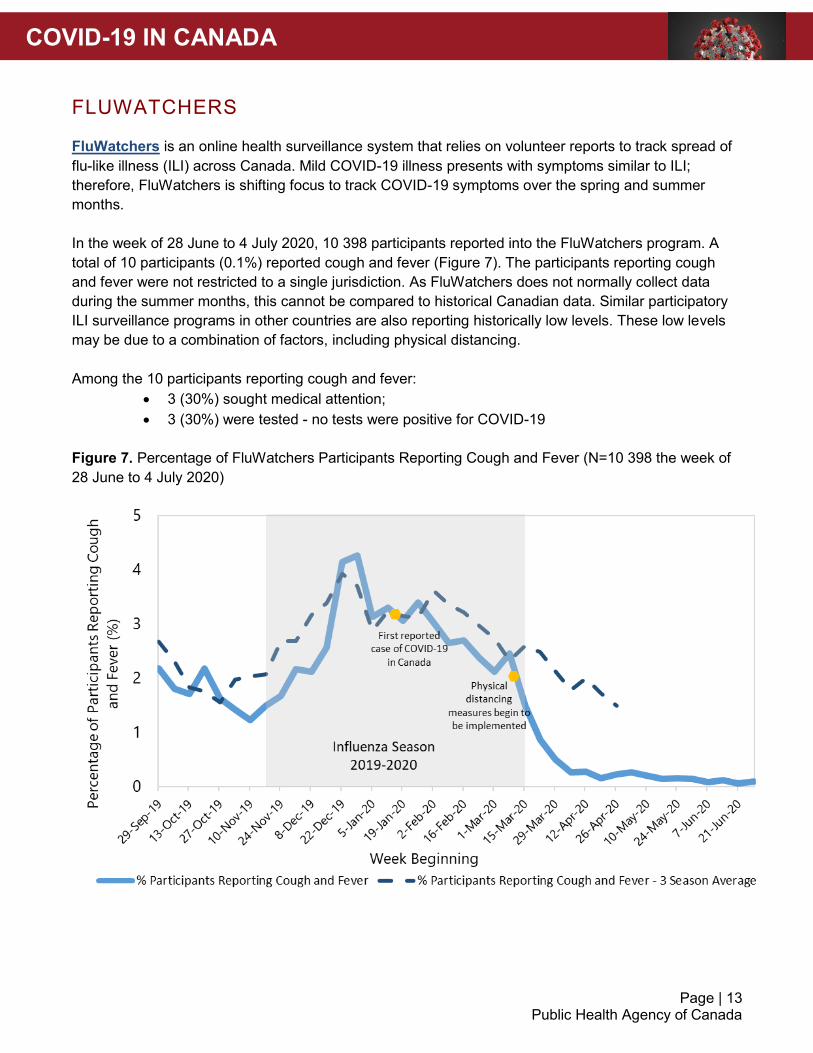
FLUWATCHERS
FluWatchers is an online health surveillance system that relies on volunteer reports to track spread of
flu-like illness (ILI) across Canada. Mild COVID-19 illness presents with symptoms similar to ILI;
therefore, FluWatchers is shifting focus to track COVID-19 symptoms over the spring and summer
months.
In the week of 28 June to 4 July 2020, 10 398 participants reported into the FluWatchers program. A
total of 10 participants (0.1%) reported cough and fever (Figure 7). The participants reporting cough
and fever were not restricted to a single jurisdiction. As FluWatchers does not normally collect data
during the summer months, this cannot be compared to historical Canadian data. Similar participatory
ILI surveillance programs in other countries are also reporting historically low levels. These low levels
may be due to a combination of factors, including physical distancing.
Among the 10 participants reporting cough and fever:
3 (30%) sought medical attention;
3 (30%) were tested - no tests were positive for COVID-19
Figure 7. Percentage of FluWatchers Participants Reporting Cough and Fever (N=10 398 the week of
28 June to 4 July 2020)
COVID-19 IN CANADA
Page | 14 Public Health Agency of Canada
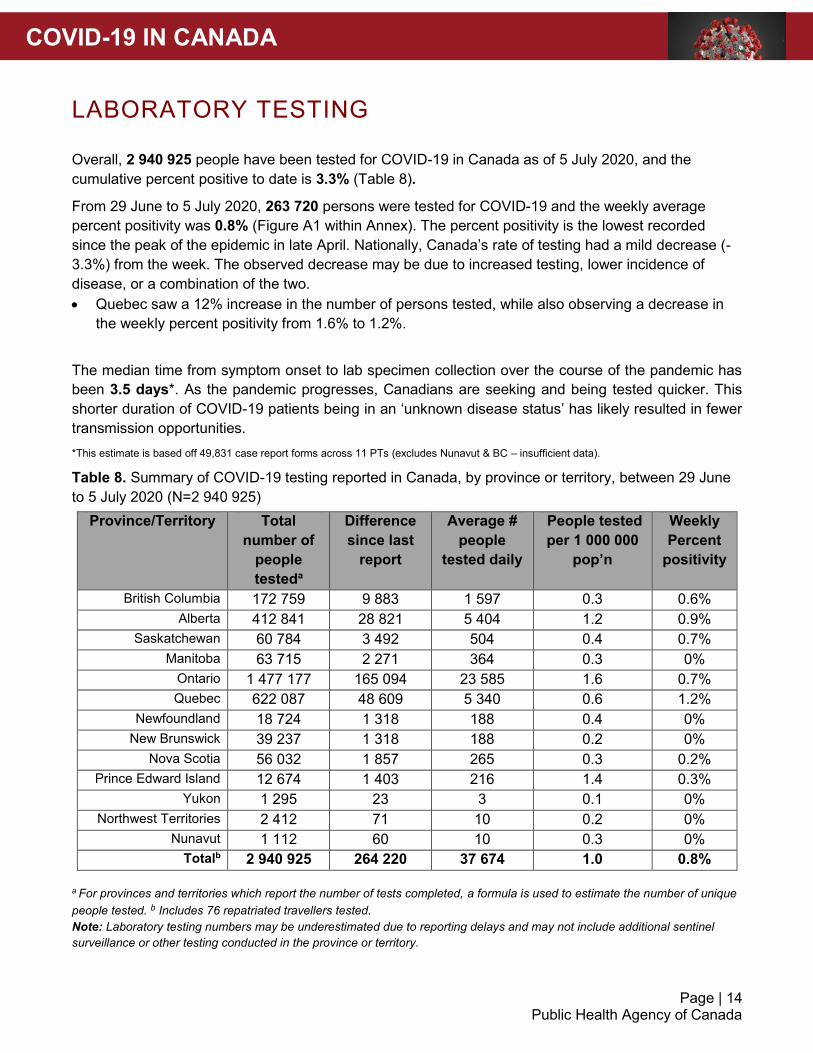
LABORATORY TESTING
Overall, 2 940 925 people have been tested for COVID-19 in Canada as of 5 July 2020, and the
cumulative percent positive to date is 3.3% (Table 8).
From 29 June to 5 July 2020, 263 720 persons were tested for COVID-19 and the weekly average
percent positivity was 0.8% (Figure A1 within Annex). The percent positivity is the lowest recorded
since the peak of the epidemic in late April. Nationally, Canada’s rate of testing had a mild decrease (-
3.3%) from the week. The observed decrease may be due to increased testing, lower incidence of
disease, or a combination of the two.
Quebec saw a 12% increase in the number of persons tested, while also observing a decrease in
the weekly percent positivity from 1.6% to 1.2%.
The median time from symptom onset to lab specimen collection over the course of the pandemic has
been 3.5 days*. As the pandemic progresses, Canadians are seeking and being tested quicker. This
shorter duration of COVID-19 patients being in an ‘unknown disease status’ has likely resulted in fewer
transmission opportunities.
*This estimate is based off 49,831 case report forms across 11 PTs (excludes Nunavut & BC – insufficient data).
Table 8. Summary of COVID-19 testing reported in Canada, by province or territory, between 29 June
to 5 July 2020 (N=2 940 925)
Province/Territory Total
number of
people
testeda
Difference
since last
report
Average #
people
tested daily
People tested
per 1 000 000
pop’n
Weekly
Percent
positivity
British Columbia 172 759 9 883 1 597 0.3 0.6%
Alberta 412 841 28 821 5 404 1.2 0.9%
Saskatchewan 60 784 3 492 504 0.4 0.7%
Manitoba 63 715 2 271 364 0.3 0%
Ontario 1 477 177 165 094 23 585 1.6 0.7%
Quebec 622 087 48 609 5 340 0.6 1.2%
Newfoundland 18 724 1 318 188 0.4 0%
New Brunswick 39 237 1 318 188 0.2 0%
Nova Scotia 56 032 1 857 265 0.3 0.2%
Prince Edward Island 12 674 1 403 216 1.4 0.3%
Yukon 1 295 23 3 0.1 0%
Northwest Territories 2 412 71 10 0.2 0%
Nunavut 1 112 60 10 0.3 0%
Totalb 2 940 925 264 220 37 674 1.0 0.8%
a For provinces and territories which report the number of tests completed, a formula is used to estimate the number of unique
people tested. b Includes 76 repatriated travellers tested.
Note: Laboratory testing numbers may be underestimated due to reporting delays and may not include additional sentinel
surveillance or other testing conducted in the province or territory.
COVID-19 IN CANADA
Page | 15 Public Health Agency of Canada
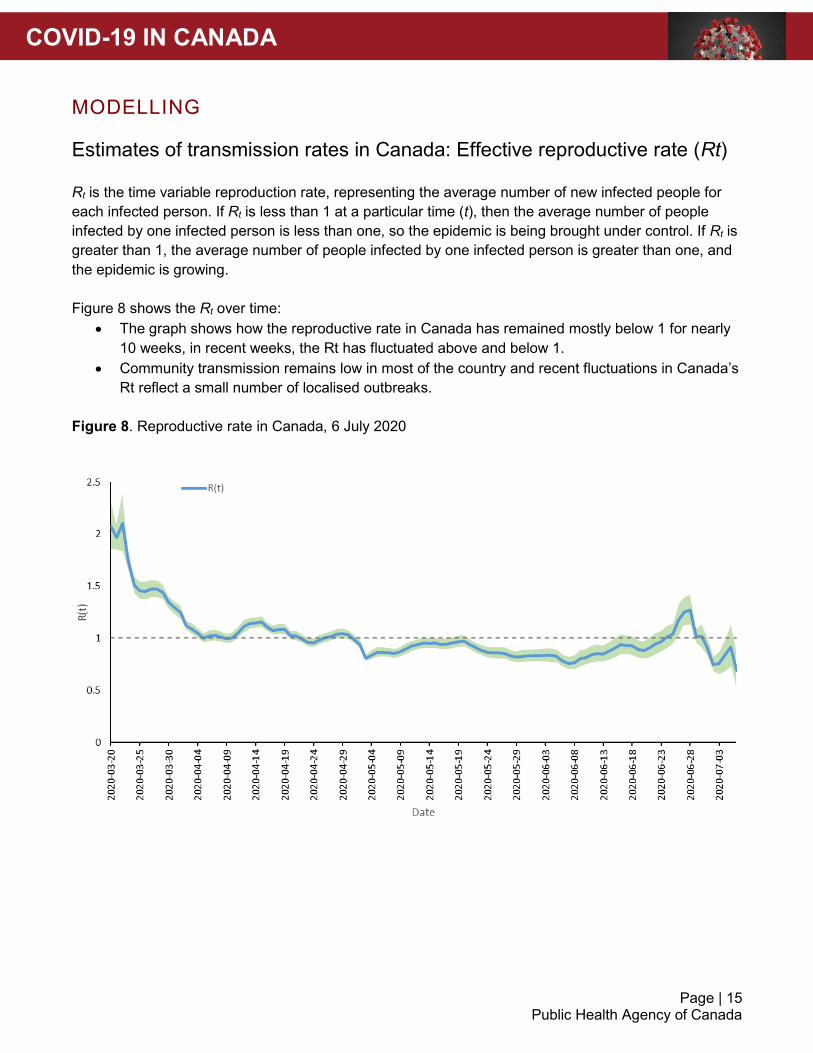
MODELLING
Estimates of transmission rates in Canada: Effective reproductive rate (Rt)
Rt is the time variable reproduction rate, representing the average number of new infected people for
each infected person. If Rt is less than 1 at a particular time (t), then the average number of people
infected by one infected person is less than one, so the epidemic is being brought under control. If Rt is
greater than 1, the average number of people infected by one infected person is greater than one, and
the epidemic is growing.
Figure 8 shows the Rt over time:
The graph shows how the reproductive rate in Canada has remained mostly below 1 for nearly
10 weeks, in recent weeks, the Rt has fluctuated above and below 1.
Community transmission remains low in most of the country and recent fluctuations in Canada’s
Rt reflect a small number of localised outbreaks.
Figure 8. Reproductive rate in Canada, 6 July 2020
COVID-19 IN CANADA
Page | 16 Public Health Agency of Canada
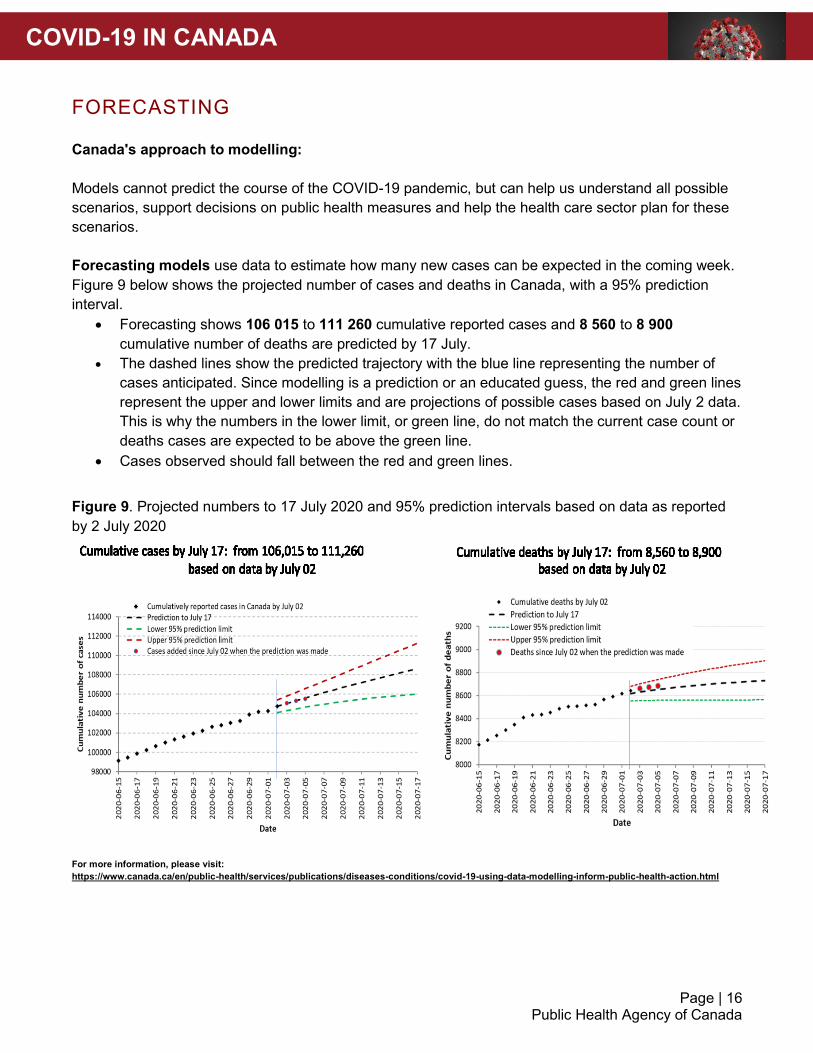
FORECASTING
Canada's approach to modelling:
Models cannot predict the course of the COVID-19 pandemic, but can help us understand all possible
scenarios, support decisions on public health measures and help the health care sector plan for these
scenarios.
Forecasting models use data to estimate how many new cases can be expected in the coming week.
Figure 9 below shows the projected number of cases and deaths in Canada, with a 95% prediction
interval.
Forecasting shows 106 015 to 111 260 cumulative reported cases and 8 560 to 8 900
cumulative number of deaths are predicted by 17 July.
The dashed lines show the predicted trajectory with the blue line representing the number of
cases anticipated. Since modelling is a prediction or an educated guess, the red and green lines
represent the upper and lower limits and are projections of possible cases based on July 2 data.
This is why the numbers in the lower limit, or green line, do not match the current case count or
deaths cases are expected to be above the green line.
Cases observed should fall between the red and green lines.
Figure 9. Projected numbers to 17 July 2020 and 95% prediction intervals based on data as reported
by 2 July 2020
For more information, please visit:
https://www.canada.ca/en/public-health/services/publications/diseases-conditions/covid-19-using-data-modelling-inform-public-health-action.html
COVID-19 IN CANADA
Page | 17 Public Health Agency of Canada
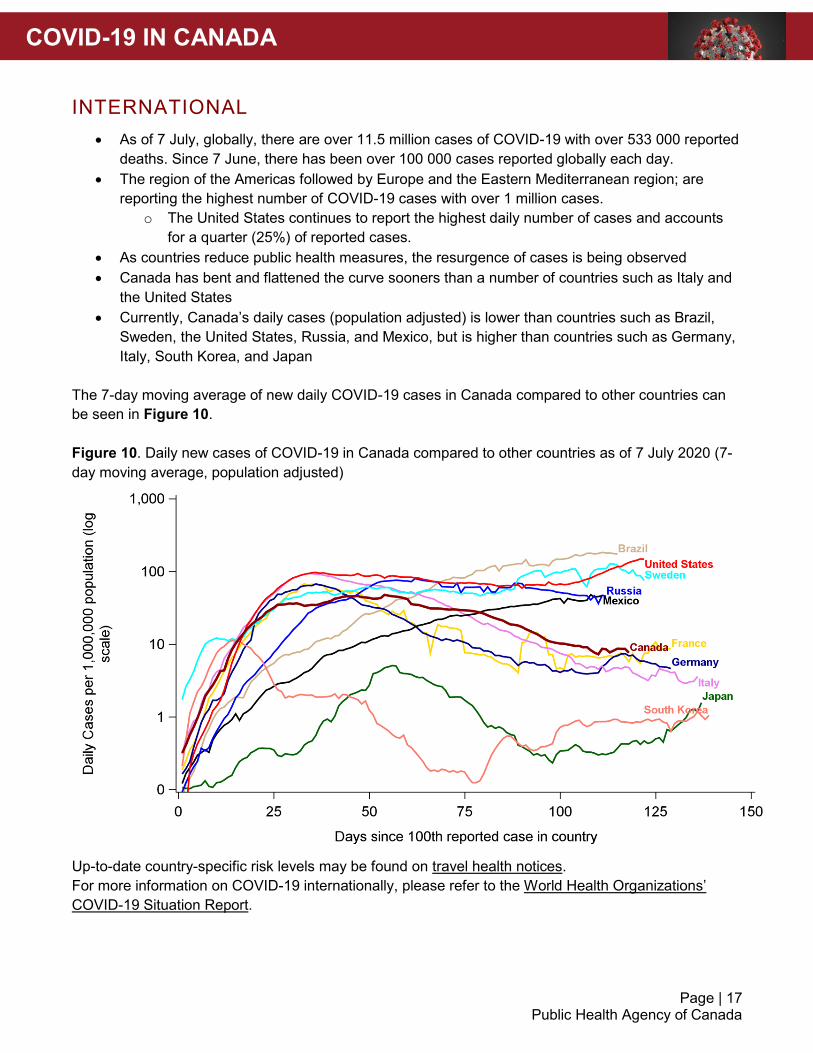
INTERNATIONAL
As of 7 July, globally, there are over 11.5 million cases of COVID-19 with over 533 000 reported
deaths. Since 7 June, there has been over 100 000 cases reported globally each day.
The region of the Americas followed by Europe and the Eastern Mediterranean region; are
reporting the highest number of COVID-19 cases with over 1 million cases.
o The United States continues to report the highest daily number of cases and accounts
for a quarter (25%) of reported cases.
As countries reduce public health measures, the resurgence of cases is being observed
Canada has bent and flattened the curve sooners than a number of countries such as Italy and
the United States
Currently, Canada’s daily cases (population adjusted) is lower than countries such as Brazil,
Sweden, the United States, Russia, and Mexico, but is higher than countries such as Germany,
Italy, South Korea, and Japan
The 7-day moving average of new daily COVID-19 cases in Canada compared to other countries can
be seen in Figure 10.
Figure 10. Daily new cases of COVID-19 in Canada compared to other countries as of 7 July 2020 (7-
day moving average, population adjusted)
Up-to-date country-specific risk levels may be found on travel health notices.
For more information on COVID-19 internationally, please refer to the World Health Organizations’
COVID-19 Situation Report.
COVID-19 IN CANADA
Page | 18 Public Health Agency of Canada
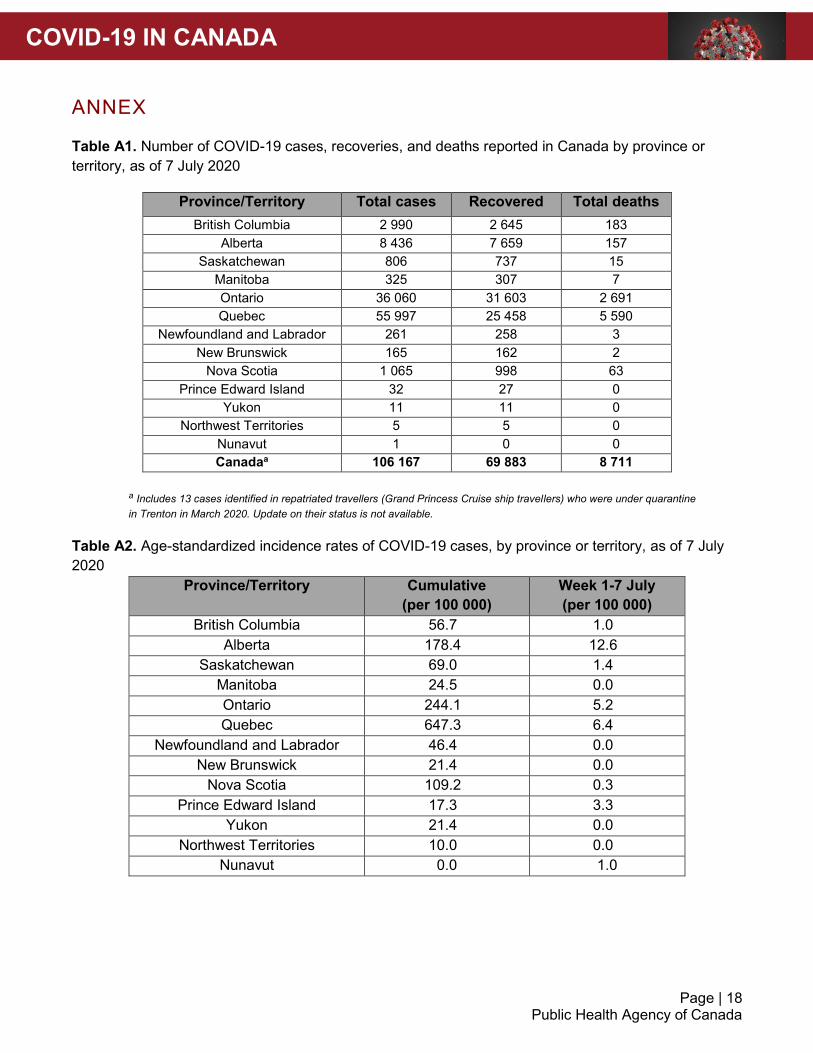
ANNEX
Table A1. Number of COVID-19 cases, recoveries, and deaths reported in Canada by province or
territory, as of 7 July 2020
Province/Territory Total cases Recovered Total deaths
British Columbia 2 990 2 645 183
Alberta 8 436 7 659 157
Saskatchewan 806 737 15
Manitoba 325 307 7
Ontario 36 060 31 603 2 691
Quebec 55 997 25 458 5 590
Newfoundland and Labrador 261 258 3
New Brunswick 165 162 2
Nova Scotia 1 065 998 63
Prince Edward Island 32 27 0
Yukon 11 11 0
Northwest Territories 5 5 0
Nunavut 1 0 0
Canadaa 106 167 69 883 8 711
a Includes 13 cases identified in repatriated travellers (Grand Princess Cruise ship travellers) who were under quarantine
in Trenton in March 2020. Update on their status is not available.
Table A2. Age-standardized incidence rates of COVID-19 cases, by province or territory, as of 7 July
2020
Province/Territory Cumulative
(per 100 000)
Week 1-7 July
(per 100 000)
British Columbia 56.7 1.0
Alberta 178.4 12.6
Saskatchewan 69.0 1.4
Manitoba 24.5 0.0
Ontario 244.1 5.2
Quebec 647.3 6.4
Newfoundland and Labrador 46.4 0.0
New Brunswick 21.4 0.0
Nova Scotia 109.2 0.3
Prince Edward Island 17.3 3.3
Yukon 21.4 0.0
Northwest Territories 10.0 0.0
Nunavut 0.0 1.0
COVID-19 IN CANADA
Page | 19 Public Health Agency of Canada
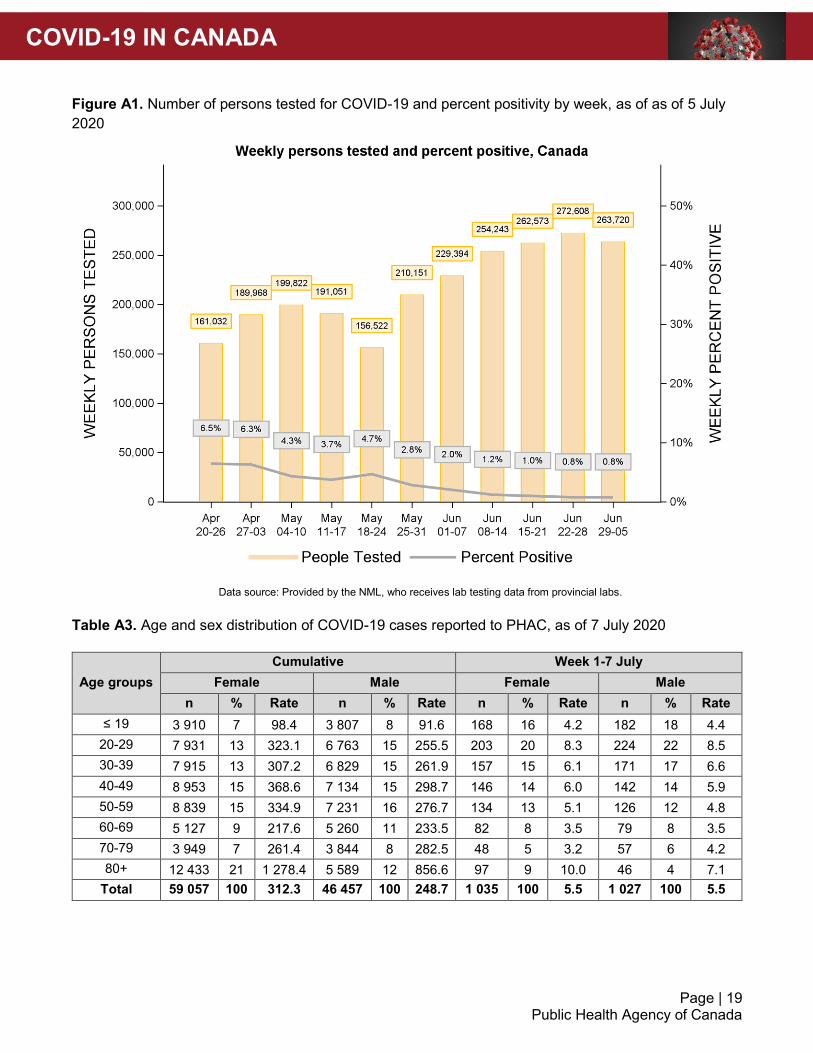
Figure A1. Number of persons tested for COVID-19 and percent positivity by week, as of as of 5 July
2020
Table A3. Age and sex distribution of COVID-19 cases reported to PHAC, as of 7 July 2020
Age groups
Cumulative Week 1-7 July
Female Male Female Male
n % Rate n % Rate n % Rate n % Rate
≤ 19 3 910 7 98.4 3 807 8 91.6 168 16 4.2 182 18 4.4
20-29 7 931 13 323.1 6 763 15 255.5 203 20 8.3 224 22 8.5
30-39 7 915 13 307.2 6 829 15 261.9 157 15 6.1 171 17 6.6
40-49 8 953 15 368.6 7 134 15 298.7 146 14 6.0 142 14 5.9
50-59 8 839 15 334.9 7 231 16 276.7 134 13 5.1 126 12 4.8
60-69 5 127 9 217.6 5 260 11 233.5 82 8 3.5 79 8 3.5
70-79 3 949 7 261.4 3 844 8 282.5 48 5 3.2 57 6 4.2
80+ 12 433 21 1 278.4 5 589 12 856.6 97 9 10.0 46 4 7.1
Total 59 057 100 312.3 46 457 100 248.7 1 035 100 5.5 1 027 100 5.5
Data source: Provided by the NML, who receives lab testing data from provincial labs.
COVID-19 IN CANADA
Page | 20 Public Health Agency of Canada
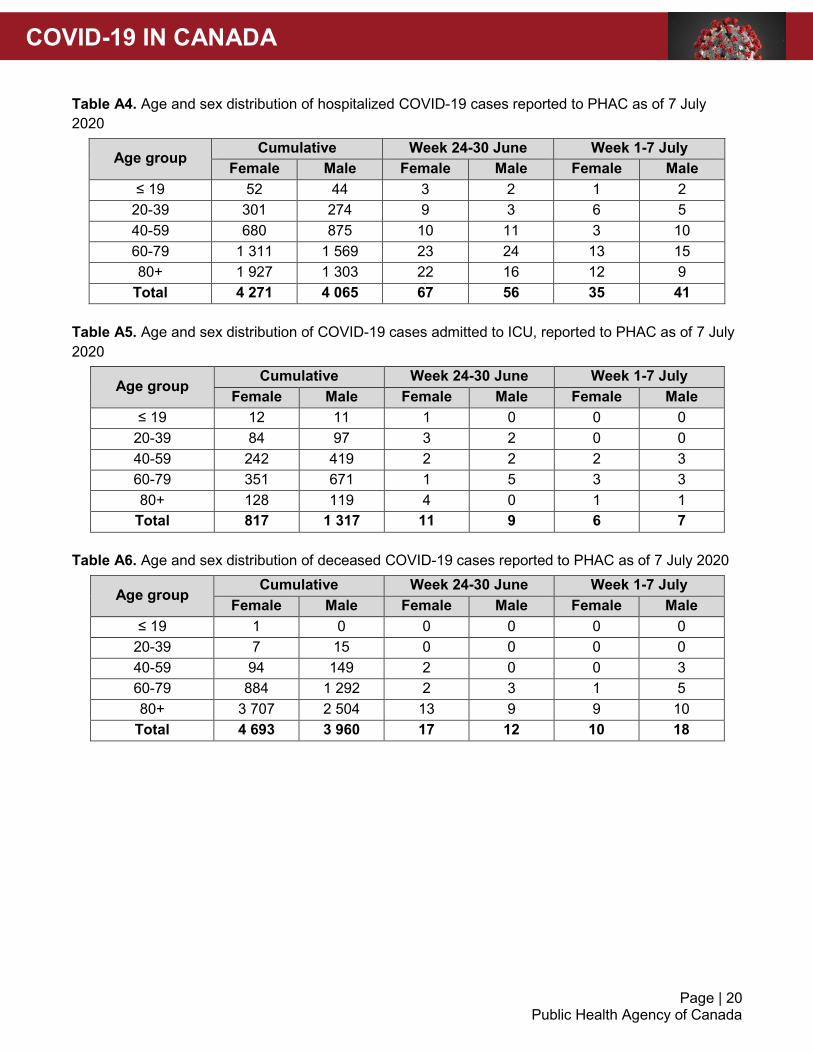
Table A4. Age and sex distribution of hospitalized COVID-19 cases reported to PHAC as of 7 July
2020
Age group Cumulative Week 24-30 June Week 1-7 July
Female Male Female Male Female Male
≤ 19 52 44 3 2 1 2
20-39 301 274 9 3 6 5
40-59 680 875 10 11 3 10
60-79 1 311 1 569 23 24 13 15
80+ 1 927 1 303 22 16 12 9
Total 4 271 4 065 67 56 35 41
Table A5. Age and sex distribution of COVID-19 cases admitted to ICU, reported to PHAC as of 7 July
2020
Age group Cumulative Week 24-30 June Week 1-7 July
Female Male Female Male Female Male
≤ 19 12 11 1 0 0 0
20-39 84 97 3 2 0 0
40-59 242 419 2 2 2 3
60-79 351 671 1 5 3 3
80+ 128 119 4 0 1 1
Total 817 1 317 11 9 6 7
Table A6. Age and sex distribution of deceased COVID-19 cases reported to PHAC as of 7 July 2020
Age group Cumulative Week 24-30 June Week 1-7 July
Female Male Female Male Female Male
≤ 19 1 0 0 0 0 0
20-39 7 15 0 0 0 0
40-59 94 149 2 0 0 3
60-79 884 1 292 2 3 1 5
80+ 3 707 2 504 13 9 9 10
Total 4 693 3 960 17 12 10 18
COVID-19 IN CANADA
Page | 21 Public Health Agency of Canada
TECHNICAL NOTES
The data in the report are based on information from various sources described below. The information
presented for case-based analyses is that available as of 7 July at 8 p.m. EDT. The information
presented for trend analyses is that available as of 7 July at 8 p.m. EDT. The information presented for
laboratory analyses is that available as of 5 July at 8 p.m. EDT.
DATA SOURCES AND DATA CAVEATS
Provincial and territorial case counts
Provincial and territorial (P/T) information on case counts, recoveries, and deaths associated with
COVID-19 are collected from publicly available P/T websites.
Only cases and deaths meeting P/T’s definition for case classification are reported. For details
on case definitions, please consult each P/T ministry of health website.
Laboratory information
Laboratory data on number of people tested per P/T are received from the National Microbiology
Laboratory.
Laboratory testing numbers may be an underestimate due to reporting delays and may not
include additional sentinel surveillance or other testing performed. They are subject to changes
as updates are received.
Some provinces may report the number of tests conducted, and not the number of people
tested. In this case, a formula is used to estimate the number of unique people tested.
Epidemiological data
Epidemiological data for this report are based on detailed case information received by PHAC from
P/Ts. This information is housed in the PHAC COVID-19 database. Case counts and level of detail in
case information submitted to PHAC varies by P/T due to:
Possible reporting delay between time of case notification to the P/T public health authority and
when detailed information is sent/received by PHAC.
Preliminary data may be limited and data are not complete for all variables.
Data on cases are updated on an ongoing basic after received by PHAC and are subject to
change.
Variation in approaches to testing and testing criteria over time within and between P/Ts.
The lag time from illness onset to PHAC report date is approximately two weeks and data within
this period is subject to change.
Data on case severity are likely under-estimated due to underreporting of these variables, as well as
events that may have occurred after the completion of public health reporting, therefore not captured in
the case report forms.
COVID-19 IN CANADA
Page | 22 Public Health Agency of Canada
Outbreak data
Reporting delays and gaps in information that is available at the federal level present difficulties in
reporting on local outbreaks. To ensure timely information is available, PHAC utilizes web-scraping
techniques to gather outbreak data from media and provincial/territorial public health agency websites.
There are several important limitations to these data:
A national standardized outbreak definition does not exist. Clusters are defined and vary
according to P/T.
The data do not represent all outbreaks that have occurred in Canada over the course of the
pandemic, but they do provide a summary of clusters reported via non-traditional data sources.
Data collection on outbreaks began March 12 2020.
Case-level data are generally not available for outbreaks detected via non-traditional data
sources. Information presented is at the aggregate level only.
The methods for defining an outbreak are currently in development and may change over time
Population data
Canadian population data from Statistics Canada Population estimates on 1 July 2019 are used
for age-standardized rate calculations.
International data
International data are retrieved from various reputable data sources, mainly the European Centre for
Disease Prevention and Control (ECDC) Situation update, Johns Hopkins Resource Center and various
country’s ministry of health website.
Given that the pandemic is rapidly evolving and the reporting cycles from government sources
are different, the case numbers may not necessarily match what is being reported publicly.
Rather, this reflects what is publicly available from the sources listed above.
International comparisons should be interpreted with caution. Number of tests conducted,
indications for testing, and diagnostic capacity by country have a large influence on total number
of reported cases. Therefore, the data displayed may not represent the true incidence of
disease within each country.


![backthepack flyer VS_2 8.5 x 8.5[1][1]](https://img.pdfslide.us/doc/110x75/587fcb331a28ab3b158b7027/backthepack-flyer-vs2-85-x-8511.jpg)