Embed Size (px)
Citation preview
CONFIDENTIAL AND PROPRIETARY
Any use of this material without specific permission of McKinsey & Company
is strictly prohibited
Last update 1 April, 2020
Overall and Kenya perspective
COVID-19: Africa Economic Impact -Kenya deep-dive
DOCUMENT INTENDED TO PROVIDE INSIGHT AND BEST
PRACTICES RATHER THAN SPECIFIC RECOMMENDATIONS
McKinsey & Company 2
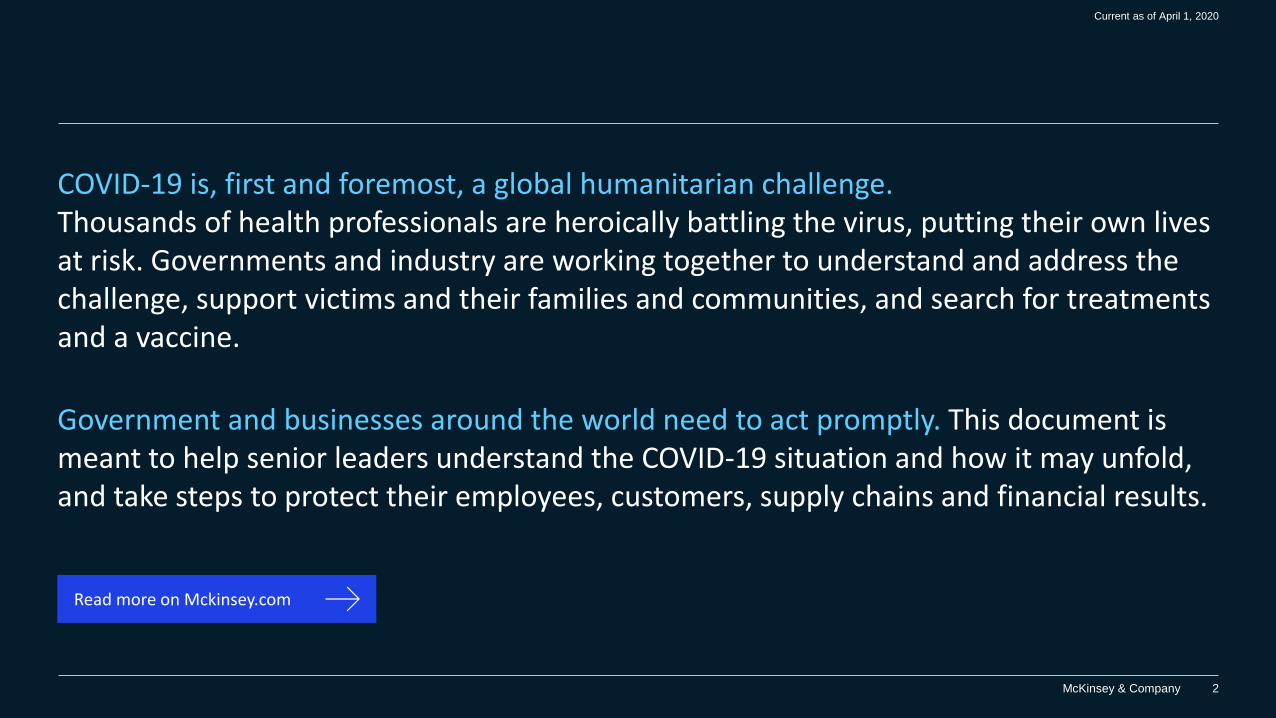
COVID-19 is, first and foremost, a global humanitarian challenge.Thousands of health professionals are heroically battling the virus, putting their own lives at risk. Governments and industry are working together to understand and address the challenge, support victims and their families and communities, and search for treatments and a vaccine.
Government and businesses around the world need to act promptly. This document is meant to help senior leaders understand the COVID-19 situation and how it may unfold, and take steps to protect their employees, customers, supply chains and financial results.
Read more on Mckinsey.com
Current as of April 1, 2020

McKinsey & Company 3
Executive Summary
With >5,300 confirmed cases and >170 deaths as of 31 March 2020, the COVID-19 pandemic has disrupted millions of people’s livelihoods
across the continent, with a disproportionate impact on poor households and small and informal businesses. The pace of this disruption is
likely to accelerate in the weeks ahead. This document addresses three key questions about the economic impact of the pandemic in Africa:
What are likely economic scenarios that Africa will face due to the COVID-19 epidemic?
We modelled four scenarios anchored in the evolution of the global and domestic epidemiology situation. The most optimistic – the global
and Africa virus spread is contained, with an overall economic slowdown. The least optimistic – the global virus is resurgent, the Africa
virus outbreak is widespread, and the global economy faces a prolonged downturn
How will these scenarios impact Africa’s GDP growth in 2020?
Even in the most optimistic scenario – where Africa is able to contain the virus spread, GDP growth could fall from 3.9% to 0.4% in 2020
driven by spread of the virus within Africa i.e. disruptions to ways of working and therefore incomes and consumption (~50%), the global
impact of the virus i.e. supply chains and exports (~30%), and oil effects impacting expenditure across the board (~20%). If Africa fails to
contain the virus, GDP growth could fall up to 8pp to -3.9%, driven by prolonged reductions in domestic consumption, and non-oil exports
Of the five countries we modelled in detail -- Nigeria, South Africa, Morocco, Angola and Kenya – all but Kenya are likely to experience a
contraction in all four scenarios
What can government, development partners, and private sector actors to do today to limit the impact of these disruptions?
Africa faces a unique set of challenges that demand bold and tailored action to the crisis: fragile healthcare systems, limited fiscal
capacity, highly informal economies with many SMES, a young and fast urbanizing population with widespread poverty. African
governments may need to be both targeted and creative in their response to the crisis. They may also need close collaboration with the
private sector and development partners. We identify actions for each player in this document
Current as of April 1, 2020
Sources: McKinsey analysis, Africa’s Business Revolution by Acha Leke, Mutsa Chironga and Georges Desvaux; UN Population Prospects 2019; ILO;, State of Small Business Report South Africa 2018;;
World Bank WDI; MGI Power of Parity Africa 2019
McKinsey & Company 4
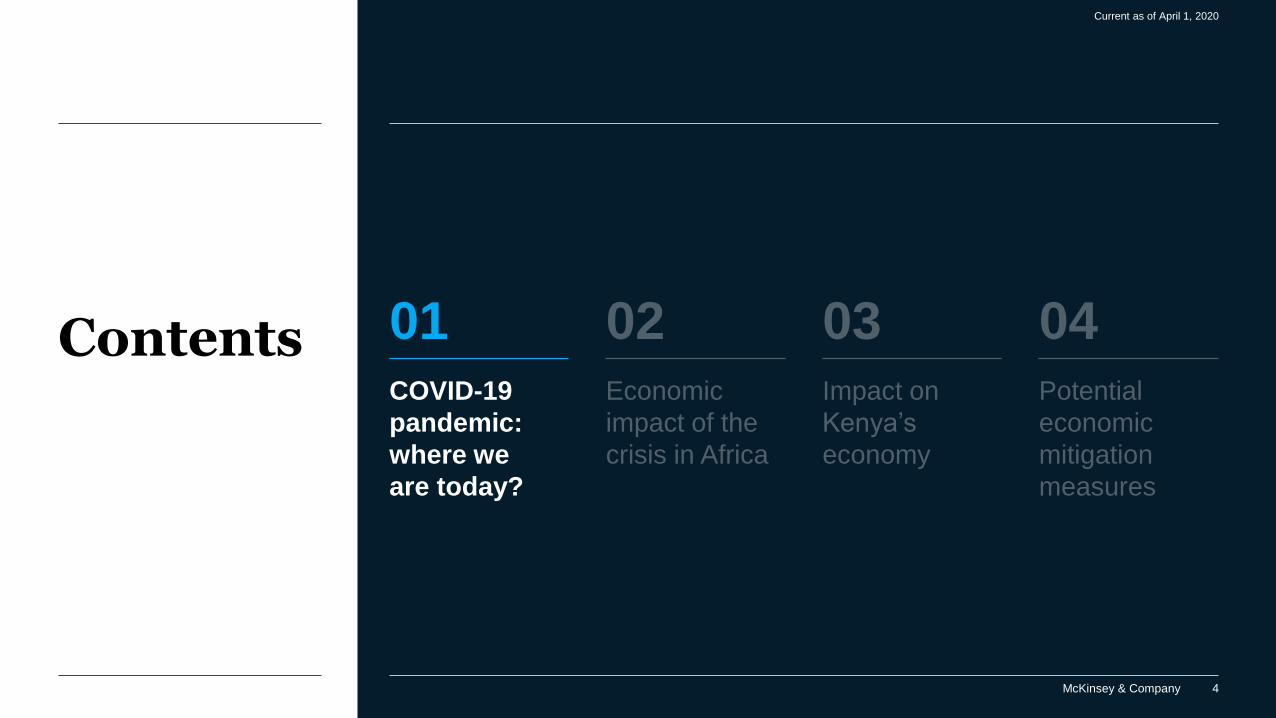
Contents
Current as of April 1, 2020
COVID-19
pandemic:
where we
are today?
01Economic
impact of the
crisis in Africa
02Impact on
Kenya’s
economy
03Potential
economic
mitigation
measures
04

McKinsey & Company 5
Current as of April 1, 2020
Sources: World Health Organization, CDC, news reports
~75%New reported cases in Europe as of April 1th
>37,000
Deaths
>50New countries with cases March 23rd-29th
<1%China’s share of new reported cases March 23rd-29th
>145
Countries or territories with evidence of local transmission2
~90
Countries or territories with more than 100 reported cases1
Countries or territories with reported cases1
>200
Reported confirmed cases
>770,000Impact to date
The global spread is accelerating with more reports of local transmissionLatest as of April 1, 2020
1. Previously counted only countries; now aligned with new WHO reports;
excluding cruise ship;
2. Previously noted as community transmission in McKinsey documents; now
aligned with WHO definition
McKinsey & Company 5

McKinsey & Company 6
COVID-19 appears to be more dangerous than the fluLatest as of March 18, 2020
Current as of April 1, 2020
1. Evidence on exact numbers are emerging, however expected to decrease as viral containment measures intensify and treatments are developed
2. WHO statement as 3.4% and latest calculated as deaths/ cases; dependent on conditions such as the patient's age, community immunity, and health system capabilities
3. In outbreak setting or the introduction of a new disease
4. Case Fatality numbers reflect outbreak settings and factors such as the patient's age, community immunity and health system capabilities
5. Estimates are very context and time specific, however are provided from prior outbreaks based on academic lit review
6. WHO estimates 15% severe and 5% critical
S. Korea case fatality rate after widespread
testing. CFR appears higher where cases
missed or health systems overwhelmed2
Features of the disease to date1
Higher reproduction than the flu
1.5-2x
~0.9%
Of cases have a severe/critical form of the
disease6
Up to 20%
Comparison to other diseases5
Early identification of the disease, intensification of viral control, and treatment, when available, will reduce
reproduction number and case fatality
Reproduction
number3 (average
number
of people infected
by each infected
person
in outbreak setting)
D
G
K
I
A
E
FJ
Zika
Chickenpox
SARS-CoV
COVID-19
Polio3
Measles3
Influenza 1918
Smallpox
MERS-CoV
Ebola (West
Africa 2014)
Influenza H1N1 2009
Influenza
H2N2 1957B
C
H
Medium (2-15%) High (>15%)Low (<2%)
Mediu
m (
2-4
)H
igh (
>4)
Low
(2
-4)
Case Fatality1 (proportion of deaths among confirmed cases)
Sources: World Health Organization, CDC, Nature, The Lancet, PLOS One The Journal of Infectious Diseases, BMC Infectious Diseases, Infectious Disease Modelling, news reports

McKinsey & Company 7
~5,300 confirmed COVID-19 cases in Africa…
Current as of April 1, 2020
At April 1, 9.00a GMT, >5,300 confirmed COVID-19 cases, >170 deaths across 47 African countries1
McKinsey & Company 7
Day
…but the pandemic is progressing at a slower rate than Europe
COVID-10: first 46 days for Africa and Europe1
Comparison of the total number of COVID-19 cases
reported over the first 46 days since first case reported in
each region
To
tal
CO
VID
-19 c
ases (
000s)
Note: The numbers in Africa may be lower due to limited testing in the continent compared to Europe
556
1326
131
656582
50
162 246
142
83
362
19152
23
9
6
70
3
63
7
19
3
128
10
114
8
6
46
7
26
33
11
8
34
168
15
14
Isolated cases
Small cluster
Communitytransmission
5
0
10
15
20
2521205 240 4310 4115 22 23 373127 29 30 32 33 34 35 36 38 39 40 42 44 45 462826
Africa Europe
Current as of April 1, 2020
Sources: WHO situation reports, JHU global dashboard, press search; https://www.who.int/emergencies/diseases/novel-coronavirus-2019/situation-reports
1. We defined <20 cases as isolated, 20-100 cases as small clusters, and >100 as community transmission. Small clusters can include cases that are locally transmitted as well as imported

McKinsey & Company 8
Contents
Current as of April 1, 2020
COVID-19
pandemic:
where we
are today?
01Economic
impact of the
crisis in
Africa
02 03 04Impact on
Kenya’s
economy
Potential
economic
mitigation
measures

McKinsey & Company 9
Four scenarios defined for Africa, considering both the health and economic situations
Current as of April 1, 2020
Sources: McKinsey analysis
2 Global resurgent virus, and prolonged downturnUS and Europe require significant quarantine measures through
much of the year; Asia faces a resurgence of infection leading to a
double dip slowdown
Africa outbreak contained
Most countries experience isolated cases or small cluster
outbreaks, but with carefully managed restrictions, there is no
widespread outbreak, and most economic impacts are driven
through global knock-on effects on trade, and travel
1 Global virus contained, and economic slowdownContinued recovery in Asia; Europe and US face a sharp downturn
but are able to control the epidemic and release most quarantine
measures by early Q3
Africa outbreak contained
Most countries experience isolated cases or small cluster
outbreaks, but with carefully managed restrictions, there is no
widespread outbreak, and most economic impacts are driven
through global knock-on effects on trade, and travel
4 Global resurgent virus, and prolonged downturnUS and Europe require significant quarantine measures through
much of the year; Asia faces a resurgence of infection leading to a
double dip slowdown”
Africa outbreak widespread
Significant outbreaks occur in most major African economies,
leading to a significant economic downturn though reduced
consumption, and global knock-on effects on trade and travel
Contained Widespread
Africa transmission
Glo
bal
tran
sm
issio
n
Co
nta
ine
dR
es
urg
en
tGlobal situation Domestic situation
3 Global virus contained, and economic slowdownContinued recovery in Asia; Europe and US face a sharp downturn
but are able to control the epidemic and release most quarantine
measures by early Q3
Africa outbreak widespread
Significant outbreaks occur in most major African economies,
leading to a significant economic downturn though reduced
consumption, and global knock-on effects on trade and travel

McKinsey & Company 10
Three major challenges face African countries around the COVID-19 crisis in the coming months
Current as of April 1, 2020
Implication
Global
COVID-19
pandemic
Africa
COVID-19
pandemic
Pressure on interest rates and currency devaluation
Rising deficits and increase pressure on debt markets
Limited access to hard currency
Reduced tax revenues
Oil impact
Economic
Fiscal
Monetary
Reduced household expenditure and consumption
Businesses – many of them SMEs -- under significant cost
pressure, potential of closure and bankruptcies
Lower productivity, job losses particularly for non-
essential sectors.
Slow down in overall economic growth, acute in hard-hit
sectors (e.g., tourism), potential for recession
Long term human capital issues (e.g., delayed schooling
or dropouts)
ImpactChallenge
F
D Limited movement of people due to
travel bans (domestic, international,
diaspora)
E Disruption to ways of working for
individuals, businesses and governments
Reduction in government and
business revenues for oil exporters,
but lower costs for oil importers and
consumers
C Delayed / reduced FDI as partners re-
direct capital locally
B Lower demand in global markets for
non-oil goods exports
Disruption in global supply chains
exposed to inputs from Asia, Europe and
the Middle East
A
In model, will continue to refine
Sources: McKinsey analysis
Not yet in model
Disclaimer: Current modelling as of 3/29/20 assumes no fiscal stimulus packages
from governments, or monetary impacts of currency and credit ratings (fix 2018 prices).
The next model iteration will be more sensitive to these elements, and shared accordingly

McKinsey & Company 11
Africa’s GDP growth could decline by between 3pp and 8pp depending on the scenarioRecall: Baseline GDP growth for 2020: 3.9% growth1
Current as of April 1, 2020
Africa transmission
Glo
ba
l tr
an
sm
iss
ion
Global situation Africa Transmission
2 Global resurgent virus, and prolonged downturn
Africa outbreak contained
1 Global virus contained, and economic slowdown
Africa outbreak contained
3.90
2020 GDP Growth Projection
0.40
~3pp
Pre-COVID19 GDP growth Scenario modelled GDP growth
2020 GDP Growth Projection
-1.40
3.90 ~5pp
2020 GDP Growth Projection
-3.90
3.90 ~8pp
Source: McKinsey analysis, AfDB African Statistical Yearbook
1. AfDB estimate, other analyst estimates range between 3.2% (e.g., UNECA) to 3.8% (e.g., Oxford Economics Research)
4 Global resurgent virus, and prolonged downturn
Africa outbreak widespread
3 Global virus contained, and economic slowdown
Africa outbreak widespread
-2.10
2020 GDP Growth Projection
3.90 ~6pp
The economic loss across
scenarios range from
between ~3-8pp of GDP
In three out of the four
scenarios looked at, Africa
as a whole could be forced
into a contraction
Across scenarios, Africa
COVID-19 effects (i.e. way
of working and limited
travel) is the most
significant lever,
accounting for between
~35-50% of total GDP loss.
Globally driven disruptions
(i.e. supply chain, non-oil
exports, and FDI) account
for about one third of total
disruptions, and the oil
effect accounts for the
remainder (20-30%)
Key insights
Contained Widespread
Co
nta
ine
dR
es
urg
en
t
Disclaimer: Current modelling as of 3/29/20 assumes no fiscal stimulus packages
from governments, or monetary impacts of currency and credit ratings (fix 2018
prices). The next model iteration will be more sensitive to these elements
McKinsey & Company 12
Contents
Current as of April 1, 2020
COVID-19
pandemic:
where we
are today?
01Impact on
Kenya’s
economy
03 04Economic
impact of the
crisis in Africa
02Potential
economic
mitigation
measures
McKinsey & Company 13
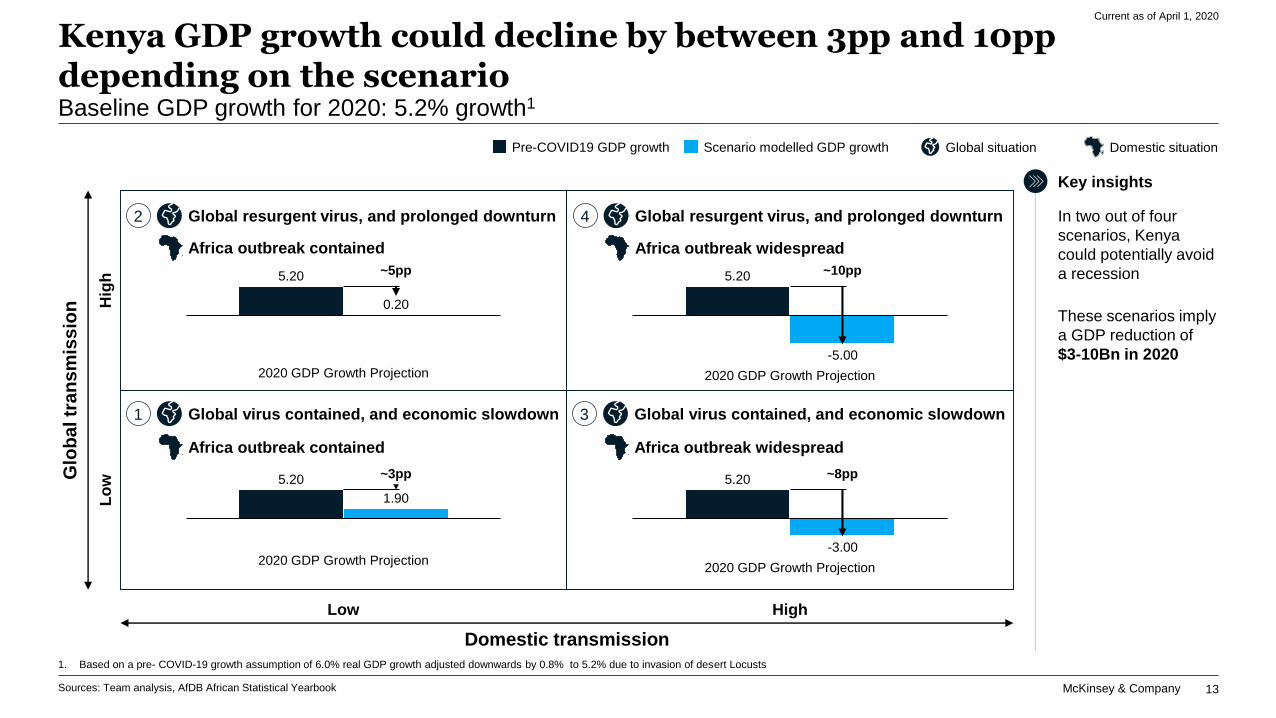
Kenya GDP growth could decline by between 3pp and 10pp depending on the scenarioBaseline GDP growth for 2020: 5.2% growth1
Current as of April 1, 2020
Low High
Domestic transmission
Glo
ba
l tr
an
sm
iss
ion
Lo
wH
igh
Global situation Domestic situation
2 Global resurgent virus, and prolonged downturn
Africa outbreak contained
1 Global virus contained, and economic slowdown
Africa outbreak contained
2020 GDP Growth Projection
1.90
5.20 ~3pp
Pre-COVID19 GDP growth Scenario modelled GDP growth
2020 GDP Growth Projection
0.20
5.20 ~5pp
2020 GDP Growth Projection
5.20
-5.00
~10pp
Sources: Team analysis, AfDB African Statistical Yearbook
1. Based on a pre- COVID-19 growth assumption of 6.0% real GDP growth adjusted downwards by 0.8% to 5.2% due to invasion of desert Locusts
4 Global resurgent virus, and prolonged downturn
Africa outbreak widespread
3 Global virus contained, and economic slowdown
Africa outbreak widespread
2020 GDP Growth Projection
5.20
-3.00
~8pp
In two out of four
scenarios, Kenya
could potentially avoid
a recession
These scenarios imply
a GDP reduction of
$3-10Bn in 2020
Key insights

McKinsey & Company 14
Impact on Kenya GDP growth driven by reduction in household consumption and supply chain disruptionsBaseline GDP for 2020: USD 98bn1
Current as of April 1, 2020
1. Based on a pre- COVID-19 growth assumption of 6.0% real GDP growth adjusted downwards by 0.8% to 5.2% due to the ongoing invasion of desert Locusts
2. Accounts for reduced household, private and government expenditure
3. Accounts for consumption disrupted by restricted movement and international travel restrictions
4. Assumes average 2020 price of $35/bbl in 2020 for Scenario 1 & 2, and average $25/bbl in 2020 for Scenario 3 & 4
Source: KNBS; AfDB; IMF
Impact on GDP growth in 2020 across scenarios, %New GDP
growth (%)
Delta
$bn
2.3-8.0
6.0
Pre-COVID growth Expected 2020
growth rate
Tourism
(limited travel)3
0.8
Adjustment for
locust invasion1
5.2
Disruption to
household &
business spend2
1.9 – (5.0)
1.3-2.4
Supply chain
disruption
0.9-1.41.2-1.5
Oil dynamics4 Projected GDP
6.0
5.2
1.9-(5.0)(3.2) - (10.0)
We use AFDB GDP 2019 growth rate of
6.0% while Kenya Monetary Policy
Committee (MPC) uses 6.2%

McKinsey & Company 15
Manufacturing and tourism affiliated sectors to be hugely impacted by the outbreak
Current as of April 1, 2020
Sector Percentage point change in sector contribution at 2020F GDP of $98Bn1
Education, Healthcare, and Defence
Manufacturing
Construction & Real Estate
Wholesale & Retail
Hotel and restaurant
Transport and storage
ICT
Financial services
Business services
Agriculture
Mining
Utilities
Arts, entertainment, recreation, others
-2pp
-4pp
+0pp
-7pp
-1pp
-2pp
-15pp
-30pp
-15pp
+15pp
-3pp
-2pp
-7pp
1. Based on a pre- COVID-19 growth assumption of 6.0% real GDP growth adjusted downwards by 0.8% to 5.2% due to invasion of desert Locusts | 2/Percentage of sector contribution to 2020F GDP.
Percentage point
change (best case)
34%
1%
9%
8%
2%
5%
7%
1%
8%
1%
6%
9%
8%
% Baseline
2020F GDP2
Decline heavily driven by
decreasing consumption
and supply chain disruption
Tourism expected to
decline by between 60-90%
depending on the scenario
-6pp
-6pp
+1pp
-15pp
-3pp
-3pp
-60pp
-60pp
-35pp
+40pp
-8pp
-5pp
-10pp
Percentage point
change (worst case)

McKinsey & Company 16
Kenya: Methodology and key assumptions
Current as of April 1, 2020
1. Methodology to arrive at financial impact. For all, financial impact is then multiplied by GDP multiplier to calculate GDP impact
2. Day-to-day impact of travel bans, including reduced domestic transport, and reduced consumption of goods and services, captured in disruption to way of working lever
3. The most direct implication to disruption in ways of working will be a reduction in disposable income at a macro-level as described. Given large share of informal sector workers, these impacts are difficult to size. We therefore used reduction in household spend as a proxy for
the impact of disruption to ways of working, and will avoid double counting on this lever
4. Includes both raw material food purchases, and purchases from retail outlets, largely driven by urban to rural migration patterns
5. Includes clothing, and personal care expenditure
Lever
F Oil impact Oil intensity (boe per GDP) x
GDP x savings per barrel
Oil price: $35/bbl average over 2020
Energy intensity: 0.5bbl/1000USD GDP
Oil price: $35/bbl average over 2020
Energy intensity: 0.5bbl/1000USD GDP
Oil price: $35/bbl average over 2020
Energy intensity: 0.5bbl/1000USD GDP
D Limited travel2 Travel & Tourism revenues x
disruption factor based on
origin of travelers
Domestic: 2 month disruption of 90%, 25%
lower for rest of year
International: 4 month disruption of 90%,
followed by 60% lower for remainder of year
Domestic: 4 month disruption of 90%, 25%
lower for rest of year
International: 4 month disruption of 90%,
followed and 60% lower for remainder of year
All: 4 month disruption of 90%, 60% lower for
rest of year
All: 4 month disruption of 90%, 75% lower for
rest of year
Disruption to
ways of working
(with direct
passthrough to
spend)3
E Household expenditures x
disruption factor (on a
category level)
F&B4: 2 month disruption of 15%6
Transport: 2 month disruption of 50%
Education: 2 month disruption of 25%
Retail5: 2 month disruption of 20%
Health and ICT: 2 month increase of 50%
F&B4: 2 month disruption of 15%6
Transport: 2 month disruption of 50%
Education: 2 month disruption of 25%
Retail5: 2 month disruption of 20%
Health and ICT: 2 month increase of 50%
F&B4: 6 month disruption of 15%
Transport: 6 month disruption of 50%
Education: 6 month disruption of 25%
Retail5: 6 month disruption of 20%
Health and ICT: 6 month increase of 50%
F&B4: 6 month disruption of 20%
Transport: 6 month disruption of 50%
Education: 6 month disruption of 25%
Retail5: 6 month disruption of 30%
Health and ICT: 6 month increase of 50%
Business expenditures x
disruption factor
(on a sector level)
Govt. spend on business x
disruption factor
(on a sector level)
Capital investment: 4% lower domestic
investment for 2020
Govt spending on business: 10% lower for 6
months
Capital investment: 8% lower domestic
investment for 2020
Govt spending on business: 10% lower for 6
months
Capital investment: 8% lower domestic
investment for 2020
Govt spending on business: 20% lower for 9
months
Capital investment: 8% lower domestic
investment for 2020
Govt spending on business: 20% lower for 9
months
Methodology1
A Supply chain import
disruption
Base case import assumptions
x disruption factor (on a
product, and trade partner
granularity
China: 1 month disruption of 50%, followed by 2
month disruption of 25%
RoW: 1 month disruption of 50%, followed by 2
month disruption of 25%
China: 1 month disruption of 50%, followed by 2
month disruption of 25%
RoW: 2 month disruption of 50%, followed by 2
month disruption of 25%
All: Extra 2 month disruption of 25% for a region
that accounts for 25% of all imports (second
outbreak)
China: 1 month disruption of 50%, followed by 2
month disruption of 25%
RoW: 1 month disruption of 50%, followed by 2
month disruption of 25%
All: 2 month disruption of 25% for internal lag
China: 1 month disruption of 50%, followed by 2
month disruption of 25%
RoW: 2 month disruption of 50%, followed by 2
month disruption of 25%
All: Extra 2 month disruption of 25% for a region
that accounts for 25% of all imports (second
outbreak)
B Non-oil goods
exportsBase case export assumptions
x disruption factor on a
product, and trade partner
granularity
Flowers: 90% disruption in flowers for 2 months,
followed by 50% disruption of another 2 months
Other agriculture: 25% disruption for 2 months
Other goods: 25-50% disruption for 2 months,
10-25% disruption for 2 months
Flowers: 90% disruption in flowers for 4
months, followed by 50% disruption of another 2
months
Other agriculture: 25% disruption for 4 months,
10% disruption for 2 months
Other goods: 25-50% disruption for 4 months,
25% disruption for 2 months
Flowers: 90% disruption in flowers for 4
months, followed by 25% disruption of another 2
months
Other agriculture: 25% disruption for 4 months
Other goods: 25-50% disruption for 4 months,
10-25% disruption for 2 months
Flowers: 90% disruption in flowers for 4 months,
followed by 50% disruption of another 2 months
Other agriculture: 25% disruption for 4 months,
10% disruption for 2 months
Other goods: 25-50% disruption for 4 months,
25% disruption for 2 months
C Foreign investment FDI inflow: FDI x disruption
factor and duration
Adjustment: 10% lower FDI flows for 2020 Adjustment: 30% lower FDI flows for 2020 Adjustment: 20% lower FDI flows for 2020 Adjustment: 30% lower FDI flows for 2020
Oil price: $25/bbl average over 2020
Energy intensity: 0.5bbl/1000USD GDP
Global economic slowdown
Africa outbreak contained1 2
Global prolonged downturn:
Africa outbreak contained3
Global economic slowdown
Africa outbreak widepsread 4Global prolonged downturn:
Africa outbreak widespread

McKinsey & Company 17
Contents
Current as of April 1, 2020
COVID-19
pandemic:
where we
are today?
01Potential
economic
mitigation
measures
04Economic
impact of the
virus in Africa
02Impact on
Kenya’s
economy
03
McKinsey & Company 18
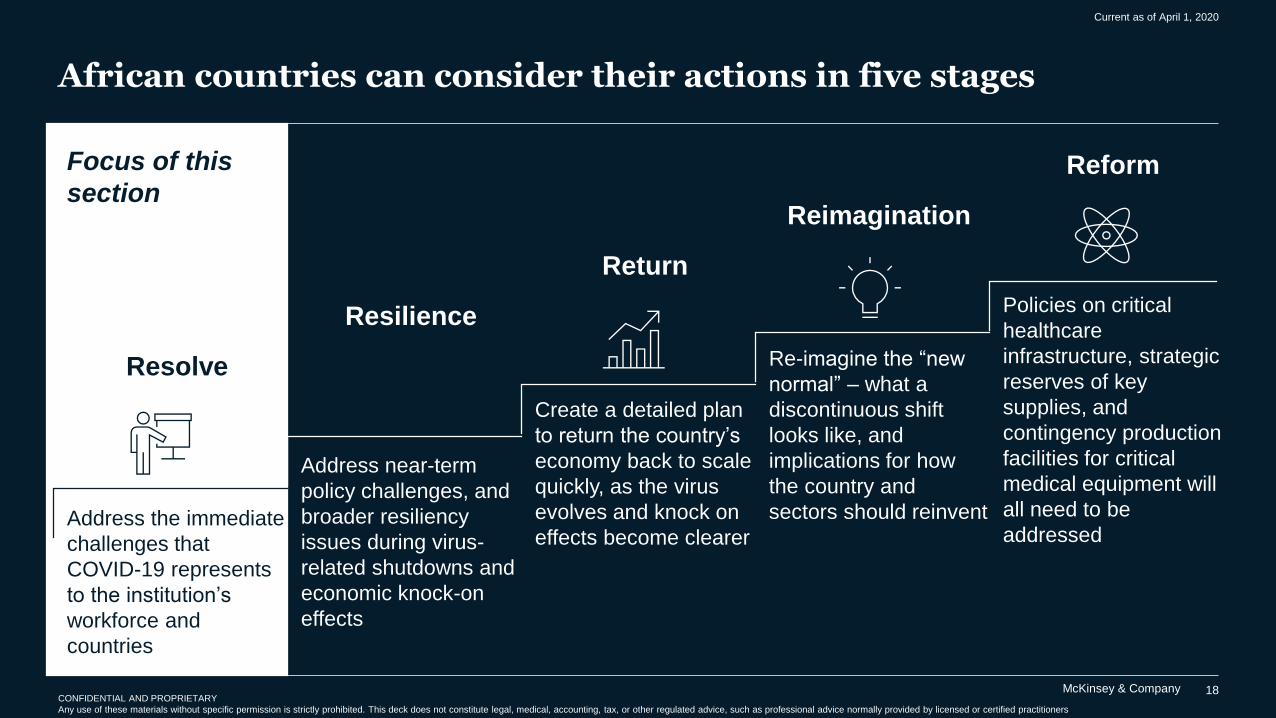
Create a detailed plan
to return the country’s
economy back to scale
quickly, as the virus
evolves and knock on
effects become clearer
Policies on critical
healthcare
infrastructure, strategic
reserves of key
supplies, and
contingency production
facilities for critical
medical equipment will
all need to be
addressed
African countries can consider their actions in five stages
Reform
CONFIDENTIAL AND PROPRIETARY
Any use of these materials without specific permission is strictly prohibited. This deck does not constitute legal, medical, accounting, tax, or other regulated advice, such as professional advice normally provided by licensed or certified practitioners
Address the immediate
challenges that
COVID-19 represents
to the institution’s
workforce and
countries
Address near-term
policy challenges, and
broader resiliency
issues during virus-
related shutdowns and
economic knock-on
effects
Re-imagine the “new
normal” – what a
discontinuous shift
looks like, and
implications for how
the country and
sectors should reinvent
Resolve
Resilience
Return
Reimagination
Focus of this
section
Current as of April 1, 2020
McKinsey & Company 19
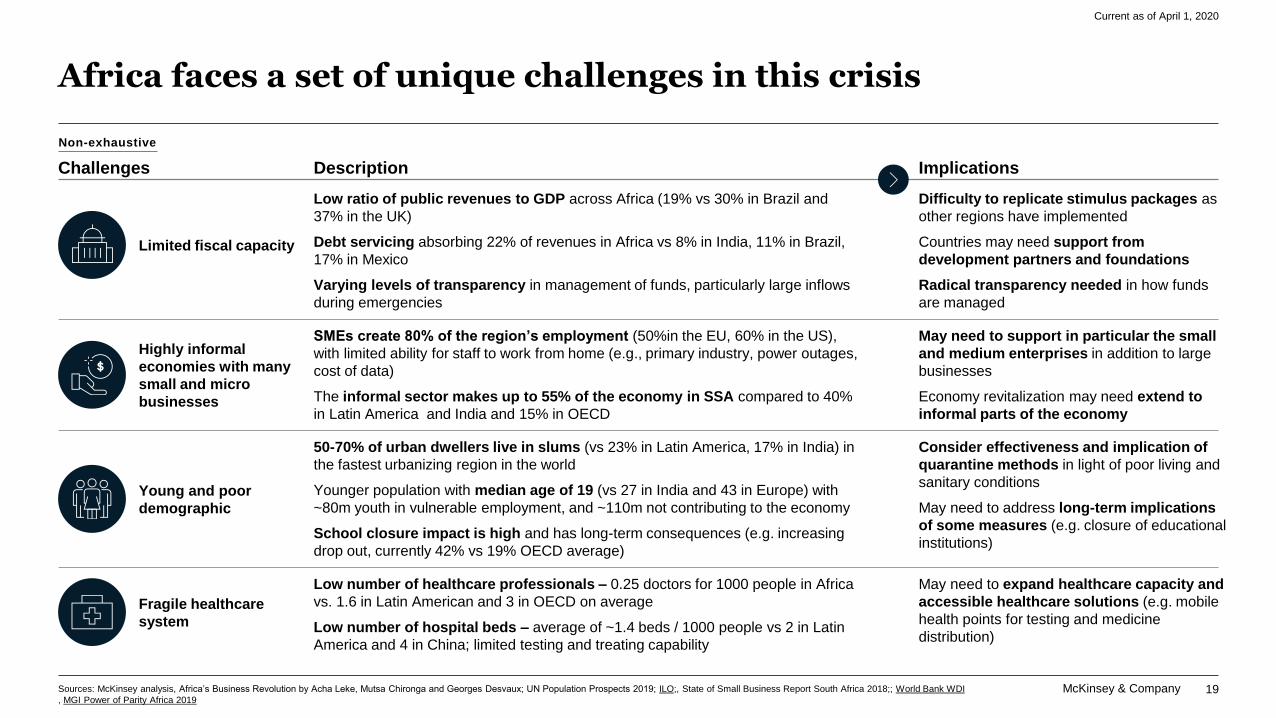
Africa faces a set of unique challenges in this crisis
Current as of April 1, 2020
Challenges Description Implications
Sources: McKinsey analysis, Africa’s Business Revolution by Acha Leke, Mutsa Chironga and Georges Desvaux; UN Population Prospects 2019; ILO;, State of Small Business Report South Africa 2018;; World Bank WDI
, MGI Power of Parity Africa 2019
Non-exhaustive
Fragile healthcare
system
Limited fiscal capacity
Low ratio of public revenues to GDP across Africa (19% vs 30% in Brazil and
37% in the UK)
Debt servicing absorbing 22% of revenues in Africa vs 8% in India, 11% in Brazil,
17% in Mexico
Varying levels of transparency in management of funds, particularly large inflows
during emergencies
Difficulty to replicate stimulus packages as
other regions have implemented
Countries may need support from
development partners and foundations
Radical transparency needed in how funds
are managed
Highly informal
economies with many
small and micro
businesses
SMEs create 80% of the region’s employment (50%in the EU, 60% in the US),
with limited ability for staff to work from home (e.g., primary industry, power outages,
cost of data)
The informal sector makes up to 55% of the economy in SSA compared to 40%
in Latin America and India and 15% in OECD
May need to support in particular the small
and medium enterprises in addition to large
businesses
Economy revitalization may need extend to
informal parts of the economy
Young and poor
demographic
50-70% of urban dwellers live in slums (vs 23% in Latin America, 17% in India) in
the fastest urbanizing region in the world
Younger population with median age of 19 (vs 27 in India and 43 in Europe) with
~80m youth in vulnerable employment, and ~110m not contributing to the economy
School closure impact is high and has long-term consequences (e.g. increasing
drop out, currently 42% vs 19% OECD average)
Consider effectiveness and implication of
quarantine methods in light of poor living and
sanitary conditions
May need to address long-term implications
of some measures (e.g. closure of educational
institutions)
Low number of healthcare professionals – 0.25 doctors for 1000 people in Africa
vs. 1.6 in Latin American and 3 in OECD on average
Low number of hospital beds – average of ~1.4 beds / 1000 people vs 2 in Latin
America and 4 in China; limited testing and treating capability
May need to expand healthcare capacity and
accessible healthcare solutions (e.g. mobile
health points for testing and medicine
distribution)

McKinsey & Company 20
Four sets of stakeholders could work together to addressthe crisis in Africa
Development PartnersMultilateral institutions
Bilateral institution and country partners
Foundations
Private Sector
Businesses
Private Sector Associations
Public SectorGovernments
African Union
Regional Economic Bodies
CitizensIndividuals
Civil SocietyCitizens
Public Sector
Private
Sector
Development
Partners
Combatting the
Covid-19 Crisis
in Africa
Current as of April 1, 2020

McKinsey & Company 21
Governments may need to focus urgently on five key areas
Contain the epidemic Prepare the health ecosystem
Protect jobs Support most vulnerable populations
Digital tracking
and monitoring
Proactive
communication
Anticipate
and manage
the health
crisis
Secure food
supply chain
and essential
services
Ensure
support for
vulnerable
populations
Anticipate
and manage
the impact
on the
economy
Drugs and medical
equipment (testing
kits, masks,
ventilators, etc.)
Infrastructure
(hospitals, beds,
etc.)
Health
professionals
Diagnostic,
Testing, and
isolating
patients
Preventive
measures (e.g.,
restrictions,
lockdowns)
Secure the food supply Maintain the access to essential services
Setup and
operationalisation
Measures to
protect jobs
TelecomsHealth &
EducationUtilities Others
Tracking
and
monitoring
Appropriate
pricing of
priority products
Supply of
priority
products
Economy Short term stimulus Prepare for recovery
Setup
National
Nerve Center
Scenario
analysis
Impact on
economy and
pubic finance
Measures to
help firms
survive the
crisis
Anticipation of the post crisis and
preparation of the ‘next normal’
Retrain existing
workforce for
current crisis
needs
Social safety net
mechanisms and
distribution
Others
Measures to
maintain
financial
stability
A
x Detail follows
B
C
D
E
Current as of April 1, 2020
McKinsey & Company 22
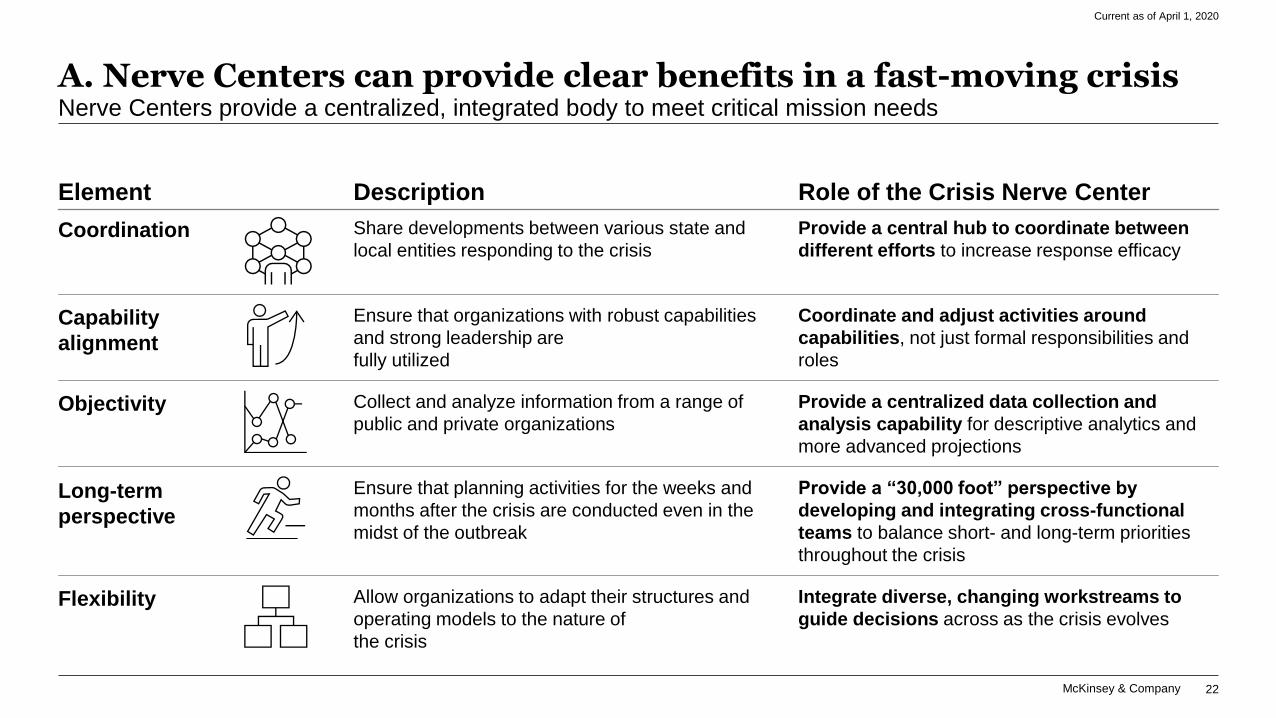
Description Role of the Crisis Nerve CenterElement
Coordination
Capability
alignment
A. Nerve Centers can provide clear benefits in a fast-moving crisisNerve Centers provide a centralized, integrated body to meet critical mission needs
Objectivity
Long-term
perspective
Flexibility
Share developments between various state and
local entities responding to the crisis
Provide a central hub to coordinate between
different efforts to increase response efficacy
Coordinate and adjust activities around
capabilities, not just formal responsibilities and
roles
Provide a centralized data collection and
analysis capability for descriptive analytics and
more advanced projections
Provide a “30,000 foot” perspective by
developing and integrating cross-functional
teams to balance short- and long-term priorities
throughout the crisis
Integrate diverse, changing workstreams to
guide decisions across as the crisis evolves
Allow organizations to adapt their structures and
operating models to the nature of
the crisis
Ensure that planning activities for the weeks and
months after the crisis are conducted even in the
midst of the outbreak
Collect and analyze information from a range of
public and private organizations
Ensure that organizations with robust capabilities
and strong leadership are
fully utilized
Current as of April 1, 2020
McKinsey & Company 23
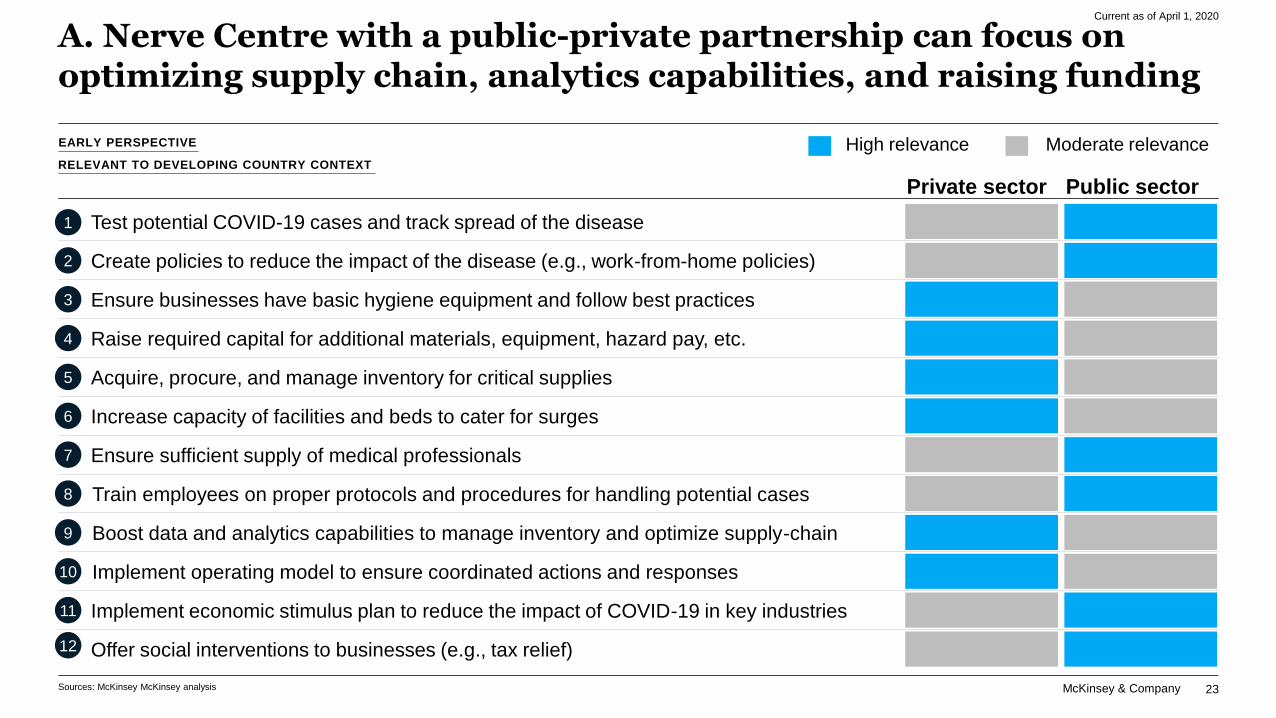
A. Nerve Centre with a public-private partnership can focus on optimizing supply chain, analytics capabilities, and raising funding
Private sector Public sector
High relevance Moderate relevance
Offer social interventions to businesses (e.g., tax relief)
Test potential COVID-19 cases and track spread of the disease
Create policies to reduce the impact of the disease (e.g., work-from-home policies)
Ensure businesses have basic hygiene equipment and follow best practices
Raise required capital for additional materials, equipment, hazard pay, etc.
Acquire, procure, and manage inventory for critical supplies
Increase capacity of facilities and beds to cater for surges
Ensure sufficient supply of medical professionals
Train employees on proper protocols and procedures for handling potential cases
Boost data and analytics capabilities to manage inventory and optimize supply-chain
Implement operating model to ensure coordinated actions and responses
Implement economic stimulus plan to reduce the impact of COVID-19 in key industries
Sources: McKinsey McKinsey analysis
1
2
3
4
5
6
7
8
9
10
11
12
EARLY PERSPECTIVE
RELEVANT TO DEVELOPING COUNTRY CONTEXT
Current as of April 1, 2020

McKinsey & Company 24
B. There are a number of healthcare interventions Governments can consider to effectively respond to the COVID-19 outbreak
Sources: McKinsey McKinsey analysis
Interventions
Prevent the virus
from becoming
widespread
1. Test potential COVID-19 cases and conduct contact tracing
2. Create policies to reduce the impact of the disease (e.g., work-from-home policies)
3. Ensure businesses have basic hygiene equipment and follow best practices
Description
Control the virus 4. Raise required capital for additional materials, equipment, hazard pay, etc.
5. Acquire, procure, and manage inventory for critical supplies (e.g., ventilators, requirements for
isolation rooms, face masks, etc.).
6. Increase capacity of facilities and beds to cater for surges
7. Ensure sufficient supply of medical professionals
8. Train medical professionals on proper protocols and procedures for handling potential cases
9. Boost data and analytics capabilities to manage inventory and optimize supply-chain
10. Clarify key new responsibilities and operating model for top teams in context of potential epidemic
Current as of April 1, 2020
McKinsey & Company
Working Draft - Current as of April 1, 2020 - 1900 GMT
25
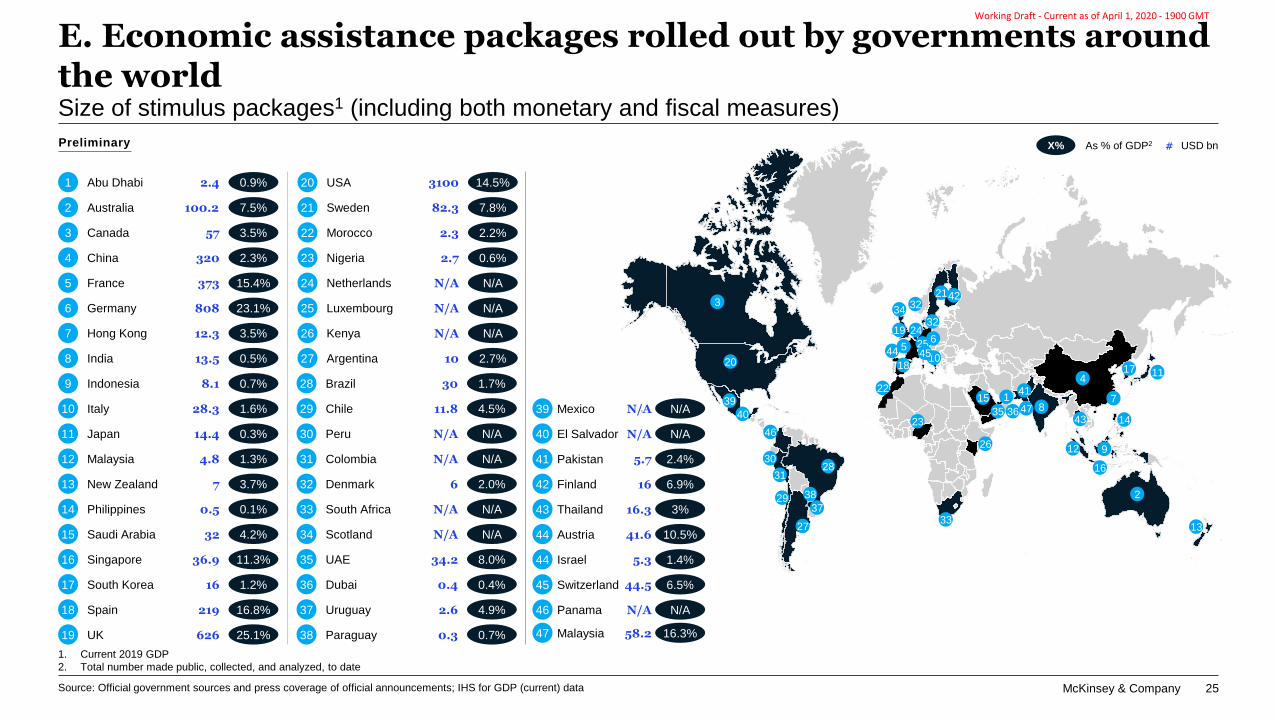
E. Economic assistance packages rolled out by governments around the worldSize of stimulus packages1 (including both monetary and fiscal measures)
1. Current 2019 GDP
2. Total number made public, collected, and analyzed, to date
# USD bnX% As % of GDP2
Source: Official government sources and press coverage of official announcements; IHS for GDP (current) data
India 13.5 0.5%8
Indonesia 8.1 0.7%9
Italy 28.3 1.6%10
Japan 14.4 0.3%11
Malaysia 4.8 1.3%12
New Zealand 7 3.7%13
Philippines 0.5 0.1%14
Saudi Arabia 4.2%15
Singapore 36.9 11.3%16
Australia 100.2 7.5%2
Abu Dhabi 2.4 0.9%1
Canada 57 3.5%3
China 320 2.3%4
15.4%France5
Germany6
Hong Kong 12.3 3.5%7
South Korea 1617 1.2%
808
373
23.1%
Preliminary
USA20
Sweden 82.321 7.8%
Morocco 2.322 2.2%
Nigeria 2.723 0.6%
Netherlands N/A24 N/A
Luxembourg N/A N/A25
Kenya N/A N/A26
Argentina 10 2.7%27
Brazil 30 1.7%28
Chile 11.8 4.5%29
Colombia N/A N/A31
Peru N/A30 N/A
Denmark 6 2.0%32
South Africa N/A N/A33
UAE 34.2 8.0%35
Scotland N/A34 N/A
3100 14.5%
Dubai 0.4 0.4%36
18 17
13
15
5 25
10
12 9
1
16
2
8
3
14
11
6
20
4
19
23
26
21
22
24
27
28
29
30
31
32
7
35
33
3432
36
37
38
39
40
41
42
43
45
46
44
N/A N/AMexico39
N/A N/AEl Salvador40
5.7 2.4%Pakistan41
16 6.9%Finland42
16.3 3%Thailand43
41.6 10.5%Austria44
5.3 1.4%Israel44
Spain 21918 16.8%
19 UK 626 25.1%
32
Uruguay 2.637 4.9%
38 Paraguay 0.3 0.7%
44.5 6.5%Switzerland45
N/A N/A46 Panama
58.2 16.3%47 Malaysia
47

McKinsey & Company
Working Draft - Current as of April 1, 2020 - 1900 GMT
26
1,000,000
100,000
10,000
E. Size of stimulus measures announced, with increasing numbers of global COVID-19 cases
Cumulative size of stimulus response2 (as % of GDP)
1. Total number made public, collected, and analyzed, to date; only covers countries with more than one package release
2. Countries are repeated in cases where stimulus packages or measures have been announced on different dates; size of stimulus response is the aggregate
amount spent at that point in time
3. Number of cases recorded on the day of the stimulus announcement
0
16
6
15
11
Feb 16
9
14
Feb 09
2
Mar 15 Mar 29Feb 23
12
3
1
Mar 08 Mar 22
10
4
17
13
8
5
7
Austria
UAE
Saudi Arabia
Sweden
Canada
Australia
UK
Japan
Denmark
UK
Saudi
Arabia
Japan
Switzerland
Malaysia
Australia
Hong Kong
UAE
UK Hong Kong
SwedenUSA
Austria
Thailand
USA
USA
Hong KongSingapore
Australia
Singapore
Italy
UK
USA
Canada
Malaysia
India
Thailand
Switzerland
India
Source: WHO Covid-19 Dashboard, IHS Data for GDP, Official government sources and press coverage of official announcements
Total stimulus size at time of first announcement Total stimulus size at time of second announcement
Total stimulus size at time of third announcement Total stimulus size at time of fourth announcement
Preliminary
Cu
mu
lativ
e n
um
ber o
f CO
VID
-19
ca
se
s, g
lob
ally
(#)
Size of stimulus response1 vs. number of global COVID-19 cases
Global number of COVID cases

McKinsey & Company 27
Private sector companies may need to consider shifting their operating model/ governance structure to a crisis response mode …
Current as of April 1, 2020
A shift from business as usual … … to remote agile model
2-3 months A few days to 2 weeks
Goes to business Goes to legal Goes to operations
Experience from other markets suggests that businesses across key markets outside of South Africa
may have 2-4 weeks to make shifts in how they serve clients, support staff members and manage
stakeholders
Long decision making process
Multiple steps and hand-offs in decision implementation
Fragmented teams working in silos
Decentralised decision making
Quick decision making
Streamlining decision making and relaxing onerous
governance requirements
Single team reporting directly to CEO
Semi-autonomous team with decision making authority

McKinsey & Company 28
Private Sector
focus areas
… and focus on 6 key areasBased on discussions with risk and health professionals and more than 200 companies across sectors
Current as of April 1, 2020
BWorkforce
protection
CSupply Chain
Stabilization
DCustomer
engagement
EStress-test
financials
AOperate nerve
center
FGovernment
support
Tiering (all/some/no WFH) | Infra setup (VPN, laptops, desktops) | Broadband availability3 Personnel & contractors
Staggering work shifts/times | Prevention (e.g., Social distancing) | Closures4 Facility & On-site norms
Multi-channel communications | Confidential reporting mechanisms | Source of truth2 Two Way Communication
Critical part identification | Parts rationing | Location optimization 2 Inventory management
Operational impact assessment | Production capacity optimization3 Production & Operations
Prevention interventions across customer journey | Cust. team training | Execution monitoring2 Customer protection
Relevant scenarios based on latest epidemiological & economic outlook1 Scenario definition
Financials in different scenarios, especially working capital requirements2 Financial stress tests
Local & federal regulators and public health officials | Support to Government5 Health & Govt engagement
Portfolio of policies and actions incl. prevention and incident response1 Policy & Management
Customer comms re: COVID-practices | Fact-based reports on issues | Situation comms3 Customer outreach
Comms to B2B customers (e.g., microsite) | Scenario-based risk comms1 B2B transparency
Ports | Logistics capacity pre-booking | Route optimization5 Logistics
Cross-tier risk transparency | Supplier restart | Order mgmt. | New supplier qualifications1 Supplier engagement
S&OP SKU-level demand signal estimates by macro scenario | Production and sourcing plan4 Demand management
Trigger-based portfolio of actions (across all workstreams above)2 Portfolio of actions
Align leaders on scenarios | Roundtable exercises 3 Leadership alignment
Offer expertise support to Governments (e.g., via the National nerve center)1 Sharing expertise
Implement supportive measures (e.g., reduced data costs, delayed interest payments, etc.)2 Providing support
Single source of truth for issue resolution & tapping surge resources where needed1 Issue map & management
Monetary and product donations to funds for support of vulnerable population3 Donations

McKinsey & Company 29
F. Manufacturing example: 15 immediate actions to control cost and ensure business continuity To create transparency and ensure agility during crisis management
Current as of April 1, 2020
Sources: McKinsey team analysis
Set up control
tower to help
implement
strategic and
tactical actions
with transparency
and execution
excellence
Recommended actions
Operations
Materials
Logistics
5 Expedite qualification process of new partners and suppliers without sacrificing quality
14 Pre-book air freight/rail/truck capacity
15 Optimize mode of transportation and route to reduce lead-time and cost
7 Work with supplier to source PPE for production lines (government is requiring glasses, gloves and masks)
3 Conduct scenario analysis to understand financial and operational implications in continuous shutdown with 3-6
month demand
4 Optimize limited production capacity based on aligned prioritization criteria (customer, profit, production efficiency,
strategic importance of goods, etc.)
Strategic
8 Determine truly critical components and understand risks of suppliers of each tier
9 Understand current inventory buffer and coordinate cross-regionally
10 Build up critical material inventory with help from distributors, brokers or alternative sources especially for
suppliers from Hubei
11 Monitor extending lead times to gauge performance and capacity against supplier promises
12 Consider short-term support to suppliers/partners along the value chain (e.g., low-interest loan) to accelerate
faster work resumption in exchange for supply stability and exclusivity
13 Re-balance the sourcing volume from impacted sites to other sites based on sourcing strategy such as single,
dual, multi, if shutdown persists
6 Implement solid business recovery action catalogue/policy/process on infectious disease situation and be able to
restart as soon as possible
Demand 1 Reshape demand if applicable and communicate with customers on inventory availability and actual production
capacity. Consider pricing action for uncertain demand outlook
2 Adjust demand forecast timely with inputs from distributors and major customers
Tactical1
1. Tactical actions are temporary actions that might not continue after the crisis, while strategic actions have long term impact on the supply chains

McKinsey & Company 30
Development partners can consider even bolder actions to support the continent through the crisis
Current as of April 1, 2020
Economy
Business
environment
Household
welfare
Ideas
3
5
2
1
These ideas are in addition to supporting governments on some of their key interventions detailed on the prior pages
Private-sector liquidity fund. Offer grants, interest free loans or debt for equity swaps to support
businesses and limit job losses.
Africa “Solidarity fund” where businesses and individuals could contribute to a fund earmarked for
immediate relief for the most vulnerable households and micro-businesses (“hustlers”).
Africa Green Program. A get-to-work program that plants millions of trees across the continent, using
a currently out-of-work labor force at reduced salary, could provide employment and help solve global
and local climate change issues.
Africa recovery plan. An extensive stimulus package or economic development plan, modelled on the
Marshall Plan that provided aid to Europe after World War II.
African procurement platform. A common platform to procure medical supplies and equipment to
combat the pandemic could provide an Africa-wide solution to challenges that each individual country is
trying to address.
4
EXAMPLES -- NOT EXHAUSTIVE

McKinsey & Company 31
Look forward: Our next perspective will focus on resilience
CONFIDENTIAL AND PROPRIETARY
Any use of these materials without specific permission is strictly prohibited. This deck does not constitute legal, medical, accounting, tax, or other regulated advice, such as professional advice normally provided by licensed or certified practitioners
Address near-term
policy challenges, and
broader resiliency issues
during virus-related
shutdowns and
economic knock-on
effects
Reform
ResolveResilience
ReturnReimagination
Focus of this
section
▪ How big do fiscal stimulus packages need to for meaningful impact?
▪ How do governments manage their roles to both protect the health of
vulnerable populations and protect the economy? When, and how, is
the decision on returning to work going to be made?
▪ How systematic can reforms be (e.g., entire sectors be re-structured
and reformed as part of any intervention package)?
▪ What are the best ways to provide targeted support to the most
vulnerable populations?
▪ What would be the long-term human-capital implications of these
measures, and how could we mitigate those? For example, school
closures are necessary now but may negatively impact quality of
education and drop-out rates.
Address the immediate
challenges that COVID-
19 represents to the
institution’s workforce
and countries
NOT EXHAUSTIVE
Current as of April 1, 2020