Embed Size (px)
Citation preview
Please see important disclosure on the last pages.
2
Agenda Page
Market overview 2
ECBC publishes covered bond statistics for 2015 4
Overview of PSPP holdings 6
ECB tracker 8
Charts & Graphs 13
Publication overview 19
Contacts 20
Find us on Bloomberg: NRDR <GO>
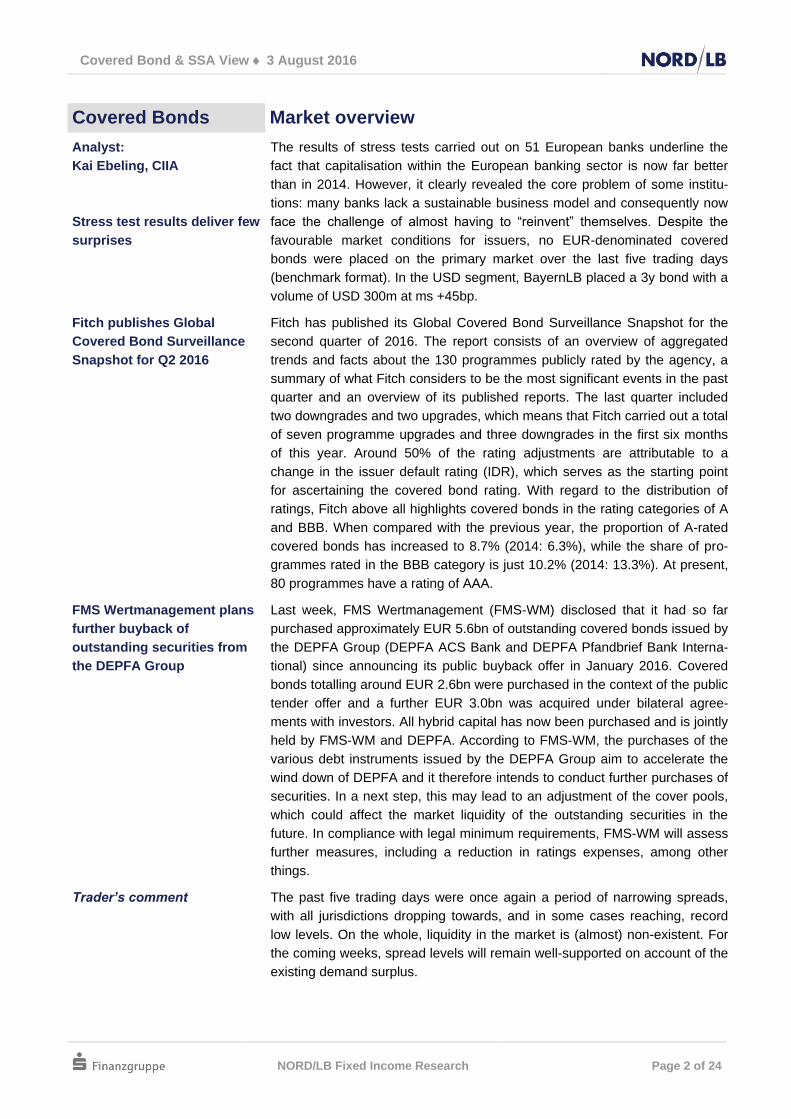
Issue volume – Covereds Issue volume – SSA
0
5
10
15
20
25
30
08
/15
09
/15
10
/15
11
/15
12
/15
01
/16
02
/16
03
/16
04
/16
05
/16
06
/16
07
/16
EU
Rbn
AUBECACHCYCZDEDKESFIFRGBGRHUIEITLUNLNONZPTSESGTR
0
5
10
15
20
25
30
35
09
/15
10
/15
11
/15
12
/15
01
/16
02
/16
03
/16
04
/16
05
/16
06
/16
07
/16
08
/16
EU
Rb
n
Other
ES
AT
NL
FR
GE
SNAT
Source: Bloomberg, NORD/LB Fixed Income Research Source: Bloomberg, NORD/LB Fixed Income Research
Fixed Income Research
Covered Bond & SSA View 3 August 2016 30/2016
Covered Bond & SSA View 3 August 2016
NORD/LB Fixed Income Research
Page 2 of 24
Covered Bonds Market overview
Analyst:
Kai Ebeling, CIIA
Stress test results deliver few
surprises
The results of stress tests carried out on 51 European banks underline the
fact that capitalisation within the European banking sector is now far better
than in 2014. However, it clearly revealed the core problem of some institu-
tions: many banks lack a sustainable business model and consequently now
face the challenge of almost having to “reinvent” themselves. Despite the
favourable market conditions for issuers, no EUR-denominated covered
bonds were placed on the primary market over the last five trading days
(benchmark format). In the USD segment, BayernLB placed a 3y bond with a
volume of USD 300m at ms +45bp.
Fitch publishes Global
Covered Bond Surveillance
Snapshot for Q2 2016
Fitch has published its Global Covered Bond Surveillance Snapshot for the
second quarter of 2016. The report consists of an overview of aggregated
trends and facts about the 130 programmes publicly rated by the agency, a
summary of what Fitch considers to be the most significant events in the past
quarter and an overview of its published reports. The last quarter included
two downgrades and two upgrades, which means that Fitch carried out a total
of seven programme upgrades and three downgrades in the first six months
of this year. Around 50% of the rating adjustments are attributable to a
change in the issuer default rating (IDR), which serves as the starting point
for ascertaining the covered bond rating. With regard to the distribution of
ratings, Fitch above all highlights covered bonds in the rating categories of A
and BBB. When compared with the previous year, the proportion of A-rated
covered bonds has increased to 8.7% (2014: 6.3%), while the share of pro-
grammes rated in the BBB category is just 10.2% (2014: 13.3%). At present,
80 programmes have a rating of AAA.
FMS Wertmanagement plans
further buyback of
outstanding securities from
the DEPFA Group
Last week, FMS Wertmanagement (FMS-WM) disclosed that it had so far
purchased approximately EUR 5.6bn of outstanding covered bonds issued by
the DEPFA Group (DEPFA ACS Bank and DEPFA Pfandbrief Bank Interna-
tional) since announcing its public buyback offer in January 2016. Covered
bonds totalling around EUR 2.6bn were purchased in the context of the public
tender offer and a further EUR 3.0bn was acquired under bilateral agree-
ments with investors. All hybrid capital has now been purchased and is jointly
held by FMS-WM and DEPFA. According to FMS-WM, the purchases of the
various debt instruments issued by the DEPFA Group aim to accelerate the
wind down of DEPFA and it therefore intends to conduct further purchases of
securities. In a next step, this may lead to an adjustment of the cover pools,
which could affect the market liquidity of the outstanding securities in the
future. In compliance with legal minimum requirements, FMS-WM will assess
further measures, including a reduction in ratings expenses, among other
things.
Trader’s comment The past five trading days were once again a period of narrowing spreads,
with all jurisdictions dropping towards, and in some cases reaching, record
low levels. On the whole, liquidity in the market is (almost) non-existent. For
the coming weeks, spread levels will remain well-supported on account of the
existing demand surplus.
Covered Bond & SSA View 3 August 2016
NORD/LB Fixed Income Research
Page 3 of 24
SSA Market overview
Analyst:
Norman Rudschuck, CIIA
Bank of England only
gives minimal indication
of what is next
Just as the information from the last central bank meetings of the ECB, Fed
and BoJ has been digested, the BoE has its next scheduled meeting tomor-
row. An interest rate cut has already been priced in, with a 50% cut from
0.50% to 0.25% the most likely scenario. This would allow enough scope for
a further rate cut while the door is also open for quantitative measures. Nei-
ther should affect interest rate levels in the rest of Europe. 10y Bunds are
hovering at around -0.05%. Spanish BONOs are testing the historically low
1% mark. This is also having a significant impact on SSA markets. We do
not expect a trend reversal in the foreseeable future. On the contrary, it is
currently more likely that the low interest rate environment will worsen.
ESM comments on Greece Klaus Regling emphasised in an interview that Greece should be able to
leave the rescue programme in around two years, provided that the country
adheres to the reform agenda. He added that the bailout fund has adopted
the same approach as the IMF, with the difference that the ESM has globally
paid out almost three times as much as the IMF since 2011.
L-Bank presents balance of
its lending to promote
business development
Dr Axel Nawrath, CEO of L-Bank, explained that “development loans trigger
new developments while safeguarding what is well established” when he
presented the bank’s balance of loans for promoting business development
for the first half of the year. L-Bank extended EUR 1.7bn to enterprises in
Baden-Wuerttemberg during the first six months of 2016. This was approxi-
mately 7% less than in 2015. Of the total figure, EUR 337m were granted to
start-up companies whereas established SMEs received financing totalling
EUR 1.1bn. A further EUR 230m comprised financial assistance for the
economy and agricultural loans. The 4,520 businesses financed in total plan
to invest EUR 2.3bn, using these funds. Dr Nawrath indicated that the fi-
nancing secured 149,000 jobs and facilitated the creation of 5,800 new jobs.
According to Nawrath, who was commenting on the further trend in the sec-
ond half of the year, “although Brexit doesn’t change the underlying mega
trends, the impact on short and medium-term economic developments and
consequently demand for financing is difficult to estimate at this juncture”.
Primary market Last week, Rentenbank increased a tap issue by EUR 300m at ms -18bp.
EIB was busy with a 2024 tap issue at ms -24bp worth EUR 400m. Hessen
had a transaction with the longest maturity (20y) since 1998, raising
EUR 500m at ms +3bp. The trading week under review was rounded off by
the Land of Brandenburg (EUR 300m for 20 years at ms +2bp).
Issuer Country Timing ISIN Maturity Volume Spread Rating
HESSEN GE 28.07.2016 DE000A1RQC02 20.0y 0.5bn +3bp - / - / -
Source: Bloomberg, NORD/LB Fixed Income Research (Rating: Fitch / Moody’s / S&P)
Trader’s comment Finally, we are seeing some new bond issues in the Länder segment. Lower
Saxony and Hessen each issued bonds worth EUR 500m with Niesa 08/24
(area ms -10bp, pricing ms -12bp) and Hessen 08/36 (area ms +4bp, pricing
ms +3bp) respectively. Both bond issues were very well received in the mar-
ket. This impressively shows how much the market has dried up. The Eu-
rosystem reduced its bond purchases in the Länder segment. Market and
sales demand for long maturities remained at a high level. Accordingly, the
spread level continued to tighten. At the moment, 8y bonds have a 0% yield.
Covered Bond & SSA View 3 August 2016
NORD/LB Fixed Income Research
Page 4 of 24
Covereds ECBC publishes covered bond statistics for 2015
Analyst:
Kai Ebeling, CIIA
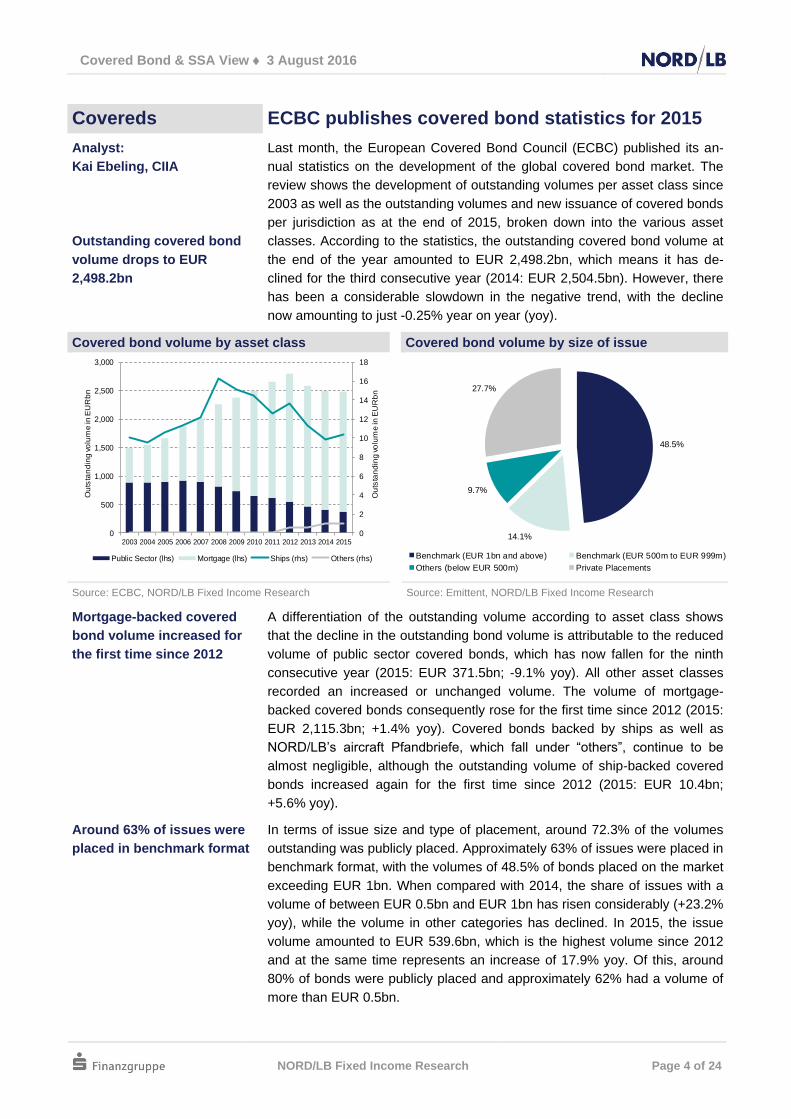
Outstanding covered bond
volume drops to EUR
2,498.2bn
Last month, the European Covered Bond Council (ECBC) published its an-
nual statistics on the development of the global covered bond market. The
review shows the development of outstanding volumes per asset class since
2003 as well as the outstanding volumes and new issuance of covered bonds
per jurisdiction as at the end of 2015, broken down into the various asset
classes. According to the statistics, the outstanding covered bond volume at
the end of the year amounted to EUR 2,498.2bn, which means it has de-
clined for the third consecutive year (2014: EUR 2,504.5bn). However, there
has been a considerable slowdown in the negative trend, with the decline
now amounting to just -0.25% year on year (yoy).
Covered bond volume by asset class Covered bond volume by size of issue
0
2
4
6
8
10
12
14
16
18
0
500
1,000
1,500
2,000
2,500
3,000
2003 2004 2005 2006 2007 2008 2009 2010 2011 2012 2013 2014 2015
Ou
tsta
nd
ing
vo
lum
e in
EU
Rb
n
Ou
tsta
nd
ing
vo
lum
e in
EU
Rb
n
Public Sector (lhs) Mortgage (lhs) Ships (rhs) Others (rhs)
48.5%
14.1%
9.7%
27.7%
Benchmark (EUR 1bn and above) Benchmark (EUR 500m to EUR 999m)
Others (below EUR 500m) Private Placements
Source: ECBC, NORD/LB Fixed Income Research Source: Emittent, NORD/LB Fixed Income Research
Mortgage-backed covered
bond volume increased for
the first time since 2012
A differentiation of the outstanding volume according to asset class shows
that the decline in the outstanding bond volume is attributable to the reduced
volume of public sector covered bonds, which has now fallen for the ninth
consecutive year (2015: EUR 371.5bn; -9.1% yoy). All other asset classes
recorded an increased or unchanged volume. The volume of mortgage-
backed covered bonds consequently rose for the first time since 2012 (2015:
EUR 2,115.3bn; +1.4% yoy). Covered bonds backed by ships as well as
NORD/LB’s aircraft Pfandbriefe, which fall under “others”, continue to be
almost negligible, although the outstanding volume of ship-backed covered
bonds increased again for the first time since 2012 (2015: EUR 10.4bn;
+5.6% yoy).
Around 63% of issues were
placed in benchmark format
In terms of issue size and type of placement, around 72.3% of the volumes
outstanding was publicly placed. Approximately 63% of issues were placed in
benchmark format, with the volumes of 48.5% of bonds placed on the market
exceeding EUR 1bn. When compared with 2014, the share of issues with a
volume of between EUR 0.5bn and EUR 1bn has risen considerably (+23.2%
yoy), while the volume in other categories has declined. In 2015, the issue
volume amounted to EUR 539.6bn, which is the highest volume since 2012
and at the same time represents an increase of 17.9% yoy. Of this, around
80% of bonds were publicly placed and approximately 62% had a volume of
more than EUR 0.5bn.
Covered Bond & SSA View 3 August 2016
NORD/LB Fixed Income Research
Page 5 of 24
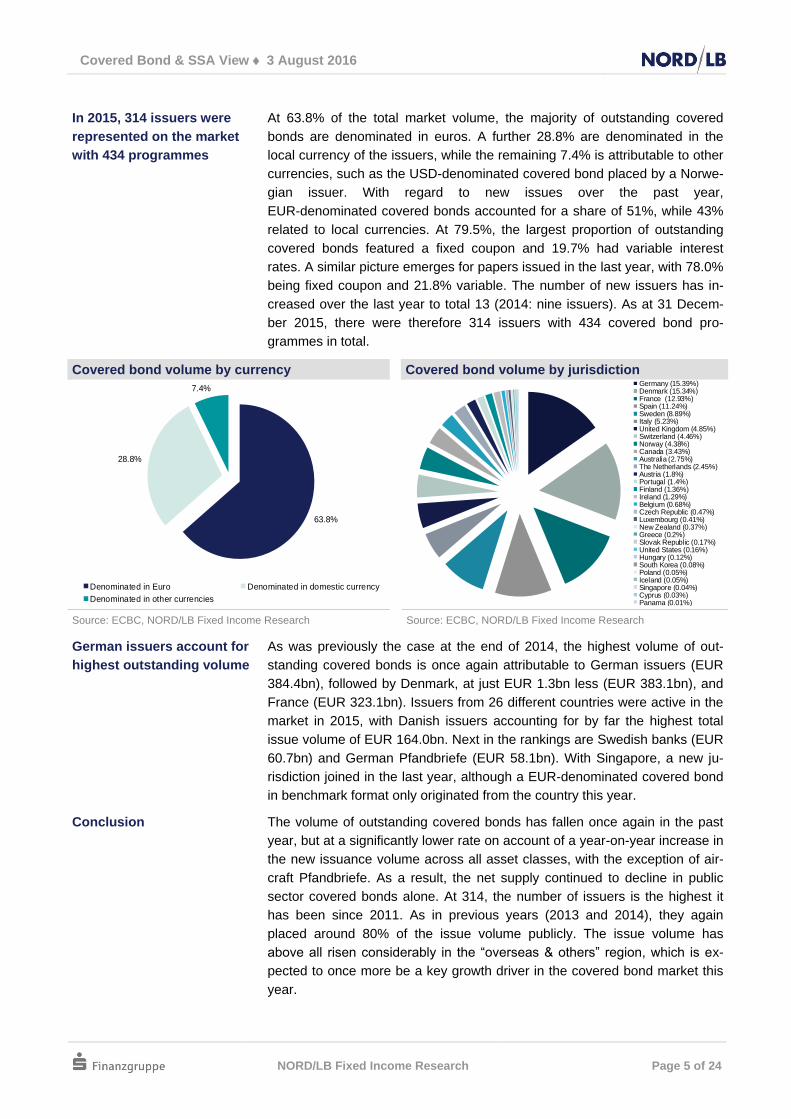
In 2015, 314 issuers were
represented on the market
with 434 programmes
At 63.8% of the total market volume, the majority of outstanding covered
bonds are denominated in euros. A further 28.8% are denominated in the
local currency of the issuers, while the remaining 7.4% is attributable to other
currencies, such as the USD-denominated covered bond placed by a Norwe-
gian issuer. With regard to new issues over the past year,
EUR-denominated covered bonds accounted for a share of 51%, while 43%
related to local currencies. At 79.5%, the largest proportion of outstanding
covered bonds featured a fixed coupon and 19.7% had variable interest
rates. A similar picture emerges for papers issued in the last year, with 78.0%
being fixed coupon and 21.8% variable. The number of new issuers has in-
creased over the last year to total 13 (2014: nine issuers). As at 31 Decem-
ber 2015, there were therefore 314 issuers with 434 covered bond pro-
grammes in total.
Covered bond volume by currency Covered bond volume by jurisdiction
63.8%
28.8%
7.4%
Denominated in Euro Denominated in domestic currency
Denominated in other currencies
Germany (15.39%)Denmark (15.34%)France (12.93%)Spain (11.24%)Sweden (8.89%)Italy (5.23%)United Kingdom (4.85%)Switzerland (4.46%)Norway (4.38%)Canada (3.43%)Australia (2.75%)The Netherlands (2.45%)Austria (1.8%)Portugal (1.4%)Finland (1.36%)Ireland (1.29%)Belgium (0.68%)Czech Republic (0.47%)Luxembourg (0.41%)New Zealand (0.37%)Greece (0.2%)Slovak Republic (0.17%)United States (0.16%)Hungary (0.12%)South Korea (0.08%)Poland (0.05%)Iceland (0.05%)Singapore (0.04%)Cyprus (0.03%)Panama (0.01%)
Source: ECBC, NORD/LB Fixed Income Research Source: ECBC, NORD/LB Fixed Income Research
German issuers account for
highest outstanding volume
As was previously the case at the end of 2014, the highest volume of out-
standing covered bonds is once again attributable to German issuers (EUR
384.4bn), followed by Denmark, at just EUR 1.3bn less (EUR 383.1bn), and
France (EUR 323.1bn). Issuers from 26 different countries were active in the
market in 2015, with Danish issuers accounting for by far the highest total
issue volume of EUR 164.0bn. Next in the rankings are Swedish banks (EUR
60.7bn) and German Pfandbriefe (EUR 58.1bn). With Singapore, a new ju-
risdiction joined in the last year, although a EUR-denominated covered bond
in benchmark format only originated from the country this year.
Conclusion The volume of outstanding covered bonds has fallen once again in the past
year, but at a significantly lower rate on account of a year-on-year increase in
the new issuance volume across all asset classes, with the exception of air-
craft Pfandbriefe. As a result, the net supply continued to decline in public
sector covered bonds alone. At 314, the number of issuers is the highest it
has been since 2011. As in previous years (2013 and 2014), they again
placed around 80% of the issue volume publicly. The issue volume has
above all risen considerably in the “overseas & others” region, which is ex-
pected to once more be a key growth driver in the covered bond market this
year.
Covered Bond & SSA View 3 August 2016
NORD/LB Fixed Income Research
Page 6 of 24
SSAs Overview of PSPP holdings
Analyst:
Norman Rudschuck, CIIA
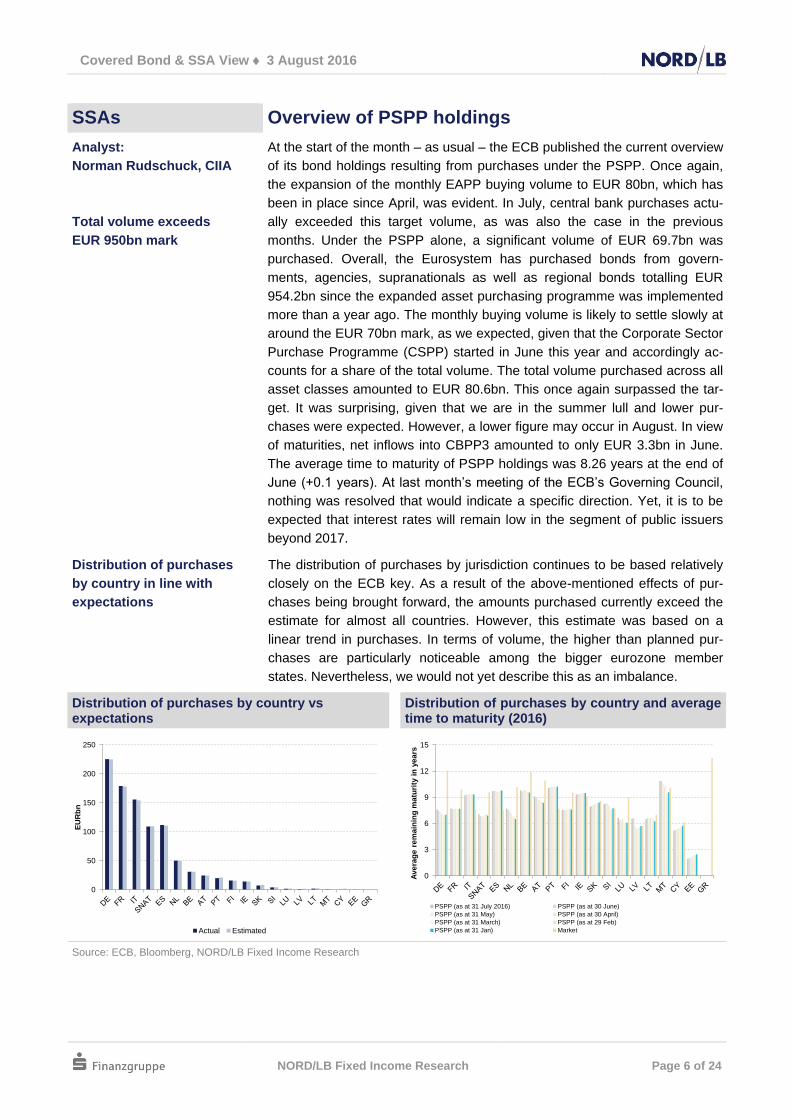
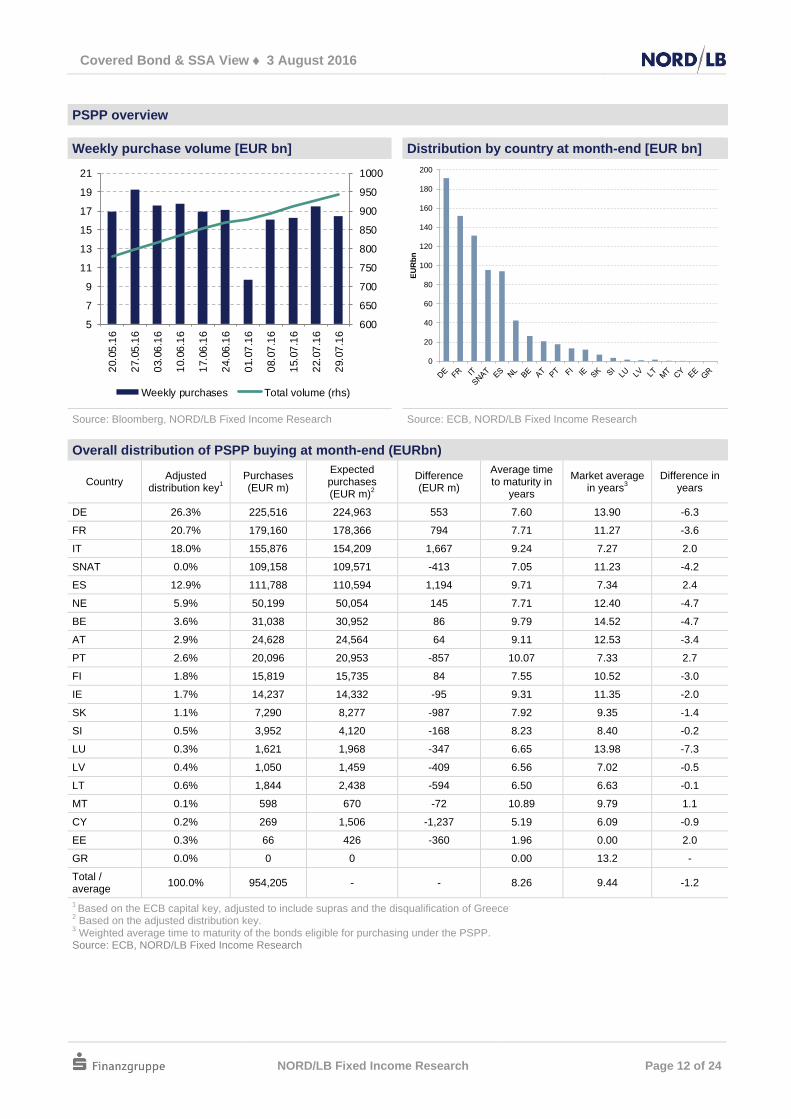
Total volume exceeds
EUR 950bn mark
At the start of the month – as usual – the ECB published the current overview
of its bond holdings resulting from purchases under the PSPP. Once again,
the expansion of the monthly EAPP buying volume to EUR 80bn, which has
been in place since April, was evident. In July, central bank purchases actu-
ally exceeded this target volume, as was also the case in the previous
months. Under the PSPP alone, a significant volume of EUR 69.7bn was
purchased. Overall, the Eurosystem has purchased bonds from govern-
ments, agencies, supranationals as well as regional bonds totalling EUR
954.2bn since the expanded asset purchasing programme was implemented
more than a year ago. The monthly buying volume is likely to settle slowly at
around the EUR 70bn mark, as we expected, given that the Corporate Sector
Purchase Programme (CSPP) started in June this year and accordingly ac-
counts for a share of the total volume. The total volume purchased across all
asset classes amounted to EUR 80.6bn. This once again surpassed the tar-
get. It was surprising, given that we are in the summer lull and lower pur-
chases were expected. However, a lower figure may occur in August. In view
of maturities, net inflows into CBPP3 amounted to only EUR 3.3bn in June.
The average time to maturity of PSPP holdings was 8.26 years at the end of
June (+0.1 years). At last month’s meeting of the ECB’s Governing Council,
nothing was resolved that would indicate a specific direction. Yet, it is to be
expected that interest rates will remain low in the segment of public issuers
beyond 2017.
Distribution of purchases
by country in line with
expectations
The distribution of purchases by jurisdiction continues to be based relatively
closely on the ECB key. As a result of the above-mentioned effects of pur-
chases being brought forward, the amounts purchased currently exceed the
estimate for almost all countries. However, this estimate was based on a
linear trend in purchases. In terms of volume, the higher than planned pur-
chases are particularly noticeable among the bigger eurozone member
states. Nevertheless, we would not yet describe this as an imbalance.
Distribution of purchases by country vs expectations
Distribution of purchases by country and average time to maturity (2016)
0
50
100
150
200
250
EU
Rb
n
Actual Estimated
0
3
6
9
12
15
Ave
rag
e r
em
ain
ing
ma
turi
ty i
n y
ea
rs
PSPP (as at 31 July 2016) PSPP (as at 30 June)
PSPP (as at 31 May) PSPP (as at 30 April)
PSPP (as at 31 March) PSPP (as at 29 Feb)
PSPP (as at 31 Jan) Market
Source: ECB, Bloomberg, NORD/LB Fixed Income Research
Covered Bond & SSA View 3 August 2016
NORD/LB Fixed Income Research
Page 7 of 24
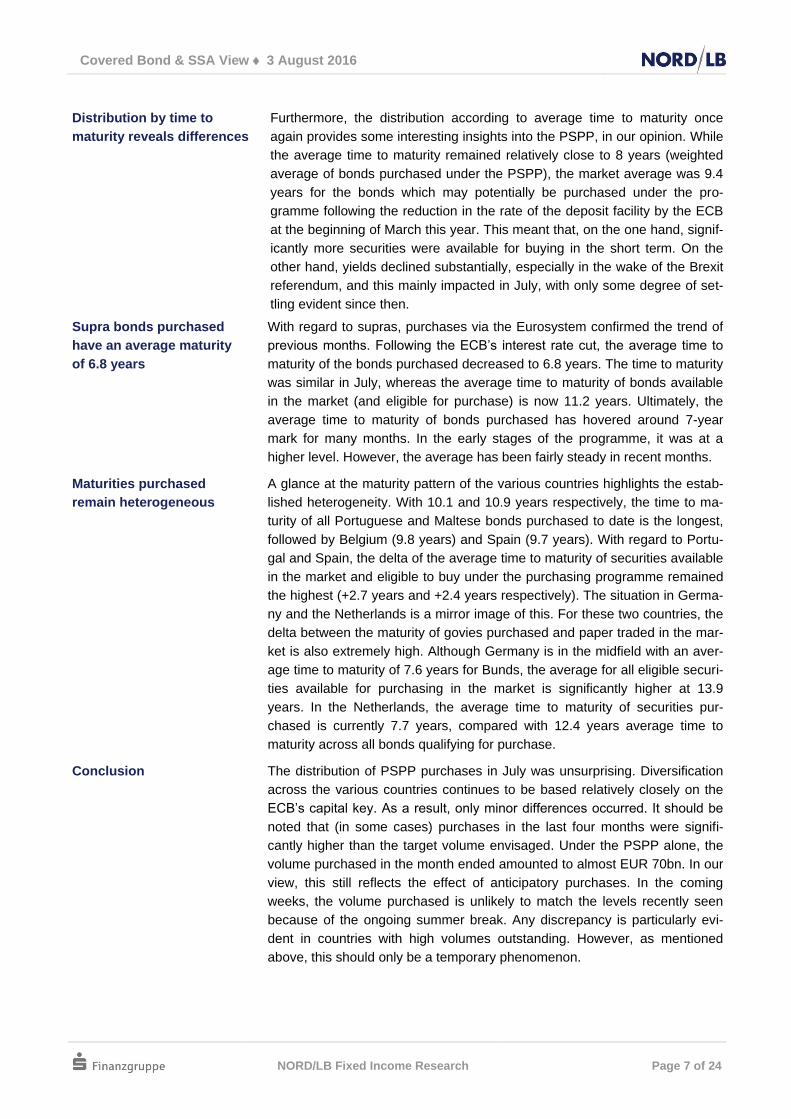
Distribution by time to
maturity reveals differences
Furthermore, the distribution according to average time to maturity once
again provides some interesting insights into the PSPP, in our opinion. While
the average time to maturity remained relatively close to 8 years (weighted
average of bonds purchased under the PSPP), the market average was 9.4
years for the bonds which may potentially be purchased under the pro-
gramme following the reduction in the rate of the deposit facility by the ECB
at the beginning of March this year. This meant that, on the one hand, signif-
icantly more securities were available for buying in the short term. On the
other hand, yields declined substantially, especially in the wake of the Brexit
referendum, and this mainly impacted in July, with only some degree of set-
tling evident since then.
Supra bonds purchased
have an average maturity
of 6.8 years
With regard to supras, purchases via the Eurosystem confirmed the trend of
previous months. Following the ECB’s interest rate cut, the average time to
maturity of the bonds purchased decreased to 6.8 years. The time to maturity
was similar in July, whereas the average time to maturity of bonds available
in the market (and eligible for purchase) is now 11.2 years. Ultimately, the
average time to maturity of bonds purchased has hovered around 7-year
mark for many months. In the early stages of the programme, it was at a
higher level. However, the average has been fairly steady in recent months.
Maturities purchased
remain heterogeneous
A glance at the maturity pattern of the various countries highlights the estab-
lished heterogeneity. With 10.1 and 10.9 years respectively, the time to ma-
turity of all Portuguese and Maltese bonds purchased to date is the longest,
followed by Belgium (9.8 years) and Spain (9.7 years). With regard to Portu-
gal and Spain, the delta of the average time to maturity of securities available
in the market and eligible to buy under the purchasing programme remained
the highest (+2.7 years and +2.4 years respectively). The situation in Germa-
ny and the Netherlands is a mirror image of this. For these two countries, the
delta between the maturity of govies purchased and paper traded in the mar-
ket is also extremely high. Although Germany is in the midfield with an aver-
age time to maturity of 7.6 years for Bunds, the average for all eligible securi-
ties available for purchasing in the market is significantly higher at 13.9
years. In the Netherlands, the average time to maturity of securities pur-
chased is currently 7.7 years, compared with 12.4 years average time to
maturity across all bonds qualifying for purchase.
Conclusion The distribution of PSPP purchases in July was unsurprising. Diversification
across the various countries continues to be based relatively closely on the
ECB’s capital key. As a result, only minor differences occurred. It should be
noted that (in some cases) purchases in the last four months were signifi-
cantly higher than the target volume envisaged. Under the PSPP alone, the
volume purchased in the month ended amounted to almost EUR 70bn. In our
view, this still reflects the effect of anticipatory purchases. In the coming
weeks, the volume purchased is unlikely to match the levels recently seen
because of the ongoing summer break. Any discrepancy is particularly evi-
dent in countries with high volumes outstanding. However, as mentioned
above, this should only be a temporary phenomenon.
Covered Bond & SSA View 3 August 2016
NORD/LB Fixed Income Research
Page 8 of 24
Covered Bonds/SSA ECB tracker
Analysts:
Kai Ebeling, CIIA
Norman Rudschuck, CIIA
In this section, we publish weekly updates on the covered bonds, ABS, spe-
cific agencies, supranationals and sovereign bonds which the European
Central Bank (ECB) is purchasing. We provide an overview of the develop-
ment of purchases.
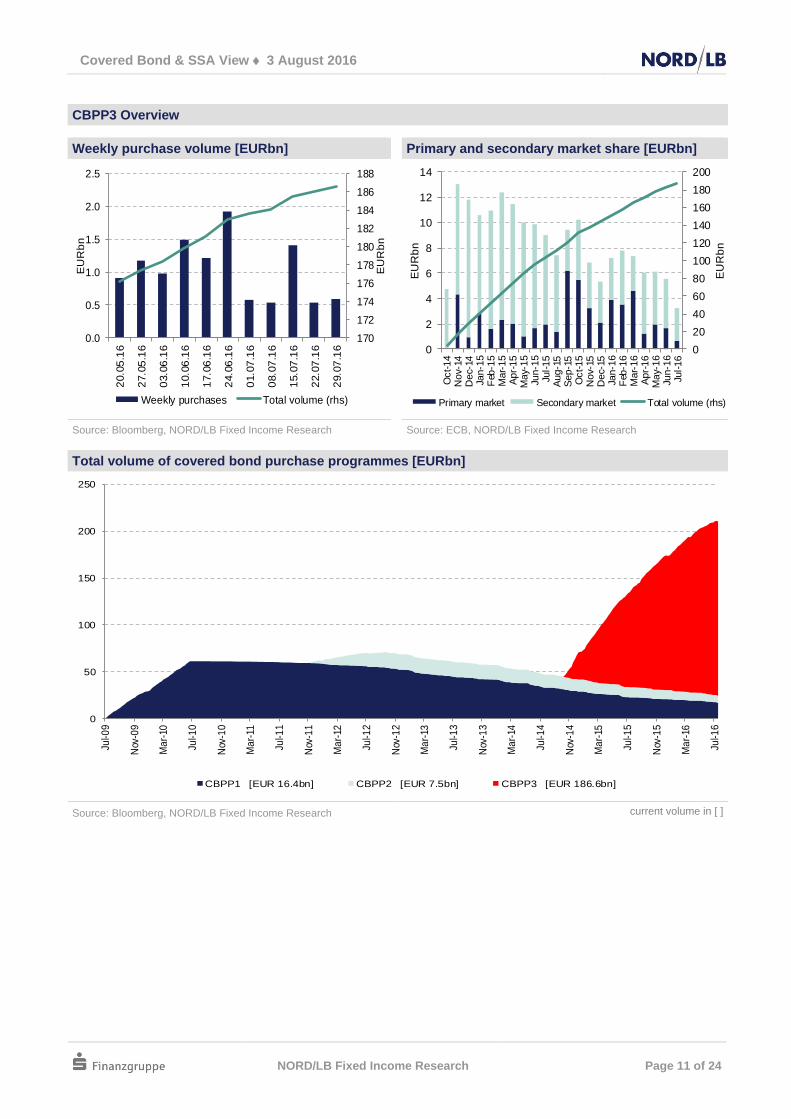
In July, net inflows as part of
the CBPP3 fall to lowest
value since the start of the
programme
As at the reference date of 22 July, the ECB reported a portfolio volume
totalling EUR 186.041bn purchased so far as part of the CBPP3. This repre-
sents an increase of EUR 534m on the previous week’s value, meaning that
net inflows in the past four weeks fell to EUR 3.053bn (previously: EUR
4.438bn). This is the lowest value since January of this year. At the same
time, the average weekly net inflows fell to the lowest value since November
2014, at EUR 2.022bn. Net inflows in this week consisted of purchases
amounting to EUR 0.9bn and maturities of EUR 0.4bn. In total, the recently
published figures reveal just how serious the situation regarding illiquidity
related to the ECB’s purchase programme on the covered bond market is.
As we expect very low primary market activity over the coming weeks until
the end of the summer break, the weekly purchase volume as part of the
CBPP3 is also likely to remain at a low level. In the last reporting period, the
ECB was faced with maturities amounting to EUR 126m, meaning that net
inflows for the past four weeks now total EUR 632m (previously EUR 858m).
Weekly PSPP purchases
total EUR 16.5bn
The figures published on Monday afternoon dropped slightly for the first
time in three weeks: in the period under review, bonds with a total value of
EUR 16.5bn were acquired (reference date: 29 July) following on from the
previous week in which EUR 17.5bn were purchased. We still expect this
value to gradually stabilise above the EUR 15bn mark – this now seems to
be happening. In the previous period under review, several newcomers
were included on the SSA shopping list: once again, a new BNG ISIN in
addition to one new ISIN each from AGFRNC, OSEOFI as well as the ESM
found their way into the Eurosytem’s books. Furthermore, four regional
German bonds were acquired by the Eurosystem: in addition to the familiar
faces of NRW and BERGER, the city state of Bremen made its debut, fea-
turing twice straight away. This week, the BDF will be concentrating on four
ESM bonds. On this occasion, medium to long maturities (2024-2026) and
ultra-long maturities (2042) will all be targeted on Friday. The planned pur-
chase volume was again confirmed at between EUR 150-250m, and there-
fore remains constant.
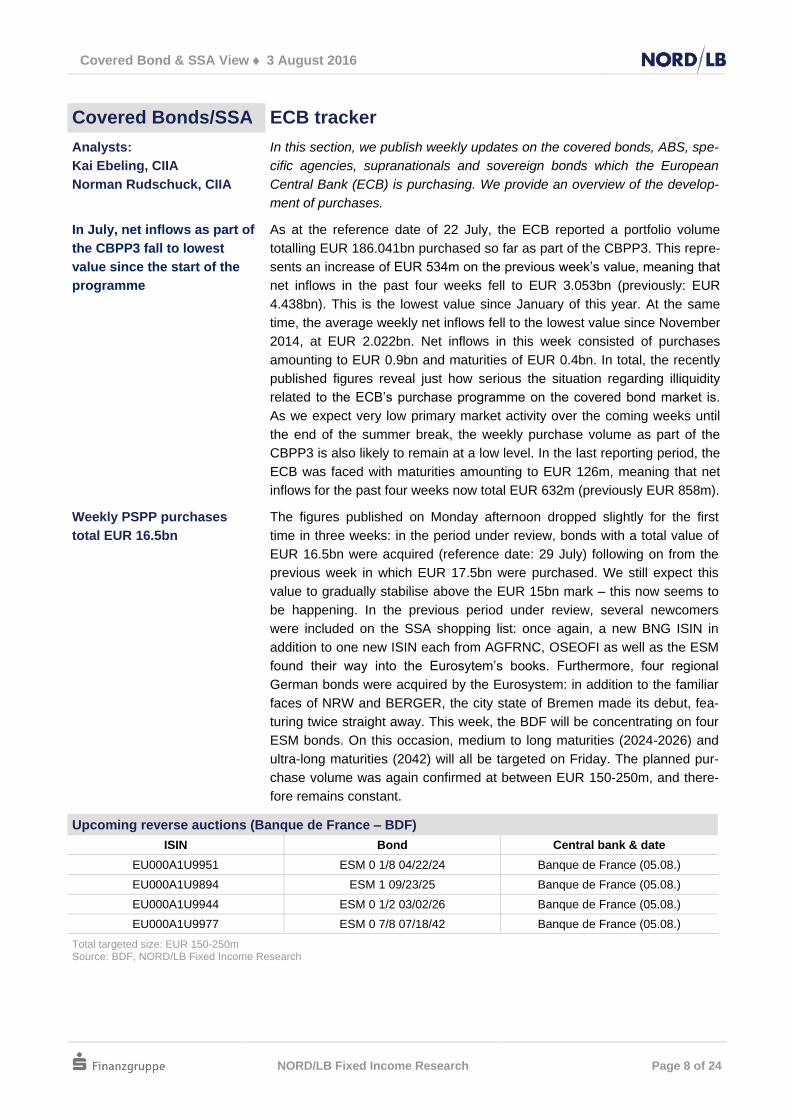
Upcoming reverse auctions (Banque de France – BDF)
ISIN Bond Central bank & date
EU000A1U9951 ESM 0 1/8 04/22/24 Banque de France (05.08.)
EU000A1U9894 ESM 1 09/23/25 Banque de France (05.08.)
EU000A1U9944 ESM 0 1/2 03/02/26 Banque de France (05.08.)
EU000A1U9977 ESM 0 7/8 07/18/42 Banque de France (05.08.)
Total targeted size: EUR 150-250m Source: BDF, NORD/LB Fixed Income Research
Covered Bond & SSA View 3 August 2016
NORD/LB Fixed Income Research
Page 9 of 24
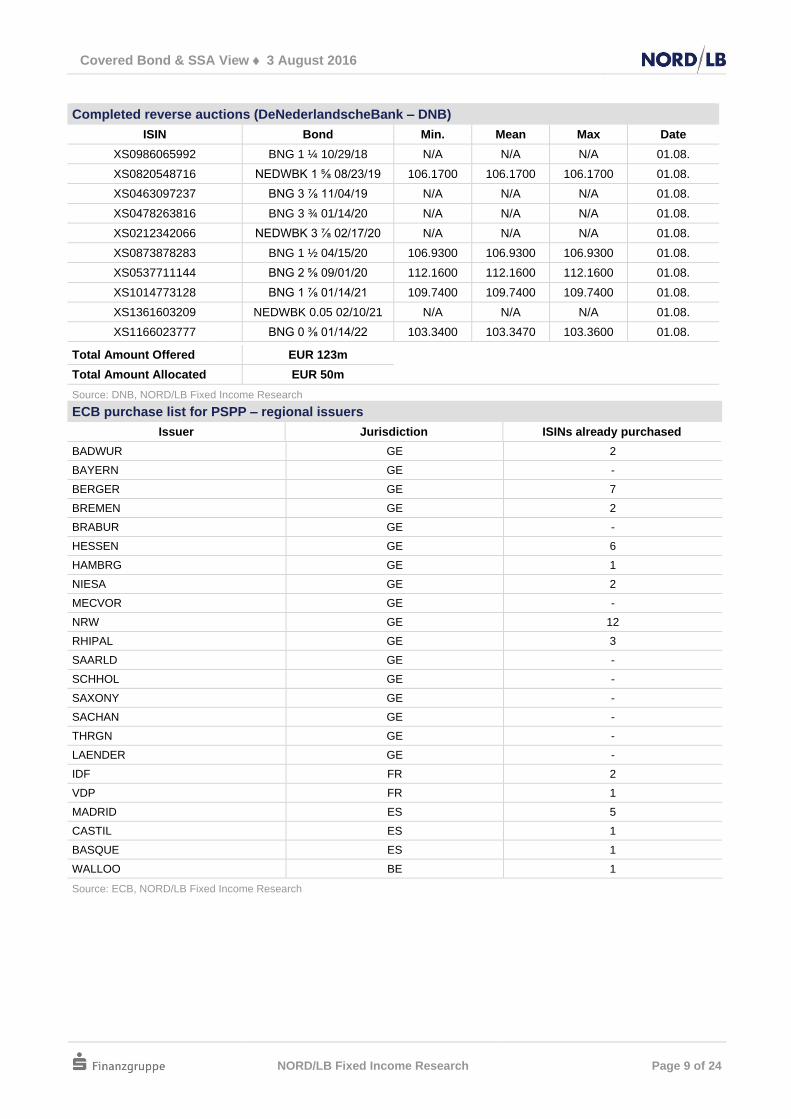
Completed reverse auctions (DeNederlandscheBank – DNB)
ISIN Bond Min. Mean Max Date
XS0986065992 BNG 1 ¼ 10/29/18 N/A N/A N/A 01.08.
XS0820548716 NEDWBK 1 ⅝ 08/23/19 106.1700 106.1700 106.1700 01.08.
XS0463097237 BNG 3 ⅞ 11/04/19 N/A N/A N/A 01.08.
XS0478263816 BNG 3 ¾ 01/14/20 N/A N/A N/A 01.08.
XS0212342066 NEDWBK 3 ⅞ 02/17/20 N/A N/A N/A 01.08.
XS0873878283 BNG 1 ½ 04/15/20 106.9300 106.9300 106.9300 01.08.
XS0537711144 BNG 2 ⅝ 09/01/20 112.1600 112.1600 112.1600 01.08.
XS1014773128 BNG 1 ⅞ 01/14/21 109.7400 109.7400 109.7400 01.08.
XS1361603209 NEDWBK 0.05 02/10/21 N/A N/A N/A 01.08.
XS1166023777 BNG 0 ⅜ 01/14/22 103.3400 103.3470 103.3600 01.08.
Total Amount Offered EUR 123m
Total Amount Allocated EUR 50m
Source: DNB, NORD/LB Fixed Income Research
ECB purchase list for PSPP – regional issuers
Issuer Jurisdiction ISINs already purchased
BADWUR GE 2
BAYERN GE -
BERGER GE 7
BREMEN GE 2
BRABUR GE -
HESSEN GE 6
HAMBRG GE 1
NIESA GE 2
MECVOR GE -
NRW GE 12
RHIPAL GE 3
SAARLD GE -
SCHHOL GE -
SAXONY GE -
SACHAN GE -
THRGN GE -
LAENDER GE -
IDF FR 2
VDP FR 1
MADRID ES 5
CASTIL ES 1
BASQUE ES 1
WALLOO BE 1
Source: ECB, NORD/LB Fixed Income Research
Covered Bond & SSA View 3 August 2016
NORD/LB Fixed Income Research
Page 10 of 24
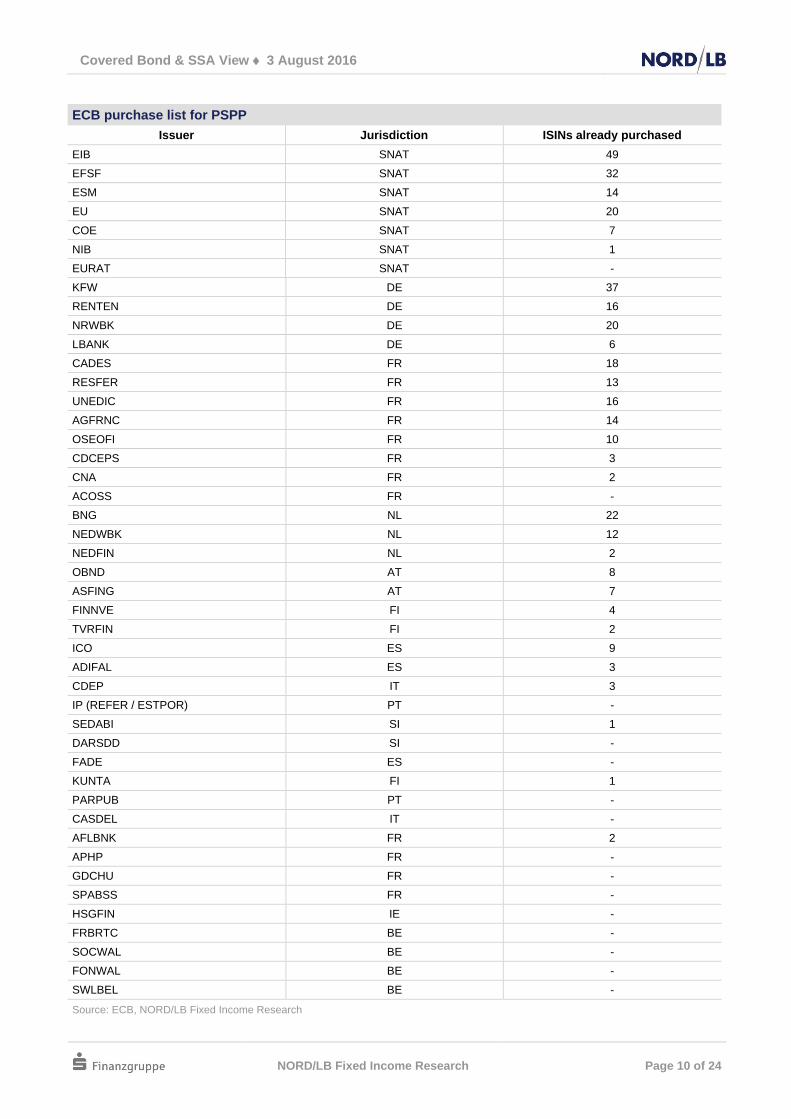
ECB purchase list for PSPP
Issuer Jurisdiction ISINs already purchased
EIB SNAT 49
EFSF SNAT 32
ESM SNAT 14
EU SNAT 20
COE SNAT 7
NIB SNAT 1
EURAT SNAT -
KFW DE 37
RENTEN DE 16
NRWBK DE 20
LBANK DE 6
CADES FR 18
RESFER FR 13
UNEDIC FR 16
AGFRNC FR 14
OSEOFI FR 10
CDCEPS FR 3
CNA FR 2
ACOSS FR -
BNG NL 22
NEDWBK NL 12
NEDFIN NL 2
OBND AT 8
ASFING AT 7
FINNVE FI 4
TVRFIN FI 2
ICO ES 9
ADIFAL ES 3
CDEP IT 3
IP (REFER / ESTPOR) PT -
SEDABI SI 1
DARSDD SI -
FADE ES -
KUNTA FI 1
PARPUB PT -
CASDEL IT -
AFLBNK FR 2
APHP FR -
GDCHU FR -
SPABSS FR -
HSGFIN IE -
FRBRTC BE -
SOCWAL BE -
FONWAL BE -
SWLBEL BE -
Source: ECB, NORD/LB Fixed Income Research
Covered Bond & SSA View 3 August 2016
NORD/LB Fixed Income Research
Page 11 of 24
CBPP3 Overview
Weekly purchase volume [EURbn] Primary and secondary market share [EURbn]
170
172
174
176
178
180
182
184
186
188
0.0
0.5
1.0
1.5
2.0
2.5
20.0
5.1
6
27.0
5.1
6
03.0
6.1
6
10.0
6.1
6
17.0
6.1
6
24.0
6.1
6
01.0
7.1
6
08.0
7.1
6
15.0
7.1
6
22.0
7.1
6
29.0
7.1
6
EU
Rb
n
EU
Rb
n
Weekly purchases Total volume (rhs)
0
20
40
60
80
100
120
140
160
180
200
0
2
4
6
8
10
12
14
Oct-14
Nov-
14D
ec-
14Ja
n-1
5F
eb-1
5M
ar-
15
Apr-
15
May-
15
Jun-1
5Ju
l-15
Aug-1
5S
ep-1
5O
ct-15
Nov-
15D
ec-
15Ja
n-1
6F
eb-1
6M
ar-
16
Apr-
16
May-
16
Jun-1
6Ju
l-16
EU
Rb
n
EU
Rb
nPrimary market Secondary market Total volume (rhs)
Source: Bloomberg, NORD/LB Fixed Income Research Source: ECB, NORD/LB Fixed Income Research
Total volume of covered bond purchase programmes [EURbn]
0
50
100
150
200
250
Jul-0
9
Nov
-09
Ma
r-10
Jul-1
0
Nov
-10
Ma
r-11
Jul-1
1
Nov
-11
Ma
r-12
Jul-1
2
Nov
-12
Ma
r-13
Jul-1
3
Nov
-13
Ma
r-14
Jul-1
4
Nov
-14
Ma
r-15
Jul-1
5
Nov
-15
Ma
r-16
Jul-1
6
CBPP1 [EUR 16.4bn] CBPP2 [EUR 7.5bn] CBPP3 [EUR 186.6bn]
Source: Bloomberg, NORD/LB Fixed Income Research current volume in [ ]
Covered Bond & SSA View 3 August 2016
NORD/LB Fixed Income Research
Page 12 of 24
PSPP overview
Weekly purchase volume [EUR bn] Distribution by country at month-end [EUR bn]
600
650
700
750
800
850
900
950
1000
5
7
9
11
13
15
17
19
21
20.0
5.1
6
27.0
5.1
6
03.0
6.1
6
10.0
6.1
6
17.0
6.1
6
24.0
6.1
6
01.0
7.1
6
08.0
7.1
6
15.0
7.1
6
22.0
7.1
6
29.0
7.1
6
Weekly purchases Total volume (rhs)
0
20
40
60
80
100
120
140
160
180
200
EU
Rb
n
Source: Bloomberg, NORD/LB Fixed Income Research Source: ECB, NORD/LB Fixed Income Research
Overall distribution of PSPP buying at month-end (EURbn)
Country Adjusted
distribution key1
Purchases (EUR m)
Expected purchases (EUR m)
2
Difference (EUR m)
Average time to maturity in
years
Market average in years
3
Difference in years
DE 26.3% 225,516 224,963 553 7.60 13.90 -6.3
FR 20.7% 179,160 178,366 794 7.71 11.27 -3.6
IT 18.0% 155,876 154,209 1,667 9.24 7.27 2.0
SNAT 0.0% 109,158 109,571 -413 7.05 11.23 -4.2
ES 12.9% 111,788 110,594 1,194 9.71 7.34 2.4
NE 5.9% 50,199 50,054 145 7.71 12.40 -4.7
BE 3.6% 31,038 30,952 86 9.79 14.52 -4.7
AT 2.9% 24,628 24,564 64 9.11 12.53 -3.4
PT 2.6% 20,096 20,953 -857 10.07 7.33 2.7
FI 1.8% 15,819 15,735 84 7.55 10.52 -3.0
IE 1.7% 14,237 14,332 -95 9.31 11.35 -2.0
SK 1.1% 7,290 8,277 -987 7.92 9.35 -1.4
SI 0.5% 3,952 4,120 -168 8.23 8.40 -0.2
LU 0.3% 1,621 1,968 -347 6.65 13.98 -7.3
LV 0.4% 1,050 1,459 -409 6.56 7.02 -0.5
LT 0.6% 1,844 2,438 -594 6.50 6.63 -0.1
MT 0.1% 598 670 -72 10.89 9.79 1.1
CY 0.2% 269 1,506 -1,237 5.19 6.09 -0.9
EE 0.3% 66 426 -360 1.96 0.00 2.0
GR 0.0% 0 0
0.00 13.2 -
Total / average
100.0% 954,205 - - 8.26 9.44 -1.2
1 Based on the ECB capital key, adjusted to include supras and the disqualification of Greece
.
2 Based on the adjusted distribution key.
3 Weighted average time to maturity of the bonds eligible for purchasing under the PSPP.
Source: ECB, NORD/LB Fixed Income Research
Covered Bond & SSA View 3 August 2016
NORD/LB Fixed Income Research
Page 13 of 24
Covered Bonds Charts & Graphs
Outstanding volume (Bmk.) Top 10 countries (Bmk.)
20.5%
19.9%
11.2%8.5%
5.3%
4.7%
4.2%
4.1%
3.1%
2.8%
15.6%
EUR 1084.2bn
FR
ES
DE
IT
GB
NL
NO
CA
SE
AT
Others
Country Vol. (€bn) No. of CBs ØVol. (€bn) Vol. weight.
ØMod. Duration
FR 222.1 168 1.3 4.3
ES 215.7 165 1.3 3.2
DE 121.8 184 0.7 4.0
IT 92.2 92 1.0 3.0
GB 57.2 47 1.2 3.6
NL 51.2 40 1.3 4.6
NO 45.7 44 1.0 3.1
CA 44.6 36 1.2 3.7
SE 33.9 33 1.0 3.8
AT 30.5 47 0.6 3.1
Issue volume by year (Bmk.) Maturities next 12 months (Bmk.)
0
50
100
150
200
250
300
350
2011 2012 2013 2014 2015 2016
EU
Rb
n
ATAUBECACHCYCZDEDKESFIFRGBGRHUIEITLUNLNONZPTSESGTR
0
5
10
15
20
25
30
35
40
07/1
6
08/1
6
09/1
6
10/1
6
11/1
6
12/1
6
01/1
7
02/1
7
03/1
7
04/1
7
05/1
7
06/1
7
EU
Rb
n
AUBECACHCYCZDEDKESFIFRGBGRHUIEITLUNLNONZPTSESGTR
Avg. mod. duration by country (vol. weighted) Rating distribution (vol. weighted)
0
1
2
3
4
5
6
AT
AU
BE
CA
CH
CZ
DE
DK
ES FI
FR
GB IE IT LU
NL
NO
NZ
PT
SE
SG
TR
62.9%
4.3%16.1%
0.9%
4.9%
4.4%0.4% 3.3%
2.2%
0.6%0.0%
6.1%
AAA/Aaa
AA+/Aa1
AA/Aa2
AA-/Aa3
A+/A1
A/A2
A-/A3
BBB+/Baa1
BBB/Baa2
BBB-/Baa3
BB+/Ba1
BB/Ba2
BB-/Ba3
Source: Bloomberg, NORD/LB Fixed Income Research
Covered Bond & SSA View 3 August 2016
NORD/LB Fixed Income Research
Page 14 of 24
Covered Bonds Charts & Graphs
Spread development (last 15 issues)
CB
AA
U 0
1/2
07/2
7/2
6
CM
0 0
7/2
5/2
2
CM
ZB
0.0
5 0
7/1
1/2
4
BR
F 0
1/4
07/0
1/2
3
CA
FFIL
0 3
/8 0
6/2
3/2
5
SH
BA
SS
0.0
5 0
6/2
0/2
2
BZ
LN
Z 0
1/8
06/1
7/2
1
WS
TP 0 1
/8 0
6/1
6/2
1
ND
B 0
3/8
06/1
5/2
3
SA
BS
M 0
5/8
06/1
0/2
4
CM
ZB
0 1
/2 0
6/0
9/2
6
PM
IIM
0 5
/8 0
6/0
8/2
3
DB
0 1
/2 0
6/0
9/2
6
SR
BA
NK
0 1
/8 0
9/0
8/2
1
DEX
GR
P
0.0
5 0
9/0
8/2
1
-20
-10
0
10
20
30
40
50
bp
Reoffer Spread Current ASW
Bid-to-Cover (last 15 issues)
0.0
0.5
1.0
1.5
2.0
2.5
3.0
3.5
0.0
0.5
1.0
1.5
2.0
2.5
3.0
CB
AA
U 0
1/2
07/2
7/2
6
CM
0 0
7/2
5/2
2
CM
ZB
0.0
5 0
7/1
1/2
4
BR
F 0
1/4
07/0
1/2
3
CA
FF
IL 0
3/8
06/2
3/2
5
SH
BA
SS
0.0
5 0
6/2
0/2
2
BZ
LN
Z 0
1/8
06/1
7/2
1
WS
TP
0 1
/8 0
6/1
6/2
1
ND
B 0
3/8
06/1
5/2
3
SA
BS
M 0
5/8
06/1
0/2
4
CM
ZB
0 1
/2 0
6/0
9/2
6
PM
IIM
0 5
/8 0
6/0
8/2
3
DB
0 1
/2 0
6/0
9/2
6
SR
BA
NK
0 1
/8 0
9/0
8/2
1
DE
XG
RP
0.0
5 0
9/0
8/2
1
EU
Rb
n
Amt. Issued Order Book Bid-to-Cover (rhs)
Spread development by country Performance (total return)
-40 -20 0 20 40 60 80
TRSGSEPTNZNONLITIE
GBFRFI
ES - SingleES - Multi
DKDECHCABEAU
bpΔ 3 Months Δ Week Δ Month
0% 5% 10% 15% 20%
Overall
1-3Y
3-5Y
5-7Y
7-10Y
2016 ytd
2015
2014
2013
2012
2011
Source: Bloomberg, NORD/LB Fixed Income Research
Covered Bond & SSA View 3 August 2016
NORD/LB Fixed Income Research
Page 15 of 24
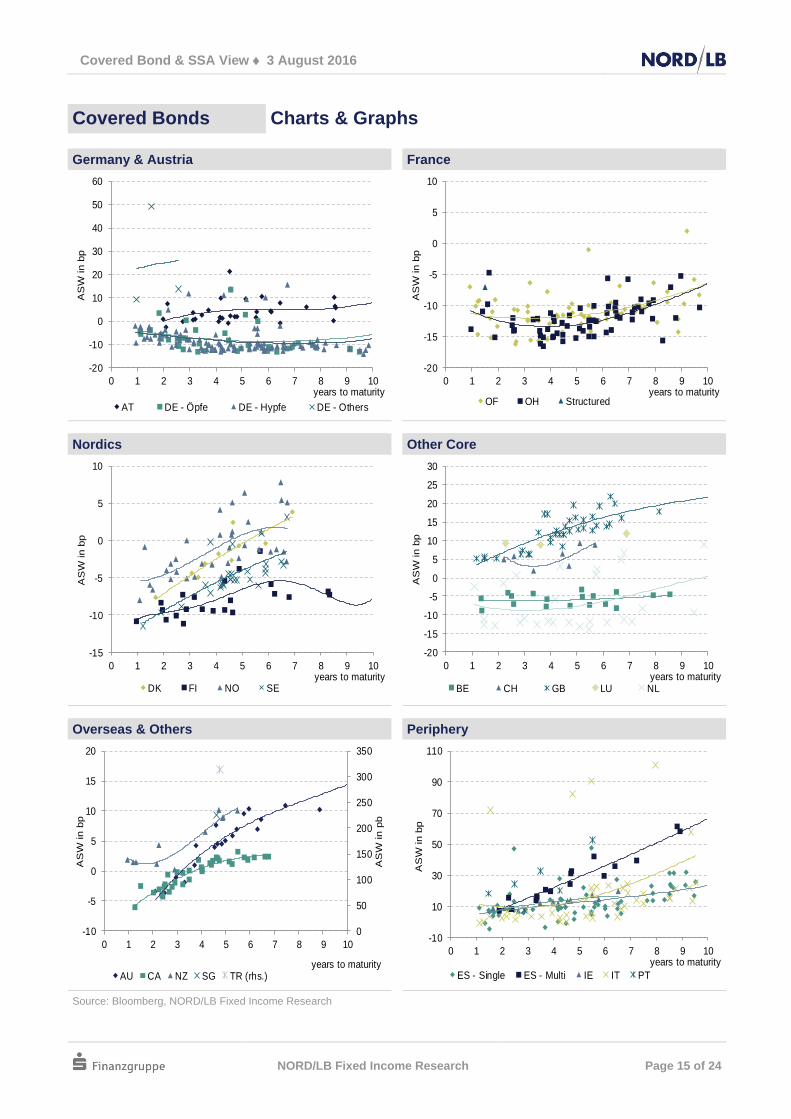
Covered Bonds Charts & Graphs
Germany & Austria France
-20
-10
0
10
20
30
40
50
60
0 1 2 3 4 5 6 7 8 9 10
AS
W in b
p
years to maturity
AT DE - Öpfe DE - Hypfe DE - Others
-20
-15
-10
-5
0
5
10
0 1 2 3 4 5 6 7 8 9 10
AS
W in b
p
years to maturityOF OH Structured
Nordics Other Core
-15
-10
-5
0
5
10
0 1 2 3 4 5 6 7 8 9 10
AS
W in b
p
years to maturityDK FI NO SE
-20
-15
-10
-5
0
5
10
15
20
25
30
0 1 2 3 4 5 6 7 8 9 10
AS
W in b
p
years to maturityBE CH GB LU NL
Overseas & Others Periphery
0
50
100
150
200
250
300
350
-10
-5
0
5
10
15
20
0 1 2 3 4 5 6 7 8 9 10
AS
W in p
b
AS
W in b
p
years to maturityAU CA NZ SG TR (rhs.)
-10
10
30
50
70
90
110
0 1 2 3 4 5 6 7 8 9 10
AS
W in b
p
years to maturity
ES - Single ES - Multi IE IT PT
Source: Bloomberg, NORD/LB Fixed Income Research
Covered Bond & SSA View 3 August 2016
NORD/LB Fixed Income Research
Page 16 of 24
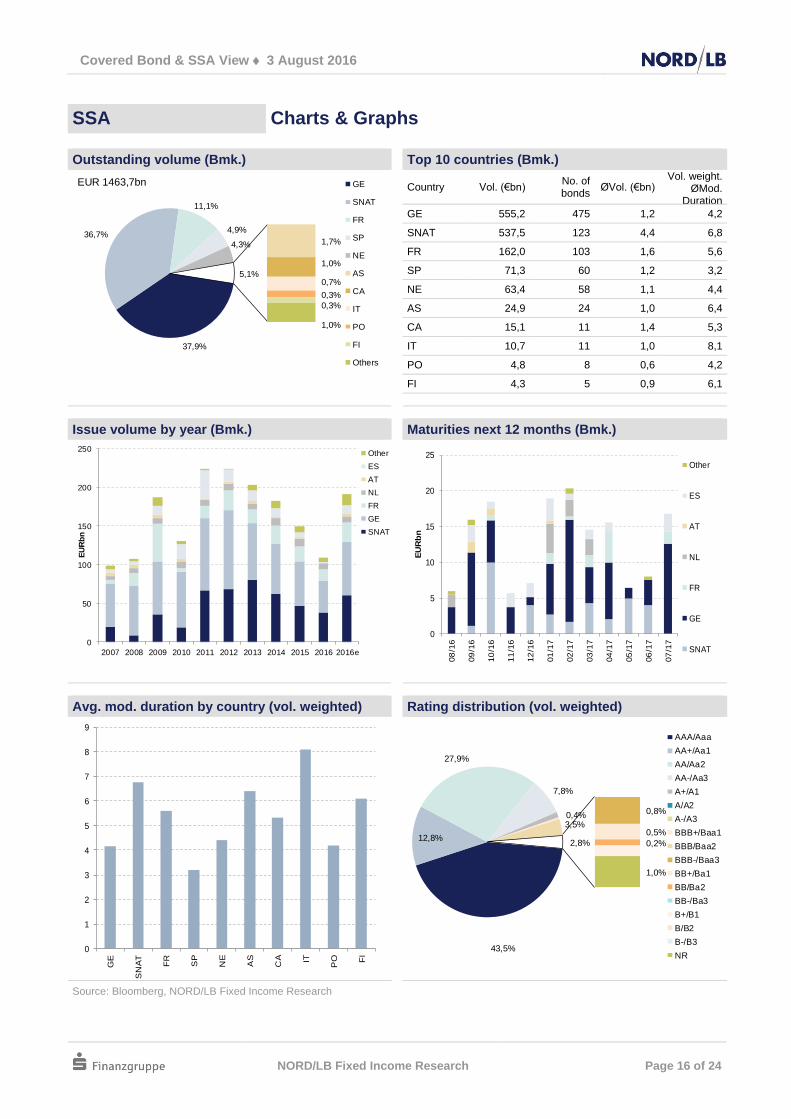
SSA Charts & Graphs
Outstanding volume (Bmk.) Top 10 countries (Bmk.)
37,9%
36,7%
11,1%
4,9%
4,3% 1,7%
1,0%
0,7%
0,3%
0,3%
1,0%
5,1%
EUR 1463,7bn GE
SNAT
FR
SP
NE
AS
CA
IT
PO
FI
Others
Country Vol. (€bn) No. of bonds
ØVol. (€bn) Vol. weight.
ØMod. Duration
GE 555,2 475 1,2 4,2
SNAT 537,5 123 4,4 6,8
FR 162,0 103 1,6 5,6
SP 71,3 60 1,2 3,2
NE 63,4 58 1,1 4,4
AS 24,9 24 1,0 6,4
CA 15,1 11 1,4 5,3
IT 10,7 11 1,0 8,1
PO 4,8 8 0,6 4,2
FI 4,3 5 0,9 6,1
Issue volume by year (Bmk.) Maturities next 12 months (Bmk.)
0
50
100
150
200
250
2007 2008 2009 2010 2011 2012 2013 2014 2015 2016 2016e
EU
Rb
n
Other
ES
AT
NL
FR
GE
SNAT
0
5
10
15
20
2508
/16
09
/16
10
/16
11
/16
12
/16
01
/17
02
/17
03
/17
04
/17
05
/17
06
/17
07
/17
EU
Rb
n
Other
ES
AT
NL
FR
GE
SNAT
Avg. mod. duration by country (vol. weighted) Rating distribution (vol. weighted)
0
1
2
3
4
5
6
7
8
9
GE
SN
AT
FR
SP
NE
AS
CA IT
PO FI
43,5%
12,8%
27,9%
7,8%
0,4%3,5%
0,8%
0,5%
0,2%
1,0%
2,8%
AAA/Aaa
AA+/Aa1
AA/Aa2
AA-/Aa3
A+/A1
A/A2
A-/A3
BBB+/Baa1
BBB/Baa2
BBB-/Baa3
BB+/Ba1
BB/Ba2
BB-/Ba3
B+/B1
B/B2
B-/B3
NR
Source: Bloomberg, NORD/LB Fixed Income Research
Covered Bond & SSA View 3 August 2016
NORD/LB Fixed Income Research
Page 17 of 24
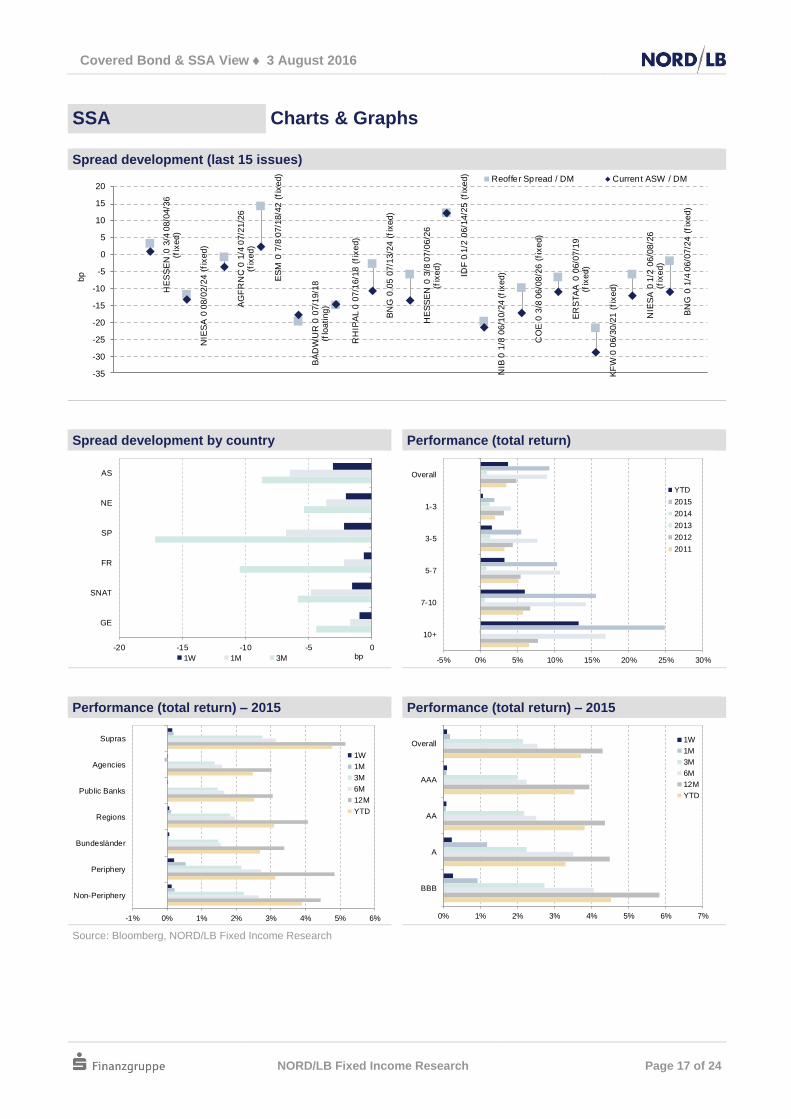
SSA Charts & Graphs
Spread development (last 15 issues) H
ES
SE
N 0
3/4
08/0
4/3
6
(fix
ed
)
NIE
SA
0 0
8/0
2/2
4 (
fix
ed
)
AG
FR
NC
0 1
/4 0
7/2
1/2
6
(fix
ed
)
ES
M 0
7/8
07/1
8/4
2 (
fixe
d)
BA
DW
UR
0 0
7/1
9/1
8
(flo
atin
g)
RH
IPA
L 0
07
/16
/18
(fi
xe
d)
BN
G 0
.05 0
7/1
3/2
4 (
fixe
d)
HE
SS
EN
0 3
/8 0
7/0
6/2
6
(fix
ed
)
IDF
0 1
/2 0
6/1
4/2
5 (
fix
ed
)
NIB
0 1
/8 0
6/1
0/2
4 (fi
xe
d)
CO
E 0
3/8
06
/08
/26
(fi
xe
d)
ER
STA
A 0
06/0
7/1
9
(fix
ed
)
KF
W 0
06/3
0/2
1 (
fixe
d)
NIE
SA
0 1
/2 0
6/0
8/2
6
(fix
ed
)
BN
G 0
1/4
06
/07
/24
(fi
xe
d)
-35
-30
-25
-20
-15
-10
-5
0
5
10
15
20
bp
Reoffer Spread / DM Current ASW / DM
Spread development by country Performance (total return)
-20 -15 -10 -5 0
GE
SNAT
FR
SP
NE
AS
bp1W 1M 3M
-5% 0% 5% 10% 15% 20% 25% 30%
Overall
1-3
3-5
5-7
7-10
10+
YTD
2015
2014
2013
2012
2011
Performance (total return) – 2015 Performance (total return) – 2015
-1% 0% 1% 2% 3% 4% 5% 6%
Supras
Agencies
Public Banks
Regions
Bundesländer
Periphery
Non-Periphery
1W
1M
3M
6M
12M
YTD
0% 1% 2% 3% 4% 5% 6% 7%
Overall
AAA
AA
A
BBB
1W
1M
3M
6M
12M
YTD
Source: Bloomberg, NORD/LB Fixed Income Research
Covered Bond & SSA View 3 August 2016
NORD/LB Fixed Income Research
Page 18 of 24
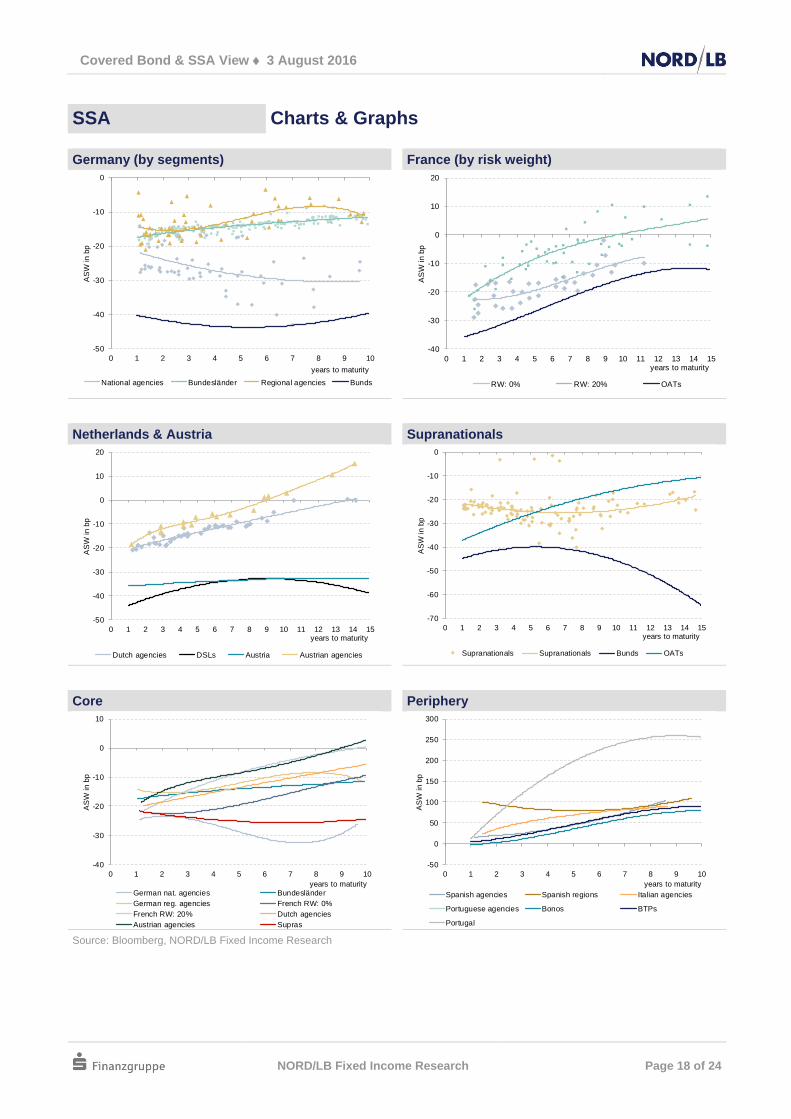
SSA Charts & Graphs
Germany (by segments) France (by risk weight)
-50
-40
-30
-20
-10
0
0 1 2 3 4 5 6 7 8 9 10
AS
W in
bp
years to maturity
National agencies Bundesländer Regional agencies Bunds
-40
-30
-20
-10
0
10
20
0 1 2 3 4 5 6 7 8 9 10 11 12 13 14 15
AS
W in
bp
years to maturity
RW: 0% RW: 20% OATs
Netherlands & Austria Supranationals
-50
-40
-30
-20
-10
0
10
20
0 1 2 3 4 5 6 7 8 9 10 11 12 13 14 15
AS
W in
bp
years to maturity
Dutch agencies DSLs Austria Austrian agencies
-70
-60
-50
-40
-30
-20
-10
0
0 1 2 3 4 5 6 7 8 9 10 11 12 13 14 15
AS
W in
bp
years to maturity
Supranationals Supranationals Bunds OATs
Core Periphery
-40
-30
-20
-10
0
10
0 1 2 3 4 5 6 7 8 9 10
AS
W in
bp
years to maturityGerman nat. agencies Bundesländer
German reg. agencies French RW: 0%
French RW: 20% Dutch agencies
Austrian agencies Supras
-50
0
50
100
150
200
250
300
0 1 2 3 4 5 6 7 8 9 10
AS
W in
bp
years to maturity
Spanish agencies Spanish regions Italian agencies
Portuguese agencies Bonos BTPs
Portugal
Source: Bloomberg, NORD/LB Fixed Income Research
Covered Bond & SSA View 3 August 2016
NORD/LB Fixed Income Research
Page 19 of 24
Appendix Publication overview
Publication Topics
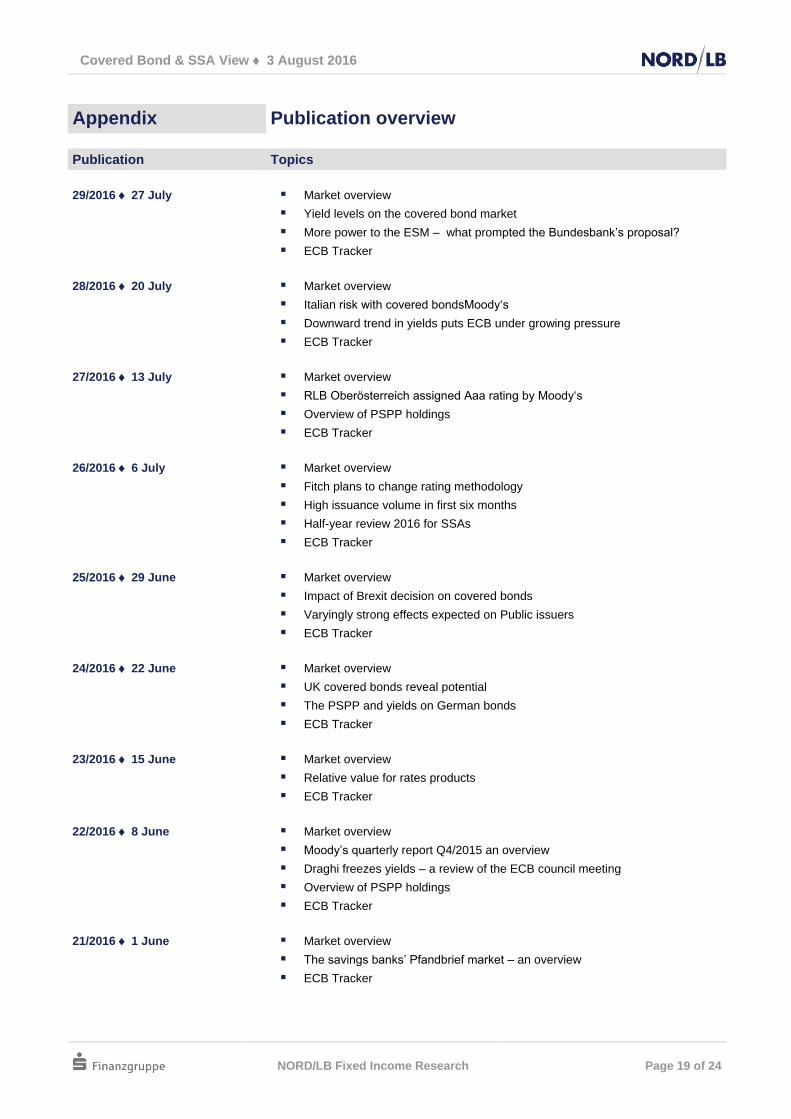
29/2016 27 July Market overview
Yield levels on the covered bond market
More power to the ESM – what prompted the Bundesbank’s proposal?
ECB Tracker
28/2016 20 July Market overview
Italian risk with covered bondsMoody‘s
Downward trend in yields puts ECB under growing pressure
ECB Tracker
27/2016 13 July Market overview
RLB Oberösterreich assigned Aaa rating by Moody‘s
Overview of PSPP holdings
ECB Tracker
26/2016 6 July Market overview
Fitch plans to change rating methodology
High issuance volume in first six months
Half-year review 2016 for SSAs
ECB Tracker
25/2016 29 June Market overview
Impact of Brexit decision on covered bonds
Varyingly strong effects expected on Public issuers
ECB Tracker
24/2016 22 June Market overview
UK covered bonds reveal potential
The PSPP and yields on German bonds
ECB Tracker
23/2016 15 June Market overview
Relative value for rates products
ECB Tracker
22/2016 8 June Market overview
Moody’s quarterly report Q4/2015 an overview
Draghi freezes yields – a review of the ECB council meeting
Overview of PSPP holdings
ECB Tracker
21/2016 1 June Market overview
The savings banks’ Pfandbrief market – an overview
ECB Tracker
Covered Bond & SSA View 3 August 2016
NORD/LB Fixed Income Research
Page 20 of 24
Appendix Contacts
Fixed Income Research
Michael Schulz Head +49 511 361-5309 [email protected]
Kai Niklas Ebeling Covered Bonds +49 511 361-9713 [email protected]
Mario Gruppe Public Issuers +49 511 361-9787 [email protected]
Michaela Hessmert Banks +49 511 361-6915 [email protected]
Christopher Kief Corporates / Retail Products +49 511 361-4710 [email protected]
Melanie Kiene Banks +49 511 361-4108 [email protected]
Jörg Kuypers Corporates / Retail Products +49 511 361-9552 [email protected]
Matthias Melms Covered Bonds +49 511 361-5427 [email protected]
Sascha Remus Corporates / Retail Products +49 511 361-2722 [email protected]
Norman Rudschuck Public Issuers +49 511 361-6627 [email protected]
Martin Strohmeier Corporates / Retail Products +49 511 361-4712 [email protected]
Kai Witt Corporates / Retail Products +49 511 361-4639 [email protected]
Markets Sales
Carsten Demmler Head +49 511 361-5587 [email protected]
Institutional Sales (+49 511 9818-9440)
Daniel Gutschka (Head) [email protected] Gabriele Schneider [email protected]
Thorsten Bock [email protected] Dirk Scholden [email protected]
Uwe Kollster [email protected] Uwe Tacke [email protected]
Daniel Novotny-Farkas [email protected]
Sales Saving Banks / Regional Banks (+49 511 9818-9400)
Christian Schneider (Head) [email protected] Martin Koch [email protected]
Oliver Bickel [email protected] Bernd Lehmann [email protected]
Tobias Bohr [email protected] Jörn Meißner [email protected]
Kai-Ulrich Dörries [email protected] Lutz Schimanski [email protected]
Jan Dröge [email protected] Ralf Schirrling [email protected]
Sascha Goetz [email protected] Brian Zander [email protected]
Stefan Krilcic [email protected]
Fixed Income / Structured Products Sales Europe (+352 452211-515)
René Rindert (Head) [email protected] Patricia Lamas [email protected]
Morgan Kermel [email protected] Laurence Payet [email protected]
Corporate Sales
Shipping / Aircraft +49 511 9818-8150 Corporate Clients +49 511 9818-4003
Real Estate / Structured Finance
+49 511 9818-8150 FX/MM
+49 511 9818-4006
Syndicate / DCM (+49 511 9818-6600)
Thomas Cohrs (Head) [email protected] Wlada Pesotska [email protected]
Axel Hinzmann [email protected] Andreas Raimchen [email protected]
Thomas Höfermann [email protected] Udo A. Schacht [email protected]
Alexander Malitsky [email protected] Marco da Silva [email protected]
Julien Marchand [email protected]
Financial Markets Trading
Corporates +49 511 9818-9690 Collat. Mgmt / Repos +49 511 9818-9200
Covereds / SSAs +49 511 9818-8040 Cust. Exec. & Trading +49 511 9818-9480
Financials +49 511 9818-9490 Frequent Issuers +49 511 9818-9640
Governments +49 511 9818-9660 Structured Products +49 511 9818-9670
Länder & Regions +49 511 9818-9550
Covered Bond & SSA View 3 August 2016
NORD/LB Fixed Income Research
Page 21 of 24
Disclaimer
This financial analysis (hereinafter the „Analysis”) was drawn up by NORDDEUTSCHE LANDESBANK GIROZENTRALE („NORD/LB“).
The supervisory authorities in charge of NORD/LB are the European Central Bank („ECB“), Sonnemannstraße 20, D-60314 Frankfurt
am Main, and the Federal Financial Supervisory Authority (Bundesanstalt für Finanzdienstleitungsaufsicht - „BaFin“), Graurheindorfer
Str. 108, D-53117 Bonn, and Marie-Curie-Str. 24-28, D-60439 Frankfurt am Main. Details about the extent of NORD/LB´s regulation by
the respective authorities are available on request. Generally, this Analysis or the products or services described therein have not been
reviewed or approved by the competent supervisory authority.
This Analysis is addressed exclusively to recipients professional and institutional clients in Germany, the United Kingdom, Austria, Bel-
gium, Italy, Spain, Denmark, Finland, Estonia, France, Greece, Ireland, Luxembourg, the Netherlands, Poland, Portugal, Sweden, the
Czech Republic, Canada, Switzerland and Cyprus (hereinafter the „Relevant Persons” or „Recipients”). The contents of this Analysis are
disclosed to the Recipients on a strictly confidential basis and, by accepting this Analysis, the Recipients agree that they will not forward
to third parties, copy and/or reproduce this Analysis without NORD/LB’s prior written consent. The figures discussed in this Analysis are
only addressed to the Relevant Persons and any persons other than the Relevant Persons must not rely on this Analysis. In particular,
neither this Analysis nor any copy thereof must be forwarded or transmitted to the United States of America or its territories or posses-
sions or distributed to any employees or affiliates of Recipients resident in these jurisdictions.
This Analysis was drawn up in compliance with the applicable provisions of the German Securities Trading Act (Wertpapierhan-
delsgesetz) and the Regulation Governing the Analysis of Financial Instruments (Verordnung über die Analyse von Finanzinstrumenten).
In organizational, hierarchical, functional and local terms, the Research Division of NORD/LB is independent of any divisions responsible
for the issuance of securities and investment banking activities, for trading (including proprietary trading) in and sales of securities as
well as for lending activities.
This Analysis and the information contained herein have been compiled and are provided exclusively for information purposes. This
Analysis is not intended as an investment incentive. It is provided for the Recipient’s personal information, subject to the express under-
standing, which is acknowledged by the Recipient, that it does not constitute any direct or indirect offer, individual recommendation,
solicitation to purchase, hold or sell or to subscribe for or acquire any securities or other financial instruments nor any measure by which
financial instruments might be offered or sold.
All actual details, information and statements contained herein were derived from sources considered reliable by NORD/LB. However,
since these sources are not verified independently, NORD/LB cannot give any assurance as to or assume responsibility for the accuracy
and completeness of the information contained herein. The opinions and prognoses given herein on the basis of these sources consti-
tute a non-binding evaluation by the analysts of NORD/LB. Any changes in the underlying premises may have a material impact on the
developments described herein. Neither NORD/LB nor its governing bodies or employees can give any assurance as to or assume any
responsibility or liability for the accuracy, adequacy and completeness of this Analysis or any loss of return, any indirect, consequential
or other damage which may be suffered by persons relying on the information or any statements or opinions set forth in this Analysis
(irrespective of whether such losses are incurred due to any negligence on the part of these persons or otherwise).
Past performances are not a reliable indicator of future performances. Exchange rates, price fluctuations of the financial instruments and
similar factors may have a negative impact on the value and price of and return on the financial instruments referred to herein or any
instruments linked thereto. An evaluation made on the basis of the historical performance of any security does not necessarily give an
indication of its future performance.
This Analysis neither constitutes any investment, legal, accounting or tax advice nor any representation that an investment or strategy is
suitable or appropriate in the light a Recipient’s individual circumstances, and nothing in this Analysis constitutes a personal recommen-
dation to the Recipient thereof. The securities or other financial instruments referred to herein may not be suitable for the Recipient’s
personal investment strategies and objectives, financial situation or individual needs.
Also this Analysis as a whole or any part thereof is not a sales or other prospectus. Correspondingly, the information contained herein
merely constitutes an overview and does not form the basis for an investor‘s potential decision to buy or sell. A full description of the
details relating to the financial instruments or transactions which may relate to the subject matter of this Analysis is set forth in the rele-
vant (financing) documentation. To the extent that the financial instruments described herein are NORD/LB’s own issues and subject to
the requirement to publish a prospectus, the conditions of issue applicable to any individual financial instrument and the relevant pro-
spectus published with respect thereto as well NORD/LB’s relevant registration form, all of which are available for downloading at
www.nordlb.de and may be obtained, free of charge, from NORD/LB, Georgsplatz 1, 30159 Hanover, shall be solely binding. Any poten-
tial investment decision should at any rate be made exclusively on the basis of such (financing) documentation. This Analysis cannot
replace personal advice. Before making an investment decision, each Recipient should consult an independent investment adviser for
individual investment advice with respect to the appropriateness of an investment in financial instruments or investment strategies as
contemplated herein as well as for other and more recent information on certain investment opportunities.
Each of the financial instruments referred to herein may involve substantial risks, including capital, interest, index, currency and credit
risks, political, fair value, commodity and market risks. The financial instruments could experience a sudden substantial deterioration in
value, including a total loss of the capital invested. Each transaction should only be entered into on the basis of the relevant investor’s
assessment of its individual financial situation as well as of the suitability and risks of the investment.
NORD/LB and its affiliates may, for their own account or for the account of third parties, participate in transactions involving the financial
instruments described herein or any underlying assets, issue further financial instruments having terms that are the same as or similar to
those governing the financial instruments referred to herein as well as enter into transactions to hedge positions. Such actions may affect
the price of the financial instruments described in this Analysis.
To the extent the financial instruments referred to herein are derivatives, they may involve an initial negative market value from the
customer’s point of view, depending on the terms and conditions prevailing as of the transaction date. Furthermore, NORD/LB reserves
the right to pass on its economic risk from any derivative transaction it has entered into to third parties in the market by way of a mirror
image counter-transaction.
Further information on any fees which may be included in the sales price is set forth in the brochure „Customer Information Relating to
Securities Transactions“ which is available at www.nordlb.de.
Covered Bond & SSA View 3 August 2016
NORD/LB Fixed Income Research
Page 22 of 24
The information set forth in this Analysis shall supersede all previous versions of any relevant Analysis and refer exclusively to the date
as of which this Analysis has been drawn up. Any future versions of this Analysis shall supersede this present version. NORD/LB shall
not be under any obligation to update and/or review this Analysis at regular intervals. Therefore, no assurance can be given as to its
currentness and continued accuracy.
By making use of this Analysis, the Recipient shall accept the foregoing terms and conditions.
NORD/LB is a member of the protection scheme of Deutsche Sparkassen-Finanzgruppe. Further information for the Recipient is set
forth in clause 28 of the General Terms and Conditions of NORD/LB or at www.dsgv.de/sicherungssystem.Additional information for
recipients in the UK
NORD/LB subject to limited regulation by the Financial Conduct Authority (“FCA”) und Prudential Regulation Authority (“PRA”). Details
about the extent of our regulation by the FCA and PRA are available from NORD/LB on request.
This Analysis is a financial promotion. Relevant Persons in the UK should contact NORD/LB’s London Branch, Investment Banking
Department, Telephone: 0044 / 2079725400 with any queries.
Investing in financial instruments referred to in this Analysis may expose an investor to a significant risk of losing all of the amount in-
vested.
Additional information for recipients in France
NORD/LB is partially regulated by the Autorité des Marchés Financiers for the conduct of French business. Details about the extent of
our regulation by the respective authorities are available from us on request.
This Analysis does constitute investment research within the meaning of Article 24(1) Directive 2006/73/EC, Article L.544-1 and R.621-
30-1 of the French Monetary and Financial Code and does qualify as research recommendation under Directive 2003/6/EC and Directive
2003/125/EC.
Additional information for recipients in Austria
None of the information contained in this Analysis constitutes a solicitation or offer by NORD/LB or its affiliates to buy or sell any securi-
ties, futures, options or other financial instruments or to participate in any other strategy. Only the published prospectus pursuant to the
Austrian Capital Market Act should be the basis for any investment decision of the Recipient.
For regulatory reasons, products mentioned in this Analysis may not being offered into Austria and are not available to investors in Aus-
tria. Therefore, NORD/LB might not be able to sell or issue these products, nor shall it accept any request to sell or issues these prod-
ucts, to investors located in Austria or to intermediaries acting on behalf of any such investors.
Additional information for recipients in Belgium
Evaluations of individual financial instruments on the basis of past performance are not necessarily indicative of future results. It should
be noted that the reported figures relate to past years.
Additional information for recipients in Cyprus
This Analysis does constitute investment research within the meaning of the definition section of the Cyprus Directive D1444-2007-
01(No 426/07). Furthermore, this material is provided for informational and advertising purposes only and does not constitute an invita-
tion or offer to sell or buy or subscribe any investment product.
Additional information for recipients in Denmark
This Analysis does not constitute a prospectus under Danish securities law and consequently is not required to be nor has been filed
with or approved by the Danish Financial Supervisory Authority as this Analysis either (i) has not been prepared in the context of a public
offering of securities in Denmark or the admission of securities to trading on a regulated market within the meaning of the Danish Securi-
ties Trading Act or any executive orders issued pursuant thereto, or (ii) has been prepared in the context of a public offering of securities
in Denmark or the admission of securities to trading on a regulated market in reliance on one or more of the exemptions from the re-
quirement to prepare and publish a prospectus in the Danish Securities Trading Act or any executive orders issued pursuant thereto.
Additional information for recipients in Greece
The information herein contained describes the view of the author at the time of its publication and it must not be used by its Recipient
unless having first confirmed that it remains accurate and up to date at the time of its use.
Past performance, simulations or forecasts are therefore not a reliable indicator of future results. Mutual funds have no guaranteed
performance and past returns do not guarantee future performance.
Additional information for recipients in Ireland
This Analysis has not been prepared in accordance with Directive 2003/71/EC, as amended, on prospectuses (the “Prospectus Di-
rective”) or any measures made under the Prospectus Directive or the laws of any Member State or EEA treaty adherent state that
implement the Prospectus Directive or those measures and therefore may not contain all the information required where a document is
prepared pursuant to the Prospectus Directive or those laws.
Additional information for recipients in Luxembourg
Under no circumstances shall this Analysis constitute an offer to sell, or issue or the solicitation of an offer to buy or subscribe for Prod-
ucts or Services in Luxembourg.
Additional information for recipients in Netherlands
The value of your investments may fluctuate. Results achieved in the past do not offer any guarantee for the future (De waarde van uw
belegging kan fluctueren. In het verleden behaalde resultaten bieden geen garantie voor de toekomst).
Additional information for recipients in Poland
This Analysis does not constitute a recommendation within the meaning of the Regulation of the Polish Minister of Finance Regarding
Information Constituting Recommendations Concerning Financial Instruments or Issuers thereof dated 19 October 2005.
Covered Bond & SSA View 3 August 2016
NORD/LB Fixed Income Research
Page 23 of 24
Additional information for recipients in Portugal
This Analysis is intended only for institutional clients and may not be (i) used by, (ii) copied by any means or (iii) distributed to any other
kind of investor, in particular not to retail clients. This Analysis does not constitute or form part of an offer to buy or sell any of the securi-
ties covered by the report nor can be understood as a request to buy or sell securities where that practise may be deemed unlawful. This
Analysis is based on information obtained from sources which we believe to be reliable, but is not guaranteed as to accuracy or com-
pleteness. Unless otherwise stated, all views herein contained are solely expression of our research and analysis and subject to change
without notice.
Additional information for recipients in Sweden
This Analysis does not constitute or form part of, and should not be construed as a prospectus or offering memorandum or an offer or
invitation to acquire, sell, subscribe for or otherwise trade in shares, subscription rights or other securities nor shall it or any part of it form
the basis of or be relied on in connection with any contract or commitment whatsoever. This Analysis has not been approved by any
regulatory authority. Any offer of securities will only be made pursuant to an applicable prospectus exemption under EC Prospectus
Directive, and no offer of securities is being directed to any person or investor in any jurisdiction where such action is wholly or partially
subject to legal restrictions or where such action would require additional prospectuses, other offer documentation, registrations or other
actions.
Additional information for recipients in Switzerland
This Analysis has not been approved by the Federal Banking Commission (merged into the Swiss Financial Market Supervisory Authori-
ty “FINMA” on 1 January 2009).
NORD/LB will comply with the Directives of the Swiss Bankers Association on the Independence of Financial Research, as amended.
This Analysis does not constitute an issuing prospectus pursuant to article 652a or article 1156 of the Swiss Code of Obligations. This
Analysis is published solely for the purpose of information on the products mentioned in this advertisement. The products do not qualify
as units of a collective investment scheme pursuant to the Federal Act on Collective Investment Schemes (CISA) and are therefore not
subject to the supervision by the Swiss Financial Market Supervisory Authority (FINMA).
Additional information for recipients in Canada
This Analysis has been prepared for informational purposes only in relation to the products contained in this material and is not, under
any circumstances to be construed as an offering memorandum or as an offering of any securities for sale directly or indirectly in any
province or territory of Canada.
No securities commission or similar regulatory authority in Canada has passed on the merits of these securities nor has it reviewed this
material and any representation to the contrary is an offence.
Relevant selling restrictions, if any, are contained in the prospectus or other documentation for the respective product.
Additional information for recipients in Estonia
It is advisable to examine all the terms and conditions of the services provided by NORD/LB. If necessary, Recipient of this Analysis
should consult with an expert.
Additional information for recipients in Finland
The financial products described in this Analysis may not be offered or sold, directly or indirectly, to any resident of the Republic of Fin-
land or in the Republic of Finland, except pursuant to applicable Finnish laws and regulations. Specifically, in the case of shares, those
shares may not be offered or sold, directly or indirectly, to the public in the Republic of Finland as defined in the Finnish Securities Mar-
ket Act (746/2012, as amended). The value of investments may go up or down. There is no guarantee to get back the invested amount.
Past performance is no guarantee of future results.
Additional information for recipients in Czech Republic
There is no guarantee to get back the invested amount. Past performance is no guarantee of future results. The value of investments
could go up and down
The information contained in this Analysis is provided on a non-reliance basis and its author does not accept any responsibility for its
content in terms of correctness, accuracy or otherwise.
Covered Bond & SSA View 3 August 2016
NORD/LB Fixed Income Research
Page 24 of 24
Arrangements for the confidential treatment of sensitive customer and business data as well as for avoiding and handling conflicts of
interest
NORD/LB has separated its business divisions that may have access to sensitive customer and business data (confidential areas) from
its other divisions (e.g. NORD/LB Research) in terms of functions and locations and/or via relevant data processing arrangements.
The disclosure of confidential information that may have an impact on the prices of securities is monitored by NORD/LB’s Compliance
Unit which is independent of its trading, operational and settlement divisions. This independent unit controls the transactions undertaken
by NORD/LB and its employees on a daily basis to ensure that they are in line with market conditions. The Compliance Unit may impose
such trading bans and restrictions as may be necessary to ensure that information, which may affect the prices of securities, is not mis-
used and to prevent confidential information from being disclosed to divisions that are only allowed to use information available to the
general public. To avoid conflicts of interest in connection with the preparation of financial analyses, the analysts of NORD/LB are
obliged to inform the Compliance Unit of any studies being drawn up and must not invest in the financial instruments handled by them.
They are obliged to notify the Compliance Unit of all transactions (including external transactions) undertaken by them for their own
account or for the account or on behalf of third parties. Thus the Compliance Unit is in a position to identify all unauthorized transactions
undertaken by the analysts, such as insider trading and front and parallel running. When a financial analysis involving conflicts of interest
to be disclosed within the NORD/LB Group is drawn up, any information on such conflicts of interest will only be made available by the
Compliance Unit upon completion of the financial analysis. Any subsequent amendment of the relevant financial analysis may only be
made upon consultation with the Compliance Unit and when it has been ensured that the results of the study are not affected by the
knowledge of such conflicts of interest. Further information on these matters is set forth in our Financial Analysis or Conflict of Interest
Policy which is available from the Compliance Unit of NORD/LB upon request.
Time of going to press
3 August 2016 08:32h (CET)
Disclosure of NORD/LB’s potential conflicts of interest according to § 34b Abs. 1 WpHG and
§ 5 FinAnV
None.
Additional disclosures
Sources and price indications
Depending on the issuer, we use information from financial data suppliers, our own estimates, company data and the public media for the
preparation of our financial analyses. Unless otherwise stated in the report, prices indicated relate to the closing price on the previous
day. Fees and commissions apply to securities (buy, sell, hold) and these may reduce the yield on investments.
Analytical methods and updates
In the preparation of financial analyses, we take company-specific methods used for fundamental securities’ analysis, quantita-
tive/statistical methods and models, as well as technical analytical methods as the basis for valuations and for the regular updates. It
should be noted that the results of analyses provide a snapshot overview and that past developments do not constitute a reliable indica-
tor for future profits. The basis of the valuations is subject to unforeseen change at any time, potentially leading to different conclusions.
The present report is prepared on a weekly basis. Recipients are not automatically entitled to receive report update publications.
Recommendation system and history of last 12 months
Positive: Positive expectations for the issuer, a security type or a specific security of an issuer.
Neutral: Neutral expectations for the issuer, a security type or a specific security of an issuer.
Negative: Negative expectations for the issuer, a security type or a specific security of an issuer.
Relative value (RV): Relative value recommendation in comparison to a market segment, an issuer or a maturity.
Issuer / security Date Recommendation Bond type Cause