Embed Size (px)
Citation preview
1
Coverage: United Kingdom Theme: The Economy Released: January 2018 Next proposed release: June 2018 Frequency of release: Bi-annual in January and June Media contact: HMRC Press Office (Business) 03000 585021 03000 585028 Statistical contacts: Max Rowe-Brown [email protected] 03000 523125 Ruvimbo Gwarada [email protected] 03000 566445 Responsible statistician: Iqbal Joomeen [email protected] 03000 586260 KAI Direct Business Taxes HM Revenue and Customs 100 Parliament Street London SW1A 2BQ Website: Petroleum Revenue Tax and government revenues from UK oil and gas production
Statistics of Government
revenues from UK Oil and Gas production

2
Contents Page
Statistics of Government revenues from UK oil and gas production 1
About these statistics 3
Key messages 3
Statistics published by HMRC for UK oil and gas sector 4
New or updated statistics in this release 4
Key contact for these statistics 4
Section 1
Current UK oil and gas fiscal regime 5
Ring Fence Corporation Tax (RFCT) 5
Supplementary Charge (SC) 5
Petroleum Revenue Tax (PRT) 5
Section 2
Government revenues from UK oil and gas production (Table 11.11) 6
Analysis of Petroleum Revenue Tax assessments (Table 11.12) 11
Numbers of oil and gas fields with different Petroleum Revenue Tax Liabilities (Table 11.13)
15
Section 3
Background Information 18
Methodology 18
Statistical quality 18
User engagement 18
Uses of the statistics 20
Abbreviations 20
Glossary of terms 20
Useful links 21
3
Statistics of Government revenues from UK oil and gas production – including related assessment data for fields subject to Petroleum Revenue Tax (PRT). About these statistics This is a National Statistics publication produced by HM Revenue and Customs. For more information on National Statistics and governance of statistics produced by public bodies please see the UK Statistics Authority website (www.statisticsauthority.gov.uk). Key messages Table 11.11 - Government revenues from UK oil and gas production (last updated in June 2017) Corporation Tax receipts in financial year 2016-17 relate to liabilities arising in calendar year 2016 (2016 H1 and 2016 H2). 1 For PRT receipts, these are primarily 2 determined by losses arising in 2015 H2 and 2016 H1 that are claimed back against PRT previously paid, resulting in a repayment in financial year 2016-17.
As a result of continued low oil and gas prices and high levels of expenditure, the recent reduction in the rates of PRT and Supplementary Charge (SC), and to a lesser extent the utilisation of the basin wide Investment Allowance (introduced in 2015), Government revenues declined to -£316 million in 2016-17, their lowest levels since records began in 1968-69. The 2015-16 figure was £151 million.
PRT revenues were -£654 million (in comparison to -£562 million in 2015-16) whilst Corporation Tax (CT) revenues fell by 53% from £713 million in 2015-16 to £338 million in 2016-17.
Government revenues have declined over the last few years from £10.9 billion in 2011-12, to -£316 million in 2016-17. Significant investment in both existing developments and new projects is resulting in continuing high levels of expenditure. This combined with a halving of the oil price between 2011-12 and 2016-17 and a 10% decline in oil and gas production over the same period contributed to the reduction in Government revenues.
Between 2015-16 and 2016-17 instalment payments of CT declined by £217 million from £1,113 million to £896 million, a fall of 19%. Whilst production rose and expenditure declined between 2015 and 2016, this was outweighed by the fall in oil and gas prices, the reduction in SC from 20% to 10% and the wider utilisation of new allowances against SC.
Over the same period repayments of CT rose from £400 million to £558 million (an increase of 40%), reflecting the higher amount of losses that were carried back, in particular decommissioning losses which have more generous loss carry back rules in comparison to general losses. The result of the carry back of losses against previous tax paid (historical profits) is a repayment of tax.
Table 11.12 - Petroleum Revenue Tax assessments (last updated in January 2018)
As a result of higher oil and gas prices in 2017 H1, income (gross profit) from oil and gas extraction increased by 11% to £1,989 million compared with 2016 H2.
1 H1: January to June; H2: July to December. 2 Companies have up to four years to make a loss carry back claim. Therefore in 2016-17 this will be the earliest year that losses from 2015 H2 and 2016 H1 can be repaid. But losses arising from other years may also be claimed back and repaid.

4
Other chargeable receipts – consisting of tariff income and revenues from asset disposals grew by 11% from £149 million in 2016 H2 to £166 million in 2017 H1.
There was a 3% decrease (from £1,372 million to £1,330 million) in field expenditure claimed over the same period. Assessable profits (before oil allowance) increased by 35% between 2016 H2 and 2017 H1, from £527 million to £713 million.
After oil allowance, PRT assessable profits were £707 million, an increase of £190 million (37%) from 2016 H2 amount of £517 million.
With effect from 1 January 2016, the PRT rate was reduced to 0% – therefore no PRT is due from this date. Where losses are carried back against chargeable profits in periods after 2015, no PRT repayments are due.
Table 11.13 – Oil and Gas fields with Petroleum Revenue Tax liabilities (last updated in January 2018)
For the PRT half year chargeable period ending 30 June 2017, there were 49 fields with gross PRT profits above £1 million, of which 21 of them (43%) did not have any chargeable profits after taking into account expenditure/losses and reliefs/allowances. This is in comparison to 2016 H2 where the total number of fields was 48, 22 of which did not have chargeable profits, equating to 46%.
Statistics published by HMRC for UK Oil and Gas sector
1. Name of publication: Table 11.11 Government revenues from UK Oil and Gas production. Last published: June 2017 Next publication date: June 2018 Frequency of publication: Once a year, in June
2. Name of publication: Table 11.12 Analysis of Petroleum Revenue Tax assessments. Last published: January 2018 Next publication date: June 2018 Frequency of publication: twice yearly in January and June
3. Name of publication: Table 11.13 Numbers of Oil and Gas fields with different
Petroleum Revenue Tax liabilities. Last published: January 2018 Next proposed publication date: June 2018 Frequency of publication: twice yearly in January and June
New or updated statistics in this release
In this January 2018 publication, Tables 11.12 and 11.13 have been updated to include statistics relating to PRT assessments for the half year chargeable period ending 30 June 2017. Small revisions have also been made to previous chargeable periods due to amended assessments issued within the last 6 months.
Key contacts for these statistics
Max Rowe-Brown [email protected] 03000 523125
Ruvimbo Gwarada [email protected] 03000 566445

5
Section 1
Current UK Oil and Gas Fiscal Regime The tax regime which applies to exploration and production of oil and gas in the UK and on the UK Continental Shelf (UKCS) currently comprises three elements:
1. Ring Fence Corporation Tax (RFCT)
This is calculated in the same way as the standard corporation tax applicable to all
companies but with the addition of a ‘ring fence’ and the availability of 100% first year
allowances for virtually all capital expenditure. The ring fence prevents taxable profits
from oil and gas extraction in the UK and UKCS being reduced by losses from other
activities or excessive interest payments. The current rate of tax on ring fence profits
is 30% and is set separately from the rate of mainstream corporation tax (currently
19%).
2. Supplementary Charge (SC)
This is an additional charge on a company’s ring fence profits (but with no deduction
for finance costs). With effect from 1 January 2016 the rate is 10%. The rate of SC
was 20% between 1 January 2015 and 31 December 2015, and was 32% prior to this3.
3. Petroleum Revenue Tax (PRT)
This is a field based tax charged on profits arising from oil and gas production from
individual oil and gas fields which were given development consent before 16 March
1993. With effect from 1 January 2016, the PRT rate was reduced to 0% (previously
the rate was 50%). PRT is a deductible expense in computing profits chargeable to
ring fence corporation tax and supplementary charge.
3 The rate of SC was 20% up until Budget 2011 (24 March 2011) when it increased to 32%

6
Section 2
Table 11.11: Government revenues from UK oil and gas production Table information and assessment (last updated in June 2017) Corporation Tax receipts in financial year 2016-17 relate to liabilities arising in calendar year 2016 (2016 H1 and 2016 H2). For PRT receipts, these are primarily determined by losses arising in 2015 H2 and 2016 H1 that are claimed back against PRT previously paid, resulting in a repayment in financial year 2016-17. Table 11.11 shows historic receipts from all taxes levied on exploration and production activities of oil and gas from the UK and the UK continental shelf. The table covers all years from 1968-69 to 2016-17. The table is supplemented by charts illustrating the changes in receipts from 1984-85 (chart C1) and the trends of oil prices compared with production and expenditure from 1984 (chart C2).
As a result of continued low oil and gas prices and high levels of expenditure, reduction in tax rates, and to a lesser extent the utilisation of the basin wide Investment Allowance, Government revenues declined to -£316 million in 2016-17, their lowest levels since records began in 1968-69. The 2015-16 figure was £151 million.
From January 2016, the rate of SC was reduced to 10% whilst the rate of PRT was permanently set to zero. The figures in Table 11.11 reflect repayments of PRT from 2016-17.
PRT revenues were -£654 million (in comparison to -£562 million in 2015-16) whilst net CT revenues fell 53% from £713 million in 2015-16 to £338 million in 2016-17.
Between 2015-16 and 2016-17 instalment payments of CT declined by £217 million from £1,113 million to £896 million, a fall of 19%. Whilst production rose and expenditure declined between 2015 and 2016, this was outweighed by the fall in oil and gas prices, the reduction in SC from 20% to 10% and the wider utilisation of new allowances against SC.
Over the same period repayments of CT rose from £400 million to £558 million (an increase of 40%), reflecting the higher amount of losses that were carried back, in particular decommissioning losses which have more generous loss carry back rules in comparison to general losses. The result of the carry back of losses against previous tax paid (historical profits) is a repayment of tax.
Between 2010-11 and 2011-12, there was a 30% increase in government revenues from £8.3 billion to £10.9 billion which was as a result of higher oil and gas prices and an increase in SC which rose from 20% to 32% effective from 24 March 2011.
Government revenues have declined over the last few years from £10.9 billion in 2011-12, to -£316 million in 2016-17. Expenditure has declined from its peak but still remains relatively high with investment in both existing developments and new projects. This combined with a halving of the oil price between 2011-12 and 2016-17 and a 10% decline in oil and gas production over the same period contributed to the reduction in government revenues.
Changes to statistics in June 2017 release Table 11.11 was updated to reflect improvements in the presentation of the Corporation Tax statistics. From 2015-16, Total Net CT has been disaggregated between payments and repayments.

7
Table, charts and supporting notes
T11.11 Government Revenues from UK oil and gas production
Amounts: £ million
Year Total Petroleum Supple- Royalty
revenues revenue mentary
(excluding tax petroleum Total ACT Ring Fence Supplementary Total Net Payments Repayments Gross Net of CT
gas levy) duty CT Charge claw back
1968-69 1 - - - - - - - - - 1 - -
1969-70 2 - - - - - - - - - 2 - -
1970-71 5 - - 2 - 2 - 2 - - 3 - -
1971-72 10 - - 4 - 4 - 4 - - 6 - -
1972-73 15 - - 4 - 4 - 4 - - 11 - -
1973-74 15 - - 3 - 3 - 3 - - 12 - -
1974-75 20 - - 5 - 5 - 5 - - 15 - -
1975-76 25 - - 5 - 5 - 5 - - 20 - -
1976-77 81 - - 10 - 10 - 10 - - 71 - -
1977-78 238 - - 10 - 10 - 10 - - 228 - -
1978-79 565 183 - 93 40 53 - 93 - - 289 - -
1979-80 2,313 1,435 - 250 78 172 - 250 - - 628 - -
1980-81 3,743 2,410 - 341 97 244 - 341 - - 992 - -
1981-82 6,492 2,390 2,025 681 270 411 - 681 - - 1,396 383 383
1982-83 7,822 3,274 2,395 521 202 319 - 521 - - 1,632 471 272
1983-84 8,798 6,017 - 877 430 447 - 877 - - 1,904 522 277
1984-85 12,035 7,177 - 2,432 1,244 1,188 - 2,432 - - 2,426 500 239
1985-86 11,348 6,375 - 2,916 1,085 1,831 - 2,916 - - 2,057 525 300
1986-87 4,783 1,188 - 2,676 1,130 1,546 - 2,676 - - 919 515 305
1987-88 4,618 2,296 - 1,298 681 617 - 1,298 - - 1,024 502 322
1988-89 3,168 1,371 - 1,195 685 510 - 1,195 - - 602 407 231
1989-90 2,368 1,050 - 743 495 248 - 743 - - 575 335 193
1990-91 2,312 860 - 847 363 484 - 847 - - 605 291 174
1991-92 979 (216) - 638 370 268 - 638 - - 557 282 182
1992-93 1,305 69 - 682 480 202 - 682 - - 554 287 193
1993-94 1,223 359 - 258 219 39 - 258 - - 606 240 145
1994-95 1,642 712 - 380 299 81 - 380 - - 550 175 96
1995-96 2,289 968 - 766 674 92 - 766 - - 555 161 107
1996-97 3,303 1,729 - 890 460 430 - 890 - - 684 198 132
1997-98 3,277 963 - 1,779 821 958 - 1,779 - - 535 200 133
1998-99 2,452 504 - 1,605 655 950 - 1,605 - - 343 - -
1999-2000 2,510 853 - 1,268 120 1,148 - 1,268 - - 389 - -
2000-01 4,399 1,518 - 2,329 - 2,329 - 2,329 - - 552 - -
2001-02 5,373 1,310 - 3,515 - 3,515 - 3,515 - - 548 - -
2002-03 5,054 958 - 3,662 - 3,369 293 3,662 - - 434 - -
2003-04 4,223 1,179 - 3,057 - 2,291 766 3,057 - - (13) - -
2004-05 5,115 1,284 - 3,831 - 2,790 1,041 3,831 - - - - -
2005-06 9,323 2,016 - 7,307 - 5,210 2,097 7,307 - - - - -
2006-07 8,864 2,155 - 6,709 - 4,919 1,790 6,709 - - - - -
2007-08 7,408 1,680 - 5,728 - 3,402 2,326 5,728 - - - - -
2008-09 12,393 2,567 - 9,826 5,716 4,110 9,826 - - - - -
2009-10 5,921 923 - 4,998 - 2,839 2,159 4,998 - - - - -
2010-11 8,322 1,458 - 6,864 - 3,810 3,054 6,864 - - - - -
2011-12 10,872 2,032 - 8,840 - 4,714 4,126 8,840 - - - - -
2012-13 6,149 1,737 - 4,412 - 1,916 2,496 4,412 - - - - -
2013-14 4,674 1,118 - 3,556 - 1,665 1,891 3,556 - - - - -
2014-15 2,103 77 - 2,026 - 970 1,056 2,026 - - - - -
2015-16 151 (562) - 713 - 465 248 713 1,113 400 - - -
2016-17 (316) (654) - 338 - 221 117 338 896 558 - - -
Updated June 2017
Corporation Tax, net of repayments Corporation Tax Gas levy

8
Footnotes 1. Figures for Corporation Tax for 2015-16 and 2016-17 are provisional and subject
to change in the future when payments originally made in respect of a group of companies are subsequently re-allocated to individual companies within the group but which are outside of the ring fence oil and gas regime.
2. Supplementary Charge receipts cannot be specifically identified from Total Net CT so they have been estimated using tax return data. 2015-16 figures for Supplementary Charge have been revised as 2015 assessment data is now available.
3. The table reflects the evolving tax regime for the UK Oil & Gas industry, so there are changes in the types of duties levied throughout the years featured in this table. Some examples of the changes are as follows:
Supplementary Petroleum Duty charged for only 2 years in the 1980’s.
Royalties abolished in 2002, although there were some residual repayments made in 2003.
Introduction of the CT supplementary charge in 2002. 4. The table reflects improvements to the presentation of these statistics
From 2015-16 Total Net CT has been disaggregated between payments and repayments
9
Notes on the Table and Charts (11.11, C1 and C2) Government revenues from oil and gas production 1. Table 11.11 summarises the tax revenues from oil and gas production in the UK
and its continental shelf since 1968-69. The yield from the gas levy is shown in the table, but it is excluded in estimates of the total tax on income from oil and gas production because it is categorised as a tax on expenditure.
2. The Corporation Tax estimates include the mainstream tax and the Advanced
Corporation Tax (ACT) set-off against the tax charged. Dividends attributable to UK oil and gas production cannot be separately identified from other dividends and therefore the amount of ACT set-off is estimated.
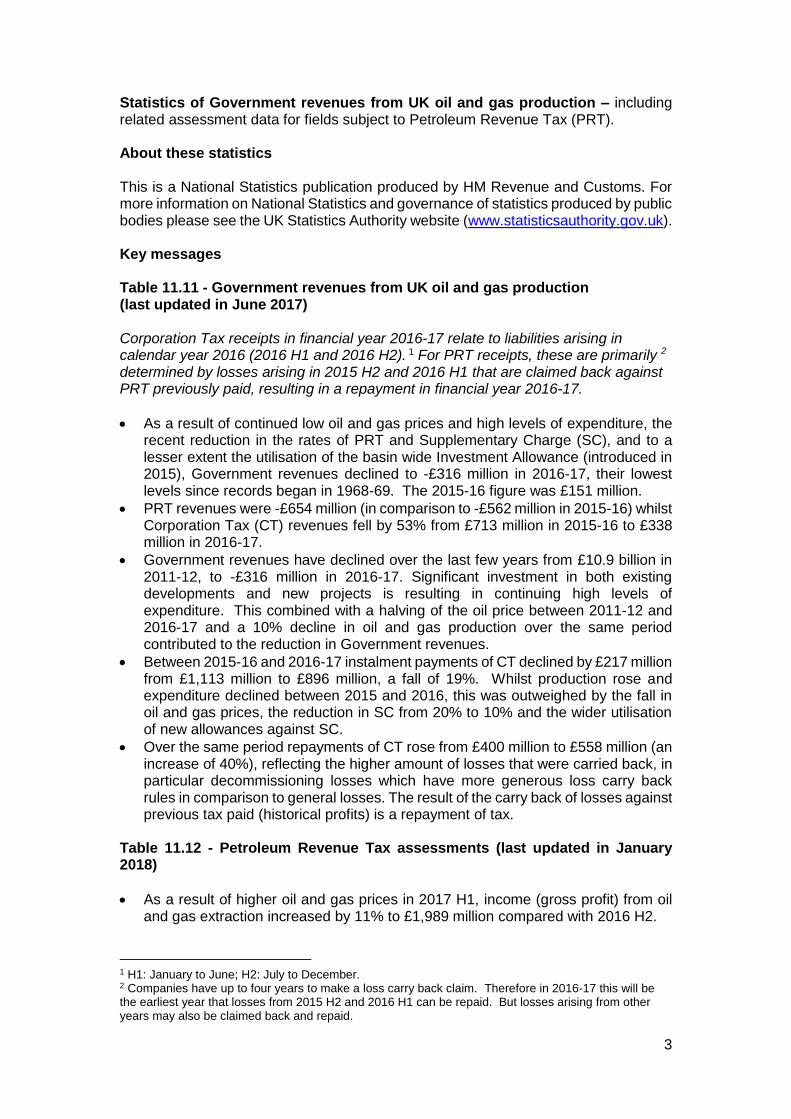
3. Chart C1 shows the annual tax yield and its separate components since 1984-85.
Chart C2 shows three of the main determinants of tax liability: annual production,

10
the sterling oil price, and total expenditure. Each is shown as an index based on 2000 = 100 and the absolute values in 2000 were as follows:
Production: 215 million tonnes of oil and the energy equivalent of gas (121 million tonnes of oil and natural gas liquids; 94 million tonnes oil equivalent of gas);
Oil price: £141 per tonne (£18.70 per barrel) averaging over 2000;
Total expenditure: £7.7 billion of capital, operating and exploration and appraisal expenditure.
4. The tax yield more than halved in 1986-87 because of the comparable fall in the oil price in 1986. Subsequently, it continued to fall as expenditure rose but from 1992-93 to 1996-97, the yield rose steadily in line with rising production and some recovery in oil prices. From 1997-98 to 1999-2000 the yield dropped in line with falling oil prices then rose again as oil prices increased.
5. The yield increased for 2005-06, boosted by a change in the instalment regime for
UK Oil & Gas companies, but declined in 2006-07 and 2007-08 as a result of lower production and higher costs. There was a considerable increase in receipts in 2008-09 due to record oil and gas prices, but yield decreased by half in 2009-10 as prices dropped significantly, production declined and expenditure increased. Despite rising expenditure and the continuing falls in production, yield increased in 2010-11 and 2011-12 as prices rose significantly from 2009 levels and the CT supplementary charge was increased to 32% from 24th March 2011.
6. The steep increase in oil prices from 2003 through to 2011 served to inflate running
costs and release capital for investment so expenditure increased during this period. Although the expenditure increases would have the effect of reducing revenues, this was outweighed by the impact of rising oil prices and the trend of revenues over this period was broadly in line with oil price trends. Since 2012-13, tax revenues have dropped significantly as a result of continued high expenditure (though this has declined from its peak), lower production and falling oil prices.
7. From 2016, the rate of PRT was permanently set to zero and SC was reduced to
10%. These reductions and to a lesser extent the utilisation of the basin wide Investment Allowance (introduced in 2015) have resulted in the lowest levels of Government revenues since records began.
9. Information on the current oil price (Brent crude) is available from Bloomberg.com. 10. Further information about UK Oil & Gas is available from the Oil and Gas Authority

11
Table 11.12: Analysis of Petroleum Revenue Tax assessments Table information and assessment (last updated in January 2018)
The table covers (PRT) assessments raised on companies participating in fields given development consent on or before 16 March 1993 and the participators are charged PRT on chargeable profits made. The assessments are raised for half year accounts periods ending 30 June (H1) and 31 December (H2). The current table covers assessments for the first half of 2011 to the first half of 2017.
HMRC Assessments are completed five months after the end of the chargeable period. Those for 2017 H1 were finalised in November 2017. Where a company has carried back a loss, this can impact receipts from seven months after the end of the chargeable period. Companies have up to four years to submit their loss carry back claim. Change in 2017 H1 assessments compared with 2016 H2 assessments
As a result of higher oil and gas prices in 2017 H1, income (gross profit) from oil and gas extraction was £1,989 million, an increase of 11% compared with 2016 H2.
Other chargeable receipts – consisting of tariff income and revenues from asset disposals was £166 million, an 11% grown in comparison to 2016 H2.
There was a 3% decrease (from £1,372 million to £1,330 million) in field expenditure claimed over the same period. Assessable profits (before oil allowance) increased by 35% between 2016 H2 and 2017 H1, from £527 million to £713 million.
There were £6 million in assessable profits relieved by oil allowance4 in 2017 H1. The modest amount of allowance used is a reflection that only a handful of small fields have unused allowance available.
This left 2017 H1 profit after oil allowance of £707 million, an increase of £190 million (37%) from 2016 H2 amount of £517 million.
With effect from 1 January 2016, the PRT rate was reduced to 0% – therefore there are no PRT payments from this date.
Comparison with previous 12 months
Comparing the 12 months ending 30 June 2017 with the period ending 30 June 2016, gross profits grew by 8% to £3,789 million largely due higher oil and gas prices.
Field expenditure decreased by 11% to £2,702 in the 12 months ending 30 June 2017 compared to the previous year. Over the same period, oil allowance fell by around 86% to £16 million.
Assessable profits for PRT increased by around 18% to £1,240 million due to a combination of higher production income and a decrease in expenditure.
Gross profits and assessable profits are significantly below their respective peaks of £9,894 million and £4,638 from the 12 months ending 30 June 2012. This significant fall in profits is mainly due to the halving of the oil prices over this period.
After oil allowance, profits chargeable to PRT in the 12 months ending 2017 H1 were £1,224 million, an increase of £289 million (31%) compared to the previous 12 month period.
4 The introduction of oil allowance in 1975 protects the economics of small or marginal fields and removes a slice of production income from PRT https://www.gov.uk/hmrc-internal-manuals/oil-taxation-manual/ot17100

12

13
Table 11.12 and supporting note
Amounts: £ million
Six month chargeable period ending 30 Jun 31 Dec 30 Jun 31 Dec 30 Jun 31 Dec 30 Jun 31 Dec 30 Jun 31 Dec 30 Jun 31 Dec 30 Jun
2011 2011 2012 2012 2013 2013 2014 2014 2015 2015 2016 2016 2017
Gross profit 4,731 4,907 4,987 4,292 4,587 4,084 3,861 2,935 2,391 1,856 1,642 1,800 1,989
plus other chargeable 349 195 178 172 390 149 140 213 169 265 486 149 166
receipts
less royalties (2) 2 3 3 2 3 2 3 2 3 2 2 1 1
less field expenditure 2,359 2,465 2,364 2,592 2,637 2,690 2,609 2,504 1,867 1,744 1,302 1,372 1,330
claimed in period
less cross field reliefs 12 15 59 60 16 5 8 1 11 11 1 2 13
claimed in period (3)
less losses brought forward 172 85 66 45 315 151 149 140 63 11 87 48 98
less losses carried back 255 313 257 103 115 24 145 112 85 19 15 0 0
Assessable Profits 2,280 2,221 2,417 1,663 1,893 1,361 1,086 394 531 334 718 527 713
less cash equivalent of 583 332 364 149 230 181 97 92 58 73 44 10 6
oil allowance
Assessable profits 1,697 1,889 2,064 1,514 1,663 1,181 988 302 473 261 674 517 707
after oil allowance
Assessable PRT before safeguard 848 944 1,027 757 831 590 494 151 236 131 0 0 0
reduction due to
safeguard restriction 0 0 0 0 0 0 0 0 0 0 0 0 0
Petroleum revenue tax payable 848 944 1,027 757 831 590 494 151 236 131 0 0 0
Memorandum item:
Repayment of PRT from
carry back of losses made
in the period (4):
Principal 63 101 88 158 127 264 297 320 227 316 229 0 0
Interest 5 10 11 13 12 0 0 0 0 0 0 0 0
Updated January 2018

14
Changes to statistics in January 2018 release
Data for 2010 H2 has been dropped and data for 2017 H1 added to Table 11.12 in
this release. Footnotes 1. Fields given development approval after 16 March 1993, which are not liable to
pay Petroleum Revenue Tax, are excluded from this table. 2. Royalties were abolished from 1 January 2003. The continuing deductions in the
assessments relate to licence fees that companies still have to pay BEIS. 3. Consisting of exploration and appraisal relief, cross-field allowance, research relief
and relief for unrelieved abandoned field loss. 4. Due to early publication of assessment data for the latest half year period, no
repayments have yet been made as a result of losses carried back from this period. The repayments for this period will however be featured in the next publication.
15
Notes on the table (11.12) Petroleum Revenue Tax assessments 1. Table 11.12 summarises the assessments of accruals of PRT liabilities so far made
for each six month period, from the first half of 2011 to the first half of 2017. Estimated assessments, which may later be revised, are included. They may subsequently change following HMRC tax assessments and because tax relief for losses and decommissioning costs in subsequent years may be deducible against some profits that would otherwise be subject to PRT in these periods.
2. No PRT assessment on a field is made until production commences. At that stage,
all expenditure claimed by the companies during the preceding development is taken into account. In general, assessments may be delayed when there is no liability to tax; the table figures do not include allowance for such cases.
3. In the table, the deduction for expenditure is limited to the amounts in assessments
required to reduce the assessable profit to nil. Field expenditure (both capital and operating) in the period is distinguished from expenditure claimed under the cross-field reliefs (mainly exploration and appraisal relief). Losses brought forward from earlier periods are not subdivided; they are predominantly from field expenditure, as it is usually inefficient to claim cross-field reliefs before they are effective.
4. As stated above, losses in a period (which are sometimes augmented by use of
cross-field reliefs) may be carried back indefinitely to earlier periods to reduce liabilities, leading to tax repayments. In the main part of the table, these losses are attributed to the period to which they were carried back. A memorandum item gives for each period the PRT arising for repayment as a result of losses carried back from the period; it is split between repayments of principal and associated interest. There is thus no simple direct link of PRT paid in each financial year and the amounts shown as payable for each reporting period. Restrictions on when losses can be carried (i.e. awaiting for the field to cease production) may result in revisions to earlier period’s data in later years. Where losses are carried back to chargeable periods starting after 2015, no repayment is due as the PRT rate was 0%.
5. For all periods after 2015, the rate of PRT is 0%.

16
Table 11.13: Numbers of oil and gas fields with different Petroleum Revenue Tax liabilities Table information and assessment (last updated in January 2018)
The table shows the numbers of fields assessed for petroleum revenue tax with gross profits of over £1 million in a six month chargeable period. The table includes the numbers of fields whose profits are covered by expenditure and allowances and those paying Petroleum Revenue Tax (PRT) at different levels.
Number of fields charged to PRT in 2017 H1
Although there were 49 fields with gross PRT profits above £1 million, 21 of them (43%) did not pay PRT by virtue of having no chargeable profits after taking into account field expenditure, losses, reliefs and allowances.
The residual 57% of fields did not pay any PRT by virtue of the tax rate being 0%. Historical number of fields chargeable and paying PRT
PRT only applies to fields given development consent before March 1993 and the number of fields with gross profits and other chargeable receipts of over £1 million in the chargeable period assessed for PRT has been generally declining as fields have ceased production.
Changes to statistics in January 2018 release
Data for 2010 H2 has been dropped and data for 2017 H1 added to Table 11.13 in
this release.

17
Table 11.13 and supporting notes (1)
Numbers: actual; Amounts: £ million
Six month chargeable period ending 30 Jun 31 Dec 30 Jun 31 Dec 30 Jun 31 Dec 30 Jun 31 Dec 30 Jun 31 Dec 30 Jun 31 Dec 30 June
2011 2011 2012 2012 2013 2013 2014 2014 2015 2015 2016 2016 2017
Number of fields where there are
no chargeable profits for PRT
All gross profits covered by
expenditure/allowable losses 19 22 20 27 26 29 30 32 30 36 25 * *
All assessable profits covered
by oil allowance and safeguard 19 19 21 15 15 15 13 8 6 4 3 * *
Total not paying PRT as profits
covered either by allowances,
expenditure or losses
38 41 41 42 41 44 43 40 36 40 28 22 21
Number of fields with chargeable
profits for PRT
Where the amount of PRT paid by the
field is zero as a result of the 0% tax
rate
0 0 0 0 0 0 0 0 0 0 26 26 28
Where the amount of PRT paid by the
field is under £10 million12 8 9 9 5 6 8 14 11 12 0 0 0
Where the amount of PRT paid by the
field is over £10 million18 19 18 17 21 15 12 5 7 5 0 0 0
Fields with chargeable profits 30 27 27 26 26 21 20 19 18 17 26 26 28
Total number of fields assessed 68 68 68 68 67 65 63 59 54 57 54 48 49
Amount of PRT payable
Under £10 million per field 58 34 37 28 5 18 24 52 18 19 0 0 0
Over £10 million per field 790 910 990 729 826 572 470 99 218 112 0 0 0
Total PRT payable 848 944 1,027 757 831 390 494 151 236 131 0 0 0
Updated January 2018

18
Footnotes
(1) Fields given development approval after 16th March 1993 are not liable for PRT and are excluded from this table.
* Number of fields in sub-category have been suppressed to comply with statistical disclosure rules.
Notes on the table (11.13) Numbers of oil and gas fields with different Petroleum Revenue Tax liabilities
1. Table 11.13 shows accruals of PRT liabilities for the periods shown. They may subsequently change following HMRC tax assessments and because tax relief for losses and decommissioning costs in subsequent years may be deductible against some profits that would otherwise be subject to PRT in these periods. In this table, the amount of tax for each field is the sum of the amount shown on the assessments for all the companies with an interest in the field. For the more recent periods, the numbers of fields with particular levels of liabilities will be revised as further assessments are made.
2. For all chargeable periods after December 2015, the rate of PRT is 0%.

19
Section 3
Background Information
Methodology Table 11.11 is updated from the latest receipts data held on HMRC accounting records and these figures are agreed as a definitive measure of receipts for the HMRC Financial Statements and Accounts. For corporation tax, the initial payment of a large percentage of instalments into the HMRC group payment accounts are recorded as ring fence UK oil and gas receipts, but these figures can be revised when the group payments are distributed between liabilities for participating companies. We are now asking companies to provide details of the proportion of their payments relating to non-ring fence charges so our initial recording of receipts relating to exploration and production operations is more accurate, but there is still likely to be small adjustments when liabilities are finalised. The CT receipts are recorded using a link to the HMRC Corporation Tax system which holds all payment records. There is an ongoing reconciliation of PRT receipts with HMRC Finance department (as recommended by the National Audit Office) to ensure accuracy of recording.
Tables 11.12 and 11.13 data are downloaded from a system which records all PRT assessments raised by HMRC Large Business (LB) - Oil & Gas branch. This source is updated regularly by LB and includes the initial bulk issue assessments raised by LB in May and November and any subsequent amendments.
Statistical quality The National Audit Office (NAO) undertake a yearly audit of PRT and CT receipts to ensure accurate recording. Recording of PRT receipts by HMRC’s analytical directorate KAI is reconciled on a monthly basis with figures produced by HMRC’s Finance directorate, as recommended by NAO.
The PRT assessment data for tables 11.12 and 11.13 is provided by LB which are then checked against HMRC accounting systems by KAI.
There is a quality assurance process in place for the output of all tables as the prepared outputs are checked by managers and signed off by senior officials before they are released.
The statistics are consistent with publications released by the ONS, OGA and the OBR.
User engagement
We are committed to providing impartial quality statistics that meet our users’ needs. We encourage our users to engage with us so we can improve our official statistics and identify gaps in the statistics that we produce. If you would like to comment on these statistics or have any enquiries please use the statistical contacts provided in this document.

20
Uses of the statistics
HMRC use these statistics to answer parliamentary questions and to inform policy decisions. Our users also use the statistics for media, research and forecasting purposes. Abbreviations ACT Advanced Corporation Tax BEIS Department for Business, Energy & Industrial Strategy CT Corporation Tax DECC Department of Energy and Climate Change HMRC HM Revenue & Customs KAI Knowledge Analysis and Intelligence (HMRC’s analysis directorate) LB Large Business (HMRC operational directorate) NAO National Audit Office OBR Office for Budget Responsibility OGA Oil and Gas Authority OGUK Oil & Gas UK (industry trade body) ONS Office for National Statistics PRT Petroleum Revenue Tax RFCT Ring Fence Corporation Tax SC Supplementary Charge Glossary of terms Ring fence Term used for the boundaries within which the special tax
regime for oil and gas exploration and production activity in the UK and UK continental shelf applies.
Royalties Royalties were broadly levied at 12.5 % of the value of
production, less some specific costs, for fields approved before 1st April 1982. Royalties were deductible from gross profits in arriving at profits chargeable to CT and PRT. Royalties were abolished from 1st January 2003. The continuing deductions in the PRT assessments relate to licence fees that companies still have to pay to BEIS.
Cross field reliefs PRT is a field based tax and these reliefs and allowances can
be passed from one field to another in certain circumstances. Safeguard restriction Safeguard deduction is aimed at ensuring marginal fields
remain profitable. It does this by restricting the amount of PRT payable by a company for their share in a field in a chargeable period if the effect of the PRT would be to reduce after-tax profit below a minimum return on investment in the field. Safeguard is only available for a limited number of periods, so this is why the restriction has decreased to nil in recent years.

21
Cash equivalent of Oil allowance The oil allowance featured in table 11.12 is referred to in terms
of cash equivalent as the allowance itself is calculated in terms of a free slice of production (in million tonnes), so the deduction in the table is the cash value of that free slice of production.
Development Approval BEIS approve and issue licences for companies to operate
fields in the UK and UK continental shelf. More information about licences can be obtained from the licensing section of the BEIS website: Oil and gas - Licensing - GOV.UK
Advanced
Corporation Tax Component of Corporation Tax levied on dividend payments.
ACT was abolished in 1999. Useful links Oil and Gas Authority (GOV.UK) UK Statistics Authority (GOV.UK) Oil & Gas UK (industry trade body)


![[XLS] · Web viewIncome Statement Summary Non-operating income Total Airport Revenues Operating aeronautical revenues Ground handling revenues Operating non-aeronautical revenues](https://img.pdfslide.us/doc/110x75/5acac1f37f8b9a7d548e1826/xls-viewincome-statement-summary-non-operating-income-total-airport-revenues-operating.jpg)