Embed Size (px)
Citation preview


SERVICE LIST Docket: 272
Ms. Pamela B. Katz Chairman Connecticut Siting Council 10 Franklin Square New Britain, CT 06051
Mr. Bruce Johnson Office of Consumer Counsel 10 Franklin Square New Britain, CT 06051
Atty. Anthony M. Fitzgerald Carmody & Torrance 195 Church Street, 18th Fl. P. O. Box 1950 New Haven, CT 06509-1950
Atty. Brian T. Henebry Carmody & Torrance 50 Leavenworth Street P. O. Box 1110 Waterbury, CT 06721-1110
Atty. Linda L. Randell Wiggin and Dana One Century Tower-P.O. Box 1832 New Haven, CT 06510
Atty. Bruce L. McDermott Wiggin & Dana LLP One Century Tower New Haven, CT 06508-1832
Atty. Peter G. Boucher Halloran and Sage One Goodwin Sq., 225 Asylum Hartford, CT 06103-4303
The Honorable Robert W. Megna State Representative 40 Foxon Hill Rd. #54 New Haven, CT 06513
The Honorable Al Adinolfi State Representative 235 Sorghum Mill Dr. Cheshire, CT 06410
Ms. MaryAnn Boord First Selectwoman Durham Town Hall 30 Townhouse Rd. Durham, CT 06422
Atty. Janice Small Town Attorney Wallingford Town Hall 45 South Main Street Wallingford, CT 06492
Mr. Louis S. Ciccarello Corporation Counsel City of Norwalk P. O. Box 798 Norwalk, CT 06856-0798
Mr. Eric Knapp Branse & Willis LLC 41-C New London Turnpike Glen Lochen East Glastonbury, CT 06033-2038
Atty. Ira W. Bloom Town of Westport 27 Imperial Ave. Westport, CT 06880
Ms. Leigh Grant Norwalk Assoc. of Silvermine Homeowners 99 Comstock Hill Road Norwalk, CT 06850
Atty. Julie Donaldson Kohler Hurwitz & Sagarin LLC 147 North Broad St. Milford, CT 06460
The Honorable Mary G. Fritz State Rep. - 90th District 43 Grove St. Yalesville, CT 06492
Ms. Melanie J. Howlett Assistant City Attorney City of Bridgeport 999 Broad Street Bridgeport, CT 06604
Ms. Trish Bradley Mr. Ed Schwartz Communities for Responsible Energy, Phase II 45 Ironwood Lane Durham, CT 06422
Atty. Michael C. Wertheimer Office of the Attorney General Ten Franklin Square New Britain, CT 06051
Deborah Moore, Esq. Meriden City Hall 142 East Main St. Meriden, CT 06450

Atty. Lawrence J. Golden Pullman & Comley LLC 90 State House Square Hartford, CT 06103-3702
The Honorable John E. Stripp State Representative - 135th District 4 Scatacook Trail Weston, CT 06883
Mr. Anthony M. MacLeod Whitman Breed Abbott & Morgan P. O. Box 2250 Greenwich, CT 06836
Mr. Arthur W. Gruhn Department of Transportation P.O. Box 317546 Newington, CT Connecticut 06131-7546
The Honorable Raymond Kalinowski State Rep. - 100th District P.O. Box 391 Durham, CT 06422
The Honorable Kenneth A. Flatto First Selectman 725 Old Post Rd. Fairfield, CT 06824
Mr. Harold W. Borden Vice President & General Counsel PSEG Power LLC 80 Park Plaza Newark, NJ 07102
The Honorable Themis Klarides State Representative-114th District 23 East St. Derby, CT 06418
Andrew W. Lord Murtha Cullina LLP CityPlace I, 29th Floor 185 Asylum Street Hartford, CT 06103-3469
Mitchell R. Goldblatt, First Selectman David A. Ball, Esq. Monte E. Frank, Esq. Town of Orange Cohen & Wolf, P.C. Cohen & Wolf, P.C. 617 Orange Center Road 1115 Broad Street 158 Deer Hill Avenue Orange, CT 06477-2499 Bridgeport, CT 06604 Danbury, CT 06810 Robert E. Earley Atty. Joaquina Borges King Atty. Richard J. Buturla Connecticut Business & Industry Assoc. Assistant Town Attorney Bercham, Moses & Devlin 350 Church Street Hamden Government Center 75 Broad Street Hartford, CT 06103-1106 2700 Dixwell Avenue Milford, CT 06460 Hamden, CT 06518
{W1285328}
STATE OF CONNECTICUT
SITING COUNCIL Re: The Connecticut Light and Power Company and The
United Illuminating Company Application for a Certificate of Environmental Compatibility and Public Need for the Construction of a New 345-kV Electric Transmission Line and Associated Facilities Between Scovill Rock Switching Station in Middletown and Norwalk Substation in Norwalk, Connecticut Including the Reconstruction of Portions of Existing 115-kV and 345-kV Electric Transmission Lines, the Construction of the Beseck Switching Station in Wallingford, East Devon Substation in Milford, and Singer Substation in Bridgeport, Modifications at Scovill Rock Switching Station and Norwalk Substation and the Reconfiguration of Certain Interconnections
) ) ) ) ) ) ) ) ) ) ) )
Docket 272 January 30, 2004
ADDENDUM # 2 TO SUPPLEMENTAL FILING
The Connecticut Light and Power Company (“CL&P”) and The United Illuminating
Company (“UI”) (together, the “Companies”) submit this addendum to their Supplemental Filing
to the Connecticut Siting Council (“Council”) dated December 16, 2003. This submission is
made pursuant to Section VIII (Q) of the Council’s Application Guides for Terrestrial Electric
Transmission Line Facilities, which provides that “the Applicant[s] shall provide supplemental
information for the Council to make a reasonable comparison between the Applicant [s’]
proposed route and any reasonable alternative route recommended by the site municipalities
pursuant to C.G.S. section 16-50l.”
In Part 5 of their December 16, 2003 filing, the Companies advised that certain thermal
load flow studies relating to the possible use of the existing 387 line between Scovill Rock

{W1285328} 2
Switching Station in Middletown and East Shore Substation in New Haven as a component of
the SWCT 345-kV loop had been commissioned from PowerGEM with respect to the “East
Shore Alternative.” These studies have been completed for system conditions representing NY-
NE flows of 0 MW. A hardcopy of the text of each of the completed studies, the full titles of
which are set forth in Footnote 1 on page 3, is attached. The study appendices will be provided
to the Council and the service list via e-mail.
When the system was modeled with the East Shore Alternative with the same dispatch
assumptions used in the previous ISO-NE Southwest Connecticut Working Group (SCWG) load
flow studies, the 387 line was nearly overloaded under normal conditions and was overloaded
post-contingency. With New Haven Harbor Station (NHHS) out of service, the 387 line was
overloaded under normal conditions and its post-contingency overloading was exacerbated.
These results indicate that the capacity of the existing 387 line would be inadequate for it to
serve as a segment of a SWCT 345-kV loop. In addition, in the studies assuming NHHS to be
out of service, other portions of the Connecticut 345-kV transmission system, specifically in the
vicinity of the Southington and Frost Bridge substations, were overloaded post-contingency.
PowerGEM also modeled an upgraded 387 line, by assuming that the 2156 ACSR
conductor between Black Pond Junction in Meriden and Scovill Rock Switching Station in
Middletown (approximately 10 miles) was replaced with the larger capacity 2-954 ACSR
bundled conductors that are already present on the remainder of the line. This replacement
would upgrade the capacity of the entire 387 line. The studies were repeated, assuming the
upgraded line, with NHHS both in and out of service. Even with this upgrade, the 387 line and

{W1285328} 3
other portions of the 345-kV system exhibited post-contingency overloads. The load flow results
of these studies, as they relate to the 387 line only, are summarized in the following table:
387 Line Summary Results
Existing 387
Line Reconductored
387 Line
NHHS
On1 NHHS
Off2 NHHS
On3 NHHS
Off4 Pre-Contingency (% of normal rating) 98 117 84 101 Post-Contingency (% of emergency rating) 106 125 - 107
Complete results are displayed in the attached reports.
The Companies are investigating whether the 387 line transmission structures could
support conductors with a capacity larger than 2-954 ACSR, and if so, how that would affect the
thermal load flow results of these studies. In the meantime, PowerGEM has also been
1 Southwest Connecticut Transmission Expansion, East Shore to Norwalk 345 KV OH/UG Alternative: Transmission Loading and Voltage Analysis @ 27.7 GW Load, New Haven Harbor Station On-Line, NE-NY 0 MW, PowerGEM Report 10021.001-1, Revised January 28, 2004. This study is included as Attachment 1 and is a slightly revised version of the December 31, 2003 PowerGEM study provided on January 5, 2004 with Supplemental Filing - Addendum 1.
2 Southwest Connecticut Transmission Expansion, East Shore to Norwalk 345 KV OH/UG Alternative: Transmission Loading and Voltage Analysis @ 27.7 GW Load, with New Haven Harbor Station Off-Line, NE-NY 0 MW, PowerGEM Report 10021.001-2 dated January 28, 2004. This study is included as Attachment 2.
3 Southwest Connecticut Transmission Expansion, East Shore to Norwalk 345 KV OH/UG Alternative: Transmission Loading and Voltage Analysis @ 27.7 GW Load, 387 Line Re-conductored, New Haven Harbor Station On-Line, NE-NY 0 MW, PowerGEM Report 10021.001-3 dated January 28, 2004. This study is included as Attachment 3.
4 Southwest Connecticut Transmission Expansion, East Shore to Norwalk 345 KV OH/UG Alternative: Transmission Loading and Voltage Analysis @ 27.7 GW Load, 387 Line Re-conductored, New Haven Harbor Station Off-Line, NE-NY 0 MW, PowerGEM Report 10021.001-4 dated January 28, 2004. This study is included as Attachment 4.

{W1285328} 4
commissioned to perform additional studies to evaluate the effect of varying transfers between
New York and New England. Once these analyses are completed, the ISO-NE SWCT Working
Group will provide a comparative document, which compares the results of the M-N project with
the East Shore alternative. The results and the Working Group document are expected to be
completed by February 20, 2004.


PowerGEM
Power Grid Engineering & Markets
Southwest Connecticut Transmission Expansion East Shore to Norwalk 345 KV OH/UG Alternative : Transmission Loading and Voltage Analysis @ 27.7 GW Load, New Haven Harbor Station On-Line, NE-NY 0 MW
Prepared for:
The United Illuminating Company
and
Northeast Utilities
Prepared by:
Johnny R. Willis PowerGEM [email protected]
PowerGEM Report 10021.001-1, Revised January 28, 2004
P. O. Box 9049, Niskayuna, NY 12309 www.power-gem.com
SWCT Transmission Expansion: East Shore to Norwalk 345 kV OH/UG Alternative Transmission Loading and Voltage Analysis, New Haven Harbor Station On-Line, NE-NY 0
EXECUTIVE SUMMARY .......................................................................................................................... 3 1. INTRODUCTION ................................................................................................................................ 4 2. DATABASE .......................................................................................................................................... 5
2.1. POWER FLOW BASE CASES ............................................................................................................. 5 2.2. CONTINGENCY FILE......................................................................................................................... 5
3. METHODOLOGY AND RESULTS FILES...................................................................................... 6 3.1. SOFTWARE ...................................................................................................................................... 6 3.2. PERFORMANCE CRITERIA ................................................................................................................ 6 3.3. SOLUTION OPTIONS......................................................................................................................... 6
4. RESULTS.............................................................................................................................................. 7 4.1. OVERLOAD RESULTS....................................................................................................................... 7 4.2. VOLTAGE VIOLATION RESULTS ...................................................................................................... 8
5. REFERENCES ................................................................................................................................... 10
PowerGEM Report 10021.001-1, Revised, Jan. 28, 2004 2

SWCT Transmission Expansion: East Shore to Norwalk 345 kV OH/UG Alternative Transmission Loading and Voltage Analysis, New Haven Harbor Station On-Line, NE-NY 0
Executive Summary
This report summarizes power flow analysis conducted for The United Illuminating Company (UI) and Northeast Utilities (NU) for one option for expanding the New England 345 kV transmission system into southwest Connecticut (SWCT). The transmission option examined, called “East Shore 27-OH/UG” in this report, is for a 345 kV transmission path from East Shore to Norwalk substations, with interconnecting substations between these stations.1 The “East Shore 27-OH/UG” transmission option, which consists primarily of underground cables with one section of overhead line, is described as follows:
From To Distance Transmission East Shore Orange (cable to
overhead line transition station)
7 miles 345 kV underground, 2500 kcmil HPFF, three parallel cables
Orange (cable to overhead line transition station)
East Devon 9.4 miles 345 kV overhead bundled 1590 ACSR conductor, single circuit
East Devon Singer 8 miles 345 kV underground, 2500 kcmil HPFF, two parallel cables
Singer Norwalk 15 miles 345 kV underground, 2500 kcmil HPFF, two parallel cables
The objective of this study is to analyze and document the performance of this transmission configuration for steady-state base case and post-contingency transmission power flows and voltages. Power flow analysis was conducted for a 27.7 GW New England load level for four southwest Connecticut generation dispatches. Loading and voltage performance of the Connecticut system was monitored for the 115 kV and 345 kV transmission systems. In all cases, the New Haven Harbor Station (447 MW), which has a significant impact on the flows on the 387 line, was in service.
The loading analysis found that one 345 kV transmission line (East Shore to Scovill Rock), twenty-three 115 kV transmission lines and one 345/115 kV autotransformer at Southington exhibited post-contingency overloads. Two of the overloaded 115 kV lines were also overloaded in the base case (all lines in) for some generation dispatches.
Voltage analysis indicated violations of voltage criteria for nine Connecticut 115 kV substations.
1 A planned 345 kV transmission expansion from the Plumtree to Norwalk substations, which is called Bethel to Norwalk, is assumed to be in-service in this analysis.
PowerGEM Report 10021.001-1, Revised, Jan. 28, 2004 3

SWCT Transmission Expansion: East Shore to Norwalk 345 kV OH/UG Alternative Transmission Loading and Voltage Analysis, New Haven Harbor Station On-Line, NE-NY 0
1. Introduction
This report summarizes power flow analysis conducted for The United Illuminating Company (UI) and Northeast Utilities (NU) for one option for expanding the New England 345 kV transmission system into southwest Connecticut (SWCT). The transmission option examined, called “East Shore 27-OH/UG” in this report, is for a 345 kV transmission path from East Shore to Norwalk substations, with interconnecting substations between these stations.2 The “East Shore 27-OH/UG” transmission option, which consists primarily of underground cables with one section of overhead line, is described as follows:
From To Distance Transmission East Shore Orange (cable to
overhead line transition station)
7 miles 345 kV underground, 2500 kcmil HPFF, three parallel cables
Orange (cable to overhead line transition station)
East Devon 9.4 miles 345 kV overhead bundled 1590 ACSR conductor, single circuit
East Devon Singer 8 miles 345 kV underground, 2500 kcmil HPFF, two parallel cables
Singer Norwalk 15 miles 345 kV underground, 2500 kcmil HPFF, two parallel cables
The objective of this study is to analyze and document the performance of this transmission configuration for steady-state base case and post-contingency transmission power flows and voltages. Performance is examined for a 27.7 GW New England load level and for four dispatches of New England generation. In all cases, the New Haven Harbor Station (447 MW), which has a significant impact on the flows on the 387 line, was in service. References 1 thru 3 are companion reports for other system conditions studied.
The following Appendices are included in this report: Appendix A “East Shore 27-OH/UG” Transmission Modeling Data Appendix B Power Flow Base Case One-Line Diagrams Appendix C Contingency File Appendix D Generation Dispatches Appendix E Summary of Overloads Appendix F Summary of Voltage Violations
2 A planned 345 kV transmission expansion from Plumtree to Norwalk substations, which is called Bethel to Norwalk, is assumed to be in-service in this analysis.
PowerGEM Report 10021.001-1, Revised, Jan. 28, 2004 4

SWCT Transmission Expansion: East Shore to Norwalk 345 kV OH/UG Alternative Transmission Loading and Voltage Analysis, New Haven Harbor Station On-Line, NE-NY 0
2. Database
This section discusses the data developed and used in the study.
2.1. Power Flow Base Cases Four power flow base cases, which included the approved Bethel to Norwalk 345-kV project in service, were utilized. PowerGEM revised each of the four cases to add the “East Shore 27-OH/UG” transmission project. Details regarding the modeling of these circuits are provided in Appendix A. In addition to this, the rating of the East Shore to Scovill Rock 345 kV line was increased to reflect the line rating by reconfiguring the East Shore Substation and removing the 345/115 kV autotransformers from the 387 line path. The line ratings used were 1240 MVA normal and 1604 MVA long-time emergency.
Each of the four base cases provided had different generation dispatches, and are denoted dispatches 2B, 3B, 4B, and 5B. These dispatches were preserved for the base cases. Appendix D contains a list of the on-line generation for dispatch 2B, and the differences in dispatches 3B, 4B, and 5B as compared for dispatch 2B. Significant changes to dispatch for the four cases were restricted to New England generation.
A one-line diagram showing power flows and voltages on the “East Shore 27-OH/UG” (and Bethel to Norwalk) transmission for each of the four base cases is included in Appendix B.
2.2. Contingency File A contingency file was modified as appropriate for this study, and is contained in Appendix C.
• Loss of multiple 345 kV underground cables on the “East Shore 27-OH/UG” configuration between Orange and East Shore, or loss of parallel cables between Devon and Norwalk, is not considered. (Simultaneous loss of one cable from Devon to Singer and Singer to Norwalk is included as a contingency).
• For loss of the Orange to East Devon 345 kV overhead line, all three 345 kV underground cables from Orange to East Shore were opened.
PowerGEM Report 10021.001-1, Revised, Jan. 28, 2004 5

SWCT Transmission Expansion: East Shore to Norwalk 345 kV OH/UG Alternative Transmission Loading and Voltage Analysis, New Haven Harbor Station On-Line, NE-NY 0
3. Methodology and Results Files
This section describes the technical approach to the study, performance criteria, solution assumptions, and the format of the results.
3.1. Software Set up of the power flow base cases used PTI’s PSS/E software (Rev. 28). Base case and contingency analysis was conducted using PTI’s MUST software (Rev. 5). Results from the MUST program are stored in Excel spreadsheets.
3.2. Performance Criteria The criteria for checking overload and voltage performance were as follows:
• Buses and transmission branches in Connecticut 115 kV and above were monitored.
• For base case loading performance, transmission lines and transformers were checked against 100% of their normal ratings.
• For post-contingency loading performance, overloads of transmission lines and transformers were checked against 100% of the long-time emergency ratings.
• Buses 230 kV and above were checked for voltages less than 95% and greater than 105%. Buses in the 115 kV system were checked for voltages less than 90% and more than 105%.
3.3. Solution Options For the analysis, tap-changing transformer and phase-shifting transformer adjustments were held fixed. For contingencies involving loss of generation/load the imbalance was made up by the system swing generator located outside New England.
PowerGEM Report 10021.001-1, Revised, Jan. 28, 2004 6

SWCT Transmission Expansion: East Shore to Norwalk 345 kV OH/UG Alternative Transmission Loading and Voltage Analysis, New Haven Harbor Station On-Line, NE-NY 0
4. Results
The results of the analysis for transmission system loading and voltage violations are provided below.
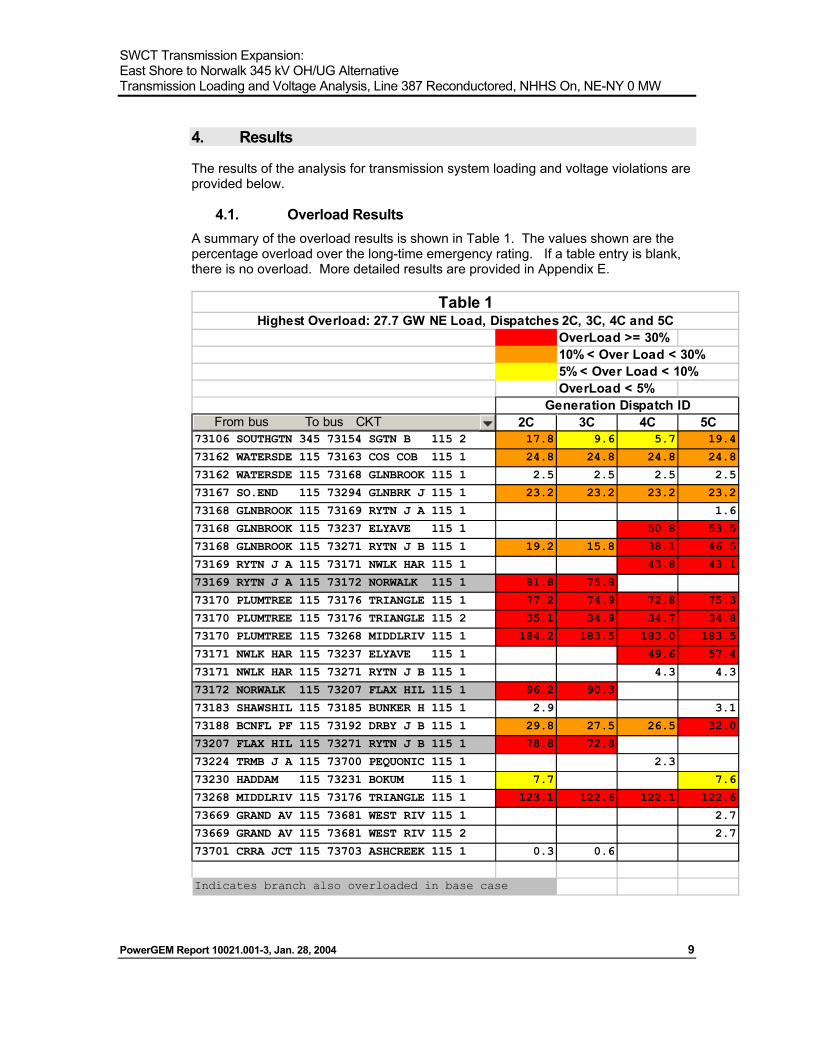
4.1. Overload Results A summary of the overload results is shown in Table 1. The values shown are the percentage overload over the long-time emergency rating. If a table entry is blank, there is no overload. More detailed results are provided in Appendix E.
Any transmission line or transformer in the study area at 115 kV or above that experiences a post-contingency overload in this study is listed in the first column of Table 1. The remaining four columns, one for each of the four Connecticut generation dispatches studied, show the maximum overload of the branch in % (considering all contingencies) for each dispatch. The overloads are color-coded as indicated at the top of the table in order to make the relative severity of the overloads more apparent. If a Table 1 entry is blank, then the branch is not overloaded for that dispatch. To find more detail, for example which contingency causes the overload, and whether other contingencies could overload the branch, the reader should refer to Appendix E.
As shown in Table 1, one 345 kV transmission line, East Shore to Scovill Rock, experiences a post-contingency overload of 5%-6% for dispatches 2B and 5B. (The causes of the overloads are stuck breaker contingencies at Southington, as may be found in Appendix E). Loading on the 387 line for base case conditions is summarized in the following table. One-lines showing the flows on this line for each case are in Appendix B.
Generation Dispatch ID 387 Line Base Case Loading
(% normal rating) 2B 98% 3B 69% 4B 53% 5B 96%
A 345/115 kV autotransformer at Southington also overloads from 7% to 21%, depending on dispatch. The contingency causing the overload is a stuck breaker contingency at Southington (see Appendix E).
Finally, there are twenty-three 115 kV line overloads that vary widely from slight overloads to severe overloads. Some overloads are sensitive to generation dispatch, while others are not. Two branches are overloaded in the base case, as indicated by the shaded branch names. These base case overloads are significant, in the 10% - 20% range.
PowerGEM Report 10021.001-1, Revised, Jan. 28, 2004 7

SWCT Transmission Expansion: East Shore to Norwalk 345 kV OH/UG Alternative Transmission Loading and Voltage Analysis, New Haven Harbor Station On-Line, NE-NY 0
OverLoad >= 30%10% < Over Load < 30%5% < Over Load < 10%OverLoad < 5%
From bus To bus CKT 2B 3B 4B 5B73106 SOUTHGTN 345 73154 SGTN B 115 2 19.4 10.8 6.7 21.1
73107 SCOVL RK 345 73663 E.SHORE 345 1 6.0 5.2
73162 WATERSDE 115 73163 COS COB 115 1 24.8 24.8 24.8 24.8
73162 WATERSDE 115 73168 GLNBROOK 115 1 2.5 2.5 2.5 2.5
73167 SO.END 115 73294 GLNBRK J 115 1 23.2 23.2 23.2 23.2
73168 GLNBROOK 115 73169 RYTN J A 115 1 1.8
73168 GLNBROOK 115 73237 ELYAVE 115 1 51.0 53.9
73168 GLNBROOK 115 73271 RYTN J B 115 1 19.2 15.8 38.1 46.5
73169 RYTN J A 115 73171 NWLK HAR 115 1 44.4 44.3
73169 RYTN J A 115 73172 NORWALK 115 1 80.8 75.2
73170 PLUMTREE 115 73176 TRIANGLE 115 1 77.4 74.7 72.9 75.5
73170 PLUMTREE 115 73176 TRIANGLE 115 2 35.2 34.9 34.7 34.9
73170 PLUMTREE 115 73268 MIDDLRIV 115 1 184.3 183.5 183.0 183.6
73171 NWLK HAR 115 73237 ELYAVE 115 1 50.2 58.4
73171 NWLK HAR 115 73271 RYTN J B 115 1 4.3 4.3
73172 NORWALK 115 73207 FLAX HIL 115 1 95.3 89.7
73183 SHAWSHIL 115 73185 BUNKER H 115 1 4.2 4.3
73188 BCNFL PF 115 73192 DRBY J B 115 1 29.9 27.6 26.5 32.1
73207 FLAX HIL 115 73271 RYTN J B 115 1 77.9 72.2
73224 TRMB J A 115 73700 PEQUONIC 115 1 1.7
73230 HADDAM 115 73231 BOKUM 115 1 9.3 9.2
73268 MIDDLRIV 115 73176 TRIANGLE 115 1 123.2 122.6 122.1 122.7
73669 GRAND AV 115 73681 WEST RIV 115 1 1.7
73669 GRAND AV 115 73681 WEST RIV 115 2 1.7
73701 CRRA JCT 115 73703 ASHCREEK 115 1 0.3
Indicates branch also overloaded in base case
Highest Overload: 27.7 GW NE Load, Dispatches 2B, 3B, 4B and 5B
Generation Dispatch ID
Table 1
4.2. Voltage Violation Results A summary of the most severe low voltage violations is provided in Table 2 (following page). More detailed results on the voltage analysis are provided in Appendix F. Since violations of high voltage limits were minor, they are not included in the table below but are included in Appendix F.
PowerGEM Report 10021.001-1, Revised, Jan. 28, 2004 8

SWCT Transmission Expansion: East Shore to Norwalk 345 kV OH/UG Alternative Transmission Loading and Voltage Analysis, New Haven Harbor Station On-Line, NE-NY 0
The table shows the bus number, bus name, and base kV, as well as area and zone numbers in the load flow data base. The “# Viols” column is the total number of violations for this bus and dispatch condition. If “# Viols” equals one, then the indicated contingency is the only one causing a violation. If “# Viols” exceeds one, then other contingencies also cause a voltage violation, but none are more severe than the indicated contingency. (Appendix F could be used to assess the comparative severity of multiple contingencies causing a voltage violation for a particular bus.)
Some observations on the results from this table are as follows:
• There are no voltage violations for 345 kV buses reported.
• Seven 115 kV buses are found to have low voltage violations. (Two 115 kV buses have minor high voltage violations but are not shown in Table 2).
• The generation dispatch does not have a dramatic effect on the magnitude of the voltage violations.
Lo Violation > 3%1% < Lo Violation < 3%0.5%< Lo Violation < 1%
Sorted by bus, then low violation Lo Violation < 0.5%
Bus # Bus Name KV Area Zone#
ViolsWorstLo
Vio Ncon LoCont Name Worst Lo Dispatch Controls
73160 BALDWINB 115.0 701 171 2 0.035 244 1272-1721DCT 5B FIX
73160 BALDWINB 115.0 701 171 1 0.023 244 1272-1721DCT 2B FIX
73160 BALDWINB 115.0 701 171 1 0.016 244 1272-1721DCT 4B FIX
73160 BALDWINB 115.0 701 171 1 0.015 244 1272-1721DCT 3B FIX
73188 BCNFL PF 115.0 701 171 1 0.006 244 1272-1721DCT 5B FIX
73185 BUNKER H 115.0 701 171 2 0.035 244 1272-1721DCT 5B FIX
73185 BUNKER H 115.0 701 171 1 0.023 244 1272-1721DCT 2B FIX
73185 BUNKER H 115.0 701 171 1 0.015 244 1272-1721DCT 3B FIX
73185 BUNKER H 115.0 701 171 1 0.015 244 1272-1721DCT 4B FIX
73682 ELMWST A 115.0 701 185 2 0.004 373 GRNDAV7TSTK 5B FIX
73683 ELMWST B 115.0 701 185 3 0.006 370 GRNDAV4TSTK 5B FIX
73189 FREIGHT 115.0 701 171 1 0.037 244 1272-1721DCT 5B FIX
73189 FREIGHT 115.0 701 171 1 0.024 244 1272-1721DCT 2B FIX
73189 FREIGHT 115.0 701 171 1 0.017 244 1272-1721DCT 3B FIX
73189 FREIGHT 115.0 701 171 1 0.017 244 1272-1721DCT 4B FIX
73199 SO.NAUG 115.0 701 171 1 0.005 244 1272-1721DCT 5B FIX
Voltage Violations, Worst & Total27.7 GW NE Load, Dispatches 2B, 3B, 4B and 5B
Table 2
The value in the “Worst Lo Vio” column indicates the amount, in per-unit, that the bus voltage is below the low voltage criteria. The contingency and dispatch for which this occurs is also indicated. More detailed information on the results of the voltage analysis may be found in Appendix F, including explanations on interpreting values in the tables.
PowerGEM Report 10021.001-1, Revised, Jan. 28, 2004 9

SWCT Transmission Expansion: East Shore to Norwalk 345 kV OH/UG Alternative Transmission Loading and Voltage Analysis, New Haven Harbor Station On-Line, NE-NY 0
PowerGEM Report 10021.001-1, Revised, Jan. 28, 2004 10
5. References
1. Southwest Connecticut Transmission Expansion, East Shore to Norwalk 345 KV OH/UG Alternative, Transmission Loading and Voltage Analysis @ 27.7 GW Load, New Haven Harbor Station Off-Line, NE-NY 0 MW, PowerGEM Report 10021.001-2 dated January 28, 2004.
2. Southwest Connecticut Transmission Expansion, East Shore to Norwalk 345 KV OH/UG Alternative, Transmission Loading and Voltage Analysis @ 27.7 GW Load, 387 Line Re-conductored, New Haven Harbor Station On-Line, NE-NY 0 MW, PowerGEM Report 10021.001-3 dated January 28, 2004.
3. Southwest Connecticut Transmission Expansion, East Shore to Norwalk 345 KV OH/UG Alternative, Transmission Loading and Voltage Analysis @ 27.7 GW Load, 387 Line Re-conductored, New Haven Harbor Station Off NE-NY 0 MW, PowerGEM Report 10021.001-4 dated January 28, 2004.

PowerGEM
Power Grid Engineering & Markets
Southwest Connecticut Transmission Expansion East Shore to Norwalk 345 KV OH/UG Alternative : Transmission Loading and Voltage Analysis @ 27.7 GW Load with New Haven Harbor Station Off-Line, NE-NY 0 MW
Prepared for:
The United Illuminating Company
and
Northeast Utilities
Prepared by:
Johnny R. Willis PowerGEM [email protected]
PowerGEM Report 10021.001-2 January 28, 2004
P. O. Box 9049, Niskayuna, NY 12309 www.power-gem.com

PowerGEM
Power Grid Engineering & Markets
EXECUTIVE SUMMARY .......................................................................................................................... 2 1. INTRODUCTION ................................................................................................................................ 4 2. DATABASE .......................................................................................................................................... 6
2.1. POWER FLOW BASE CASES ............................................................................................................. 6 2.2. CONTINGENCY FILE......................................................................................................................... 6
3. METHODOLOGY AND RESULTS FILES...................................................................................... 7 3.1. SOFTWARE ...................................................................................................................................... 7 3.2. PERFORMANCE CRITERIA ................................................................................................................ 7 3.3. SOLUTION OPTIONS......................................................................................................................... 7
4. RESULTS.............................................................................................................................................. 8 4.1. OVERLOAD RESULTS....................................................................................................................... 8 4.2. VOLTAGE VIOLATION RESULTS .................................................................................................... 10 4.3. COMPARISON OF RESULTS WITH NEW HAVEN HARBOR STATION ON-LINE .................................. 12
4.3.1. Loading Violations ............................................................................................................... 12 4.3.2. Voltage Violations ................................................................................................................ 13
5. REFERENCES ................................................................................................................................... 15
P. O. Box 9049, Niskayuna, NY 12309 www.power-gem.com

SWCT Transmission Expansion: East Shore to Norwalk 345 kV OH/UG Alternative Transmission Loading and Voltage Analysis, New Haven Harbor Station Off-Line, NE-NY 0 MW
Executive Summary
This report summarizes power flow analysis conducted for The United Illuminating Company (UI) and Northeast Utilities (NU) for one option for expanding the New England 345 kV transmission system into southwest Connecticut (SWCT). The transmission option examined, called “East Shore 27-OH/UG” in this report, is for a 345 kV transmission path from East Shore to Norwalk substations, with interconnecting substations between these stations.1 The “East Shore 27-OH/UG” transmission option, which consists primarily of underground cables with one section of overhead line, is described as follows:
From To Distance Transmission East Shore Orange (cable to
overhead line transition station)
7 miles 345 kV underground, 2500 kcmil HPFF, three parallel cables
Orange (cable to overhead line transition station)
East Devon 9.4 miles 345 kV overhead bundled 1590 ACSR conductor, single circuit
East Devon Singer 8 miles 345 kV underground, 2500 kcmil HPFF, two parallel cables
Singer Norwalk 15 miles 345 kV underground, 2500 kcmil HPFF, two parallel cables
A companion report (Reference 1) summarizes analysis of this option for several generation dispatches. This report examines the same dispatches except that the 447 MW New Haven Harbor Station, which was on for the studies in Reference 1, is off-line. The generation deficiency is made up by the Kleen Energy generation project, which is expected to be connected to the Scovill Rock to Manchester 345 kV line very near the Scovill Rock Substation.
Power flow analysis was conducted for a 27.7 GW New England load level for four southwest Connecticut generation dispatches. Loading and voltage performance of the Connecticut system was monitored for the 115 kV and 345 kV transmission systems.
Comparing the results of this study with that of Reference 1, in which New Haven Harbor Station is on-line, indicates that the availability of this generator is important to the viability of this system alternative.
1 A planned 345 kV transmission expansion from the Plumtree to Norwalk substations, which is called Bethel to Norwalk, is assumed to be in-service in this analysis.
PowerGEM Report 10021.001-2, Jan. 28, 2004 2

SWCT Transmission Expansion: East Shore to Norwalk 345 kV OH/UG Alternative Transmission Loading and Voltage Analysis, New Haven Harbor Station Off-Line, NE-NY 0 MW
The loading analysis found that three 345 kV transmission lines, twenty-four 115 kV transmission lines and one 345/115 kV autotransformer at Southington exhibited post-contingency overloads. The three 345 kV transmission lines are East Shore to Scovill Rock, Southington to Frost Bridge, and Southington to Meriden. The East Shore to Scovill Rock 345 kV line is also overloaded in the base case, in the range of 15% to 17%, for two SWCT generation dispatches.
Voltage analysis indicated violations of voltage criteria for eight Connecticut 345 kV substations and fourteen Connecticut 115 kV substations. Many of these were low voltage violations resulting from a stuck breaker contingency that trips the Scovill Rock to Haddam Neck and Scovill Rock to East Shore 345 kV lines including the Cross-Sound Cable.
PowerGEM Report 10021.001-2, Jan. 28, 2004 3

SWCT Transmission Expansion: East Shore to Norwalk 345 kV OH/UG Alternative Transmission Loading and Voltage Analysis, New Haven Harbor Station Off-Line, NE-NY 0 MW
1. Introduction
This report summarizes power flow analysis conducted for The United Illuminating Company (UI) and Northeast Utilities (NU) for one option for expanding the New England 345 kV transmission system into southwest Connecticut (SWCT). The transmission option examined, called “East Shore 27-OH/UG” in this report, is for a 345 kV transmission path from East Shore to Norwalk substations, with interconnecting substations between these stations.2 The “East Shore 27-OH/UG” transmission option, which consists primarily of underground cables with one section of overhead line, is described as follows:
From To Distance Transmission East Shore Orange (cable to
overhead line transition station)
7 miles 345 kV underground, 2500 kcmil HPFF, three parallel cables
Orange (cable to overhead line transition station)
East Devon 9.4 miles 345 kV overhead bundled 1590 ACSR conductor, single circuit
East Devon Singer 8 miles 345 kV underground, 2500 kcmil HPFF, two parallel cables
Singer Norwalk 15 miles 345 kV underground, 2500 kcmil HPFF, two parallel cables
A companion report (Reference 1) summarizes analysis of this option for several generation dispatches. This report examines the same dispatches except that the 447 MW New Haven Harbor Station, which was on for the studies in Reference 1, is off-line. The generation deficiency is made up by the Kleen Energy generation project, which is expected to be connected to the Scovill Rock to Manchester 345 kV line very near the Scovill Rock Substation. References 1 thru 3 are companion reports for other system conditions studied.
The objective of this study is to analyze and document the performance of this transmission configuration for steady-state base case and post-contingency transmission power flows and voltages. Performance is examined for a 27.7 GW New England load level and for four dispatches of New England generation. In all cases, the New Haven Harbor Station (447 MW), which has a significant impact on the flows on the 387 line, was out of service.
The following Appendices are included in this report: Appendix A “East Shore 27-OH/UG” Transmission Modeling Data Appendix B Power Flow Base Case One-Line Diagrams Appendix C Contingency File
2 A planned 345 kV transmission expansion from Plumtree to Norwalk substations, which is called Bethel to Norwalk , is assumed to be in-service in this analysis.
PowerGEM Report 10021.001-2, Jan. 28, 2004 4

SWCT Transmission Expansion: East Shore to Norwalk 345 kV OH/UG Alternative Transmission Loading and Voltage Analysis, New Haven Harbor Station Off-Line, NE-NY 0 MW
Appendix D Generation Dispatches Appendix E Summary of Overloads Appendix F Summary of Voltage Violations
PowerGEM Report 10021.001-2, Jan. 28, 2004 5

SWCT Transmission Expansion: East Shore to Norwalk 345 kV OH/UG Alternative Transmission Loading and Voltage Analysis, New Haven Harbor Station Off-Line, NE-NY 0 MW
2. Database
This section discusses the data developed and used in the study.
2.1. Power Flow Base Cases Four power flow base cases, which included the approved Bethel to Norwalk 345-kV project in service, were utilized. PowerGEM revised each of the four cases to add the “East Shore 27-OH/UG” transmission project. Details regarding the modeling of these circuits are provided in Appendix A. In addition to this, the rating of the East Shore to Scovill Rock 345 kV line was increased to reflect the line rating by reconfiguring the East Shore Substation and removing the 345/115 kV autotransformers from the 387 line path. The line ratings used were 1240 MVA normal and 1604 MVA long-time emergency.
Each of the four base cases provided had different generation dispatches. For all of these cases, the 447 MW New Haven Harbor Station was turned off and replaced by generation from the Kleen Energy project, both of which are outside the SWCT interface. These dispatches are designated 6B, 7B, 8B, and 9B in this report. Appendix D contains a list of the on-line generation for dispatch 6B, and the differences in dispatches 7B, 8B, and 9B as compared for dispatch 6B. Significant changes to dispatch for the four cases were restricted to New England generation.
A one-line diagram showing power flows and voltages on the “East Shore 27-OH/UG” (and Bethel to Norwalk) transmission for each of the four base cases is included in Appendix B.
2.2. Contingency File A contingency file provided was modified as appropriate for this study, including those contingencies required to model the Kleen Energy project on the Scovill Rock to Manchester 345 kV line, and is contained in Appendix C.
• Loss of multiple 345 kV underground cables on the “East Shore 27-OH/UG” configuration between Orange and East Shore, or loss of parallel cables between Devon and Norwalk, is not considered. (Simultaneous loss of one cable from Devon to Singer and Singer to Norwalk is included as a contingency).
• For loss of the Orange to East Devon 345 kV overhead line, all three 345 kV underground cables from Orange to East Shore were opened.
PowerGEM Report 10021.001-2, Jan. 28, 2004 6

SWCT Transmission Expansion: East Shore to Norwalk 345 kV OH/UG Alternative Transmission Loading and Voltage Analysis, New Haven Harbor Station Off-Line, NE-NY 0 MW
3. Methodology and Results Files
This section describes the technical approach to the study, performance criteria, solution assumptions, and the format of the results.
3.1. Software Set up of the power flow base cases used PTI’s PSS/E software (Rev. 28). Base case and contingency analysis was conducted using PTI’s MUST software (Rev. 5). Results from the MUST program are stored in Excel spreadsheets.
3.2. Performance Criteria The criteria for checking overload and voltage performance were as follows:
• Buses and transmission branches in Connecticut 115 kV and above were monitored.
• For base case loading performance, transmission lines and transformers were checked against 100% of their normal ratings.
• For post-contingency loading performance, overloads of transmission lines and transformers were checked against 100% of the long-time emergency ratings.
• Buses 230 kV and above were checked for voltages less than 95% and greater than 105%. Buses in the 115 kV system were checked for voltages less than 90% and more than 105%.
3.3. Solution Options For the analysis, tap-changing transformer and phase-shifting transformer adjustments were held fixed. For contingencies involving loss of generation/load the imbalance was made up by the system swing generator located outside New England.
PowerGEM Report 10021.001-2, Jan. 28, 2004 7

SWCT Transmission Expansion: East Shore to Norwalk 345 kV OH/UG Alternative Transmission Loading and Voltage Analysis, New Haven Harbor Station Off-Line, NE-NY 0 MW
4. Results
The results of the analysis for transmission system loading and voltage violations are provided below.
4.1. Overload Results A summary of the overload results is shown in Table 1. The values shown are the percentage overload over the long-time emergency rating. If a table entry is blank, there is no overload. More detailed results are provided in Appendix E.
Any transmission line or transformer in the study area at 115 kV or above that experiences a post-contingency overload in this study is listed in the first column of Table 1. The remaining four columns, one for each of the four Connecticut generation dispatches studied, show the maximum overload of the branch in % (considering all contingencies) for each dispatch. The overloads are color-coded as indicated at the top of the table in order to make the relative severity of the overloads more apparent. If a Table 1 entry is blank, then the branch is not overloaded for that dispatch. To find more detail, for example which contingency causes the overload, and whether other contingencies could overload the branch, the reader should refer to Appendix E.
As shown in Table 1, three 345 kV transmission lines are overloaded following contingencies. Loading on the 387 line for base case conditions is summarized in the following table. One-lines showing the flows on this line for each case are in Appendix B.
Generation Dispatch ID 387 Line Base Case Loading
(% of normal rating) 6B 117% 7B 88% 8B 72% 9B 115%
A 345/115 kV autotransformer at Southington also overloads in the range of 12% to 27%. The contingency causing the overload is a stuck breaker contingency at Southington (see Appendix E).
Finally, there are twenty four 115 kV line overloads that vary widely from slight overloads to severe overloads. Some overloads are sensitive to generation dispatch, while others are not. Three branches are overloaded in the base case, as indicated by the shaded branch names. The base case overloads are in the 3% - 25% range. Details are provided in Appendix E.
PowerGEM Report 10021.001-2, Jan. 28, 2004 8

SWCT Transmission Expansion: East Shore to Norwalk 345 kV OH/UG Alternative Transmission Loading and Voltage Analysis, New Haven Harbor Station Off-Line, NE-NY 0 MW
OverLoad >= 30%10% < Over Load < 30%5% < Over Load < 10%OverLoad < 5%
From bus To bus CKT 6B 7B 8B 9B73104 FRSTBDGE 345 73106 SOUTHGTN 345 1 4.1 6.0
73106 SOUTHGTN 345 73122 MERID362 345 1 4.6 5.5
73106 SOUTHGTN 345 73154 SGTN B 115 2 24.8 15.9 11.7 26.8
73107 SCOVL RK 345 73663 E.SHORE 345 1 24.5 23.7
73162 WATERSDE 115 73163 COS COB 115 1 24.8 24.8 24.8 24.8
73162 WATERSDE 115 73168 GLNBROOK 115 1 2.5 2.5 2.5 2.5
73164 BALDWNJA 115 73202 FROST BR 115 1 7.1 2.3
73167 SO.END 115 73294 GLNBRK J 115 1 23.2 23.2 23.2 23.2
73168 GLNBROOK 115 73169 RYTN J A 115 1 2.9
73168 GLNBROOK 115 73237 ELYAVE 115 1 51.4 54.3
73168 GLNBROOK 115 73271 RYTN J B 115 1 21.1 17.4 39.5 48.2
73169 RYTN J A 115 73171 NWLK HAR 115 1 44.2 44.0
73169 RYTN J A 115 73172 NORWALK 115 1 83.8 78.3
73170 PLUMTREE 115 73176 TRIANGLE 115 1 88.7 76.6 73.8 85.6
73170 PLUMTREE 115 73176 TRIANGLE 115 2 35.3 35.2 34.9 35.1
73170 PLUMTREE 115 73268 MIDDLRIV 115 1 187.9 184.1 183.3 187.3
73171 NWLK HAR 115 73237 ELYAVE 115 1 51.4 59.7
73171 NWLK HAR 115 73271 RYTN J B 115 1 4.3 4.5
73172 NORWALK 115 73207 FLAX HIL 115 1 98.2 92.7
73183 SHAWSHIL 115 73185 BUNKER H 115 1 11.8 11.9
73188 BCNFL PF 115 73192 DRBY J B 115 1 31.3 28.1 27.0 33.5
73196 GLEN JCT 115 73198 SOUTHGTN 115 1 20.1 20.0
73198 SOUTHGTN 115 73631 WLNGF PF 115 1 2.1 1.2
73207 FLAX HIL 115 73271 RYTN J B 115 1 80.9 75.3
73230 HADDAM 115 73231 BOKUM 115 1 23.4 23.4
73230 HADDAM 115 73231 BOKUM 115 2 7.3 7.2
73268 MIDDLRIV 115 73176 TRIANGLE 115 1 126.4 123.0 122.3 126.0
73701 CRRA JCT 115 73703 ASHCREEK 115 1 0.3
Indicates branch also overloaded in base case
Table 1Highest Overload: 27.7 GW NE Load, Dispatches 6B, 7B, 8B and 9B
Generation Dispatch ID
PowerGEM Report 10021.001-2, Jan. 28, 2004 9

SWCT Transmission Expansion: East Shore to Norwalk 345 kV OH/UG Alternative Transmission Loading and Voltage Analysis, New Haven Harbor Station Off-Line, NE-NY 0 MW
4.2. Voltage Violation Results A summary of the most severe low voltage violations is provided in the Table 2 (following pages). More detailed results on the voltage analysis are provided in Appendix F. Since violations of high voltage limits were minor, they are not included in the table below but are included in Appendix F.
Table 2 shows the bus number, bus name, and base kV, as well as area and zone numbers in the load flow data base. The “# Viols” column is the total number of violations for this bus and dispatch condition. If “# Viols” equals one, then the indicated contingency is the only one causing a violation. If “# Viols” exceeds one, then other contingencies also cause a voltage violation, but none are more severe than the indicated contingency. (Appendix F could be used to assess the comparative severity of multiple contingencies causing a voltage violation for a particular bus.)
The value in the “Worst Lo Vio” column indicates the amount, in per-unit, that the bus voltage is below the low voltage criteria. The contingency and dispatch for which this occurs is also indicated. More detailed information on the results of the voltage analysis may be found in Appendix F, including explanations on interpreting values in the tables.
There are a number of 345 kV and 115 kV system voltage violations within western Connecticut. The most significant violations are all for dispatch 6B, and all are for the contingency (SCOVRK8TSTK) which trips the Scovill Rock to Haddam Neck 345 kV line, and the Scovill Rock to East Shore 345 kV line, including the Cross Sound Cable to Long Island (see Appendix F).
PowerGEM Report 10021.001-2, Jan. 28, 2004 10
SWCT Transmission Expansion: East Shore to Norwalk 345 kV OH/UG Alternative Transmission Loading and Voltage Analysis, New Haven Harbor Station Off-Line, NE-NY 0 MW
Lo Violation > 3%1% < Lo Violation < 3%
Worst violation for each violation shaded 0.5%< Lo Violation < 1%Sorted by bus, then low violation, then high violation Lo Violation < 0.5%
Bus # Bus Name KV Area Zone#
ViolsWorstLo
VioNcon Lo
Cont Name Worst Lo Dispatch Controls
73160 BALDWINB 115.0 701 171 2 0.045 248 1272-1721DCT 9B FIX
73160 BALDWINB 115.0 701 171 1 0.029 248 1272-1721DCT 6B FIX
73160 BALDWINB 115.0 701 171 1 0.016 248 1272-1721DCT 7B FIX
73160 BALDWINB 115.0 701 171 1 0.016 248 1272-1721DCT 8B FIX
73188 BCNFL PF 115.0 701 171 1 0.015 248 1272-1721DCT 9B FIX
73188 BCNFL PF 115.0 701 171 2 0.001 460 SCOVRK8TSTK 6B FIX
73231 BOKUM 115.0 701 171 3 0.002 247 1261-1620DCT 9B FIX
73153 BRANFORD 115.0 701 171 1 0.000 460 SCOVRK8TSTK 6B FIX
73185 BUNKER H 115.0 701 171 2 0.044 248 1272-1721DCT 9B FIX
73185 BUNKER H 115.0 701 171 1 0.029 248 1272-1721DCT 6B FIX
73185 BUNKER H 115.0 701 171 1 0.016 248 1272-1721DCT 7B FIX
73185 BUNKER H 115.0 701 171 1 0.016 248 1272-1721DCT 8B FIX
73697 CONGRESS 115.0 701 185 1 0.018 401 PEQUON42TSTK 9B FIX
73297 DEVON 345.0 701 171 1 0.014 460 SCOVRK8TSTK 6B FIX
73663 E.SHORE 345.0 701 185 1 0.022 460 SCOVRK8TSTK 6B FIX
73663 E.SHORE 345.0 701 185 1 0.001 460 SCOVRK8TSTK 9B FIX
73682 ELMWST A 115.0 701 185 3 0.034 376 GRNDAV6TSTK 9B FIX
73682 ELMWST A 115.0 701 185 3 0.025 377 GRNDAV7TSTK 6B FIX
73683 ELMWST B 115.0 701 185 3 0.036 375 GRNDAV5TSTK 9B FIX
73683 ELMWST B 115.0 701 185 3 0.027 374 GRNDAV4TSTK 6B FIX
73683 ELMWST B 115.0 701 185 2 0.001 441 WRIVER2TSTK 7B FIX
73189 FREIGHT 115.0 701 171 1 0.046 248 1272-1721DCT 9B FIX
73189 FREIGHT 115.0 701 171 1 0.031 248 1272-1721DCT 6B FIX
73189 FREIGHT 115.0 701 171 1 0.018 248 1272-1721DCT 7B FIX
73189 FREIGHT 115.0 701 171 1 0.017 248 1272-1721DCT 8B FIX
73104 FRSTBDGE 345.0 701 171 1 0.002 460 SCOVRK8TSTK 6B FIX
73265 GREEN HL 115.0 701 171 1 0.019 460 SCOVRK8TSTK 6B FIX
73265 GREEN HL 115.0 701 171 1 0.003 460 SCOVRK8TSTK 9B FIX
73707 JUNE ST 115.0 701 185 1 0.006 460 SCOVRK8TSTK 6B FIX
73105 LONG MTN 345.0 701 171 1 0.006 460 SCOVRK8TSTK 6B FIX
73675 MIX AVE 115.0 701 185 1 0.015 460 SCOVRK8TSTK 6B FIX
73293 NORWALK 345.0 701 171 1 0.013 460 SCOVRK8TSTK 6B FIX
73371 ORANGE 345.0 701 185 1 0.021 460 SCOVRK8TSTK 6B FIX
73115 PLUMTREE 345.0 701 171 1 0.018 460 SCOVRK8TSTK 6B FIX
73673 SACKPHS 115.0 701 185 1 0.014 460 SCOVRK8TSTK 6B FIX
73301 SINGER 345.0 701 186 1 0.013 460 SCOVRK8TSTK 6B FIX
73199 SO.NAUG 115.0 701 171 1 0.014 248 1272-1721DCT 9B FIX
27.7 GW NE Load, Dispatches 6B, 7B, 8B and 9BLow Voltage Violations, Worst & Total
Table 2
PowerGEM Report 10021.001-2, Jan. 28, 2004 11

SWCT Transmission Expansion: East Shore to Norwalk 345 kV OH/UG Alternative Transmission Loading and Voltage Analysis, New Haven Harbor Station Off-Line, NE-NY 0 MW
4.3. Comparison of Results with New Haven Harbor Station On-Line
4.3.1. Loading Violations Table 3 compares the worst overloads for the four SWCT generation dispatches with New Haven Harbor on-line and off-line (displaced by Kleen Energy).
Some points of interest regarding the effect of New Haven Harbor generation follow:
• Two additional overloads of 345 kV transmission lines occur for dispatches 6B and 9B that are not overloaded in the cases with New Haven Harbor on-line. The new overloads are Frost Bridge to Southington 345 kV line and Southington to Meriden 345 kV line. Though not indicated in the table, these overloads occur following loss of the East Shore to Scovill Rock 345 kV line (387 line) and the 1460-387 DCT (double circuit) contingency (see Appendix E).
• Four additional overloads of 115kV transmission lines occur for generation dispatches 6B and 9B that do not occur in the cases with New Haven Harbor on-line.
PowerGEM Report 10021.001-2, Jan. 28, 2004 12

SWCT Transmission Expansion: East Shore to Norwalk 345 kV OH/UG Alternative Transmission Loading and Voltage Analysis, New Haven Harbor Station Off-Line, NE-NY 0 MW
OverLoad >= 30%10% < Over Load < 30%5% < Over Load < 10%OverLoad < 5%
From bus To bus CKT 2B 3B 4B 5B 6B 7B 8B 9B73104 FRSTBDGE 345 73106 SOUTHGTN 345 1 4.1 6.0
73106 SOUTHGTN 345 73122 MERID362 345 1 4.6 5.5
73106 SOUTHGTN 345 73154 SGTN B 115 2 19.4 10.8 6.7 21.1 24.8 15.9 11.7 26.8
73107 SCOVL RK 345 73663 E.SHORE 345 1 6.0 5.2 24.5 23.7
73162 WATERSDE 115 73163 COS COB 115 1 24.8 24.8 24.8 24.8 24.8 24.8 24.8 24.8
73162 WATERSDE 115 73168 GLNBROOK 115 1 2.5 2.5 2.5 2.5 2.5 2.5 2.5 2.5
73164 BALDWNJA 115 73202 FROST BR 115 1 7.1 2.3
73167 SO.END 115 73294 GLNBRK J 115 1 23.2 23.2 23.2 23.2 23.2 23.2 23.2 23.2
73168 GLNBROOK 115 73169 RYTN J A 115 1 1.8 2.9
73168 GLNBROOK 115 73237 ELYAVE 115 1 51.0 53.9 51.4 54.3
73168 GLNBROOK 115 73271 RYTN J B 115 1 19.2 15.8 38.1 46.5 21.1 17.4 39.5 48.2
73169 RYTN J A 115 73171 NWLK HAR 115 1 44.4 44.3 44.2 44.0
73169 RYTN J A 115 73172 NORWALK 115 1 80.8 75.2 83.8 78.3
73170 PLUMTREE 115 73176 TRIANGLE 115 1 77.4 74.7 72.9 75.5 88.7 76.6 73.8 85.6
73170 PLUMTREE 115 73176 TRIANGLE 115 2 35.2 34.9 34.7 34.9 35.3 35.2 34.9 35.1
73170 PLUMTREE 115 73268 MIDDLRIV 115 1 184.3 183.5 183.0 183.6 187.9 184.1 183.3 187.3
73171 NWLK HAR 115 73237 ELYAVE 115 1 50.2 58.4 51.4 59.7
73171 NWLK HAR 115 73271 RYTN J B 115 1 4.3 4.3 4.3 4.5
73172 NORWALK 115 73207 FLAX HIL 115 1 95.3 89.7 98.2 92.7
73183 SHAWSHIL 115 73185 BUNKER H 115 1 4.2 4.3 11.8 11.9
73188 BCNFL PF 115 73192 DRBY J B 115 1 29.9 27.6 26.5 32.1 31.3 28.1 27.0 33.5
73196 GLEN JCT 115 73198 SOUTHGTN 115 1 20.1 20.0
73198 SOUTHGTN 115 73631 WLNGF PF 115 1 2.1 1.2
73207 FLAX HIL 115 73271 RYTN J B 115 1 77.9 72.2 80.9 75.3
73224 TRMB J A 115 73700 PEQUONIC 115 1 1.7
73230 HADDAM 115 73231 BOKUM 115 1 9.3 9.2 23.4 23.4
73230 HADDAM 115 73231 BOKUM 115 2 7.3 7.2
73268 MIDDLRIV 115 73176 TRIANGLE 115 1 123.2 122.6 122.1 122.7 126.4 123.0 122.3 126.0
73669 GRAND AV 115 73681 WEST RIV 115 1 1.7
73669 GRAND AV 115 73681 WEST RIV 115 2 1.7
73701 CRRA JCT 115 73703 ASHCREEK 115 1 0.3 0.3
New Haven Harbor On
Table 3Highest Overload: 27.7 GW NE Load, Dispatches 2B through 9B
New Haven Harbor OffGeneration Dispatch ID
4.3.2. Voltage Violations A primary effect of the generation at New Haven Harbor Station being off-line was to cause widespread voltage violations at Connecticut 345 kV and 115 kV substations for the SCOVRK8TSTK contingency for the 6B generation dispatch. This contingency, which causes the loss of Scovill Rock - Haddam 345 kV line, Scovill Rock – East Shore 345 kV line, including the Cross Sound Cable, did not cause voltage violations when New Haven Harbor Station was on-line.
PowerGEM Report 10021.001-2, Jan. 28, 2004 13

SWCT Transmission Expansion: East Shore to Norwalk 345 kV OH/UG Alternative Transmission Loading and Voltage Analysis, New Haven Harbor Station Off-Line, NE-NY 0 MW
In addition, having New Haven Harbor off-line generally worsened voltage violations that also occurred when it was on-line.
PowerGEM Report 10021.001-2, Jan. 28, 2004 14

SWCT Transmission Expansion: East Shore to Norwalk 345 kV OH/UG Alternative Transmission Loading and Voltage Analysis, New Haven Harbor Station Off-Line, NE-NY 0 MW
PowerGEM Report 10021.001-2, Jan. 28, 2004 15
5. References
1. Southwest Connecticut Transmission Expansion, East Shore to Norwalk 345 KV OH/UG Alternative: Transmission Loading and Voltage Analysis @ 27.7 GW Load, New Haven Harbor Station On-Line, NE-NY 0 MW, PowerGEM Report 10021.001-1 Revised, dated January 28, 2004.
2. Southwest Connecticut Transmission Expansion, East Shore to Norwalk 345 KV OH/UG Alternative: Transmission Loading and Voltage Analysis @ 27.7 GW Load, 387 Line Re-conductored, New Haven Harbor Station Off-Line, NE-NY 0 MW, PowerGEM Report 10021.001-4 dated January 28, 2004
3. Southwest Connecticut Transmission Expansion, East Shore to Norwalk 345 KV OH/UG Alternative: Transmission Loading and Voltage Analysis @ 27.7 GW Load, 387 Line Re-conductored, New Haven Harbor Station On-Line, NE-NY 0 MW, PowerGEM Report 10021.001-3 dated January 28, 2004


PowerGEM
Power Grid Engineering & Markets
Southwest Connecticut Transmission Expansion East Shore to Norwalk 345 KV OH/UG Alternative : Transmission Loading and Voltage Analysis @ 27.7 GW Load. 387 Line Reconductored, New Haven Harbor Station On-Line, NE-NY 0 MW
Prepared for:
The United Illuminating Company
and
Northeast Utilities
Prepared by:
Johnny R. Willis PowerGEM [email protected]
PowerGEM Report 10021.001-3 January 28, 2004
P. O. Box 9049, Niskayuna, NY 12309 www.power-gem.com

EXECUTIVE SUMMARY .......................................................................................................................... 2 1. INTRODUCTION ................................................................................................................................ 4 2. DATABASE .......................................................................................................................................... 6
2.1. POWER FLOW BASE CASES ............................................................................................................. 6 2.2. CONTINGENCY FILE......................................................................................................................... 7
3. METHODOLOGY AND RESULTS FILES...................................................................................... 8 3.1. SOFTWARE ...................................................................................................................................... 8 3.2. PERFORMANCE CRITERIA ................................................................................................................ 8 3.3. SOLUTION OPTIONS......................................................................................................................... 8
4. RESULTS.............................................................................................................................................. 9 4.1. OVERLOAD RESULTS....................................................................................................................... 9 4.2. VOLTAGE VIOLATION RESULTS .................................................................................................... 10
5. REFERENCES ................................................................................................................................... 12
2

SWCT Transmission Expansion: East Shore to Norwalk 345 kV OH/UG Alternative Transmission Loading and Voltage Analysis, Line 387 Reconductored, NHHS On, NE-NY 0 MW
Executive Summary
This report summarizes power flow analysis conducted for The United Illuminating Company (UI) and Northeast Utilities (NU) for one option for expanding the New England 345 kV transmission system into southwest Connecticut (SWCT). The transmission option examined, called “East Shore 27-OH/UG” in this report, is for a 345 kV transmission path from East Shore to Norwalk substations, with interconnecting substations between these stations.1 The “East Shore 27-OH/UG” transmission option, which consists primarily of underground cables with one section of overhead line, is described as follows:
From To Distance Transmission East Shore Orange (cable to
overhead line transition station)
7 miles 345 kV underground, 2500 kcmil HPFF, three parallel cables
Orange (cable to overhead line transition station)
East Devon 9.4 miles 345 kV overhead bundled 1590 ACSR conductor, single circuit
East Devon Singer 8 miles 345 kV underground, 2500 kcmil HPFF, two parallel cables
Singer Norwalk 15 miles 345 kV underground, 2500 kcmil HPFF, two parallel cables
In addition to the above transmission alternative, the study assumes re-conductoring of the limiting portion of the East Shore to Scovill Rock 345 kV line (387 line) from a single 2156 ACSR conductor to a bundled 2 x 954 ACSR conductor. This raises the normal rating of the line from 1240 MVA to 1488 MVA, and the long-time emergency rating from 1604 MVA to 1912 MVA. It also results in a reduction in the impedance of the line of about 9%.
The objective of this study is to analyze and document the performance of this transmission configuration for steady-state base case and post-contingency transmission power flows and voltages. Power flow analysis was conducted for a 27.7 GW New England load level for four southwest Connecticut generation dispatches. In all cases, the New Haven Harbor Station, which has a significant impact on the flows on the 387 line, was in service. Loading and voltage performance of the Connecticut system was monitored for the 115 kV and 345 kV transmission systems.
The loading analysis found that twenty-three 115 kV transmission lines, and one 345/115 kV autotransformer at Southington, exhibited post-contingency overloads.
1 A planned 345 kV transmission expansion from the Plumtree to Norwalk substations, which is called Bethel to Norwalk, is assumed to be in-service in this analysis.
PowerGEM Report 10021.001-3, January 28, 2004 2

SWCT Transmission Expansion: East Shore to Norwalk 345 kV OH/UG Alternative Transmission Loading and Voltage Analysis, Line 387 Reconductored, NHHS On, NE-NY 0 MW
Three of the overloaded 115 kV lines were also overloaded in the base case (all lines in) for some generation dispatches.
Voltage analysis indicated violations of voltage criteria for nine Connecticut 115 kV substations. There were no voltage violations for 345 kV substations.
PowerGEM Report 10021.001-3, Jan. 28, 2004 3

SWCT Transmission Expansion: East Shore to Norwalk 345 kV OH/UG Alternative Transmission Loading and Voltage Analysis, Line 387 Reconductored, NHHS On, NE-NY 0 MW
1. Introduction
This report summarizes power flow analysis conducted for The United Illuminating Company (UI) and Northeast Utilities (NU) for one option for expanding the New England 345 kV transmission system into southwest Connecticut (SWCT). The transmission option examined, called “East Shore 27-OH/UG” in this report, is for a 345 kV transmission path from East Shore to Norwalk substations, with interconnecting substations between these stations.2 The “East Shore 27-OH/UG” transmission option, which consists primarily of underground cables with one section of overhead line, is described as follows:
From To Distance Transmission East Shore Orange (cable to
overhead line transition station)
7 miles 345 kV underground, 2500 kcmil HPFF, three parallel cables
Orange (cable to overhead line transition station)
East Devon 9.4 miles 345 kV overhead bundled 1590 ACSR conductor, single circuit
East Devon Singer 8 miles 345 kV underground, 2500 kcmil HPFF, two parallel cables
Singer Norwalk 15 miles 345 kV underground, 2500 kcmil HPFF, two parallel cables
In addition to the above transmission alternative, the study assumes re-conductoring of the limiting portion of the East Shore to Scovill Rock 345 kV line (387 line) from a single 2156 ACSR conductor to a bundled 2 x 954 ACSR conductor. This raises the normal rating of the line from 1240 MVA to 1488 MVA, and the long-time emergency rating from 1604 MVA to 1912 MVA. It also results in a reduction in the impedance of the line of about 9%.
The objective of this study is to analyze and document the performance of this transmission configuration for steady-state base case and post-contingency transmission power flows and voltages. Performance, is examined for a 27.7 GW New England load level and for four dispatches of New England generation. In all cases, the New Haven Harbor Station (447 MW), which has a significant impact on the flows on the 387 line, was in service. References 1 thru 3 are companion reports for other system conditions studied.
The following Appendices are included in this report: Appendix A “East Shore 27-OH/UG” Transmission Modeling Data Appendix B Power Flow Base Case One-Line Diagrams
2 A planned 345 kV transmission expansion from Plumtree to Norwalk substations, which is called Bethel to Norwalk, is assumed to be in-service in this analysis.
PowerGEM Report 10021.001-3, January 28, 2004 4

SWCT Transmission Expansion: East Shore to Norwalk 345 kV OH/UG Alternative Transmission Loading and Voltage Analysis, Line 387 Reconductored, NHHS On, NE-NY 0 MW
Appendix C Contingency File Appendix D Generation Dispatches Appendix E Summary of Overloads Appendix F Summary of Voltage Violations
PowerGEM Report 10021.001-3, Jan. 28, 2004 5

SWCT Transmission Expansion: East Shore to Norwalk 345 kV OH/UG Alternative Transmission Loading and Voltage Analysis, Line 387 Reconductored, NHHS On, NE-NY 0 MW
2. Database
This section discusses the data developed and used in the study.
2.1. Power Flow Base Cases Four power flow base cases, which included the approved Bethel to Norwalk 345-kV project in service, were utilized. PowerGEM revised each of the four cases to add the “East Shore 27-OH/UG” transmission project. Details regarding the modeling of these circuits are provided in Appendix A. In addition to this, the rating of the East Shore to Scovill Rock 345 kV line was increased to reflect the line rating by reconfiguring the East Shore Substation and removing the 345/115 kV autotransformers from the 387 line path. The line ratings used were 1240 MVA normal and 1604 MVA long-time emergency.
Details regarding the modeling of these circuits are provided in Appendix A.
Further, the impedance and ratings of the East Shore to Scovill Rock 345 kV line (387 line) were revised to reflect re-conductoring. The existing line has a portion with a single 2156 ACSR conductor (Black Pond Junction to Scovill Rock Switching station) and a portion with 2x 954 bundled ACSR conductor (Black Pond Junction to East Shore Substation). The data used in this analysis for re-conductoring assumed that the 2156 ACSR conductor is replaced by 2 x 954 conductor ACSR. The data is given below.
.
East Shore to Scovill Rock 345 kV Line Modeling Data
Impedances (p.u) Ratings MVA
R X B Normal LTE STE
Existing Line 0.00137 0.01767 0.26688 1240 1604 1966
Re-conductored Line 0.00136 0.01618 0.28561 1488 1912 2098
The re-conductoring results in about a 9% decrease in the line impedance, and about a 20% increase in the line loading capability.
Each of the four base cases had different generation dispatches, and are denoted dispatches 2C, 3C, 4C, and 5C. These dispatches were preserved for the base cases. Appendix D contains a list of the on-line generation for dispatch 2C, and the differences in dispatches 3C, 4C, and 5C as compared for dispatch 2C. Significant changes to dispatch for the four cases were restricted to New England generation.
A one-line diagram showing power flows and voltages on the “East Shore 27-OH/UG” (and Bethel to Norwalk) transmission for each of the four base cases is included in Appendix B.
PowerGEM Report 10021.001-3, January 28, 2004 6

SWCT Transmission Expansion: East Shore to Norwalk 345 kV OH/UG Alternative Transmission Loading and Voltage Analysis, Line 387 Reconductored, NHHS On, NE-NY 0 MW
2.2. Contingency File A contingency file was modified as appropriate for this study, and is contained in Appendix C. There are several assumptions in the contingencies, including:
• Loss of multiple 345 kV underground cables on the “East Shore 27-OH/UG” configuration between Orange and East Shore, or loss of parallel cables between Devon and Norwalk, is not considered. (Simultaneous loss of one cable from Devon to Singer and Singer to Norwalk is included as a contingency).
• For loss of the Orange to East Devon 345 kV overhead line, all three 345 kV underground cables from Orange to East Shore were opened.
PowerGEM Report 10021.001-3, Jan. 28, 2004 7

SWCT Transmission Expansion: East Shore to Norwalk 345 kV OH/UG Alternative Transmission Loading and Voltage Analysis, Line 387 Reconductored, NHHS On, NE-NY 0 MW
3. Methodology and Results Files
This section describes the technical approach to the study, performance criteria, solution assumptions, and the format of the results.
3.1. Software Set up of the power flow base cases used PTI’s PSS/E software (Rev. 28). Base case and contingency analysis was conducted using PTI’s MUST software (Rev. 5). Results from the MUST program are stored in Excel spreadsheets.
3.2. Performance Criteria The criteria for checking overload and voltage performance were as follows:
• Buses and transmission branches in Connecticut 115 kV and above were monitored.
• For base case loading performance, transmission lines and transformers were checked against 100% of their normal ratings.
• For post-contingency loading performance, overloads of transmission lines and transformers were checked against 100% of the long-time emergency ratings.
• Buses 230 kV and above were checked for voltages less than 95% and greater than 105%. Buses in the 115 kV system were checked for voltages less than 90% and more than 105%.
3.3. Solution Options For the analysis, tap-changing transformer and phase-shifting transformer adjustments were held fixed. For contingencies involving loss of generation/load the imbalance was made up by the system swing generator located outside New England.
PowerGEM Report 10021.001-3, January 28, 2004 8
SWCT Transmission Expansion: East Shore to Norwalk 345 kV OH/UG Alternative Transmission Loading and Voltage Analysis, Line 387 Reconductored, NHHS On, NE-NY 0 MW
4. Results
The results of the analysis for transmission system loading and voltage violations are provided below.
4.1. Overload Results A summary of the overload results is shown in Table 1. The values shown are the percentage overload over the long-time emergency rating. If a table entry is blank, there is no overload. More detailed results are provided in Appendix E.
OverLoad >= 30%10% < Over Load < 30%5% < Over Load < 10%OverLoad < 5%
From bus To bus CKT 2C 3C 4C 5C73106 SOUTHGTN 345 73154 SGTN B 115 2 17.8 9.6 5.7 19.4
73162 WATERSDE 115 73163 COS COB 115 1 24.8 24.8 24.8 24.8
73162 WATERSDE 115 73168 GLNBROOK 115 1 2.5 2.5 2.5 2.5
73167 SO.END 115 73294 GLNBRK J 115 1 23.2 23.2 23.2 23.2
73168 GLNBROOK 115 73169 RYTN J A 115 1 1.6
73168 GLNBROOK 115 73237 ELYAVE 115 1 50.8 53.5
73168 GLNBROOK 115 73271 RYTN J B 115 1 19.2 15.8 38.1 46.5
73169 RYTN J A 115 73171 NWLK HAR 115 1 43.8 43.1
73169 RYTN J A 115 73172 NORWALK 115 1 81.8 75.8
73170 PLUMTREE 115 73176 TRIANGLE 115 1 77.2 74.9 72.8 75.3
73170 PLUMTREE 115 73176 TRIANGLE 115 2 35.1 34.9 34.7 34.8
73170 PLUMTREE 115 73268 MIDDLRIV 115 1 184.2 183.5 183.0 183.5
73171 NWLK HAR 115 73237 ELYAVE 115 1 49.6 57.4
73171 NWLK HAR 115 73271 RYTN J B 115 1 4.3 4.3
73172 NORWALK 115 73207 FLAX HIL 115 1 96.2 90.3
73183 SHAWSHIL 115 73185 BUNKER H 115 1 2.9 3.1
73188 BCNFL PF 115 73192 DRBY J B 115 1 29.8 27.5 26.5 32.0
73207 FLAX HIL 115 73271 RYTN J B 115 1 78.8 72.8
73224 TRMB J A 115 73700 PEQUONIC 115 1 2.3
73230 HADDAM 115 73231 BOKUM 115 1 7.7 7.6
73268 MIDDLRIV 115 73176 TRIANGLE 115 1 123.1 122.6 122.1 122.6
73669 GRAND AV 115 73681 WEST RIV 115 1 2.7
73669 GRAND AV 115 73681 WEST RIV 115 2 2.7
73701 CRRA JCT 115 73703 ASHCREEK 115 1 0.3 0.6
Indicates branch also overloaded in base case
Table 1Highest Overload: 27.7 GW NE Load, Dispatches 2C, 3C, 4C and 5C
Generation Dispatch ID
PowerGEM Report 10021.001-3, Jan. 28, 2004 9

SWCT Transmission Expansion: East Shore to Norwalk 345 kV OH/UG Alternative Transmission Loading and Voltage Analysis, Line 387 Reconductored, NHHS On, NE-NY 0 MW
Any transmission line or transformer in the study area at 115 kV or above that experiences a post-contingency overload in this study is listed in the first column of Table 1. The remaining four columns, one for each of the four Connecticut generation dispatches studied, show the maximum overload of the branch in % (considering all contingencies) for each dispatch. The overloads are color-coded as indicated at the top of the table in order to make the relative severity of the overloads more apparent. If a Table 1 entry is blank, then the branch is not overloaded for that dispatch. To find more detail, for example which contingency causes the overload, and whether other contingencies could overload the branch, the reader should refer to Appendix E.
As indicated in Table 1, there are no 345 kV transmission line overloads. Base case loadings for the 387 line were as follows:
Generation Dispatch ID 387 Line Base Case Loading
(% of normal rating) 2C 84% 3C 59% 4C 46% 5C 82%
A 345/115 kV autotransformer at Southington overloads by about 20%. The contingency causing the overload is a stuck breaker contingency at Southington.
Finally, there are twenty-three 115 kV line overloads that vary widely from slight overloads to severe overloads. Some overloads are sensitive to generation dispatch, while others are not. Three branches are overloaded in the base case, as indicated by the shaded branch names. The base case overloads range from very slight to about 20%. More detail is given in Appendix F.
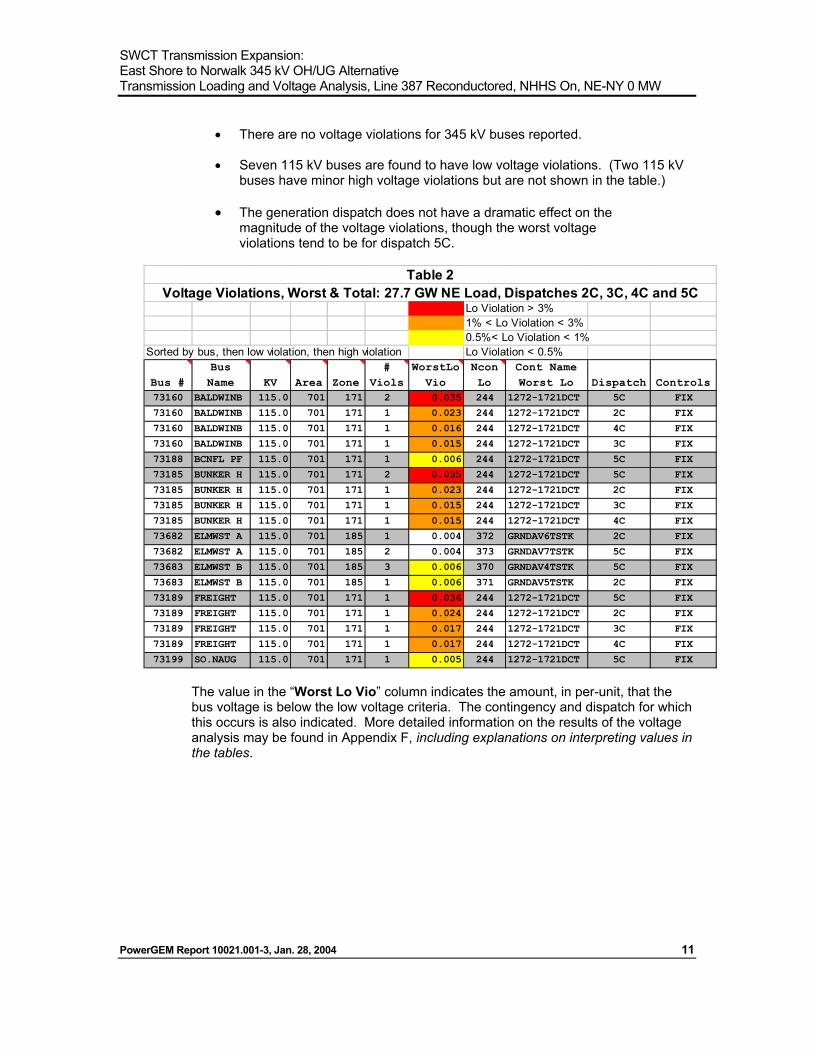
4.2. Voltage Violation Results A summary of the most severe low voltage violations is provided in Table 2 (following page). More detailed results on the voltage analysis are provided in Appendix F. Since violations of high voltage limits were minor, they are not included in the table below but are included in Appendix F.
The table shows the bus number, bus name, and base kV, as well as area and zone numbers in the load flow data base. The “# Viols” column is the total number of violations for this bus and dispatch condition. If “# Viols” equals one, then the indicated contingency is the only one causing a violation. If “# Viols” exceeds one, then other contingencies also cause a voltage violation, but none are more severe than the indicated contingency. (Appendix F could be used to assess the comparative severity of multiple contingencies causing a voltage violation for a particular bus.)
Some observations on the results from of Table 2 are as follows:
PowerGEM Report 10021.001-3, January 28, 2004 10
SWCT Transmission Expansion: East Shore to Norwalk 345 kV OH/UG Alternative Transmission Loading and Voltage Analysis, Line 387 Reconductored, NHHS On, NE-NY 0 MW
• There are no voltage violations for 345 kV buses reported.
• Seven 115 kV buses are found to have low voltage violations. (Two 115 kV buses have minor high voltage violations but are not shown in the table.)
• The generation dispatch does not have a dramatic effect on the magnitude of the voltage violations, though the worst voltage violations tend to be for dispatch 5C.
Lo Violation > 3%1% < Lo Violation < 3%0.5%< Lo Violation < 1%
Sorted by bus, then low violation, then high violation Lo Violation < 0.5%
Bus #Bus Name KV Area Zone
# Viols
WorstLoVio
Ncon Lo
Cont Name Worst Lo Dispatch Controls
73160 BALDWINB 115.0 701 171 2 0.035 244 1272-1721DCT 5C FIX
73160 BALDWINB 115.0 701 171 1 0.023 244 1272-1721DCT 2C FIX
73160 BALDWINB 115.0 701 171 1 0.016 244 1272-1721DCT 4C FIX
73160 BALDWINB 115.0 701 171 1 0.015 244 1272-1721DCT 3C FIX
73188 BCNFL PF 115.0 701 171 1 0.006 244 1272-1721DCT 5C FIX
73185 BUNKER H 115.0 701 171 2 0.035 244 1272-1721DCT 5C FIX
73185 BUNKER H 115.0 701 171 1 0.023 244 1272-1721DCT 2C FIX
73185 BUNKER H 115.0 701 171 1 0.015 244 1272-1721DCT 3C FIX
73185 BUNKER H 115.0 701 171 1 0.015 244 1272-1721DCT 4C FIX
73682 ELMWST A 115.0 701 185 1 0.004 372 GRNDAV6TSTK 2C FIX
73682 ELMWST A 115.0 701 185 2 0.004 373 GRNDAV7TSTK 5C FIX
73683 ELMWST B 115.0 701 185 3 0.006 370 GRNDAV4TSTK 5C FIX
73683 ELMWST B 115.0 701 185 1 0.006 371 GRNDAV5TSTK 2C FIX
73189 FREIGHT 115.0 701 171 1 0.036 244 1272-1721DCT 5C FIX
73189 FREIGHT 115.0 701 171 1 0.024 244 1272-1721DCT 2C FIX
73189 FREIGHT 115.0 701 171 1 0.017 244 1272-1721DCT 3C FIX
73189 FREIGHT 115.0 701 171 1 0.017 244 1272-1721DCT 4C FIX
73199 SO.NAUG 115.0 701 171 1 0.005 244 1272-1721DCT 5C FIX
Voltage Violations, Worst & Total: 27.7 GW NE Load, Dispatches 2C, 3C, 4C and 5CTable 2
The value in the “Worst Lo Vio” column indicates the amount, in per-unit, that the bus voltage is below the low voltage criteria. The contingency and dispatch for which this occurs is also indicated. More detailed information on the results of the voltage analysis may be found in Appendix F, including explanations on interpreting values in the tables.
PowerGEM Report 10021.001-3, Jan. 28, 2004 11

SWCT Transmission Expansion: East Shore to Norwalk 345 kV OH/UG Alternative Transmission Loading and Voltage Analysis, Line 387 Reconductored, NHHS On, NE-NY 0 MW
PowerGEM Report 10021.001-3, January 28, 2004 12
5. References
1. Southwest Connecticut Transmission Expansion, East Shore to Norwalk 345 KV OH/UG Alternative: Transmission Loading and Voltage Analysis @ 27.7 GW Load, New Haven Harbor Station On-Line, NE-NY 0 MW, PowerGEM Report 10021.001-1 Revised, dated January 28, 2004.
2. Southwest Connecticut Transmission Expansion, East Shore to Norwalk 345 KV OH/UG Alternative: Transmission Loading and Voltage Analysis @ 27.7 GW Load, New Haven Harbor Station Off-Line, NE-NY 0 MW, PowerGEM Report 10021.001-2 dated January 28, 2004.
3. Southwest Connecticut Transmission Expansion, East Shore to Norwalk 345 KV OH/UG Alternative: Transmission Loading and Voltage Analysis @ 27.7 GW Load, 387 Line Re-conductored, New Haven Harbor Station Off-Line, NE-NY 0 MW, PowerGEM Report 10021.001-4 dated January 28, 2004.


PowerGEM
Power Grid Engineering & Markets
Southwest Connecticut Transmission Expansion East Shore to Norwalk 345 KV OH/UG Alternative : Transmission Loading and Voltage Analysis @ 27.7 GW Load. 387 Line Reconductored, New Haven Harbor Station Off-Line, NE-NY 0 MW
Prepared for:
The United Illuminating Company
and
Northeast Utilities
Prepared by:
Johnny R. Willis PowerGEM [email protected]
PowerGEM Report 10021.001-4 January 28, 2004
P. O. Box 9049, Niskayuna, NY 12309 www.power-gem.com

EXECUTIVE SUMMARY .......................................................................................................................... 2 1. INTRODUCTION ................................................................................................................................ 4 2. DATABASE .......................................................................................................................................... 6
2.1. POWER FLOW BASE CASES ............................................................................................................. 6 2.2. CONTINGENCY FILE......................................................................................................................... 6
3. METHODOLOGY AND RESULTS FILES...................................................................................... 8 3.1. SOFTWARE ...................................................................................................................................... 8 3.2. PERFORMANCE CRITERIA ................................................................................................................ 8 3.3. SOLUTION OPTIONS......................................................................................................................... 8
4. RESULTS.............................................................................................................................................. 9 4.1. OVERLOAD RESULTS....................................................................................................................... 9 4.2. VOLTAGE VIOLATION RESULTS .................................................................................................... 11 4.3. COMPARISON OF RESULTS WITH NEW HAVEN HARBOR STATION ON-LINE .................................. 13
4.3.1. Loading Violations ............................................................................................................... 13 4.3.2. Voltage Violations ................................................................................................................ 15
5. REFERENCES ................................................................................................................................... 16
2

SWCT Transmission Expansion: East Shore to Norwalk 345 kV OH/UG Alternative Transmission Loading and Voltage Analysis, Line 387 Reconductored, NHHS Off, NE-NY 0 MW
Executive Summary
This report summarizes power flow analysis conducted for The United Illuminating Company (UI) and Northeast Utilities (NU) for one option for expanding the New England 345 kV transmission system into southwest Connecticut (SWCT). The transmission option examined, called “East Shore 27-OH/UG” in this report, is for a 345 kV transmission path from East Shore to Norwalk substations, with interconnecting substations between these stations.1 The “East Shore 27-OH/UG” transmission option, which consists primarily of underground cables with one section of overhead line, is described as follows:
From To Distance Transmission East Shore Orange (cable to
overhead line transition station)
7 miles 345 kV underground, 2500 kcmil HPFF, three parallel cables
Orange (cable to overhead line transition station)
East Devon 9.4 miles 345 kV overhead bundled 1590 ACSR conductor, single circuit
East Devon Singer 8 miles 345 kV underground, 2500 kcmil HPFF, two parallel cables
Singer Norwalk 15 miles 345 kV underground, 2500 kcmil HPFF, two parallel cables
In addition to the above transmission alternative, the study assumes re-conductoring of the limiting portion of the East Shore to Scovill Rock 345 kV line (387 line) from a single 2156 ACSR conductor to a bundled 2 x 954 ACSR conductor. This raises the normal rating of the line from 1240 MVA to 1488 MVA, and the long-time emergency rating from 1604 MVA to 1912 MVA. It also results in a reduction in the impedance of the line of about 9%.
Power flow analysis was conducted for a 27.7 GW New England load level for four southwest Connecticut generation dispatches with the 447 MW New Haven Harbor Station (NHHS) off-line. (An earlier report, Reference 1, summarizes analysis of this option for several generation dispatches with NHHS on). The NHHS generation is made up by the Kleen Energy generation project, which is expected to be connected to the Scovill Rock to Manchester 345 kV line very near the Scovill Rock Substation. Loading and voltage performance of the Connecticut system was monitored for the 115 kV and 345 kV transmission systems.
The loading analysis found that three 345 kV transmission lines, twenty-five 115 kV transmission lines, and one 345/115 kV autotransformer at Southington, exhibited
1 A planned 345 kV transmission expansion from the Plumtree to Norwalk substations, which is called Bethel to Norwalk, is assumed to be in-service in this analysis.
PowerGEM Report 10021.-001-4, Jan. 28, 2004 2

SWCT Transmission Expansion: East Shore to Norwalk 345 kV OH/UG Alternative Transmission Loading and Voltage Analysis, Line 387 Reconductored, NHHS Off, NE-NY 0 MW
post-contingency overloads. The East Shore to Scovill Rock 345 kV line was also overloaded in the base case (all lines in) for one generation dispatch, and very nearly overloaded for another generation dispatch. Three of the overloaded 115 kV lines were also overloaded in the base case for some generation dispatches.
Voltage analysis indicated violations of voltage criteria for nine 115 kV substations. In addition, one contingency, a stuck breaker at Scovill Rock, caused widespread voltage violations at several 345 kV and 115 kV substations. A companion study (Reference 1) does not indicate these voltage violations when the New Haven Harbor station is on-line.
PowerGEM Report 10021.-001-4, Jan. 28, 2004 3

SWCT Transmission Expansion: East Shore to Norwalk 345 kV OH/UG Alternative Transmission Loading and Voltage Analysis, Line 387 Reconductored, NHHS Off, NE-NY 0 MW
1. Introduction
This report summarizes power flow analysis conducted for The United Illuminating Company (UI) and Northeast Utilities (NU) for one option for expanding the New England 345 kV transmission system into southwest Connecticut (SWCT). The transmission option examined, called “East Shore 27-OH/UG” in this report, is for a 345 kV transmission path from East Shore to Norwalk substations, with interconnecting substations between these stations.2 The “East Shore 27-OH/UG” transmission option, which consists primarily of underground cables with one section of overhead line, is described as follows:
From To Distance Transmission East Shore Orange (cable to
overhead line transition station)
7 miles 345 kV underground, 2500 kcmil HPFF, three parallel cables
Orange (cable to overhead line transition station)
East Devon 9.4 miles 345 kV overhead bundled 1590 ACSR conductor, single circuit
East Devon Singer 8 miles 345 kV underground, 2500 kcmil HPFF, two parallel cables
Singer Norwalk 15 miles 345 kV underground, 2500 kcmil HPFF, two parallel cables
In addition to the above transmission alternative, the study assumes re-conductoring of the limiting portion of the East Shore to Scovill Rock 345 kV line (387 line) from a single 2156 ACSR conductor to a bundled 2 x 954 ACSR conductor. This raises the normal rating of the line from 1240 MVA to 1488 MVA, and the long-time emergency rating from 1604 MVA to 1912 MVA. It also results in a reduction in the impedance of the line of about 9%.
Power flow analysis was conducted for a 27.7 GW New England load level for four southwest Connecticut generation dispatches with the 447 MW New Haven Harbor Station (NHHS) off-line. (An earlier report, Reference 1, summarizes analysis of this option for several generation dispatches with NHHS on). The NHHS generation is made up by the Kleen Energy generation project, which is expected to be connected to the Scovill Rock to Manchester 345 kV line very near the Scovill Rock substation. Loading and voltage performance of the Connecticut system was monitored for the 115 kV and 345 kV transmission systems. References 1 thru 3 are companion reports for other system conditions studied.
The objective of this study is to analyze and document the performance of this transmission configuration for steady-state base case and post-contingency
2 A planned 345 kV transmission expansion from Plumtree to Norwalk substations, which is called Bethel to Norwalk , is assumed to be in-service in this analysis.
PowerGEM Report 10021.-001-4, Jan. 28, 2004 4

SWCT Transmission Expansion: East Shore to Norwalk 345 kV OH/UG Alternative Transmission Loading and Voltage Analysis, Line 387 Reconductored, NHHS Off, NE-NY 0 MW
transmission power flows and voltages. In all cases, the New Haven Harbor station (447 MW), which has a significant impact on the flows on the 387 line, was out of service.
The following Appendices are included in this report: Appendix A “East Shore 27-OH/UG” Transmission Modeling Data Appendix B Power Flow Base Case One-Line Diagrams Appendix C Contingency File Appendix D Generation Dispatches Appendix E Summary of Overloads Appendix F Summary of Voltage Violations
PowerGEM Report 10021.-001-4, Jan. 28, 2004 5

SWCT Transmission Expansion: East Shore to Norwalk 345 kV OH/UG Alternative Transmission Loading and Voltage Analysis, Line 387 Reconductored, NHHS Off, NE-NY 0 MW
2. Database
This section discusses the data developed and used in the study.
2.1. Power Flow Base Cases Four power flow base cases, which included the approved Bethel to Norwalk 345-kV project in service, were utilized. PowerGEM revised each of the four cases to add the “East Shore 27-OH/UG” transmission project. Details regarding the modeling of these circuits are provided in Appendix A. In addition to this, the rating of the East Shore to Scovill Rock 345 kV line was increased to reflect the line rating by reconfiguring the East Shore Substation and removing the 345/115 kV autotransformers from the 387 line path. The line ratings used were 1240 MVA normal and 1604 MVA long-time emergency.
Details regarding the modeling of these circuits are provided in Appendix A.
Further, the impedance and ratings of the East Shore to Scovill Rock 345 kV line (387 line) were revised to reflect re-conductoring. The existing line has a portion with a single 2156 ACSR conductor (Black Pond Junction to Scovill Rock Switching station) and a portion with 2x 954 bundled ACSR conductor (Black Pond Junction to East Shore Substation). The data used in this analysis for re-conductoring assumed that the 2156 ACSR conductor is replaced by 2 x 954 conductor ACSR. The data is given below.
East Shore to Scovill Rock 345 kV Line Modeling Data
Impedances (p.u) Ratings MVA
R X B Normal LTE STE
Existing Line 0.00137 0.01767 0.26688 1240 1604 1966
Re-conductored Line 0.00136 0.01618 0.28561 1488 1912 2098
The re-conductoring results in about a 9% decrease in the line impedance, and about a 20% increase in the line loading capability.
Each of the four base cases had different generation dispatches, and are denoted dispatches 6C, 7C, 8C, and 9C. These dispatches were preserved for the base cases. Appendix D contains a list of the on-line generation for dispatch 6C, and the differences in dispatches 7C, 8C, and 9C as compared for dispatch 6C. Significant changes to dispatch for the four cases were restricted to New England generation.
A one-line diagram showing power flows and voltages on the “East Shore 27-OH/UG” (and Bethel to Norwalk) transmission line for each of the four base cases is included in Appendix B.
2.2. Contingency File A contingency file was modified as appropriate for this study, and is contained in Appendix C.
PowerGEM Report 10021.-001-4, Jan. 28, 2004 6

SWCT Transmission Expansion: East Shore to Norwalk 345 kV OH/UG Alternative Transmission Loading and Voltage Analysis, Line 387 Reconductored, NHHS Off, NE-NY 0 MW
• Loss of multiple 345 kV underground cables on the “East Shore 27-OH/UG” configuration between Orange and East Shore, or loss of parallel cables between Devon and Norwalk, is not considered. (Simultaneous loss of one cable from Devon to Singer and Singer to Norwalk is included as a contingency).
• For loss of the Orange to East Devon 345 kV overhead line, all three 345 kV underground cables from Orange to East Shore were opened.
PowerGEM Report 10021.-001-4, Jan. 28, 2004 7

SWCT Transmission Expansion: East Shore to Norwalk 345 kV OH/UG Alternative Transmission Loading and Voltage Analysis, Line 387 Reconductored, NHHS Off, NE-NY 0 MW
3. Methodology and Results Files
This section describes the technical approach to the study, performance criteria, solution assumptions, and the format of the results.
3.1. Software Set up of the power flow base cases used PTI’s PSS/E software (Rev. 28). Base case and contingency analysis was conducted using PTI’s MUST software (Rev. 5). Results from the MUST program are stored in Excel spreadsheets.
3.2. Performance Criteria The criteria for checking overload and voltage performance were as follows:
• Buses and transmission branches in Connecticut 115 kV and above were monitored.
• For base case loading performance, transmission lines and transformers were checked against 100% of their normal ratings.
• For post-contingency loading performance, overloads of transmission lines and transformers were checked against 100% of the long-time emergency ratings.
• Buses 230 kV and above were checked for voltages less than 95% and greater than 105%. Buses in the 115 kV system were checked for voltages less than 90% and more than 105%.
3.3. Solution Options For the analysis, tap-changing transformer and phase-shifting transformer adjustments were held fixed. For contingencies involving loss of generation/load the imbalance was made up by the system swing generator located outside New England.
PowerGEM Report 10021.-001-4, Jan. 28, 2004 8

SWCT Transmission Expansion: East Shore to Norwalk 345 kV OH/UG Alternative Transmission Loading and Voltage Analysis, Line 387 Reconductored, NHHS Off, NE-NY 0 MW
4. Results
The results of the analysis for transmission system loading and voltage violations are provided below.
4.1. Overload Results A summary of the overload results is shown in Table 1. The values shown are the percentage overload over the long-time emergency rating. If a table entry is blank, there is no overload. More detailed results are provided in Appendix E.
Any transmission line or transformer in the study area at 115 kV or above that experiences a post-contingency overload in this study is listed in the first column of Table 1. The remaining four columns, one for each of the four Connecticut generation dispatches studied, show the maximum overload of the branch in % (considering all contingencies) for each dispatch. The overloads are color-coded as indicated at the top of the table in order to make the relative severity of the overloads more apparent. If a Table 1 entry is blank, then the branch is not overloaded for that dispatch. To find more detail, for example which contingency causes the overload, and whether other contingencies could overload the branch, the reader should refer to Appendix E.
As shown in Table 1, there are three 345 kV transmission lines that experience post-contingency overloads. The East Shore to Scovill Rock 345 kV line (387 line), which experiences post-contingency overloads for dispatches 6C and 9C, is also overloaded in the base case for one generation dispatch, and is almost overloaded for a second dispatch, as shown in the table below. More detail is given in Appendix E.
Generation Dispatch ID 387 Line Base Case Loading
(% of normal rating) 6C 101% 7C 76% 8C 62% 9C 99%
A 345/115 kV autotransformer at Southington has post-contingency overloads ranging from 10% to 25%. The contingency causing the overload is a stuck breaker contingency at Southington (contingency SGTN5TSTK).
Finally, there are twenty-five 115 kV line post-contingency overloads that vary widely from slight overloads to severe overloads. Some overloads are sensitive to generation dispatch, while others are not. Three 115 kV branches are overloaded in the base case, as indicated by the shaded branch names. The base case overloads range from a few percent to about 25%. More detail is given in Appendix E.
PowerGEM Report 10021.-001-4, Jan. 28, 2004 9

SWCT Transmission Expansion: East Shore to Norwalk 345 kV OH/UG Alternative Transmission Loading and Voltage Analysis, Line 387 Reconductored, NHHS Off, NE-NY 0 MW
OverLoad >= 30%10% < Over Load < 30%5% < Over Load < 10%OverLoad < 5%
From bus To bus CKT 6C 7C 8C 9C73104 FRSTBDGE 345 73106 SOUTHGTN 345 1 4.2 6.1
73106 SOUTHGTN 345 73122 MERID362 345 1 4.7 5.5
73106 SOUTHGTN 345 73154 SGTN B 115 2 22.9 14.4 10.5 24.8
73107 SCOVL RK 345 73663 E.SHORE 345 1 6.9 6.2
73162 WATERSDE 115 73163 COS COB 115 1 24.8 24.8 24.8 24.8
73162 WATERSDE 115 73168 GLNBROOK 115 1 2.5 2.5 2.5 2.5
73164 BALDWNJA 115 73202 FROST BR 115 1 6.4 2.2
73167 SO.END 115 73294 GLNBRK J 115 1 23.2 23.2 23.2 23.2
73168 GLNBROOK 115 73169 RYTN J A 115 1 2.8
73168 GLNBROOK 115 73237 ELYAVE 115 1 51.1 54.3
73168 GLNBROOK 115 73271 RYTN J B 115 1 21.0 17.4 39.5 48.2
73169 RYTN J A 115 73171 NWLK HAR 115 1 43.4 43.8
73169 RYTN J A 115 73172 NORWALK 115 1 85.0 79.1
73170 PLUMTREE 115 73176 TRIANGLE 115 1 88.4 76.5 73.7 85.2
73170 PLUMTREE 115 73176 TRIANGLE 115 2 35.2 35.2 34.9 35.0
73170 PLUMTREE 115 73268 MIDDLRIV 115 1 187.7 184.1 183.2 187.2
73171 NWLK HAR 115 73237 ELYAVE 115 1 50.7 59.6
73171 NWLK HAR 115 73271 RYTN J B 115 1 4.3 4.5
73172 NORWALK 115 73207 FLAX HIL 115 1 99.4 93.5
73183 SHAWSHIL 115 73185 BUNKER H 115 1 10.2 10.3
73188 BCNFL PF 115 73192 DRBY J B 115 1 31.2 28.0 26.9 33.4
73196 GLEN JCT 115 73198 SOUTHGTN 115 1 20.9 19.9
73198 SOUTHGTN 115 73631 WLNGF PF 115 1 4.5 1.2
73207 FLAX HIL 115 73271 RYTN J B 115 1 82.1 76.1
73228 BALDWNJB 115 73185 BUNKER H 115 1 1.4
73230 HADDAM 115 73231 BOKUM 115 1 21.5 21.4
73230 HADDAM 115 73231 BOKUM 115 2 5.6 5.5
73268 MIDDLRIV 115 73176 TRIANGLE 115 1 126.3 123.0 122.3 125.9
73701 CRRA JCT 115 73703 ASHCREEK 115 1 0.1 0.6
Indicates branch overloaded in base case
Table 1Highest Overload: 27.7 GW NE Load, Dispatches 6C, 7C, 8C and 9C
Generation Dispatch ID
PowerGEM Report 10021.-001-4, Jan. 28, 2004 10

SWCT Transmission Expansion: East Shore to Norwalk 345 kV OH/UG Alternative Transmission Loading and Voltage Analysis, Line 387 Reconductored, NHHS Off, NE-NY 0 MW
4.2. Voltage Violation Results A summary of the most severe low voltage violations is provided in Table 2 (following page). More detailed results on the voltage analysis are provided in Appendix F. Since violations of high voltage limits were minor, they are not included in the table below but are included in Appendix F.
The table shows the bus number, bus name, and base kV, as well as area and zone numbers in the load flow data base. The “# Viols” column is the total number of violations for this bus and dispatch condition. If “# Viols” equals one, then the indicated contingency is the only one causing a violation. If “# Viols” exceeds one, then other contingencies also cause a voltage violation, but none are more severe than the indicated contingency. (Appendix F could be used to assess the comparative severity of multiple contingencies causing a voltage violation for a particular bus.)
The value in the “Worst Lo Vio” column indicates the amount, in per-unit, that the bus voltage is below the low voltage criteria. The contingency and dispatch for which this occurs is also indicated. More detailed information on the results of the voltage analysis may be found in Appendix F, including explanations on interpreting values in the tables.
Some observations on the results from Table 2 are as follows:
• There are no voltage violations for 345 kV buses reported (except for one contingency not shown in the table and discussed in more detail following Table 2).
• Nine 115 kV buses are found to have low voltage violations. (Two 115 kV buses have minor high voltage violations but are not shown in the table)
• The generation dispatch does not have a dramatic effect on the magnitude of the voltage violations, though the worst voltage violations tend to be for dispatch 9C.
PowerGEM Report 10021.-001-4, Jan. 28, 2004 11

SWCT Transmission Expansion: East Shore to Norwalk 345 kV OH/UG Alternative Transmission Loading and Voltage Analysis, Line 387 Reconductored, NHHS Off, NE-NY 0 MW
Lo Violation > 3%1% < Lo Violation < 3%0.5%< Lo Violation < 1%
Sorted by bus, then low violation Lo Violation < 0.5%
Bus # Bus Name KV Area Zone#
ViolsWorstLo
VioNcon Lo
Cont Name Worst Lo Dispatch Controls
73160 BALDWINB 115.0 701 171 2 0.043 248 1272-1721DCT 9C FIX
73160 BALDWINB 115.0 701 171 2 0.029 248 1272-1721DCT 6C FIX
73160 BALDWINB 115.0 701 171 1 0.016 248 1272-1721DCT 7C FIX
73160 BALDWINB 115.0 701 171 1 0.016 248 1272-1721DCT 8C FIX
73188 BCNFL PF 115.0 701 171 1 0.013 248 1272-1721DCT 9C FIX
73231 BOKUM 115.0 701 171 3 0.002 247 1261-1620DCT 9C FIX
73185 BUNKER H 115.0 701 171 2 0.043 248 1272-1721DCT 9C FIX
73185 BUNKER H 115.0 701 171 1 0.028 248 1272-1721DCT 6C FIX
73185 BUNKER H 115.0 701 171 1 0.016 248 1272-1721DCT 7C FIX
73185 BUNKER H 115.0 701 171 1 0.016 248 1272-1721DCT 8C FIX
73697 CONGRESS 115.0 701 185 1 0.021 401 PEQUON42TSTK 9C FIX
73682 ELMWST A 115.0 701 185 3 0.029 377 GRNDAV7TSTK 9C FIX
73682 ELMWST A 115.0 701 185 4 0.023 377 GRNDAV7TSTK 6C FIX
73683 ELMWST B 115.0 701 185 3 0.031 374 GRNDAV4TSTK 9C FIX
73683 ELMWST B 115.0 701 185 4 0.025 374 GRNDAV4TSTK 6C FIX
73683 ELMWST B 115.0 701 185 2 0.001 441 WRIVER2TSTK 7C FIX
73189 FREIGHT 115.0 701 171 1 0.044 248 1272-1721DCT 9C FIX
73189 FREIGHT 115.0 701 171 1 0.030 248 1272-1721DCT 6C FIX
73189 FREIGHT 115.0 701 171 1 0.017 248 1272-1721DCT 7C FIX
73189 FREIGHT 115.0 701 171 1 0.017 248 1272-1721DCT 8C FIX
73199 SO.NAUG 115.0 701 171 1 0.012 248 1272-1721DCT 9C FIX
Note: Does not include low voltages for contingency SCOVRK8TSTK
Table 2Worst Low & Total Voltage Violations
27.7 GW NE Load, Dispatches 6C, 7C, 8C and 9C
As the note at the bottom of Table 2 indicates, low voltages for contingency SCOVRK8TSTK are not included in this table (though they are shown in Appendix F). This contingency, which trips Scovill Rock to Haddam Neck 345 kV and Scovill Rock to East Shore 345 kV, including the Cross-Sound Cable, did not converge to normal tolerance for dispatch 6C using the normal solution options.
Additional analysis using other solution options, and the non-divergent load flow, was used to obtain a convergent case. The post-contingency voltages are shown in Table 2A.
PowerGEM Report 10021.-001-4, Jan. 28, 2004 12

SWCT Transmission Expansion: East Shore to Norwalk 345 kV OH/UG Alternative Transmission Loading and Voltage Analysis, Line 387 Reconductored, NHHS Off, NE-NY 0 MW
Bus #Bus Name KV Area Zone ContVolt BaseVolt LowLimit Dispatch
73297 DEVON 345.0 701 171 1.0130 0.9500 6C
73663 E.SHORE 345.0 701 185 1.0097 0.9500 6C
73104 FRSTBDGE 345.0 701 171 1.0208 0.9500 6C
73105 LONG MTN 345.0 701 171 1.0072 0.9500 6C
73293 NORWALK 345.0 701 171 1.0092 0.9500 6C
73371 ORANGE 345.0 701 185 1.0098 0.9500 6C
73115 PLUMTREE 345.0 701 171 1.0032 0.9500 6C
73301 SINGER 345.0 701 186 1.0122 0.9500 6C
73196 GLEN JCT 115.0 701 171 1.0114 0.9000 6C
73265 GREEN HL 115.0 701 171 0.9941 0.9000 6C
73707 JUNE ST 115.0 701 185 1.0123 0.9000 6C
73675 MIX AVE 115.0 701 185 1.0114 0.9000 6C
73673 SACKPHS 115.0 701 185 1.0131 0.9000 6C
Post-Contingency Voltage for Contingency SCOVRK8TSTK, Dispatch 6CLoss of Scovill-Haddam 345, Scovill-EastShore 345, and Cross Sound Cable
TABLE 2A
0.9394
0.9317
0.9498
0.9461
0.9399
0.9327
0.9349
0.9402
0.8928
0.8833
0.8982
0.8887
0.8906
As shown in the table, this contingency results in widespread low voltages in the SWCT 345 kV system, as well as several low voltages in the 115 kV system. This contingency is unusually severe with respect to voltage impact, as it was the only one tested that resulted in 345 kV voltage violations, and they are spread out over relatively large geographic area, affecting 345 kV buses as distant from each other as Long Mountain and East Shore.
4.3. Comparison of Results with New Haven Harbor Station On-Line
4.3.1. Loading Violations Table 3 compares the worst overloads for the four SWCT generation dispatches with New Haven Harbor on-line and off-line (displaced by Kleen Energy).
PowerGEM Report 10021.-001-4, Jan. 28, 2004 13

SWCT Transmission Expansion: East Shore to Norwalk 345 kV OH/UG Alternative Transmission Loading and Voltage Analysis, Line 387 Reconductored, NHHS Off, NE-NY 0 MW
OverLoad >= 30%10% < Over Load < 30%5% < Over Load < 10%OverLoad < 5%
From bus To bus CKT 2C 3C 4C 5C 6C 7C 8C 9C
73104 FRSTBDGE 345 73106 SOUTHGTN 345 1 4.2 6.1
73106 SOUTHGTN 345 73122 MERID362 345 1 4.7 5.5
73106 SOUTHGTN 345 73154 SGTN B 115 2 17.8 9.6 5.7 19.4 22.9 14.4 10.5 24.8
73107 SCOVL RK 345 73663 E.SHORE 345 1 6.9 6.2
73162 WATERSDE 115 73163 COS COB 115 1 24.8 24.8 24.8 24.8 24.8 24.8 24.8 24.8
73162 WATERSDE 115 73168 GLNBROOK 115 1 2.5 2.5 2.5 2.5 2.5 2.5 2.5 2.5
73164 BALDWNJA 115 73202 FROST BR 115 1 6.4 2.2
73167 SO.END 115 73294 GLNBRK J 115 1 23.2 23.2 23.2 23.2 23.2 23.2 23.2 23.2
73168 GLNBROOK 115 73169 RYTN J A 115 1 1.6 2.8
73168 GLNBROOK 115 73237 ELYAVE 115 1 50.8 53.5 51.1 54.3
73168 GLNBROOK 115 73271 RYTN J B 115 1 19.2 15.8 38.1 46.5 21.0 17.4 39.5 48.2
73169 RYTN J A 115 73171 NWLK HAR 115 1 43.8 43.1 43.4 43.8
73169 RYTN J A 115 73172 NORWALK 115 1 81.8 75.8 85.0 79.1
73170 PLUMTREE 115 73176 TRIANGLE 115 1 77.2 74.9 72.8 75.3 88.4 76.5 73.7 85.2
73170 PLUMTREE 115 73176 TRIANGLE 115 2 35.1 34.9 34.7 34.8 35.2 35.2 34.9 35.0
73170 PLUMTREE 115 73268 MIDDLRIV 115 1 184.2 183.5 183.0 183.5 187.7 184.1 183.2 187.2
73171 NWLK HAR 115 73237 ELYAVE 115 1 49.6 57.4 50.7 59.6
73171 NWLK HAR 115 73271 RYTN J B 115 1 4.3 4.3 4.3 4.5
73172 NORWALK 115 73207 FLAX HIL 115 1 96.2 90.3 99.4 93.5
73183 SHAWSHIL 115 73185 BUNKER H 115 1 2.9 3.1 10.2 10.3
73188 BCNFL PF 115 73192 DRBY J B 115 1 29.8 27.5 26.5 32.0 31.2 28.0 26.9 33.4
73196 GLEN JCT 115 73198 SOUTHGTN 115 1 20.9 19.9
73198 SOUTHGTN 115 73631 WLNGF PF 115 1 4.5 1.2
73207 FLAX HIL 115 73271 RYTN J B 115 1 78.8 72.8 82.1 76.1
73224 TRMB J A 115 73700 PEQUONIC 115 1 2.3
73228 BALDWNJB 115 73185 BUNKER H 115 1 1.4
73230 HADDAM 115 73231 BOKUM 115 1 7.7 7.6 21.5 21.4
73230 HADDAM 115 73231 BOKUM 115 2 5.6 5.5
73268 MIDDLRIV 115 73176 TRIANGLE 115 1 123.1 122.6 122.1 122.6 126.3 123.0 122.3 125.9
73669 GRAND AV 115 73681 WEST RIV 115 1 2.7
73669 GRAND AV 115 73681 WEST RIV 115 2 2.7
73701 CRRA JCT 115 73703 ASHCREEK 115 1 0.3 0.6 0.1 0.6
Generation Dispatch ID
Table 3Highest Overload: 27.7 GW NE Load, Dispatches 2C - 9C
New Haven Harbor On New Haven Harbor Off
The main points regarding a comparison of the effect of the dispatch of New Haven Harbor are:
• Three additional overloads of 345 kV transmission occur for the SWCT dispatches 6C and 9C that are not overloaded in the cases with New Haven Harbor on-line. The new overloads are Frost Bridge to Southington 345 kV line, Southington to Meriden 345 kV line, and East Shore to Scovill 345 kV line, which as noted in Section 4.1, is slightly overloaded for dispatch 6C (101%) and is almost overloaded for dispatch 9C (99%). Though not indicated in the table, these
PowerGEM Report 10021.-001-4, Jan. 28, 2004 14

SWCT Transmission Expansion: East Shore to Norwalk 345 kV OH/UG Alternative Transmission Loading and Voltage Analysis, Line 387 Reconductored, NHHS Off, NE-NY 0 MW
overloads occur following loss of the East Shore to Scovill Rock 345 kV line (see Appendix E).
• Five additional overloads of 115kV transmission occur for the SWCT generation dispatches 6C or 9C that do not occur in the cases with New Haven Harbor on-line.
• Some overloads are essentially unaffected by generation at New Haven Harbor, while for others the overloads are greater.
4.3.2. Voltage Violations A primary effect of the generation at New Haven Harbor Station being off-line was to cause widespread voltage violations in the study area for the SCOVRK8TSTK contingency for the 6C generation dispatch. This contingency, which trips the Scovill Rock - Haddam 345 kV, and Scovill Rock – East Shore 345 kV, including the Cross Sound Cable, did not cause voltage violations when New Haven Harbor Station was on-line. As discussed in Section 4.2, there are fairly widespread voltage violations in the study area for this contingency and dispatch condition. This could be an indication of voltage instability for this contingency, dispatch, and loading condition.
In addition, having the 447 MW New Haven Harbor Station generation off-line generally worsened voltage violations that also occurred when it was on-line.
PowerGEM Report 10021.-001-4, Jan. 28, 2004 15

SWCT Transmission Expansion: East Shore to Norwalk 345 kV OH/UG Alternative Transmission Loading and Voltage Analysis, Line 387 Reconductored, NHHS Off, NE-NY 0 MW
PowerGEM Report 10021.-001-4, Jan. 28, 2004 16
5. References
1. Southwest Connecticut Transmission Expansion: East Shore to Norwalk 345 KV OH/UG Alternative, Transmission Loading and Voltage Analysis @ 27.7 GW Load. 387 Line Re-conductored, New Haven Harbor Station On-Line, NY-NE 0 MW, PowerGEM Report 10021.001-3 dated January 28, 2004.
2. Southwest Connecticut Transmission Expansion, East Shore to Norwalk 345 KV OH/UG Alternative, Transmission Loading and Voltage Analysis @ 27.7 GW Load, New Haven Harbor Station Off-Line, NE-NY 0 MW, PowerGEM Report 10021.001-2 dated January 28, 2004.
3. Southwest Connecticut Transmission Expansion, East Shore to Norwalk 345 KV OH/UG Alternative, Transmission Loading and Voltage Analysis @ 27.7 GW Load, New Haven Harbor Station On-Line, NE-NY 0 MW, PowerGEM Report 10021.001-1 Revised, dated January 28, 2004.