Embed Size (px)
Citation preview
i
E C O N O M I C A N D P U R P O S E
C L A S S I F I C A T I ON O F
S T A T E G O V E R N M E N T B U D G E T
2013-2014 (Accounts)
&
2014-2015 (Revised Estimates)
DIRECTORATE OF ECONOMICS AND STATISTICS,
MADHYA PRADESH
�
�� � � �
� � � � �
� � � � � � �
� � � � �
� � � � � � � �
� � � � �
� � � � � � � � � � �
� � ��
�� �
� �� � � � � �
� � � �
� � � � � � � �
�
� � � � ��
� � �� � � � � � �
�� � � � � � � � �
� � � � � � � � � ��
� � � �� � � � �
� � � � �
� � � � � �
� � � � ��
� � � � � �
�� � � � � � � �
� � � � � � � �
� � � � � � � � �
� � � � � � ��
� � � � � ��
� � � � � �
� � �
� � � � �
� � �� � �
� � � �
� � �
� � � � � � �
� � �� � � � �
� �
��������������������� �������
���������������������� ��� ����� ��� �� ����� ����������� ����� �� ����� ��������������������
� �˘�ˇ��������� ��˘� � ˇ�������� ������� �� ��� ����� ������ � ˘��ˆ�� �������� ������ ����
�� � ����� ��� � �� ����� �� ��������˙� ˝�� ����� ��������� � ˘ ����� � �� ��� ���� ��ˇ������ ˛�
�ˆ�� �������� �� � ���˘� � ˇ������� ��ˇ�� ��˘ ���� ��� �˘� � ˇ���������� ��� �����ˇ��� ��
�° �������˙��˜ ���˘ ���� ˘������� ���� ��������ˇ������ˇˇ � ���������˘ ��� ���ˇ�� ˘���� �� �
� ��������� ������� �� ����� ˘����� ����������ˇ �� �� ˇ��� ���� �����ˇ �� ������ ��
�� ��������˙� °����� ��� � ��� ����� � ��� � ���ˇ ��ˇ� �� �˘�ˇ� ˇ�� ˘� � ����� ��������
��� ��ˇ�� �� ˘�� �� ��� �� �˙�
�
�� ˜ �� ������� �� � � ����� �� �� � � � ��� ��� �� ��� ���� ������ ˘ ˇ���� ��� � � ��
�������� � � � ��ˇ���� � �� ����� ��� �� �� ��� ��ˇ�� �� � � ����� � � � �������� � ���ˇ ��ˇ�
�� �˘�ˇ� ˇ�� ˘�� ������� ��ˇ�� �˙�˜ ��������ˇ��� !�˜°� ��� � ���� �� ��������!������ ���� ��
�ˇ ��ˇ�� ������ ���ˇ�����˘�ˇ��� � ˘� �����" ��� �� ��#�� ���˘ ��� ��������$%&'($%&)�
*�ˇˇ � ��+�� ��$%&)($%&,�*-����������������+˙���
�
˜ �� �ˇ ��ˇ� ̌ �����˘�ˇ��� � � °�� ��� �� �� �ˆ�� ������� � �� ��ˇ������ ���
�ˇ ��ˇ� ˇ��� ����� � ��� ���� ˘� �� �˘�ˇ� ˇ�� ˘ �� � ����� � � �� � ����� �˘˘�ˇ��� ˘� � ��
��� �� ����� ��ˇ�� ��� ��� ���ˇ ��˙��˝ �� ������ˇ�˘�ˇ������!������ � °���� �� ��� ��
�ˆ�� ��� ˘��ˇ��������˘ ����� � ��� ˘�� ����� ��������� ��ˇ��!����� �� ˘�� �� ��� �� ��
� ��ˇ ������� � ˘�� ��� ��� �� ���� �� �� ���� �����ˇ��� ��ˇ�˙�˜ ������!�� ���˘ ��!��� �
�������� � � ˇ�����˘�!� � �� � ��� � � �� � ����ˇ�� � �� ����� � �ˇ�������� ���� � � � �� ��� ���
� ˇ��� ���� ������� ˘�� �����ˇˇ � ���� �� ���� �������ˇ�� ˙����
�
� ˜ �� ���� ��� ̌ �����˘�ˇ��� � ������ °�� � � �� ̌ �����˘�ˇ��� � ˘� � �� ��� �� ��
�ˆ�� ���������ˇˇ ��� �� ���˘˘��� �������� ˘������ˇ����� ����������ˇ���� ��˘� � ˇ������� ��
����� ��� �� �� � � � � ˇ���� �� � �� ̌ ������� �� ��� �� � � �˙� ̃ �� �° � ������ ˘�
ˇ�����˘�ˇ��� !���.˙!��ˇ ��ˇ� � �ˇ�����˘�ˇ��� �� ������ ���ˇ�����˘�ˇ��� �����ˇ ��� ���� �
˘ ���� � /�ˇ ��ˇ(ˇ��(0��� ���1�����˘�ˇ��� /˙� ˜ ��� � �� ������ ˇ�����˘�ˇ��� � � °�� °�
� ���ˆ�� �������˘ ����������ˇ���������� ��������������������� �� ���ˇ ��ˇ�ˇ��� ����˙�
˝�� ��� � � °�� °� � �� �ˆ�� ������� � � �� �����ˇ����� � � �ˇ ��ˇ� ˇ��� ��� ��� ������������
�� ���˘˘��� ������ ���� �������� ˘������ˇ������ˇ����� �����˙��������������������������������������������������������������������
�
� ˜ ��������ˇ��� � ������ ����������� �� ���#�� ����� ������� �2����� ��°�� ��� ˇ����
�˘˘ ���� ˘��2�˙�3˙ ̇2 ��� �!�4 � ��2���ˇ� �!� ����1˙0˙�4�� !�� ��������� � ��� ��°��!�������� ��
����ˇ� ���� ��� ���-˙5˙�"� ����!�����˙�0� �������� ����� ����������� �� �� ���� ˇ��
˘�� ���-˙ ̇-�� ��������� ���2���ˇ� �˙�
�
�������˝�� ��� ���� � ��� � �� � ������� ����� ���� °���� ��� ˘ � �� ���˘��� ��� � �� � ��ˇ�� ��6���!�
���� ������ ���� ��������ˇ ��ˇ ������ � ���� �� �������� ˘�� ����� ��������� ��ˇ�� ��
˘�� �� �����" ��� �� �˙�� � ���� ��˘ ������ ���� ������°��ˇ ��˙� � � �
����� ������������������������������������������������������ ������� �������������� � � �� ������ �� �ated : 31 December ,2015 ����
Commissioner
Economics and Statistics
Madhya Pradesh
i

ii
��
� �
��
�� � � � � �
� � � � � ���
�
� � � � �
� � � � � �
� �
� � � � � �
�
��� � � �� � �
� �
��� � � � � � �
�
� � �
� � � �
C O N T E N T S
���������� ��
�� �� ���
����� ��������
���� � �
˘�ˇˆˇ˙�� ��� � �����ˇˆ ̌ ˝�˛ ���° ���ˆ ����ˇˆ ˜�
��������� ! � ��� ��������� � �� ���� � ���� ����˘��ˇ�ˆ��� � ��˙�˝˛�°�˝˛�˜ � � ��!� � �˝˛�˜�˝˛�"� #$%$!���
"#�""
�������˝� ! &� � �� ��� � ��� ���ˇ�ˆ��� � �������������� ' �� ����( ����)� *�˙�˝˛�°� ˝˛�˜ � � ��!�� �˝˛�˜�˝˛�" #$%$!���
"$
�������° ! '�ˆ�����+� � ��� � �� ���,��-� ����� - ˘�� � �˙�˝˛�°�˝˛�˜� � � ��!�� � ˝˛�˜�˝˛�"� #$%$!���
"˜
���� � ��
���%ˇ ��� � �����ˇˆ ̌ �� ˘&% ˆ˛���� ˇ ' ˆ ���
'ˇ� �ˆ˙ ˆ�
"(�")
��������� ! &��ˆ ���'������� ��� � ���%.ˆ� ������ �� � � �������˘���ˇ�ˆ��� � ��˙�˝˛�°�˝˛�˜� � � ��!�� �˝˛�˜�˝˛�"� #$%$!���
$#
�������˝ ! % � � � �ˆ��ˆ ���'������� ��� ����������� ���%.ˆ� ������� ��� � �������˘��
ˇ�ˆ��� � ��˙��˝˛�°�˝˛�˜� � � ��!
$"�$*
�������° ! % � � � �ˆ��ˆ ���'������� ��� � ��� %.ˆ� ������� ��� � �������˘��ˇ�ˆ����
� ��˙��˝˛�˜�˝˛�"� #$%$!
$+�˜#
���� � ���������������
� �ˇˆ�������ˇˆ ,��� ˙ ˆ� ˜˜�˜-
���� � �.
,ˇ˙ ,� ˆ� ���ˆ� /� ˆ���˛ ˜(�-
iii

iv
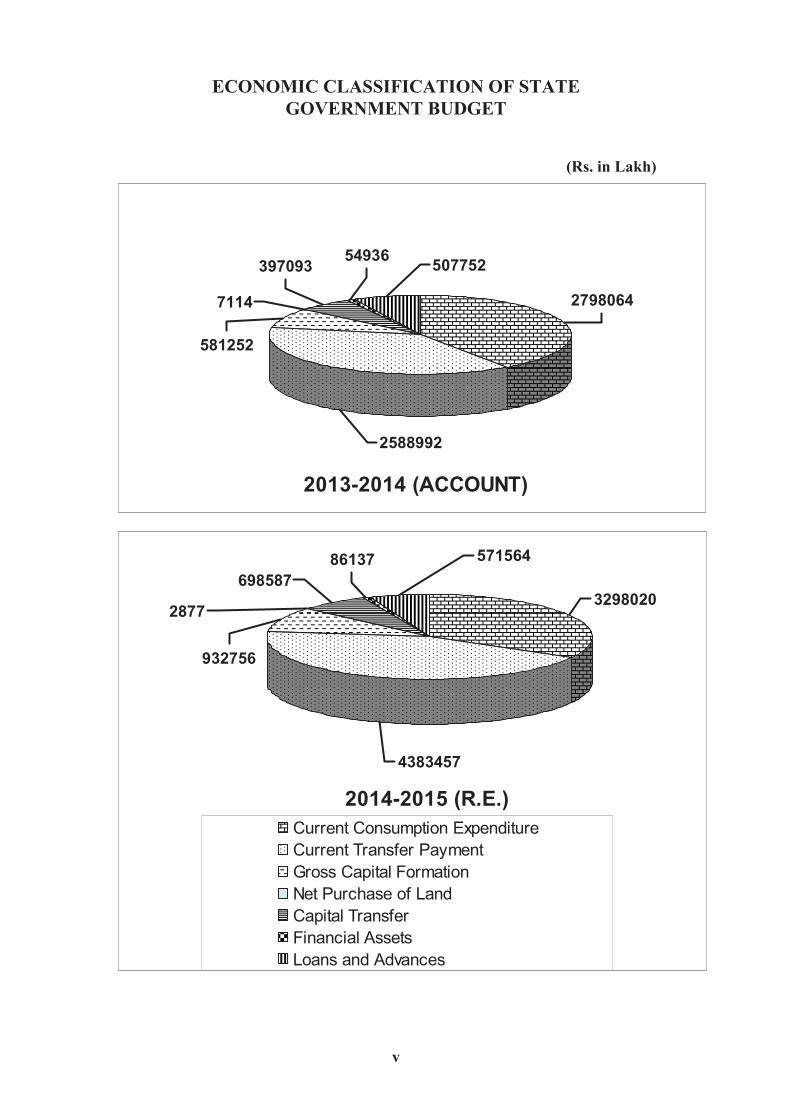
ECONOMIC CLASSIFICATION OF STATE
GOVERNMENT BUDGET
(Rs. in Lakh)
2013-2014 (ACCOUNT)
507752 54936
397093
7114
581252
2588992
2798064
571564 86137
698587
2877
932756
4383457
3298020
2014-2015 (R.E.)
Current Consumption Expenditure
Current Transfer Payment
Gross Capital Formation
Net Purchase of Land
Capital Transfer
Financial Assets
Loans and Advances
v
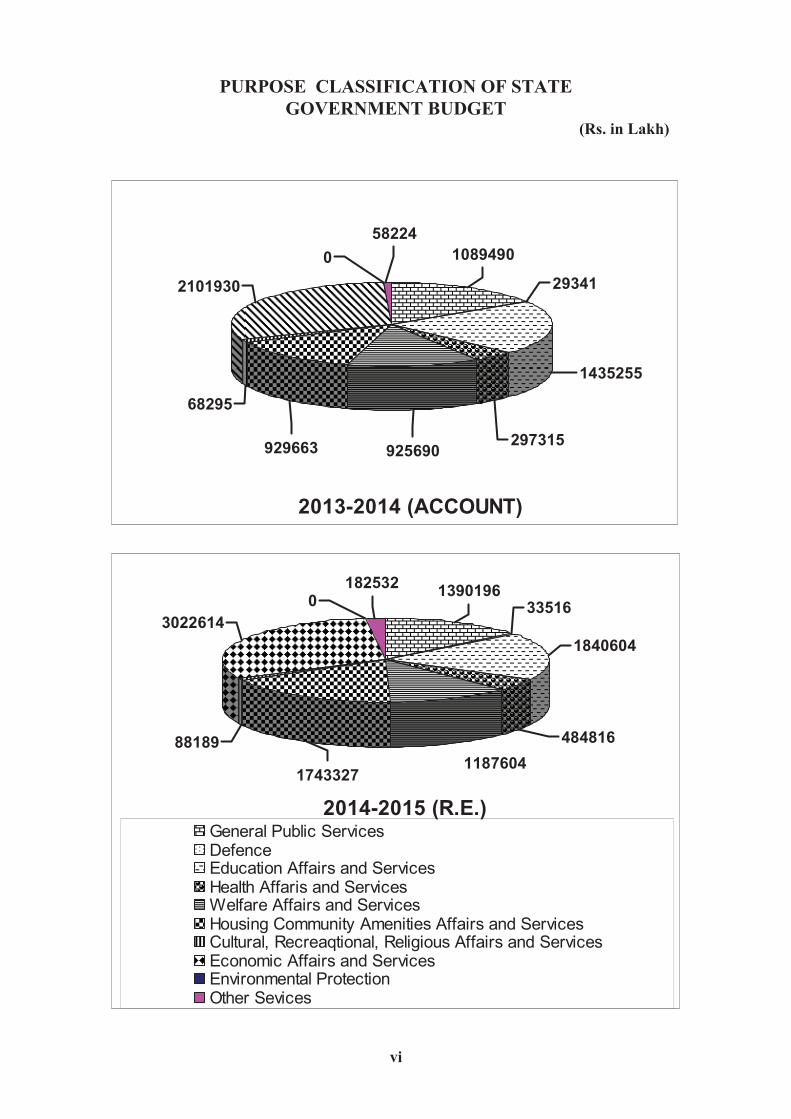
PURPOSE CLASSIFICATION OF STATE
GOVERNMENT BUDGET (Rs. in Lakh)
2013-2014 (ACCOUNT)
58224
0
2101930
68295
929663 925690 297315
1435255
29341
1089490
0
3022614
88189
1743327 1187604
484816
1840604
33516 1390196
182532
2014-2015 (R.E.) General Public Services Defence Education Affairs and Services Health Affaris and Services Welfare Affairs and Services Housing Community Amenities Affairs and Services Cultural, Recreaqtional, Religious Affairs and Services Economic Affairs and Services Environmental Protection Other Sevices
vi
iv
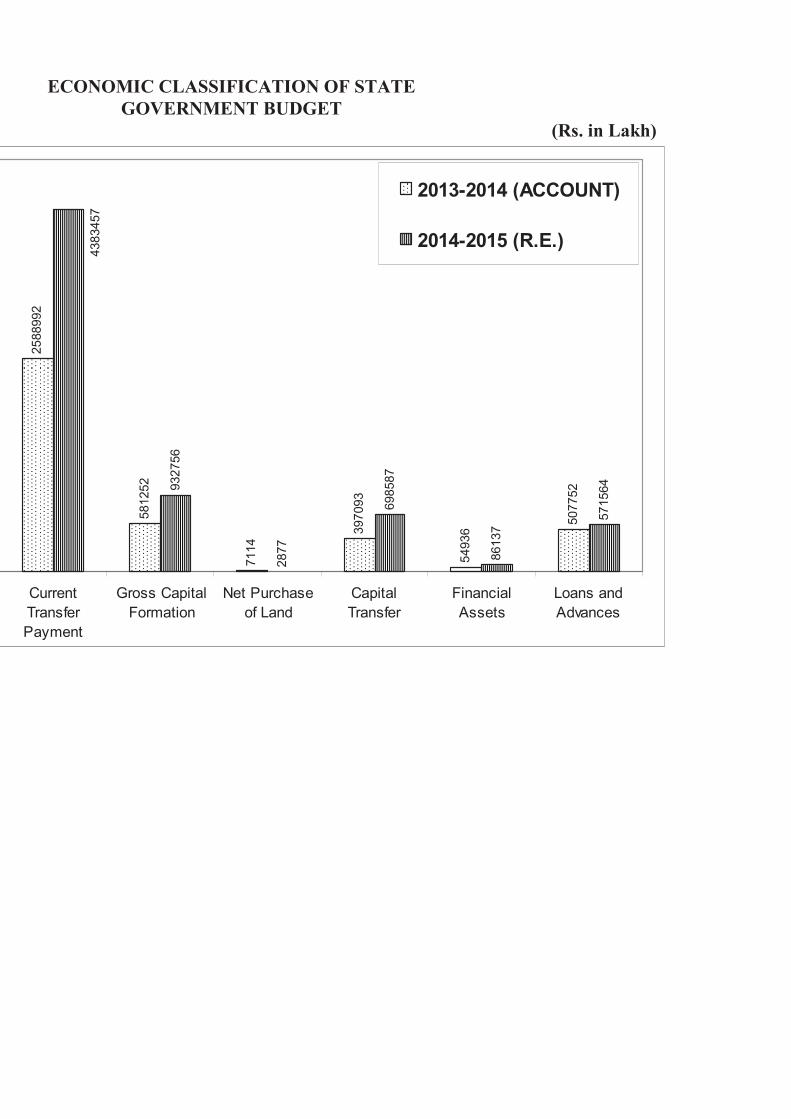
ECONOMIC CLASSIFICATION OF STATE
GOVERNMENT BUDGET
(Rs. in Lakh)
25
88992
581252
7114
397
093
54936
507752
932
756
2877
69858
7
86137
57
1564
438
3457
Current
Transfer
Payment
Gross Capital
Formation
Net Purchase
of Land
Capital
Transfer
Financial
Assets
Loans and
Advances
2013-2014 (ACCOUNT)
2014-2015 (R.E.)
33516
v
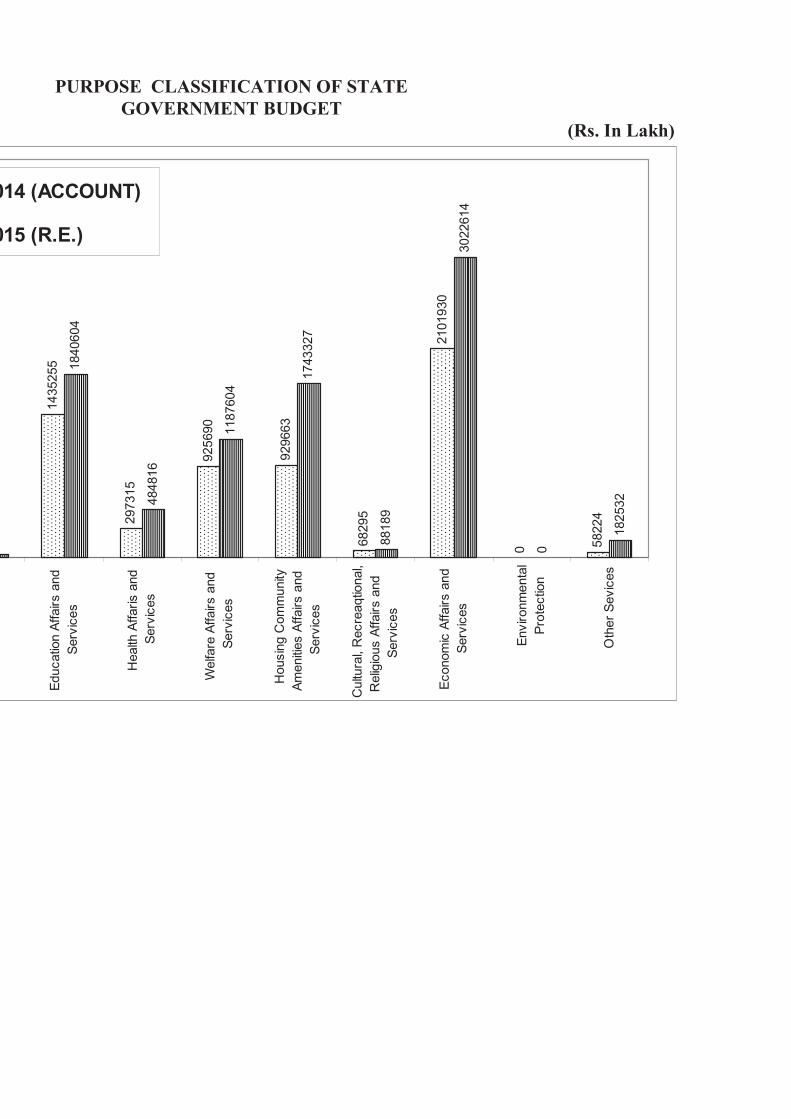
PURPOSE CLASSIFICATION OF STATE
GOVERNMENT BUDGET
(Rs. In Lakh)
1435255
297315
925690
929663
68295
2101930
0 58224
1840604
484816
1187604
1743327
88189
3022614
0
182532
Educatio
n A
ffairs a
nd
Serv
ices
Health
Affaris a
nd
Serv
ices
Welfa
re A
ffairs a
nd
Serv
ices
Housin
g C
om
munity
Am
eniti
es A
ffairs a
nd
Serv
ices
Cultu
ral,
Recre
aqtio
nal,
Relig
ious A
ffairs a
nd
Serv
ices
Econom
ic A
ffairs a
nd
Serv
ices
Environm
enta
l
Pro
tectio
n
Oth
er
Sevic
es
014 (ACCOUNT)
015 (R.E.)
�����
P A R T - I
E c o n o m i c C l a s s i f i c a t i o n o f
B u d g e t a r y T r a n s a c t i o n s
���

��������
�����
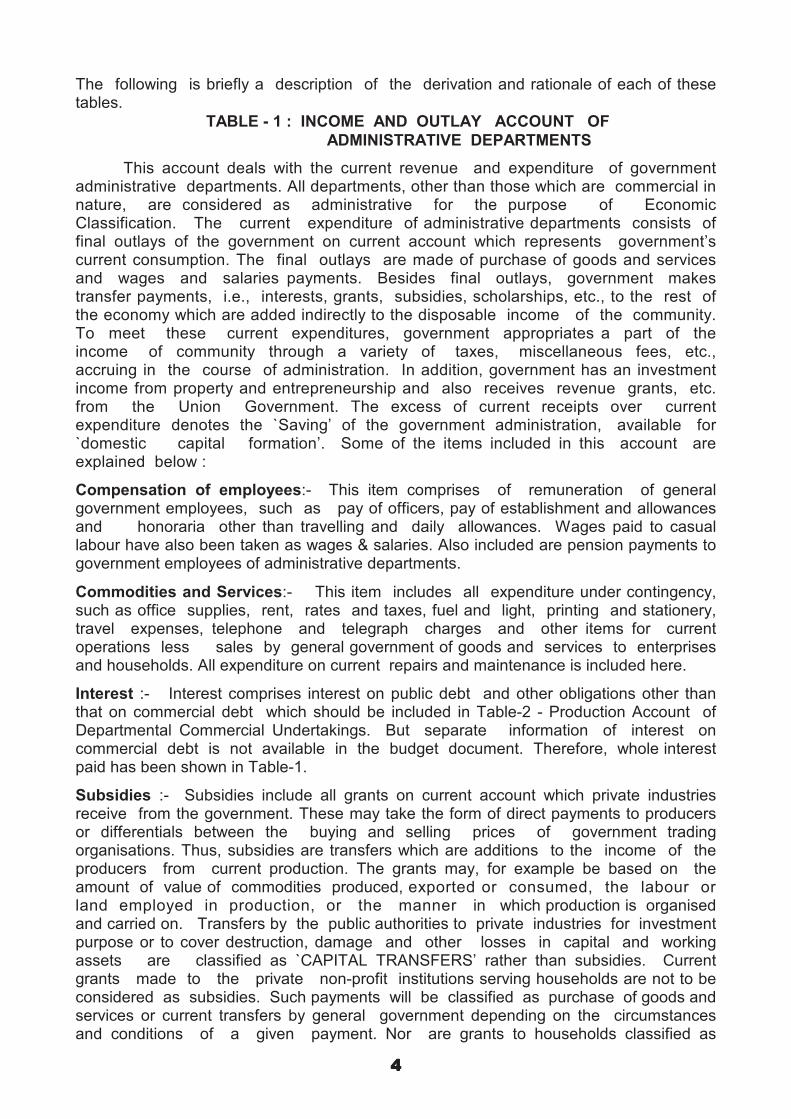
PART-I
ECONOMIC CLASSIFICATION OF BUDGETARY TRANSACTIONS
The Annual Financial Statement and the Demand for Grant in a Government Budget are drawn up in accordance with the provision under Article 202 (1) of the Constitution of India and presented to the State Legislature every year in order to secure legislative control. The expenditure in the Government Budget is generally classified department-wise and presented in the form of ‘ Demand for Grant ` for various departments. Each demand gives gross expenditure and various recoveries from other Governments or State Departments and various organisations. The recoveries are deducted from the gross expenditure to get net expenditure which are shown in the Financial Statement. Each demand specifies various items of expenditure, viz., pay of officers, pay of establishment, contingencies, etc., which are grouped under major and minor heads of accounts of expenditure.
The budget so presented reveals mere financial transactions and not the economic and social significance of the transactions. For instance, from the study of budget documents as they are, it is not possible to get a clear idea of capital formation out of budgetary resources, savings of the State Government, Government’s contribution to the generation of State Domestic Product, etc. The Government’s transactions are significant only in terms of such items in order to assess the impact of operations of the Government on the economy for purpose of formulation of correct monetary and fiscal policies and hence the need for economic classification of the State Government Budget.
The system of classification adopted here is based on a series of distinctions useful for analysing their economic impact on the rest of the economy. The term `rest of the economy’ refers to all entities other than the State Government and includes the Central Government, other State Governments, local bodies, statutory corporations or companies and individuals. `Current transactions’ are distinguished from capital transactions and under both, transactions in goods and services are separated from transfers. The current transactions of Government Administration are distinguished from the current operations of Departmental Commercial Undertakings as current expenditure of the former on wages and salaries and goods and services are final outlays but those of the latter are intermediate expenditure, such as cost of raw materials, fuels, etc. In other words, such expenditure represent expenses of production and not expenditure of final goods and services. Purely financial transactions are again separated from transactions on goods and services and transfers. The Economic Classification of the State Government Budget is presented in three Standard Tables as recommended by the Committee on Regional Accounts. These are :
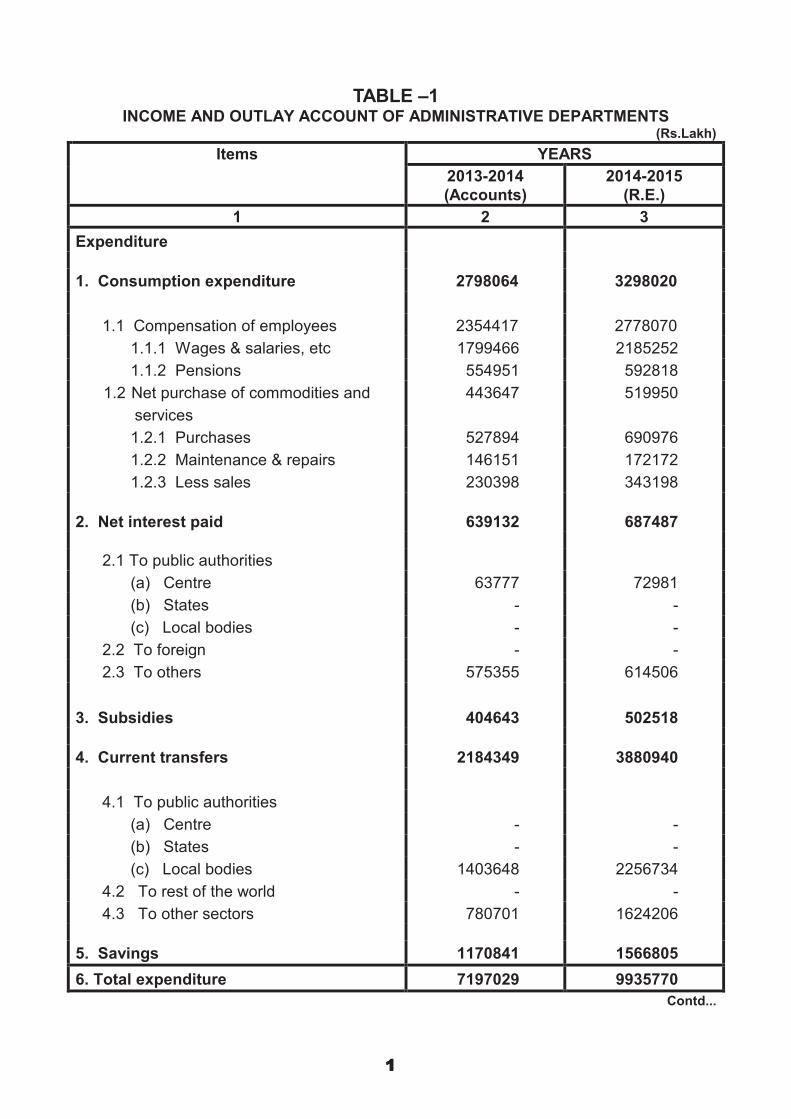
TABLE - 1 : INCOME AND OUTLAY ACCOUNT OF ADMINISTRATIVE DEPARTMENTS
TABLE - 2 : PRODUCTION ACCOUNT OF DEPARTMENTAL COMMERCIAL UNDERTAKINGS
TABLE - 3 : CAPITAL FINANCE ACCOUNT OF GENERAL GOVERNMENT.
���
�����
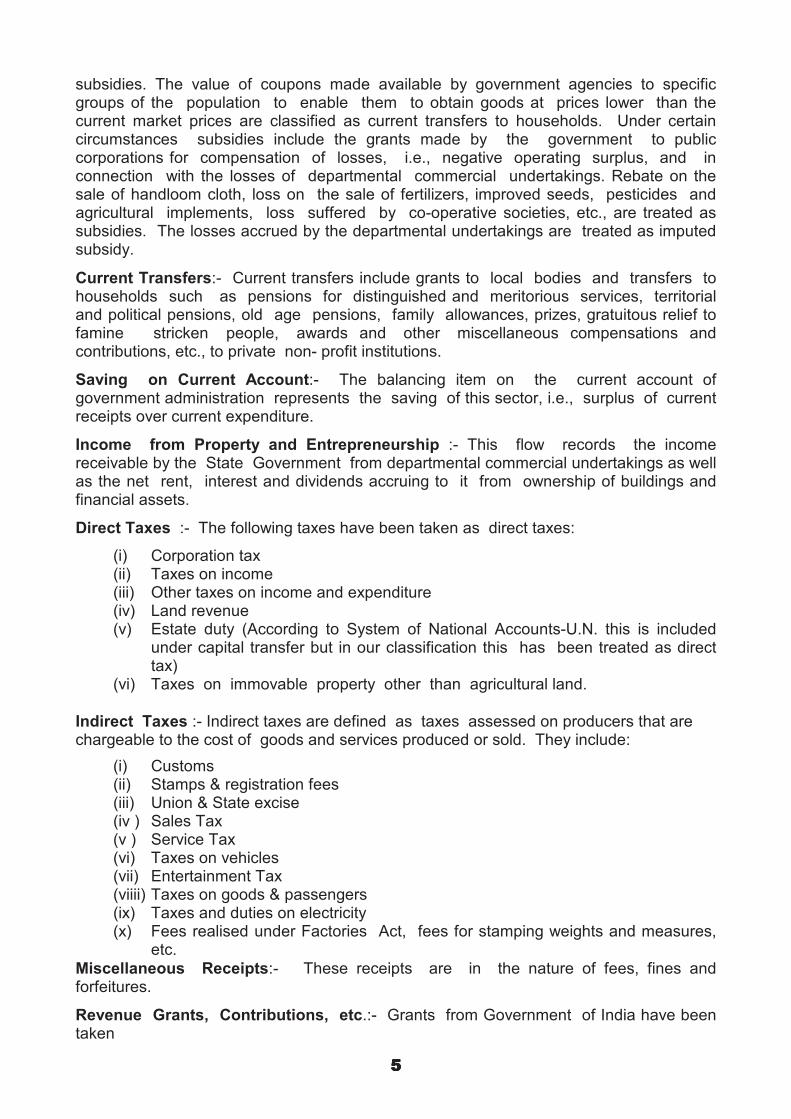
The following is briefly a description of the derivation and rationale of each of these tables.
TABLE - 1 : INCOME AND OUTLAY ACCOUNT OF
ADMINISTRATIVE DEPARTMENTS
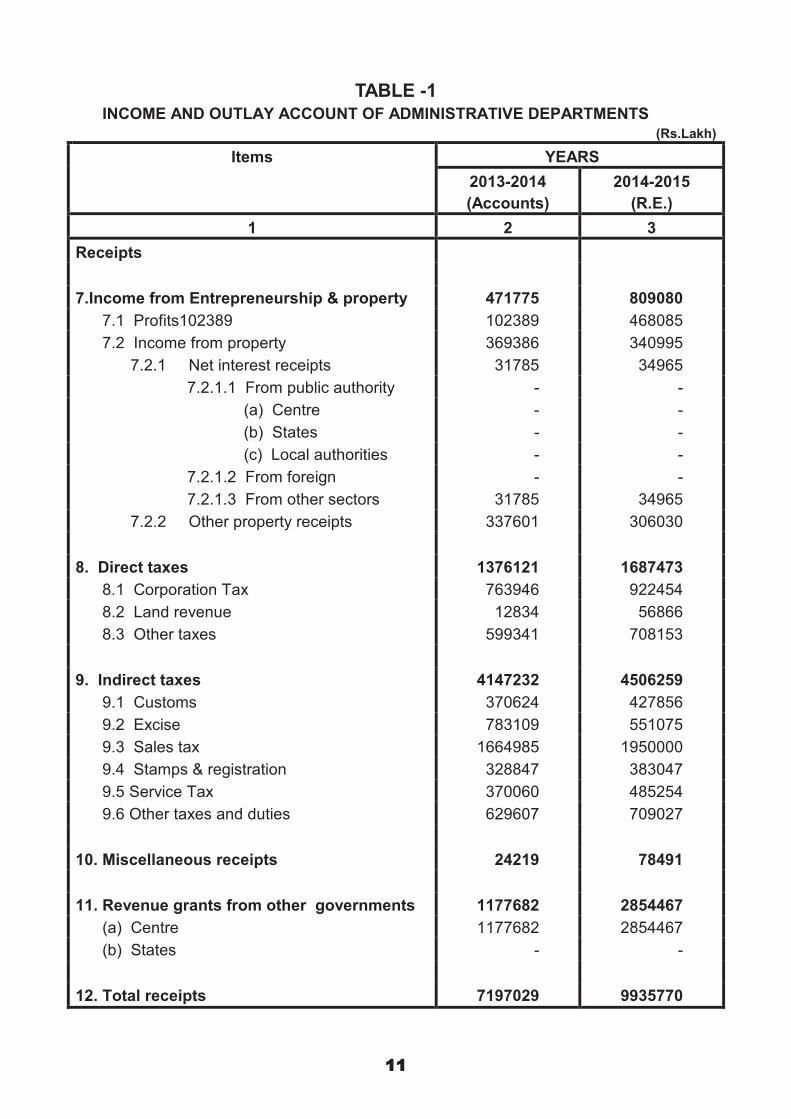
This account deals with the current revenue and expenditure of government administrative departments. All departments, other than those which are commercial in nature, are considered as administrative for the purpose of Economic Classification. The current expenditure of administrative departments consists of final outlays of the government on current account which represents government’s current consumption. The final outlays are made of purchase of goods and services and wages and salaries payments. Besides final outlays, government makes transfer payments, i.e., interests, grants, subsidies, scholarships, etc., to the rest of the economy which are added indirectly to the disposable income of the community. To meet these current expenditures, government appropriates a part of the income of community through a variety of taxes, miscellaneous fees, etc., accruing in the course of administration. In addition, government has an investment income from property and entrepreneurship and also receives revenue grants, etc. from the Union Government. The excess of current receipts over current expenditure denotes the `Saving’ of the government administration, available for `domestic capital formation’. Some of the items included in this account are explained below :
Compensation of employees:- This item comprises of remuneration of general government employees, such as pay of officers, pay of establishment and allowances and honoraria other than travelling and daily allowances. Wages paid to casual labour have also been taken as wages & salaries. Also included are pension payments to government employees of administrative departments.
Commodities and Services:- This item includes all expenditure under contingency, such as office supplies, rent, rates and taxes, fuel and light, printing and stationery, travel expenses, telephone and telegraph charges and other items for current operations less sales by general government of goods and services to enterprises and households. All expenditure on current repairs and maintenance is included here.
Interest :- Interest comprises interest on public debt and other obligations other than that on commercial debt which should be included in Table-2 - Production Account of Departmental Commercial Undertakings. But separate information of interest on commercial debt is not available in the budget document. Therefore, whole interest paid has been shown in Table-1.
Subsidies :- Subsidies include all grants on current account which private industries receive from the government. These may take the form of direct payments to producers or differentials between the buying and selling prices of government trading organisations. Thus, subsidies are transfers which are additions to the income of the producers from current production. The grants may, for example be based on the amount of value of commodities produced, exported or consumed, the labour or land employed in production, or the manner in which production is organised and carried on. Transfers by the public authorities to private industries for investment purpose or to cover destruction, damage and other losses in capital and working assets are classified as `CAPITAL TRANSFERS’ rather than subsidies. Current grants made to the private non-profit institutions serving households are not to be considered as subsidies. Such payments will be classified as purchase of goods and services or current transfers by general government depending on the circumstances and conditions of a given payment. Nor are grants to households classified as
���
�����
subsidies. The value of coupons made available by government agencies to specific groups of the population to enable them to obtain goods at prices lower than the current market prices are classified as current transfers to households. Under certain circumstances subsidies include the grants made by the government to public corporations for compensation of losses, i.e., negative operating surplus, and in connection with the losses of departmental commercial undertakings. Rebate on the sale of handloom cloth, loss on the sale of fertilizers, improved seeds, pesticides and agricultural implements, loss suffered by co-operative societies, etc., are treated as subsidies. The losses accrued by the departmental undertakings are treated as imputed subsidy.
Current Transfers:- Current transfers include grants to local bodies and transfers to households such as pensions for distinguished and meritorious services, territorial and political pensions, old age pensions, family allowances, prizes, gratuitous relief to famine stricken people, awards and other miscellaneous compensations and contributions, etc., to private non- profit institutions.
Saving on Current Account:- The balancing item on the current account of government administration represents the saving of this sector, i.e., surplus of current receipts over current expenditure.
Income from Property and Entrepreneurship :- This flow records the income receivable by the State Government from departmental commercial undertakings as well as the net rent, interest and dividends accruing to it from ownership of buildings and financial assets.
Direct Taxes :- The following taxes have been taken as direct taxes:
(i) Corporation tax (ii) Taxes on income (iii) Other taxes on income and expenditure (iv) Land revenue (v) Estate duty (According to System of National Accounts-U.N. this is included
under capital transfer but in our classification this has been treated as direct tax)
(vi) Taxes on immovable property other than agricultural land.
Indirect Taxes :- Indirect taxes are defined as taxes assessed on producers that are chargeable to the cost of goods and services produced or sold. They include:
(i) Customs (ii) Stamps & registration fees (iii) Union & State excise (iv ) Sales Tax (v ) Service Tax (vi) Taxes on vehicles (vii) Entertainment Tax (viiii) Taxes on goods & passengers (ix) Taxes and duties on electricity (x) Fees realised under Factories Act, fees for stamping weights and measures,
etc.
Miscellaneous Receipts:- These receipts are in the nature of fees, fines and forfeitures.
Revenue Grants, Contributions, etc.:- Grants from Government of India have been taken
���
��
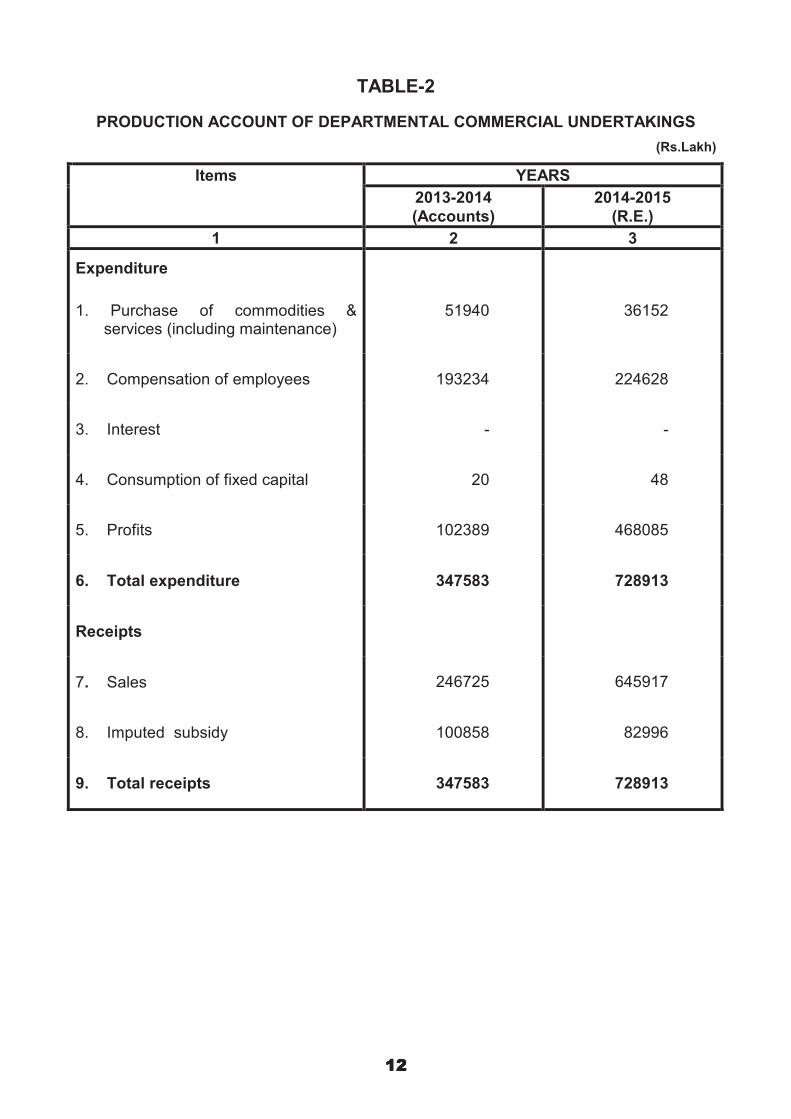
TABLE - 2 : PRODUCTION ACCOUNT OF DEPARTMENTAL
COMMERCIAL UNDERTAKINGS
The Departmental Commercial Undertakings may be defined as government agencies producing goods and services that are not provided free of charge. The operations of departmental commercial undertakings, which figure in the budget, are of the nature of entrepreneurial activities of government. Current expenditure of these undertakings, like working expenses of productive enterprises constitute intermediate expenditure that enter into prices of goods and services as these are sold to other sectors of economy. Therefore, these are different in character from final outlays by administrative departments. Likewise, sale proceeds of commercial undertakings are different from the receipts (e.g. taxes) of purely administrative departments which have no income of their own and draw upon incomes of other sectors to meet out their expenditure. Other related characteristics are :
(i) Departmental Commercial Undertakings are subject to market forces, i.e., demand and supply.
(ii) The activities of such undertakings are subordinate to legislative control and are owned, run and managed by the government.
(ii) The intention to make profit is not the essential characteristic and the activities of an undertaking may be carried on deliberately at a loss.
(iv) The operations of the undertakings usually involve the use of the expensive capital equipment and the holding of stock which may be subject to large fluctuations and the provision for depreciation may, therefore, be a significant element in the total cost of operations. Independent statutory Corporations and Boards set up by the State Government are excluded from the purview of this table. In this study, the following have been considered under departmental commercial undertakings:
(a) Forests (b) Irrigation (c) Milk supply
(d) Printing Press (Printing, storage and distribution of forms and Govt. Presses ). The items under this head are self explanatory. The expenditure part of the said account spells out compensation of employees (i.e., wages and salaries), commodities and services (i.e., purchase of raw materials, expenditure on repairs and maintenance, etc.), interest, consumption of fixed capital and profits. The receipts part shows their gross sale proceeds.
��
�����
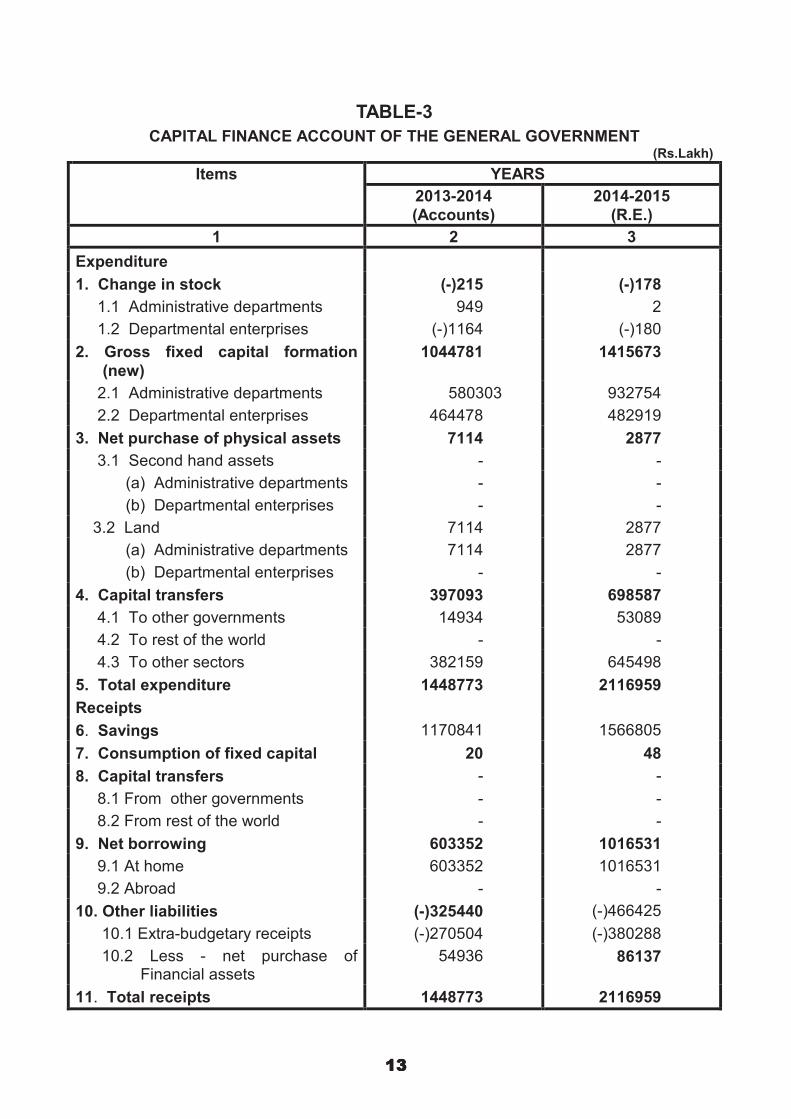
TABLE-3 : CAPITAL FINANCE ACCOUNT OF THE
GENERAL GOVERNMENT
This account is concerned with the total capital formation by government administration and departmental commercial undertakings together with capital transfer payments which are mostly for assisting capital formation. The capital expenditure of government administration and departmental commercial undertakings have been given separately whereas the sources of finance are common to both.
Change in Stocks:- Change in stocks represent the value of the physical change in raw materials, work-in- progress (other than the work-in-progress in buildings which are included in fixed capital formation) and finished products, which are held by commercial enterprises and in government stockpiles.
Gross Fixed Capital Formation:- Gross capital formation represents the gross value of goods which are added to the domestic capital stocks of the State. It comprises both expenditure on the acquisition of fixed assets and the value of physical change in stocks. The gross fixed capital formation has been classified into buildings and other construction and machinery and equipment. These terms may be specified as:
Buildings and other Construction:- Buildings include all expenditure on new construction and major alterations to residential and non-residential buildings including the value of the change in work-in-progress. Other construction includes mostly expenditure on construction of roads and bridges and works on power and irrigation projects, flood control, forest clearance, land reclamation, water supply and sanitation.
Machinery and Equipment:- This item includes expenditure incurred on the purchase of various equipment such as buses, jeeps, trucks, tractors for road haulage, power generating machinery, agricultural machinery and implements, office furniture, machinery and equipment and instruments used by professional men. Under this head the expenditure shown against renewals and replacements refers mainly to departmental commercial undertakings.
Net Purchase of Physical Assets:- The major component here is purchase of land.
Capital Transfers:- Capital transfers cover grants to finance the construction of buildings, etc. and for purchase of machinery and equipment for public works, water supply and sewage disposal schemes, etc. Capital transfers are intended to assist capital formation in other sectors of economy.
Receipts on Capital Account :- This part deals with the financing of capital formation and the sources for the same are discussed as under :
Saving :- The saving on current account is directly taken from Table -1.
���
��
Net Borrowing:- Items like internal debt, small savings, provident fund, etc. are included here.
Other Liabilities:- All investments in the share capital of statutory corporations and co-operative societies are classified as financial assets and are shown against other liabilities as a negative figure. Also included are the extra-budgetary receipts like loans from Government of India, contingency fund, deposits and advances, suspense, remittances and cash balances. Besides these, there are some funds maintained by the government like famine relief fund, road fund, etc. which are also covered here.
The three tables as explained above for Madhya Pradesh State Government budget for the years 2013-2014 (Accounts) and 2014-2015 (R.E.) are presented in the following pages.
��
��
TABLES
TABLE 1 : Income and outlay account of Administrative Departments.
TABLE 2 : Production account of Departmental Commercial Undertakings.
TABLE 3 : Capital finance account of the General Government.
��
����
��� ��
TABLE –1 INCOME AND OUTLAY ACCOUNT OF ADMINISTRATIVE DEPARTMENTS
(Rs.Lakh)
Items YEARS
2013-2014
(Accounts)
2014-2015
(R.E.)
1 2 3
Expenditure
1. Consumption expenditure
1.1 Compensation of employees
1.1.1 Wages & salaries, etc
1.1.2 Pensions
1.2 Net purchase of commodities and
services
1.2.1 Purchases
1.2.2 Maintenance & repairs
1.2.3 Less sales
2. Net interest paid
2.1 To public authorities
(a) Centre
(b) States
(c) Local bodies
2.2 To foreign
2.3 To others
3. Subsidies
4. Current transfers
4.1 To public authorities
(a) Centre
(b) States
(c) Local bodies
4.2 To rest of the world
4.3 To other sectors
5. Savings
2798064
2354417
1799466
554951
443647
527894
146151
230398
639132
63777
-
-
-
575355
404643
2184349
-
-
1403648
-
780701
1170841
3298020
2778070
2185252
592818
519950
690976
172172
343198
687487
72981
-
-
-
614506
502518
3880940
-
-
2256734
-
1624206
1566805
6. Total expenditure 7197029 9935770
Contd...
� ��
��������
TABLE -1
INCOME AND OUTLAY ACCOUNT OF ADMINISTRATIVE DEPARTMENTS
(Rs.Lakh)
Items YEARS
2013-2014
(Accounts)
2014-2015
(R.E.)
1 2 3
Receipts
7.Income from Entrepreneurship & property
7.1 Profits102389
7.2 Income from property
7.2.1 Net interest receipts
7.2.1.1 From public authority
(a) Centre
(b) States
(c) Local authorities
7.2.1.2 From foreign
7.2.1.3 From other sectors
7.2.2 Other property receipts
8. Direct taxes
8.1 Corporation Tax
8.2 Land revenue
8.3 Other taxes
9. Indirect taxes
9.1 Customs
9.2 Excise
9.3 Sales tax
9.4 Stamps & registration
9.5 Service Tax
9.6 Other taxes and duties
10. Miscellaneous receipts
11. Revenue grants from other governments
(a) Centre
(b) States
12. Total receipts
471775
102389
369386
31785
-
-
-
-
-
31785
337601
1376121
763946
12834
599341
4147232
370624
783109
1664985
328847
370060
629607
24219
1177682
1177682
-
7197029
809080
468085
340995
34965
-
-
-
-
-
34965
306030
1687473
922454
56866
708153
4506259
427856
551075
1950000
383047
485254
709027
78491
2854467
2854467
-
9935770
����
��������
TABLE-2
PRODUCTION ACCOUNT OF DEPARTMENTAL COMMERCIAL UNDERTAKINGS
(Rs.Lakh)
Items YEARS
2013-2014
(Accounts)
2014-2015
(R.E.)
1 2 3
Expenditure
1. Purchase of commodities & services (including maintenance)
2. Compensation of employees
3. Interest
4. Consumption of fixed capital
5. Profits
6. Total expenditure
Receipts
7. Sales
8. Imputed subsidy
9. Total receipts
51940
193234
-
20
102389
347583
246725
100858
347583
36152
224628
-
48
468085
728913
645917
82996
728913
����
��������
TABLE-3
CAPITAL FINANCE ACCOUNT OF THE GENERAL GOVERNMENT (Rs.Lakh)
Items YEARS
2013-2014
(Accounts)
2014-2015
(R.E.)
1 2 3
Expenditure
1. Change in stock
1.1 Administrative departments
1.2 Departmental enterprises
2. Gross fixed capital formation
(new)
2.1 Administrative departments
2.2 Departmental enterprises
3. Net purchase of physical assets
3.1 Second hand assets
(a) Administrative departments
(b) Departmental enterprises
3.2 Land
(a) Administrative departments
(b) Departmental enterprises
4. Capital transfers
4.1 To other governments
4.2 To rest of the world
4.3 To other sectors
5. Total expenditure
Receipts
6. Savings
7. Consumption of fixed capital
8. Capital transfers
8.1 From other governments
8.2 From rest of the world
9. Net borrowing
9.1 At home
9.2 Abroad
10. Other liabilities
10.1 Extra-budgetary receipts
10.2 Less - net purchase of Financial assets
11. Total receipts
(-)215
949
(-)1164
1044781
580303
464478
7114
-
-
-
7114
7114
-
397093
14934
-
382159
1448773
1170841
20
-
-
-
603352
603352
-
(-)325440
(-)270504
54936
1448773
(-)178
2
(-)180
1415673
932754
482919
2877
-
-
-
2877
2877
-
698587
53089
-
645498
2116959
1566805
48
-
-
-
1016531
1016531
-
(-)466425
(-)380288
86137
2116959
����

������������
��������
P A R T - II
P u r p o s e C l a s s i f i c a t i o n o f t h e
E x p e n d i t u r e o f G e n e r a l
G o v e r n m e n t
����

��� ��� ��
��������
PART -II
PURPOSE CLASSIFICATION OF THE EXPENDITURE OF
GENERAL GOVERNMENT
Introduction :-
The Government expenditure can be classified in accordance with [i] the economic character of the expenditure like current expenditure, capital formation, loans etc., and [ii] the purpose it is likely to serve, such as health, education, defence, etc. The former is known as economic classification and the latter is termed as the purpose classification. These two schemes are combined to form economic-cum-purpose classification.
This type of classification shows how expenditure for a particular purpose, say health, is divided between economic categories and it also shows how expenditure in a particular economic category, say capital formation is allocated to different purpose or types of public services provided. Economic-cum-purpose classification, therefore, serves as a very good guide to the policy makers for planning expenditure in the best possible manner to attain social and economic objectives of development.
The purpose of the government expenditure might be of two types (i) long term and (ii) short term. Long term expenditure might be aimed at tackling the problem of unemployment, economic development of the country and to bring about certain fundamental changes in the structure of the economy. The short term expenditure relate to immediate objectives of expenditure incurred in regard to health, defence, education, social welfare, economic services, etc. The aim of the purpose classification is, therefore, to classify expenditure in accordance with the immediate or short term social needs.
Coverage and scope :-
The purpose classification of the State Government Budget relates only to general government expenditure excluding departmental commercial enterprises. Financial investment of the government in commercial activities in terms of purchase of shares and debentures, etc., are included. Similarly, grants and loans given to commercial organisations, non-government institutions or the individuals are also included. It may, however, be pointed out that the repayment of loans are excluded. The receipts of the government do not come into the picture. However, some of the receipts like sales of goods and services produced in the government sector are taken into account in working out the expenditure on net purchase of goods and services by the general government.
Classification :-
This classification has been discussed under the following heads :
(a) Need for purpose classification, (b) Major categories, (c) Principles of classification adopted.
����
��� ��
(a) Need for purpose classification:-Entire government expenditures are recorded annually in the budget documents issued by State Government. The arrangement in regard to the presentation of the expenditure in the budgets is generally in keeping with the requirements of the legislative control, administrative accountability and auditing. The budgets are also presented under a few standard account heads of the functional character of the expenditure such as education, health, agriculture, industry, defence, etc. The expenditure shown under these account heads are not strictly in accordance with the principles of purpose classification. For instance, expenditure on medical colleges and other educational institutions are generally shown under account head medical and so on. Further, there are various account heads which pertain to so many purpose categories, such as public works department, community development, national extension services, cooperation, etc. The expenditure under these heads are not specific to any purpose categories. It becomes, therefore, essential to classify these heads of expenditure afresh.
(b) Major categories:-The purpose classification attempted for the present study is in conformity with the U.N. recommendations. U.N. has recommended classification in fourteen major categories:
(i) General Public Services (ii) Defence Affairs and Services (iii) Public Order and Safety Affairs (iv) Education Affairs and Services (v) Health Affairs and Services (vi) Social Security and Welfare Services (vii) Housing and Community Amenities, Affairs and Services (viii) Recreational, Cultural and Religious Affairs and Services (ix) Fuel and Energy Affairs and Services (x) Agricultural, Forestry, fishing and Hunting Affairs and Services (xi) Mining and Mineral Resource Affairs and Services Other than Fuels,
Manufacturing Affairs and Services and Construction Affairs and Services. (xii) Transportation and Communication Affairs and Services (xiii) Other Economic Affairs and Services (xiv) Expenditures not Classified by Major Group
We have adopted this classification for our purpose here. These major heads have been split into minor groups. In the present study we have some adjustments in the minor categories. Atomic energy has been shown as a miner head, which is not given in the U.N. Classification. Further a new major head "Environmental Protection has also been included. The whole list of major and minor purpose categories is as under:
List of purpose categories 1. General public services
1.1 General administration, external affairs, public order and safety 1.2 General research
2. Defence 3. Education Affairs And Services
3.1 Administration, Regulation And Research 3.2 Schools, Universities And Institutions Including Subsidiary
Services
� ��
��� ��
4. Health Affairs And Services (Allopathic, Ayurvadic, HomeoPathic, Unani And others ) 4.1 Administration, Regulation And Research 4.2 Hospitals, Clinics And Other Health Services
5. Welfare Affairs And Services 5.1 Social Security Affairs And Services 5.2 Social Welfare Services
6. Housing And Community, Amenities Affairs And Services 7. Cultural, Recreational And Religious Affairs And Services 8. Economic Affairs And Services
8.1 General Administration, Regulation And Research 8.2 Agriculture, Forestry, Fishing And Hunting 8.3 Mining, Manufacturing And Construction 8.4 Electricity, Gas, Steam, And Atomic Energy 8.5 Drinking Water Supply 8.6 Transportation And Communication 8.7 Other Economic Services
9. Environmental Protection 10 Other Services
(c) Principles of classification adopted:-All the items of expenditure are grouped under the appropriate categories regardless of their manner of presentation in the budget. Items which relate to more than one purpose class are first disintegrated in accordance with the details that are given in the budget, and then classified into appropriate purpose categories. In the absence of any details, either the major function of the expenditure is considered as the purpose or it is disintegrated into related purpose categories applying some suitable norms. In case of grants, loans and advances to private institutions or to individuals, if the purpose of utilisation is not specifically mentioned, classification is done on the basis of the main function of the institutions which are receiving the grants, loans and advances. In many cases neither the name of the organisations receiving the grants, loans and advances nor the purpose of utilisation is given. In such cases the classification is done on the basis of account heads under which these expenditure have been shown.
Facilities provided to employees like residential housing facility, free or subsidised medical aid, etc., are classified by the nature of the facility and not by the functional character of the office providing facilities. Accordingly loans and advances to employees for construction of houses, purchase of motor car, etc., are classified according to the types of the services likely to be obtained by the utilisation of the loans.
Pension and other retirement benefits (including employees family pension schemes) are distributed to all the purpose categories in proportion to the amount of wages and salaries attributable to different categories. The welfare pensions like old age pensions, pensions to political sufferers or to freedom fighters, etc., are however, classified under the welfare services.
Following tables give purpose classification of Madhya Pradesh State Government Budget for the years 2013-2014 (Accounts) and 2014-2015 (R.E.) (Table -1) and economic-cum-purpose classification separately for these years (Tables - 2 & 3).
� ��
����
��� ��
TABLE-1
PURPOSE CLASSIFICATION OF EXPENDITURE
OF ADMINISTRATIVE DEPARTMENTS (Rs.Lakh)
Purpose classification
2013-2014
(Accounts)
Percen-
tage
distri-
bution
2014-2015
(R.E.)
Percen-
tage
distri-
bution
Percentage
increase or
decrease in
2014-2015 Over
2013-2014 (A/C )
1 2 3 4 5 6
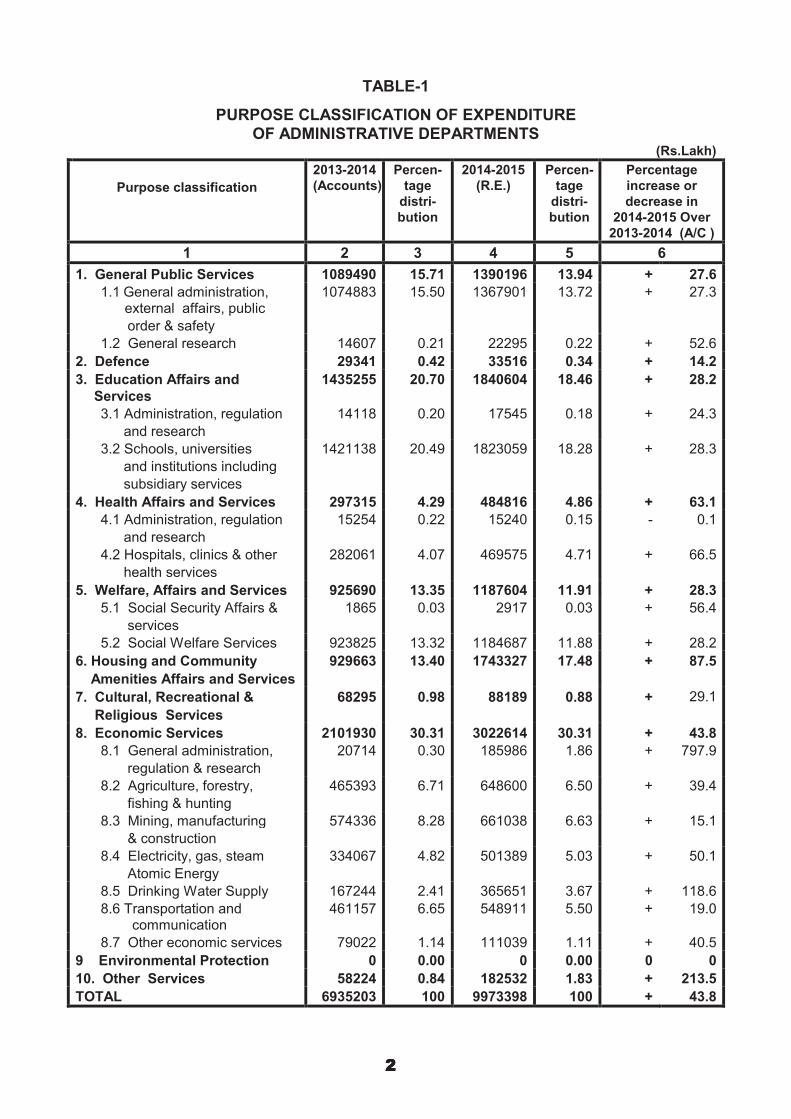
1. General Public Services 1089490 15.71 1390196 13.94 + 27.6
1.1 General administration, external affairs, public
order & safety
1074883 15.50 1367901 13.72 + 27.3
1.2 General research 14607 0.21 22295 0.22 + 52.6
2. Defence 29341 0.42 33516 0.34 + 14.2
3. Education Affairs and
Services
1435255 20.70 1840604 18.46 + 28.2
3.1 Administration, regulation
and research
14118 0.20 17545 0.18 + 24.3
3.2 Schools, universities
and institutions including
subsidiary services
1421138 20.49 1823059 18.28 + 28.3
4. Health Affairs and Services 297315 4.29 484816 4.86 + 63.1
4.1 Administration, regulation
and research
15254 0.22 15240 0.15 - 0.1
4.2 Hospitals, clinics & other
health services
282061 4.07 469575 4.71 + 66.5
5. Welfare, Affairs and Services 925690 13.35 1187604 11.91 + 28.3
5.1 Social Security Affairs &
services
1865 0.03 2917 0.03 + 56.4
5.2 Social Welfare Services 923825 13.32 1184687 11.88 + 28.2
6. Housing and Community
Amenities Affairs and Services
929663 13.40 1743327 17.48 + 87.5
7. Cultural, Recreational &
Religious Services
68295 0.98 88189 0.88 + 29.1
8. Economic Services 2101930 30.31 3022614 30.31 + 43.8
8.1 General administration,
regulation & research
20714 0.30 185986 1.86 + 797.9
8.2 Agriculture, forestry,
fishing & hunting
465393 6.71 648600 6.50 + 39.4
8.3 Mining, manufacturing
& construction
574336 8.28 661038 6.63 + 15.1
8.4 Electricity, gas, steam
Atomic Energy
334067 4.82 501389 5.03 + 50.1
8.5 Drinking Water Supply 167244 2.41 365651 3.67 + 118.6
8.6 Transportation and communication
461157 6.65 548911 5.50 + 19.0
8.7 Other economic services 79022 1.14 111039 1.11 + 40.5
9 Environmental Protection 0 0.00 0 0.00 0 0
10. Other Services 58224 0.84 182532 1.83 + 213.5
TOTAL 6935203 100 9973398 100 + 43.8
� ��
��������
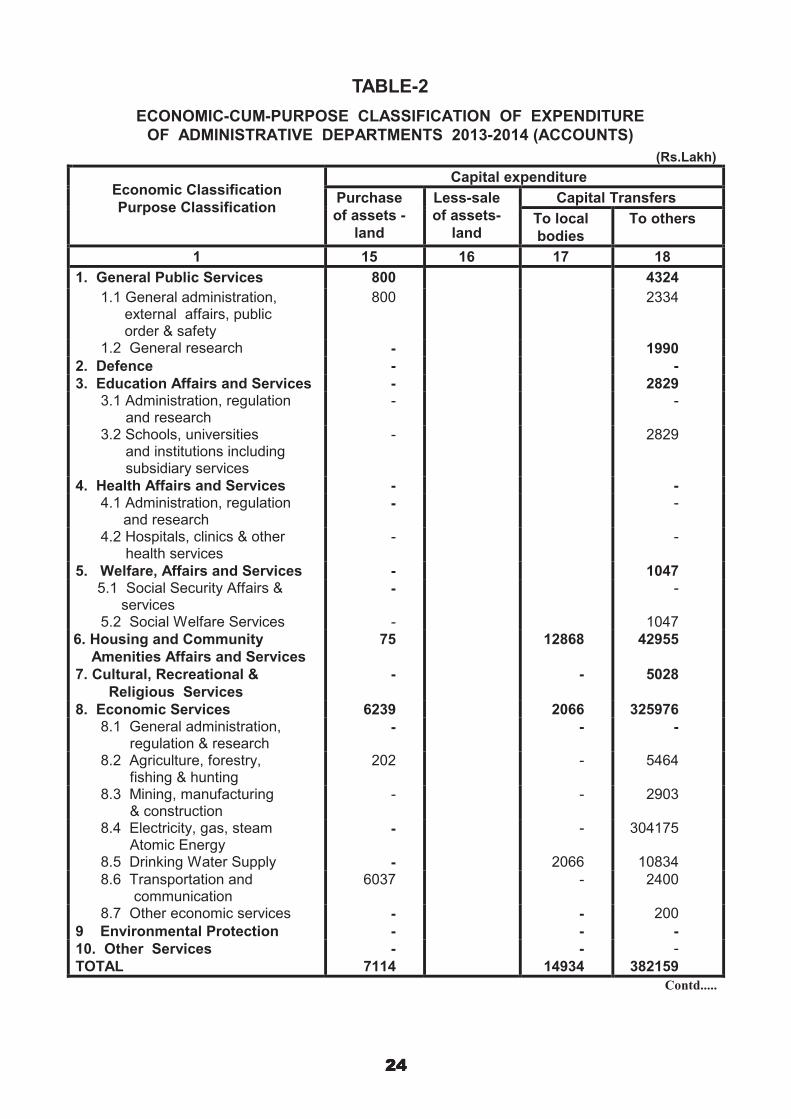
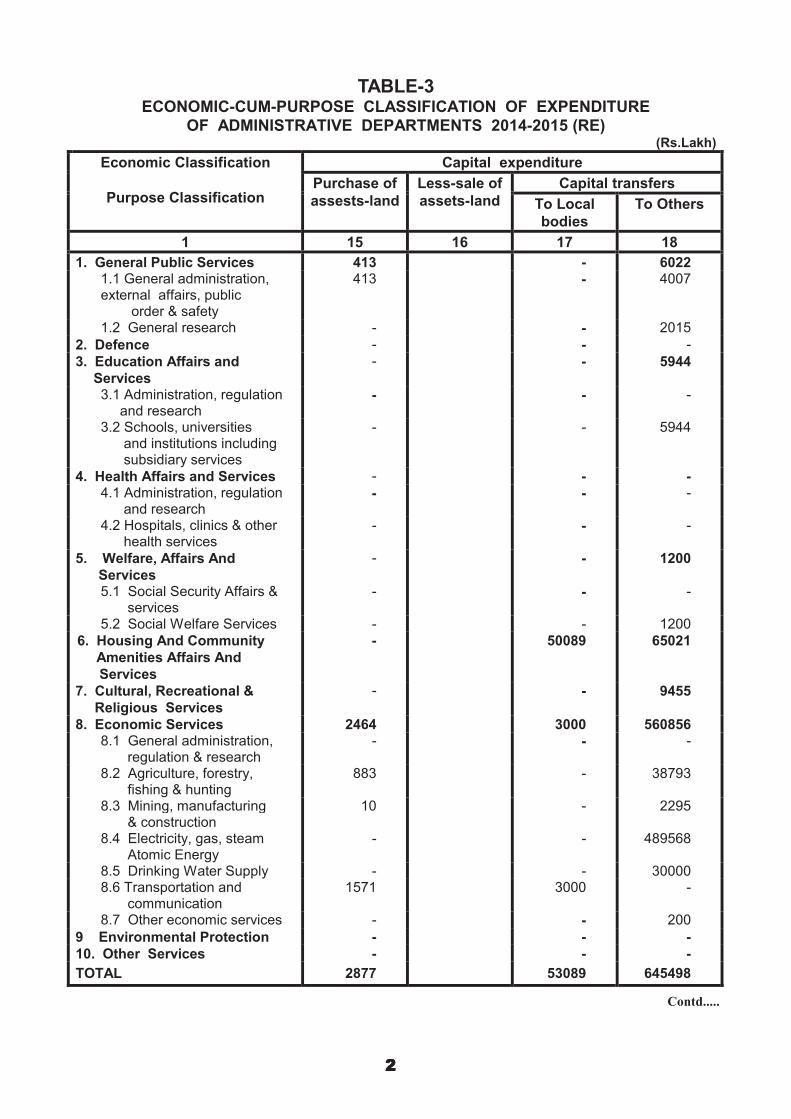
TABLE-2 ECONOMIC-CUM-PURPOSE CLASSIFICATION OF EXPENDITURE
OF ADMINISTRATIVE DEPARTMENTS 2013-2014 (ACCOUNTS) (Rs.Lakh)
Economic Classification Current expenditure
Consumption expenditure
Wages and Commodities Less - Total Purpose Classification salaries and services Sales Consumption
including expenditure pension
1 2 3 4 5
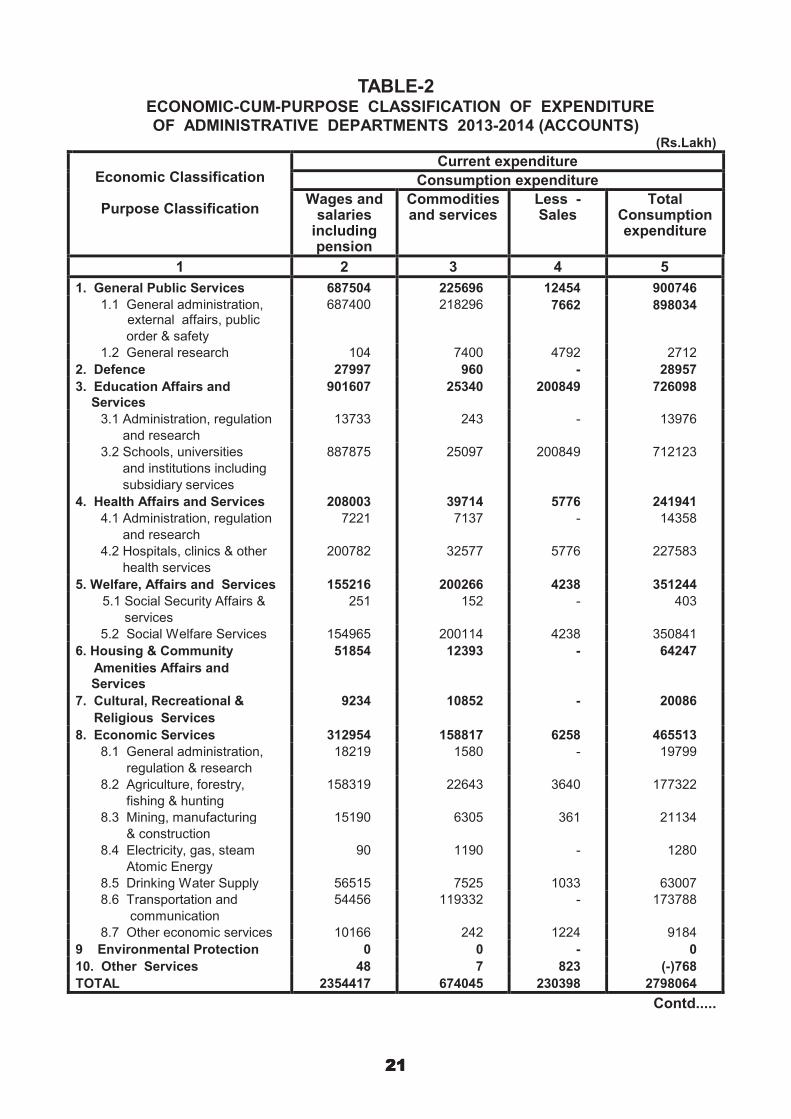
1. General Public Services 687504 225696 12454 900746
1.1 General administration, external affairs, public
order & safety
687400 218296 7662 898034
1.2 General research 104 7400 4792 2712
2. Defence 27997 960 - 28957
3. Education Affairs and
Services
901607 25340 200849 726098
3.1 Administration, regulation
and research
13733 243 - 13976
3.2 Schools, universities
and institutions including
subsidiary services
887875 25097 200849 712123
4. Health Affairs and Services 208003 39714 5776 241941
4.1 Administration, regulation
and research
7221 7137 - 14358
4.2 Hospitals, clinics & other
health services
200782 32577 5776 227583
5. Welfare, Affairs and Services 155216 200266 4238 351244
5.1 Social Security Affairs &
services
251 152 - 403
5.2 Social Welfare Services 154965 200114 4238 350841
6. Housing & Community
Amenities Affairs and
Services
51854 12393 - 64247
7. Cultural, Recreational &
Religious Services
9234 10852 - 20086
8. Economic Services 312954 158817 6258 465513
8.1 General administration,
regulation & research
18219 1580 - 19799
8.2 Agriculture, forestry,
fishing & hunting
158319 22643 3640 177322
8.3 Mining, manufacturing
& construction
15190 6305 361 21134
8.4 Electricity, gas, steam
Atomic Energy
90 1190 - 1280
8.5 Drinking Water Supply 56515 7525 1033 63007
8.6 Transportation and
communication
54456 119332 - 173788
8.7 Other economic services 10166 242 1224 9184
9 Environmental Protection 0 0 - 0
10. Other Services 48 7 823 (-)768
TOTAL 2354417 674045 230398 2798064
Contd.....
����
��������
TABLE-2 ECONOMIC-CUM-PURPOSE CLASSIFICATION OF EXPENDITURE
OF ADMINISTRATIVE DEPARTMENTS 2013-2014 (ACCOUNTS) (Rs.Lakh)
Economic Classification
Purpose Classification
Current expenditure Total current expend-
iture (5+6+9)
Transfer payment
Subsidies Transfer to local bodies
To others Total transfer
payments (7+8)
1 6 7 8 9 10
1. General Public Services
1.1 General administration, external affairs, public
order & safety
1.2 General research
2. Defence
3. Education Affairs and Services
3.1 Administration, regulation
and research
3.2 Schools, universities
and institutions including
subsidiary services
4. Health Affairs and Services
4.1 Administration, regulation
and research
4.2 Hospitals, clinics & other
health services
5. Welfare, Affairs and Services
5.1 Social Security Affairs &
services
5.2 Social Welfare Services
6. Housing & Community
Amenities Affairs and Services
7. Cultural, Recreational &
Religious Services
8. Economic Services
8.1 General administration,
regulation & research
8.2 Agriculture, forestry,
fishing & hunting
8.3 Mining, manufacturing
& construction
8.4 Electricity, gas, steam
Atomic Energy
8.5 Drinking Water Supply
8.6 Transportation and
communication
8.7 Other economic services
9 Environmental Protection
10. Other Services
TOTAL
-
-
-
-
7881
-
7881
-
-
-
168970
-
168970
-
4847
222945
-
139855
29902
18284
-
-
34904
-
-
404643
121531
121531
-
-
387294
-
387294
-
-
-
88332
758
87574
745495
17
60979
-
10530
30323
-
19815
311
-
-
--
1403648
25449
16261
9188
250
293664
13
293651
41458
19
41439
241551
-
241551
11092
28936
79309
244
58992
3686
10314
3141
24
2910
-
58992
780701
146980
137792
9188
250
680958
13
680945
41458
19
41439
329883
758
329125
756587
28953
140288
244
69522
34009
10314
22956
333
2910
-
58992
2184349
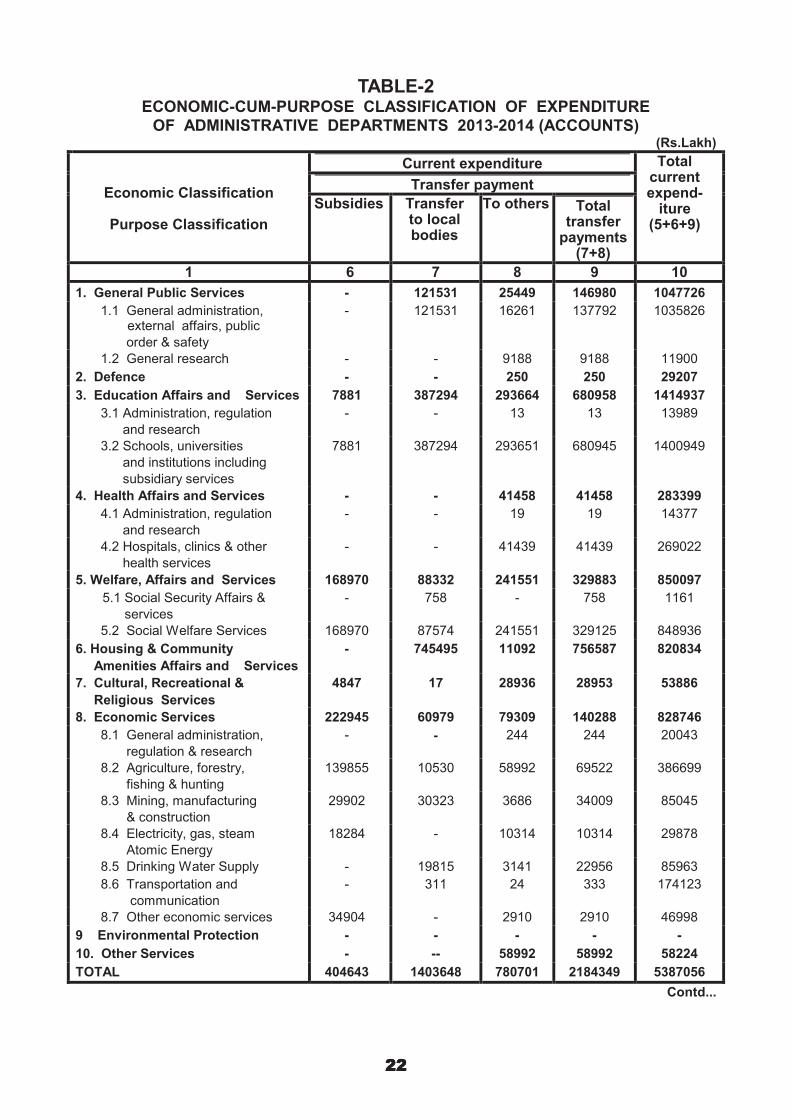
1047726
1035826
11900
29207
1414937
13989
1400949
283399
14377
269022
850097
1161
848936
820834
53886
828746
20043
386699
85045
29878
85963
174123
46998
-
58224
5387056
Contd...
����
��������
TABLE-2
ECONOMIC-CUM-PURPOSE CLASSIFICATION OF EXPENDITURE OF ADMINISTRATIVE DEPARTMENTS 2013-2014 (ACCOUNTS)
(Rs.Lakh)
Economic Classification
Purpose Classification
Capital expenditure
Gross Capital Formation
Buildings and other
Construction s
Machinery and
equipment
Change in stock
Gross capital formation (11+12+13)
1 11 12 13 14
1. General Public Services 1.1 General administration,
external affairs, public order & safety
1.2 General research 2. Defence
3. Education Affairs and Services 3.1 Administration, regulation
and research 3.2 Schools, universities
and institutions including subsidiary services
4. Health Affairs and Services 4.1 Administration, regulation
and research 4.2 Hospitals, clinics & other
health services 5. Welfare Affairs and Services
5.1 Social Security Affairs & services
5.2 Social Welfare Services
6. Housing & Community
Amenities Affairs and Services
7. Cultural, Recreational &
Religious Services
8. Economic Services 8.1 General administration,
regulation & research 8.2 Agriculture, forestry,
fishing & hunting 8.3 Mining, manufacturing
& construction 8.4 Electricity, gas, steam
Atomic Energy
8.5 Drinking Water Supply 8.6 Transportation and
communication 8.7 Other economic services
9 Environmental Protection
10. Other Services
TOTAL
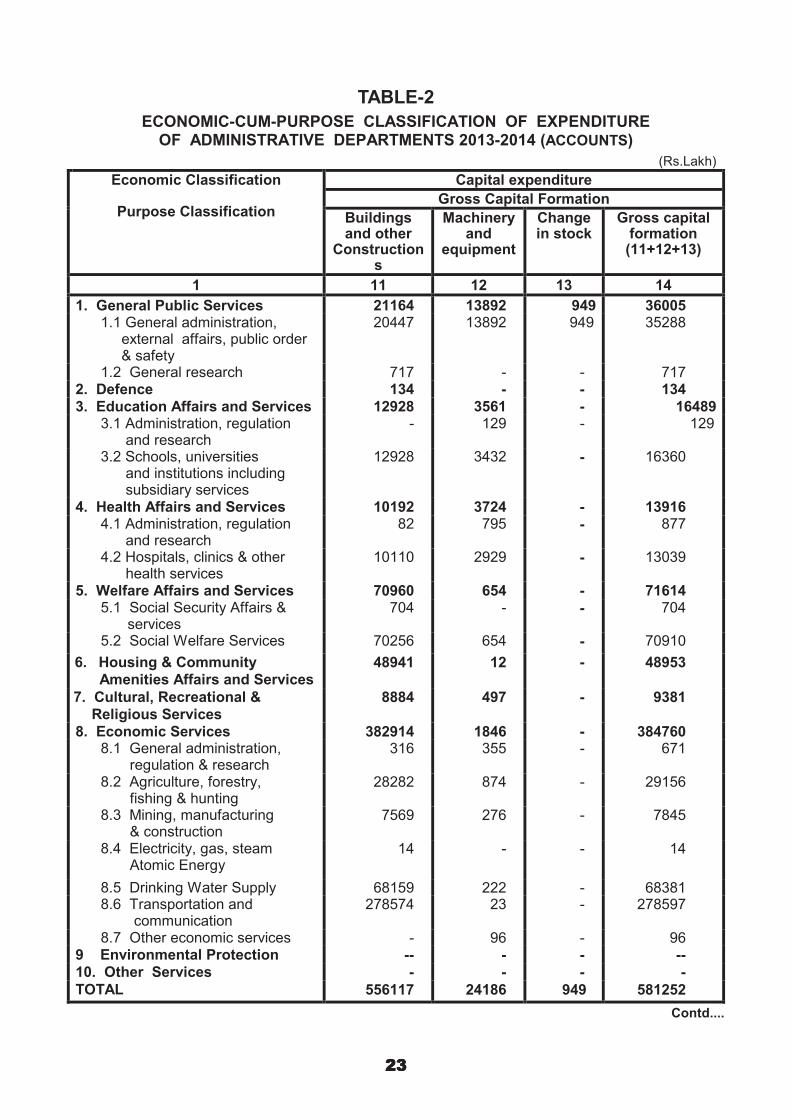
21164 20447
717 134
12928 -
12928
10192 82
10110
70960 704
70256
48941
8884
382914 316
28282
7569
14
68159 278574
---
-
556117
13892 13892
--
3561 129
3432
3724 795
2929
654 -
654
12
497
1846 355
874
276
-
222 23
96 -
-
24186
949 949
--
--
-
-
-
-
-
-
-
-
-
--
-
-
-
--
--
-
949
36005 35288
717 134
16489 129
16360
13916 877
13039
71614 704
70910
48953
9381
384760 671
29156
7845
14
68381 278597
96 --
-
581252
Contd....
����
��������
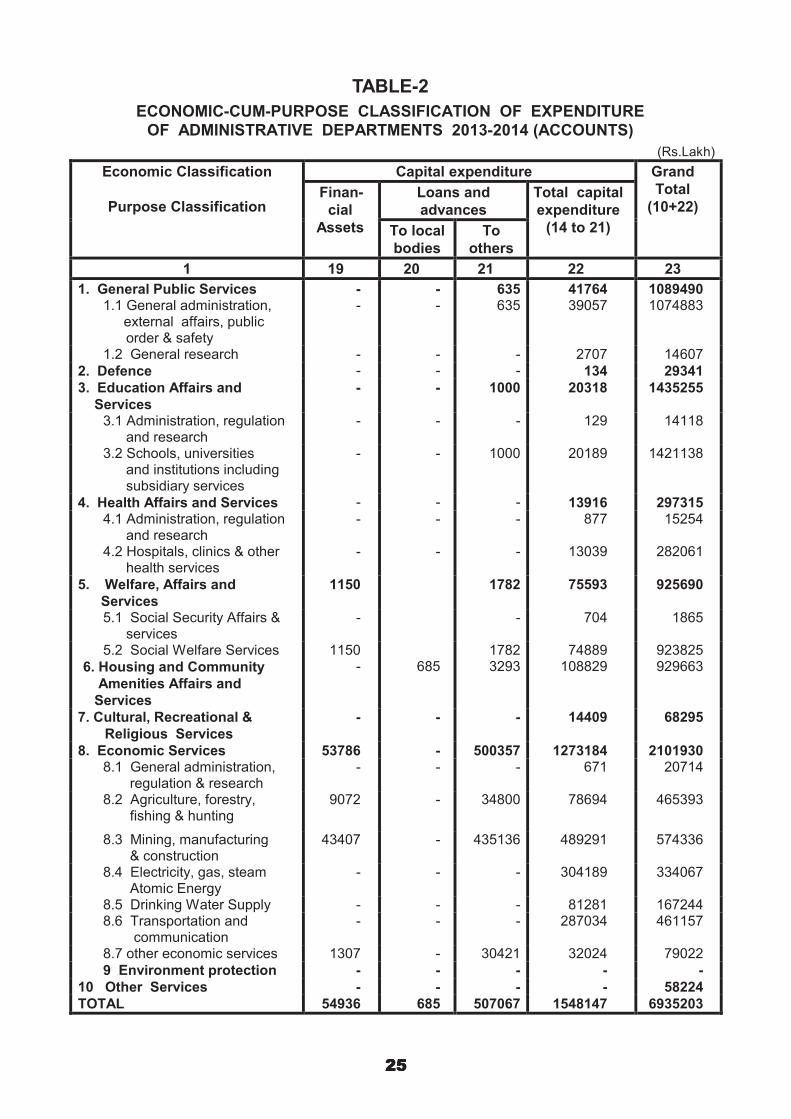
TABLE-2
ECONOMIC-CUM-PURPOSE CLASSIFICATION OF EXPENDITURE
OF ADMINISTRATIVE DEPARTMENTS 2013-2014 (ACCOUNTS)
(Rs.Lakh)
Economic Classification
Purpose Classification
Capital expenditure
Purchase
of assets -
land
Less-sale
of assets-
land
Capital Transfers
To local
bodies
To others
1 15 16 17 18
1. General Public Services
1.1 General administration, external affairs, public order & safety
1.2 General research
2. Defence
3. Education Affairs and Services 3.1 Administration, regulation
and research 3.2 Schools, universities
and institutions including subsidiary services
4. Health Affairs and Services 4.1 Administration, regulation
and research 4.2 Hospitals, clinics & other
health services
5. Welfare, Affairs and Services 5.1 Social Security Affairs &
services 5.2 Social Welfare Services
6. Housing and Community
Amenities Affairs and Services
7. Cultural, Recreational &
Religious Services
8. Economic Services 8.1 General administration,
regulation & research 8.2 Agriculture, forestry,
fishing & hunting 8.3 Mining, manufacturing
& construction 8.4 Electricity, gas, steam
Atomic Energy 8.5 Drinking Water Supply
8.6 Transportation and communication
8.7 Other economic services
9 Environmental Protection
10. Other Services
TOTAL
800
800
-
-
--
-
-
-
-
-
-
-
75
-
6239
-
202
-
-
-6037
-
-
-
7114
12868
-
2066
-
-
-
-
2066
-
-
-
-
14934
4324
2334
1990
-
2829 -
2829
--
-
1047 -
1047
42955
5028
325976
-
5464
2903
304175
10834
2400
200
--
382159
Contd.....
����
��������
TABLE-2
ECONOMIC-CUM-PURPOSE CLASSIFICATION OF EXPENDITURE
OF ADMINISTRATIVE DEPARTMENTS 2013-2014 (ACCOUNTS)
(Rs.Lakh)
Economic Classification
Purpose Classification
Capital expenditure Grand
Total
(10+22) Finan-
cial
Assets
Loans and
advances
Total capital
expenditure
(14 to 21)To local
bodies
To
others
1 19 20 21 22 23
1. General Public Services 1.1 General administration,
external affairs, public order & safety
1.2 General research
2. Defence
3. Education Affairs and
Services 3.1 Administration, regulation
and research 3.2 Schools, universities
and institutions including subsidiary services
4. Health Affairs and Services 4.1 Administration, regulation
and research 4.2 Hospitals, clinics & other
health services
5. Welfare, Affairs and
Services 5.1 Social Security Affairs &
services 5.2 Social Welfare Services
6. Housing and Community
Amenities Affairs and
Services
7. Cultural, Recreational &
Religious Services
8. Economic Services 8.1 General administration,
regulation & research 8.2 Agriculture, forestry,
fishing & hunting
8.3 Mining, manufacturing & construction
8.4 Electricity, gas, steam Atomic Energy
8.5 Drinking Water Supply 8.6 Transportation and
communication 8.7 other economic services
9 Environment protection
10 Other Services
TOTAL
--
--
-
-
-
-
-
-
1150
-
1150 -
-
53786 -
9072
43407
-
--
1307
-
-
54936
--
--
-
-
-
-
-
-
685
-
--
-
-
-
--
-
-
-
685
635 635
--
1000
-
1000
-
-
-
1782
-
1782 3293
-
500357 -
34800
435136
-
--
30421
-
-
507067
41764 39057
2707
134
20318
129
20189
13916 877
13039
75593
704
74889 108829
14409
1273184 671
78694
489291
304189
81281 287034
32024
-
-
1548147
1089490 1074883
14607
29341
1435255
14118
1421138
297315 15254
282061
925690
1865
923825 929663
68295
2101930 20714
465393
574336
334067
167244 461157
79022
-
58224
6935203
����
��� ��
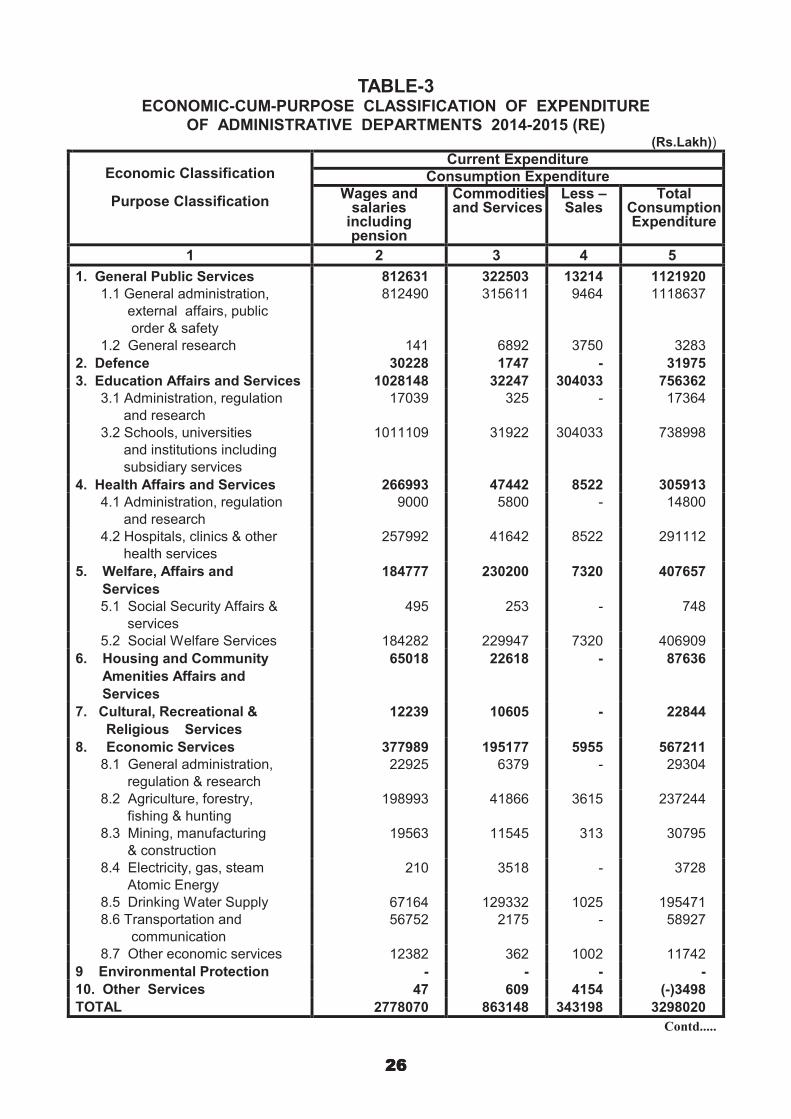
TABLE-3 ECONOMIC-CUM-PURPOSE CLASSIFICATION OF EXPENDITURE
OF ADMINISTRATIVE DEPARTMENTS 2014-2015 (RE) (Rs.Lakh))
Economic Classification
Purpose Classification
Current Expenditure
Consumption Expenditure Wages and
salaries including pension
Commodities and Services
Less – Sales
Total Consumption Expenditure
1 2 3 4 5
1. General Public Services
1.1 General administration,
external affairs, public
order & safety
1.2 General research
2. Defence
3. Education Affairs and Services
3.1 Administration, regulation
and research
3.2 Schools, universities
and institutions including
subsidiary services
4. Health Affairs and Services
4.1 Administration, regulation
and research
4.2 Hospitals, clinics & other
health services
5. Welfare, Affairs and
Services
5.1 Social Security Affairs &
services
5.2 Social Welfare Services
6. Housing and Community
Amenities Affairs and
Services
7. Cultural, Recreational &
Religious Services
8. Economic Services
8.1 General administration,
regulation & research
8.2 Agriculture, forestry,
fishing & hunting
8.3 Mining, manufacturing
& construction
8.4 Electricity, gas, steam
Atomic Energy
8.5 Drinking Water Supply
8.6 Transportation and
communication
8.7 Other economic services
9 Environmental Protection
10. Other Services
TOTAL
812631
812490
141
30228
1028148
17039
1011109
266993
9000
257992
184777
495
184282
65018
12239
377989
22925
198993
19563
210
67164
56752
12382
-
47
2778070
322503
315611
6892
1747
32247
325
31922
47442
5800
41642
230200
253
229947
22618
10605
195177
6379
41866
11545
3518
129332
2175
362
-
609
863148
13214
9464
3750
-
304033
-
304033
8522
-
8522
7320
-
7320
-
-
5955
-
3615
313
-
1025
-
1002
-
4154
343198
1121920
1118637
3283
31975
756362
17364
738998
305913
14800
291112
407657
748
406909
87636
22844
567211
29304
237244
30795
3728
195471
58927
11742
-
(-)3498
3298020
Contd.....
� ��

��������
TABLE-3 ECONOMIC-CUM-PURPOSE CLASSIFICATION OF EXPENDITURE
OF ADMINISTRATIVE DEPARTMENTS 2014-2015 (RE) (Rs.Lakh)
Economic Classification
Purpose Classification
Current expenditure
Transfer payment
Subsidies Transfer to
local
bodies
To others Total
Transfer
Payment
(7+8)
Total
current
expendi-
ture
(5+6+9)
1 6 7 8 9 10
1. General Public Services 1.1 General administration,
external affairs, public order & safety
1.2 General research
2. Defence
3. Education Affairs and
Services 3.1 Administration, regulation
and research 3.2 Schools, universities
and institutions including subsidiary services
4. Health Affairs and Services 4.1 Administration, regulation
and research 4.2 Hospitals, clinics & other
health services
5. Welfare, Affairs And
Services 5.1 Social Security Affairs &
services 5.2 Social Welfare Services
6. Housing And Community
Amenities Affairs And
Services
7. Cultural, Recreational &
Religious Services
8. Economic Services 8.1 General administration,
regulation & research 8.2 Agriculture, forestry,
fishing & hunting 8.3 Mining, manufacturing
& construction 8.4 Electricity, gas, steam
Atomic Energy 8.5 Drinking Water Supply 8.6 Transportation and
communication 8.7 Other economic services
9 Environmental Protection
10. Other Services
TOTAL
--
-
-
7700
-
7700
--
-
221395
-
221395
-
5275
268147 150890
56635
13000
-
--
47622
-
-
502517
144147 144147
-
-
438703
-
438703
--
-
112819
2092
110727
1489813
18
71234 -
7604
34703
-
28923 4
-
-
-
2256734
42645 28039
14606
444
569381
31
569350
160974 61
160913
344885
-
344885
16396
33176
270525 239
234781
13307
8058
7603 20
6517
-
185780
1624206
186792 172186
14606
444
1008084
31
1008053
160974 61
160913
457704
2092
455612
1506209
33194
341759 239
242385
48010
8058
36526 24
6517
-
185780
3880940
1308712 1290823
17889
32419
1772146
17395
1754751
466887 14861
452025
1086756
2840
1083916
1593845
61313
1177117 180433
536264
91805
11786
231997 58951
65881
-
182282
7681477
Contd.....
����
��� ��
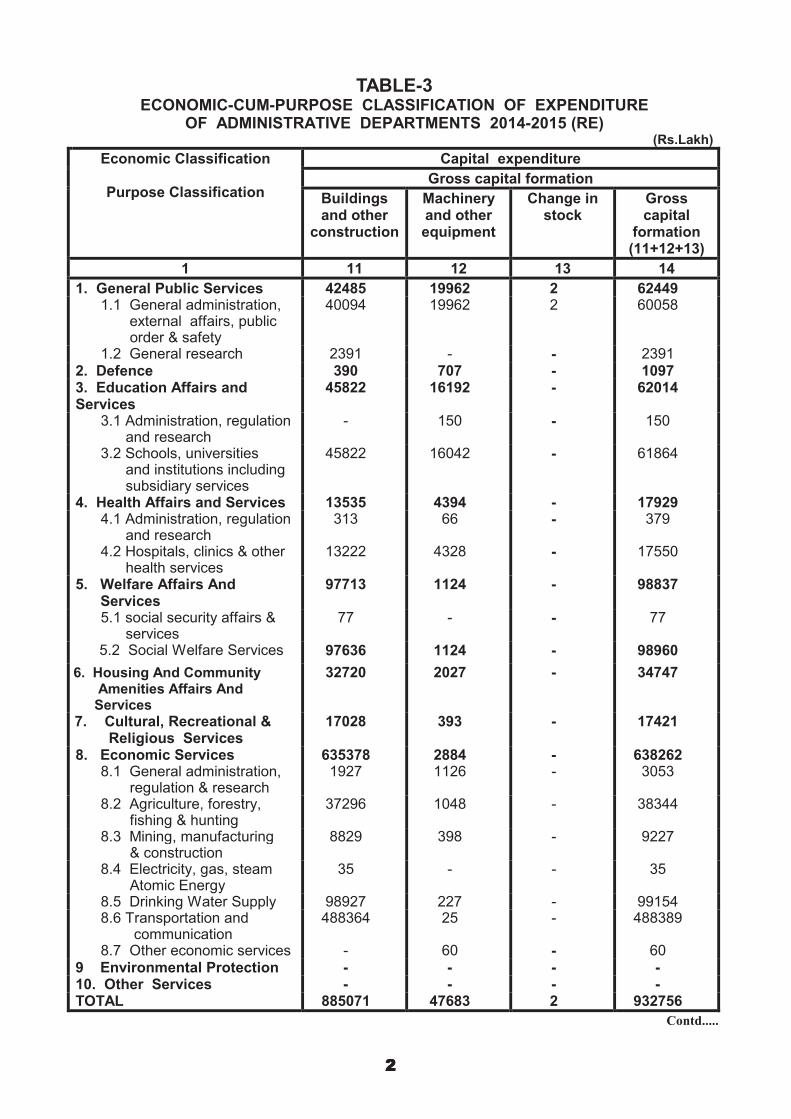
TABLE-3 ECONOMIC-CUM-PURPOSE CLASSIFICATION OF EXPENDITURE
OF ADMINISTRATIVE DEPARTMENTS 2014-2015 (RE) (Rs.Lakh)
Economic Classification
Purpose Classification
Capital expenditure
Gross capital formation
Buildings and other
construction
Machinery and other equipment
Change in stock
Gross capital
formation (11+12+13)
1 11 12 13 14
1. General Public Services 1.1 General administration,
external affairs, public order & safety
1.2 General research 2. Defence 3. Education Affairs and Services
3.1 Administration, regulation and research
3.2 Schools, universities and institutions including subsidiary services
4. Health Affairs and Services 4.1 Administration, regulation
and research 4.2 Hospitals, clinics & other
health services 5. Welfare Affairs And
Services 5.1 social security affairs &
services 5.2 Social Welfare Services
6. Housing And Community Amenities Affairs And Services
7. Cultural, Recreational & Religious Services
8. Economic Services 8.1 General administration,
regulation & research 8.2 Agriculture, forestry,
fishing & hunting 8.3 Mining, manufacturing
& construction 8.4 Electricity, gas, steam
Atomic Energy 8.5 Drinking Water Supply 8.6 Transportation and
communication 8.7 Other economic services
9 Environmental Protection 10. Other Services TOTAL
42485 40094
2391 390
45822
-
45822
13535 313
13222
97713
77
97636
32720
17028
635378 1927
37296
8829
35
98927 488364
---
885071
19962 19962
-707
16192
150
16042
4394 66
4328
1124
-
1124
2027
393
2884 1126
1048
398
-
227 25
60 --
47683
2 2
---
-
-
--
-
-
-
-
-
-
--
-
-
-
--
---2
62449 60058
2391 1097
62014
150
61864
17929 379
17550
98837
77
98960
34747
17421
638262 3053
38344
9227
35
99154 488389
60 --
932756
Contd.....
� ��
��� ��
TABLE-3 ECONOMIC-CUM-PURPOSE CLASSIFICATION OF EXPENDITURE
OF ADMINISTRATIVE DEPARTMENTS 2014-2015 (RE) (Rs.Lakh)
Economic Classification
Purpose Classification
Capital expenditure
Purchase of
assests-land
Less-sale of
assets-land
Capital transfers
To Local
bodies
To Others
1 15 16 17 18
1. General Public Services 1.1 General administration, external affairs, public
order & safety 1.2 General research
2. Defence
3. Education Affairs and
Services 3.1 Administration, regulation
and research 3.2 Schools, universities
and institutions including subsidiary services
4. Health Affairs and Services 4.1 Administration, regulation
and research 4.2 Hospitals, clinics & other
health services
5. Welfare, Affairs And
Services 5.1 Social Security Affairs &
services 5.2 Social Welfare Services
6. Housing And Community
Amenities Affairs And
Services
7. Cultural, Recreational &
Religious Services
8. Economic Services 8.1 General administration,
regulation & research 8.2 Agriculture, forestry,
fishing & hunting 8.3 Mining, manufacturing
& construction 8.4 Electricity, gas, steam
Atomic Energy 8.5 Drinking Water Supply 8.6 Transportation and
communication 8.7 Other economic services
9 Environmental Protection
10. Other Services
TOTAL
413 413
-
-
-
-
-
-
-
-
-
-
-
-
-
2464 -
883
10
-
-1571
-
-
-
2877
-
-
-
-
-
-
-
-
-
-
-
-
-
50089
-
3000
-
-
-
-
-3000
-
-
-
53089
6022 4007
2015
-
5944
-
5944
--
-
1200
-
1200
65021
9455
560856 -
38793
2295
489568
30000 -
200
-
-
645498
Contd.....
� ��
����
��� ��
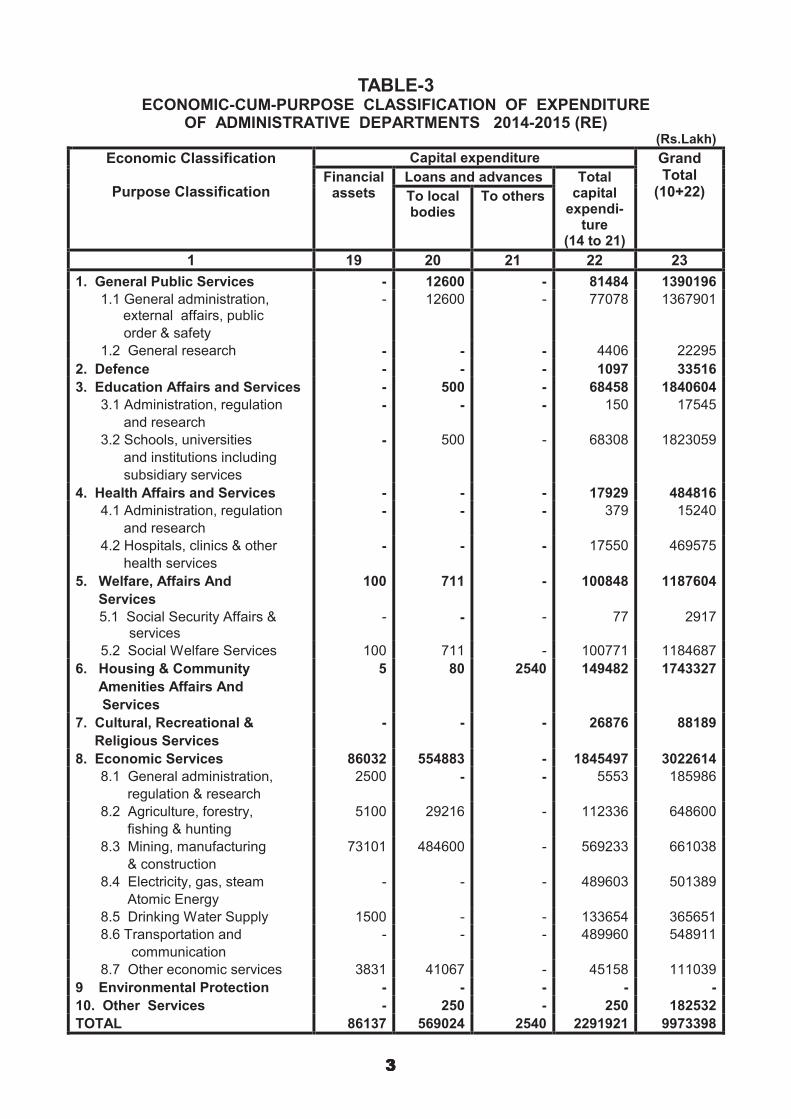
TABLE-3 ECONOMIC-CUM-PURPOSE CLASSIFICATION OF EXPENDITURE
OF ADMINISTRATIVE DEPARTMENTS 2014-2015 (RE) (Rs.Lakh)
Economic Classification
Purpose Classification
Capital expenditure Grand Total
(10+22) Financial
assets Loans and advances Total
capitalTo local To others bodies expendi-
ture (14 to 21)
1 19 20 21 22 23
1. General Public Services
1.1 General administration, external affairs, public
order & safety
1.2 General research
2. Defence
3. Education Affairs and Services
3.1 Administration, regulation
and research
3.2 Schools, universities
and institutions including
subsidiary services
4. Health Affairs and Services
4.1 Administration, regulation
and research
4.2 Hospitals, clinics & other
health services
5. Welfare, Affairs And
Services
5.1 Social Security Affairs & services
5.2 Social Welfare Services
6. Housing & Community
Amenities Affairs And
Services
7. Cultural, Recreational &
Religious Services
8. Economic Services
8.1 General administration,
regulation & research
8.2 Agriculture, forestry,
fishing & hunting
8.3 Mining, manufacturing
& construction
8.4 Electricity, gas, steam
Atomic Energy
8.5 Drinking Water Supply
8.6 Transportation and
communication
8.7 Other economic services
9 Environmental Protection
10. Other Services
TOTAL
-
-
-
-
-
-
-
-
-
-
100
-
100
5
-
86032
2500
5100
73101
-
1500
-
3831
-
-
86137
12600
12600
-
-
500
-
500
-
-
-
711
-
711
80
-
554883
-
29216
484600
-
-
-
41067
-
250
569024
-
-
-
-
-
-
-
-
-
-
-
-
-
2540
-
-
-
-
-
-
-
-
-
-
-
2540
81484
77078
4406
1097
68458
150
68308
17929
379
17550
100848
77
100771
149482
26876
1845497
5553
112336
569233
489603
133654
489960
45158
-
250
2291921
1390196
1367901
22295
33516
1840604
17545
1823059
484816
15240
469575
1187604
2917
1184687
1743327
88189
3022614
185986
648600
661038
501389
365651
548911
111039
-
182532
9973398
� ��

��������
P A R T - III
R e c o n c i l i a t i o n S t a t e m e n t s
����

������������
��������
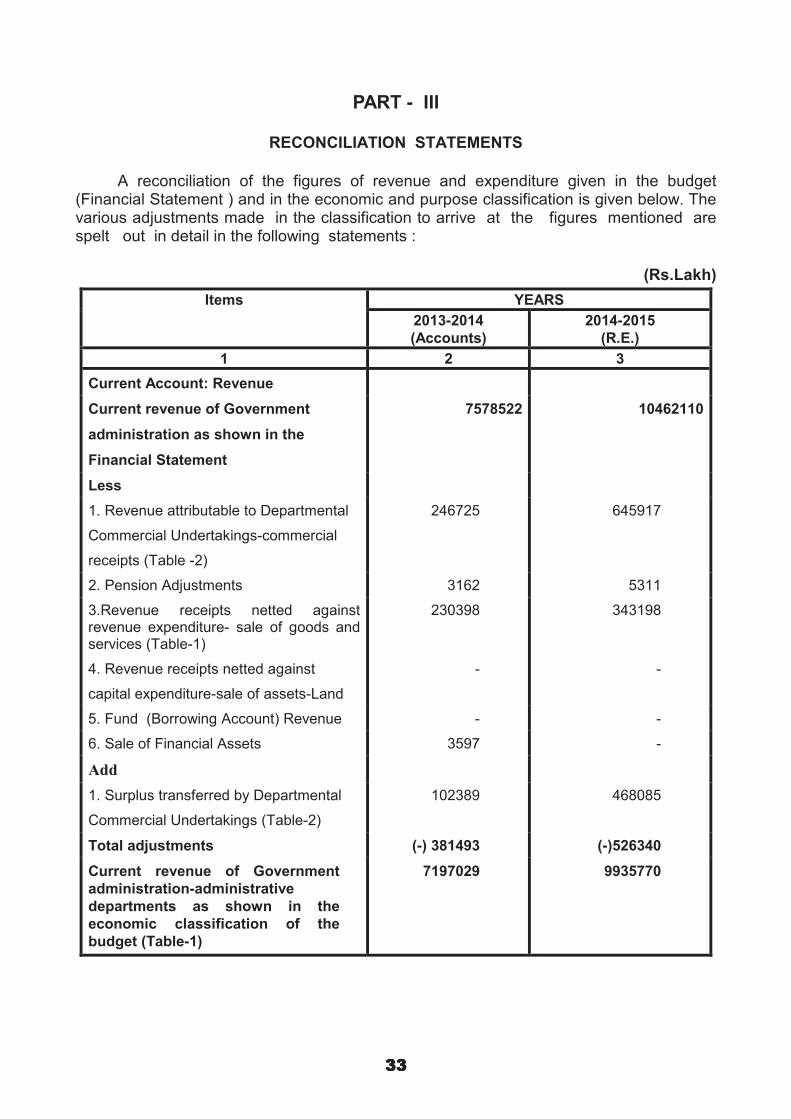
PART - III
RECONCILIATION STATEMENTS
A reconciliation of the figures of revenue and expenditure given in the budget (Financial Statement ) and in the economic and purpose classification is given below. The various adjustments made in the classification to arrive at the figures mentioned are spelt out in detail in the following statements :
(Rs.Lakh)
Items YEARS
2013-2014
(Accounts)
2014-2015
(R.E.)
1 2 3
Current Account: Revenue
Current revenue of Government
administration as shown in the
Financial Statement
Less
1. Revenue attributable to Departmental
Commercial Undertakings-commercial
receipts (Table -2)
2. Pension Adjustments
3.Revenue receipts netted against revenue expenditure- sale of goods and services (Table-1)
4. Revenue receipts netted against
capital expenditure-sale of assets-Land
5. Fund (Borrowing Account) Revenue
6. Sale of Financial Assets
Add
1. Surplus transferred by Departmental
Commercial Undertakings (Table-2)
Total adjustments
Current revenue of Government
administration-administrative
departments as shown in the
economic classification of the
budget (Table-1)
7578522
246725
3162
230398
-
-
3597
102389
(-) 381493
7197029
10462110
645917
5311
343198
-
-
-
468085
(-)526340
9935770
����

��������
(Rs.Lakh)
Items YEARS
2013-2014 (Accounts)
2014-2015 (R.E.)
1 2 3
Total Expenditure
As per Consolidated Fund shown in the
Financial Statement
Less
1. Current expenditure of Departmental Commercial Undertakings (Table-2)
2. Capital formation in Departmental
Commercial Undertakings (Table-3)
3. Net purchase of physical assets in
Departmental Commercial
Undertakings-land (Table-3)
4. Revenue receipts netted against
revenue expenditure (Table-1)
5. Revenue receipts netted against capital expenditure
6. Fund (Borrowing account)
7. Interest (Table-1)
8. Repayment of public debt
9. Other Debt (Borrowing Account)
10. Pension Adjustments
11. Sale of Financial Assets
Add
1. Imputed subsidy
Total adjustment
Total expenditure as shown in the
economic-cum-purpose classification
of the budget
8976444
245194
463314
-
230398
-
156838
639132
400464
-
3162
3597
100858
(-) 2041241
6935203
12339986
260828
482739
-
343198
-
151791
687487
518231
-
5311
-
82996
(-) 2366588
9973398
����

��������
P A R T - IV
S o m e S i g n i f i c a n t M a g n i t u d e s
����

��� ��� ��
��������
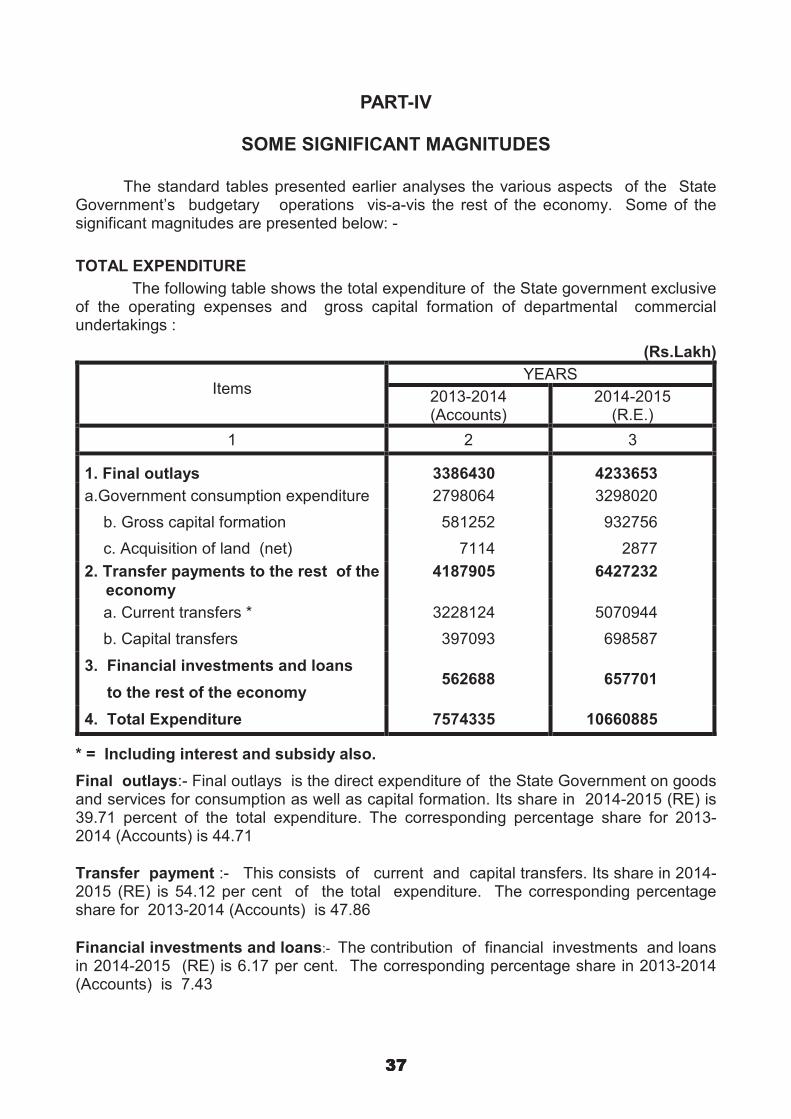
PART-IV
SOME SIGNIFICANT MAGNITUDES
The standard tables presented earlier analyses the various aspects of the State Government’s budgetary operations vis-a-vis the rest of the economy. Some of the significant magnitudes are presented below: -
TOTAL EXPENDITURE
The following table shows the total expenditure of the State government exclusive of the operating expenses and gross capital formation of departmental commercial undertakings :
(Rs.Lakh)
Items YEARS
2013-2014 (Accounts)
2014-2015 (R.E.)
1 2 3
1. Final outlays 3386430 4233653
a.Government consumption expenditure 2798064 3298020
b. Gross capital formation 581252 932756
c. Acquisition of land (net) 7114 2877
2. Transfer payments to the rest of the
economy
4187905 6427232
a. Current transfers * 3228124 5070944
b. Capital transfers
3. Financial investments and loans
397093 698587
to the rest of the economy 562688 657701
4. Total Expenditure 7574335 10660885
* = Including interest and subsidy also.
Final outlays:- Final outlays is the direct expenditure of the State Government on goods and services for consumption as well as capital formation. Its share in 2014-2015 (RE) is 39.71 percent of the total expenditure. The corresponding percentage share for 2013-2014 (Accounts) is 44.71
Transfer payment :- This consists of current and capital transfers. Its share in 2014-2015 (RE) is 54.12 per cent of the total expenditure. The corresponding percentage share for 2013-2014 (Accounts) is 47.86
Financial investments and loans:- The contribution of financial investments and loans in 2014-2015 (RE) is 6.17 per cent. The corresponding percentage share in 2013-2014 (Accounts) is 7.43
����
��� ��
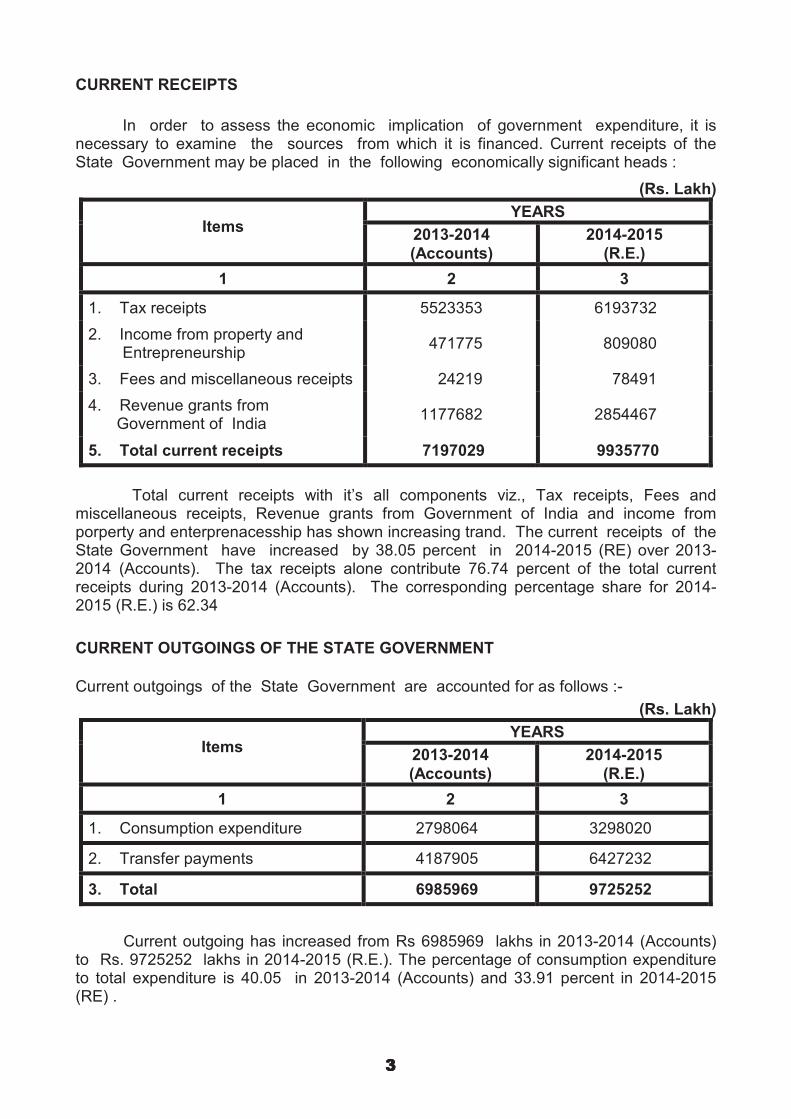
CURRENT RECEIPTS
In order to assess the economic implication of government expenditure, it is necessary to examine the sources from which it is financed. Current receipts of the State Government may be placed in the following economically significant heads :
(Rs. Lakh)
Items YEARS
2013-2014
(Accounts)
2014-2015
(R.E.)
1 2 3
1.
2.
3.
4.
5.
Tax receipts
Income from property and Entrepreneurship
Fees and miscellaneous receipts
Revenue grants from Government of India
Total current receipts
5523353
471775
24219
1177682
7197029
6193732
809080
78491
2854467
9935770
Total current receipts with it’s all components viz., Tax receipts, Fees and miscellaneous receipts, Revenue grants from Government of India and income from porperty and enterprenacesship has shown increasing trand. The current receipts of the State Government have increased by 38.05 percent in 2014-2015 (RE) over 2013-2014 (Accounts). The tax receipts alone contribute 76.74 percent of the total current receipts during 2013-2014 (Accounts). The corresponding percentage share for 2014-2015 (R.E.) is 62.34
CURRENT OUTGOINGS OF THE STATE GOVERNMENT
Current outgoings of the State Government are accounted for as follows :-
(Rs. Lakh)
Items YEARS
2013-2014
(Accounts)
2014-2015
(R.E.)
1 2 3
1. Consumption expenditure 2798064 3298020
2. Transfer payments 4187905 6427232
3. Total 6985969 9725252
Current outgoing has increased from Rs 6985969 lakhs in 2013-2014 (Accounts) to Rs. 9725252 lakhs in 2014-2015 (R.E.). The percentage of consumption expenditure to total expenditure is 40.05 in 2013-2014 (Accounts) and 33.91 percent in 2014-2015 (RE) .
� ��

��� ��
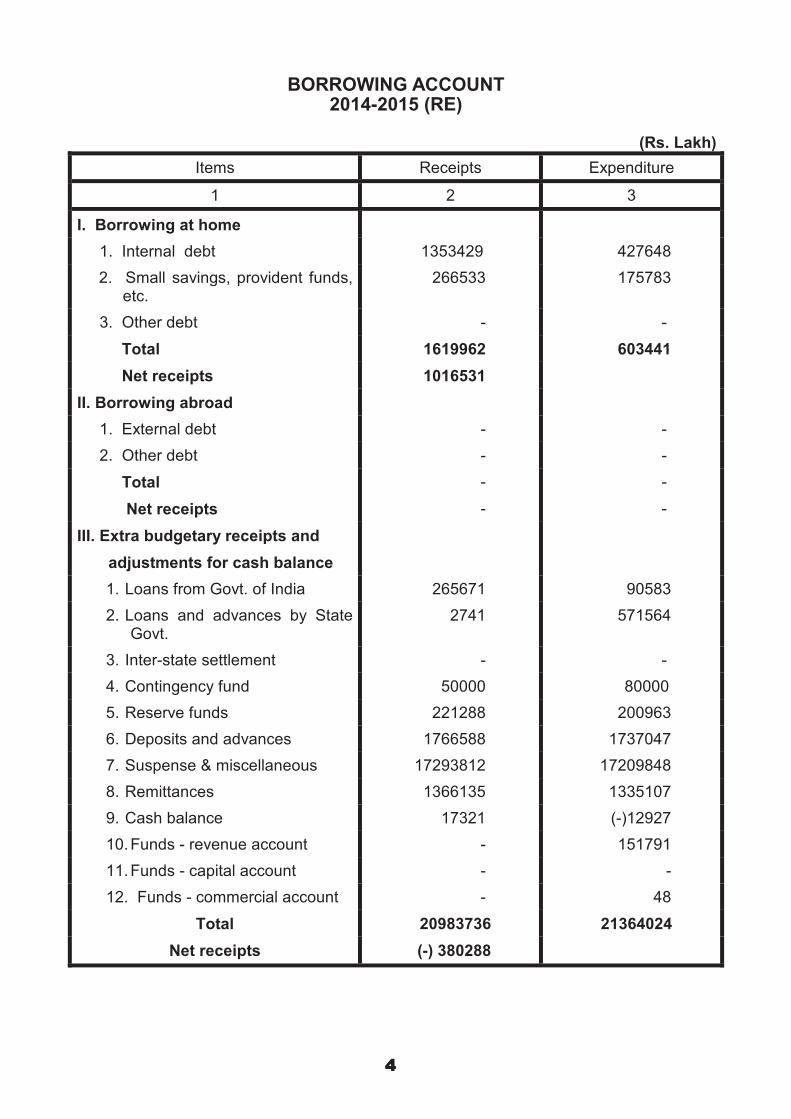
Net receipts from borrowing and extra-budgetary resources have been shown in the accounts given below :-
BORROWING ACCOUNT
2013-2014 (ACCOUNTS)
(Rs. Lakh)
Items Receipts Expenditure
1 2 3
I. Borrowing at home
1. Internal debt
2. Small savings, provident funds, etc.
3. Other debt
Total
Net receipts
II. Borrowing abroad
1. External debt
2. Other debt
Total
Net receipts
III. Extra budgetary receipts and
adjustments for cash balance
1. Loans from Govt. of India
2. Loans and advances by State Govt.
3. Inter-state settlement
4. Contingency fund
5. Reserve funds
6. Deposits and advances
7. Suspense & miscellaneous
8. Remittances
9. Cash balance
10.Funds - revenue account
11.Funds - capital account
12.Funds - commercial account
Total
Net receipts
832838
278403
-
1111241
603352
-
-
-
-
121244
9323
244
-
161200
1036884
24747987
1560217
(-)26275
-
-
-
27610824
(-) 270504
324262
183627
-
507889
-
-
-
-
76202
507752
236
-
64394
1085759
24441152
1531654
17321
156838
-
20
27881328
� ��
����
��� ��
BORROWING ACCOUNT 2014-2015 (RE)
(Rs. Lakh)
Items Receipts Expenditure
1 2 3
I. Borrowing at home
1. Internal debt
2. Small savings, provident funds, etc.
3. Other debt
Total
Net receipts
II. Borrowing abroad
1. External debt
2. Other debt
Total
Net receipts
III. Extra budgetary receipts and
adjustments for cash balance
1. Loans from Govt. of India
2. Loans and advances by State Govt.
3. Inter-state settlement
4. Contingency fund
5. Reserve funds
6. Deposits and advances
7. Suspense & miscellaneous
8. Remittances
9. Cash balance
10. Funds - revenue account
11. Funds - capital account
12. Funds - commercial account
Total
Net receipts
1353429
266533
-
1619962
1016531
-
-
-
-
265671
2741
-
50000
221288
1766588
17293812
1366135
17321
-
-
-
20983736
(-) 380288
427648
175783
-
603441
-
-
-
-
90583
571564
-
80000
200963
1737047
17209848
1335107
(-)12927
151791
-
48
21364024
� ��
��������
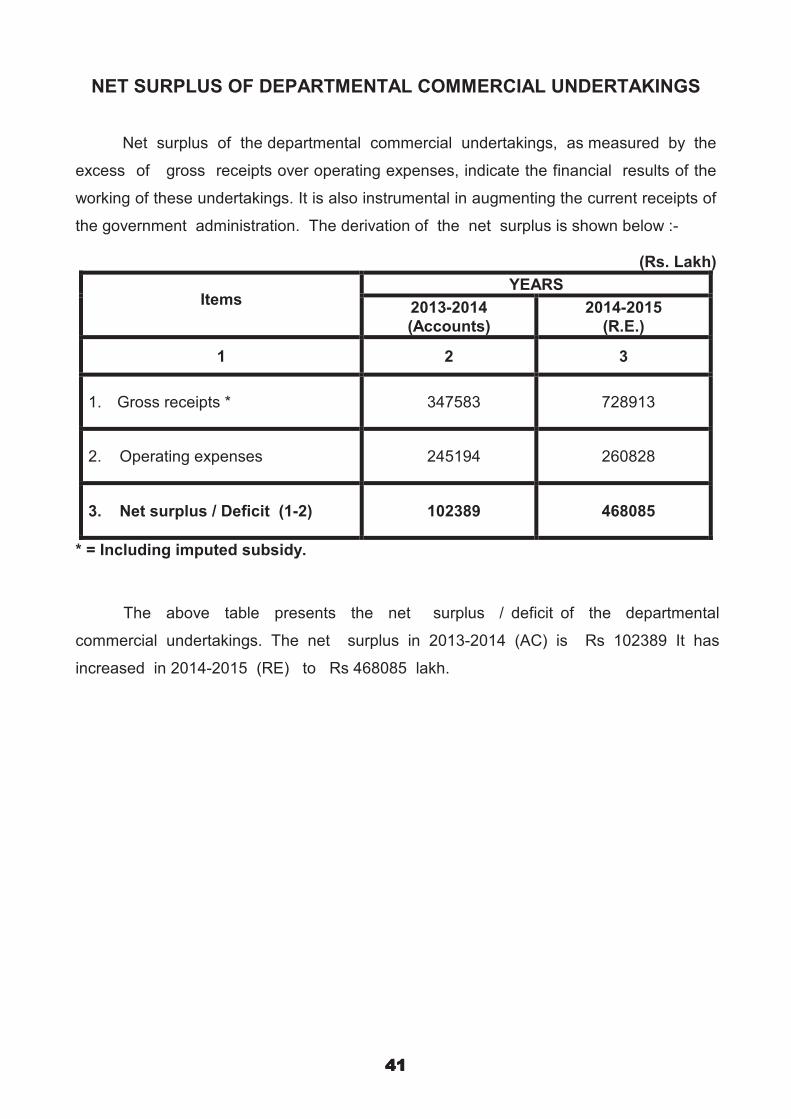
NET SURPLUS OF DEPARTMENTAL COMMERCIAL UNDERTAKINGS
Net surplus of the departmental commercial undertakings, as measured by the
excess of gross receipts over operating expenses, indicate the financial results of the
working of these undertakings. It is also instrumental in augmenting the current receipts of
the government administration. The derivation of the net surplus is shown below :-
(Rs. Lakh)
Items YEARS
2013-2014
(Accounts)
2014-2015
(R.E.)
1 2 3
1. Gross receipts * 347583 728913
2. Operating expenses 245194 260828
3. Net surplus / Deficit (1-2) 102389 468085
* = Including imputed subsidy.
The above table presents the net surplus / deficit of the departmental
commercial undertakings. The net surplus in 2013-2014 (AC) is Rs 102389 It has
increased in 2014-2015 (RE) to Rs 468085 lakh.
����

��������
ESTIMATES OF NET PRODUCT FROM PUBLIC ADMINISTRATION
(Rs. Lakh)
Items YEARS
2013-2014
(Accounts)
2014-2015
(R.E.)
1 2 3
Administration
1. Total wages and salaries
Less wages and salaries in :
2354417 2778070
2. Construction
(Repairs and maintenance)
81681 94891
3. Water supply 54870 65206
4. Other services 1090302 1270675
a. Education 887875 1011109
b. Medical and public health 200782 257992
c. Sanitation 1645 1574
5. Sub - Total (2 to 4) 1226853 1430772
6. Public administration (1-5) 1127564 1347298
Note : Wages and salaries include pension. Total pension is proportionately distributed in public administration and departmental enterprises.
����
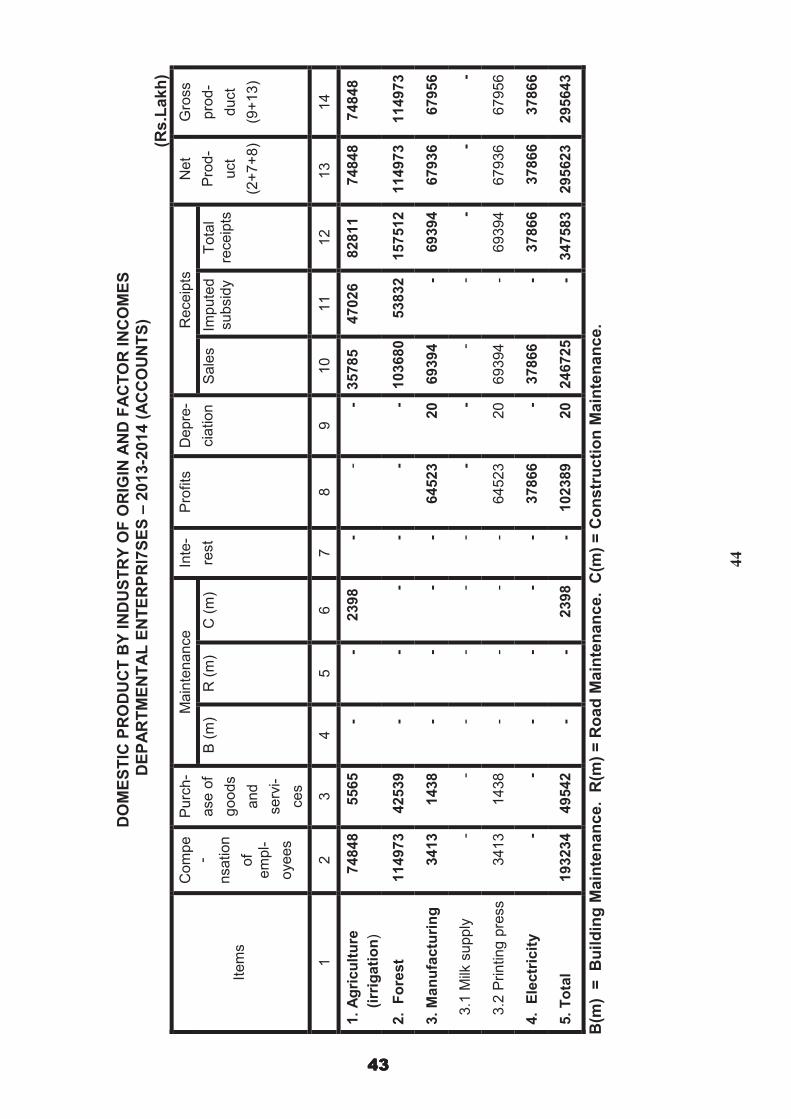
������������
DO
ME
ST
IC P
RO
DU
CT
BY
IN
DU
ST
RY
OF
OR
IGIN
AN
D F
AC
TO
R I
NC
OM
ES
DE
PA
RT
ME
NT
AL
EN
TE
RP
RI7
SE
S –
20
13
-20
14 (
AC
CO
UN
TS
)
(Rs
.La
kh
)
Item
s
Com
pe
-
nsation
of
em
pl-
oyees
Purc
h-
ase o
f
goods
and
serv
i-
ces
Main
tenance
Inte
-
rest
Pro
fits
D
epre
-
cia
tion
Receip
ts
Net
Pro
d-
uct
(2+
7+
8)
Gro
ss
pro
d-
duct
(9+
13)
B (
m)
R (
m)
C (
m)
Sale
s
Impute
dsubsid
y
Tota
lre
ceip
ts
1
2
3
4
5
6
7
8
9
10
11
12
13
14
1.
Ag
ricu
ltu
re
(irr
igati
on
)
2.
Fo
rest
3.
Man
ufa
ctu
rin
g
3.1
Milk
supply
3.2
Printing p
ress
4.
Ele
ctr
icit
y
5.
To
tal
74848
114973
3413 -
3413 -
193234
5565
42539
1438 -
1438 -
49542
- - - - - - -
- - - - - - -
2398 - - - - -
2398
- - - - - - -
- -
64523 -
64523
37866
102389
- -
20 -
20 -
20
35785
103680
69394 -
69394
37866
246725
47026
53832 - - - - -
82811
157512
69394 -
69394
37866
347583
74848
11497
3
679
36 -
67
936
37866
295
623
74848
114973
67956 -
67956
37866
295643
B(m
) =
B
uil
din
g M
ain
ten
an
ce
. R
(m)
= R
oa
d M
ain
ten
an
ce
. C
(m)
= C
on
str
uc
tio
n M
ain
ten
an
ce
.
44
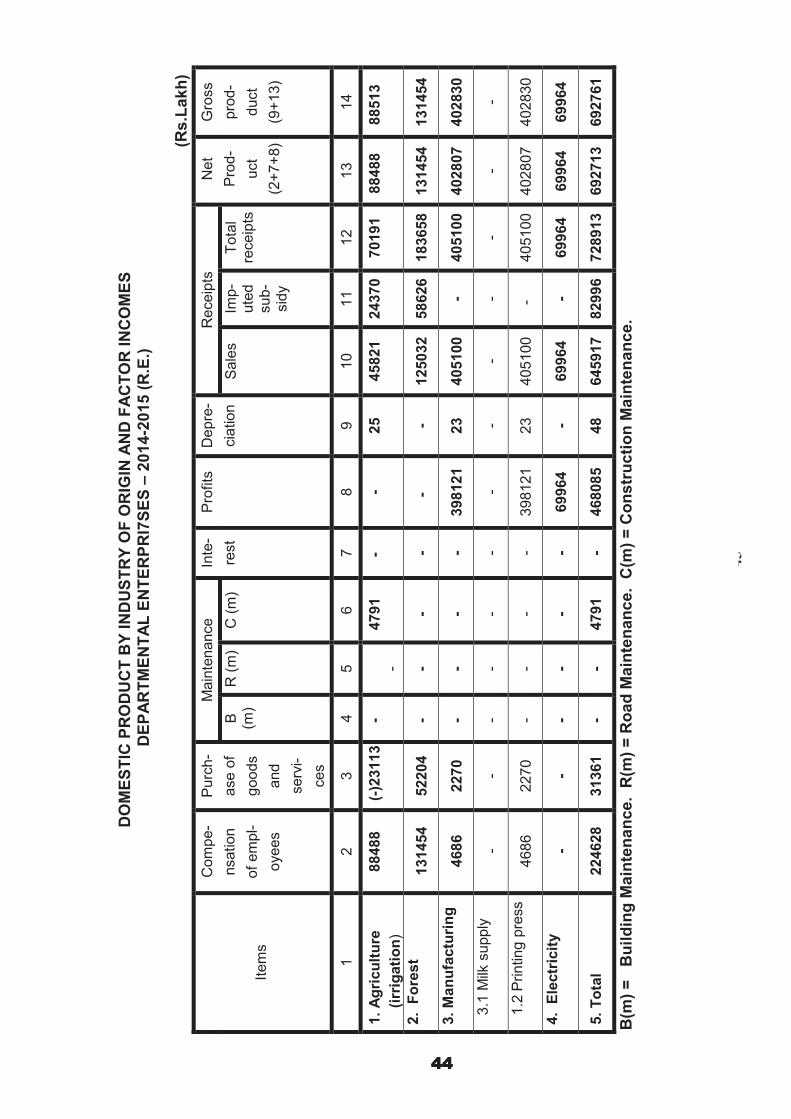
������������
DO
ME
ST
IC P
RO
DU
CT
BY
IN
DU
ST
RY
OF
OR
IGIN
AN
D F
AC
TO
R I
NC
OM
ES
DE
PA
RT
ME
NT
AL
EN
TE
RP
RI7
SE
S –
20
14
-20
15 (
R.E
.)
(Rs
.La
kh
)
Item
s
Com
pe-
nsation
of
em
pl-
oyees
Purc
h-
ase o
f
goods
and
serv
i-
ces
Main
tenance
Inte
-
rest
Pro
fits
D
epre
-
cia
tion
Receip
ts
Net
Pro
d-
uct
(2+
7+
8)
Gro
ss
pro
d-
duct
(9+
13)
B (m)
R (
m)
C (
m)
Sale
s
Imp-
ute
dsub-
sid
y
Tota
lre
ceip
ts
1
2
3
4
5
6
7
8
9
10
11
12
13
14
1.
Ag
ricu
ltu
re
(irr
igati
on
)
88488
(-)2
3113
--
4791
--
25
45821
24370
70191
88488
88513
2.
Fo
rest
131454
52204
--
--
--
125032
58626
183658
131454
131
454
3.
Man
ufa
ctu
rin
g
4686
2270
--
--
398121
23
405100
-405100
402807
402
830
3.1
Milk
supply
-
--
--
--
--
--
--
1.2
Printing p
ress
4686
2270
--
--
398121
23
405100
-405100
402807
402
830
4.
Ele
ctr
icit
y
--
--
--
69964
-69964
-69964
69964
69964
5.
To
tal
224628
31361
--
4791
-468085
48
645917
829
96
728913
692713
692761
B(m
) =
B
uil
din
g M
ain
ten
an
ce
. R
(m)
= R
oa
d M
ain
ten
an
ce
. C
(m)
= C
on
str
uc
tio
n M
ain
ten
an
ce
.
45

���������
CA
PIT
AL
FO
RM
AT
ION
BY
TY
PE
S O
F A
SS
ET
S A
ND
IN
DU
ST
RY
OF
US
E -
AD
MIN
IST
RA
TIO
N –
20
13
-20
14 (
AC
CO
UN
TS
)
(Rs
.La
kh
)
Item
s
Gro
ss D
om
esti
c F
ixed
Cap
ital
Fo
rmati
on
Ch
an
ge i
n
sto
ck
Gro
ss /
Net
cap
ital
form
ati
on
(9+
10)
Bu
ild
-
ing
s
Ro
ad
s
&
Bri
dg
e
s
Oth
er
co
nstr
u
cti
on
Tra
nsp
ort
eq
uip
men
t
Mach
inery
an
d
eq
uip
men
t
To
tal
New
ou
tlay (
2
to 6
)
Net
Pu
rch
ase
of
seco
nd
han
d
assets
To
tal
(7+
8)
1
2
3
4
5
6
7
8
9
10
11
1.
Adm
inis
tration
Tota
l
Les
s
2.
Constr
uction –
machin
ery
and
sto
cks
of
P.W
.D.
3.
Wa
ter
Su
pp
ly
4.
Oth
er s
erv
ices
i. E
ducation
ii. M
edic
al and
public
health
iii.
Sanitation
5.
To
tal
(2 t
o 4
)
6.
Public
adm
inis
t-
ration (
1-5
)
83703 - -
11257
3047
8210 -
11257
72446
264099 -
5090 - - - -
5090
259009
208315 -
68159
11781
9881
1900 -
79940
128375
2090 - - - - - - -
2090
22096
11
222
6361
3432
2929 -
6594
15502
580303
11
73471
29399
16360
13039 -
102881
477422
- - - - - - - - -
580303
11
73471
29399
16360
13039 -
102881
477422
949
949 - - - - -
949 0
581252
960
73471
29399
16360
13039 -
103830
477422
46
���
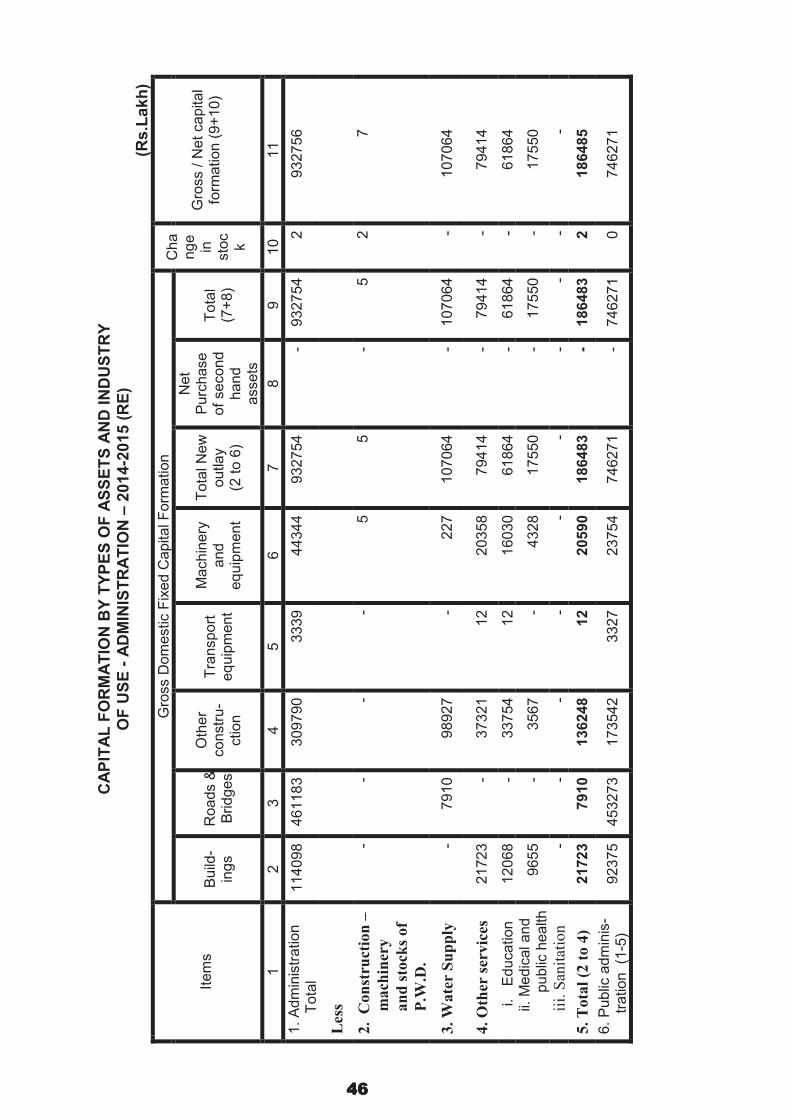
47
���������
CA
PIT
AL
FO
RM
AT
ION
BY
TY
PE
S O
F A
SS
ET
S A
ND
IN
DU
ST
RY
OF
US
E -
AD
MIN
IST
RA
TIO
N –
20
14
-20
15 (
RE
)
(Rs
.La
kh
)
���
Item
s
Gro
ss D
om
estic F
ixed C
apital F
orm
ation
Cha
ng
ein
sto
ck
Gro
ss /
Net
capital
form
ation (
9+
10)
Build
-in
gs
Roads &
Bridg
es
Oth
er
constr
u-
ction
Tra
nsport
eq
uip
ment
Machin
ery
and
eq
uip
ment
Tota
l N
ew
outlay
(2 t
o 6
)
Net
Purc
hase
of
second
hand
assets
Tota
l(7
+8)
1
2
3
4
5
6
7
8
9
10
11
1.
Adm
inis
tration
Tota
l
Les
s
2.
Co
nst
ruct
ion
–
ma
chin
ery
an
d s
tock
s o
f
P.W
.D.
3.
Wa
ter
Su
pp
ly
4.
Oth
er s
erv
ices
i.
Education
ii. M
edic
al and
public
health
iii.
San
itati
on
5.
To
tal
(2 t
o 4
)
6.
Public
adm
inis
-tr
ation
(1-5
)
114098 - -
21723
12068
9655 -
21723
92375
461183 -
7910 - - - -
7910
453273
309790 -
98927
37321
33754
3567 -
136248
173542
3339 - -
12
12 - -
12
3327
44344 5
227
20358
16030
4328 -
20590
23754
932754 5
107064
79414
61864
17550 -
186483
746271
- - - - - - - - -
932754 5
107064
79414
61864
17550 -
186483
746271
2 2 - - - - - 2 0
932756 7
107064
79414
61864
17550 -
186485
746271
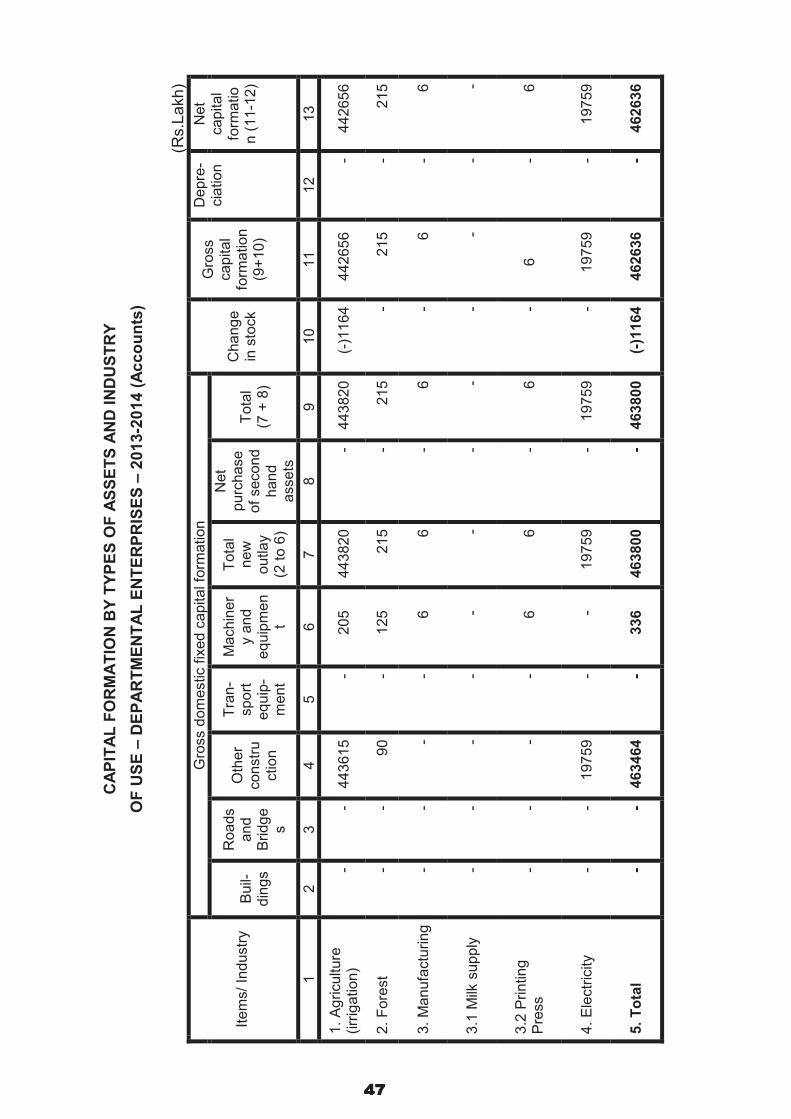
48
������������
CA
PIT
AL
FO
RM
AT
ION
BY
TY
PE
S O
F A
SS
ET
S A
ND
IN
DU
ST
RY
OF
US
E –
DE
PA
RT
ME
NT
AL
EN
TE
RP
RIS
ES
– 2
01
3-2
01
4 (
Ac
co
un
ts)
(Rs.L
akh
)
Item
s/
Industr
y
Gro
ss d
om
estic f
ixed c
apital fo
rmation
Chang
ein
sto
ck
Gro
ss
capital
form
ation
(9+
10)
Depre
-cia
tion
Net
capital
form
atio
n (
11-1
2)
Buil-
din
gs
Roads
and
Bridg
es
Oth
er
constr
uction
Tra
n-
sport
eq
uip
-m
ent
Machin
er
y a
nd
eq
uip
men
t
Tota
lnew
outlay
(2 t
o 6
)
Net
purc
hase
of
second
hand
assets
Tota
l(7
+ 8
)
1
2
3
4
5
6
7
8
9
10
11
12
13
1.
Ag
riculture
(irr
igation)
2.
Fore
st
3.
Manufa
ctu
ring
3.1
Milk
supply
3.2
Printing
Pre
ss
4.
Ele
ctr
icity
5.
To
tal
- - - - - - -
- - - - - - -
443615
90 - - -
19759
463464
- - - - - - -
205
125 6 - 6 -
336
443820
215 6 - 6
19759
463800
- - - - - - -
443820
215 6 - 6
19759
463800
(-)1
164 - - - - -
(-)1
164
442656
215 6 -
6 19759
462636
- - - - - - -
442656
215 6 - 6
19759
462636

49
��� ���
CA
PIT
AL
FO
RM
AT
ION
BY
TY
PE
S O
F A
SS
ET
S A
ND
IN
DU
ST
RY
OF
US
E –
DE
PA
RT
ME
NT
AL
EN
TE
RP
RIS
ES
– 2
01
4-2
01
5 (
R.E
.)
(Rs.L
akh
)
� �
Item
s/
Industr
y
Gro
ss d
om
estic f
ixed c
apital fo
rmation
Chang
ein
sto
ck
Gro
ss
capital
form
ation
(9+
10)
Depre
-cia
tion
Net
capital
form
atio
n (
11-1
2)
Buil-
din
gs
Roads
and
Bridg
es
Oth
er
constr
uction
Tra
ns-
port
eq
uip
-m
ent
Machin
er
y a
nd
eq
uip
men
t
Tota
lnew
outlay
(2 t
o 6
)
Net
purc
hase
of
second
hand
assets
Tota
l(7
+ 8
)
1
2
3
4
5
6
7
8
9
10
11
12
13
1.
Ag
riculture
(irr
igation)
2.
Fore
st
3.
Manufa
ctu
ring
3.1
Milk
supply
3.2
Printing
Pre
ss
4.
Ele
ctr
icity
5.
To
tal
- - - - - - -
- - - - - - -
477138
72 5 - 5
3339
480554
- - - - - - -
800
183
203
-
203
-
1186
477938
255
208
-
208
3339
481740
- - - - - - -
477938
255
208
-
208
3339
481740
(-)1
80
- - - - -
(-)1
80
477758
255
208
-
208
3339
48516
0
- - - - - - -
477758
255
208
-
208
3339
481560