Embed Size (px)
Citation preview

Seediscussions,stats,andauthorprofilesforthispublicationat:https://www.researchgate.net/publication/274894961
CoverCropMixturesDoNotUseWaterDifferentlythanSingle-SpeciesPlantings
ArticleinAgronomyjournal·May2015
DOI:10.2134/agronj14.0504
CITATIONS
8
READS
272
6authors,including:
Someoftheauthorsofthispublicationarealsoworkingontheserelatedprojects:
CompletingpastresearchwritingViewproject
PotentialforUsingCoverCropsinDrylandAgriculturalSystemsViewproject
DrewJ.Lyon
WashingtonStateUniversity
144PUBLICATIONS2,251CITATIONS
SEEPROFILE
GaryW.Hergert
UniversityofNebraskaatLincoln
78PUBLICATIONS711CITATIONS
SEEPROFILE
RobertHiggins
UniversityofNebraskaatLincoln
7PUBLICATIONS43CITATIONS
SEEPROFILE
FranciscoCalderón
ColegiodePostgraduados
19PUBLICATIONS661CITATIONS
SEEPROFILE
AllcontentfollowingthispagewasuploadedbyD.C.Nielsenon13April2015.
Theuserhasrequestedenhancementofthedownloadedfile.Allin-textreferencesunderlinedinblueareaddedtotheoriginaldocument
andarelinkedtopublicationsonResearchGate,lettingyouaccessandreadthemimmediately.
Agronomy Journa l • Volume 107, I s sue 3 • 2015 1025
Crop Economics, Production & Management
Cover Crop Mixtures Do Not Use Water Differently than Single-Species Plantings
David C. Nielsen,* Drew J. Lyon, Gary W. Hergert, Robert K. Higgins, Francisco J. Calderón, and Merle F. Vigil
Published in Agron. J. 107:1025–1038 (2015)doi:10.2134/agronj14.0504Copyright © 2015 by the American Society of Agronomy, 5585 Guilford Road, Madison, WI 53711. All rights reserved. No part of this periodical may be reproduced or transmitted in any form or by any means, electronic or mechanical, including photocopying, recording, or any information storage and retrieval system, without permission in writing from the publisher.
ABSTRACTRecent recommendations advocating the use of cover crop mixtures instead of single-species in semi-arid environments require rigorous scientific studies. One of those stated benefits is greatly reduced water use by cover crops grown in mixtures. The objec-tives of this study were to characterize soil water extraction patterns and determine water use of cover crops grown in single-species plantings and in a 10-species mixture and to compare cover crop water use to evaporative water loss from no-till fallow. The study was conducted at Akron, CO, and Sidney, NE, during the 2012 and 2013 growing seasons on silt loam soils. At each location there were a dryland treatment and an irrigated treatment. Soil water contents were measured by neutron scattering and time-domain reflectometry at six depths (0.0–1.8 m, Akron) or four or five depths (to 1.2 m or 1.5 m, Sidney). There were no con-sistent significant differences in soil water contents or growing season crop water use with the single-species plantings compared with the 10-species mixture. Cover crop water use (216 mm) averaged 1.78 times greater than evaporative water loss (122 mm) from the no-till fallow treatment with proso millet (Panicum miliaceum L.) residue. There appears to be no evidence from data collected in this semi-arid environment, even when irrigated to simulate higher rainfall environments, to support the conclusion that cover crops grown in multi-species mixtures use water differently than single species-plantings of cover crops.
D.C. Nielsen, F.J. Calderón, and M.F. Vigil, USDA-ARS, Central Great Plains Research Station, 40335 County Road GG, Akron, CO 80720; D.J. Lyon, Dep. Crop and Soil Sciences, Washington State Univ., 169 Johnson Hall, P.O. Box 646420, Pullman, WA 99164-6420; G.W. Hergert, Univ. of Nebraska Panhandle Research and Extension Center, 4502 Ave. I, Scottsbluff, NE 69361; and R.K. Higgins, Univ. of Nebraska, High Plains Ag Lab, 3257 Rd 109, Sidney, NE 69162. Disclaimer: The use of trade, firm, or corporation names is for the information and convenience of the reader. Such use does not constitute an official endorsement or approval by the United States Department of Agriculture or the Agricultural Research Service of any product or service to the exclusion of others that may be suitable. The U.S. Department of Agriculture (USDA) prohibits discrimination in all its programs and activities on the basis of race, color, national origin, age, disability, and where applicable, sex, marital status, familial status, parental status, religion, sexual orientation, genetic information, political beliefs, reprisal, or because all or part of an individual’s income is derived from any public assistance program. Received 18 Sept. 2014. Accepted 20 Jan. 2015. *Corresponding author ([email protected]).
The past few years have seen a greatly renewed interest in adding cover crops to agricultural production systems. Unger et al. (2006) defined cover crops as “close-growing crops such as grasses, legumes, or small grains that are used primarily to pro-vide seasonal protection against soil erosion and for soil improve-ment.” Some of the reasons given for cover crop use include benefits associated with increasing organic matter, improving soil structure, improving infiltration, reducing evaporation, provid-ing soil erosion protection, catching snow, fixing N, increasing soil biological activity, increasing nutrient availability, reducing nutrient loss, reducing excess soil water, and suppressing weeds (Snapp et al., 2005). Much of the literature documenting these benefits associated with cover crop use come from studies done in regions with less evaporative demand and/or more precipita-tion than the semi-arid region of the central Great Plains of the United States. A press release about cover crop mixtures from the USDA-Natural Resources Conservation Service in Champaign, IL, (http://www.nrcs.usda.gov/wps/portal/nrcs/detail/il/news-room/releases/?cid=STELPRDB1117185) stated that “…cover crops don’t interfere or compete with the production of grain and commodity crops.”
While that statement may be true in humid and subhumid regions, Unger et al. (2006) cautioned that cover crop use in semi-arid dryland regions (annual precipitation of 250–500 mm)
could be detrimental to yields of subsequent crops because of the water that the cover crop used that was not replenished by precipitation between the time of cover crop termination and planting the next crop. Unger and Vigil (1998) made the defini-tive statement that “Specific reasons for growing cover crops vary among sites and regions, but a consequence in all cases is that they use soil water, which can positively, neutrally, or negatively affect the soil water supply for the next crop.” Wortman et al. (2012) indicated that a major farmer concern related to cover crop use was the amount of soil water used by the cover crop that could potentially reduce available soil water for the subse-quent cash crop. A study from eastern Nebraska (Kessavalou and Walters, 1997) in which growing season precipitation was supplemented with irrigation reported the effects of a rye (Secale cereale L.) cover crop grown following soybean [Glycine max (L.) Merr.] in a corn (Zea mays L.)–soybean rotation on a silty
1026 Agronomy Journa l • Volume 107, Issue 3 • 2015
clay loam. In 2 of the 3 yr reported there was no effect of the rye cover crop on subsequent corn yields. However, yields in those 2 yr were low because of delayed planting in one year and low solar radiation levels in another year. In the third (higher yielding) year, the cover crop reduced corn yield by 9.3%. The authors attributed the yield reduction to allelopathic effects of rye on corn. No soil water measurements were reported in this study. Ewing et al. (1991) noted that even in the more humid region of the Atlantic Coastal Plain of North Carolina the water use by a crimson clover (Trifolium incarnatum L.) cover crop grown on a sandy soil would, in below average precipitation years, reduce subsequent corn yields.
Unfortunately, recent recommendations advocating the use of cover crop mixtures in semi-arid environments have not been derived from the results of rigorous scientific studies. Recently, the results from a single-year, unreplicated demonstration plot in south-central Nebraska (average annual precipitation of 691 mm) indicated that cover crops grown in mixtures of 9 to 14 species and seeded in mid-July did not show declines in soil water content during the August through November period while single-species plantings of cover crops planted at the same time
and location did use significant amounts of soil water (Berns and Berns, 2009). The soil water measurements were made with granular matrix electrical resistance sensors (Watermark 200SS, The Irrometer Company, Inc., Riverside, CA) installed at three depths in the 0.0 to 0.9 m soil profile and monitored over time. These results have been widely disseminated as authoritative evidence that cover crops grown in mixtures may use much less water than crops grown in single-species plantings (R. Archuleta, NRCS, Greensboro, NC, personal communication, 2013; Berns and Berns, 2009). While the mechanism for the reduced water use from cover crop mixtures has not been identified, it has been hypothesized that such a reduction could be possible as the result of soil fungal and bacterial associations that improve drought tolerance through access to greater soil volume (East, 2013) (Dr. K Nichols, formerly USDA-ARS, Mandan, ND, now Rodale Institute, Kutztown, PA, personal communication, 2012).
Wortman et al. (2012) evaluated cover crops growing in two-, four-, six-, and eight-species mixtures in eastern Nebraska (annual precipitation of about 750 mm) and found soil water content in the 0.00- to 0.08-m surface layer at cover crop termi-nation (late May to early June) was not affected by number of species in the mixture in 2 yr when April–May precipitation was below average (<175 mm). During the third year of that study when April–May precipitation (240 mm) was above average they reported that surface soil water content at cover crop termina-tion was greater in the four-, six-, and eight-species mixtures than in the two-species mixture. It is unfortunate that they did not report soil water contents from deeper in the soil profile. Replicated studies documenting soil water contents throughout the entire rooting profile and water use by cover crops in the semi-arid central Great Plains have not been reported previously.
After inspecting the soil water figures presented by Berns and Berns (2009) we suspected some instrument problems may have led them to conclude that cover crop mixtures used much less water than single-species plantings of cover crops. For example, there are a number of instances when the soil water sensors did not show a response to precipitation events, and other times when precipitation events caused responses to occur at lower soil depths before responses were observed at depths closer to the soil surface. The objectives of this study were to (1) compare volumet-ric soil water contents during the spring cover crop growing sea-son under (a) no-till fallow proso millet (Panicum miliaceum L.) residue, (b) four single-species plantings of cover crops, and (c) a 10-species cover crop mixture, and (2) compare evaporative water loss from the no-till fallow treatment with cover crop water use (from planting to crop termination) for the four single-species plantings and the 10-species mixture.
MATERIALS AND METHODSThe study was conducted during the 2012 and 2013 grow-
ing seasons at the USDA-ARS Central Great Plains Research Station, 6.4 km east of Akron, CO (40°09¢ N, 103°09¢ W, 1384 m elevation above sea level) and at the University of Nebraska High Plains Ag Lab, 9.7 km northwest of Sidney, NE (41°12¢ N, 103°0¢ W, 1315 m elevation above sea level). The soil type at both locations was silt loam (Akron: Weld silt loam [fine, smectitic, mesic Aridic Argiustoll]; Sidney: Keith silt loam [fine-silty, mixed, superactive, mesic Aridic Argiustoll]).
Table 1. Cover crop planting and termination dates, seeding rates, and mixture composition at Akron, CO, and Sidney, NE.
LocationPlanting
dateTermination
date Crop†Seeding
ratekg ha–1
Akron 27 Mar. 2012 16 June 2012 Rapeseed 7.44 Apr. 2013 27 June 2013 Flax 39.2
Oat 94.0Pea 114.5Mixture 59.7 Rapeseed 2.3 Flax 4.7 Oat 13.7 Pea 8.9 Lentil 5.9 Common vetch 4.7 Berseem clover 1.2 Barley 12.5 Phacelia 2.3 Safflower 3.5
Sidney 4 Apr. 2012 15 June 2012 Rapeseed 6.730 Apr. 2013 18 July 2013 Flax 39.2
Oat 100.8Pea 112.0Mixture 57.1 Rapeseed 2.2 Flax 4.5 Oat 13.1 Pea 8.5 Lentil 5.7 Common vetch 4.5 Berseem clover 1.1 Barley 11.9 Phacelia 2.2 Safflower 3.4
† Rapeseed (Brassica napus L.), flax (Linum usitatissimum L.), oat (Avena sativa L.), pea (Pisum sativa L.), lentil (Lens culinaris L.), common vetch (Vicia sativa L.), berseem clover (Trifolium alexandrinum L.), barley (Hordeum vulgare L.), phacelia (Phacelia tanacetifolia L.), safflower (Carthamus tinctorius L.).
Agronomy Journa l • Volume 107, Issue 3 • 2015 1027
The experiment was laid out as a split plot design with four repli-cations at both locations. The main plot factor was irrigation treat-ment (rainfed or irrigated) and the split plot factor was cover crop species (fallow, four single-species plantings, 10-species mixture). Main plots were 6.1 by 54.6 m (2012) and 12.2 by 36.6 m (2013) at Akron and 4.6 by 54.6 m (both years) at Sidney. Individual split plot dimensions were 6.1 by 9.1 m (2012) and 6.1 by 12.2 m (2013) at Akron and 4.6 by 9.1 m (both years) at Sidney. Planting dates, seeding rates, and mixture composition are given in Table 1. At Akron the irrigated plots were irrigated biweekly to simulate aver-age precipitation at Blue Hill, NE, (south-central Nebraska, the site of the study by Berns and Berns (2009)) in order to determine if cover crop water use differences or similarities between single-species plantings and mixture remained the same in a higher rain-fall regime. The irrigated plots at Sidney were irrigated biweekly to simulate the 30-yr average precipitation at Sidney. Because of the severe drought conditions experienced at Akron in 2012, the dry-land plots received enough supplemental irrigation to keep them at 80% of the long-term average precipitation received at Akron. Observed and average monthly temperatures, precipitation, and irrigation amounts are shown in Table 2. Irrigations at both loca-tions were applied through linear move irrigation systems, and 13 to 19 mm of water was applied with each irrigation.
All cover crop treatments were no-till seeded into proso millet residue at Akron and Sidney in both years. Row spacing was 0.20 m at Akron and 0.25 m at Sidney. The plot area was sprayed with glyphosate ([N-(phosphonomethyl)glycine] prior to planting and fertilized with 34 kg N ha–1. Hand-weeding was performed periodically at Akron and Sidney during the growing season, with most of that performed during the last week of April.
Soil water was measured at the center of each plot in 0.3-m intervals using a neutron probe (Model 503 Hydroprobe, CPN International, Martinez, CA) at both locations. At Akron the depth intervals were 0.3 to 0.6 m, 0.6 to 0.9 m, 0.9 to 1.2 m, 1.2 to 1.5 m, and 1.5 to 1.8 m. Soil water in the 0.0 to 0.3 m surface layer was determined using time-domain reflectometry (Trase System I, Soil Moisture Equipment Corp., Santa Barbara, CA)
with 0.3-m waveguides installed vertically to average the water content over the entire layer. At Sidney the 0.0 to 0.3 m surface layer was measured with the neutron probe and the lowest layer measured was 1.2 to 1.5 m (2012) and 0.9 to 1.2 m (2013) due to the presence of a restricting calcium carbonate layer that limited access tube insertion depth. The neutron probe was calibrated against gravimetric soil water samples taken in the plot area. Gravimetric soil water was converted to volumetric water by multiplying by the soil bulk density for each depth. Bulk density was determined from the dry weight of the soil cores (38 mm diam. by 300 mm length) taken from each depth at the time of neutron probe access tube installation.
Full season water use was calculated from the water balance as the difference between soil water readings at planting and cover crop termination plus growing season precipitation. Precipita-tion was manually measured daily at both locations at weather observing sites approximately 300 m from the plot area. Runoff and deep percolation were assumed to be negligible. This was considered a reasonable assumption as the slope in the plot area was <1% and visual observations in the plot area following heavy rains did not show evidence of runoff. However, there may have been some deep percolation unaccounted for at Akron in 2013, especially under the irrigated condition.
Plant population was measured at Akron on 1 May 2012 and 29 May 2013 with number of plants counted in 1 m of row in each single-species plot and 2 m of row in each mixture plot. Plant populations were not measured at Sidney in either year.
Proso millet residue cover in the fallow treatment was mea-sured in 2012 and 2013 at Akron using photographs taken with a digital camera held at arm’s length and level with the horizon at approximately 1.7 m above the soil surface at the center of each plot. Photographs were analyzed using SamplePoint software (Booth et al., 2006) set to select 64 random points within each photograph. Residue cover measurements were not obtained at Sidney due to lack of technician support.
Analysis of variance was performed with Statistix 10 software (Analytical Software, Tallahassee, FL). Statistically significant
Table 2. Monthly average temperature (T) and precipitation (P) at Akron CO, and Sidney NE, during the experimental period and long-term averages (Tavg, Pavg). Also shown are irrigation amounts applied at each site.
Year MonthAkron Sidney
T P Irrigation Tavg† Pavg† T P Irrigation Tavg‡ Pavg‡°C ––––––– mm ––––––– °C mm °C –––––––– mm –––––––– °C mm
2012 April 12.3 42 51 8.1 42 10.6 57 0 7.4 41May 16.0 41 87 13.5 73 14.6 22 38 13.1 73June 23.9 67 67 19.3 62 23.1 28 51 18.6 80July 26.0 82 62 23.1 67 24.8 107 19 22.6 66August 24.0 2 74 22.0 54 22.6 8 76 21.5 50September 18.9 43 33 17.0 32 17.8 27 0 16.2 35October 9.3 15 0 10.2 23 7.7 26 13 9.4 23November 6.4 4 0 2.8 14 4.8 3 0 2.1 12December –1.0 10 0 –2.4 11 –2.5 6 0 –2.3 8
2013 January –1.9 3 0 –2.4 8 –2.4 4 0 –3.3 7February –1.4 10 0 –1.1 9 –2.4 16 0 –1.3 9March 2.1 49 0 2.7 21 2.3 8 0 2.4 23April 5.5 37 25 8.1 42 3.9 58 13 7.4 41May 14.0 40 118 13.5 73 13.2 81 25 13.1 73June 21.3 75 71 19.3 62 19.7 74 20 18.6 80
†1908 to 2013.‡ 1946 to 2013.
1028 Agronomy Journa l • Volume 107, Issue 3 • 2015
differences in cover crop water use were determined by the Tukey HSD mean separation test (alpha = 0.05) when the analysis of variance indicated significant treatment effects.
RESULTSWeather
Precipitation during the cover crop growing season (April–June) at Akron was much below normal and the values shown in Table 2 include the irrigation amounts applied to keep precipitation near 80% of the long-term average. The 3-mo total for both 2012 and 2013 was about 150 mm (compared with average precipitation of 177 mm). The amount of pre-cipitation received at Sidney for the same 3-mo period was
107 mm in 2012 and 213 mm in 2013 (compared with average precipitation of 194 mm). The irrigation amounts applied to the irrigated treatments for the same 3-mo period were 205 mm (2012) and 214 mm (2013) at Akron and 89 mm (2012) and 58 mm (2013) at Sidney. As stated earlier, the irrigation amounts were much greater at Akron than at Sidney because at Akron we were simulating the average rainfall for south-central Nebraska. Monthly temperatures at both Akron and Sidney in 2012 during April, May, and June were much warmer (about 3°C) than average. At both locations in 2013 April was about 3°C cooler than average while May and June were slightly warmer than average (1.3°C at Akron, 0.6°C at Sidney).
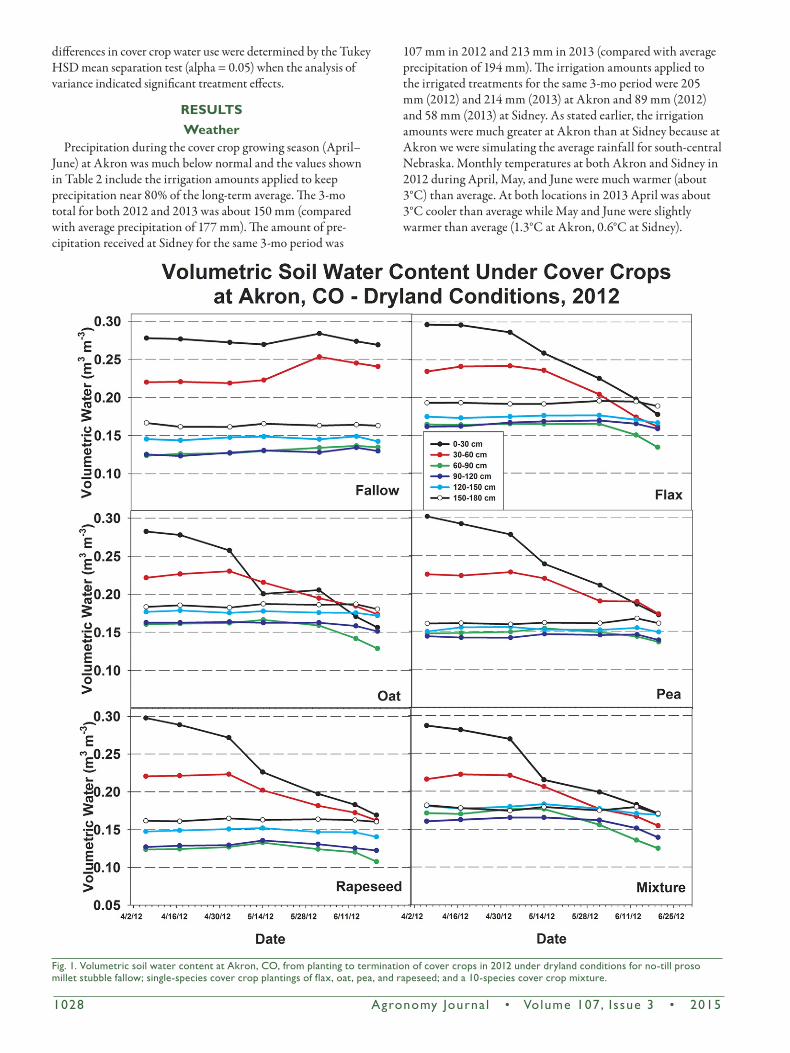
Fig. 1. Volumetric soil water content at Akron, CO, from planting to termination of cover crops in 2012 under dryland conditions for no-till proso millet stubble fallow; single-species cover crop plantings of flax, oat, pea, and rapeseed; and a 10-species cover crop mixture.
Agronomy Journa l • Volume 107, Issue 3 • 2015 1029
Growing Season Changes in Volumetric Soil Water Content
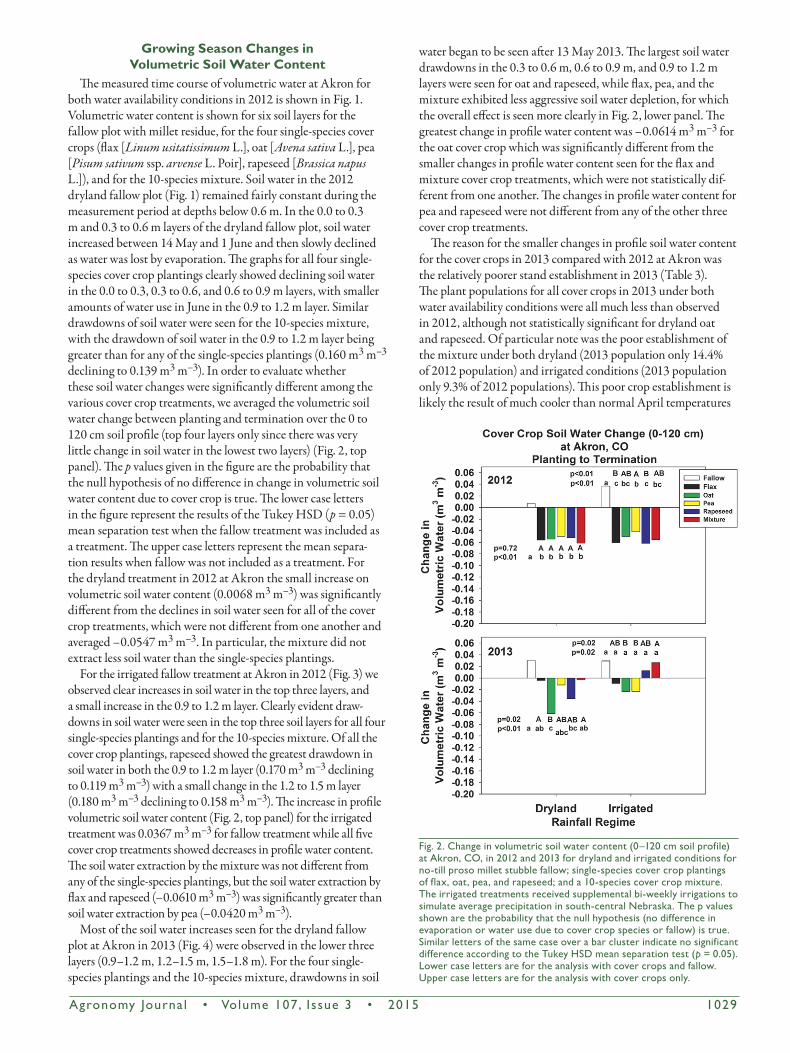
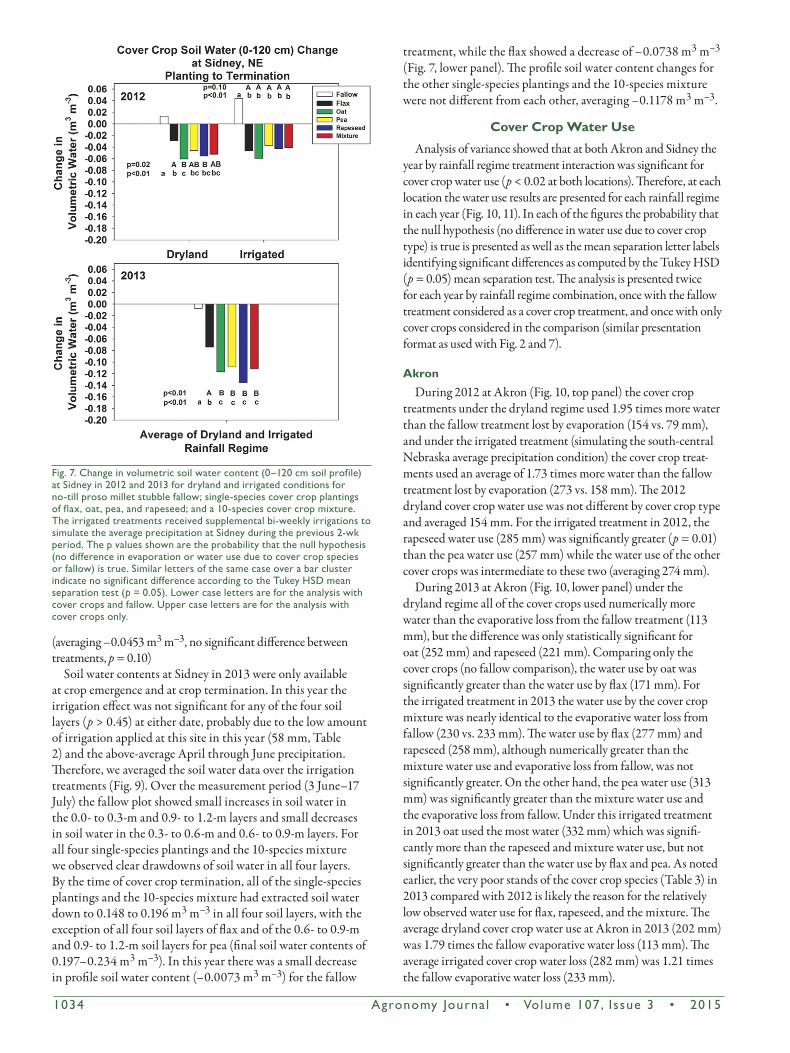
The measured time course of volumetric water at Akron for both water availability conditions in 2012 is shown in Fig. 1. Volumetric water content is shown for six soil layers for the fallow plot with millet residue, for the four single-species cover crops (flax [Linum usitatissimum L.], oat [Avena sativa L.], pea [Pisum sativum ssp. arvense L. Poir], rapeseed [Brassica napus L.]), and for the 10-species mixture. Soil water in the 2012 dryland fallow plot (Fig. 1) remained fairly constant during the measurement period at depths below 0.6 m. In the 0.0 to 0.3 m and 0.3 to 0.6 m layers of the dryland fallow plot, soil water increased between 14 May and 1 June and then slowly declined as water was lost by evaporation. The graphs for all four single-species cover crop plantings clearly showed declining soil water in the 0.0 to 0.3, 0.3 to 0.6, and 0.6 to 0.9 m layers, with smaller amounts of water use in June in the 0.9 to 1.2 m layer. Similar drawdowns of soil water were seen for the 10-species mixture, with the drawdown of soil water in the 0.9 to 1.2 m layer being greater than for any of the single-species plantings (0.160 m3 m–3 declining to 0.139 m3 m–3). In order to evaluate whether these soil water changes were significantly different among the various cover crop treatments, we averaged the volumetric soil water change between planting and termination over the 0 to 120 cm soil profile (top four layers only since there was very little change in soil water in the lowest two layers) (Fig. 2, top panel). The p values given in the figure are the probability that the null hypothesis of no difference in change in volumetric soil water content due to cover crop is true. The lower case letters in the figure represent the results of the Tukey HSD (p = 0.05) mean separation test when the fallow treatment was included as a treatment. The upper case letters represent the mean separa-tion results when fallow was not included as a treatment. For the dryland treatment in 2012 at Akron the small increase on volumetric soil water content (0.0068 m3 m–3) was significantly different from the declines in soil water seen for all of the cover crop treatments, which were not different from one another and averaged –0.0547 m3 m–3. In particular, the mixture did not extract less soil water than the single-species plantings.
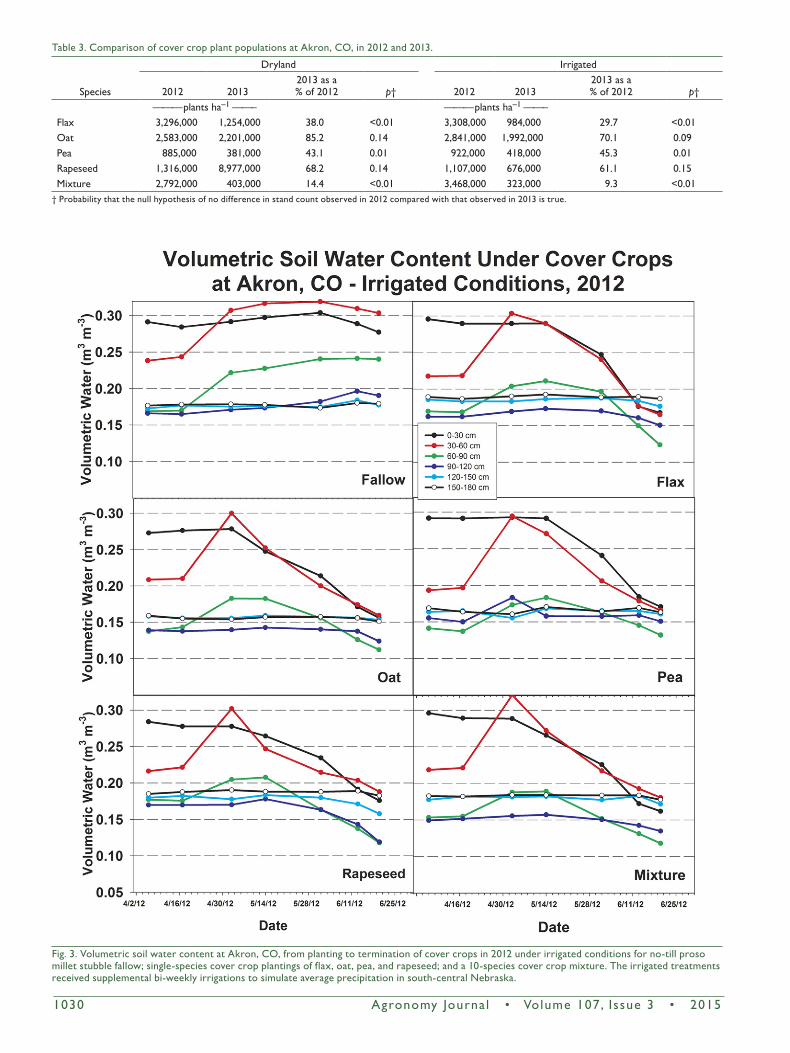
For the irrigated fallow treatment at Akron in 2012 (Fig. 3) we observed clear increases in soil water in the top three layers, and a small increase in the 0.9 to 1.2 m layer. Clearly evident draw-downs in soil water were seen in the top three soil layers for all four single-species plantings and for the 10-species mixture. Of all the cover crop plantings, rapeseed showed the greatest drawdown in soil water in both the 0.9 to 1.2 m layer (0.170 m3 m–3 declining to 0.119 m3 m–3) with a small change in the 1.2 to 1.5 m layer (0.180 m3 m–3 declining to 0.158 m3 m–3). The increase in profile volumetric soil water content (Fig. 2, top panel) for the irrigated treatment was 0.0367 m3 m–3 for fallow treatment while all five cover crop treatments showed decreases in profile water content. The soil water extraction by the mixture was not different from any of the single-species plantings, but the soil water extraction by flax and rapeseed (–0.0610 m3 m–3) was significantly greater than soil water extraction by pea (–0.0420 m3 m–3).
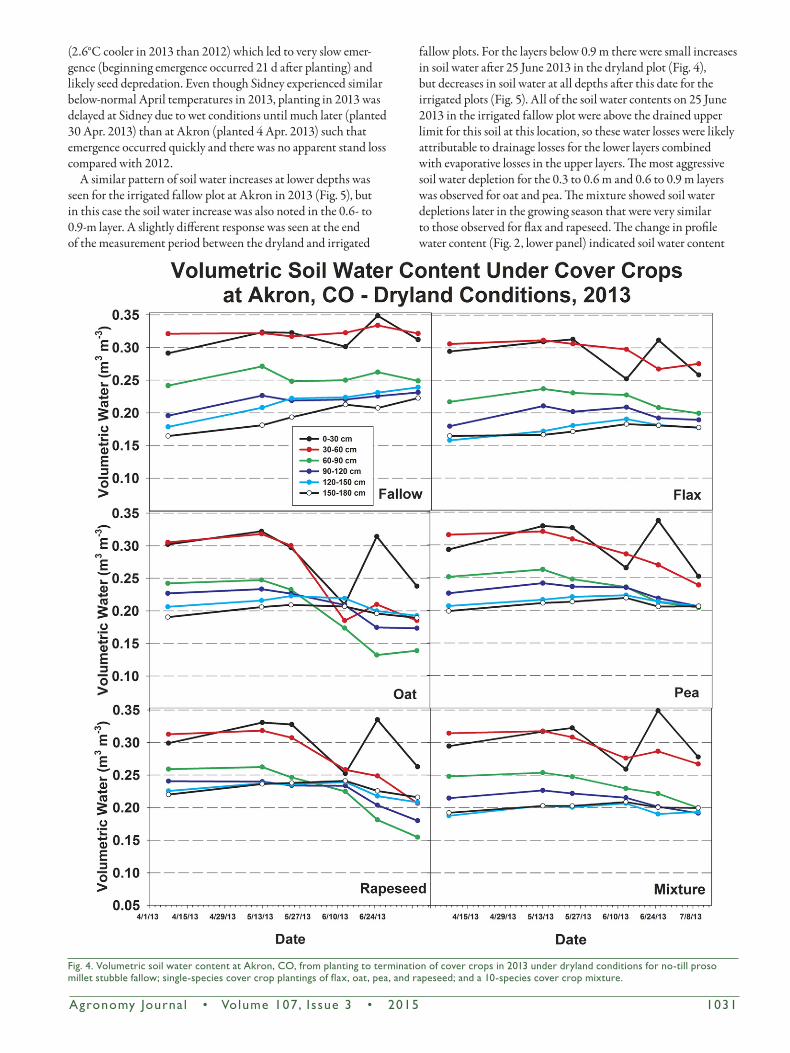
Most of the soil water increases seen for the dryland fallow plot at Akron in 2013 (Fig. 4) were observed in the lower three layers (0.9–1.2 m, 1.2–1.5 m, 1.5–1.8 m). For the four single-species plantings and the 10-species mixture, drawdowns in soil
water began to be seen after 13 May 2013. The largest soil water drawdowns in the 0.3 to 0.6 m, 0.6 to 0.9 m, and 0.9 to 1.2 m layers were seen for oat and rapeseed, while flax, pea, and the mixture exhibited less aggressive soil water depletion, for which the overall effect is seen more clearly in Fig. 2, lower panel. The greatest change in profile water content was –0.0614 m3 m–3 for the oat cover crop which was significantly different from the smaller changes in profile water content seen for the flax and mixture cover crop treatments, which were not statistically dif-ferent from one another. The changes in profile water content for pea and rapeseed were not different from any of the other three cover crop treatments.
The reason for the smaller changes in profile soil water content for the cover crops in 2013 compared with 2012 at Akron was the relatively poorer stand establishment in 2013 (Table 3). The plant populations for all cover crops in 2013 under both water availability conditions were all much less than observed in 2012, although not statistically significant for dryland oat and rapeseed. Of particular note was the poor establishment of the mixture under both dryland (2013 population only 14.4% of 2012 population) and irrigated conditions (2013 population only 9.3% of 2012 populations). This poor crop establishment is likely the result of much cooler than normal April temperatures
Fig. 2. Change in volumetric soil water content (0–120 cm soil profile) at Akron, CO, in 2012 and 2013 for dryland and irrigated conditions for no-till proso millet stubble fallow; single-species cover crop plantings of flax, oat, pea, and rapeseed; and a 10-species cover crop mixture. The irrigated treatments received supplemental bi-weekly irrigations to simulate average precipitation in south-central Nebraska. The p values shown are the probability that the null hypothesis (no difference in evaporation or water use due to cover crop species or fallow) is true. Similar letters of the same case over a bar cluster indicate no significant difference according to the Tukey HSD mean separation test (p = 0.05). Lower case letters are for the analysis with cover crops and fallow. Upper case letters are for the analysis with cover crops only.
1030 Agronomy Journa l • Volume 107, Issue 3 • 2015
Fig. 3. Volumetric soil water content at Akron, CO, from planting to termination of cover crops in 2012 under irrigated conditions for no-till proso millet stubble fallow; single-species cover crop plantings of flax, oat, pea, and rapeseed; and a 10-species cover crop mixture. The irrigated treatments received supplemental bi-weekly irrigations to simulate average precipitation in south-central Nebraska.
Table 3. Comparison of cover crop plant populations at Akron, CO, in 2012 and 2013.
Species
Dryland Irrigated
2012 20132013 as a % of 2012 p† 2012 2013
2013 as a % of 2012 p†
——— plants ha–1 ——– ——— plants ha–1 ——–Flax 3,296,000 1,254,000 38.0 <0.01 3,308,000 984,000 29.7 <0.01Oat 2,583,000 2,201,000 85.2 0.14 2,841,000 1,992,000 70.1 0.09Pea 885,000 381,000 43.1 0.01 922,000 418,000 45.3 0.01Rapeseed 1,316,000 8,977,000 68.2 0.14 1,107,000 676,000 61.1 0.15Mixture 2,792,000 403,000 14.4 <0.01 3,468,000 323,000 9.3 <0.01
† Probability that the null hypothesis of no difference in stand count observed in 2012 compared with that observed in 2013 is true.
Agronomy Journa l • Volume 107, Issue 3 • 2015 1031
(2.6°C cooler in 2013 than 2012) which led to very slow emer-gence (beginning emergence occurred 21 d after planting) and likely seed depredation. Even though Sidney experienced similar below-normal April temperatures in 2013, planting in 2013 was delayed at Sidney due to wet conditions until much later (planted 30 Apr. 2013) than at Akron (planted 4 Apr. 2013) such that emergence occurred quickly and there was no apparent stand loss compared with 2012.
A similar pattern of soil water increases at lower depths was seen for the irrigated fallow plot at Akron in 2013 (Fig. 5), but in this case the soil water increase was also noted in the 0.6- to 0.9-m layer. A slightly different response was seen at the end of the measurement period between the dryland and irrigated
fallow plots. For the layers below 0.9 m there were small increases in soil water after 25 June 2013 in the dryland plot (Fig. 4), but decreases in soil water at all depths after this date for the irrigated plots (Fig. 5). All of the soil water contents on 25 June 2013 in the irrigated fallow plot were above the drained upper limit for this soil at this location, so these water losses were likely attributable to drainage losses for the lower layers combined with evaporative losses in the upper layers. The most aggressive soil water depletion for the 0.3 to 0.6 m and 0.6 to 0.9 m layers was observed for oat and pea. The mixture showed soil water depletions later in the growing season that were very similar to those observed for flax and rapeseed. The change in profile water content (Fig. 2, lower panel) indicated soil water content
Fig. 4. Volumetric soil water content at Akron, CO, from planting to termination of cover crops in 2013 under dryland conditions for no-till proso millet stubble fallow; single-species cover crop plantings of flax, oat, pea, and rapeseed; and a 10-species cover crop mixture.
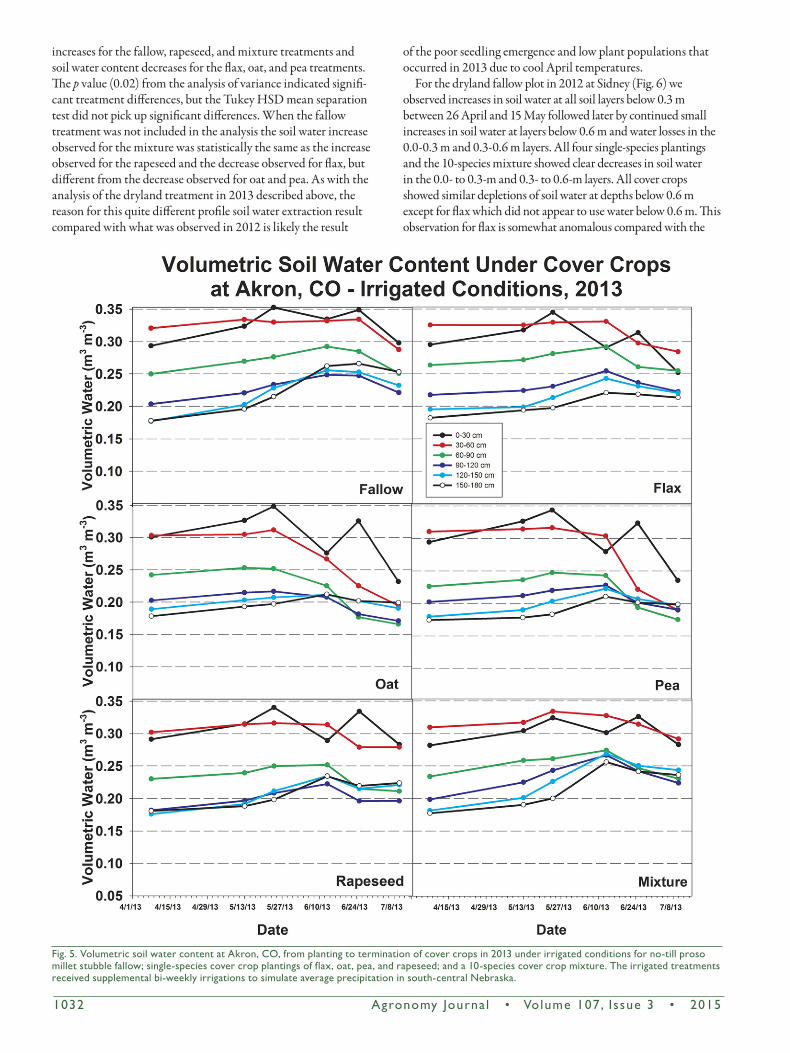
1032 Agronomy Journa l • Volume 107, Issue 3 • 2015
increases for the fallow, rapeseed, and mixture treatments and soil water content decreases for the flax, oat, and pea treatments. The p value (0.02) from the analysis of variance indicated signifi-cant treatment differences, but the Tukey HSD mean separation test did not pick up significant differences. When the fallow treatment was not included in the analysis the soil water increase observed for the mixture was statistically the same as the increase observed for the rapeseed and the decrease observed for flax, but different from the decrease observed for oat and pea. As with the analysis of the dryland treatment in 2013 described above, the reason for this quite different profile soil water extraction result compared with what was observed in 2012 is likely the result
of the poor seedling emergence and low plant populations that occurred in 2013 due to cool April temperatures.
For the dryland fallow plot in 2012 at Sidney (Fig. 6) we observed increases in soil water at all soil layers below 0.3 m between 26 April and 15 May followed later by continued small increases in soil water at layers below 0.6 m and water losses in the 0.0-0.3 m and 0.3-0.6 m layers. All four single-species plantings and the 10-species mixture showed clear decreases in soil water in the 0.0- to 0.3-m and 0.3- to 0.6-m layers. All cover crops showed similar depletions of soil water at depths below 0.6 m except for flax which did not appear to use water below 0.6 m. This observation for flax is somewhat anomalous compared with the
Fig. 5. Volumetric soil water content at Akron, CO, from planting to termination of cover crops in 2013 under irrigated conditions for no-till proso millet stubble fallow; single-species cover crop plantings of flax, oat, pea, and rapeseed; and a 10-species cover crop mixture. The irrigated treatments received supplemental bi-weekly irrigations to simulate average precipitation in south-central Nebraska.
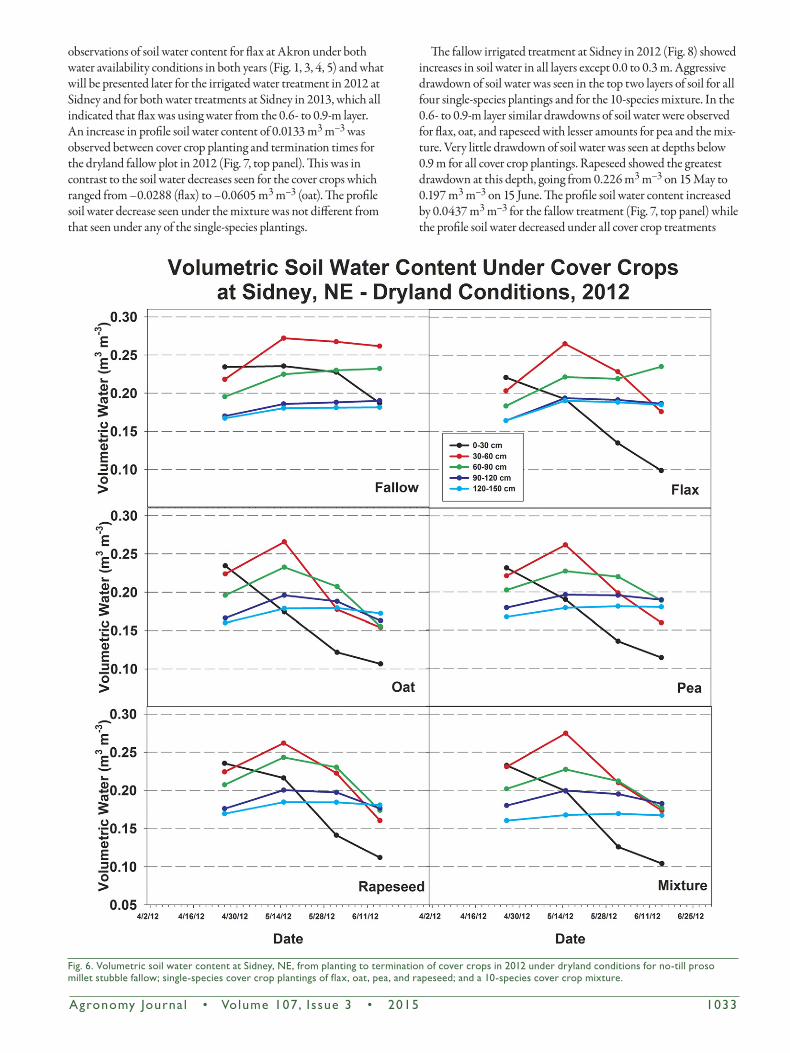
Agronomy Journa l • Volume 107, Issue 3 • 2015 1033
observations of soil water content for flax at Akron under both water availability conditions in both years (Fig. 1, 3, 4, 5) and what will be presented later for the irrigated water treatment in 2012 at Sidney and for both water treatments at Sidney in 2013, which all indicated that flax was using water from the 0.6- to 0.9-m layer. An increase in profile soil water content of 0.0133 m3 m–3 was observed between cover crop planting and termination times for the dryland fallow plot in 2012 (Fig. 7, top panel). This was in contrast to the soil water decreases seen for the cover crops which ranged from –0.0288 (flax) to –0.0605 m3 m–3 (oat). The profile soil water decrease seen under the mixture was not different from that seen under any of the single-species plantings.
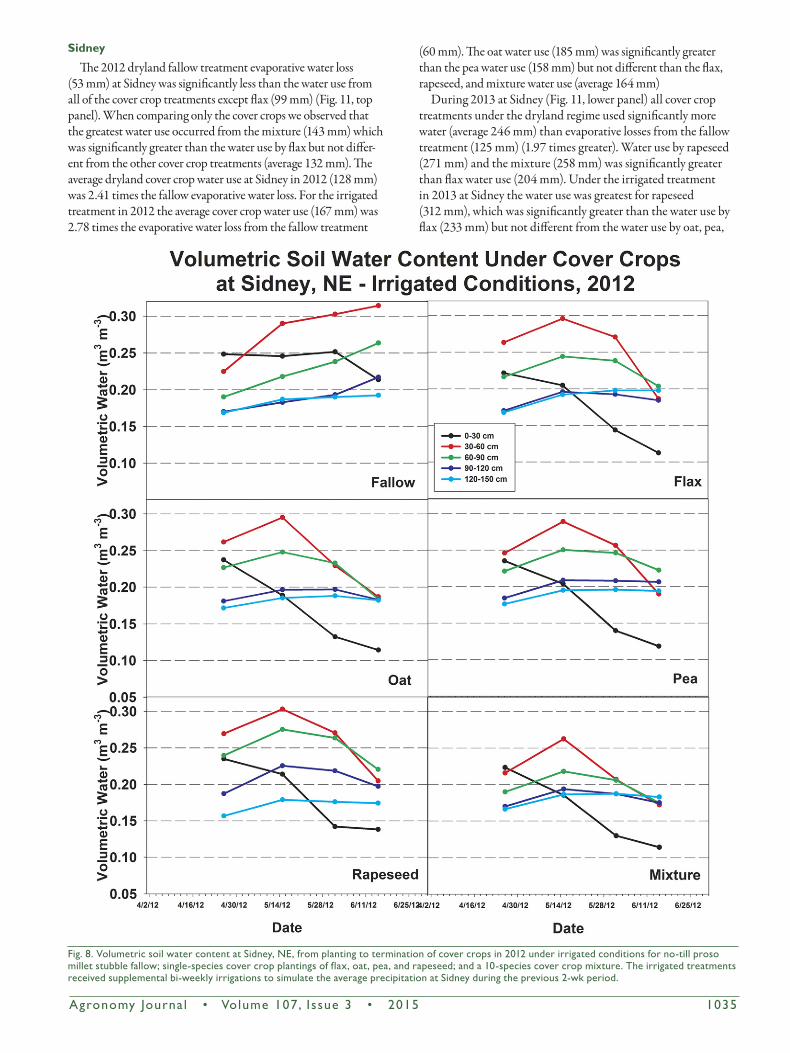
The fallow irrigated treatment at Sidney in 2012 (Fig. 8) showed increases in soil water in all layers except 0.0 to 0.3 m. Aggressive drawdown of soil water was seen in the top two layers of soil for all four single-species plantings and for the 10-species mixture. In the 0.6- to 0.9-m layer similar drawdowns of soil water were observed for flax, oat, and rapeseed with lesser amounts for pea and the mix-ture. Very little drawdown of soil water was seen at depths below 0.9 m for all cover crop plantings. Rapeseed showed the greatest drawdown at this depth, going from 0.226 m3 m–3 on 15 May to 0.197 m3 m–3 on 15 June. The profile soil water content increased by 0.0437 m3 m–3 for the fallow treatment (Fig. 7, top panel) while the profile soil water decreased under all cover crop treatments
Fig. 6. Volumetric soil water content at Sidney, NE, from planting to termination of cover crops in 2012 under dryland conditions for no-till proso millet stubble fallow; single-species cover crop plantings of flax, oat, pea, and rapeseed; and a 10-species cover crop mixture.
1034 Agronomy Journa l • Volume 107, Issue 3 • 2015
(averaging –0.0453 m3 m–3, no significant difference between treatments, p = 0.10)
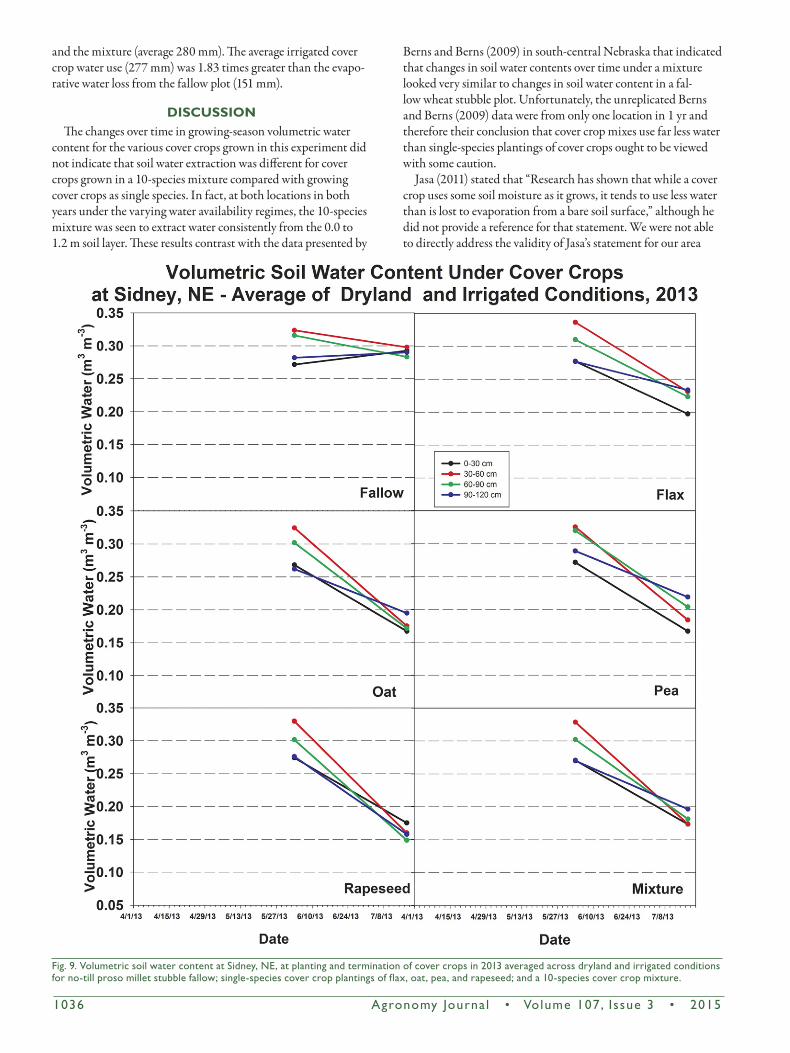
Soil water contents at Sidney in 2013 were only available at crop emergence and at crop termination. In this year the irrigation effect was not significant for any of the four soil layers (p > 0.45) at either date, probably due to the low amount of irrigation applied at this site in this year (58 mm, Table 2) and the above-average April through June precipitation. Therefore, we averaged the soil water data over the irrigation treatments (Fig. 9). Over the measurement period (3 June–17 July) the fallow plot showed small increases in soil water in the 0.0- to 0.3-m and 0.9- to 1.2-m layers and small decreases in soil water in the 0.3- to 0.6-m and 0.6- to 0.9-m layers. For all four single-species plantings and the 10-species mixture we observed clear drawdowns of soil water in all four layers. By the time of cover crop termination, all of the single-species plantings and the 10-species mixture had extracted soil water down to 0.148 to 0.196 m3 m–3 in all four soil layers, with the exception of all four soil layers of flax and of the 0.6- to 0.9-m and 0.9- to 1.2-m soil layers for pea (final soil water contents of 0.197–0.234 m3 m–3). In this year there was a small decrease in profile soil water content (–0.0073 m3 m–3) for the fallow
treatment, while the flax showed a decrease of –0.0738 m3 m–3 (Fig. 7, lower panel). The profile soil water content changes for the other single-species plantings and the 10-species mixture were not different from each other, averaging –0.1178 m3 m–3.
Cover Crop Water Use
Analysis of variance showed that at both Akron and Sidney the year by rainfall regime treatment interaction was significant for cover crop water use (p < 0.02 at both locations). Therefore, at each location the water use results are presented for each rainfall regime in each year (Fig. 10, 11). In each of the figures the probability that the null hypothesis (no difference in water use due to cover crop type) is true is presented as well as the mean separation letter labels identifying significant differences as computed by the Tukey HSD (p = 0.05) mean separation test. The analysis is presented twice for each year by rainfall regime combination, once with the fallow treatment considered as a cover crop treatment, and once with only cover crops considered in the comparison (similar presentation format as used with Fig. 2 and 7).
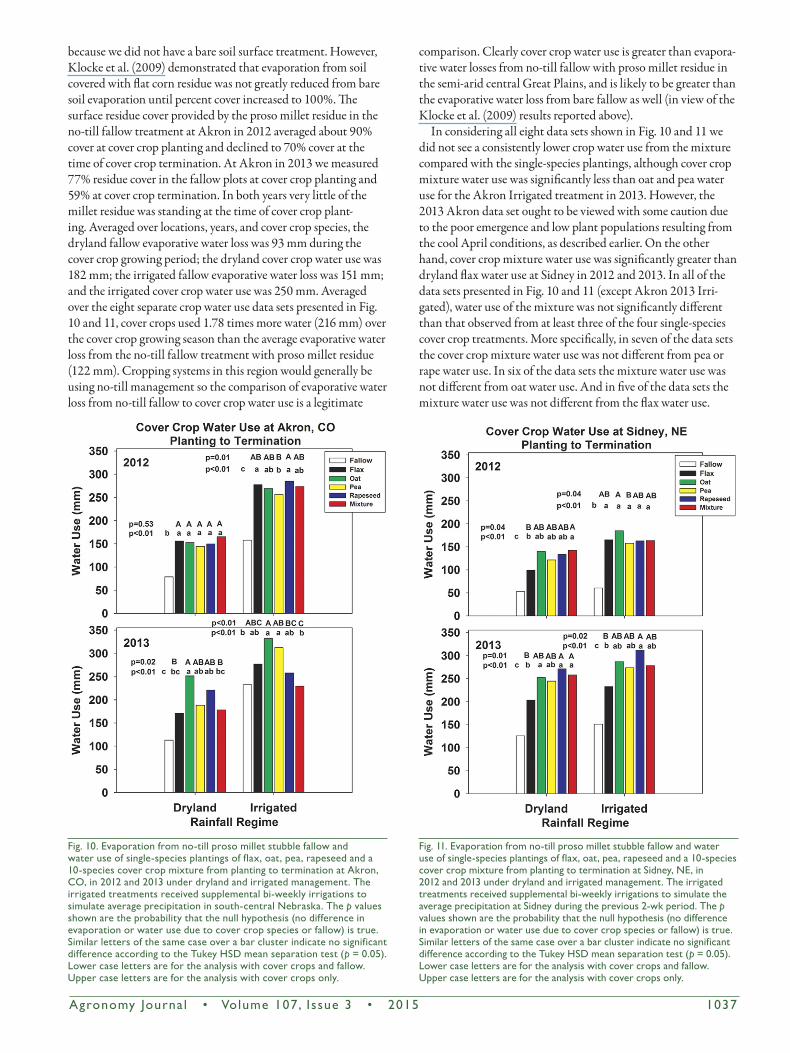
Akron
During 2012 at Akron (Fig. 10, top panel) the cover crop treatments under the dryland regime used 1.95 times more water than the fallow treatment lost by evaporation (154 vs. 79 mm), and under the irrigated treatment (simulating the south-central Nebraska average precipitation condition) the cover crop treat-ments used an average of 1.73 times more water than the fallow treatment lost by evaporation (273 vs. 158 mm). The 2012 dryland cover crop water use was not different by cover crop type and averaged 154 mm. For the irrigated treatment in 2012, the rapeseed water use (285 mm) was significantly greater (p = 0.01) than the pea water use (257 mm) while the water use of the other cover crops was intermediate to these two (averaging 274 mm).
During 2013 at Akron (Fig. 10, lower panel) under the dryland regime all of the cover crops used numerically more water than the evaporative loss from the fallow treatment (113 mm), but the difference was only statistically significant for oat (252 mm) and rapeseed (221 mm). Comparing only the cover crops (no fallow comparison), the water use by oat was significantly greater than the water use by flax (171 mm). For the irrigated treatment in 2013 the water use by the cover crop mixture was nearly identical to the evaporative water loss from fallow (230 vs. 233 mm). The water use by flax (277 mm) and rapeseed (258 mm), although numerically greater than the mixture water use and evaporative loss from fallow, was not significantly greater. On the other hand, the pea water use (313 mm) was significantly greater than the mixture water use and the evaporative loss from fallow. Under this irrigated treatment in 2013 oat used the most water (332 mm) which was signifi-cantly more than the rapeseed and mixture water use, but not significantly greater than the water use by flax and pea. As noted earlier, the very poor stands of the cover crop species (Table 3) in 2013 compared with 2012 is likely the reason for the relatively low observed water use for flax, rapeseed, and the mixture. The average dryland cover crop water use at Akron in 2013 (202 mm) was 1.79 times the fallow evaporative water loss (113 mm). The average irrigated cover crop water loss (282 mm) was 1.21 times the fallow evaporative water loss (233 mm).
Fig. 7. Change in volumetric soil water content (0–120 cm soil profile) at Sidney in 2012 and 2013 for dryland and irrigated conditions for no-till proso millet stubble fallow; single-species cover crop plantings of flax, oat, pea, and rapeseed; and a 10-species cover crop mixture. The irrigated treatments received supplemental bi-weekly irrigations to simulate the average precipitation at Sidney during the previous 2-wk period. The p values shown are the probability that the null hypothesis (no difference in evaporation or water use due to cover crop species or fallow) is true. Similar letters of the same case over a bar cluster indicate no significant difference according to the Tukey HSD mean separation test (p = 0.05). Lower case letters are for the analysis with cover crops and fallow. Upper case letters are for the analysis with cover crops only.
Agronomy Journa l • Volume 107, Issue 3 • 2015 1035
Sidney
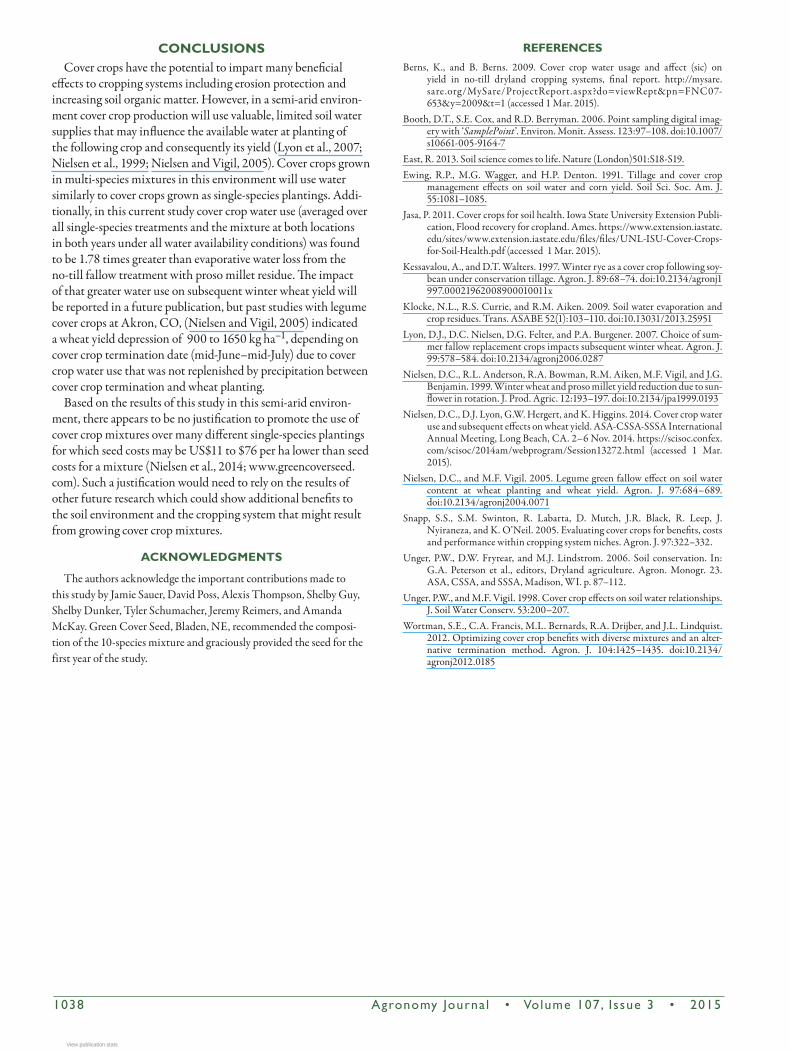
The 2012 dryland fallow treatment evaporative water loss (53 mm) at Sidney was significantly less than the water use from all of the cover crop treatments except flax (99 mm) (Fig. 11, top panel). When comparing only the cover crops we observed that the greatest water use occurred from the mixture (143 mm) which was significantly greater than the water use by flax but not differ-ent from the other cover crop treatments (average 132 mm). The average dryland cover crop water use at Sidney in 2012 (128 mm) was 2.41 times the fallow evaporative water loss. For the irrigated treatment in 2012 the average cover crop water use (167 mm) was 2.78 times the evaporative water loss from the fallow treatment
(60 mm). The oat water use (185 mm) was significantly greater than the pea water use (158 mm) but not different than the flax, rapeseed, and mixture water use (average 164 mm)
During 2013 at Sidney (Fig. 11, lower panel) all cover crop treatments under the dryland regime used significantly more water (average 246 mm) than evaporative losses from the fallow treatment (125 mm) (1.97 times greater). Water use by rapeseed (271 mm) and the mixture (258 mm) was significantly greater than flax water use (204 mm). Under the irrigated treatment in 2013 at Sidney the water use was greatest for rapeseed (312 mm), which was significantly greater than the water use by flax (233 mm) but not different from the water use by oat, pea,
Fig. 8. Volumetric soil water content at Sidney, NE, from planting to termination of cover crops in 2012 under irrigated conditions for no-till proso millet stubble fallow; single-species cover crop plantings of flax, oat, pea, and rapeseed; and a 10-species cover crop mixture. The irrigated treatments received supplemental bi-weekly irrigations to simulate the average precipitation at Sidney during the previous 2-wk period.
1036 Agronomy Journa l • Volume 107, Issue 3 • 2015
and the mixture (average 280 mm). The average irrigated cover crop water use (277 mm) was 1.83 times greater than the evapo-rative water loss from the fallow plot (151 mm).
DISCUSSIONThe changes over time in growing-season volumetric water
content for the various cover crops grown in this experiment did not indicate that soil water extraction was different for cover crops grown in a 10-species mixture compared with growing cover crops as single species. In fact, at both locations in both years under the varying water availability regimes, the 10-species mixture was seen to extract water consistently from the 0.0 to 1.2 m soil layer. These results contrast with the data presented by
Berns and Berns (2009) in south-central Nebraska that indicated that changes in soil water contents over time under a mixture looked very similar to changes in soil water content in a fal-low wheat stubble plot. Unfortunately, the unreplicated Berns and Berns (2009) data were from only one location in 1 yr and therefore their conclusion that cover crop mixes use far less water than single-species plantings of cover crops ought to be viewed with some caution.
Jasa (2011) stated that “Research has shown that while a cover crop uses some soil moisture as it grows, it tends to use less water than is lost to evaporation from a bare soil surface,” although he did not provide a reference for that statement. We were not able to directly address the validity of Jasa’s statement for our area
Fig. 9. Volumetric soil water content at Sidney, NE, at planting and termination of cover crops in 2013 averaged across dryland and irrigated conditions for no-till proso millet stubble fallow; single-species cover crop plantings of flax, oat, pea, and rapeseed; and a 10-species cover crop mixture.
Agronomy Journa l • Volume 107, Issue 3 • 2015 1037
because we did not have a bare soil surface treatment. However, Klocke et al. (2009) demonstrated that evaporation from soil covered with flat corn residue was not greatly reduced from bare soil evaporation until percent cover increased to 100%. The surface residue cover provided by the proso millet residue in the no-till fallow treatment at Akron in 2012 averaged about 90% cover at cover crop planting and declined to 70% cover at the time of cover crop termination. At Akron in 2013 we measured 77% residue cover in the fallow plots at cover crop planting and 59% at cover crop termination. In both years very little of the millet residue was standing at the time of cover crop plant-ing. Averaged over locations, years, and cover crop species, the dryland fallow evaporative water loss was 93 mm during the cover crop growing period; the dryland cover crop water use was 182 mm; the irrigated fallow evaporative water loss was 151 mm; and the irrigated cover crop water use was 250 mm. Averaged over the eight separate crop water use data sets presented in Fig. 10 and 11, cover crops used 1.78 times more water (216 mm) over the cover crop growing season than the average evaporative water loss from the no-till fallow treatment with proso millet residue (122 mm). Cropping systems in this region would generally be using no-till management so the comparison of evaporative water loss from no-till fallow to cover crop water use is a legitimate
comparison. Clearly cover crop water use is greater than evapora-tive water losses from no-till fallow with proso millet residue in the semi-arid central Great Plains, and is likely to be greater than the evaporative water loss from bare fallow as well (in view of the Klocke et al. (2009) results reported above).
In considering all eight data sets shown in Fig. 10 and 11 we did not see a consistently lower crop water use from the mixture compared with the single-species plantings, although cover crop mixture water use was significantly less than oat and pea water use for the Akron Irrigated treatment in 2013. However, the 2013 Akron data set ought to be viewed with some caution due to the poor emergence and low plant populations resulting from the cool April conditions, as described earlier. On the other hand, cover crop mixture water use was significantly greater than dryland flax water use at Sidney in 2012 and 2013. In all of the data sets presented in Fig. 10 and 11 (except Akron 2013 Irri-gated), water use of the mixture was not significantly different than that observed from at least three of the four single-species cover crop treatments. More specifically, in seven of the data sets the cover crop mixture water use was not different from pea or rape water use. In six of the data sets the mixture water use was not different from oat water use. And in five of the data sets the mixture water use was not different from the flax water use.
Fig. 10. Evaporation from no-till proso millet stubble fallow and water use of single-species plantings of flax, oat, pea, rapeseed and a 10-species cover crop mixture from planting to termination at Akron, CO, in 2012 and 2013 under dryland and irrigated management. The irrigated treatments received supplemental bi-weekly irrigations to simulate average precipitation in south-central Nebraska. The p values shown are the probability that the null hypothesis (no difference in evaporation or water use due to cover crop species or fallow) is true. Similar letters of the same case over a bar cluster indicate no significant difference according to the Tukey HSD mean separation test (p = 0.05). Lower case letters are for the analysis with cover crops and fallow. Upper case letters are for the analysis with cover crops only.
Fig. 11. Evaporation from no-till proso millet stubble fallow and water use of single-species plantings of flax, oat, pea, rapeseed and a 10-species cover crop mixture from planting to termination at Sidney, NE, in 2012 and 2013 under dryland and irrigated management. The irrigated treatments received supplemental bi-weekly irrigations to simulate the average precipitation at Sidney during the previous 2-wk period. The p values shown are the probability that the null hypothesis (no difference in evaporation or water use due to cover crop species or fallow) is true. Similar letters of the same case over a bar cluster indicate no significant difference according to the Tukey HSD mean separation test (p = 0.05). Lower case letters are for the analysis with cover crops and fallow. Upper case letters are for the analysis with cover crops only.
1038 Agronomy Journa l • Volume 107, Issue 3 • 2015
CONCLUSIONSCover crops have the potential to impart many beneficial
effects to cropping systems including erosion protection and increasing soil organic matter. However, in a semi-arid environ-ment cover crop production will use valuable, limited soil water supplies that may influence the available water at planting of the following crop and consequently its yield (Lyon et al., 2007; Nielsen et al., 1999; Nielsen and Vigil, 2005). Cover crops grown in multi-species mixtures in this environment will use water similarly to cover crops grown as single-species plantings. Addi-tionally, in this current study cover crop water use (averaged over all single-species treatments and the mixture at both locations in both years under all water availability conditions) was found to be 1.78 times greater than evaporative water loss from the no-till fallow treatment with proso millet residue. The impact of that greater water use on subsequent winter wheat yield will be reported in a future publication, but past studies with legume cover crops at Akron, CO, (Nielsen and Vigil, 2005) indicated a wheat yield depression of 900 to 1650 kg ha–1, depending on cover crop termination date (mid-June–mid-July) due to cover crop water use that was not replenished by precipitation between cover crop termination and wheat planting.
Based on the results of this study in this semi-arid environ-ment, there appears to be no justification to promote the use of cover crop mixtures over many different single-species plantings for which seed costs may be US$11 to $76 per ha lower than seed costs for a mixture (Nielsen et al., 2014; www.greencoverseed.com). Such a justification would need to rely on the results of other future research which could show additional benefits to the soil environment and the cropping system that might result from growing cover crop mixtures.
ACKNOWLEDGMENTS
The authors acknowledge the important contributions made to this study by Jamie Sauer, David Poss, Alexis Thompson, Shelby Guy, Shelby Dunker, Tyler Schumacher, Jeremy Reimers, and Amanda McKay. Green Cover Seed, Bladen, NE, recommended the composi-tion of the 10-species mixture and graciously provided the seed for the first year of the study.
REFERENCESBerns, K., and B. Berns. 2009. Cover crop water usage and affect (sic) on
yield in no-till dryland cropping systems, final report. http://mysare.sare.org/MySare/ProjectReport.aspx?do=viewRept&pn=FNC07-653&y=2009&t=1 (accessed 1 Mar. 2015).
Booth, D.T., S.E. Cox, and R.D. Berryman. 2006. Point sampling digital imag-ery with ‘SamplePoint’. Environ. Monit. Assess. 123:97–108. doi:10.1007/s10661-005-9164-7
East, R. 2013. Soil science comes to life. Nature (London)501:S18-S19. Ewing, R.P., M.G. Wagger, and H.P. Denton. 1991. Tillage and cover crop
management effects on soil water and corn yield. Soil Sci. Soc. Am. J. 55:1081–1085.
Jasa, P. 2011. Cover crops for soil health. Iowa State University Extension Publi-cation, Flood recovery for cropland. Ames. https://www.extension.iastate.edu/sites/www.extension.iastate.edu/files/files/UNL-ISU-Cover-Crops-for-Soil-Health.pdf (accessed 1 Mar. 2015).
Kessavalou, A., and D.T. Walters. 1997. Winter rye as a cover crop following soy-bean under conservation tillage. Agron. J. 89:68–74. doi:10.2134/agronj1997.00021962008900010011x
Klocke, N.L., R.S. Currie, and R.M. Aiken. 2009. Soil water evaporation and crop residues. Trans. ASABE 52(1):103–110. doi:10.13031/2013.25951
Lyon, D.J., D.C. Nielsen, D.G. Felter, and P.A. Burgener. 2007. Choice of sum-mer fallow replacement crops impacts subsequent winter wheat. Agron. J. 99:578–584. doi:10.2134/agronj2006.0287
Nielsen, D.C., R.L. Anderson, R.A. Bowman, R.M. Aiken, M.F. Vigil, and J.G. Benjamin. 1999. Winter wheat and proso millet yield reduction due to sun-flower in rotation. J. Prod. Agric. 12:193–197. doi:10.2134/jpa1999.0193
Nielsen, D.C., D.J. Lyon, G.W. Hergert, and K. Higgins. 2014. Cover crop water use and subsequent effects on wheat yield. ASA-CSSA-SSSA International Annual Meeting, Long Beach, CA. 2–6 Nov. 2014. https://scisoc.confex.com/scisoc/2014am/webprogram/Session13272.html (accessed 1 Mar. 2015).
Nielsen, D.C., and M.F. Vigil. 2005. Legume green fallow effect on soil water content at wheat planting and wheat yield. Agron. J. 97:684–689. doi:10.2134/agronj2004.0071
Snapp, S.S., S.M. Swinton, R. Labarta, D. Mutch, J.R. Black, R. Leep, J. Nyiraneza, and K. O’Neil. 2005. Evaluating cover crops for benefits, costs and performance within cropping system niches. Agron. J. 97:322–332.
Unger, P.W., D.W. Fryrear, and M.J. Lindstrom. 2006. Soil conservation. In: G.A. Peterson et al., editors, Dryland agriculture. Agron. Monogr. 23. ASA, CSSA, and SSSA, Madison, WI. p. 87–112.
Unger, P.W., and M.F. Vigil. 1998. Cover crop effects on soil water relationships. J. Soil Water Conserv. 53:200–207.
Wortman, S.E., C.A. Francis, M.L. Bernards, R.A. Drijber, and J.L. Lindquist. 2012. Optimizing cover crop benefits with diverse mixtures and an alter-native termination method. Agron. J. 104:1425–1435. doi:10.2134/agronj2012.0185
View publication statsView publication stats