Embed Size (px)
Citation preview

Courtney Capital… DECEPTION AND CHARTS
Written and presented by David William Paul
Courtney Capital
• In the following short presentation I will detail several simple patterns for short term swing trading
• They are all traded with the trend and should be
applied to shares that can grow earnings strongly and
safely for a 80% hit rate. • If the fundamentals are technical position are not in
sync the hit rate will fall markedly.
• I want to be “long” undervalued stocks and “short of
overvalued stocks.
• My undervalued stocks have not budged in this market blues.
Courtney Capital
• I am looking to build a hit list of undervalued shares that have high earnings growth potential
• These shares must have a good track record of
growing earnings safely and consistently.
• The VectorVest software does this automatically • If you wish to be a position trader the you need
nothing more.
• If you wish to be a short term trader over a few days
with leverage use the following concepts with
undervalued safe stocks. The results will surprise you.
Courtney Capital
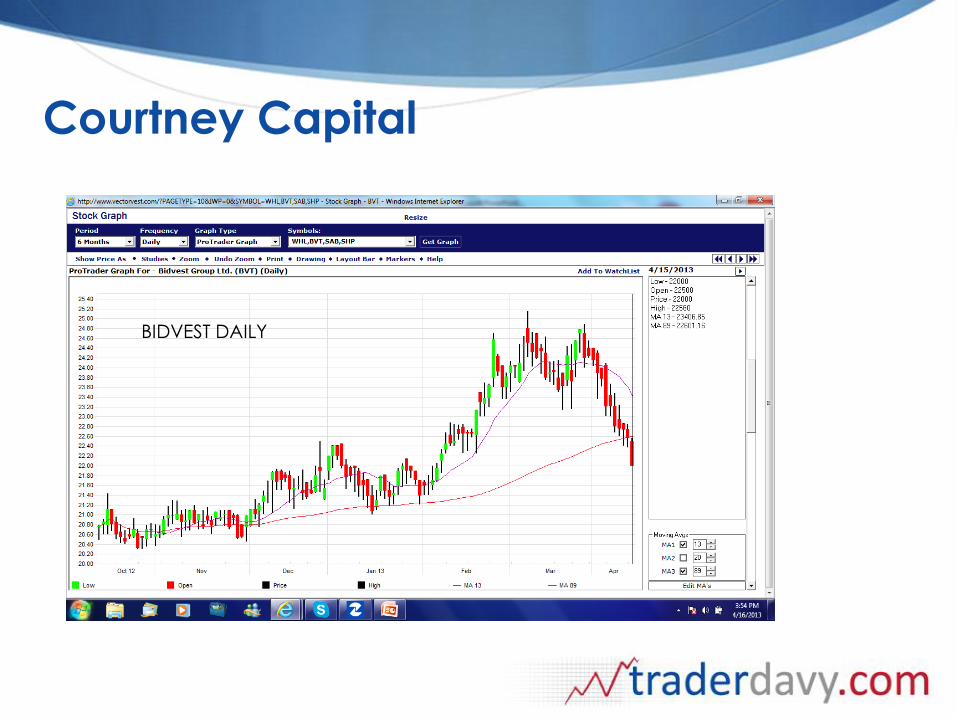
• I use a 21 period average and a 89 period to determine the trend on all my charts
• In addition VectorVest measures the short term trend
and the breadth of the advance of the total market
• A chart of Bidvest is shown next which looks at a
typical layout.
Courtney Capital
BIDVEST DAILY
Lost Motion
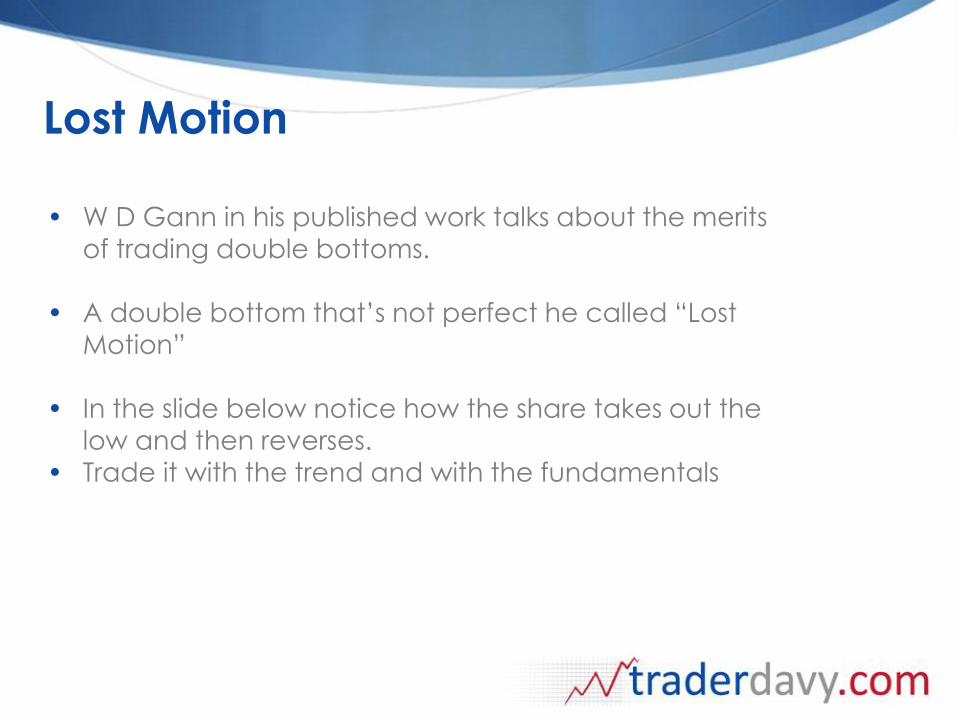
• W D Gann in his published work talks about the merits of trading double bottoms.
• A double bottom that’s not perfect he called “Lost
Motion”
• In the slide below notice how the share takes out the
low and then reverses.
• Trade it with the trend and with the fundamentals
Lost Motion
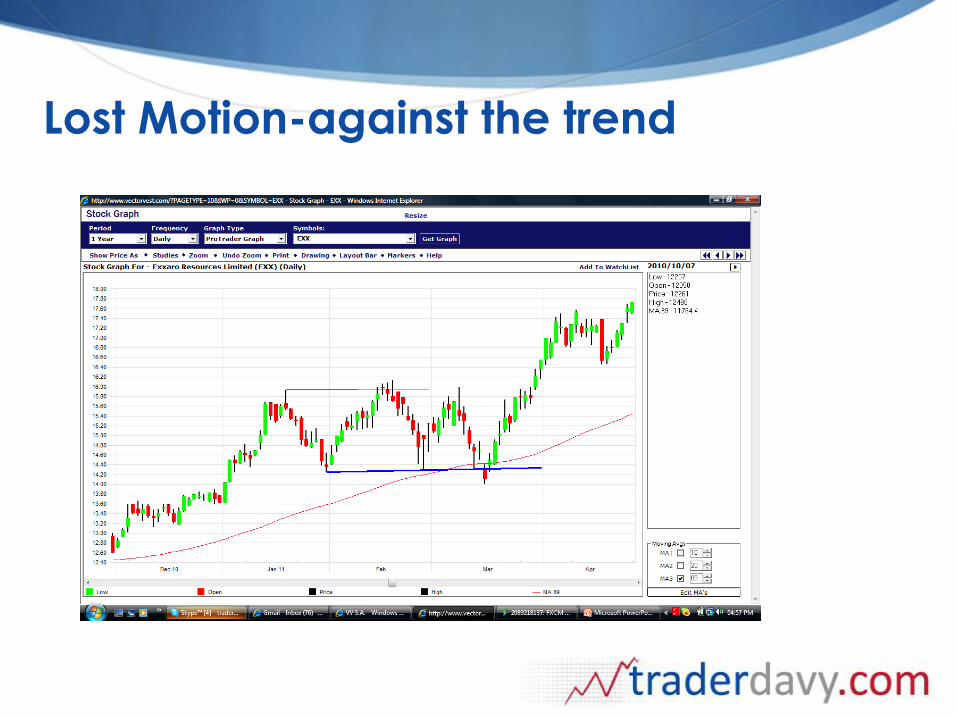
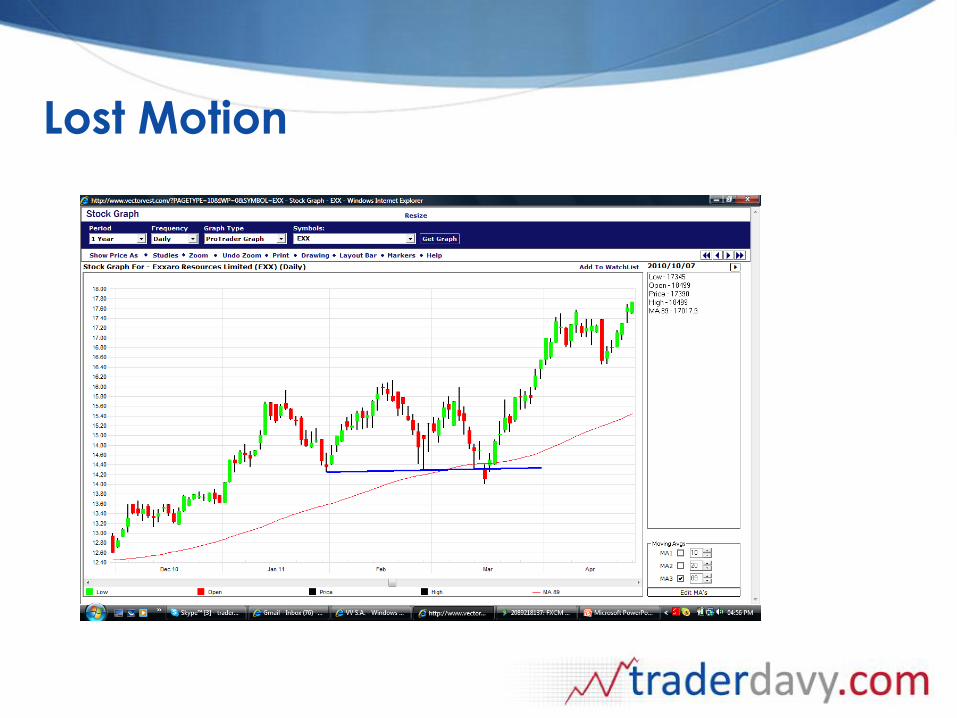
Lost Motion-against the trend
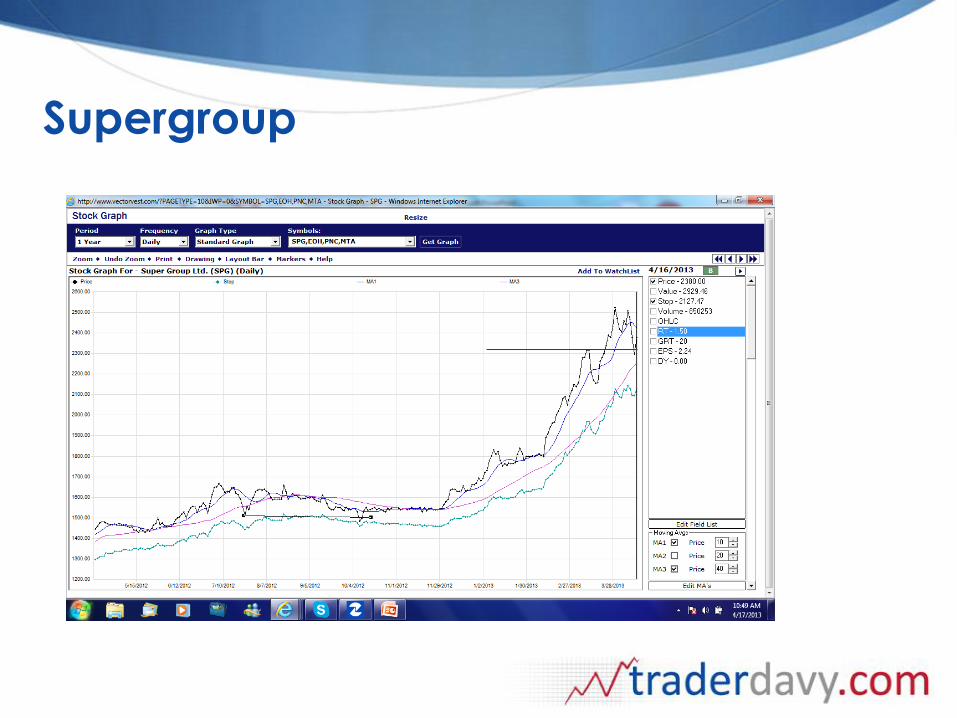
Supergroup
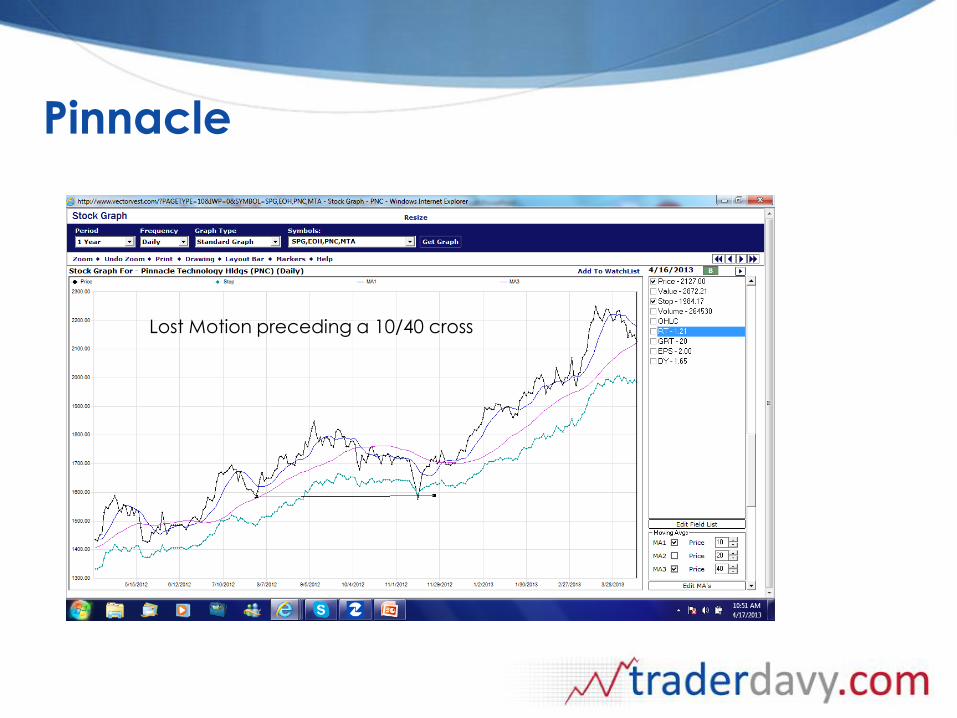
Pinnacle
Lost Motion preceding a 10/40 cross
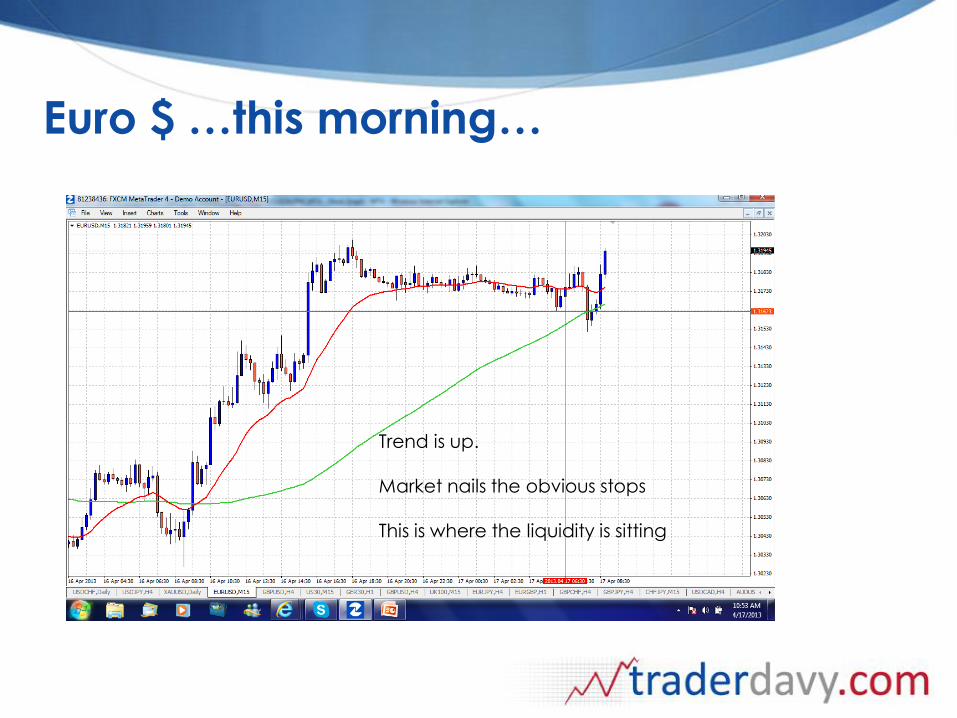
Euro $ …this morning…
Trend is up. Market nails the obvious stops This is where the liquidity is sitting
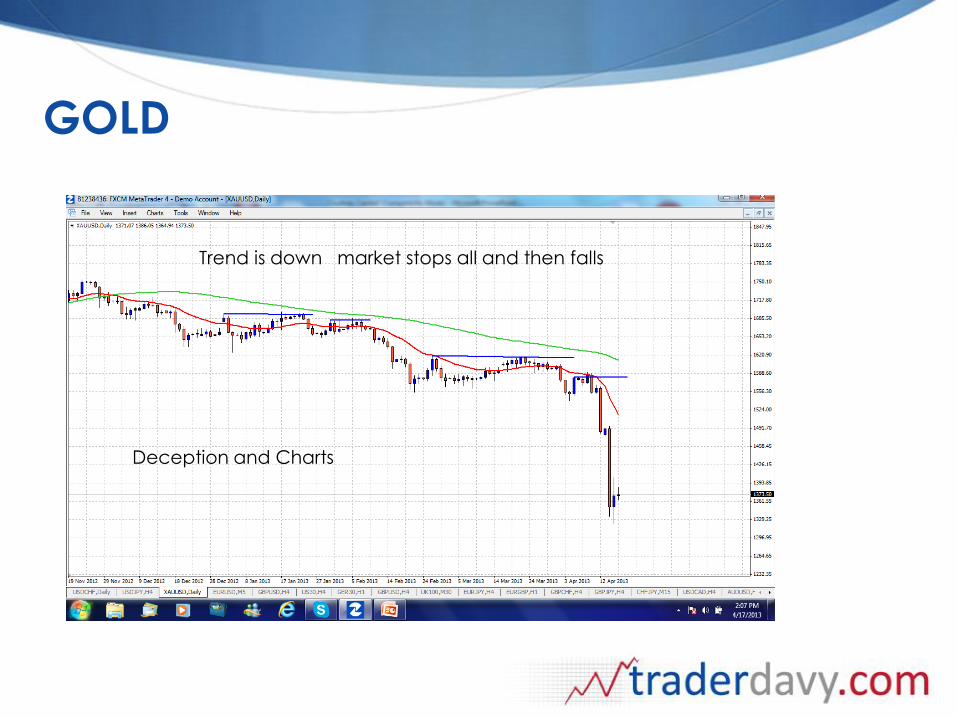
GOLD
Trend is down market stops all and then falls
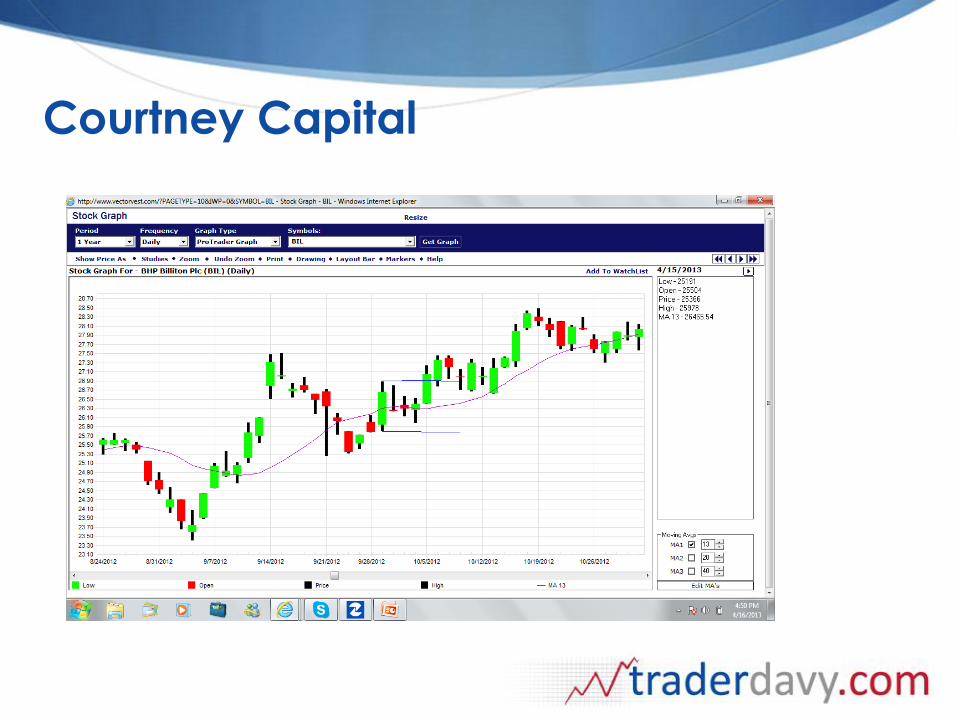
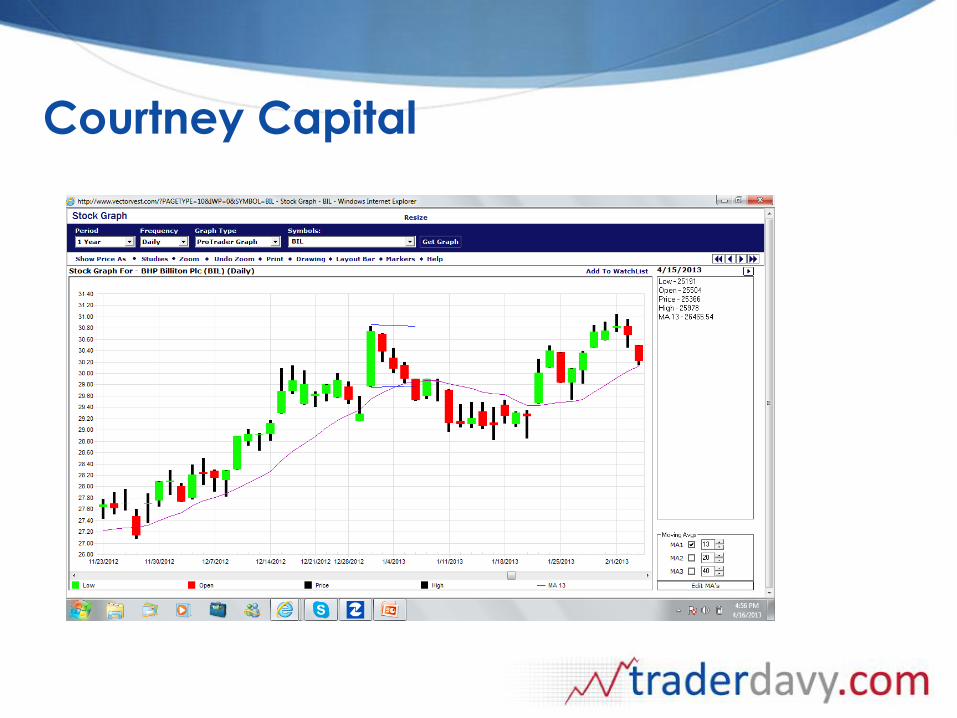
Deception and Charts
Lost Motion
• Lost Motion is the basis of a lot of my trading.
• The following pattern is Lost Motion in disguise.
Bar Chart patterns
• I have spent years researching bar chart patterns and have largely kept to myself.
• In my opinion they have a better hit rate than candle
patterns but I appreciate that is a controversial view.
• I use them every day in my trading of stocks, stock
indices and forex. • I will include examples from all asset classes.
• With the trend the trader needs little more.
Multiple Outside Bar
• This is where a bar completely engulfs the highs and lows of the last three bars.
• Its a very strong formation.
• I include a trade on the Dow cash which happened recently.
• Let the market close above the range of the outside
bar and Buy/Sell at the open of the next.
• Stop is a long way away at the low of the outside bar.
• This means that a small position will need to be traded
as the stop is large.
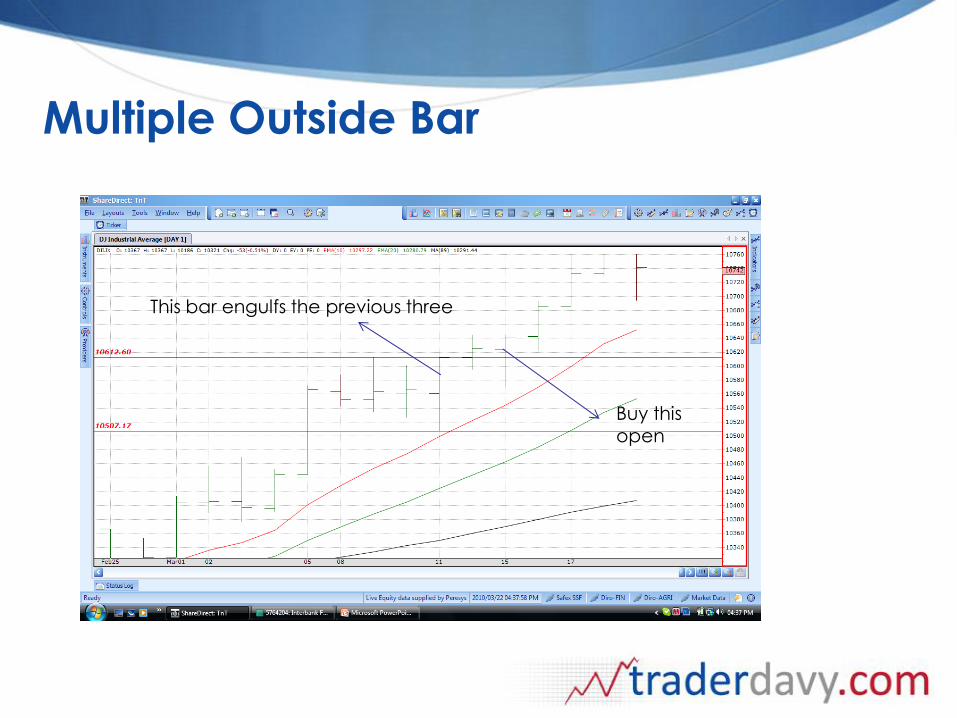
Multiple Outside Bar
This This bar engulfs the previous three
Buy this open
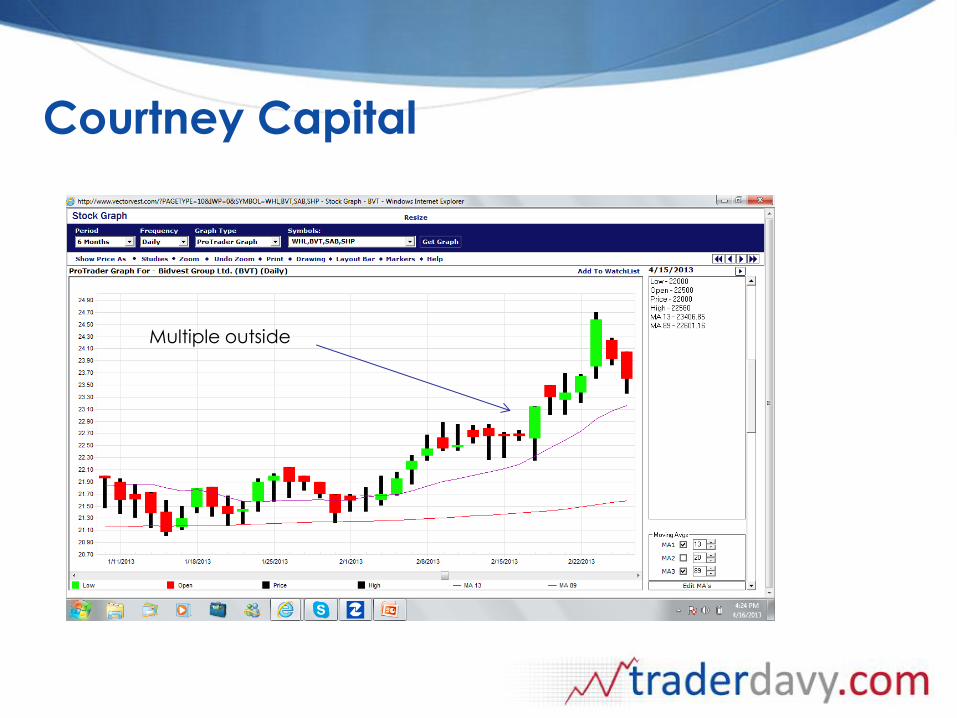
Courtney Capital
Multiple outside
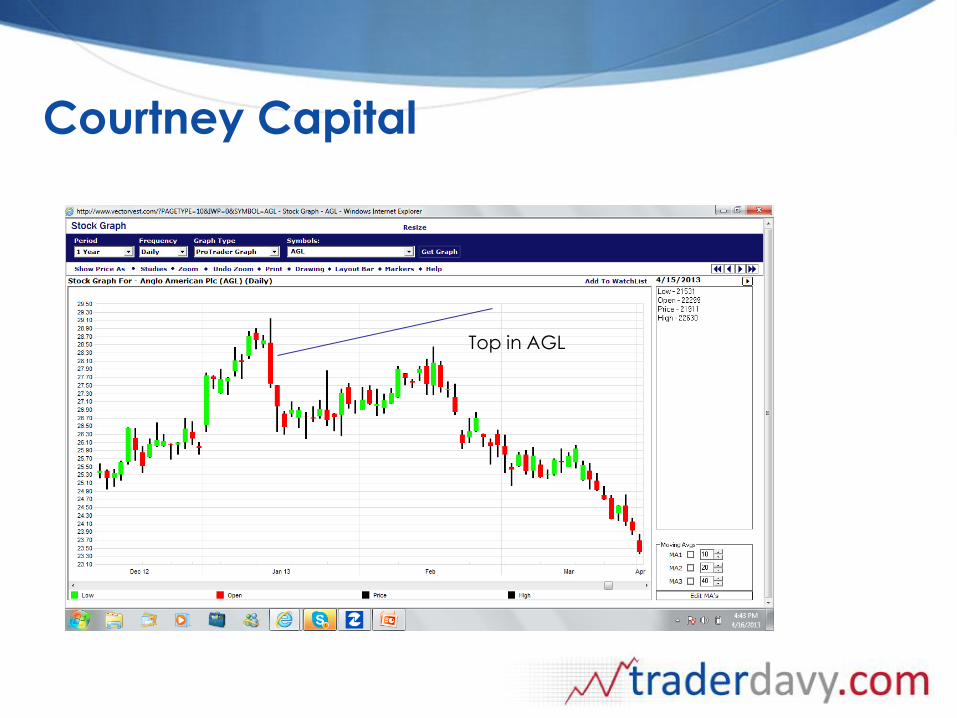
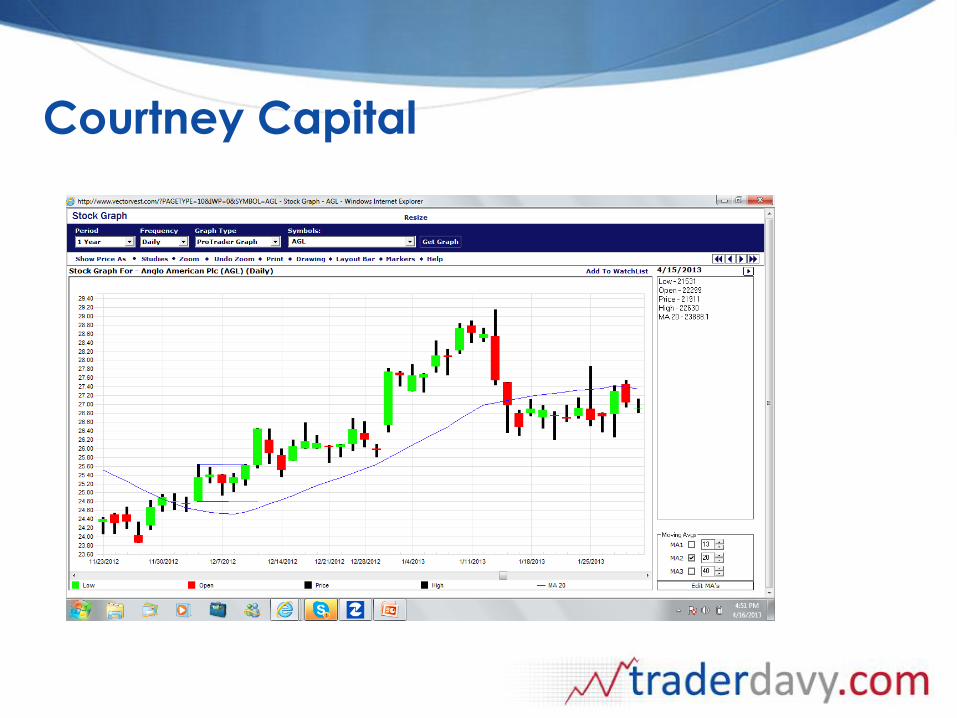
Courtney Capital
Top in AGL
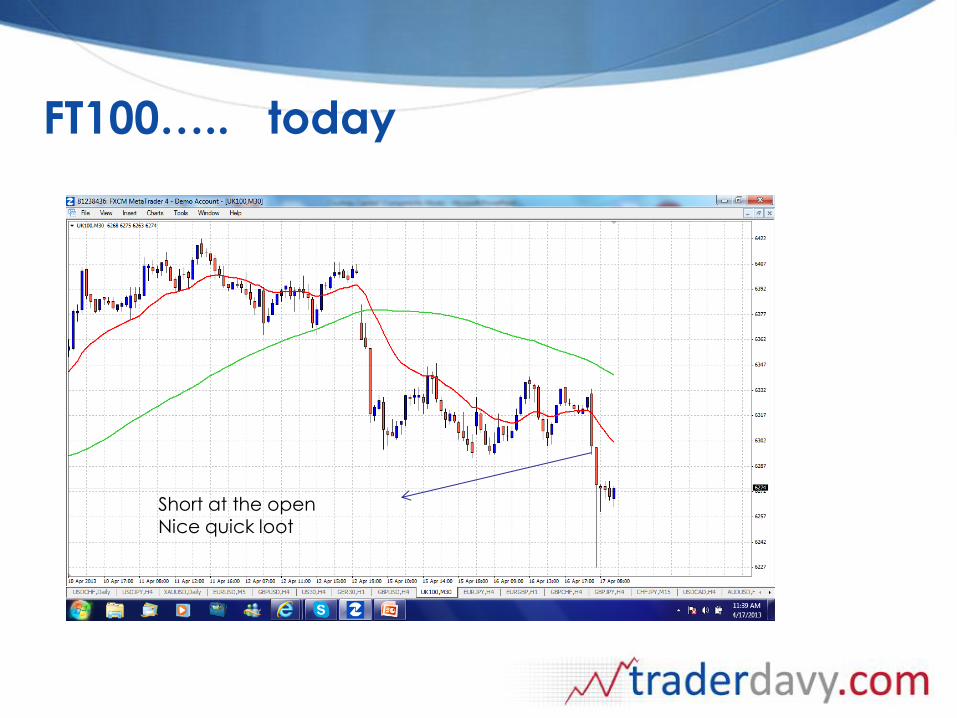
FT100….. today
Short at the open Nice quick loot
Two Bar Outside Reversal
• This is the most amazing little pattern
• Its simple. The markets makes a new high and then
reverses and closes below the last two closes.
• The market makes a new low and then closes above the last two closes.
• The pattern happens frequently. On the Jse-Alsi40
future there are two of these a day on the 30 min
chart.
• In forex define the trend and take 2 bar outside reversals in the direction of the trend.
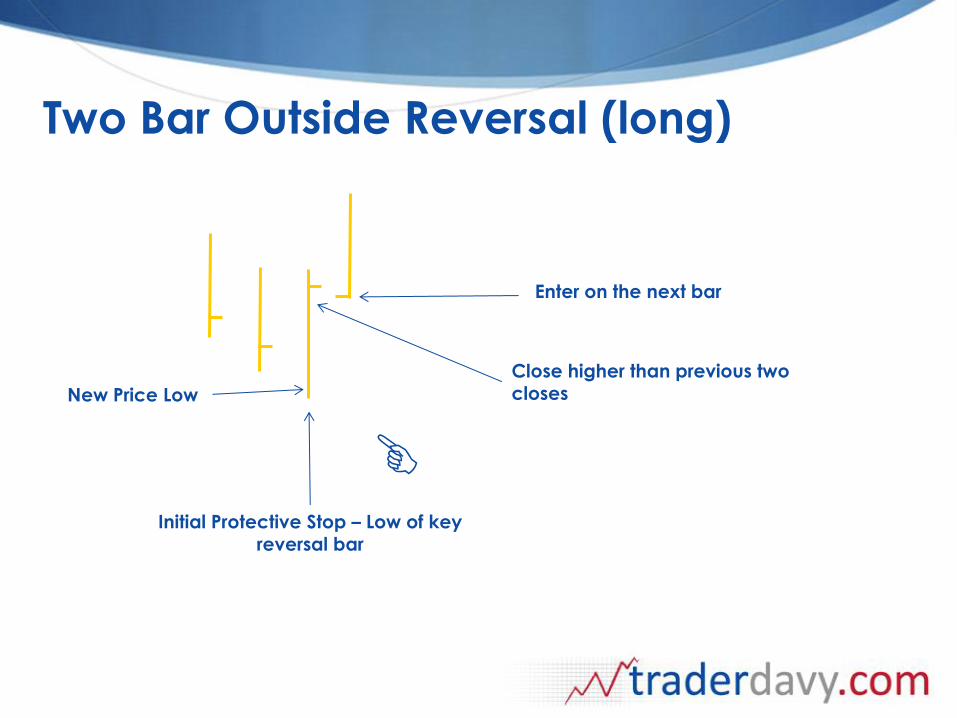
Two Bar Outside Reversal (long)
Initial Protective Stop – Low of key reversal bar
Enter on the next bar
Close higher than previous two closes New Price Low
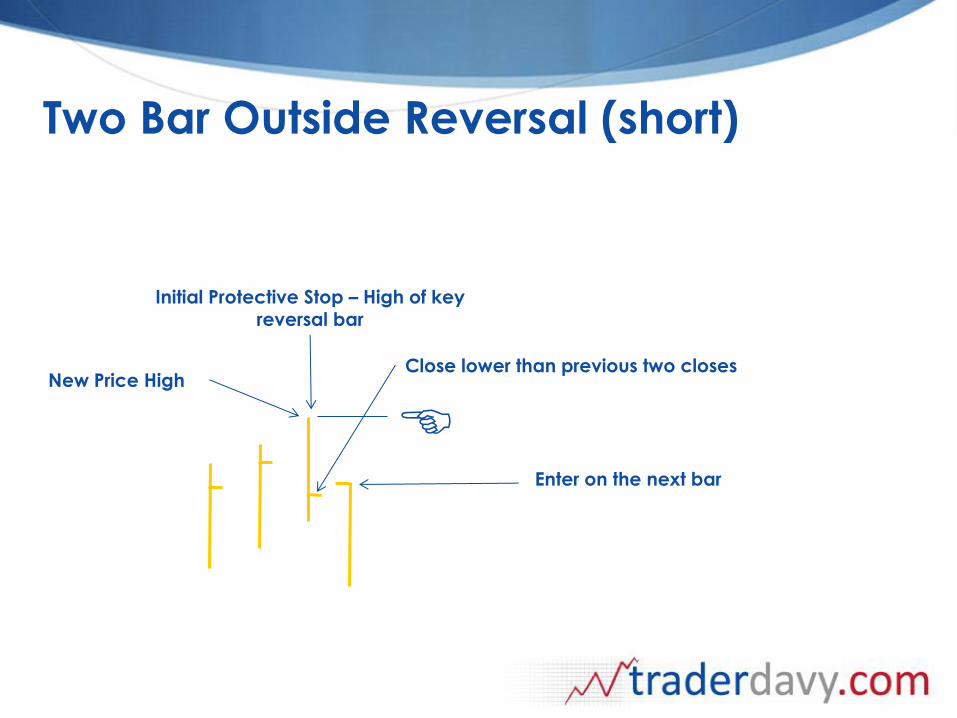
Two Bar Outside Reversal (short)
Initial Protective Stop – High of key reversal bar
Enter on the next bar
Close lower than previous two closes New Price High
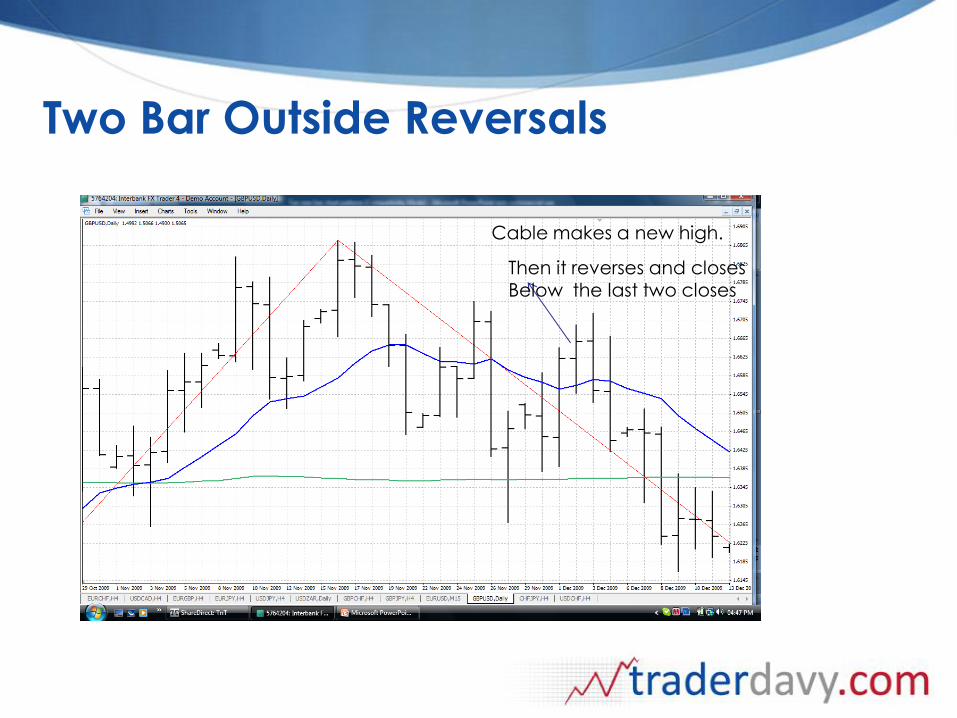
Two Bar Outside Reversals
Cable makes a new high.
Then it reverses and closes Below the last two closes
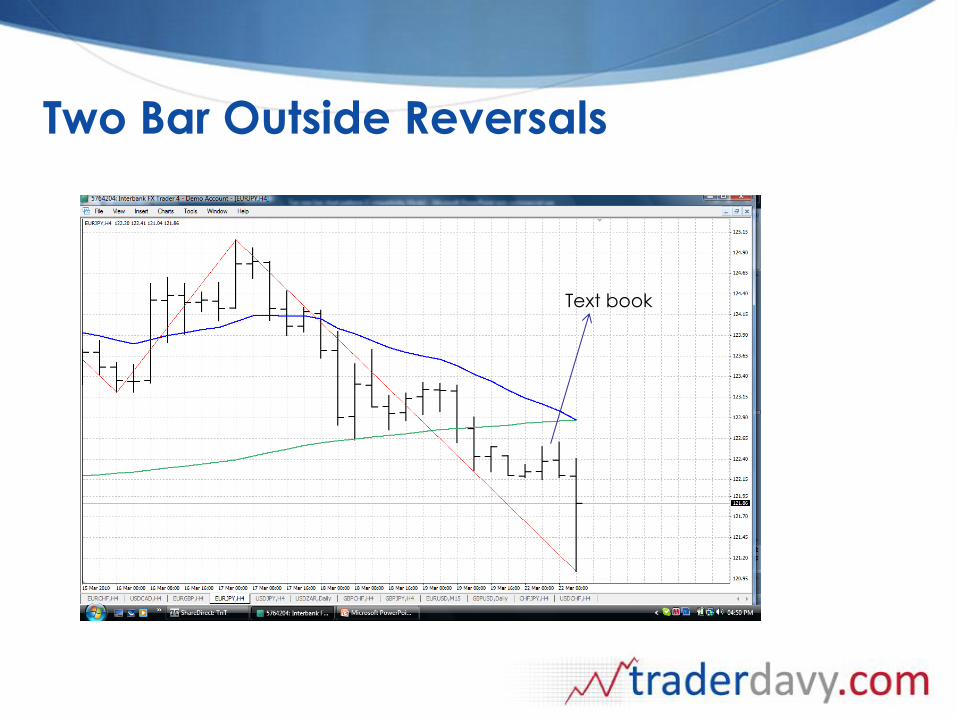
Two Bar Outside Reversals
Text book
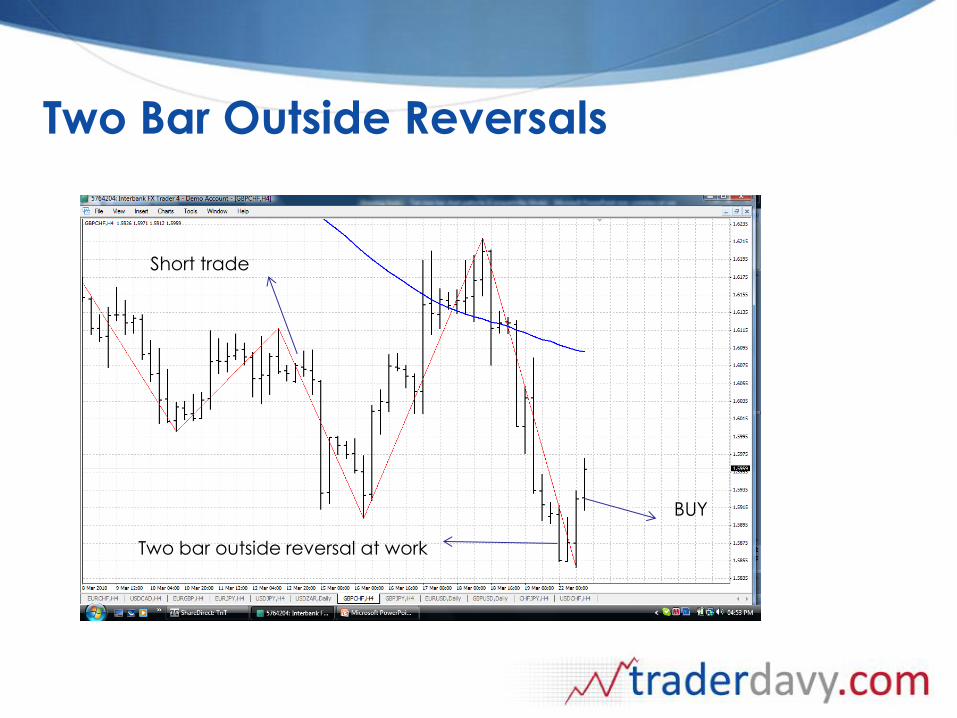
Two Bar Outside Reversals
Two bar outside reversal at work
BUY
Short trade
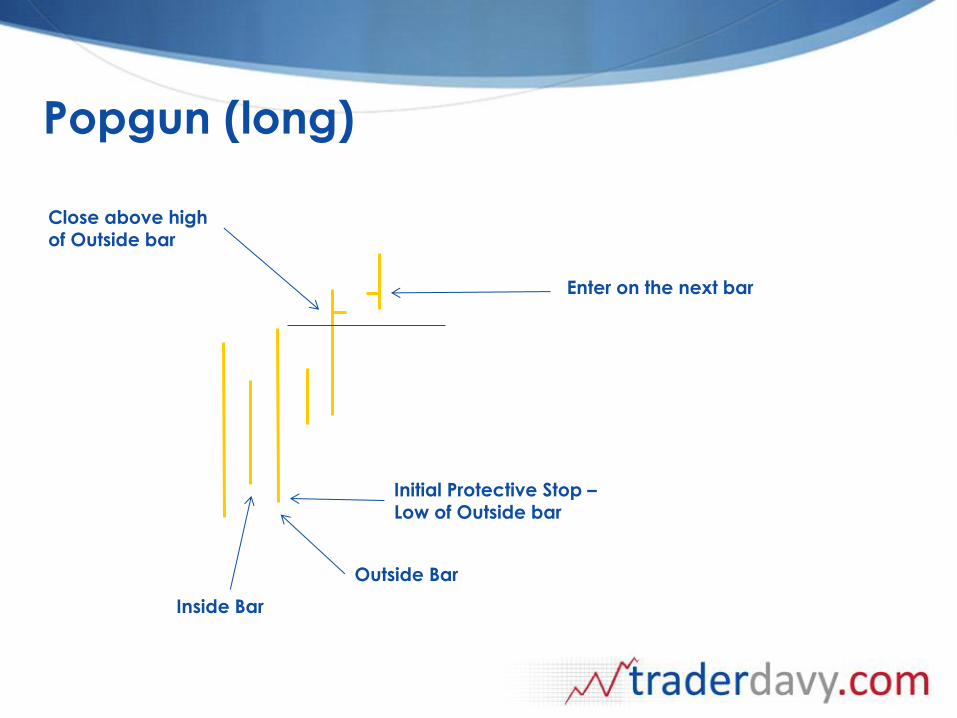
Popgun (long)
Initial Protective Stop – Low of Outside bar
Enter on the next bar
Outside Bar
Close above high of Outside bar
Inside Bar
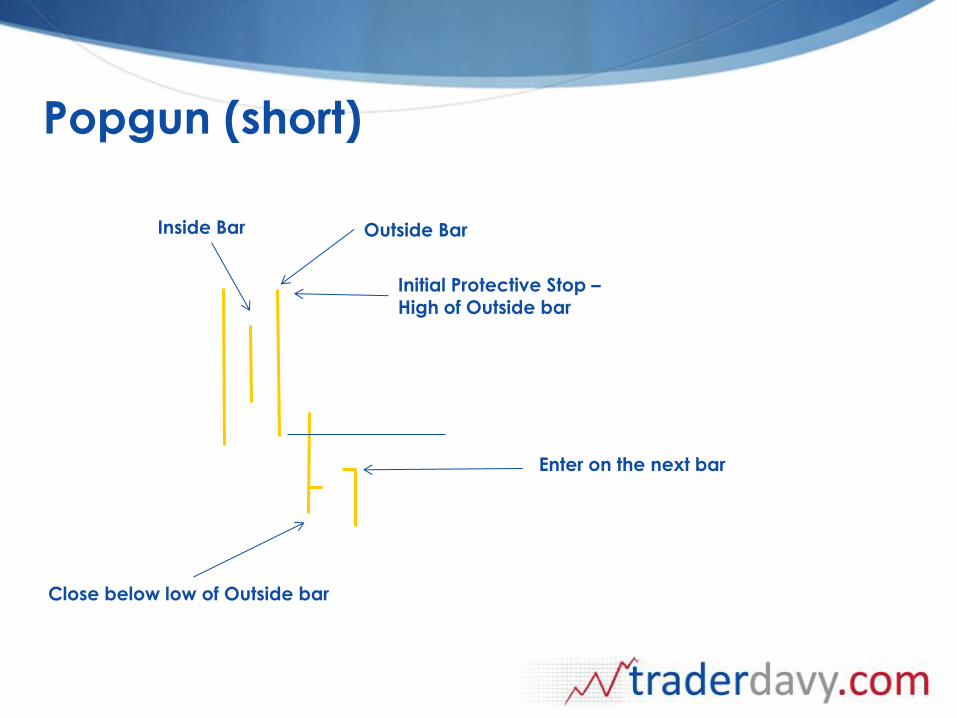
Popgun (short)
Initial Protective Stop – High of Outside bar
Enter on the next bar
Outside Bar
Close below low of Outside bar
Inside Bar
Multiple Inside Bars
• The pattern is simplicity its self.
• The market trades inside a bar for a minimum of 3 bars
• Its breaks and closes above the range of the formation
as shown in the next slide. • Enter on the open of the next bar.
• Place a stop below the low of the bar prior to the
breakout or setup bar.
• The formation does not supply any information on targets.
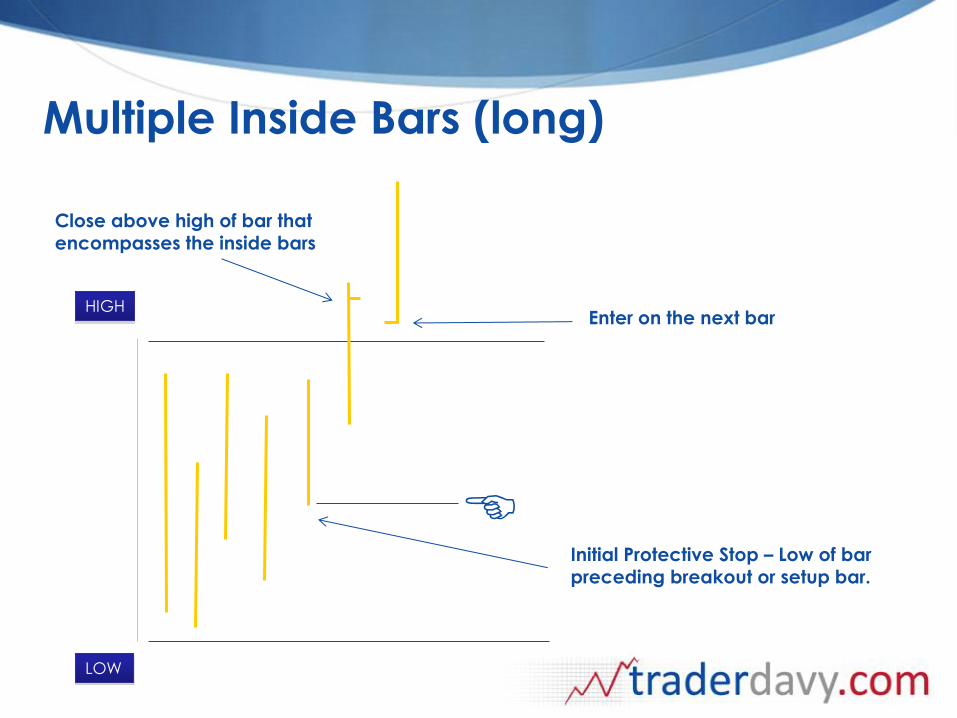
Multiple Inside Bars (long)
HIGH
LOW
Initial Protective Stop – Low of bar preceding breakout or setup bar.
Enter on the next bar
Close above high of bar that
encompasses the inside bars
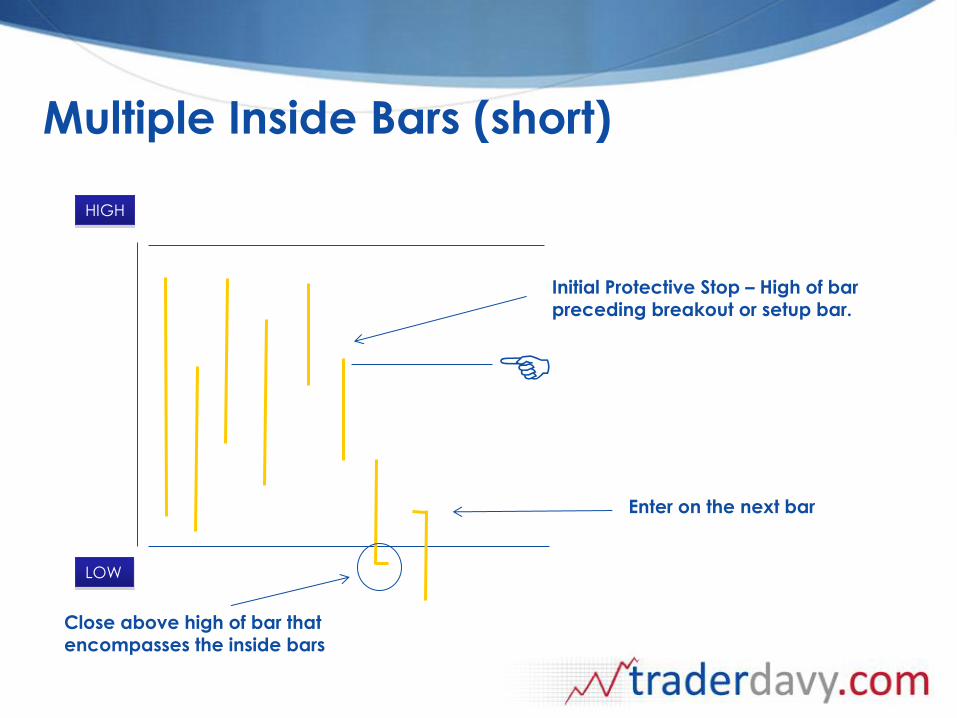
Multiple Inside Bars (short)
HIGH
LOW
Initial Protective Stop – High of bar preceding breakout or setup bar.
Enter on the next bar
Close above high of bar that
encompasses the inside bars
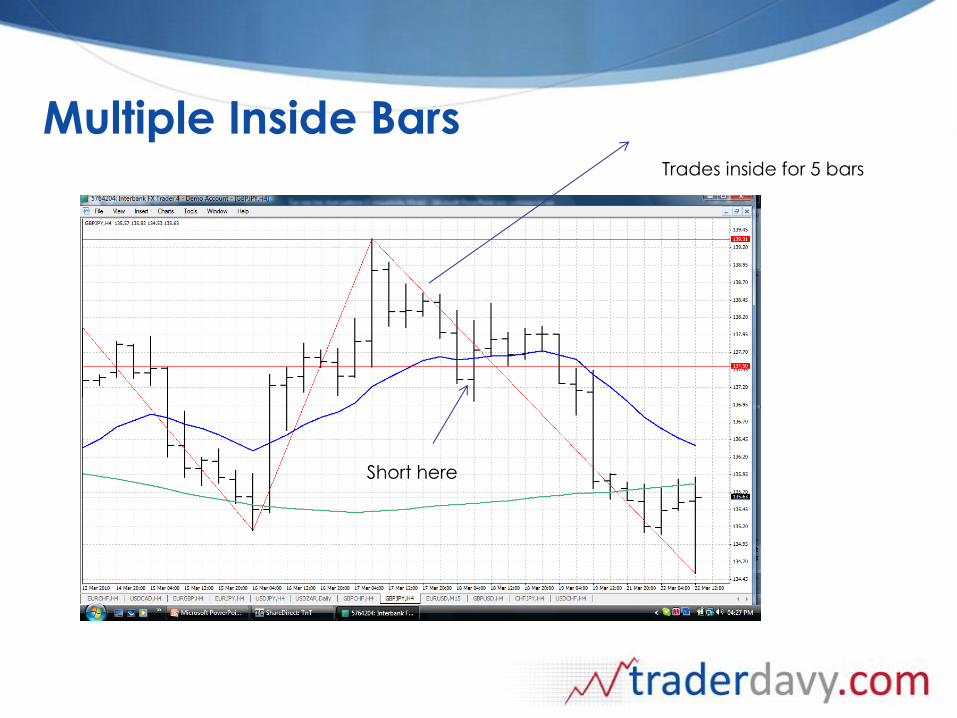
Multiple Inside Bars Trades inside for 5 bars
Short here
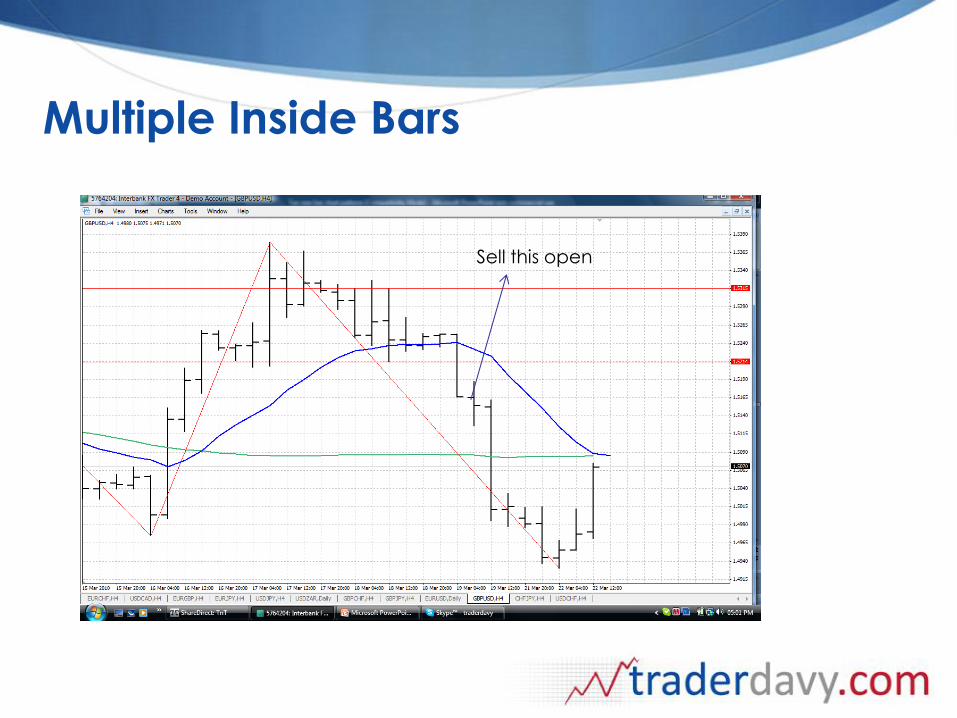
Multiple Inside Bars
Sell this open
Courtney Capital
Courtney Capital
Courtney Capital