Embed Size (px)
Citation preview

COMPASS CoursePlacement ServiceInterpretive Guide
Setting the Right Course for College Success


i
TABLE OF CONTENTS CHAPTER Page 1. Introduction ........................................................................................................................... 1 2. Overview of the Course Placement Service .................................................................... 3 Developmental History.......................................................................................... 3 The Course Placement Model ............................................................................... 4 Validity Statistics..................................................................................................... 8 Two Placement Variables .....................................................................................12 Alternatives to Cutoff Scores ...............................................................................14 3. Tests Used for Course Placement .................................................................................. 17 Content Validity .................................................................................................... 17 The COMPASS tests ............................................................................................. 18 Summary of Placement Research....................................................................... 18 4. Step-by-Step Instructions for Interpreting Your Report .............................................. 21 Components of the CPS Report .......................................................................... 21 Examining the Descriptive Information ........................................................... 23 Evaluating the Chance of a B/C or Higher ...................................................... 26 Evaluating Placement Statistics and Cutoff Scores......................................... 32 Evaluating a Current Cutoff Score..................................................................... 39 Finding a Cutoff Score for Two Placement Variables..................................... 40 The Grade Experience Table ............................................................................... 41 Comparing Placement Variables........................................................................ 43 5. More Questions and Answers about the CPS Report ................................................. 47 GLOSSARY........................................................................................................................................ 53 APPENDIX ........................................................................................................................................ 57 Decision Theory .................................................................................................................. 57 Logistic Regression............................................................................................................. 58 Statistical Anomalies and Unusual Report Features .................................................... 61 REFERENCES ................................................................................................................................... 65

ii

1
CHAPTER 1 Introduction Few factors are more crucial to success in college than appropriate course placement. Underprepared students who are incorrectly placed in college-level classes often find themselves on a downward spiral of frustration and failure, while better-prepared students who are incorrectly placed in remedial classes not only waste time and money, but can miss out on some of the intellectual excitement that college has to offer. The COMPASS Course Placement Service (CPS) is designed to help institutions place students into courses that are most appropriate for their level of academic skills, and to evaluate their course placement decisions. Specifically, the CPS report helps you select cutoff scores or validate current cutoff scores for one or more courses. The report can be based on COMPASS scores, ACT scores, local placement test scores, or high school course work and grade information. The CPS Interpretive Guide was designed to help college staff use the information in the CPS report. Chapter 1 provides an overview of this guide. Chapter 2 contains a nontechnical explanation of the main ideas used in the CPS reports. Explanations of a more technical and statistical nature are provided in an appendix. A glossary of the terms used in the CPS report follows Chapter 5. Chapter 3 describes the contents of the COMPASS tests and summarizes the results of course placement research conducted by ACT. The contents of COMPASS are as important as the statistical relationship these tests have with course grades in determining their validity for course placement. Placement tests are expected to measure the academic skills thought to be necessary for successful performance in a given course. Chapter 4 explains the tables and figures in your CPS report, and provides examples of interpreting and using the information they contain. Examples are discussed with regard to selecting a cutoff score, validating a current cutoff score, and selecting an individual placement variable or set of placement variables. This chapter incorporates and complements the instructions contained in the report itself. Chapter 5 answers questions that you or your associates might ask in the course of interpreting and using the CPS report. ACT's Course Placement Service is the product of several years of research and practical insights gained from close working partnerships with colleges. The questions and answers in this chapter reflect this history. The guide, Procedures for Participating in the COMPASS Course Placement Service, provides information on how to register for the CPS and how to prepare your data. Copies of this guide can be obtained from the Research Services Department at 319-339-3089. The COMPASS Course Placement Service is separate from the COMPASS Returning Student Retention Report. The Returning Student Retention Report is provided at no charge to COMPASS users that want this service. The CPS is available for a fee, and is designed to answer specific questions about course placement. (Both services include a ‘grade experience table’ in their report,

2
although this table is not the primary information in the CPS report.) For more detailed information on the capabilities of each service, see the ACT web site (www.act.org) or use the web address: http://www.act.org/compass/reports/research.html

3
CHAPTER 2 Overview of the Course Placement Service This chapter contains an explanation of the COMPASS Course Placement Service. The rationale and concepts behind the Course Placement Service are presented. Key statistical terms and concepts such as accuracy rate, chance of a B/C or higher, and success rate are introduced and illustrated. You may want to refer to this chapter again as you review later chapters. Developmental History Since 1963, ACT has provided to postsecondary institutions informational services to support its student assessment programs. These services are related to ACT's mission as a not-for-profit organization to facilitate educational and career planning and decision making. COMPASS, for example, currently provides to over 300 participating institutions aggregate information based on the COMPASS scores of enrolled students. One area of decision-making that has grown in recent years at postsecondary institutions is course placement (McNabb, 1990). Course placement decisions typically involve assigning a student to either a standard or lower-level course. Lower-level courses are given various names, such as developmental, preparatory, or remedial courses. By the end of the 1980's a large majority of U.S. colleges and universities had developmental placement programs. For example, in 1989, 68% of all institutions provided developmental instruction in mathematics, and 65% provided developmental instruction in writing (NCES data cited in Education Week, 1994). By 2000, 80% of public 4-year colleges and 98% of public 2-year colleges offered developmental instruction (U.S. Department of Education, 2003). Moreover, 28% of all freshmen took at least one developmental course, and 90% of all institutions with developmental placement programs used placement tests to identify those needing help. ACT's student assessments, such as COMPASS and the ACT, stand out in their suitability for making course placement decisions. They are designed to measure academic achievement: they measure the skills and competencies that have been identified by curriculum experts as essential for success in postsecondary education, and that are typically taught in college preparatory courses in high school. Student performance on these tests is reported in terms of achievement in subjects or domains of skills that are specific enough to be used for course placement. COMPASS, for example, includes tests of writing skills, reading, prealgebra, algebra, college algebra, geometry, and trigonometry. ACT began development of the CPS in 1988 in response to the growth in course placement decision-making. The statistics reported in the CPS reflect, as directly as possible, the practical advantage of using a given placement test and cutoff score for course placement. Over 80 institutions participated in research leading up to the first operational CPS report. Results of course placement research involving several institutions are summarized in the COMPASS Reference Manual (ACT, 2000). ACT continues to conduct course placement research in partnership with participating institutions and to make its findings available to the general

4
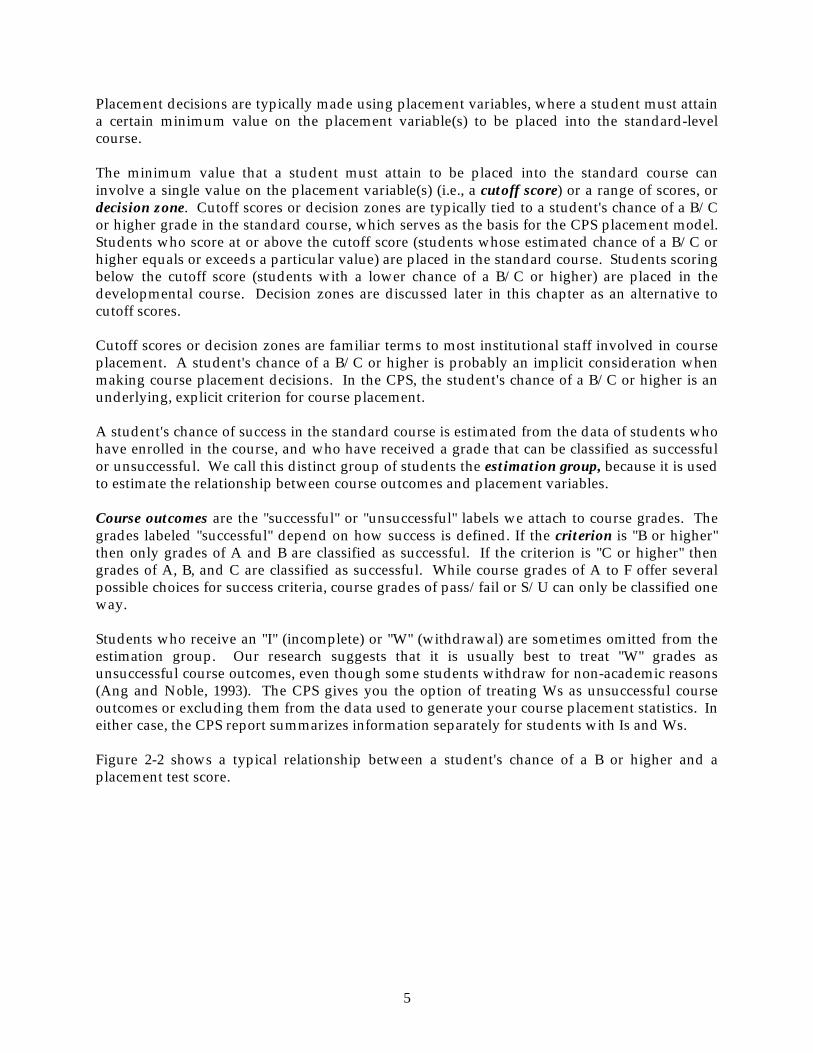
educational research community (Schiel and Harmston, 2000; Schiel and King, 1999; Sawyer, 1996; Ang and Noble, 1993a, 1993b; Crouse, 1993; Houston, 1993; Schulz, 1993). Results of this research are included throughout this guide. Chapter 3, for example, summarizes the distribution of COMPASS cutoff scores for standard first-year courses across institutions that participated in CPS research. The Course Placement Model The course placement model is a set of assumptions and ideas about how course placement works and how it can be made to work better. The statistics and other information in a Course Placement Service report are based on the course placement model. The placement group represents the population of students for whom a placement decision needs to be made. In the CPS, the placement group for a standard first-year course contains all first-time entering students for whom scores are available on COMPASS (or other placement variable). A placement variable is any test score or other information that could be used to place students in a course. In CPS, placement variables may consist of scores on a COMPASS test, ACT scores, high school grades, post-high school grades, or scores on a local placement test. Figure 2-1: Placement Group Expected to be successful
Expected to be unsuccessful The placement decision, illustrated in Figure 2-1, is a choice between two courses. These courses are sequentially related within a subject area such that the lower-level, or developmental course, provides students the skills and knowledge they need to succeed in the upper-level, or standard course. This description applies to any two courses that are adjacent in a sequential course hierarchy, not just standard and developmental courses. More generally, the standard and developmental courses may be referred to respectively as the upper-level and lower-level courses.
Placement group
Placement decision
Developmental course
Standard course
5
Placement decisions are typically made using placement variables, where a student must attain a certain minimum value on the placement variable(s) to be placed into the standard-level course. The minimum value that a student must attain to be placed into the standard course can involve a single value on the placement variable(s) (i.e., a cutoff score) or a range of scores, or decision zone. Cutoff scores or decision zones are typically tied to a student's chance of a B/C or higher grade in the standard course, which serves as the basis for the CPS placement model. Students who score at or above the cutoff score (students whose estimated chance of a B/C or higher equals or exceeds a particular value) are placed in the standard course. Students scoring below the cutoff score (students with a lower chance of a B/C or higher) are placed in the developmental course. Decision zones are discussed later in this chapter as an alternative to cutoff scores. Cutoff scores or decision zones are familiar terms to most institutional staff involved in course placement. A student's chance of a B/C or higher is probably an implicit consideration when making course placement decisions. In the CPS, the student's chance of a B/C or higher is an underlying, explicit criterion for course placement. A student's chance of success in the standard course is estimated from the data of students who have enrolled in the course, and who have received a grade that can be classified as successful or unsuccessful. We call this distinct group of students the estimation group, because it is used to estimate the relationship between course outcomes and placement variables. Course outcomes are the "successful" or "unsuccessful" labels we attach to course grades. The grades labeled "successful" depend on how success is defined. If the criterion is "B or higher" then only grades of A and B are classified as successful. If the criterion is "C or higher" then grades of A, B, and C are classified as successful. While course grades of A to F offer several possible choices for success criteria, course grades of pass/fail or S/U can only be classified one way. Students who receive an "I" (incomplete) or "W" (withdrawal) are sometimes omitted from the estimation group. Our research suggests that it is usually best to treat "W" grades as unsuccessful course outcomes, even though some students withdraw for non-academic reasons (Ang and Noble, 1993). The CPS gives you the option of treating Ws as unsuccessful course outcomes or excluding them from the data used to generate your course placement statistics. In either case, the CPS report summarizes information separately for students with Is and Ws. Figure 2-2 shows a typical relationship between a student's chance of a B or higher and a placement test score.

6
Figure 2-2: Chance of a B or Higher in English 101 Based on COMPASS Writing Skills Score
0
10
20
30
40
50
60
70
80
90
100
10 15 20 25 30 35 40 45 50 55 60 65 70 75 80 85 90 95
COMPASS Writing Skills score
Chance of B or higher
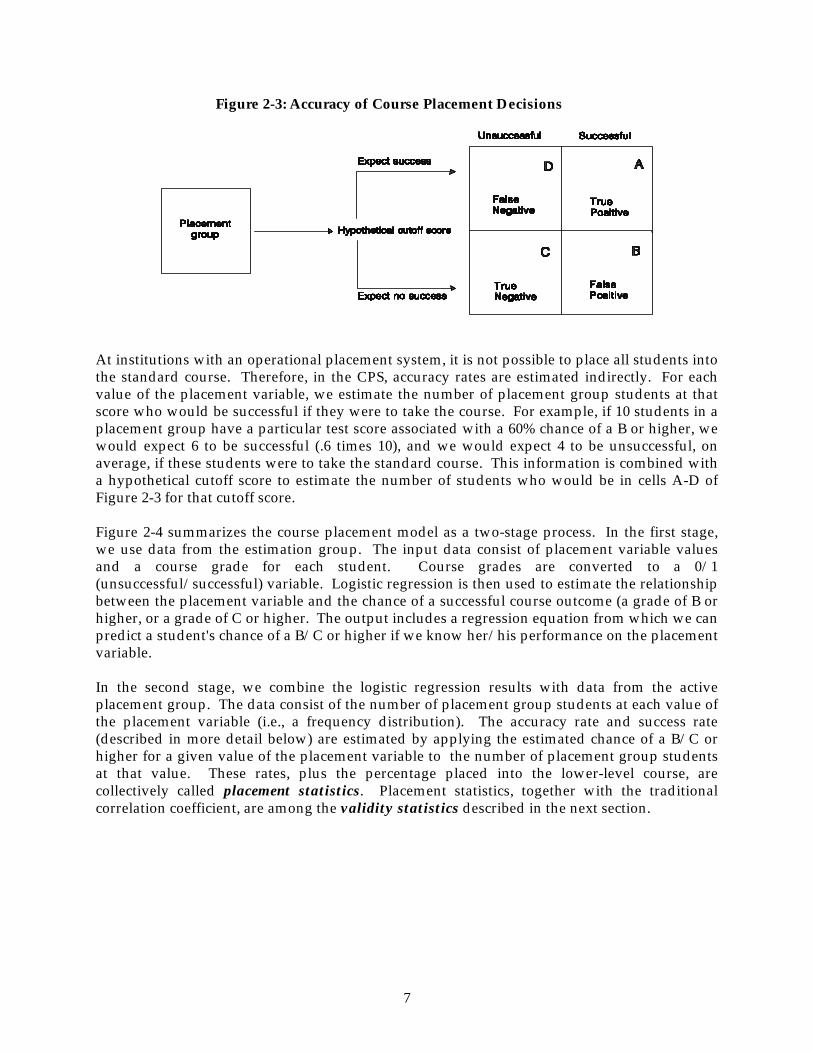
The plot in Figure 2-2 shows the relationship between the COMPASS Writing Skills test score and the chance of a B or higher grade in a standard English course at a specific institution. The plot shows that a student with a COMPASS Writing Skills score of 30 has about a 22% chance of a B or higher in this course. This means that about 22 out of 100 students with a COMPASS Writing Skills score of 30 would be expected to earn a B or higher in the course. The plot also shows that the chance of a B or higher improves with higher COMPASS Writing Skills scores. At a COMPASS Writing Skills score of 85, the chance of a B or higher is about 58%. We use a statistical procedure called logistic regression to construct the chance of success curves. Figure 2-3 depicts one way of representing the accuracy of course placement decisions. If all of the students in the placement group were to take the standard course, regardless of their test scores, we could compare predicted versus actual course outcomes. Students would be predicted to succeed or predicted not to succeed, depending on whether their performance on the placement variable(s) was above or below a hypothetical cutoff score [students at the cutoff score are also predicted to succeed]. The students' actual outcomes are classified as successful or unsuccessful, depending on their grades in the course. The percentage of true positives plus true negatives (cells A and C) reflects the overall accuracy of placement decisions, had they been made according to the hypothetical cutoff score. This sum is called the accuracy rate (AR).
7
Figure 2-3: Accuracy of Course Placement Decisions
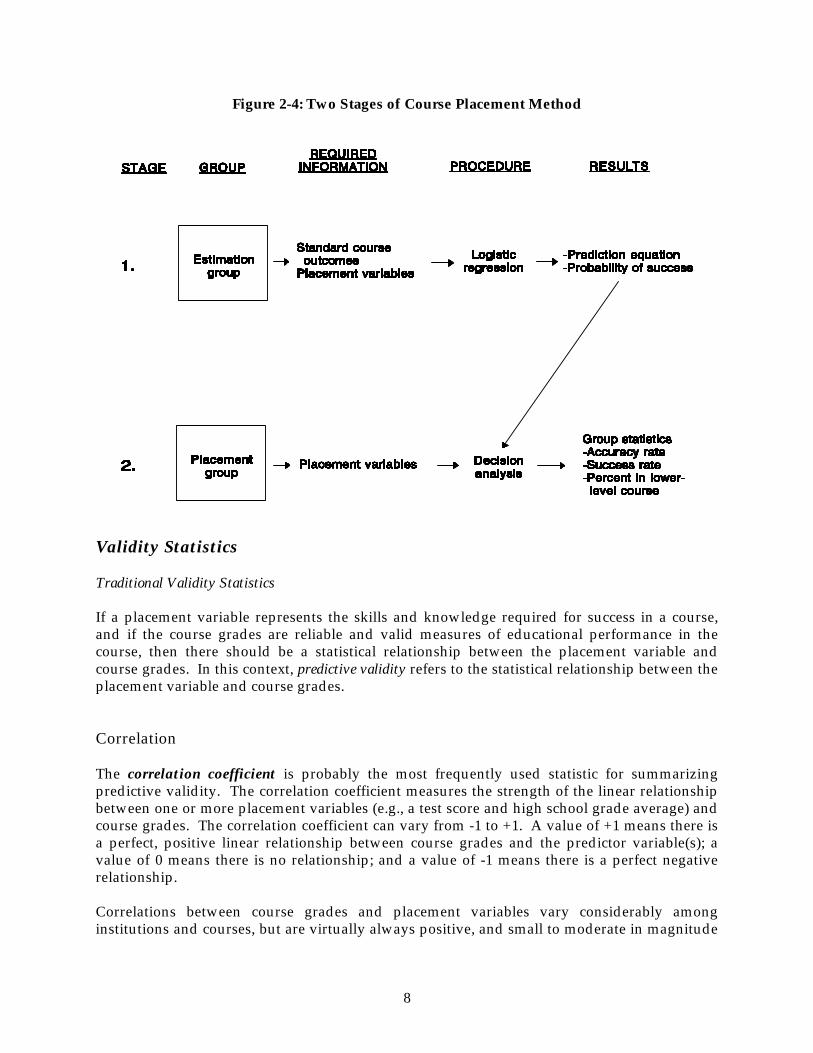
At institutions with an operational placement system, it is not possible to place all students into the standard course. Therefore, in the CPS, accuracy rates are estimated indirectly. For each value of the placement variable, we estimate the number of placement group students at that score who would be successful if they were to take the course. For example, if 10 students in a placement group have a particular test score associated with a 60% chance of a B or higher, we would expect 6 to be successful (.6 times 10), and we would expect 4 to be unsuccessful, on average, if these students were to take the standard course. This information is combined with a hypothetical cutoff score to estimate the number of students who would be in cells A-D of Figure 2-3 for that cutoff score. Figure 2-4 summarizes the course placement model as a two-stage process. In the first stage, we use data from the estimation group. The input data consist of placement variable values and a course grade for each student. Course grades are converted to a 0/1 (unsuccessful/successful) variable. Logistic regression is then used to estimate the relationship between the placement variable and the chance of a successful course outcome (a grade of B or higher, or a grade of C or higher. The output includes a regression equation from which we can predict a student's chance of a B/C or higher if we know her/his performance on the placement variable. In the second stage, we combine the logistic regression results with data from the active placement group. The data consist of the number of placement group students at each value of the placement variable (i.e., a frequency distribution). The accuracy rate and success rate (described in more detail below) are estimated by applying the estimated chance of a B/C or higher for a given value of the placement variable to the number of placement group students at that value. These rates, plus the percentage placed into the lower-level course, are collectively called placement statistics. Placement statistics, together with the traditional correlation coefficient, are among the validity statistics described in the next section.
8
Figure 2-4: Two Stages of Course Placement Method
Validity Statistics Traditional Validity Statistics If a placement variable represents the skills and knowledge required for success in a course, and if the course grades are reliable and valid measures of educational performance in the course, then there should be a statistical relationship between the placement variable and course grades. In this context, predictive validity refers to the statistical relationship between the placement variable and course grades. Correlation The correlation coefficient is probably the most frequently used statistic for summarizing predictive validity. The correlation coefficient measures the strength of the linear relationship between one or more placement variables (e.g., a test score and high school grade average) and course grades. The correlation coefficient can vary from -1 to +1. A value of +1 means there is a perfect, positive linear relationship between course grades and the predictor variable(s); a value of 0 means there is no relationship; and a value of -1 means there is a perfect negative relationship. Correlations between course grades and placement variables vary considerably among institutions and courses, but are virtually always positive, and small to moderate in magnitude

9
for placement variables such as COMPASS scores, scores on locally-developed placement tests, high school grade averages, and high school course work. In a summary of current CPS data, grades in standard English courses have a median correlation of .24 with COMPASS Writing Skills scores and a median correlation of .16 with COMPASS Reading scores. Grades in mathematics courses have a median correlation of .20 to .40 with COMPASS Prealgebra, Algebra, or College Algebra scores. There are several limitations of the correlation coefficient as an index of predictive validity. One limitation is that for a given linear relationship between two variables, the correlation coefficient decreases as the range of one or both variables decreases. If a test is already being used to place students into a given course, the range of test scores among students in the course will be restricted: no student in the course will have a score lower than the cutoff score. The correlation between the test and course outcomes will be artificially low due to this restriction in the range of test scores. Moreover, if the test is effective for course placement, variation in course outcomes will also be restricted: there will be few low grades in the course. These limitations can make comparisons among potential placement variables, on the basis of correlation coefficients, misleading. Another limitation of the correlation coefficient is that it does not provide information to set a specific cutoff score for placing a specific group of students. The correlation represents the average accuracy of prediction across all values of the placement variable. In a typical course placement system, a specific cutoff score is used. Statistics are needed that show how well one cutoff score is working, relative to other possible cutoff scores, so that best cutoff score can be chosen. Placement statistics The Course Placement Service was designed to overcome some of the limitations of correlation coefficients. In the Course Placement Service, placement statistics estimate what would happen if a specific cutoff score were applied to a specific placement group. These statistics estimate the percentage of placement group students who would be placed into the lower-level course, the success rate among the students who could be placed into the standard course, and the accuracy rate of the placement decisions. Because placement statistics estimate what would happen if a particular cutoff score were used, these statistics change as the hypothetical cutoff score changes. Table 2-1 shows the placement statistics for hypothetical COMPASS Writing Skills cutoff scores. The data in this table came from the English 101 course on which the chance of a B or higher plot in Figure 2-2 was based. (Due to space constraints, not all COMPASS scores between the lowest (1) and highest (99) scores in Table 2-1 are listed. Placement statistics for missing scores, if needed, may be estimated by interpolation.)

10
Table 2-1: Placement statistics for a Standard English Course
COMPASS Writing Skills score
Percentage placed in lower-level course
Estimated accuracy rate (in percent)
Estimated success rate (in percent)
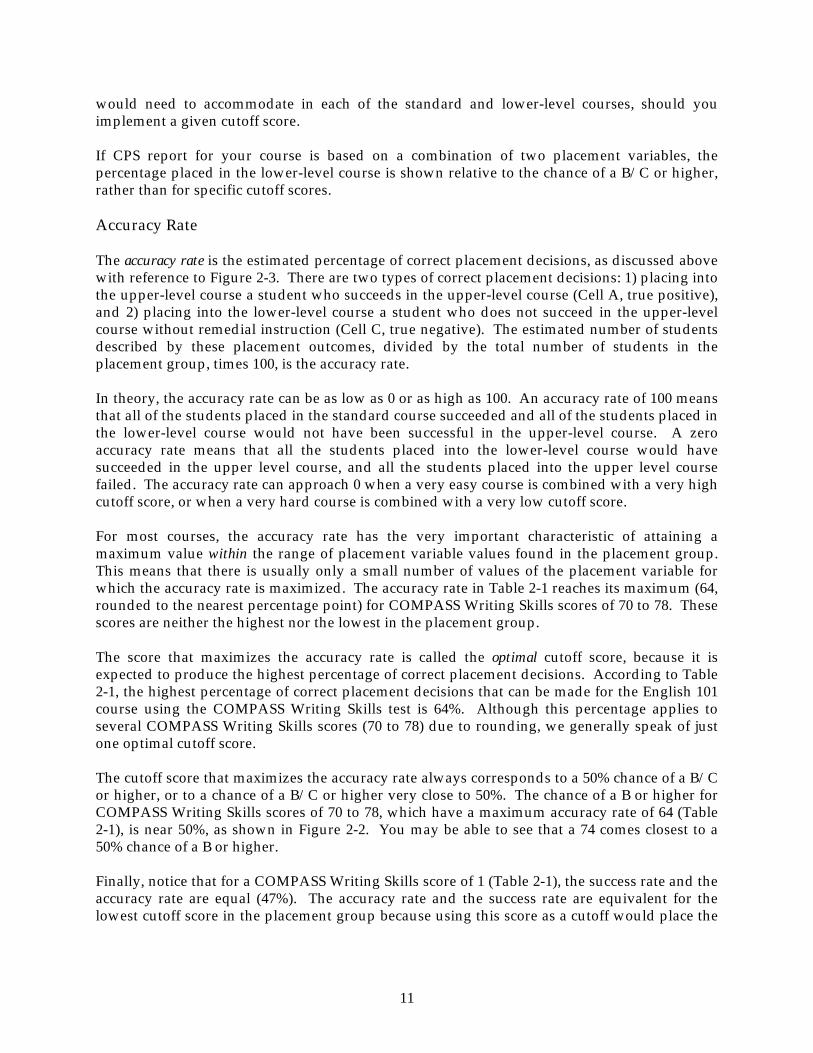
99 94 55 67 95 85 57 67 90 75 60 65 86 65 62 64 83 62 62 63 80 55 63 62 78 51 64 61 76 51 64 61 74 47 64 61 72 45 64 60 70 43 64 60 67 40 63 59 64 36 63 58 61 33 62 57 58 30 62 56 55 26 61 56 52 23 60 55 49 22 59 54 46 20 59 54 43 18 58 53 40 16 57 52 37 14 56 52 34 12 55 51 31 10 54 51 28 9 53 50 25 7 52 50 22 6 52 49 19 5 51 49 16 4 50 49 13 3 50 48 10 2 49 48 5 1 48 48 1 0 47 47
Percentage Placed in Lower-level Course The percentage placed in lower-level course is the percentage of placement group students with scores below the cutoff score. This percentage is shown for possible cutoff scores in Section B of your Course Placement Service report. For example, Table 2-1 shows the percentage of the placement group who would be placed in a developmental course, rather than in the standard course (English 101), using hypothetical COMPASS Writing Skills cutoff scores. If a COMPASS Writing Skills cutoff score of 61 were used, an estimated 33% of the placement group would be placed in a developmental course. The percentage placed in a lower-level course typically increases with increasing values of the cutoff score. It is often used because it addresses practical concerns, but it should not be the sole basis for setting a cutoff score. There is no universally agreed-upon optimal percentage of students that should be placed in a lower-level course. The size of your placement group, combined with the estimated percentage placed in a lower-level course, will enable you to estimate the number of students that you
11
would need to accommodate in each of the standard and lower-level courses, should you implement a given cutoff score. If CPS report for your course is based on a combination of two placement variables, the percentage placed in the lower-level course is shown relative to the chance of a B/C or higher, rather than for specific cutoff scores. Accuracy Rate The accuracy rate is the estimated percentage of correct placement decisions, as discussed above with reference to Figure 2-3. There are two types of correct placement decisions: 1) placing into the upper-level course a student who succeeds in the upper-level course (Cell A, true positive), and 2) placing into the lower-level course a student who does not succeed in the upper-level course without remedial instruction (Cell C, true negative). The estimated number of students described by these placement outcomes, divided by the total number of students in the placement group, times 100, is the accuracy rate. In theory, the accuracy rate can be as low as 0 or as high as 100. An accuracy rate of 100 means that all of the students placed in the standard course succeeded and all of the students placed in the lower-level course would not have been successful in the upper-level course. A zero accuracy rate means that all the students placed into the lower-level course would have succeeded in the upper level course, and all the students placed into the upper level course failed. The accuracy rate can approach 0 when a very easy course is combined with a very high cutoff score, or when a very hard course is combined with a very low cutoff score. For most courses, the accuracy rate has the very important characteristic of attaining a maximum value within the range of placement variable values found in the placement group. This means that there is usually only a small number of values of the placement variable for which the accuracy rate is maximized. The accuracy rate in Table 2-1 reaches its maximum (64, rounded to the nearest percentage point) for COMPASS Writing Skills scores of 70 to 78. These scores are neither the highest nor the lowest in the placement group. The score that maximizes the accuracy rate is called the optimal cutoff score, because it is expected to produce the highest percentage of correct placement decisions. According to Table 2-1, the highest percentage of correct placement decisions that can be made for the English 101 course using the COMPASS Writing Skills test is 64%. Although this percentage applies to several COMPASS Writing Skills scores (70 to 78) due to rounding, we generally speak of just one optimal cutoff score. The cutoff score that maximizes the accuracy rate always corresponds to a 50% chance of a B/C or higher, or to a chance of a B/C or higher very close to 50%. The chance of a B or higher for COMPASS Writing Skills scores of 70 to 78, which have a maximum accuracy rate of 64 (Table 2-1), is near 50%, as shown in Figure 2-2. You may be able to see that a 74 comes closest to a 50% chance of a B or higher. Finally, notice that for a COMPASS Writing Skills score of 1 (Table 2-1), the success rate and the accuracy rate are equal (47%). The accuracy rate and the success rate are equivalent for the lowest cutoff score in the placement group because using this score as a cutoff would place the

12
entire placement group into the standard course. [They may occasionally differ slightly due to rounding error.] This situation conceivably represents the alternative of using no placement system, so the accuracy rate for the lowest possible cutoff score is referred to as the baseline accuracy rate. Success Rate The success rate is the estimated percentage of successful students among all students who would be placed into the standard course, given a particular cutoff score. In terms of Figure 2-3, it is the predicted number of students in Cell A (true positives), divided by the total number of students at or above the hypothetical cutoff score, times 100. Table 2-1 shows the estimated success rate in an English 101 course for possible COMPASS Writing Skills cutoff scores. If the cutoff score were 22 in this example, then slightly less than half (49%) of the students placed into this course would be expected to be successful (i.e., earn a grade of B or higher). If the cutoff score were 74, then about 61% of the students placed into this course would be expected to be successful. When placement is based on two placement variables, the estimated success rate is shown relative to the chance of a B/C or higher. An example for two placement variables is provided at the end of this chapter. Two placement variables It is possible to use two placement variables jointly for course placement, such as a test score and subject-area grade point average. Instead of using a single placement variable score, combinations of the values of the two placement variables would be used to place students into the standard course. In this case, to estimate the chance of a B/C or higher, both placement variables are used. The contour plot in Figure 2-5 shows the combinations of placement variable values and their corresponding chances of a B or higher for a standard English course (English 101). This contour plot is the counterpart of the single placement variable plot in Figure 2-3. The chance of a B or higher in English 101 is shown by the level of shading in the plot. A 30 level of shading, for example, represents a 30% chance of a B or higher. It is evident in Figure 2-5 that a particular chance of a B or higher may correspond to many combinations of the placement variable values. A 60% chance of a B or higher, for example, corresponds to many combinations of COMPASS Writing Skills scores and COMPASS Reading scores. These include the following COMPASS Writing Skills score and COMPASS Reading score combinations: 50/90, 70/70, and 90/30.

13
Figure 2-5: Chance of a B or Higher in English 101, Given COMPASS
Writing Skills Score & COMPASS Reading Score
Chanceof
B or Higher
30
40
50
60
70
COMPASS/ESL Rd Score
19
29
39
49
59
69
79
89
99
COMPASS/ESL Wrt Score
1 21 41 61 81 101
For two placement variables, the CPS report lists placement statistics relative to students' chances of B/C or higher, as shown in Table 2-2. For a single placement variable (e.g., Table 2-1) placement statistics are listed relative to values of the placement variable. The usual procedure for selecting cutoff scores in the case of two placement variables is to select a minimum chance of a B/C or higher, based on its associated placement statistics, using a table like Table 2-2. Cutoff scores on the placement variables can then be determined from the selected minimum chance of a B/C or higher using figures such as Figure 2-5. For validating current cutoff scores, the procedure is to identify the chance of a B/C or higher associated with the cutoff scores using a figure like Figure 2-5. Then, the chance of a B/C or higher can be used to identify its associated placement statistics using a table like Table 2-2.

14
Table 2-2: Placement statistics for COMPASS Writing Skills Score
and COMPASS Reading Score
Chance of a B or higher in ENGLISH
101
Percent placed in lower-level
course
Estimated accuracy rate (in percent)
Estimated success rate
(in percent) 74 88 48 76 69 72 55 73 64 57 60 71 61 50 62 70 59 46 63 69 57 39 64 68 55 37 64 67 54 35 64 67 53 34 64 67 52 32 64 66 51 30 64 66 50 28 65 66 49 27 64 65 48 25 64 65 47 24 64 64 46 22 64 64 45 21 64 64 44 20 64 64 42 17 64 63 40 15 63 62 38 13 63 62 35 10 62 61 30 5 60 60 25 2 59 59 20 1 58 58
In the case of a single placement variable, a cutoff score may be selected directly using placement statistics such as those in Table 2-1. If you wanted to know the chance of a B/C or higher corresponding to the selected cutoff score, however, you would have to consult a figure in the CPS report comparable to Figure 2-2. The CPS report also contains a table that shows the chance of a B/C or higher associated with values of a single placement variable. Alternatives to Cutoff Scores It is often advisable to interpret cutoff scores as guides, rather than as rigid rules, in placement. One way to do this is to use decision zones. A decision zone is an interval around the cutoff score; students whose test scores (or high school grades) are in a decision zone are encouraged to meet with their academic advisors. The student and advisor then review the student's skills, interests, backgrounds, and plans before deciding which course to take. In this way factors other than students' scores on placement variables can be considered in the placement decision.

15
Institutions that administer a local placement test have a further option. These institutions can use COMPASS scores and/or high school subject grade point averages to screen students for placement. Students whose scores and/or grades are sufficiently high can be exempted from taking the local test, and placed according to their scores. Of course, a screening strategy will be effective only if the local test itself is effective.

16

17
CHAPTER 3 Tests Used for Course Placement In this chapter we explain the importance of a test's content validity for course placement and provide information about the content of the COMPASS tests. For any given course, local faculty and staff who are familiar with the course are in the best position to evaluate a test's content validity for course placement. In order to perform this evaluation, they need the kind of information provided in this chapter. This chapter also contains summary results from course placement research using the COMPASS tests. Results include median optimal cutoff scores on COMPASS tests for various courses such as standard composition, algebra, and psychology. Median group statistics are also reported for these courses, based on the optimal cutoff scores. The median optimal cutoff scores can be used as a starting point for institutions initiating course placement with COMPASS tests. Optimal cutoff scores and group statistics can also be compared to the results in course placement reports prepared for similar, local courses. Content Validity Content validity refers to whether the items on a test truly represent the skills the test is intended to measure. A test score used for course placement is expected to reflect the skills necessary for success in the standard course. The notion of content validity also applies to high school grades or any variable used for course placement, though in this chapter we will confine ourselves to talking about tests. If a developmental course is effective in preparing students for success in a standard course, then it too is a relevant basis for assessing the content validity of a test for course placement. For example, if the alternative to a standard history course were a developmental reading course, a COMPASS Writing scores may be less appropriate than COMPASS Reading Skills scores for placing students into the history course. Placement test scores also need to be appropriate for those students not placed into the standard course, e.g., into developmental reading. The content validity of a test for course placement is best evaluated by staff who teach the courses involved. For example, English faculty are in the best position to evaluate the contents of the COMPASS Writing and COMPASS Reading Skills tests with regard to the skills necessary for success in the standard courses taught in their department. COMPASS tests are developed according to detailed test specifications to ensure that the test content represents current instruction in the relevant courses. All COMPASS test are reviewed to be certain they match these specifications, and this process includes a content review by outside experts in the subject area being assessed. Content validity for computerized adaptive tests differs somewhat from content validity in conventional tests. In adaptive testing, this concept applies to the representativeness of 1) the item pools from which the adaptive test items are drawn and 2) the adaptive tests that are computer-selected for each student. The COMPASS system of adaptive tests is designed to ensure that

18
content validity is maintained for both the item pools and the individualized tests. For details on how examinees are assigned to various COMPASS tests, refer to the chapter on Configuring Test Administration Modes in the COMPASS Reference Manual. It is unlikely that any given test will measure all aspects of students' academic preparation for a given course. It is therefore advisable to consider using additional measures, such as high school course work and grades, or scores on additional tests, in making placement decisions. One strategy for incorporating additional information in making course placement decisions is to take the information into account for students in a decision zone, i.e., inside a range of placement variable values close to the cutoff score. The COMPASS Tests The three standard COMPASS placement measures, Mathematics, Reading and Writing Skills can result in a total of up to seven possible placement scores (one each in Writing Skills and Reading, and up to five in Mathematics, including Prealgebra, Algebra, College Algebra, Trigonometry, and Geometry). The COMPASS Reference Manual provides the content, procedural, and psychometric documentation for these measures. Summary of Placement Research Table 3-1 summarizes the results of institutions’ participation in CPS for different COMPASS test/course pairings. The COMPASS Writing Skills and the COMPASS Reading tests were studied as placement tests for first-year standard composition. The COMPASS Prealgebra test was studied as a placement test for arithmetic and elementary algebra. The COMPASS Algebra test was studied as a placement test for intermediate algebra, college algebra, and pre-calculus. The COMPASS College Algebra test was studied as a placement test for calculus. The COMPASS Reading test was paired with history and psychology courses.
Table 3-1 Summary of COMPASS Placement Cutoff Scores
B or Higher Success Criterion
Course type COMPASS test Number of institutions
Median cutoff score
Percent ready for course
Median accuracy rate
Median increase in accuracy rate
Standard Composition Writing Skills 78 70 46 65 19
Standard Composition Reading Skills 29 80 59 60 9
Arithmetic Prealgebra 30 36 61 70 15
Elementary Algebra Prealgebra 43 61 20 65 24
Intermediate Algebra Algebra 34 48 19 70 28
College Algebra Algebra 23 71 6 72 43
Pre-calculus Algebra 7 80 4 79 54
Calculus College Algebra 7 57 39 64 18
History Reading 5 95 14 74 47
Psychology Reading 17 89 33 66 23

19
The number of institutions represented for each test/course pair ranges from 5 to 78; some institutions provided data for more than one course. Standard composition and elementary algebra courses are represented by the largest numbers of institutions. These courses generally have larger enrollments and are more likely to provide the sample sizes needed for developing reliable course placement statistics (40 students per course). The institutions are not necessarily representative of all postsecondary institutions using COMPASS scores for placement. The remaining columns in Table 3-1 summarize results of the course placement research for these institutions. The column labeled "Median cutoff score" shows the median optimal cutoff scores across institutions. The optimal cutoff score maximizes the estimated accuracy rate, or percentage of correct course placement decisions, for the course. For standard composition courses, the median optimal cutoff score on the COMPASS Writing Skills test was 70. By definition, half of the optimal cutoff scores for a given course were higher than the median optimal cutoff score and half were lower. Optimal cutoff scores differ among institutions because of differences in course content and grading practices. Across course types, differences between median optimal cutoff scores on the same test may reflect differences in the difficulty of the type of course or in the achievement of the placement groups. For example, history appears to be a more difficult course, on average, than psychology because it has a higher median optimal cutoff score (95 compared to 89) for COMPASS Reading. The percentage of students prepared for the course is the percentage of students at or above the cutoff score. This is the opposite of (or 100 minus) the percentage placed into the lower-level course. History again appears to be a more difficult course than psychology because a smaller percentage of students in the placement group for history are prepared for this course (14% compared to 33% for psychology). Accuracy rates (the second to last column of Table 3-1) showed no clear trend across the types of courses represented in Table 1. The median accuracy rate ranged from a low of 60 (standard composition with COMPASS Reading) to a high of 79 (pre-calculus). The increase in accuracy rate is the difference between the maximum accuracy rate and the accuracy rate of placing all students into the course (baseline accuracy rate). The median increase in accuracy rate tends to be higher for more difficult courses. History, for example, has a higher median increase in accuracy rate (47 percentage points) than psychology (23 percentage points). Compared to courses of moderate difficulty, difficult courses tend to have higher maximum accuracy rates and lower baseline accuracy rate. The baseline accuracy rate tends to be low because a small percentage of placement group students would succeed in a difficult course. The median cutoff scores reported for courses similar to your own may help you choose among potential cutoff scores, based on information in your own report. However, unless the information in your report leads you to question your results, you should give more weight to the statistics in your own report than to the medians reported here.

20

21
CHAPTER 4 Step-by-Step Instructions for Interpreting Your CPS Report This chapter takes you step-by-step through the contents of your CPS report. The tables and figures in the report are oriented towards selecting or evaluating a cutoff score. A good deal of the interpretation process involves combining and comparing information from different parts of the report. To illustrate this work, we refer to the same example throughout the chapter. Since every course is unique, your report may have features not covered specifically in the example. Nevertheless, we believe this chapter will give you the insight you need to interpret the unique, as well as the standard, features of your report. Components of the CPS Report First, take a few minutes to become familiar with the organization and contents of your CPS report. A separate CPS report is generated for each subject area and placement group. A subject area is a meaningful group of courses for which placement decisions are to be made. For example, all the placement information on the mathematics courses included in an institution's CPS request will be combined in a mathematics area CPS report. When you completed the COMPASS Course Placement Service Course Information Form (CIF), you indicated the subject areas and placement groups that you wanted to study. A CPS report is organized around the reference courses and set of placement variables that you requested within a given subject area. * A reference course is a particular course into which students may be placed. In most cases,
the reference course is a standard-level, first-year course. * A placement variable is any variable that could be used to place students into the
reference course. These could include COMPASS scores, local placement test scores, or high school grades and course work. One or more sets of placement variables can be used for each reference course.
All of the courses within a subject area and placement group that you included in your CPS request should be listed in the Table of Contents, which appears on page 2 of the report. The example in Box 4-1 is from a mathematics CPS report for just one course (Math 101).

22
The placement variables that you selected for each course in your CPS request are listed in the table of contents, underneath the course name. In the example, two sets of placement variables were requested: 1) the COMPASS Algebra score, and 2) the COMPASS Algebra score and Local Math score jointly. Occasionally, the CPS report may not contain all of the reference course/placement variable combinations that you requested. There may have been insufficient data or technical or statistical problems associated with the course grades or placement variables. Your report will contain appropriate flags and messages about such problems. Following the table of contents is a brief discussion of the information provided for each reference course and placement variable. As you can see from the Table of Contents, the information for each course and placement variable is divided into three major components: Group Description, Individual Advising, and Placement Information. Course Success/Grade Experience tables are also included for single placement variables. A section on placement effectiveness follows the last set of placement variables for a given course. The explanatory text on pages 3 and 4 of the report reinforces and supplements many of the points covered in this guide. After reviewing the Table of Contents and reading the introductory discussion, you are ready to focus on the reference course and placement variable that interests you most. There is no need to read the report in a sequential fashion. Select a course and placement variable and begin there. The results for each course are preceded by a blue title page which lists the sets of placement variables you requested.
BOX 4-1: Table of Contents in CPS Report for Math 101
The table below shows the reference courses and the placement variables that you requested.
Reference Courses and Placement Variables Studied in This Report Page Math 101 ......................................................................................................................... 5 COMPASS Algebra Score ..................................................................................... 7 Group Description......................................................................................... 7 Individual Advising ...................................................................................... 8 Placement Information.................................................................................. 9 Course Success/Grade Experience ............................................................ 10 COMPASS Algebra Score and Local Math Score.............................................. 11 Group Description........................................................................................ 11 Individual Advising ..................................................................................... 12 Placement Information................................................................................. 13 Comparing Placement Variables ........................................................................ 14 Glossary......................................................................................................................... 15 Appendix....................................................................................................................... 17

23
Examining the Descriptive Information: Group Description The first step after choosing a specific reference course and placement variable to study is to check the descriptive information for this combination. Descriptive information is contained in Table 1 of the Group Description Section. Box 4-2 and Box 4-3 contain two variations of Table 1 for Math 101. Box 4-2 summarizes data for the COMPASS Algebra score as the sole placement variable. Box 4-3 summarizes data for the COMPASS Algebra score and local Math test score jointly as placement variables. These tables show you the averages and ranges of placement variable values and course grades among the key groups of students in your report: students who completed the course (estimation group), placement group students, and students who received an I or W. Notice that the results differ somewhat for Math 101, depending on the placement variable. For the COMPASS Algebra score alone, there are 241 students in the placement group; for COMPASS Algebra and local Math test in combination, there are 231. Further, there are differences in the reported numbers of students who completed Math 101. These differences occur because descriptive information can be summarized only for students with valid (not missing) values for the placement variables of interest. Usually these differences will be inconsequential.
As shown in Box 4-2, 61% of the students who completed the course received a grade of B or higher, and 80% received a C or higher grade. Extremely high percentages (e.g., 90% or higher) could be cause for concern; it is difficult to predict course success if only a very few students receive grades lower than a B or C. In this example the percentages are sufficient to predict course success. Because there were two fewer students who had both COMPASS Algebra and local math
Box 4-2: Table 1 in CPS Report for Math 101 Group Description Table 1: Summary of Placement Variable and Course Grade Data
Placement group Students enrolled in Math 101 with COMPASS Algebra
Score Placement variable and course grade
All first time entering students with COMPASS Alg Score
Students who received A-F grade
Students received I or W* grade
N 241 75 I (0) W (2)
Entire score range 16 - 99 18 - 99 24 - 26
Middle 50% score range 28 - 58 41 - 68 24 - 26 COMPASS Alg Score
Mean 44.6 55.0 25.0
Mean 2.7
Pct. B or higher 61 Course grade
Pct. C or higher 80
* W grades (withdrawals) were defined as not successful in calculating the individual advising and placement information.

24
scores, the percentage of successful students in Box 4-3 differs slightly (63% received a grade of B or higher, and 81% received a C or higher grade).
Questions about Descriptive Information The following questions can be answered with the information in the Group description. We will answer them as best we can for Math 101 using the information provided in Boxes 4-2 and 4-3. 1) Is the number of students in each group consistent for this course? The placement group is supposed to represent the population of students for whom a
placement decision was actually made. Your CPS report is based on the records of students in a given academic period. Does the size of your placement group reflect the number of students for whom a placement decision was made concerning your reference course, during the given academic period? Similarly, is the reported number of students who completed the course with a grade, consistent with other information at your institution concerning class enrollment? You should also verify that the reported number of students who completed the course is less than or equal to the reported number of students in the placement group, as would be required by the logic of course placement.
For Math 101, there are 241 students in the placement group (Box 4-2). Of those, 75
students took and completed Math 101 (the estimation group), and an additional 2 took Math 101 but received a W (withdrew).
Box 4-3: Table 1 in CPS Report for Math 101
Group Description Table 1: Summary of Placement Variable and Course Grade Data
Placement group Students enrolled in Math 101 with COMPASS Algebra Score
Placement variable and course grade All first time entering students with COMPASS Alg Score
Students who received A-F grade
Students received I or W* grade
N 231 73 I (0) W ( 2)
Entire score range 16 - 99 18 - 99 24 - 26
Middle 50% score range 28 - 59 41 - 68 24 - 26 COMPASS Alg Score
Mean 44.5 55.4 25.0
Entire score range 2 - 25 12 - 23 15 - 17
Middle 50% score range 10 - 19 16 - 21 15 - 17 Local Math
Score
Mean 14.5 18.3 16.0
Course grade Mean 2.7
Pct. B or higher 63
Pct. C or higher 81
* W grades (withdrawals) were defined as not successful in calculating the individual advising and placement information.

25
The number of students in the I or W group should be within normal bounds for the course. If the number of these students is large, you would do well to consider how this group may influence your course placement results (see below). If you elected to have students who received a W included in the estimation group as unsuccessful outcomes, a message will be printed in your report to remind you of that choice. Otherwise, Is and Ws are excluded from the estimation group. In either case your course placement results may depend to some degree on how you decide to classify these students.
As shown in Box 4-2 and Box 4-3, two students (or less than 1%) received a W. This
percentage is not high enough to warrant consideration of whether treating W's as unsuccessful course outcomes would/did influence the results for this course.
2) Are the score ranges reasonable? Are there any outlier values? The upper and lower values for the entire score range should be within the scale limits of
the placement variables. The range for COMPASS Algebra scores should be between 15 and 99. The Math 101 example presents no surprises here. The minimum and maximum values for the local Math test score in Box 4-3 would need to be reviewed locally.
The upper and lower values should also be consistent with other information you may
have about these groups. While a minimum COMPASS Algebra score of 15 is possible from a technical standpoint, low values might cause some concern at colleges with selective admissions standards. If you are already using a mandatory cutoff score for course placement, the score range for students who completed the course should appear truncated at the cutoff score on the placement test.
The middle 50% score range can help you determine whether there are irregularities in the
data. Typically, the middle 50% score range is about one-fourth to one-third as large as the entire score range. In Box 4-2, the middle 50% range for the placement group extends from 28 to 59, a 31 scale score unit range, while the range for the entire group extends from 16 to 99 - an 83 scale score unit range. For students completing Math 101, the middle 50% and full range widths are 27 scale units and 81 scale units, respectively. The relative magnitude of these ranges is within normal bounds.
3) Are there group differences in performance on the placement variables? Group differences on COMPASS will depend on the level of the reference course and, for
math, how you have configured the domain routing rules. If, for example, students start in COMPASS Algebra, those who complete a standard-level reference course will usually have a higher mean score than placement group students (all first-time entering students). This is what you would expect if the placement group, in contrast to students who completed the course, contains some students who are not academically ready to succeed in the standard course. In Box 4-2, the average COMPASS Algebra score is 44.6 for the placement group and 55.0 for the students who completed Math 101. In Box 4-3, the average COMPASS Algebra score is 44.5 for the placement group and 55.4 for the students who completed Math 101. Averages based on the local Math test score are also consistent with expectations: the average score for the placement group (14.5) is lower than the

26
average for those students who completed the course (18.3). The descriptive information in Box 4-2 and Box 4-3 shows that some students in the course
have very high COMPASS Algebra scores. This may seem unusual especially if these students would qualify for the course above Math 101. Some institutions, however, have found that students who have been out of school for many years may lack confidence in their academic skills even though they have obtained high test scores. These students sometimes opt to take a lower-level course.
Students frequently receive Ws in courses because of poor performance and a desire to not
receive D or F grade for the course. One way to determine if this is the case is to compare the placement test scores of students who received a W or I grades to those of students who received letter grades. Box 4-2 and Box 4-3 show that students who receive a W in Math 101 do indeed have lower average placement variable scores than do students who completed Math 101. This result supports treating Ws as unsuccessful course outcomes.
Evaluating the Chance of a B/C or Higher: Individual Advising In this section, we begin to evaluate the relationship between course outcomes and placement variables. This relationship can be used to advise individual students as to their chance of a B/C or higher in the course. If the relationship is strong, academically underprepared students can be identified from their small chance of a B/C or higher. A practical way to view this relationship is through the change in chance of success across values of the placement variables. In the examples and discussion to follow the chance of a B/C or higher increases with increasing values of the placement variables. Increase in the chance of a B/C or higher is shown in one of two ways, depending on whether you are studying one or two placement variables. One Placement Variable For a single placement variable, the chances of a B/C or higher corresponding to values of the placement variable are shown in your CPS report in both a table and a figure. The table and figure are placed side by side in the CPS report in order to facilitate interpretation. Box 4-4 contains Table 2 and Figure 1 from the section of the Math 101 CPS report using the COMPASS Algebra score as the single placement variable. The table shows the chances of a B/C or higher for up to 33 values of the placement variable, including the value corresponding most closely to a 50% chance of a B/C or higher (opt. B, opt. C), and the highest and lowest scores/values in the placement group. A count of the number of students at and below each COMPASS Algebra score who received a grade in Math 101 is also listed (total N-count is 77 because W grades were treated as unsuccessful outcomes). This gives you an idea of the placement variable distribution of students with grades.

27
` Box 4-4: Table 2 and Figure 1 in CPS Report for Math 101
Individual Advising
Table 2: Chance of a B/C or higher in Math 101Given COMPASS Alg Score
Figure 1: Chance of a B/C or higher in Math 101 Given COMPASS Alg Score
COMPASS Alg Score Chance (percent)
Score Cumulative
N-count* B or higher
C or higher
opt. B
opt. C
99 84 69 67 63 55 54 50 49 48 47 46 45 43 41 40 39 38 36 35 34 31 30 29 28 27 26 25 24 22 19 18 16
77 75 60 58 50 45 43 34 32 32 28 27 26 22 22 20 16 14 12 9 9 9 9 7 7 7 7 6 6 4 3 2 0
97 92 81 79 74 64 62 56 54 53 50 49 48 45 42 40 39 37 34 33 32 28 26 25 24 23 22 21 20 18 15 14 13
98 95 90 89 87 82 81 78 77 76 75 74 73 71 69 68 67 66 64 63 62 58 57 56 54 53 52 50 49 47 43 42 40
C or higherB or higherextrapolated toplacement group
Chances of B/C or Higher
0
10
20
30
40
50
60
70
80
90
100
COMPASS Alg Score1 21 41 61 81 101
Example: If the chance of B or higher corresponding to a COMPASS Algebra score of 47 is 51, then we would expect that about 51 out of 100 students with a COMASS Algebra score of 47 would be successful in Math 101 Note: The ‘opt.’ labeled score refers to the optimal cutoff score for each success criteria.
* Students with COMPASS Alg score and grade in Math101 at or below each score
The figure is a plot of the values shown in the table for both criteria (B or higher, C or higher grade). The plotted curve is dotted, rather than dashed or solid, where the range of placement variable values for the placement group exceeds the range for the estimation group. The chances of a B/C or higher curves in Box 4-4 for Math 101 are dotted for COMPASS Algebra scores of 16 and 17. These scores occurred in the placement group, but not among students who completed Math 101 (see Box 4-2). The chances of a B/C or higher for placement group students at these scores were extrapolated from the course outcomes and placement variables of students in the estimation group. If you have a large number of placement group students with these scores, you may be interested in the more detailed discussion of extrapolation in Chapter 5. The chance of a B/C or higher for a score not specifically listed in the table for a single placement variable may be estimated from the figure adjacent to the table (see Box 4-4) or estimated directly
28
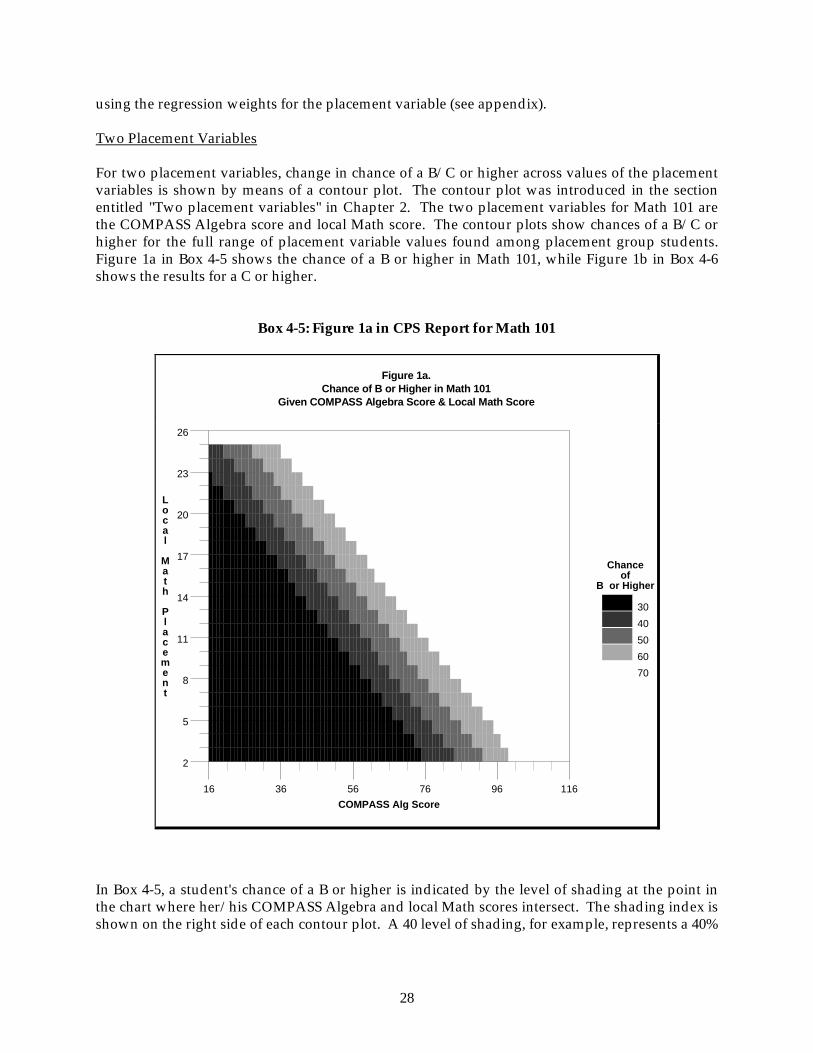
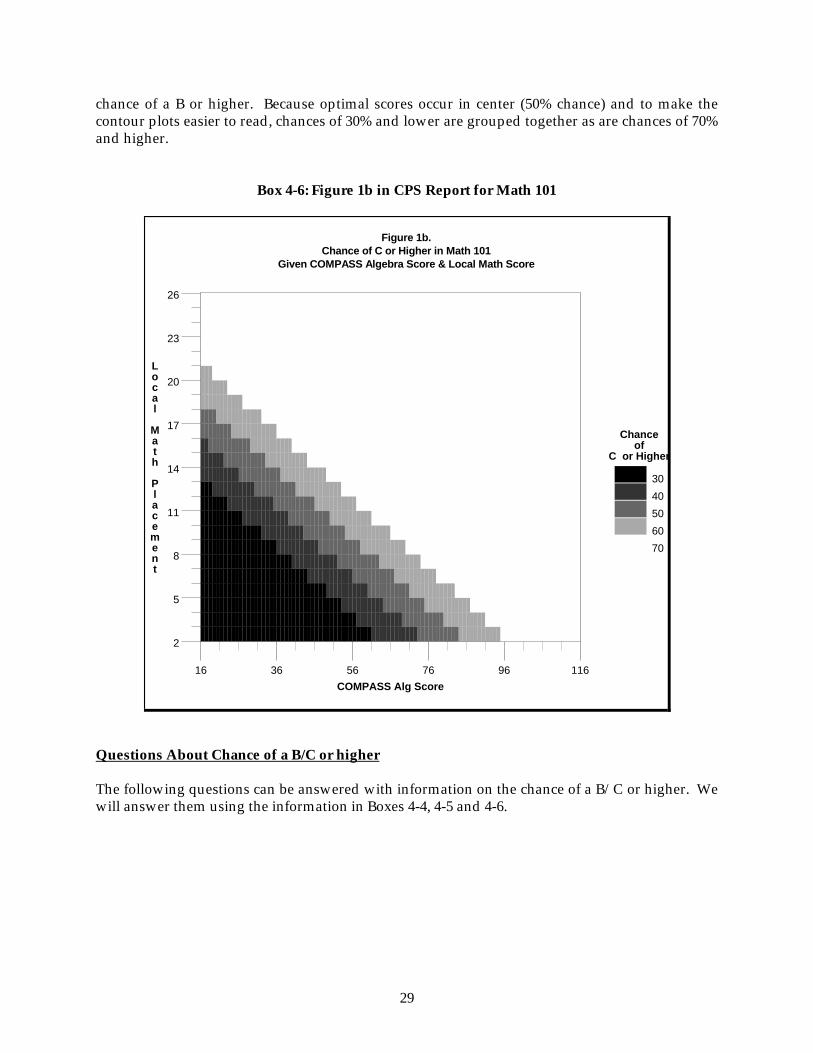
using the regression weights for the placement variable (see appendix). Two Placement Variables For two placement variables, change in chance of a B/C or higher across values of the placement variables is shown by means of a contour plot. The contour plot was introduced in the section entitled "Two placement variables" in Chapter 2. The two placement variables for Math 101 are the COMPASS Algebra score and local Math score. The contour plots show chances of a B/C or higher for the full range of placement variable values found among placement group students. Figure 1a in Box 4-5 shows the chance of a B or higher in Math 101, while Figure 1b in Box 4-6 shows the results for a C or higher.
Box 4-5: Figure 1a in CPS Report for Math 101
Figure 1a. Chance of B or Higher in Math 101
Given COMPASS Algebra Score & Local Math Score
Chanceof
B or Higher
30
40
50
60
70
Local Math Placement
2
5
8
11
14
17
20
23
26
COMPASS Alg Score
16 36 56 76 96 116
In Box 4-5, a student's chance of a B or higher is indicated by the level of shading at the point in the chart where her/his COMPASS Algebra and local Math scores intersect. The shading index is shown on the right side of each contour plot. A 40 level of shading, for example, represents a 40%
29
chance of a B or higher. Because optimal scores occur in center (50% chance) and to make the contour plots easier to read, chances of 30% and lower are grouped together as are chances of 70% and higher.
Box 4-6: Figure 1b in CPS Report for Math 101
Figure 1b. Chance of C or Higher in Math 101
Given COMPASS Algebra Score & Local Math Score
Chanceof
C or Higher
30
40
50
60
70
Local Math Placement
2
5
8
11
14
17
20
23
26
COMPASS Alg Score
16 36 56 76 96 116
Questions About Chance of a B/C or higher The following questions can be answered with information on the chance of a B/C or higher. We will answer them using the information in Boxes 4-4, 4-5 and 4-6.

30
1. Does the chance of a B/C or higher increase across values of the placement variables? Ideally, the chance of a B/C or higher should increase from approximately zero percent at
low values of the placement variable to approximately 100% at high values. If the chance of a B/C or higher increases very little, either the placement variable or the criterion of success may not be effective for course placement.
One Placement Variable In Box 4-4, the chance of a B/C or higher increases over the range of COMPASS Algebra
scores in the placement group, using either the B or higher or C or higher criterion. The chance of a B or higher outcome increases from 13% to 97%, and the chance of a C or higher increases from 40% to 98%.
These results, combined with other information, suggest that the relationship between the
COMPASS Algebra score and success in Math 101 is relatively strong. Because the B or higher criterion divided Math 101 completers more evenly (61% got a B or higher grade, according to Box 4-2), conditions were favorable for the chance of a B or higher to approach 0% and 100% at extreme COMPASS scores. The chance of a B or higher varied substantially (13% to 97%) across COMPASS scores, but did not achieve either extreme (0% to 100%). The C or higher criterion was more uneven (80% got a C or higher grade, according to Box 4-2) so it was less likely that the chance of a C or higher would approach 0%.
Two Placement Variables A combination of two placement variables has practical value if the contour plot shows a
wide range of shading. This means the chance of a B/C or higher changes substantially over the range of placement variable values. In most cases, the boundaries between levels of shading will run from upper left to lower right, meaning both placement variables are related to success in the course. If the boundaries run in a mostly horizontal or vertical direction, then one placement variable is more strongly associated with course success than the other.
In the Math 101 example, all chances of success are represented for the B or higher
criterion (Box 4-5) and for the C or higher criterion (Box 4-6). The lower left corner of these plots are black, meaning the chance of success is 30% or less for combinations of low local Math test and low COMPASS Algebra scores. The upper right corner of these plots are white, meaning the chance of success is 70% or more for combinations of high local Math test and high COMPASS Algebra scores.
Drawing a diagonal line from the highest local Math score to the highest COMPASS
Algebra score is a rough method of determining which variable contributes more to the prediction. The shaded bands for the C or higher criterion appear to be parallel to the diagonal, suggesting that the two variables are equally strong predictors of success in the course. The shaded bands for the B or higher criterion are angled slightly more vertical, suggesting that the COMPASS Algebra score are stronger predictors of success.

31
2. Is the rate of change in chance of a B/C or higher across values of the placement variable greater for one criterion than another?
A faster rate of change may mean more accurate prediction. The rate of change is shown
by the slope of the curves plotted in Box 4-4 (Figure 1), for one placement variable, and by the degrees of shading in Box 4-5 for two placement variables. These examples are discussed in greater detail below.
One Placement Variable The increase in chance of a B/C or higher in Math 101, across increasing COMPASS
scores, is greater for the B or higher criterion. For the B or higher criterion, the chance of success increases by 84% - from a low of 13% to a high of 97%. For the C or higher criterion the chance of success increases by 58% - from a low of 40% to a high of 98%. These differences are reflected in the plot in Box 4-4. The plot for the B or higher criterion (solid line) is slightly steeper.
The difference between success criteria is partly due to the tendency of Math 101 to be
easy. Of the Math 101 completers, 80% got a C or higher grade (Box 4-2). The estimated chance of a C or higher for a student with the lowest possible COMPASS Algebra score (16) is relatively high (40%). This relatively high chance restricts the increase that is possible.
Two Placement Variables In general, contour plots with narrower bands have steeper slopes or greater rates of
change. Comparisons made using the middle three chance levels in Boxes 4-5 and 4-6 show that the contour plot for the B or higher criterion (Fig. 1a) has slightly smaller bands than the contour plot for the C or higher criterion. It is also obvious that the C or higher plot has a noticeable larger area that is one shade (in this case white). These features suggest that, like the one-variable results, the plot for B or higher criterion is slightly steeper.
3. Does the chance of a B/C or higher increase among students in the placement group? In order for a placement variable to have practical value for placing a specific group of
students, the placement variable must show that those students differ in their chance of a B/C or higher in a course. In order to satisfy this condition, it is necessary for the chance of success not only to increase across values of the placement variable, but to also have a useful range of values among students in the placement group.
The ideal range for the chance of a B/C or higher to have among placement group
students is from near zero to near 100%, with the average student in the placement group having approximately a 50% chance of a B/C or higher. Placement variables can be useful even if this condition is not met, which is the case with most courses. For a given course and placement group, differences in placement statistics for different placement variables and criteria can usually be explained by how nearly this ideal is met for each set of placement variable(s) and criterion.
32
One Placement Variable To see how the chance of a B/C or higher varies across students in your placement group,
find the upper and lower values of the placement variable for the middle 50% range of the placement group. Box 4-2 shows that the middle 50% range of the COMPASS Algebra scores among 241 placement group students is 28 to 58. The chance of success for a score of 28 can be found in Table 2 of Box 4-4. To find the chance of success for a score of 58, you will first need to draw a vertical line in Figure 1 of Box 4-4 starting at that score. Next, draw two horizontal lines from the point were the vertical line crosses each chance curve. The points where the horizontal lines cross the chance axis are the chances of success for a score of 58. For the middle 50% scores of 28 to 58, the chances of success range from 24 to 71% using the B or higher criterion, and from 54 to 84% using the C or higher criterion. Notice that the range for the B or higher criterion is wider, and includes the 50% chance of success (recall that the optimal cutoff score corresponds to a chance of a B/C or higher of about 50%).
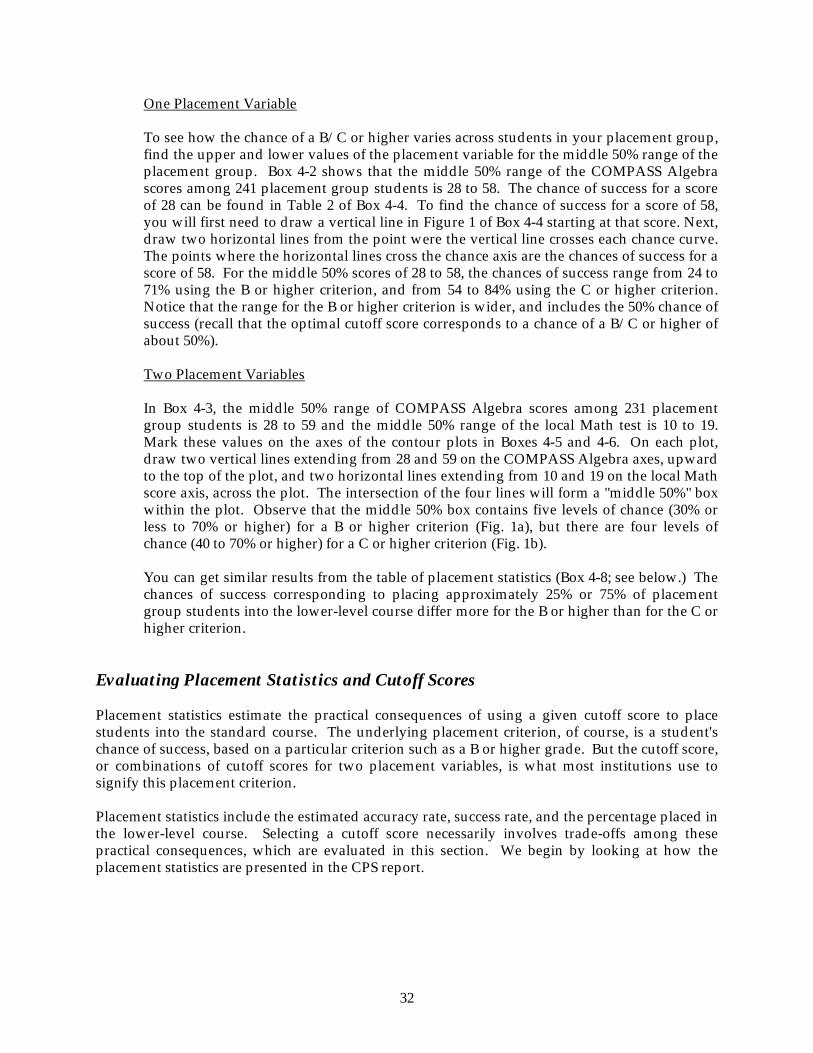
Two Placement Variables In Box 4-3, the middle 50% range of COMPASS Algebra scores among 231 placement
group students is 28 to 59 and the middle 50% range of the local Math test is 10 to 19. Mark these values on the axes of the contour plots in Boxes 4-5 and 4-6. On each plot, draw two vertical lines extending from 28 and 59 on the COMPASS Algebra axes, upward to the top of the plot, and two horizontal lines extending from 10 and 19 on the local Math score axis, across the plot. The intersection of the four lines will form a "middle 50%" box within the plot. Observe that the middle 50% box contains five levels of chance (30% or less to 70% or higher) for a B or higher criterion (Fig. 1a), but there are four levels of chance (40 to 70% or higher) for a C or higher criterion (Fig. 1b).
You can get similar results from the table of placement statistics (Box 4-8; see below.) The
chances of success corresponding to placing approximately 25% or 75% of placement group students into the lower-level course differ more for the B or higher than for the C or higher criterion.
Evaluating Placement Statistics and Cutoff Scores Placement statistics estimate the practical consequences of using a given cutoff score to place students into the standard course. The underlying placement criterion, of course, is a student's chance of success, based on a particular criterion such as a B or higher grade. But the cutoff score, or combinations of cutoff scores for two placement variables, is what most institutions use to signify this placement criterion. Placement statistics include the estimated accuracy rate, success rate, and the percentage placed in the lower-level course. Selecting a cutoff score necessarily involves trade-offs among these practical consequences, which are evaluated in this section. We begin by looking at how the placement statistics are presented in the CPS report.

33
One Placement Variable For a single placement variable, placement statistics are associated directly with values of the placement variable, as in Box 4-7 for Math 101. This is because there are only two chances of success, accuracy rates, and success rates for each value of a single placement variable, one for each of the B or higher and C or higher criteria. The percentage placed in the lower-level course for a given value of the placement variable does not depend on the criterion (for one placement variable only), and so is listed only once.
You may notice that the placement statistics on the same row of the table for a single placement variable correspond to the same hypothetical cutoff score, whether they pertain to the B or higher, or C or higher criterion. They will, however, correspond to different chances of success because
Box 4-7: Table 3 in CPS Report for Math 101
Placement Information
Table 3: Estimated Impact of Using Different COMPASS Algebra Cutoff Scores
Students placed in lower-level course
B or higher C or higher (1)
COMPASS Alg Score (2)
Percent below
(3) Cumulative
N-count
(4) Estimated
accuracy rate
(5) Estimated
success rate)
(6) Estimated
accuracy rate
(7) Estimated
success rate
99 99 238 54 97 32 98 84 95 229 58 94 36 96 69 84 202 66 88 45 94 67 82 197 67 87 47 93 63 78 187 69 85 50 92 55 72 173 71 82 54 90 54 68 164 72 79 56 89 50 64 155 73 77 58 88 49 63 151 73 76 59 88 48 61 147 73 75 60 87
Optimal B 47 59 142 73 74 61 87 46 57 138 73 73 62 86 45 56 134 73 72 63 86 43 53 127 73 70 64 85 41 51 122 72 69 65 84 40 48 115 72 68 66 83 39 46 111 71 67 66 83 38 44 106 71 66 67 82 36 41 99 70 64 68 81 35 39 95 69 63 68 81 34 36 87 68 62 69 80 31 33 79 67 60 70 79 30 29 71 65 58 70 78 29 27 65 64 57 70 77 28 24 58 62 56 71 76 27 22 54 61 55 71 76 26 20 47 60 54 71 75
Optimal C 25 17 41 58 53 71 74 24 14 34 57 52 71 73 22 11 26 54 51 71 72 19 7 17 52 49 70 71 18 5 13 51 49 70 71 16 0 0 47 47 69 698

34
the criteria are different. You will note also that the chances of success are not listed in this table because they are provided in an earlier table in your CPS report (see Table 2 in Box 4-4). Two Placement Variables When two placement variables are used jointly, placement statistics are listed for only selected chances of success. Box 4-8 contains Table 3 from the CPS report for Math 101. The chances of success are more closely concentrated near 50%, as that is the chance of success associated with the optimal cutoff score. Because chances of success and COMPASS scores have nearly the same range, you need to be careful not to confuse the two when selecting cutoff scores.
Box 4-8: Table 3 in CPS Report for Math 101
Placement Information
Table 3: Estimated Impact of Using Different COMPASS Algebra Score & Local Math Score Cutoff Scores
B or higher C or higher
Students placed in lower-level course
Students placed in lower-level course
(1) Chance of success in Math 101 based on COMPASS Alg
Score & Local Math Score
(2) Percent below
(3) Cumulative
N-count
(4)
Estimated accuracy
rate
(5)
Estimated success
rate
(6) Percent below
(7) Cumulative
N-count
(8)
Estimated accuracy
rate
(9)
Estimated success rate
94 97 223 61 96 88 203 51 96 89 90 208 66 93 80 184 58 94 84 84 195 71 91 75 174 61 93 79 81 186 73 89 68 158 66 90 74 78 181 74 88 62 143 69 88 69 76 175 75 86 56 129 72 86 64 74 170 76 85 52 121 73 84 61 69 160 77 82 49 114 74 83 59 68 157 77 81 47 109 74 82 57 65 151 78 79 45 104 74 81 55 65 149 78 78 44 101 74 81 54 64 147 78 78 42 97 75 80 53 63 146 78 77 42 97 75 80
Optimal 52 63 145 78 77 41 95 75 79 51 62 143 78 77 40 92 75 79 50 61 142 78 76 36 84 75 77 49 61 141 78 76 36 83 75 77 48 61 140 78 76 35 80 75 76 47 60 139 78 75 35 80 75 76 46 59 136 78 75 33 77 75 76 45 58 133 78 74 33 76 75 76 44 57 132 78 73 32 73 74 75 42 54 124 77 71 29 67 74 74 40 53 122 77 71 28 65 74 74 38 52 120 77 70 26 60 73 73 35 52 119 77 70 24 55 73 72 30 46 106 75 66 19 43 71 69 25 40 93 72 62 13 31 69 66 20 34 79 69 59 10 22 66 65 15 26 59 63 54 4 9 63 62 10 16 38 57 49 0 1 60 60 5 4 10 46 44 0 0 60 60

35
The placement statistics on the same row of the table correspond to the same chance of success, whether they represent a B or higher or C or higher criterion. If you are interested in the B or higher placement statistics, use the chance of a B/C or higher column and the placement statistics column labeled "B or higher." Conversely, if you are interested in the C or higher criterion, use the chance of a B/C or higher column and the placement statistics columns labeled "C or higher." Placement statistics on the same row will, however, correspond to different cutoff scores. The usual procedure with two placement variables is to select a chance of a B/C or higher using the placement statistics for one or both criteria, and then use one or both contour plots (Boxes 4-5 and 4-6) to find the combinations of placement variable values (i.e., cutoff scores) associated with the chance of a B/C or higher. This procedure is discussed and illustrated later in this chapter. If you want to take both criteria into account when choosing a cutoff score, you may find it useful to link the placement statistics for the criteria by finding comparable percentages placed into the lower-level course. In Box 4-8, 52% percent appears in both the B or higher and C or higher columns for the percentage placed into the lower level course. The corresponding chance of success is 38% for the B or higher criterion and 64% for the C or higher criterion. This means that the B or higher placement statistics on the row for the 38% chance are linked to the C or higher placement statistics on the row for the 64% chance. The link is through common combinations of values of the two placement variables that would place 52% of the placement group into the lower-level course. Questions about Placement statistics The information on placement statistics in your CPS report can be used to answer the following questions: 1. What is the optimal cutoff score and maximum accuracy rate? The optimal cutoff score is the score at which the estimated accuracy rate, or percentage of
correct placement decisions, is maximized. It is usually located somewhere between the lowest and highest possible cutoff score. Maximizing the accuracy rate may not be the only, or even the primary consideration in selecting a cutoff score, but it is a good starting point for considering all the consequences of using a cutoff score.
A good rule to keep in mind is that a difference of 5 or more percentage points in accuracy
rate is probably reliable and practically significant; smaller differences may not be reliable or practically significant, and should not outweigh other more meaningful differences that may exist between cutoff scores, such as differences in percent placed in the lower-level course or success rates.
One Placement Variable. Box 4-7 shows that the accuracy rate for the B or higher criterion for Math 101 is highest
(73%) at COMPASS Algebra scores of 43 through 50; the accuracy rate for the C or higher criterion is maximized (71%) at COMPASS Algebra scores of 22 through 28. The rows containing the maximum accuracy rates will always be shaded in Table 3 of your CPS report.

36
Note that the statistics in Table 3 of a CPS report are reported as integers. If they were to
be shown to one or more decimal places, the accuracy rate would be highest for the score labeled ‘optimal’. Obviously, the difference in accuracy rate among the shaded values will be small (less than 1%) and not practically significant. The optimal cutoff scores are also labeled in Table 2 and will always occur at the chance of success that is closest to 50% (see Box 4-4).
An alternative strategy is to designate a decision zone rather than one cutoff score. The
decision zone could include all placement variable values that are tied for the maximum accuracy rate or are within one or two percentage points of the maximum accuracy rate. In Box 4-7, the scores 40 through 54 are within one percentage point of the maximum accuracy rate for the B or higher criterion. Additional information can be used to make placement recommendations for students in the decision zone.
Two Placement Variables The placement statistics table (Box 4-8) will not directly show you what particular scores
maximize the accuracy rate. The accuracy rate for both criteria is necessarily highest near the 50% chance of a B/C or higher. The cutoff scores maximizing the accuracy rate correspond to the 50% level of shading in the contour plot.
In Box 4-5, for the Math 101 B or higher criterion (Fig. 1a), this boundary extends through
combinations likely to occur in the placement group such as a COMPASS Algebra score of 56 and a local Math test of 13. (The combinations also include COMPASS Algebra scores ranging from 21 to 92 and local Math tests ranging from 2 to 25 (the entire range). In Box 4-6 for the Math 101 C or higher criterion (Fig. 1b), the 50% level of shading is smaller. COMPASS Algebra scores of 16 to 83 and local Math test scores of 2 to 18 are included.
The combinations of cutoff scores suggested by the 50% level of shading in the contour
plots may be more precise than necessary for obtaining a maximum accuracy rate. Box 4-8 shows us that the maximum accuracy rate for the B or higher criterion in Math 101 (78%) applies to the chances of success 44% through 57%. These chances correspond to a somewhat broader range of cutoff score combinations than are represented by the 50% level of shading in the contour plot. The maximum accuracy rate for the C or higher criterion in Box 4-8 (75%) corresponds to a slightly smaller range of chances of success (45% - 54%).
If the contour plot is unclear or imprecise for your needs, you can use the placement
variable regression weights to find values that predict any given chance of a B/C or higher. This procedure is described in the appendix, and may require statistical expertise.
2. What percentage of students would be placed into the lower-level course? Your institution may not be able to accommodate the change in class size that would
accompany using a cutoff score selected only for its estimated accuracy rate. The percentage placed in the lower-level course is a practical consideration pertaining to the potential numbers of students taking either the remedial or standard course. The

37
descriptive information for your course (see Group Description Section) may be useful in interpreting this estimate.
One Placement Variable For example, Box 4-2 shows that there were 241 students in the Math 101 placement
group. Of these, 77 (including 2 students who withdrew), or approximately 32%, took Math 101. Conceivably, 68% of the placement group took a lower-level course. Box 4-7 shows that the optimal cutoff score for a B or higher criterion (47) would place 59% of the placement group, or 142 students, into the lower-level course; conversely, 99 students would be placed in Math 101.
The optimal cutoff score for the C or higher criterion (25) would place 17% of the
placement group, or 41 students, into the lower-level course and 200 students into Math 101.
If these numbers seem surprising or unreasonable, the placement group may not represent
students choosing exclusively between the course and a lower-level course. The placement group for Math 101 may contain some students choosing between Math 101 and a higher-level course, as was suggested earlier. It is also conceivable that some students in the placement group may not take a mathematics course their first semester. In such cases, the estimated percentage placed into the lower-level course may not be useful for estimating class sizes.
Two Placement Variables According to the information in Boxes 4-8 and 4-3, a 50% chance of getting a B or higher is
estimated to place 61% of the placement group, or 141 of 231 students into a lower-level course; 100 would be placed into Math 101. A 50% chance of getting a C or higher would place 36% or 83 students into a lower-level course and 148 would be placed into Math 101. As was noted above in the one placement variable example, current descriptive information for your course will indicate whether the estimated percentage placed in the lower-level course can be used in this fashion to make valid estimates of class size.
3. What percentage of students would be successful in the standard course? The percentage of students who would be successful in the course is estimated by the
success rate. There is an estimated success rate for each criterion and cutoff score or chance of success shown in the placement information table. Estimated success rates can be compared to the current observed success rate for your course, which is found in the Group Description Section. For example, Box 4-2 shows that 61% of the students who completed Math 101 got a B or higher grade and 80% got a C or higher grade.
One Placement Variable The current success rates for Math 101 (61% and 80% respectively for B or higher and C or
higher criteria) are closest to the success rates estimated for an COMPASS Algebra cutoff score of 34 (62% and 80%) according to Box 4-7. Cutoff scores higher than 34 would

38
therefore likely result in higher success rates in Math 101 than are currently obtained. The optimal cutoff score for the B or higher criterion, 47, would improve success rates to
74% using the B or higher criterion, and 87% using the C or higher criterion. Using the optimal cutoff score for the C or higher criterion, 25, would decrease success rates slightly to 53% for the B or higher criterion and 74% for the C or higher criterion.
To understand how the success rate for your course would change from its current value if
a particular cutoff score were used, compare the placement variable values of students who completed the course (Box 4-2) with the hypothetical cutoff score. For example, an COMPASS Algebra score of 47 is 22 points higher than the mean of students who received a W grade, and 29 points higher than the minimum COMPASS Algebra score among students who received an A-F grade in Math 101 (18). In effect, implementing a cutoff score of 47 would have prevented about 35% of the students who took Math 101 from enrolling directly in this course (see N-counts in Table 2, Box 4-4). These students would have been the least prepared, which would improve the success rate of the remaining students.
Two Placement Variables Two estimated success rates for a given chance of a B/C or higher are reported in the
placement statistics table for two placement variables (Box 4-8); one for each criterion. For example, the estimated success rates for a 50% chance of a B/C or higher in Box 4-7 is 76% for B or higher and 77% for C or higher.
For the C or higher criterion, a 53 or 54% chance of a B/C or higher criterion for placement
is estimated to give the same success rate (80%) as the current percentage of students who complete Math 101 with a C or higher grade. Using the optimal cutoff score combinations for the C or higher criterion (corresponding to a 50% chance of a B/C or higher) would slightly decrease the current C or higher success rate (to 77%).
For the B or higher criterion, a 25% chance of a B/C or higher is estimated to give about
the same success rate (62%) as the percentage of students who currently complete Math 101 with a B or higher grade. Using the optimal cutoff score combinations for the B or higher criterion (corresponding to a 50% chance of a B/C or higher) would significantly increase the current B or higher success rate (to 76%).
4. What are some of the tradeoffs among hypothetical cutoff scores? Some tradeoffs are easy to see. For example, the estimated success rate will always
improve at the expense of placing more students into the lower-level course. In Box 4-7, the highest success rate for Math 101 (98% for the C or higher criterion) occurs for the COMPASS Algebra score of 99. With this cutoff score, virtually all of students in the placement group would be placed into the lower-level course.
Other tradeoffs may be more subtle. For example, two different cutoff scores can have the
same accuracy rate, but different success rates. For the B or higher criterion in Box 4-7, COMPASS Algebra scores of 43 and 50 have the same accuracy rate (73%), but different

39
success rates (70% versus 77%, respectively). These scores also have different percentages of students placed into the lower-level course (53% versus 64% respectively).
Tradeoffs may also involve the comparison of placement statistics across criteria. Optimal
cutoff scores are rarely the same for both criteria. For Math 101, the optimal COMPASS Algebra cutoff score was 47 for the B or higher criterion and 25 for the C or higher criterion (Box 4-7).
The chance of a B/C or higher corresponding to the proposed cutoff score may also be
considered in choosing a cutoff score. This is the minimum chance of a B/C or higher a student who is placed into the standard course can have. When advising a student, it is important to consider what chance of a B/C or higher may seem reasonable, or sufficiently high to the student. Whether a given chance is acceptable may depend on the criterion. For example, some students may feel that a 50% chance of a C or higher grade is too low to justify taking the standard course, but that a 50% chance of a B or higher grade is high enough.
Evaluating a Current Cutoff Score If you are already using a cutoff score, you can see how well it works by finding the placement statistics associated with it and comparing these to the placement statistics of other possible cutoff scores. The estimated percent placed into the lower-level course for your current cutoff score should agree with the percentages that result from comparing group sizes in the tables of descriptive information for your course. For example, the students who completed Math 101 comprise approximately 32% of the placement group according to the group sizes in Box 4-2. Presumably, 68% were placed into the lower-level course. The estimated percentage placed into the lower-level course for an existing Math 101 cutoff score should therefore be close to 68%. You should also check whether the estimated success rates for your current cutoff score agree with the descriptive information for your course. For example, 80% of the Math 101 completers in Box 4-2 earned a C or higher grade, and 61% earned a B or higher grade. The estimated success rates for an existing Math 101 cutoff score should be close to these percentages. If estimates of the success rates and percent placed into the lower-level course for the current cutoff score agree with descriptive information for the course, the estimated accuracy rate should also be valid. The estimated accuracy rate is computed under the assumption that all placement group students at and above the cutoff score are placed into the reference course and that all placement group students below the cutoff score are placed into the lower-level course. One Placement Variable For one placement variable, locate your current cutoff score in column 1 of the placement statistics table (e.g., Box 4-7) and read the placement statistics expected on the same row. Suppose an COMPASS Algebra score of 35 were the current cutoff score for Math 101. According to Box 4-7, using this cutoff score would place 39% of the placement group into the lower-level course; of the

40
students placed into the standard course, 63% would earn a B or higher grade and 81% would earn a C or higher grade. The estimated success rates are close to the descriptive information for Math 101 (61% earned a B or higher grade; 80% earned a C or higher grade in Box 4-2). A COMPASS Algebra cutoff score of 35 is estimated to place 39% of the Math 101 placement group into the lower-level course (Box 4-7). This means that 61% would be placed into Math 101. But Box 4-2 shows that only 32% of the placement group (N=241) took Math 101 (including 75 who completed Math 101 with a grade and 2 who withdrew). A plausible explanation for this discrepancy, if 35 were the existing Math 101 cutoff score, is that a portion of the students above the cutoff score are enrolling in a higher-level course. The estimated accuracy rate for a cutoff score of 35 is 69% for the B or higher criterion and 68% for the C or higher criterion. Because this score is not the optimal cutoff score for either criterion, the accuracy rates are not the maximum. Two Placement Variables For two placement variables, choose a criterion (B or higher or C or higher) and find the area on the contour plot where the coordinates of your cutoff scores intersect. For example, if the cutoff scores for placing students into Math 101 were an COMPASS Algebra score of 36 and a local Math test score of 17, we would find the level of shading where these criteria intersect in the contour plots in Box 4-5. (Note that the chance values within a level of shading range from –5% to +4% of the shading label. For example, the 50% contour level includes chances values of 45 – 54%.) In Box 4-5, Fig. 1a, for the B or higher criterion, these cutoff scores intersect near the start of the 40% level of shading (or about a 35% chance). We would then read the placement statistics for the B or higher criterion on the row for the 35% chance of a B/C or higher in Box 4-8. These placement statistics are: 52% placed in the lower-level course, an accuracy rate of 77%, and a success rate of 70%. We would conclude that the current cutoff score of 36 on the COMPASS Algebra test and 17 on the local Math test is very close to optimal in terms of estimated accuracy rate. In comparison with the percentages listed in Box 4-2, the current cutoff score would place 9% fewer students in a lower-level course but is higher in terms of estimated success rate. To see placement statistics for the current cutoff score based on the C or higher criterion, we would repeat the procedure for that criterion. In Box 4-5, Fig.1b, n COMPASS Algebra score of 36 and local Math test score of 17 intersect near the end of 60% level of shading (or about 64%). We would therefore read the placement statistics in Box 4-8 for the C or higher criterion from the row for a 64% chance of a B/C or higher. Finding a Cutoff Score for Two Placement Variables When two placement variables are used jointly, the first step is to select a criterion of success (B or higher or C or higher) and a minimum chance of success for placing students into the reference course. This step is described in the previous section on evaluating placement statistics. The next step is to find combinations of placement variable values that correspond to the minimum chance of success you selected. To do this, you use the contour plot that corresponds to the criterion of success that you selected.

41
For example, suppose we have decided that the configuration of placement statistics associated with the 40% level of chance for a B or higher criterion is the best we can obtain. We would then refer to Box 4-5 to find combinations of COMPASS Algebra and local Math test scores that correspond to a 40% level of shading (i.e., the center of that level). The 40% chance of success in Fig 1a., Box 4-5 includes combinations of COMPASS Algebra and local Math test scores of, respectively, 29 and 20, 41 and 16, 52 and 12, and 73 and 5. For a 35% chance of a B/C or higher, we would find combinations near the 30%/40% boundary, and for a 45% chance of a B/C or higher we would find combinations near the 40%/50% boundary. In the above example, we clearly cannot express the cutoff score in terms of a fixed COMPASS Algebra score and a fixed local Math test score. You might want to construct a table that gives the minimum score on one placement variable that would be acceptable in combination with each score on the second placement variable corresponding to the given level of shading. For example, the middle of the 40% level of shading corresponds to COMPASS Algebra scores ranging from 16 to 80. The combinations mentioned in the preceding paragraph would be acceptable pairings. For example, students with a COMPASS Algebra score of 41 would have to have a local Math score of at least 16 in order to be placed into Math 101; students with an COMPASS Algebra score of 52 would have to have a local Math score of at least 12, etc. In practice, it might be useful to develop more than one table of cutoff scores, where each table corresponds to a different level of shading and/or a different criterion (B or higher and C or higher). The cutoff score table you ultimately use may be a compromise between criteria of success as well as placement statistics. The Grade Experience Table A grade experience table like the one shown in Box 4-9 is provided for those who are familiar with the grade experience tables in the COMPASS Returning Student Retention Report. Faculty use this table to examine the relationship between scores on a current placement test and grades in a course. The grade experience table is limited to prespecified grade and cutoff score ranges, which may or may not correspond exactly to the values that interest you as potential cutoff scores, based on other information in your CPS report. The table is also provided only for single placement variables. Tables based on two or more placement variables would be too complicated to interpret. Section A of Box 4-9 shows the percentage of all students who earn a C or higher grade in Math 101, and for increasing levels of the COMPASS Algebra test score. Of the 77 students summarized in this table, 60, or 78% were successful (earned a C or higher) in Math 101. Of the students with COMPASS Algebra scores in the 18-22 range, 25% were successful. Except for students scoring in the range of 54-70, the percentage of successful students increases as the COMPASS Algebra score level increases, up to 88% successful at the 71-99 score level. The grade distribution (in percent) and number of students at each COMPASS Algebra score range is shown in Section B of Box 4-9. For example, there were 21 students with COMPASS Algebra scores in the 40-53 range. The 86% of these students who received a C or higher (according to Section A), include 24% who received an A, 43% who received a B, and 19% who

42
received a C grade. Due to rounding, percentages in Section B may not always total to 100% or correspond exactly to the percentages in Section A for the grades considered successful. Section C presents the mean and standard deviation of student's grades within each COMPASS Algebra score range. Students with I or W outcomes are excluded from this summary, as indicated by the smaller sample sizes at each COMPASS Algebra score range, compared to those in Section B. Except for the second score range, the mean grade in Math 101 increases with increasing score ranges. W grades are treated as unsuccessful outcomes in Section A. The fairly small number of students in Math 101 make it difficult to determine trends using the Grade Experience Table. Box 4-9: Table 4 in in CPS Report for Math 101
In sum, the grade experience table will be consistent with other results in your CPS report, and could give you some additional working insight for using the results of your report. You may be able to better evaluate your decision to treat W and I outcomes as missing data or unsuccessful course outcomes, and can see cases of incorrect and correct placement decisions for a given cutoff score range. This information may help you evaluate the effectiveness of a current or potential cutoff scores, and can also illustrate the need to avoid overemphasizing a single cutoff score. Decision zones are described in Chapter 2 of this guide as alternatives to single test cutoff scores.
Course Success/Grade Experience Table 4: Math 101 Grades For Given Categories of COMPASS Algebra Score
Percentage of enrollees assigned each grade by COMPASS Algebra score range
Score
N Total% 1-17 18-22 23-29 30-39 40-53 54-70 71-99 Mean SD
A. Success summary
60 78 0 25 0 78 86 83 88 57.9 16.9
(C or higher)
B. Grade categories (A) 3.50-4.00 23 30 0 0 0 11 24 30 59 66.3 15.1
(B) 2.50-3.49 23 30 0 0 0 11 43 39 24 56.1 15.4 (C) 1.50-2.49 14 18 0 25 0 56 19 13 6 45.2 14.1 (D) 0.50-1.49 11 14 0 75 33 11 14 9 6 41.5 18.8 (F) 0.00-0.49 4 5 0 0 0 11 0 9 6 55.8 12.2 (W) Withdrawal 2 3 0 0 67 0 0 0 0 25.0 1.0 (I) Incomplete 0 0 0 0 0 0 0 0 0 0.0 0.0 All Enrollees 77 100 0 4 3 9 21 23 17 54.3 18.4
C. Grade summary Average grade by COMPASS Algebra score range
(A-F only) Mean 2.67 0.00 1.25 1.00 2.00 2.76 2.74 3.24 55.0 18.0 S.D. 1.20 0.00 0.43 0.00 1.05 0.97 1.22 1.16 N 75 0 4 1 9 21 23 17
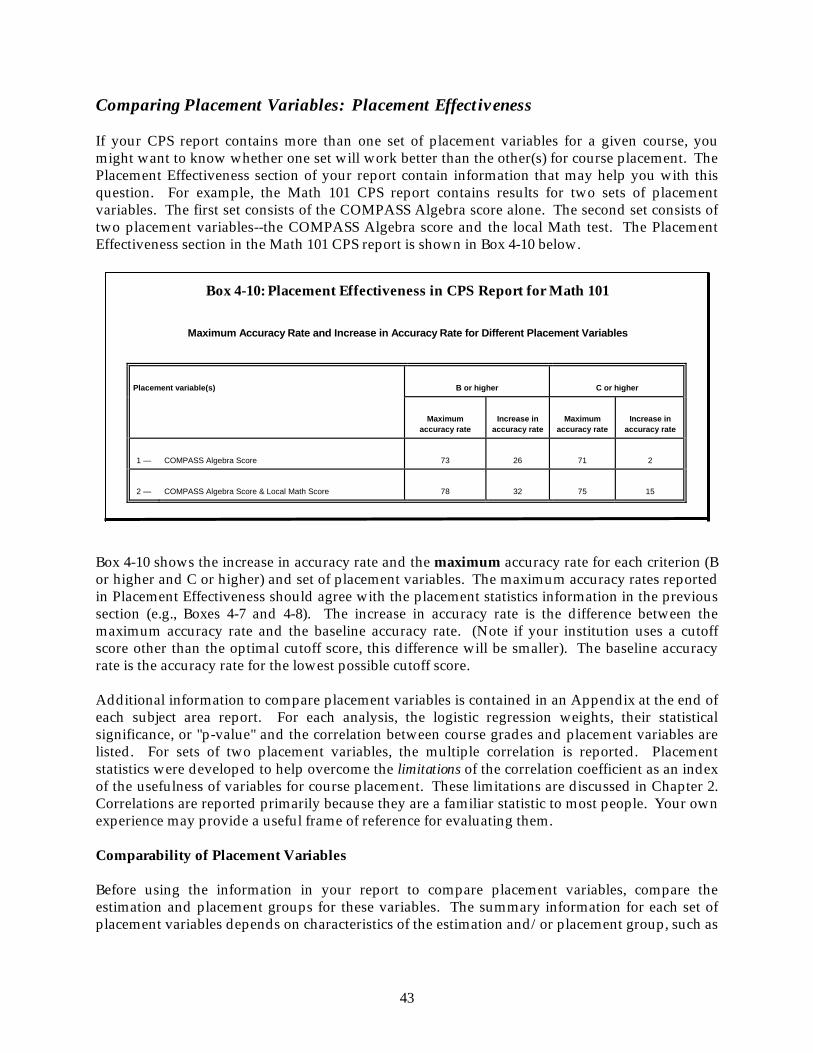
43
Comparing Placement Variables: Placement Effectiveness If your CPS report contains more than one set of placement variables for a given course, you might want to know whether one set will work better than the other(s) for course placement. The Placement Effectiveness section of your report contain information that may help you with this question. For example, the Math 101 CPS report contains results for two sets of placement variables. The first set consists of the COMPASS Algebra score alone. The second set consists of two placement variables--the COMPASS Algebra score and the local Math test. The Placement Effectiveness section in the Math 101 CPS report is shown in Box 4-10 below.
Box 4-10 shows the increase in accuracy rate and the maximum accuracy rate for each criterion (B or higher and C or higher) and set of placement variables. The maximum accuracy rates reported in Placement Effectiveness should agree with the placement statistics information in the previous section (e.g., Boxes 4-7 and 4-8). The increase in accuracy rate is the difference between the maximum accuracy rate and the baseline accuracy rate. (Note if your institution uses a cutoff score other than the optimal cutoff score, this difference will be smaller). The baseline accuracy rate is the accuracy rate for the lowest possible cutoff score. Additional information to compare placement variables is contained in an Appendix at the end of each subject area report. For each analysis, the logistic regression weights, their statistical significance, or "p-value" and the correlation between course grades and placement variables are listed. For sets of two placement variables, the multiple correlation is reported. Placement statistics were developed to help overcome the limitations of the correlation coefficient as an index of the usefulness of variables for course placement. These limitations are discussed in Chapter 2. Correlations are reported primarily because they are a familiar statistic to most people. Your own experience may provide a useful frame of reference for evaluating them. Comparability of Placement Variables Before using the information in your report to compare placement variables, compare the estimation and placement groups for these variables. The summary information for each set of placement variables depends on characteristics of the estimation and/or placement group, such as
Box 4-10: Placement Effectiveness in CPS Report for Math 101 Maximum Accuracy Rate and Increase in Accuracy Rate for Different Placement Variables
Placement variable(s) B or higher C or higher
Maximum accuracy rate
Increase in accuracy rate
Maximum accuracy rate
Increase in accuracy rate
1 — COMPASS Algebra Score 73 26 71 2
2 — COMPASS Algebra Score & Local Math Score 78 32 75 15
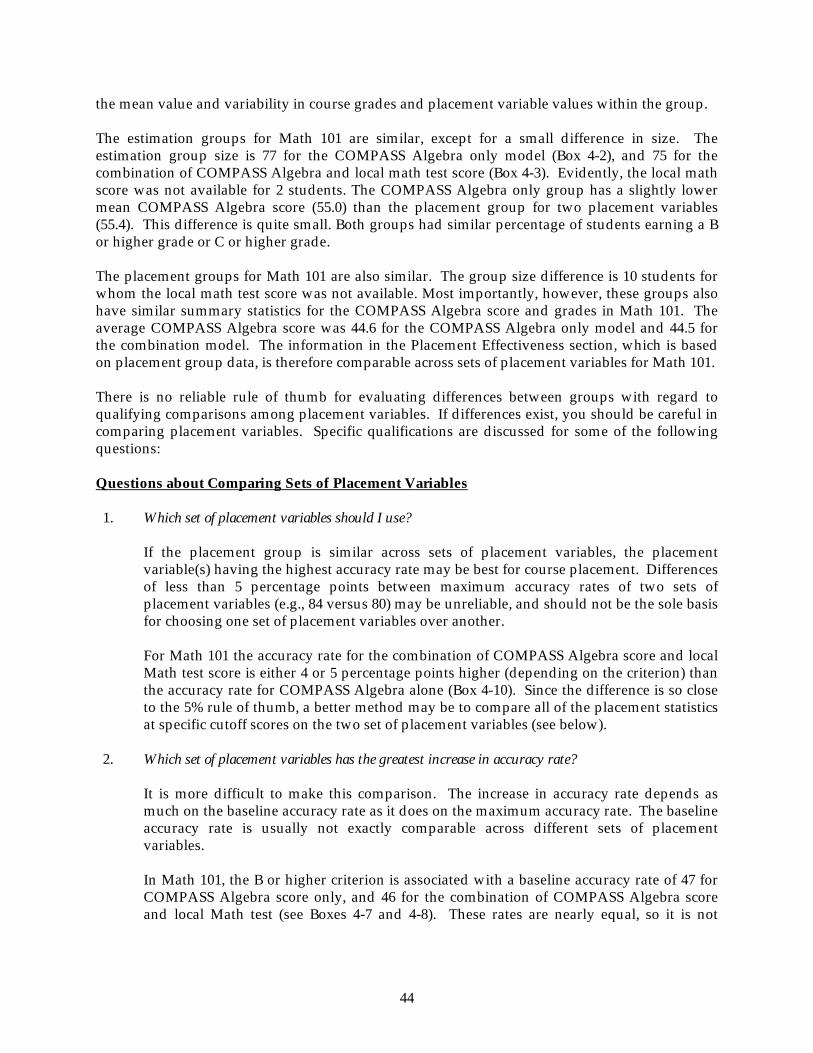
44
the mean value and variability in course grades and placement variable values within the group. The estimation groups for Math 101 are similar, except for a small difference in size. The estimation group size is 77 for the COMPASS Algebra only model (Box 4-2), and 75 for the combination of COMPASS Algebra and local math test score (Box 4-3). Evidently, the local math score was not available for 2 students. The COMPASS Algebra only group has a slightly lower mean COMPASS Algebra score (55.0) than the placement group for two placement variables (55.4). This difference is quite small. Both groups had similar percentage of students earning a B or higher grade or C or higher grade. The placement groups for Math 101 are also similar. The group size difference is 10 students for whom the local math test score was not available. Most importantly, however, these groups also have similar summary statistics for the COMPASS Algebra score and grades in Math 101. The average COMPASS Algebra score was 44.6 for the COMPASS Algebra only model and 44.5 for the combination model. The information in the Placement Effectiveness section, which is based on placement group data, is therefore comparable across sets of placement variables for Math 101. There is no reliable rule of thumb for evaluating differences between groups with regard to qualifying comparisons among placement variables. If differences exist, you should be careful in comparing placement variables. Specific qualifications are discussed for some of the following questions: Questions about Comparing Sets of Placement Variables 1. Which set of placement variables should I use? If the placement group is similar across sets of placement variables, the placement
variable(s) having the highest accuracy rate may be best for course placement. Differences of less than 5 percentage points between maximum accuracy rates of two sets of placement variables (e.g., 84 versus 80) may be unreliable, and should not be the sole basis for choosing one set of placement variables over another.
For Math 101 the accuracy rate for the combination of COMPASS Algebra score and local
Math test score is either 4 or 5 percentage points higher (depending on the criterion) than the accuracy rate for COMPASS Algebra alone (Box 4-10). Since the difference is so close to the 5% rule of thumb, a better method may be to compare all of the placement statistics at specific cutoff scores on the two set of placement variables (see below).
2. Which set of placement variables has the greatest increase in accuracy rate? It is more difficult to make this comparison. The increase in accuracy rate depends as
much on the baseline accuracy rate as it does on the maximum accuracy rate. The baseline accuracy rate is usually not exactly comparable across different sets of placement variables.
In Math 101, the B or higher criterion is associated with a baseline accuracy rate of 47 for
COMPASS Algebra score only, and 46 for the combination of COMPASS Algebra score and local Math test (see Boxes 4-7 and 4-8). These rates are nearly equal, so it is not

45
unreasonable to compare the increase in accuracy rates for these two sets of placement variables. The increase is 26 for the COMPASS Algebra score only, and 32 for the combination of COMPASS Algebra score and local math test score--a 6-percentage point difference. This difference may be practically significant.
Comparisons Based on Selected Cutoff Scores Another way to compare placement variables is to compare the placement statistics for the cutoff scores you would implement within each set of placement variables. For example, suppose a COMPASS Algebra score of 36 were the proposed cutoff score, if the COMPASS Algebra score alone were used to place students into Math 101, and a 35% chance of a B or higher were the proposed placement criterion, if a combination of COMPASS Algebra and local Math score were used. How do the group placement statistics for these cutoff scores compare? According to Boxes 4-7 and 4-8, they would place 41% and 52% of the placement group into the lower-level course. The two-placement variable model has a slightly higher estimated accuracy rate (70% versus 77%) and success rate for the B or higher criterion (64% versus 70%). The two sets of placement variables can be evaluated with respect to these more specific differences.

46

47
CHAPTER 5 More Questions and Answers about the CPS Report In this chapter, we answer questions that are frequently asked by people who want to use and understand the CPS report. Answers to these questions may be contained in one form or another elsewhere in this report, but were not presented in the context of a specific question. Questions about Criteria of Successful Performance in the Course 1. Why is course placement concerned with successful/unsuccessful outcomes instead of grades? While the grade scale represents finer distinctions among students, in comparison to the
successful/unsuccessful scale, the placement decision itself divides students into just two groups--those placed or not placed into the course. Fine distinctions among predicted course outcomes are often superfluous for the placement decision. Moreover, we can make fine distinctions among students with regard to a successful/unsuccessful outcome by referring to their chance of B/C or higher.
Also, differences between grades, i.e., the difference between an A and B or the difference
between a C and D, are not necessarily equal or comparable in utility. The grade scale is ordinal. Statistical procedures commonly used in prediction, however, assume the dependent variable is equal-interval.
2. Why are there both "C or higher" and "B or higher" criteria? Usually, information from both criteria is important for setting a cutoff score. The cutoff
score eventually chosen often lies between the cutoff scores that maximize the accuracy rate for either criterion.
Even if only one criterion were to be used for setting or evaluating a cutoff score, it would
usually be impossible for us to know in advance which criterion would work best. The best criterion is identified partly through the results in the CPS report, such as the amount of change in the chance level among students in the placement group, and partly through the judgment of local faculty. The judgment component is aided by results in the CPS report. Thus, information on both criteria is needed.
3. Which criterion should I use to set my cutoff score? You may want to give more weight to the placement statistics for the criterion that seems
to make the most sense to your faculty. What does a B or C grade for the course mean? Does a C mean the student is ready for upper-level course work? Do B students do significantly better than C students in future course work? What percentage of students currently taking the course actually complete the course "unsuccessfully," in the opinion of the faculty, and which criterion of success (B or higher or C or higher) reflects this percentage in Section A of your report? While the results shown in the CPS report, and
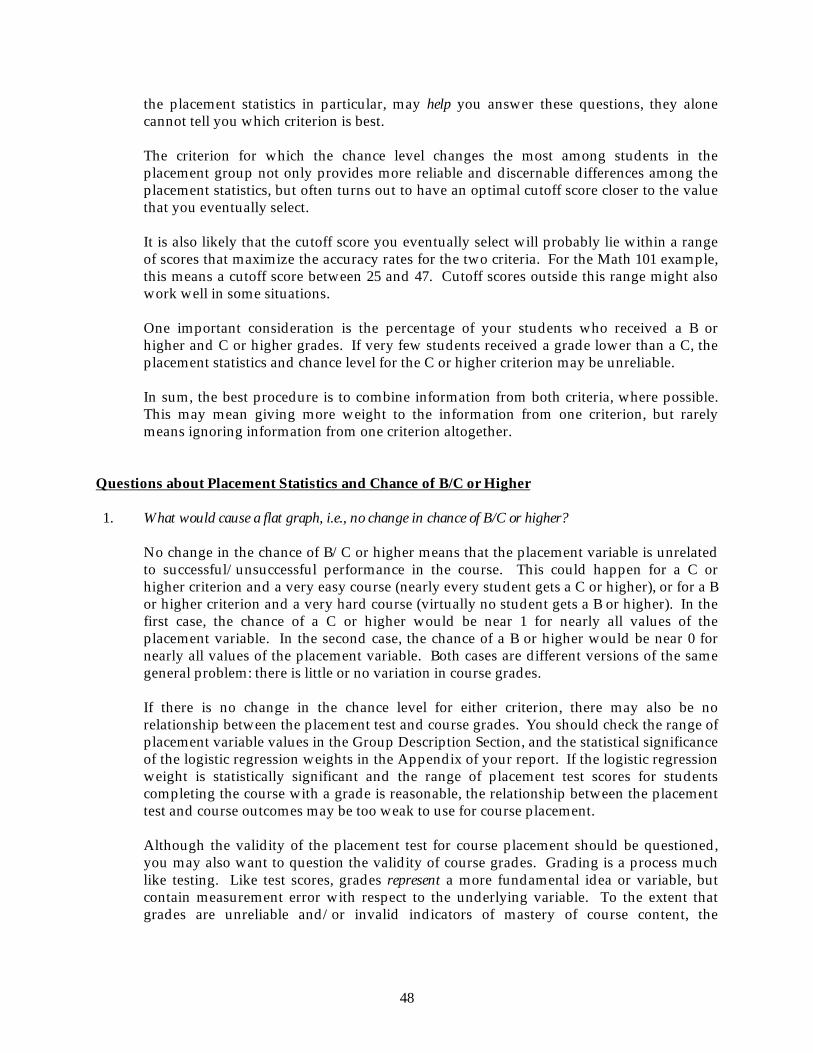
48
the placement statistics in particular, may help you answer these questions, they alone cannot tell you which criterion is best.
The criterion for which the chance level changes the most among students in the
placement group not only provides more reliable and discernable differences among the placement statistics, but often turns out to have an optimal cutoff score closer to the value that you eventually select.
It is also likely that the cutoff score you eventually select will probably lie within a range
of scores that maximize the accuracy rates for the two criteria. For the Math 101 example, this means a cutoff score between 25 and 47. Cutoff scores outside this range might also work well in some situations.
One important consideration is the percentage of your students who received a B or
higher and C or higher grades. If very few students received a grade lower than a C, the placement statistics and chance level for the C or higher criterion may be unreliable.
In sum, the best procedure is to combine information from both criteria, where possible.
This may mean giving more weight to the information from one criterion, but rarely means ignoring information from one criterion altogether.
Questions about Placement Statistics and Chance of B/C or Higher 1. What would cause a flat graph, i.e., no change in chance of B/C or higher? No change in the chance of B/C or higher means that the placement variable is unrelated
to successful/unsuccessful performance in the course. This could happen for a C or higher criterion and a very easy course (nearly every student gets a C or higher), or for a B or higher criterion and a very hard course (virtually no student gets a B or higher). In the first case, the chance of a C or higher would be near 1 for nearly all values of the placement variable. In the second case, the chance of a B or higher would be near 0 for nearly all values of the placement variable. Both cases are different versions of the same general problem: there is little or no variation in course grades.
If there is no change in the chance level for either criterion, there may also be no
relationship between the placement test and course grades. You should check the range of placement variable values in the Group Description Section, and the statistical significance of the logistic regression weights in the Appendix of your report. If the logistic regression weight is statistically significant and the range of placement test scores for students completing the course with a grade is reasonable, the relationship between the placement test and course outcomes may be too weak to use for course placement.
Although the validity of the placement test for course placement should be questioned,
you may also want to question the validity of course grades. Grading is a process much like testing. Like test scores, grades represent a more fundamental idea or variable, but contain measurement error with respect to the underlying variable. To the extent that grades are unreliable and/or invalid indicators of mastery of course content, the

49
relationship between a valid placement test and course grades will be compromised. 2. How does the success rate differ from the chance of B/C or higher for a hypothetical cutoff score? The success rate is based on placement group students at or above the hypothetical cutoff
score, and is the estimated percentage of these students who would be successful in the standard course. The chance of B/C or higher for a hypothetical cutoff score applies only to students at the cutoff score, and is the minimum chance of B/C or higher that a student placed into the course would have.
3. How can the accuracy rate decline at high score levels? The accuracy rate counts true positives and true negatives equally. Whenever students
who are more likely to succeed in the standard course than to fail are placed into the remedial course, the accuracy rate is lowered. This is because these students are more likely to become a false negative than a true negative. If they had been placed into the standard course, they are more likely to have become a true positive than a false positive. At higher scores, students are generally more likely to succeed than to fail. In other words, their chance of B/C or higher is greater than 50%. Therefore, the accuracy rate declines as the cutoff score increases above a value for which the chance of B/C or higher equals 50%.
Questions about Cutoff Scores 1. What if there is more than one optimal cutoff score? By definition, the optimal cutoff score is the score corresponding to the maximum
accuracy rate. Due to rounding, the maximum accuracy rate in your report may be listed for more than one score. There is no practical or statistical basis for distinguishing these scores on the basis of their accuracy rate. Nevertheless, you can usually break ties for the maximum accuracy rate by finding the score at which the chance of B/C or higher is closest to 50%.
Of course, the optimal cutoff score is not necessarily best for your course. Other
considerations, such as the percentage placed in the lower-level course and the success rate are more important for distinguishing among possible cutoff scores sharing equivalent accuracy rates.
2. What are some cutoff scores other colleges are using? Table 3-1 in Chapter 3 summarizes cutoff scores and placement statistics for pairings of
COMPASS tests with college courses. The results in your CPS report will probably not match the results reported in this table. The median cutoff scores reported for courses similar to your own may help you choose among potential cutoff scores, based on information in your own report. However, unless the information in your report leads you to question your results, you should give more weight to the statistics in your own report than to the information from other courses.

50
Questions about Using Placement Tests and Cutoff Scores 1. How do I place students who don't have valid placement test/variable scores? This is an important consideration in choosing a set of placement variables. For example,
two placement variables often do better than either one alone, in terms of accuracy rate and other indicators of predictive validity, but cannot be used to place as many students. In the Math 101 example, the set of two placement variables (COMPASS Algebra score and local Math score had a slightly higher accuracy rate than did the COMPASS Algebra score only model (78% versus 73% for the B or higher criterion in Box 4-10, Chapter 4) could be applied to 10 fewer students, as indicated by the placement group sizes (241 versus 231).
In this case, one solution would be to use the COMPASS Algebra score alone to place the
10 students lacking a local Math score and to use both placement variables for the remaining 231 students. More generally, this solution means using all the relevant information available for the student. You would need to establish placement criteria for each placement variable used singly and in combination with each other.
Another solution is to require students to supply the needed information prior to course
placement. For example, all students might be required to take a local placement test, in addition to supplying their COMPASS scores.
2. How can I effectively use COMPASS test scores in combination with local placement test scores,
without extensive testing? A major concern of institutions is the time and costs associated with placement testing.
One way to minimize local testing, while maximizing placement information, is to use COMPASS test scores as an initial screening test, followed by local placement testing for selected students. Students scoring below a particular score, say 25, could go into the lower-level course. Student scoring at or above a score (e.g., 47) could go into the standard-level course. Only the students scoring in the 25-46 range would need local placement testing.
Questions about Reliability and Validity of CPS Results 1. Do we need a CPS report every year? The statistics in the course placement report may vary from one year to the next,
depending on the distribution of grades in the course, the performance of entering freshmen students on the placement variables, the relationship between placement variables and course grades, and the cutoff scores used. A statistic such as the percentage placed into the lower-level course will change less than the chance of B/C or higher, accuracy rate, and success rate for a given value of the placement variable. If none of these factors change, then you don't need to participate in CPS every year. If one or more of these factors change, then you will need to participate in CPS to validate your cutoff scores.

51
2. What is extrapolation? In the context of course placement, extrapolation occurs when the chance of B/C or higher
is estimated for a placement group student whose score on the placement test is outside the range of scores of students who completed the course. These estimates may be questioned in that the statistical relationship between the placement variable and chance of B/C or higher may not be the same for all values of the placement variable. Often, students with very low scores are more likely to be successful, and students with very high scores less likely to be successful, than we would predict from their scores alone.
Research at ACT has shown that extrapolated chances of success are accurate when less
than 25% of the placement group is in the region of extrapolation (Schiel and Noble, 1992; Houston, 1993; Shiel & King, 1999; Schiel & Harmston, 2000). Most of the course placement data encountered in the ACT Course Placement Service meets this criterion. If a large proportion, e.g., over 25% of scores of placement group students are extrapolated, the chance of B/C or higher for these students could be systematically over- or underestimated; in such cases, estimates of accuracy rates and success rates would also be affected because these statistics require an estimate of every placement group student's chance of B/C or higher.

52
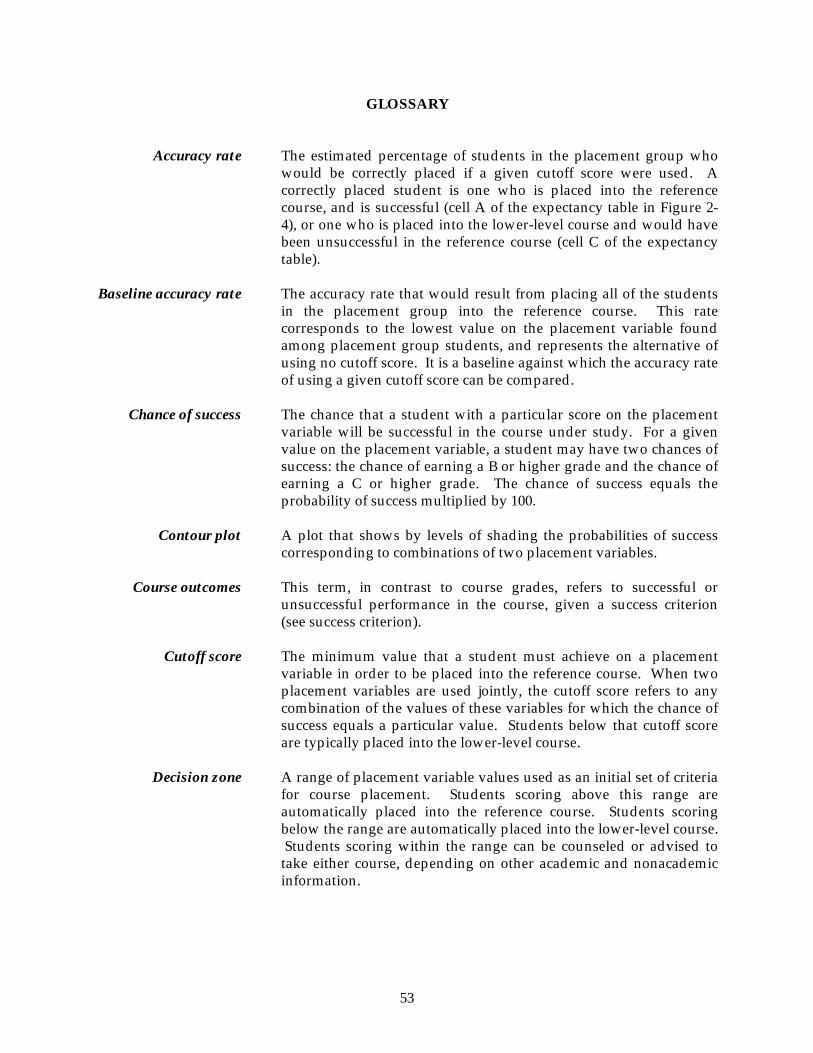
53
GLOSSARY Accuracy rate The estimated percentage of students in the placement group who
would be correctly placed if a given cutoff score were used. A correctly placed student is one who is placed into the reference course, and is successful (cell A of the expectancy table in Figure 2-4), or one who is placed into the lower-level course and would have been unsuccessful in the reference course (cell C of the expectancy table).
Baseline accuracy rate The accuracy rate that would result from placing all of the students
in the placement group into the reference course. This rate corresponds to the lowest value on the placement variable found among placement group students, and represents the alternative of using no cutoff score. It is a baseline against which the accuracy rate of using a given cutoff score can be compared.
Chance of success The chance that a student with a particular score on the placement
variable will be successful in the course under study. For a given value on the placement variable, a student may have two chances of success: the chance of earning a B or higher grade and the chance of earning a C or higher grade. The chance of success equals the probability of success multiplied by 100.
Contour plot A plot that shows by levels of shading the probabilities of success
corresponding to combinations of two placement variables. Course outcomes This term, in contrast to course grades, refers to successful or
unsuccessful performance in the course, given a success criterion (see success criterion).
Cutoff score The minimum value that a student must achieve on a placement
variable in order to be placed into the reference course. When two placement variables are used jointly, the cutoff score refers to any combination of the values of these variables for which the chance of success equals a particular value. Students below that cutoff score are typically placed into the lower-level course.
Decision zone A range of placement variable values used as an initial set of criteria
for course placement. Students scoring above this range are automatically placed into the reference course. Students scoring below the range are automatically placed into the lower-level course. Students scoring within the range can be counseled or advised to take either course, depending on other academic and nonacademic information.

54
Estimation group The group of students who completed the reference course with a grade or other outcome, such as a W, that can be classified as successful or unsuccessful performance in the course. The relationship between placement variables and course success is estimated from these students' data.
Extrapolation In the context of course placement, extrapolation occurs when the
chance of success is estimated for a placement group student whose score on the placement test is outside the range of scores of students who completed the course (the estimation group). See Chapter 5 for further explanation of extrapolation.
Increase in accuracy rate The difference between the maximum estimated accuracy rate, for
the optimal hypothetical cutoff score, and the estimated baseline accuracy rate. The increase in accuracy rate may be viewed as an estimate of the increase in the percentage of correct placement decisions that would be obtained by using the optimal cutoff score, compared to not using the cutoff score.
Logistic regression A statistical analysis in which one or more variables (e.g., placement
variables) are used to predict the probability of an outcome (e.g., success in the reference course).
Lower-level course The course into which students who score below the cutoff score
would be placed. Usually this is a remedial course, but could also be a standard or higher-level course if the reference course is an advanced course.
Maximum accuracy rate The highest percentage of correct placement decisions that can be
achieved using a given set of placement variables. See optimal cutoff score.
Optimal cutoff score The cutoff score that has the maximum accuracy rate. This score (or
combination of placement variable values) depends on the success criterion, and may not be an acceptable cutoff score in terms of other practical consequences of using the cutoff score, such as the percentage placed into the lower-level course.
Percentage placed in The percentage of students in the placement group who score below lower-level course a hypothetical cutoff score. This is the estimated percentage of
students who would be placed into the lower-level or remedial course if the cutoff score were used.
Placement decision Placing a student into the upper-level or lower-level course, given a
choice between two sequentially-related courses.

55
Placement group The students for whom a placement decision needs to be made. In the CPS report, this group usually consists of all first-time entering students with valid data on the placement variables of interest.
Placement statistics Estimates of the practical consequences of applying a cutoff score to
a specific group of students (placement group): percentage placed into the lower-level course, accuracy rate, and success rate.
Placement variable Any variable that is used to make placement decisions. In the CPS
report, a placement variable is used, either solely or jointly with another placement variable, to predict a student's chance of success in the reference course. A placement variable is also a measure for which a cutoff score or decision zone can be identified for course placement.
Reference course The course for which a CPS report is prepared. The course that
students at or above the cutoff score will take--typically a standard, as opposed to a lower-level or remedial, course.
Regression weight A value within the regression equation used to estimate a student's
probability of success. The regression weight associated with a placement variable represents the amount of change in the log-odds probability of success in the reference course for a 1-point increase in the value of the placement variable.
Success criterion The grade(s) that represent, for the purpose of estimating course
placement group statistics, successful performance in the course. For example, a "B or higher" success criterion means that the course outcome of a student is coded as successful ("1") if s/he received an A or a B grade and unsuccessful ("0") if s/he received a C or lower grade in the reference course. The course placement group statistics may be useful even if the success criterion does not represent local subjective standards of success in the course.
Success rate The estimated percentage of placement group students scoring at or
above the cutoff score who would be successful in the reference course if they took it; the percentage of successful students among those placed into the course.

56

57
APPENDIX Decision Theory During the past three decades, several authors have proposed using decision theory for validating educational selection systems. Two different general approaches are those proposed by Cronbach and Gleser (1965) and by Petersen and Novick (1976). Cronbach and Gleser adapted linear regression methodology to estimate the expected costs and benefits of using a test score or other predictor variable for classifying or selecting personnel. Their technique continues to be widely applied in industrial and organizational settings. Petersen and Novick (1976) developed a "threshold" model based on Bayesian decision theory. The methods used in the CPS are based on the Petersen and Novick threshold model. Their application specifically to course placement is described in recent ACT papers and publications (Sawyer, 1994, 1996). The decision problem can be formally defined as follows: One must select a particular decision d from a set D of possible decisions. A particular outcome θ occurs, from among a set of possible outcomes Θ. A utility function u(d,θ) assigns a value to the desirability of decision d when the outcome is θ. The exact outcome θ that will occur is unknown to the decision maker, but there is probabilistic information available about the likely values of θ. In a Bayesian decision theory model, this information is described by a subjective probability distribution on Θ; the subjective probability distribution quantifies the decision maker's beliefs about the likely values of θ, given both prior beliefs and any relevant data previously collected. The Bayesian optimal strategy is to choose the decision d which maximizes the expected value of u(d,θ) with respect to the subjective probability distribution on Θ (Lindley, 1972). To illustrate, let us first consider the requirement that a placement test accurately identify underprepared students. Suppose that a given cutoff score K on a placement test is being considered, and that: * test scores are obtained for all first-year students at an institution; * students whose test scores are less than K are classified as needing remedial
instruction, and students whose test scores are greater than or equal to K are classified as not needing remedial instruction; and
* the hypothetical performance of students in the standard course, without any prior remedial instruction, can be measured or estimated.
Each student is classified either as being adequately prepared for the standard course (if his or her test score equals or exceeds K), or as needing remedial instruction (if the score is less than K). Because the classification for any student depends on the assumed cutoff score K, the set of "decisions" (D) in this case is the set of possible values of K. The goal is to find the "best" value of K, and to quantify the effectiveness of the associated classifications. (This notion can be extended to multiple predictors). In the identification component of a placement system, the "outcomes" (Θ) for a group of students are their test scores and their performance (without prior remedial instruction) in the standard course. Therefore, for each student, four possible events could occur, as illustrated in Figure 4, Chapter 2. The four possible outcomes are traditionally referred to as true positive, true negative,

58
false positive and false negative. The outcomes "true positive" and "true negative" (events A and C) are preferred because they correspond to correct classifications. The usefulness of the placement test can then be evaluated in terms of the benefits of correct classifications and the losses resulting from incorrect classifications. A function that expresses preferences among different pairs of outcomes and decisions is called a utility function. For this simple model, one possible utility function would be the relative frequency of correct classifications (accuracy rate); according to such a utility, every correct classification results in the same positive benefit, and every incorrect classification results in zero benefit. A more complex utility function would assign different values to each event, and weight their sum: u(K;θ) = wApA(K) + wBpB(K) + wCpC(K) + wDpD(K) (1) where wA,...,wD are positive weights, and pA(K), ... pD(K), are the proportions of students with outcomes A to D. The accuracy rate is obtained by letting wA=wC=1 and wB=wD=0 in Expression (1), so that the utility of using a particular cutoff score, K, is the sum of the proportion of students with outcomes A and C. The accuracy rate is estimated indirectly, as discussed in Chapter 2, by first estimating the relationship between placement variable values and probability of success, and then applying this estimated relationship to students in the placement group. Logistic Regression Although we are ultimately interested in a student's probability of success in the standard course, there are problems with using the probability of success as the dependent variable in an ordinary regression analysis. (Note that chance of success is probability of success times 100.) The probability of success is bounded between 0 and 1, which means that probabilities of success greater than 1 or less than 0 are invalid. If we tried to predict the probability of success directly in an ordinary least-squares regression analysis, we would sometimes obtain estimates greater than 1 or less than 0, which are clearly inappropriate. Another problem is that a variable that is bounded, like the probability of success, tends to have a nonlinear relationship with other variables. Nonlinear relationships are complex and difficult to estimate directly. In logistic regression, we work with a different form of the student's probability of success, called a log odds-ratio (LOR). The log odds-ratio is the natural log of the odds ratio, and the odds-ratio is the probability of a successful outcome divided by the probability of an unsuccessful outcome. If px is the probability of a successful outcome for a student with placement test score X, and 1 - px is the probability of an unsuccessful outcome for the student, then the student's log odds-ratio of success is:
where ln denotes the natural logarithm. The natural logarithm of a number n (denoted ln n) is x if n = ex (e ≅ 2.72). The log odds-ratio is unbounded; as the probability of success approaches 0, the
⎟⎟⎠
⎞⎜⎜⎝
⎛
p - 1
p = LOR
x
xln (2)

59
log odds-ratio approaches negative infinity, and as the probability of success approaches 1 the log odds-ratio approaches positive infinity. If the probability of success is exactly .5, the log odds-ratio is 0. One property of the log odds-ratio is that, because it is unbounded, it has the potential to have a linear relationship with other variables. The logistic regression equation models a student's log odds-ratio of success in the course, LOR, as a linear function of a placement test score, X:
The numbers a and b are the logistic regression weights reported in Table 6 of the CPS report; a is the intercept and b is the regression weight for the placement variable. An additional regression weight would be estimated for a set of two placement variables. The student's probability of success, px, is obtained from the log odds-ratio by the inverse of equation 2:
The regression weight for a placement variable, (i.e., b) has no theoretical upper or lower bound; it can be negative or positive. If there were no relationship between the placement variable and course outcomes, we would expect the weight to be near zero. A positive weight means that the probability of success increases with increasing values of the placement variable. With negative weights the probability of success decreases with increasing values of the placement variable. The statistical significance of the regression weight is related to its magnitude (absolute value) and to the number of students in the group used to estimate it (the estimation group). If there are few students, the regression weight must be large in order to be statistically significant. Most regression weights for COMPASS test scores as the sole placement variable are in the range of .01 to .12. The COMPASS Algebra score regression weight is .06 in the Math 101 example. Most regression weights in this range will be statistically significant with the minimum sample size of 40 that has been established for CPS reports. Regression weights are not comparable across placement variables. Placement variables have different scales, or units, and vary differently among students in the estimation sample. The COMPASS Algebra score scale, for example, is not the same as the scale of high school gpa. The COMPASS Algebra score scale ranges from 15 to 99, while the gpa scale ranges from 0 to 4. A change of one unit on the grade scale, e.g., from 3 to 4 is a much greater change than is a change of one unit on the COMPASS Algebra score scale. A logistic regression weight for a grade average would usually be larger than one for a COMPASS test score. The regression weight is the amount of change in the log odds-ratio of success for a one-unit change in the placement variable. To see what this means, consider the Math 101 CPS report for the COMPASS Algebra score as the sole placement variable and a B or higher criterion of
X*b + a = LOR (3)
e + 1
e = pLOR
LOR
X (4)

60
success. The intercept is -2.9338 and the regression weight for the COMPASS Algebra score is 0.0635 (see Box 4.13). The log-odds of success for COMPASS Algebra scores of 46 and 47 are:
The difference between COMPASS Algebra scores of 46 and 47 is one scale score unit and the difference in their log odds-ratios of success is .06 (LOR43 - LOR44 = .06). A larger log-odds ratio corresponds to a higher probability of success. The probabilities of success corresponding to COMPASS Algebra scores of 46 and 47 are:
The difference in probability of success is .01 (p47 - p46 = .01) for a one-unit change in COMPASS Algebra scores near the 0.5 probability of success. This gives you an idea of what a 0.0635 regression weight means. Table A-1 provides similar information for different regression weights. The table shows the difference in probability of success between two students. If the first student has a .5 probability of success according to the logistic regression model, and the second student's score is one scale score unit higher on the placement variable than the first, a regression weight of 1 means the second student has a .73 probability of success. A regression weight of 0.2 means the second student has a .55 probability of success. These differences shown in Table A-1 apply only when the first student has a .5 probability of success. The relationship between the log odds-ratio and the probability of success is nonlinear. We chose a .5 probability of success for the first student in Table A-1 because it corresponds to the maximum accuracy rate (see Accuracy Rate in Chapter 2) and is in the middle of the probability scale. The change in probability of success for a particular change in log odds-ratio is also largest near the .5 probability of success.
. .0 = )(4.0 + .93- = LOR
and
.- = )(4.0 + .93- = LOR
4
4
576350382
0166350382
7
6
. .51 = e + 1
e = p
and
. = e + 1
e = p
.0
.0
4
.0-
-.0
4
5
5
7
1
1
6 50
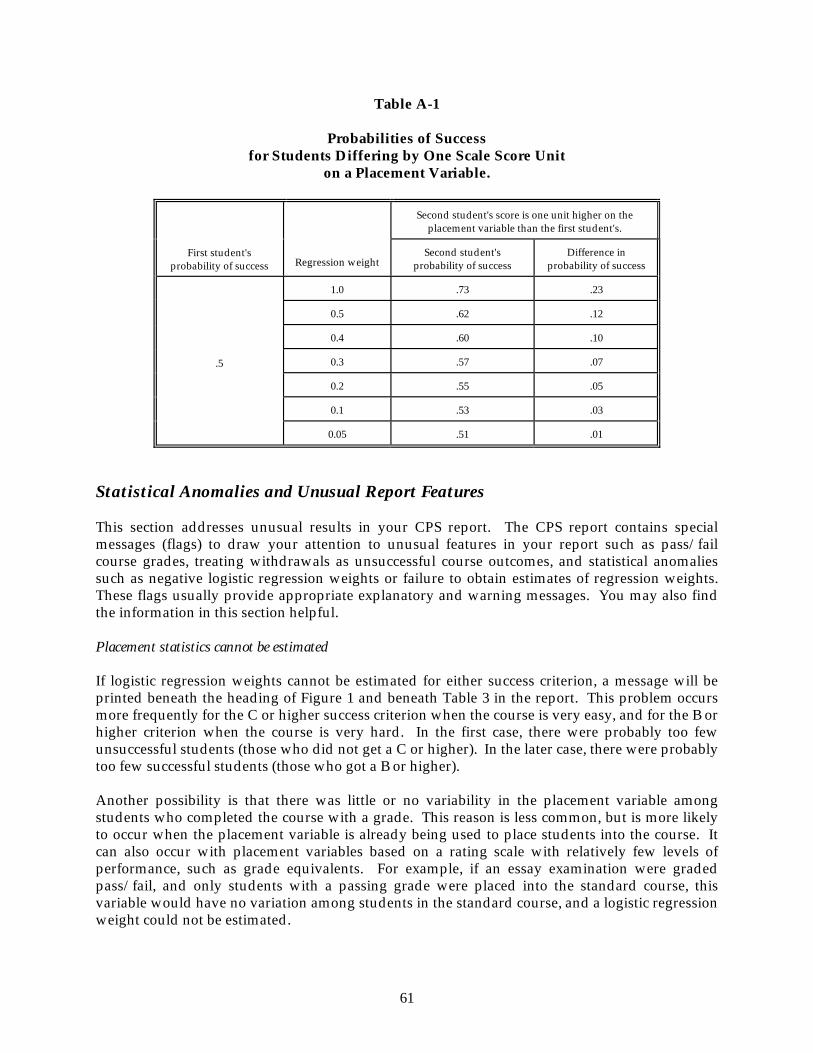
61
Table A-1
Probabilities of Success for Students Differing by One Scale Score Unit
on a Placement Variable.
Second student's score is one unit higher on the placement variable than the first student's.
First student's probability of success
Regression weight
Second student's probability of success
Difference in probability of success
1.0 .73 .23
0.5 .62 .12
0.4 .60 .10
0.3 .57 .07
0.2 .55 .05
0.1 .53 .03
.5
0.05 .51 .01
Statistical Anomalies and Unusual Report Features This section addresses unusual results in your CPS report. The CPS report contains special messages (flags) to draw your attention to unusual features in your report such as pass/fail course grades, treating withdrawals as unsuccessful course outcomes, and statistical anomalies such as negative logistic regression weights or failure to obtain estimates of regression weights. These flags usually provide appropriate explanatory and warning messages. You may also find the information in this section helpful. Placement statistics cannot be estimated If logistic regression weights cannot be estimated for either success criterion, a message will be printed beneath the heading of Figure 1 and beneath Table 3 in the report. This problem occurs more frequently for the C or higher success criterion when the course is very easy, and for the B or higher criterion when the course is very hard. In the first case, there were probably too few unsuccessful students (those who did not get a C or higher). In the later case, there were probably too few successful students (those who got a B or higher). Another possibility is that there was little or no variability in the placement variable among students who completed the course with a grade. This reason is less common, but is more likely to occur when the placement variable is already being used to place students into the course. It can also occur with placement variables based on a rating scale with relatively few levels of performance, such as grade equivalents. For example, if an essay examination were graded pass/fail, and only students with a passing grade were placed into the standard course, this variable would have no variation among students in the standard course, and a logistic regression weight could not be estimated.

62
Logistic Regression weights are not statistically significant A message is printed in your report if the logistic regression weight for any placement variable is not statistically significant at the .10 level. This means the p-value for that weight is greater than .1, and that there is a 10% chance that a regression weight of that magnitude would occur, when in actuality the regression weight is equal to zero. Lack of statistical significance can be associated with a small regression weight small sample size (number of students who completed the course with a grade), or both. If the sample size is large (100 or more) and the regression weight small, there may in fact be no useful relationship between the placement variable and course outcomes. If the sample size is small, there may be a useful relationship between the placement variable and course outcomes, particularly if the regression weight is large, but the results in the report may be unreliable. If you were to submit another set of data for this course, the size of the regression weight, and the apparent utility of a cutoff score based on the placement variable could change substantially. Regression weight is negative A negative regression weight will most often be associated with lack of statistical significance, and/or little variability in the course outcomes or placement variables, among students who completed the course. If so, the relationship between the placement variable and course outcomes is probably not negative for all freshmen cohorts (the freshman class in a given year) at your institution. However, the fact that it is negative in the data at hand means it is probably not sufficiently positive in any set of data to be useful. When negative regression weights occur for a placement variable and success criterion, the corresponding placement statistics are not reported. If the regression weight is negative and statistically significant, the data for the placement variable may have been miscoded, or there may be a legitimate reason why the relationship should be negative. In either case, the variable may be useful for course placement, though you may want to recode the values of the placement variable so that the results conform to the standard interpretation of tables and figures in the CPS report. If the negative relationship doesn't make sense, you may want to verify that the course grades are valid indicators of student's mastery of course content. Withdrawing students are included in the group used to estimate logistic regression weights If you elected to have students who received a W included in the estimation group, a message will be printed in your report to remind you of that choice. In such cases, Ws are coded as unsuccessful outcomes per your specifications. Otherwise, Is and Ws are excluded from the estimation sample. In either case your course placement results may depend to some degree on how you decide to classify these students. Research at ACT has shown that students who receive a W usually score lower on the placement variable than students in the estimation group (Ang and Noble, 1993). This result suggests that in general, W marks should be treated as unsuccessful course outcomes, although results will vary from course to course. In the Math 101 example, students who received a W had lower average COMPASS Algebra scores and local Math scores than students who completed the course. This result suggests that W marks in this course should be treated as unsuccessful outcomes.

63
Course grades are pass/fail For courses graded pass/fail, there is only one possible success criterion. In order to accommodate these courses in the CPS analyses, a passing grade is coded "2" and a failing grade is coded "0," which associates the pass/fail outcome with the "C or higher" success criterion. There will be no variability in course outcomes for the B or higher success criterion, causing the report to generate the message (described above) that placement statistics cannot be estimated for a success criterion. For pass/fail courses, these messages for the B or higher success criterion should be ignored. Other consequences of pass/fail grading are: mean course grade information in Table 1 should not be interpreted with reference to the standard 0 to 4 numeric scale. Students who took remedial and standard courses concurrently Students identified as completing the standard course with a grade, and as taking developmental instruction in a related subject at the same time, are omitted from the estimation group. In other words, these students are not included among the students described in Section A as having completed the course with a grade, and are not used to estimate the logistic regression weights reported in the appendix of the report. It is reasonable to assume that the grades these students received in the standard course would be affected by concurrent developmental instruction. The placement statistics, such as the accuracy rate and success rate, are interpreted with the assumption that students take the standard course without prior or concurrent remediation. Inclusion of these students in your analyses will likely depress the statistical relationship between placement variables and course outcomes, and thus yield misleading placement statistics and probabilities of success.

64

65
REFERENCES Ang. C.H. & Noble, J.P. (1993a). The effects of alternative interpretations of incomplete and withdrawal grades on course placement validity indices. (ACT Research Report Series 93-3). Iowa City, Iowa: American College Testing. Ang, C.H. & Noble, J.P. (1993b). Incremental Validity of ACT Assessment Scores and High School Course Information for Freshman Course Placement. (ACT Research Report Series 93-5). Iowa City, Iowa: American College Testing. American College Testing (2000). COMPASS Reference Manual. Iowa City, Iowa: Author. Colleges and Universities offering remedial instructions and tutoring. (1994, April 13). Education Week, XIII, No. 29, p.6. Cronbach, L.J., & Gleser, G.C. (1965). Psychological tests and personnel decisions. Urbana, Illinois: University of Illinois Press. Crouse, J. (1993, April). Diagnosing influential observations in estimating logistic regression functions. Paper presented at the annual meeting of the American Educational Research Association, Atlanta. Houston, W.M. (1993, April). Accuracy of validity indices for course placement systems. Paper presented at the annual meeting of the American Educational Research Association, Atlanta. Lindley, D.V. (1972).Bayesian statistics: A review. (Regional Conferences Series in Applied Mathematics.) Philadelphia: Society for Industrial and Applied Mathematics. McNabb, T. (1990). Course placement practices of American postsecondary institutions. (ACT Research Report Series 90-10). Iowa City, Iowa: American College Testing. Petersen, N.S & Novick, M.R. (1976). An evaluation of some models for culture-fair selection. Journal of Educational Measurement, 13(2), 3-29. Sawyer, R.L. (1994, April). Eliciting utility functions for validating course placement systems. Paper presented at the annual meeting of the National Council for Measurement in Education, New Orleans. Sawyer, R. L. (1996). Decision theory models for validating course placement tests. Journal of Educational Measurement, 33, 271-290. Schulz, E.M. (1993, April). Statistics for cross-validation logistic regression models for course placement. Paper presented at the annual meeting of the American Educational Research Association, Atlanta. Schiel, J., & King, J. (1999). Accuracy of course placement validity statistics under various soft truncation conditions. (ACT Research Report No. 99-2). Iowa City, IA: ACT.

66
Schiel, J., & Harmston, M. (2000). Validating two-stage course placement systems when data are truncated. (ACT Research Report No. 2000-3). Iowa City, IA: ACT. U.S. Department of Education, National Center for Education Statistics. Remedial Education at Degree-Granting Postsecondary Institutions in Fall 2000, NCES 2004-010. Washington, DC: 2003. ACT endorses the Code of Fair Testing Practices in Education, a statement of the obligations to test takers of those who develop, administer, and use educational tests and test data. The Code sets forth criteria for fairness in four areas: developing and selecting appropriate tests, interpreting test scores, striving for fairness, and informing test takers. ACT is committed to ensuring that each of its testing programs upholds the Code's standards for appropriate test development practice and use. A copy of the full Code may be obtained free of charge from ACT Publications, P.O. Box 168, Iowa City, Iowa 52243, 319/337-1429. © 2004 by the ACT, Inc.. All rights reserved.


© 2008 ACT, Inc. All rights reserved. 11929 *0170CP090*
ACT Offices
Postsecondary Services—Assessment Programs
National Headquarters500 ACT DriveP.O. Box 168
Iowa City, Iowa 52243-0168Telephone: 319/337-1000
Washington, DC OfficeOne Dupont Circle NW, Suite 340
Washington, DC 20036-1170Telephone: 202/223-2318
Hunt Valley OfficeExecutive Plaza I, Suite 200
11350 McCormick RoadHunt Valley, Maryland 21031-1002
Telephone: 410/584-8000
National Center for Educational Accountability
4030-2 West Braker LaneAustin, Texas 78759-5329Telephone: 512/320-1800
WEST REGION
Denver Office3131 South Vaughn Way, Suite 218
Aurora, Colorado 80014-3507Telephone: 303/337-3273
Sacramento Office2880 Sunrise Boulevard, Suite 214
Rancho Cordova, California 95742-6549Telephone: 916/631-9200
MIDWEST REGION
Chicago Office300 Knightsbridge Parkway, Suite 300
Lincolnshire, Illinois 60069-9498Telephone: 847/634-2560
Ohio Office700 Taylor Road, Suite 210Gahanna, Ohio 43230-3318Telephone: 614/470-9828
Michigan Office1001 Centennial Way, Suite 400Lansing, Michigan 48917-8249
Telephone: 517/327-5919
SOUTHWEST REGION
Austin Office8303 MoPac Expressway N, Suite A-110
Austin, Texas 78759-8369Telephone: 512/345-1949
EAST REGION
Albany Office4 Pine West Plaza, Suite 403Albany, New York 12205-5564
Telephone: 518/869-7378
Atlanta Office3355 Lenox Road NE, Suite 320
Atlanta, Georgia 30326-1332Telephone: 404/231-1952
Florida Office1315 East Lafayette Street, Suite A
Tallahassee, Florida 32301-4757Telephone: 850/878-2729
Field Offices
Olathe Office1365 North Winchester StreetOlathe, Kansas 66061-5880Telephone: 913/768-1696