Embed Size (px)
Citation preview
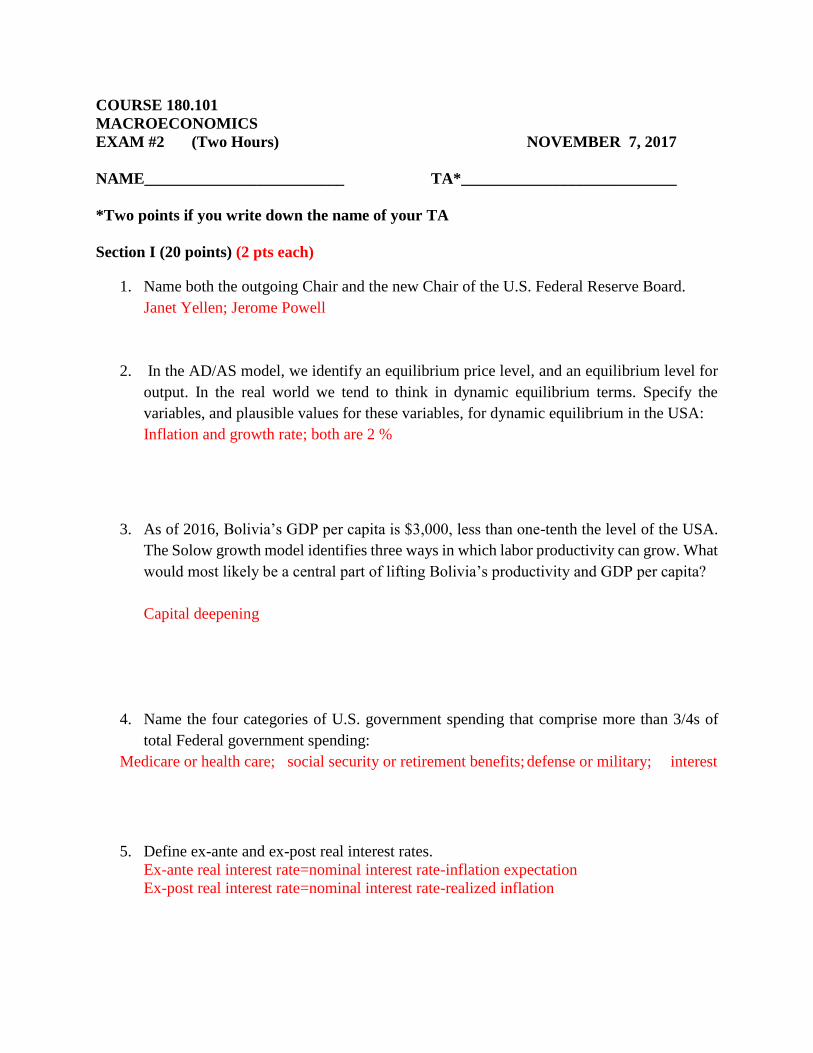
COURSE 180.101
MACROECONOMICS
EXAM #2 (Two Hours) NOVEMBER 7, 2017
NAME_________________________ TA*___________________________
*Two points if you write down the name of your TA
Section I (20 points) (2 pts each)
1. Name both the outgoing Chair and the new Chair of the U.S. Federal Reserve Board.
Janet Yellen; Jerome Powell
2. In the AD/AS model, we identify an equilibrium price level, and an equilibrium level for
output. In the real world we tend to think in dynamic equilibrium terms. Specify the
variables, and plausible values for these variables, for dynamic equilibrium in the USA:
Inflation and growth rate; both are 2 %
3. As of 2016, Bolivia’s GDP per capita is $3,000, less than one-tenth the level of the USA.
The Solow growth model identifies three ways in which labor productivity can grow. What
would most likely be a central part of lifting Bolivia’s productivity and GDP per capita?
Capital deepening
4. Name the four categories of U.S. government spending that comprise more than 3/4s of
total Federal government spending:
Medicare or health care; social security or retirement benefits; defense or military; interest
5. Define ex-ante and ex-post real interest rates.
Ex-ante real interest rate=nominal interest rate-inflation expectation
Ex-post real interest rate=nominal interest rate-realized inflation

6. Briefly explain the Laffer curve.
Relationship between tax revenue and tax rate (1 point)
At very high tax rates, if you raise taxes revenue levels fall as people choose to work less
(1 point)
7. For over 200 years, what phenomenon has prevented the outcome predicted by Malthus in
1798?
Technology OR PRODUCTIVITY
8. In our loanable funds model, why does the corporate demand curve slope downward?
Corporate sector finds fewer projects are PROFITABLE when they must pay higher interest
for funds
9. In the AD/AS model, a jump in oil prices shifts which curve, and in what direction?
SRAS to the left
10. Fred makes $125 thousand per year. Sally makes $125 million per year. Given current
social security tax law:
a. Fred pays $7,347 and Sally pays $7,347,000 in social security taxes.
b. Fred pays $7,347 and Sally pays $734,700 in social security taxes.
c. Fred pays $7,347 and Sally pays $73,470 in social security taxes.
d. Fred pays $7,347 and Sally pays $7,347 in social security taxes.
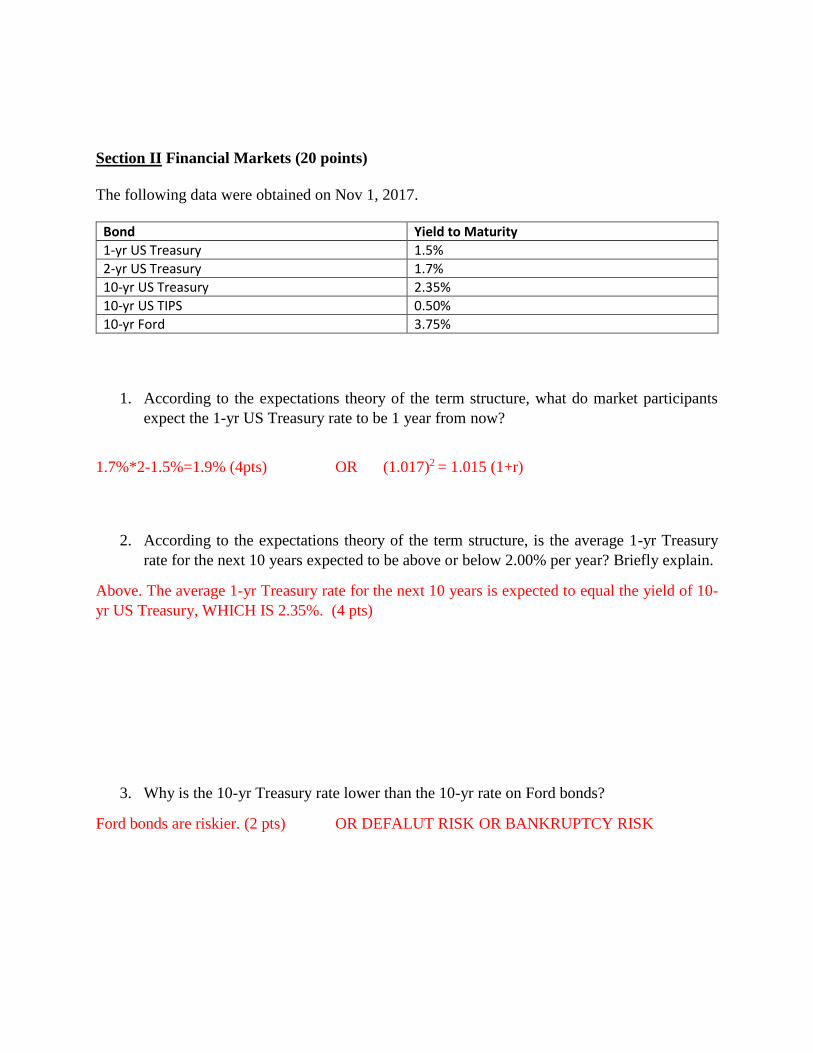
Section II Financial Markets (20 points)
The following data were obtained on Nov 1, 2017.
Bond Yield to Maturity
1-yr US Treasury 1.5%
2-yr US Treasury 1.7%
10-yr US Treasury 2.35%
10-yr US TIPS 0.50%
10-yr Ford 3.75%
1. According to the expectations theory of the term structure, what do market participants
expect the 1-yr US Treasury rate to be 1 year from now?
1.7%*2-1.5%=1.9% (4pts) OR (1.017)2 = 1.015 (1+r)
2. According to the expectations theory of the term structure, is the average 1-yr Treasury
rate for the next 10 years expected to be above or below 2.00% per year? Briefly explain.
Above. The average 1-yr Treasury rate for the next 10 years is expected to equal the yield of 10-
yr US Treasury, WHICH IS 2.35%. (4 pts)
3. Why is the 10-yr Treasury rate lower than the 10-yr rate on Ford bonds?
Ford bonds are riskier. (2 pts) OR DEFALUT RISK OR BANKRUPTCY RISK

4. Ford currently must pay 140 basis points more per year than the U.S. treasury, if it chooses
to borrow money for 10-years. Ford announces it has developed a new battery that will
propel its cars 1,000 miles on one charge. Choose the most likely new value for the spread
between the Ford bond and the 10-year treasury? (2 pts)
(i) 180 basis points (ii) 100 basis points (iii) -20 basis points
5. If you expect inflation to average 3.00% per year over the next 10 years, would you prefer
to hold 10-yr TIPS or Treasuries? Briefly explain.
Hold 10-yr TIPS. The nominal yield from 10-yr TIPS is 0.5%+3%=3.5%>2.35%, nominal
yield from 10-yr Treasuries. (4 pts)
6. The bankruptcy of Lehman Brothers, one of the largest investment banks in the US, in
September 2008 was one of the most dramatic events of the financial crisis. What do you
expect happened to corporate bond yields in the months after the failure of Lehman? And
to government bond yields?
Increase; decrease (2 pts)
7. The expectations theory of the term structure is incomplete – after accounting for the
expected path of interest rates, the 10-yr Treasury rate is usually higher than the 1-yr
Treasury rate. What is the main explanation for that? (2 points)
The residual is due to risk premium,
OR TERM PREMIUM

Section III Phillips Curve (20 points)
1. Write down the Phillips Curve equation. (2 pts)
EQUATION: πt = πe + α(U*-U)
(2 points for correct, zero points for wrong)
2. What is the mandate of the Federal Reserve? What is the mandate of the European Central
Bank? (2 pts)
Fed: target low inflation and low unemployment (1 point)
ECB: target low inflation (1 point)
3. Suppose the economy is characterized by having 𝛼 = 0.2, 𝑈∗ = 5%, and 𝜋𝑒 = 2%, and
the economy is currently in a recession with the unemployment rate at 𝑈𝑡 = 8%. What is
the implied inflation rate 𝜋𝑡? (2 pts)
πt = πe + α(U*-U) πt = 2% + .2(5%-8%) = 1.4%
(2 points for correct, zero points for wrong)
4. Based on current 𝜋𝑡 and 𝑈𝑡 rank the likely response of the ECB and Fed: (2 pts)
ECB response: (1 point)
Strongly Tighten, Moderately Tighten, Moderately Loosen, Strongly Loosen (circle one)
Fed response: (1 point)
Strongly Tighten, Moderately Tighten, Moderately Loosen, Strongly Loosen (circle one)

The nation of Balonia, in the early 1980s, experiences a long recession. At the start of the recession,
1979, inflation is very high. The Table below provides details for the performance of
unemployment in Balonia over the four years of recession.
Assume the Phillips curve perfectly predicts inflation each year. Assume further that expected
inflation in year t equals actual inflation in year t-1
Calculate the path for inflation, 1980 through 1983, and fill in the blanks in the table below: (4 pts)
Table πe Natural rate Phillips curve forecast
12.5% 6% 10.5% 10.5% 6% 7.5% 7.5% 6% 4.5% 4.5% 6% 2.5%
(Column 1: 0.25 each; Column 2: 0.25 each; Column 3: 0.5 each)
Balonia has two more recessions. Again, assume that the Phillips curve perfectly predicts inflation
each year. The tables below depict the performances for unemployment and inflation.
BALONIA
(assume U* = 6%) (assume α = ???) 1988: π = 5.5%
expected unemployment natural rate Phillips curve
inflation rate of unemployment inflation forecast
1989 5.5% 8.0% 6.0% 5.1%
1990 5.1% 9.0% 6.0% 4.5%
1991 4.5% 9.0% 6.0% 3.9%
1992 3.9% 8.0% 6.0% 3.5%
BALONIA
(assume U* = 6%) (assume α = ???) 2007: π = 3.5%
expected unemployment natural rate Phillips curve
inflation rate of unemployment inflation forecast
2008 3.5% 8.0% 6.0% 3.3%
2009 3.3% 9.0% 6.0% 3.0%
2010 3.0% 9.0% 6.0% 2.7%
2011 2.7% 8.0% 6.0% 2.5%

5. By how much did the inflation rate change, in each of the three recessions from the first
year of the recession (1980, 1989 or 2008) to the last year provided in the tables (1983,
1992 or 2011)? (2 pts)
1980: 2.5%-10.5% = -8 percentage points OR (2.5-10.5)/10.5% = -76%
1989 3.5%-5.1%= -1.6 percentage points OR (3.5-5.1)/5.1 = -31%
2008 2.5%-3.3%= -0.8 percentage points OR (2.5-3.3)/3.3 = -24%
(0.5 for each; full points no matter positive or negative)
6. Did the different pace for inflation’s decline reflect a different output gap? (2 pts)
(Explain briefly)
NO (1 point)
the gap between U and U* was the same in all three cases (1 point)
7. What are the two values for α that would result in the declines for inflation presented in the
two tables provided above? (2 pts)
5.1=5.5+ α (6-8) => α = 0.2 (1 point)
3.3=3.5+ α (6-8) => α = 0.1 (1 point)
8. What might explain the different pace of inflation’s decline that led to the different values
you computed for α? (Hint, think of the second way we use the phrase ZERO
BOUND). (2pts)
Wage gains can slow much more easily than wage levels can fall
In practice this means we rarely get deflation
Thus a large output gap, if it starts from a low inflation rate produces little additional
decline
(I will give full points if students mention de facto “zero lower bound on inflation,” “it is
hard for wages to go down,” “it is hard to have deflation;” however, if they mention “sticky wages,”
which is relevant but not fully correct, I will give 1 point.)
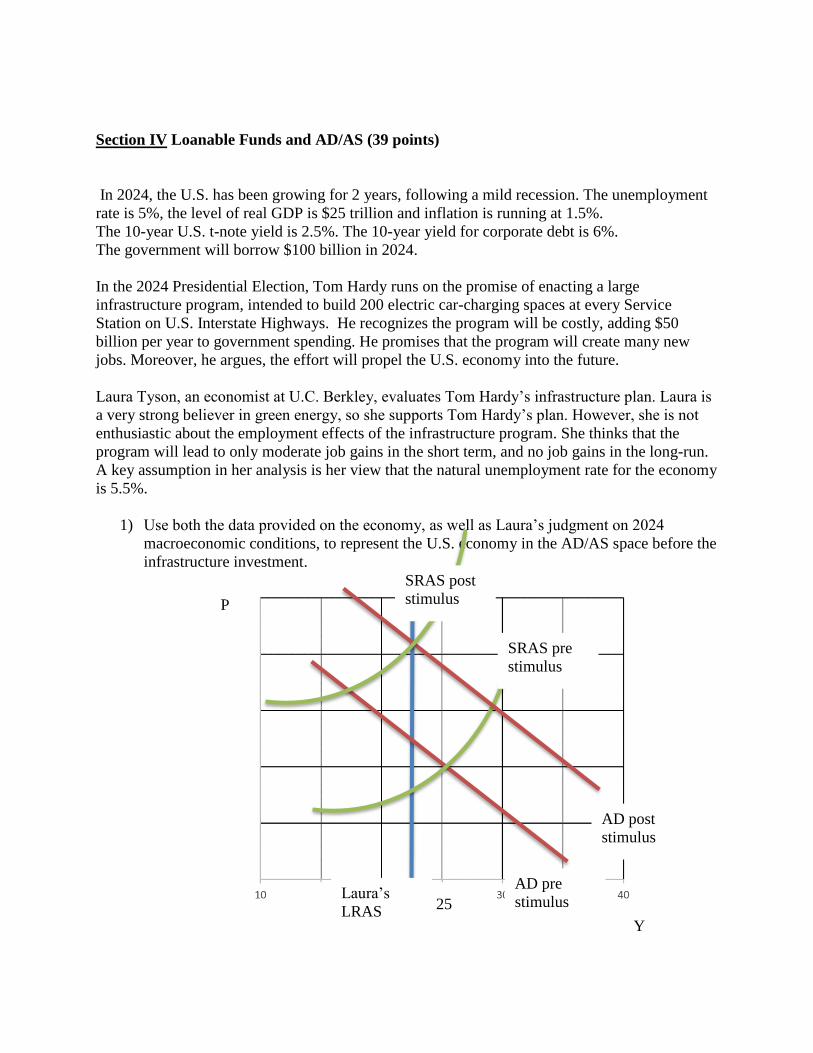
Section IV Loanable Funds and AD/AS (39 points)
In 2024, the U.S. has been growing for 2 years, following a mild recession. The unemployment
rate is 5%, the level of real GDP is $25 trillion and inflation is running at 1.5%.
The 10-year U.S. t-note yield is 2.5%. The 10-year yield for corporate debt is 6%.
The government will borrow $100 billion in 2024.
In the 2024 Presidential Election, Tom Hardy runs on the promise of enacting a large
infrastructure program, intended to build 200 electric car-charging spaces at every Service
Station on U.S. Interstate Highways. He recognizes the program will be costly, adding $50
billion per year to government spending. He promises that the program will create many new
jobs. Moreover, he argues, the effort will propel the U.S. economy into the future.
Laura Tyson, an economist at U.C. Berkley, evaluates Tom Hardy’s infrastructure plan. Laura is
a very strong believer in green energy, so she supports Tom Hardy’s plan. However, she is not
enthusiastic about the employment effects of the infrastructure program. She thinks that the
program will lead to only moderate job gains in the short term, and no job gains in the long-run.
A key assumption in her analysis is her view that the natural unemployment rate for the economy
is 5.5%.
1) Use both the data provided on the economy, as well as Laura’s judgment on 2024
macroeconomic conditions, to represent the U.S. economy in the AD/AS space before the
infrastructure investment.
Laura’s
LRAS
AD pre
stimulus
AD post
stimulus
SRAS post
stimulus
Y
P
25
SRAS pre
stimulus

To receive full credit, answers should be properly labeled; show that output is equal to 25
trillion prior to the stimulus and Laura’s view is that potential output is below 25 trillion.
2) Now use the chart you made above to show how the infrastructure program would affect
the economy. Draw the graph to support Laura’s view on job creation both in the short
and long-run.
The stimulus program shifts AD to the right, generating temporarily higher output and
employment. Laura thinks the economy was operating over capacity even before the
infrastructure program. With the program, the economy is seriously over-heating. Wages
rise which shift the LRAS curve to the left, to bring back output to its long-run level
(where the unemployment rate is 5.5%, Laura’s view on the natural rate of
unemployment). To receive full credit, answers should be properly labeled, and show that
in the long-run, SRAS=LRAS=AD.
3) Larry Ball, an economist at the Johns Hopkins University, also evaluates Tom Hardy’s
infrastructure plan. Larry is also a very strong believer in green energy, so he also
supports Tom Hardy’s plan. Different from Laura, he thinks that the infrastructure
program can lead to large and permanent job gains. He believes that the economy is
currently operating below capacity – specifically, he thinks the natural rate of
unemployment is 2.5%.

In the quadrant below, use Larry’s view on 2024 macroeconomic conditions to represent
the U.S. economy in the AD/AS space before the infrastructure investment.
To receive full credit, answers should be properly labeled; show that output is equal to 25
trillion prior to the stimulus, and Larry’s view is that potential output is above 25 trillion.
4) Now use the chart you made to show how the infrastructure program would affect the
economy, according to Larry.
According to Larry, the economy is currently operating under-capacity. The stimulus
program works to heal the economy and bring back output to its long-run equilibrium
(where the unemployment rate equals the natural rate of unemployment). The job gains
are permanent. To receive full credit, answers should be properly labeled, and show that
in the long-run, SRAS=LRAS=AD.
Larry’s
LRAS
AD pre
stimulus
AD post
stimulus
SRAS
Y
P
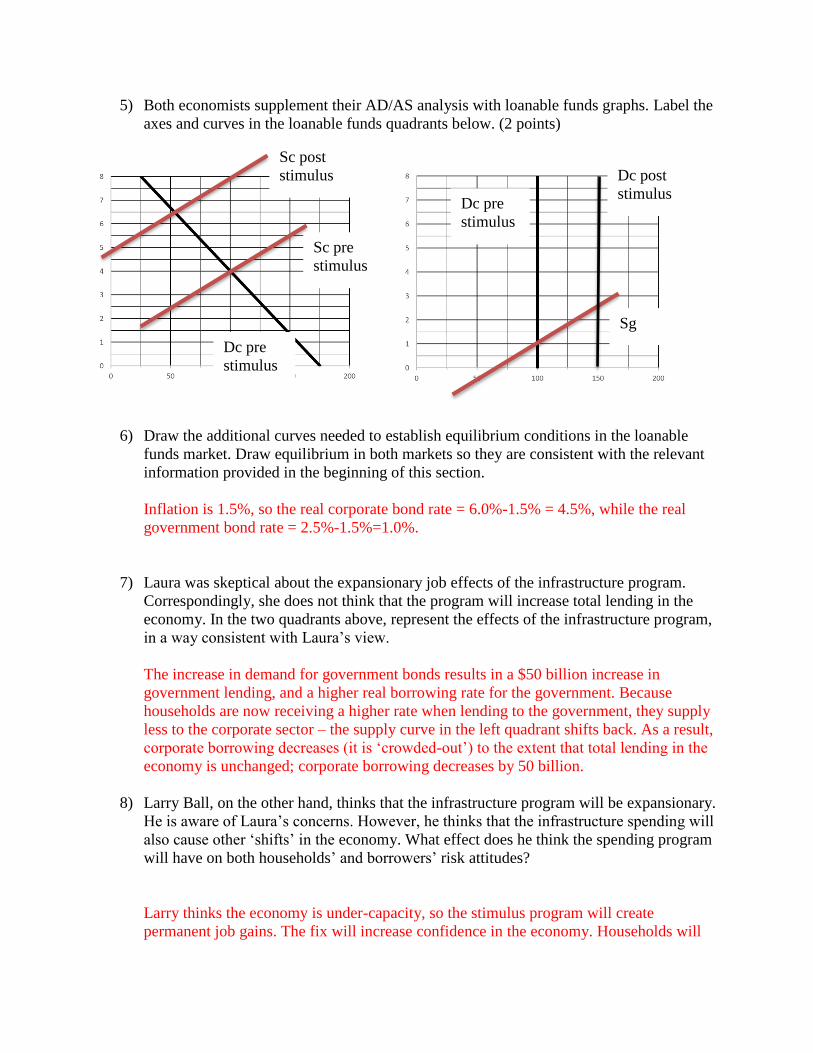
5) Both economists supplement their AD/AS analysis with loanable funds graphs. Label the
axes and curves in the loanable funds quadrants below. (2 points)
6) Draw the additional curves needed to establish equilibrium conditions in the loanable
funds market. Draw equilibrium in both markets so they are consistent with the relevant
information provided in the beginning of this section.
Inflation is 1.5%, so the real corporate bond rate = 6.0%-1.5% = 4.5%, while the real
government bond rate = 2.5%-1.5%=1.0%.
7) Laura was skeptical about the expansionary job effects of the infrastructure program.
Correspondingly, she does not think that the program will increase total lending in the
economy. In the two quadrants above, represent the effects of the infrastructure program,
in a way consistent with Laura’s view.
The increase in demand for government bonds results in a $50 billion increase in
government lending, and a higher real borrowing rate for the government. Because
households are now receiving a higher rate when lending to the government, they supply
less to the corporate sector – the supply curve in the left quadrant shifts back. As a result,
corporate borrowing decreases (it is ‘crowded-out’) to the extent that total lending in the
economy is unchanged; corporate borrowing decreases by 50 billion.
8) Larry Ball, on the other hand, thinks that the infrastructure program will be expansionary.
He is aware of Laura’s concerns. However, he thinks that the infrastructure spending will
also cause other ‘shifts’ in the economy. What effect does he think the spending program
will have on both households’ and borrowers’ risk attitudes?
Larry thinks the economy is under-capacity, so the stimulus program will create
permanent job gains. The fix will increase confidence in the economy. Households will
Sg
Sc pre
stimulus
Dc pre
stimulus
Dc pre
stimulus
Dc post
stimulus
Sc post
stimulus

be willing to lend more to risky companies, (the supply curve in the left quadrant will
shift to the right) and demand for funds from corporations will also increase (the demand
curve in the left quadrant will shift to the right). Overall, loans to the private sector
increase.
9) In the graphs below, draw the effect of the infrastructure program on the government and
corporate debt markets, in a way consistent with Larry’s view.
10) Tom Hardy is not sure if Laura or Larry is right. He recognizes that their analysis has
different predictions for the supply of credit in the corporate loan market. He thinks to
himself "If I announce a large spending program, and ____________________ falls, then
I will know Larry is right." Fill in the blank.
The equilibrium spread (government bond yield – corporate bond yield) should now be
lower, reflecting higher risk tolerance in the financial sector.
Answers that only discussed lower corporate bond yields, but provided enough
explanation, received full credit. To receive full credit, the answers needed to be clear
that the spread would be lower, or that corporate bond rates would be lower. Answers
like “the interest rate would be lower” received only partial credit because they did not
specify whether “the interest rate” referred to the firms or the government.
More explaining: If corporate bond rates fall upon announcement, that will mean that
financial markets interpret that the boost in confidence will lower borrowing rates – a sign
that Larry is right, and that Laura’s concerns of crowding-out concerns are exaggerated
(otherwise corporate bond rates would have risen).
Sg
Sc pre
stimulus
Dc pre
stimulus
Dc pre
stimulus
Dc post
stimulus
Sc post
stimulus
Dc post
stimulus