Embed Size (px)
Citation preview
1
COURSE 180.101
MACROECONOMICS
EXAM #2 (Two Hours) NOVEMBER 7th, 2017
NAME_________________________ TA*___________________________
*Two extra points if you remember to write down the name of your TA
Section I: Multiple Choice (20 points)
1. Social Security + Health Care Costs + Defense + Interest Payments make up roughly what
percent of U.S. Federal Spending?
a. 10% b. 40% c. 60% d. 80% e. 90%
2. William Nordhaus received the Nobel Prize for his work creating the DICE model, a framework
designed to evaluate the benefits and costs of what?
a. Cutting income taxes b. reducing C02 emissions c. targeting M1 d. targeting the $/Yen
3. What was the month-to-month rise for U.S. non-farm payrolls, for October 2018?
a. 1 million b. 100 thousand c. 2.5 million d. 250,000
4. What was the U.S. unemployment rate in October of 2018?
a. 1.6% b. 2.4% c. 3.1% d. 3.7% e. 4.5% f. 5.3%
5. What was the average annual gain for U.S. labor productivity, 1955-2005?
a.1% b. 2% c. 3% d. 4% e. 5%
6. China’s economy began to boom in the 1990s, when what leader embraced the use of free
markets?
a. Chiang Kai-Shek b. Mao Zedong c. Deng Xiaoping d. Xi Jinping
7. What invention might devastate the finances of Saudi Arabia, Iran, and Russia?
a. portable MRI b. super powerful battery c. high protein corn strain d. 4D TV
8. Which European Nation passed a budget that put it at odds with the European Commission?
a. Spain b. Italy c. France d. Belgium
9. One type of positive supply shock results from a surge in?
a. labor costs b. labor productivity c. oil prices d. the budget deficit
10. Who is the current Chair of the U.S. Federal Reserve?
a. Jerome Powell b. Janet Yellen c. Steve Mnuchin d. Jon Faust e. Paul Romer
2
Section II (16 points)
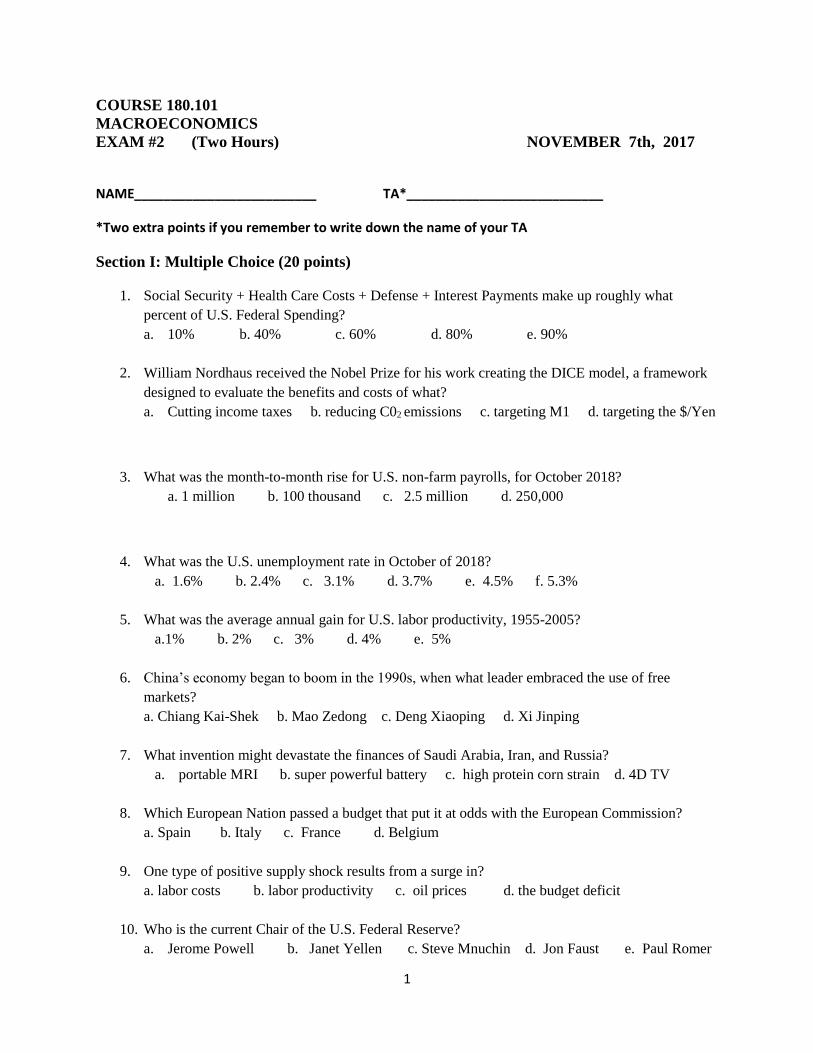
Joey, in early 2018, intends to save $100 for two years. He investigates lending to the
U.S. government versus lending to different U.S. corporations. He thinks inflation will
average 2% over the next several years. Joey looks at a Bloomberg screen that provides
information about the characteristics of the following U.S. Treasury securities:
U.S. T-note, issue date 1/05/18, repayment date 1/05/19, price $100 yield 2.0%
U.S. T-note, issue date 1/05/18, repayment date 1/05/20, price $100 yield 2.5%
A) What does Joey believe the ex-ante real yield is on the 2-year note?
B) Suppose inflation averages 3% over the next two years. What was the ex-post real
yield on the 2-year note?
C) What do market participants, on average, expect the 1-year yield will be in 2019?
(Ignore term premia considerations)
D) If inflation turned out to be 4% in 2018, would you expect that the government would
have to offer a higher or lower interest rate to borrow money for 1-year, in 2019? And
if Joey bought the 2-year note, at a price of 100, and went to sell it in 2019 would the
payment he collected likely be higher or lower that 100? Briefly explain:
3
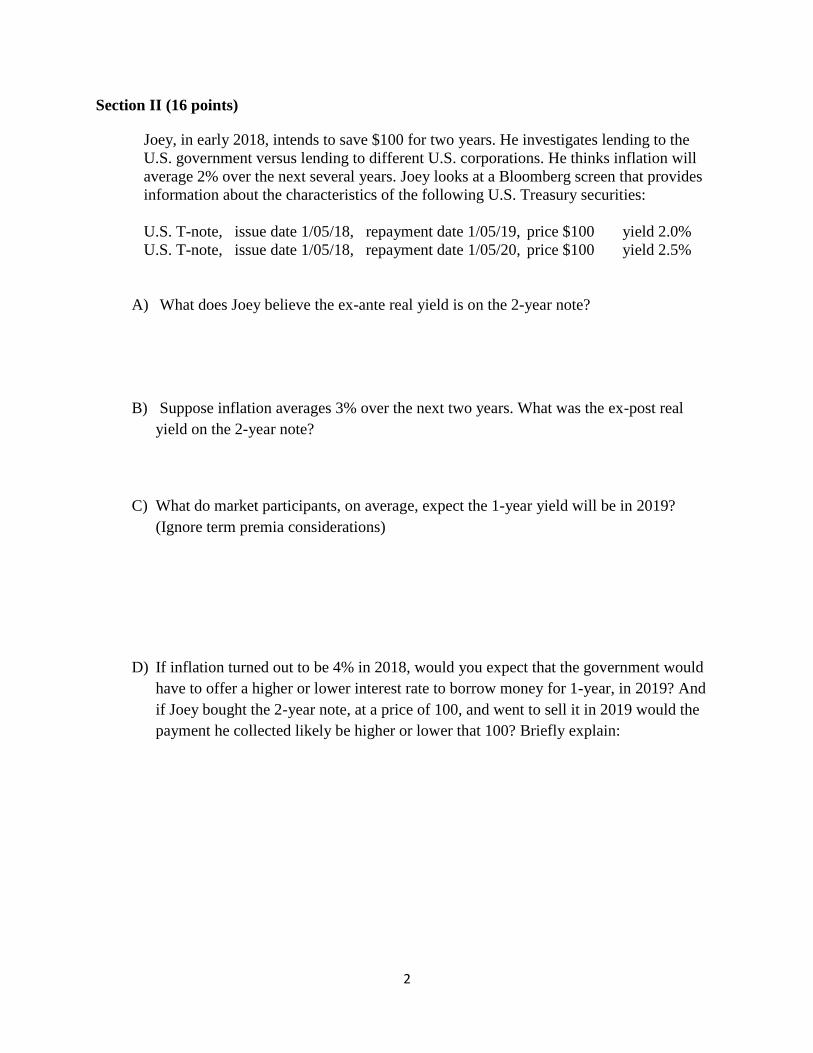
E) Joey now looks at a Bloomberg screen that provides information about the
characteristics of a number of corporate bonds:
MSFT note, issue date 1/05/18, repayment date 1/05/20, price $100 yield 3.5%
SnorX note, issue date 1/05/18, repayment date 1/05/20, price $100 yield 6.5%
i) Explain why SnorX must pay a higher rate than Microsoft (MSFT) to borrow for
2 years, and why both Snorx and Microsoft pay more than the government to
borrow money over the same period.
ii) Suppose that the trade war between China, Europe and the USA intensifies.
Suppose further that this looks likely to badly hurt economies around the globe.
a) The price of the 2-year t-note likely (circle one answer)
Goes up Goes down
b) The price of the 2-year Microsoft note likely (circle one answer)
Goes up Goes down Goes down a lot
c) The price of the 2-year SnoreX note likely (circle one answer)
Goes up Goes down Goes down a lot
4
Section III (20 points)
1. The nation of Brumba has 10% unemployment, 1% inflation and it is growing at a rate that has
kept these conditions in place for several years. The government authorizes a very large
infrastructure program.
a. What is likely to happen to the government’s budget deficit? Explain briefly
b. What is likely to happen to real GDP growth? Explain briefly
c. What is likely to happen to unemployment? Explain briefly
d. What is likely to happen to inflation? Explain briefly
e. What is likely to happen to the yield on 10-year government TIPS bonds? Briefly explain
5
f. What is likely to happen to the yield on the 10-year government bond? Use your
responses to d, e, and the Fisher equation to briefly explain your answer.
2. Briefly explain the Malthusian dilemma, and explain why developed world economies have
avoided the dire outcome defined by the dilemma.
3. Some suggest Schumpeter’s notion of creative destruction can be labeled the price of progress.
a. Briefly explain the notion that creative destruction is the price of progress
b. When Lehman Brothers went bankrupt, in 2008, some enthusiasts of Schumpeter’s
theories objected to any government intervention efforts to limit economic decline.
Keynes would have disagreed. Briefly explain.
4. Real GDP growth averaged around 3.3%, 1955 to 2005. Today, forecasters fear it may only grow
at 2% per year. What were the numerical values for the components of 3.3% historical growth,
and why do forecasters look for only 2% growth going forward?
6
5. Paul Romer is optimistic about a rebound for economic growth. Romer believes that the key to
strong growth is what?
6. Romer argues that non-rivalry is a concept that must be understood when thinking about the
key driver for long term real growth. Briefly explain
7. Romer’s focus on non-rivalry issues leads him to argue for what government polices to support
strong growth in the future?
8. Over the 1995 to 2005 period, alongside the average 3.3% real GDP growth, the average real
borrowing rate for the U.S. treasury equaled roughly
a. 1.0% b. 2.6% c. 3.3% d. 4.0% e. 5.3%
9. The average annual growth rate for real GDP, 2010 through 2017, was 2.1%. Late in 2017, a
large fiscal stimulus was enacted. Over the four quarters ending in Q3:2018, real GDP growth
averaged roughly
a. 1.5% b. 2.0% c. 2.5% d. 3.0%
10. Annual growth for labor productivity averaged 1.3% over the 2010-2017 period. As noted above,
in late 2017, a large stimulus was enacted. Productivity growth over the past four quarters—
Q3:17 through Q3:18—has averaged,
a. 0.7% b. 1.3% c. 2.1% d. 2.6%
7
11. Those who champion markets free of government intervention correctly point out that, much of
the time, the invisible hand directs business decision makers to produce in accordance with the
wants of the populace. What is the essential signal that comes from free markets, and delivers
this positive set of outcomes?
12. Markets don’t always succeed in delivering the best outcomes.
a. Very briefly define a pure public good.
b. How does the free rider problem issue arise, when societies consider how to provide
pure public goods?
c. What about externalities? Explain how climate change, if it is real, is a classic market
externality.
8
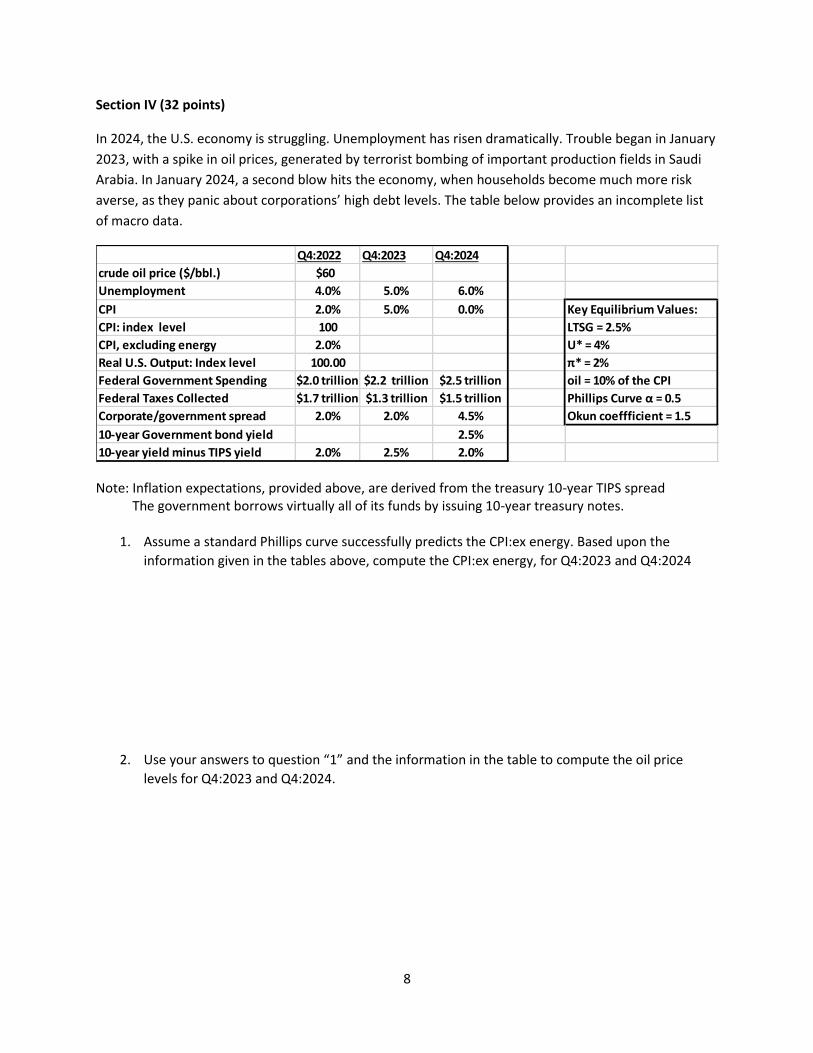
Section IV (32 points)
In 2024, the U.S. economy is struggling. Unemployment has risen dramatically. Trouble began in January
2023, with a spike in oil prices, generated by terrorist bombing of important production fields in Saudi
Arabia. In January 2024, a second blow hits the economy, when households become much more risk
averse, as they panic about corporations’ high debt levels. The table below provides an incomplete list
of macro data.
Note: Inflation expectations, provided above, are derived from the treasury 10-year TIPS spread The government borrows virtually all of its funds by issuing 10-year treasury notes.
1. Assume a standard Phillips curve successfully predicts the CPI:ex energy. Based upon the
information given in the tables above, compute the CPI:ex energy, for Q4:2023 and Q4:2024
2. Use your answers to question “1” and the information in the table to compute the oil price
levels for Q4:2023 and Q4:2024.
Q4:2022 Q4:2023 Q4:2024
crude oil price ($/bbl.) $60
Unemployment 4.0% 5.0% 6.0%
CPI 2.0% 5.0% 0.0% Key Equilibrium Values:
CPI: index level 100 LTSG = 2.5%
CPI, excluding energy 2.0% U* = 4%
Real U.S. Output: Index level 100.00 π* = 2%
Federal Government Spending $2.0 trillion $2.2 trillion $2.5 trillion oil = 10% of the CPI
Federal Taxes Collected $1.7 trillion $1.3 trillion $1.5 trillion Phillips Curve α = 0.5
Corporate/government spread 2.0% 2.0% 4.5% Okun coeffficient = 1.5
10-year Government bond yield 2.5%
10-year yield minus TIPS yield 2.0% 2.5% 2.0%
9
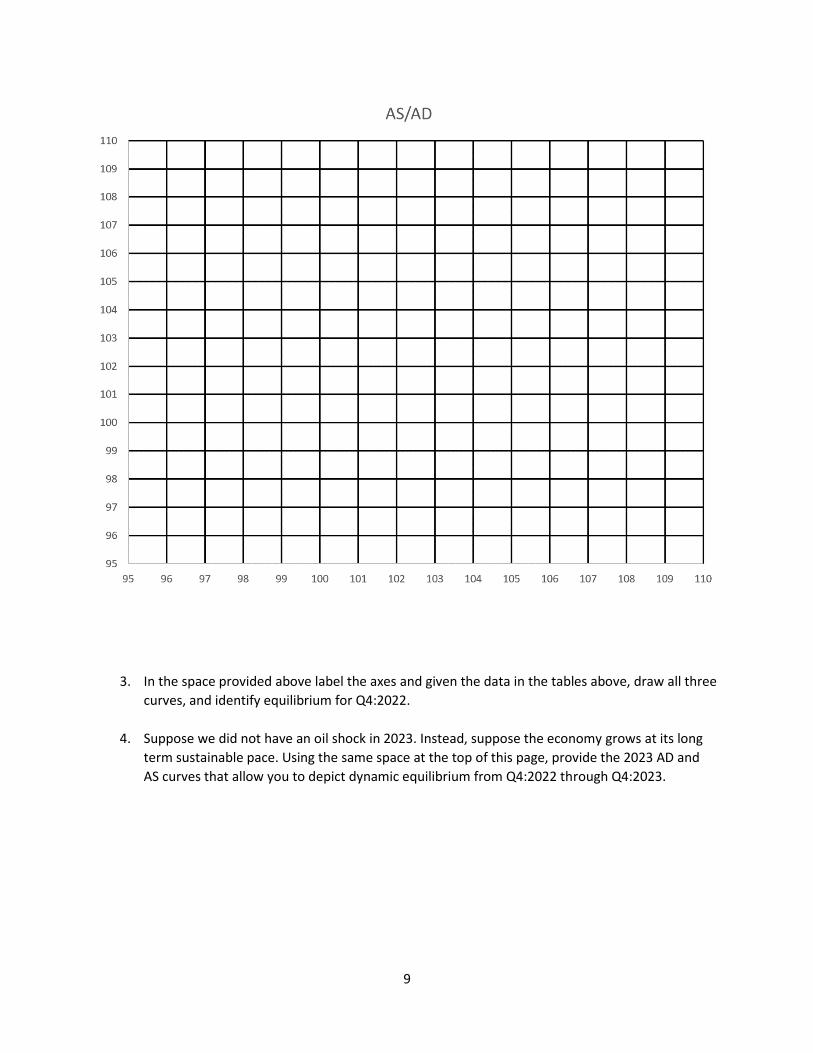
3. In the space provided above label the axes and given the data in the tables above, draw all three
curves, and identify equilibrium for Q4:2022.
4. Suppose we did not have an oil shock in 2023. Instead, suppose the economy grows at its long
term sustainable pace. Using the same space at the top of this page, provide the 2023 AD and
AS curves that allow you to depict dynamic equilibrium from Q4:2022 through Q4:2023.

10
5. We now use the quadrant above to depict AD/AS analysis for the 2023 oil shock.
a. Draw the 2023 LRAS Curve and the 2023 SRAS curve assuming dynamic equilibrium
b. Use Okun’s law to calculate the value for 2023 output
c. Use the data in the tables to calculate the value for the 2023 price level
d. Depict the output/price value for 2023 on the quadrant above (draw the “dot”)
e. Now draw the AD and SRAS curves that capture the oil price shock.
11
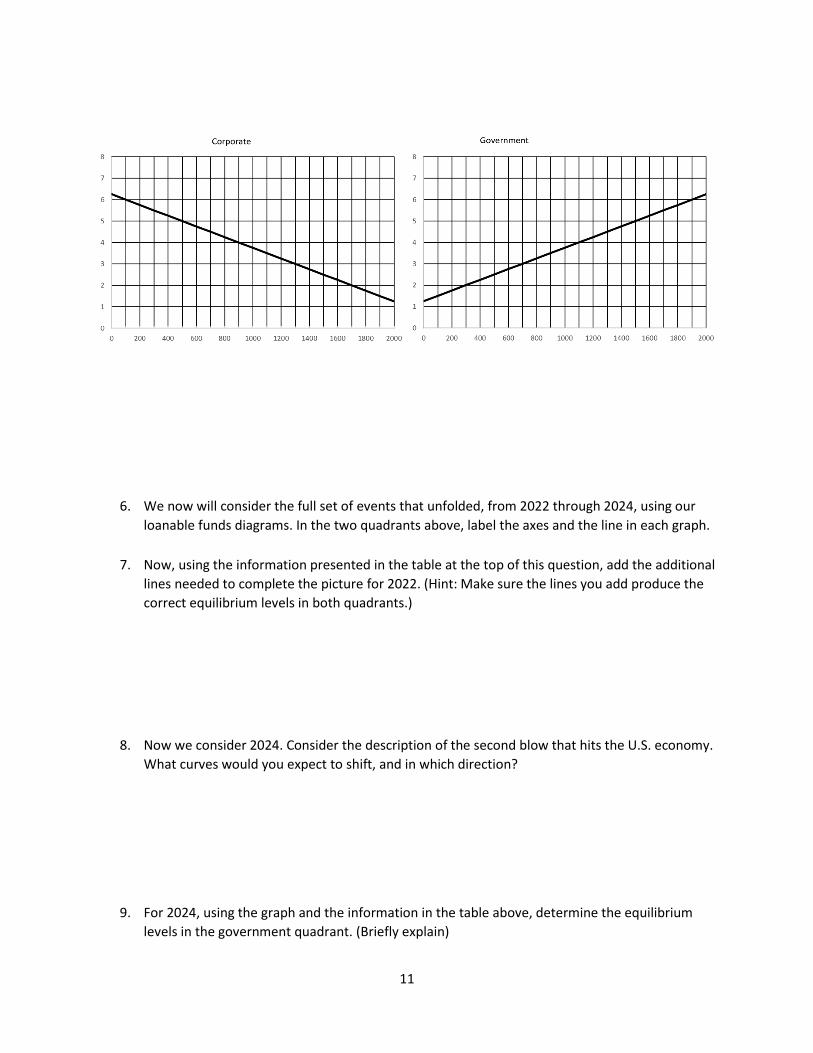
6. We now will consider the full set of events that unfolded, from 2022 through 2024, using our
loanable funds diagrams. In the two quadrants above, label the axes and the line in each graph.
7. Now, using the information presented in the table at the top of this question, add the additional
lines needed to complete the picture for 2022. (Hint: Make sure the lines you add produce the
correct equilibrium levels in both quadrants.)
8. Now we consider 2024. Consider the description of the second blow that hits the U.S. economy.
What curves would you expect to shift, and in which direction?
9. For 2024, using the graph and the information in the table above, determine the equilibrium
levels in the government quadrant. (Briefly explain)
12
10. Draw the curve(s) that intersect at this new equilibrium.
11. Again, for 2024, using your results from question 8 and the information in the table above,
calculate the equilibrium values in the corporate borrowing and lending space. (briefly explain)
12. Draw the curve(s) that intersect at this new equilibrium.
13. One economist, contemplating 2024, remarked, “The flow of funds data make it clear that there
was a rise for the savings rate, and I think that played a material role in the plunge for the
economy”. What phrase did John Maynard Keynes use, to describe the notion that rising
savings can drive the economy lower?
13
14. Assume that 100% of household savings was used to buy either corporate or government bonds.
a. Based upon the data in the table provided and the values on your charts, calculate total
savings in 2024 and 2022.
b. Did households save more in 2024 than in 2022?
15. Some economists argue that if households did save more and spend less, the loanable funds
model suggests the economy would not suffer. Explain their line of reasoning.
16. How does our expanded loanable funds model allow us to reject the ideas described in question
15. Put differently, why did higher savings fail to help the economy in 2024?


![AP Macroeconomics Exam/Course Study Guidejsher.myclassupdates.com/.../macro_study_guide_june2009.docx · Web viewAP Macroeconomics Exam: Course Study Guide [ UNIT I ] What is economics?](https://img.pdfslide.us/doc/110x75/5ae68c257f8b9a29048da432/ap-macroeconomics-examcourse-study-viewap-macroeconomics-exam-course-study-guide.jpg)