Embed Size (px)
Citation preview
UPTEC K11 002
Examensarbete 30 hpMars 2011
Coupling of substances containing a primary amine to hyaluronan via carbodiimide-mediated amidation
Hotan Mojarradi
Coupling of substances containing a primary amine to hyaluronan via carbodiimide-mediated amidation
Hotan Mojarradi
The purpose of this study was to investigate the carbodiimide-mediated amidation of
hyaluronan (HA). The carbodiimide-mediated amidation includes the formation of a urea
derivative, O-acylisourea, between the carbodiimide and a carboxylic group of HA, which a
primary amine can displace, resulting in an amide bond. Reaction conditions were
investigated and optimized, the molecular weights Mn and Mw were determined with size-
exclusion chromatography and by-products were analysed with 1H NMR. The reaction is
done at room temperature in slightly acidic pH, giving a degree of substitution between 5 to
15%. A catalyst, N-hydroxysuccinimide, was needed for the coupling to be successful, since
O-acylisourea was shown not to be reactive enough towards primary amines. It was found out
that dissociated primary amines successfully couple to HA, contrary to what has been
suggested before. 1H NMR revealed that O-acylisourea readily forms a by-product, which is
covalently attached to HA, through the means of rearrangement. Also, 1H NMR showed that
the carbodiimide reacts with phenols. An increase of Mn and Mw compared with native HA
was observed and attributed to ester bond formation between a hydroxyl- and carboxylic
group of HA polysaccharides. To conclude, the carbodiimide-mediated amidation is an
unspecific reaction which is not suited for the coupling of primary amines to HA.
Handledare: Anders Karlsson
Ämnesgranskare: Gunnar Johansson
Examinator: Adolf Gogoll
ISSN: 1650-8297, UPTEC K11 002
Teknisk- naturvetenskaplig fakultet UTH-enheten
Besöksadress: Ångströmlaboratoriet Lägerhyddsvägen 1 Hus 4, Plan 0
Postadress: Box 536 751 21 Uppsala
Telefon: 018 – 471 30 03
Telefax: 018 – 471 30 00
Hemsida: http://www.teknat.uu.se/student
Table of contents
1. LIST OF ABBREVIATIONS ........................................................................................................................... 1
2. INTRODUCTION ............................................................................................................................................. 2
2.1. Aim ......................................................................................................................................................... 3
3. LITERATURE - CARBODIIMIDE ................................................................................................................ 3
3.1. GENERAL ...................................................................................................................................... 3
3.2. CARBODIIMIDE MECHANISM ........................................................................................................ 4
3.2.1. The use of succinimidyl esters ............................................................................................................. 7
3.2.2. Reaction conditions ............................................................................................................................. 8
3.3. ANALYSIS ..................................................................................................................................... 9
3.3.1. General about the by-products ............................................................................................................. 9
3.3.2. Analytical methods .............................................................................................................................. 9
3.3.3. Quantification of amide and N-acylurea ............................................................................................ 10
3.4. DEGRADATION OF HA ................................................................................................................ 11
4. EXPERIMENTAL .......................................................................................................................................... 12
4.1. APPARATUS ................................................................................................................................ 12
4.1.1. HPLC & 1H NMR ............................................................................................................................. 13
4.1.2. Chemicals .......................................................................................................................................... 13
4.2. GENERAL .................................................................................................................................... 14
4.2.1. Sample preparation ............................................................................................................................ 14
4.3. METHOD DEVELOPMENT – ANALYSIS OF DERIVATIZED HA ...................................................... 15
4.4. METHOD DEVELOPMENT – PURIFICATION OF DERIVATIZED HA ................................................ 16
4.4.1. Dialysis .............................................................................................................................................. 16
4.4.2. Evaporation and 1H NMR sample preparation .................................................................................. 17
4.5. METHOD DEVELOPMENT – MOLECULAR WEIGHT OF DERIVATIZED HA..................................... 17
4.5.1. Method development – primary amine amount of native HA ........................................................... 18
4.6. VALIDATION OF METHODS ......................................................................................................... 19
5. RESULTS AND DISCUSSION ..................................................................................................................... 20
5.1. ANALYSIS OF REACTION PARAMETERS ...................................................................................... 20
5.1.1. Choice of buffer and salt ................................................................................................................... 20
5.1.2. Time dependence and temperature .................................................................................................... 20
5.1.3. Stirring ............................................................................................................................................... 21
5.1.4. pH dependence .................................................................................................................................. 22
5.1.5. Buffer concentration .......................................................................................................................... 23
5.2. DESIGN OF EXPERIMENTS (DOE) ............................................................................................... 23
5.2.1. DOE1 ................................................................................................................................................. 24 5.2.1.1 Results DOE1 - DS and ΔpH .................................................................................................................. 24
5.2.2. Lowest NHS ratio .............................................................................................................................. 25
5.2.3. DOE2 ................................................................................................................................................. 26 5.2.3.1 Results DOE2 - DS and ΔpH .................................................................................................................. 26
5.2.4. Validation of DOE2 ........................................................................................................................... 27
5.2.5. DOE3 ................................................................................................................................................. 28 5.2.5.1 Results DOE3 ........................................................................................................................................... 28
5.2.6. Validation of DOE3 ........................................................................................................................... 29
5.3. COUPLING OF OTHER AMINES ..................................................................................................... 29
5.3.1. No NHS ............................................................................................................................................. 31
5.4. EFFECT ON MOLECULAR WEIGHT ............................................................................................... 31
5.4.1. Derivatization .................................................................................................................................... 32
5.5. 1H NMR ...................................................................................................................................... 33
5.6. VALIDATION OF METHODS ......................................................................................................... 35
5.6.1. SEC-HPLC-DAD .............................................................................................................................. 35
5.6.1.1 Dialysis ............................................................................................................................................ 36
6. CONCLUSION................................................................................................................................................ 37
7. ACKNOWLEDGMENTS .............................................................................................................................. 38
REFERENCES .................................................................................................................................................... 39
8. APPENDICES ................................................................................................................................................. 42
8.1. APPENDIX I - MOLECULAR WEIGHT ANALYSIS .......................................................................... 42
8.2. APPENDIX II – STRUCTURE OF THE PRIMARY AMINES ............................................................... 42
8.3. APPENDIX III – CALIBRATION CURVES AND RESIDUAL ANALYSIS PLOTS .................................. 43
1
1. List of abbreviations
2-AP 2-aminopyridine
DAD Diode array detector
DCC Dicyclohexylcarbodiimide
DIC N,N´-diisopropylcarbodiimide
DOE Design of experiments
DOP Dopamine
DS Degree of substitution
EDC 1-ethyl-3-(3-(dimethylamino)propyl)carbodiimide
HA Hyaluronan
HPLC High performance liquid chromatography
LOD Limit of detection
LOQ Limit of quantification
MES 2-(N-morpholine)ethanesulfonic acid
3-MP 3-mercaptopropionic acid
MEX Mexiletine
Mw Weight average molar mass
Mn Number average molar mass
NaHA Sodium hyaluronan
NMR Nuclear magnetic resonance
OPA o-phthaldialdehyde
SEC Size-exclusion chromatography
SUL Sulfacetamide
THI Thiamine
tr Retention time
UV Ultra-violet
2
2. Introduction
The year was 1934 when K. Meyer discovered, from the vitreous humour of cattle eyes, a
polysaccharide acid of high molecular weight which he named hyaluronic acid [1]. The
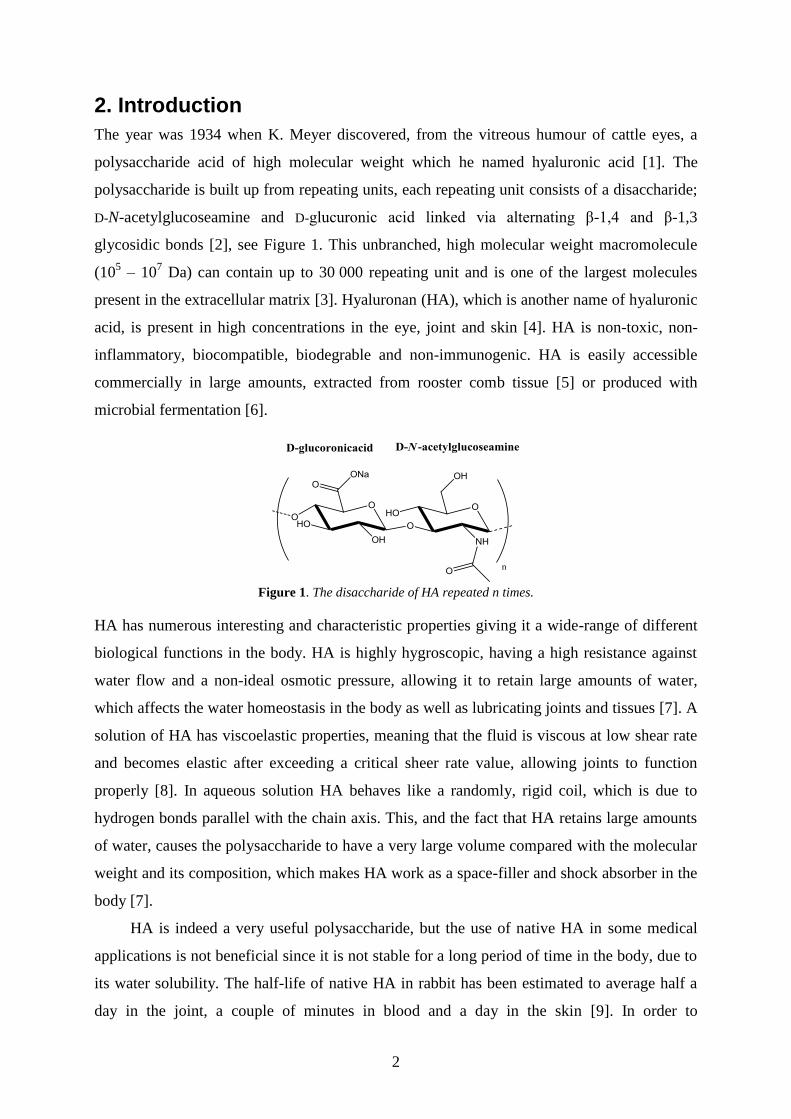
polysaccharide is built up from repeating units, each repeating unit consists of a disaccharide;
D-N-acetylglucoseamine and D-glucuronic acid linked via alternating β-1,4 and β-1,3
glycosidic bonds [2], see Figure 1. This unbranched, high molecular weight macromolecule
(105 – 10
7 Da) can contain up to 30 000 repeating unit and is one of the largest molecules
present in the extracellular matrix [3]. Hyaluronan (HA), which is another name of hyaluronic
acid, is present in high concentrations in the eye, joint and skin [4]. HA is non-toxic, non-
inflammatory, biocompatible, biodegrable and non-immunogenic. HA is easily accessible
commercially in large amounts, extracted from rooster comb tissue [5] or produced with
microbial fermentation [6].
Figure 1. The disaccharide of HA repeated n times.
HA has numerous interesting and characteristic properties giving it a wide-range of different
biological functions in the body. HA is highly hygroscopic, having a high resistance against
water flow and a non-ideal osmotic pressure, allowing it to retain large amounts of water,
which affects the water homeostasis in the body as well as lubricating joints and tissues [7]. A
solution of HA has viscoelastic properties, meaning that the fluid is viscous at low shear rate
and becomes elastic after exceeding a critical sheer rate value, allowing joints to function
properly [8]. In aqueous solution HA behaves like a randomly, rigid coil, which is due to
hydrogen bonds parallel with the chain axis. This, and the fact that HA retains large amounts
of water, causes the polysaccharide to have a very large volume compared with the molecular
weight and its composition, which makes HA work as a space-filler and shock absorber in the
body [7].
HA is indeed a very useful polysaccharide, but the use of native HA in some medical
applications is not beneficial since it is not stable for a long period of time in the body, due to
its water solubility. The half-life of native HA in rabbit has been estimated to average half a
day in the joint, a couple of minutes in blood and a day in the skin [9]. In order to
3
functionalize native HA it must be modified to enhance its durability in the body while
preserving the remaining native properties of the polysaccharide. Today modified HA is used
in eye surgery [10], treatment of osteoarthritis [11], tissue engineering [12], drug delivery
[13], dermal filling [14], breast augmentation [15], treatment of vesicoureteral reflux [16] and
much more.
The general approach to modify HA is either by (i) reaction of bifunctional molecules
which can induce cross-linking of HA producing gels with reduced water-solubility or (ii)
reaction of monofunctional molecules which affects the properties of HA. Balazs et al. [17]
obtained a highly viscoelastic hydrogel, when formaldehyde reacts with HA, forming cross-
linked HA molecular chains. Balazs et al. [18] also discovered that divinyl sulfone readily
reacts with HA in alkaline solution at room temperature, producing cross-linked HA gels. The
reaction with bisepoxides also produces cross-linked HA gels [19]. Other modifications of
HA include, but are not limited to; esterfication of the carboxyl group with different aliphatic
alcohols [20], carbodiimide-mediated amidation with hydrazide [21] or amine [22] and
triazine-activated amidation with amine [23].
2.1. Aim
This work will focus on the carbodiimide reaction, which produces a zero-crosslinker
between HA and a primary amine in the form of an amide bond. The aim of this work is to
investigate and optimize the carbodiimide reaction and the required analysis methods with
respect to the amount of amine coupled, the effect on the molecular distribution of HA, any
potential by-products formed and the requirements of the primary amines used.
3. Literature - carbodiimide
In order to get as much information about the reaction as possible an extensive search of the
literature regarding carbodiimide was performed during the two first weeks of the thesis.
Browsing the literature was also done continuously as the work progressed. The results of the
literature search are presented in section 3.1- 3.4.
3.1. General
In the recent decades there has been a great interest to attach functional groups to HA, while
at the same time preserving the molecular distribution of HA and its useful native properties.
The huge attention towards such reactions is due to the possibility to cross-link and couple
molecules to HA, e.g. pharmacophores. With its allene functional group, carbodiimide has
4
shown great potential to accomplish this, and is a known tool in the field of bioconjugation
[24], peptide synthesis [25] and modifications of polysaccharides [26].
The benefit of the carbodiimide reaction is the use of non-hazardous reagents and that
the reaction can be done in aqueous solution. In addition, the carbodiimide-mediated
amidation is done at room temperature, which most likely preserves the molecular distribution
of native HA. The benefits of the carbodiimide reaction are plenty, but still it must be
investigated if there are any drawbacks with this coupling reaction, such as by-products or
non-specific reactions.
1-ethyl-3-(3-(dimethylamino)propyl)carbodiimide (EDC) is the most common used
carbodiimide, since it is soluble in water [22, 27–30]. The toxicity of the carbodiimide
reaction has been estimated to low since EDC is transformed in to a non-toxic urea derivative
in the coupling reaction [31]. There are a couple of other carbodiimides, such as
dicyclohexylcarbodiimide (DCC) and N,N´-diisopropylcarbodiimide (DIC), but they are
allergens and since they are water-insoluble they require organic solvents, in which
polysaccharides such as HA is not soluble.
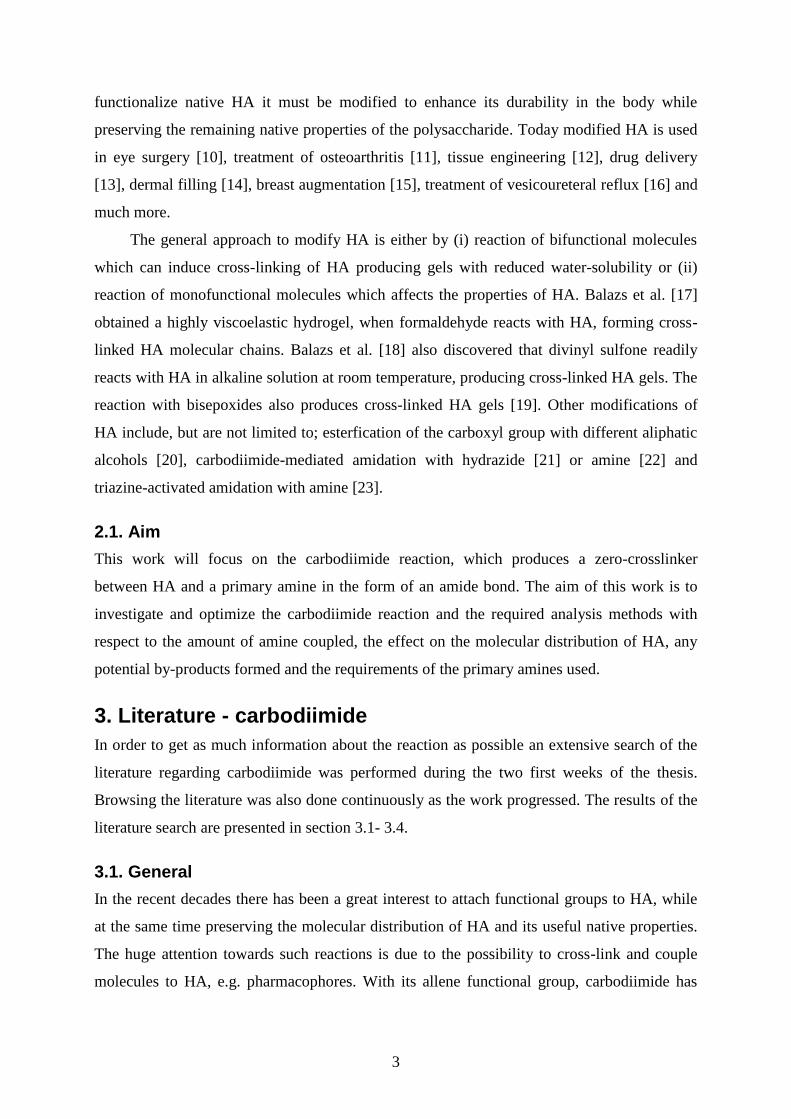
The carbodiimide reacts with carboxylic groups of e.g. polysaccharides, which is shown
briefly in Scheme 1; the reaction between a carboxyl group and carbodiimide results in a urea,
which a nucleophile – a primary amine– can attack, resulting in an amide bond. The coupling
is a zero-length crosslinker, meaning no additional residues besides the amide bond and amine
have been added to HA. Besides couplings of primary amines, hydrazides have been coupled
to HA via the carbodiimide-mediated amidation [21], but it was chosen early that the focus
would lie on primary amines since more interesting molecules containing a primary amine,
such as thiamine, could potentially be coupled.
Scheme 1. The overall scheme of carbodiimide reaction.
3.2. Carbodiimide mechanism
The reaction of carbodiimide is more complicated than described above in Scheme 1 and a
thorough research has been made by Nakajima and Ikada [22] to unravel its mechanism,
which has been accepted as true and is often referenced to. The mechanism is shown in
5
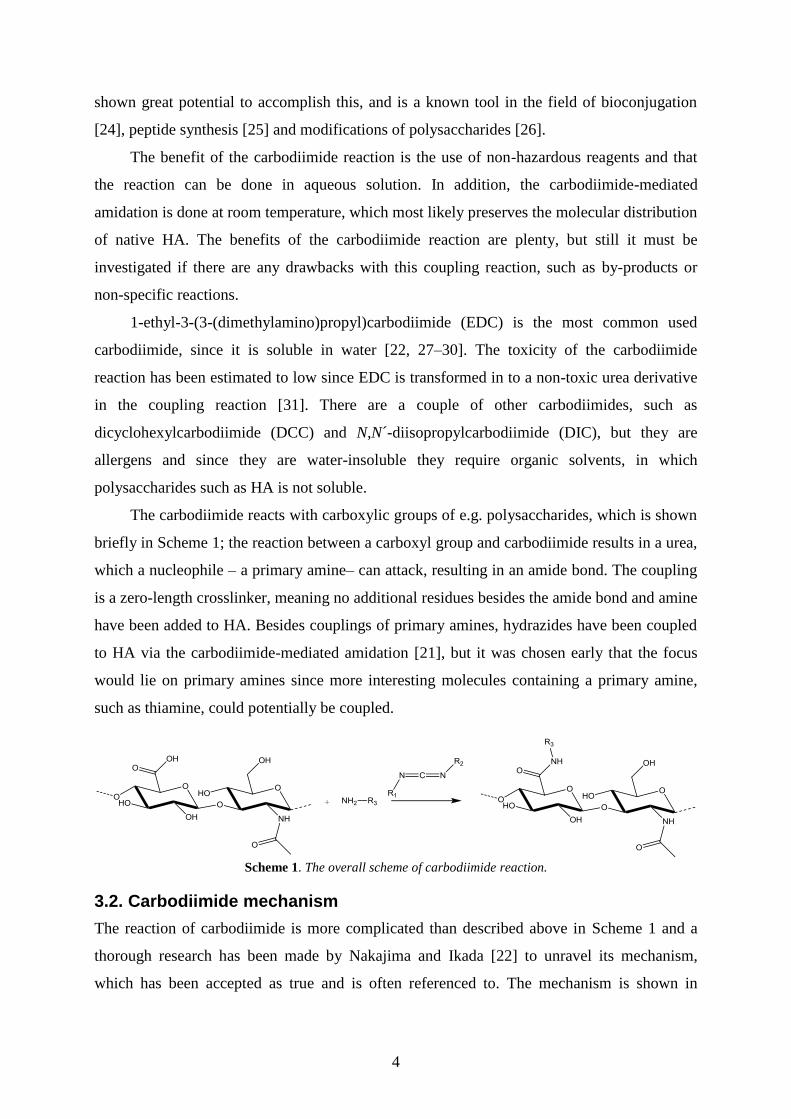
Scheme 3-5 and the abbreviations used in the mechanisms are shown in Scheme 2. R1 and R2
of EDC can be changed between each other in the schemes.
Scheme 2. Abbreviations of molecules used in the following reaction schemes.
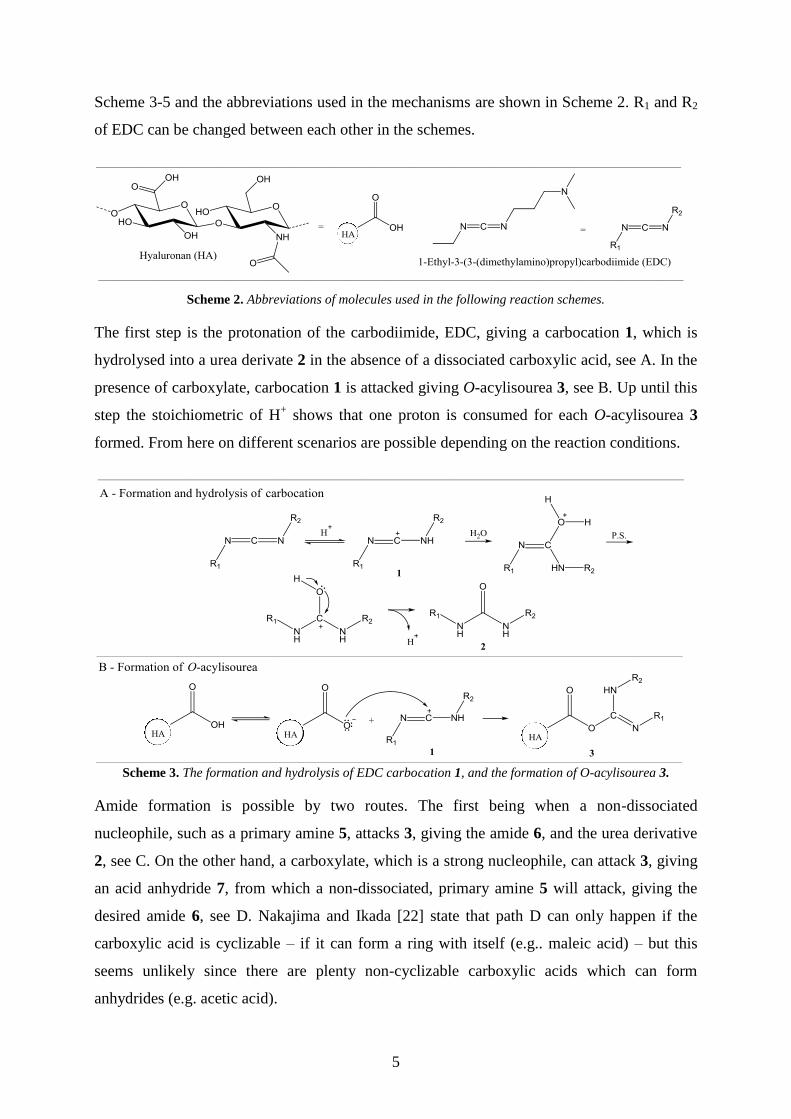
The first step is the protonation of the carbodiimide, EDC, giving a carbocation 1, which is
hydrolysed into a urea derivate 2 in the absence of a dissociated carboxylic acid, see A. In the
presence of carboxylate, carbocation 1 is attacked giving O-acylisourea 3, see B. Up until this
step the stoichiometric of H+ shows that one proton is consumed for each O-acylisourea 3
formed. From here on different scenarios are possible depending on the reaction conditions.
Scheme 3. The formation and hydrolysis of EDC carbocation 1, and the formation of O-acylisourea 3.
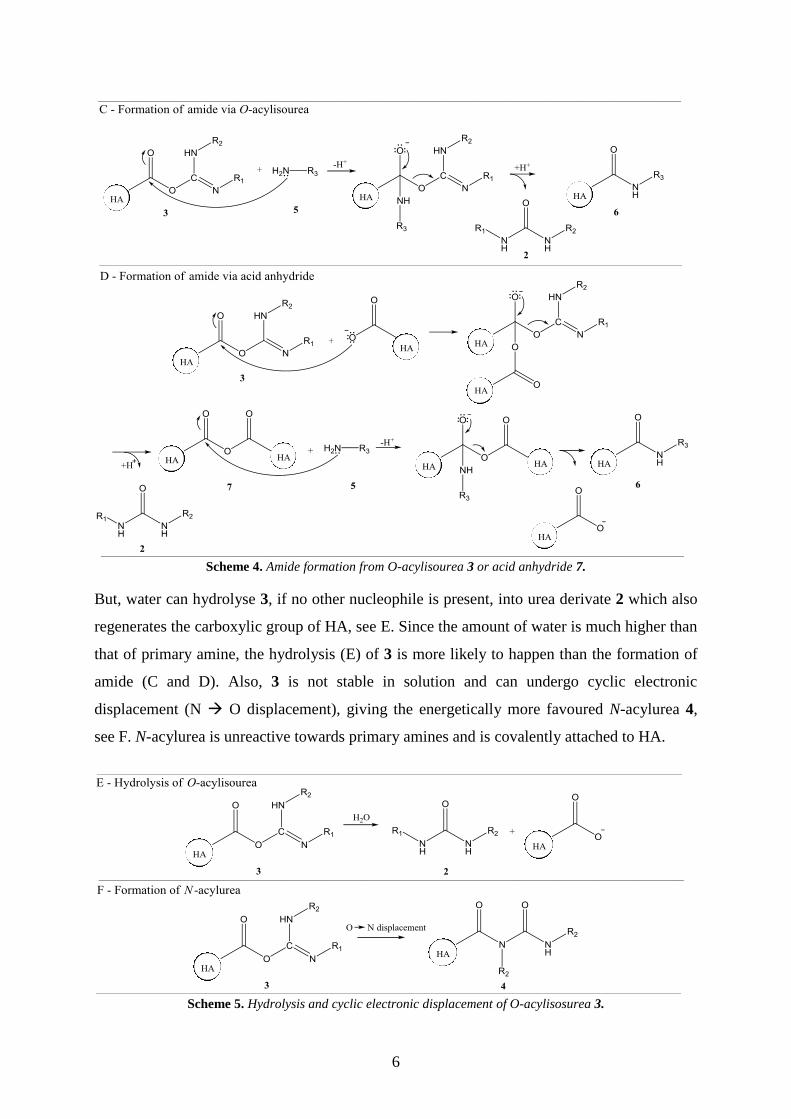
Amide formation is possible by two routes. The first being when a non-dissociated
nucleophile, such as a primary amine 5, attacks 3, giving the amide 6, and the urea derivative
2, see C. On the other hand, a carboxylate, which is a strong nucleophile, can attack 3, giving
an acid anhydride 7, from which a non-dissociated, primary amine 5 will attack, giving the
desired amide 6, see D. Nakajima and Ikada [22] state that path D can only happen if the
carboxylic acid is cyclizable – if it can form a ring with itself (e.g.. maleic acid) – but this
seems unlikely since there are plenty non-cyclizable carboxylic acids which can form
anhydrides (e.g. acetic acid).
6
Scheme 4. Amide formation from O-acylisourea 3 or acid anhydride 7.
But, water can hydrolyse 3, if no other nucleophile is present, into urea derivate 2 which also
regenerates the carboxylic group of HA, see E. Since the amount of water is much higher than
that of primary amine, the hydrolysis (E) of 3 is more likely to happen than the formation of
amide (C and D). Also, 3 is not stable in solution and can undergo cyclic electronic
displacement (N O displacement), giving the energetically more favoured N-acylurea 4,
see F. N-acylurea is unreactive towards primary amines and is covalently attached to HA.
Scheme 5. Hydrolysis and cyclic electronic displacement of O-acylisosurea 3.
7
Sadly, many state that the primary product is often N-acylurea and not the amide, meaning
that no successful amidation is obtained [22, 28, 32–33]. Though, some have shown that it is
possible to obtain amide, which will be discussed now.
3.2.1. The use of succinimidyl esters
Slightly acidic pH is required for the protonation of EDC, as depicted and explained above in
section 3.2. At pH 4.75 the hydrolysis rate of O-acylisourea has been estimated to 2-3 s-1
[34],
which is problematic, since the O-acylisourea becomes deactivated fast making it difficult for
amines to react with it. In addition, the rearrangement of O-acylisourea to the more stable N-
acylurea occurs readily in solution, as shown by Bulpitt and Aeschlimann [33]. This suggests
that O-acylisourea is quite unreactive towards primary amines which results in inferior
amount of amide being produced.
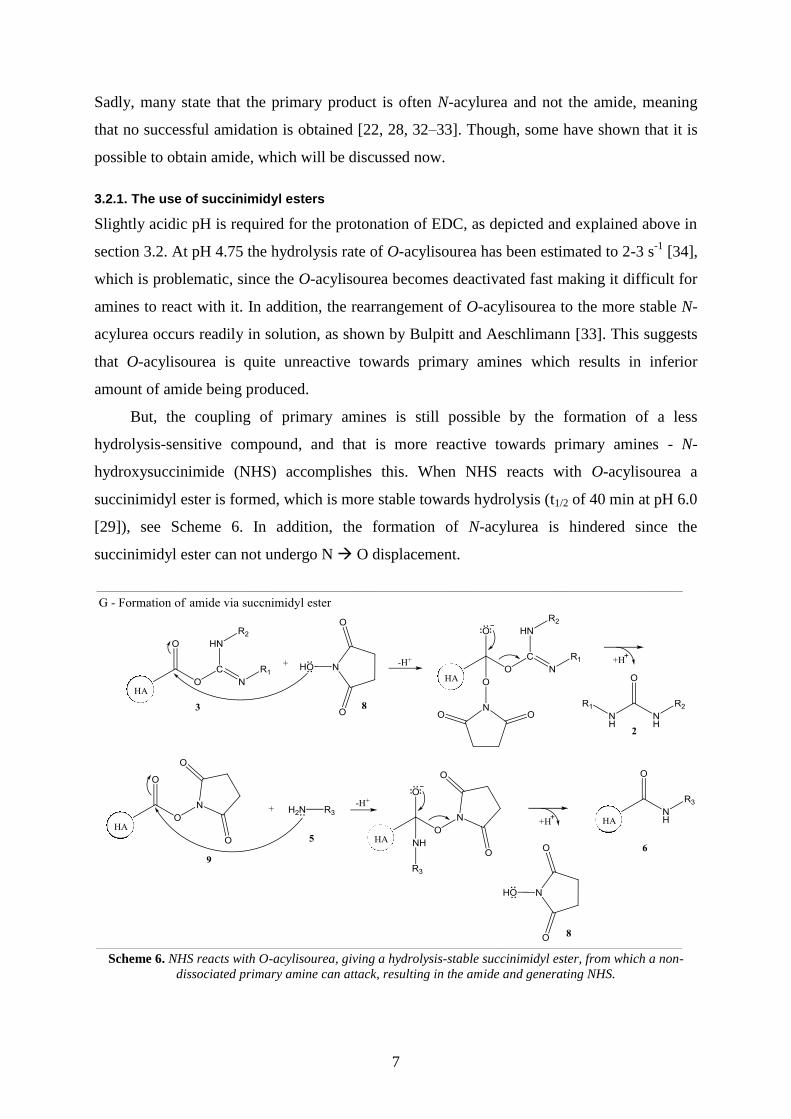
But, the coupling of primary amines is still possible by the formation of a less
hydrolysis-sensitive compound, and that is more reactive towards primary amines - N-
hydroxysuccinimide (NHS) accomplishes this. When NHS reacts with O-acylisourea a
succinimidyl ester is formed, which is more stable towards hydrolysis (t1/2 of 40 min at pH 6.0
[29]), see Scheme 6. In addition, the formation of N-acylurea is hindered since the
succinimidyl ester can not undergo N O displacement.
Scheme 6. NHS reacts with O-acylisourea, giving a hydrolysis-stable succinimidyl ester, from which a non-
dissociated primary amine can attack, resulting in the amide and generating NHS.
8
The mechanism is as follows; the dissociated hydroxyl group of NHS 8 makes a nucleophilic
attack on O-acylisourea 3, giving urea derivative 2 and succinimidyl ester 9, which can then
be attacked by a non-dissociated primary amine, resulting in the amide 6 and regenerating
NHS 8. The conversion of O-acylisourea to a succinimidyl ester has enabled the formation of
amide [26–27, 29–30, 32–33].
3.2.2. Reaction conditions
Different reaction conditions have been studied, some with the result of the corresponding
amide while others with only N-acylurea. The following text is a summary of what has been
found.
The requirement of a carbocation and a carboxylate to form O-acylisourea sets certain
restriction on the pH. It has been shown by Nakajima and Ikada [22] that the optimal pH for
the formation of O-acylisourea is slightly acidic, around 3.5-4.5, since the carboxylic group is
dissociated and the carbocation is formed. On the other hand, the amide formation between O-
acylisourea and amine is preferred at higher pH to suppress the ionization of the amine.
Though, in general a higher pH is used, around 5-6.5, when NHS is used as a catalyst [26–27,
30, 32–33].
The reaction seems to be completed after 12 h [27], but still the reaction time reported
ranges from 15 min to 24 h. The reaction is done in room temperature [25–34], and no
information regarding utilizing higher temperatures has been found. The use of salt varies, but
it does not seem to be any requirement for the reaction, other than having a physiological salt
concentration.
The reaction between carboxylate and EDC can be followed by the increase of pH over
time, since a proton is consumed for each O-acylisourea formed. But, since this reaction
seems to be pH sensitive, a buffer could be used to stabilize the pH. The buffer used must not
contain any carboxylic acids since this will interfere with the reaction, and should have some
buffer capacity around pH 4.5. The most common buffer used is 2-(N-
morpholine)ehanesulfonic (MES), which is a buffer with no carboxylic groups and a pKa of
6.15 at 20 °C [26–27, 29]. The use of buffer is predominantly seen when NHS is utilized,
otherwise the pH is kept stable by adding dilute acid.
There have been indications that an excess of EDC compared to the amount of
carboxylic groups available gives mostly N-acylurea, however, this might be the case of O-
acylisourea readily undergoing N O displacement. No formation of N-acylurea was
observed when the concentration of EDC was half that of carboxylic groups [22]. In addition,
9
Kuo et al. [28] reported that an excess of amine catalyses the formation of N-acylurea, but this
seems unlikely, since it already is formed readily in solution. When NHS has been used the
molar amount has not exceeded that of available carboxylic groups, since it works as a
catalyst [26–27, 29, 33].
3.3. Analysis
In any reaction it is vital to establish the identity of the products and any possible by-products,
and as well a quantification of these, using analysis methods. The carbodiimide reaction can
be investigated by determining the amount of amide bonds formed, the amount of by-products
such as N-acylurea and by molecular weight analysis. The molecular weight analysis will be
discussed in section 3.4, and it is of great importance to determine if HA is degraded in to
low-molecular fragments in the reaction since it has been shown that such fragments of HA
have the possibility to induce inflammatory reactions [35].
3.3.1. General about the by-products
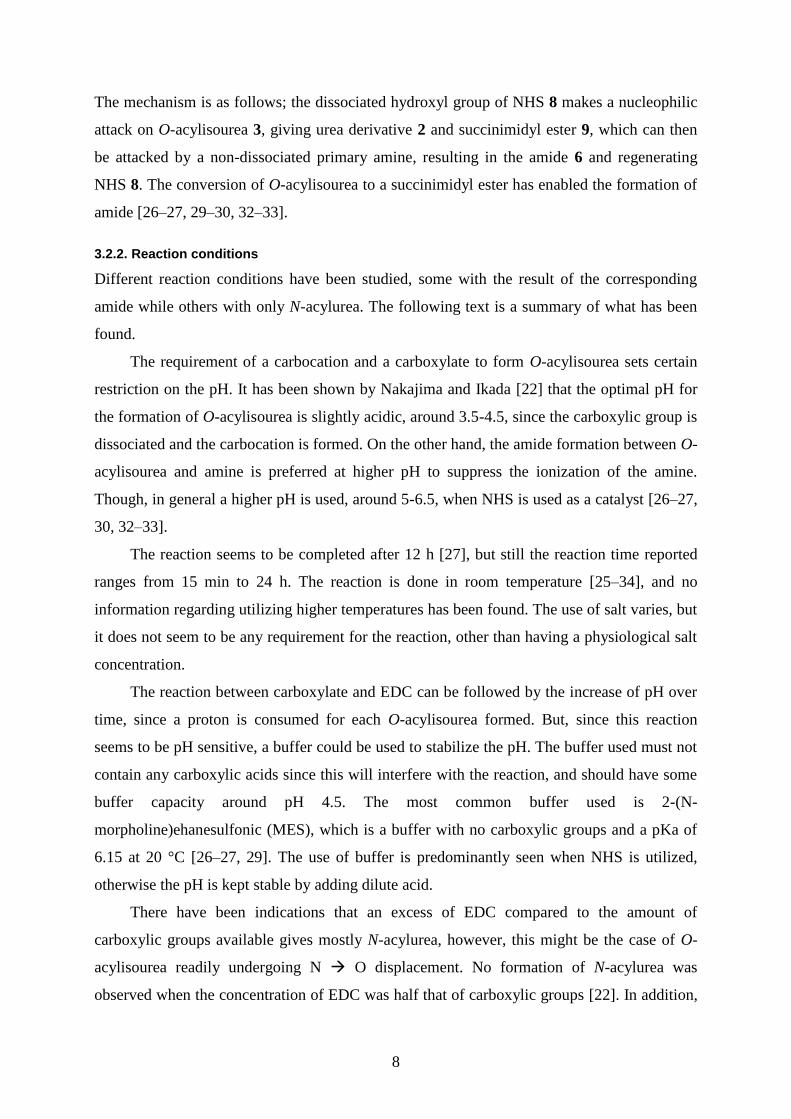
Before any summarize of the literature is made regarding the analysis methods used, a couple
of words will be said about the by-products, see Figure 2. To begin with, the urea derivative 2
and N-acylurea 4 contain no chromophore or fluorophore, disabling the detection with
spectrophotometry and fluorometry. Urea derivative 2 is water-soluble and thus is distributed
in the reaction crude, allowing an easy removal of it with dialysis. It has also been shown to
be non-toxic [31]. Since 2 is difficult to detect, and easily removed, attention should not be
paid on quantifying it. On the other hand, 4 is important to detect and, if possible, to quantify,
since it is attached to HA. 4 contains a tertiary amine and at first it was looked in to if any
derivatization reaction could facilitate the detection, but derivatization methods regarding
tertiary amines are few and those available can not be used because of the polysaccharide
[36]. Also, gas chromatography is not applicable on big molecules such as HA. The
remaining methods are few, but will hopefully do the job.
Figure 2. To the left is urea derivative 2 and to the right N-acylurea 4.
3.3.2. Analytical methods
Different analytical methods have been employed in order to show that the coupling reaction
has been successful. Some are better than others, and below is presented what has been found.
10
Nakajima and Ikada [22] has used the staining method of toluidine blue, which
estimates the amount of carboxyl groups, to quantify the extent of amide formation by
measuring the decrease of carboxyl groups available after the reaction. This method does not
distinguish between the amide and the by-product N-acylurea since both modifies the
carboxylic group. In fact, the use of toluidine blue undermines the credibility of the report and
the reaction mechanism suggested, but it is of general consensus that this is the correct
mechanism. Some have coupled molecules with 14
C and then measured the radioactivity to
determine the extent of amidation, but it does not distinguish or give any information about N-
acylurea [27,30]. 1H NMR has been employed to show that the coupling is successful [22, 26,
28, 33], which has proven to an effective method, but only Kuo et al. [28] has mentioned that
N-acylurea is shown in the spectrum. Also, none have verified that all of the reagents have
been removed by purification with dialysis, which is problematic because if free amine still
remains in solution it will probably give the same signals as the theoretically coupled amine.
Darr and Calabro [26] coupled an amine containing a chromophore to measure the amount of
amine coupled to HA using a spectrophotometer, an effective way of quantifying the amount
of amine coupled to HA. In addition, the use of infrared spectroscopy to reveal additional
peaks, which in some cases have been attributed to the stretching and bending of the amide
bonds, is common [22, 37] [38]. Only Nakajima and Ikada [22] attributed this to the
formation of N-acylurea 4, which probably also shows a similar “amide stretch and bend
peak”, but this is only speculation.
To conclude the various analysis methods used; 1) only investigating the amide
coupling is not sufficient since a high N-acylurea formation is not wanted and 2) at least two
different methods are needed; one to quantify the amide and one to see if any by-products
have been formed.
3.3.3. Quantification of amide and N-acylurea
The most convenient way to quantify the amount of amide formed is to use an amine with a
chromophore. An example of this is tyramine (TYR), the amine used in this work to
investigate the reaction, which has an absorption maximum of 275 nm and a pKa of 10.8 [26],
see Figure 24 (see Appendix). Using a spectrophotometer to measure this will not work as
coupled TYR and free TYR probably have similar absorption spectra, meaning that a
separation technique will be needed. Size-exclusion chromatography (SEC) HPLC with UV
detection has been used to separate and quantify HA [39–41]. The most reasonable way to
11
detect, and somewhat quantify N-acylurea and other by-products is to use NMR after
purification with dialysis.
SEC separates solely on hydrodynamic volume, with other words on how much volume
a molecule occupies in solution, which can be converted to molecular weight. A SEC column
consists of small, porous particles of defined sizes. A small molecule can migrate in to these
porous particles, resulting in a longer way to travel compared to big molecules which will not
migrate in to the pores as much. Thus, molecules elute depending on their size, big molecules
such as proteins or macromolecules, eluting first. A calibration curve created from HA
solutions with known molecular weights must be used since SEC is a relative and not an
absolute molecular weight technique [42].
Dialysis is a purification process driven by a concentration gradient. The reaction crude
is poured in to a semi-permeable dialysis membrane, often a tube, with a certain pore size and
put in to a NaCl solution. A diffusion of solutes take place since the concentration of solutes
is higher in the tube than it is outside. The semi-permeable membrane allows solutes smaller
than a certain molecular weight to diffuse through, while larger molecules are retained inside
the tube. This means that everything except HA, which can not diffuse through the dialysis
membrane, is diluted in the surrounding solution. When equilibrium is reached, that is the
concentration gradient has been nullified, the NaCl solution is replaced allowing for yet
another dilution of the solutes. In the end, all that remain in the dialysis tube is native and
derivatized HA [43].
3.4. Degradation of HA
As mentioned above in section 3.3 it is important to investigate if HA is degraded in the
reaction. The non-enzymatic reactions that can degrade HA, which is relevant to this work,
include base- and acid-catalyzed hydrolysis as well as deacetylation of the N-acetylgroup.
Marklund [44] has in her thesis investigated how the molecular weight of HA is affected
at 25 °C in solutions with different pH. She showed that HA was more sensitive towards basic
milieu than of acidic. The degradation rate constant at pH 13 was approximately 50 times
larger than that of pH 2. The molecular weight of native HA had decreased to 50% after 1 day
in pH 13 and after 25 days in pH 3. In addition, the degradation rate is enhanced at higher
temperatures. Also, it was reported that the degradation constant of HA at neutral pH is very
low, almost no loss of molecular weight was observed in the study. No mechanisms or
degradation products will be shown, but it is highly probable that acid- and base catalyzed
hydrolysis cleave the 1→ 4 and/or 1→ 3 glycosidic bond of HA, resulting in low-molecular
12
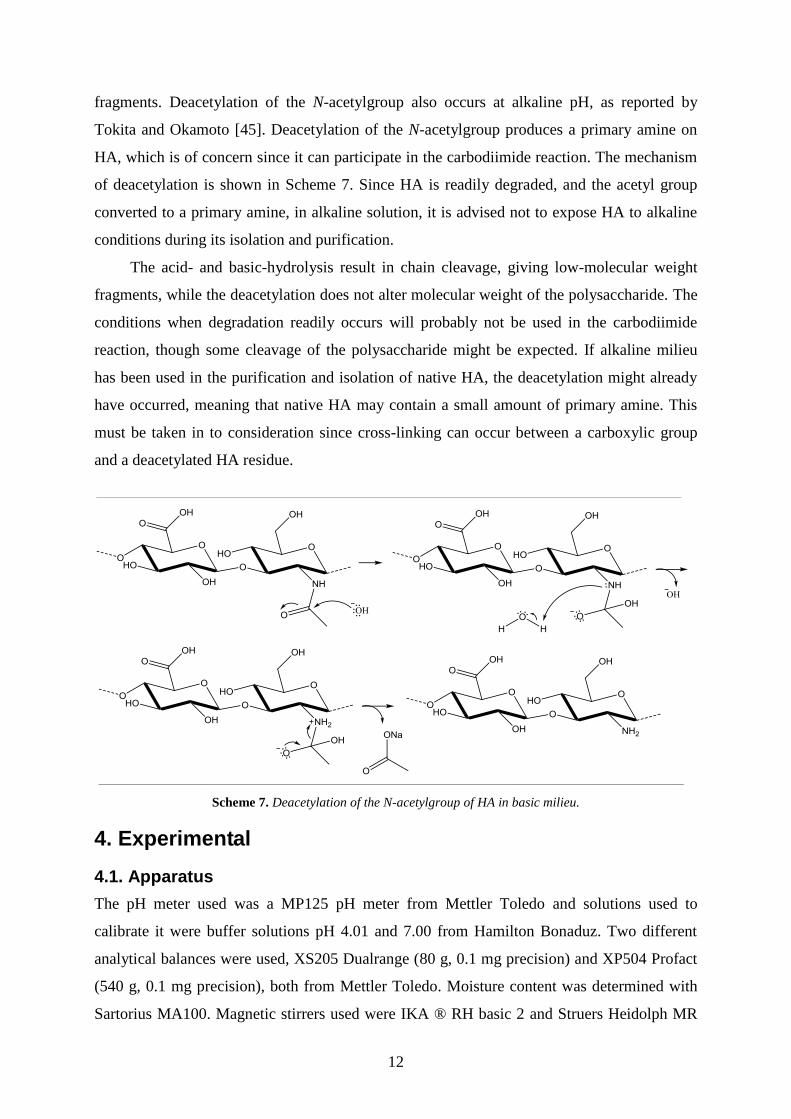
fragments. Deacetylation of the N-acetylgroup also occurs at alkaline pH, as reported by
Tokita and Okamoto [45]. Deacetylation of the N-acetylgroup produces a primary amine on
HA, which is of concern since it can participate in the carbodiimide reaction. The mechanism
of deacetylation is shown in Scheme 7. Since HA is readily degraded, and the acetyl group
converted to a primary amine, in alkaline solution, it is advised not to expose HA to alkaline
conditions during its isolation and purification.
The acid- and basic-hydrolysis result in chain cleavage, giving low-molecular weight
fragments, while the deacetylation does not alter molecular weight of the polysaccharide. The
conditions when degradation readily occurs will probably not be used in the carbodiimide
reaction, though some cleavage of the polysaccharide might be expected. If alkaline milieu
has been used in the purification and isolation of native HA, the deacetylation might already
have occurred, meaning that native HA may contain a small amount of primary amine. This
must be taken in to consideration since cross-linking can occur between a carboxylic group
and a deacetylated HA residue.
Scheme 7. Deacetylation of the N-acetylgroup of HA in basic milieu.
4. Experimental
4.1. Apparatus
The pH meter used was a MP125 pH meter from Mettler Toledo and solutions used to
calibrate it were buffer solutions pH 4.01 and 7.00 from Hamilton Bonaduz. Two different
analytical balances were used, XS205 Dualrange (80 g, 0.1 mg precision) and XP504 Profact
(540 g, 0.1 mg precision), both from Mettler Toledo. Moisture content was determined with
Sartorius MA100. Magnetic stirrers used were IKA ® RH basic 2 and Struers Heidolph MR
13
3000. The incubator used was KBP6151 from Termaks. The NMR used was a 400 MHz
(unknown manufacturer). The rotavapor was a R-205 from Büchi. The spectrophotometer was
a UV-250PPC from Shimadzu.
4.1.1. HPLC & 1H NMR
The HPLC from Shimadzu consisted of a system controller (SCL-10A VP), two liquid
chromatographs (LC-10AD VP), a degasser (DGU-14A), a photodiode array detector (SPD-
M10A VP), an auto-injector (SIL-10AD VP) and a column oven (CTO-10AS VP). The HPLC
was operated with the software Shimadzu LC Solution. Column used was TSKgel GMPWXL
13µm (7.9×300 mm). Mobile phases were filtered with 0.45µm HVLP filters from Millipore.
Prior to analysis, crudes were filtered with Acrodisc® 0.45µm PVDF membrane using a BD
Discardit™ II 2 ml syringe. The crude was filtered in to a 1.5 ml glass vial with a screw cap
PP red (9 mm hole). All the filter equipment was supplied from VWR International.
1H NMR spectrum was recorded at SVA by Lars Nord, Q-Med. The chemical shift of
the signals were adjusted to that of D2O (δ 4.79) and the areas of the peaks were compared to
that of the methyl protons of the N-acetylgroup of HA (area = 3).
4.1.2. Chemicals
The following were kindly supplied from Q-MED AB: Hyaluronan from the Streptococcus
strain with molecular weight 1,000,000 g/mol and 250,000 g/mol, HA standards for the
molecular weight determination and chondroitinase enzyme.
The following chemicals were bought from Sigma-Aldrich; N-(3-
Dimethylaminopropyl)-N’-ethylcarbodiimide hydrochloride ≥98% (CAS 25952-53-8), N-
hydroxysuccinimide 98% (CAS 6066-82-6), 2-aminopyridine ≥99% (CAS 504-29-0), sodium
hydroxide 1 M (CAS 1310-73-2), mexiletine hydrochloride ≥98% (CAS 31828-71-4),
sulfacetamide ≥98% (CAS 144-80-9), dopamine hydrochloride ≥98% (CAS 62-31-7),
thiamine hydrochloride ≥99% (CAS 67-03-8), chitosan medium molecular weight (CAS
9012-76-4), poly-D-lysine hydrobromide mol wt 30,000 – 70,000 (CAS 27964-99-4), o-
phthaldialdehyde >99% (CAS 643-79-8), 3-mercaptopropionic acid ≥99% (CAS 107-96-0)
sodium tetraborate decahydrate ≥99.5% (CAS 1303-96-4) and benzoylated dialysis tubing
(width 32 mm).
The following chemicals were supplied from VWR International; 2-(N-
morpholino)ethanesulphonic acid monohydrate ≥99% (CAS 145224-94-8), tyramine
hydrochloride 98% (CAS 60-19-5), sodium dihydrogen phosphate monohydrate ≥99% (CAS
14
10049-21-5), di-sodium hydrogen phosphate ≥99% (CAS 7558-79-4), sodium chloride
≥99.5% (CAS 7647-14-5), hydrochloric acid 1.2 M (CAS 7647-01-0).
4.2. General
The amount of reagents used in the reactions is compared with the amount of carboxylic acids
in solution. From now on, the ratios will be given in the form of EDC:Amine.NHS X:Y:Z,
where the concentration of COOH in all experiments is 2.49 mM. Example: EDC:TYR:NHS
10:10:10 shows that the amount of EDC, NHS and TYR used are ten times higher that of
COOH. The amount of modified carboxylic acid will be discussed in the degree of
substitution (DS), which is calculated by equation ( 1 ).
)(
COOH)(100
COOHTot
ModDS
( 1 )
Where Mod(COOH) is the amount of amine coupled to HA, which is quantified with SEC-
HPLC-DAD and Tot(COOH) is the total amount of carboxylic groups in solution, which can
be calculated. All results presented have been subtracted with the blank of HA at the relevant
wavelength.
4.2.1. Sample preparation
Throughout this work a 0.1 % w/v (1 mg/ml) of HA solution was used if not otherwise stated.
A multitude of reactions were prepared with different pH and reagent concentrations. Below
is a short description of how such a reaction was put together.
The HA solution was prepared by weighing an appropriate amount of sodium
hyaluronan (NaHA) and sodium chloride in the desired solvent, and was left to stir in a glass
bottle overnight. The moisture content of NaHA was determined with a Sartorius moisture
scale prior to the preparation of the HA solution and the amount of NaHA weighed in was
adjusted according to the moisture content in order to obtain a 0.1% w/v HA solution. When
not in use, the HA solution was stored in the refrigerator (8 °C) to prevent degradation of HA.
Two different solutions, one with NHS and the other with amine, were prepared by
weighing up a desired amount of the chemicals. These were dissolved in the same solvent
used for the HA solution and the pH was adjusted with diluted hydrochloric acid. Below are
different methods used to prepare a reaction mixture. Generally, method 1 was used in the
experiments if not otherwise stated.
15
Method 1
All solutions were dissolved in MES buffer and 154 mM NaCl. EDC was weighed up in a
Falcon tube 15 ml. To this a wanted volume of the NHS solution and of the 0.1% HA solution
were added and the tube was shaken a couple of seconds before adjusting the pH with diluted
hydrochloric acid. A specific volume of the amine solution was added and the pH was
adjusted again, if necessary. The mixture was analysed with SEC-HPLC-UV at regular time
intervals, which depended on the elution time of the primary amine used.
Method 2
All solutions were dissolved in 154 mM NaCl. EDC was weighed in a glass beaker containing
a magnetic stirrer. To this beaker a volume of 0.1% HA solution was added. The mixture was
left to stir and the pH was held steady at 4.5 with dilute acid since pH increased with time.
When the pH increase had diminished, after approximately one hour, the pH was raised to pH
9 with diluted sodium hydroxide and an appropriate volume of the amine was added to the
beaker. The solution was left to stir for 20 minutes before analysing it with SEC-HPLC-UV at
regular time intervals, which depended on the elution time of the primary amine used.
Method 3
All solutions were dissolved in 154 mM NaCl. EDC was weighed up in a glass beaker
containing a magnetic stirrer. To this beaker a volume of 0.1% HA and amine solution were
added. The mixture was left to stir and the pH was held steady at 4.5 with dilute hydrochloric
acid since pH increased with time. After one hour the mixture was analysed with SEC-HPLC-
UV at regular time intervals, which depended on the elution time of the primary amine used.
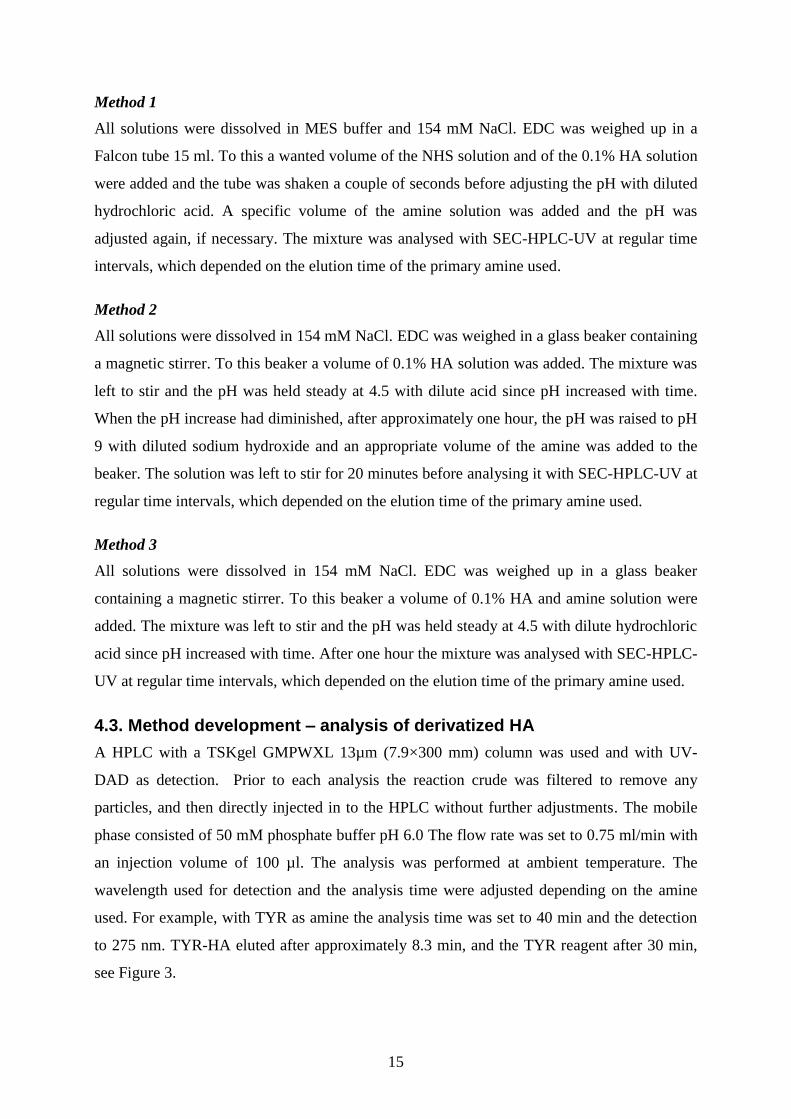
4.3. Method development – analysis of derivatized HA
A HPLC with a TSKgel GMPWXL 13µm (7.9×300 mm) column was used and with UV-
DAD as detection. Prior to each analysis the reaction crude was filtered to remove any
particles, and then directly injected in to the HPLC without further adjustments. The mobile
phase consisted of 50 mM phosphate buffer pH 6.0 The flow rate was set to 0.75 ml/min with
an injection volume of 100 µl. The analysis was performed at ambient temperature. The
wavelength used for detection and the analysis time were adjusted depending on the amine
used. For example, with TYR as amine the analysis time was set to 40 min and the detection
to 275 nm. TYR-HA eluted after approximately 8.3 min, and the TYR reagent after 30 min,
see Figure 3.
16
Figure 3. TYR-HA and TYR eluted after approximately 8.3 and 30 min respectively (275 nm).
4.4. Method development – purification of derivatized HA
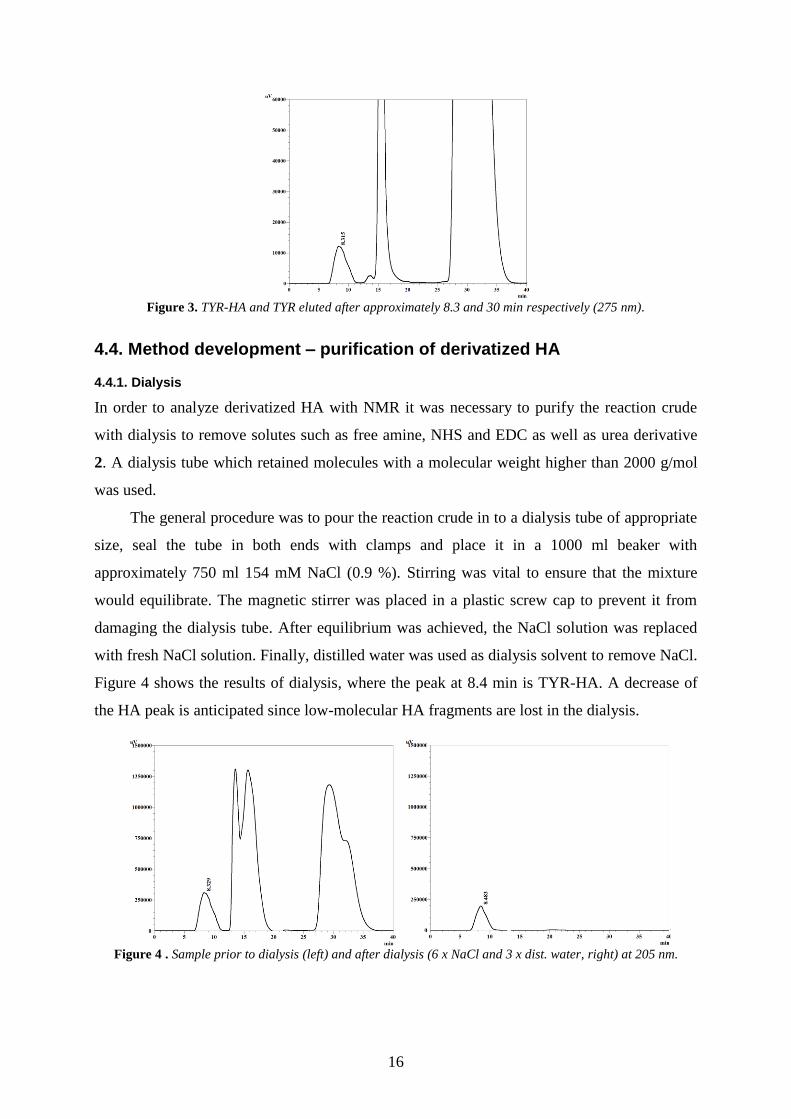
4.4.1. Dialysis
In order to analyze derivatized HA with NMR it was necessary to purify the reaction crude
with dialysis to remove solutes such as free amine, NHS and EDC as well as urea derivative
2. A dialysis tube which retained molecules with a molecular weight higher than 2000 g/mol
was used.
The general procedure was to pour the reaction crude in to a dialysis tube of appropriate
size, seal the tube in both ends with clamps and place it in a 1000 ml beaker with
approximately 750 ml 154 mM NaCl (0.9 %). Stirring was vital to ensure that the mixture
would equilibrate. The magnetic stirrer was placed in a plastic screw cap to prevent it from
damaging the dialysis tube. After equilibrium was achieved, the NaCl solution was replaced
with fresh NaCl solution. Finally, distilled water was used as dialysis solvent to remove NaCl.
Figure 4 shows the results of dialysis, where the peak at 8.4 min is TYR-HA. A decrease of
the HA peak is anticipated since low-molecular HA fragments are lost in the dialysis.
Figure 4 . Sample prior to dialysis (left) and after dialysis (6 x NaCl and 3 x dist. water, right) at 205 nm.
17
4.4.2. Evaporation and 1H NMR sample preparation
After dialysis the water was evaporated under reduced pressure using a rotary evaporator. The
reduced pressure lowers the boiling point of water and by simultaneous heating of the sample
it is possible to evaporate the water without affecting the HA.
The general procedure was to pour the content of the dialysis tube in to a round bottom
flask, which was then attached to the rotary evaporator. A vacuum was built up, a cold water
flow was started through the condenser and the flask was lowered in a heated water bath
while rotating. The evaporation was completed after a couple of minutes, depending on the
amount of water, giving a thin layer of HA on the wall of the round bottom flask. After the
evaporation of water, D2O was added to the round bottom flask to re-dissolve HA. This was
evaporated the same way as the water.
1H NMR was used to determine the structure of the derivatized HA and of by-products.
To prepare the sample for NMR, the HA was needed to be cut into small fragments to give
sharp signals. This was done by dissolving the evaporated sample in 2000 µL D2O for 10
minutes. Aliquots of 250 µL of the sample, 300 µL D2O and 75 µL of chondroitinase were
transferred to an eppendorf tube and put in an incubator at 37 °C over night. 600 µL of this
mixture was added to an NMR tube.
4.5. Method development – molecular weight of derivatized HA
SEC-HPLC-UV was used in order to determine how the reaction affects the molecular size of
the derivatized HA. Different columns were tested and evaluated, and the best was found to
be TSKgel GMPWXL 13µm (7.9×300 mm). The column gave good separation between the
standards and TYR was eluted in reasonable time. Also, changing between columns was
prevented and thus time was not wasted on this. The mobile phase consisted of 50 mM
phosphate buffer (pH 6) and the sample bracket was set to 4°C to prevent further degradation
of HA. The injection volume was 25 µL with an injection rate of 1 µL/s. Detection was set at
205 nm. A non-isocratic flow was used, see Table 1.
Table 1. Molecular weight analysis scheme.
Time (min) Flow (ml/min)
0-50 0.25
50-52,25 0.75
52.25-100 0.75
100-130 0.25
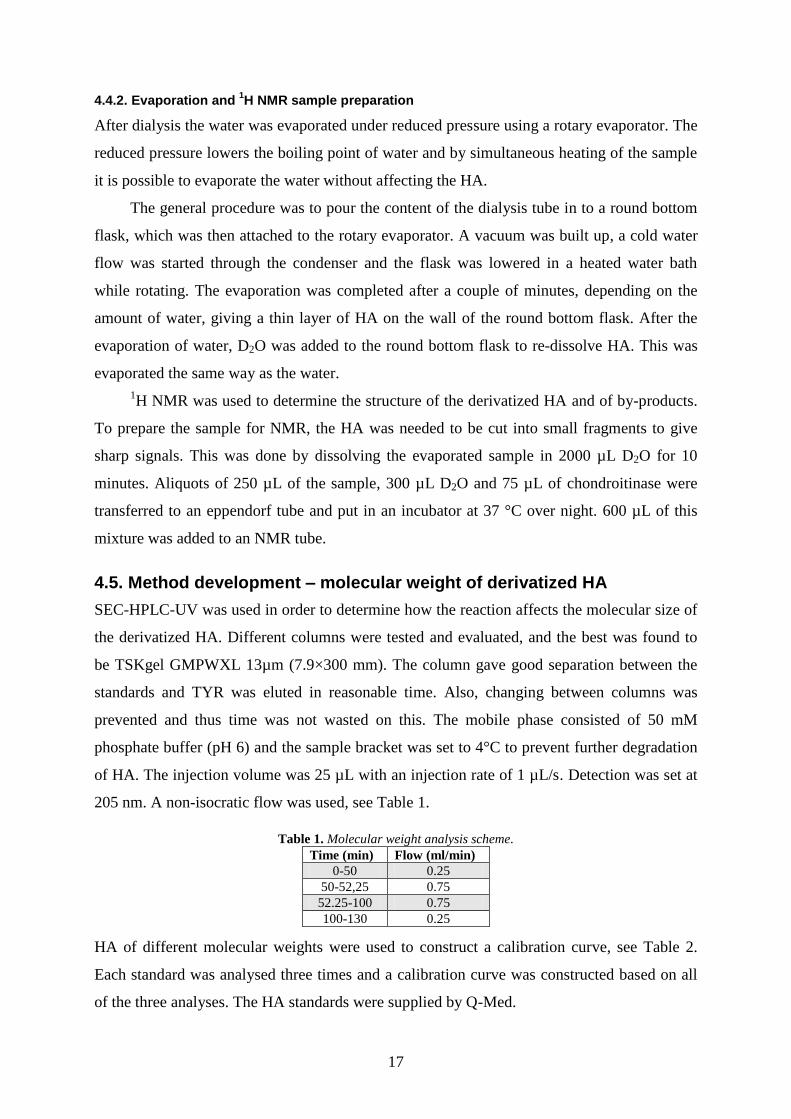
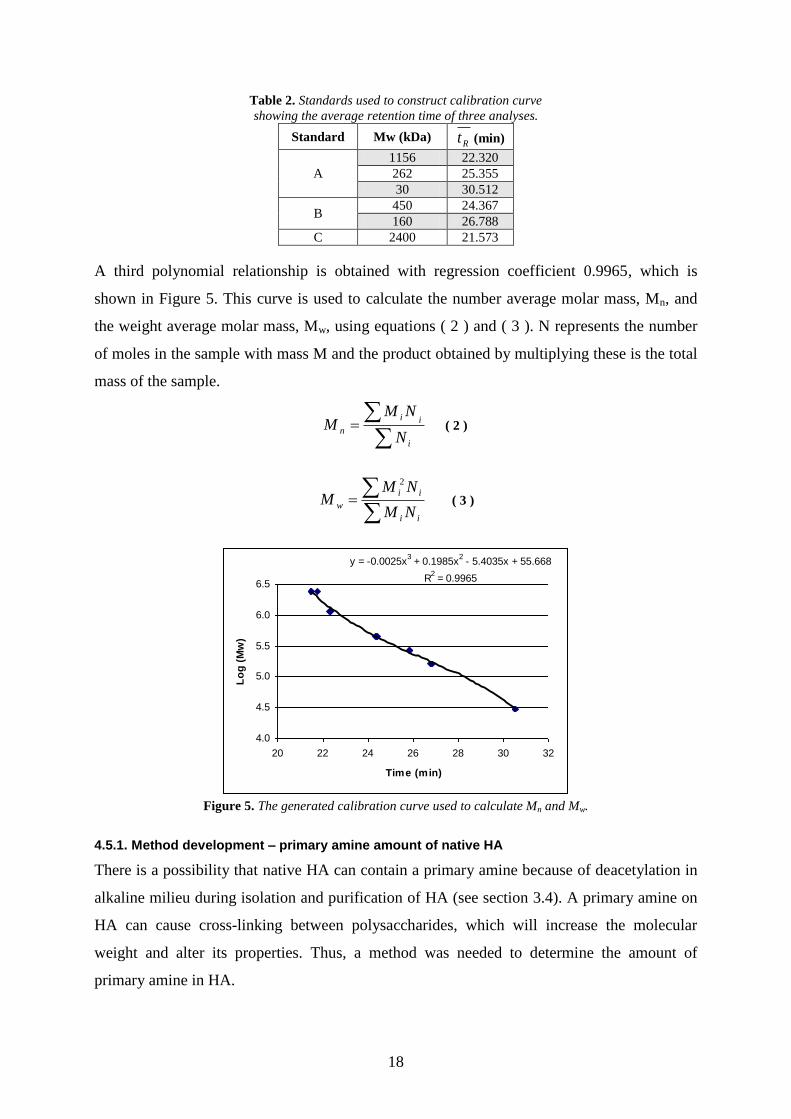
HA of different molecular weights were used to construct a calibration curve, see Table 2.
Each standard was analysed three times and a calibration curve was constructed based on all
of the three analyses. The HA standards were supplied by Q-Med.
18
Table 2. Standards used to construct calibration curve
showing the average retention time of three analyses.
Standard Mw (kDa) Rt (min)
A
1156 22.320
262 25.355
30 30.512
B 450 24.367
160 26.788
C 2400 21.573
A third polynomial relationship is obtained with regression coefficient 0.9965, which is
shown in Figure 5. This curve is used to calculate the number average molar mass, Mn, and
the weight average molar mass, Mw, using equations ( 2 ) and ( 3 ). N represents the number
of moles in the sample with mass M and the product obtained by multiplying these is the total
mass of the sample.
i
ii
nN
NMM ( 2 )
ii
ii
wNM
NMM
2
( 3 )
y = -0.0025x3 + 0.1985x
2 - 5.4035x + 55.668
R2 = 0.9965
4.0
4.5
5.0
5.5
6.0
6.5
20 22 24 26 28 30 32
Time (min)
Lo
g (
Mw
)
Figure 5. The generated calibration curve used to calculate Mn and Mw.
4.5.1. Method development – primary amine amount of native HA
There is a possibility that native HA can contain a primary amine because of deacetylation in
alkaline milieu during isolation and purification of HA (see section 3.4). A primary amine on
HA can cause cross-linking between polysaccharides, which will increase the molecular
weight and alter its properties. Thus, a method was needed to determine the amount of
primary amine in HA.
19
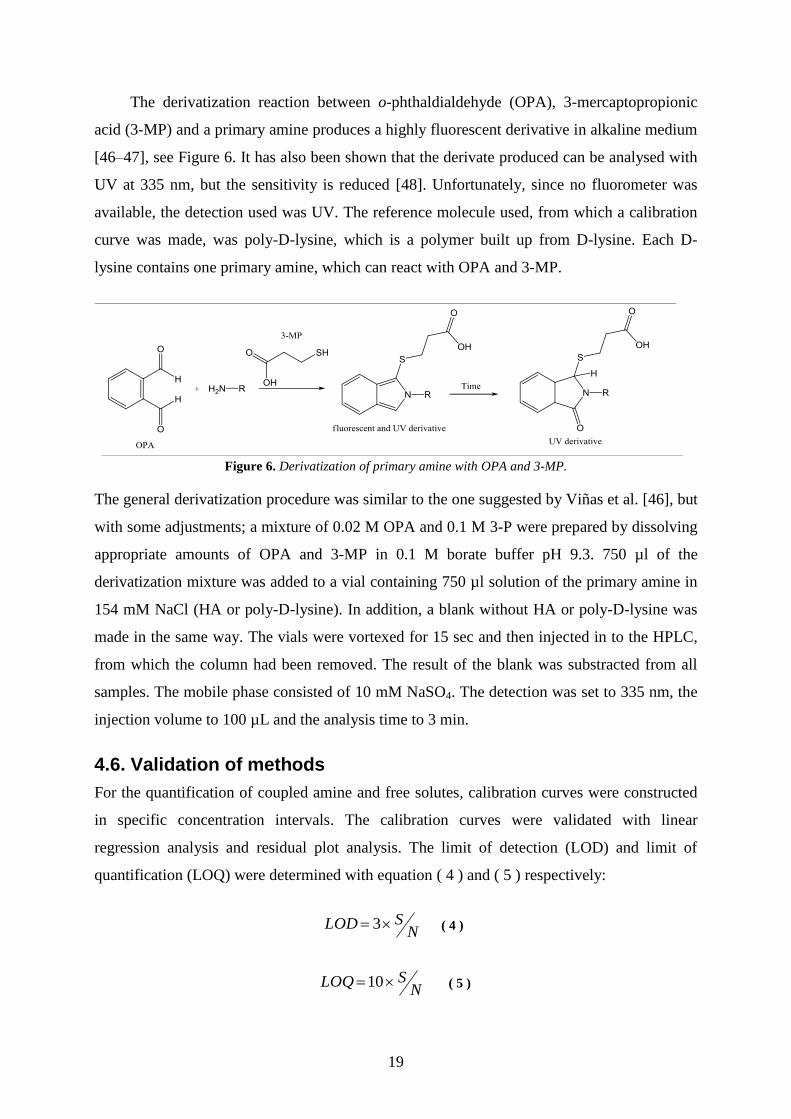
The derivatization reaction between o-phthaldialdehyde (OPA), 3-mercaptopropionic
acid (3-MP) and a primary amine produces a highly fluorescent derivative in alkaline medium
[46–47], see Figure 6. It has also been shown that the derivate produced can be analysed with
UV at 335 nm, but the sensitivity is reduced [48]. Unfortunately, since no fluorometer was
available, the detection used was UV. The reference molecule used, from which a calibration
curve was made, was poly-D-lysine, which is a polymer built up from D-lysine. Each D-
lysine contains one primary amine, which can react with OPA and 3-MP.
Figure 6. Derivatization of primary amine with OPA and 3-MP.
The general derivatization procedure was similar to the one suggested by Viñas et al. [46], but
with some adjustments; a mixture of 0.02 M OPA and 0.1 M 3-P were prepared by dissolving
appropriate amounts of OPA and 3-MP in 0.1 M borate buffer pH 9.3. 750 µl of the
derivatization mixture was added to a vial containing 750 µl solution of the primary amine in
154 mM NaCl (HA or poly-D-lysine). In addition, a blank without HA or poly-D-lysine was
made in the same way. The vials were vortexed for 15 sec and then injected in to the HPLC,
from which the column had been removed. The result of the blank was substracted from all
samples. The mobile phase consisted of 10 mM NaSO4. The detection was set to 335 nm, the
injection volume to 100 µL and the analysis time to 3 min.
4.6. Validation of methods
For the quantification of coupled amine and free solutes, calibration curves were constructed
in specific concentration intervals. The calibration curves were validated with linear
regression analysis and residual plot analysis. The limit of detection (LOD) and limit of
quantification (LOQ) were determined with equation ( 4 ) and ( 5 ) respectively:
NSLOD 3 ( 4 )
NSLOQ 10 ( 5 )
20
S/N is the signal to noise ratio. The signal is equal to the peak’s height and the noise equal to
the height of the noise prior to the peak. All validation results are presented in section 5.6.
It was especially important to have a way to quantitatively measure the amount of free
amine, EDC and NHS in the reaction solution after dialysis, otherwise 1H NMR signals from
free amine might be wrongly interpreted to be amine bound to HA. A qualitative analysis was
made for the salt peak since it does not interfere in a NMR spectrum.
5. Results and discussion
5.1. Analysis of reaction parameters
Parameters to be investigated were the effect of time, pH, [EDC], [NHS], [amine], [NaCl] and
[buffer] on the reaction.
5.1.1. Choice of buffer and salt
Buffers without any carboxylic acids which operate in acidic conditions are limited. The
choice was between two buffers; pyridine (pKa 5.25) and MES (pKa 6.15). Pyridine would be
the better choice with regards to its pKa, but since it is not pleasant to work with it was
discarded. MES does not have that good buffer capacity at pH below 5, but a high buffer
concentration could maybe compensate this. Nowhere in the literature has it been said
anything about the effect of salt, and thus the concentration of NaCl was set to 154 mM
throughout the work since it is the physiological salt concentration in the body.
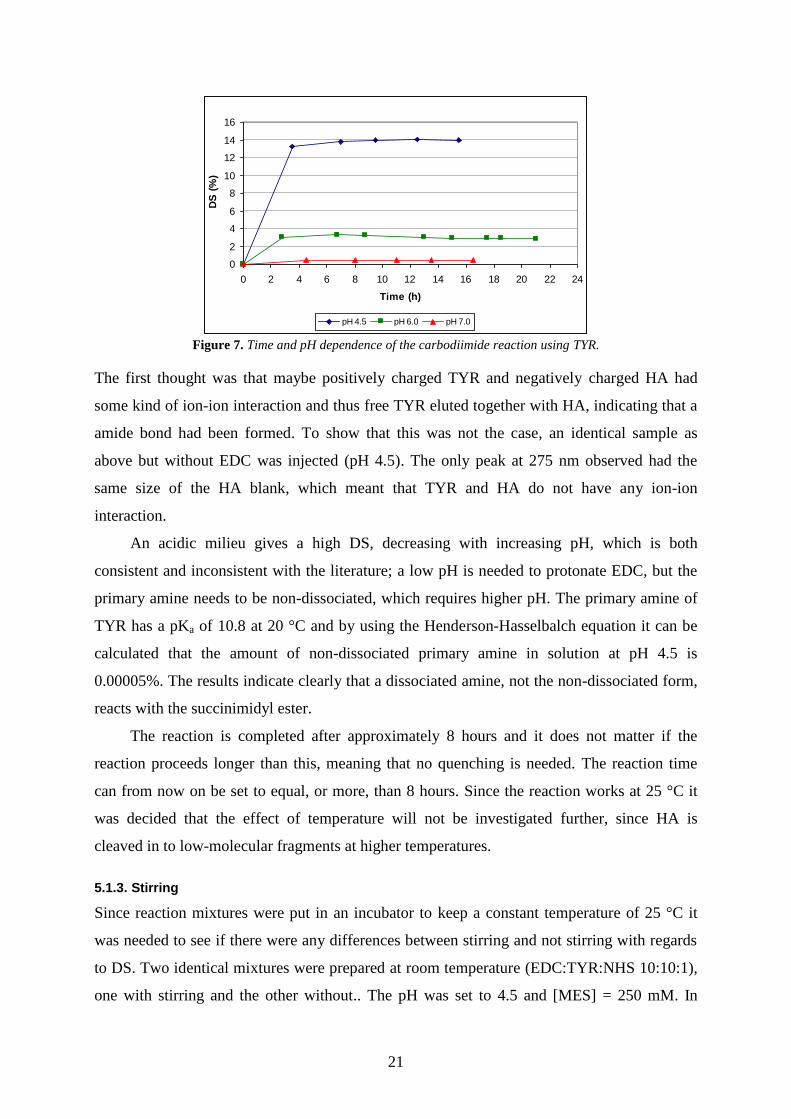
5.1.2. Time dependence and temperature
Early it was investigated how long it was required before the reaction was completed and if
any quenching was needed. At the same time it was investigated briefly how different pH
affects the reaction. Three different mixtures (EDC:TYR:NHS 10:10:1) with pH 4.5, 6.0 and
7.0 were prepared. [MES] was set to 154 mM and the reaction was done at 25 °C. The three
samples were analysed continuously and the results are shown in Figure 7.
21
0
2
4
6
8
10
12
14
16
0 2 4 6 8 10 12 14 16 18 20 22 24
Time (h)
DS
(%
)
pH 4.5 pH 6.0 pH 7.0
Figure 7. Time and pH dependence of the carbodiimide reaction using TYR.
The first thought was that maybe positively charged TYR and negatively charged HA had
some kind of ion-ion interaction and thus free TYR eluted together with HA, indicating that a
amide bond had been formed. To show that this was not the case, an identical sample as
above but without EDC was injected (pH 4.5). The only peak at 275 nm observed had the
same size of the HA blank, which meant that TYR and HA do not have any ion-ion
interaction.
An acidic milieu gives a high DS, decreasing with increasing pH, which is both
consistent and inconsistent with the literature; a low pH is needed to protonate EDC, but the
primary amine needs to be non-dissociated, which requires higher pH. The primary amine of
TYR has a pKa of 10.8 at 20 °C and by using the Henderson-Hasselbalch equation it can be
calculated that the amount of non-dissociated primary amine in solution at pH 4.5 is
0.00005%. The results indicate clearly that a dissociated amine, not the non-dissociated form,
reacts with the succinimidyl ester.
The reaction is completed after approximately 8 hours and it does not matter if the
reaction proceeds longer than this, meaning that no quenching is needed. The reaction time
can from now on be set to equal, or more, than 8 hours. Since the reaction works at 25 °C it
was decided that the effect of temperature will not be investigated further, since HA is
cleaved in to low-molecular fragments at higher temperatures.
5.1.3. Stirring
Since reaction mixtures were put in an incubator to keep a constant temperature of 25 °C it
was needed to see if there were any differences between stirring and not stirring with regards
to DS. Two identical mixtures were prepared at room temperature (EDC:TYR:NHS 10:10:1),
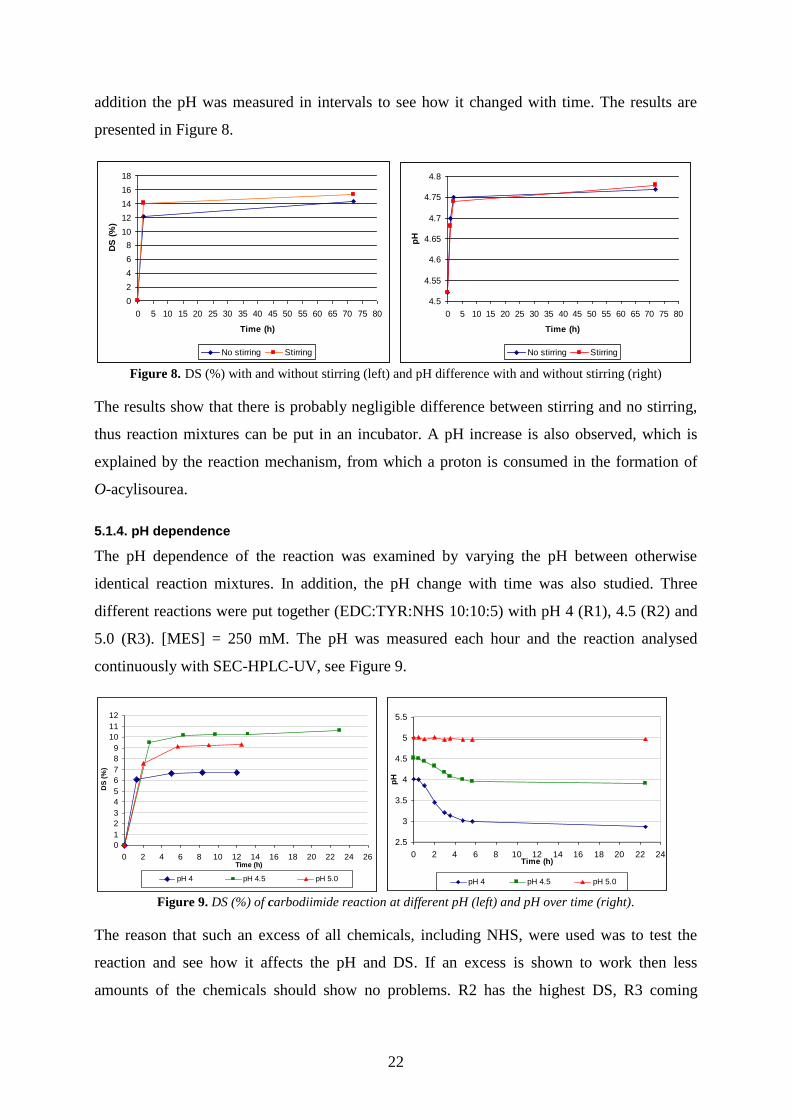
one with stirring and the other without.. The pH was set to 4.5 and [MES] = 250 mM. In
22
addition the pH was measured in intervals to see how it changed with time. The results are
presented in Figure 8.
0
2
4
6
8
10
12
14
16
18
0 5 10 15 20 25 30 35 40 45 50 55 60 65 70 75 80
Time (h)
DS
(%
)
No stirring Stirring
4.5
4.55
4.6
4.65
4.7
4.75
4.8
0 5 10 15 20 25 30 35 40 45 50 55 60 65 70 75 80
Time (h)
pH
No stirring Stirring
Figure 8. DS (%) with and without stirring (left) and pH difference with and without stirring (right)
The results show that there is probably negligible difference between stirring and no stirring,
thus reaction mixtures can be put in an incubator. A pH increase is also observed, which is
explained by the reaction mechanism, from which a proton is consumed in the formation of
O-acylisourea.
5.1.4. pH dependence
The pH dependence of the reaction was examined by varying the pH between otherwise
identical reaction mixtures. In addition, the pH change with time was also studied. Three
different reactions were put together (EDC:TYR:NHS 10:10:5) with pH 4 (R1), 4.5 (R2) and
5.0 (R3). [MES] = 250 mM. The pH was measured each hour and the reaction analysed
continuously with SEC-HPLC-UV, see Figure 9.
0
1
2
3
4
5
6
7
8
9
10
11
12
0 2 4 6 8 10 12 14 16 18 20 22 24 26Time (h)
DS
(%
)
pH 4 pH 4.5 pH 5.0
2.5
3
3.5
4
4.5
5
5.5
0 2 4 6 8 10 12 14 16 18 20 22 24Time (h)
pH
pH 4 pH 4.5 pH 5.0
Figure 9. DS (%) of carbodiimide reaction at different pH (left) and pH over time (right).
The reason that such an excess of all chemicals, including NHS, were used was to test the
reaction and see how it affects the pH and DS. If an excess is shown to work then less
amounts of the chemicals should show no problems. R2 has the highest DS, R3 coming
23
closely after and R1 having the lowest. Looking at the pH change over time R3 is the most
stable, changing almost nothing at all. R1 drops rapidly to below pH 3 in a couple of hours,
which might explain the low DS.
If Figure 9 is compared to Figure 8, there is quite a difference between pH 4.5. In Figure
8 the pH increases with time and a higher DS is acquired in comparison with Figure 9. This
difference might be attributed to the five times higher amount of NHS used in Figure 9, which
indicates that such high amount has a negative impact on both the DS and the pH stability.
Without further investigation the pH is set to 4.5 since it gives a good DS and hopefully the
pH is stable if the amount of NHS is lowered.
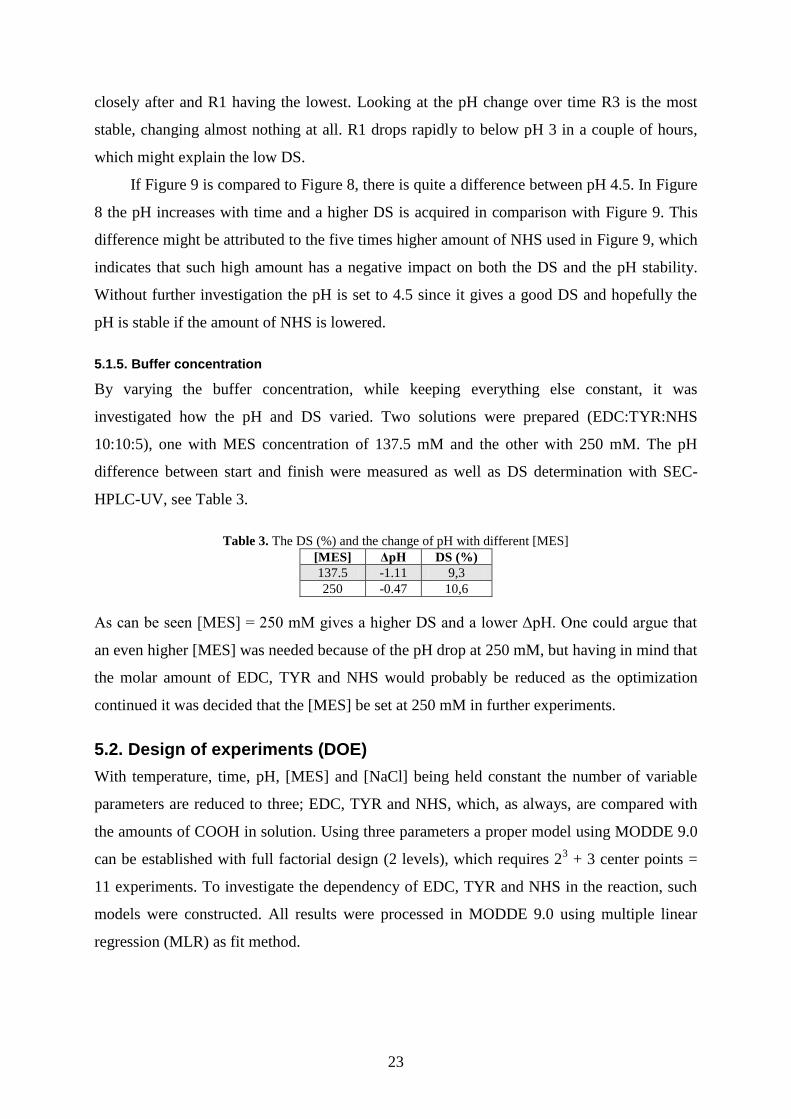
5.1.5. Buffer concentration
By varying the buffer concentration, while keeping everything else constant, it was
investigated how the pH and DS varied. Two solutions were prepared (EDC:TYR:NHS
10:10:5), one with MES concentration of 137.5 mM and the other with 250 mM. The pH
difference between start and finish were measured as well as DS determination with SEC-
HPLC-UV, see Table 3.
Table 3. The DS (%) and the change of pH with different [MES]
[MES] ΔpH DS (%)
137.5 -1.11 9,3
250 -0.47 10,6
As can be seen [MES] = 250 mM gives a higher DS and a lower ΔpH. One could argue that
an even higher [MES] was needed because of the pH drop at 250 mM, but having in mind that
the molar amount of EDC, TYR and NHS would probably be reduced as the optimization
continued it was decided that the [MES] be set at 250 mM in further experiments.
5.2. Design of experiments (DOE)
With temperature, time, pH, [MES] and [NaCl] being held constant the number of variable
parameters are reduced to three; EDC, TYR and NHS, which, as always, are compared with
the amounts of COOH in solution. Using three parameters a proper model using MODDE 9.0
can be established with full factorial design (2 levels), which requires 23 + 3 center points =
11 experiments. To investigate the dependency of EDC, TYR and NHS in the reaction, such
models were constructed. All results were processed in MODDE 9.0 using multiple linear
regression (MLR) as fit method.
24
5.2.1. DOE1
The set-up and the results are presented in Table 4. The parameters were evaluated towards
DS, but the ΔpH was also investigated.
Table 4. DOE1 set up and results.
Exp. EDC TYR NHS DS ΔpH
1 1 1 1 0.94 -0.11
2 10 1 1 3 0.01
3 1 10 1 2.17 -0.05
4 10 10 1 13.7 0.28
5 1 1 10 0.95 -0.1
6 10 1 10 1.15 -1.35
7 1 10 10 1.11 -0.11
8 10 10 10 4.94 -1.11
9 5.5 5.5 5.5 3.54 -0.58
10 5.5 5.5 5.5 3.8 -0.6
11 5.5 5.5 5.5 3.4 -0.58
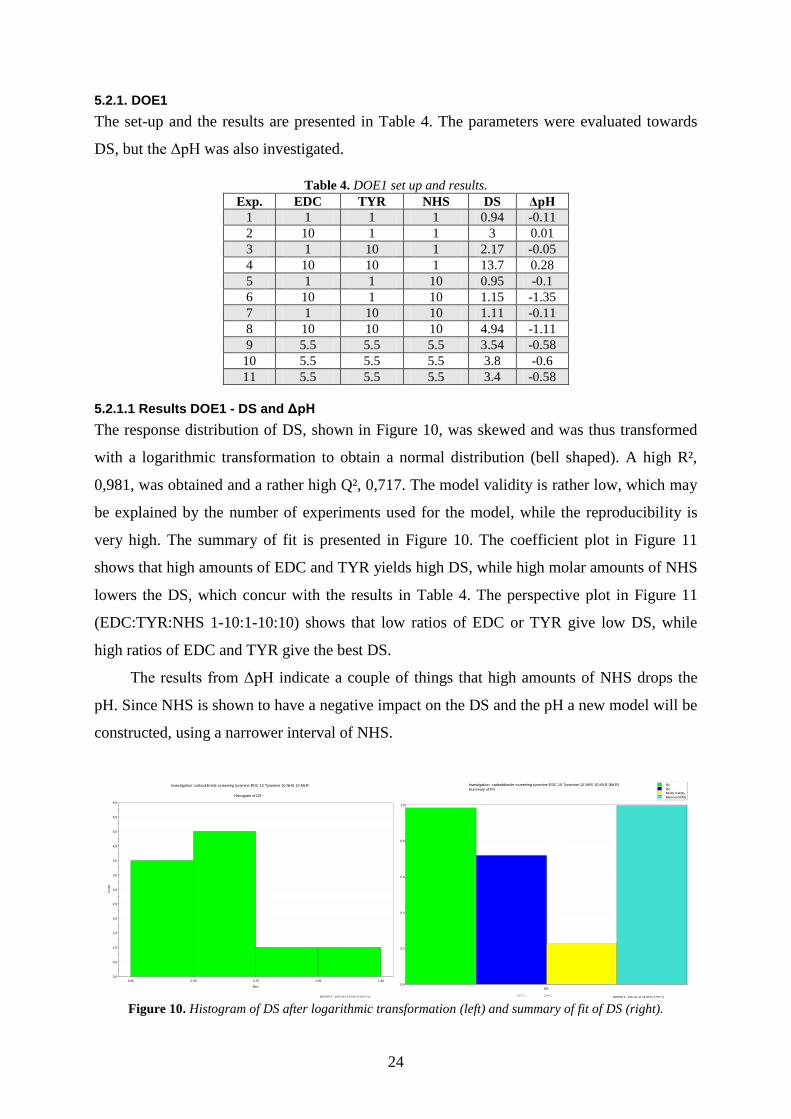
5.2.1.1 Results DOE1 - DS and ΔpH
The response distribution of DS, shown in Figure 10, was skewed and was thus transformed
with a logarithmic transformation to obtain a normal distribution (bell shaped). A high R²,
0,981, was obtained and a rather high Q², 0,717. The model validity is rather low, which may
be explained by the number of experiments used for the model, while the reproducibility is
very high. The summary of fit is presented in Figure 10. The coefficient plot in Figure 11
shows that high amounts of EDC and TYR yields high DS, while high molar amounts of NHS
lowers the DS, which concur with the results in Table 4. The perspective plot in Figure 11
(EDC:TYR:NHS 1-10:1-10:10) shows that low ratios of EDC or TYR give low DS, while
high ratios of EDC and TYR give the best DS.
The results from ΔpH indicate a couple of things that high amounts of NHS drops the
pH. Since NHS is shown to have a negative impact on the DS and the pH a new model will be
constructed, using a narrower interval of NHS.
0,0
0,5
1,0
1,5
2,0
2,5
3,0
3,5
4,0
4,5
5,0
5,5
6,0
0,00 0,35 0,70 1,05 1,40
Count
Bins
Histogram of DS~
Investigation: carboddimide screening tyramine EDC 10 Tyramine 10 NHS 10 MLR
MODDE 9 - 2011-01-14 16:09:12 (UTC+1)
0,0
0,2
0,4
0,6
0,8
1,0
DS~
Investigation: carboddimide screening tyramine EDC 10 Tyramine 10 NHS 10 MLR (MLR)
Summary of Fit
N=11 DF=4
R2
Q2
Model Validity
Reproducibility
MODDE 9 - 2011-01-14 16:08:07 (UTC+1) Figure 10. Histogram of DS after logarithmic transformation (left) and summary of fit of DS (right).
25
-0,35
-0,30
-0,25
-0,20
-0,15
-0,10
-0,05
0,00
0,05
0,10
0,15
0,20
0,25
0,30
0,35
ED
C
Am
i
NH
S
Am
i*A
mi
ED
C*A
mi
ED
C*N
HS
%
Scaled & Centered Coefficients for DS~
N=11 R2=0,982 RSD=0,07755
DF=4 Q2=0,717 Conf. lev.=0,95
Investigation: carboddimide screening tyramine EDC 10 Tyramine 10 NHS 10 MLR (MLR)
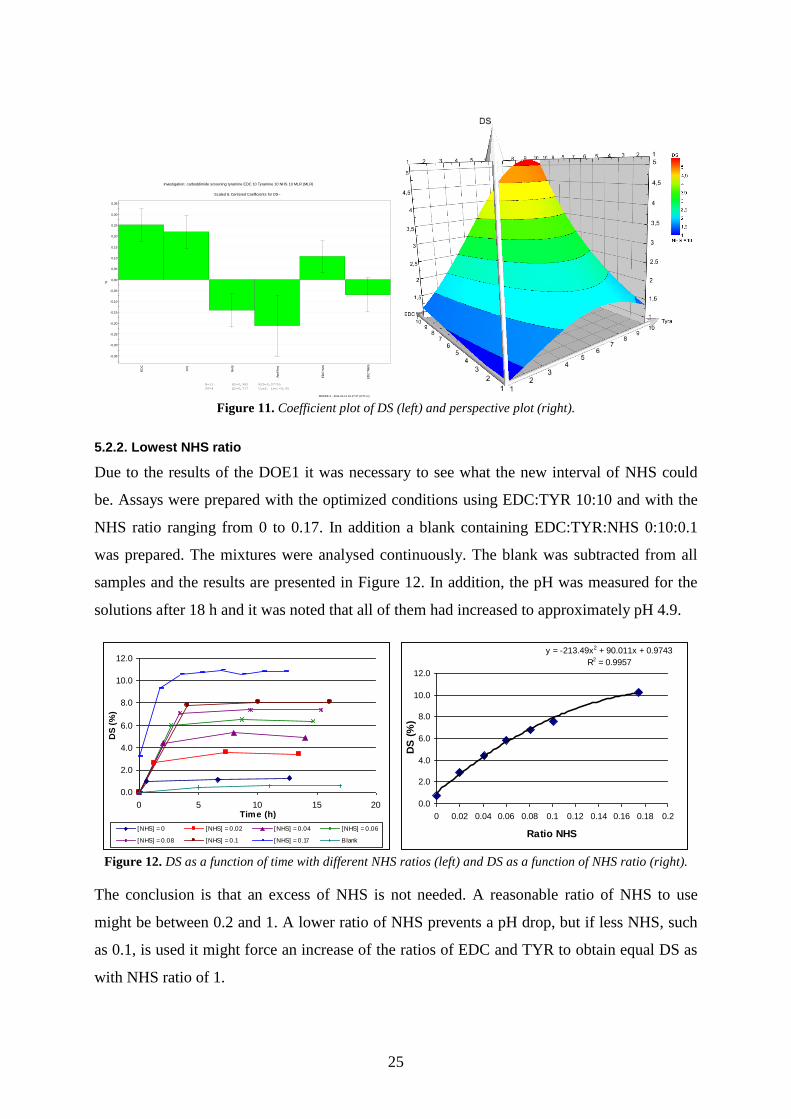
MODDE 9 - 2011-01-14 16:17:57 (UTC+1) Figure 11. Coefficient plot of DS (left) and perspective plot (right).
5.2.2. Lowest NHS ratio
Due to the results of the DOE1 it was necessary to see what the new interval of NHS could
be. Assays were prepared with the optimized conditions using EDC:TYR 10:10 and with the
NHS ratio ranging from 0 to 0.17. In addition a blank containing EDC:TYR:NHS 0:10:0.1
was prepared. The mixtures were analysed continuously. The blank was subtracted from all
samples and the results are presented in Figure 12. In addition, the pH was measured for the
solutions after 18 h and it was noted that all of them had increased to approximately pH 4.9.
0.0
2.0
4.0
6.0
8.0
10.0
12.0
0 5 10 15 20Time (h)
DS
(%
)
[NHS] = 0 [NHS] = 0.02 [NHS] = 0.04 [NHS] = 0.06
[NHS] = 0.08 [NHS] = 0.1 [NHS] = 0.17 Blank
y = -213.49x2 + 90.011x + 0.9743
R2 = 0.9957
0.0
2.0
4.0
6.0
8.0
10.0
12.0
0 0.02 0.04 0.06 0.08 0.1 0.12 0.14 0.16 0.18 0.2
Ratio NHS
DS
(%
)
Figure 12. DS as a function of time with different NHS ratios (left) and DS as a function of NHS ratio (right).
The conclusion is that an excess of NHS is not needed. A reasonable ratio of NHS to use
might be between 0.2 and 1. A lower ratio of NHS prevents a pH drop, but if less NHS, such
as 0.1, is used it might force an increase of the ratios of EDC and TYR to obtain equal DS as
with NHS ratio of 1.
26
5.2.3. DOE2
The ratio of NHS was reduced to the range of 0.1 to 1 and the ratios of EDC and TYR to 1-5.
the pH difference at the end of the reaction was measured and is presented as ΔpH. The assay
and results are presented in Table 5.
Table 5. DOE2 set-up and results.
Exp. EDC TYR NHS DS (%) ΔpH
1 1 1 0.1 0.89 0.07
2 5 1 0.1 1.93 0.14
3 1 5 0.1 2.61 0.11
4 5 5 0.1 6.04 0.22
5 1 1 1 0.34 0
6 5 1 1 2.22 0
7 1 5 1 1.57 0
8 5 5 1 7.87 0.08
9 3 3 0.55 4.21 0
10 3 3 0.55 4.44 0
11 3 3 0.55 4.37 0
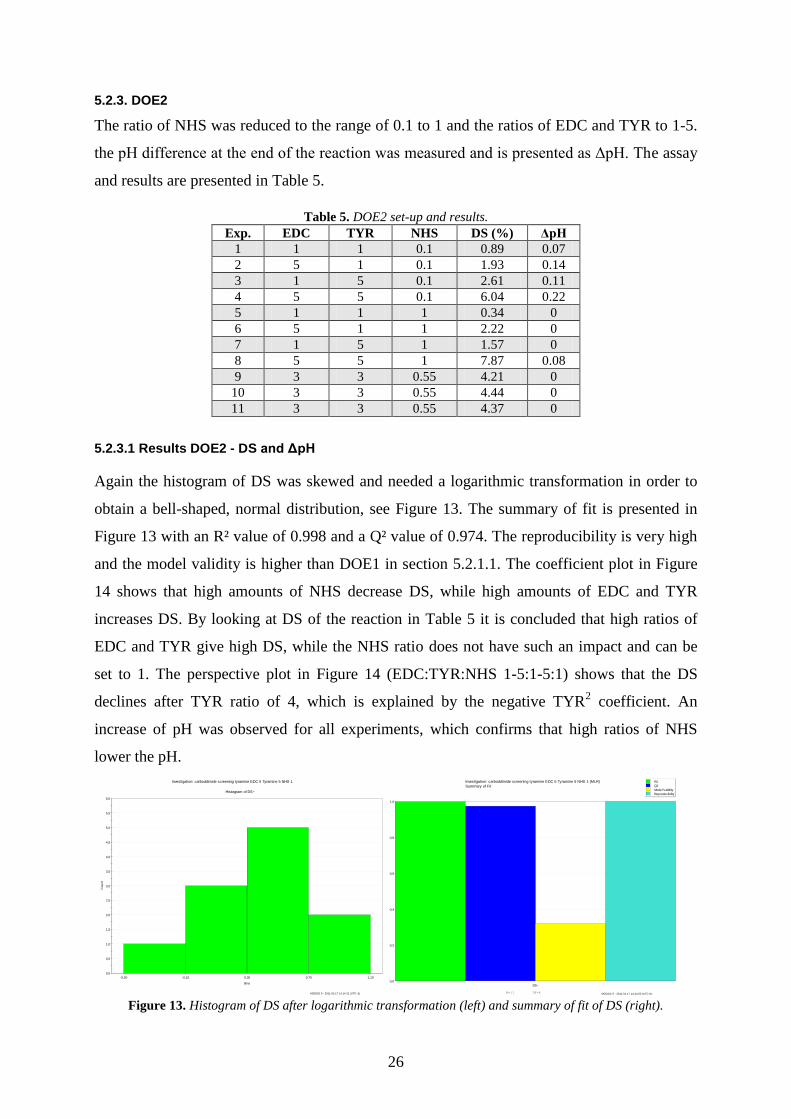
5.2.3.1 Results DOE2 - DS and ΔpH
Again the histogram of DS was skewed and needed a logarithmic transformation in order to
obtain a bell-shaped, normal distribution, see Figure 13. The summary of fit is presented in
Figure 13 with an R² value of 0.998 and a Q² value of 0.974. The reproducibility is very high
and the model validity is higher than DOE1 in section 5.2.1.1. The coefficient plot in Figure
14 shows that high amounts of NHS decrease DS, while high amounts of EDC and TYR
increases DS. By looking at DS of the reaction in Table 5 it is concluded that high ratios of
EDC and TYR give high DS, while the NHS ratio does not have such an impact and can be
set to 1. The perspective plot in Figure 14 (EDC:TYR:NHS 1-5:1-5:1) shows that the DS
declines after TYR ratio of 4, which is explained by the negative TYR2 coefficient. An
increase of pH was observed for all experiments, which confirms that high ratios of NHS
lower the pH.
0,0
0,5
1,0
1,5
2,0
2,5
3,0
3,5
4,0
4,5
5,0
5,5
6,0
-0,50 -0,10 0,30 0,70 1,10
Count
Bins
Histogram of DS~
Investigation: carboddimide screening tyramine EDC 5 Tyramine 5 NHS 1
MODDE 9 - 2011-01-17 14:14:31 (UTC+1)
0,0
0,2
0,4
0,6
0,8
1,0
DS~
Investigation: carboddimide screening tyramine EDC 5 Tyramine 5 NHS 1 (MLR)
Summary of Fit
N=11 DF=4
R2
Q2
Model Validity
Reproducibility
MODDE 9 - 2011-01-17 14:14:00 (UTC+1) Figure 13. Histogram of DS after logarithmic transformation (left) and summary of fit of DS (right).
27
-0,35
-0,30
-0,25
-0,20
-0,15
-0,10
-0,05
0,00
0,05
0,10
0,15
0,20
0,25
0,30
ED
C
Am
i
NH
S
Am
i*A
mi
ED
C*N
HS
Am
i*N
HS
%
Scaled & Centered Coefficients for DS~
N=11 R2=0,998 RSD=0,02565
DF=4 Q2=0,975 Conf. lev.=0,95
Investigation: carboddimide screening tyramine EDC 5 Tyramine 5 NHS 1 (MLR)
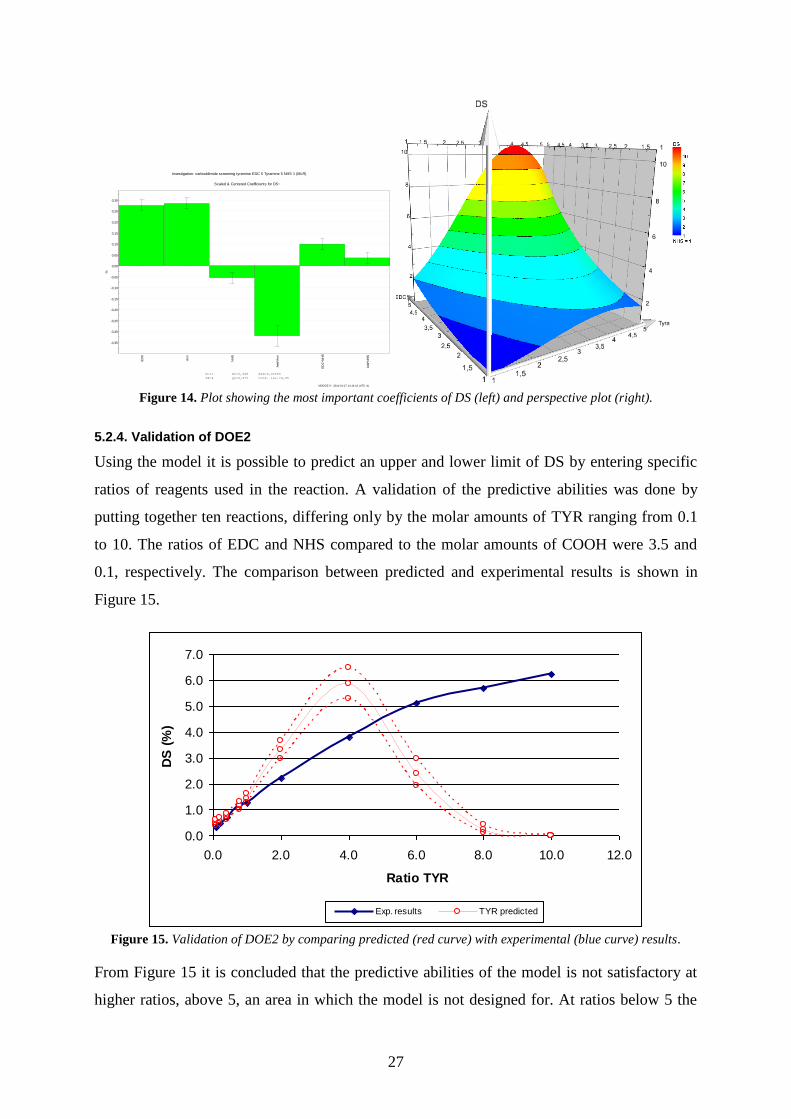
MODDE 9 - 2011-01-17 14:14:16 (UTC+1) Figure 14. Plot showing the most important coefficients of DS (left) and perspective plot (right).
5.2.4. Validation of DOE2
Using the model it is possible to predict an upper and lower limit of DS by entering specific
ratios of reagents used in the reaction. A validation of the predictive abilities was done by
putting together ten reactions, differing only by the molar amounts of TYR ranging from 0.1
to 10. The ratios of EDC and NHS compared to the molar amounts of COOH were 3.5 and
0.1, respectively. The comparison between predicted and experimental results is shown in
Figure 15.
0.0
1.0
2.0
3.0
4.0
5.0
6.0
7.0
0.0 2.0 4.0 6.0 8.0 10.0 12.0
Ratio TYR
DS
(%
)
Exp. results TYR predicted
Figure 15. Validation of DOE2 by comparing predicted (red curve) with experimental (blue curve) results.
From Figure 15 it is concluded that the predictive abilities of the model is not satisfactory at
higher ratios, above 5, an area in which the model is not designed for. At ratios below 5 the
28
experimental results does not match with the predicted, which may be attributed to the
dominating TYR² coefficient in Figure 14. The validation shows that the model can not be
used to predict experimental values and thus does not represent the reaction.
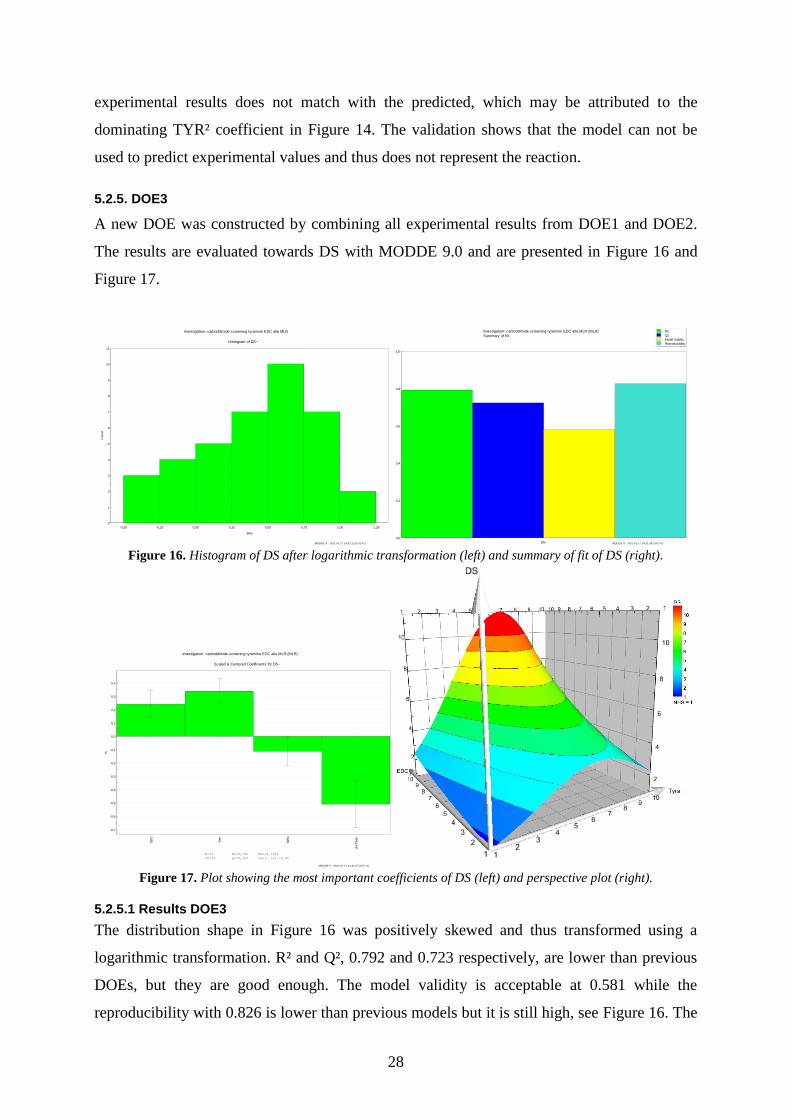
5.2.5. DOE3
A new DOE was constructed by combining all experimental results from DOE1 and DOE2.
The results are evaluated towards DS with MODDE 9.0 and are presented in Figure 16 and
Figure 17.
0
1
2
3
4
5
6
7
8
9
10
11
-0,50 -0,25 0,00 0,25 0,50 0,75 1,00 1,25
Count
Bins
Histogram of DS~
Investigation: carboddimide screening tyramine EDC alla MLR
MODDE 9 - 2011-01-17 14:32:23 (UTC+1)
0,0
0,2
0,4
0,6
0,8
1,0
DS~
Investigation: carboddimide screening tyramine EDC alla MLR (MLR)
Summary of Fit
R2
Q2
Model Validity
Reproducibility
MODDE 9 - 2011-01-17 14:31:58 (UTC+1) Figure 16. Histogram of DS after logarithmic transformation (left) and summary of fit of DS (right).
-0,7
-0,6
-0,5
-0,4
-0,3
-0,2
-0,1
0,0
0,1
0,2
0,3
0,4
ED
C
Am
i
NH
S
Am
i*A
mi
%
Scaled & Centered Coefficients for DS~
N=38 R2=0,792 RSD=0,1963
DF=33 Q2=0,723 Conf. lev.=0,95
Investigation: carboddimide screening tyramine EDC alla MLR (MLR)
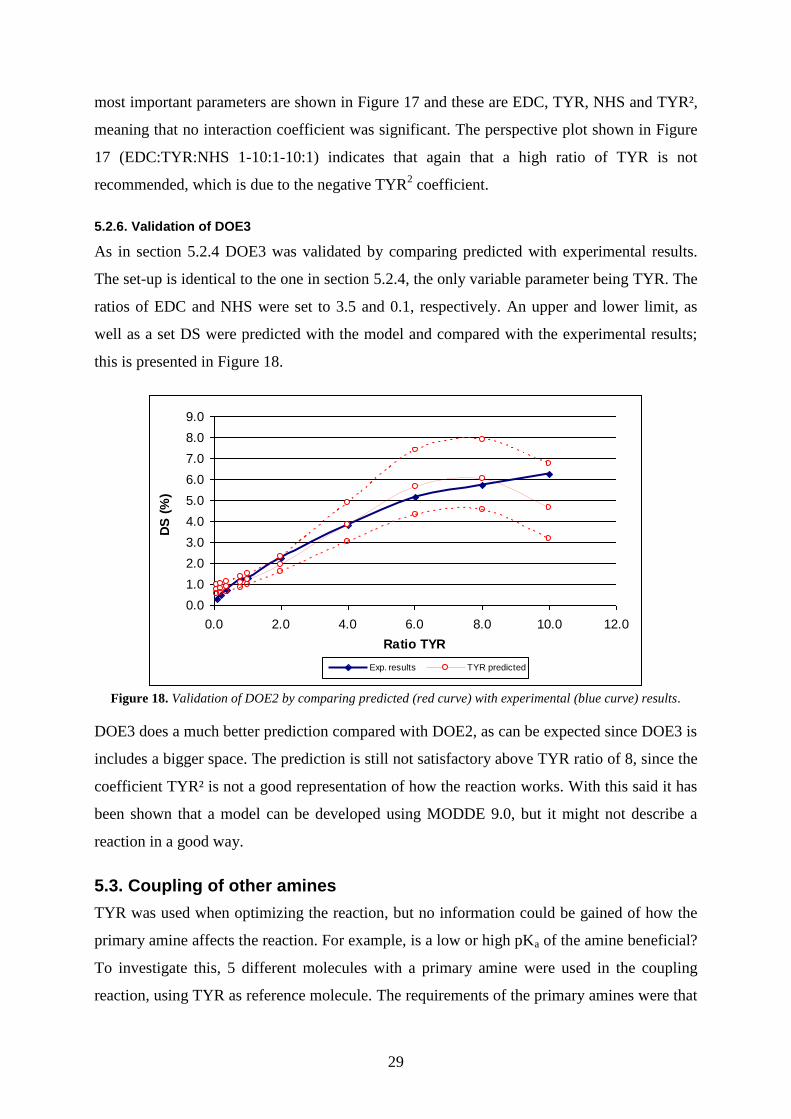
MODDE 9 - 2011-01-17 14:32:07 (UTC+1) Figure 17. Plot showing the most important coefficients of DS (left) and perspective plot (right).
5.2.5.1 Results DOE3
The distribution shape in Figure 16 was positively skewed and thus transformed using a
logarithmic transformation. R² and Q², 0.792 and 0.723 respectively, are lower than previous
DOEs, but they are good enough. The model validity is acceptable at 0.581 while the
reproducibility with 0.826 is lower than previous models but it is still high, see Figure 16. The
29
most important parameters are shown in Figure 17 and these are EDC, TYR, NHS and TYR²,
meaning that no interaction coefficient was significant. The perspective plot shown in Figure
17 (EDC:TYR:NHS 1-10:1-10:1) indicates that again that a high ratio of TYR is not
recommended, which is due to the negative TYR2 coefficient.
5.2.6. Validation of DOE3
As in section 5.2.4 DOE3 was validated by comparing predicted with experimental results.
The set-up is identical to the one in section 5.2.4, the only variable parameter being TYR. The
ratios of EDC and NHS were set to 3.5 and 0.1, respectively. An upper and lower limit, as
well as a set DS were predicted with the model and compared with the experimental results;
this is presented in Figure 18.
0.0
1.0
2.0
3.0
4.0
5.0
6.0
7.0
8.0
9.0
0.0 2.0 4.0 6.0 8.0 10.0 12.0
Ratio TYR
DS
(%
)
Exp. results TYR predicted
Figure 18. Validation of DOE2 by comparing predicted (red curve) with experimental (blue curve) results.
DOE3 does a much better prediction compared with DOE2, as can be expected since DOE3 is
includes a bigger space. The prediction is still not satisfactory above TYR ratio of 8, since the
coefficient TYR² is not a good representation of how the reaction works. With this said it has
been shown that a model can be developed using MODDE 9.0, but it might not describe a
reaction in a good way.
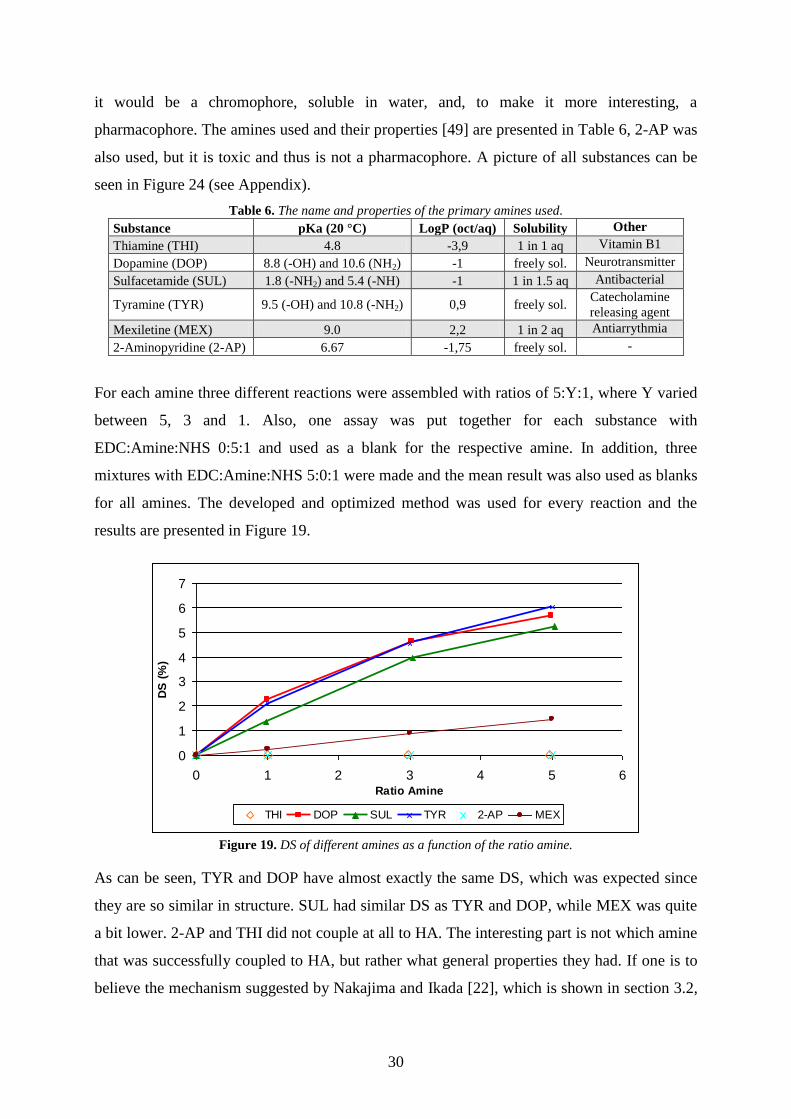
5.3. Coupling of other amines
TYR was used when optimizing the reaction, but no information could be gained of how the
primary amine affects the reaction. For example, is a low or high pKa of the amine beneficial?
To investigate this, 5 different molecules with a primary amine were used in the coupling
reaction, using TYR as reference molecule. The requirements of the primary amines were that
30
it would be a chromophore, soluble in water, and, to make it more interesting, a
pharmacophore. The amines used and their properties [49] are presented in Table 6, 2-AP was
also used, but it is toxic and thus is not a pharmacophore. A picture of all substances can be
seen in Figure 24 (see Appendix).
Table 6. The name and properties of the primary amines used.
Substance pKa (20 °C) LogP (oct/aq) Solubility Other
Thiamine (THI) 4.8 -3,9 1 in 1 aq Vitamin B1
Dopamine (DOP) 8.8 (-OH) and 10.6 (NH2) -1 freely sol. Neurotransmitter
Sulfacetamide (SUL) 1.8 (-NH2) and 5.4 (-NH) -1 1 in 1.5 aq Antibacterial
Tyramine (TYR) 9.5 (-OH) and 10.8 (-NH2) 0,9 freely sol. Catecholamine
releasing agent
Mexiletine (MEX) 9.0 2,2 1 in 2 aq Antiarrythmia
2-Aminopyridine (2-AP) 6.67 -1,75 freely sol. -
For each amine three different reactions were assembled with ratios of 5:Y:1, where Y varied
between 5, 3 and 1. Also, one assay was put together for each substance with
EDC:Amine:NHS 0:5:1 and used as a blank for the respective amine. In addition, three
mixtures with EDC:Amine:NHS 5:0:1 were made and the mean result was also used as blanks
for all amines. The developed and optimized method was used for every reaction and the
results are presented in Figure 19.
0
1
2
3
4
5
6
7
0 1 2 3 4 5 6Ratio Amine
DS
(%
)
THI DOP SUL TYR 2-AP MEX
Figure 19. DS of different amines as a function of the ratio amine.
As can be seen, TYR and DOP have almost exactly the same DS, which was expected since
they are so similar in structure. SUL had similar DS as TYR and DOP, while MEX was quite
a bit lower. 2-AP and THI did not couple at all to HA. The interesting part is not which amine
that was successfully coupled to HA, but rather what general properties they had. If one is to
believe the mechanism suggested by Nakajima and Ikada [22], which is shown in section 3.2,
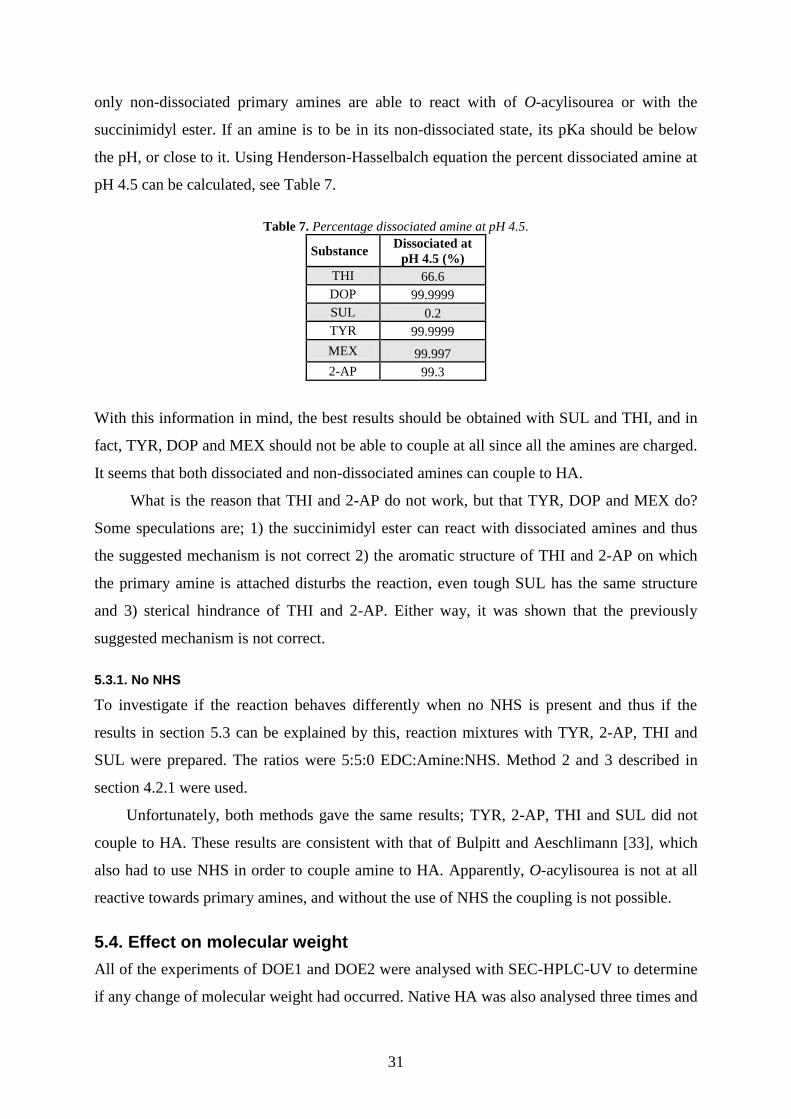
31
only non-dissociated primary amines are able to react with of O-acylisourea or with the
succinimidyl ester. If an amine is to be in its non-dissociated state, its pKa should be below
the pH, or close to it. Using Henderson-Hasselbalch equation the percent dissociated amine at
pH 4.5 can be calculated, see Table 7.
Table 7. Percentage dissociated amine at pH 4.5.
Substance Dissociated at
pH 4.5 (%)
THI 66.6
DOP 99.9999
SUL 0.2
TYR 99.9999
MEX 99.997
2-AP 99.3
With this information in mind, the best results should be obtained with SUL and THI, and in
fact, TYR, DOP and MEX should not be able to couple at all since all the amines are charged.
It seems that both dissociated and non-dissociated amines can couple to HA.
What is the reason that THI and 2-AP do not work, but that TYR, DOP and MEX do?
Some speculations are; 1) the succinimidyl ester can react with dissociated amines and thus
the suggested mechanism is not correct 2) the aromatic structure of THI and 2-AP on which
the primary amine is attached disturbs the reaction, even tough SUL has the same structure
and 3) sterical hindrance of THI and 2-AP. Either way, it was shown that the previously
suggested mechanism is not correct.
5.3.1. No NHS
To investigate if the reaction behaves differently when no NHS is present and thus if the
results in section 5.3 can be explained by this, reaction mixtures with TYR, 2-AP, THI and
SUL were prepared. The ratios were 5:5:0 EDC:Amine:NHS. Method 2 and 3 described in
section 4.2.1 were used.
Unfortunately, both methods gave the same results; TYR, 2-AP, THI and SUL did not
couple to HA. These results are consistent with that of Bulpitt and Aeschlimann [33], which
also had to use NHS in order to couple amine to HA. Apparently, O-acylisourea is not at all
reactive towards primary amines, and without the use of NHS the coupling is not possible.
5.4. Effect on molecular weight
All of the experiments of DOE1 and DOE2 were analysed with SEC-HPLC-UV to determine
if any change of molecular weight had occurred. Native HA was also analysed three times and
32
the mean used as reference. The analyses were evaluated towards Mn and Mw using the
calibration curve obtained and compared with native HA (see section 4.5). Table 11, which is
located in section 8.1 in the appendices, shows the experiments and the results.
The results show clearly that Mw and Mn have increased, in some cases doubled, because
of the carbodiimide coupling. There are two possibilites; 1) hydrodynamic volume has
increased due to the coupling of TYR, which makes derivatized HA elute faster than native
HA, and hence a higher Mw and Mn, which are not correct, are obtained. 2) the molecular
weight has increased because of cross-linking between HA polysaccharides. If primary amine
is present on native HA the possibility of cross-linking is available.
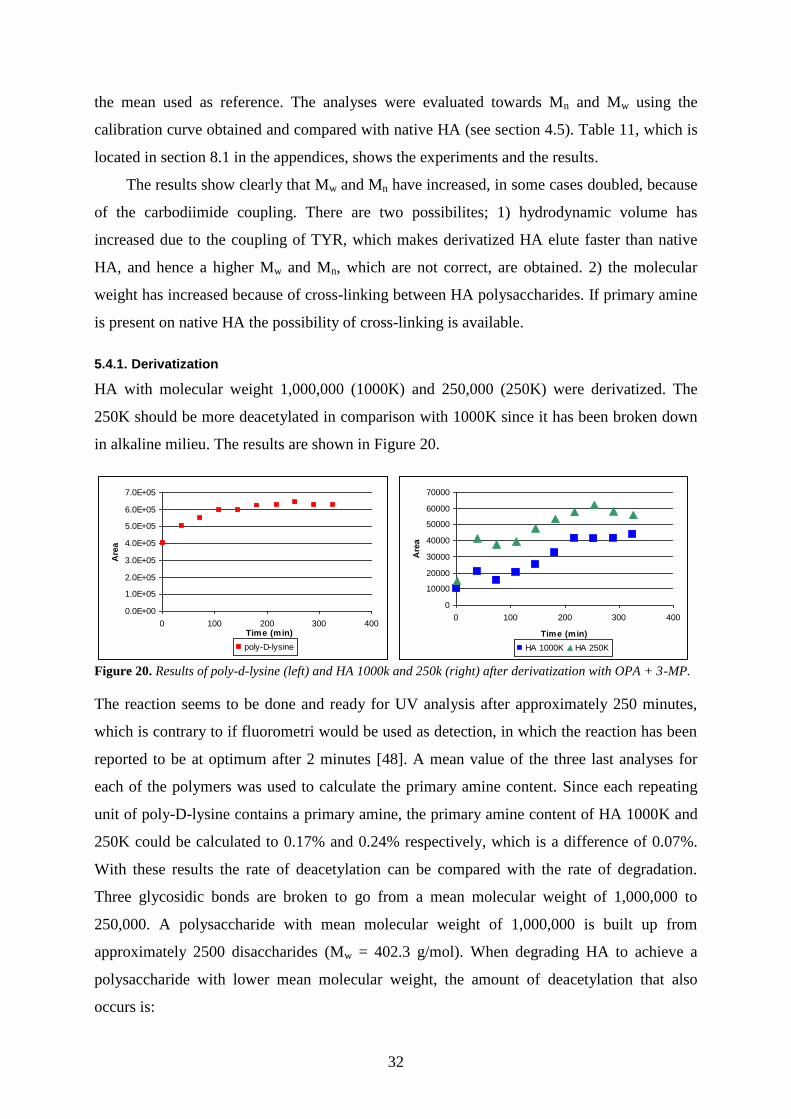
5.4.1. Derivatization
HA with molecular weight 1,000,000 (1000K) and 250,000 (250K) were derivatized. The
250K should be more deacetylated in comparison with 1000K since it has been broken down
in alkaline milieu. The results are shown in Figure 20.
0.0E+00
1.0E+05
2.0E+05
3.0E+05
4.0E+05
5.0E+05
6.0E+05
7.0E+05
0 100 200 300 400Time (min)
Are
a
poly-D-lysine
0
10000
20000
30000
40000
50000
60000
70000
0 100 200 300 400
Time (min)
Are
a
HA 1000K HA 250K
Figure 20. Results of poly-d-lysine (left) and HA 1000k and 250k (right) after derivatization with OPA + 3-MP.
The reaction seems to be done and ready for UV analysis after approximately 250 minutes,
which is contrary to if fluorometri would be used as detection, in which the reaction has been
reported to be at optimum after 2 minutes [48]. A mean value of the three last analyses for
each of the polymers was used to calculate the primary amine content. Since each repeating
unit of poly-D-lysine contains a primary amine, the primary amine content of HA 1000K and
250K could be calculated to 0.17% and 0.24% respectively, which is a difference of 0.07%.
With these results the rate of deacetylation can be compared with the rate of degradation.
Three glycosidic bonds are broken to go from a mean molecular weight of 1,000,000 to
250,000. A polysaccharide with mean molecular weight of 1,000,000 is built up from
approximately 2500 disaccharides (Mw = 402.3 g/mol). When degrading HA to achieve a
polysaccharide with lower mean molecular weight, the amount of deacetylation that also
occurs is:
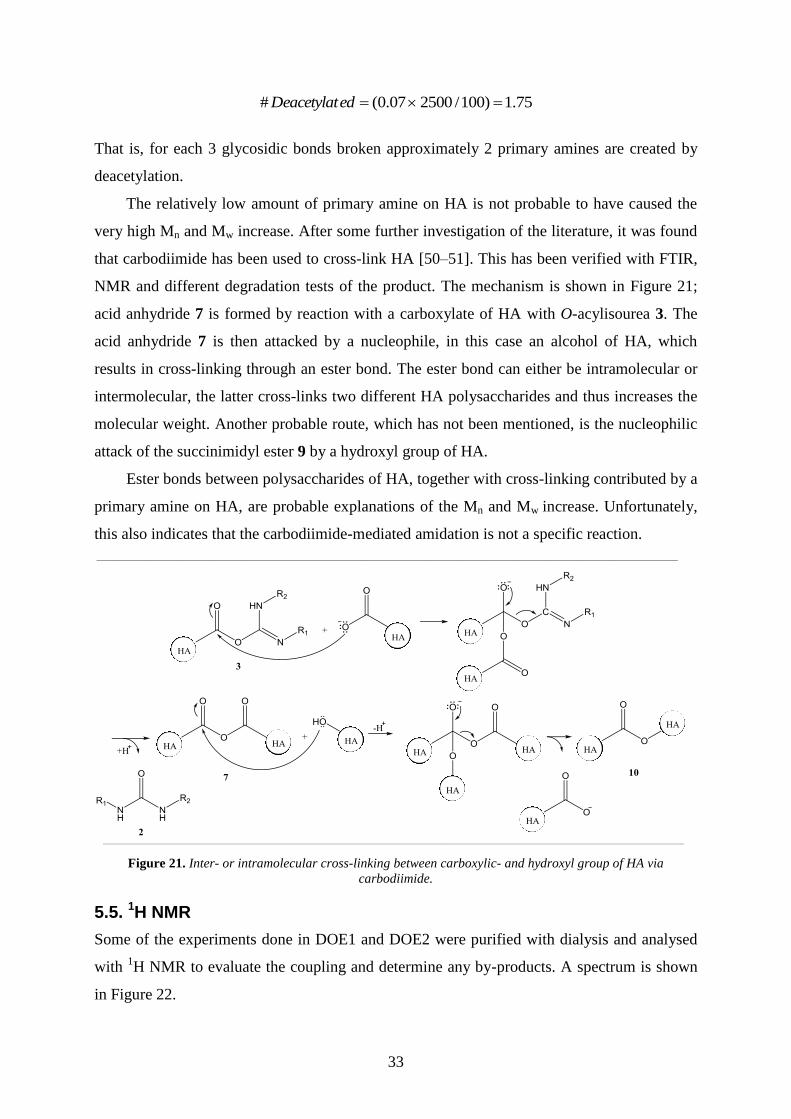
33
75.1)100/250007.0(# edDeacetylat
That is, for each 3 glycosidic bonds broken approximately 2 primary amines are created by
deacetylation.
The relatively low amount of primary amine on HA is not probable to have caused the
very high Mn and Mw increase. After some further investigation of the literature, it was found
that carbodiimide has been used to cross-link HA [50–51]. This has been verified with FTIR,
NMR and different degradation tests of the product. The mechanism is shown in Figure 21;
acid anhydride 7 is formed by reaction with a carboxylate of HA with O-acylisourea 3. The
acid anhydride 7 is then attacked by a nucleophile, in this case an alcohol of HA, which
results in cross-linking through an ester bond. The ester bond can either be intramolecular or
intermolecular, the latter cross-links two different HA polysaccharides and thus increases the
molecular weight. Another probable route, which has not been mentioned, is the nucleophilic
attack of the succinimidyl ester 9 by a hydroxyl group of HA.
Ester bonds between polysaccharides of HA, together with cross-linking contributed by a
primary amine on HA, are probable explanations of the Mn and Mw increase. Unfortunately,
this also indicates that the carbodiimide-mediated amidation is not a specific reaction.
Figure 21. Inter- or intramolecular cross-linking between carboxylic- and hydroxyl group of HA via
carbodiimide.
5.5. 1H NMR
Some of the experiments done in DOE1 and DOE2 were purified with dialysis and analysed
with 1H NMR to evaluate the coupling and determine any by-products. A spectrum is shown
in Figure 22.
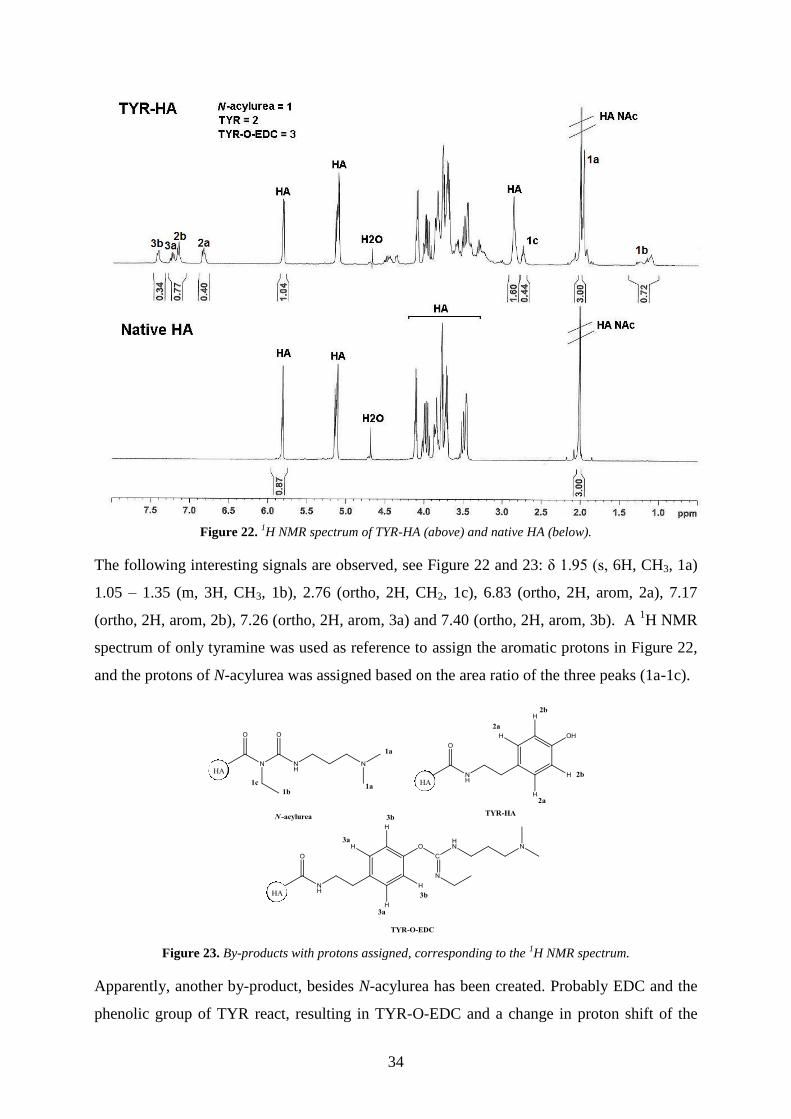
34
Figure 22.
1H NMR spectrum of TYR-HA (above) and native HA (below).
The following interesting signals are observed, see Figure 22 and 23: δ 1.95 (s, 6H, CH3, 1a)
1.05 – 1.35 (m, 3H, CH3, 1b), 2.76 (ortho, 2H, CH2, 1c), 6.83 (ortho, 2H, arom, 2a), 7.17
(ortho, 2H, arom, 2b), 7.26 (ortho, 2H, arom, 3a) and 7.40 (ortho, 2H, arom, 3b). A 1H NMR
spectrum of only tyramine was used as reference to assign the aromatic protons in Figure 22,
and the protons of N-acylurea was assigned based on the area ratio of the three peaks (1a-1c).
Figure 23. By-products with protons assigned, corresponding to the 1H NMR spectrum.
Apparently, another by-product, besides N-acylurea has been created. Probably EDC and the
phenolic group of TYR react, resulting in TYR-O-EDC and a change in proton shift of the
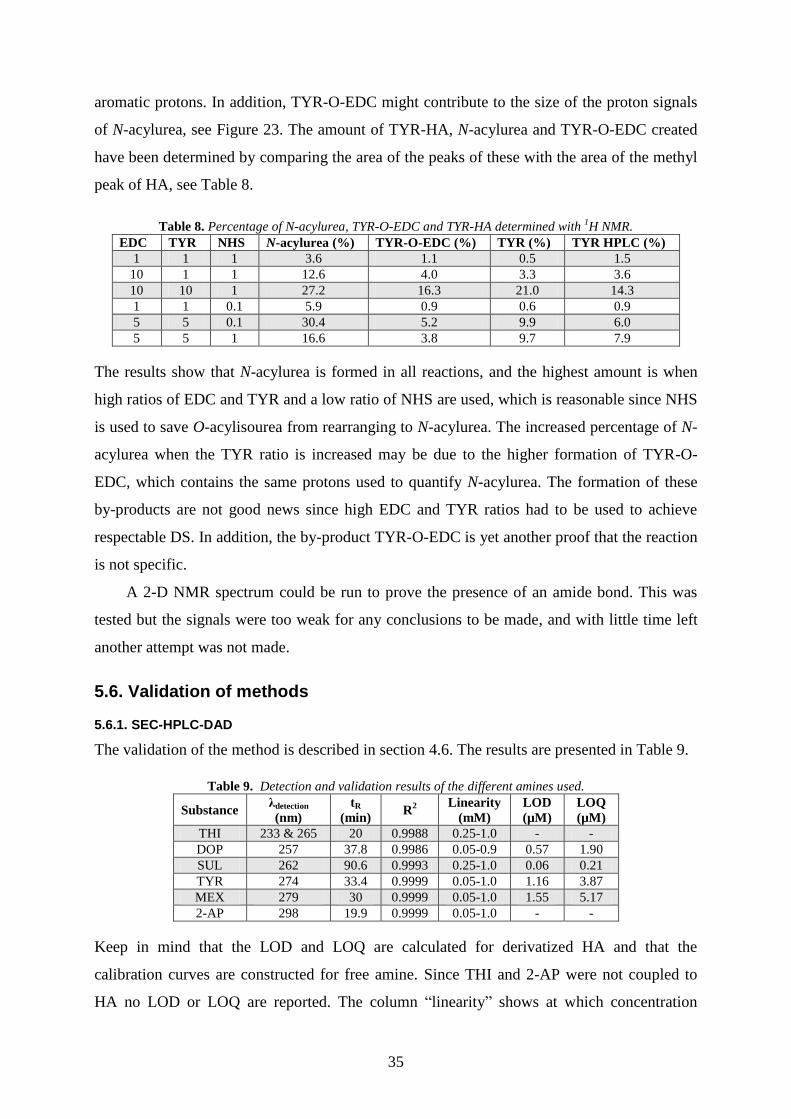
35
aromatic protons. In addition, TYR-O-EDC might contribute to the size of the proton signals
of N-acylurea, see Figure 23. The amount of TYR-HA, N-acylurea and TYR-O-EDC created
have been determined by comparing the area of the peaks of these with the area of the methyl
peak of HA, see Table 8.
Table 8. Percentage of N-acylurea, TYR-O-EDC and TYR-HA determined with 1H NMR.
EDC TYR NHS N-acylurea (%) TYR-O-EDC (%) TYR (%) TYR HPLC (%)
1 1 1 3.6 1.1 0.5 1.5
10 1 1 12.6 4.0 3.3 3.6
10 10 1 27.2 16.3 21.0 14.3
1 1 0.1 5.9 0.9 0.6 0.9
5 5 0.1 30.4 5.2 9.9 6.0
5 5 1 16.6 3.8 9.7 7.9
The results show that N-acylurea is formed in all reactions, and the highest amount is when
high ratios of EDC and TYR and a low ratio of NHS are used, which is reasonable since NHS
is used to save O-acylisourea from rearranging to N-acylurea. The increased percentage of N-
acylurea when the TYR ratio is increased may be due to the higher formation of TYR-O-
EDC, which contains the same protons used to quantify N-acylurea. The formation of these
by-products are not good news since high EDC and TYR ratios had to be used to achieve
respectable DS. In addition, the by-product TYR-O-EDC is yet another proof that the reaction
is not specific.
A 2-D NMR spectrum could be run to prove the presence of an amide bond. This was
tested but the signals were too weak for any conclusions to be made, and with little time left
another attempt was not made.
5.6. Validation of methods
5.6.1. SEC-HPLC-DAD
The validation of the method is described in section 4.6. The results are presented in Table 9.
Table 9. Detection and validation results of the different amines used.
Substance λdetection
(nm)
tR
(min) R
2
Linearity
(mM)
LOD
(µM)
LOQ
(µM)
THI 233 & 265 20 0.9988 0.25-1.0 - -
DOP 257 37.8 0.9986 0.05-0.9 0.57 1.90
SUL 262 90.6 0.9993 0.25-1.0 0.06 0.21
TYR 274 33.4 0.9999 0.05-1.0 1.16 3.87
MEX 279 30 0.9999 0.05-1.0 1.55 5.17
2-AP 298 19.9 0.9999 0.05-1.0 - -
Keep in mind that the LOD and LOQ are calculated for derivatized HA and that the
calibration curves are constructed for free amine. Since THI and 2-AP were not coupled to
HA no LOD or LOQ are reported. The column “linearity” shows at which concentration
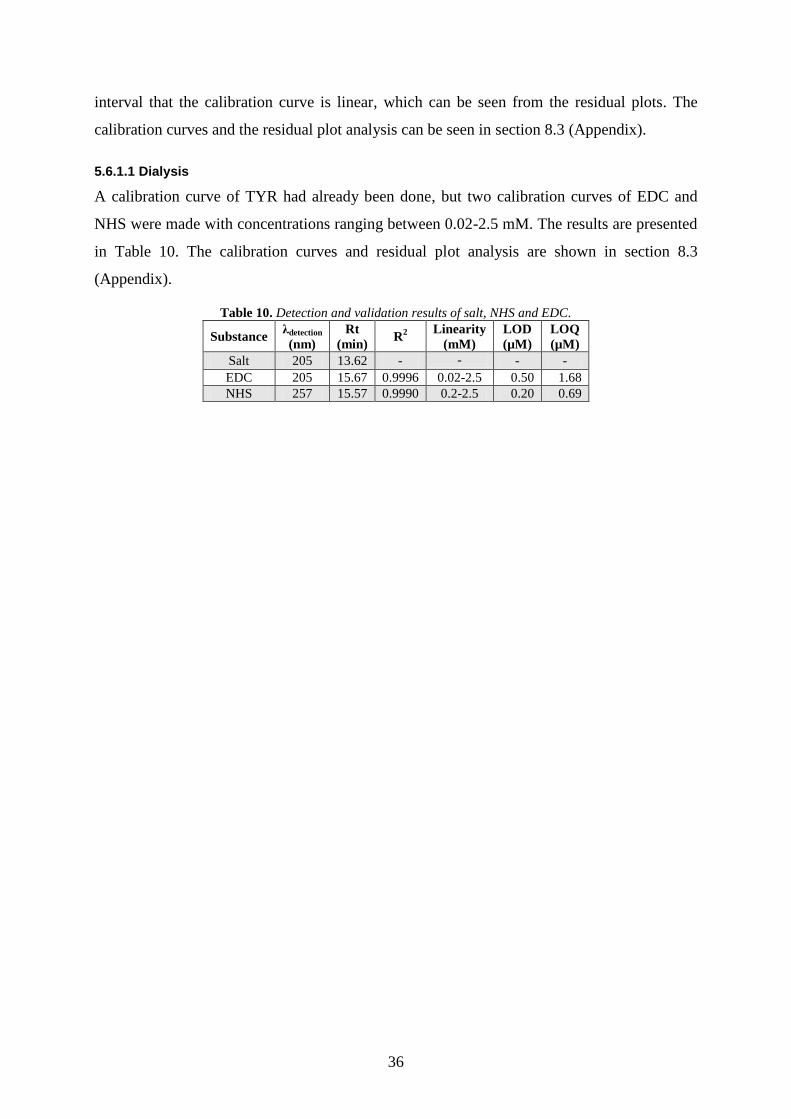
36
interval that the calibration curve is linear, which can be seen from the residual plots. The
calibration curves and the residual plot analysis can be seen in section 8.3 (Appendix).
5.6.1.1 Dialysis
A calibration curve of TYR had already been done, but two calibration curves of EDC and
NHS were made with concentrations ranging between 0.02-2.5 mM. The results are presented
in Table 10. The calibration curves and residual plot analysis are shown in section 8.3
(Appendix).
Table 10. Detection and validation results of salt, NHS and EDC.
Substance λdetection
(nm)
Rt
(min) R
2
Linearity
(mM)
LOD
(µM)
LOQ
(µM)
Salt 205 13.62 - - - -
EDC 205 15.67 0.9996 0.02-2.5 0.50 1.68
NHS 257 15.57 0.9990 0.2-2.5 0.20 0.69
37
6. Conclusion
This thesis has shown that the carbodiimide-mediated amidation introduces primary amines
on HA. The corresponding urea which is formed when the carbodiimide reacts with the
carboxylic acid of HA was shown to be prone to rearrangement and unreactive towards
primary amines. NHS was used as some sort of catalyst to circumvent this, replacing the
carbodiimide urea with a hydrolysis-stable succinimidyl ester which is reactive towards
primary amines. But, 1H NMR proved that the rearrangement product of the urea, which is
covalently attached to HA, was readily formed in solution regardless of the experimental set-
up. Also, it was shown with 1H NMR that the carbodiimide reacts with phenols, indicating a
very non-specific reaction. The reaction was performed at acidic pH and even though NHS
was used the degree of substitution was proven to be quite low (5-15%). It was shown that the
amidation is successful whether the primary amine is dissociated or non-dissociated, which
conflicts with the previous suggested mechanism, but the requirements of the amine were not
thoroughly investigated. A big increase of Mn and Mw were observed, which was first
attributed to the determined primary amine content of 0.17% for native HA, which can induce
cross-linking, but it was later found out that the carbodiimide reaction has also been used to
cross-link the hydroxyl- and carboxyl group of HA via an ester bond, which also seemed to be
the case here.
The carbodiimide-mediated amidation is an unspecific reaction with a covalently
attached by-product that seems to be uncontrollable. The reaction is not suited for the
coupling of primary amines to HA.

38
7. Acknowledgments
I would like to give a heartfelt and big thanks to my supervisor Anders Karlsson for his
support, endless advice and always positive spirit. Also, I want to thank Lars Nord for helping
me with the NMR and Lennart Kenne for his wise words. To all the kind people at Q-MED
who have made me feel more than welcome during my master thesis: thank you.
39
References
[1] Meyer K. and Palmer J.W. The polysaccharide of vitreous humor, J. Biol. Chem., 1934, 107, 629-634
[2] Garg H. G. and Hales C. A. Chemistry and biology of Hyaluronan, 2004, Elsevier Ltd.
[3] Price R. D., Berry M. G. and Navsaria H. A. Hyaluronic acid: the scientific and clinical evidence, J. Plastic.
Reconstructive Aesthetic Surgery, 2007, 60, 1110-1119
[4] Balazs E. A. The role of hyaluronan in the structure and function of the biomatrix and connective tissues,
Struct Chem, 2009, 20, 233-243
[5] Boas N. F. Isolation of hyaluronic acid from cock’s comb, J. Biol. Chem., 1949, 181, 573-575
[6] Kendall F .E., Heidelberger M. and Dawson M.. H. A serologically inactive polysaccharide elaborated by
mucoid strains of group A hemolytic streptococcus, J. Biol. Chem., 1937, 118, 61-69
[7] Laurent T. C., Laurent U. B. G. and Fraser J. B. E. Function of hyaluronan, Annals of Rheumatic Diseases,
1995, 54, 429-432
[8] Rwei S. P., Chen S. W., Mao C. F. and Fang, H. W. Viscoelasticity and weariability of hyaluronate solutions,
Biochem. Eng. J., 2008, 40, 211-217
[9] Laurent U. B. G. and Reed R. K. Turnover of hyaluronan in the tissues. Adv. Drug Del. Rev., 1991, 7, 237-
256
[10] Rah M.. J.. A review of Hyaluronan and its ophthalmic applications, Optometry, 2011, 82, 38-43
[11] Altman R. D., Åkerman C, Beaulieu A. D. and Schnitzer T. Efficacy and safety of a single intra-articular
injection of non-animal stabilized hyaluronic acid (NASHA) in patients with osteoarthritis of the knee, Ostearthr
Cartilage 2004, 12, 642-649
[12] Davidenko N., Campbell J. J., Thian E. S., Watson C. J. and Cameron R. E. Collagen-hyaluronic acid
scaffolds for adipose tissue engineering, Acta biomaterialia, 2010, 6, 3957-3968
[13] Kafedjiiski K., Jetti R. K. R., Föger F., Hoyer H., Werle M., Hoffer M. and Bernkop-Schnürch A. Synthesis
and in vitro evaluation of thiolated hyaluronic acid for mucoadhesive drug delivery, Int J Pharm, 2007, 343, 48-
58
[14] Sánches-Carpintero I., Candelas D. and Ruiz-Rodríguez R. Dermal fillers: types, indications, and
complications, 2010, 101 (5), 381-393
[15] Lin K., Barlett S. P., Matsuo K., LiVolsi V. A., Parry C., Hass B. and Whitaker L. A., Hyaluronic acid-
filled mammary implants: an experimental study, Plast Reconstr Surg, 1994, 94, 306-315
[16] Puri P., Pirker M., Mohanan N., Dawrant M., Dass L. and Colhoun E. Subureteral dextranomer/hyaluronic
acid as first line treatment in the management of high grade vesicoureteral reflux, J. Urology, 2006, 176, 1856-
1860
[17] Balazs E. A, Leshchiner A, Leshchiner A, Larsen N. E. and Band P. Method for preparing hylan and novel
hylan product. EU Pat. Appl. EP19880311301 19881129, 14.06.89
[18] Balazs E. A., Leshchiner A., Cross-linked gels of hyaluronic acid and products containing such gels. U.S.
Pat. Appl. Publ., 4,605,691, 12.08.86
[19] Laurent T. C., Hellsing K. and Gelotte B. Cross-linked gels of hyaluronic acid, Acta. Chem. Scand., 1964,
18 (1), 274
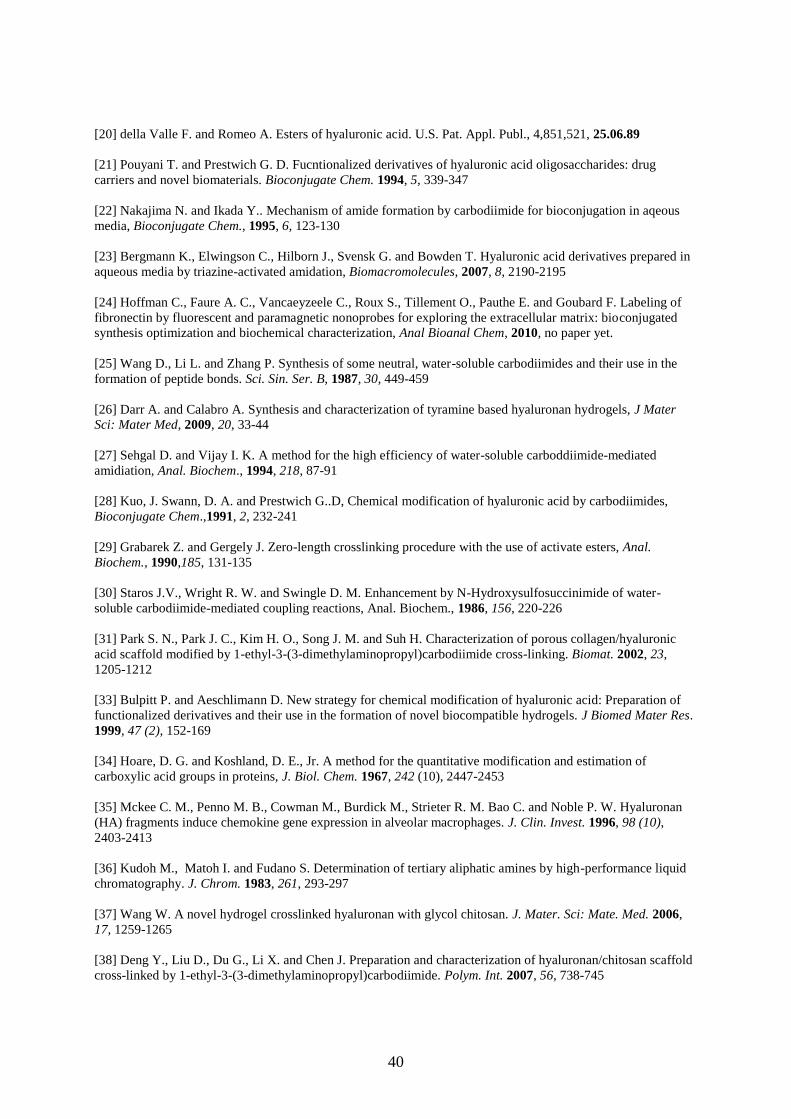
40
[20] della Valle F. and Romeo A. Esters of hyaluronic acid. U.S. Pat. Appl. Publ., 4,851,521, 25.06.89
[21] Pouyani T. and Prestwich G. D. Fucntionalized derivatives of hyaluronic acid oligosaccharides: drug
carriers and novel biomaterials. Bioconjugate Chem. 1994, 5, 339-347
[22] Nakajima N. and Ikada Y.. Mechanism of amide formation by carbodiimide for bioconjugation in aqeous
media, Bioconjugate Chem., 1995, 6, 123-130
[23] Bergmann K., Elwingson C., Hilborn J., Svensk G. and Bowden T. Hyaluronic acid derivatives prepared in
aqueous media by triazine-activated amidation, Biomacromolecules, 2007, 8, 2190-2195
[24] Hoffman C., Faure A. C., Vancaeyzeele C., Roux S., Tillement O., Pauthe E. and Goubard F. Labeling of
fibronectin by fluorescent and paramagnetic nonoprobes for exploring the extracellular matrix: bioconjugated
synthesis optimization and biochemical characterization, Anal Bioanal Chem, 2010, no paper yet.
[25] Wang D., Li L. and Zhang P. Synthesis of some neutral, water-soluble carbodiimides and their use in the
formation of peptide bonds. Sci. Sin. Ser. B, 1987, 30, 449-459
[26] Darr A. and Calabro A. Synthesis and characterization of tyramine based hyaluronan hydrogels, J Mater
Sci: Mater Med, 2009, 20, 33-44
[27] Sehgal D. and Vijay I. K. A method for the high efficiency of water-soluble carboddiimide-mediated
amidiation, Anal. Biochem., 1994, 218, 87-91
[28] Kuo, J. Swann, D. A. and Prestwich G..D, Chemical modification of hyaluronic acid by carbodiimides,
Bioconjugate Chem.,1991, 2, 232-241
[29] Grabarek Z. and Gergely J. Zero-length crosslinking procedure with the use of activate esters, Anal.
Biochem., 1990,185, 131-135
[30] Staros J.V., Wright R. W. and Swingle D. M. Enhancement by N-Hydroxysulfosuccinimide of water-
soluble carbodiimide-mediated coupling reactions, Anal. Biochem., 1986, 156, 220-226
[31] Park S. N., Park J. C., Kim H. O., Song J. M. and Suh H. Characterization of porous collagen/hyaluronic
acid scaffold modified by 1-ethyl-3-(3-dimethylaminopropyl)carbodiimide cross-linking. Biomat. 2002, 23,
1205-1212
[33] Bulpitt P. and Aeschlimann D. New strategy for chemical modification of hyaluronic acid: Preparation of
functionalized derivatives and their use in the formation of novel biocompatible hydrogels. J Biomed Mater Res.
1999, 47 (2), 152-169
[34] Hoare, D. G. and Koshland, D. E., Jr. A method for the quantitative modification and estimation of
carboxylic acid groups in proteins, J. Biol. Chem. 1967, 242 (10), 2447-2453
[35] Mckee C. M., Penno M. B., Cowman M., Burdick M., Strieter R. M. Bao C. and Noble P. W. Hyaluronan
(HA) fragments induce chemokine gene expression in alveolar macrophages. J. Clin. Invest. 1996, 98 (10),
2403-2413
[36] Kudoh M., Matoh I. and Fudano S. Determination of tertiary aliphatic amines by high-performance liquid
chromatography. J. Chrom. 1983, 261, 293-297
[37] Wang W. A novel hydrogel crosslinked hyaluronan with glycol chitosan. J. Mater. Sci: Mate. Med. 2006,
17, 1259-1265
[38] Deng Y., Liu D., Du G., Li X. and Chen J. Preparation and characterization of hyaluronan/chitosan scaffold
cross-linked by 1-ethyl-3-(3-dimethylaminopropyl)carbodiimide. Polym. Int. 2007, 56, 738-745
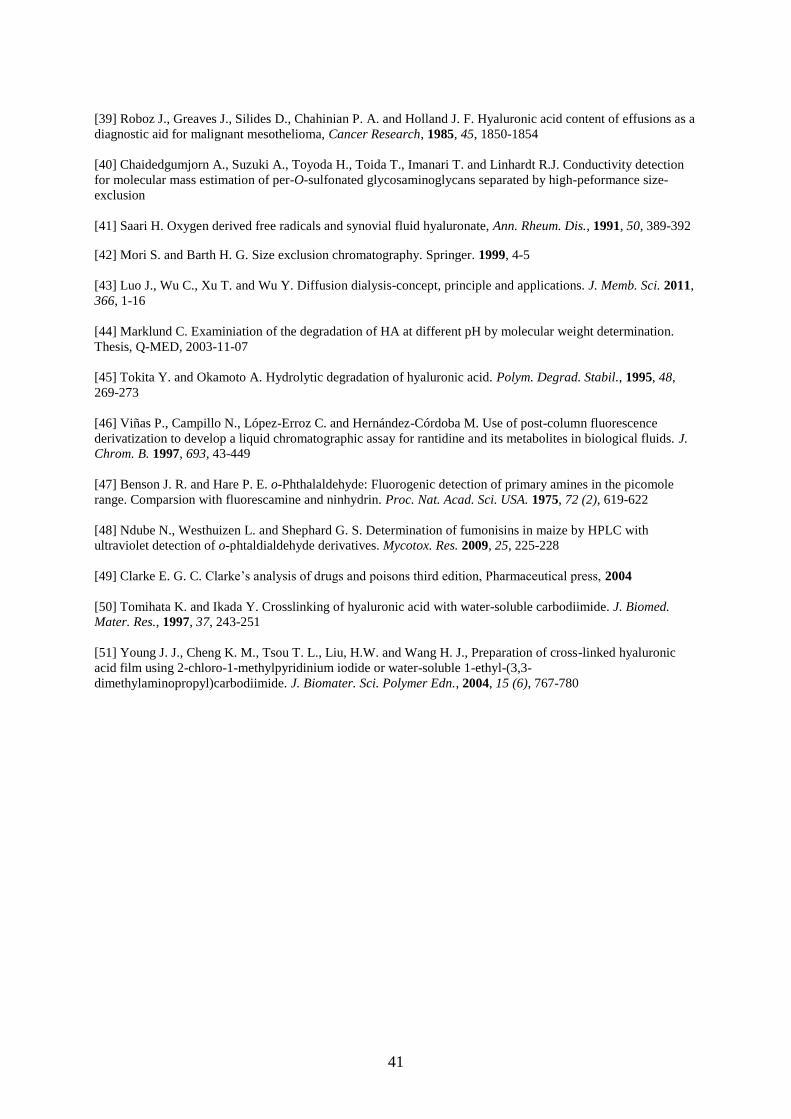
41
[39] Roboz J., Greaves J., Silides D., Chahinian P. A. and Holland J. F. Hyaluronic acid content of effusions as a
diagnostic aid for malignant mesothelioma, Cancer Research, 1985, 45, 1850-1854
[40] Chaidedgumjorn A., Suzuki A., Toyoda H., Toida T., Imanari T. and Linhardt R.J. Conductivity detection
for molecular mass estimation of per-O-sulfonated glycosaminoglycans separated by high-peformance size-
exclusion
[41] Saari H. Oxygen derived free radicals and synovial fluid hyaluronate, Ann. Rheum. Dis., 1991, 50, 389-392
[42] Mori S. and Barth H. G. Size exclusion chromatography. Springer. 1999, 4-5
[43] Luo J., Wu C., Xu T. and Wu Y. Diffusion dialysis-concept, principle and applications. J. Memb. Sci. 2011,
366, 1-16
[44] Marklund C. Examiniation of the degradation of HA at different pH by molecular weight determination.
Thesis, Q-MED, 2003-11-07
[45] Tokita Y. and Okamoto A. Hydrolytic degradation of hyaluronic acid. Polym. Degrad. Stabil., 1995, 48,
269-273
[46] Viñas P., Campillo N., López-Erroz C. and Hernández-Córdoba M. Use of post-column fluorescence
derivatization to develop a liquid chromatographic assay for rantidine and its metabolites in biological fluids. J.
Chrom. B. 1997, 693, 43-449
[47] Benson J. R. and Hare P. E. o-Phthalaldehyde: Fluorogenic detection of primary amines in the picomole
range. Comparsion with fluorescamine and ninhydrin. Proc. Nat. Acad. Sci. USA. 1975, 72 (2), 619-622
[48] Ndube N., Westhuizen L. and Shephard G. S. Determination of fumonisins in maize by HPLC with
ultraviolet detection of o-phtaldialdehyde derivatives. Mycotox. Res. 2009, 25, 225-228
[49] Clarke E. G. C. Clarke’s analysis of drugs and poisons third edition, Pharmaceutical press, 2004
[50] Tomihata K. and Ikada Y. Crosslinking of hyaluronic acid with water-soluble carbodiimide. J. Biomed.
Mater. Res., 1997, 37, 243-251
[51] Young J. J., Cheng K. M., Tsou T. L., Liu, H.W. and Wang H. J., Preparation of cross-linked hyaluronic
acid film using 2-chloro-1-methylpyridinium iodide or water-soluble 1-ethyl-(3,3-
dimethylaminopropyl)carbodiimide. J. Biomater. Sci. Polymer Edn., 2004, 15 (6), 767-780

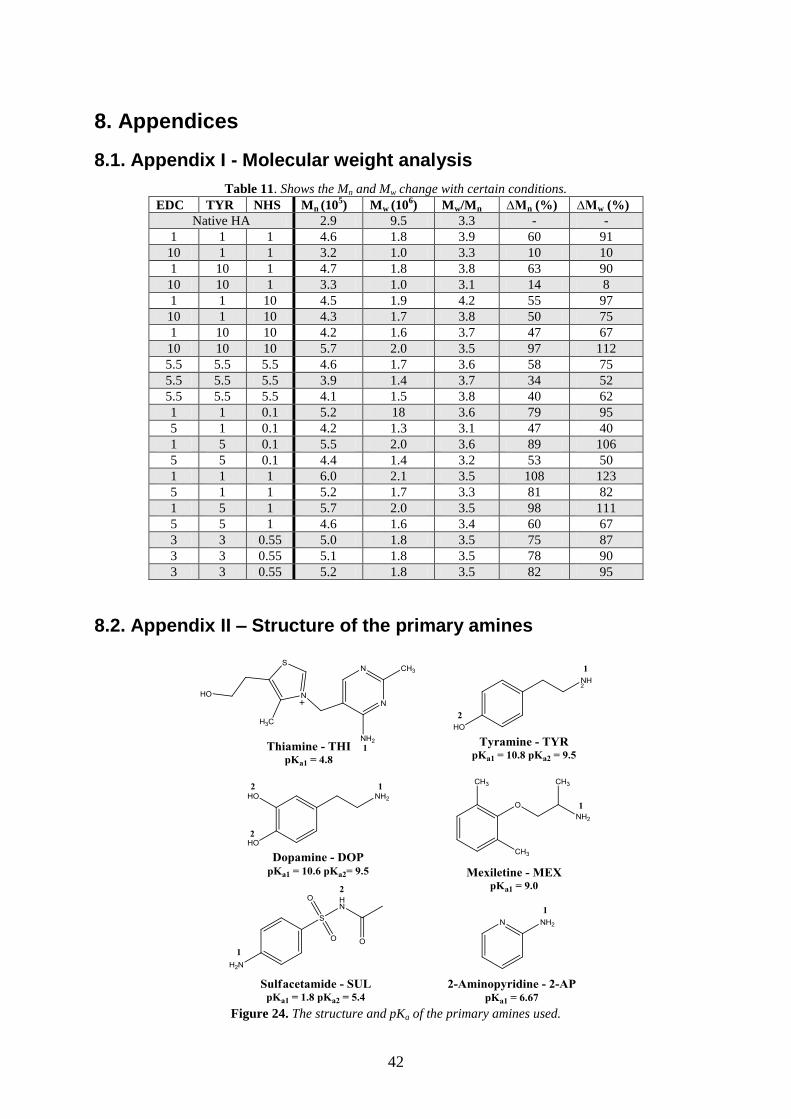
42
8. Appendices
8.1. Appendix I - Molecular weight analysis
Table 11. Shows the Mn and Mw change with certain conditions.
EDC TYR NHS Mn (105) Mw (10
6) Mw/Mn ∆Mn (%) ∆Mw (%)
Native HA 2.9 9.5 3.3 - -
1 1 1 4.6 1.8 3.9 60 91
10 1 1 3.2 1.0 3.3 10 10
1 10 1 4.7 1.8 3.8 63 90
10 10 1 3.3 1.0 3.1 14 8
1 1 10 4.5 1.9 4.2 55 97
10 1 10 4.3 1.7 3.8 50 75
1 10 10 4.2 1.6 3.7 47 67
10 10 10 5.7 2.0 3.5 97 112
5.5 5.5 5.5 4.6 1.7 3.6 58 75
5.5 5.5 5.5 3.9 1.4 3.7 34 52
5.5 5.5 5.5 4.1 1.5 3.8 40 62
1 1 0.1 5.2 18 3.6 79 95
5 1 0.1 4.2 1.3 3.1 47 40
1 5 0.1 5.5 2.0 3.6 89 106
5 5 0.1 4.4 1.4 3.2 53 50
1 1 1 6.0 2.1 3.5 108 123
5 1 1 5.2 1.7 3.3 81 82
1 5 1 5.7 2.0 3.5 98 111
5 5 1 4.6 1.6 3.4 60 67
3 3 0.55 5.0 1.8 3.5 75 87
3 3 0.55 5.1 1.8 3.5 78 90
3 3 0.55 5.2 1.8 3.5 82 95
8.2. Appendix II – Structure of the primary amines
Figure 24. The structure and pKa of the primary amines used.
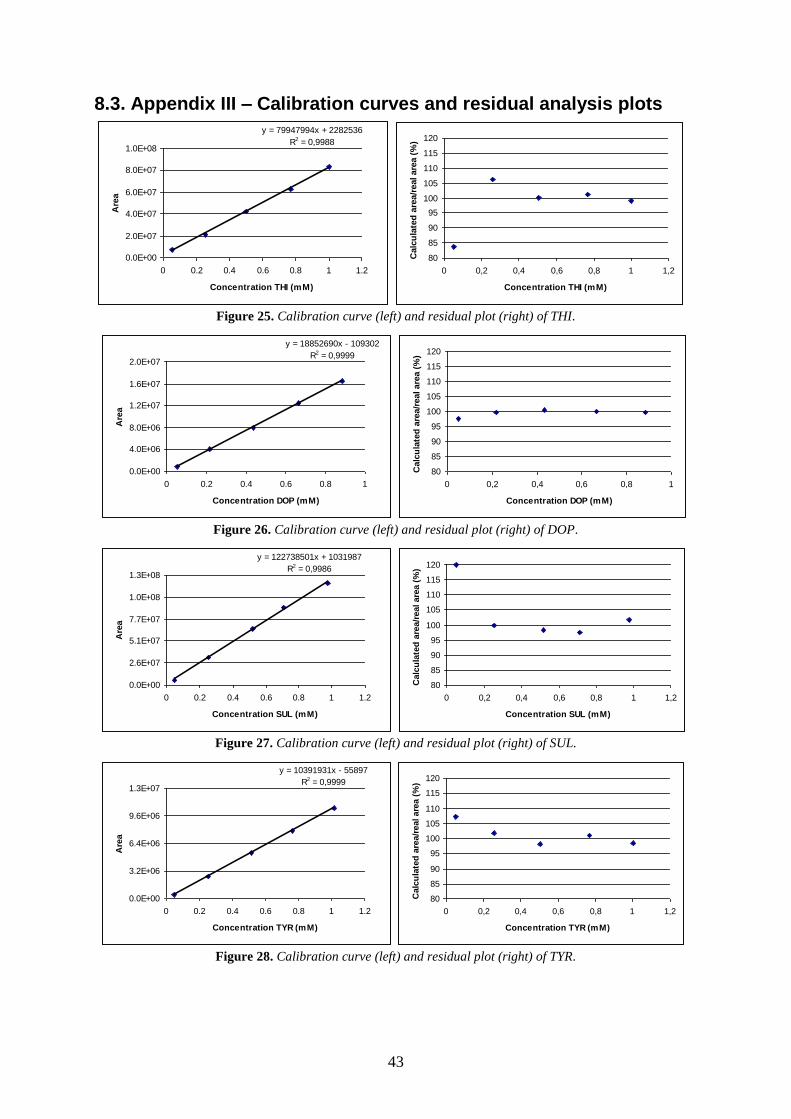
43
8.3. Appendix III – Calibration curves and residual analysis plots
y = 79947994x + 2282536
R2 = 0,9988
0.0E+00
2.0E+07
4.0E+07
6.0E+07
8.0E+07
1.0E+08
0 0.2 0.4 0.6 0.8 1 1.2
Concentration THI (mM)
Are
a
80
85
90
95
100
105
110
115
120
0 0,2 0,4 0,6 0,8 1 1,2
Concentration THI (mM)
Calc
ula
ted
are
a/r
eal are
a (
%)
Figure 25. Calibration curve (left) and residual plot (right) of THI.
y = 18852690x - 109302
R2 = 0,9999
0.0E+00
4.0E+06
8.0E+06
1.2E+07
1.6E+07
2.0E+07
0 0.2 0.4 0.6 0.8 1
Concentration DOP (mM)
Are
a
80
85
90
95
100
105
110
115
120
0 0,2 0,4 0,6 0,8 1
Concentration DOP (mM)
Calc
ula
ted
are
a/r
eal are
a (
%)
Figure 26. Calibration curve (left) and residual plot (right) of DOP.
y = 122738501x + 1031987
R2 = 0,9986
0.0E+00
2.6E+07
5.1E+07
7.7E+07
1.0E+08
1.3E+08
0 0.2 0.4 0.6 0.8 1 1.2
Concentration SUL (mM)
Are
a
80
85
90
95
100
105
110
115
120
0 0,2 0,4 0,6 0,8 1 1,2
Concentration SUL (mM)
Calc
ula
ted
are
a/r
eal are
a (
%)
Figure 27. Calibration curve (left) and residual plot (right) of SUL.
y = 10391931x - 55897
R2 = 0,9999
0.0E+00
3.2E+06
6.4E+06
9.6E+06
1.3E+07
0 0.2 0.4 0.6 0.8 1 1.2
Concentration TYR (mM)
Are
a
80
85
90
95
100
105
110
115
120
0 0,2 0,4 0,6 0,8 1 1,2
Concentration TYR (mM)
Calc
ula
ted
are
a/r
eal are
a (
%)
Figure 28. Calibration curve (left) and residual plot (right) of TYR.
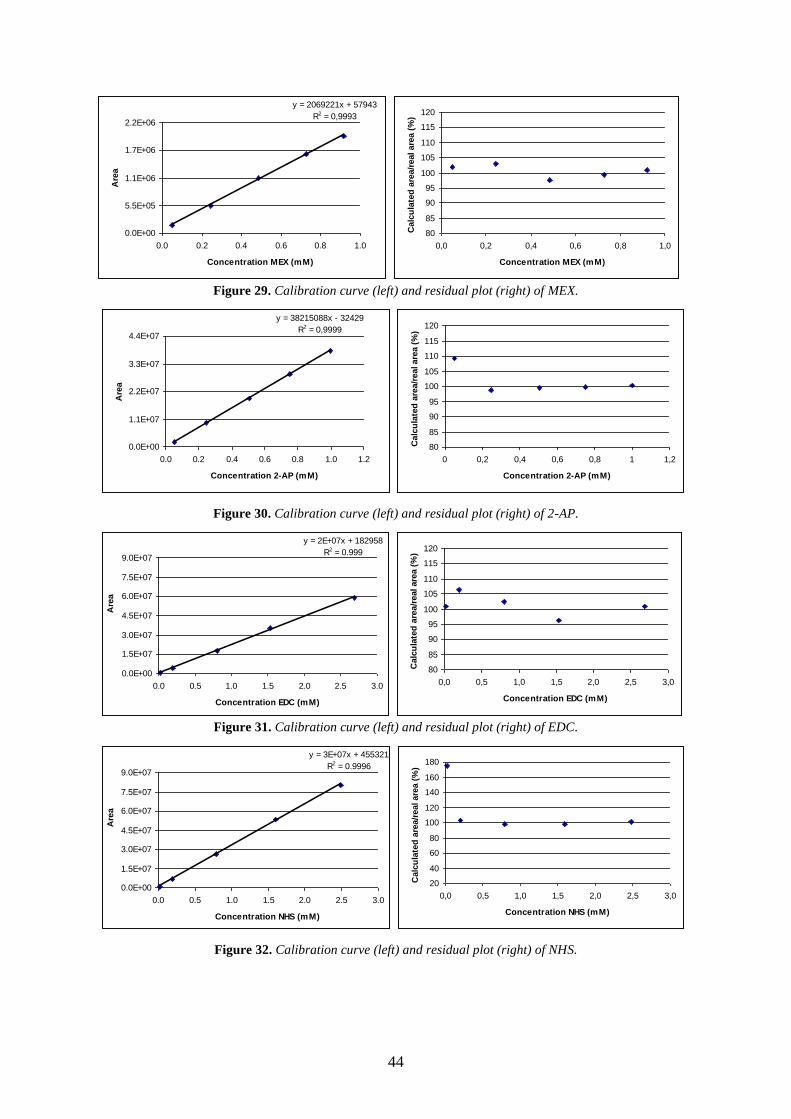
44
y = 2069221x + 57943
R2 = 0,9993
0.0E+00
5.5E+05
1.1E+06
1.7E+06
2.2E+06
0.0 0.2 0.4 0.6 0.8 1.0
Concentration MEX (mM)
Are
a
80
85
90
95
100
105
110
115
120
0,0 0,2 0,4 0,6 0,8 1,0
Concentration MEX (mM)
Calc
ula
ted
are
a/r
eal are
a (
%)
Figure 29. Calibration curve (left) and residual plot (right) of MEX.
y = 38215088x - 32429
R2 = 0,9999
0.0E+00
1.1E+07
2.2E+07
3.3E+07
4.4E+07
0.0 0.2 0.4 0.6 0.8 1.0 1.2
Concentration 2-AP (mM)
Are
a
80
85
90
95
100
105
110
115
120
0 0,2 0,4 0,6 0,8 1 1,2
Concentration 2-AP (mM)
Calc
ula
ted
are
a/r
eal are
a (
%)
Figure 30. Calibration curve (left) and residual plot (right) of 2-AP.
y = 2E+07x + 182958
R2 = 0.999
0.0E+00
1.5E+07
3.0E+07
4.5E+07
6.0E+07
7.5E+07
9.0E+07
0.0 0.5 1.0 1.5 2.0 2.5 3.0
Concentration EDC (mM)
Are
a
80
85
90
95
100
105
110
115
120
0,0 0,5 1,0 1,5 2,0 2,5 3,0
Concentration EDC (mM)
Calc
ula
ted
are
a/r
eal are
a (
%)
Figure 31. Calibration curve (left) and residual plot (right) of EDC.
y = 3E+07x + 455321
R2 = 0.9996
0.0E+00
1.5E+07
3.0E+07
4.5E+07
6.0E+07
7.5E+07
9.0E+07
0.0 0.5 1.0 1.5 2.0 2.5 3.0
Concentration NHS (mM)
Are
a
20
40
60
80
100
120
140
160
180
0,0 0,5 1,0 1,5 2,0 2,5 3,0
Concentration NHS (mM)
Calc
ula
ted
are
a/r
eal are
a (
%)
Figure 32. Calibration curve (left) and residual plot (right) of NHS.