Embed Size (px)
Citation preview

CO U N T Y PR O F I L E
S T R A T E G I E S T O M I T I G A T E T H E I M P A C T S O F N A T U R A L D I S A S T E R S O N
H U M A N L I F E A N D P R O P E R T Y
OVERVIEW ................................................................................................................................................. 1
CLIMATE .................................................................................................................................................... 4
POPULATION AND DEMOGRAPHICS ..................................................................................................... 4
POPULATION GROWTH ............................................................................................................................... 8
AGE ......................................................................................................................................................... 9
ETHNICITY .............................................................................................................................................. 11
EDUCATION ............................................................................................................................................. 13
HOUSEHOLD INCOME ............................................................................................................................... 15
ASSET INVENTORY ................................................................................................................................ 17
FUTURE DEVELOPMENT ....................................................................................................................... 18
ECONOMIC IMPACTS ................................................................................................................................ 20
CURRENT RESIDENTIAL AND COMMERCIAL DEVELOPMENT TRENDS .............................................................. 22
DEVELOPMENT CHANGES AFFECTING HAZARD RISK AND VULNERABILITY....................................................... 23
OVERVIEW
Otsego County covers one thousand and fifteen (1,015) square miles and encompasses the following
towns, villages, and city for an aggregate
population of 62,259, according to the 2010 U.S.
Census Bureau: Towns of Burlington, Butternuts,
Cherry Valley, Decatur, Edmeston, Exeter,
Hartwick, Laurens, Maryland, Middlefield, Milford,
Morris, New Lisbon, Oneonta, Otego, Otsego,
Pittsfield, Plainfield, Richfield, Roseboom,
Springfield, Unadilla, Westford, and Worcester;
Villages of Cherry Valley, Cooperstown,
Gilbertsville, Laurens, Milford, Morris, Otego,
Richfield Springs, and Unadilla; and the City of
Oneonta. Otsego County is located in central New
York State and belongs to the Southern Tier
region; it is bordered by Herkimer County to the
north, Montgomery County to the northeast, Schoharie County to the east, Delaware County to the south,
Chenango County to the southwest, Oneida County to the northwest, and Madison County to the northwest.
Otsego County has 12 square miles of water and is home to the Otsego, Canadarago, and Goodyear Lakes
and the Susquehanna and Unadilla Rivers. Otsego County is situated in the Allegheny Plateau and Catskill
Mountains, which is part of the Appalachian basin and includes mines and gas and oil wells throughout the
County.

County Profile
Page 2 | Otsego County | Hazard Mitigation Plan Update
Figure 3-1. Map of Otsego County Study Area
The map above, Figure 3-1, illustrates the extent of the study area, including the thirty-four participating
jurisdictions that form Otsego County. Provided in Table 3-1 below is a listing of the jurisdictions and
stakeholders in Otsego County that participated in the Hazard Mitigation Plan Update.

County Profile
Otsego County | Hazard Mitigation Plan Update | Page 3
Table 3-1. Participating Jurisdictions and Stakeholders in the Study Area
PARTICIPATING JURISDICTIONS PARTICIPATING STAKEHOLDERS
Otsego County Otsego County Soil and Water Conservation District
Town of Burlington
Town of Butternuts
Town of Cherry Valley
Village of Cherry Valley
Village of Cooperstown Bassett Hospital System
Town of Decatur
Town of Edmeston
Town of Exeter
Village of Gilbertsville
Town of Hartwick
Town of Laurens
Village of Laurens
Town of Maryland
Town of Middlefield
Town of Milford Milford Central School District
Village of Milford
Town of Morris Morris Central School District
Village of Morris
Town of New Lisbon
City of Oneonta
Town of Oneonta Hartwick College
Town of Otego Franklin Central School District
Village of Otego
Town of Otsego
Town of Pittsfield
Town of Plainfield

County Profile
Page 4 | Otsego County | Hazard Mitigation Plan Update
PARTICIPATING JURISDICTIONS PARTICIPATING STAKEHOLDERS
Town of Richfield
Village of Richfield Springs
Town of Roseboom
Town of Springfield
Town of Unadilla
Village of Unadilla
Town of Westford
Town of Worcester
CLIMATE
The climate in Otsego County is considered to be continental-humid with cold winters and mild summers,
having precipitation throughout the year. The annual average temperature is 44F with average
precipitation being 41.7 inches. The lowest recorded temperature was in 1934 at -34F.
POPULATION AND DEMOGRAPHICS
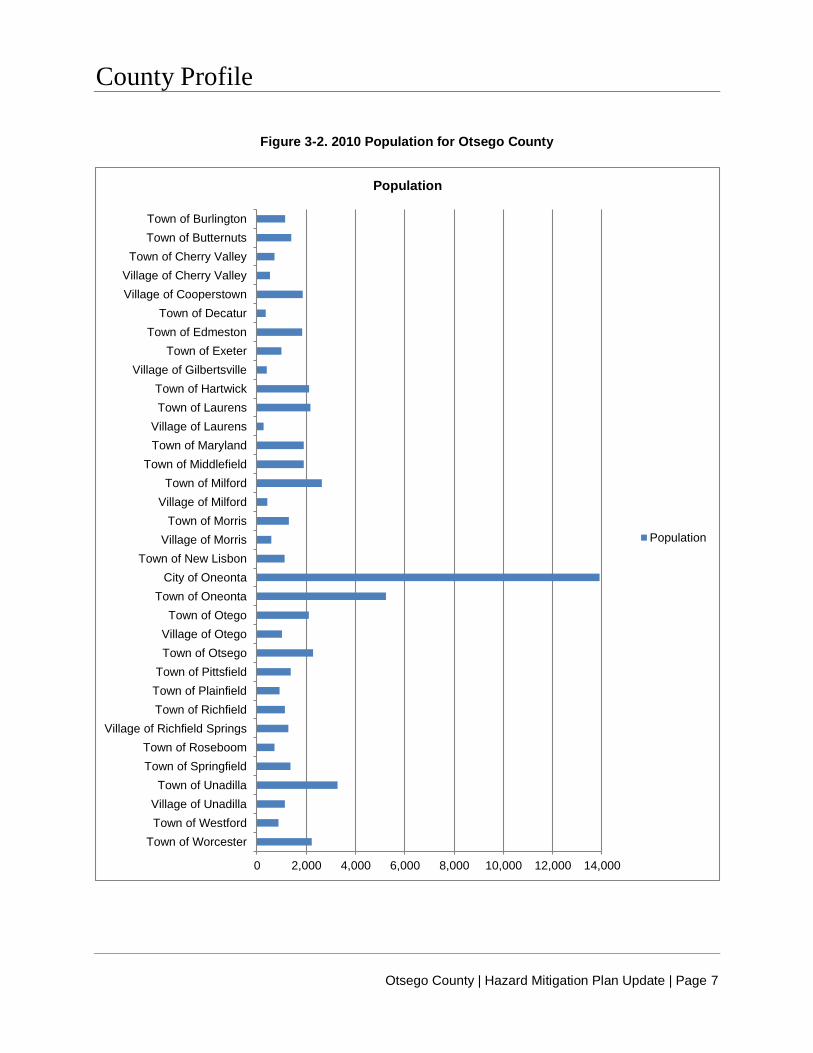
Otsego County has a population of 62,259, according to the 2010 U.S. Census Bureau. The City of Oneonta
is the largest jurisdiction in Otsego County, with 22.3 percent of the total population, with a population of
13,901. The Town of Oneonta is the second largest with its population accounting for 8.4 percent of the
Otsego County population. All of the other jurisdictions are small in comparison, each accounting for less
than 5.2 percent of the total population.
Table 3-2. Population Distribution by Jurisdiction
JURISDICTION 2010
POPULATION PERCENTAGE
ESTIMATED SPECIAL NEEDS
POPULATIONS
Elderly (Over
65)
Low Income
(</= $20,000)
Town of Burlington 1,140 1.8% 14.0% 9.3%
Town of Butternuts 1,387 2.2% 14.5% 11.4%
Town of Cherry Valley 703 1.1% 15.4% 10.2%
Village of Cherry Valley 520 0.8% 16.7% 13.1%

County Profile
Otsego County | Hazard Mitigation Plan Update | Page 5
JURISDICTION 2010
POPULATION PERCENTAGE
ESTIMATED SPECIAL NEEDS
POPULATIONS
Elderly (Over
65)
Low Income
(</= $20,000)
Village of Cooperstown1 1,852 3.0% 27.0% 19.7%
Town of Decatur 353 0.6% 17.3% 14.9%
Town of Edmeston 1,826 2.9% 14.6% 17.1%
Town of Exeter 987 1.6% 14.5% 15.0%
Village of Gilbertsville 399 0.6% 24.0% 14.3%
Town of Hartwick 2,110 3.4% 13.8% 17.1%
Town of Laurens 2,161 3.5% 13.2% 19.7%
Village of Laurens 263 0.4% 14.0% 20.3%
Town of Maryland 1,897 3.0% 15.1% 7.3%
Town of Middlefield 1,893 3.0% 22.3% 7.3%
Town of Milford2 2,629 4.2% 15.0% 17.6%
Village of Milford 415 0.7% 12.9% 11.4%
Town of Morris3 1,295 2.1% 13.5% 10.8%
Village of Morris 583 0.9% 17.5% 20.1%
Town of New Lisbon 1,114 1.8% 14.0% 7.3%
City of Oneonta 13,901 22.3% 11.8% 26.8%
Town of Oneonta4 5,229 8.4% 16.6% 21.2%
Town of Otego5 2,105 3.4% 14.1% 12.8%
Village of Otego 1,010 1.6% 14.1% 11.7%
Town of Otsego 2,269 3.6% 21.1% 14.4%
Town of Pittsfield 1,366 2.2% 11.7% 17.0%
1 For demographic information, Bassett Hospital System and Otsego County Soil and Water Conservation District are
included with the Village of Cooperstown. 2 For demographic information, Milford Central School District is included with the Town of Milford. 3 For demographic information, Morris Central School District is included with the Town of Morris. 4 For demographic information, Hartwick College is included with the Town of Oneonta. 5 For demographic information, Franklin Central School District is included with the Town of Otego.

County Profile
Page 6 | Otsego County | Hazard Mitigation Plan Update
JURISDICTION 2010
POPULATION PERCENTAGE
ESTIMATED SPECIAL NEEDS
POPULATIONS
Elderly (Over
65)
Low Income
(</= $20,000)
Town of Plainfield 915 1.5% 10.8% 17.0%
Town of Richfield 1,124 1.8% 21.0% 13.3%
Village of Richfield Springs 1,264 2.0% 23.1% 13.8%
Town of Roseboom 711 1.1% 12.7% 6.3%
Town of Springfield 1,358 2.2% 17.5% 14.8%
Town of Unadilla 3,264 5.2% 15.3% 10.5%
Village of Unadilla 1,128 1.8% 17.1% 15.3%
Town of Westford 868 1.4% 15.0% 11.8%
Town of Worcester 2,220 3.6% 16.6% 13.6%
Otsego County Total 62,259 100% 15.0% 16.4%
County Profile
Otsego County | Hazard Mitigation Plan Update | Page 7
Figure 3-2. 2010 Population for Otsego County
0 2,000 4,000 6,000 8,000 10,000 12,000 14,000
Town of Worcester
Town of Westford
Village of Unadilla
Town of Unadilla
Town of Springfield
Town of Roseboom
Village of Richfield Springs
Town of Richfield
Town of Plainfield
Town of Pittsfield
Town of Otsego
Village of Otego
Town of Otego
Town of Oneonta
City of Oneonta
Town of New Lisbon
Village of Morris
Town of Morris
Village of Milford
Town of Milford
Town of Middlefield
Town of Maryland
Village of Laurens
Town of Laurens
Town of Hartwick
Village of Gilbertsville
Town of Exeter
Town of Edmeston
Town of Decatur
Village of Cooperstown
Village of Cherry Valley
Town of Cherry Valley
Town of Butternuts
Town of Burlington
Population
Population

County Profile
Page 8 | Otsego County | Hazard Mitigation Plan Update
POPULATION GROWTH
Otsego County experienced an increase in population between 1980 and 2010 by 7.3 percent or 4,229
people. The Towns of Butternuts, Cherry Valley, Milford, Otego, Pittsfield, Unadilla, and Westford all
exhibited a significant increase in population between 1980 and 2010 by 21.1 percent or higher, with all
continuing to have population growth between 2000 and 2010, except for the Towns of Butternuts, Otego,
and Unadilla. Between 2000 and 2010, two villages and one town experienced significant population losses
of 12.2 percent or higher, while eight jurisdictions saw their population decline slightly. During that same
time period, the City of Oneonta, as well as the Towns of Burlington, Edmeston, Exeter, Laurens, Morris,
Oneonta, Otsego, Roseboom, Springfield, and Worcester, and the Villages of Cooperstown, Gilbertsville,
Richfield Springs, and Unadilla had population growth.
Table 3-3. Population for Otsego County, 1980 – 2010
JURISDICTION 1980 1990 2000 2010 POP
CHANGE 1980-2010
PERCENT OF
CHANGE
POP CHANGE 2000-2010
PERCENT OF
CHANGE
Town of Burlington 1,045 1,036 1,085 1,140 95 9.1% 55 5.1%
Town of Butternuts 1,031 1,238 1,417 1,387 356 34.5% -30 -2.1%
Town of Cherry Valley 521 584 674 703 182 34.9% 29 4.3%
Village of Cherry Valley 684 617 592 520 -164 -24.0% -72 -12.2%
Village of Cooperstown 2,104 2,180 1,787 1,852 -252 -12.0% 65 3.6%
Town of Decatur 312 356 410 353 41 13.1% -57 -13.9%
Town of Edmeston 1,732 1,717 1,824 1,826 94 5.4% 2 0.1%
Town of Exeter 968 967 954 987 19 2.0% 33 3.5%
Village of Gilbertsville 455 388 375 399 -56 -12.3% 24 6.4%
Town of Hartwick 1,796 2,045 2,203 2,110 314 17.5% -93 -4.2%
Town of Laurens 1,825 2,056 2,125 2,161 336 18.4% 36 1.7%
Village of Laurens 276 293 277 263 -13 -4.7% -14 -5.1%
Town of Maryland 1,690 1,716 1,407 1,897 207 12.2% 490 34.8%
Town of Middlefield 1,618 1,698 2,004 1,893 275 17.0% -111 -5.5%
Town of Milford 2,171 2,383 2,427 2,629 458 21.1% 202 8.3%
Village of Milford 514 462 511 415 -99 -19.3% -96 -18.8%
Town of Morris 1,099 1,145 1,276 1,295 196 17.8% 19 1.5%
Village of Morris 681 642 591 583 -98 -14.4% -8 -1.4%

County Profile
Otsego County | Hazard Mitigation Plan Update | Page 9
JURISDICTION 1980 1990 2000 2010 POP
CHANGE 1980-2010
PERCENT OF
CHANGE
POP CHANGE 2000-2010
PERCENT OF
CHANGE
Town of New Lisbon 948 996 1,116 1,114 166 17.5% -2 -0.2%
City of Oneonta 14,933 13,954 13,292 13,901 -1,032 -6.9% 609 4.6%
Town of Oneonta 4,655 4,963 4,994 5,229 574 12.3% 235 4.7%
Town of Otego 1,712 2,060 2,131 2,105 393 23.0% -26 -1.2%
Village of Otego 1,089 1,068 1,052 1,010 -79 -7.3% -42 -4.0%
Town of Otsego 2,160 2,014 2,117 2,269 109 5.0% 152 7.2%
Town of Pittsfield 1,067 1,116 1,295 1,366 299 28.0% 71 5.5%
Town of Plainfield 847 850 982 915 68 8.0% -67 -6.8%
Town of Richfield 1,047 1,146 1,168 1,124 77 7.4% -44 -3.8%
Village of Richfield Springs
1,561 1,565 1,255 1,264 -297 -19.0% 9 0.7%
Town of Roseboom 630 668 684 711 81 12.9% 27 3.9%
Town of Springfield 1,239 1,267 1,350 1,358 119 9.6% 8 0.6%
Town of Unadilla 2,653 3,078 3,421 3,264 611 23.0% -157 -4.6%
Village of Unadilla 1,367 1,265 1,127 1,128 -239 -17.5% 1 0.1%
Town of Westford 652 634 784 868 216 33.1% 84 10.7%
Town of Worcester 1,993 2,070 2,207 2,220 227 11.4% 13 0.6%
Otsego County Total 58,030 59,201 60,918 62,259 4,229 7.3% 1,341 2.2%
AGE
The median age of persons living in Otsego County varies for the different jurisdictions ranging from 22
years of age to 56 years of age, according to the U.S. Census Bureau 2007-2011 American Community
Survey 5-year estimates. The Town of Oneonta has the highest percentage of persons under the age of
19, with 29.0 percent of the population. The jurisdiction with the highest percentage of persons 65 years of
age and older is the Village of Richfield Springs, with 31.0 percent of the population.

County Profile
Page 10 | Otsego County | Hazard Mitigation Plan Update
Table 3-4. Age of Population for Otsego County
JURISDICTION MEDIAN
AGE
UNDER
19
AGE 20
TO 24
AGE 25
TO 34
AGE 35
TO 44
AGE 45
TO 54
AGE 55
TO 64
AGE 65
TO 74
AGE 75
TO 84
AGE
85+
Town of Burlington 44.4 20.9% 6.9% 6.3% 15.4% 19.5% 17.7% 7.4% 4.4% 1.4%
Town of Butternuts 43.3 24.6% 2.3% 12.4% 13.5% 19.5% 12.9% 8.8% 5.0% 0.9%
Town of Cherry Valley 48.8 20.4% 6.3% 8.1% 10.7% 15.9% 16.9% 15.4% 4.7% 1.7%
Village of Cherry Valley
44.1 25.6% 7.8% 5.0% 13.5% 19.5% 10.7% 11.9% 5.6% 0.4%
Village of Cooperstown 43.4 24.4% 10.9% 8.8% 9.1% 15.2% 16.2% 5.8% 6.3% 3.3%
Town of Decatur 51.3 18.5% 7.8% 8.4% 5.6% 15.7% 23.5% 12.3% 7.0% 1.1%
Town of Edmeston 40.5 28.9% 7.4% 9.1% 12.1% 18.3% 11.7% 7.5% 3.1% 1.8%
Town of Exeter 41 24.5% 3.4% 14.2% 14.0% 16.3% 11.8% 11.0% 4.2% 0.7%
Village of Gilbertsville 43.1 29.4% 0.3% 8.1% 15.9% 9.2% 16.4% 7.0% 11.3% 2.4%
Town of Hartwick 42.3 27.9% 6.4% 7.7% 10.0% 22.9% 14.7% 4.1% 4.4% 2.0%
Town of Laurens 48.3 20.3% 6.4% 8.4% 10.1% 20.5% 18.0% 10.3% 4.8% 1.2%
Village of Laurens 51 23.6% 9.0% 0.0% 10.7% 22.3% 21.5% 11.2% 1.7% 0.0%
Town of Maryland 44.8 25.5% 4.2% 12.9% 7.5% 17.2% 16.3% 8.6% 5.4% 2.3%
Town of Middlefield 49.3 18.5% 4.5% 11.7% 11.4% 17.0% 21.3% 7.3% 7.0% 1.4%
Town of Milford 45.5 19.9% 5.8% 7.7% 15.5% 19.8% 15.1% 7.9% 5.8% 2.5%
Village of Milford 40.7 17.0% 10.4% 12.9% 12.7% 15.0% 15.8% 11.0% 3.5% 1.7%
Town of Morris 49.4 19.1% 2.5% 5.5% 13.1% 19.1% 14.9% 17.3% 6.4% 2.1%
Village of Morris 56.1 16.6% 5.3% 3.5% 12.7% 11.5% 21.5% 19.4% 5.5% 3.9%
Town of New Lisbon 44.1 21.4% 5.5% 9.5% 15.4% 15.5% 15.4% 10.8% 5.4% 1.2%
City of Oneonta 22.9 27.6% 26.6% 8.6% 8.0% 8.3% 8.9% 4.5% 4.3% 3.3%
Town of Oneonta 35.5 29.0% 10.8% 9.7% 10.0% 11.0% 13.8% 7.9% 5.6% 2.2%
Town of Otego 44.1 24.0% 4.8% 8.4% 14.2% 16.3% 14.4% 11.8% 3.8% 2.2%
Village of Otego 40 28.5% 5.5% 6.0% 18.8% 18.8% 9.7% 4.1% 4.7% 3.9%
Town of Otsego 47.3 23.1% 7.1% 6.1% 10.7% 13.9% 16.6% 9.6% 7.7% 5.1%
Town of Pittsfield 43.2 28.1% 6.3% 8.8% 9.3% 19.9% 14.9% 6.7% 3.0% 3.1%
Town of Plainfield 40 27.4% 6.1% 8.8% 12.6% 13.7% 16.0% 8.6% 5.5% 1.4%

County Profile
Otsego County | Hazard Mitigation Plan Update | Page 11
JURISDICTION MEDIAN
AGE
UNDER
19
AGE 20
TO 24
AGE 25
TO 34
AGE 35
TO 44
AGE 45
TO 54
AGE 55
TO 64
AGE 65
TO 74
AGE 75
TO 84
AGE
85+
Town of Richfield 49.7 16.5% 8.9.% 7.1% 11.7% 13.2% 14.0% 14.1% 11.7% 2.5%
Village of Richfield Springs
51.2 18.1% 8.2% 7.7% 10.9% 8.8% 15.4% 17.2% 9.3% 4.5%
Town of Roseboom 39.3 23.6% 6.8% 11.0% 14.7% 11.6% 18.8% 5.4% 7.1% 1.1%
Town of Springfield 48.1 25.1% 4.3% 10.0% 8.0% 15.0% 14.7% 12.6% 7.7% 2.7%
Town of Unadilla 40.6 28.1% 5.6% 7.2% 16.3% 14.6% 11.3% 10.2% 3.7% 2.9%
Village of Unadilla 43.8 23.7% 8.0% 6.5% 13.6% 13.3% 16.2% 10.3% 4.2% 4.3%
Town of Westford 47.3 24.5% 4.4% 6.4% 11.7% 20.2% 17.6% 10.3% 3.5% 1.4%
Town of Worcester 43.6 23.1% 7.4% 9.3% 12.6% 17.8% 9.8% 9.8% 8.5% 1.7%
Otsego County Total 40.4 24.9% 10.9% 8.7% 11.2% 14.6% 13.4% 8.5% 5.4% 2.5%
ETHNICITY
Otsego County is ethnically diverse varying considerably among the jurisdictions. The City of Oneonta has
the highest population of residents whose ethnicity is Hispanic alone at 5.9 percent; they also have the
lowest percentage of residents with an ethnicity of white alone at 86.3 percent. The Town of Plainfield’s
population is mainly of white alone ethnicity at 97.6 percent, with the Town of Oneonta having the highest
percentage of African Americans at 5.3 percent. A relatively small percentage of American Indians, Asians,
and Native Hawaiians reside in Otsego County.
Table 3-5. Ethnicity for Otsego County
JURISDICTION HISPANIC
ALONE
WHITE
ALONE
AFRICAN
AMERICAN
ALONE
AMERICAN
INDIAN &
ALASKAN
NATIVE
ALONE
ASIAN
ALONE
NATIVE
HAWAIIAN
/PACIFIC
ISLANDER
ALONE
OTHER
RACE
ALONE
MULTI-
RACIA
L
Town of Burlington 0.8% 96.7% 0.9% 0.0% 0.3% 0.0% 0.0% 1.4%
Town of Butternuts 1.5% 96.7% 0.4% 0.2% 0.2% 0.0% 0.0% 1.1%
Town of Cherry Valley 0.7% 97.1% 0.7% 0.4% 0.2% 0.0% 0.1% 0.8%
Village of Cherry Valley
1.0% 95.6% 1.2% 0.6% 0.0% 0.0% 0.0% 1.7%
Village of Cooperstown 3.1% 91.4% 0.3% 0.1% 4.2% 0.0% 0.0% 1.0%
Town of Decatur 1.4% 96.3% 0.8% 0.0% 0.3% 0.0% 0.0% 1.1%
Town of Edmeston 1.5% 96.8% 0.3% 0.0% 0.5% 0.0% 0.1% 0.7%

County Profile
Page 12 | Otsego County | Hazard Mitigation Plan Update
JURISDICTION HISPANIC
ALONE
WHITE
ALONE
AFRICAN
AMERICAN
ALONE
AMERICAN
INDIAN &
ALASKAN
NATIVE
ALONE
ASIAN
ALONE
NATIVE
HAWAIIAN
/PACIFIC
ISLANDER
ALONE
OTHER
RACE
ALONE
MULTI-
RACIA
L
Town of Exeter 1.5% 95.4% 0.6% 0.3% 0.8% 0.2% 0.2% 0.9%
Village of Gilbertsville 1.0% 97.5% 0.5% 0.3% 0.3% 0.0% 0.0% 0.5%
Town of Hartwick 2.0% 95.1% 0.3% 0.2% 0.9% 0.0% 0.0% 1.5%
Town of Laurens 2.7% 94.7% 0.4% 0.1% 0.6% 0.0% 0.0% 1.6%
Village of Laurens 3.4% 94.7% 0.0% 0.0% 0.4% 0.0% 0.0% 1.5%
Town of Maryland 2.6% 95.0% 0.9% 0.0% 0.2% 0.0% 0.0% 1.3%
Town of Middlefield 1.3% 94.1% 0.6% 0.1% 2.6% 0.0% 0.0% 1.3%
Town of Milford 1.8% 94.9% 1.1% 0.1% 1.0% 0.2% 0.1% 0.9%
Village of Milford 1.7% 93.5% 1.2% 0.2% 1.2% 0.0% 0.0% 2.2%
Town of Morris 2.8% 95.3% 0.4% 0.1% 0.1% 0.0% 0.0% 1.4%
Village of Morris 3.3% 94.0% 1.0% 0.0% 0.0% 0.0% 0.0% 1.7%
Town of New Lisbon 2.2% 96.2% 0.3% 0.3% 0.0% 0.0% 0.2% 0.8%
City of Oneonta 5.9% 86.3% 3.1% 0.2% 2.4% 0.0% 0.1% 2.0%
Town of Oneonta 4.4% 87.7% 5.3% 0.2% 1.1% 0.0% 0.1% 1.1%
Town of Otego 2.6% 94.4% 0.6% 0.0% 0.6% 0.0% 0.0% 1.7%
Village of Otego 2.6% 92.8% 1.4% 0.1% 1.3% 0.1% 0.0% 1.8%
Town of Otsego 2.0% 95.1% 0.4% 0.2% 1.2% 0.0% 0.1% 1.0%
Town of Pittsfield 1.7% 95.0% 0.7% 0.1% 0.7% 0.0% 0.1% 1.8%
Town of Plainfield 1.1% 97.6% 0.2% 0.2% 0.4% 0.0% 0.0% 0.4%
Town of Richfield 0.9% 96.7% 0.3% 0.5% 0.7% 0.0% 0.0% 0.8%
Village of Richfield Springs
1.3% 95.3% 0.4% 0.9% 1.0% 0.0% 0.1% 0.9%
Town of Roseboom 1.5% 96.2% 0.7% 0.3% 0.3% 0.0% 0.0% 1.0%
Town of Springfield 1.0% 96.8% 0.7% 0.1% 0.4% 0.0% 0.1% 0.9%
Town of Unadilla 2.1% 95.8% 0.8% 0.1% 0.3% 0.0% 0.0% 0.8%
Village of Unadilla 2.2% 94.5% 1.1% 0.3% 0.7% 0.0% 0.0% 1.2%
Town of Westford 2.4% 94.5% 0.3% 0.0% 0.8% 0.0% 0.0% 2.0%

County Profile
Otsego County | Hazard Mitigation Plan Update | Page 13
JURISDICTION HISPANIC
ALONE
WHITE
ALONE
AFRICAN
AMERICAN
ALONE
AMERICAN
INDIAN &
ALASKAN
NATIVE
ALONE
ASIAN
ALONE
NATIVE
HAWAIIAN
/PACIFIC
ISLANDER
ALONE
OTHER
RACE
ALONE
MULTI-
RACIA
L
Town of Worcester 4.6% 93.0% 0.5% 0.3% 0.3% 0.1% 0.0% 1.0%
Otsego County Total 3.1% 92.7% 1.5% 0.2% 1.1% 0.0% 0.1% 1.3%
EDUCATION
The level of education varies among the different jurisdictions, according to the U.S. Census Bureau 2007-
2011 American Community Survey 5-year estimates. The Village of Cooperstown has the highest
population of people with a graduate or professional degree with 30.5 percent. The highest percentage of
population with a Bachelors Degree resides in City of Oneonta with 22.8 percent of their population. Table
3-6 depicts the level of education data for Otsego County.
Table 3-6. Level of Education for Otsego County
JURISDICTION
GRADUATE OR
PROFESSIONAL
DEGREE
BACHELORS
DEGREE
ASSOCIATES
DEGREE
SOME
COLLEGE,
NO DEGREE
HIGH
SCHOOL
GRADUATE
NO
DIPLOMA
Town of Burlington 3.9% 6.1% 11.2% 17.7% 50.2% 7.0%
Town of Butternuts 10.6% 8.0% 9.8% 20.3% 40.0% 8.7%
Town of Cherry Valley 7.6% 17.4% 12.0% 13.0% 40.9% 6.0%
Village of Cherry Valley
5.7% 15.7% 15.7% 13.3% 42.3% 4.2%
Village of Cooperstown 30.5% 22.2% 12.1% 14.3% 14.2% 4.6%
Town of Decatur 6.5% 8.0% 8.0% 16.3% 43.7% 17.5%
Town of Edmeston 3.3% 6.3% 11.2% 20.9% 40.4% 12.1%
Town of Exeter 3.3% 9.6% 10.8% 13.5% 40.9% 15.2%
Village of Gilbertsville 19.9% 8.0% 10.0% 11.9% 37.9% 12.3%
Town of Hartwick 12.1% 16.8% 8.8% 12.8% 35.1% 13.3%
Town of Laurens 6.4% 16.2% 12.2% 18.2% 36.3% 9.5%
Village of Laurens 0.0% 11.5% 12.1% 31.2% 38.9% 6.4%
Town of Maryland 6.6% 7.6% 15.2% 25.3% 34.4% 8.7%

County Profile
Page 14 | Otsego County | Hazard Mitigation Plan Update
JURISDICTION
GRADUATE OR
PROFESSIONAL
DEGREE
BACHELORS
DEGREE
ASSOCIATES
DEGREE
SOME
COLLEGE,
NO DEGREE
HIGH
SCHOOL
GRADUATE
NO
DIPLOMA
Town of Middlefield 21.9% 18.1% 8.7% 19.5% 27.1% 2.9%
Town of Milford 4.9% 15.1% 11.9% 20.9% 35.9% 9.1%
Village of Milford 10.3% 16.0% 9.2% 16.6% 39.5% 6.3%
Town of Morris 7.7% 12.9% 9.5% 19.7% 38.1% 6.6%
Village of Morris 9.5% 20.7% 8.6% 24.6% 27.2% 5.0%
Town of New Lisbon 8.5% 12.3% 9.9% 22.9% 37.4% 7.3%
City of Oneonta 19.9% 22.8% 8.1% 14.5% 24.8% 6.3%
Town of Oneonta 18.8% 17.5% 6.9% 15.8% 31.9% 5.0%
Town of Otego 11.7% 13.1% 10.1% 17.1% 31.7% 9.8%
Village of Otego 11.8% 16.5% 14.6% 15.3% 27.6% 10.3%
Town of Otsego 19.0% 17.8% 9.4% 17.4% 24.6% 7.7%
Town of Pittsfield 3.7% 7.2% 14.7% 15.2% 43.0% 12.1%
Town of Plainfield 6.1% 10.5% 11.1% 19.2% 40.6% 8.2%
Town of Richfield 7.4% 14.8% 11.0% 11.8% 38.4% 10.8%
Village of Richfield Springs
8.1% 12.9% 10.5% 11.4% 42.3% 9.3%
Town of Roseboom 10.7% 8.1% 9.3% 17.0% 42.5% 9.3%
Town of Springfield 14.0% 19.1% 14.5% 12.1% 29.3% 5.1%
Town of Unadilla 3.6% 8.5% 10.6% 17.1% 48.5% 9.0%
Village of Unadilla 5.7% 9.6% 14.5% 21.5% 38.8% 8.3%
Town of Westford 9.5% 15.2% 10.6% 14.1% 40.8% 6.5%
Town of Worcester 6.6% 11.8% 11.0% 26.4% 33.8% 5.5%
Otsego County Total 11.5% 14.7% 10.2% 17.3% 34.6% 8.1%

County Profile
Otsego County | Hazard Mitigation Plan Update | Page 15
HOUSEHOLD INCOME
The data for household income is reported from the 2007-2011 5-year estimates of the U.S. Census
Bureau’s American Community Survey. The median household income for the State of New York is $56,951
and the median household income for the United States is $52,762. The jurisdiction with the highest median
household income in Otsego County is the Town of Middlefield, which is $62,212. There is one other town
whose median household income is higher than the state’s, the Town of Burlington. Statistics indicate that
14.5 percent of individuals residing in the State of New York are in poverty, fifteen jurisdictions in Otsego
County have a higher percentage of residents living in poverty.
Table 3-7. Household Income for Otsego County
JURISDICTION
MEDIAN
FAMILY
INCOME
AT OR
ABOVE
$200K
$150,000
TO
$199,999
$100,000
TO
$149,999
$75,000
TO
$99,999
$50,000
TO
$74,999
$35,000
TO
$49,999
$25,000
TO
$34,999
$15,000
TO
$24,999
$10,000
TO
$14,999
LESS
THAN
$10,000
BELOW
POVERTY
LEVEL
Town of
Burlington $59,083 0.6% 1.7% 19.6% 17.5% 20.9% 11.9% 15.4% 4.9% 3.0% 4.5% 9.3%
Town of
Butternuts $49,615 0.4% 2.8% 11.3% 14.6% 20.6% 20.7% 8.5% 11.1% 7.1% 2.8% 11.4%
Town of
Cherry Valley $44,375 1.9% 1.5% 10.6% 12.9% 21.2% 11.2% 18.2% 12.5% 5.5% 4.5% 10.2%
Village of
Cherry Valley $39,844 0.9% 0.0% 8.1% 16.7% 21.3% 6.3% 24.9% 12.2% 8.6% 0.9% 13.1%
Village of
Cooperstown $51,422 9.6% 4.4% 8.9% 9.4% 21.5% 13.9% 7.9% 13.0% 2.5% 8.8% 19.7%
Town of
Decatur $36,548 0.0% 1.9% 7.1% 17.5% 9.7% 22.1% 9.7% 11.7% 4.5% 15.6% 14.9%
Town of
Edmeston $47,109 0.0% 1.4% 15.2% 6.2% 20.7% 17.0% 11.6% 13.2% 8.0% 6.7% 17.1%
Town of
Exeter $41,250 0.8% 2.8% 5.0% 11.7% 18.6% 15.0% 16.7% 15.6% 4.2% 9.7% 15.0%
Village of
Gilbertsville $47,500 0.0% 5.5% 13.4% 11.6% 18.3% 10.4% 17.1% 10.4% 11.0% 2.4% 14.3%
Town of
Hartwick $47,059 4.5% 3.2% 10.4% 12.5% 18.1% 15.2% 14.7% 13.2% 3.5% 4.7% 17.1%
Town of
Laurens $45,750 0.0% 1.5% 7.4% 12.6% 23.6% 14.5% 16.6% 8.0% 5.2% 10.7% 19.7%
Village of
Laurens $44,375 0.0% 0.0% 4.9% 4.9% 35.0% 9.7% 9.7% 15.5% 9.7% 10.7% 20.3%
Town of
Maryland $45,900 1.1% 3.8% 6.9% 12.9% 21.7% 23.0% 10.5% 8.7% 4.1% 7.3% 7.3%
Town of
Middlefield $62,212 4.2% 1.6% 19.3% 16.3% 15.9% 13.3% 11.0% 12.4% 2.8% 3.2% 7.3%

County Profile
Page 16 | Otsego County | Hazard Mitigation Plan Update
JURISDICTION
MEDIAN
FAMILY
INCOME
AT OR
ABOVE
$200K
$150,000
TO
$199,999
$100,000
TO
$149,999
$75,000
TO
$99,999
$50,000
TO
$74,999
$35,000
TO
$49,999
$25,000
TO
$34,999
$15,000
TO
$24,999
$10,000
TO
$14,999
LESS
THAN
$10,000
BELOW
POVERTY
LEVEL
Town of
Milford $46,750 1.9% 3.9% 12.1% 11.4% 17.9% 17.5% 14.4% 10.1% 3.6% 7.3% 17.6%
Village of
Milford $45,556 2.3% 1.9% 6.0% 15.7% 14.4% 26.9% 13.0% 5.1% 3.2% 11.6% 11.4%
Town of
Morris $46,151 0.6% 0.9% 8.7% 8.7% 24.7% 23.2% 14.8% 6.3% 7.3% 4.8% 10.8%
Village of
Morris $38,365 0.0% 2.7% 13.1% 12.7% 9.5% 14.0% 25.8% 5.9% 11.8% 4.5% 20.1%
Town of New
Lisbon $48,375 2.1% 2.6% 2.8% 18.0% 21.5% 20.3% 6.8% 16.1% 7.0% 2.8% 7.3%
City of
Oneonta $33,620 2.0% 1.3% 8.1% 9.7% 13.7% 14.0% 8.6% 16.2% 11.0% 15.4% 26.8%
Town of
Oneonta $55,347 3.9% 5.7% 12.3% 15.4% 18.0% 9.7% 15.7% 9.9% 5.4% 4.0% 21.2%
Town of
Otego $50,102 1.3% 1.8% 14.7% 5.7% 26.7% 18.1% 5.8% 14.4% 4.2% 7.4% 12.8%
Village of
Otego $52,283 0.6% 2.1% 16.0% 4.0% 31.3% 19.8% 6.3% 6.7% 6.0% 7.1% 11.7%
Town of
Otsego $52,782 7.0% 3.6% 6.2% 12.9% 23.1% 17.2% 9.2% 9.5% 4.1% 7.0% 14.4%
Town of
Pittsfield $44,402 1.4% 1.6% 12.2% 6.6% 23.6% 19.5% 13.4% 10.7% 7.5% 3.4% 17.0%
Town of
Plainfield $50,368 0.0% 1.2% 8.7% 18.1% 22.7% 20.7% 12.0% 6.7% 5.2% 4.7% 17.0%
Town of
Richfield $33,170 0.4% 2.5% 6.1% 10.6% 18.7% 9.7% 15.3% 21.9% 7.4% 7.4% 13.3%
Village of
Richfield
Springs
$27,772 0.8% 0.4% 6.4% 12.0% 17.2% 7.9% 7.5% 28.6% 8.9% 10.3% 13.8%
Town of
Roseboom $48,676 2.4% 2.1% 7.8% 13.3% 21.7% 15.7% 14.5% 12.0% 3.9% 6.6% 6.3%
Town of
Springfield $50,764 3.6% 2.5% 10.5% 16.3% 18.0% 14.0% 13.6% 8.9% 7.3% 5.3% 14.8%
Town of
Unadilla $40,538 0.0% 0.2% 4.3% 11.9% 25.3% 18.8% 13.2% 14.6% 3.2% 8.6% 10.5%
Village of
Unadilla $42,841 0.0% 0.9% 4.7% 11.0% 27.1% 21.7% 10.1% 6.9% 4.3% 13.4% 15.3%
Town of
Westford $47,321 3.9% 1.2% 8.9% 11.9% 24.0% 15.4% 10.4% 6.5% 10.1% 7.7% 11.8%

County Profile
Otsego County | Hazard Mitigation Plan Update | Page 17
JURISDICTION
MEDIAN
FAMILY
INCOME
AT OR
ABOVE
$200K
$150,000
TO
$199,999
$100,000
TO
$149,999
$75,000
TO
$99,999
$50,000
TO
$74,999
$35,000
TO
$49,999
$25,000
TO
$34,999
$15,000
TO
$24,999
$10,000
TO
$14,999
LESS
THAN
$10,000
BELOW
POVERTY
LEVEL
Town of
Worcester $47,112 0.0% 2.9% 10.8% 5.9% 28.0% 14.2% 12.0% 12.4% 10.8% 3.1% 13.6%
Otsego
County Total $45,334 2.0% 2.3% 9.6% 11.6% 20.0% 15.7% 11.9% 12.6% 6.5% 8.1% 16.4%
ASSET INVENTORY
Provided in Table 3-8 is the total estimated dollar exposure for parcels with structures. This demographic
and building stock data form the basis of large portions of this risk assessment and were derived from
HAZUS-MH MR4. Building counts are based on census housing unit counts.
The 2010 Census estimates there are 30,777 housing units in the study area and HAZUS-MH MR4
estimates there are 27,092 parcels with structures, with an aggregate value of $3.3 billion. The dollar value
for structures has been converted to 2012 dollars.
Table 3-8. Estimated Housing Units and Structures by Jurisdiction
JURISDICTION
2010 Housing
Units 2012 Parcels with Structures
Number Number Value
Town of Burlington 553 605 $29,602,642
Town of Butternuts 1,012 779 $79,609,875
Town of Cherry Valley 689 404 $62,757,900
Village of Cherry Valley 300 278 $30,476,823
Village of Cooperstown 1,166 901 $369,999,907
Town of Decatur 283 258 $10,405,678
Town of Edmeston 847 908 $56,564,405
Town of Exeter 589 582 $23,299,424
Village of Gilbertsville 207 192 $23,525,500
Town of Hartwick 1,162 1,076 $170,401,960
Town of Laurens 1,242 938 $89,290,150
Village of Laurens 128 95 $18,496,000
Town of Maryland 1,117 1,029 $99,563,143
Town of Middlefield 1,227 1,031 $150,735,421

County Profile
Page 18 | Otsego County | Hazard Mitigation Plan Update
JURISDICTION
2010 Housing
Units 2012 Parcels with Structures
Number Number Value
Town of Milford 1,672 1,359 $74,587,230
Village of Milford 231 193 $16,239,502
Town of Morris 951 590 $28,270,989
Village of Morris 292 263 $20,610,000
Town of New Lisbon 659 640 $57,220,600
City of Oneonta 4,774 3,166 $591,530,695
Town of Oneonta 2,302 1,998 $443,476,966
Town of Otego 1,479 851 $99,799,085
Village of Otego 474 404 $51,703,666
Town of Otsego 2,377 1,318 $298,786,448
Town of Pittsfield 696 657 $27,255,445
Town of Plainfield 431 449 $40,916,536
Town of Richfield 1,436 722 $51,580,683
Village of Richfield Springs 684 548 $49,335,200
Town of Roseboom 477 472 $18,303,500
Town of Springfield 827 762 $65,673,129
Town of Unadilla 2,162 1,413 $74,897,037
Village of Unadilla 559 503 $31,841,290
Town of Westford 514 514 $21,989,300
Town of Worcester 1,299 1,190 $63,880,107
Otsego County Total 30,777 27,092 $3,342,904,384
FUTURE DEVELOPMENT
Otsego County’s Economic Development Department is committed to enhancing the quality of life for the
residents in the 34 jurisdictions located in the County by creating new community and business wealth. This
is achieved by: advancing private enterprise, creating high-quality jobs, making productive use of local
resources, and broadening the tax base. The Economic Development Department works with the County
of Otsego Industrial Development Agency (COIDA), the Otsego County Development Corporation (OCDC)

County Profile
Otsego County | Hazard Mitigation Plan Update | Page 19
and the Empire Zone Program. Together these organizations have made $2.5 million in loans, leveraging
an additional $16 million in capital investment, and creating or retaining 400 local jobs.
To better understand how future growth and developments in this county might affect hazard vulnerability,
it is useful to consider population growth, occupied and vacant land, the potential for future development in
hazard areas, and current planning and growth management efforts.
This section includes an analysis of the projected population change, the number of permits that have been
issued throughout the County and economic impacts.
Population projections from 2010 to 2040 are listed in Table 3-9 and illustrated in Figure 3-3, as provided
by Cornell University, Program on Applied Demographics. Population projects were based upon rates of
change estimated from historic data.
Table 3-9. Otsego County Population Projections
COUNTY LAND
AREA
2010 2020 2030 2040
Population
Total
Number
Density
(Land
Area,
SQ MI)
Total
Number
Density
(Land
Area,
SQ MI)
Total
Number
Density
(Land
Area,
SQ MI)
Total
Number
Density
(Land
Area,
SQ MI)
Otsego County 1015 62,259 61 62,094 61 61,343 60 59,637 59
Figure 3-3. Otsego County Population Projections
58,000
58,500
59,000
59,500
60,000
60,500
61,000
61,500
62,000
62,500
2010 2020 2030 2040
Otsego County

County Profile
Page 20 | Otsego County | Hazard Mitigation Plan Update
ECONOMIC IMPACTS
The economy is vital to all infrastructures. Otsego County is located in a prime location being in the Southern
Tier Region and bordering the Mohawk Valley Region. The location provides easy access to transportation
corridors, metropolitan areas, and immense recreational and tourism destinations. Tourism is one of the
largest industries in the county, bringing in an estimated $134 million. Some of the tourist attractions are:
the National Baseball Hall of Fame and Museum in Cooperstown, Fenimore Art Museum, Farmers’
Museum, Glimmersglass Festival, Foothills Performing Arts Center, Cooperstown Beverage Trail, Oneonta
Theatre, and Oneonta’s Orpheus Theatre.
The majority of Otsego County’s businesses have continued to grow and show stability throughout the past
40 years. The County has benefited from the high-technology manufacturing industry, as well as the
medical industry.
Agri-business continues to bring in a significant amount of revenue for the County. In Otsego County,
according to the 2007 Census of Agriculture, the market value of products sold is over $51 million with 980
farms. The majority of the land is comprised of farm and ranch land, primarily used for forage and cattle.
Additionally, a critical portion of the economy lies within the major employers for Otsego County. The major
employers are: Bassett Healthcare (2,615 employees), SUNY Collage at Oneonta (1,181), New York
Central Mutual Fire Insurance Company (1,000), A.O. Fox Hospital (967), County of Otsego (850), Wal-
Mart (470), Hartwick College (356), Wilber National Bank (279), Corning, Inc. (210), Astrocom Electronics
(96), Custom Electronics, Inc. (72), Medical Coaches (70), Burt Rigid Box, Inc. (65), and Mold-A-Matic
(MAMCO) (60).
For a broader perspective on occupation and development in Otsego County, Figure 3-4 displays the
percentage of occupation by industry for the County.

County Profile
Otsego County | Hazard Mitigation Plan Update | Page 21
Figure 3-4. Occupation by Industry
0 5 10 15 20 25 30 35 40
Public Administration
Other Services
Arts, Entertainment, and Recreation, andAccommodation and Food Services
Educational Services, and Health Care andSocial Assistance
Professional, Scientific, and Management,and Administrative and Waste Management
Services
Finance and Insurance, and Real Estate,Rental, and Leasing
Information
Transportation and Warehousing, andUtilities
Retail Trade
Wholesale Trade
Manufacturing
Construction
Agriculture, Forestry, Fishing and Hunting,and Mining
Otsego County
New York

County Profile
Page 22 | Otsego County | Hazard Mitigation Plan Update
Building permits indicate what types of buildings are being constructed and their relative uses. Table 3-10
lists the number of residential building permits for Otsego County that have been granted between 1990
and 2011. The data includes all sizes of family homes for reported permits, as well as the construction costs
to show the potential increase in vulnerability of structures to the various hazards assessed in this risk
assessment. The increase in vulnerability can be attributed to the higher construction costs that would be
factored into repairing or replacing a structure using current market values. Permits are reported annually
in September and the data includes that for the years of 2010 and 2011 to demonstrate growth.
Table 3-10. County Residential Building Permits6
Otsego County
Year Buildings Units Construction Cost
1990 46 48 $3,508,838
1995 34 34 $3,312,893
2000 38 41 $4,584,974
2005 138 139 $20,337,921
2010 62 62 $6,017,767
2011 33 33 $5,567,000
CURRENT RESIDENTIAL AND COMMERCIAL DEVELOPMENT TRENDS
Subsequent to Otsego County’s first Hazard Mitigation Action Plan (HMAP), approved in 2008, Otsego
County’s development for residential construction has remained consistent relative to the overall number
of building permits issued from 1990-2011 as shown in Table 3-10 (above). There have been 247 residential
homes permitted in unincorporated Otsego County and incorporated jurisdictions of Burlington, Unadilla,
Milford, Hartwick, Springfield, and Richfield. These include mobile and manufactured construction. Of these
247 structures, 13 are located adjacent to or within the SFHA boundaries on the FEMA Flood Insurance
Study dated September 2009.
New commercial development has also remained somewhat steady with 57 new commercial structures
built since 2008 in unincorporated Otsego County, and jurisdictions of Unadilla, Hartwick, and Edmeston.
Of the 57 permitted sites, 4 lie in or adjacent to the SFHA on the FEMA Flood Insurance Study dated
September 2009.
Residential and commercial structures built since 2008 are located in communities in good standing with
the National Flood Insurance Program (NFIP), and all structures permitted in compliance with FEMA
standards as mandated by provisions of the local or county FEMA Floodplain Ordinance and applicable
Floodplain, Watershed and Land Use regulations.
6 http://censtats.census.gov/cgi-bin/bldgprmt/bldgdisp.pl

County Profile
Otsego County | Hazard Mitigation Plan Update | Page 23
DEVELOPMENT CHANGES AFFECTING HAZARD RISK AND VULNERABILITY
Otsego County has not experienced significant change in development trends from 2008 to the present.
The County, in proximity to major transportation corridors, metropolitan areas, and popular tourism
destinations has maintained a stable economy; however, the majority of land continues to be rural, and
used primarily for forage and cattle. Predominately rural land use is reflected in the average population
density of 61.5 people per square mile. Natural hazards, particularly flooding and hurricane wind, continue
to threaten people and assets county-wide. However, since 2008, there have been no significant factors or
development trends with a consequential effect or increase in overall risk and vulnerability to natural
hazards identified in the 2013 Plan update.
Figure 3-5. Residential Construction 2008-2012

County Profile
Page 24 | Otsego County | Hazard Mitigation Plan Update
Figure 3-6. Commercial Construction 2008-2012