Embed Size (px)
Citation preview
Week
17
Week
16 FYTD#
Week
17 FYTD#
Week
17 FYTD#
All influenza detections reported (rapid or PCR) 96 101 20,757 56 5,484 45 6,137
Percent of emergency department visits for ILI 1% 2% 1% 2%
Percent of deaths registered with pneumonia and/or influenza 7% 6% 5% 7%
Number of influenza-related deaths reported^ 0 2 341 0 86 0 77# FYTD=Fiscal Year To Date (FY is July 1 - June 30, W eeks 27-26). Total deaths reported in prior years: 87 in 2016-17, 68 in 2015-16, and 97 in 2014-15.
* Previous weeks case counts or percentages may change due to delayed processing or reporting.
** Includes FYs 2014-15, 2015-16, and 2016-17.
^ Current FY deaths are shown by week of report; by week of death for prior FYs.
Indicator
FY 2017-18* FY 2016-17
Prior 3-Year
Average**
Table 1. Influenza Surveillance Indicators
Page 1 of 3
April 30, 2014 Week #17, ending 4/26/14
The purpose of the weekly Influenza Watch is to summarize current influenza surveillance in San Diego County. Please note that reported weekly data are preliminary and may change due to delayed submissions and additional laboratory results.
INFLUENZA WATCHCounty of San Diego
Current Week 17 (ending 4/28/2018)• 96 new influenza detections reported: Expected level• 1% influenza-like-illness (ILI) among emergency department visits: Expected level• No new influenza-related deaths reported this week• No new ICU cases reported this week• 7% of deaths registered with pneumonia and/or influenza: Expected level
Epidemiology and Immunization Services Branch(619) 692-8499 [email protected]
Page 1 of 8
20,757 Total Cases
Cu
rre
nt
Seas
on
Su
mm
ary
Cu
rre
nt
We
ek
300ICU Cases
341Deaths†
Report ContentsPage 1: Overview & IndicatorsPage 2: Virus CharacteristicsPages 3-8: Trend graphsPage 8: Reporting Information
Virus Characteristics
PUBLIC HEALTH SERVICES
117Outbreaks*
May 2, 2018Volume 17, Issue 30
Week 17Ending 4/28/2018
* At least one case of laboratory-confirmed influenza in a setting experiencing ≥2 cases of influenza like illness (ILI) within a 72-hour period.
63.4%
0.3%
2.9%
32.3%
0.2%0.1% 0.9%
Influenza A
Influenza A (H1N1)pdm09
Influenza A (H3) Seasonal
Influenza B
Influenza B/Yamagata
Influenza B/Victoria
Influenza A/B
† Including 44 deaths less than 65 years of age, reportable to CDPH.
Positive Test Type/Subtype Week 17
Total
FY-To-Date
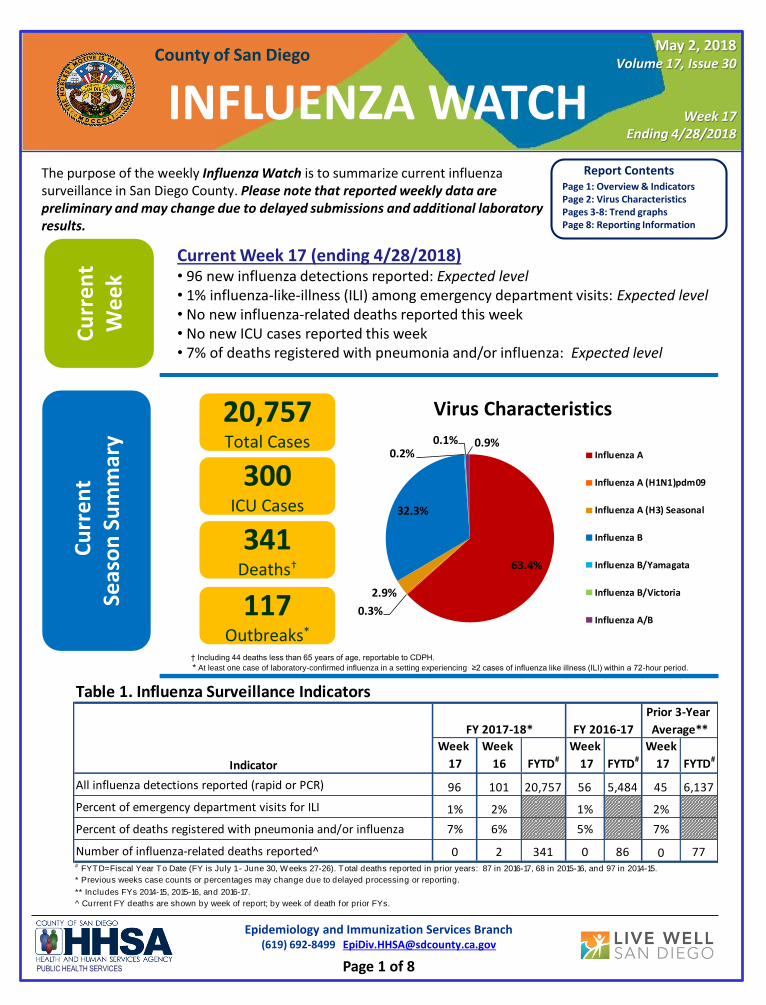
Influenza A† 20 13,117
Influenza A(H1N1) Pandemic 2009 2 62
Influenza A (H3) Seasonal 5 594
Influenza B† 69 6,745
Influenza B/Victoria 0 19
Influenza B/Yamagata 0 41Influenza A/B† 0 179
Total 96 20,757* FY is July 1 - June 30.
† No further characterization performed, or results were not yet available at time of publication.
Note: Totals may change due to further laboratory f indings.
Table 2. Influenza Detections Reported, FY 2017-18*
Page 1 of 3
April 30, 2014 Week #17, ending 4/26/14
Influenza Watch
County of San Diego
Epidemiology and Immunization Services Branch(619) 692-8499 [email protected]
Page 2 of 8PUBLIC HEALTH SERVICES
Weekly Influenza Watch Surveillance Report
This is the final Influenza Watch surveillance report for this season.
If you have any comments or suggestions regarding the Influenza Watch, please
email us at [email protected].
A final influenza season summary will be available in July, and the weekly
Influenza Watch reports will resume again around October, 2018.
May 2, 2018Volume 17, Issue 30
Week 17Ending 4/28/2018
Page 1 of 3
Influenza Watch
County of San Diego
Epidemiology and Immunization Services Branch(619) 692-8499 [email protected]
Page 3 of 8PUBLIC HEALTH SERVICES
0
2
4
6
8
10
12
14
27 29 31 33 35 37 39 41 43 45 47 49 51 1 3 5 7 9 11 13 15 17 19 21 23 25
Perc
ent
Week Number
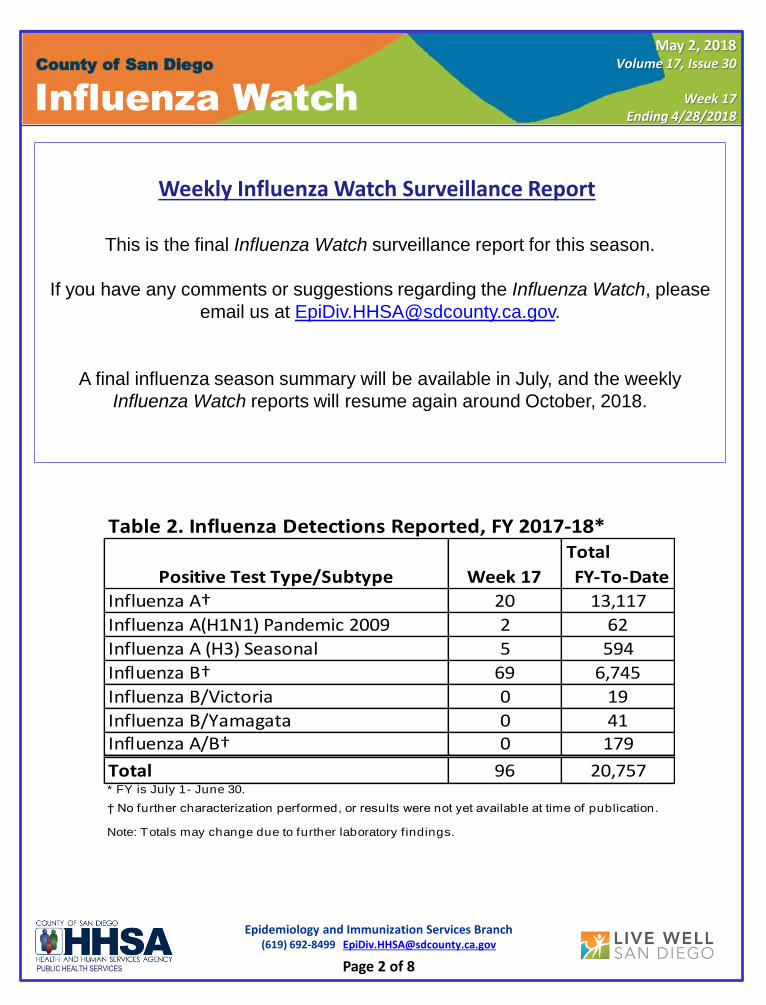
Figure 1. Percent of Emergency Department Visits for Influenza-like Illness by Week and FY
2011-12 2012-13 2013-14 2014-15 2015-16 2016-17 2017-18
0
500
1,000
1,500
2,000
2,500
3,000
3,500
27 29 31 33 35 37 39 41 43 45 47 49 51 1 3 5 7 9 11 13 15 17 19 21 23 25
Num
ber
of C
ases
Week Number
Figure 2. San Diego County Influenza Detections by Type and Week
of Report, 2017-18 FYTD (N=20,757)
Influenza A Influenza A(H1N1)pdm09 Influenza A(H3) Influenza B Influenza B/Victoria Influenza B/Yamagata Influenza A/B
May 2, 2018Volume 17, Issue 30
Week 17Ending 4/28/2018
Page 1 of 3
Influenza Watch
Epidemiology and Immunization Services Branch(619) 692-8499 [email protected]
Page 4 of 8
County of San Diego
PUBLIC HEALTH SERVICES
0%
10%
20%
30%
40%
50%
60%
70%
80%
90%
100%
<1 1-9 yrs 10-19 yrs 20-39 yrs 40-59 yrs 60-79 yrs 80+
Perc
ent
Age Group
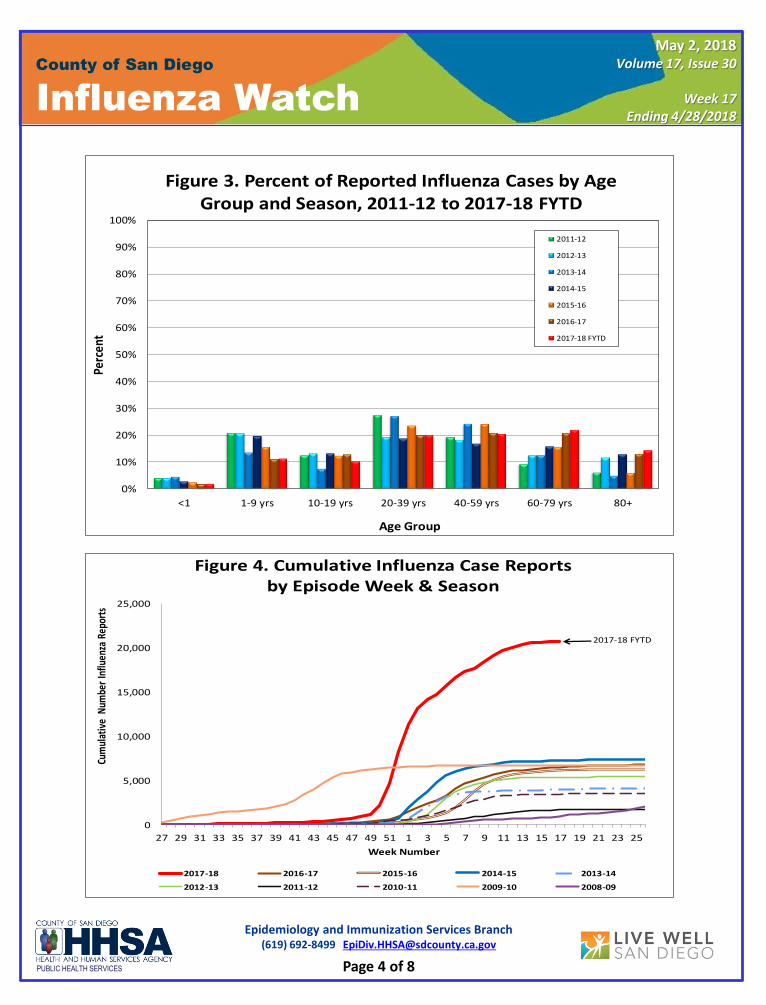
Figure 3. Percent of Reported Influenza Cases by Age Group and Season, 2011-12 to 2017-18 FYTD
2011-12
2012-13
2013-14
2014-15
2015-16
2016-17
2017-18 FYTD
2017-18 FYTD
0
5,000
10,000
15,000
20,000
25,000
27 29 31 33 35 37 39 41 43 45 47 49 51 1 3 5 7 9 11 13 15 17 19 21 23 25
Cum
ulat
ive
Num
ber
Influ
enza
Rep
orts
Week Number
Figure 4. Cumulative Influenza Case Reports by Episode Week & Season
2017-18 2016-17 2015-16 2014-15 2013-14
2012-13 2011-12 2010-11 2009-10 2008-09
May 2, 2018Volume 17, Issue 30
Week 17Ending 4/28/2018
Page 1 of 3
Influenza Watch
Epidemiology and Immunization Services Branch(619) 692-8499 [email protected]
Page 5 of 8
County of San Diego
PUBLIC HEALTH SERVICES
024
68101214
27 34 41 48 3 10 17 24 31 38 45 52 7 14 21 28 35 42 49 3 10 17 24 31 38 45 52 7 14 21 28 35 42 49 4 11 18 25 32 39 46 1 8 15 22Percent of Emergency Department Visits
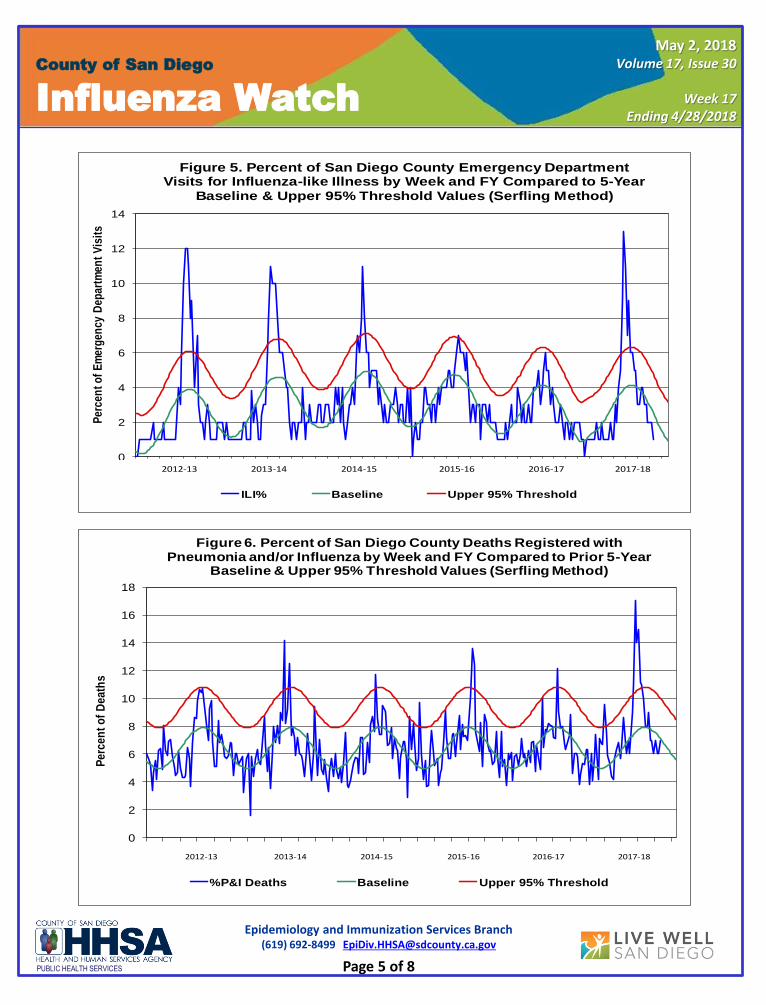
Figure 5. Percent of San Diego County Emergency Department Visits for Influenza-like Illness by Week and FY Compared to 5-Year Baseline & Upper 95% Threshold Values (Serfling Method)
ILI% Baseline Upper 95% Threshold2012-13 2013-14 2014-15 2015-16 2016-17 2017-18
0
2
4
6
8
10
12
14
27 34 41 48 3 10 17 24 31 38 45 52 7 14 21 28 35 42 49 3 10 17 24 31 38 45 52 7 14 21 28 35 42 49 4 11 18 25 32 39 46 1 8 15 22
Per
cen
t o
f E
mer
gen
cy D
epar
tmen
t V
isit
s
Figure 5. Percent of San Diego County Emergency Department Visits for Influenza-like Illness by Week and FY Compared to 5-Year
Baseline & Upper 95% Threshold Values (Serfling Method)
ILI% Baseline Upper 95% Threshold
2012-13 2013-14 2014-15 2015-16 2016-17 2017-18
0
2
4
6
8
10
12
14
16
18
27 41 3 17 31 45 7 21 35 49 10 24 38 52 14 28 42 4 18 32 46 8 22
Pe
rce
nt
of
De
ath
s
Figure 6. Percent of San Diego County Deaths Registered with Pneumonia and/or Influenza by Week and FY Compared to Prior 5-Year
Baseline & Upper 95% Threshold Values (Serfling Method)
%P&I Deaths Baseline Upper 95% Threshold
2012-13 2013-14 2014-15 2015-16 2016-17 2017-18
May 2, 2018Volume 17, Issue 30
Week 17Ending 4/28/2018
Page 1 of 3
Influenza Watch
Epidemiology and Immunization Services Branch(619) 692-8499 [email protected]
Page 6 of 8
County of San Diego
PUBLIC HEALTH SERVICES
0
25
50
75
100
125
150
175
200
225
250
275
300
325
350
375
2005
-06
2006
-07
2007
-08
2008
-09
2009
-10
2010
-11
2011
-12
2012
-13
2013
-14
2014
-15
2015
-16
2016
-17
2017
-18
FYTD
Num
ber o
f Dea
ths
Season
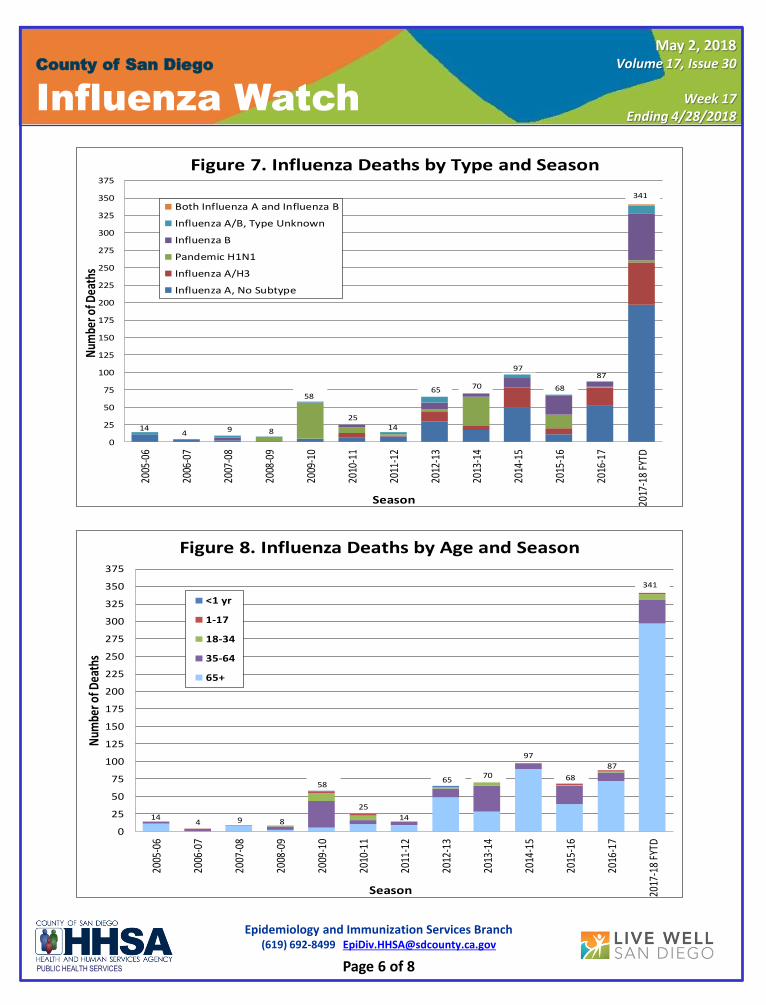
Figure 7. Influenza Deaths by Type and Season
Both Influenza A and Influenza B
Influenza A/B, Type Unknown
Influenza B
Pandemic H1N1
Influenza A/H3
Influenza A, No Subtype
87
68
97
7065
1425
341
58
9 8144
0
25
50
75
100
125
150
175
200
225
250
275
300
325
350
375
2005
-06
2006
-07
2007
-08
2008
-09
2009
-10
2010
-11
2011
-12
2012
-13
2013
-14
2014
-15
2015
-16
2016
-17
2017
-18
FYTD
Num
ber o
f Dea
ths
Season
Figure 8. Influenza Deaths by Age and Season
<1 yr
1-17
18-34
35-64
65+
341
87
68
97
7065
14
25
58
89144
May 2, 2018Volume 17, Issue 30
Week 17Ending 4/28/2018
Page 1 of 3
Influenza Watch
Epidemiology and Immunization Services Branch(619) 692-8499 [email protected]
Page 7 of 8
County of San Diego
PUBLIC HEALTH SERVICES
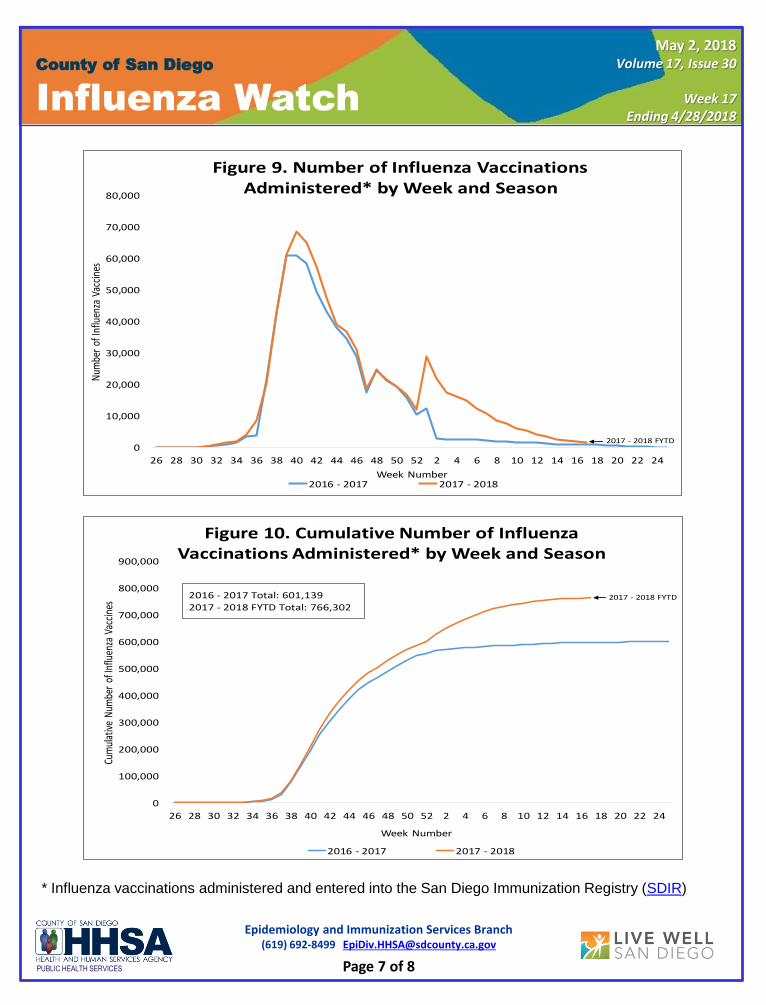
* Influenza vaccinations administered and entered into the San Diego Immunization Registry (SDIR)
0
10,000
20,000
30,000
40,000
50,000
60,000
70,000
80,000
26 28 30 32 34 36 38 40 42 44 46 48 50 52 2 4 6 8 10 12 14 16 18 20 22 24
Num
ber
of In
fluen
za V
acci
nes
Week Number
Figure 9. Number of Influenza Vaccinations Administered* by Week and Season
2016 - 2017 2017 - 2018
2017 - 2018 FYTD
0
100,000
200,000
300,000
400,000
500,000
600,000
700,000
800,000
900,000
26 28 30 32 34 36 38 40 42 44 46 48 50 52 2 4 6 8 10 12 14 16 18 20 22 24
Cum
ulat
ive
Num
ber
of In
fluen
za V
acci
nes
Week Number
Figure 10. Cumulative Number of Influenza Vaccinations Administered* by Week and Season
2016 - 2017 2017 - 2018
2017 - 2018 FYTD2016 - 2017 Total: 601,139
2017 - 2018 FYTD Total: 766,302
May 2, 2018Volume 17, Issue 30
Week 17Ending 4/28/2018
Page 1 of 3
Influenza Watch
Epidemiology and Immunization Services Branch(619) 692-8499 [email protected]
Page 8 of 8
County of San Diego
PUBLIC HEALTH SERVICES
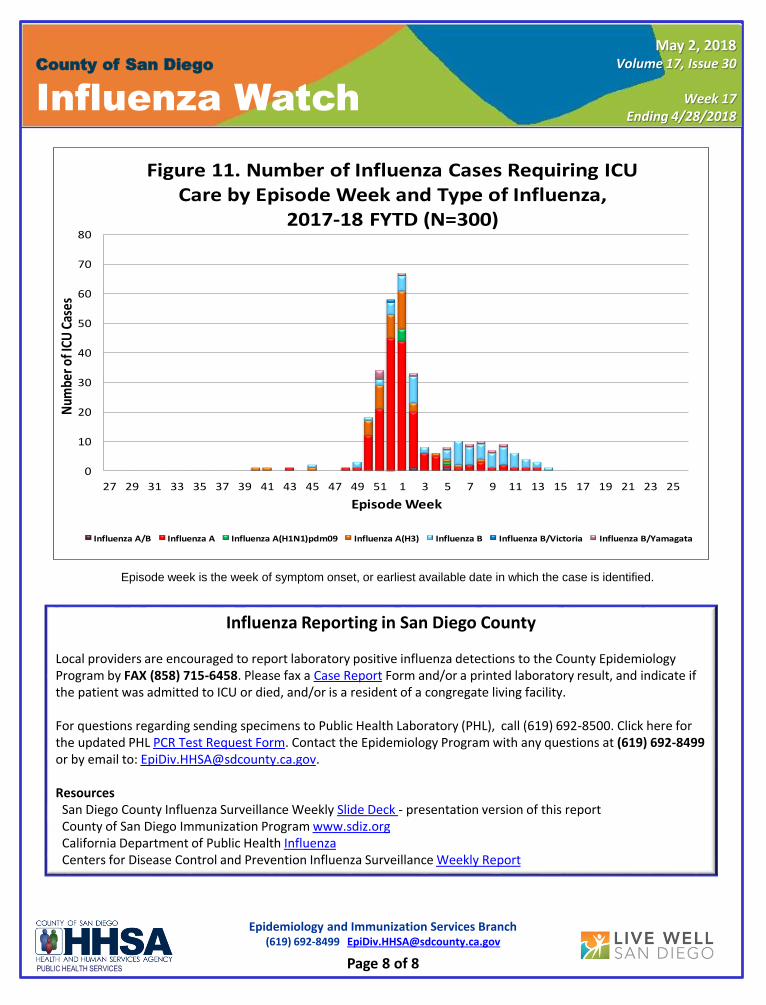
Episode week is the week of symptom onset, or earliest available date in which the case is identified.
Influenza Reporting in San Diego County
Local providers are encouraged to report laboratory positive influenza detections to the County Epidemiology Program by FAX (858) 715-6458. Please fax a Case Report Form and/or a printed laboratory result, and indicate if the patient was admitted to ICU or died, and/or is a resident of a congregate living facility.
For questions regarding sending specimens to Public Health Laboratory (PHL), call (619) 692-8500. Click here for the updated PHL PCR Test Request Form. Contact the Epidemiology Program with any questions at (619) 692-8499or by email to: [email protected].
ResourcesSan Diego County Influenza Surveillance Weekly Slide Deck - presentation version of this report County of San Diego Immunization Program www.sdiz.orgCalifornia Department of Public Health InfluenzaCenters for Disease Control and Prevention Influenza Surveillance Weekly Report
0
10
20
30
40
50
60
70
80
27 29 31 33 35 37 39 41 43 45 47 49 51 1 3 5 7 9 11 13 15 17 19 21 23 25
Num
ber o
f ICU
Cas
es
Episode Week
Figure 11. Number of Influenza Cases Requiring ICU Care by Episode Week and Type of Influenza,
2017-18 FYTD (N=300)
Influenza A/B Influenza A Influenza A(H1N1)pdm09 Influenza A(H3) Influenza B Influenza B/Victoria Influenza B/Yamagata
May 2, 2018Volume 17, Issue 30
Week 17Ending 4/28/2018