Embed Size (px)
Citation preview
1
COUNTRY REPORT:
RUSSIAN FEDERATION
June 2015
This project has received funding from the European Union’s Seventh Framework Programme for
Research, Technological Development and Demonstration under grant agreement no 612755
Dmitri Rylko, Daniil Khotko, Abuzarova Svetlana, Natalia Yunosheva,
Irina Glazunova
Institute for Agricultural Market Studies, Russia
2
Content
1. MACROECONOMIC ENVIRONMENT AND POLICIES ................................................................................. 4
1.1 Background data................................................................................................................................. 4
1.2 Macroeconomic developments .......................................................................................................... 5
1.3 Macro-economic and other general policies ..................................................................................... 5
1.4 Institutional environment of the agro-food sector ............................................................................ 7
2. SITUATION AND DEVELOPMENT OF THE AGRICULTURAL SECTOR .......................................................... 9
2.1 Role of agricultural sector in the economy ........................................................................................ 9
2.2 Land use .............................................................................................................................................. 9
2.3 Farm structures (including land properties) ..................................................................................... 10
2.4 Production and output (including major sectors and yields) ........................................................... 11
2.4.1 Crop production and yields ....................................................................................................... 12
2.4.2 Animal production ..................................................................................................................... 20
2.4.3 Organic production .................................................................................................................... 25
2.5 Prices, costs and income .................................................................................................................. 25
2.5.1 Prices ......................................................................................................................................... 25
2.5.2 Costs .......................................................................................................................................... 27
2.5.3 Farm income .............................................................................................................................. 28
2.6 Future perspective for the agricultural sector ................................................................................. 28
3. SITUATION AND DEVELOPMENT OF UPSTREAM AND DOWNSTREAM SECTORS .................................. 30
3.1 Input production and use ................................................................................................................. 30
3.1.1 Input production ....................................................................................................................... 30
3.1.2 Input use .................................................................................................................................... 30
3.2 Food industry .................................................................................................................................... 31
3.2.1 Food production ........................................................................................................................ 31
3.2.2 Structure of the food sector ...................................................................................................... 33
3.2.3 Prices, costs and performance indicators ................................................................................. 34
3.2.4 Food law .................................................................................................................................... 34
3.3 Bioenergy production ....................................................................................................................... 35
3.4 Food retail and consumption patterns ............................................................................................. 35
3.4.1 Food retail sector ...................................................................................................................... 35
3.4.2 Consumption ............................................................................................................................. 36
3
4. AGRI-FOOD TRADE AND TRADE RELATIONS .......................................................................................... 40
4.1 Agri-food trade ................................................................................................................................. 40
4.1.1 Overall agri-food trade .............................................................................................................. 40
4.1.2 Agri-food trade by trading partner ............................................................................................ 41
4.1.3 Agri-food trade by products ...................................................................................................... 44
4.2 Trade policy and infrastructures ...................................................................................................... 44
4.2.1 Measures directly affecting trade imports and exports ............................................................ 44
4.2.2 Logistics and infrastructure ....................................................................................................... 45
4.2.3 Main trade agreements ............................................................................................................. 46
5. AGRICULTURAL POLICY AND INSTITUTIONAL ENVIRONMENT............................................................... 47
6. CONCLUSIONS ........................................................................................................................................ 49
4
1. MACROECONOMIC ENVIRONMENT AND POLICIES
1.1 Background data
The Russian Federation is located at the north of Eurasia. It shares land borders with 14 countries, and
maritime borders with Japan, USA and Canada (Figure 1). Russia covers more than 17 mln. square
kilometres that represent more than one-eighth of the Earth's inhabited land area (Table 1). Russia is
situated in different climate zones but the humid continental climate is prevalent. The range of climate
zones goes from polar and subarctic climate at the north to humid subtropical climate at the south (near
the Black Sea coast). Differences in temperatures are significant; the coldest month is January, whereas
the warmest is July.
Figure 1 Map of the Russian Federation
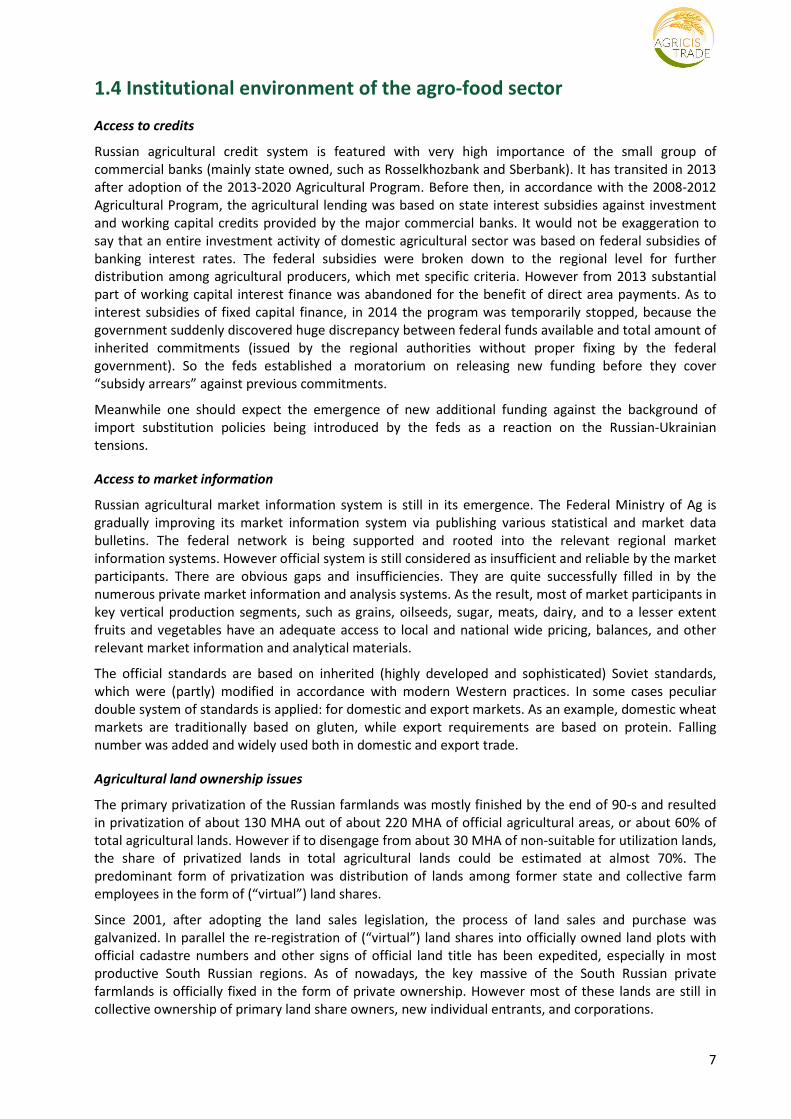
Table 1 Main country view 2013
Russia – Year 2013
Population (1st January) (000 inhabitants) 143 667
Area (sq. km) 17 125 187
Real GDP growth rate (% change on previous year) 1.32
Unemployment rate (%) 5.5
Agricultural Utilized Area (ha) 191095300
Agriculture, hunting and fishing (% of total GVA) 3.76
Source: Rosstat
From north to south, the East European Plain, also known as Russian Plain, is clad sequentially in Arctic
tundra, coniferous forest (taiga), mixed and broad-leaf forests, grassland (steppe), and semi-desert
(fringing the Caspian Sea), as the changes in vegetation reflect the changes in climate. Siberia supports a
similar sequence but largely consists of taiga. Russia has the world's largest forest reserves, second only
after the Amazon Rainforest in amount of carbon dioxide absorbed.
5
1.2 Macroeconomic developments
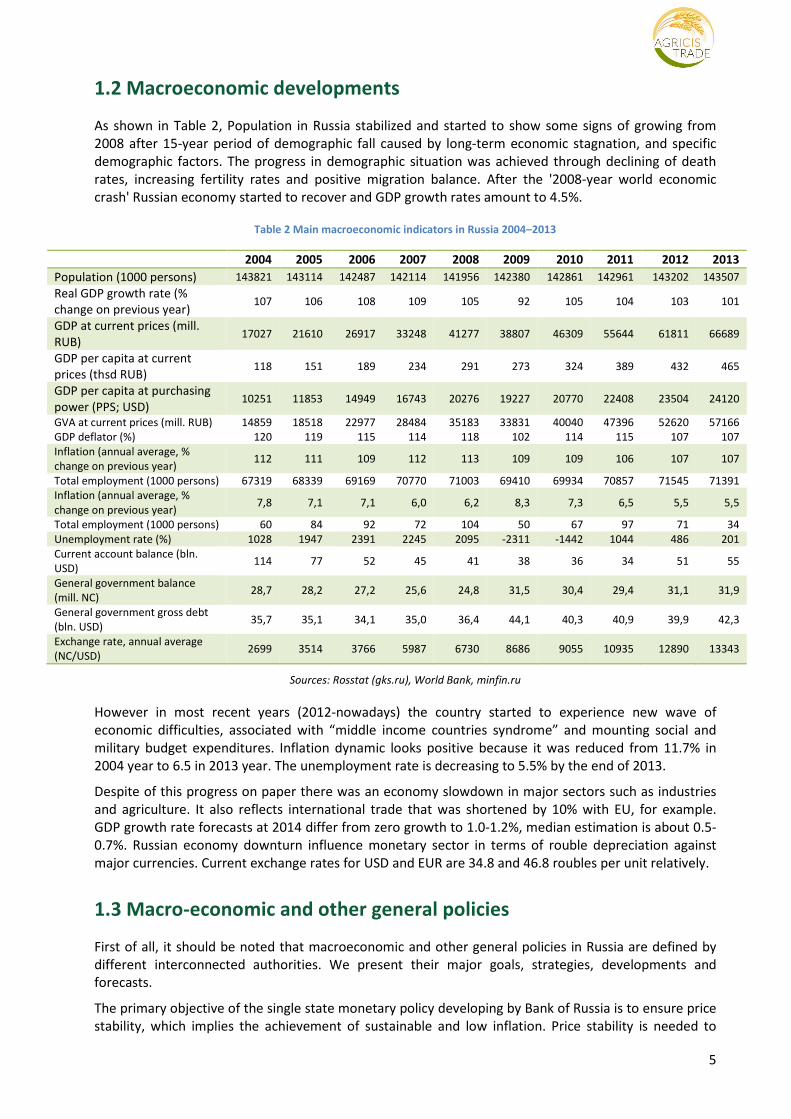
As shown in Table 2, Population in Russia stabilized and started to show some signs of growing from
2008 after 15-year period of demographic fall caused by long-term economic stagnation, and specific
demographic factors. The progress in demographic situation was achieved through declining of death
rates, increasing fertility rates and positive migration balance. After the '2008-year world economic
crash' Russian economy started to recover and GDP growth rates amount to 4.5%.
Table 2 Main macroeconomic indicators in Russia 2004–2013
2004 2005 2006 2007 2008 2009 2010 2011 2012 2013
Population (1000 persons) 143821 143114 142487 142114 141956 142380 142861 142961 143202 143507
Real GDP growth rate (%
change on previous year) 107 106 108 109 105 92 105 104 103 101
GDP at current prices (mill.
RUB) 17027 21610 26917 33248 41277 38807 46309 55644 61811 66689
GDP per capita at current
prices (thsd RUB) 118 151 189 234 291 273 324 389 432 465
GDP per capita at purchasing
power (PPS; USD) 10251 11853 14949 16743 20276 19227 20770 22408 23504 24120
GVA at current prices (mill. RUB)
GDP deflator (%) 14859
120
18518
119
22977
115
28484
114
35183
118
33831
102
40040
114
47396
115
52620
107
57166
107
Inflation (annual average, %
change on previous year) 112 111 109 112 113 109 109 106 107 107
Total employment (1000 persons) 67319 68339 69169 70770 71003 69410 69934 70857 71545 71391
Inflation (annual average, %
change on previous year) 7,8 7,1 7,1 6,0 6,2 8,3 7,3 6,5 5,5 5,5
Total employment (1000 persons) 60 84 92 72 104 50 67 97 71 34
Unemployment rate (%) 1028 1947 2391 2245 2095 -2311 -1442 1044 486 201
Current account balance (bln.
USD) 114 77 52 45 41 38 36 34 51 55
General government balance
(mill. NC) 28,7 28,2 27,2 25,6 24,8 31,5 30,4 29,4 31,1 31,9
General government gross debt
(bln. USD) 35,7 35,1 34,1 35,0 36,4 44,1 40,3 40,9 39,9 42,3
Exchange rate, annual average
(NC/USD) 2699 3514 3766 5987 6730 8686 9055 10935 12890 13343
Sources: Rosstat (gks.ru), World Bank, minfin.ru
However in most recent years (2012-nowadays) the country started to experience new wave of
economic difficulties, associated with “middle income countries syndrome” and mounting social and
military budget expenditures. Inflation dynamic looks positive because it was reduced from 11.7% in
2004 year to 6.5 in 2013 year. The unemployment rate is decreasing to 5.5% by the end of 2013.
Despite of this progress on paper there was an economy slowdown in major sectors such as industries
and agriculture. It also reflects international trade that was shortened by 10% with EU, for example.
GDP growth rate forecasts at 2014 differ from zero growth to 1.0-1.2%, median estimation is about 0.5-
0.7%. Russian economy downturn influence monetary sector in terms of rouble depreciation against
major currencies. Current exchange rates for USD and EUR are 34.8 and 46.8 roubles per unit relatively.
1.3 Macro-economic and other general policies
First of all, it should be noted that macroeconomic and other general policies in Russia are defined by
different interconnected authorities. We present their major goals, strategies, developments and
forecasts.
The primary objective of the single state monetary policy developing by Bank of Russia is to ensure price
stability, which implies the achievement of sustainable and low inflation. Price stability is needed to

6
raise and keep a high level of the living standards of Russian citizens, which is an ultimate objective of
the state economic policy.
Starting from 2015, the monetary policy will be conducted under the inflation targeting regime. The
Bank of Russia influences pricing processes with a certain time lag, therefore the inflation target should
be set for a medium run. The monetary policy goal is to lower inflation to 4% in 2017 and keep it close
to this level. The permanent target has been set with due consideration of the structural specifics of the
Russian economy and price dynamics in the countries that are Russia’s trading partners; and this target
is regarded as feasible over a three-year horizon.
The inflation target is set for the consumer price index (CPI), which is measured for a month on the
corresponding month of the previous year. This indicator reflects a change in the prices of a basket of
goods and services consumed by an average household and helps assess the scale of inflation impact on
public welfare. The CPI is the most easily perceived inflation measure widely used by economic agents.
Therefore, its dynamics considerably influence inflation expectations. The Bank of Russia also uses other
inflation indicators, e.g. core inflation, to conduct analysis of the economic situation and take monetary
policy decisions.
Concerning the SME-business climate in Russia one should be noted that Russia improved the position in
Doing Business ranking for 5 levels at the end of 2014. There are several reasons, developments,
amendments affected for pretty good results. Starting a business Russia made starting a business easier
by abolishing the requirement to have the bank signature card notarized before opening a company
bank account. Dealing with construction permits Russia made dealing with construction permits easier
by eliminating several requirements for project approvals from government agencies and by reducing
the time required to register a new building. Getting electricity Russia made getting electricity simpler
and less costly by setting standard connection tariffs and eliminating many procedures previously
required. Registering property Russia made transferring property easier by streamlining procedures and
implementing effective time limits for processing transfer applications. Trading across borders Russia
made trading across borders easier by implementing an electronic system for submitting export and
import documents and by reducing the number of physical inspections.
As of today, activities aimed at overcoming the crisis in the economy took on a strategic nature. In
accordance with the instructions of the Government of the Russian Federation active work is being done
on monitoring measures aimed at reviving the economy.
Effective functioning of the strategic management system is especially important in the context of a
financial crisis and Federal budget deficit. Formation of the strategic management of the state will
change the approach to the medium-term prognosis, link it to the prediction of long-term trends, will
coordinate the development and implement the long-term development strategies and programs of the
Russian Federation as a whole, as well as those of individual regions and sectors of the economy, and
their mutual alignment of goals, deadlines and activities. In addition, this system involves the
development of mechanisms of "performance management" or “result based management”, providing
a clear connection between performance of public authorities and the budget allocated to their
achievement.
Table 3 FDI flows in Russia 2004–2013
2004 2005 2006 2007 2008 2009 2010 2011 2012 2013
FDI (mill. NC) 2865 3611 4730 6716 8782 7976 9152 11036 12586 13256
FDI in agricultural sector (mill. NC) 117 142 224 339 400 325 304 447 476 488
FDI in food-processing sector (mill. NC) 93 113 128 170 194 157 177 187 219 226
Source: Rosstat (gks.ru)
7
1.4 Institutional environment of the agro-food sector
Access to credits
Russian agricultural credit system is featured with very high importance of the small group of
commercial banks (mainly state owned, such as Rosselkhozbank and Sberbank). It has transited in 2013
after adoption of the 2013-2020 Agricultural Program. Before then, in accordance with the 2008-2012
Agricultural Program, the agricultural lending was based on state interest subsidies against investment
and working capital credits provided by the major commercial banks. It would not be exaggeration to
say that an entire investment activity of domestic agricultural sector was based on federal subsidies of
banking interest rates. The federal subsidies were broken down to the regional level for further
distribution among agricultural producers, which met specific criteria. However from 2013 substantial
part of working capital interest finance was abandoned for the benefit of direct area payments. As to
interest subsidies of fixed capital finance, in 2014 the program was temporarily stopped, because the
government suddenly discovered huge discrepancy between federal funds available and total amount of
inherited commitments (issued by the regional authorities without proper fixing by the federal
government). So the feds established a moratorium on releasing new funding before they cover
“subsidy arrears” against previous commitments.
Meanwhile one should expect the emergence of new additional funding against the background of
import substitution policies being introduced by the feds as a reaction on the Russian-Ukrainian
tensions.
Access to market information
Russian agricultural market information system is still in its emergence. The Federal Ministry of Ag is
gradually improving its market information system via publishing various statistical and market data
bulletins. The federal network is being supported and rooted into the relevant regional market
information systems. However official system is still considered as insufficient and reliable by the market
participants. There are obvious gaps and insufficiencies. They are quite successfully filled in by the
numerous private market information and analysis systems. As the result, most of market participants in
key vertical production segments, such as grains, oilseeds, sugar, meats, dairy, and to a lesser extent
fruits and vegetables have an adequate access to local and national wide pricing, balances, and other
relevant market information and analytical materials.
The official standards are based on inherited (highly developed and sophisticated) Soviet standards,
which were (partly) modified in accordance with modern Western practices. In some cases peculiar
double system of standards is applied: for domestic and export markets. As an example, domestic wheat
markets are traditionally based on gluten, while export requirements are based on protein. Falling
number was added and widely used both in domestic and export trade.
Agricultural land ownership issues
The primary privatization of the Russian farmlands was mostly finished by the end of 90-s and resulted
in privatization of about 130 MHA out of about 220 MHA of official agricultural areas, or about 60% of
total agricultural lands. However if to disengage from about 30 MHA of non-suitable for utilization lands,
the share of privatized lands in total agricultural lands could be estimated at almost 70%. The
predominant form of privatization was distribution of lands among former state and collective farm
employees in the form of (“virtual”) land shares.
Since 2001, after adopting the land sales legislation, the process of land sales and purchase was
galvanized. In parallel the re-registration of (“virtual”) land shares into officially owned land plots with
official cadastre numbers and other signs of official land title has been expedited, especially in most
productive South Russian regions. As of nowadays, the key massive of the South Russian private
farmlands is officially fixed in the form of private ownership. However most of these lands are still in
collective ownership of primary land share owners, new individual entrants, and corporations.
8
The land may be leased out for up to 49 years. To be officially recognized, the land lease agreement
must be officially registered in the local registration chamber.
Foreigners have the right to lease Russian farmland. Direct foreign ownership is prohibited. However
nothing prevents so far the foreign company or individual to register the company in Russia, which
would have the right then to buy the Russian farmland. In total, we are aware about at least 2.7 MHA of
the Russian farmland, which is under control of foreign entities. It includes about 1 MHA in ownership of
Russian companies, which in the end of end belong to the foreign companies or individuals.
Provision and access to other public goods such as infrastructure, education, research
Russia has highly developed inherited from the Soviet times agricultural education system. Dozens of
state owned and budget financed agricultural academies, universities, and colleges are opened in almost
every major Russian city. Unfortunately the system is not well adapted yet to the modern practices, so
that the share of graduates who prefer to work outside of agriculture and agribusiness is extremely high.
Russia has developed system of agricultural and food inspection services, which belong to
Rosselkhnadzor, or Rospotrebnadzor federal Agencies. Besides, an accredited network of private labs
and testing centres is functioning across the country.
9
2. SITUATION AND DEVELOPMENT OF THE
AGRICULTURAL SECTOR
2.1 Role of agricultural sector in the economy
Russian agriculture (including hunting and forestry) occupies 3.1% in domestic GDP (2013, Rosstat). Its
share in GDP is steadily declining: in 2004 it was 5.9%.
During recent decade the agricultural output was steadily growing at %: CAGR. According to the
Agricultural Program (2013-2020), during 2013-2020, domestic agricultural output should grow rather
modestly, at 2% per year. However we believe that agricultural authorities tend to put low targets and
underestimate potential growth rates, to be able to more easily report about “goals fulfilment”.
As of January 2013, rural population amounted to 37.2 Mln, in comparison with 38.3 Mln in 2004. The
share of rural in total domestic population has steadily declined to 25.9% in 2013 from 26.5% in 2004.
The number of agricultural employees (including hunting and forestry) is 6.5 Mln (Rosstat, 2012). The
number of agricultural employees is steadily declining: in 2004 the relevant figure was 7.4 Mln. The
share of agricultural labour in the annual country workforce is also steadily declining: 9.6% in 2012, in
comparison with 11.1% in 2004 (Rosstat, 2013).
We forecast all above given rural; population and rural employment trends will be real in foreseeable
future.
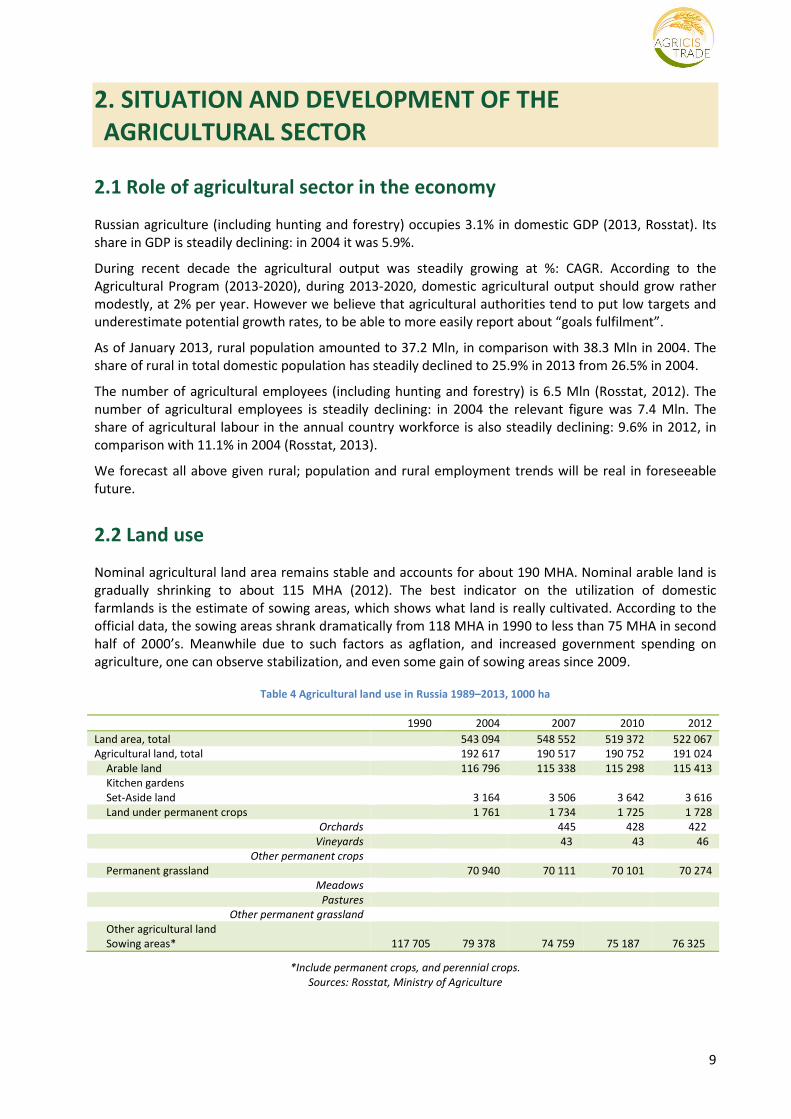
2.2 Land use
Nominal agricultural land area remains stable and accounts for about 190 MHA. Nominal arable land is
gradually shrinking to about 115 MHA (2012). The best indicator on the utilization of domestic
farmlands is the estimate of sowing areas, which shows what land is really cultivated. According to the
official data, the sowing areas shrank dramatically from 118 MHA in 1990 to less than 75 MHA in second
half of 2000’s. Meanwhile due to such factors as agflation, and increased government spending on
agriculture, one can observe stabilization, and even some gain of sowing areas since 2009.
Table 4 Agricultural land use in Russia 1989–2013, 1000 ha
1990 2004 2007 2010 2012
Land area, total 543 094 548 552 519 372 522 067
Agricultural land, total 192 617 190 517 190 752 191 024
Arable land 116 796 115 338 115 298 115 413
Kitchen gardens
Set-Aside land 3 164 3 506 3 642 3 616
Land under permanent crops 1 761 1 734 1 725 1 728
Orchards 445 428 422
Vineyards 43 43 46
Other permanent crops
Permanent grassland 70 940 70 111 70 101 70 274
Meadows
Pastures
Other permanent grassland
Other agricultural land
Sowing areas* 117 705 79 378 74 759 75 187 76 325
*Include permanent crops, and perennial crops.
Sources: Rosstat, Ministry of Agriculture
10
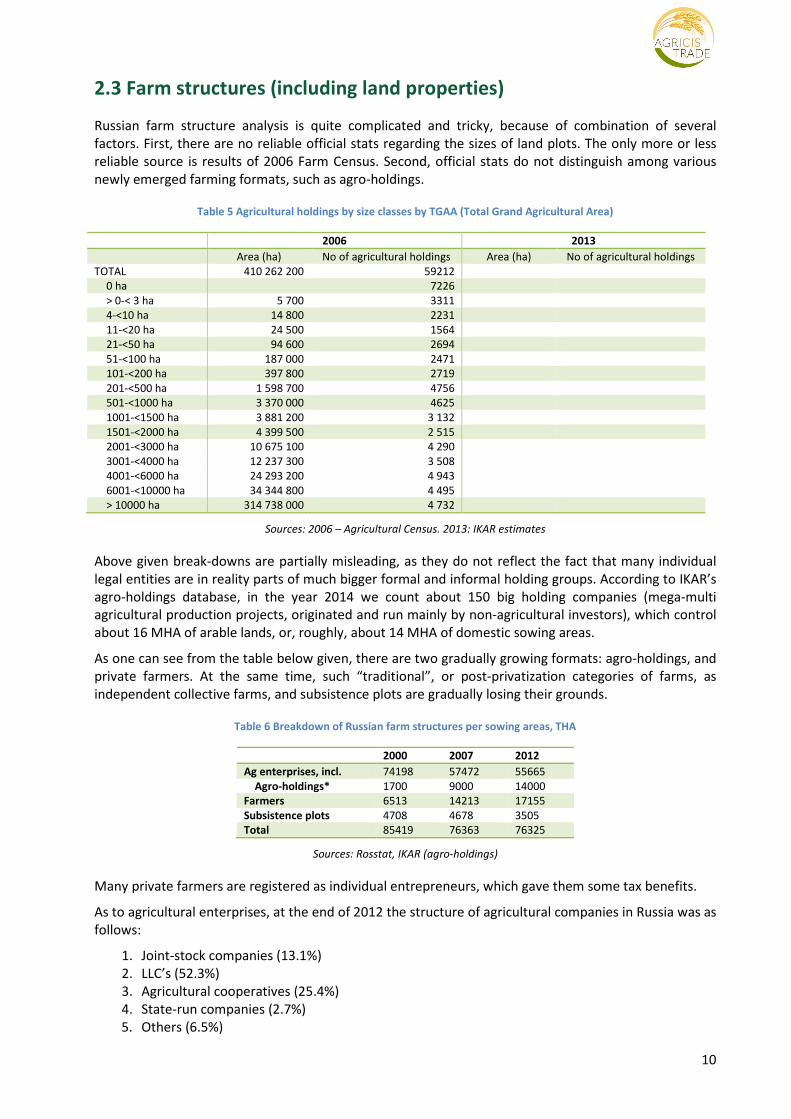
2.3 Farm structures (including land properties)
Russian farm structure analysis is quite complicated and tricky, because of combination of several
factors. First, there are no reliable official stats regarding the sizes of land plots. The only more or less
reliable source is results of 2006 Farm Census. Second, official stats do not distinguish among various
newly emerged farming formats, such as agro-holdings.
Table 5 Agricultural holdings by size classes by TGAA (Total Grand Agricultural Area)
2006 2013
Area (ha) No of agricultural holdings Area (ha) No of agricultural holdings
TOTAL 410 262 200 59212
0 ha 7226
> 0-< 3 ha 5 700 3311
4-<10 ha 14 800 2231
11-<20 ha 24 500 1564
21-<50 ha 94 600 2694
51-<100 ha 187 000 2471
101-<200 ha 397 800 2719
201-<500 ha 1 598 700 4756
501-<1000 ha 3 370 000 4625
1001-<1500 ha 3 881 200 3 132
1501-<2000 ha 4 399 500 2 515
2001-<3000 ha 10 675 100 4 290
3001-<4000 ha 12 237 300 3 508
4001-<6000 ha 24 293 200 4 943
6001-<10000 ha 34 344 800 4 495
> 10000 ha 314 738 000 4 732
Sources: 2006 – Agricultural Census. 2013: IKAR estimates
Above given break-downs are partially misleading, as they do not reflect the fact that many individual
legal entities are in reality parts of much bigger formal and informal holding groups. According to IKAR’s
agro-holdings database, in the year 2014 we count about 150 big holding companies (mega-multi
agricultural production projects, originated and run mainly by non-agricultural investors), which control
about 16 MHA of arable lands, or, roughly, about 14 MHA of domestic sowing areas.
As one can see from the table below given, there are two gradually growing formats: agro-holdings, and
private farmers. At the same time, such “traditional”, or post-privatization categories of farms, as
independent collective farms, and subsistence plots are gradually losing their grounds.
Table 6 Breakdown of Russian farm structures per sowing areas, THA
2000 2007 2012
Ag enterprises, incl. 74198 57472 55665
Agro-holdings* 1700 9000 14000
Farmers 6513 14213 17155
Subsistence plots 4708 4678 3505
Total 85419 76363 76325
Sources: Rosstat, IKAR (agro-holdings)
Many private farmers are registered as individual entrepreneurs, which gave them some tax benefits.
As to agricultural enterprises, at the end of 2012 the structure of agricultural companies in Russia was as
follows:
1. Joint-stock companies (13.1%)
2. LLC’s (52.3%)
3. Agricultural cooperatives (25.4%)
4. State-run companies (2.7%)
5. Others (6.5%)
11
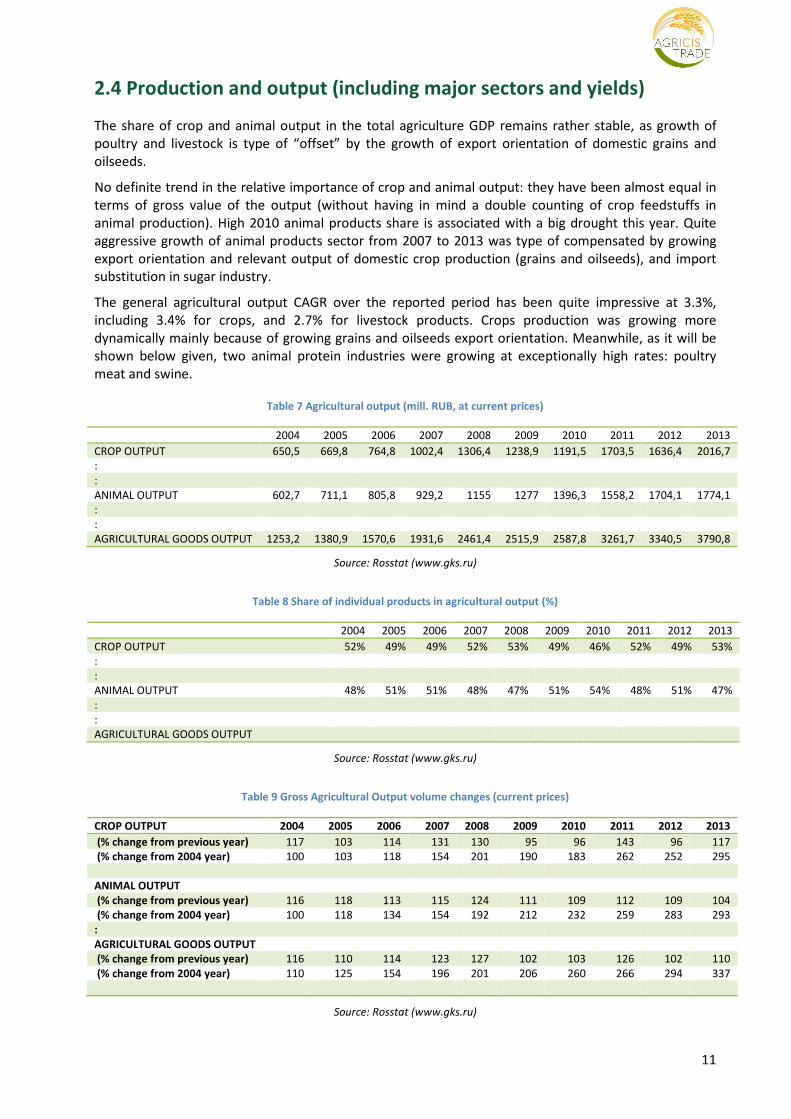
2.4 Production and output (including major sectors and yields)
The share of crop and animal output in the total agriculture GDP remains rather stable, as growth of
poultry and livestock is type of “offset” by the growth of export orientation of domestic grains and
oilseeds.
No definite trend in the relative importance of crop and animal output: they have been almost equal in
terms of gross value of the output (without having in mind a double counting of crop feedstuffs in
animal production). High 2010 animal products share is associated with a big drought this year. Quite
aggressive growth of animal products sector from 2007 to 2013 was type of compensated by growing
export orientation and relevant output of domestic crop production (grains and oilseeds), and import
substitution in sugar industry.
The general agricultural output CAGR over the reported period has been quite impressive at 3.3%,
including 3.4% for crops, and 2.7% for livestock products. Crops production was growing more
dynamically mainly because of growing grains and oilseeds export orientation. Meanwhile, as it will be
shown below given, two animal protein industries were growing at exceptionally high rates: poultry
meat and swine.
Table 7 Agricultural output (mill. RUB, at current prices)
2004 2005 2006 2007 2008 2009 2010 2011 2012 2013
CROP OUTPUT 650,5 669,8 764,8 1002,4 1306,4 1238,9 1191,5 1703,5 1636,4 2016,7
:
:
ANIMAL OUTPUT 602,7 711,1 805,8 929,2 1155 1277 1396,3 1558,2 1704,1 1774,1
:
:
AGRICULTURAL GOODS OUTPUT 1253,2 1380,9 1570,6 1931,6 2461,4 2515,9 2587,8 3261,7 3340,5 3790,8
Source: Rosstat (www.gks.ru)
Table 8 Share of individual products in agricultural output (%)
2004 2005 2006 2007 2008 2009 2010 2011 2012 2013
CROP OUTPUT 52% 49% 49% 52% 53% 49% 46% 52% 49% 53%
:
:
ANIMAL OUTPUT 48% 51% 51% 48% 47% 51% 54% 48% 51% 47%
:
:
AGRICULTURAL GOODS OUTPUT
Source: Rosstat (www.gks.ru)
Table 9 Gross Agricultural Output volume changes (current prices)
CROP OUTPUT 2004 2005 2006 2007 2008 2009 2010 2011 2012 2013
(% change from previous year) 117 103 114 131 130 95 96 143 96 117
(% change from 2004 year) 100 103 118 154 201 190 183 262 252 295
ANIMAL OUTPUT
(% change from previous year) 116 118 113 115 124 111 109 112 109 104
(% change from 2004 year) 100 118 134 154 192 212 232 259 283 293
:
AGRICULTURAL GOODS OUTPUT
(% change from previous year) 116 110 114 123 127 102 103 126 102 110
(% change from 2004 year) 110 125 154 196 201 206 260 266 294 337
Source: Rosstat (www.gks.ru)
12
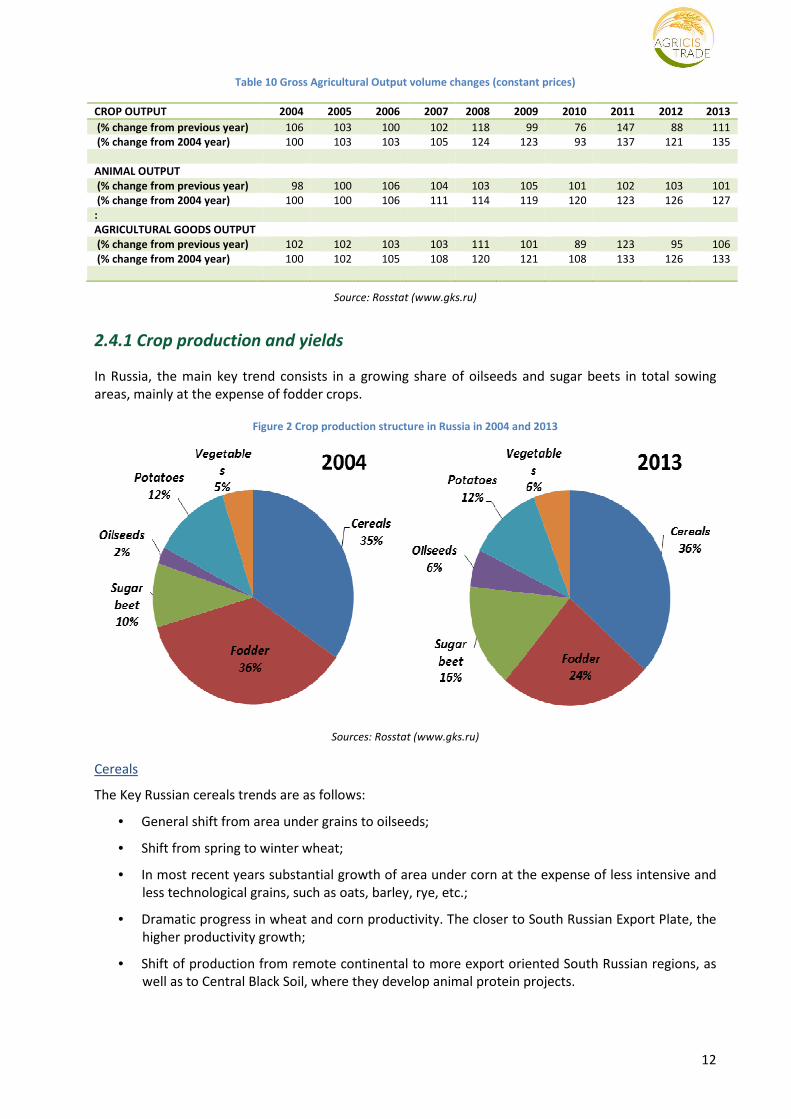
Table 10 Gross Agricultural Output volume changes (constant prices)
CROP OUTPUT 2004 2005 2006 2007 2008 2009 2010 2011 2012 2013
(% change from previous year) 106 103 100 102 118 99 76 147 88 111
(% change from 2004 year) 100 103 103 105 124 123 93 137 121 135
ANIMAL OUTPUT
(% change from previous year) 98 100 106 104 103 105 101 102 103 101
(% change from 2004 year) 100 100 106 111 114 119 120 123 126 127
:
AGRICULTURAL GOODS OUTPUT
(% change from previous year) 102 102 103 103 111 101 89 123 95 106
(% change from 2004 year) 100 102 105 108 120 121 108 133 126 133
Source: Rosstat (www.gks.ru)
2.4.1 Crop production and yields
In Russia, the main key trend consists in a growing share of oilseeds and sugar beets in total sowing
areas, mainly at the expense of fodder crops.
Figure 2 Crop production structure in Russia in 2004 and 2013
Sources: Rosstat (www.gks.ru)
Cereals
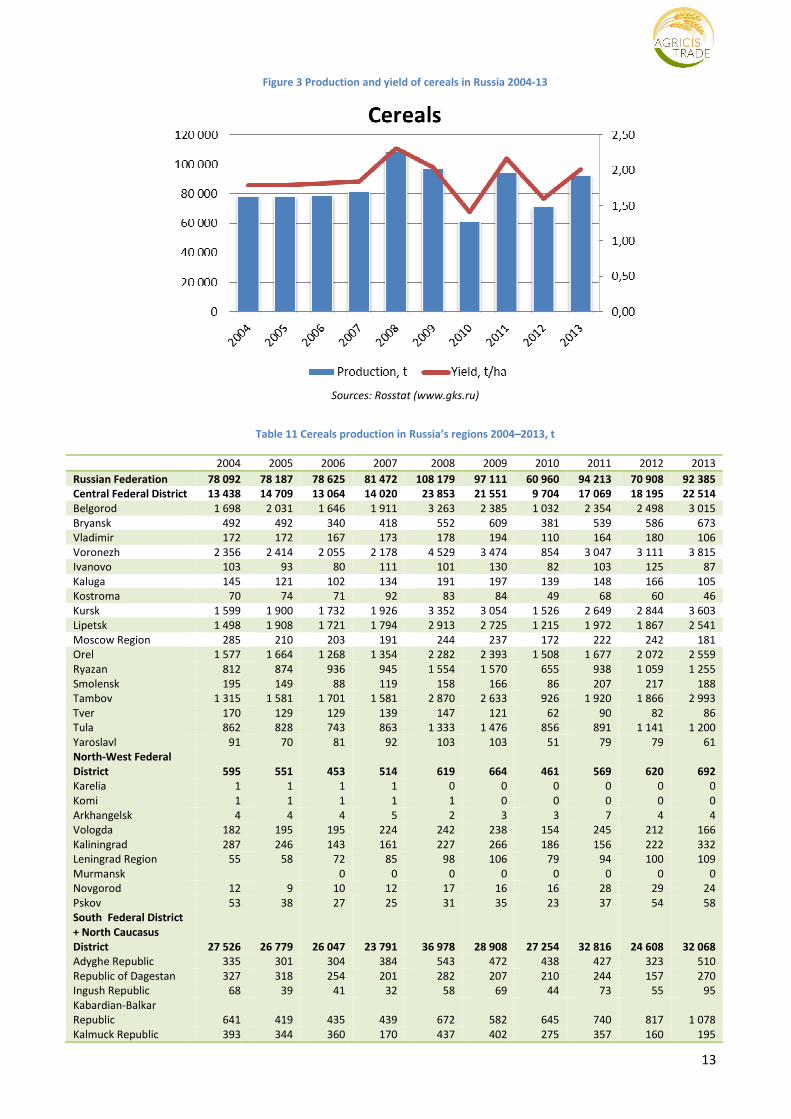
The Key Russian cereals trends are as follows:
• General shift from area under grains to oilseeds;
• Shift from spring to winter wheat;
• In most recent years substantial growth of area under corn at the expense of less intensive and
less technological grains, such as oats, barley, rye, etc.;
• Dramatic progress in wheat and corn productivity. The closer to South Russian Export Plate, the
higher productivity growth;
• Shift of production from remote continental to more export oriented South Russian regions, as
well as to Central Black Soil, where they develop animal protein projects.
13
Figure 3 Production and yield of cereals in Russia 2004-13
Sources: Rosstat (www.gks.ru)
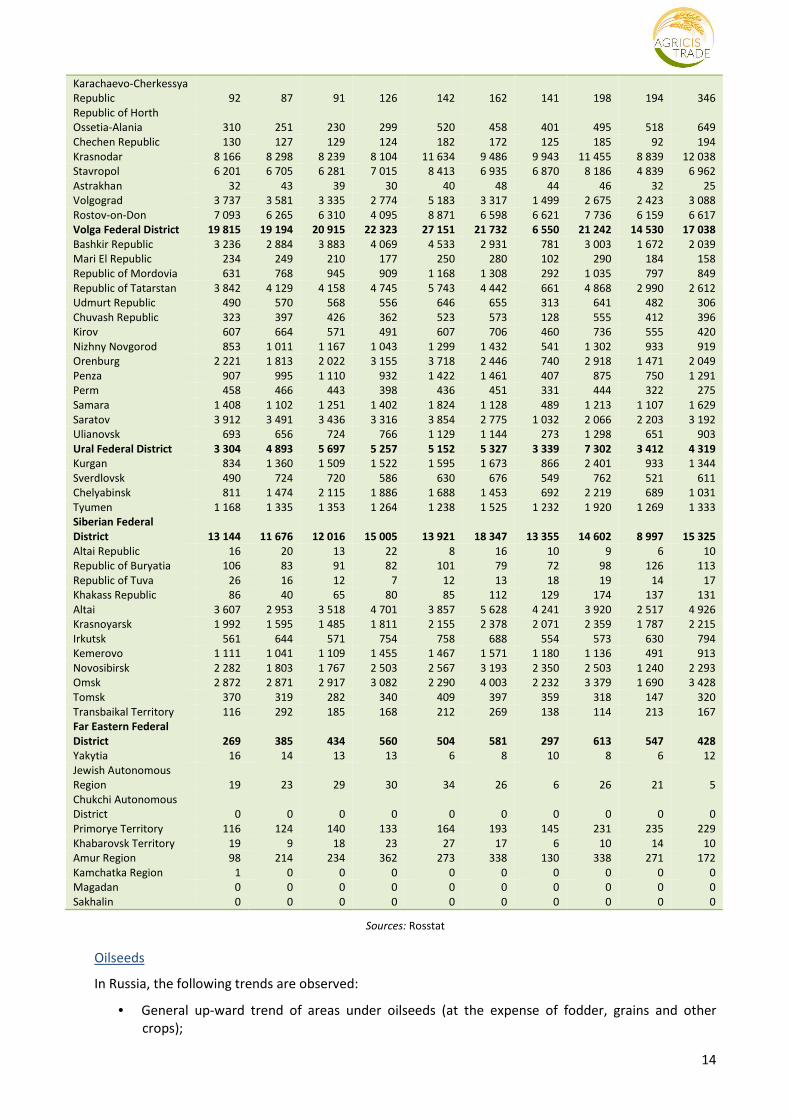
Table 11 Cereals production in Russia’s regions 2004–2013, t
2004 2005 2006 2007 2008 2009 2010 2011 2012 2013
Russian Federation 78 092 78 187 78 625 81 472 108 179 97 111 60 960 94 213 70 908 92 385
Central Federal District 13 438 14 709 13 064 14 020 23 853 21 551 9 704 17 069 18 195 22 514
Belgorod 1 698 2 031 1 646 1 911 3 263 2 385 1 032 2 354 2 498 3 015
Bryansk 492 492 340 418 552 609 381 539 586 673
Vladimir 172 172 167 173 178 194 110 164 180 106
Voronezh 2 356 2 414 2 055 2 178 4 529 3 474 854 3 047 3 111 3 815
Ivanovo 103 93 80 111 101 130 82 103 125 87
Kaluga 145 121 102 134 191 197 139 148 166 105
Kostroma 70 74 71 92 83 84 49 68 60 46
Kursk 1 599 1 900 1 732 1 926 3 352 3 054 1 526 2 649 2 844 3 603
Lipetsk 1 498 1 908 1 721 1 794 2 913 2 725 1 215 1 972 1 867 2 541
Moscow Region 285 210 203 191 244 237 172 222 242 181
Orel 1 577 1 664 1 268 1 354 2 282 2 393 1 508 1 677 2 072 2 559
Ryazan 812 874 936 945 1 554 1 570 655 938 1 059 1 255
Smolensk 195 149 88 119 158 166 86 207 217 188
Tambov 1 315 1 581 1 701 1 581 2 870 2 633 926 1 920 1 866 2 993
Tver 170 129 129 139 147 121 62 90 82 86
Tula 862 828 743 863 1 333 1 476 856 891 1 141 1 200
Yaroslavl 91 70 81 92 103 103 51 79 79 61
North-West Federal
District 595 551 453 514 619 664 461 569 620 692
Karelia 1 1 1 1 0 0 0 0 0 0
Komi 1 1 1 1 1 0 0 0 0 0
Arkhangelsk 4 4 4 5 2 3 3 7 4 4
Vologda 182 195 195 224 242 238 154 245 212 166
Kaliningrad 287 246 143 161 227 266 186 156 222 332
Leningrad Region 55 58 72 85 98 106 79 94 100 109
Murmansk 0 0 0 0 0 0 0 0
Novgorod 12 9 10 12 17 16 16 28 29 24
Pskov 53 38 27 25 31 35 23 37 54 58
South Federal District
+ North Caucasus
District 27 526 26 779 26 047 23 791 36 978 28 908 27 254 32 816 24 608 32 068
Adyghe Republic 335 301 304 384 543 472 438 427 323 510
Republic of Dagestan 327 318 254 201 282 207 210 244 157 270
Ingush Republic 68 39 41 32 58 69 44 73 55 95
Kabardian-Balkar
Republic 641 419 435 439 672 582 645 740 817 1 078
Kalmuck Republic 393 344 360 170 437 402 275 357 160 195
14
Karachaevo-Cherkessya
Republic 92 87 91 126 142 162 141 198 194 346
Republic of Horth
Ossetia-Alania 310 251 230 299 520 458 401 495 518 649
Chechen Republic 130 127 129 124 182 172 125 185 92 194
Krasnodar 8 166 8 298 8 239 8 104 11 634 9 486 9 943 11 455 8 839 12 038
Stavropol 6 201 6 705 6 281 7 015 8 413 6 935 6 870 8 186 4 839 6 962
Astrakhan 32 43 39 30 40 48 44 46 32 25
Volgograd 3 737 3 581 3 335 2 774 5 183 3 317 1 499 2 675 2 423 3 088
Rostov-on-Don 7 093 6 265 6 310 4 095 8 871 6 598 6 621 7 736 6 159 6 617
Volga Federal District 19 815 19 194 20 915 22 323 27 151 21 732 6 550 21 242 14 530 17 038
Bashkir Republic 3 236 2 884 3 883 4 069 4 533 2 931 781 3 003 1 672 2 039
Mari El Republic 234 249 210 177 250 280 102 290 184 158
Republic of Mordovia 631 768 945 909 1 168 1 308 292 1 035 797 849
Republic of Tatarstan 3 842 4 129 4 158 4 745 5 743 4 442 661 4 868 2 990 2 612
Udmurt Republic 490 570 568 556 646 655 313 641 482 306
Chuvash Republic 323 397 426 362 523 573 128 555 412 396
Kirov 607 664 571 491 607 706 460 736 555 420
Nizhny Novgorod 853 1 011 1 167 1 043 1 299 1 432 541 1 302 933 919
Orenburg 2 221 1 813 2 022 3 155 3 718 2 446 740 2 918 1 471 2 049
Penza 907 995 1 110 932 1 422 1 461 407 875 750 1 291
Perm 458 466 443 398 436 451 331 444 322 275
Samara 1 408 1 102 1 251 1 402 1 824 1 128 489 1 213 1 107 1 629
Saratov 3 912 3 491 3 436 3 316 3 854 2 775 1 032 2 066 2 203 3 192
Ulianovsk 693 656 724 766 1 129 1 144 273 1 298 651 903
Ural Federal District 3 304 4 893 5 697 5 257 5 152 5 327 3 339 7 302 3 412 4 319
Kurgan 834 1 360 1 509 1 522 1 595 1 673 866 2 401 933 1 344
Sverdlovsk 490 724 720 586 630 676 549 762 521 611
Chelyabinsk 811 1 474 2 115 1 886 1 688 1 453 692 2 219 689 1 031
Tyumen 1 168 1 335 1 353 1 264 1 238 1 525 1 232 1 920 1 269 1 333
Siberian Federal
District 13 144 11 676 12 016 15 005 13 921 18 347 13 355 14 602 8 997 15 325
Altai Republic 16 20 13 22 8 16 10 9 6 10
Republic of Buryatia 106 83 91 82 101 79 72 98 126 113
Republic of Tuva 26 16 12 7 12 13 18 19 14 17
Khakass Republic 86 40 65 80 85 112 129 174 137 131
Altai 3 607 2 953 3 518 4 701 3 857 5 628 4 241 3 920 2 517 4 926
Krasnoyarsk 1 992 1 595 1 485 1 811 2 155 2 378 2 071 2 359 1 787 2 215
Irkutsk 561 644 571 754 758 688 554 573 630 794
Kemerovo 1 111 1 041 1 109 1 455 1 467 1 571 1 180 1 136 491 913
Novosibirsk 2 282 1 803 1 767 2 503 2 567 3 193 2 350 2 503 1 240 2 293
Omsk 2 872 2 871 2 917 3 082 2 290 4 003 2 232 3 379 1 690 3 428
Tomsk 370 319 282 340 409 397 359 318 147 320
Transbaikal Territory 116 292 185 168 212 269 138 114 213 167
Far Eastern Federal
District 269 385 434 560 504 581 297 613 547 428
Yakytia 16 14 13 13 6 8 10 8 6 12
Jewish Autonomous
Region 19 23 29 30 34 26 6 26 21 5
Chukchi Autonomous
District 0 0 0 0 0 0 0 0 0 0
Primorye Territory 116 124 140 133 164 193 145 231 235 229
Khabarovsk Territory 19 9 18 23 27 17 6 10 14 10
Amur Region 98 214 234 362 273 338 130 338 271 172
Kamchatka Region 1 0 0 0 0 0 0 0 0 0
Magadan 0 0 0 0 0 0 0 0 0 0
Sakhalin 0 0 0 0 0 0 0 0 0 0
Sources: Rosstat
Oilseeds
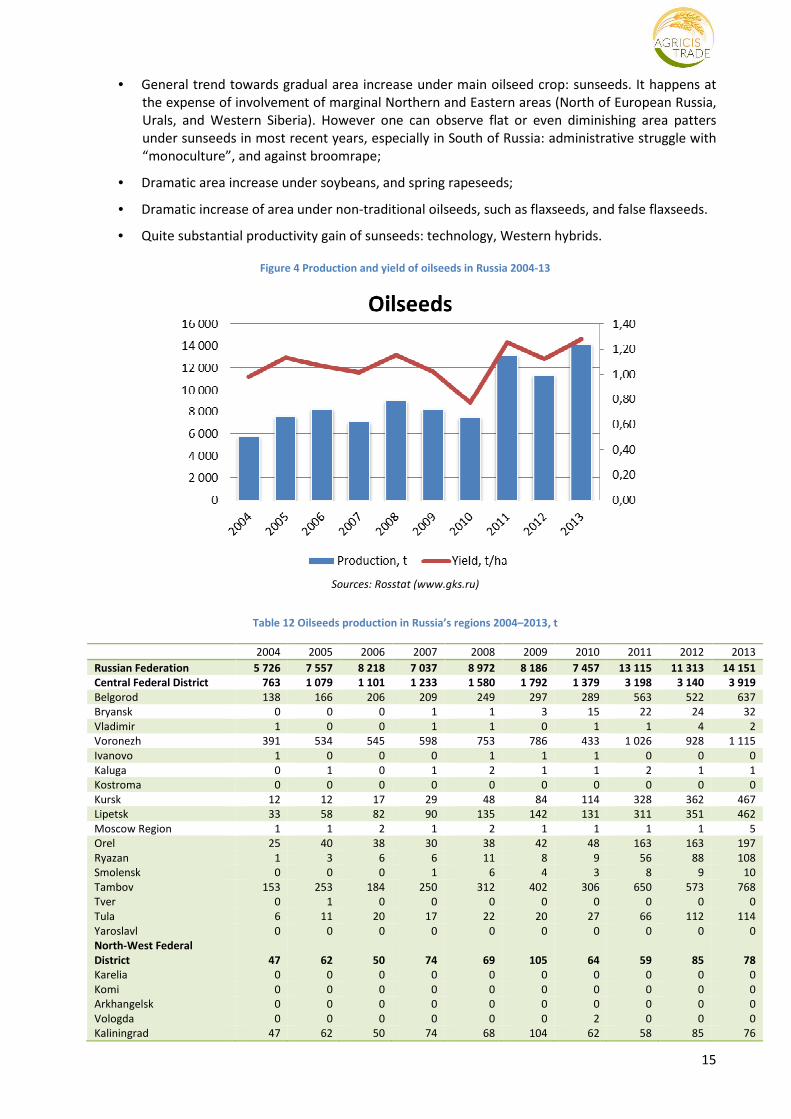
In Russia, the following trends are observed:
• General up-ward trend of areas under oilseeds (at the expense of fodder, grains and other
crops);
15
• General trend towards gradual area increase under main oilseed crop: sunseeds. It happens at
the expense of involvement of marginal Northern and Eastern areas (North of European Russia,
Urals, and Western Siberia). However one can observe flat or even diminishing area patters
under sunseeds in most recent years, especially in South of Russia: administrative struggle with
“monoculture”, and against broomrape;
• Dramatic area increase under soybeans, and spring rapeseeds;
• Dramatic increase of area under non-traditional oilseeds, such as flaxseeds, and false flaxseeds.
• Quite substantial productivity gain of sunseeds: technology, Western hybrids.
Figure 4 Production and yield of oilseeds in Russia 2004-13
Sources: Rosstat (www.gks.ru)
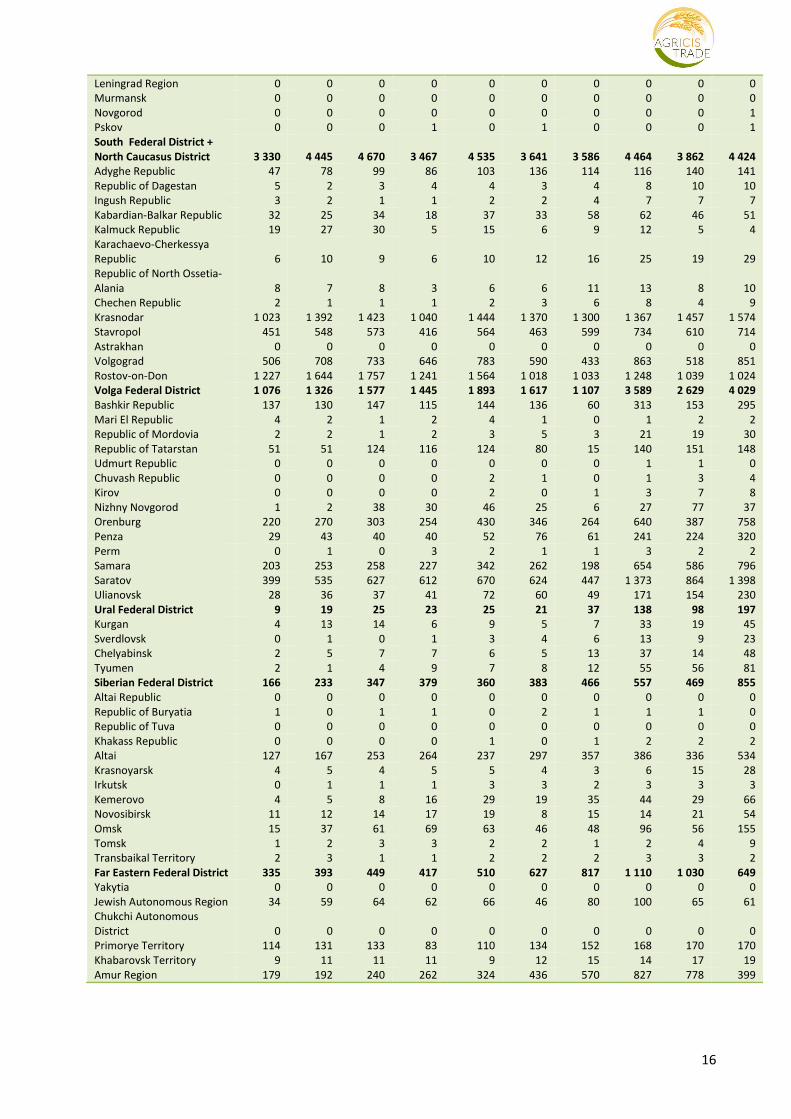
Table 12 Oilseeds production in Russia’s regions 2004–2013, t
2004 2005 2006 2007 2008 2009 2010 2011 2012 2013
Russian Federation 5 726 7 557 8 218 7 037 8 972 8 186 7 457 13 115 11 313 14 151
Central Federal District 763 1 079 1 101 1 233 1 580 1 792 1 379 3 198 3 140 3 919
Belgorod 138 166 206 209 249 297 289 563 522 637
Bryansk 0 0 0 1 1 3 15 22 24 32
Vladimir 1 0 0 1 1 0 1 1 4 2
Voronezh 391 534 545 598 753 786 433 1 026 928 1 115
Ivanovo 1 0 0 0 1 1 1 0 0 0
Kaluga 0 1 0 1 2 1 1 2 1 1
Kostroma 0 0 0 0 0 0 0 0 0 0
Kursk 12 12 17 29 48 84 114 328 362 467
Lipetsk 33 58 82 90 135 142 131 311 351 462
Moscow Region 1 1 2 1 2 1 1 1 1 5
Orel 25 40 38 30 38 42 48 163 163 197
Ryazan 1 3 6 6 11 8 9 56 88 108
Smolensk 0 0 0 1 6 4 3 8 9 10
Tambov 153 253 184 250 312 402 306 650 573 768
Tver 0 1 0 0 0 0 0 0 0 0
Tula 6 11 20 17 22 20 27 66 112 114
Yaroslavl 0 0 0 0 0 0 0 0 0 0
North-West Federal
District 47 62 50 74 69 105 64 59 85 78
Karelia 0 0 0 0 0 0 0 0 0 0
Komi 0 0 0 0 0 0 0 0 0 0
Arkhangelsk 0 0 0 0 0 0 0 0 0 0
Vologda 0 0 0 0 0 0 2 0 0 0
Kaliningrad 47 62 50 74 68 104 62 58 85 76
16
Leningrad Region 0 0 0 0 0 0 0 0 0 0
Murmansk 0 0 0 0 0 0 0 0 0 0
Novgorod 0 0 0 0 0 0 0 0 0 1
Pskov 0 0 0 1 0 1 0 0 0 1
South Federal District +
North Caucasus District 3 330 4 445 4 670 3 467 4 535 3 641 3 586 4 464 3 862 4 424
Adyghe Republic 47 78 99 86 103 136 114 116 140 141
Republic of Dagestan 5 2 3 4 4 3 4 8 10 10
Ingush Republic 3 2 1 1 2 2 4 7 7 7
Kabardian-Balkar Republic 32 25 34 18 37 33 58 62 46 51
Kalmuck Republic 19 27 30 5 15 6 9 12 5 4
Karachaevo-Cherkessya
Republic 6 10 9 6 10 12 16 25 19 29
Republic of North Ossetia-
Alania 8 7 8 3 6 6 11 13 8 10
Chechen Republic 2 1 1 1 2 3 6 8 4 9
Krasnodar 1 023 1 392 1 423 1 040 1 444 1 370 1 300 1 367 1 457 1 574
Stavropol 451 548 573 416 564 463 599 734 610 714
Astrakhan 0 0 0 0 0 0 0 0 0 0
Volgograd 506 708 733 646 783 590 433 863 518 851
Rostov-on-Don 1 227 1 644 1 757 1 241 1 564 1 018 1 033 1 248 1 039 1 024
Volga Federal District 1 076 1 326 1 577 1 445 1 893 1 617 1 107 3 589 2 629 4 029
Bashkir Republic 137 130 147 115 144 136 60 313 153 295
Mari El Republic 4 2 1 2 4 1 0 1 2 2
Republic of Mordovia 2 2 1 2 3 5 3 21 19 30
Republic of Tatarstan 51 51 124 116 124 80 15 140 151 148
Udmurt Republic 0 0 0 0 0 0 0 1 1 0
Chuvash Republic 0 0 0 0 2 1 0 1 3 4
Kirov 0 0 0 0 2 0 1 3 7 8
Nizhny Novgorod 1 2 38 30 46 25 6 27 77 37
Orenburg 220 270 303 254 430 346 264 640 387 758
Penza 29 43 40 40 52 76 61 241 224 320
Perm 0 1 0 3 2 1 1 3 2 2
Samara 203 253 258 227 342 262 198 654 586 796
Saratov 399 535 627 612 670 624 447 1 373 864 1 398
Ulianovsk 28 36 37 41 72 60 49 171 154 230
Ural Federal District 9 19 25 23 25 21 37 138 98 197
Kurgan 4 13 14 6 9 5 7 33 19 45
Sverdlovsk 0 1 0 1 3 4 6 13 9 23
Chelyabinsk 2 5 7 7 6 5 13 37 14 48
Tyumen 2 1 4 9 7 8 12 55 56 81
Siberian Federal District 166 233 347 379 360 383 466 557 469 855
Altai Republic 0 0 0 0 0 0 0 0 0 0
Republic of Buryatia 1 0 1 1 0 2 1 1 1 0
Republic of Tuva 0 0 0 0 0 0 0 0 0 0
Khakass Republic 0 0 0 0 1 0 1 2 2 2
Altai 127 167 253 264 237 297 357 386 336 534
Krasnoyarsk 4 5 4 5 5 4 3 6 15 28
Irkutsk 0 1 1 1 3 3 2 3 3 3
Kemerovo 4 5 8 16 29 19 35 44 29 66
Novosibirsk 11 12 14 17 19 8 15 14 21 54
Omsk 15 37 61 69 63 46 48 96 56 155
Tomsk 1 2 3 3 2 2 1 2 4 9
Transbaikal Territory 2 3 1 1 2 2 2 3 3 2
Far Eastern Federal District 335 393 449 417 510 627 817 1 110 1 030 649
Yakytia 0 0 0 0 0 0 0 0 0 0
Jewish Autonomous Region 34 59 64 62 66 46 80 100 65 61
Chukchi Autonomous
District 0 0 0 0 0 0 0 0 0 0
Primorye Territory 114 131 133 83 110 134 152 168 170 170
Khabarovsk Territory 9 11 11 11 9 12 15 14 17 19
Amur Region 179 192 240 262 324 436 570 827 778 399
17
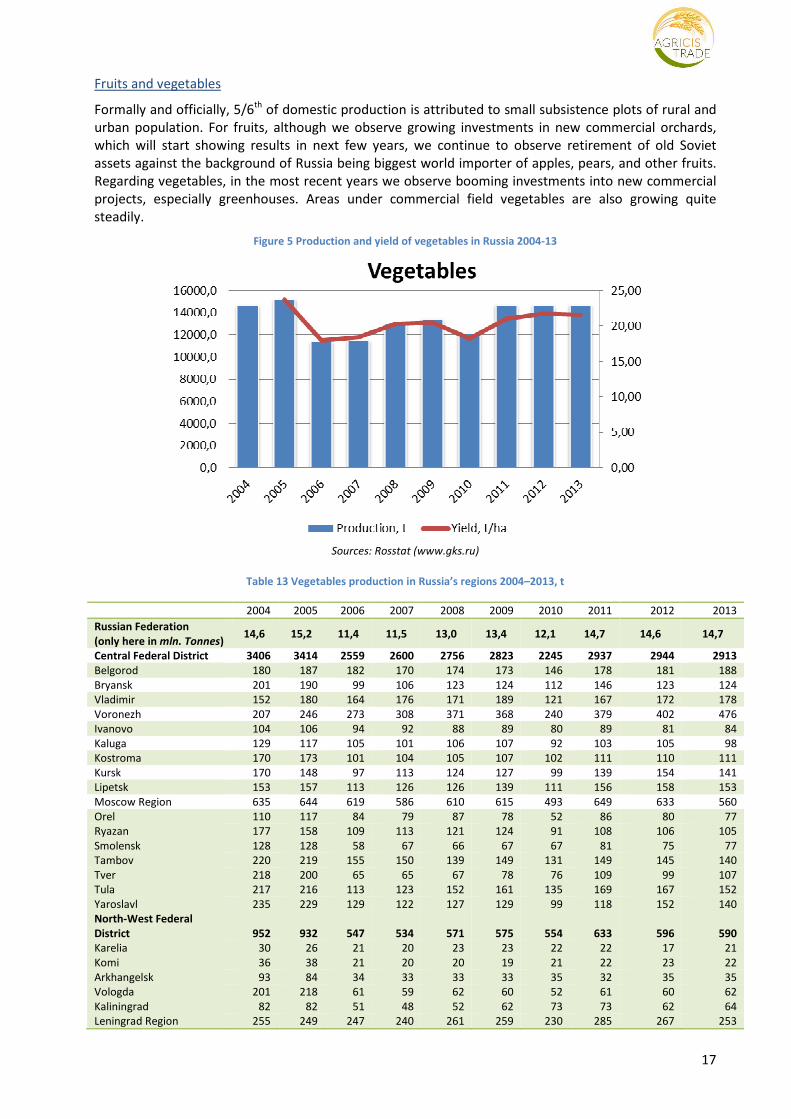
Fruits and vegetables
Formally and officially, 5/6th of domestic production is attributed to small subsistence plots of rural and
urban population. For fruits, although we observe growing investments in new commercial orchards,
which will start showing results in next few years, we continue to observe retirement of old Soviet
assets against the background of Russia being biggest world importer of apples, pears, and other fruits.
Regarding vegetables, in the most recent years we observe booming investments into new commercial
projects, especially greenhouses. Areas under commercial field vegetables are also growing quite
steadily.
Figure 5 Production and yield of vegetables in Russia 2004-13
Sources: Rosstat (www.gks.ru)
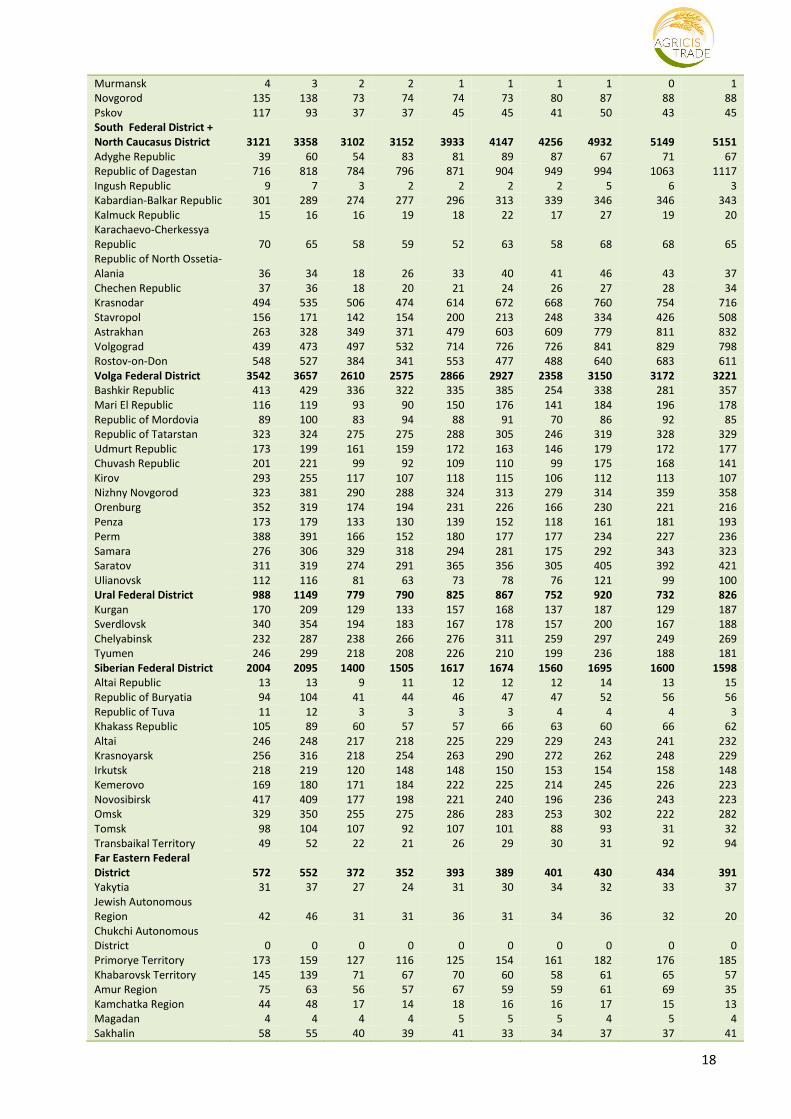
Table 13 Vegetables production in Russia’s regions 2004–2013, t
2004 2005 2006 2007 2008 2009 2010 2011 2012 2013
Russian Federation
(only here in mln. Tonnes) 14,6 15,2 11,4 11,5 13,0 13,4 12,1 14,7 14,6 14,7
Central Federal District 3406 3414 2559 2600 2756 2823 2245 2937 2944 2913
Belgorod 180 187 182 170 174 173 146 178 181 188
Bryansk 201 190 99 106 123 124 112 146 123 124
Vladimir 152 180 164 176 171 189 121 167 172 178
Voronezh 207 246 273 308 371 368 240 379 402 476
Ivanovo 104 106 94 92 88 89 80 89 81 84
Kaluga 129 117 105 101 106 107 92 103 105 98
Kostroma 170 173 101 104 105 107 102 111 110 111
Kursk 170 148 97 113 124 127 99 139 154 141
Lipetsk 153 157 113 126 126 139 111 156 158 153
Moscow Region 635 644 619 586 610 615 493 649 633 560
Orel 110 117 84 79 87 78 52 86 80 77
Ryazan 177 158 109 113 121 124 91 108 106 105
Smolensk 128 128 58 67 66 67 67 81 75 77
Tambov 220 219 155 150 139 149 131 149 145 140
Tver 218 200 65 65 67 78 76 109 99 107
Tula 217 216 113 123 152 161 135 169 167 152
Yaroslavl 235 229 129 122 127 129 99 118 152 140
North-West Federal
District 952 932 547 534 571 575 554 633 596 590
Karelia 30 26 21 20 23 23 22 22 17 21
Komi 36 38 21 20 20 19 21 22 23 22
Arkhangelsk 93 84 34 33 33 33 35 32 35 35
Vologda 201 218 61 59 62 60 52 61 60 62
Kaliningrad 82 82 51 48 52 62 73 73 62 64
Leningrad Region 255 249 247 240 261 259 230 285 267 253
18
Murmansk 4 3 2 2 1 1 1 1 0 1
Novgorod 135 138 73 74 74 73 80 87 88 88
Pskov 117 93 37 37 45 45 41 50 43 45
South Federal District +
North Caucasus District 3121 3358 3102 3152 3933 4147 4256 4932 5149 5151
Adyghe Republic 39 60 54 83 81 89 87 67 71 67
Republic of Dagestan 716 818 784 796 871 904 949 994 1063 1117
Ingush Republic 9 7 3 2 2 2 2 5 6 3
Kabardian-Balkar Republic 301 289 274 277 296 313 339 346 346 343
Kalmuck Republic 15 16 16 19 18 22 17 27 19 20
Karachaevo-Cherkessya
Republic 70 65 58 59 52 63 58 68 68 65
Republic of North Ossetia-
Alania 36 34 18 26 33 40 41 46 43 37
Chechen Republic 37 36 18 20 21 24 26 27 28 34
Krasnodar 494 535 506 474 614 672 668 760 754 716
Stavropol 156 171 142 154 200 213 248 334 426 508
Astrakhan 263 328 349 371 479 603 609 779 811 832
Volgograd 439 473 497 532 714 726 726 841 829 798
Rostov-on-Don 548 527 384 341 553 477 488 640 683 611
Volga Federal District 3542 3657 2610 2575 2866 2927 2358 3150 3172 3221
Bashkir Republic 413 429 336 322 335 385 254 338 281 357
Mari El Republic 116 119 93 90 150 176 141 184 196 178
Republic of Mordovia 89 100 83 94 88 91 70 86 92 85
Republic of Tatarstan 323 324 275 275 288 305 246 319 328 329
Udmurt Republic 173 199 161 159 172 163 146 179 172 177
Chuvash Republic 201 221 99 92 109 110 99 175 168 141
Kirov 293 255 117 107 118 115 106 112 113 107
Nizhny Novgorod 323 381 290 288 324 313 279 314 359 358
Orenburg 352 319 174 194 231 226 166 230 221 216
Penza 173 179 133 130 139 152 118 161 181 193
Perm 388 391 166 152 180 177 177 234 227 236
Samara 276 306 329 318 294 281 175 292 343 323
Saratov 311 319 274 291 365 356 305 405 392 421
Ulianovsk 112 116 81 63 73 78 76 121 99 100
Ural Federal District 988 1149 779 790 825 867 752 920 732 826
Kurgan 170 209 129 133 157 168 137 187 129 187
Sverdlovsk 340 354 194 183 167 178 157 200 167 188
Chelyabinsk 232 287 238 266 276 311 259 297 249 269
Tyumen 246 299 218 208 226 210 199 236 188 181
Siberian Federal District 2004 2095 1400 1505 1617 1674 1560 1695 1600 1598
Altai Republic 13 13 9 11 12 12 12 14 13 15
Republic of Buryatia 94 104 41 44 46 47 47 52 56 56
Republic of Tuva 11 12 3 3 3 3 4 4 4 3
Khakass Republic 105 89 60 57 57 66 63 60 66 62
Altai 246 248 217 218 225 229 229 243 241 232
Krasnoyarsk 256 316 218 254 263 290 272 262 248 229
Irkutsk 218 219 120 148 148 150 153 154 158 148
Kemerovo 169 180 171 184 222 225 214 245 226 223
Novosibirsk 417 409 177 198 221 240 196 236 243 223
Omsk 329 350 255 275 286 283 253 302 222 282
Tomsk 98 104 107 92 107 101 88 93 31 32
Transbaikal Territory 49 52 22 21 26 29 30 31 92 94
Far Eastern Federal
District 572 552 372 352 393 389 401 430 434 391
Yakytia 31 37 27 24 31 30 34 32 33 37
Jewish Autonomous
Region 42 46 31 31 36 31 34 36 32 20
Chukchi Autonomous
District 0 0 0 0 0 0 0 0 0 0
Primorye Territory 173 159 127 116 125 154 161 182 176 185
Khabarovsk Territory 145 139 71 67 70 60 58 61 65 57
Amur Region 75 63 56 57 67 59 59 61 69 35
Kamchatka Region 44 48 17 14 18 16 16 17 15 13
Magadan 4 4 4 4 5 5 5 4 5 4
Sakhalin 58 55 40 39 41 33 34 37 37 41
19
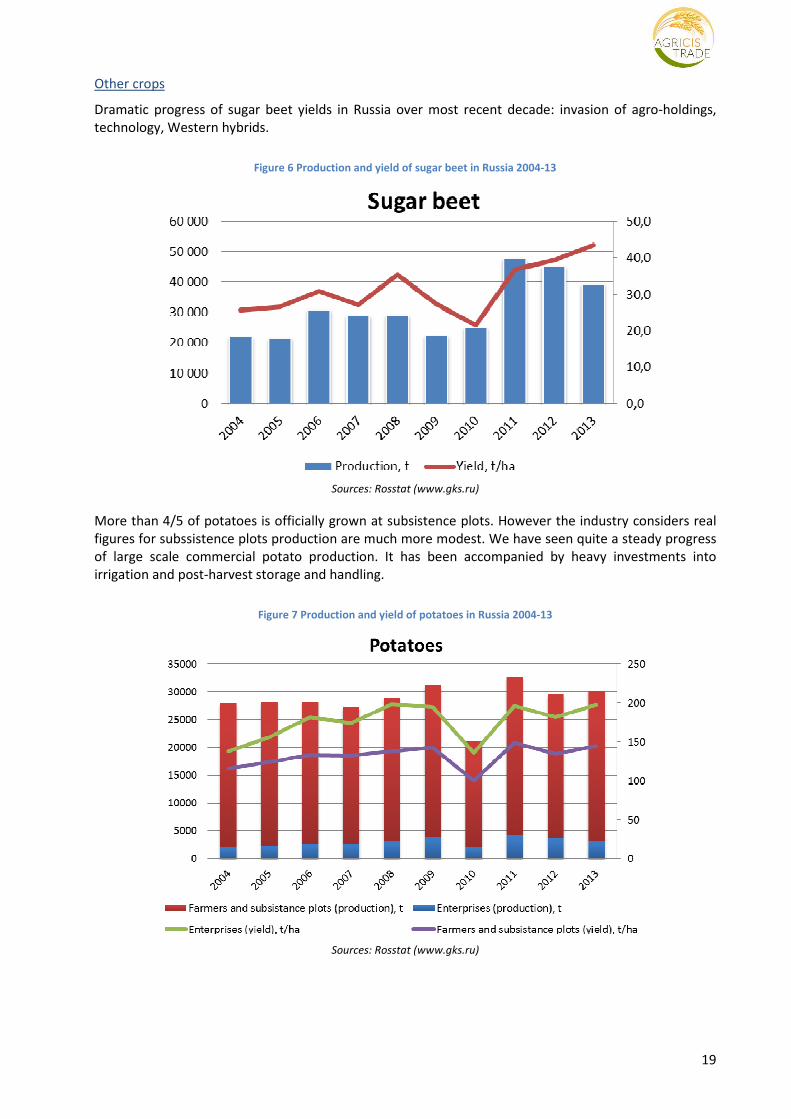
Other crops
Dramatic progress of sugar beet yields in Russia over most recent decade: invasion of agro-holdings,
technology, Western hybrids.
Figure 6 Production and yield of sugar beet in Russia 2004-13
Sources: Rosstat (www.gks.ru)
More than 4/5 of potatoes is officially grown at subsistence plots. However the industry considers real
figures for subssistence plots production are much more modest. We have seen quite a steady progress
of large scale commercial potato production. It has been accompanied by heavy investments into
irrigation and post-harvest storage and handling.
Figure 7 Production and yield of potatoes in Russia 2004-13
Sources: Rosstat (www.gks.ru)
20
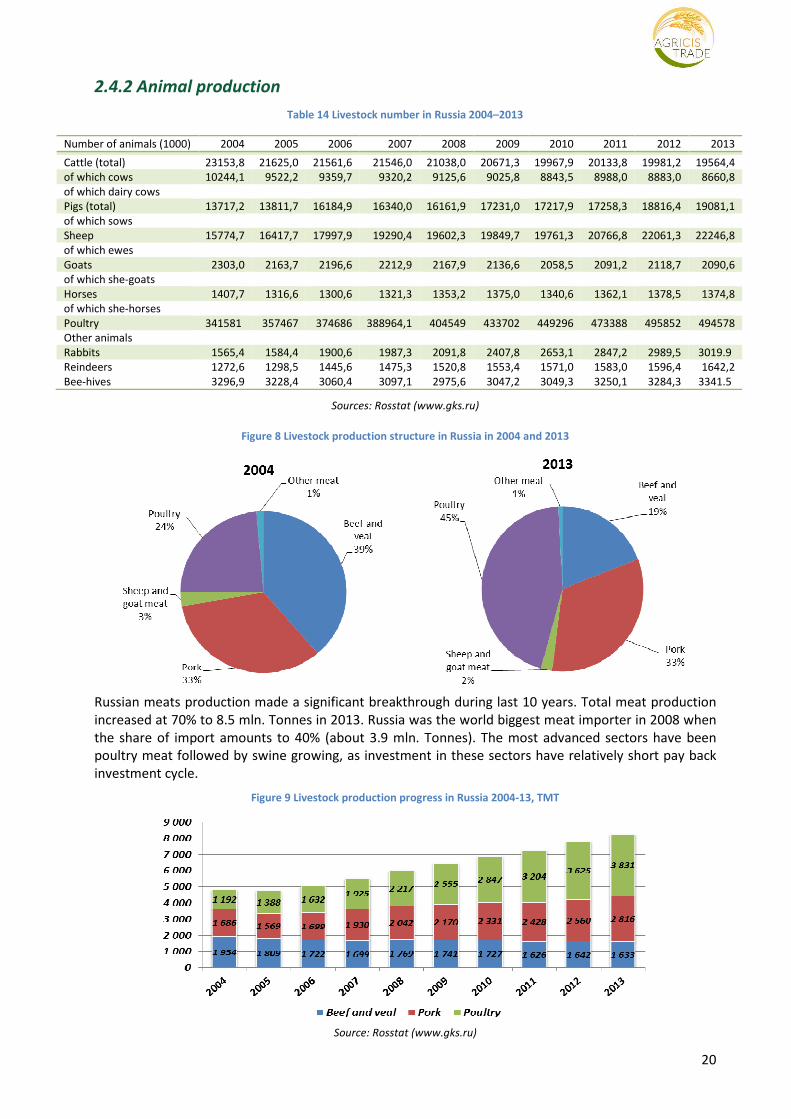
2.4.2 Animal production
Table 14 Livestock number in Russia 2004–2013
Number of animals (1000) 2004 2005 2006 2007 2008 2009 2010 2011 2012 2013
Cattle (total) 23153,8 21625,0 21561,6 21546,0 21038,0 20671,3 19967,9 20133,8 19981,2 19564,4
of which cows 10244,1 9522,2 9359,7 9320,2 9125,6 9025,8 8843,5 8988,0 8883,0 8660,8
of which dairy cows
Pigs (total) 13717,2 13811,7 16184,9 16340,0 16161,9 17231,0 17217,9 17258,3 18816,4 19081,1
of which sows
Sheep 15774,7 16417,7 17997,9 19290,4 19602,3 19849,7 19761,3 20766,8 22061,3 22246,8
of which ewes
Goats 2303,0 2163,7 2196,6 2212,9 2167,9 2136,6 2058,5 2091,2 2118,7 2090,6
of which she-goats
Horses 1407,7 1316,6 1300,6 1321,3 1353,2 1375,0 1340,6 1362,1 1378,5 1374,8
of which she-horses
Poultry 341581 357467 374686 388964,1 404549 433702 449296 473388 495852 494578
Other animals
Rabbits 1565,4 1584,4 1900,6 1987,3 2091,8 2407,8 2653,1 2847,2 2989,5 3019.9
Reindeers 1272,6 1298,5 1445,6 1475,3 1520,8 1553,4 1571,0 1583,0 1596,4 1642,2
Bee-hives 3296,9 3228,4 3060,4 3097,1 2975,6 3047,2 3049,3 3250,1 3284,3 3341.5
Sources: Rosstat (www.gks.ru)
Figure 8 Livestock production structure in Russia in 2004 and 2013
Russian meats production made a significant breakthrough during last 10 years. Total meat production
increased at 70% to 8.5 mln. Tonnes in 2013. Russia was the world biggest meat importer in 2008 when
the share of import amounts to 40% (about 3.9 mln. Tonnes). The most advanced sectors have been
poultry meat followed by swine growing, as investment in these sectors have relatively short pay back
investment cycle.
Figure 9 Livestock production progress in Russia 2004-13, TMT
Source: Rosstat (www.gks.ru)
21
Pork
Table 15 Pork production in Russia’s regions 2004–2013, 1000 t
2004 2005 2006 2007 2008 2009 2010 2011 2012 2013
PORK
RUSSIA 2197 2024 2197 2507 2692 2899 3086 3198 3286 3611
CENTRAL FD 427 400 443 546 646 803 941 1034 1226 1586
NORTHWESTERN FD 75 67 68 76 86 95 110 127 144 174
SOUTHERN FD 450 426 465 536 483 479 455 429 349 212
NORTH CAUCASIAN FD Included to Southern FD till 2008 year 79 80 73 74 70 83
VOLGA FD 608 582 632 687 685 717 736 728 690 691
URAL FD 148 133 141 158 165 172 199 213 212 240
SIBERIAN FD 449 379 411 466 505 508 528 550 546 574
FAR EASTERN FD 40 38 37 38 43 45 43 46 49 52
Sources: Rosstat (www.gks.ru)
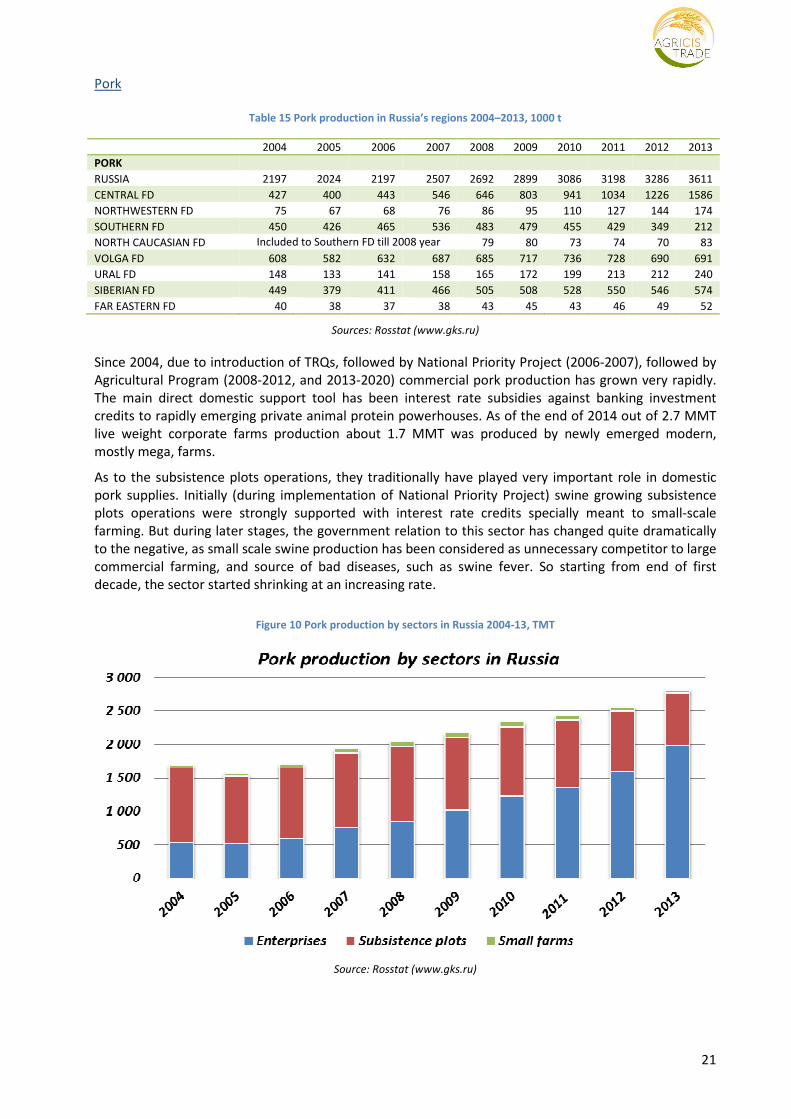
Since 2004, due to introduction of TRQs, followed by National Priority Project (2006-2007), followed by
Agricultural Program (2008-2012, and 2013-2020) commercial pork production has grown very rapidly.
The main direct domestic support tool has been interest rate subsidies against banking investment
credits to rapidly emerging private animal protein powerhouses. As of the end of 2014 out of 2.7 MMT
live weight corporate farms production about 1.7 MMT was produced by newly emerged modern,
mostly mega, farms.
As to the subsistence plots operations, they traditionally have played very important role in domestic
pork supplies. Initially (during implementation of National Priority Project) swine growing subsistence
plots operations were strongly supported with interest rate credits specially meant to small-scale
farming. But during later stages, the government relation to this sector has changed quite dramatically
to the negative, as small scale swine production has been considered as unnecessary competitor to large
commercial farming, and source of bad diseases, such as swine fever. So starting from end of first
decade, the sector started shrinking at an increasing rate.
Figure 10 Pork production by sectors in Russia 2004-13, TMT
Source: Rosstat (www.gks.ru)
22
Poultry
Table 16 Poultry meat production in Russia’s regions 2004–2013, 1000 t
2004 2005 2006 2007 2008 2009 2010 2011 2012 2013
POULTRY
RUSSIA 1709 1961 2257 2638 3022 3475 3867 4325 4864 5141
CENTRAL FD 477 620 764 938 1106 1275 1397 1547 1748 1871
NORTHWESTERN FD 194 195 214 211 257 306 368 443 481 465
SOUTHERN FD 293 336 370 435 316 360 428 506 532 504
NORTH CAUCASIAN FD Included to Southern FD till 2008 year 168 192 222 261 310 347
VOLGA FD 356 383 430 490 530 597 634 689 825 930
URAL FD 168 184 209 255 294 319 343 372 425 477
SIBERIAN FD 192 207 231 263 297 365 401 430 467 473
FAR EASTERN FD 29 36 39 44 54 62 74 78 77 75
Sources: Rosstat (www.gks.ru)
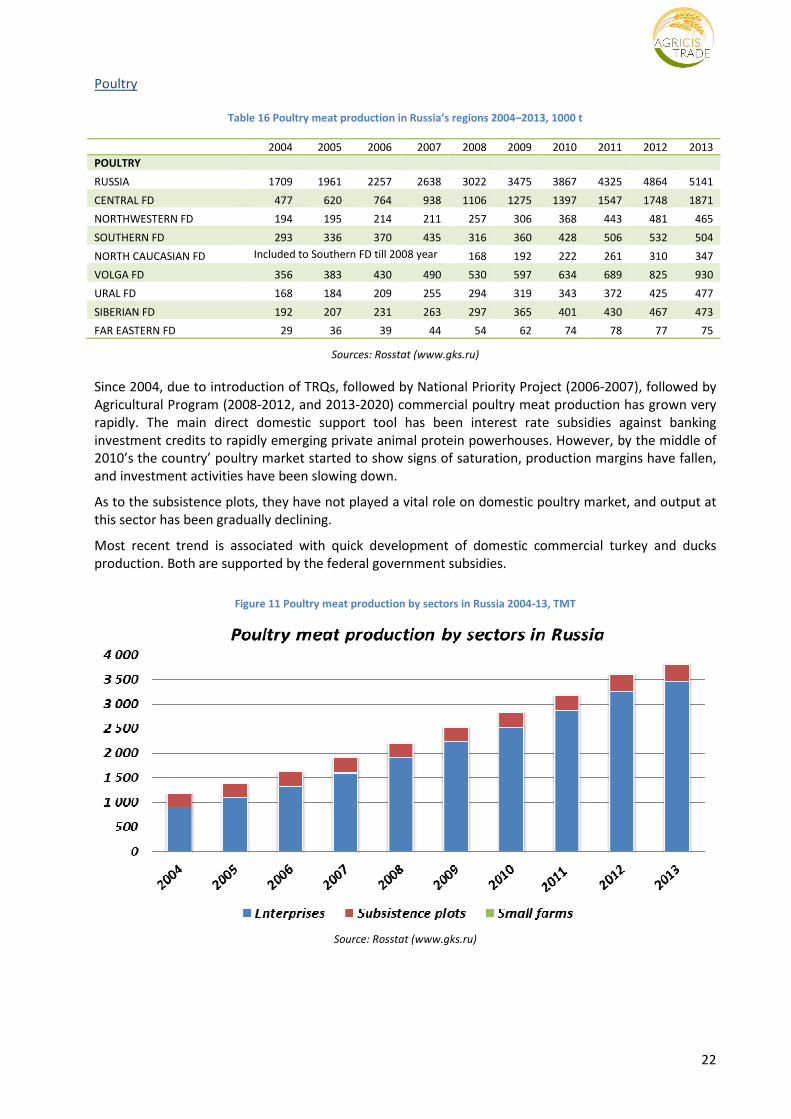
Since 2004, due to introduction of TRQs, followed by National Priority Project (2006-2007), followed by
Agricultural Program (2008-2012, and 2013-2020) commercial poultry meat production has grown very
rapidly. The main direct domestic support tool has been interest rate subsidies against banking
investment credits to rapidly emerging private animal protein powerhouses. However, by the middle of
2010’s the country’ poultry market started to show signs of saturation, production margins have fallen,
and investment activities have been slowing down.
As to the subsistence plots, they have not played a vital role on domestic poultry market, and output at
this sector has been gradually declining.
Most recent trend is associated with quick development of domestic commercial turkey and ducks
production. Both are supported by the federal government subsidies.
Figure 11 Poultry meat production by sectors in Russia 2004-13, TMT
Source: Rosstat (www.gks.ru)
23
Beef and Veal
Table 17 Beef production in Russia’s regions 2004–2013, 1000 t
2004 2005 2006 2007 2008 2009 2010 2011 2012 2013
BEEF AND VEAL
RUSSIA 3386 3148 3025 3003 3115 3070 3053 2888 2913 2910
CENTRAL FD 669 602 560 539 546 508 495 457 451 461
NORTHWESTERN FD 145 125 117 114 113 105 101 96 97 95
SOUTHERN FD 557 528 545 564 319 336 341 343 363 371
NORTH CAUCASIAN FD Included to Southern FD till 2008 year 274 280 275 276 269 270
VOLGA FD 1077 1024 1008 1006 1039 1030 1045 944 927 926
URAL FD 238 210 183 185 187 184 178 170 171 171
SIBERIAN FD 627 592 545 532 574 565 558 547 577 556
FAR EASTERN FD 73 67 68 64 64 62 60 57 57 59
Sources: Rosstat (www.gks.ru)
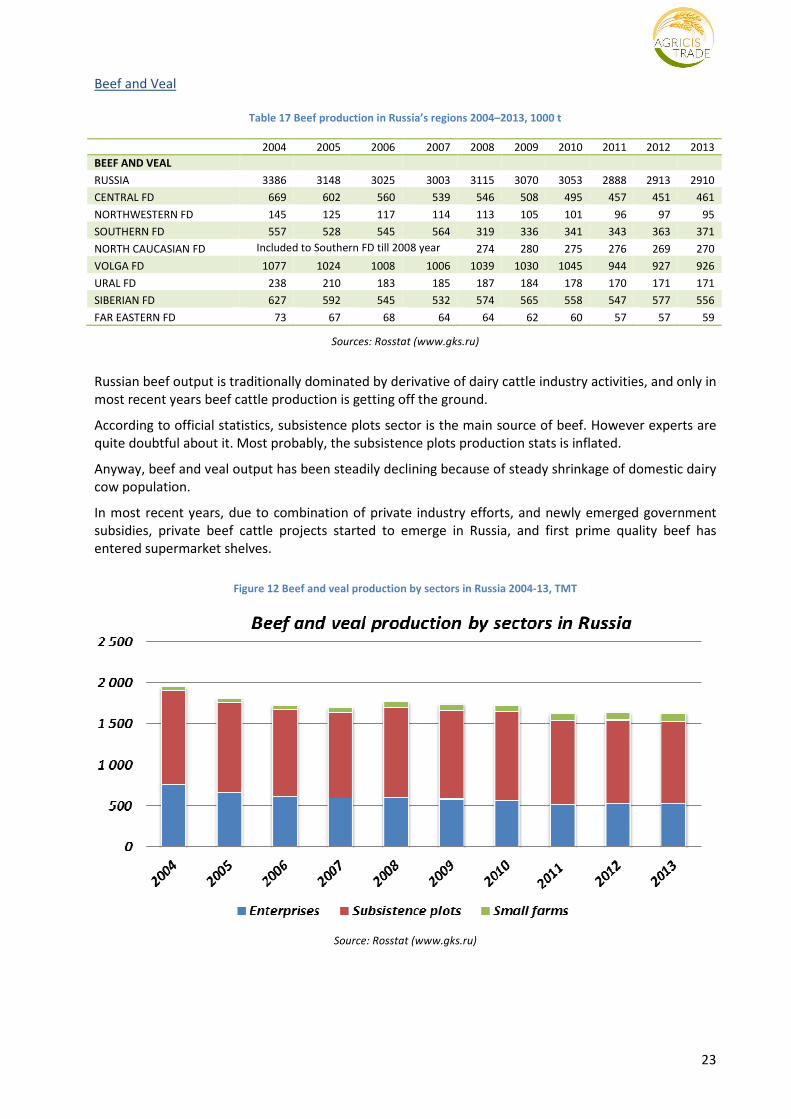
Russian beef output is traditionally dominated by derivative of dairy cattle industry activities, and only in
most recent years beef cattle production is getting off the ground.
According to official statistics, subsistence plots sector is the main source of beef. However experts are
quite doubtful about it. Most probably, the subsistence plots production stats is inflated.
Anyway, beef and veal output has been steadily declining because of steady shrinkage of domestic dairy
cow population.
In most recent years, due to combination of private industry efforts, and newly emerged government
subsidies, private beef cattle projects started to emerge in Russia, and first prime quality beef has
entered supermarket shelves.
Figure 12 Beef and veal production by sectors in Russia 2004-13, TMT
Source: Rosstat (www.gks.ru)
24
Milk production
Table 18 Raw milk production in Russia’s regions 2004–2013, 1000 t
2004 2005 2006 2007 2008 2009 2010 2011 2012 2013
MILK 31935 30907 31441 32181 32363 32570 31847 31646 31756 30529
RUSSIA 6867 6442 6356 6256 6172 6004 5753 5708 5784 5494
CENTRAL FD 2016 1932 1905 1851 1808 1791 1747 1746 1776 1685
NORTHWESTERN FD 4593 4523 4917 5260 3258 3304 3264 3281 3374 3305
SOUTHERN FD 31935 30907 31441 32181 32363 32570 31847 31646 31756 30529
NORTH CAUCASIAN FD Included to Southern FD till 2008 year 2184 2271 2358 2494 2640 2676
VOLGA FD 10219 10009 10226 10610 10631 10843 10409 10023 9950 9481
URAL FD 2120 1963 2028 2067 2055 2105 2096 2087 2078 2024
SIBERIAN FD 5511 5454 5435 5553 5671 5656 5629 5726 5583 5299
FAR EASTERN FD 609 584 575 583 584 596 591 583 572 565
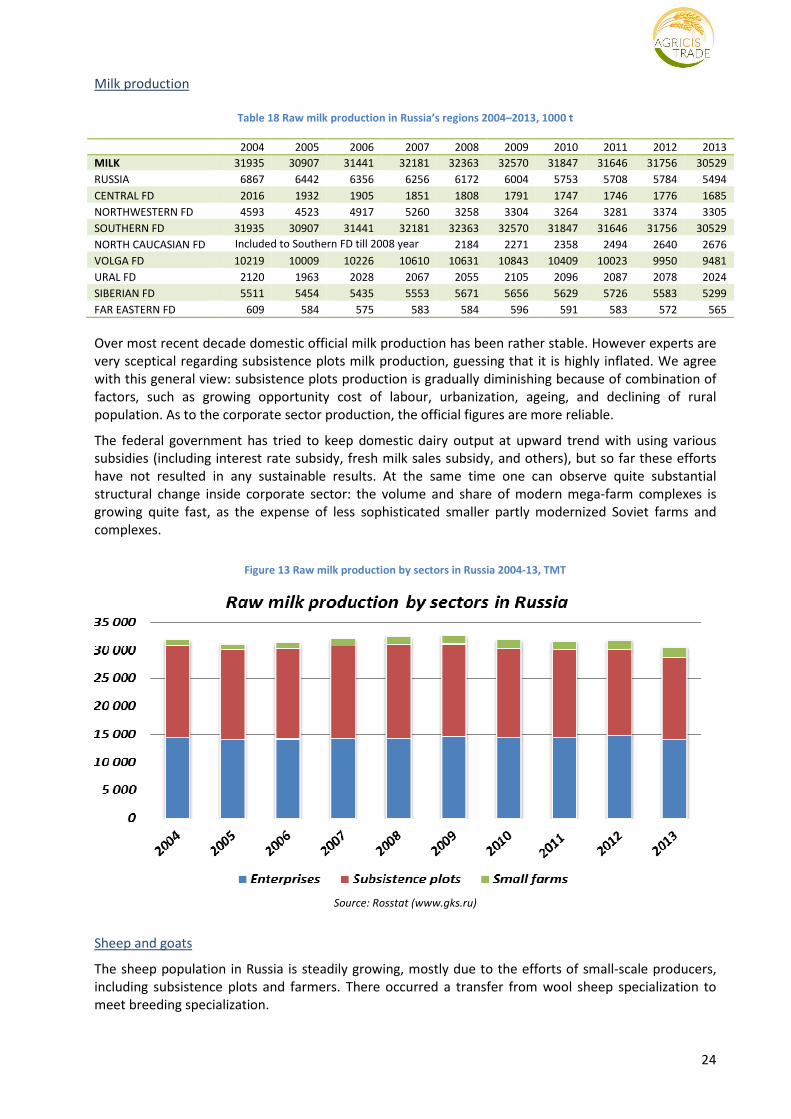
Over most recent decade domestic official milk production has been rather stable. However experts are
very sceptical regarding subsistence plots milk production, guessing that it is highly inflated. We agree
with this general view: subsistence plots production is gradually diminishing because of combination of
factors, such as growing opportunity cost of labour, urbanization, ageing, and declining of rural
population. As to the corporate sector production, the official figures are more reliable.
The federal government has tried to keep domestic dairy output at upward trend with using various
subsidies (including interest rate subsidy, fresh milk sales subsidy, and others), but so far these efforts
have not resulted in any sustainable results. At the same time one can observe quite substantial
structural change inside corporate sector: the volume and share of modern mega-farm complexes is
growing quite fast, as the expense of less sophisticated smaller partly modernized Soviet farms and
complexes.
Figure 13 Raw milk production by sectors in Russia 2004-13, TMT
Source: Rosstat (www.gks.ru)
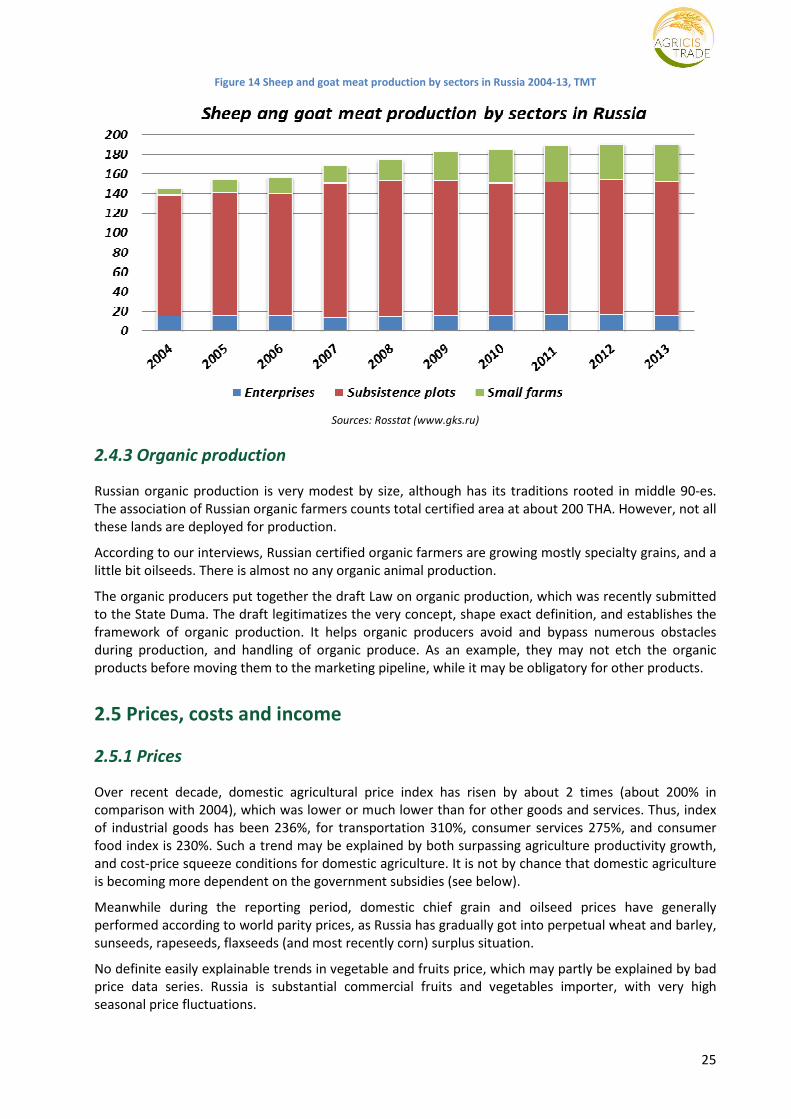
Sheep and goats
The sheep population in Russia is steadily growing, mostly due to the efforts of small-scale producers,
including subsistence plots and farmers. There occurred a transfer from wool sheep specialization to
meet breeding specialization.
25
Figure 14 Sheep and goat meat production by sectors in Russia 2004-13, TMT
Sources: Rosstat (www.gks.ru)
2.4.3 Organic production
Russian organic production is very modest by size, although has its traditions rooted in middle 90-es.
The association of Russian organic farmers counts total certified area at about 200 THA. However, not all
these lands are deployed for production.
According to our interviews, Russian certified organic farmers are growing mostly specialty grains, and a
little bit oilseeds. There is almost no any organic animal production.
The organic producers put together the draft Law on organic production, which was recently submitted
to the State Duma. The draft legitimatizes the very concept, shape exact definition, and establishes the
framework of organic production. It helps organic producers avoid and bypass numerous obstacles
during production, and handling of organic produce. As an example, they may not etch the organic
products before moving them to the marketing pipeline, while it may be obligatory for other products.
2.5 Prices, costs and income
2.5.1 Prices
Over recent decade, domestic agricultural price index has risen by about 2 times (about 200% in
comparison with 2004), which was lower or much lower than for other goods and services. Thus, index
of industrial goods has been 236%, for transportation 310%, consumer services 275%, and consumer
food index is 230%. Such a trend may be explained by both surpassing agriculture productivity growth,
and cost-price squeeze conditions for domestic agriculture. It is not by chance that domestic agriculture
is becoming more dependent on the government subsidies (see below).
Meanwhile during the reporting period, domestic chief grain and oilseed prices have generally
performed according to world parity prices, as Russia has gradually got into perpetual wheat and barley,
sunseeds, rapeseeds, flaxseeds (and most recently corn) surplus situation.
No definite easily explainable trends in vegetable and fruits price, which may partly be explained by bad
price data series. Russia is substantial commercial fruits and vegetables importer, with very high
seasonal price fluctuations.
26
As to livestock products, one should distinguish three key trends: relatively modest poultry (chicken)
meat price index growth, neutral price index increase for pigs and poultry eggs, and surpassing price rise
for products associated with livestock and sheep and goat sectors. Such trends are related with sectoral
investment activities, which were highest in poultry meat sector, ongoing in swine industry, while cattle
sector has remained relatively unadjusted, and only recently it has received an attention of investors
(mainly in beef cattle).
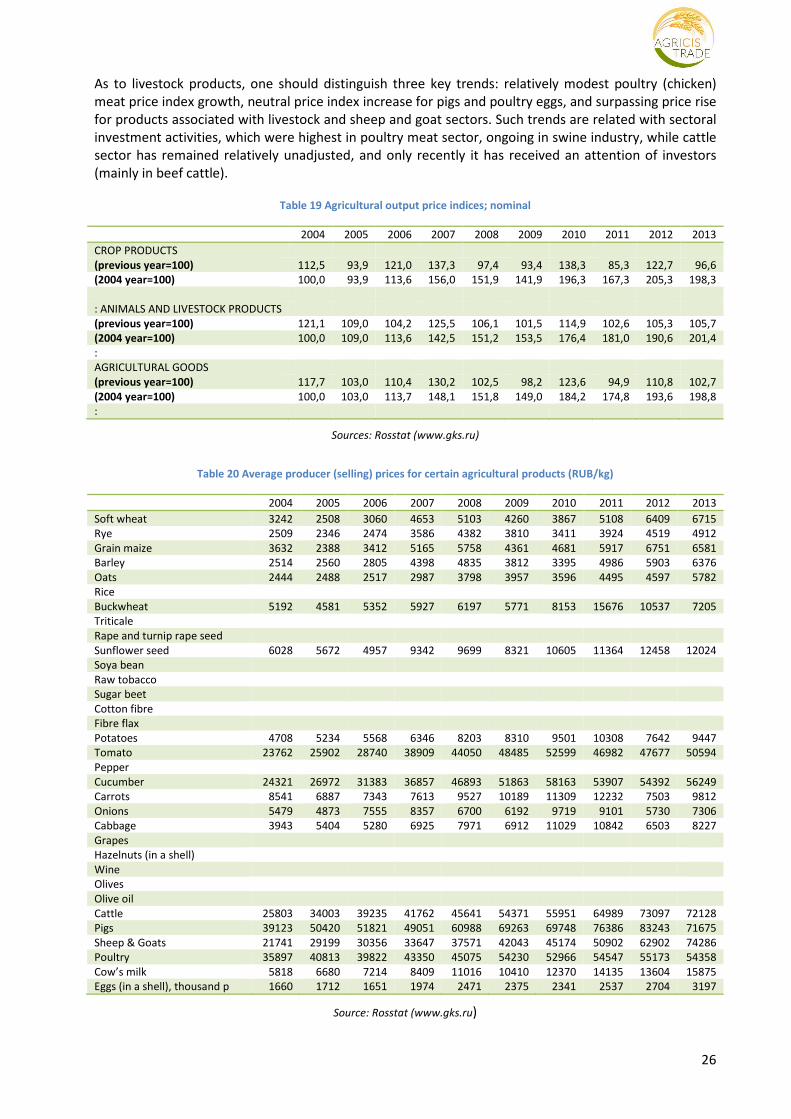
Table 19 Agricultural output price indices; nominal
2004 2005 2006 2007 2008 2009 2010 2011 2012 2013
CROP PRODUCTS
(previous year=100) 112,5 93,9 121,0 137,3 97,4 93,4 138,3 85,3 122,7 96,6
(2004 year=100) 100,0 93,9 113,6 156,0 151,9 141,9 196,3 167,3 205,3 198,3
: ANIMALS AND LIVESTOCK PRODUCTS
(previous year=100) 121,1 109,0 104,2 125,5 106,1 101,5 114,9 102,6 105,3 105,7
(2004 year=100) 100,0 109,0 113,6 142,5 151,2 153,5 176,4 181,0 190,6 201,4
:
AGRICULTURAL GOODS
(previous year=100) 117,7 103,0 110,4 130,2 102,5 98,2 123,6 94,9 110,8 102,7
(2004 year=100) 100,0 103,0 113,7 148,1 151,8 149,0 184,2 174,8 193,6 198,8
:
Sources: Rosstat (www.gks.ru)
Table 20 Average producer (selling) prices for certain agricultural products (RUB/kg)
2004 2005 2006 2007 2008 2009 2010 2011 2012 2013
Soft wheat 3242 2508 3060 4653 5103 4260 3867 5108 6409 6715
Rye 2509 2346 2474 3586 4382 3810 3411 3924 4519 4912
Grain maize 3632 2388 3412 5165 5758 4361 4681 5917 6751 6581
Barley 2514 2560 2805 4398 4835 3812 3395 4986 5903 6376
Oats 2444 2488 2517 2987 3798 3957 3596 4495 4597 5782
Rice
Buckwheat 5192 4581 5352 5927 6197 5771 8153 15676 10537 7205
Triticale
Rape and turnip rape seed
Sunflower seed 6028 5672 4957 9342 9699 8321 10605 11364 12458 12024
Soya bean
Raw tobacco
Sugar beet
Cotton fibre
Fibre flax
Potatoes 4708 5234 5568 6346 8203 8310 9501 10308 7642 9447
Tomato 23762 25902 28740 38909 44050 48485 52599 46982 47677 50594
Pepper
Cucumber 24321 26972 31383 36857 46893 51863 58163 53907 54392 56249
Carrots 8541 6887 7343 7613 9527 10189 11309 12232 7503 9812
Onions 5479 4873 7555 8357 6700 6192 9719 9101 5730 7306
Cabbage 3943 5404 5280 6925 7971 6912 11029 10842 6503 8227
Grapes
Hazelnuts (in a shell)
Wine
Olives
Olive oil
Cattle 25803 34003 39235 41762 45641 54371 55951 64989 73097 72128
Pigs 39123 50420 51821 49051 60988 69263 69748 76386 83243 71675
Sheep & Goats 21741 29199 30356 33647 37571 42043 45174 50902 62902 74286
Poultry 35897 40813 39822 43350 45075 54230 52966 54547 55173 54358
Cow’s milk 5818 6680 7214 8409 11016 10410 12370 14135 13604 15875
Eggs (in a shell), thousand p 1660 1712 1651 1974 2471 2375 2341 2537 2704 3197
Source: Rosstat (www.gks.ru)
27
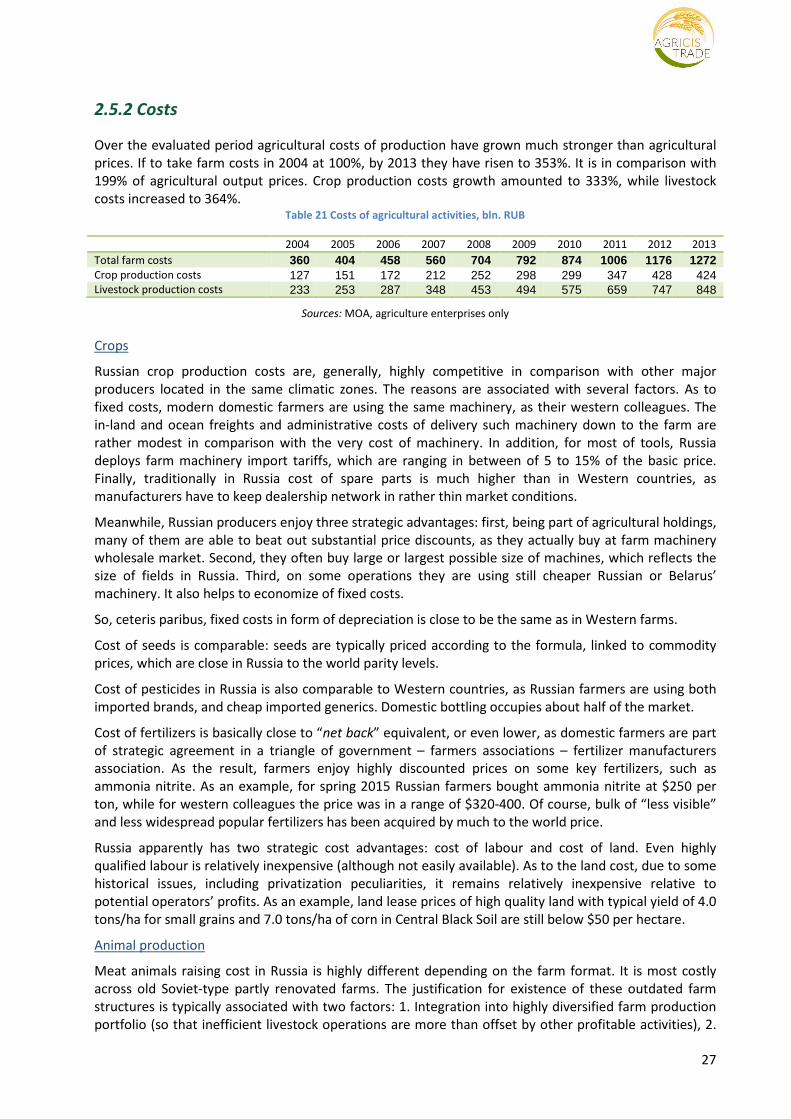
2.5.2 Costs
Over the evaluated period agricultural costs of production have grown much stronger than agricultural
prices. If to take farm costs in 2004 at 100%, by 2013 they have risen to 353%. It is in comparison with
199% of agricultural output prices. Crop production costs growth amounted to 333%, while livestock
costs increased to 364%. Table 21 Сosts of agricultural activities, bln. RUB
2004 2005 2006 2007 2008 2009 2010 2011 2012 2013
Total farm costs 360 404 458 560 704 792 874 1006 1176 1272 Crop production costs 127 151 172 212 252 298 299 347 428 424 Livestock production costs 233 253 287 348 453 494 575 659 747 848
Sources: MOA, agriculture enterprises only
Crops
Russian crop production costs are, generally, highly competitive in comparison with other major
producers located in the same climatic zones. The reasons are associated with several factors. As to
fixed costs, modern domestic farmers are using the same machinery, as their western colleagues. The
in-land and ocean freights and administrative costs of delivery such machinery down to the farm are
rather modest in comparison with the very cost of machinery. In addition, for most of tools, Russia
deploys farm machinery import tariffs, which are ranging in between of 5 to 15% of the basic price.
Finally, traditionally in Russia cost of spare parts is much higher than in Western countries, as
manufacturers have to keep dealership network in rather thin market conditions.
Meanwhile, Russian producers enjoy three strategic advantages: first, being part of agricultural holdings,
many of them are able to beat out substantial price discounts, as they actually buy at farm machinery
wholesale market. Second, they often buy large or largest possible size of machines, which reflects the
size of fields in Russia. Third, on some operations they are using still cheaper Russian or Belarus’
machinery. It also helps to economize of fixed costs.
So, ceteris paribus, fixed costs in form of depreciation is close to be the same as in Western farms.
Cost of seeds is comparable: seeds are typically priced according to the formula, linked to commodity
prices, which are close in Russia to the world parity levels.
Cost of pesticides in Russia is also comparable to Western countries, as Russian farmers are using both
imported brands, and cheap imported generics. Domestic bottling occupies about half of the market.
Cost of fertilizers is basically close to “net back” equivalent, or even lower, as domestic farmers are part
of strategic agreement in a triangle of government – farmers associations – fertilizer manufacturers
association. As the result, farmers enjoy highly discounted prices on some key fertilizers, such as
ammonia nitrite. As an example, for spring 2015 Russian farmers bought ammonia nitrite at $250 per
ton, while for western colleagues the price was in a range of $320-400. Of course, bulk of “less visible”
and less widespread popular fertilizers has been acquired by much to the world price.
Russia apparently has two strategic cost advantages: cost of labour and cost of land. Even highly
qualified labour is relatively inexpensive (although not easily available). As to the land cost, due to some
historical issues, including privatization peculiarities, it remains relatively inexpensive relative to
potential operators’ profits. As an example, land lease prices of high quality land with typical yield of 4.0
tons/ha for small grains and 7.0 tons/ha of corn in Central Black Soil are still below $50 per hectare.
Animal production
Meat animals raising cost in Russia is highly different depending on the farm format. It is most costly
across old Soviet-type partly renovated farms. The justification for existence of these outdated farm
structures is typically associated with two factors: 1. Integration into highly diversified farm production
portfolio (so that inefficient livestock operations are more than offset by other profitable activities), 2.
28
Geographically remote location and dominant positioning on the local market, so that technical
inefficiency is type of offset by high entry barriers.
As to the modern advanced meat raising farms, their cost of production is close to the international
benchmarks: key productivity indicators are close to modern world ones, while all key equipment and
genetics have been originated in Western countries.
Again, like in case of crop production costs, some important drawbacks are type of offset by important
advantages. Russian animal farm production has important disadvantages in comparison with key
competitors regarding cost of finance, costs of getting permissions, and costs of construction works.
Contrary, domestic animal farmsteads have strategic advantages in terms of size of operations (typically,
these are mega-multi farming units) and scope of vertical integration back to full-size crop production
and up to further processing and even retail.
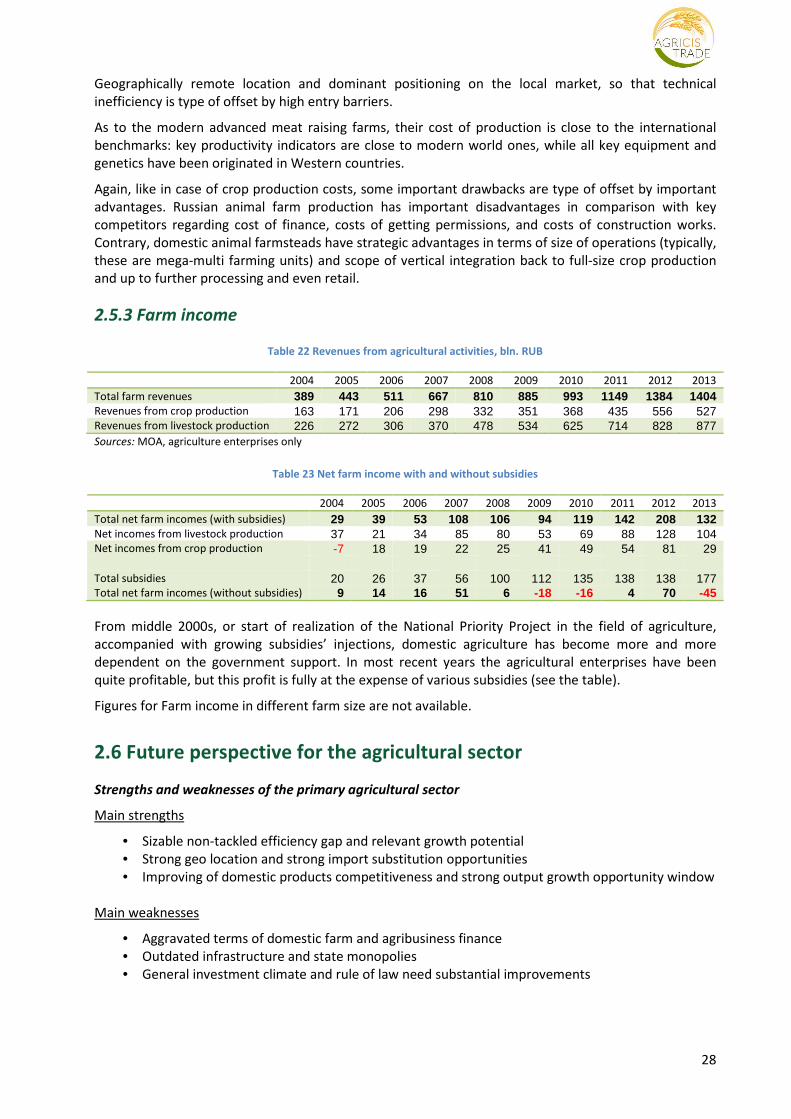
2.5.3 Farm income
Table 22 Revenues from agricultural activities, bln. RUB
2004 2005 2006 2007 2008 2009 2010 2011 2012 2013
Total farm revenues 389 443 511 667 810 885 993 1149 1384 1404 Revenues from crop production 163 171 206 298 332 351 368 435 556 527 Revenues from livestock production 226 272 306 370 478 534 625 714 828 877 Sources: MOA, agriculture enterprises only
Table 23 Net farm income with and without subsidies
2004 2005 2006 2007 2008 2009 2010 2011 2012 2013
Total net farm incomes (with subsidies) 29 39 53 108 106 94 119 142 208 132 Net incomes from livestock production 37 21 34 85 80 53 69 88 128 104 Net incomes from crop production -7 18 19 22 25 41 49 54 81 29 Total subsidies 20 26 37 56 100 112 135 138 138 177 Total net farm incomes (without subsidies) 9 14 16 51 6 -18 -16 4 70 -45
From middle 2000s, or start of realization of the National Priority Project in the field of agriculture,
accompanied with growing subsidies’ injections, domestic agriculture has become more and more
dependent on the government support. In most recent years the agricultural enterprises have been
quite profitable, but this profit is fully at the expense of various subsidies (see the table).
Figures for Farm income in different farm size are not available.
2.6 Future perspective for the agricultural sector
Strengths and weaknesses of the primary agricultural sector
Main strengths
• Sizable non-tackled efficiency gap and relevant growth potential
• Strong geo location and strong import substitution opportunities
• Improving of domestic products competitiveness and strong output growth opportunity window
Main weaknesses
• Aggravated terms of domestic farm and agribusiness finance
• Outdated infrastructure and state monopolies
• General investment climate and rule of law need substantial improvements
29
Factors influencing future developments
• Macroeconomic destabilization may affect future investment and business climate
• “Governmentalization” of the main national economy industries
• Speed of localization (if any) of major multinational ag machinery, ag chemicals, and genetic
brands
• The development of Eurasian Economic Union and its common ag market
Production and yields potentials and bottlenecks to address
To combine both the support of most advanced export oriented industries, such as grains, and oilseeds,
as well as address import substitution potential in most promising vertical subsectors
The rule of law and private ownership institutional building must become the priorities for the domestic
agricultural economics agenda
The state must concentrate its support on green box type of measures rather than on quite distorting
and contradictory direct farm support
30
3. SITUATION AND DEVELOPMENT OF UPSTREAM AND
DOWNSTREAM SECTORS
3.1 Input production and use
3.1.1 Input production
Russia has highly developed commercial agricultural inputs sector. The fuel supplies are provided by
major domestic multinational giants, such as Rosneft, Gaspromneft, Lukoil, and others. All major
corporations have in-house network of gasoline stations across the country. There is also a network of
independent gasoline companies. In some regions there are signs of dominant positioning of some
major companies on the retail farmers markets.
Fertilizers are provided by domestic multinational giants, such as Fosagro, Eurochem, Acron, UralKali,
and others. However, these corporations consider Russian agriculture as a secondary market in
comparison with their foreign operations.
Domestic pesticides market is broken down into two major segments: import of branded final products
and domestic bottling of generics. In a latter case the companies import active matter anyway. The
shares of both segments are estimated as 50-50%.
Practically all multinational pesticide brands are well established on the domestic market. Among them
are Syngenta, BASF, Bayer, Dupont, Monsanto (although quite modest in Russia), and other companies.
Seed industry is very different, depending on the product. Such industries, as wheat, oats, peas, millet,
and some others are dominated by domestic seed breeders. In such industries, as malting barley, corn,
sugar beets, sunseeds, almost all commercial vegetables and potatoes, horticultural products, etc.
foreign varieties and hybrids are very well established or even dominant.
During recent wave of reindustrialization in modern commercial poultry and livestock farming, foreign
genetic material and equipment have occupied a dominant position. Practically all major multinational
brands are present. Among them are big Dutchman, Hypor, and others.
Russian farmers banking finance is dominated by a group of major diversified commercial banks. Ag
finance is highly linked with interest rate subsidies, provided by the government. Two banks dominated
in these kinds of deals: Sberbank, and Rosselkhozbank, which have about 85-90% cumulative market
share. Other banks, such as VEB, VTB, Alfa, Gazprombank, and others, are rather modest in agriculture
finance.
3.1.2 Input use
For the last 4 years the fertilizer use in Russia decreased while fertilized area increased. Tractor’s
availability per 1000 hectares of arable land is decreasing from 4.4 in 2009 to 3.9 in 2012 year (2013
year data is not available yet). The number of harvesters per 1000 hectares of cereals land is also falling
from 3.0 to 2.7 pcs for the same period.
Table 24 Fertilisation in Russia 2010-2013
2010 2011 2012 2013
Fertiliser use, total (1000 centres) 19020 19577 18659 18468 Pure nutrients use, total
N, total 11875 12572 11744 11597 P2O5, total 4352 4253 4203 4358 K2O, total 1355 1260 1326 1375
Fertilised area, ‘000 ha total 21189 23018 22157 22626
Sources: Rosstat
31
3.2 Food industry
3.2.1 Food production
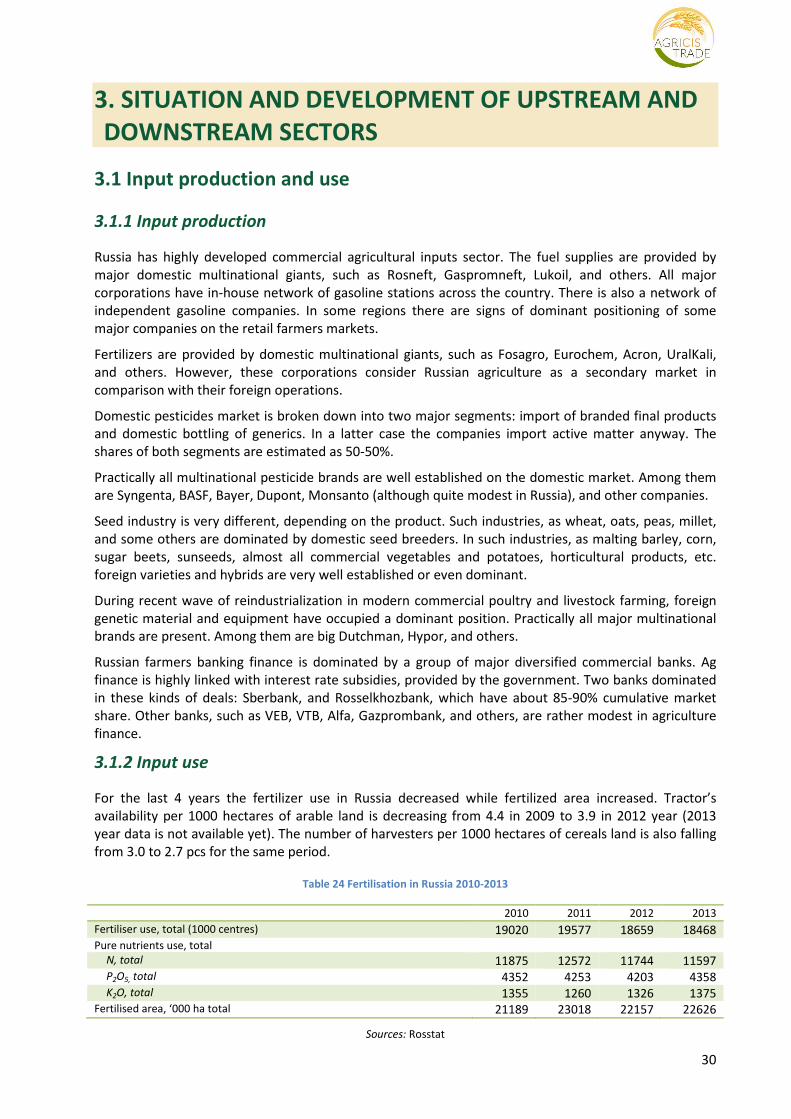
Domestic food industry has been steadily growing over the past decade, surpassing relevant growth of
agricultural output.
Figure 15 Agricultural and food industry output in Russia 2014-14 (index), 2004=100
Source: Rosstat
Against the background of this steady growth, some categories are rather flat or declining, while others
are booming. One should say that in each and every food industries there, deep structural changes
occur (see below given).
Figure 16 Meat products production in Russia 2004-14, TMT
Source: Rosstat
32
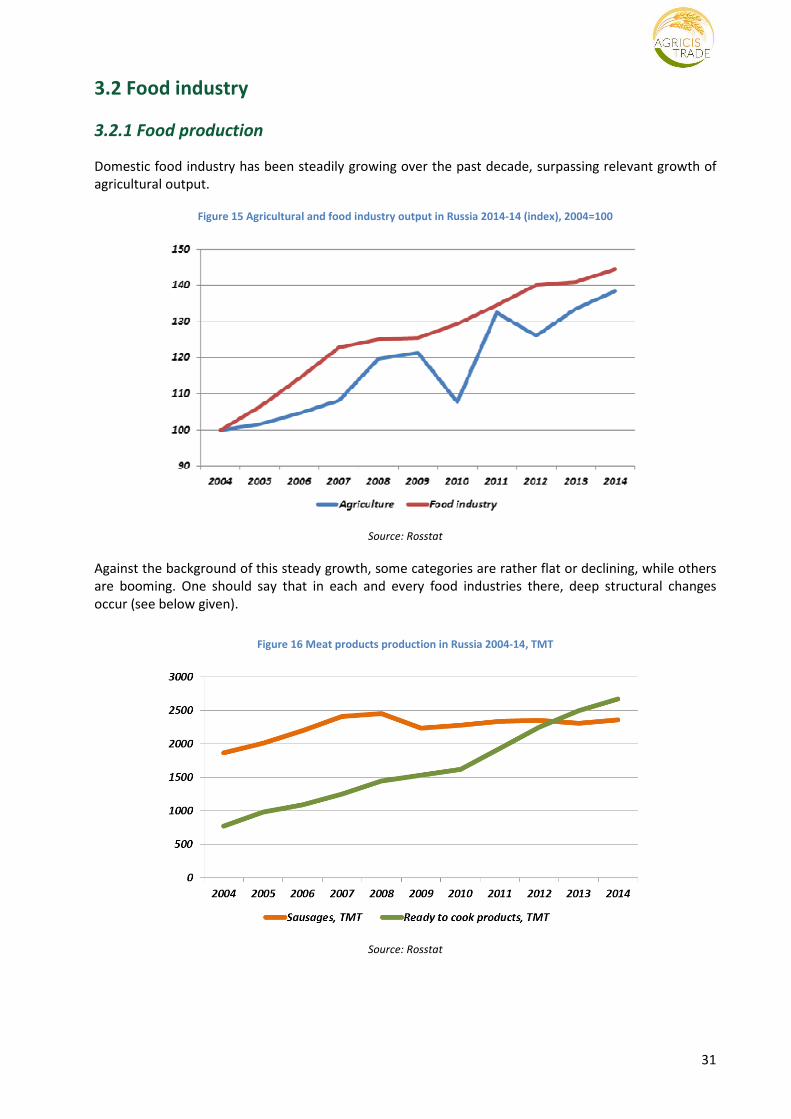
Figure 17 Major dairy products production in Russia 2004-14, TMT
Source: Rosstat
Figure 18 Flour and feedstuffs production in Russia 2004-14, TMT
Source: Rosstat
Figure 19 Other key agricultural products production in Russia 2004-14, TMT
Source: Rosstat
33
3.2.2 Structure of the food sector
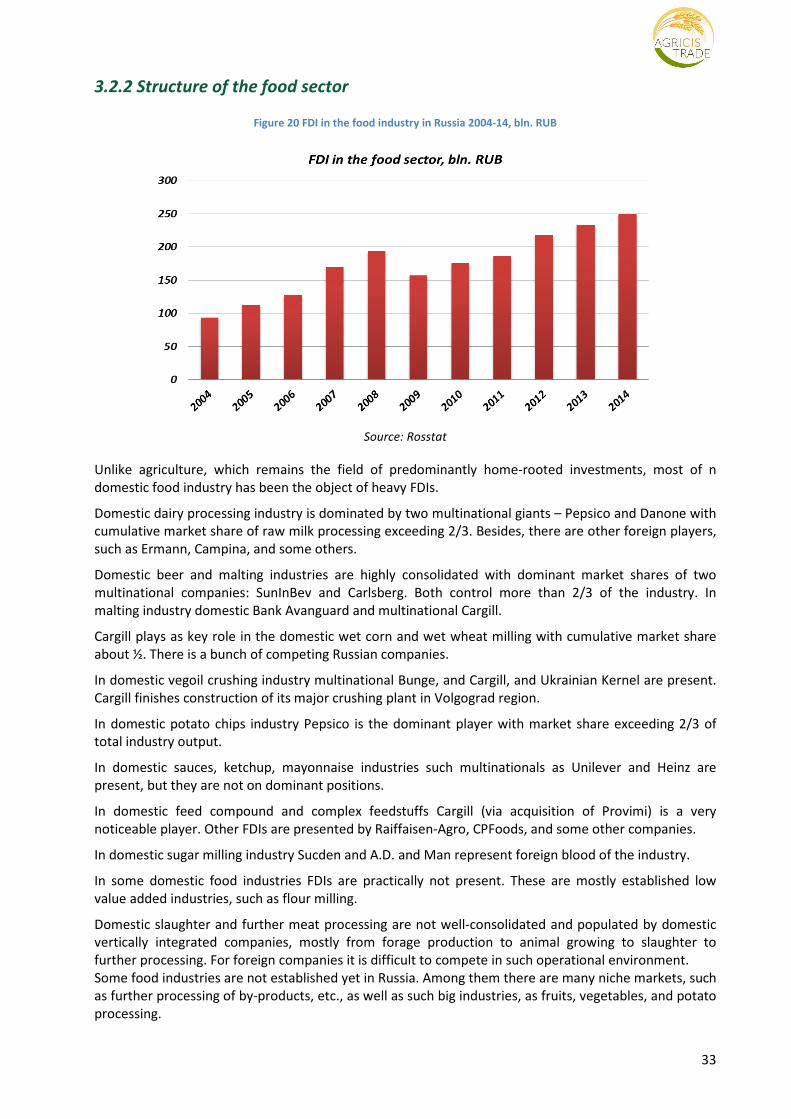
Figure 20 FDI in the food industry in Russia 2004-14, bln. RUB
Source: Rosstat
Unlike agriculture, which remains the field of predominantly home-rooted investments, most of n
domestic food industry has been the object of heavy FDIs.
Domestic dairy processing industry is dominated by two multinational giants – Pepsico and Danone with
cumulative market share of raw milk processing exceeding 2/3. Besides, there are other foreign players,
such as Ermann, Campina, and some others.
Domestic beer and malting industries are highly consolidated with dominant market shares of two
multinational companies: SunInBev and Carlsberg. Both control more than 2/3 of the industry. In
malting industry domestic Bank Avanguard and multinational Cargill.
Cargill plays as key role in the domestic wet corn and wet wheat milling with cumulative market share
about ½. There is a bunch of competing Russian companies.
In domestic vegoil crushing industry multinational Bunge, and Cargill, and Ukrainian Kernel are present.
Cargill finishes construction of its major crushing plant in Volgograd region.
In domestic potato chips industry Pepsico is the dominant player with market share exceeding 2/3 of
total industry output.
In domestic sauces, ketchup, mayonnaise industries such multinationals as Unilever and Heinz are
present, but they are not on dominant positions.
In domestic feed compound and complex feedstuffs Cargill (via acquisition of Provimi) is a very
noticeable player. Other FDIs are presented by Raiffaisen-Agro, CPFoods, and some other companies.
In domestic sugar milling industry Sucden and A.D. and Man represent foreign blood of the industry.
In some domestic food industries FDIs are practically not present. These are mostly established low
value added industries, such as flour milling.
Domestic slaughter and further meat processing are not well-consolidated and populated by domestic
vertically integrated companies, mostly from forage production to animal growing to slaughter to
further processing. For foreign companies it is difficult to compete in such operational environment.
Some food industries are not established yet in Russia. Among them there are many niche markets, such
as further processing of by-products, etc., as well as such big industries, as fruits, vegetables, and potato
processing.
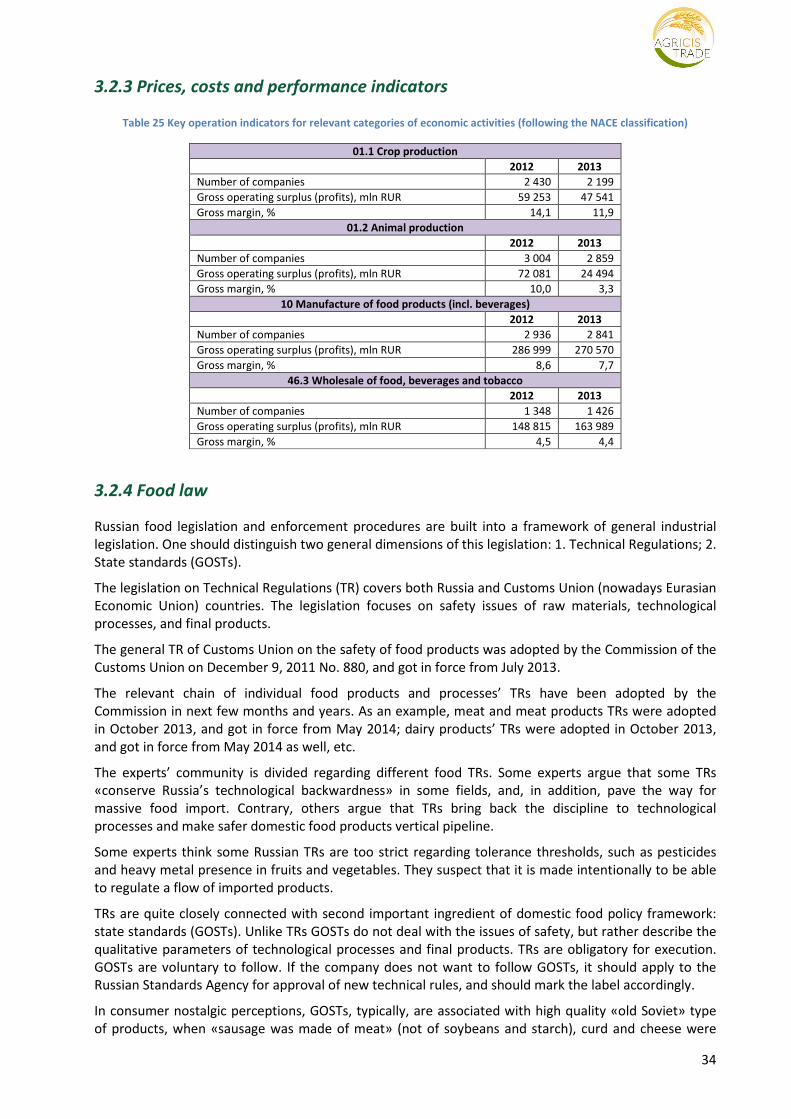
34
3.2.3 Prices, costs and performance indicators
Table 25 Key operation indicators for relevant categories of economic activities (following the NACE classification)
01.1 Crop production
2012 2013
Number of companies 2 430 2 199
Gross operating surplus (profits), mln RUR 59 253 47 541
Gross margin, % 14,1 11,9
01.2 Animal production
2012 2013
Number of companies 3 004 2 859
Gross operating surplus (profits), mln RUR 72 081 24 494
Gross margin, % 10,0 3,3
10 Manufacture of food products (incl. beverages)
2012 2013
Number of companies 2 936 2 841
Gross operating surplus (profits), mln RUR 286 999 270 570
Gross margin, % 8,6 7,7
46.3 Wholesale of food, beverages and tobacco
2012 2013
Number of companies 1 348 1 426
Gross operating surplus (profits), mln RUR 148 815 163 989
Gross margin, % 4,5 4,4
3.2.4 Food law
Russian food legislation and enforcement procedures are built into a framework of general industrial
legislation. One should distinguish two general dimensions of this legislation: 1. Technical Regulations; 2.
State standards (GOSTs).
The legislation on Technical Regulations (TR) covers both Russia and Customs Union (nowadays Eurasian
Economic Union) countries. The legislation focuses on safety issues of raw materials, technological
processes, and final products.
The general TR of Customs Union on the safety of food products was adopted by the Commission of the
Customs Union on December 9, 2011 No. 880, and got in force from July 2013.
The relevant chain of individual food products and processes’ TRs have been adopted by the
Commission in next few months and years. As an example, meat and meat products TRs were adopted
in October 2013, and got in force from May 2014; dairy products’ TRs were adopted in October 2013,
and got in force from May 2014 as well, etc.
The experts’ community is divided regarding different food TRs. Some experts argue that some TRs
«conserve Russia’s technological backwardness» in some fields, and, in addition, pave the way for
massive food import. Contrary, others argue that TRs bring back the discipline to technological
processes and make safer domestic food products vertical pipeline.
Some experts think some Russian TRs are too strict regarding tolerance thresholds, such as pesticides
and heavy metal presence in fruits and vegetables. They suspect that it is made intentionally to be able
to regulate a flow of imported products.
TRs are quite closely connected with second important ingredient of domestic food policy framework:
state standards (GOSTs). Unlike TRs GOSTs do not deal with the issues of safety, but rather describe the
qualitative parameters of technological processes and final products. TRs are obligatory for execution.
GOSTs are voluntary to follow. If the company does not want to follow GOSTs, it should apply to the
Russian Standards Agency for approval of new technical rules, and should mark the label accordingly.
In consumer nostalgic perceptions, GOSTs, typically, are associated with high quality «old Soviet» type
of products, when «sausage was made of meat» (not of soybeans and starch), curd and cheese were
35
made of milk (not of palm oil); bread was made of high quality wheat, etc. That’s why there is a high
stimulus to label the main staple food products as produced according to the GOST, and not according
to the technical rules (which automatically make consumers suspicious about the quality). Paradoxically,
but as of today those companies and individuals, which falsify the labelling, bear very limited
responsibility in form of very miserable administrative penalty, not comparable to the damage/
incremental benefit. The new draft law on standardization, which went through three Duma hearings
and which is at final stage of adoption, is meant to overcome this important drawback.
One important item of domestic food policies is associated with GMO issue. Russian public relation to
GMO is highly negative, if not to say hysterically negative. Although some analysts argue that due to
wide holes in safety inspection, Russians anyway consume a lot of GMO containing products via import
channels.
Meanwhile, formally, according to the Ministry of Health Rules, which came in force from January 2008,
all food products containing more than 0.9% GMO, must be obligatory labelled (although we have never
seen such a labelling in Russia, while the label «without soybeans» (meaning «without GMO») is very
widespread in domestic meat products industry).
Officially, up until most recently the commercial production of GMs was prohibited. Officially approved
imported GMO traits have been allowed in animal feeding, although there exist some important regions,
which announced themselves as “GMO-free” (such as Belgorod), which represents additional headaches
to local animal feed companies.
In September 2013 the Russian government published (without making public noise, so to say) a Decree,
which allowed, in theory, commercial production of GMs in Russia, of course with a lot of tests, and
precautions. However when the Decree was made available to the public, it received such a negative
reaction that made zero chances to any GM growing approvals in foreseeable future.
3.3 Bioenergy production
The government of Russia has established guidelines for support of “green energy” (renewable energy)
industries. However, after some debating, agricultural industries were excluded from the list. The
arguments were given in such a way that it is immoral to channel potential sources of food for energy
production. As the result, the key issue of bioethanol production – spirit excises - remains unsolved,
which makes production as unviable. As to the biodiesel, the price correspondence of vegoils and diesel
fuel in Russia does not make it economically viable either.
As the net result, up-to-date there is practically no any sizable bioenergy production in Russia. We are
aware only about some rather pilot biogas plants, and some wood pellets production plants in domestic
timber industry.
Having said so, we can’t fully deny a possibility of biofuel production: it may be part of fossil fuel
vertically integrated complex, so that bioethanol is produced and added into the final product – gasoline
– inside the plant as an ecologically clean additive. Or some farmers may use biodiesel based on on-farm
oilseed crushing capacity. But such developments are rather of local nature.
3.4 Food retail and consumption patterns
3.4.1 Food retail sector
Over the recent decade the domestic food retail sector has been in very deep, if not to say,
revolutionary restructuring. It was associated with emergence and deep rooting of modern supermarket
formats, which represent by now more than 1/3 of total food turnover. Among major supermarket
chains two Russian companies are dominant: Magnit, and X5 Retail. They are followed by two major
multinationals: Auchan, and Metro, followed by a number of Russian companies.
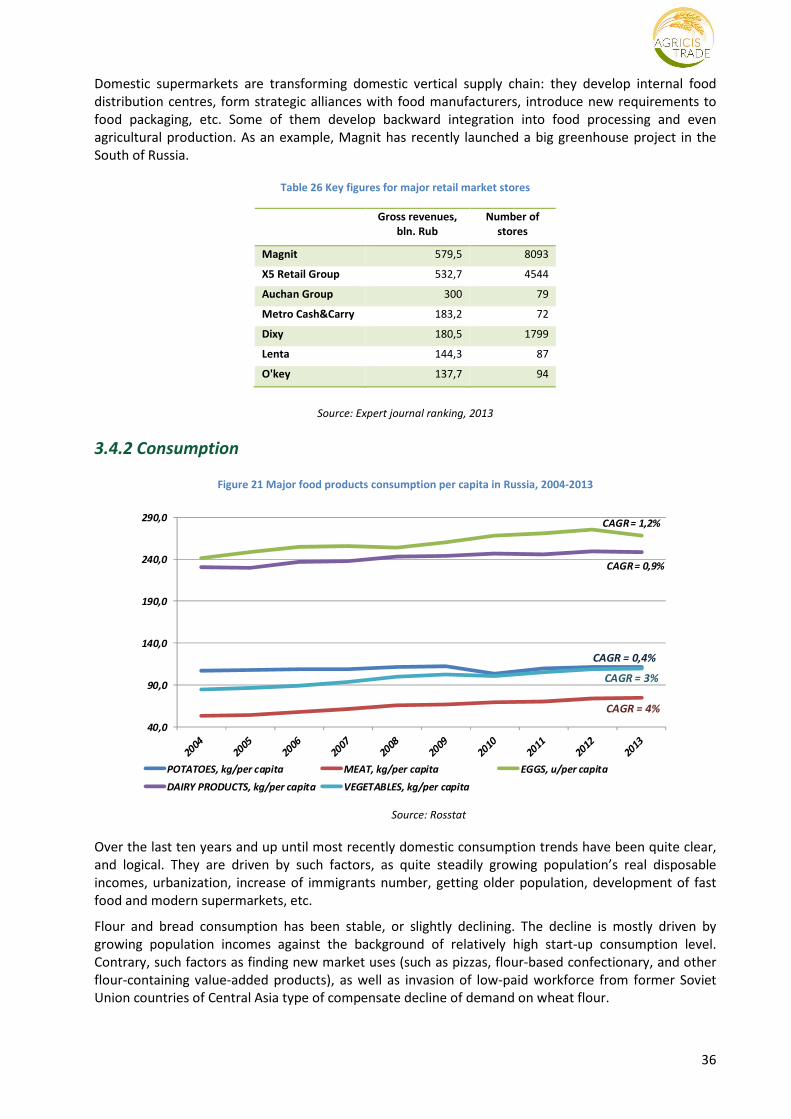
36
Domestic supermarkets are transforming domestic vertical supply chain: they develop internal food
distribution centres, form strategic alliances with food manufacturers, introduce new requirements to
food packaging, etc. Some of them develop backward integration into food processing and even
agricultural production. As an example, Magnit has recently launched a big greenhouse project in the
South of Russia.
Table 26 Key figures for major retail market stores
Source: Expert journal ranking, 2013
3.4.2 Consumption
Figure 21 Major food products consumption per capita in Russia, 2004-2013
CAGR = 0,4%
CAGR = 4%
CAGR = 1,2%
CAGR = 0,9%
CAGR = 3%
40,0
90,0
140,0
190,0
240,0
290,0
POTATOES, kg/per capita MEAT, kg/per capita EGGS, u/per capita
DAIRY PRODUCTS, kg/per capita VEGETABLES, kg/per capita
Source: Rosstat
Over the last ten years and up until most recently domestic consumption trends have been quite clear,
and logical. They are driven by such factors, as quite steadily growing population’s real disposable
incomes, urbanization, increase of immigrants number, getting older population, development of fast
food and modern supermarkets, etc.
Flour and bread consumption has been stable, or slightly declining. The decline is mostly driven by
growing population incomes against the background of relatively high start-up consumption level.
Contrary, such factors as finding new market uses (such as pizzas, flour-based confectionary, and other
flour-containing value-added products), as well as invasion of low-paid workforce from former Soviet
Union countries of Central Asia type of compensate decline of demand on wheat flour.
Gross revenues,
bln. Rub
Number of
stores
Magnit 579,5 8093
X5 Retail Group 532,7 4544
Auchan Group 300 79
Metro Cash&Carry 183,2 72
Dixy 180,5 1799
Lenta 144,3 87
O'key 137,7 94
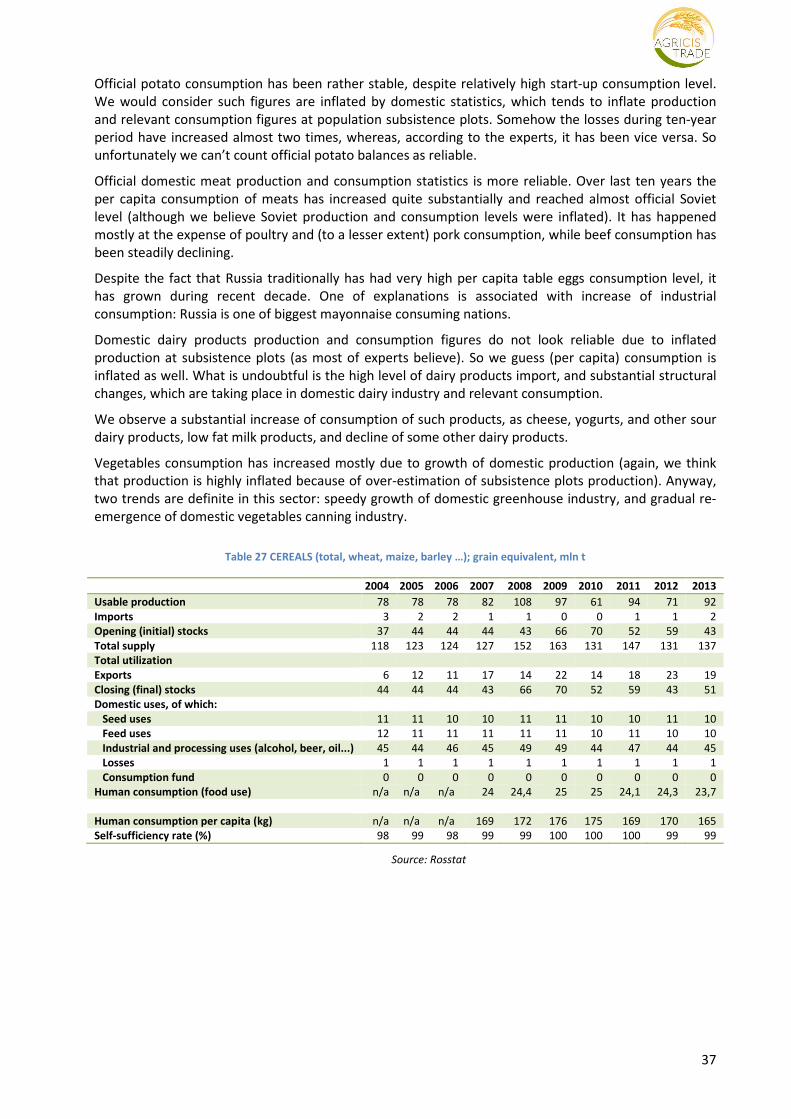
37
Official potato consumption has been rather stable, despite relatively high start-up consumption level.
We would consider such figures are inflated by domestic statistics, which tends to inflate production
and relevant consumption figures at population subsistence plots. Somehow the losses during ten-year
period have increased almost two times, whereas, according to the experts, it has been vice versa. So
unfortunately we can’t count official potato balances as reliable.
Official domestic meat production and consumption statistics is more reliable. Over last ten years the
per capita consumption of meats has increased quite substantially and reached almost official Soviet
level (although we believe Soviet production and consumption levels were inflated). It has happened
mostly at the expense of poultry and (to a lesser extent) pork consumption, while beef consumption has
been steadily declining.
Despite the fact that Russia traditionally has had very high per capita table eggs consumption level, it
has grown during recent decade. One of explanations is associated with increase of industrial
consumption: Russia is one of biggest mayonnaise consuming nations.
Domestic dairy products production and consumption figures do not look reliable due to inflated
production at subsistence plots (as most of experts believe). So we guess (per capita) consumption is
inflated as well. What is undoubtful is the high level of dairy products import, and substantial structural
changes, which are taking place in domestic dairy industry and relevant consumption.
We observe a substantial increase of consumption of such products, as cheese, yogurts, and other sour
dairy products, low fat milk products, and decline of some other dairy products.
Vegetables consumption has increased mostly due to growth of domestic production (again, we think
that production is highly inflated because of over-estimation of subsistence plots production). Anyway,
two trends are definite in this sector: speedy growth of domestic greenhouse industry, and gradual re-
emergence of domestic vegetables canning industry.
Table 27 CEREALS (total, wheat, maize, barley …); grain equivalent, mln t
2004 2005 2006 2007 2008 2009 2010 2011 2012 2013
Usable production 78 78 78 82 108 97 61 94 71 92
Imports 3 2 2 1 1 0 0 1 1 2
Opening (initial) stocks 37 44 44 44 43 66 70 52 59 43
Total supply 118 123 124 127 152 163 131 147 131 137
Total utilization
Exports 6 12 11 17 14 22 14 18 23 19
Closing (final) stocks 44 44 44 43 66 70 52 59 43 51
Domestic uses, of which:
Seed uses 11 11 10 10 11 11 10 10 11 10
Feed uses 12 11 11 11 11 11 10 11 10 10
Industrial and processing uses (alcohol, beer, oil...) 45 44 46 45 49 49 44 47 44 45
Losses 1 1 1 1 1 1 1 1 1 1
Consumption fund 0 0 0 0 0 0 0 0 0 0
Human consumption (food use) n/a n/a n/a 24 24,4 25 25 24,1 24,3 23,7
Human consumption per capita (kg) n/a n/a n/a 169 172 176 175 169 170 165
Self-sufficiency rate (%) 98 99 98 99 99 100 100 100 99 99
Source: Rosstat
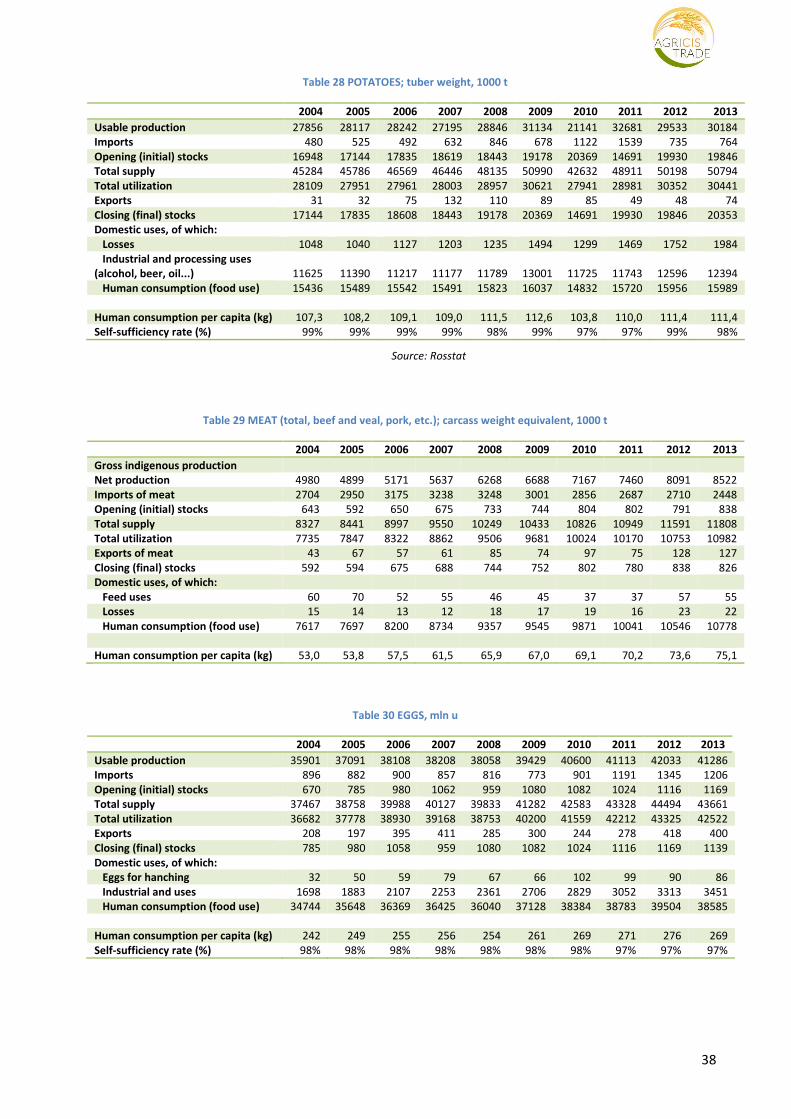
38
Table 28 POTATOES; tuber weight, 1000 t
2004 2005 2006 2007 2008 2009 2010 2011 2012 2013
Usable production 27856 28117 28242 27195 28846 31134 21141 32681 29533 30184
Imports 480 525 492 632 846 678 1122 1539 735 764
Opening (initial) stocks 16948 17144 17835 18619 18443 19178 20369 14691 19930 19846
Total supply 45284 45786 46569 46446 48135 50990 42632 48911 50198 50794
Total utilization 28109 27951 27961 28003 28957 30621 27941 28981 30352 30441
Exports 31 32 75 132 110 89 85 49 48 74
Closing (final) stocks 17144 17835 18608 18443 19178 20369 14691 19930 19846 20353
Domestic uses, of which:
Losses 1048 1040 1127 1203 1235 1494 1299 1469 1752 1984
Industrial and processing uses
(alcohol, beer, oil...) 11625 11390 11217 11177 11789 13001 11725 11743 12596 12394
Human consumption (food use) 15436 15489 15542 15491 15823 16037 14832 15720 15956 15989
Human consumption per capita (kg) 107,3 108,2 109,1 109,0 111,5 112,6 103,8 110,0 111,4 111,4
Self-sufficiency rate (%) 99% 99% 99% 99% 98% 99% 97% 97% 99% 98%
Source: Rosstat
Table 29 MEAT (total, beef and veal, pork, etc.); carcass weight equivalent, 1000 t
2004 2005 2006 2007 2008 2009 2010 2011 2012 2013
Gross indigenous production
Net production 4980 4899 5171 5637 6268 6688 7167 7460 8091 8522
Imports of meat 2704 2950 3175 3238 3248 3001 2856 2687 2710 2448
Opening (initial) stocks 643 592 650 675 733 744 804 802 791 838
Total supply 8327 8441 8997 9550 10249 10433 10826 10949 11591 11808
Total utilization 7735 7847 8322 8862 9506 9681 10024 10170 10753 10982
Exports of meat 43 67 57 61 85 74 97 75 128 127
Closing (final) stocks 592 594 675 688 744 752 802 780 838 826
Domestic uses, of which:
Feed uses 60 70 52 55 46 45 37 37 57 55
Losses 15 14 13 12 18 17 19 16 23 22
Human consumption (food use) 7617 7697 8200 8734 9357 9545 9871 10041 10546 10778
Human consumption per capita (kg) 53,0 53,8 57,5 61,5 65,9 67,0 69,1 70,2 73,6 75,1
Table 30 EGGS, mln u
2004 2005 2006 2007 2008 2009 2010 2011 2012 2013
Usable production 35901 37091 38108 38208 38058 39429 40600 41113 42033 41286
Imports 896 882 900 857 816 773 901 1191 1345 1206
Opening (initial) stocks 670 785 980 1062 959 1080 1082 1024 1116 1169
Total supply 37467 38758 39988 40127 39833 41282 42583 43328 44494 43661
Total utilization 36682 37778 38930 39168 38753 40200 41559 42212 43325 42522
Exports 208 197 395 411 285 300 244 278 418 400
Closing (final) stocks 785 980 1058 959 1080 1082 1024 1116 1169 1139
Domestic uses, of which:
Eggs for hanching 32 50 59 79 67 66 102 99 90 86
Industrial and uses 1698 1883 2107 2253 2361 2706 2829 3052 3313 3451
Human consumption (food use) 34744 35648 36369 36425 36040 37128 38384 38783 39504 38585
Human consumption per capita (kg) 242 249 255 256 254 261 269 271 276 269
Self-sufficiency rate (%) 98% 98% 98% 98% 98% 98% 98% 97% 97% 97%
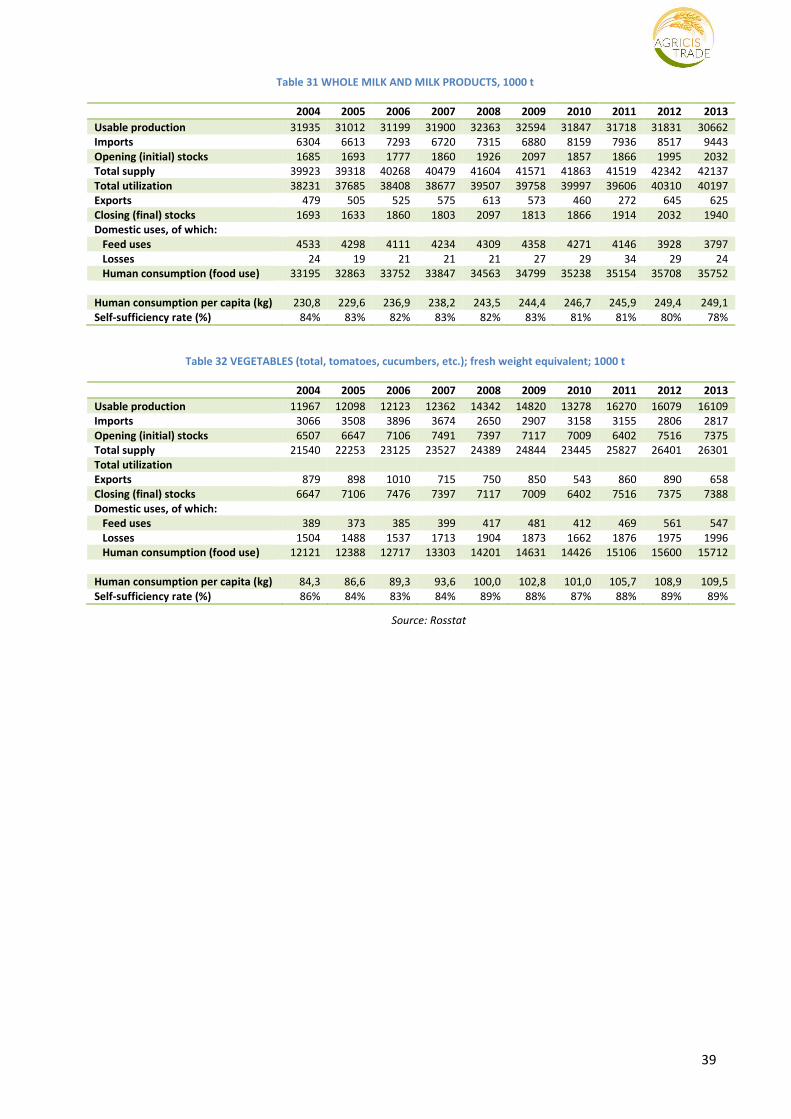
39
Table 31 WHOLE MILK AND MILK PRODUCTS, 1000 t
2004 2005 2006 2007 2008 2009 2010 2011 2012 2013
Usable production 31935 31012 31199 31900 32363 32594 31847 31718 31831 30662
Imports 6304 6613 7293 6720 7315 6880 8159 7936 8517 9443
Opening (initial) stocks 1685 1693 1777 1860 1926 2097 1857 1866 1995 2032
Total supply 39923 39318 40268 40479 41604 41571 41863 41519 42342 42137
Total utilization 38231 37685 38408 38677 39507 39758 39997 39606 40310 40197
Exports 479 505 525 575 613 573 460 272 645 625
Closing (final) stocks 1693 1633 1860 1803 2097 1813 1866 1914 2032 1940
Domestic uses, of which:
Feed uses 4533 4298 4111 4234 4309 4358 4271 4146 3928 3797
Losses 24 19 21 21 21 27 29 34 29 24
Human consumption (food use) 33195 32863 33752 33847 34563 34799 35238 35154 35708 35752
Human consumption per capita (kg) 230,8 229,6 236,9 238,2 243,5 244,4 246,7 245,9 249,4 249,1
Self-sufficiency rate (%) 84% 83% 82% 83% 82% 83% 81% 81% 80% 78%
Table 32 VEGETABLES (total, tomatoes, cucumbers, etc.); fresh weight equivalent; 1000 t
2004 2005 2006 2007 2008 2009 2010 2011 2012 2013
Usable production 11967 12098 12123 12362 14342 14820 13278 16270 16079 16109
Imports 3066 3508 3896 3674 2650 2907 3158 3155 2806 2817
Opening (initial) stocks 6507 6647 7106 7491 7397 7117 7009 6402 7516 7375
Total supply 21540 22253 23125 23527 24389 24844 23445 25827 26401 26301
Total utilization
Exports 879 898 1010 715 750 850 543 860 890 658
Closing (final) stocks 6647 7106 7476 7397 7117 7009 6402 7516 7375 7388
Domestic uses, of which:
Feed uses 389 373 385 399 417 481 412 469 561 547
Losses 1504 1488 1537 1713 1904 1873 1662 1876 1975 1996
Human consumption (food use) 12121 12388 12717 13303 14201 14631 14426 15106 15600 15712
Human consumption per capita (kg) 84,3 86,6 89,3 93,6 100,0 102,8 101,0 105,7 108,9 109,5
Self-sufficiency rate (%) 86% 84% 83% 84% 89% 88% 87% 88% 89% 89%
Source: Rosstat
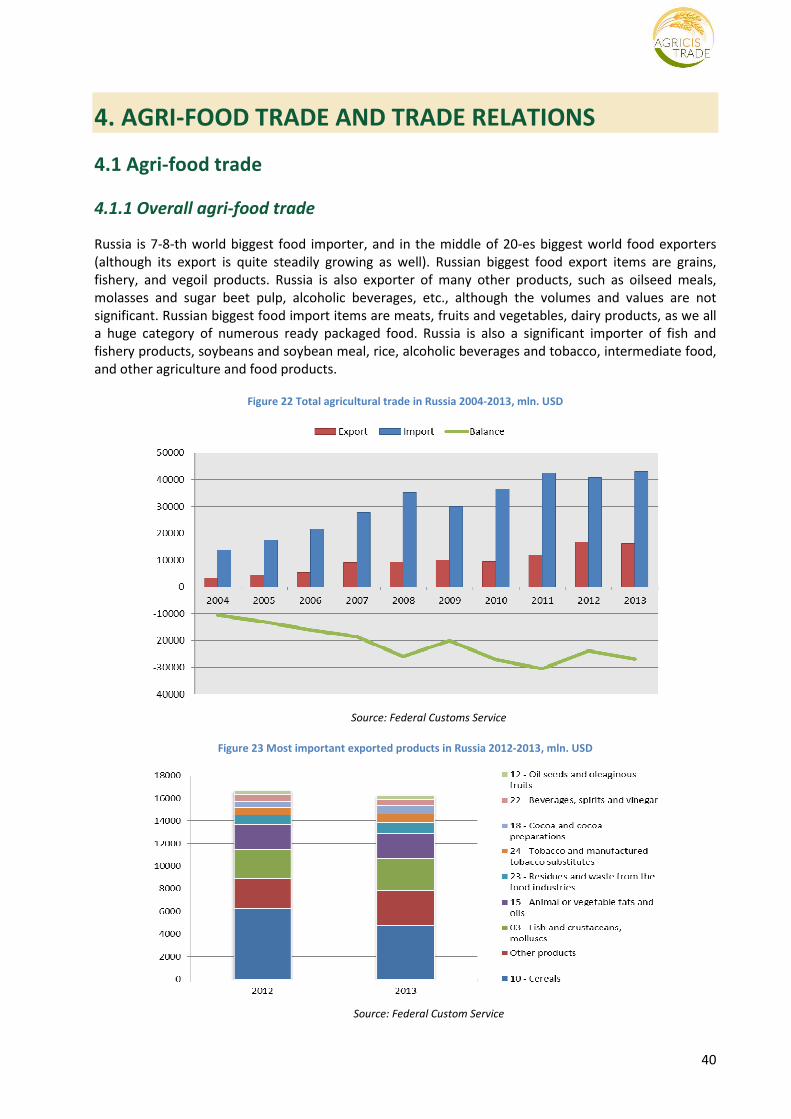
40
4. AGRI-FOOD TRADE AND TRADE RELATIONS
4.1 Agri-food trade
4.1.1 Overall agri-food trade
Russia is 7-8-th world biggest food importer, and in the middle of 20-es biggest world food exporters
(although its export is quite steadily growing as well). Russian biggest food export items are grains,
fishery, and vegoil products. Russia is also exporter of many other products, such as oilseed meals,
molasses and sugar beet pulp, alcoholic beverages, etc., although the volumes and values are not
significant. Russian biggest food import items are meats, fruits and vegetables, dairy products, as we all
a huge category of numerous ready packaged food. Russia is also a significant importer of fish and
fishery products, soybeans and soybean meal, rice, alcoholic beverages and tobacco, intermediate food,
and other agriculture and food products.
Figure 22 Total agricultural trade in Russia 2004-2013, mln. USD
Source: Federal Customs Service
Figure 23 Most important exported products in Russia 2012-2013, mln. USD
Source: Federal Custom Service
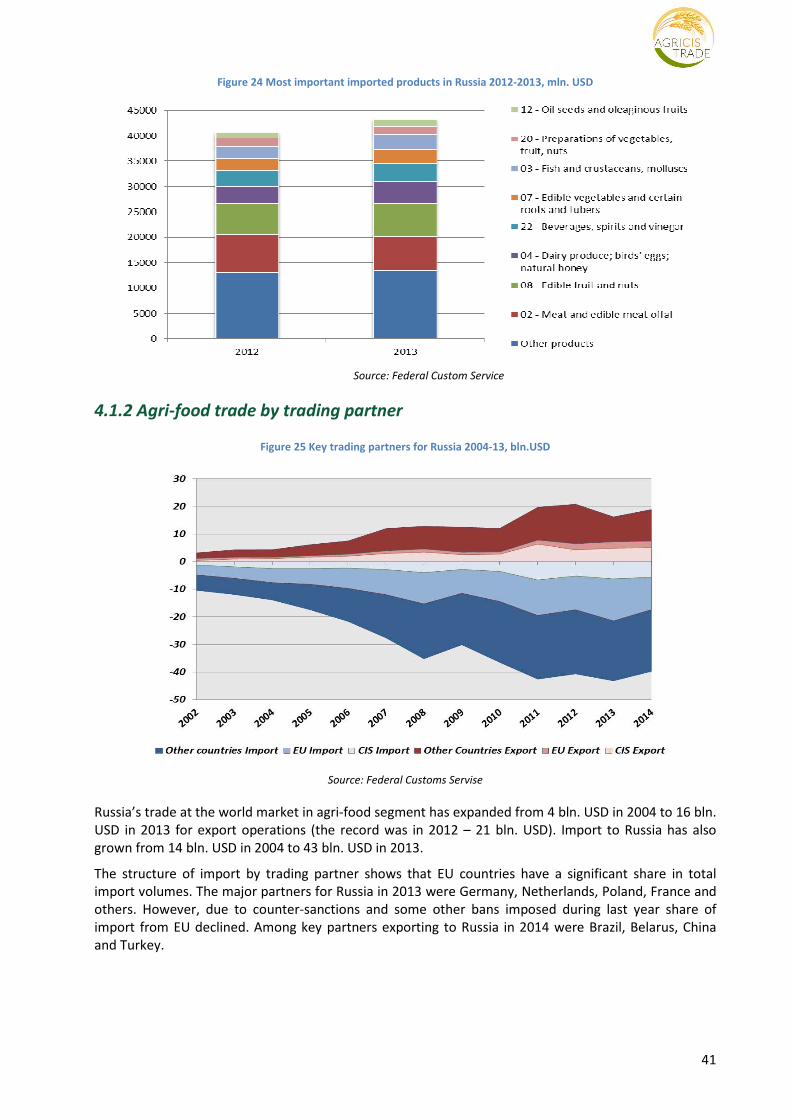
41
Figure 24 Most important imported products in Russia 2012-2013, mln. USD
Source: Federal Custom Service
4.1.2 Agri-food trade by trading partner
Figure 25 Key trading partners for Russia 2004-13, bln.USD
Source: Federal Customs Servise
Russia’s trade at the world market in agri-food segment has expanded from 4 bln. USD in 2004 to 16 bln.
USD in 2013 for export operations (the record was in 2012 – 21 bln. USD). Import to Russia has also
grown from 14 bln. USD in 2004 to 43 bln. USD in 2013.
The structure of import by trading partner shows that EU countries have a significant share in total
import volumes. The major partners for Russia in 2013 were Germany, Netherlands, Poland, France and
others. However, due to counter-sanctions and some other bans imposed during last year share of
import from EU declined. Among key partners exporting to Russia in 2014 were Brazil, Belarus, China
and Turkey.
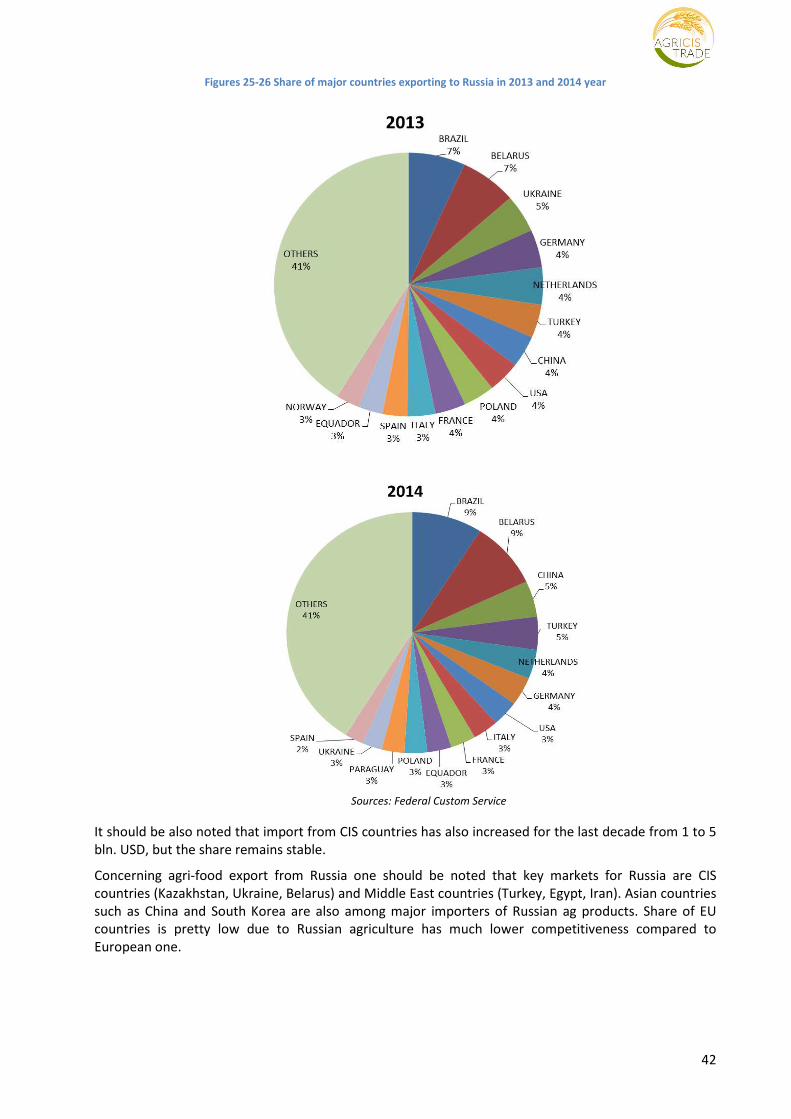
42
Figures 25-26 Share of major countries exporting to Russia in 2013 and 2014 year
Sources: Federal Custom Service
It should be also noted that import from CIS countries has also increased for the last decade from 1 to 5
bln. USD, but the share remains stable.
Concerning agri-food export from Russia one should be noted that key markets for Russia are CIS
countries (Kazakhstan, Ukraine, Belarus) and Middle East countries (Turkey, Egypt, Iran). Asian countries
such as China and South Korea are also among major importers of Russian ag products. Share of EU
countries is pretty low due to Russian agriculture has much lower competitiveness compared to
European one.
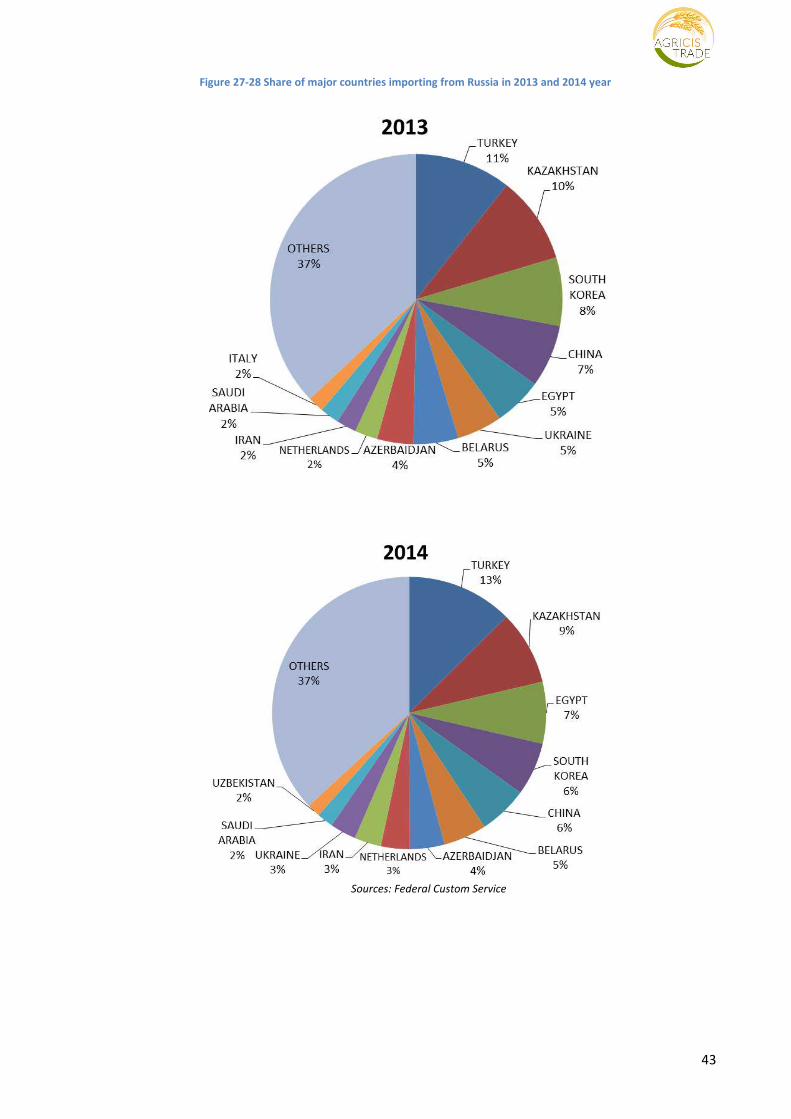
43
Figure 27-28 Share of major countries importing from Russia in 2013 and 2014 year
Sources: Federal Custom Service
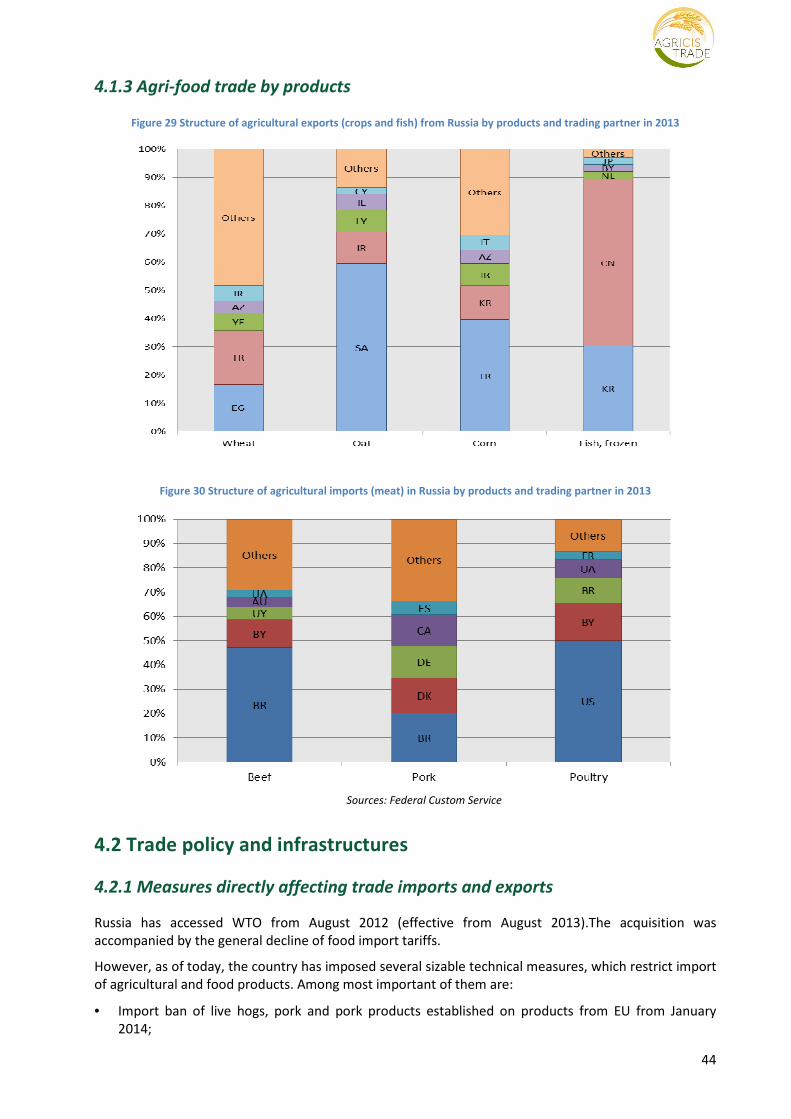
44
4.1.3 Agri-food trade by products
Figure 29 Structure of agricultural exports (crops and fish) from Russia by products and trading partner in 2013
Figure 30 Structure of agricultural imports (meat) in Russia by products and trading partner in 2013
Sources: Federal Custom Service
4.2 Trade policy and infrastructures
4.2.1 Measures directly affecting trade imports and exports
Russia has accessed WTO from August 2012 (effective from August 2013).The acquisition was
accompanied by the general decline of food import tariffs.
However, as of today, the country has imposed several sizable technical measures, which restrict import
of agricultural and food products. Among most important of them are:
• Import ban of live hogs, pork and pork products established on products from EU from January
2014;
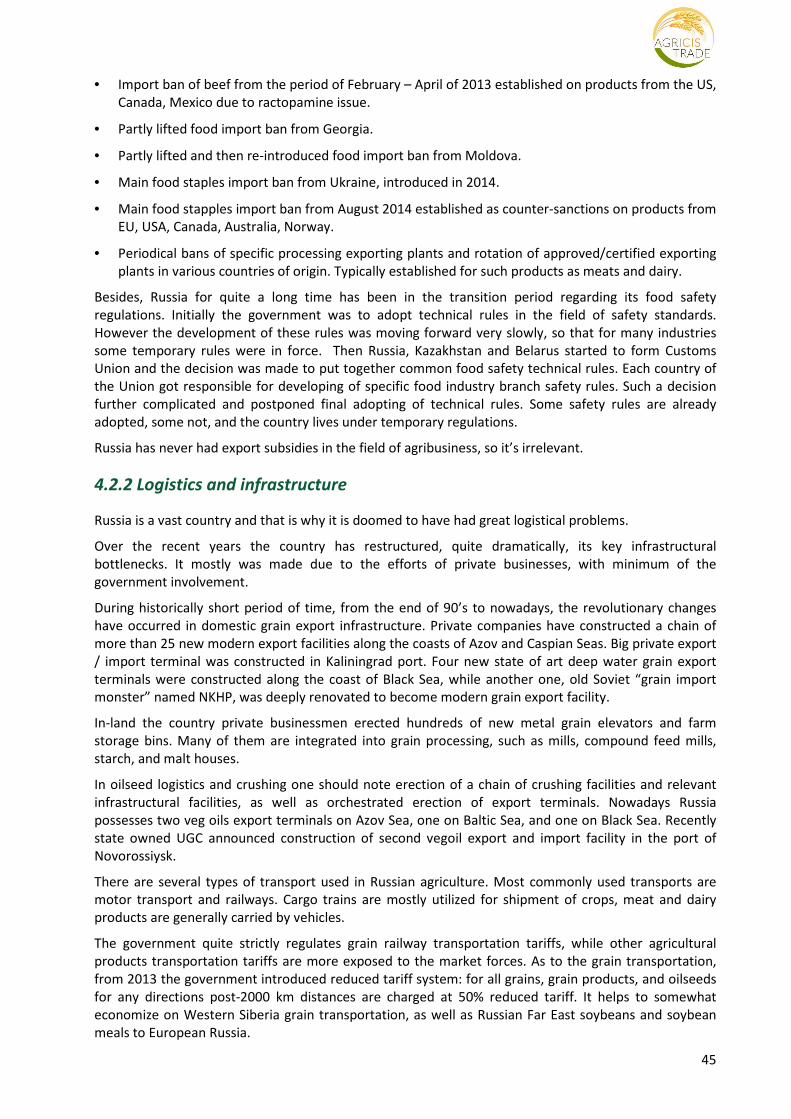
45
• Import ban of beef from the period of February – April of 2013 established on products from the US,
Canada, Mexico due to ractopamine issue.
• Partly lifted food import ban from Georgia.
• Partly lifted and then re-introduced food import ban from Moldova.
• Main food staples import ban from Ukraine, introduced in 2014.
• Main food stapples import ban from August 2014 established as counter-sanctions on products from
EU, USA, Canada, Australia, Norway.
• Periodical bans of specific processing exporting plants and rotation of approved/certified exporting
plants in various countries of origin. Typically established for such products as meats and dairy.
Besides, Russia for quite a long time has been in the transition period regarding its food safety
regulations. Initially the government was to adopt technical rules in the field of safety standards.
However the development of these rules was moving forward very slowly, so that for many industries
some temporary rules were in force. Then Russia, Kazakhstan and Belarus started to form Customs
Union and the decision was made to put together common food safety technical rules. Each country of
the Union got responsible for developing of specific food industry branch safety rules. Such a decision
further complicated and postponed final adopting of technical rules. Some safety rules are already
adopted, some not, and the country lives under temporary regulations.
Russia has never had export subsidies in the field of agribusiness, so it’s irrelevant.
4.2.2 Logistics and infrastructure
Russia is a vast country and that is why it is doomed to have had great logistical problems.
Over the recent years the country has restructured, quite dramatically, its key infrastructural
bottlenecks. It mostly was made due to the efforts of private businesses, with minimum of the
government involvement.
During historically short period of time, from the end of 90’s to nowadays, the revolutionary changes
have occurred in domestic grain export infrastructure. Private companies have constructed a chain of
more than 25 new modern export facilities along the coasts of Azov and Caspian Seas. Big private export
/ import terminal was constructed in Kaliningrad port. Four new state of art deep water grain export
terminals were constructed along the coast of Black Sea, while another one, old Soviet “grain import
monster” named NKHP, was deeply renovated to become modern grain export facility.
In-land the country private businessmen erected hundreds of new metal grain elevators and farm
storage bins. Many of them are integrated into grain processing, such as mills, compound feed mills,
starch, and malt houses.
In oilseed logistics and crushing one should note erection of a chain of crushing facilities and relevant
infrastructural facilities, as well as orchestrated erection of export terminals. Nowadays Russia
possesses two veg oils export terminals on Azov Sea, one on Baltic Sea, and one on Black Sea. Recently
state owned UGC announced construction of second vegoil export and import facility in the port of
Novorossiysk.
There are several types of transport used in Russian agriculture. Most commonly used transports are
motor transport and railways. Cargo trains are mostly utilized for shipment of crops, meat and dairy
products are generally carried by vehicles.
The government quite strictly regulates grain railway transportation tariffs, while other agricultural
products transportation tariffs are more exposed to the market forces. As to the grain transportation,
from 2013 the government introduced reduced tariff system: for all grains, grain products, and oilseeds
for any directions post-2000 km distances are charged at 50% reduced tariff. It helps to somewhat
economize on Western Siberia grain transportation, as well as Russian Far East soybeans and soybean
meals to European Russia.
46
Typical rates for transporting vary depending on the item to be carried. Approximate rates are listed
below for major livestock agricultural products in Russia:
Raw milk (auto) Broilers (auto)
Distance Rate, RUB/kg Distance Rate, RUB/kg
200 km 1,1 -1,2
350 km 2,5
1100 km 6 - 6,5
1100 km 4,2
1700 km 8 - 8,5
1800 km 6
4.2.3 Main trade agreements
Russia has a type of multi-layer trade agreements system.
First, with CIS countries (nowadays with exclusion of Georgia, Moldova, Ukraine) Russia has duty-free
food trade regime. Before introduction of import ban from Ukraine, Russia had special exclusions from
duty-free agreement with this country. Key example is white sugar: Ukraine was treated as the rest of
other non-CIS countries.
Then later Russia, Belarus, and Kazakhstan created Customs Union, which later has been transformed
into Eurasian Economic Community (EEC) followed by Eurasian Economic Union (EEU). The latter is being
formed by same three countries (Russia, Belarus, Kazakhstan) and being joined by Armenia (the process
is almost completed), Kirgizstan (formal accession is expected in May 2015). Another potential member
is Tajikistan.
The Customs Union was created to establish single economic frontier of three countries, so that
Customs frontiers between the countries were abandoned. As to EEU, it is meant to gradually create a
Single Economic Space of member countries.
The Eurasian Economic Commission (EEC) is a single permanent regulatory body (supranational
governing body) of the Customs Union of Belarus, Kazakhstan and Russia (CU) and the EEU.
Within its competence, the Commission issues non-binding instruments, such as recommendations and
also may take decisions that are binding on the Parties.
Cooperation in the agro-industrial sector (execution of memoranda, agreements) as follows:
• development and implementation of the policy aimed to achieve the highest and the most
sustainable growth in the agribusiness;
• international exchange of scientific and technical information and regulations regarding
agricultural production, food processing, marketing and distribution;
• creation of favourable conditions for trade and fund-raising in the agri-food sector;
• food security;
• financial and technical support of projects of agricultural development in order to increase food
production;
• expansion of the grain market;
• development of high-performance technologies of food production;
• promotion of livestock, poultry, crop production, breeding new plant varieties, conservation and
utilization of genetic resources of animals and plants;
• Promotion of all types of engineering works in agriculture.
47
5. AGRICULTURAL POLICY AND INSTITUTIONAL
ENVIRONMENT
Over the decade of 2004 – 2013 Russian agricultural policies made quite a dramatic shift from relatively
modest to very heavy regulation and state (first of all federal) budget support.
From 2004 onwards Russia pursues strong food import tariff regulation. It has dealt with introduction
and gradual perfection (strengthening) of flexible raw sugar import duty (2004), introduction of meat
import TRQs (2004), gradual elevating of rice and dairy products import tariffs. In parallel various non-
tariff imports restriction measures have been launched against major exporting nations in many
branches of food economy: from apples import from Poland to chicken meat from the US, and port
meat from the EU, etc.
Russia’s accession to WTO has put some upper limits on further expansion of import tariffs protection,
as well as started the process of lowering import tariffs in many food product categories. However in
some (most sensitive) industry branches the process was accompanied by a sharp introduction of new
non-tariff protection measures, such as launching the issues of ractopomine, trenbolone, etc.
In parallel to elevation of import restriction measures (which, by the way, have not prevented Russia
from growing food import over the decade) the country shifted to much more aggressive domestic
support policies.
The type of official start of growing support to domestic agriculture was in 2006, with launching National
priority project in the field of agriculture. The Project was followed by the 2008-2012 Agricultural
Program, which could be viewed as a remote analogue of the US Farm Bill, or EU CAP. According to both
Project and Program, annual federal budget support to domestic agriculture has grown substantially,
although from quite a modest “start-up” level. After rather successful completion of the Program, a new
2013-20 Agricultural Program has been launched.
Over the period of 2006-2013 the focus of domestic farm support was on animal protein sector,
primarily on dairy, poultry meat, and swine production, which most recently beef cattle has become a
priority.
Over entire period the main tool of domestic farm support has been working and fixed capital interest
rate subsidy, provided by the federal and regional governments against commercial banks landing to
agricultural producers. Both subsidies accounted for up to 70% of all federal budget allocations to
agriculture. Working capital interest rate subsidy has supported mainly crop producers and buyers of
agricultural products. The federal government basically provides 2/3 of official Central bank refinancing
rate to the relevant commercial bank after credit repayment on the part of agricultural producer or the
buyer of agricultural products. The terms for fixed capital interest rate subsidy have changed over the
time. As an example, the credit period was extended to up to 15 years (for dairy farming). Up until
recently they envisaged up to 100% of Central Bank refinancing rate coverage. Plus in both cases for
working and fixed capital finance the regional governments could come up with additional interest rate
subsidies.
The results of the interest rate subsidy programs have been rather positive: the access to both working,
and fixed capital finance has greatly improved, a lot of green field investments were made by private
operators. Thus during the period of 2006-2013 the CAGR in poultry meat industry has been 13%,
including 15% in corporate sector, while the CAGR in swine sector has been 7%, incl. 19% in the
corporate sector. Both industries (especially poultry) have greatly moved towards domestic self-
sufficiency.
However in such industry, as dairy farming, the results of aggressive investment stimulation were rather
disappointing, as too many private entrants over-estimated the cash flow and underestimated cost of
total investments.
48
In parallel to interest rate subsidies Agricultural Program supported Rural development, and Soil
improvement programs (the latter with the focus on irrigation), crop insurance (50% of standard crop
insurance premium has been covered from the state budged), breeding, agricultural science and
education, young farmers, etc.
The introduction and implementation of the2013-2020 Agricultural Program has been accompanied by
some structural shifts in subsidization programs. Most recently these shifts received additional push in
the framework of counter-sanctions package.
In crop production the area payments were launched, although at very modest level ($100-150 per ha).
The measure is aimed to spread the subsidies more equally, and not allow concentrate them mostly at
big holding companies. In dairy industry they introduced a special subsidy payment per litre of raw milk
coming for processing.
There emerged new industry lines of investment credits support, such as greenhouses, and open air
commercial vegetables, horticulture, aquaculture, and some other lines of investments. The priority is
given to those industry branches where one could achieve rather quick and sizable import substitution.
49
6. CONCLUSIONS
Trade pattern of the country
Russia has got strong natural competitive advantages in the field of grains and oilseeds (excluding
soybeans, and tropical oilseeds) production and export and has developed very strong export pipelines
in these commodity sub-segments.
Russia has been a traditional importer of fruits, vegetables, meat and dairy products, but this position
has changed, changing, or is going to change in the foreseeable future due to strong motivations for
import substitution, supported by the relevant state subsidies.
Russia is very sizable importer of some key technological agricultural inputs, including some seeds, all
pesticides, agricultural machinery, food processing machinery, and others.
Future production and consumption perspectives
Russia will most likely to continue to gradually strengthen its grain and oilseeds export orientation,
along with development of domestic value added pipelines, mostly associated with feedstuffs.
The country may quite quickly fill-in the gaps and sharply increase self-sufficiency in such industry
branches as pork, vegetables, some fruits production.
As to such items, as agricultural inputs, beef, and dairy, it is problematic to expect quick increase of self-
sufficiency.
Main strengths of the agri-food sector
Russia has strong opportunities for yield growth regarding many agricultural crops and animal
production sectors. Yield gaps between Krasnodar region (as one of the most effective regions in terms
of productivity) and France remain pretty high. Crops such as wheat, maize or sunflower have 25-50%
yield gaps to France agricultural sector. Sugar beet yield and cow’s productivity may also be higher and
closer to France figures.
• Potential advantages for Russian ag sector should be included:
• Devaluation has improved domestic products competitiveness.
• Abundant supply of cheap natural resources, such as land, fuel, fertilizers, water.
• Close proximity of South Russia to the main grains and oilseeds export markets
• Strong North-West (Kaliningrad) and Far East (Amur, Vladivostok) untackled export potential.
• Strong import substitution opportunities in many industry branches.
Main weaknesses of the agri-food sector
Russian economy is quite weak for today and not able to provide as much support for agri-food sector as
it requires. Recent developments were achieved due to large-scale support from the government. State
support continues even at the same level as for 2-3 last years but the economic environment has
aggravated sharply. In this new reality agri-food market players will face with increase of production
costs. Despite this important problem there are also some institutional weaknesses:
• Deterioration of macro-economic and financial situation.
• Outdated physical infrastructure in many industry branches.
• State or semi-state monopolies dominate in some input supply and agricultural service industry
branches.
• Quality of laws and enforcement.
50
• Scarce availability of highly qualified and reliable rural labour.
• Ag education and science remain non-reformed yet.
Production potential
Quite sizable export and import substitution driven production potential practically in all key agricultural
branches, with small exceptions (barley domestic and export markets look quite saturated; poultry meat
and egg production looks quite saturated, and some other branches…).
Main factors influencing the development of agri-food chains
Macro-economic and political situation
Agricultural policies/subsidies agenda: focus on import substitution/”self-sufficiency”, or export
orientation and strengthen of competitive value-added chain.
Recommendations on addressing bottlenecks to reduce yield gaps and increase production level
To combine both the support of most advanced export oriented industries, such as grains, and oilseeds,
as well as address import substitution potential in most promising vertical subsectors
The rule of law and private ownership institutional building must become the priorities for the domestic
agricultural economics agenda
The state must concentrate its support on green box type of measures rather than on quite distorting
and contradictory direct farm support