Embed Size (px)
Citation preview

Country profiles — industrial emissions
Methodology report
ETC/ACM Technical Paper 2016/2
July 2016
Katrina Young, Justin Goodwin and Daniel Martin-Montalvo Álvarez
The European Topic Centre on Air Pollution and Climate Change Mitigation (ETC/ACM) is a consortium of European institutes under contract of the European Environment Agency
RIVM Aether CHMI CSIC EMISIA INERIS NILU ÖKO-Institut ÖKO-Recherche PBL UAB UBA-V VITO 4Sfera
Front page picture:
Cover photo: Jorge Franganillo, Creative Commons Attribution 2.0 Generic
(https://goo.gl/rqHYk6)
Author affiliation:
Katrina Young, Justin Goodwin: Aether (UK)
Daniel Martin-Montalvo Álvarez: EEA
DISCLAIMER
© ETC/ACM, 2016. ETC/ACM Technical Paper 2016/2 European Topic Centre on Air Pollution and Climate Change Mitigation
PO Box 1
3720 BA Bilthoven The Netherlands Phone +31 30 2748562 Fax +31 30 2744433 Email [email protected]
Website http://acm.eionet.europa.eu/
This ETC/ACM Technical Paper has not been subjected to European Environment Agency (EEA) member country review. It does not represent the formal views of the EEA.

Contents
1 Introduction ...................................................................................................... 5
2 Scope ................................................................................................................ 5
2.1 Definition of industry ................................................................................ 5
2.2 Pollutants considered .............................................................................. 8
2.2.1 Air …………………………………………………………………………….. 8
2.2.2 Water ....................................................................................................... 9
2.2.3 Waste .................................................................................................... 10
2.2.4 Soil …………………………………………………………………………... 10
3 Gap filling ....................................................................................................... 10
4 Data quality .................................................................................................... 11
5 Industrial drivers ............................................................................................ 12
5.1 Data sources ......................................................................................... 12
5.2 Figures .................................................................................................. 14
6 Industrial pollution......................................................................................... 16
6.1 Air emissions ......................................................................................... 16
6.1.1 Data sources ......................................................................................... 16
6.1.2 Figures .................................................................................................. 17
6.2 Emissions to water ................................................................................ 18
6.2.1 Data sources ......................................................................................... 18
6.2.2 Figures .................................................................................................. 19
6.3 Waste .................................................................................................... 20
6.3.1 Data sources ......................................................................................... 20
6.3.2 Figures .................................................................................................. 20
6.4 Soil ........................................................................................................ 21
References .............................................................................................................. 22
Units, abbreviations and acronyms ...................................................................... 24
Annex 1 Scope of industry across datasets ........................................................ 25
Annex 2 Feedback received from countries on this methodology .................... 39

Country factsheets — industrial emissions, methodology report 5
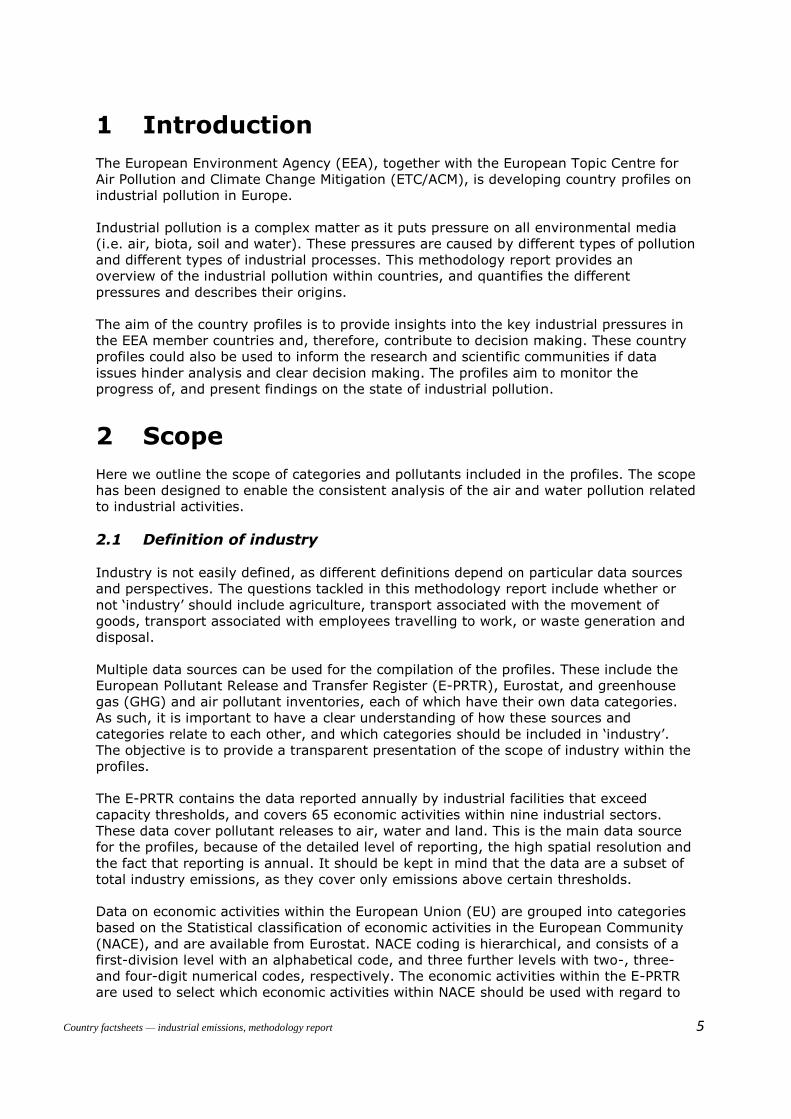
1 Introduction
The European Environment Agency (EEA), together with the European Topic Centre for
Air Pollution and Climate Change Mitigation (ETC/ACM), is developing country profiles on
industrial pollution in Europe.
Industrial pollution is a complex matter as it puts pressure on all environmental media
(i.e. air, biota, soil and water). These pressures are caused by different types of pollution
and different types of industrial processes. This methodology report provides an
overview of the industrial pollution within countries, and quantifies the different
pressures and describes their origins.
The aim of the country profiles is to provide insights into the key industrial pressures in
the EEA member countries and, therefore, contribute to decision making. These country
profiles could also be used to inform the research and scientific communities if data
issues hinder analysis and clear decision making. The profiles aim to monitor the
progress of, and present findings on the state of industrial pollution.
2 Scope
Here we outline the scope of categories and pollutants included in the profiles. The scope
has been designed to enable the consistent analysis of the air and water pollution related
to industrial activities.
2.1 Definition of industry
Industry is not easily defined, as different definitions depend on particular data sources
and perspectives. The questions tackled in this methodology report include whether or
not ‘industry’ should include agriculture, transport associated with the movement of
goods, transport associated with employees travelling to work, or waste generation and
disposal.
Multiple data sources can be used for the compilation of the profiles. These include the
European Pollutant Release and Transfer Register (E-PRTR), Eurostat, and greenhouse
gas (GHG) and air pollutant inventories, each of which have their own data categories.
As such, it is important to have a clear understanding of how these sources and
categories relate to each other, and which categories should be included in ‘industry’.
The objective is to provide a transparent presentation of the scope of industry within the
profiles.
The E-PRTR contains the data reported annually by industrial facilities that exceed
capacity thresholds, and covers 65 economic activities within nine industrial sectors.
These data cover pollutant releases to air, water and land. This is the main data source
for the profiles, because of the detailed level of reporting, the high spatial resolution and
the fact that reporting is annual. It should be kept in mind that the data are a subset of
total industry emissions, as they cover only emissions above certain thresholds.
Data on economic activities within the European Union (EU) are grouped into categories
based on the Statistical classification of economic activities in the European Community
(NACE), and are available from Eurostat. NACE coding is hierarchical, and consists of a
first-division level with an alphabetical code, and three further levels with two-, three-
and four-digit numerical codes, respectively. The economic activities within the E-PRTR
are used to select which economic activities within NACE should be used with regard to

6 ETC/ACM Working Paper, 2016
industry. Based on these considerations, NACE divisions B, C, D and E are included in
industry. As outlined in Table 2.1, this covers mining and quarrying; manufacturing;
electricity, gas, steam and air conditioning supply; and water supply, sewerage, waste
management and remediation activities.
Table 2.1 NACE divisions
NACE division code
NACE division name
B Mining and quarrying
C Manufacturing
D Electricity, gas, steam and air conditioning supply
E Water supply, sewerage, waste management and remediation activities
National inventories of emissions to air are reported in separate national inventories for
GHGs and air pollutants. Air pollutant emissions are reported under the Convention on
Long-range Transboundary Air Pollution (CLRTAP) using Nomenclature for Reporting (NFR)
categories.
To ensure a consistent approach with regard to the activities included in ‘industry’, these
data sources have been aligned, or ‘mapped’. The mapping of industrial sectors from these
different data sources has been performed by consolidating two pre-existing mapping
tables: one created by Finnish emission experts (1) for NACE, NFR and E-PRTR; and one
of NACE and E-PRTR codes (ETC/ACM, 2011). ‘Gap filling’ has been performed using expert
judgement. The mapping table of the data sources is available on the European
(1) http://www.ceip.at/fileadmin/inhalte/emep/xls/ConversionTableReportingCodes_October2015.xlsx
Box 2.1 What is industry?
The scope of ‘industry’ spans multiple data sources and attempts to cover the same
activities as those data sources. In summary, these are the energy industry, metal
production, cement and lime production, mining and quarrying, the chemical industry,
manufacturing, the waste industry (including water and sewage management), and the
distribution of electricity, gas, steam and air conditioning.
The energy used for transport related to these industries is not included (except pipelines
for the transmission of energy). Agricultural activities are also not included, because of the
diffuse and country-specific nature of such data, which makes cross-comparisons
inappropriate.
The source codes of the data included are presented in Annex 1. In summary, these
include:
NACE divisions B, C, D and E;
NFR14 categories 1A1, 1A2 (except 1A2gvii), 1A3e, 1A4ai, 1A4bi 1A4ci, 1A5a, 1B,
2 (except 2A5b, 2D3a) and 5. E-PRTR sectors: all except 5f, 7a, 7b

Country factsheets — industrial emissions, methodology report 7
Environment Information and Observation Network (Eionet) Forum (2). The list of codes
for these reporting systems included in ‘industry’ is presented in Annex 1. A summary of
what is included in industry is given in Box 2.1. An overview of the data sources used is
provided in Table 2.2.
Data for all 33 EEA member countries (the 28 EU Member States (EU-28) together with
Iceland, Liechtenstein, Norway, Switzerland and Turkey, known collectively as the EEA-
33) are not always available from these data sources. Alternative data sources in such
instances are described in Chapter 3 ‘Gap filling’, and are listed in Table 2.2.
Exclusions
Within the initial scope of the E-PRTR sectors and NACE divisions B, C, D and E, some
sectors have been excluded from the definition of industry. These exclusions are
summarised below.
Common Reporting Format (CRF) and NFR sector 4 — ‘Agriculture’ — has been
excluded. The reasons for this exclusion are as follows: for specific substances
(especially nutrients), agricultural discharges will be high but also difficult to
quantify, and relatively difficult to compare among the countries because of local
conditions, monitoring efforts and different quantification methods.
E-PRTR sectors 7a and 7b — ‘Installations for the intensive rearing of poultry or
pigs’ and ‘Intensive aquaculture’ — have been excluded. These were excluded as
they mainly relate to the use of manure and fertilisers, and can therefore be
considered diffuse sources.
E-PRTR sector 5f — ‘Urban wastewater treatment plants’ (UWWTPs) — has been
excluded. The UWWTP sector has been excluded because of the special nature of
this activity; in this sector, the majority of treated water is urban wastewater, and
only a limited amount is industrial wastewater (as, in general, only small and
medium enterprises are connected to the sewer system). In all other EU emissions
reporting, other than the E-PRTR, UWWTPs are viewed as a separate source
category, and not as part of ‘industry’.
Table 2.2 Data sources used for these country profiles
Data source Use Reporting updates
Reference
Eurostat Economy (GVA) Annual Eurostat (2015a) Eurostat Energy consumption Annual Eurostat (2015b) Eurostat Water consumption Annual Eurostat (2015c) Eurostat Waste generation Biennial Eurostat (2015d) EEA Industry emissions to
water and air (E-PRTR) Annual EEA (2016)
EEA Emissions to air (CLRTAP) Annual EEA (2015a)
International Energy Agency (IEA)
Industry energy consumption (gap-filling data)
Annual IEA (2015)
World Bank Industry GVA (gap-filling
data)
Annual World Bank (2015a, 2015b)
(2) http://forum.eionet.europa.eu/nrc-industrial-pollution/library/consultations/2016/draft-2016-country-
profiles/methodology
8 ETC/ACM Working Paper, 2016
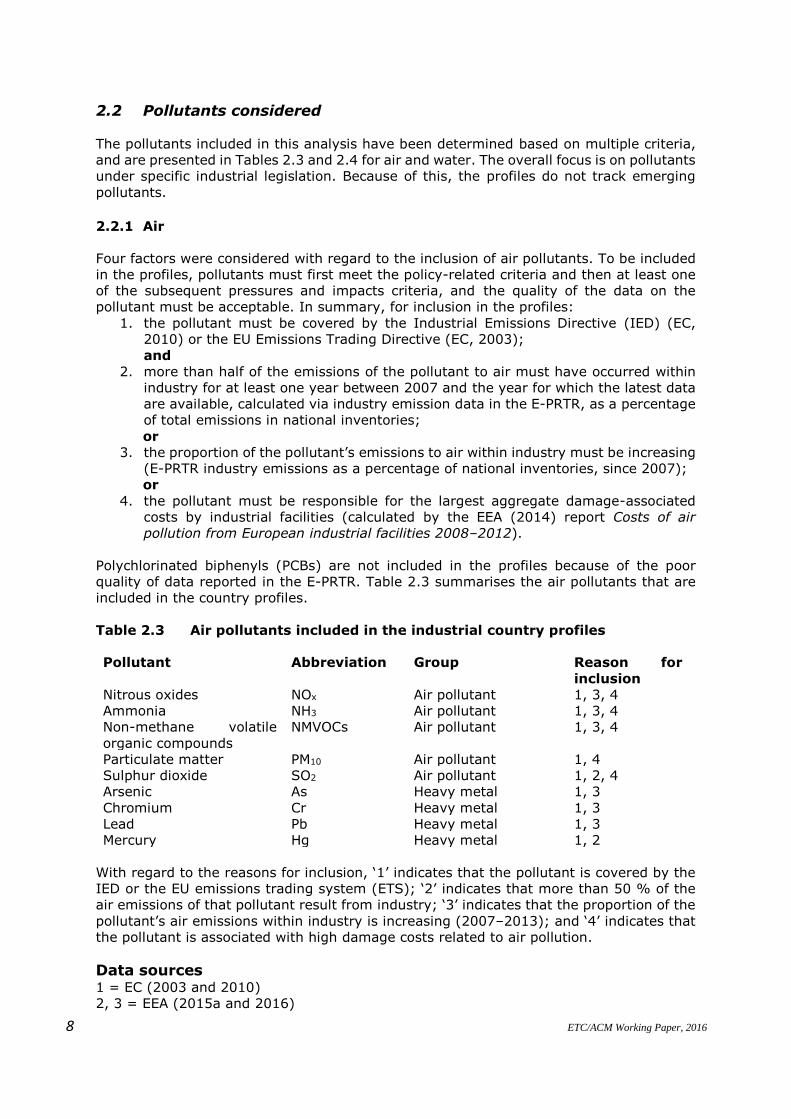
2.2 Pollutants considered
The pollutants included in this analysis have been determined based on multiple criteria,
and are presented in Tables 2.3 and 2.4 for air and water. The overall focus is on pollutants
under specific industrial legislation. Because of this, the profiles do not track emerging
pollutants.
2.2.1 Air
Four factors were considered with regard to the inclusion of air pollutants. To be included
in the profiles, pollutants must first meet the policy-related criteria and then at least one
of the subsequent pressures and impacts criteria, and the quality of the data on the
pollutant must be acceptable. In summary, for inclusion in the profiles:
1. the pollutant must be covered by the Industrial Emissions Directive (IED) (EC,
2010) or the EU Emissions Trading Directive (EC, 2003);
and
2. more than half of the emissions of the pollutant to air must have occurred within
industry for at least one year between 2007 and the year for which the latest data
are available, calculated via industry emission data in the E-PRTR, as a percentage
of total emissions in national inventories;
or
3. the proportion of the pollutant’s emissions to air within industry must be increasing
(E-PRTR industry emissions as a percentage of national inventories, since 2007);
or
4. the pollutant must be responsible for the largest aggregate damage-associated
costs by industrial facilities (calculated by the EEA (2014) report Costs of air
pollution from European industrial facilities 2008–2012).
Polychlorinated biphenyls (PCBs) are not included in the profiles because of the poor
quality of data reported in the E-PRTR. Table 2.3 summarises the air pollutants that are
included in the country profiles.
Table 2.3 Air pollutants included in the industrial country profiles
Pollutant Abbreviation Group Reason for
inclusion
Nitrous oxides NOx Air pollutant 1, 3, 4
Ammonia NH3 Air pollutant 1, 3, 4
Non-methane volatile
organic compounds
NMVOCs Air pollutant 1, 3, 4
Particulate matter PM10 Air pollutant 1, 4
Sulphur dioxide SO2 Air pollutant 1, 2, 4
Arsenic As Heavy metal 1, 3
Chromium Cr Heavy metal 1, 3
Lead Pb Heavy metal 1, 3
Mercury Hg Heavy metal 1, 2
With regard to the reasons for inclusion, ‘1’ indicates that the pollutant is covered by the
IED or the EU emissions trading system (ETS); ‘2’ indicates that more than 50 % of the
air emissions of that pollutant result from industry; ‘3’ indicates that the proportion of the
pollutant’s air emissions within industry is increasing (2007–2013); and ‘4’ indicates that
the pollutant is associated with high damage costs related to air pollution.
Data sources 1 = EC (2003 and 2010)
2, 3 = EEA (2015a and 2016)

Country factsheets — industrial emissions, methodology report 9
4 = EEA (2014)
2.2.2 Water
Four factors were considered with regard to the inclusion of water pollutants. For
inclusion in the profiles, pollutants must first meet the policy-related criteria and then at
least one of the subsequent pressures and impacts criteria, and the quality of the data
on the pollutant must be acceptable. In summary, for inclusion in the country profiles:
1. the pollutant must be covered by the IED (EC, 2010), the Water Framework
Directive (WFD) (EC, 2000) or the OSPAR (Convention for the Protection of the
Marine Environment of the North-East Atlantic) list of chemicals for priority action;
and
2. the pollutant must be highlighted as having a potentially significant impact on
health in water (determined through the toxicity, bioavailability and
bioaccumulation potential);
or
3. the pollutant must have significant eutrophication impacts on water and
ecosystems;
or
4. the substance must affect the oxygen balance of water.
The WFD’s list of priority substances covers 33 substances or groups of substances, of
which 13 are priority hazardous substances (EC, 2000). More recently, the European
Commission’s proposal (EC, 2011) for a directive amending the WFD suggests further
pollutants for consideration as priority substances. Although the E-PRTR covers these,
and other, substances, the data quality and consistency of reporting across countries is
sufficient for only a small selection of water pollutants. Pollutants outside this selection,
including polycyclic aromatic hydrocarbons (PAHs) and dioxins and furans, are not
included in the profiles because of the poor quality of the data reported in the E-PRTR.
Table 2.4 summarises the water pollutants that are included in the profiles. It must be
emphasised that this list of pollutants does not cover numerous organic pollutants,
pesticides and emerging compounds, such as pharmaceuticals and microplastics.
Table 2.4 Water pollutants included in the industrial country profiles
Pollutant Abbreviation Group Reason for
inclusion
Arsenic As Heavy metal 1, 2
Cadmium Cd Heavy metal 1, 2
Chromium Cr Heavy metal 1, 2
Copper Cu Heavy metal 1, 2
Lead Pb Heavy metal 1, 2
Mercury Hg Heavy metal 1, 2
Nickel Ni Heavy metal 1, 2
Zinc Zn Heavy metal 1, 2
Total nitrogen Tot-N Inorganic substances 1, 3
Total phosphorus Tot-P Inorganic substances 1, 3
Total organic
carbon
TOC Organic substances 1, 4
With regard to the reasons for inclusion, ‘1’ indicates that the pollutant is covered by the
IED, WFD or OSPAR; ‘2’ indicates that the pollutant has potentially significant health
impacts; ‘3’ indicates that the pollutant has significant eutrophication impacts in water;

10 ETC/ACM Working Paper, 2016
and ‘4’ indicates that the pollutant has an unfavourable influence on the oxygen balance
of water.
Data sources 1 = EC (2010); OSPAR (2014); EC (2000),
2 = WHO (2010); OSPAR (2014)
3, 4 = EC (2000)
2.2.3 Waste
Waste is defined as ‘any substance or object which the holder discards or intends or is
required to discard’ (EC, 2008). Data concerning industrial waste are grouped into three
sectors: hazardous waste, non-hazardous waste, and waste from mining and quarrying.
Mining and quarrying waste covers both hazardous and non-hazardous waste resulting
from these activities.
Hazardous waste can pose a risk to health or the environment if not managed and disposed
of correctly. The properties of waste that render it hazardous are defined in Annex III of
the Waste Directive (EC, 2008) and include, inter alia, explosive, flammable, toxic and
carcinogenic properties.
Data on waste from mining and quarrying are presented separately, because of the
different nature and large volumes of this type of waste. Mining and quarrying waste
results from the prospecting, extraction, treatment and storage of mineral resources, and
the working of quarries. This category of waste is also addressed by a separate directive
on the management of waste from extractive industries (EC, 2006).
2.2.4 Soil
Soil pollutants will be defined and included in future versions of the profiles.
3 Gap filling
The aim of the country profiles is to cover industrial pollution in all EEA-33 countries:
Austria, Belgium, Bulgaria, Croatia, Cyprus, Czech Republic, Denmark, Estonia, Finland,
France, Germany, Greece, Hungary, Iceland, Ireland, Italy, Latvia, Liechtenstein,
Lithuania, Luxembourg, Malta, Netherlands, Norway, Poland, Portugal, Romania, Slovakia,
Slovenia, Spain, Sweden, Switzerland, Turkey and the United Kingdom. However, not all
of the data sources cover all of the countries. If data are missing, a gap-filling methodology
was followed.
Final energy consumption — industry
No data were available for Switzerland, Iceland or Liechtenstein. Therefore, an alternative
data source, the International Energy Agency’s (IEA, 2015) energy balances, was used for
Switzerland and Iceland. No alternative data source was found for Liechtenstein. The scope
of industry with regard to the IEA data is the same as for the Eurostat data, except that
construction data are also included in the IEA data. Because of the low level of detail, it
was not possible to remove these construction data in order to match the scopes
completely.
For these countries, the alternative data are indicated in Figure 3 of the profiles by showing
only the allocation to ‘Industry (no detail)’ and ‘Non industry’.

Country factsheets — industrial emissions, methodology report 11
Water consumption by sector
For almost all countries, the time-series data for water consumption in industrial sectors
and total water consumption are incomplete or missing. If there were enough data, a gap-
filling methodology was followed. If data for only one or two years were provided, data
were gap-filled using the trend obtained from the time-series data for water abstraction
in the sector.
Gross value added by sector
No data at all were available for Liechtenstein, Ireland, Iceland, Croatia, Cyprus or Malta,
and data on total gross value added (GVA) alone were available for Turkey.
For those countries, for which data were absent or incomplete, an alternative data source,
the World Bank, was used. Two indicators were combined to obtain the industry GVA.
National gross domestic product (GDP) was obtained from World Bank data (2015a,
2015b) and converted into millions of euros using average annual USD to EUR exchange
rates from AMECO (2015). The second data set, industry as a percentage of national GDP,
was used to calculate industry GVA in millions of euros. Non-industry GVA was calculated
by subtracting this industry GVA from national GDP. The World Bank’s definition of industry
is the same as Eurostat’s, except that construction is also included in the World Bank’s
definition. ‘Industry total’ was the most detailed level of data available, so it was not
possible to remove these construction data in order to match the scopes completely.
For these countries, the alternative data are indicated in Figure 1 of the profiles by showing
only the allocation to ‘Industry (no detail)’ and ‘Non industry’.
For almost all countries, some data are missing for certain years for some of the NACE
activities in the Eurostat data. If the missing data relate to the end of a time-series, a
linear extrapolation calculation was performed. If the missing data relate to the middle of
a time-series, a linear interpolation calculation was performed.
E-PRTR emissions
Turkey does not report to the E-PRTR. Croatia, an EU Member State since 2013, reported
for the first time to the E-PRTR in 2016, concerning 2014 data. No data were available for
Liechtenstein.
CLRTAP emissions
Greece and Liechtenstein did not report emissions to the CLRTAP in 2015. This means that
they are not in the database, and a manual extraction per pollutant from the Centre on
Emission Inventories and Projections (CEIP) website was necessary.
4 Data quality
E-PRTR
The quality of the data reported to the E-PRTR is the responsibility of operators and
national competent authorities. However, the EEA, with the ETC/ACM, has been working
on improvements as part of an informal data review of the E-PRTR data set. While the E-
PRTR provides a highly detailed level of information on emissions, the completeness and
12 ETC/ACM Working Paper, 2016
consistency of reporting across countries varies. Improvements in the data quality would
increase the robustness of the fact sheet data.
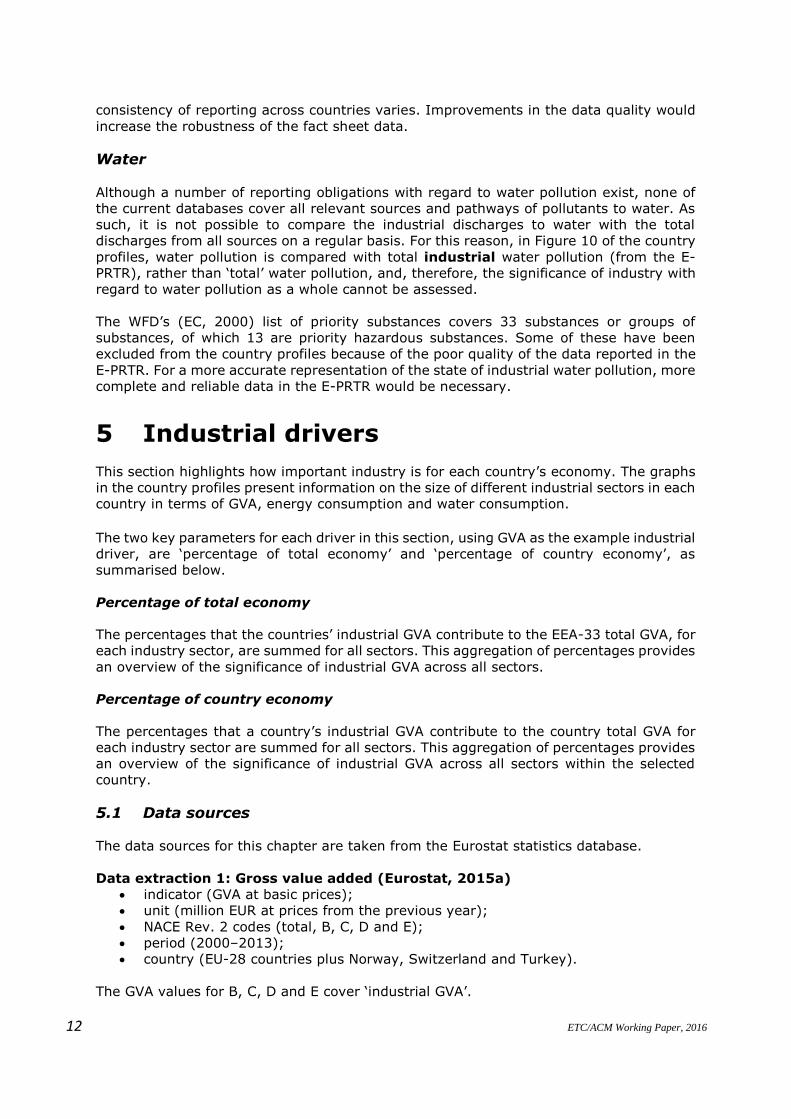
Water
Although a number of reporting obligations with regard to water pollution exist, none of
the current databases cover all relevant sources and pathways of pollutants to water. As
such, it is not possible to compare the industrial discharges to water with the total
discharges from all sources on a regular basis. For this reason, in Figure 10 of the country
profiles, water pollution is compared with total industrial water pollution (from the E-
PRTR), rather than ‘total’ water pollution, and, therefore, the significance of industry with
regard to water pollution as a whole cannot be assessed.
The WFD’s (EC, 2000) list of priority substances covers 33 substances or groups of
substances, of which 13 are priority hazardous substances. Some of these have been
excluded from the country profiles because of the poor quality of the data reported in the
E-PRTR. For a more accurate representation of the state of industrial water pollution, more
complete and reliable data in the E-PRTR would be necessary.
5 Industrial drivers
This section highlights how important industry is for each country’s economy. The graphs
in the country profiles present information on the size of different industrial sectors in each
country in terms of GVA, energy consumption and water consumption.
The two key parameters for each driver in this section, using GVA as the example industrial
driver, are ‘percentage of total economy’ and ‘percentage of country economy’, as
summarised below.
Percentage of total economy
The percentages that the countries’ industrial GVA contribute to the EEA-33 total GVA, for
each industry sector, are summed for all sectors. This aggregation of percentages provides
an overview of the significance of industrial GVA across all sectors.
Percentage of country economy
The percentages that a country’s industrial GVA contribute to the country total GVA for
each industry sector are summed for all sectors. This aggregation of percentages provides
an overview of the significance of industrial GVA across all sectors within the selected
country.
5.1 Data sources
The data sources for this chapter are taken from the Eurostat statistics database.
Data extraction 1: Gross value added (Eurostat, 2015a)
indicator (GVA at basic prices);
unit (million EUR at prices from the previous year);
NACE Rev. 2 codes (total, B, C, D and E);
period (2000–2013);
country (EU-28 countries plus Norway, Switzerland and Turkey).
The GVA values for B, C, D and E cover ‘industrial GVA’.

Country factsheets — industrial emissions, methodology report 13
The GVA values for B, C, D and E are subtracted from total GVA for each country and year
to obtain ‘Non-industry GVA’.
Total GVA covers all economic activity.
Data for Liechtenstein, Ireland, Iceland, Croatia, Cyprus, Malta and Turkey are not
available from Eurostat (2015a), so alternative data were obtained from the World Bank
(2015) and converted into millions of euros using the annual average USD to EUR
exchange rates from AMECO (2015). The second data set, industry as a percentage of
national GDP, was used to calculate industry GVA in millions of euros. Non-industry GVA
is calculated by subtracting this industry GVA from national GDP. The World Bank’s
definition of industry is the same as Eurostat’s, except that construction is also included
in the World Bank’s definition. No more detailed data are available than industry total, so
it is not possible to remove these data so that the scopes match completely. For these
countries, the alternative data are indicated in Figure 1 of the country profiles by showing
only the allocation to ‘Industry (no detail)’ and ‘Non industry’.
Data extraction 2: Final energy consumption — industry (Eurostat, 2015b)
indicator (final energy consumption; iron and steel; non-ferrous metals; chemical
and petrochemical; non-metallic minerals; mining and quarrying; food and
tobacco; textile and leather; paper, pulp and print; transport equipment;
machinery; wood and wood products; or non-specified industry);
product (all products);
unit (terajoules);
period (1990–2013);
country (EU-28 countries plus Norway and Turkey).
The industry groups (i.e. indicators) in Data extraction 2 are assigned to sectors for
aggregation, as shown in Table 5.1.
Table 5.1 Energy industry sectors
Energy group Sector
Iron and steel Metal industry
Non-ferrous metals Metal industry
Chemical and petrochemical Chemical industry
Non-metallic minerals Non-metallic minerals
Mining and quarrying Mining and quarrying
Food and tobacco Manufacturing
Textile and leather Manufacturing
Paper, pulp and print Manufacturing
Transport equipment Manufacturing
Machinery Manufacturing
Wood and wood products Manufacturing
Non-specified (industry) Other industry
Final energy consumption Total energy consumption
Data extraction 3: Water consumption (Eurostat, 2015c)
NACE (B, C, ‘D2511_D3513’ and ‘TOTAL_HH’);
‘Wat_Proc’ (Public water supply, self and other supply);
unit (million cubic metres);
period (1990–2013);
country (EU-28 countries plus Norway, Turkey, Switzerland and Iceland).

14 ETC/ACM Working Paper, 2016
5.2 Figures
Please note, the figures in this section are numbered as they would appear in the country
profiles, not according to the layout of this methodology report.
Figure 1: GVA of industry as a percentage of the EEA-33 economy, and as a
percentage of the country’s economy
Developing the figure (Data extraction 1)
Part 1
Sum the GVA by country and year for NACE divisions B, C, D and E.
Sum all ‘total’ GVA values across countries, per year, to obtain the EEA-33 total GVA.
For each country and year, subtract the sum of the ‘industry GVA’ (i.e. sum of GVA for
NACE divisions B, C, D and E) from the ‘total GVA’ to obtain ‘Non-industry GVA’.
Divide GVA for each NACE division (or non-industry GVA), country and year by the sum of
total GVA for all countries for that year. The data obtained should be presented as
described below:
present the data as a stacked bar graph for the latest year;
show the country names on the Y axis;
show the ‘percentage of total EEA-33 economy’ on the x-axis;
colour each bar on the graph by NACE division; non-industry data should be
represented in grey.
Part 2
For each country, year and category (i.e. each NACE division and all non-industry), divide
the GVA by country ‘Total’ GVA. The data obtained should be presented as described
below:
present the data as a pie chart for the latest year for the country highlighted
in the bar graph in Part 1;
the percentage of total country GVA should be shown;
colour each section of the pie chart by NACE division; non-industry data
should be shown in grey.
Figure 2: Evolution of the GVA of industry in the relevant country
Developing the figure (Data extraction 1)
Sum the industrial GVA by country, year and NACE division.
Sum the industrial GVA by country and year to obtain total industry GVA.
The data obtained should be presented as described below:
present the data as a line graph;
show GVA (million EUR) on the Y axis;
show the year on the x-axis;
colour the lines by NACE division; total industry GVA data should be shown
in black.
Figure 3: Energy consumption of industry as a percentage of EEA-33 energy
consumption, with country-specific detail
Developing the figure (Data extraction 2)
Part 1
Sum the industrial energy consumption by assigned sector, as detailed in Table 5.1, per
country and year.
Sum all ‘Total energy consumption’ across countries, per year, to obtain EEA-33 total
energy consumption.
For each country and year, subtract the sum of the industry energy consumption from the
total energy consumption to obtain ‘Non-industry energy consumption’.

Country factsheets — industrial emissions, methodology report 15
For each sector group, country and year, divide energy consumption by the total EEA-33
energy consumption for that year. The data obtained should be presented as described
below:
present the data as a stacked bar graph;
show the country names on the Y axis;
show the ‘percentage of total EEA-33 energy consumption’ on the x-axis
colour each bar on the graph by energy sector; non-industry data should be
represented in grey.
Part 2
For each country, year and energy sector (and non-industry), divide the energy
consumption by country “‘Total’ energy consumption. The data obtained should be
presented as described below:
present the data as a pie chart for the latest year for the country highlighted
in the bar graph in Part 1;
the percentage of total country energy consumption should be shown;
colour each section of the pie chart by energy sector; non-industry data
should be shown in grey.
In summary, Figure 3 should have the same overall design as Figure 1.
Figure 4: Evolution of the energy consumption of industry in the relevant country Developing the figure (Data extraction 2)
Sum the industrial energy consumption by country, year and assigned sector, as detailed
in Table 5.1. The data obtained should be presented as described below:
present the data as a line graph;
show energy consumption (petajoules) on the Y axis;
show the year on the x-axis;
colour the lines by NACE division; total country industry energy
consumption should be shown in black.
In summary, Figure 4 should have the same overall design as Figure 2.
Figure 5: Water usage by industry as a percentage of EEA-33 water usage, with
country-specific details
Developing the figure (Data extraction 3)
Part 1
Sum ‘All NACE activities plus households’ across countries, per year, to obtain EEA-33
‘total water consumption’.
For each country and year, subtract the sum of the ‘Industry water consumption’ from the
‘Total water consumption’ to obtain ‘Non-industry water consumption’.
For each NACE division, country and year, divide water consumption by the total EEA-33
water consumption for that year. The data obtained should be presented as described
below:
present the data as a stacked bar graph;
show the country names on the Y axis;
show the ‘percentage of total EEA-33 water consumption’ on the x-axis;
colour each bar on the graph by NACE division; non-industry data should be
shown in grey.
Part 2
For each country, year and category (i.e. each NACE division and all non-industry), divide
the water consumption by country ‘total’ water consumption. The data obtained should be
presented as described below:
present the data as a pie chart for the latest year for the country highlighted
in the bar graph in Part 1;
the percentage of total country water consumption;

16 ETC/ACM Working Paper, 2016
colour each section of the pie chart by NACE division; non-industry data
should be shown in grey.
In summary, Figure 5 should have the same overall design as Figure 1.
Figure 6: Evolution of industrial water usage in the relevant country
Developing the figure (Data extraction 3)
The data should be presented as described below:
present the data as a line graph;
show water consumption (million cubic metres) on the Y axis;
show the year on the x-axis;
colour the lines by NACE division; total country industry water consumption
should be shown in black.
In summary, Figure 6 should have the same overall design as Figure 2.
6 Industrial pollution
Some key parameters are used for all media to provide insights into the state of industrial
pollution in the EEA countries.
The percentage of a country’s total pollution
The emissions of a country’s industrial activities are calculated as a percentage of the total
country emissions of that pollutant from all sources.
Decoupling
The decoupling of industry emission trends from industry GVA growth can be absolute (i.e.
emissions decrease as GVA increases) or relative (i.e. emissions increase at a slower rate
than GVA). Both types of decoupling are important with regard to reducing the impact of
emissions on the environment without hindering economic development.
6.1 Air emissions
The figures in this section present industry emissions, by sector, as a percentage of total
country emissions for that pollutant; the decoupling of industrial pollution from the
economy and from energy consumption are also shown.
6.1.1 Data sources
Data extraction 1, as described in section 5.1, is used again in this section.
The data sources related to air emissions in this chapter are the EEA databases for
emissions reported to the E-PRTR (EEA, 2016) and CLRTAP (EEA, 2015a).
Trends for industry emissions to air are extracted from the E-PRTR. The EEA-33 countries’
total air emissions, and industrial emissions from the latest year, are extracted from the
CLRTAP database.
Data are taken from the E-PRTR. A query is created to link the tables [PollutantRelease],
[FacilityReport] and [FacilityID_Changes] to add the fields ‘ReportingYear’
[FacilityID_Changes] and ‘NACEMainEconomicActivity’ [FacilityReport] to the data in
[PollutantRelease], via the field ‘FacilityReportID’. This query is filtered on the medium

Country factsheets — industrial emissions, methodology report 17
‘Air’ for the air pollutants listed in Table 2.3. Only the NACE activities included in the
industry definition in the mapping document are included, and are assigned a NACE
division code, namely B, C, D or E. The final query sums these emissions by NACE division,
country, year and pollutant.
Turkey does not report data to the E-PRTR.
Extraction 4: industrial air emissions
The following data are selected from the E-PRTR database (EEA, 2016):
NACEMainActivityName (B, C, D, E);
year (2007–latest available);
pollutant name (of those listed in Table 2.3);
emissions;
unit;
medium (i.e. ‘Air’ in this case);
country (of the EU-28 countries plus Iceland, Norway, Switzerland and
Liechtenstein).
The following data on air pollutants are taken from a database containing information on
annual air pollutant emissions submitted by EEA member countries to the CLRTAP. It
covers emissions data reported since 1990 by all EEA countries. The emissions are broken
down by NFR sector, using the revised ‘NFR14’ nomenclature (3). Greece and Liechtenstein
did not report for 2013, so are not included in the EEA database. Their data are downloaded
individually from the CEIP website using the same extraction criteria as shown for
extraction 5 below.
Extraction 5: air pollutant emissions
The following data are selected from the CLRTAP database (EEA, 2015a):
country (all EEA-33 countries);
sector code (all at most detailed level available, excluding national totals, memo
items, and LULUCF);
year (latest available);
pollutant name (of those listed in Table 2.3);
emissions;
unit.
Emissions from extraction 5 are grouped into industry sectors as per the mapping
document (summarised in Table A1.2 of Annex 1 of this methodology report). Non-
industry activities are grouped together, as detailed in Table A1.3.
6.1.2 Figures
Please note, the figures in this section are numbered as they would appear in the country
profiles, not according to the layout of this methodology report.
Figure 7: Industrial air emissions as a percentage of total country pollution, by
sector origins
Developing the figure
For the latest year in each country, pollutant and sector group, divide the industry
emissions by country total industrial emissions for that pollutant (Data extraction 5). The
data obtained should be presented as described below:
(3) http://www.ceip.at/reporting_instructions

18 ETC/ACM Working Paper, 2016
present the data as a bar chart of the latest year;
show the pollutants on the Y axis;
show the percentage of total pollutant emissions on the x-axis;
colour the bars on the graph by sector; non-industry data should be
represented in grey.
Figures 8 and 9: Industrial air pollution versus economic growth in the relevant
country
Developing the figures
Sum the emissions in each NACE division by year and country to get total air industry
emissions for each country by pollutant per year (Data extraction 4).
Divide the industry emissions by 2007 emissions, for each pollutant and country, to
normalise the trends.
Divide the sum of GVA for industry sectors for each country and year (Data extraction 1)
by 2007 industry GVA . The data obtained should be presented as described below:
present the data as a line graph;
show industrial emissions, industry GVA (relative to 2007), on the Y axis;
show the year on the x-axis;
colour the lines by pollutant.
Figure 8 shows the industry GVA for the main air pollutants. Figure 9 shows the industry
GVA for heavy metals.
6.2 Emissions to water
6.2.1 Data sources
This section uses Data extractions 1 and 2, which are described in section 5.1.
Data are taken from the E-PRTR, but the NACE divisions are used rather than the E-PRTR
sectors. A query is created to link the tables [PollutantRelease], [FacilityReport], and
[FacilityID_Changes] to add the fields ‘ReportingYear’ [FacilityID_Changes] and
‘NACEMainEconomicActivity’ [FacilityReport] to the data in [PollutantRelease], via the field
‘FacilityReportID’. This query is filtered on the medium ‘Water’ for the water pollutants
listed in Table 2.4. Only the NACE activities included in the industry definition in the
mapping document are included, and assigned a NACE division code, namely B, C, D or E.
The final query sums these emissions by NACE division, year and pollutant.
Turkey does not report data to the E-PRTR.
Extraction 6: Industrial water emissions
The following data are selected from the E-PRTR database (EEA, 2016):
NACEMainActivityName (B, C, D, E);
year (2007–latest available);
pollutant name (of those listed in Table 2.4);
emissions;
unit;
medium (i.e. ‘Water’ in this case);
country (of the EU-28 countries plus Iceland, Norway, Switzerland and
Liechtenstein).
Aggregation by toxicity
In Figure 11, heavy metal emissions to water are aggregated by toxicity. The aggregation
of heavy metals is based on the absolute sums of pollutants released (in kg), weighted by
factors corresponding to the reciprocal predicted no effect concentration (PNEC) values

Country factsheets — industrial emissions, methodology report 19
(i.e. 1/PNEC) for each pollutant and made equivalent to one of the metals; in this case,
mercury (Hg) was chosen. If the aggregation of heavy metals is made equivalent to
another metal, the diagram would look the same but the scaling on the ordinate axis would
be different. This weighting was made in order to reflect the differences in the
environmental impact of the heavy metals. The PNECs used are presented in Table 6.1.
Table 6.1 Heavy metal PNECs
Heavy metal PNEC (μg/l)
As 0.6
Cd 0.2
Cr 0.6
Cu 2.6
Hg 0.05
Ni 8.6
Pb 1.3
Zn 3.4
Source: OSPAR, 2014.
The total metal equivalent (Hg) released per country, per year, can be calculated as
follows:
Total metal equivalent (Hg) release (per country, per year) = (LAs (PNEC Hg/PNEC
As)) + (LCd × (PNEC Hg/PNEC Cd)) + (LCr × (PNEC Hg/PNEC Cr)) + (LCu × (PNEC Hg/PNEC
Cu)) + (LHg × (PNEC Hg/PNEC Hg)) + (LNi × (PNEC Hg/PNEC Ni)) + (LPb × (PNEC Hg/PNEC
Pb)) + (LZn (PNEC Hg/PNEC Zn))
Based on the values in Table 6.1, the total metal equivalent (Hg) released per country,
per year, would be as follows:
Total metal equivalent (Hg) release (per country, per
year) = (LAs × (0.05/0.6)) + (LCd × (0.05/0.2)) + (LCr × (0.05/0.6)) + (LCu × (0.05/2.6))
+ LHg + (LNi × (0.05/8.6)) + (LPb × (0.05/1.3)) + (LZn × (0.05/3.4))
In these equations, LCd, for example, refers to Cd emissions to water per country and per
year.
6.2.2 Figures
Please note, the figures in this section are numbered as they would appear in the country
profiles, not according to the layout of this methodology report.
Figure 10: Industrial water releases as a percentage of country E-PRTR industrial
pollution, by sector origins
Developing the figure
For the latest year in each country, pollutant and NACE activity, divide the industry
emissions by country total industrial emissions for that pollutant (Data extraction 6). The
data obtained should be presented as described below:
present the data as a bar chart of the latest year;
show the pollutants on the Y axis;
show the percentage of total pollutant emissions on the x-axis;
colour the bars on the graph by sector; non-industry data should be
represented in grey
Figures 11 and 12: Industrial water pollution (E-PRTR) versus economic growth

20 ETC/ACM Working Paper, 2016
Developing the figure
Sum the emissions in each NACE division by year and country to get total water industry
emissions for each country by pollutant per year (Data extraction 6).
Aggregate heavy metal emissions by toxicity, as described in section 6.2.1.
Divide the industry emissions by 2007 emissions, for each pollutant (heavy metals
aggregated) and country, to normalise the trends.
Divide the sum of GVA for industry sectors for each country and year (Data extraction 1)
by 2007 industry GVA. The data obtained should be presented as described below:
present the data as a line graph;
show industrial emissions, industry GVA (relative to 2007), on the Y axis;
show the year on the x-axis;
colour the lines by pollutant.
Figure 11 shows the industry GVA for the main pollutants and aggregated heavy metals
(Hg equivalent). Figure 12 shows the industry GVA for heavy metals (kg).
6.3 Waste
6.3.1 Data sources
This section uses Data extraction 1, which is described in section 5.1.
Data are retrieved from the Eurostat statistics database.
Extraction 7: Generation of waste (env_wasgt) (Eurostat, 2015d)
waste type (total);
NACE Rev. 2 codes (B; C; D; E; ‘all NACE activities including households’);
time (all);
unit (tonnes);
hazard (Hazardous waste; Non-hazardous waste).
Data are summed by NACE divisions B, C, D and E.
6.3.2 Figures
Please note, the figures in this section are numbered as they would appear in the country
profiles, not according to the layout of this methodology report.
Figures 13–15: Industrial waste as a percentage of total EEA waste, with waste
intensity and percentage of country-specific waste generation
Part 1. Developing the figure
Sum the industrial waste by NACE, country and year, for each hazard type (Data extraction
7).
Sum total waste for all countries by year, for each hazard type (Data extraction 7).
Subtract the sum of industry waste for each country and year from total waste in each
country and year, for each hazard type, to obtain non-industry waste by country, hazard
type and year.
Divide waste by the total EEA-33 waste generation for each year.
The NACE division percentages are stacked within each country, and countries are ordered
on the graph according to the sum of the percentages. The data obtained should be
presented as described below:
present the data as a stacked bar graph for the latest year available;
show the country names on the Y axis;
show the ‘percentage of total EEA-33 waste generation’ on the x-axis;
colour by sector (grouped by type, non-industry is grey).

Country factsheets — industrial emissions, methodology report 21
In the mirror Y axis, add industrial waste intensity, calculated as described below.
Part 2. Developing the figure
For each country and year, sum the GVA of each industrial sector to obtain total industry
GVA (Data extraction 1).
For each country, hazard type and year, sum the waste generated (in tonnes) (Data
extraction 7).
For each country, hazard type and year, divide the first calculation by the second to obtain
the intensity of industrial waste, that is, the relationship between the industrial economy
and waste generation. The data obtained should be presented as follows:
present the data as a bar chart;
show the country names (ordered by total contribution to EEA waste
generation) on the Y axis;
show industry waste intensity on the x-axis.
Part 3. Developing the figure
For each country, year, hazard type and category (NACE divisions and non-industry),
divide the waste generation by total country waste generation to obtain the percentage of
country-specific waste generation. The data obtained should be presented as follows:
present the data as a pie chart;
the size of each section should represent the percentage of waste from each
NACE division in the specific country;
colour each section of the pie chart by NACE division.
Figure 13 shows ‘Non-hazardous waste’ (NACE divisions C, D and E) data, Figure 14 shows
‘Hazardous waste’ (NACE divisions C, D and E) data; and Figure 15 shows ‘Mining and
quarrying’ (NACE division B) data.
Figure 16: Decoupling of industrial waste
Divide the industry waste generation by 2004 waste for each NACE division, hazard type
and country, to normalise the trends (Data extraction 7).
Divide the sum of GVA for industry sectors (Data extraction 1) by industry GVA in 2004
for each country and year. The data obtained should be presented as described below:
present the data as a line graph;
show industrial waste generation and industry GVA (relative to 2004) on the
Y axis;
show the year on the x-axis;
colour the lines by NACE division.
Figure 16 shows ‘Non-hazardous waste’ data and Figure 17 shows ‘Hazardous waste’ data.
6.4 Soil
Industry is a major contributor to soil contamination in Europe. There is a lack of good-
quality and comparable quantifiable soil data for countries within the EEA-33, which limits
the analysis of soil pollution trends (EEA, 2015b). The inclusion of soil pollution data will
be developed in future versions of the country profiles.

22 ETC/ACM Working Paper, 2016
References
AMECO, 2015, ‘Annual macro-economic database: Monetary variables — exchange rate
and purchasing power parities interest rates’
(http://ec.europa.eu/economy_finance/db_indicators/ameco/zipped_en.htm) accessed
10 October 2015.
EC, 2000, Directive 2000/60/EC of 23 October 2000 establishing a framework for
Community action in the field of water policy (http://eur-lex.europa.eu/legal-
content/EN/TXT/?uri=celex:32000L0060) accessed 19 August 2015.
EC, 2003, Directive 2003/87/EC of the European Parliament and of the Council of 13
October 2003 establishing a scheme for greenhouse gas emission allowance trading
within the Community and amending Council Directive 96/61/EC (http://eur-
lex.europa.eu/legal-content/EN/TXT/?uri=celex:32003L0087) accessed 6 August 2015.
EC, 2006, Directive 2006/21/EC of the European Parliament and of the Council of 15
March 2006 on the management of waste from extractive industries and amending
Directive 2004/35/EC — Statement by the European Parliament, the Council and the
Commission (http://eur-lex.europa.eu/legal-content/EN/TXT/?uri=CELEX:32006L0021)
accessed 7 August 2015.
EC, 2008, Directive 2008/98/EC of the European Parliament and of the Council of 19
November 2008 on waste and repealing certain directives (http://eur-
lex.europa.eu/LexUriServ/LexUriServ.do?uri=OJ:L:2008:312:0003:0030:en:PDF)
accessed 7 August 2015.
EC, 2010, Directive 2010/75/EU of the European Parliament and of the Council of 24
November 2010 on industrial emissions (integrated pollution prevention and control)
(http://eur-
lex.europa.eu/LexUriServ/LexUriServ.do?uri=OJ:L:2010:334:0017:0119:en:PDF)
accessed 7 August 2015.
EC, 2011, Proposal for a directive of the European Parliament and of the Council
amending Directives 2000/60/EC and 2008/105/EC as regards priority substances in the
field of water policy (COM/2011/0876 final - 2011/0429 (COD)) (http://eur-
lex.europa.eu/legal-content/EN/TXT/?uri=CELEX:52011PC0876) accessed 14 August
2015.
EEA, 2014, Costs of air pollution from European industrial facilities 2008–2012. EEA
Technical report No 20/2014, European Environment Agency
(http://www.eea.europa.eu/publications/costs-of-air-pollution-2008–2012) accessed 5
August 2015.
EEA, 2015a, National emissions reported to the Convention on Long-range
Transboundary Air Pollution (LRTAP Convention), European Environment Agency
(http://www.eea.europa.eu/data-and-
maps/data/ds_resolveuid/4e4e71b79c584e45989949d87864a70a) accessed 14
November 2015.
EEA, 2015b, The European environment: state and outlook 2015, European Environment
Agency (http://www.eea.europa.eu/soer) accessed 31 July 2015.
EEA, 2016, ‘The European Pollutant Release and Transfer Register (E-PRTR), Member
States reporting under Article 7 of Regulation (EC) No 166/2006’, European Environment

Country factsheets — industrial emissions, methodology report 23
Agency (http://www.eea.europa.eu/data-and-maps/data/member-states-reporting-art-
7-under-the-european-pollutant-release-and-transfer-register-e-prtr-regulation-12)
accessed 27 June 2016.
Eurostat, 2015a, ‘National Accounts by 64 branches - volumes’ (http://goo.gl/m1I0S8)
accessed 24 November 2015.
Eurostat, 2015b, ‘Complete energy balances - annual data’ (http://goo.gl/ckqIRF)
accessed 24 November 2015.
Eurostat, 2015c, ‘Water use by supply category and economical sector’
(http://goo.gl/0o8Ixu) accessed 24 November 2015.
Eurostat, 2015d, ‘Generation of waste’ (http://goo.gl/o1nJxl) accessed 24 November
2015.
ETC/ACM, 2011, Annex E: Correlation of the Eurostat and E‐PRTR economic activities’
classification (http://acm.eionet.europa.eu/docs/ETCACM_TP_2011_6_Annex_E_E-
PRTR2011.pdf) accessed 3 August 2015.
IEA, 2015, Sankey, ‘Final energy consumption’ (http://www.iea.org/Sankey/index.html)
accessed 10 September 2015.
OSPAR, 2014, Establishment of a list of Predicted No Effect Concentrations (PNECs) for
naturally occurring substances in produced water (OSPAR Agreement 2014–05), OSPAR
Commission
(https://www.gov.uk/government/uploads/system/uploads/attachment_data/file/36147
6/OSPAR_RBA_Predicted_No_Effect_Concentrations__PNECs__Background_Document.p
df) accessed 7 August 2015.
WHO, 2010, Exposure to dioxins and dioxin-like substances: a major public health
concern, World Health Organization
(http://www.who.int/ipcs/features/dioxins.pdf?ua=1) accessed 31 July 2015.
World Bank, 2015a, ‘Industry, value added (% of GDP)’, ( http://goo.gl/k23F3g)
accessed 10 September 2015.
World Bank, 2015b, ‘GDP at market prices (current US$)’, (http://goo.gl/Bme8GU)
accessed 10 September 2015.

24 ETC/ACM Working Paper, 2016
Units, abbreviations and acronyms
As Arsenic
Cd Cadmium
CLRTAP Convention on Long-range Transboundary Air Pollution
Cr Chromium
Cu Copper
EEA European Environment Agency
EEA-33 The 33 European Environment Agency member countries (the 28
European Union Member States together with Iceland, Liechtenstein,
Norway, Switzerland and Turkey)
Eionet European Environment Information Network
E-PRTR European Pollutant Release and Transfer Register
ETC/ACM European Topic Centre for Air Pollution and Climate Change Mitigation
EU European Union
EU-28 The 28 European Union Member States
GDP Gross domestic product
GHG Greenhouse gas
GVA Gross value added
Hg Mercury
IEA International Energy Agency
IED Industrial Emissions Directive
NACE Statistical classification of economic activities in the European
Community
NFR Nomenclature for Reporting
Ni Nickel
NMVOC Non-methane volatile organic compound
NO2 Nitrogen dioxide
NOx Nitrogen oxides
Pb Lead
PNEC Predicted no effect concentration
SO2 Sulfur dioxide
SOx Sulfur oxides
TOC Total organic carbon
Tot-N Total nitrogen
Ton-P Total phosphorous
UWWTP Urban wastewater treatment plant
WFD Water Framework Directive
Zn Zinc

Country factsheets — industrial emissions, methodology report 25
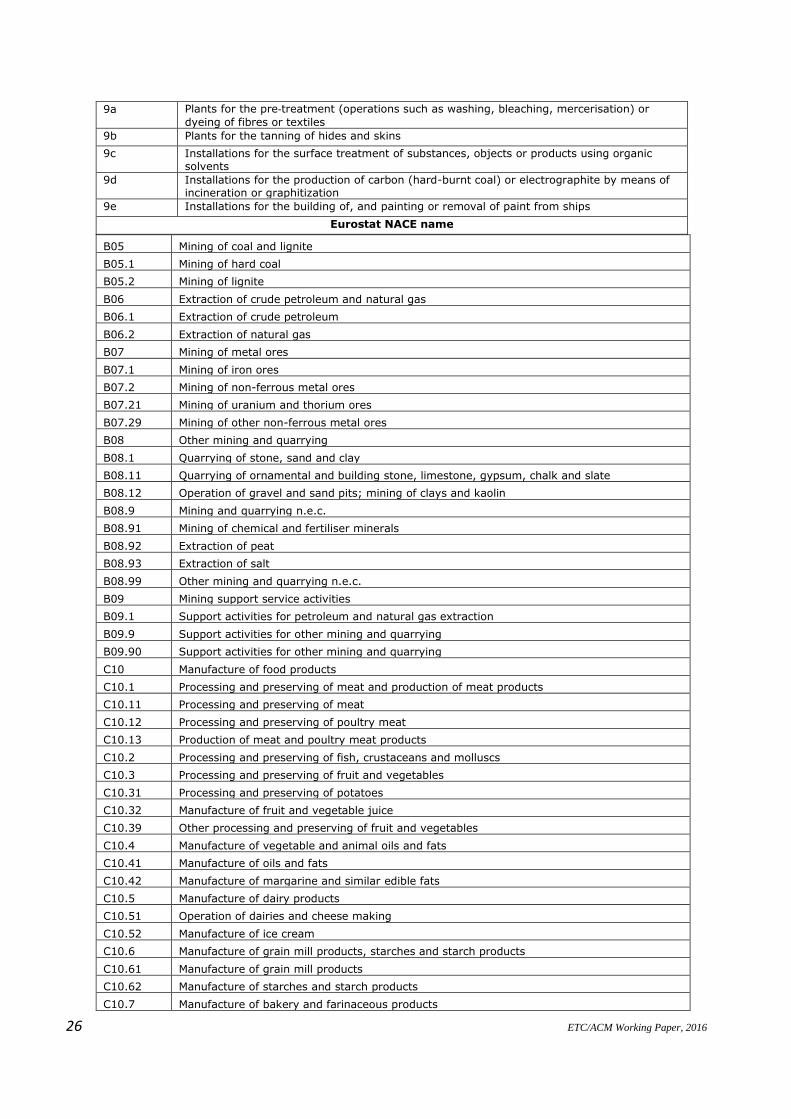
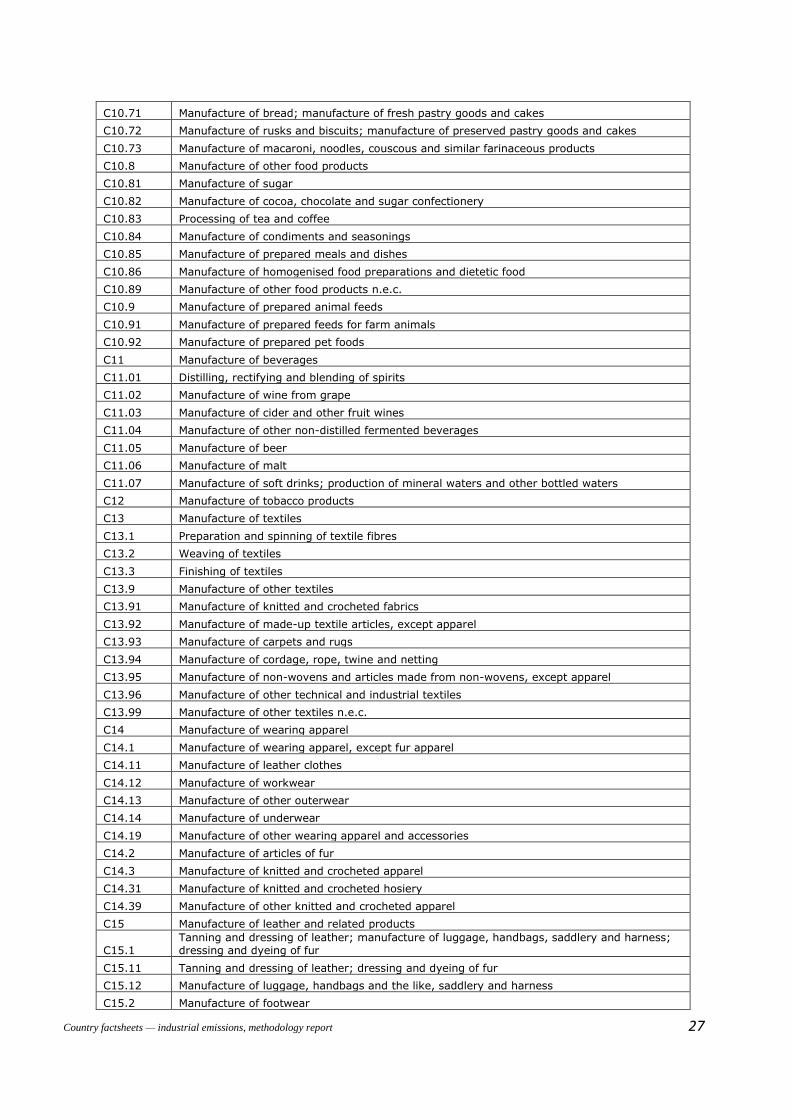
Annex 1 Scope of industry across datasets
Table A1.1 presents the list of codes used to extract data from Eurostat (NACE codes),
the E-PRTR and the CLRTAP (NFR codes). The NACE codes listed are all of those beneath
divisions B, C, D and E. There are different levels of activity, for example B05.1 is a
subset of B05, but no double counting occurs as each facility reports only one NACE
code.
Table A1.1 Industry codes
E-PRTR codes
1a Mineral oil and gas refineries
1b Installations for gasification and liquefaction
1c Thermal power stations and other combustion installations (>50 MW)
1d Coke ovens
1e Coal rolling mills
1f Installations for the manufacture of coal products and solid smokeless fuel
2a Metal ore roasting or sintering installations
2b Installations for the production of pig iron or steel (primary or secondary melting) including continuous casting
2c Installations for the processing of ferrous metals
2d Ferrous metal foundries
2e Installations for non-ferrous metals
2f Installations for surface treatment of metals and plastic materials using an electrolytic or chemical process
3a Underground mining and related operations
3b Opencast mining and quarrying
3c Installations for the production of cement clinker and lime in rotary kilns
3d Installations for the production of asbestos and the manufacture of asbestos-based products
3e Installations for the manufacture of glass, incl. Glass fibre
3f Installations for melting mineral substances, incl. The production of mineral fibres
3g Installations for the manufacture of ceramic products by firing
4a Chemical installations for the production on an industrial scale of basic organic chemicals
4b Chemical installations for the production on an industrial scale of basic inorganic chemicals
4c Chemical installations for the production on an industrial scale of fertilisers
4d Installations using a chemical or biological process for the production on an industrial scale
of basic plant health products and of biocides
4e Installations using a chemical or biological process for the production on an industrial scale of basic pharmaceutical products
4f Installations for the production on an industrial scale of explosives and pyrotechnic products
5a Installations for the disposal or recovery of hazardous waste
5b Installations for the incineration of non-hazardous waste
5c Installations for the disposal of non-hazardous waste
5d Landfills
5e Installations for the disposal or recycling of animal carcasses and animal waste
5g Independently operated industrial wastewater treatment plants
6a Industrial plants for the production of pulp from timber or similar fibrous materials
6b Industrial plants for the production of paper and board and other primary wood products
6c Industrial plants for the preservation of wood and wood products with chemicals
8a Slaughterhouses
8b Treatment and processing intended for the production of food and beverage products from
animal raw materials other than milk; from vegetable raw materials
8c Treatment and processing of milk
26 ETC/ACM Working Paper, 2016
9a Plants for the pre‐treatment (operations such as washing, bleaching, mercerisation) or
dyeing of fibres or textiles
9b Plants for the tanning of hides and skins
9c Installations for the surface treatment of substances, objects or products using organic solvents
9d Installations for the production of carbon (hard-burnt coal) or electrographite by means of incineration or graphitization
9e Installations for the building of, and painting or removal of paint from ships
Eurostat NACE name
B05 Mining of coal and lignite
B05.1 Mining of hard coal
B05.2 Mining of lignite
B06 Extraction of crude petroleum and natural gas
B06.1 Extraction of crude petroleum
B06.2 Extraction of natural gas
B07 Mining of metal ores
B07.1 Mining of iron ores
B07.2 Mining of non-ferrous metal ores
B07.21 Mining of uranium and thorium ores
B07.29 Mining of other non-ferrous metal ores
B08 Other mining and quarrying
B08.1 Quarrying of stone, sand and clay
B08.11 Quarrying of ornamental and building stone, limestone, gypsum, chalk and slate
B08.12 Operation of gravel and sand pits; mining of clays and kaolin
B08.9 Mining and quarrying n.e.c.
B08.91 Mining of chemical and fertiliser minerals
B08.92 Extraction of peat
B08.93 Extraction of salt
B08.99 Other mining and quarrying n.e.c.
B09 Mining support service activities
B09.1 Support activities for petroleum and natural gas extraction
B09.9 Support activities for other mining and quarrying
B09.90 Support activities for other mining and quarrying
C10 Manufacture of food products
C10.1 Processing and preserving of meat and production of meat products
C10.11 Processing and preserving of meat
C10.12 Processing and preserving of poultry meat
C10.13 Production of meat and poultry meat products
C10.2 Processing and preserving of fish, crustaceans and molluscs
C10.3 Processing and preserving of fruit and vegetables
C10.31 Processing and preserving of potatoes
C10.32 Manufacture of fruit and vegetable juice
C10.39 Other processing and preserving of fruit and vegetables
C10.4 Manufacture of vegetable and animal oils and fats
C10.41 Manufacture of oils and fats
C10.42 Manufacture of margarine and similar edible fats
C10.5 Manufacture of dairy products
C10.51 Operation of dairies and cheese making
C10.52 Manufacture of ice cream
C10.6 Manufacture of grain mill products, starches and starch products
C10.61 Manufacture of grain mill products
C10.62 Manufacture of starches and starch products
C10.7 Manufacture of bakery and farinaceous products
Country factsheets — industrial emissions, methodology report 27
C10.71 Manufacture of bread; manufacture of fresh pastry goods and cakes
C10.72 Manufacture of rusks and biscuits; manufacture of preserved pastry goods and cakes
C10.73 Manufacture of macaroni, noodles, couscous and similar farinaceous products
C10.8 Manufacture of other food products
C10.81 Manufacture of sugar
C10.82 Manufacture of cocoa, chocolate and sugar confectionery
C10.83 Processing of tea and coffee
C10.84 Manufacture of condiments and seasonings
C10.85 Manufacture of prepared meals and dishes
C10.86 Manufacture of homogenised food preparations and dietetic food
C10.89 Manufacture of other food products n.e.c.
C10.9 Manufacture of prepared animal feeds
C10.91 Manufacture of prepared feeds for farm animals
C10.92 Manufacture of prepared pet foods
C11 Manufacture of beverages
C11.01 Distilling, rectifying and blending of spirits
C11.02 Manufacture of wine from grape
C11.03 Manufacture of cider and other fruit wines
C11.04 Manufacture of other non-distilled fermented beverages
C11.05 Manufacture of beer
C11.06 Manufacture of malt
C11.07 Manufacture of soft drinks; production of mineral waters and other bottled waters
C12 Manufacture of tobacco products
C13 Manufacture of textiles
C13.1 Preparation and spinning of textile fibres
C13.2 Weaving of textiles
C13.3 Finishing of textiles
C13.9 Manufacture of other textiles
C13.91 Manufacture of knitted and crocheted fabrics
C13.92 Manufacture of made-up textile articles, except apparel
C13.93 Manufacture of carpets and rugs
C13.94 Manufacture of cordage, rope, twine and netting
C13.95 Manufacture of non-wovens and articles made from non-wovens, except apparel
C13.96 Manufacture of other technical and industrial textiles
C13.99 Manufacture of other textiles n.e.c.
C14 Manufacture of wearing apparel
C14.1 Manufacture of wearing apparel, except fur apparel
C14.11 Manufacture of leather clothes
C14.12 Manufacture of workwear
C14.13 Manufacture of other outerwear
C14.14 Manufacture of underwear
C14.19 Manufacture of other wearing apparel and accessories
C14.2 Manufacture of articles of fur
C14.3 Manufacture of knitted and crocheted apparel
C14.31 Manufacture of knitted and crocheted hosiery
C14.39 Manufacture of other knitted and crocheted apparel
C15 Manufacture of leather and related products
C15.1 Tanning and dressing of leather; manufacture of luggage, handbags, saddlery and harness; dressing and dyeing of fur
C15.11 Tanning and dressing of leather; dressing and dyeing of fur
C15.12 Manufacture of luggage, handbags and the like, saddlery and harness
C15.2 Manufacture of footwear

28 ETC/ACM Working Paper, 2016
C16 Manufacture of wood and of products of wood and cork, except furniture; manufacture of articles of straw and plaiting materials
C16.1 Sawmilling and planing of wood
C16.2 Manufacture of products of wood, cork, straw and plaiting materials
C16.21 Manufacture of veneer sheets and wood-based panels
C16.22 Manufacture of assembled parquet floors
C16.23 Manufacture of other builders’ carpentry and joinery
C16.24 Manufacture of wooden containers
C16.29 Manufacture of other products of wood; manufacture of articles of cork, straw and plaiting materials
C17 Manufacture of paper and paper products
C17.1 Manufacture of pulp, paper and paperboard
C17.11 Manufacture of pulp
C17.12 Manufacture of paper and paperboard
C17.2 Manufacture of articles of paper and paperboard
C17.21 Manufacture of corrugated paper and paperboard and of containers of paper and paperboard
C17.22 Manufacture of household and sanitary goods and of toilet requisites
C17.23 Manufacture of paper stationery
C17.24 Manufacture of wallpaper
C17.29 Manufacture of other articles of paper and paperboard
C18 Printing and reproduction of recorded media
C18.1 Printing and service activities related to printing
C18.11 Printing of newspapers
C18.12 Other printing
C18.13 Pre-press and pre-media services
C18.14 Binding and related services
C18.2 Reproduction of recorded media
C19 Manufacture of coke and refined petroleum products
C19.1 Manufacture of coke oven products
C19.2 Manufacture of refined petroleum products
C20 Manufacture of chemicals and chemical products
C20.1 Manufacture of basic chemicals, fertilisers and nitrogen compounds, plastics and synthetic rubber in primary forms
C20.11 Manufacture of industrial gases
C20.12 Manufacture of dyes and pigments
C20.13 Manufacture of other inorganic basic chemicals
C20.14 Manufacture of other organic basic chemicals
C20.15 Manufacture of fertilisers and nitrogen compounds
C20.16 Manufacture of plastics in primary forms
C20.17 Manufacture of synthetic rubber in primary forms
C20.2 Manufacture of pesticides and other agrochemical products
C20.3 Manufacture of paints, varnishes and similar coatings, printing ink and mastics
C20.4 Manufacture of soap and detergents, cleaning and polishing preparations, perfumes and toilet preparations
C20.41 Manufacture of soap and detergents, cleaning and polishing preparations
C20.42 Manufacture of perfumes and toilet preparations
C20.5 Manufacture of other chemical products
C20.51 Manufacture of explosives
C20.52 Manufacture of glues
C20.53 Manufacture of essential oils
C20.59 Manufacture of other chemical products n.e.c.
C20.6 Manufacture of man-made fibres
C21 Manufacture of basic pharmaceutical products and pharmaceutical preparations

Country factsheets — industrial emissions, methodology report 29
C21.1 Manufacture of basic pharmaceutical products
C21.2 Manufacture of pharmaceutical preparations
C22 Manufacture of rubber and plastic products
C22.1 Manufacture of rubber products
C22.11 Manufacture of rubber tyres and tubes; retreading and rebuilding of rubber tyres
C22.19 Manufacture of other rubber products
C22.2 Manufacture of plastic products
C22.21 Manufacture of plastic plates, sheets, tubes and profiles
C22.22 Manufacture of plastic packing goods
C22.23 Manufacture of builders’ ware of plastic
C22.29 Manufacture of other plastic products
C23 Manufacture of other non-metallic mineral products
C23.1 Manufacture of glass and glass products
C23.11 Manufacture of flat glass
C23.12 Shaping and processing of flat glass
C23.13 Manufacture of hollow glass
C23.14 Manufacture of glass fibres
C23.19 Manufacture and processing of other glass, including technical glassware
C23.2 Manufacture of refractory products
C23.3 Manufacture of clay building materials
C23.31 Manufacture of ceramic tiles and flags
C23.32 Manufacture of bricks, tiles and construction products, in baked clay
C23.4 Manufacture of other porcelain and ceramic products
C23.41 Manufacture of ceramic household and ornamental articles
C23.42 Manufacture of ceramic sanitary fixtures
C23.43 Manufacture of ceramic insulators and insulating fittings
C23.44 Manufacture of other technical ceramic products
C23.49 Manufacture of other ceramic products
C23.5 Manufacture of cement, lime and plaster
C23.51 Manufacture of cement
C23.52 Manufacture of lime and plaster
C23.6 Manufacture of articles of concrete, cement and plaster
C23.61 Manufacture of concrete products for construction purposes
C23.62 Manufacture of plaster products for construction purposes
C23.63 Manufacture of ready-mixed concrete
C23.64 Manufacture of mortars
C23.65 Manufacture of fibre cement
C23.69 Manufacture of other articles of concrete, plaster and cement
C23.7 Cutting, shaping and finishing of stone
C23.9 Manufacture of abrasive products and non-metallic mineral products n.e.c.
C23.91 Production of abrasive products
C23.99 Manufacture of other non-metallic mineral products n.e.c.
C24 Manufacture of basic metals
C24.1 Manufacture of basic iron and steel and of ferro-alloys
C24.2 Manufacture of tubes, pipes, hollow profiles and related fittings, of steel
C24.3 Manufacture of other products of first processing of steel
C24.31 Cold drawing of bars
C24.32 Cold rolling of narrow strip
C24.33 Cold forming or folding
C24.34 Cold drawing of wire
C24.4 Manufacture of basic precious and other non-ferrous metals

30 ETC/ACM Working Paper, 2016
C24.41 Precious metals production
C24.42 Aluminium production
C24.43 Lead, zinc and tin production
C24.44 Copper production
C24.45 Other non-ferrous metal production
C24.46 Processing of nuclear fuel
C24.5 Casting of metals
C24.51 Casting of iron
C24.52 Casting of steel
C24.53 Casting of light metals
C24.54 Casting of other non-ferrous metals
C25 Manufacture of fabricated metal products, except machinery and equipment
C25.1 Manufacture of structural metal products
C25.11 Manufacture of metal structures and parts of structures
C25.12 Manufacture of doors and windows of metal
C25.2 Manufacture of tanks, reservoirs and containers of metal
C25.21 Manufacture of central heating radiators and boilers
C25.29 Manufacture of other tanks, reservoirs and containers of metal
C25.3 Manufacture of steam generators, except central heating hot water boilers
C25.4 Manufacture of weapons and ammunition
C25.5 Forging, pressing, stamping and roll-forming of metal; powder metallurgy
C25.6 Treatment and coating of metals; machining
C25.61 Treatment and coating of metals
C25.62 Machining
C25.7 Manufacture of cutlery, tools and general hardware
C25.71 Manufacture of cutlery
C25.72 Manufacture of locks and hinges
C25.73 Manufacture of tools
C25.9 Manufacture of other fabricated metal products
C25.91 Manufacture of steel drums and similar containers
C25.92 Manufacture of light metal packaging
C25.93 Manufacture of wire products, chain and springs
C25.94 Manufacture of fasteners and screw machine products
C25.99 Manufacture of other fabricated metal products n.e.c.
C26 Manufacture of computer, electronic and optical products
C26.1 Manufacture of electronic components and boards
C26.11 Manufacture of electronic components
C26.12 Manufacture of loaded electronic boards
C26.2 Manufacture of computers and peripheral equipment
C26.3 Manufacture of communication equipment
C26.4 Manufacture of consumer electronics
C26.5 Manufacture of instruments and appliances for measuring, testing and navigation; watches and clocks
C26.51 Manufacture of instruments and appliances for measuring, testing and navigation
C26.52 Manufacture of watches and clocks
C26.6 Manufacture of irradiation, electromedical and electrotherapeutic equipment
C26.7 Manufacture of optical instruments and photographic equipment
C26.8 Manufacture of magnetic and optical media
C27 Manufacture of electrical equipment
C27.1 Manufacture of electric motors, generators, transformers and electricity distribution and control apparatus
C27.11 Manufacture of electric motors, generators and transformers

Country factsheets — industrial emissions, methodology report 31
C27.12 Manufacture of electricity distribution and control apparatus
C27.2 Manufacture of batteries and accumulators
C27.3 Manufacture of wiring and wiring devices
C27.31 Manufacture of fibre optic cables
C27.32 Manufacture of other electronic and electric wires and cables
C27.33 Manufacture of wiring devices
C27.4 Manufacture of electric lighting equipment
C27.5 Manufacture of domestic appliances
C27.51 Manufacture of electric domestic appliances
C27.52 Manufacture of non-electric domestic appliances
C27.9 Manufacture of other electrical equipment
C28 Manufacture of machinery and equipment n.e.c.
C28.1 Manufacture of general-purpose machinery
C28.11 Manufacture of engines and turbines, except aircraft, vehicle and cycle engines
C28.12 Manufacture of fluid power equipment
C28.13 Manufacture of other pumps and compressors
C28.14 Manufacture of other taps and valves
C28.15 Manufacture of bearings, gears, gearing and driving elements
C28.2 Manufacture of other general-purpose machinery
C28.21 Manufacture of ovens, furnaces and furnace burners
C28.22 Manufacture of lifting and handling equipment
C28.23 Manufacture of office machinery and equipment (except computers and peripheral equipment)
C28.24 Manufacture of power-driven hand tools
C28.25 Manufacture of non-domestic cooling and ventilation equipment
C28.29 Manufacture of other general-purpose machinery n.e.c.
C28.3 Manufacture of agricultural and forestry machinery
C28.4 Manufacture of metal forming machinery and machine tools
C28.41 Manufacture of metal forming machinery
C28.49 Manufacture of other machine tools
C28.9 Manufacture of other special-purpose machinery
C28.91 Manufacture of machinery for metallurgy
C28.92 Manufacture of machinery for mining, quarrying and construction
C28.93 Manufacture of machinery for food, beverage and tobacco processing
C28.94 Manufacture of machinery for textile, apparel and leather production
C28.95 Manufacture of machinery for paper and paperboard production
C28.96 Manufacture of plastics and rubber machinery
C28.99 Manufacture of other special-purpose machinery n.e.c.
C29 Manufacture of motor vehicles, trailers and semi-trailers
C29.1 Manufacture of motor vehicles
C29.2 Manufacture of bodies (coachwork) for motor vehicles; manufacture of trailers and semi-trailers
C29.3 Manufacture of parts and accessories for motor vehicles
C29.31 Manufacture of electrical and electronic equipment for motor vehicles
C29.32 Manufacture of other parts and accessories for motor vehicles
C30 Manufacture of other transport equipment
C30.1 Building of ships and boats
C30.11 Building of ships and floating structures
C30.12 Building of pleasure and sporting boats
C30.2 Manufacture of railway locomotives and rolling stock
C30.3 Manufacture of air and spacecraft and related machinery
C30.4 Manufacture of military fighting vehicles

32 ETC/ACM Working Paper, 2016
C30.9 Manufacture of transport equipment n.e.c.
C30.91 Manufacture of motorcycles
C30.92 Manufacture of bicycles and invalid carriages
C30.99 Manufacture of other transport equipment n.e.c.
C31 Manufacture of furniture
C31.01 Manufacture of office and shop furniture
C31.02 Manufacture of kitchen furniture
C31.03 Manufacture of mattresses
C31.09 Manufacture of other furniture
C32 Other manufacturing
C32.1 Manufacture of jewellery, bijouterie and related articles
C32.11 Striking of coins
C32.12 Manufacture of jewellery and related articles
C32.13 Manufacture of imitation jewellery and related articles
C32.2 Manufacture of musical instruments
C32.3 Manufacture of sports goods
C32.4 Manufacture of games and toys
C32.5 Manufacture of medical and dental instruments and supplies
C32.9 Manufacturing n.e.c.
C32.91 Manufacture of brooms and brushes
C32.99 Other manufacturing n.e.c.
C33 Repair and installation of machinery and equipment
C33.1 Repair of fabricated metal products, machinery and equipment
C33.11 Repair of fabricated metal products
C33.12 Repair of machinery
C33.13 Repair of electronic and optical equipment
C33.14 Repair of electrical equipment
C33.15 Repair and maintenance of ships and boats
C33.16 Repair and maintenance of aircraft and spacecraft
C33.17 Repair and maintenance of other transport equipment
C33.19 Repair of other equipment
C33.2 Installation of industrial machinery and equipment
D35.1 Electric power generation, transmission and distribution
D35.11 Production of electricity
D35.12 Transmission of electricity
D35.13 Distribution of electricity
D35.14 Trade of electricity
D35.2 Manufacture of gas; distribution of gaseous fuels through mains
D35.21 Manufacture of gas
D35.22 Distribution of gaseous fuels through mains
D35.23 Trade of gas through mains
D35.3 Steam and air conditioning supply
E36 Water collection, treatment and supply
E37 Sewerage
E38 Waste collection, treatment and disposal activities; materials recovery
E38.1 Waste collection
E38.11 Collection of non-hazardous waste
E38.12 Collection of hazardous waste
E38.2 Waste treatment and disposal
E38.21 Treatment and disposal of non-hazardous waste
E38.22 Treatment and disposal of hazardous waste

Country factsheets — industrial emissions, methodology report 33
E38.3 Materials recovery
E38.31 Dismantling of wrecks
E38.32 Recovery of sorted materials
E39 Remediation activities and other waste management services
NFR14
1 A 1 a Public electricity and heat production
1 A 1 b Petroleum refining
1 A 1 c Manufacture of solid fuels and other energy industries
1 A 2 a Stationary combustion in manufacturing industries and construction: Iron and steel
1 A 2 b Stationary combustion in manufacturing industries and construction: Non-ferrous metals
1 A 2 c Stationary combustion in manufacturing industries and construction: Chemicals
1 A 2 d Stationary combustion in manufacturing industries and construction: Pulp, Paper and Print
1 A 2 e Stationary combustion in manufacturing industries and construction: Food processing, beverages and tobacco
1 A 2 f Stationary combustion in manufacturing industries and construction: Non-metallic minerals
1 A 2 g viii Stationary combustion in manufacturing industries and construction: Other (Please specify in your IIR)
1 A 3 e i Pipeline transport
1 A 3 e ii Other (please specify)
1 A 4 a i Commercial/institutional: Stationary
1 A 4 b i Residential: Stationary
1 A 4 c i Agriculture/Forestry/Fishing: Stationary
1 A 5 a Other stationary (including military)
1 B 1 a Fugitive emission from solid fuels: Coal mining and handling
1 B 1 b Fugitive emission from solid fuels: Solid fuel transformation
1 B 1 c Other fugitive emissions from solid fuels
1 B 2 a i Fugitive emissions oil: Exploration, production, transport
1 B 2 a iv Fugitive emissions oil: Refining/storage
1 B 2 a v Distribution of oil products
1 B 2 b Natural gas (exploration, production, processing, transmission, storage, distribution and other)
1 B 2 c Venting and flaring (oil, gas, combined)
1 B 2 d Other fugitive emissions from energy production
2 A 1 Cement production
2 A 2 Lime production
2 A 3 Glass production
2 A 5 a Quarrying and mining of minerals other than coal
2 A 5 c Storage, handling and transport of mineral products
2 A 6 Other Mineral products (Please specify the sources included/excluded in the notes column to the right)
2 B 1 Ammonia production
2 B 10 a Chemical industry: Other (Please specify in the IIR)
2 B 10 b Storage, handling and transport of chemical products (Please specify in the IIR)
2 B 2 Nitric acid production
2 B 3 Adipic acid production
2 B 5 Carbide production
2 B 6 Titanium dioxide production
2 B 7 Soda ash production
2 C 1 Iron and steel production
2 C 2 Ferroalloys production
2 C 3 Aluminium production
2 C 4 Magnesium Production
2 C 5 Lead production

34 ETC/ACM Working Paper, 2016
2 C 6 Zinc production
2 C 7 a Copper production
2 C 7 b Nickel production
2 C 7 c Other metal production (Please specify the sources included/excluded in the notes column to the right)
2 C 7 d Storage, handling and transport of metal products (Please specify the sources included/excluded in the notes column to the right)
2 D 3 b Road paving with asphalt
2 D 3 c Asphalt roofing
2 D 3 d Coating application
2 D 3 e Degreasing
2 D 3 f Dry cleaning
2 D 3 g Chemical products
2 D 3 i Other solvent use
2 D 3 h Printing
2 G Other product use
2 H 1 Pulp and paper industry
2 H 2 Food and beverages industry
2 I Wood processing
2 J Production of POPs
2 K Consumption of POPs and heavy metals (e.g. electrical and scientific equipment)
2 L Other production, consumption, storage, transportation or handling of bulk products (Please specify the sources included/excluded in the notes column to the right)
5 A Biological treatment of waste - Solid waste disposal on land
5 B 1 Biological treatment of waste - Composting
5 B 2 Biological treatment of waste - Anaerobic digestion at biogas facilities
5 C 1 a Municipal waste incineration
5 C 1 b i Industrial waste incineration
5 C 1 b ii Hazardous waste incineration
5 C 1 b iii Clinical waste incineration
5 C 1 b iv Sewage sludge incineration
5 C 1 b v Cremation
5 C 1 b vi Other Waste incineration (Please specify in the IIR)
5 C 2 Open Burning of Waste
5 D 2 Industrial wastewater handling
5 D 3 Other wastewater handling
5 E Other waste handling (Please specify in IIR)
Table A1.2 presents the list of codes used in each grouping of air emissions data from
the CLRTAP (EEA, 2015a).
Table A1.2 Industry groupings — CLRTAP
Group NFR14 (emissions to air, CLRTAP)
Cement and lime production 1A2f
Cement and lime production 2A1
Cement and lime production 2A2
Cement and lime production 2A6
Chemical industry 2A5c
Chemical industry 2B1
Chemical industry 2B10a
Chemical industry 2B10b

Country factsheets — industrial emissions, methodology report 35
Chemical industry 2B2
Chemical industry 2B3
Chemical industry 2B5
Chemical industry 2B6
Chemical industry 2D3g
Chemical industry 2D3i
Chemical industry 2J
Energy Industry 1A1a
Energy Industry 1A1b
Energy Industry 1A1c
Energy Industry 1A2c
Energy Industry 1A2d
Energy Industry 1A2e
Energy Industry 1A3ei
Energy Industry 1A3eii
Energy Industry 1A4ai
Energy Industry 1A4bi
Energy Industry 1A4ci
Energy Industry 1A5a
Energy Industry 1B1b
Energy Industry 1B2aiv
Energy Industry 1B2av
Energy Industry 1B2b
Energy Industry 1B2c
Food and Drink 2H2
Iron & Steel Manufacturing 1A2a
Iron & Steel Manufacturing 2C1
Iron & Steel Manufacturing 2C7c
Iron & Steel Manufacturing 2C7d
Mining and Quarrying 1B1a
Mining and Quarrying 1B1c
Mining and Quarrying 1B2ai
Mining and Quarrying 1B2d
Mining and Quarrying 2A5a
Non-ferrous metal production 1A2b
Non-ferrous metal production 2C2
Non-ferrous metal production 2C3
Non-ferrous metal production 2C4
Non-ferrous metal production 2C5
Non-ferrous metal production 2C6
Non-ferrous metal production 2C7a
Non-ferrous metal production 2C7b
Other manufacturing 1A2gviii
Other manufacturing 2A3
Other manufacturing 2B7
Other manufacturing 2D3b
Other manufacturing 2D3c
Other manufacturing 2D3d
Other manufacturing 2D3e

36 ETC/ACM Working Paper, 2016
Other manufacturing 2D3f
Other manufacturing 2D3h
Other manufacturing 2G
Other manufacturing 2K
Other manufacturing 2L
Pulp paper and wood production 2H1
Pulp paper and wood production 2I
Waste industry 5A
Waste industry 5B1
Waste industry 5B2
Waste industry 5C1a
Waste industry 5C1bi
Waste industry 5C1bii
Waste industry 5C1biii
Waste industry 5C1biv
Waste industry 5C1bv
Waste industry 5C1bvi
Waste industry 5C2
Waste industry 5D2
Waste industry 5D3
Waste industry 5E
Table A1.3 presents the list of codes included in emissions to air data for ‘Non-industry’
from the CLRTAP (EEA, 2015a).
Table A1.3 Non-industry groupings — CLRTAP
NFR14 Non-industry sector name
1A2gvii Mobile Combustion in manufacturing industries and construction
1A3ai(i) International aviation LTO (civil)
1A3aii(i) Domestic aviation LTO (civil)
1A3bi Road transport: Passenger cars
1A3bii Road transport: Light duty vehicles
1A3biv Road transport: Mopeds & motorcycles
1A3bv Road transport: Gasoline evaporation
1A3bvi Road transport: Automobile tyre and brake wear
1A3bvii Road transport: Automobile road abrasion
1A3c Railways
1A3di(ii) International inland waterways
1A3dii National navigation (shipping)
1A4aii Commercial/institutional: Mobile
1A4bii Residential: Household and gardening (mobile)
1A4cii Agriculture/Forestry/Fishing: Off-road vehicles and other machinery
1A4ciii Agriculture/Forestry/Fishing: National fishing
2A5b Construction and demolition
2D3a Domestic solvent use including fungicides
3B1a Manure management - Dairy cattle
3B1b Manure management - Non-dairy cattle
3B2 Manure management - Sheep
3B3 Manure management - Swine

Country factsheets — industrial emissions, methodology report 37
3B4a Manure management - Buffalo
3B4d Manure management - Goats
3B4e Manure management - Horses
3B4f Manure management - Mules and asses
3B4h Manure management - Other animals
3Da1 Inorganic N-fertilizers (includes also urea application)
3Da2a Animal manure applied to soils
3Da2c Other organic fertilisers applied to soils (including compost)
3Dc Farm-level agricultural operations including storage, handling and transport of agricultural products
3Dd Off-farm storage, handling and transport of bulk agricultural products
3F Field burning of agricultural residues
3I Agriculture other
6A Other (included in national total for entire territory)
Table A1.4 presents the list of energy consumption sectors from Eurostat (2015b) and
the groups they are aggregated to.
Table A1.4 Industry groupings — energy consumption
Energy consumption sector Eurostat Code
Group
Final Energy Consumption B_101700 Total Energy Consumption
Final Energy Consumption — Industry B_101800 Total Industry
Iron and Steel B_101805 Metal Industry
Non-Ferrous Metals B_101810 Metal Industry
Chemical and Petrochemical B_101815 Chemical Industry
Non-Metallic Minerals B_101820 Non-Metallic Minerals
Mining and Quarrying B_101825 Mining and Quarrying
Food and Tobacco B_101830 Manufacturing
Textile and Leather B_101835 Manufacturing
Paper, Pulp and Print B_101840 Manufacturing
Transport Equipment B_101846 Manufacturing
Machinery B_101847 Manufacturing
Wood and Wood Products B_101851 Manufacturing
Non-specified (Industry) B_101853 Other Industry
Table A1.5 presents the list of GVA activities and their NACE code from Eurostat (2015a)
and the NACE divisions they are aggregated to.
Table A1.5 Industry groupings — GVA
GVA NACE activity NACE code
NACE division
code NACE division name
Total — All NACE activities TOTAL Total economy
Total economy
Mining and quarrying B B Mining & Quarrying
Manufacture of food products; beverages and tobacco products
C10–C12 C Manufacturing
Manufacture of textiles, wearing apparel, leather and related products
C13–C15 C Manufacturing
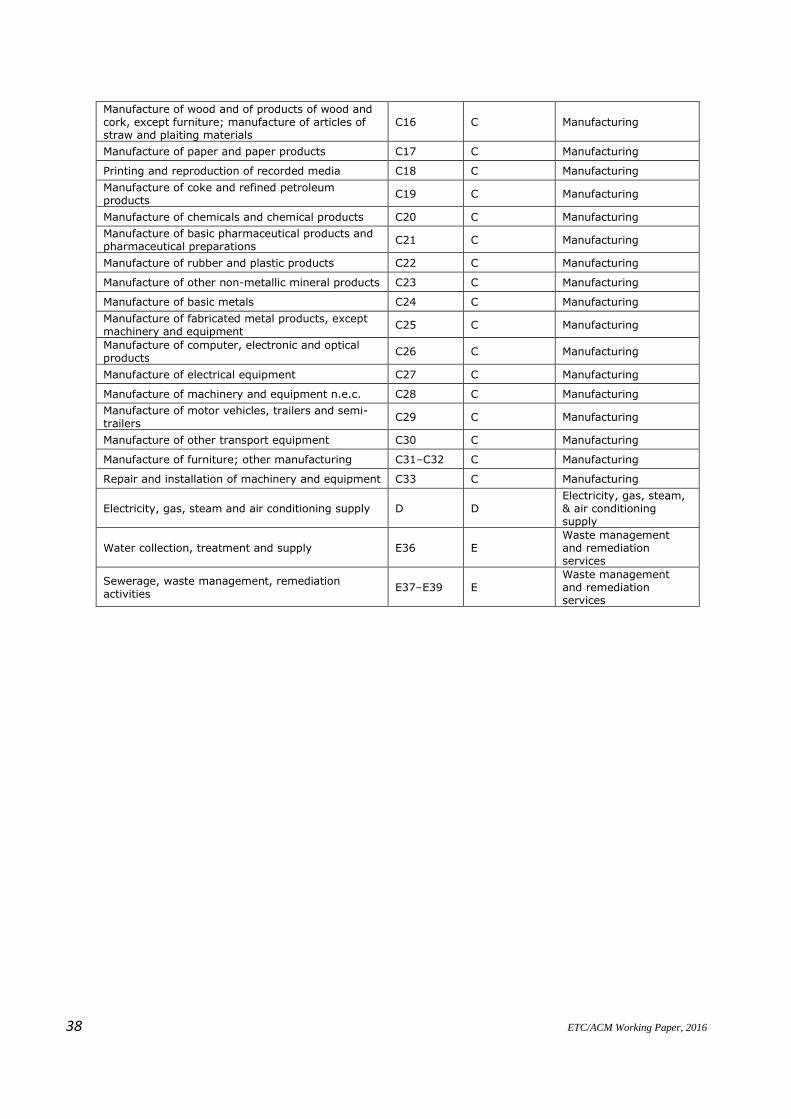
38 ETC/ACM Working Paper, 2016
Manufacture of wood and of products of wood and cork, except furniture; manufacture of articles of straw and plaiting materials
C16 C Manufacturing
Manufacture of paper and paper products C17 C Manufacturing
Printing and reproduction of recorded media C18 C Manufacturing
Manufacture of coke and refined petroleum products
C19 C Manufacturing
Manufacture of chemicals and chemical products C20 C Manufacturing
Manufacture of basic pharmaceutical products and pharmaceutical preparations
C21 C Manufacturing
Manufacture of rubber and plastic products C22 C Manufacturing
Manufacture of other non-metallic mineral products C23 C Manufacturing
Manufacture of basic metals C24 C Manufacturing
Manufacture of fabricated metal products, except machinery and equipment
C25 C Manufacturing
Manufacture of computer, electronic and optical products
C26 C Manufacturing
Manufacture of electrical equipment C27 C Manufacturing
Manufacture of machinery and equipment n.e.c. C28 C Manufacturing
Manufacture of motor vehicles, trailers and semi-trailers
C29 C Manufacturing
Manufacture of other transport equipment C30 C Manufacturing
Manufacture of furniture; other manufacturing C31–C32 C Manufacturing
Repair and installation of machinery and equipment C33 C Manufacturing
Electricity, gas, steam and air conditioning supply D D Electricity, gas, steam, & air conditioning supply
Water collection, treatment and supply E36 E Waste management and remediation services
Sewerage, waste management, remediation activities
E37–E39 E Waste management and remediation services
Country factsheets — industrial emissions, methodology report 39
Annex 2 Feedback received from countries on this methodology
The elaboration of industrial pollution country profiles using a harmonised method at European
level is a challenge. Industry is subject to several pieces of legislation that simultaneously
tackle different dimensions of environmental pressures. These country profiles aim to provide
a Europe-wide standardised information product based on several data sources that are found
in various data streams, use various classification mechanisms and cover non-identical scopes.
This methodology explains how these divergences in data sources have been tackled in order
to provide an accurate snapshot of industry that benefits from the information available from
the data sources. It also takes into account the fact that data are not always available across
Europe and, therefore, alternatives have to be applied if possible.
At the beginning of 2016, Eionet was asked to review both the methodology report and the
country profiles for each country. Comments from 19 countries and from the European
Commission were received. While generally endorsing the product, some countries expressed
their concerns about the effect of the diverse nature of the data sources on the outcome.
This annex describes the way in which the products address such issues and the further
improvement options that are planned for future implementation.
Definition of the scope of ‘industry’
Countries expressed their concerns about the understanding of ‘industry’ as a sector, since there
is no particular definition used by the various data streams. These country profiles deliberately
establish a broad definition of the sector, which is mapped across the different classifications.
To improve the readability of this concept, the country profiles’ introductions contain a more
thorough explanation of this, and, during the preparation of this methodology report, many
contributions from countries were taken into account in order to improve its content.
However, it is clear that these country profiles are designed to provide a broad interpretation
of what the industrial sector comprises, and other interpretations are also valid.
Comments on the mapping with regard to the mechanism of the NACE classification
In these country profiles, activities are mapped across the various classifications (a detailed
explanation of this is provided in Chapter 2 of this methodology report). The mapping defined
in this methodology report uses individual CLRTAP NFR categories, E-PRTR Regulation
activities and NACE classes, and assumes that they all relate to the same reality, namely
‘industry’.
Countries commented on the use of NACE codes with regard to how they are assigned in the
data sets in which they are used or reported (i.e. the E-PRTR and all Eurostat’s data streams).
While the NFR codes used in the data reported to the CLRTAP identify the exact nature of the
emission-releasing activity, the NACE codes are assigned on the basis of the business activity
of an organisation. Potentially, this could mean that some installations are classified with two
non-equivalent codes in one data stream (CLRTAP) and others use the NACE codes (E-PRTR
and Eurostat in the case of the country profiles).

40 ETC/ACM Working Paper, 2016
The differences due to different categorisation systems are acknowledged, as inherent
uncertainties were inevitably introduced. However, it is considered that the benefits obtained
by linking these two systems do outweigh the negative aspects.
Data quality issues
Various countries highlighted specific cases of data quality issues and, where possible,
provided reasoning with regard to the origin of such issues and possible solutions. These
country profiles use the data reported by countries to the various official bodies (Eurostat, the
EEA, and the EMEP centre) and only minor gap filling was implemented. The data were not
quality assured (e.g. by removing outliers) during the elaboration of the country profiles, as
this is part of official data collection mechanisms.
Countries also highlighted the fact that the European data were, in some cases, not in line with
national data sets. After a thorough verification of all comments received, for all cases in which
an error was identified, the country profiles were updated. If the graphs and tables reflected the
data actually reported by countries through the various data collection mechanisms, no change
was implemented. Because certain countries provided caveats with regard to specific graphs
and tables, the EEA included specific disclaimer notes for those graphs affected by such
potential errors.
The EEA encourages countries to make use of the re-submission mechanisms of the different
reporting obligations in order to further improve data quality.
Water statistics
Certain countries were concerned about (1) the robustness of Eurostat data on water use and
(2) the categories that these country profiles considered relevant in the context of industry. The
EEA encourages countries to use the mechanisms established in order to improve the data on
water that Eurostat holds.
With regard to the second issue related to water statistics, namely the specific uses considered
relevant to industry in this methodology report, a thorough revision of the comments received
led to a revision of the method. Several countries wished to include the category ‘self and other
supply’, as these data are also relevant to industry. The EEA took this comment on board and
this has led to a clearer picture as regards water use by industry.
Conceptual suggestions
Some countries provided several suggestions regarding the general concept of the country
profiles. They expressed, among other things, a wish to have a less standardised set of graphs
and a deeper assessment of what the figures actually mean in terms of environmental pressures.
This would mean introducing tailored text and country-specific information in the product. The
EEA will consider these possibilities in the future.
A general wish to further clarify the ‘scope’ of industry was expressed by various countries.
Alternatives for sector breakdowns, data visualisation and data assurance/gap filling were
provided. All of these aspects will be considered for future revisions of the country profiles.
The EEA acknowledges the comments received from countries and the European Commission;
these comments have led to improvements in the country profiles.


![Profiles of Drug Substances, Excipients and Related Methodology] Profiles of Drug Substances, Excipients, and Related Methodolo.pdf](https://img.pdfslide.us/doc/110x75/577c84771a28abe054b90f09/profiles-of-drug-substances-excipients-and-related-methodology-profiles-of.jpg)