Embed Size (px)
Citation preview

COUNTRY PRACTICE IN ENERGY STATISTICS
Topic/Statistics: Electricity and natural gas consumption of households
Institution/Organization: Statistics Austria Country: Austria Date: 29 March 2012
2
CONTENTS
Abstract .................................................................................................................................................. 3
1. General information......................................................................................................................... 4 1.1. Name of the statistics/topic ........................................................................................................ 4 1.2. History and purpose.................................................................................................................... 4 1.3. Reference period......................................................................................................................... 4 1.4. Frequency ................................................................................................................................... 4 1.5. Dissemination ............................................................................................................................. 4 1.6. Regional level............................................................................................................................. 4 1.7. Main users .................................................................................................................................. 5 1.8. Responsible authority ................................................................................................................. 5 1.9. Legal basis and legally binding commitments ........................................................................... 5 1.10. Resource requirements ..................................................................................................... 5 1.11. International reporting...................................................................................................... 5
2. Statistical concepts, methodology, variables and classifications .................................................. 6 2.1. Scope 6 2.2. Definitions of main concepts and variables................................................................................ 6 2.3. Measurement units...................................................................................................................... 6 2.4. Classification scheme ................................................................................................................. 6 2.5. Data sources ............................................................................................................................... 6 2.6. Population................................................................................................................................... 6 2.7. Sampling frame and sample characteristics................................................................................ 7 2.8. Collection method ...................................................................................................................... 7 2.9. Survey participation/response rate.............................................................................................. 7
3. The statistical production process .................................................................................................. 8 3.1. Data capture and storage ............................................................................................................ 8 3.2. Data editing ................................................................................................................................ 8 3.3. Imputation .................................................................................................................................. 8 3.4. Grossing up procedures .............................................................................................................. 8 3.5. Analytical methods..................................................................................................................... 9
4. Dissemination.................................................................................................................................. 10 4.1. Publications and additional documentation.............................................................................. 10 4.2. Revisions .................................................................................................................................. 11 4.3. Microdata.................................................................................................................................. 11 4.4. Confidentiality.......................................................................................................................... 11
5. Quality............................................................................................................................................. 11 5.1. Relevance ................................................................................................................................. 11 5.2. Accuracy................................................................................................................................... 12 5.3. Timeliness and punctuality....................................................................................................... 16 5.4. Accessibility ............................................................................................................................. 16 5.5. Comparability ........................................................................................................................... 16 5.6. Coherence and consistency....................................................................................................... 16
6. Future plans.................................................................................................................................... 17
Annexes ................................................................................................................................................ 18
3
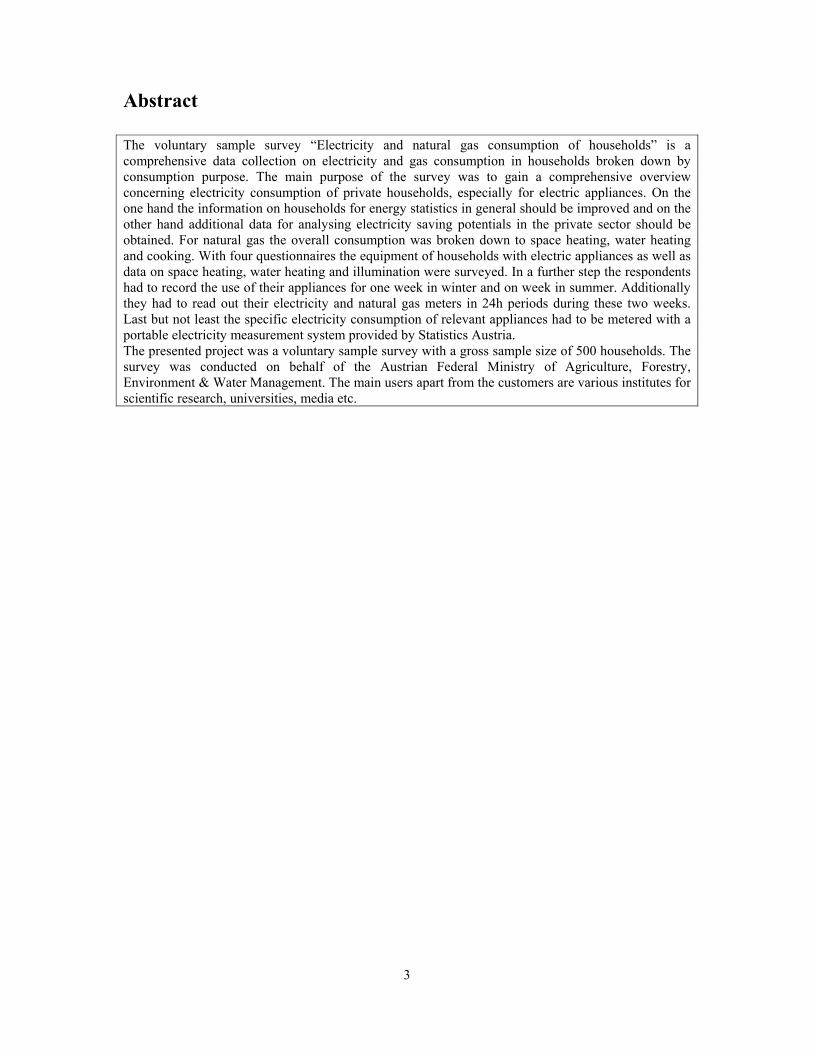
Abstract The voluntary sample survey “Electricity and natural gas consumption of households” is a comprehensive data collection on electricity and gas consumption in households broken down by consumption purpose. The main purpose of the survey was to gain a comprehensive overview concerning electricity consumption of private households, especially for electric appliances. On the one hand the information on households for energy statistics in general should be improved and on the other hand additional data for analysing electricity saving potentials in the private sector should be obtained. For natural gas the overall consumption was broken down to space heating, water heating and cooking. With four questionnaires the equipment of households with electric appliances as well as data on space heating, water heating and illumination were surveyed. In a further step the respondents had to record the use of their appliances for one week in winter and on week in summer. Additionally they had to read out their electricity and natural gas meters in 24h periods during these two weeks. Last but not least the specific electricity consumption of relevant appliances had to be metered with a portable electricity measurement system provided by Statistics Austria. The presented project was a voluntary sample survey with a gross sample size of 500 households. The survey was conducted on behalf of the Austrian Federal Ministry of Agriculture, Forestry, Environment & Water Management. The main users apart from the customers are various institutes for scientific research, universities, media etc.

4
1. General information
1.1. Name of the statistics/topic Energy consumption of households
1.2. History and purpose State when the statistics were first published. The statistics were first published in 2009. Describe briefly the main purpose of producing the statistics and why it is relevant. The survey offers a comprehensive data collection concerning electricity and natural gas consumption in households the first time. The main focus of the survey as well as of the report is electricity. Initials were the increasing electricity consumption on the one hand and the directive 2006/32 EC on energy efficiency and energy services on the other hand. Electricity consumption for water heating and space heating is well documented since 1977. Therefore core interest of this survey focused on the consumption of electric appliances and for illumination where no information was available. With this survey the database was significantly improved. Detailed information not only on the equipment of households with such appliances but also on the user behaviour was collected. Based on this information the consumption patterns for cooking, laundry washing or entertainment electronics could be calculated. For all households connected to the natural gas grid data on natural gas consumption for space and water heating as well as for cooking were surveyed additionally. The data give an exact picture of electricity consumption in households by purpose. As a follow up, the database enables the recognition of electricity saving potentials regarding appliances used and changes in user behaviour.
1.3. Reference period 2008
1.4. Frequency In 2008 the survey was conducted the first time and for 2011/12 a follow up survey is fixed. Further surveys depend on respective contracts.
1.5. Dissemination The statistics are published as printed and online publications. Web address: http://www.statistik.at/web_en/statistics/energy_environment/energy/energy_consumption_of_households/index.html
1.6. Regional level NUTS 1-regions
5
1.7. Main users - Federal Ministry of Agriculture, Forestry, Environment and Water Management - http://www.e-control.at/en/home_en - http://www.umweltbundesamt.at/en/ (Austrian Environment Agency) - Austrian Institute of Economic Research - Eurostat - Various institutes for scientific research, universities, media etc.
1.8. Responsible authority Statistics Austria, Directorate of Spatial Statistics, Energy and Environment division
1.9. Legal basis and legally binding commitments Bundesgesetz über die Bundesstatistik (Federal Statistics Act 2000) in the current version. If the data collection is not based on a legal basis, give a short description of other agreements or volunteer arrangements. Private contracts with the Federal Ministry of Agriculture, Forestry, Environment and Water Management and E-Control Ltd. If applicable, give reference to national and international commitments that are legally binding (e.g. EU statistical legal acts). None
1.10. Resource requirements Specify how the production of the statistics is financed (e.g. over the ordinary budget, project based support, financial support from other institutions or organization). If applicable, state the contracting entity (e.g.: Ministry, EU Commission, OECD). A contracting entity is any entity which is ordering a survey or the compilation of a statistics, and paying for it Project based support by the Federal Ministry of Agriculture, Forestry, Environment and Water Management and E-Control Ltd. Specify the resource requirements for producing the statistics (e.g. man-labour days, number of workers involved in the statistical production process of the statistics/topic in question). 510 working hours; 4 workers involved
1.11. International reporting None
6
2. Statistical concepts, methodology, variables and classifications
2.1. Scope The statistics cover the consumption of electricity and natural gas in private households.
2.2. Definitions of main concepts and variables Describe the main concepts (e.g.: territory principle, resident principle, net calorific value, gross calorific value). Resident principle Describe the main variables (e.g. how are the different energy products defined in the statistics? How are production, intermediate consumption, final consumption, transformation, feed stock, the energy sector, etc. defined?). 1. Electricity and if relevant natural gas consumption and the related expenditures based on the last annual statement (2007) 2. Number and type of appliances including data on age, power and power rating 3. Number and power of lamps broken down by type and rooms 4. Electricity and natural gas consumption by 24h periods within one week in summer and one week in winter 5. The use of relevant appliances by 24h periods (consumption behaviour) within one week in summer and one week in winter differentiated by type e.g. in minutes (taking a shower), hours (watching TV) or number of uses (dish washer) 6. Stand by consumption for relevant appliances 7. The use of illumination by 24h periods (consumption behaviour) within one week in summer and one week in winter 8. Device specific electricity consumption of relevant (big) appliances metered with a portable electricity measurement system provided by Statistics Austria
2.3. Measurement units Physical and monetary units
2.4. Classification scheme Not relevant
2.5. Data sources Household survey
2.6. Population Describe the entire group of units which is the focus of the statistics (the population). Austrian households on their main residence

7
Specify the following statistical units: • Reporting unit • Observational unit • Analytical unit
Examples of different kind of statistical units include: enterprise, enterprise group, kind-of-activity unit (KAU), local unit, establishment, homogeneous unit of production. In most cases the reporting unit, observational unit and analytical unit are identical, but there are examples where this is not the case. In electricity statistics, you may find that energy companies (the reporting unit) provide data about different consumers like the individual household or manufacturing company (the observational unit). The analytical unit may be a group of energy consumers, defined by the ISIC. The reporting unit, the observational unit and the analytical unit are Austrian households on their main residence.
2.7. Sampling frame and sample characteristics Describe the type of sampling frame used in the collection and compilation of the statistics (e.g. list, area or multiple frames). A sampling frame is the source material or device from which a sample is drawn. Note that the sampling frame might differ from the population. During the labour force survey in the fourth quarter 2007 the respondents were asked to volunteer the sample survey “Electricity and natural gas consumption of households 2008”. The 1 494 volunteers were broken down to classes following the grossing up criteria which are size of the household, dwelling type (single/double family houses vs. apartments), regional distribution and highest degree of education. Out of these classes a representative gross sample of 500 households was drawn. For each survey(s) used for the compilation of the statistics, specify the sampling design (e.g. random, stratified, etc.). Describe the routines employed for updating the sample. Include information about the sample size, and discuss to what extent the sample covers the population (e.g. energy consumption in the sample compared to total energy use by the population). Note that chapter 2.7: Sample frame and sample characteristics may overlap with chapter 3.4: Grossing up procedures. See above
2.8. Collection method Paper and electronic questionnaires (One third with e-mail and two third with regular mail)
2.9. Survey participation/response rate The respondent rate was 51 % or 254 households which returned all questionnaires filled in completely.
8
3. The statistical production process
3.1. Data capture and storage Manual data capture via excel by IT division in case of paper questionnaires (two third). One third was submitted as excel workbooks.
3.2. Data editing In a first step the questionnaires were checked concerning typing errors and implausible entries. These errors could be mostly avoided with internal checks in case of data submission as excel workbooks. Afterwards plausibility checks were operated partially in excel and partially in SPSS. Although the number of surveyed features is high (around 4000 characteristics) each of them was checked separately and the internal consistency of each questionnaire was verified. In opposition the consistency between the questionnaires was verified only partially because changes within the surveyed period are possible e.g. in case of equipment with electric devices. By running the plausibility checks e.g. in case of consumption quantities household characteristics like household size or floor area were taken into account.
3.3. Imputation Item-Non Response imputation only; The questionnaire on electricity and natural gas devices included questions on quantities and expenditures from the most recent annual statement. Missing expenditures were calculated with average prices from reported quantities and missing quantities in the same way from reported expenditures. In case of completely missing data the following procedure was applied to calculate the quantities: The difference between the meter readings reported in the questionnaires on consumption behaviour in winter in summer was broken by the number of days between these two meter readings and multiplied with 365. The expenditures were calculated with average prices. The imputation rates are 4.7% for the first and 6.9% for the second electricity meter and 4.9% for the natural gas meter. In case of missing meter readings the daily and annual quantities were added from the calculated quantities of appliance groups (derived from the average device specific consumption quantities). The imputation rate is 2.8%.
3.4. Grossing up procedures The sample was grossed up to the overall population of main residences in Austria. The grossing up criteria was: Size of households (number of household members) One and two family houses versus apartments Highest degree of education The household size was limited to 4 characteristics (4+ = 4), the degree of education was condensed to 3 categories.
9
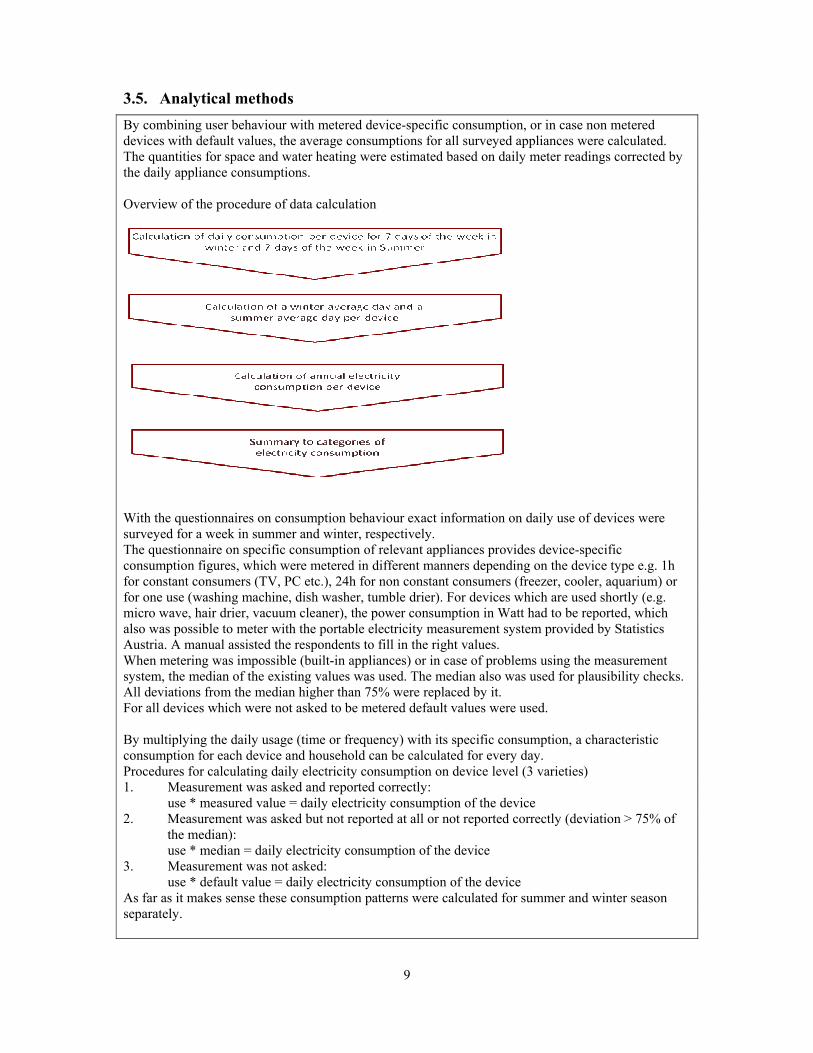
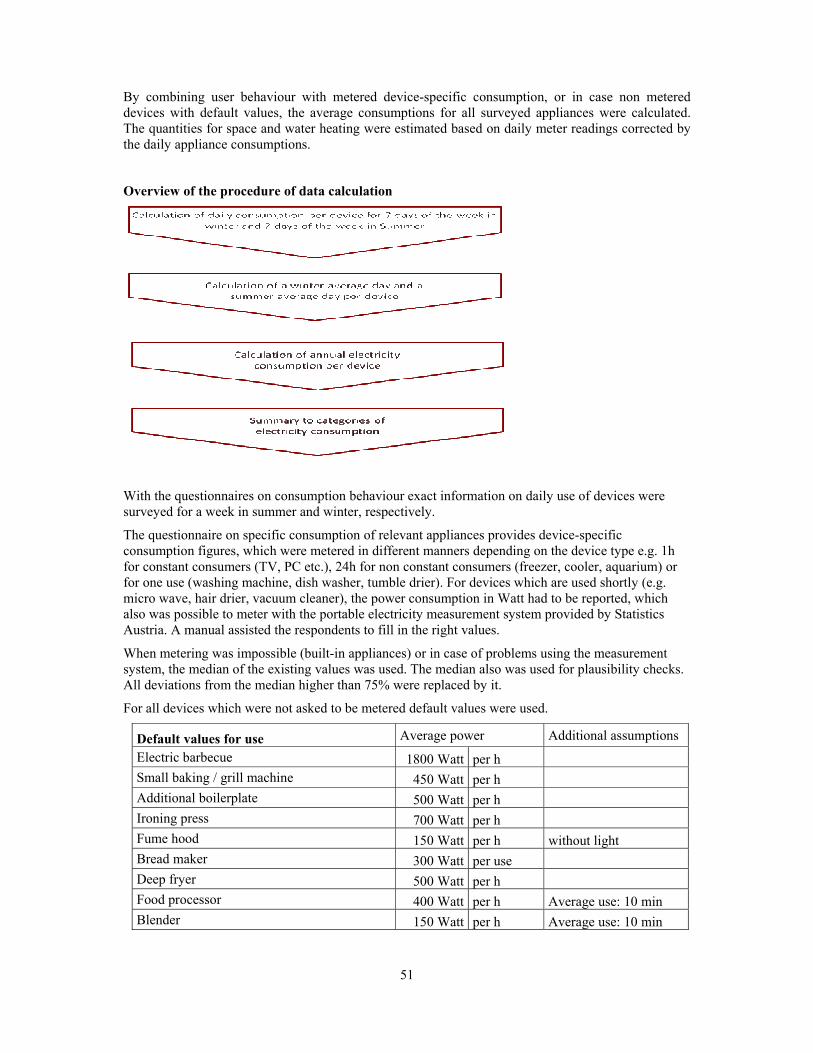
3.5. Analytical methods By combining user behaviour with metered device-specific consumption, or in case non metered devices with default values, the average consumptions for all surveyed appliances were calculated. The quantities for space and water heating were estimated based on daily meter readings corrected by the daily appliance consumptions. Overview of the procedure of data calculation
With the questionnaires on consumption behaviour exact information on daily use of devices were surveyed for a week in summer and winter, respectively. The questionnaire on specific consumption of relevant appliances provides device-specific consumption figures, which were metered in different manners depending on the device type e.g. 1h for constant consumers (TV, PC etc.), 24h for non constant consumers (freezer, cooler, aquarium) or for one use (washing machine, dish washer, tumble drier). For devices which are used shortly (e.g. micro wave, hair drier, vacuum cleaner), the power consumption in Watt had to be reported, which also was possible to meter with the portable electricity measurement system provided by Statistics Austria. A manual assisted the respondents to fill in the right values. When metering was impossible (built-in appliances) or in case of problems using the measurement system, the median of the existing values was used. The median also was used for plausibility checks. All deviations from the median higher than 75% were replaced by it. For all devices which were not asked to be metered default values were used. By multiplying the daily usage (time or frequency) with its specific consumption, a characteristic consumption for each device and household can be calculated for every day. Procedures for calculating daily electricity consumption on device level (3 varieties) 1. Measurement was asked and reported correctly: use * measured value = daily electricity consumption of the device 2. Measurement was asked but not reported at all or not reported correctly (deviation > 75% of
the median): use * median = daily electricity consumption of the device 3. Measurement was not asked: use * default value = daily electricity consumption of the device As far as it makes sense these consumption patterns were calculated for summer and winter season separately.
10
The annual consumption by device or meter was derived from the daily seasonal consumptions as follows: Average summer day * 175 + average winter day* 175 350 days for device use were chosen because the average holiday period is two weeks. Additionally following assumptions were made: Cooler: for calculating the overall consumption, the volumes of freezing and cooling compartments were taken into account separately. The consumption by 100l was calculated and used for plausibility checks. In cases of missing measurements, the median by 100l was used and converted to the reported size. Freezer: for calculating the overall consumption, the volume was taken into account. The consumption by 100l was calculated and used for plausibility checks. In cases of missing measurements, the median by 100l was used and converted to the reported size. Washing machine: the consumption reported for different washing temperatures were taken into account by calculating the average consumption. Iron: after the sixth minute, only 50% of the operating period is classified as heating phase. Food processor: operating period 10 minutes by use Blender, mixing rod: operating period 1 minute by use Handheld blender: operating period 5 minutes by use TV: in case of missing measurements screen diagonals were used for calculating the specific consumption.
4. Dissemination
4.1. Publications and additional documentation Describe the form of dissemination of the statistics/topics in question (e.g. printed publications, website, etc.). Please provide relevant website link(s) if available. The report is published on the website of Statistics Austria: http://www.statistik.at/web_en/statistics/energy_environment/energy/energy_consumption_of_households/index.html. Tables and charts are also available on the website of Statistics Austria: http://www.statistik.at/web_en/statistics/energy_environment/energy/energy_consumption_of_households/index.html and http://www.statistik.at/web_en/statistics/energy_environment/energy/energy_consumption_of_households/index.html Give a complete reference to publicly available statistics databases where data from the statistics can be extracted. Include web addresses if available online. Not relevant Indicate whether you charge users for access to the statistics at any level of aggregation. Not relevant
11
4.2. Revisions Describe the current revision policies. E.g.: Is historical data revised when new methodology, new definitions, new classifications etc. are taken into use? Is the data continuously revised, or is the data revised at certain points in times (e.g. every third year, annually, etc.)? Not planned If applicable, describe any major conceptual or methodological revisions that have been carried out for this statistic/topic in the past. Not relevant
4.3. Microdata Describe how microdata are stored. Microdata are stored as SPSS and Excel files. Specify if microdata are available for scientific and/or public use. If so, describe under what conditions these are made available. Microdata are available for scientific and public use, but the data supply to third parties follow strictly the Federal Statistics Act 2000 (in the current version). That means data are only supplied in anonymized form, therefore no conclusions to single households are possible.
4.4. Confidentiality Describe the legal authority that regulates confidentiality, and what restrictions are applied to the publication of the statistics. The publication and data supply to third parties follow strictly the Federal Statistics Act 2000 in the current version. That means data are only supplied in anonymized form, therefore no conclusions to single households are possible. Describe the criteria used to suppress sensitive data in statistical tables (cell suppression). Not relevant Describe how confidential data are handled. Personal data (e.g. name, address, telephone number, etc.) were deleted before publishing or supplying the data to third parties. Describe any confidentiality standards that go beyond what is legally required. Not relevant
5. Quality
5.1. Relevance The representational survey gives a comprehensive overview of the electricity and natural gas consumption by purposes and devices.
12
The main reasons for the survey were the increasing electricity consumption on the one hand and the directive 2006/32 EC on energy efficiency and energy services on the other hand. Electricity consumption for water heating and space heating is well documented since 1977, whereas no information about the consumption of electric appliances and for illumination was available. The present survey significantly improved the information not only on the equipment of households with such appliances but also on the user behaviour. Based on this information the consumption patterns for cooking, laundry washing or entertainment electronics could be calculated. All households connected to the natural gas grid data were additionally surveyed on their natural gas consumption for space and water heating as well as for cooking. The data give an exact picture of the electricity consumption in households by purpose. Furthermore, the database enables the recognition of electricity saving potentials with regard to appliances used and changes in user behaviour.
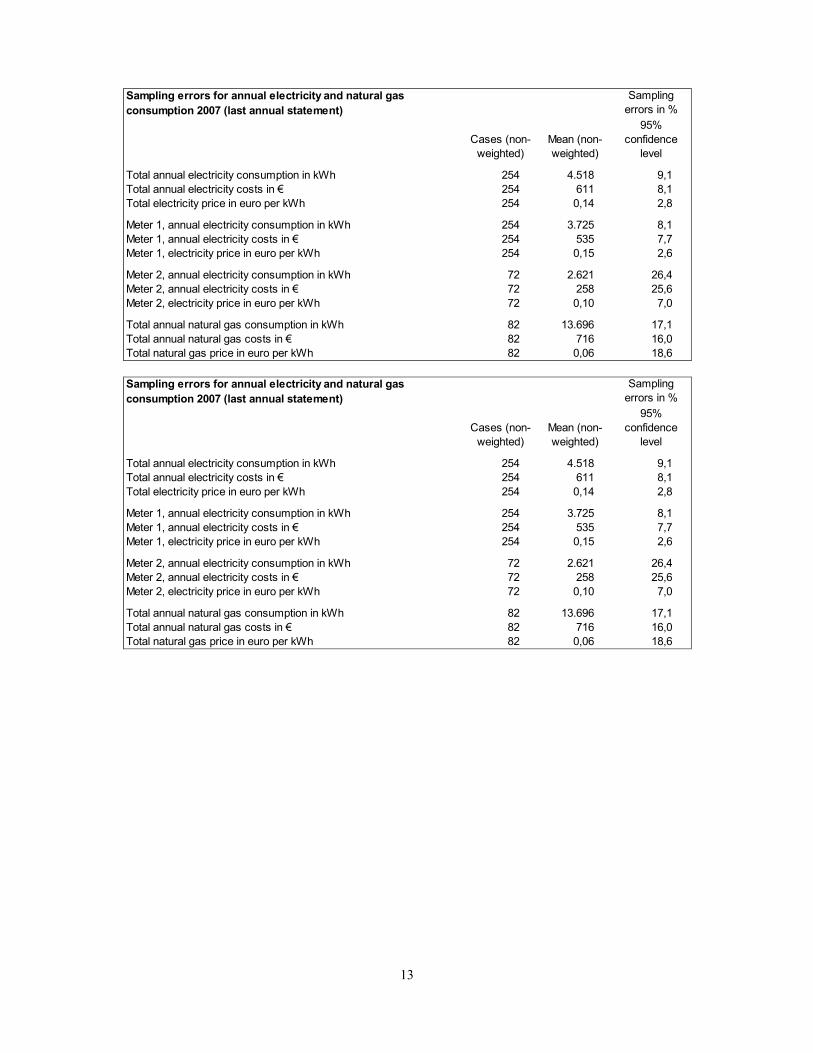
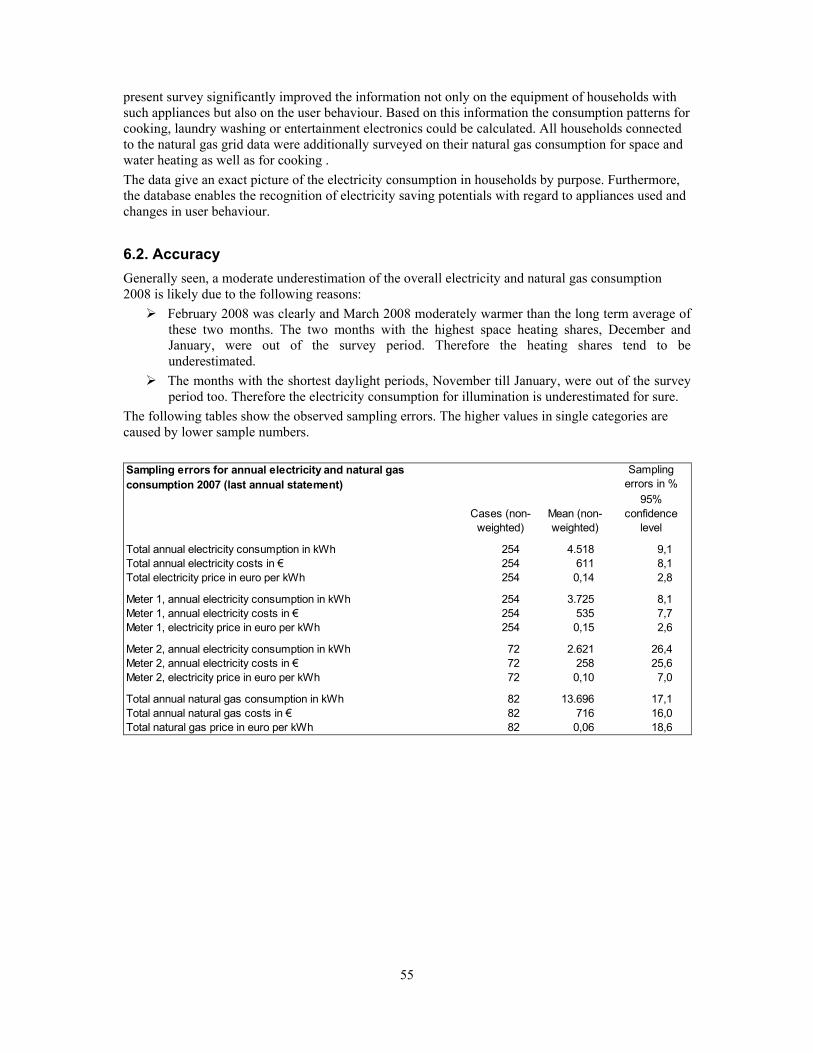
5.2. Accuracy Generally seen, a moderate underestimation of the overall electricity and natural gas consumption 2008 is likely due to the following reasons: February 2008 was clearly and March 2008 moderately warmer than the long term average of these two months. The two months with the highest space heating shares, December and January, were out of the survey period. Therefore the heating shares tend to be underestimated. The month with the shortest daylight periods, November till January, were out of the survey period too. Therefore the electricity consumption for illumination is underestimated for sure. Measurement and processing errors The measurement of power with the electricity cost meter worked from 7 Watt onwards exactly; figures lower 5 Watt were not displayed at all. E.g. cell phone chargers could not be measured although these chargers were part of the previous questionnaires. Non-response errors Unit non response: 49% Item non response: only in single cases and then around 5% Sampling errors The following tables show the observed sampling errors. The higher values in single categories are caused by lower sample numbers.
13
Sampling errors for annual electricity and natural gas consumption 2007 (last annual statement)
Sampling errors in %
Cases (non-weighted)
Mean (non-weighted)
95% confidence
level
Total annual electricity consumption in kWh 254 4.518 9,1Total annual electricity costs in € 254 611 8,1Total electricity price in euro per kWh 254 0,14 2,8
Meter 1, annual electricity consumption in kWh 254 3.725 8,1Meter 1, annual electricity costs in € 254 535 7,7Meter 1, electricity price in euro per kWh 254 0,15 2,6
Meter 2, annual electricity consumption in kWh 72 2.621 26,4Meter 2, annual electricity costs in € 72 258 25,6Meter 2, electricity price in euro per kWh 72 0,10 7,0
Total annual natural gas consumption in kWh 82 13.696 17,1Total annual natural gas costs in € 82 716 16,0Total natural gas price in euro per kWh 82 0,06 18,6 Sampling errors for annual electricity and natural gas consumption 2007 (last annual statement)
Sampling errors in %
Cases (non-weighted)
Mean (non-weighted)
95% confidence
level
Total annual electricity consumption in kWh 254 4.518 9,1Total annual electricity costs in € 254 611 8,1Total electricity price in euro per kWh 254 0,14 2,8
Meter 1, annual electricity consumption in kWh 254 3.725 8,1Meter 1, annual electricity costs in € 254 535 7,7Meter 1, electricity price in euro per kWh 254 0,15 2,6
Meter 2, annual electricity consumption in kWh 72 2.621 26,4Meter 2, annual electricity costs in € 72 258 25,6Meter 2, electricity price in euro per kWh 72 0,10 7,0
Total annual natural gas consumption in kWh 82 13.696 17,1Total annual natural gas costs in € 82 716 16,0Total natural gas price in euro per kWh 82 0,06 18,6

14
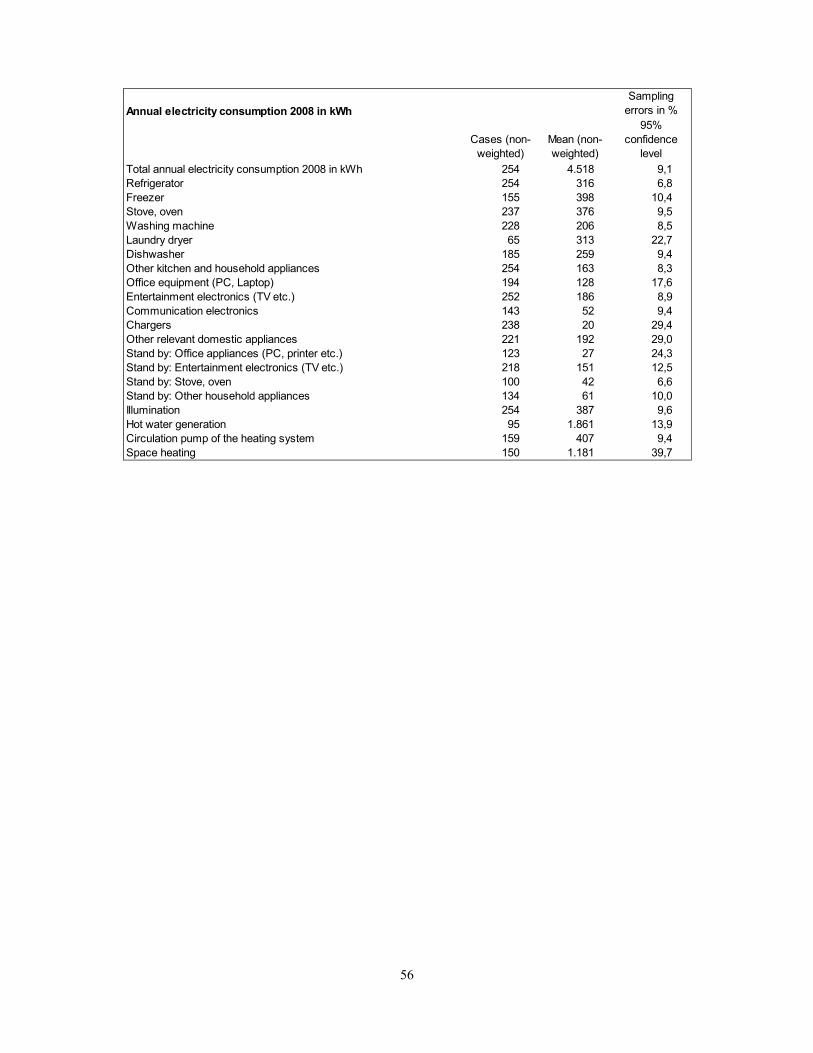
Annual electricity consumption 2008 in kWhSampling
errors in %
Cases (non-weighted)
Mean (non-weighted)
95% confidence
levelTotal annual electricity consumption 2008 in kWh 254 4.518 9,1Refrigerator 254 316 6,8Freezer 155 398 10,4Stove, oven 237 376 9,5Washing machine 228 206 8,5Laundry dryer 65 313 22,7Dishwasher 185 259 9,4Other kitchen and household appliances 254 163 8,3Office equipment (PC, Laptop) 194 128 17,6Entertainment electronics (TV etc.) 252 186 8,9Communication electronics 143 52 9,4Chargers 238 20 29,4Other relevant domestic appliances 221 192 29,0Stand by: Office appliances (PC, printer etc.) 123 27 24,3Stand by: Entertainment electronics (TV etc.) 218 151 12,5Stand by: Stove, oven 100 42 6,6Stand by: Other household appliances 134 61 10,0Illumination 254 387 9,6Hot water generation 95 1.861 13,9Circulation pump of the heating system 159 407 9,4Space heating 150 1.181 39,7

15
Daily electricity consumption in kWhSampling
errors in %
Cases (non-weighted)
Mean (non-weighted)
95% confidence
levelTotal daily electricity consumption, Winter 254 14,9 11,7Total daily electricity consumption, Summer 254 9,9 7,6Refrigerator 254 0,9 6,8Freezer 155 1,1 10,4Stove, oven , Winter 235 1,2 9,5Stove, oven , Summer 223 1,1 11,2Washing machine, Winter 219 0,6 8,8Washing machine, Summer 216 0,6 9,0Laundry dryer, Winter 63 1,2 23,4Laundry dryer, Summer 49 0,9 23,8Dishwasher, Winter 176 0,8 9,1Dishwasher, Summer 175 0,8 9,6Other kitchen and household appliances, Winter 251 0,5 8,6Other kitchen and household appliances, Summer 251 0,5 9,2Ventilator, dehumidifiers and humidifiers, Winter 22 0,2 69,6Ventilator, dehumidifiers and humidifiers, Summer 19 0,1 59,9Office equipment, Winter 189 0,4 17,8Office equipment, Summer 179 0,4 19,0Entertainment electronics, Winter 250 0,6 8,9Entertainment electronics, Summer 249 0,5 9,9Communication electronics 143 0,1 9,4Chargers, Winter 224 0,1 31,3Chargers, Summer 225 0,1 29,4Other relevant domestic appliances (incl. air conditioners, additional heating), Winter 202 0,8 38,0Other relevant domestic appliances (incl. air conditioners, additional heating), Summer 185 0,4 22,5Stand by: Office appliances, Winter 96 0,1 26,5Stand by: Office appliances, Summer 92 0,1 27,0Stand by: Entertainment electronics, Winter 204 0,5 12,1Stand by: Entertainment electronics, Summer 177 0,5 12,8Stand by: Stove, oven 100 0,1 6,6Stand by: Other household appliances 134 0,2 10,0Illumination, Winter 254 1,5 10,3Illumination, Summer 250 0,7 11,2Hot water generation 95 5,3 13,9Circulation pump of the heating system, Winter 157 1,8 10,4Circulation pump of the heating system, Summer 156 0,4 12,6Space heating, Winter 150 6,7 39,7
Sampling errors in %
Cases (non-weighted)
Mean (non-weighted)
95% confidence
levelNatural Gas, Winter in Bm³ 80 6,7 17,1Natural Gas, Summer in Bm³ 65 0,9 20,9
Other sources of error Not relevant
16
5.3. Timeliness and punctuality Specify the time between the end of the reference period and publication. If the statistics are published both as preliminary and final figures, specify the time between publication of preliminary and final figures. You should also point out whether the publication date is set according to certain rules (e.g. advance release calendar, a specific day or prior to other publications). The final data for 2010 were available in May 2010. Preliminary results are not published. Final results are published at latest as announced in the “Veröffentlichungskalender” on the Statistics Austria website (only available in German): http://www.statistik.at/web_de/ueber_uns/veroeffentlichungskalender/index.html Point out if there have been any major discrepancies between the planned publication date and the actual publication date in recent years. If so, state the length of this discrepancy and its cause. No discrepancies
5.4. Accessibility The statistics are easily to access on Statistics Austria website. There is no advance release calendar because the data are not published regularly.
5.5. Comparability Discuss the comparability of the statistics over time, geographical areas and other domains. Comparability over time Discuss comparability over time and include information about whether there have been any breaks in the time series of the statistics and why. Also describe any major changes in the statistical methodology that may have had an impact on comparability over time. Due to the fact that this is a pilot study, the questions on comparability are not relevant. Comparability over region Discuss comparability over geographical areas, and include information about whether the statistics are comparable to relevant statistics published by other countries and/or international organisations. See above Comparability over other domains Discuss comparability over domains, and include information about whether the statistics are comparable between different industries, different types of households etc. See above
5.6. Coherence and consistency Discuss the coherence/consistency between preliminary and final figures. Not relevant

17
Discuss the coherence/consistency between monthly, quarterly or yearly statistics within the same subject area. Can the results of different frequencies for the same reference period be combined in a reliable manner? Not relevant Discuss the coherence/consistency with other related statistics (also those produced by other institutions/organisations on the same subject). The results of the present survey were compared with the comparable ones from “Household energy consumption survey 2008” and are fitting very well.
6. Future plans A follow up survey is fixed for 2011/12. Further surveys depend on respective contracts. Concerning respondents burdens, the questionnaires will be shortened.

18
Annexes Illustrations and flowcharts Illustrations and flowcharts are useful to summarize information and to get a better overview of the statistical production process. Illustrations and flowcharts can either be places in annexes or be included under relevant paragraphs in the template. E.g.:
• A conceptual flowchart which illustrates the flow of data in the production of the statistics.
• A flowchart which illustrates the main tasks in the production process and the dependency between them.

19
Time schedule Oct Nov Dec Jan Feb Mar Apr May Jun Jul Aug Sep Oct Nov DecClarify needs Plan and design Build Collect Edit Analyse Disseminate

20
Questionnaires Include the complete questionnaire(s)/survey form(s) used
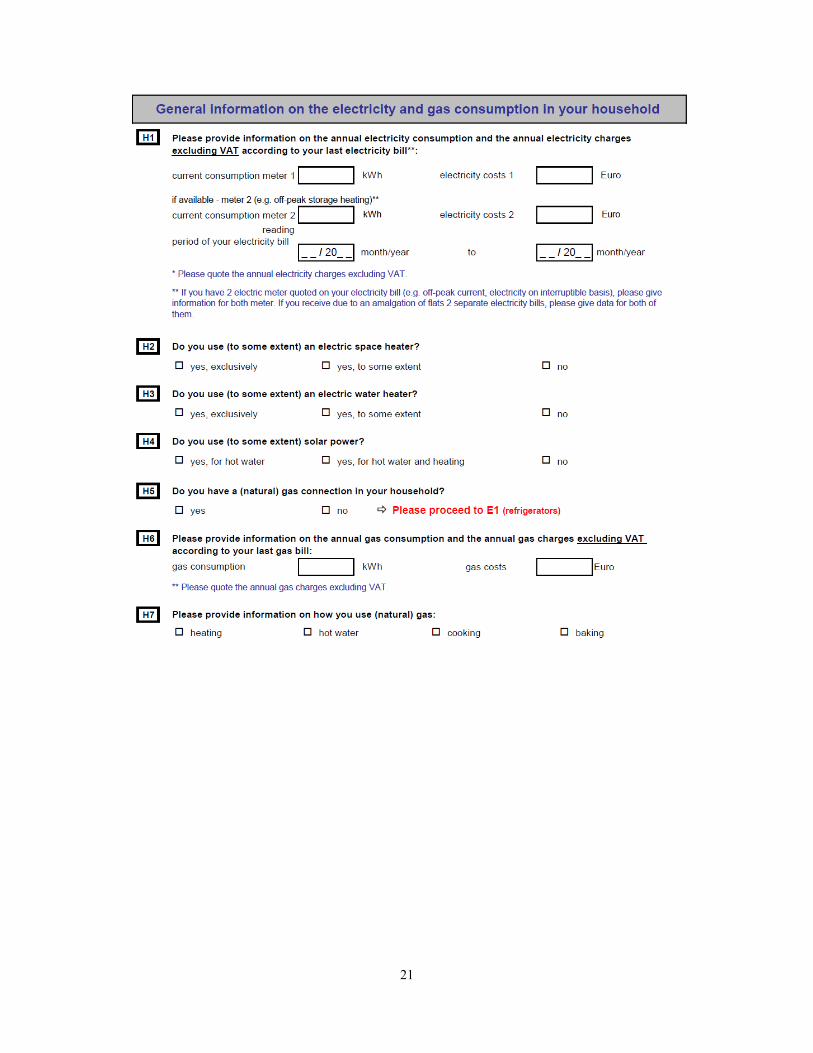
1. Questionnaire on electricity and natural gas device
21

22

23

24
25

26
27
28
29
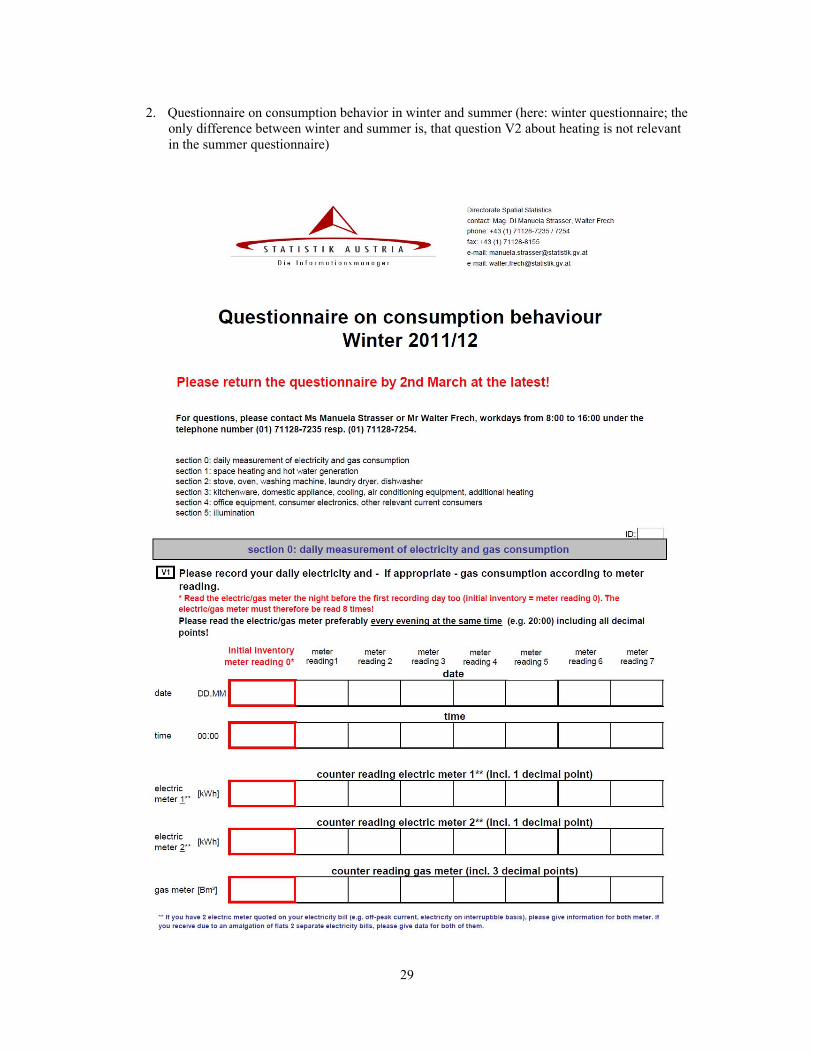
2. Questionnaire on consumption behavior in winter and summer (here: winter questionnaire; the
only difference between winter and summer is, that question V2 about heating is not relevant in the summer questionnaire)

30
31
32

33
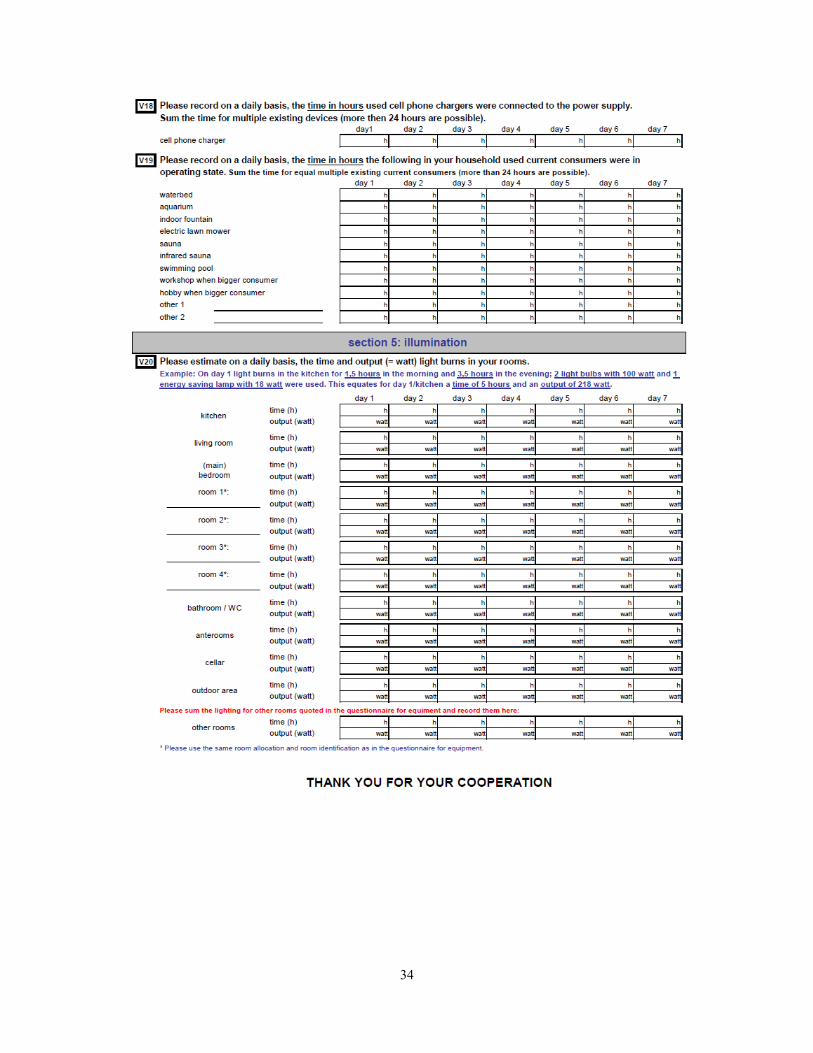
34
35
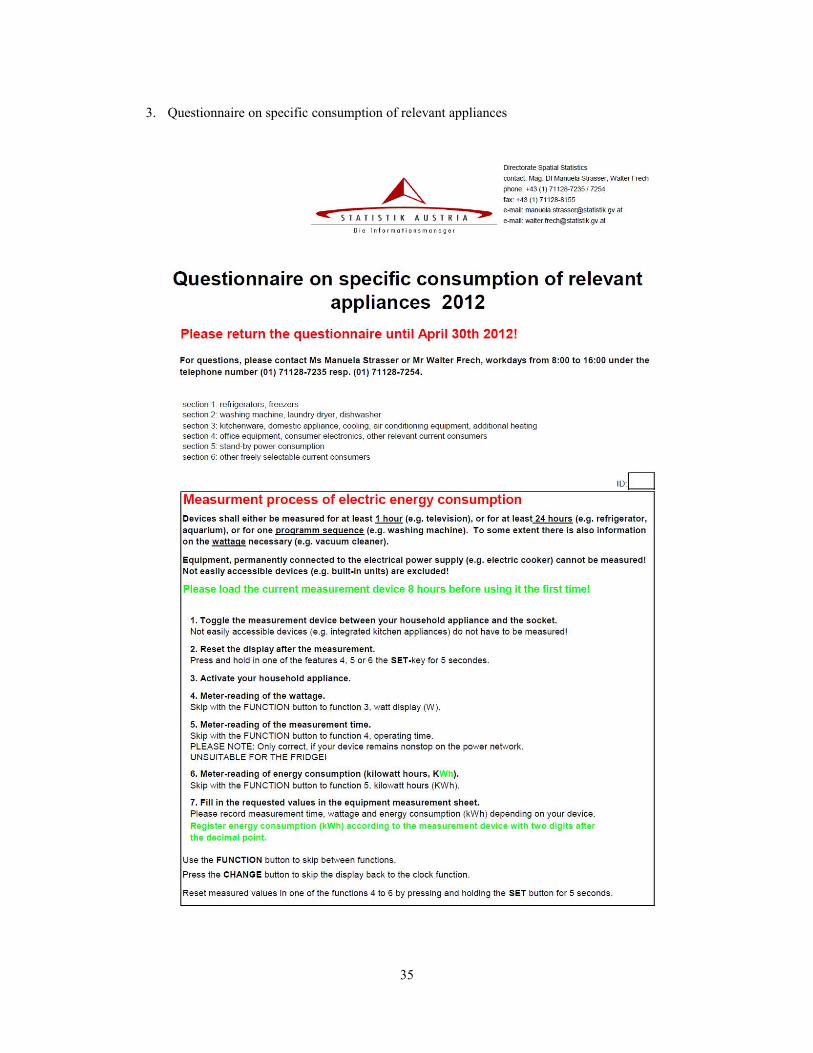
3. Questionnaire on specific consumption of relevant appliances

36

37

38
39
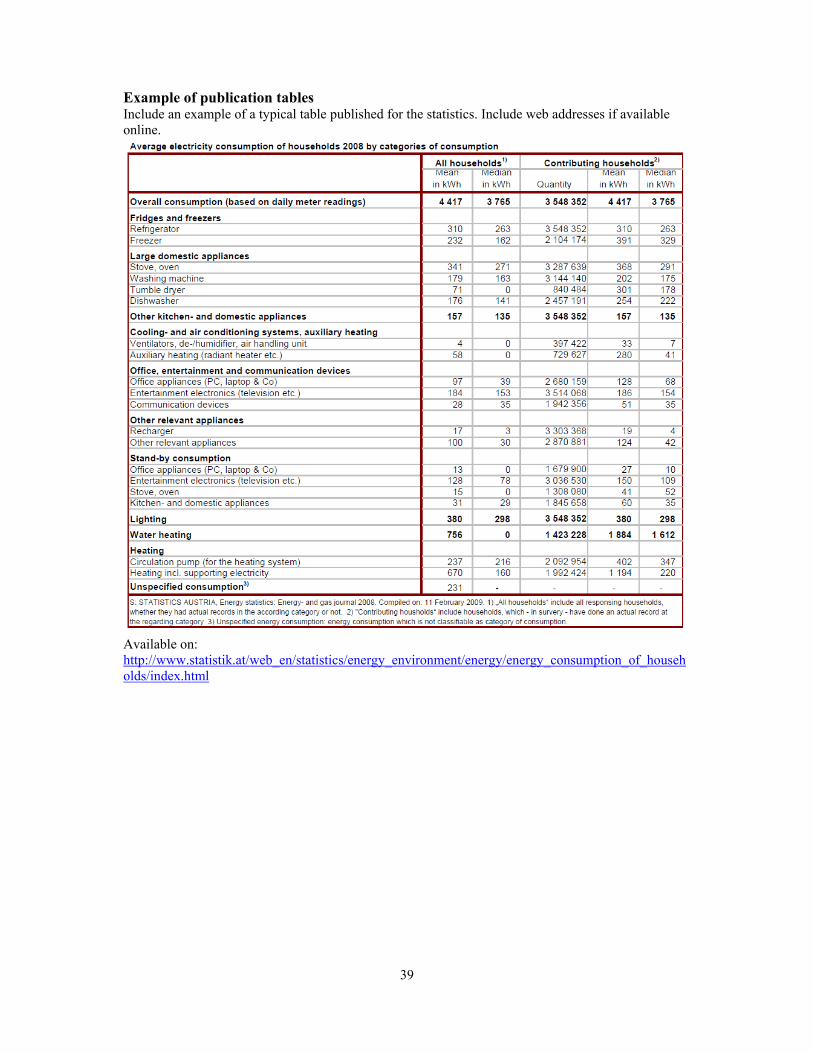
Example of publication tables Include an example of a typical table published for the statistics. Include web addresses if available online.
Available on: http://www.statistik.at/web_en/statistics/energy_environment/energy/energy_consumption_of_households/index.html
40
Detailed description on analytical methods
Standard documentation Meta information
(definitions, explanations, methods, quality)
on
Electricity and natural gas consumption of households 2008
This documentation is valid as of the reporting period:
2008
Status: March 2010
S T A T I S T I C S A U S T R I A
T h e I n f o r m a t i o n M a n a g e r
STATISTICS AUSTRIA Federal Institution under Public Law A-1110 Wien, Guglgasse 13

41
Tel.: +43-1-71128-0 www.statistik.at

42
Contents
1. Summary and important hints ....................................................................................................... 44 1.1 Preliminary remarks ................................................................................................. 44 1.2 Objective and purpose.............................................................................................. 44 1.3 Subject of the statistics ............................................................................................. 44 1.4 Data sources, coverage............................................................................................. 44 1.5 Data preparation ....................................................................................................... 44 1.6 Quality...................................................................................................................... 44 1.7 Publication................................................................................................................ 44
2. General Information ....................................................................................................................... 45 2.1 Type of statistics....................................................................................................... 45 2.2 Subject area .............................................................................................................. 45 2.3 Responsible organisational unit and contact details................................................. 45 2.4 Objective and purpose, history................................................................................. 45 2.5 Periodicity ................................................................................................................ 45 2.6 Contracting entity..................................................................................................... 45 2.7 Main users ................................................................................................................ 46 2.8 Legal basis................................................................................................................ 46
3. Statistical concepts and methodology ............................................................................................ 46 3.1 Subject of the statistics ............................................................................................. 46 3.2 Observed unit / reporting unit / presentation unit..................................................... 46 3.3 Data sources ............................................................................................................. 46 3.4 Reporting unit and respondents................................................................................ 46 3.5 Survey format........................................................................................................... 46 3.6 Sample characteristics .............................................................................................. 46 3.7 Survey techniques / data transmission...................................................................... 47 3.8 Survey questionnaire (including explanatory notes) ................................................ 47 3.9 Survey participation (mandatory or voluntary) ........................................................ 48 3.10 Variables surveyed and derived, indicators (including definitions) ....................... 48 3.11 Classifications used ................................................................................................ 49 3.12 Regional breakdown of the results ......................................................................... 49
4. Production of Statistics, Processing, Quality assurance measures ............................................. 49 4.1 Data capture ............................................................................................................. 49 4.2 Coding ...................................................................................................................... 49 4.3 Editing and verification of data sources used........................................................... 50 4.4 Imputation (where responses are missing or data incomplete) ................................ 50 4.5 Grossing up procedures (Weighting) ....................................................................... 50 4.6 Compilation of the final data set, (other) models and statistical estimation techniques used .............................................................................................................. 50 4.7 Other quality insurance measures ............................................................................ 54
5. Publication (accessibility) ............................................................................................................... 54 5.1 Preliminary results.................................................................................................... 54 5.2 Final results .............................................................................................................. 54 5.3 Revisions .................................................................................................................. 54 5.4 Published in:............................................................................................................. 54 5.5 Treatment of confidential data ................................................................................. 54
6. Quality ............................................................................................................................................. 54
43
6.1. Relevance ............................................................................................................................... 54 6.2. Accuracy.................................................................................................................................. 55
6.2.1. Sampling effects ......................................................................................................... 57 6.2.2. Non-sampling effects ................................................................................................. 57
Quality of data sources used........................................................................................... 58 Coverage (misclassifications, undercoverage/overcoverage) ........................................ 58 Missing responses (unit non-response, item non-response) ........................................... 58 Measurement errors (entry errors).................................................................................. 58 Processing errors ............................................................................................................ 58 Model assumption effects............................................................................................... 58
6.3. Timeliness and punctuality ................................................................................................... 58 6.4. Comparability.......................................................................................................................... 58 6.5. Coherence .............................................................................................................................. 58

44
1. Summary and important hints
1.1 Preliminary remarks The voluntary sample survey “Electricity and natural gas consumption of households 2008” is a comprehensive data collection on electricity and gas consumption in households broken down by consumption purpose. It was conducted on behalf of the Austrian energy regulator E-Control Ltd. and the Federal Ministry of Agriculture, Forestry, Environment and Water Management.
1.2 Objective and purpose The main purpose of the present survey was to get a comprehensive overview concerning the electricity consumption of private households, especially for electric appliances. On the one hand the information on households for energy statistics in general should be improved and on the other hand additional data for analysing electricity saving potentials in the private sector should be obtained. For natural gas, the overall consumption was broken down to space heating, water heating and cooking.
1.3 Subject of the statistics The statistics cover the consumption of electricity and natural gas in private households. With five questionnaires the equipment of households with electric appliances as well as data on space heating, water heating and illumination were surveyed. In a further step, the respondents had to record the use of their appliances for one week in winter and for one week in summer. Additionally, they had to read out their electricity and natural gas meters in 24h periods during these two weeks. Last but not least, the specific electricity consumption of relevant appliances had to be metered with a portable electricity measurement system provided by Statistics Austria.
1.4 Data sources, coverage The gross sample size of the voluntary sample survey was 500 households. The respondent rate was almost 51% (254 households). The source for defining the overall population was the micro census data set.
1.5 Data preparation Data preparation consists of manual data input with MS Excel and plausibility checks in Excel and the statistical software SPSS. The sample was grossed up to the overall population of main residences. As criteria for representativeness, the size of households and buildings (single-/double-family houses versus apartment buildings) as well as the highest degree of education were applied.
1.6 Quality The quality of the results was checked with the results of the Sample Survey on Energy Consumption of Households (Statistics Austria). Despite the small sample size, the data quality was found to be surprisingly good.
1.7 Publication The report (available in German only) is published on the website of Statistics Austria: http://www.statistik.at/web_de/statistiken/energie_und_umwelt/energie/energieeinsatz_der_haushalte/index.html

45
2. General Information
2.1 Type of statistics Random sample survey
2.2 Subject area Energy statistics
2.3 Responsible organisational unit and contact details Energy and Environment Division; Directorate Spatial Statistics
Wolfgang Bittermann
Tel. +43 (1) 71128- 7315, e-mail: [email protected]
Alexandra Wegscheider-Pichler
Tel. +43 (1) 71128 7235, E-Mail: [email protected]
2.4 Objective and purpose, history The present survey offers a comprehensive data collection concerning electricity and natural gas consumption in households for the first time. The main focus of the survey and the report is electricity. The main reasons for the survey were the increasing electricity consumption on the one hand and the directive 2006/32 EC on energy efficiency and energy services on the other hand. Electricity consumption for water heating and space heating is well documented since 1977, whereas no information about the consumption of electric appliances and for illumination was available. The present survey significantly improved the information not only on the equipment of households with such appliances but also on the user behaviour. Based on this information the consumption patterns for cooking, laundry washing or entertainment electronics could be calculated. All households connected to the natural gas grid were additionally surveyed on their natural gas consumption for space and water heating as well as for cooking. The data give an exact picture of the electricity consumption in households by purpose. Furthermore, the database enables the recognition of electricity saving potentials with regard to appliances used and changes in user behaviour. To make the results international comparable, an additional questionnaire was implemented based on the EU-Project „REMODECE“ (Residential Monitoring to Decrease Energy Use and Carbon Emissions in Europe) financed by the EU program „Intelligent Energy for Europe“ (Nr. EIE/05/124/S12.419657).
2.5 Periodicity The survey was conducted the first time in 2008 and a follow up survey is fixed for 2011. Further surveys depend on respective contracts.
2.6 Contracting entity • Federal Ministry of Agriculture, Forestry, Environment and Water Management (BMLFUW) • E-Control Ltd.
46
2.7 Main users • Federal Ministry of Agriculture, Forestry, Environment and Water Management • E-Control Ltd. • Austrian Environment Agency • Austrian Energy Agency • Austrian Institute of Economic Research • Eurostat • Various institutes for scientific research, universities, media etc.
2.8 Legal basis Federal Statistics Act 2000 in the current version, private contracts with Federal Ministry of Agriculture, Forestry, Environment and Water Management and E-Control Ltd.
3. Statistical concepts and methodology
3.1 Subject of the statistics The subject of the statistics is the consumption of electricity and natural gas in private households. In a first step the equipment with electric and natural gas appliances as well as data on space and water heating systems and illumination were surveyed. In two further steps the respondents had to record data on their consumption behaviour for one week in summer and one week in winter. During these two weeks the electricity and natural gas meters had to be read in 24h intervals. In a fourth step the specific electricity consumption of relevant appliances had to be metered with a portable electricity measurement system provided by Statistics Austria. To make the results international comparable, an additional questionnaire based on the EU-Project „REMODECE“ (Residential Monitoring to Decrease Energy Use and Carbon Emissions in Europe) financed by the EU program „Intelligent Energy for Europe“ (Nr. EIE/05/124/S12.419657) had to be filled in.
3.2 Observed unit / reporting unit / presentation unit Households on their main residence.
3.3 Data sources The gross sample size of the voluntary sample survey was 500 households. The data source to define the overall population was the Labour force survey (micro-zensus).
3.4 Reporting unit and respondents Households in their dwellings with main residence
3.5 Survey format Sample survey
3.6 Sample characteristics

47
During the micro-census in the fourth quarter 2007 the respondents were asked to volunteer the sample survey “Electricity and natural gas consumption of households 2008”. The 1,494 volunteers were broken down to classes depending on the household size, building type (single-/double-family houses versus apartments), regional distribution and highest degree of education. Out of these classes a representative gross sample of 500 households was drawn.
Although an allowance of 100 € was paid to every household which filled in the 5 questionnaires, the dropout rate was rather high 49%), probably due to the complexity of the survey.
3.7 Survey techniques / data transmission Survey techniques
Paper and electronic questionnaires
Data transmission
One third per e-mail and two third per regular mail.
3.8 Survey questionnaire (including explanatory notes) Between February 2008 and August 2008 all volunteers received 5 harmonised questionnaires in 3 survey cycles.
1. Questionnaire on electricity and natural gas devices (February/March 2008)
Type of space and water heating appliances, circulation pump for the heating system
Overall annual electricity and natural gas consumption (from the last annual statement)
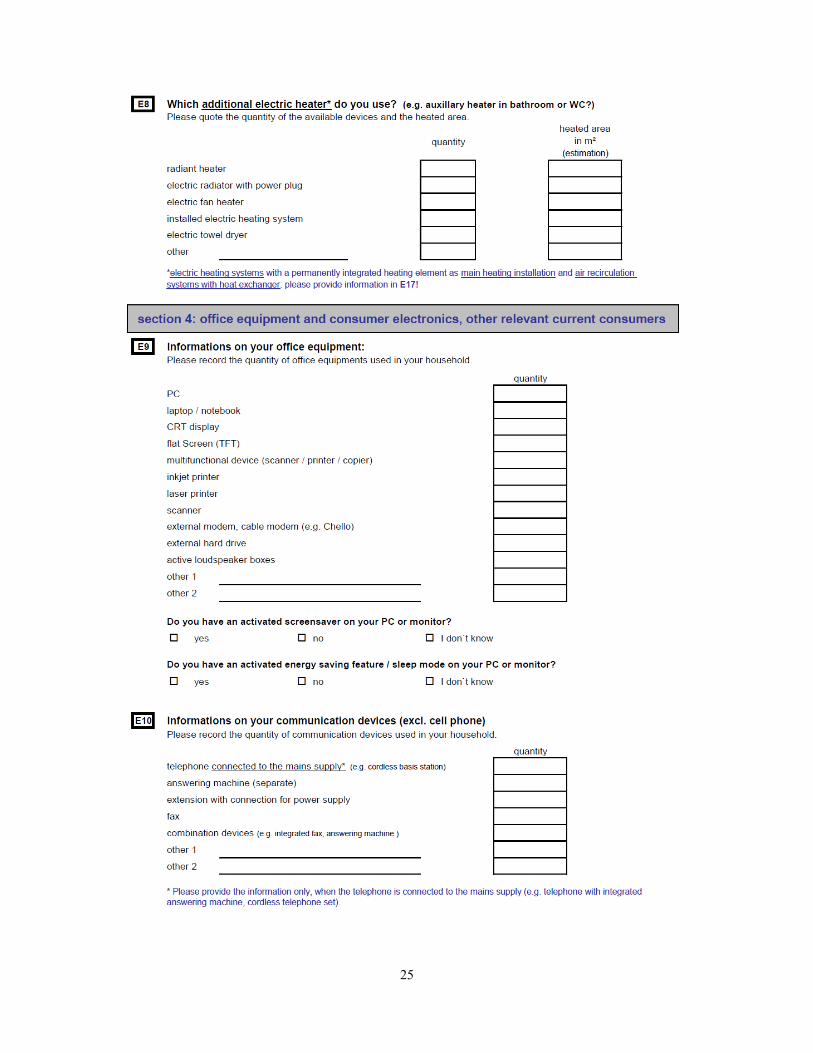
Equipment with electric appliances e.g. cooler, freezer, washing machine, dish washer, computer, TV and small appliances like coffee machine, mixer or hair drier
Additional information like age, power rating and capacity of the appliances
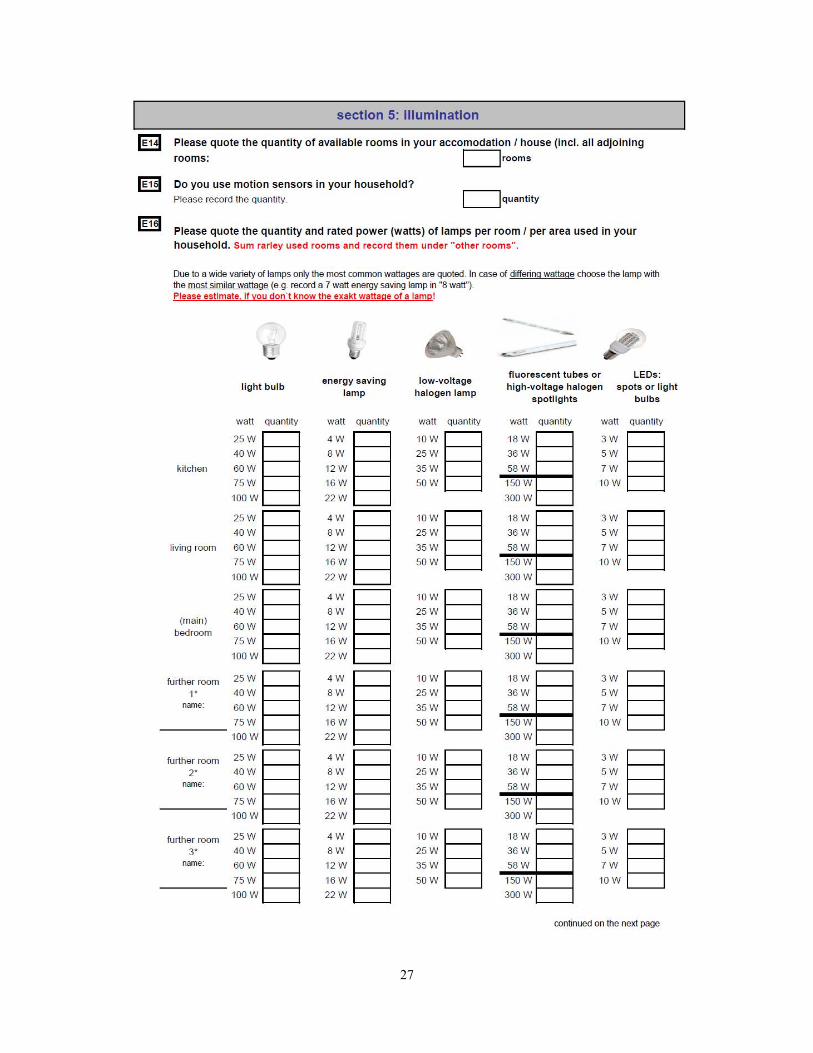
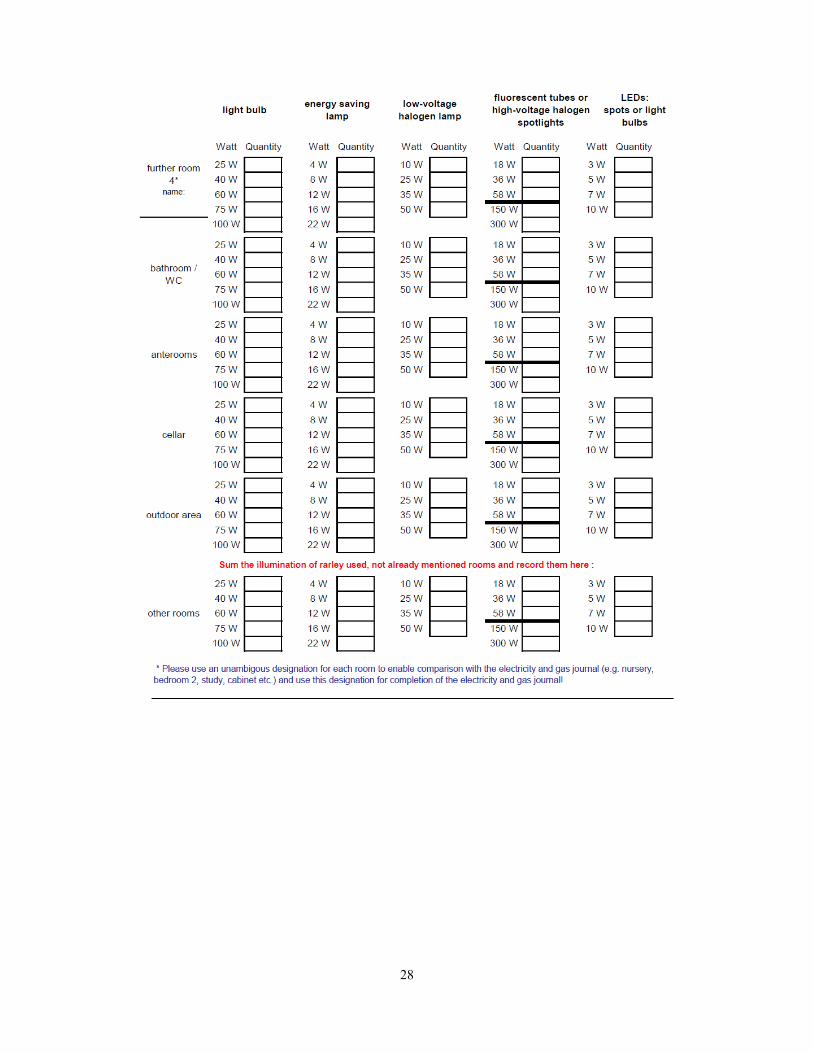
Illumination (number of lamps by type and power)
2. Questionnaire on user behaviour in winter (February/March 2008)
Daily readings of electricity and natural gas meters (24h periods)
Records on heating behaviour and hot water consumption
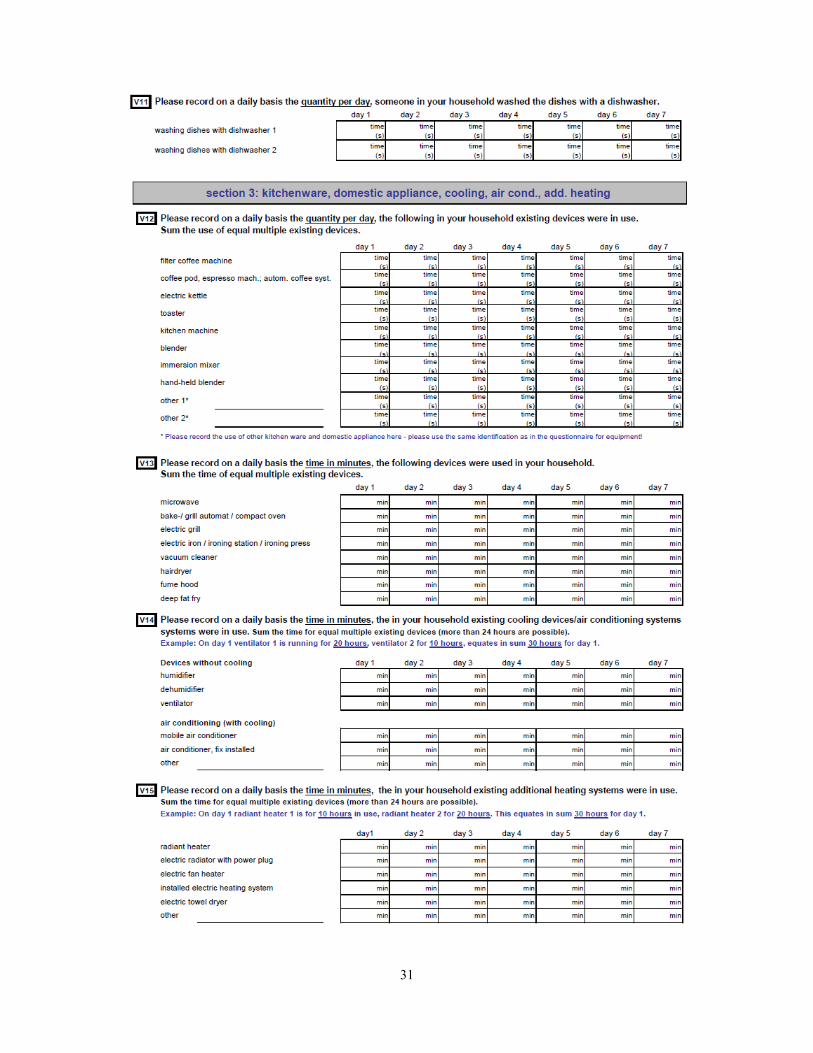
Records on activities like dish washing, cooking, laundry washing, vacuum cleaning
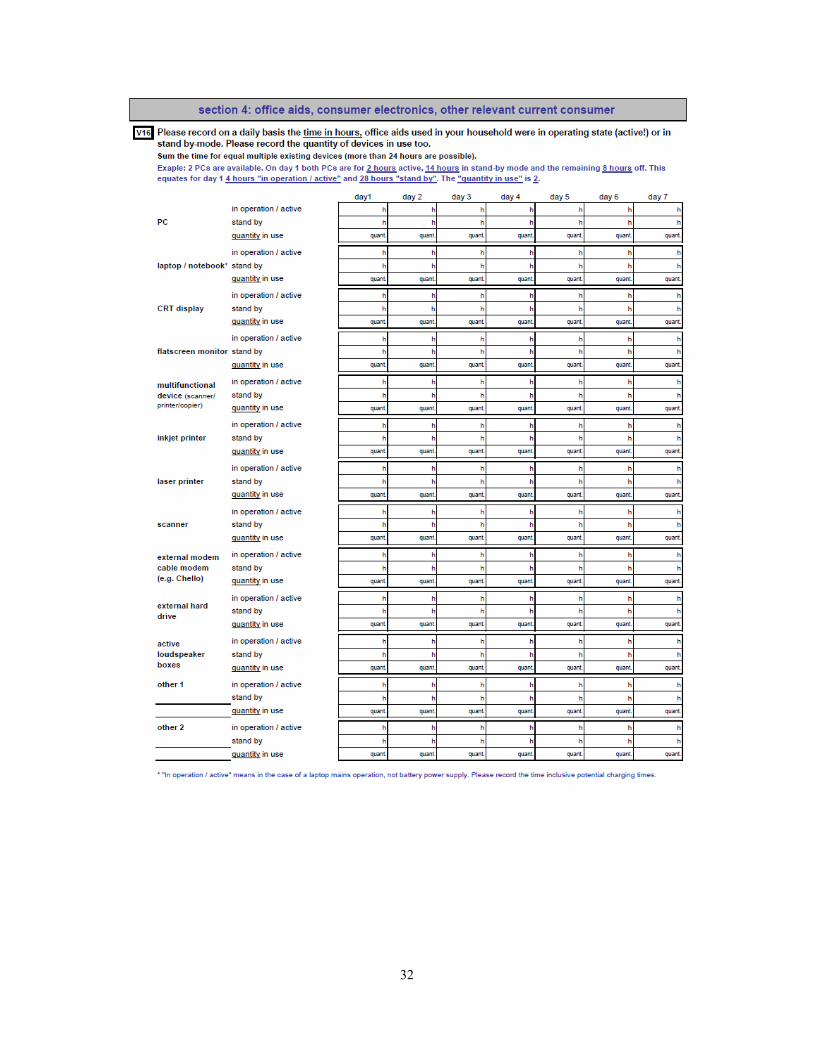
Records on use of IT (information technology) and consumer electronics and illumination
3. Questionnaire on specific consumption of relevant appliances (April to August 2008)
4. Questionnaire on user behaviour in summer (June to August 2008)
See point 2.
5. REMODECE Questionnaire (June to August 2008) to make the results comparable on EU level

48
Survey process
3.9 Survey participation (mandatory or voluntary) Voluntary; the respondent rate was 51 % or 254 households which returned all 5 questionnaires filled in completely.
3.10 Variables surveyed and derived, indicators (including definitions) 1. Electricity and if relevant, natural gas consumption and the related expenditures based on the
last annual statement (2007)
2. Number and type of appliances including data on age, power and power rating
3. Number and power of lamps broken down by type and rooms
4. Electricity and natural gas consumption by 24h periods within one week in summer and one week in winter
5. The use of relevant appliances by 24h periods (user behaviour) within one week in Summer and one week in Winter differentiated by type e.g. in minutes (taking a shower), hours (watching TV) or number of uses (dish washer)
6. Stand-by power consumption for relevant appliances
7. The use of illumination by 24h periods (user behaviour) within one week in Summer and one week in Winter
8. Device specific electricity consumption of relevant appliances with a relatively high consumption, metered with a portable electricity measurement system provided by Statistics Austria
49
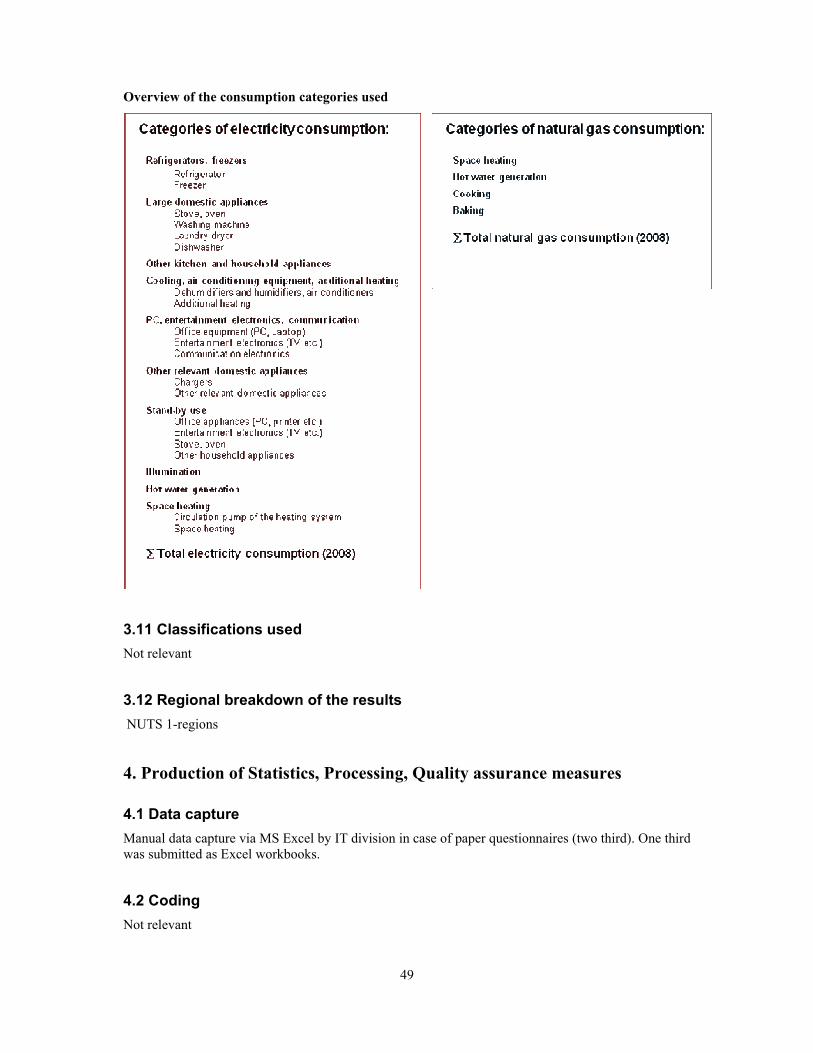
Overview of the consumption categories used
3.11 Classifications used Not relevant
3.12 Regional breakdown of the results NUTS 1-regions
4. Production of Statistics, Processing, Quality assurance measures
4.1 Data capture
Manual data capture via MS Excel by IT division in case of paper questionnaires (two third). One third was submitted as Excel workbooks.
4.2 Coding Not relevant
50
4.3 Editing and verification of data sources used In a first step the questionnaires were checked concerning typing errors and implausible entries. These errors could be mostly avoided with internal checks in case of data submission as Excel workbooks.
Afterwards plausibility checks were operated partially in excel and partially in SPSS. Although the number of surveyed features is high (around 4000 characteristics) each of them was checked separately and the internal consistency of each questionnaire was verified. The consistency between the questionnaires was only verified partially because changes within the surveyed period (e.g. equipment with electric devices) were possible .
By running the plausibility checks, e.g. in case of consumption quantities, household characteristics like household size or floor area were taken into account.
4.4 Imputation (where responses are missing or data incomplete) Item-Non Response imputation only
Annual consumption 2007 (based on annual statement 2007)
The questionnaire on electricity and natural gas devices included questions on quantities and expenditures from the most recent annual statement. Missing expenditures were calculated with average prices from reported quantities and missing quantities in the same way from reported expenditures.
In case of completely missing data the following procedure was applied to calculate the quantities:
The difference between the meter readings reported in the questionnaires on consumption behaviour in winter and in summer was broken by the number of days between these two meter readings and multiplied with 365. The expenditures were calculated with average prices.
The imputation rates are 4.7% for the first and 6.9% for the second electricity meter and 4.9% for the natural gas meter.
Annual and daily electricity consumption quantities (calculated from meter readings in summer and winter 2008)
In case of missing meter readings the daily and annual quantities were added from the calculated quantities of appliance groups (derived from the average device specific consumption quantities). The imputation rate is 2.8%.
4.5 Grossing up procedures (Weighting) The sample was grossed up to the overall population of main residences in Austria.
The grossing up criteria was:
Size of households (number of household members)
One- and two-family houses versus apartment buildings
Highest degree of education
The household size was limited to 4 characteristics (4+ = 4), the degree of education was condensed to 3 categories.
Due to the small sample the grossing up to the level of federal states was not possible.
4.6 Compilation of the final data set, (other) models and statistical estimation techniques used
51
By combining user behaviour with metered device-specific consumption, or in case non metered devices with default values, the average consumptions for all surveyed appliances were calculated. The quantities for space and water heating were estimated based on daily meter readings corrected by the daily appliance consumptions.
Overview of the procedure of data calculation
With the questionnaires on consumption behaviour exact information on daily use of devices were surveyed for a week in summer and winter, respectively.
The questionnaire on specific consumption of relevant appliances provides device-specific consumption figures, which were metered in different manners depending on the device type e.g. 1h for constant consumers (TV, PC etc.), 24h for non constant consumers (freezer, cooler, aquarium) or for one use (washing machine, dish washer, tumble drier). For devices which are used shortly (e.g. micro wave, hair drier, vacuum cleaner), the power consumption in Watt had to be reported, which also was possible to meter with the portable electricity measurement system provided by Statistics Austria. A manual assisted the respondents to fill in the right values.
When metering was impossible (built-in appliances) or in case of problems using the measurement system, the median of the existing values was used. The median also was used for plausibility checks. All deviations from the median higher than 75% were replaced by it.
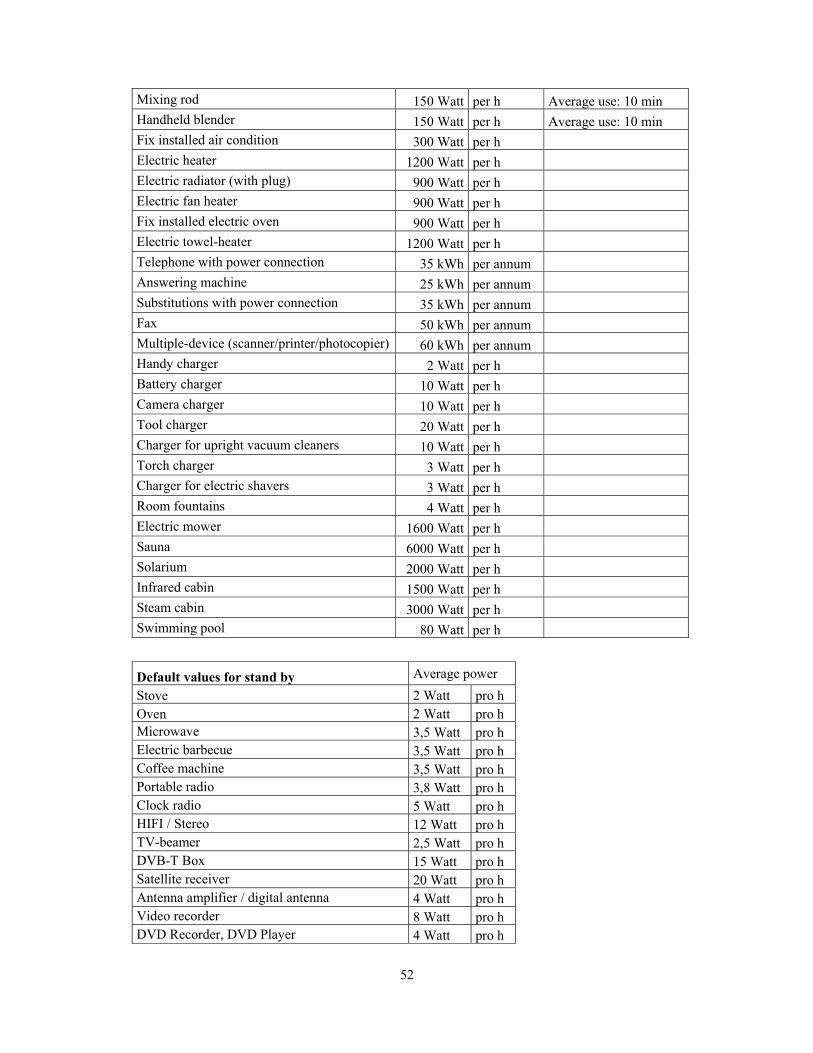
For all devices which were not asked to be metered default values were used.
Default values for use Average power Additional assumptions Electric barbecue 1800 Watt per h Small baking / grill machine 450 Watt per h Additional boilerplate 500 Watt per h Ironing press 700 Watt per h Fume hood 150 Watt per h without light Bread maker 300 Watt per use Deep fryer 500 Watt per h Food processor 400 Watt per h Average use: 10 min Blender 150 Watt per h Average use: 10 min
52
Mixing rod 150 Watt per h Average use: 10 min Handheld blender 150 Watt per h Average use: 10 min Fix installed air condition 300 Watt per h Electric heater 1200 Watt per h Electric radiator (with plug) 900 Watt per h Electric fan heater 900 Watt per h Fix installed electric oven 900 Watt per h Electric towel-heater 1200 Watt per h Telephone with power connection 35 kWh per annum Answering machine 25 kWh per annum Substitutions with power connection 35 kWh per annum Fax 50 kWh per annum Multiple-device (scanner/printer/photocopier) 60 kWh per annum Handy charger 2 Watt per h Battery charger 10 Watt per h Camera charger 10 Watt per h Tool charger 20 Watt per h Charger for upright vacuum cleaners 10 Watt per h Torch charger 3 Watt per h Charger for electric shavers 3 Watt per h Room fountains 4 Watt per h Electric mower 1600 Watt per h Sauna 6000 Watt per h Solarium 2000 Watt per h Infrared cabin 1500 Watt per h Steam cabin 3000 Watt per h Swimming pool 80 Watt per h
Default values for stand by Average power Stove 2 Watt pro h Oven 2 Watt pro h Microwave 3,5 Watt pro h Electric barbecue 3,5 Watt pro h Coffee machine 3,5 Watt pro h Portable radio 3,8 Watt pro h Clock radio 5 Watt pro h HIFI / Stereo 12 Watt pro h TV-beamer 2,5 Watt pro h DVB-T Box 15 Watt pro h Satellite receiver 20 Watt pro h Antenna amplifier / digital antenna 4 Watt pro h Video recorder 8 Watt pro h DVD Recorder, DVD Player 4 Watt pro h

53
CD Player 6 Watt pro h Play station 1 Watt pro h CRT monitor 2 Watt pro h Flat Screen (TPF) 2 Watt pro h Multiple device (scanner / printer / photocopier) 8,6 Watt pro h Ink-jet-printer 5,3 Watt pro h Laser printer 8,6 Watt pro h Scanner 6,9 Watt pro h External modem 3 Watt pro h Cable modem 5,7 Watt pro h Active speakers 3,7 Watt pro h
By multiplying the daily usage (time or frequency) with its specific consumption, a characteristic consumption for each device and household can be calculated for every day.
Procedures for calculating daily electricity consumption on device level (3 varieties)
1. Measurement was asked and reported correctly:
use * measured value = daily electricity consumption of the device
2. Measurement was asked but not reported at all or not reported correctly (deviation > 75% of the median):
use * median = daily electricity consumption of the device
3. Measurement was not asked:
use * default value = daily electricity consumption of the device
As far as it makes sense these consumption patterns were calculated for summer and winter season separately.
The annual consumption by device or meter was derived from the daily seasonal consumptions as follows:
Average summer day * 175 + average winter day* 175
350 days for device use were chosen because the average holiday period is two weeks (Statistics Austria 2002).
Additionally following assumptions were made:
Cooler: for calculating the overall consumption, the volumes of freezing and cooling compartments were taken into account separately. The consumption by 100l was calculated and used for plausibility checks. In cases of missing measurements, the median by 100l was used and converted to the reported size.
Freezer: for calculating the overall consumption, the volume was taken into account. The consumption by 100l was calculated and used for plausibility checks. In cases of missing measurements, the median by 100l was used and converted to the reported size.
Washing machine: the consumption reported for different washing temperatures were taken into account by calculating the average consumption.

54
Iron: after the sixth minute, only 50% of the operating period is classified as heating phase.
Food processor: operating period 10 minutes by use
Blender, mixing rod: operating period 1 minute by use
Handheld blender: operating period 5 minutes by use
TV: in case of missing measurements screen diagonals were used for calculating the specific consumption.
4.7 Other quality insurance measures An intensive respondent assistance by telephone was necessary due to the complexity of the survey.
5. Publication (accessibility)
5.1 Preliminary results Not relevant
5.2 Final results February 2009
5.3 Revisions Not planned
5.4 Published in: The report (available in German only) is published on the website of Statistics Austria: http://www.statistik.at/web_de/statistiken/energie_und_umwelt/energie/energieeinsatz_der_haushalte/index.html
5.5 Treatment of confidential data The publication and data supply to third parties follow strictly the Federal Statistics Act 2000 in the current version. That means data are only supplied in anonymised form, thereforeno conclusions to single households are possible.
6. Quality
6.1. Relevance The representational survey gives a comprehensive overview of the electricity and natural gas consumption by purposes and devices.
The main reasons for the survey were the increasing electricity consumption on the one hand and the directive 2006/32 EC on energy efficiency and energy services on the other hand. Electricity consumption for water heating and space heating is well documented since 1977, whereas no information about the consumption of electric appliances and for illumination was available. The
55
present survey significantly improved the information not only on the equipment of households with such appliances but also on the user behaviour. Based on this information the consumption patterns for cooking, laundry washing or entertainment electronics could be calculated. All households connected to the natural gas grid data were additionally surveyed on their natural gas consumption for space and water heating as well as for cooking . The data give an exact picture of the electricity consumption in households by purpose. Furthermore, the database enables the recognition of electricity saving potentials with regard to appliances used and changes in user behaviour.
6.2. Accuracy Generally seen, a moderate underestimation of the overall electricity and natural gas consumption 2008 is likely due to the following reasons:
February 2008 was clearly and March 2008 moderately warmer than the long term average of these two months. The two months with the highest space heating shares, December and January, were out of the survey period. Therefore the heating shares tend to be underestimated.
The months with the shortest daylight periods, November till January, were out of the survey period too. Therefore the electricity consumption for illumination is underestimated for sure.
The following tables show the observed sampling errors. The higher values in single categories are caused by lower sample numbers. Sampling errors for annual electricity and natural gas consumption 2007 (last annual statement)
Sampling errors in %
Cases (non-weighted)
Mean (non-weighted)
95% confidence
level
Total annual electricity consumption in kWh 254 4.518 9,1Total annual electricity costs in € 254 611 8,1Total electricity price in euro per kWh 254 0,14 2,8
Meter 1, annual electricity consumption in kWh 254 3.725 8,1Meter 1, annual electricity costs in € 254 535 7,7Meter 1, electricity price in euro per kWh 254 0,15 2,6
Meter 2, annual electricity consumption in kWh 72 2.621 26,4Meter 2, annual electricity costs in € 72 258 25,6Meter 2, electricity price in euro per kWh 72 0,10 7,0
Total annual natural gas consumption in kWh 82 13.696 17,1Total annual natural gas costs in € 82 716 16,0Total natural gas price in euro per kWh 82 0,06 18,6
56
Annual electricity consumption 2008 in kWhSampling
errors in %
Cases (non-weighted)
Mean (non-weighted)
95% confidence
levelTotal annual electricity consumption 2008 in kWh 254 4.518 9,1Refrigerator 254 316 6,8Freezer 155 398 10,4Stove, oven 237 376 9,5Washing machine 228 206 8,5Laundry dryer 65 313 22,7Dishwasher 185 259 9,4Other kitchen and household appliances 254 163 8,3Office equipment (PC, Laptop) 194 128 17,6Entertainment electronics (TV etc.) 252 186 8,9Communication electronics 143 52 9,4Chargers 238 20 29,4Other relevant domestic appliances 221 192 29,0Stand by: Office appliances (PC, printer etc.) 123 27 24,3Stand by: Entertainment electronics (TV etc.) 218 151 12,5Stand by: Stove, oven 100 42 6,6Stand by: Other household appliances 134 61 10,0Illumination 254 387 9,6Hot water generation 95 1.861 13,9Circulation pump of the heating system 159 407 9,4Space heating 150 1.181 39,7

57
Daily electricity consumption in kWhSampling
errors in %
Cases (non-weighted)
Mean (non-weighted)
95% confidence
levelTotal daily electricity consumption, Winter 254 14,9 11,7Total daily electricity consumption, Summer 254 9,9 7,6Refrigerator 254 0,9 6,8Freezer 155 1,1 10,4Stove, oven , Winter 235 1,2 9,5Stove, oven , Summer 223 1,1 11,2Washing machine, Winter 219 0,6 8,8Washing machine, Summer 216 0,6 9,0Laundry dryer, Winter 63 1,2 23,4Laundry dryer, Summer 49 0,9 23,8Dishwasher, Winter 176 0,8 9,1Dishwasher, Summer 175 0,8 9,6Other kitchen and household appliances, Winter 251 0,5 8,6Other kitchen and household appliances, Summer 251 0,5 9,2Ventilator, dehumidifiers and humidifiers, Winter 22 0,2 69,6Ventilator, dehumidifiers and humidifiers, Summer 19 0,1 59,9Office equipment, Winter 189 0,4 17,8Office equipment, Summer 179 0,4 19,0Entertainment electronics, Winter 250 0,6 8,9Entertainment electronics, Summer 249 0,5 9,9Communication electronics 143 0,1 9,4Chargers, Winter 224 0,1 31,3Chargers, Summer 225 0,1 29,4Other relevant domestic appliances (incl. air conditioners, additional heating), Winter 202 0,8 38,0Other relevant domestic appliances (incl. air conditioners, additional heating), Summer 185 0,4 22,5Stand by: Office appliances, Winter 96 0,1 26,5Stand by: Office appliances, Summer 92 0,1 27,0Stand by: Entertainment electronics, Winter 204 0,5 12,1Stand by: Entertainment electronics, Summer 177 0,5 12,8Stand by: Stove, oven 100 0,1 6,6Stand by: Other household appliances 134 0,2 10,0Illumination, Winter 254 1,5 10,3Illumination, Summer 250 0,7 11,2Hot water generation 95 5,3 13,9Circulation pump of the heating system, Winter 157 1,8 10,4Circulation pump of the heating system, Summer 156 0,4 12,6Space heating, Winter 150 6,7 39,7
Sampling errors in %
Cases (non-weighted)
Mean (non-weighted)
95% confidence
levelNatural Gas, Winter in Bm³ 80 6,7 17,1Natural Gas, Summer in Bm³ 65 0,9 20,9
6.2.1. Sampling effects None observed.
6.2.2. Non-sampling effects None observed.

58
Quality of data sources used
Not relevant
Coverage (misclassifications, undercoverage/overcoverage)
Not relevant
Missing responses (unit non-response, item non-response)
Unit non response: 49%
Item non response: only in single cases and then around 5%
Measurement errors (entry errors)
Not relevant
Processing errors
Not relevant
Model assumption effects
None observed
6.3. Timeliness and punctuality The final data for 2008 were available in February 2009.
6.4. Comparability Pilot survey and therefore not relevant
6.5. Coherence The results of the present survey were compared with the “Household energy consumption survey 2008” and were fitting very well.