Embed Size (px)
Citation preview

1
COUNTRY NOTE ON FISHERIES MANAGEMENT SYSTEMS -- CANADA
1. Overview of Canadian Fisheries
1. Canada has traditionally benefited from the abundant fisheries resources in some of the world’s most productive marine and freshwater systems. These rich fisheries resources have maintained an important fishing industry that provides employment and supports the livelihood of hundreds of small communities in coastal areas.
2. In addition, there is a large recreational fisheries sector comprised of some 3.6 million anglers with annual expenditures of close to CAD 4.7 billion exclusively on sport fishing activities and investments. Furthermore, fishing has been entrenched in the daily life of Canadian aboriginal people in more than 300 First Nations who participate in fisheries for food, social and ceremonial purposes.
3. Aside from capture fisheries, aquaculture has been growing rapidly in Canada. In 1986, the total farm gate value of aquaculture was CAD 35 million. By 2000, production had increased to CAD 600 million, of which 81% was salmon. Trout, mussels and oysters are also major aquaculture species.
4. Canada’s commercial fisheries operate in three broad regions - along the Atlantic and Pacific coasts and inland (mainly near the Great Lakes and Lake Winnipeg). The last decade has seen major changes in the Canadian commercial fisheries on both coasts. The collapse of the Atlantic groundfishery in the early 1990s and the subsequent failure of Pacific salmon fishery in the mid-1990s -- the two traditional staple species in the Atlantic and Pacific fisheries respectively -- have completely changed the landscape of the Canadian fishing industry.
5. The rapid expansion of shrimp and crab fisheries along with continuing strong price performance for shellfish in general, have not only made shellfish the most dominant sector on the Atlantic coast but also brought the overall landed value past the historical record prior to the groundfish moratoria. On the Pacific coast, strong prices for both groundfish and shellfish have helped offset losses in the salmon fishery.
6. The Atlantic fishery remains Canada’s largest, with total landings worth close to CAD 1.8 billion in 2000 accounting for 80% of the total Canadian landed value (CAD 2.2 billion), compared to CAD 958 million and 64% in 1990. The Pacific fishery, valued at CAD 368 million, represented another 16% of the Canadian primary fisheries production, down from CAD 480 million and 32% in 1990.
7. In 2000, four major Atlantic shellfish species alone (lobster, snow crab, shrimp and sea scallop) accounted for 64% of the total Canadian landed value. Adding Atlantic cod, Pacific herring, sockeye salmon, Pacific halibut, geoduck, Atlantic herring, sablefish, Pacific prawn and haddock, the top thirteen species together represented 80% of the Canadian landed value of over 200 fish and shellfish species commercially harvested in Canada.
8. In the processing sector, the production pattern has also changed. Between 1990 and 2000, Canadian export value had grown from CAD 2.6 billion to CAD 4.1 billion. Significant increases were

2
reported in fresh or frozen shellfish and specialty products, from CAD 612 million and CAD 62 million in 1990 to CAD 2.2 billion and CAD 262 million in 2000 respectively, reflecting increased production of shellfish and a shift to value-added products. In effect, these two items alone accounted for 62% of the total export value in 2000. On the import side, import value almost tripled from CAD 731 million in 1990 to CAD 2.1 billion in 2000. Significant increases had occurred in fresh or frozen fish, canned fish and fresh or frozen shellfish from a combined value of CAD 586 million in 1990 to CAD 1.7 billion in 2000, as a result of the shortage of domestic supply of groundfish and salmon as well as increased demand for shellfish.
9. These domestic changes are also reflected in Canada’s international ranking in catches and trade. In terms of catches, Canada ranked 21st in 2000, down from 15th in 1990. On the international trade side, in terms of trade values, Canada became the 5th leading fish exporter in 2000 as opposed to 2nd in 1990 while climbing from the 13th leading fish importer in 1990 to 10th in 2000.
10. The structure of the Canadian fishing industry is characterized by a multitude of small operators and a handful of large vertically-integrated companies. The harvesting sector is composed largely (over 90%) of vessels under 65 feet, with over 70% of the processing plants employing less than 100 workers. For the most part, fisheries are seasonal because of the species harvested and geography. Most small vessels and plants operate less than six months, between May and October, while large vertically-integrated plants are able to operate year round due to continued supply from either their offshore catches or imports. As such, many fishers and plant workers earn incomes lower than those workers in other economic sectors and rely heavily on Employment Insurance (EI) to supplement their incomes.
11. In 2000, there were 56 427 fishers and 23 819 vessels engaged in commercial fisheries on both Atlantic and Pacific coasts. This represented a significant decline from the reported 81 473 fishers and 35 135 vessels in 1990 due to the various adjustment and restructuring measures implemented in response to the Atlantic groundfish and Pacific salmon declines.
12. It was estimated that, in 2000, there were approximately 875 licensed processing plants on both coasts, out of which only 400 plants reported value of shipment of own-manufactured goods over CAD 30 000 with an estimated total value of shipments of CAD 3.5 billion and total annual employment of 20 160 full time equivalents (FTE). It is worth noting that, compared to the 1990 estimate of 23 679 FTEs, there has not been such a significant decline in the processing workforce as was experienced in the harvesting sector. In effect, the workforce has been on an upward trend since 1996 reflecting, as stated above, increased production of shellfish and positive adjustments made in the processing sector.
13. Although nationally the commercial fishery sector has generally accounted for only about 0.3% of the Canadian gross domestic product (GDP), it plays an important role in the economy of coastal regions. In 2000, it was estimated that about 3.6% of the Atlantic GDP (excluding Quebec) was accounted for by the commercial fisheries and 0.4% for the Pacific fisheries.
14. This, however, does still not convey the importance of fishing within coastal regions. Although fishing comprises a relatively small portion of the overall economy of coastal regions, sub-areas are highly dependent on the fishery. For some areas, the fishery is the only available economic activity.
15. Commercial fishing is just part of a larger ocean industry sector, which consists of commercial fisheries and mariculture, offshore oil and gas, ocean transport, ocean tourism (including recreational fishing), marine construction, and ocean manufacturing and services. The total output of the Canadian ocean industry sector was estimated at CAD 22.7 billion in 2000. In real terms, it enjoyed a 7.7% annual growth rate between 1990 and 2000 as opposed to 1.2% annual growth in commercial fisheries alone. In 2000, the ocean industry sector is estimated to have accounted for 1.3% of the Canadian GDP.

3
2. Fisheries Management Systems
Objectives
16. Fisheries management in Canada involves the management and protection of fisheries resources with the following ultimate objectives:
� Conservation of Canada’s fishery resources
� Sustainable utilization of Canada’s fishery resources
� Environmental and economic stability in all fisheries
17. In March 2004, a policy framework for the management of Atlantic Fisheries was released. It contains the four following objectives:
1. Conservation and Sustainable Use: Conservation of marine resources and habitat, and rebuilding of resources and restoration of habitat where necessary, will remain the highest priority for the management of all fisheries.
2. Self-reliance: Self-reliant fisheries and continued collaboration with the provinces and Nunavut, communities, aboriginal groups, industry and others will contribute to the well-being of coastal communities.
3. A Stable and Transparent Access and Allocation Approach: The access and allocation of fisheries resources will be more stable and predictable, and decisions will be made and conflicts resolved through a more fair, transparent and rules-based processes.
4. Shared Stewardship: Participants will be effectively involved in fisheries management decision-making processes at appropriate levels; they will contribute specialized knowledge and experience, and share in accountability for outcomes.
18. On the Pacific coast, the department has initiated a number of policy renewal initiatives to address challenges in the Pacific salmon fisheries. The New Direction policy papers are intended to clarify policy direction for the management of Pacific salmon fisheries. They address promotion of conservation-based fisheries, community-based stewardship initiatives, restoration and enhancement work for fish habitat, and an improvement in consultation processes to ensure that all parties are able to participate in fisheries management decision making.
Institutional Arrangements
19. Under the Constitution Act 1867, the Federal Government is vested with exclusive legislative jurisdiction over sea coast and inland fisheries in all parts of Canada (Section 91). The Federal Department of Fisheries and Oceans (DFO) has been entrusted by the Parliament of Canada through Fisheries Act and Coastal Fisheries Protection Act to administer all laws relating to fisheries.
� In certain provinces, the administration of federal fisheries laws has, by agreement, been delegated to the provincial government. In areas where land claims have been settled, the management of fisheries has been delegated, for the most part, to a Wildlife Management Board.
� In addition, the Species at Risk Act came into force on June 5, 2003, which provides further protection for at-risk fish stocks.

4
20. DFO is responsible for the management of fisheries in the tidal waters of Pacific, Atlantic, and Arctic and in the inland waters of four Atlantic provinces, the territories and salmon rivers in British Columbia.
� This includes management in Canadian portions of transboundary rivers, shared management of most interception fisheries in international waters, and management of the aboriginal, recreational and commercial fishing effort in Canadian coastal waters.
� DFO is also responsible for negotiating international arrangements to advance Canada’s fisheries conservation interests, in co-operation with other national governments, and negotiating and administering international treaties and agreements affecting bilateral and multilateral fisheries relations.
21. The department’s fisheries managers work with all sectors of the fishing industry, provinces, processors, communities and others as required to develop fish management plans. These plans set out rules and regulations pertaining to harvesting.
� In most fisheries managed by DFO, there is an advisory committee comprised of representatives from the various sectors of the fishery. The role of this group is to provide input on management strategies proposed by DFO and to serve as a consultative body for fishers.
� Over the past few years, significant progress has been made in how DFO manages the fisheries through the Integrated Fisheries Management Plan (IFMP) process and various forms of co-management with resource users, with a growing focus on measurable objectives and reference points -- i.e., "objective-based fisheries management". These were reported previously in Canada's country note on costs of managing fisheries.
� Aboriginal fishing for food, social and ceremonial purposes has priority over other uses, after conservation requirements are met.
Management Measures to Maintain the Resource
22. Since 1977, when Canada extended its Exclusive Economic Zone to the 200-mile limit, Canada has employed a variety of management measures to maintain the productive and reproductive capacity of fish stocks.
23. A national inventory of fisheries management regimes in the Canadian main marine fisheries is presented in Annex 1, which indicates the existence of various input control, output control and technical measures as defined in Annex 2. It also shows the availability of catch monitoring programs and the degree of coverage where possible of industry paid at-sea observer and dockside monitoring programs. In addition, information is given on the number of participants and landed value of each fishery concerned.
� As opposed to the on-going management measures, there were special restructuring and adjustment programs in response to resource downturns in the Atlantic groundfish and Pacific salmon fisheries in the 1990s. These programs were delivered in the form of licence buy-back and early retirement programs as well as short-term income support, retraining and economic diversification to assist affected fisheries workers and communities. These were reported previously in Canada's country note on government financial transfers.
� In addition, over the years, DFO has been charging fishing industry for issuance of licences, permits and other privileges. The guiding principle is that those who benefit from access to a public resource managed at public expense should pay a fee that reflects the value of the access

5
privilege. Rather than a pure ‘rent’ calculation, however, this is approximated by a charge on benchmark landed values or on individual quotas authorized.
24. All measures employ limited-entry licensing with vessel and gear restrictions to control fishing capacity, in combination with measures such as Total Allowable Catches (TAC) for most species, escapement targets (salmon), recruitment strategies (e.g., lobster) or trip/period limits to limit catches. Other commonly-used management measures include limitations on fishing area, fishing season, fish (or mesh) size and sex selectivity to ensure conservation. There are vessel replacement rules for all fleet to control growth of capacity.
25. Limits on the quantity/dimension of gear or the amount of time a unit of gear that can be used are usually required as a licence condition for most fixed gear fisheries. There are also restrictions on the dimension of gear in certain mobile gear fisheries such as Southern Gulf of St. Lawrence scallop, Pacific herring and salmon seine fisheries. Such limits are usually set uniformly for all vessels in a given fleet or fishery rather than varying by individual vessels.
26. TACs are the most commonly used output control measures, usually subdivided at area or fleet levels. There are a few major exceptions in which fisheries are managed with the objective of meeting escapement targets in terms of the number of adult fish returning to the spawning grounds (Pacific salmon), or increasing the survival rate of the female population (Pacific prawn and Atlantic lobster).
27. Trip/period limits are applied through industry plans in various forms, such as limits for directed species, by-catch limits, and small-fish protocols. Once the limit is reached, a vessel is required to either stop fishing or move to other fishing grounds. As such, these limits are difficult to enforce without full-scale at-sea observers or dockside monitoring.
28. Technical measures such as restrictions on mesh size or actual fish size are commonly applied in most fisheries. Notable examples of sex selectivity are prohibitions to harvest any female crab and berried lobster. Nearly all fisheries have some sort of restrictions on fishing area or fishing season or both. In some cases, fisheries are closed for a period to avoid conflict with fishing of other species in the same area.
29. All fisheries are subject to various degree of catch monitoring, ranging from periodic catch reporting, submission of log books, sales slips, and at-sea hail-in of catch estimates. Catch monitoring activities also include random at-sea boardings and dockside inspections by fisheries officers.
Market-like Instruments
30. Market-like instruments -- in the form of Enterprise Allocations (EA) and Individual Quotas (IQ) -- have been introduced in some fisheries as a way to integrate capacity and catch control to overcome the common property problem. (See Box below for the definition of market-like instruments.)
� In general, EA/IQ management can be implemented if agreed to by consensus within the membership of a fishery. Transfers of quotas in the form of individual transferable quotas (ITQ) or transferable individual vessel quotas (IVQ) can take place as per agreed guidelines (such as imposition of an upper limit to prevent concentration of quotas) between the government and industry participants in the fishery.
� At a more aggregate level, community-based quotas are managed by individual community groups and temporary quota transfers are permitted between communities.
31. In most cases, EA/IQs are determined as percentage shares of the global or area/fleet quotas either evenly distributed or based on catch histories among the participants. Further, licence fees charged

6
to the EA/IQ holders are calculated on a per-ton-of-quota basis as opposed to a fixed amount based on a benchmark landed value for non-EA/IQ holders.
32. Individual effort quotas (IEQ) are rarely applied in Canada, although, as stated above, it is a common practice to impose limits on the quantity of gear or the amount of time a unit of gear that can be used for most fixed gear fisheries (notably the trap limits per licence for lobster and crab fisheries).
33. In the sea urchin fishery along the southwest and east coasts of Nova Scotia, there is an individual restricted zone system (one licence per area) where qualified fishers can benefit from non-competitive fishing practices.
34. Rights-based systems have gained increasing acceptance in Canada. In 2000, out of 67 850 commercial licences/permits issued in main marine fisheries, at least 12 729 were under a variety of rights-based systems, representing 19% of all major species licences/permits issued. Further, these rights-based fisheries registered a total landed value of CAD 1.2 billion, accounting for at least 56% of the total landed valued value (CAD 2.1 billion) reported in main marine fisheries listed in Annex 1.
35. Approximately 26 out of the 45 rights-based fleets/fisheries defined in Annex 1 have adopted EA or ITQ/IVQ and permanent transfers of quotas are allowed in about 17 fleets/fisheries. Almost all rights-based fleets/fisheries are subject to industry-paid at-sea observers and dockside monitoring programs (DMP), with the majority implementing a full-scale (100%) DMP.
36. The next section highlights key observations from this country note on the use of market-like instruments in Canada. This is then followed by a more detailed description of main marine fisheries and fleets on a species-by-species (or fishery-by-fishery) basis for which market-like instruments (mainly in the form of various rights-based systems) are in use, particularly on the experience with the implementation of such instruments where information is available. The reader is encouraged to consult Annex 1 to identify fisheries in which a particular market-like system is employed.
3. Observations
37. Fisheries management regimes in Canada have been undergoing constant evolution in response to changing environmental, economic and social conditions. Before the introduction of rights-based systems, the fishing industry had already been well-tuned to various forms of input/output control and technical measures such as limited-entry licensing, TACs, time/area closures, and size/sex selectivity, etc. Such experience appears to have facilitated a smooth transition into various rights-based systems in Canadian fisheries.
38. Like any other economic sector, there is always a mixture of independent family-based inshore fishers and incorporated business enterprises (mostly in the midshore/offshore sector) in the fishing industry. The aspiration and needs of these various economic enterprises often dictate the form of rights-based systems to be implemented.
39. Rights-based systems exist in different forms. On one end of the spectrum, there is the so-called community based management (CBM) approach, in which quotas are allocated to and managed by individual communities as opposed to individual licence holders. Such a system is usually adopted when there exists a critical mass normally consisting of numerous small independent operators from geographically congruent fishing communities, who advocate self management at the local community level in order to better address the social and economic needs of their communities. Notable examples are the Scotia-Fundy groundfish fixed gear < 45 ft. sector and many aboriginal commercial communal licences.
7
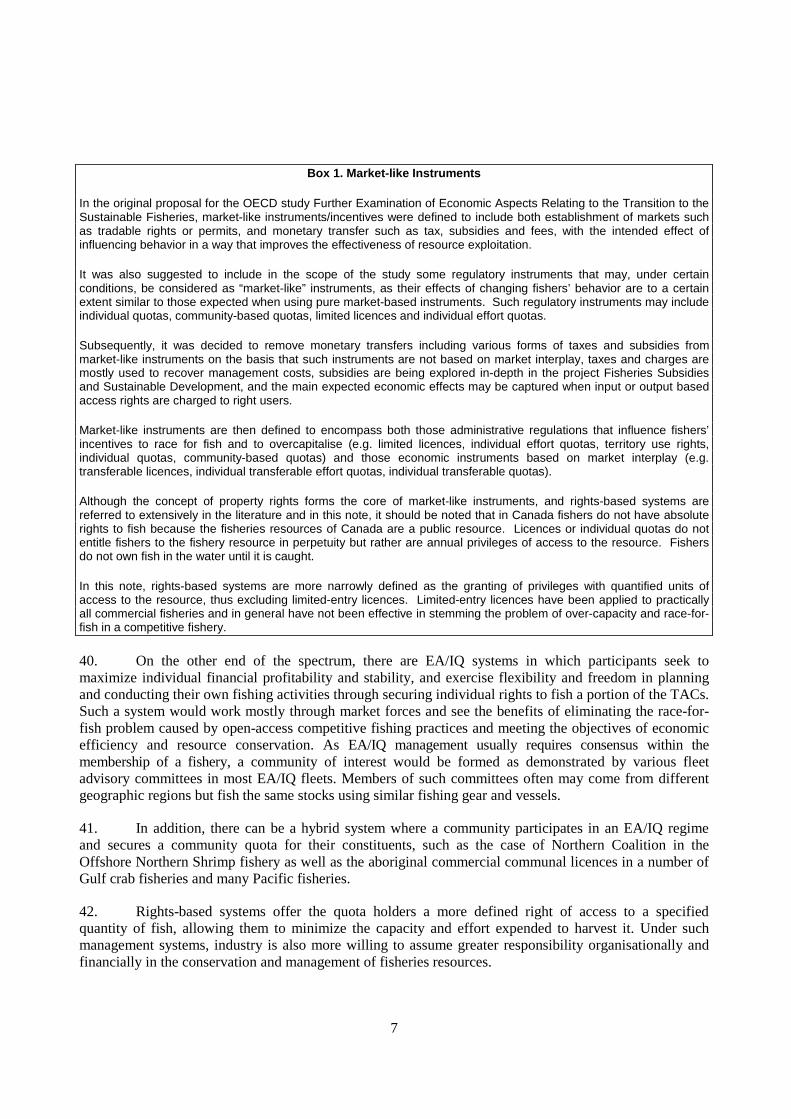
Box 1. Market-like Instruments
In the original proposal for the OECD study Further Examination of Economic Aspects Relating to the Transition to the Sustainable Fisheries, market-like instruments/incentives were defined to include both establishment of markets such as tradable rights or permits, and monetary transfer such as tax, subsidies and fees, with the intended effect of influencing behavior in a way that improves the effectiveness of resource exploitation.
It was also suggested to include in the scope of the study some regulatory instruments that may, under certain conditions, be considered as “market-like” instruments, as their effects of changing fishers’ behavior are to a certain extent similar to those expected when using pure market-based instruments. Such regulatory instruments may include individual quotas, community-based quotas, limited licences and individual effort quotas.
Subsequently, it was decided to remove monetary transfers including various forms of taxes and subsidies from market-like instruments on the basis that such instruments are not based on market interplay, taxes and charges are mostly used to recover management costs, subsidies are being explored in-depth in the project Fisheries Subsidies and Sustainable Development, and the main expected economic effects may be captured when input or output based access rights are charged to right users.
Market-like instruments are then defined to encompass both those administrative regulations that influence fishers’ incentives to race for fish and to overcapitalise (e.g. limited licences, individual effort quotas, territory use rights, individual quotas, community-based quotas) and those economic instruments based on market interplay (e.g. transferable licences, individual transferable effort quotas, individual transferable quotas).
Although the concept of property rights forms the core of market-like instruments, and rights-based systems are referred to extensively in the literature and in this note, it should be noted that in Canada fishers do not have absolute rights to fish because the fisheries resources of Canada are a public resource. Licences or individual quotas do not entitle fishers to the fishery resource in perpetuity but rather are annual privileges of access to the resource. Fishers do not own fish in the water until it is caught.
In this note, rights-based systems are more narrowly defined as the granting of privileges with quantified units of access to the resource, thus excluding limited-entry licences. Limited-entry licences have been applied to practically all commercial fisheries and in general have not been effective in stemming the problem of over-capacity and race-for-fish in a competitive fishery.
40. On the other end of the spectrum, there are EA/IQ systems in which participants seek to maximize individual financial profitability and stability, and exercise flexibility and freedom in planning and conducting their own fishing activities through securing individual rights to fish a portion of the TACs. Such a system would work mostly through market forces and see the benefits of eliminating the race-for-fish problem caused by open-access competitive fishing practices and meeting the objectives of economic efficiency and resource conservation. As EA/IQ management usually requires consensus within the membership of a fishery, a community of interest would be formed as demonstrated by various fleet advisory committees in most EA/IQ fleets. Members of such committees often may come from different geographic regions but fish the same stocks using similar fishing gear and vessels.
41. In addition, there can be a hybrid system where a community participates in an EA/IQ regime and secures a community quota for their constituents, such as the case of Northern Coalition in the Offshore Northern Shrimp fishery as well as the aboriginal commercial communal licences in a number of Gulf crab fisheries and many Pacific fisheries.
42. Rights-based systems offer the quota holders a more defined right of access to a specified quantity of fish, allowing them to minimize the capacity and effort expended to harvest it. Under such management systems, industry is also more willing to assume greater responsibility organisationally and financially in the conservation and management of fisheries resources.
8
� The social impact of rights-based systems is generally hard to determine due to offsetting effects and lack of data. Some loss of harvesting employment is expected where fleet rationalization takes place, which, however, is usually accompanied with increased crew earnings and length of employment for those remaining. There are also reports of geographic redistribution of landings, which could have some impact on the local economy of affected communities.
43. It is fair to conclude that there is no one-size-fits-all solution. For example, the cooperative pooling system for the Pacific roe herring fishery has proven to be a working alternative to rights-based systems. One could even argue that an open-access regime may have its merit in some small-scale and artisanal fisheries with restrictive gear, such as handlines, where the resource is not threatened and there is no need to incur extra management and enforcement costs. On the other hand, rights-based systems do not necessarily come without problems. For instance, highgrading and increased administrative/enforcement costs have been reported in a number of EA/IQ fisheries while CBM may face a potential latent capacity problem.
44. Finally, in situations where the resources become scarce or decline for whatever reasons, there is a need for governments, fishing industry and communities to look for creative solutions both within and outside the fisheries -- in particular, alternative opportunities that may exist in the broader ocean economy.
4. Main Marine Fisheries with Market-Like Instruments
Atlantic Fisheries
Groundfish
45. The Atlantic groundfish fishery is a multispecies fishery, targeting a variety of groundfish species with a variety of gears and vessel sizes. Cod has traditionally been a mainstay of the fishery, but haddock, pollock, redfish and many flatfish species are also targeted. The fishery has, for some time, been divided into inshore, midshore and offshore sectors. Inshore vessels are less than 65 feet and typically fish within 50 or 60 miles of the coast, midshore vessels range from 65 to under 100 feet in length, and offshore vessels are greater than 100 feet and fish more than 50 miles out from the coast. Today the size of the vessel does not necessarily restrict owners to where fishing occurs. Also, many EA holders of licences > 100 ft. use less than 65 ft. vessels. Groundfish resources have been managed in three areas: stocks of the Grand Banks, Labrador Shelf and Davis Strait; stocks of the Gulf of St. Lawrence; and stocks of the Scotian Shelf, Bay of Fundy and Georges Bank. Management measures common to all fisheries include limited entries, fleet quotas, gear and mesh size restrictions, small fish protocols, open seasons and closures.
46. The Grand Banks, Labrador Shelf and Davis Strait fishery is prosecuted in NAFO (Northwest Atlantic Fisheries Organization) Sub-Areas 0, 2, 3 and Division 4R. Until the moratorium in 1992, cod was fished in all coastal areas, and by larger vessels offshore. Redfish fisheries were primarily in offshore deep-water areas, with most of the fishing effort in the southern and western divisions. Flounder fisheries were primarily on the Grand Banks and St. Pierre Bank by offshore trawlers. The inshore fishery has traditionally been a fixed-gear cod fishery, with less emphasis placed on other species such as flounders, lumpfish and skates. With the moratorium on cod fishing, more effort in recent years has been directed to these other species. The northern cod fishery (2J3KL) fishery, after the moratorium introduced in 1992, was reopened in 1998 as a limited index fishery, but was closed again for an indefinite period in 2003 due to poor resource conditions. The important commercial fisheries that remain open at present are Greendland halibut, 3O redfish and 3LNO yellowtail flounder.

9
47. The Gulf of St. Lawrence fishery is divided into two major groundfish fishing grounds: the Southern Gulf (4T) and the Northern Gulf (4RS, 3Pn). Since the moratorium in 1993, DFO has not permitted vessels access to the cod winter fishery in 4Vn but vessels with 4Vn allocations were permitted to harvest their allocations in 4T. A moratorium on cod was introduced in the Northern Gulf in 1994. Since the re-opening in 1997, the cod fishery had been conducted with fixed gear only, and was closed again for an indefinite period in 2003 due to poor resource conditions. Apart from cod, traditionally, there has been an important redfish fishery mainly prosecuted by inshore mobile gear fleet and large offshore vessels. The fishery was closed in 1995 and re-opened in 1998, on a limited basis, for index program and sentinel fishery. At present, only flatfish fisheries remain open commercially (notably, 4T American plaice and winter flounder, 4RST witch flounder, Atlantic halibut and Greenland halibut).
48. The Eastern Scotian Shelf fisheries for cod and haddock were closed in 1993 and remain under moratoria. Fixed-gear fleets maintain a fishery in this area based mainly on pollock, and halibut. The inshore mobile-gear fleet continues to fish for pollock, flatfish and redfish, while the offshore fleet concentrates its fishing on redfish, halibut, hake and pollock. The Western Scotian Shelf is presently fished predominantly by the inshore fleets, both fixed and mobile. An exception to this is the pollock fishery, where almost half of the quota is allocated to the offshore. Georges Bank is also fished primarily by the inshore fleets at this time. Cod and haddock were the main species fished historically, but a yellowtail flounder fishery was established in the early 1990s. The offshore fleets are managed on an Atlantic-wide basis and the Scotia-Fundy based large trawler fleet fishes in waters outside the region.
49. The rights-based system in the Atlantic groundfish fishery started with the Atlantic-wide Enterprise Allocation (EA) Program for offshore vessels (100 ft. and over) owned by fishing firms. A trial EA program was introduced in 1982 in order to achieve orderly harvesting in the offshore sector. During the trial period, it was evident that the EAs contributed to a more economically efficient and stable pattern of fishing, reduced fishing capacity, more uniform harvesting and processing activity throughout the year and better marketing of products. In 1989 it was decided to continue the program on a permanent basis. Landings from offshore EAs are subject to an industry-funded full-scale Dockside Monitoring Program (DMP). Annual EAs are based on percentage shares of the offshore quota and have been based, for the most part, on catch history prior to the implementation of EAs. Any portion of an EA can be transferred on a temporary basis between enterprises. All permanent transfers must be approved by the Minister of Fisheries. The offshore groundfish fleet is represented by the Groundfish Enterprise Allocation Council (GEAC) for EA companies holding groundfish licences for vessels greater than 100 ft., which is responsible for developing Conservation Harvesting Plans (CHP) and participating in management consultations with DFO. Highgrading and area misreporting have been cited as enforcement concerns associated with EAs, which however have also occurred throughout the fishery.
50. The Atlantic-wide midshore groundfish EA program did not come into effect until 1988. Prior to the introduction of the EA program, many groundfish vessel owners were faced with replacing or modernizing their vessels in order to remain in the fishery. Given the success in the offshore EA program, vessel owners were willing to adopt EAs for cod as a possible measure to revitalize their operations. A five-year trial midshore EA program was implemented in 1988 and became permanent in 1994. Landings from midshore EAs are also subject to an industry-funded full-scale DMP. Temporary transfers of EAs are allowed. All permanent transfers must be approved by the Minister of Fisheries. The Midshore Groundfish Vessel Owners Working Group represents only the fixed-gear fleet while the executive director of GEAC also represents the midshore mobile gear fleet in the development of CHPs and consultations with DFO. It is hard to assess the impact of the program on the fleet as the poor resource conditions since 1988 have resulted in a rapid decline in fishing activity. There was evidence that some participants had traded their entire allocation of one species in order to gain access to larger quantities of other species to make their operations viable. Enforcement officials have indicated that the movement to EAs has resulted in increased highgrading and area misreporting.

10
51. The implementation of ITQs in the inshore mobile groundfish fleet took place at different times and in different manners, depending on stock areas. As a result of recommendations from the Task Force Report on Atlantic Fisheries, a three-year pilot project in enterprise allocations was undertaken in 1984, in conjunction with the owner/operators of otter trawlers less than 65 ft. based at ports along the west coast of Newfoundland. The project was later extended to five years and included vessels from the Quebec North Shore (4S). In 1989, at the request of industry, the trial program became a ten-year program with percentage shares of cod allocated to each vessel dependent on the length category of the vessel. The program was extended in 1999 for a ten-year period ending 2009. Both temporary and permanent transfers of allocations are allowed, subject to a maximum ceiling. The program was managed through a local management committee in each area with an overall management committee overseeing the management throughout the Gulf, including its monitoring and supervision. There has been no directed cod fishery for this fleet since the cod moratorium in 1993.
52. The ITQ program for the mobile gear vessels less than 65 ft. in the Southern Gulf of St. Lawrence (4T) was developed in three stages. First, the fleet consisting of vessels between 50 ft. and 65 ft. and wholly dependent on groundfish adopted a one-year trial ITQ program in 1989, with individual quotas allocated according to length category and historical performance for cod and an equal allocation of 4T American plaice. With a high degree of satisfaction, the program became a ten-year program in 1990. As in the Northern Gulf, the Southern Gulf program has been extended for another ten years to end in 2009. The fleet of vessels from 45 ft. to 49 ft. did not agree with the allocation formula in 1989 and remained fishing competitively until 1992 when a revised formula based on historical catch of 4T cod and 4T American plaice was accepted by this fleet. In 1993, this fleet was integrated into the 50 ft. to 65 ft. fleet and administered under a single ITQ management committee. The small vessel fleet (less than 45 ft.) involved far more licence holders with highly variable degree of dependency on groundfish. A separate allocation formula for cod was developed for this fleet and not all the licence holders participated in the ITQ program, which became fully operational in 1993 as part of the ITQ fleet less than 65 ft. Both temporary and permanent transfers of allocations are allowed, subject to a maximum ceiling. Although there was evidence of capacity reduction in the 50 ft. to 65 ft. fleet during the first few years of ITQ implementation, the impact of the program on the remaining inshore mobile gear fleet is difficult to measure due to the groundfish moratoria introduced in the mid 1990s.
53. The ITQ program for the Scotia-Fundy inshore mobile gear groundfish fleet was first introduced as a result of recommendations from a 1989 Task Force study to address the significant over-capacity problem in this fleet. A working group including industry and DFO representatives was established to design the program, which came into effect in 1991. Initially, there was not a great deal of industry support for this new management system, but the majority of participants who remained in the ITQ program three years later generally supported it. Although the program was introduced on a three-year trial basis, the participants elected to make it permanent and to endorse the permanency of quota transfers a full year earlier than the scheduled review. Each vessel had a percentage share of the total inshore mobile gear quota based on their catch history, with a maximum ceiling in terms of all the groundfish ITQs that a quota holder may own or hold. The species covered include cod, haddock, pollock, redfish and flatfish. Silver hake has also recently been added under ITQ management. An industry ITQ committee provides feedback, advice and recommendations to DFO on all matters associated with the ITQ program. There is a “Generalists” group currently consisting of 28 mobile gear vessels that have chosen to fish their combined ITQs as a fleet quota and develop seasonal quotas with trip limits. Through a variety of financial arrangements, industry has made contributions to resource surveys and funded special research projects. There was evidence of capacity reduction in this fleet during the first few years of ITQ implementation as well as reduced operating costs and improved prices. Also, there was evidence of more quota being transferred into a number of specific areas in the region. Enforcement concerns have now shifted to at-sea discarding, trans-shipping and area misreporting as these violations tend to increase under an IQ system.

11
54. In the inshore fixed-gear sector, at the request of the Quebec fleet, DFO agreed to split the 4RST Greenland halibut quota between Newfoundland and Quebec so that the Quebec fleet could implement an IQ system for the fishery in 1995. Fixed-gear vessels of 45-65 ft. fishing from Nova Scotia ports established an ITQ program in 1997 and the New Brunswick portion of this fleet adopted a separate ITQ system in 1998. These fleets have fully transferable individual quotas for cod, haddock, pollock, halibut and white hake. Temporary quota transfers are permitted between the mobile and fixed gear ITQ fleets. The 3Ps cod commercial fishery was reopened in 1997 followed by 2J3KL cod in 1998 as a limited index fishery (closed in 2003). For tighter control and monitoring, IQ systems were introduced in 1998 for both inshore mobile and fixed gear vessels fishing 3Ps cod and in 1999 for the inshore fixed gear 2J3KL cod fishery.
55. The Scotia-Fundy fixed gear fleet of vessels less than 45 ft. consists of over 2 500 licences and has adopted a community-based management (CBM) approach since 1996 as an alternative to individual quota systems. In 1996, the fixed-gear sector was initially divided into a series of community or geographic quota groups for cod, haddock and pollock stocks in the 4X5Y stock area. A quota was calculated for each group based on the average landings within the community using the average catch from 1986-1993. This community management format was extended for a three-year trial period that began in 1997 where the fleet quota in 4X+5 was divided into seven geographic sub-allocations, based on the 1996 formula. The quota groups largely follow the county boundaries. Each of the different community management boards develops harvesting plans that generally include further quota divisions into three gear sector quotas for handline, longline and gillnet groups. Specific seasonal quotas are usually established for each of these quota groups, as are industry monitored trip limits. A single competitive harvesting plan is developed in 4X5Y for halibut by all the community management boards, as separate community quotas are not developed for this stock. The combined harvesting plan includes industry agreement on seasonal quotas and industry monitored trip limits. The CBM approach allows for community solutions to problems in fish management and gives industry associations the opportunity to develop conservation harvesting plans that address seasonal fishing patterns and provide most benefit to their own groups. Community boards are permitted to trade quotas on a temporary basis at the community level. These measures have had the result of reducing the utilization of licences in these fleets, with some 700 licences actively engaged in the fishery at present. There is a concern, however, that such a low utilization of groundfish licences could be due to more fishers involved in the high-valued lobster fishery. A potential latent capacity problem may exist should there be a renewed interest in groundfish by holders of unutilized licences.
Herring
56. Canadian herring stocks are distributed in three broad management areas: stocks off the East and South Coasts of Newfoundland (NAFO 2J3KLPs), stocks of the Gulf of St. Lawrence (NAFO 4RSTVn), and stocks on the Scotian Shelf and in the Bay of Fundy (NAFO 4VWX). These herring migrate extensively annually in large schools throughout coastal waters, between spawning grounds and feeding areas, where fisheries are carried out. The fisheries are commonly regulated by limited entries, fleet and area quotas, gear and mesh size restrictions, small fish limits, opening dates, fishing areas and seasons.
57. Five herring stock complexes -- distributed along the northeast and southeast coasts of Newfoundland -- have historically supported commercial, food and bait fisheries. These stocks are characterised by the predominance of spring-spawning herring. The fisheries in all Eastern Newfoundland stock areas were closed in the early 1980s due to declining abundance caused by poor recruitment subsequent to the 1968 year class. The fishery reopened in the mid 1980s as a result of significant recruitment from the 1982 year class. These stocks are fished by inshore vessels less than 65 ft. Although controlled by a biological TAC, the fishery since the mid 1980s has been driven largely by market availability, and in most years quotas have not been taken.

12
58. The Gulf of St. Lawrence stocks consist of the west coast of Newfoundland (4R), Quebec North Shore (4S) and Southern Gulf (4TVn). Herring found along the west coast of Newfoundland are comprised of two stock components, spring and fall spawners, fished by large purse seiners and inshore vessels. The Quebec North Shore fishery is mainly executed by inshore vessels using gillnets. Herring in the southern Gulf is fished in the spring when stocks are concentrated on or near the spawning grounds around the Magdalen Islands and the Northumberland Strait. In the fall the fishery takes place when stocks concentrate on or near the spawning grounds located throughout the Southern Gulf. The spring fishery is directed towards bait, herring fillets, cured products and the bloater plants in southeastern New Brunswick. The fall inshore fishery is directed almost exclusively to the Japanese herring roe market, while the large seiners direct mainly for herring fillets.
59. The 4VWX herring fisheries are divided into four components: Southwest Nova Scotia/Bay of Fundy (4WX) spawning component, Southwest New Brunswick migrant juveniles, Coastal (South Shore, Eastern Shore and Cape Breton 4Vn) Nova Scotia spawning component; and Offshore Scotian Shelf Banks spawning component. The 4WX fishery is the largest herring fishery in the western Atlantic. It is predominantly based on fish from the major spawning areas off Southwest Nova Scotia, which comprises the Bay of Fundy spawning component (4WX) stock complex. This area also contains migrants from the Gulf of Maine and discrete localised herring spawning groups along the Atlantic coast of Nova Scotia. The 4WX herring fishery involves gillnets, traps, weirs and the purse seine fleet. The large weir catches on the New Brunswick side of the Bay of Fundy are believed to be primarily of juveniles originating in the Gulf of Maine. This passive fishery is not subject to catch limits but is constrained, not only by resource availability, but also by market. The Nova Scotia coastal fisheries are mainly carried out by inshore vessels using gillnets while the offshore Scotian Shelf component is fished by purse seiners.
60. The 4WX purse seine herring fishery was the first major Canadian fishery where an individual vessel quota program was applied. The purse seine fishery was developed in the 1960s as a result of strong market demand for fish meal. In the early 1970s, low TACs and low fish meal prices plagued the purse seine industry. In 1976, in a major effort to restructure the Bay of Fundy herring industry from low-valued meal processing to higher-priced food processing, the federal government, among other measures, moved to manage the herring purse seine fishery using a “boat sub-allocation” scheme to achieve economic viability. Some success was immediate as the 1976 fishery lasted six weeks longer than the 1975 fishery. In the early 1980s another market crisis in over-supply of herring prompted a ten-year fleet rationalization plan (1983). The ten-year program was an ITQ program, where the initial allocation involved a fixed percentage share of the annual purse seine quota for each vessel depending on the vessel category: mobile, non-mobile and processor-owned. Buyers of quota could purchase in any increment but could not hold more than 4% of the purse seine quota. Upward transfers (e.g. from independent to processor-owned vessels) were not permitted. There was evidence of capacity reduction during the first few yeas of implementation. The number of licences has been constant at around 40 since 1993, while the number of active vessels has been declining over the years (to 28 at present). Widespread misreporting of catches throughout the duration of the 10-year plan was a serious problem that compromised the effectiveness of the program. To correct this problem, an industry-funded DMP was implemented in the 1992-93 fishing season. In addition to the multi-sector consultations under the Scotia-Fundy Herring Advisory Committee, a Purse Seine Industry Monitoring Group was established to address in-season fishing issues and make adjustments to the Conservation Harvesting Plan approved by DFO.
61. The establishment of ITQs in the Gulf of St. Lawrence large purse seine fleet (65 ft. and over) was part of the above mentioned Atlantic-wide ten-year herring seiner management plan introduced in 1983. The Atlantic-wide seiner fleet was divided into two fleets with separate quota and fishing areas. The Gulf vessels were restricted to NAFO 4RST and 4Vn while the Scotia-Fundy vessels were only allowed access to 4WX and 5Ze. The initial quota allocation was divided equally among the Gulf fleet. Initially the fishery was monitored using DFO enforcement personnel until 1991 when an industry-funded DMP was

13
put into place. During the 10-year plan, the number of seiners in the Gulf was reduced from 16 to 11, representing a reduction of 31%. The impact of ITQs on the fishing effort and prices is difficult to assess. It would appear that market conditions have a stronger influence on effort and prices. The Gulf Small Pelagics Advisory Committee serves as the primary vehicle through which stakeholders from Quebec, New Brunswick, Prince Edward Island, Nova Scotia and Newfoundland are consulted on Gulf herring issues. There are also Area Advisory Committees or Working Groups to consult on local issues.
62. The 4R herring purse seine fishery started as an experimental fishery in 1988 to assist fixed gear groundfish vessels less than 45 ft. to diversify from traditional groundfish fisheries, and to secure, for small independent plants, a continuous supply of high-quality fish. The program is essentially a vessel quota program, where trades or transfers of allocations are not permitted. Beginning in 1993 the fleet was subject to an industry-funded full-scale DMP. The management of the fishery is done through the 4R Small Pelagics Advisory Committee comprised of representatives from all aspects of the pelagic fisheries in the 4R area and DFO managers and scientists.
Capelin
63. There are three capelin stocks in eastern and southern Newfoundland: NAFO 2J3KL, 3NO, and 3Ps. The 3NO stock is managed by NAFO and no Canadian fishery takes place in this area. A fourth stock is found on the west coast of Newfoundland and the Gulf of St. Lawrence (4RST). Historically, a small domestic fishery with an estimated annual harvest of about 25,000 tonnes existed for spawning capelin on Newfoundland beaches to provide food, bait and fertilizer for local residents. A large inshore commercial fishery came into prominence through the late 1970s to mid 1980s in response to a growing Japanese roe capelin market, and became the sole harvesting sector in Atlantic Canada in the 1990s. The bulk of the inshore fishery occurs along the northeast coast of Newfoundland where the major stock component is situated (3KL). About 20% of the Canadian quota and a similar proportion of recent annual landings occur in a significant commercial fishery along the west coast of Newfoundland. A small fishery dominated by traps and weirs is located along the Quebec north shore and in the St. Lawrence River estuary (4ST). The fisheries are commonly regulated by limited entries, fleet and area quotas, gear and mesh-size restrictions, roe-bearing female content, opening dates, fishing areas and seasons.
64. The TAC for the Newfoundland fishery is divided among fleet sectors within quota management areas, determined by geographical location and gear type, and is allocated according to an established sharing arrangement. Quota within each fleet sector is fished competitively. Since 1995, DFO has entertained proposals for an IQ fishery based on the principle of equal sharing of area quota among licence holders. In 1998 purse seine fishers in 4R3Pn agreed to conduct an IQ fishery based on a combination of equal shares and the landing history of individual area fishers since 1993. This arrangement continued in 1999. Approval for IQ projects is subject to a minimum two-thirds majority support among licence holders in a quota-area fleet and implementation of industry funded DMP. The management of the fishery is done through a Small Pelagics Advisory Committee comprised of industry representatives and DFO managers and scientists.
Swordfish
65. The Atlantic swordfish fishery began commercially in the late 1880s as harpoon sailing vessels fished swordfish throughout Atlantic Canada and eventually expanded their fishery along the annual migration patterns of the eastern seaboard of North America. In the early 1960s, the Atlantic swordfish fishery shifted from a harpoon to a longline fishery and landings increased. North Atlantic swordfish stocks come under the stewardship of the International Commission for the Conservation of Atlantic Tunas (ICCAT), established in 1969. National allocations are established by ICCAT to those member countries with a history of fishing swordfish. DFO manages the Canadian fishery by further dividing the ICCAT

14
quota, through consultations within the Atlantic Large Pelagics Advisory Committee, into separate allocations to the harpoon and longline sectors in the directed swordfish fisheries, as well as a small amount of by-catch quota for the offshore tuna sector. The fishery follows the seasonal migration of the swordfish through Canadian waters. Harpooning for swordfish currently occurs primarily along the edges of Georges and Browns Banks while the large pelagic longline fishery extends from Georges Bank south of Nova Scotia to beyond the Flemish Cap east of Newfoundland when swordfish migrate into and adjacent to the Canadian EEZ. Common management measures include limited entries, fleet quotas (directed and by-catch), gear restrictions, small fish limit, time and area closures.
66. The longliners usually account for 90% of the Canadian swordfish catches. Out of over 1,000 harpoon licences, there are only about 140 actively reporting catches in recent years. The majority of the longline licences are currently based in the Scotia-Fundy while the remaining licences are held in Newfoundland. Over the past few years, few Newfoundland licenced vessels have participated in the pelagic fishery due to involvement in other fisheries (i.e., snowcrab and shrimp). DFO has been promoting increased responsibility within the various fleets for their own actions, by encouraging fleets to recommend and adopt measures which include self-management (reporting on fishing activities to their own Associations, internal sharing of the fleet sector quota, industry-funded full-scale DMP, advising DFO of early closures of the fishery if necessary, etc.). In 2002, the longline fleet adopted the ITQ system, where permanent transfers of quotas are permitted up to a cap of 5%.
Snow Crab
67. The Atlantic snow crab resource is highly cyclical and is being managed in three broad zones: Coastal Newfoundland, the Gulf of St. Lawrence, and Eastern Nova Scotia. In general, the capture of all female snow crab, as well as males with a carapace width under 95 mm, is prohibited. This reduces the impact of the harvest on the reproductive potential of the snow crab resource, since females, undersized males, and unharvested legal-sized males are considered sufficient to maintain snow crab reproduction. As well, the management of the fishery includes soft-shell closure periods or soft-shell catch limit to protect molting crab. Other management measures include limited entries, fleet quotas, trap limits per licence, fishing season, and number of fishers, etc.
68. Snow crab has been harvested in Newfoundland as early as the late-1960s. Initially crab was taken as bycatch in groundfish gillnet fisheries. During the 1970s directed snow crab fisheries developed along the Northeast Coast of the Island, primarily in NAFO 3L. The fishery in 3K began to develop in the mid-1970s. Crab fishing occurred sporadically in 3Ps in the 1970s but did not occur on a regular basis until the mid-1980s. The fishery in 2J also began in the mid-1980s while the first substantial landings in 4R occurred in the early 1990s. There are three distinct fleets in the Newfoundland snow crab fishery: full-time licence holders (50 – 65 ft.), supplementary licence holders (35 – 65 ft.), and temporary (seasonal) permit holders (less than 35 ft.). The full-time fleet has changed very little over the past 15 years. As the snow crab fishery developed and new or increasing resources became apparent, access was granted to other fishers to help supplement their groundfish incomes. Consequently, the supplementary and temporary fleets have grown rapidly during the late 1990s. In addition, exploratory licences have also been issued to fishers for some areas in 2J, 3Ps, 4R and 3Pn as well as the areas outside 200 miles in 3LNO.
69. The Gulf of St. Lawrence stocks can be further divided into three sub-management areas: Estuary and Northern Gulf of St. Lawrence, Southern Gulf of St. Lawrence, and West Coast of Cape Breton. The Gulf fisheries all developed around the late 1960s and 1970s. The commercial snow crab fishery in the Estuary and Northern Gulf intensified in the late 1970s and is executed by vessels less than 50 ft. using baited traps. The Estuary and Northern Gulf stocks fished mainly by vessels less than 50 ft. are divided into five traditional management areas numbered 13 to 17, from east to west, with Area 16 being the most productive ground. The Southern Gulf stocks (Areas 12, 25 and 26) are fished mostly by midshore vessels

15
(45 – 65 ft.) from New Brunswick, Quebec and Nova Scotia, and inshore vessels (less than 45 ft.) from P.E.I. Stocks off the West Coast of Cape Breton (Areas 18 and 19) are fished exclusively by Nova Scotia inshore vessels. With the steady rise of the stocks and good prices, the resource has been shared on a temporary basis for a few years since 1995 with non-traditional groups including aboriginals, inshore fishers and midshore groundfish fishers. In addition, there are exploratory fishing zones established adjacent to Area 12 so as to collect biologicial and commercial data in order to better understand the status of these stocks in relation to Area 12.
70. Interest in fishing snow crab off the Eastern Nova Scotia began in the mid to late 1970s. This is an inshore fishery distributed in five management areas numbered 20 to 24, from north to south. Vessels in the northern Areas 20-22 fish closer to shore although there was a small amount of new effort in the unfished offshore portion of Area 20 in 1999. Vessels in Areas 23 and 24, on the other hand, fish greater distance from shore. Areas 23 and 24 are the most productive in terms of catch per trap haul, total harvest and average catch per fisher. Also, the crab grounds in these two areas were the least "crowded" in terms of the amount of fishing ground available per fisher. Therefore, annual temporary crab permits have been permitted in these areas since 1995.
71. The Area 19 snow crab fishery was the first in Atlantic Canada to adopt ITQs as a management tool. Since the implementation of ITQs (based on equal shares of the global quota) in 1979, the lucrative fishery has expanded over time by reducing boat quotas and increasing the number of inshore licenses. These licenses were issued to existing inshore bonafide fishers, i.e., fishers holding licenses for major species such as lobster, groundfish, etc. In addition, due to increased crab prices, temporary sharing with local core fishers has taken place since 1995 according to a pre-determined trigger mechanism and sharing formula. In 1996, in addition to a multi-year IFMP, DFO and the Area 19 Snow Crab Fishermen’s Association entered a Joint Project Agreement (JPA), which dealt with the roles and responsibilities of each party and their financial contributions to the management of this fishery. A Joint Management Committee made up of Area 19 fishermen and representatives of DFO acts as an advisory body regarding implementation of IFMP and establishing its annual harvesting plan. This new “co-management arrangement” was the first of its kind with inshore fishers in Canada, and would eventually serve as a model for others. An IQ system was implemented around the same time with equal shares of the global quota for the Area 18 licence holders. All landings must be monitored under an industry-funded DMP. A case study on the co-management experience for the Area 19 snow crab fishery in Canada was presented at the 86th session of the OECD Fisheries Committee.
72. The snow crab fishery in the Southern Gulf developed quickly since mid 1970s due to emerging new markets, technological improvements to vessels and increased fishing effort. Between the period of mid-1970s to mid-1980s, landings grew steadily to reach a peak of over 30,000 metric tons in 1982. In 1987, however, catches fell drastically and the downward slide continued even to the point of early closure of the fishery in 1989. In 1990, DFO and the fishers’ associations in Area 12 decided to implement an IQ system, based on a sharing formula that saw 80% of the global quota equally shared among the fishers and the remaining 20% divided according to individual catch recorded from 1984 to 1989. Subsequently in 1993, an IQ system was also implemented for the inshore fleet in Areas 25 and 26, where annual TACs would be equally shared among licence holders. In both fleets, limited temporary transfers of quotas are allowed. All landings must be monitored under an industry-funded DMP. Between 1997 and 2001, in addition to temporary sharing of the resource with non-traditional groups, a special fund was levied by industry on all crab fishers (including non-traditional and aboriginal fishers). The fund was used to assist plant workers extend their employment and for displaced crew members. There was also a JPA between the traditional crab fishers and DFO where traditional crab fishers agreed to contribute to the management costs incurred by DFO. The Southern Gulf Snow Crab Advisory Committee is the focal point for consultations between DFO, traditional snow crab fishers, plant workers, crew members, processors and provincial governments. The establishment of IQs has slowed down the frantic race for crab that existed

16
before. However, highgrading has been identified as an ongoing enforcement concern. Administrative and enforcement workload has increased as a result of the IQ program. In 2003, Area 18 was integrated into the Southern Gulf management regime. As well, non-traditional groups were provided regular access to the resource to ensure long-term stability for these groups.
73. In order to protect the resource and stabilize catch and effort for the emerging crab fishery in Area 16, DFO decided to impose a TAC in 1991, equal to the average landings for the previous four years, and a DMP. The licence holders involved in the fishery chose to be managed under an ITQ program with each participant receiving an equal share of the global quota. Since 1992, temporary transfers of up to 100% of the individual quota are authorized although no participant can get, through transfers, more than the equivalent of one quota. The Area 16 Snow Crab Advisory Committee is the main mechanism for public consultations, with a view to preparing the snow crab management plan for this fishing area. In 1992, an IQ program was adopted by the Area 17 fishers with a sharing formula based on 90% of the TAC divided into equal shares and the remaining 10% shared according to historical individual catches during 1989-91. Highgrading has been identified as an enforcement concern, but its consequence could be minimized by careful handling so that the discarding mortality rate would be negligible. IQ programs were also established for the crab fleets in Areas 13 and 14 in 1986 and Area 15 in 1994. Temporary sharing of the resource with other core fishers have been in place in the recent years. There is a JPA between Area 17 fishers and DFO dealing with management and research aspects of the fishery.
74. For Eastern Nova Scotia, IQ systems with equal shares of area quotas have been implemented for all fishing areas (20-24) since 1994. All landings must be monitored under an industry-funded DMP. Temporary sharing of the resource with non-traditional groups has been authorized in Areas 23-24 since 1996. In 1999, at industry’s request, ITQs were implemented for Area 24. No transfer is permitted between the permanent and temporary fleets; transfers are limited to a single season; and resulting vessel quota cannot be more than double the initial quota. There are JPAs between area fishers and DFO where fishers pay the costs of scientific surveys in their areas.
75. Throughout the 1970s, 1980s and into the 1990s all snow crab fisheries in Newfoundland were conducted on a competitive basis. Individual quotas were implemented for the first time in 1995. During that year, the fulltime fleet in NAFO 3K participated in a pilot IQ program. In addition, all enterprises that were issued temporary seasonal permits during 1995 fished with an individual or boat quota. The use of IQs expanded after 1995 and currently all fleets in most areas are fishing under this management regime. During the late-1990s there were still small quotas that were available to some fleets to be fished on a competitive basis, but these quotas comprised less than 5% of the total snow crab harvest in Newfoundland and Labrador. The basic criterion for movement from a competitive fishery to an individual quota regime was agreement by at least two-thirds of the licence holders in each fleet. Fleet representatives determined the specific quota sharing arrangements. In 2003, temporary permits were converted to permanent licences to ensure the financial stability for these small-boat inshore fishers.
Offshore Lobster
76. The Canadian offshore lobster fishery was started in 1971 when five licences were issued to owners of displaced swordfish vessels as a result of fishery closure due to higher than acceptable levels of mercury in swordfish. By 1976, the number of licences was limited to eight as DFO’s response to inshore fishers’ concern that their catches and incomes would be jeopardized by increased effort on offshore grounds. The offshore fishing occurs within the boundaries of the "offshore lobster area" known as Area 41, which extends from the Canada-U.S. boundary line on Georges Bank to the Laurentian Channel off Cape Breton. However, all traditional, commercial fishing occurs on five major grounds: Georges Bank, Georges Basin, Crowell Basin, Southeast Browns Bank and West Browns found in NAFO 4X and 5Ze. The fishery is year-round and managed by measures similar to those in effect in the inshore lobster fishery,

17
such as limited entries, trap limits per licence, minimum carapace length, and a ban on berried females. Further, offshore fishing is prohibited within 50 miles of the coast.
77. In 1985, following extensive government/industry consultations through the Offshore Lobster Advisory Committee (OLAC), a three-year trial EA program was established in the offshore lobster fishery. Each licence was given an equal share of the TAC, which was determined after an assessment of financial performance of the fleet in 1984. By the time the EA program was renewed for a five-year period in 1989, additional licences had been transferred, such that seven of the eight licences were held by a single company. The total number of vessels actively fishing had decreased to six and the trap limit had been removed on a trial basis. Catches are monitored by an industry-funded DMP implemented in 1994. In 1995, DFO and OLAC determined to continue EAs as a form of ITQs under the IFMP. There is no significant market power arising from the high concentration of ownership within the EA program, as the offshore landings only represent a small fraction of the total regional lobster landings.
Sea Scallop
78. Sea scallops also called giant scallops are among the most important commercial species of molluscan shellfish in Canada. The sea scallop is found in the northwest Atlantic from the northern part of the Gulf of St. Lawrence to the coastal waters of North Carolina in the U.S. Major fishing areas in eastern Canada occur on Georges Bank, the Scotian Shelf, the Mid-Atlantic Shelf, in the Grand Manan and Digby areas of the Bay of Fundy, and for the Gulf, in the Chaleur Bay and around Îles-de-la-Madeleine (Northern Gulf) and in the Northumberland Strait (Southern Gulf). In the northern part of this range, they occur in shallow water while in the southern portion, they are found in deeper water. Scallops are harvested predominantly for the meat, but markets for roe and whole scallop in Europe and Japan have drawn industry attention. The scallop fishery is commonly managed by limited entries, fleet and area quotas (except Southern Gulf), gear restrictions, establishment of fishing areas and seasons, and meat count limit (except Northern Gulf).
79. Offshore scallop fisheries are conducted on Georges Bank, Browns and German Bank the Eastern Scotian Shelf and St. Pierre Bank. The offshore scallop fishery in most fishing areas is open year round. The one exception is German Bank, which is the subject of an intensive six-month inshore lobster fishery from November each year to the end of May the following year. To avoid gear conflicts, the offshore scallop fleet does not fish German Bank during the open lobster season. Although the fishing season is open all year on St. Pierre Bank, winter weather conditions there normally prevent a twelve-month fishery. The offshore fleet (greater than 65 ft.) fishes with two New Bedford offshore scallop drags simultaneously, one on each side of the vessel.
80. The Bay of Fundy area is fished by the Full-Bay fleet (45 - 65 ft.) and the Mid-Bay fleet (30 - 45 ft.). Full-Bay vessels are permitted to fish all the Bay of Fundy while the Mid-Bay vessels have access to the New Brunswick side and portions of the Nova Scotia side of the Bay to the Mid-Bay line. There are also a number of Upper-Bay vessels restricted to the upper reaches of the Bay. TACs were only introduced in 1997 for the Bay of Fundy fleets. The scallop fishery in the Gulf has always been a complementary fishery to the lobster, herring and groundfish fisheries. Almost all scallop fishers hold more than one fishing licence. Fishers in the Gulf harvest inshore sea scallops using vessels of about 50 ft. which tow Digby-type buckets with mesh bags (made with rings held together with washers) over the ocean bottom.
81. Until 1985, the primary conservation method in the scallop fishery was size limits (meat counts). In June 1986, TAC and EAs were introduced on a three-year trial basis in the offshore fishery with a view to ensuring conservation and restoration of the resource, stabilizing annual landings over time, and providing increased economic benefits to the industry. EAs were made permanent in early 1990, and in late 1993 an industry-funded dockside weighing of all offshore scallop landings was implemented. (All

18
offshore scallop vessels are now also required to carry a real-time electronic monitoring device.) EAs were based primarily on historical catch shares of vessels in the offshore fishery. EAs are not permanently transferable except in the event of the sale of a company, subject to the approval of the Minister of Fisheries. Temporary transfers of EAs within the fishing year are permitted. No one fishing enterprise may hold more than 50% of the quota for any specific scallop stock. The Offshore Scallop Advisory Committee (OSAC) serves as the primary vehicle through which the Offshore Scallop Fishing Plan is developed. The OSAC consists of representatives of crew members, unions, owners/processors, the provincial governments, and DFO advisors. There exists a JPA including industry’s participation in research surveys, funding of port sampling, DFO collection of scientific data, and seabed mapping. There is evidence that the offshore scallop EA program has reduced fishing capacity and improved stocks resulting in higher landings and increased value.
82. In the inshore sector, the Full-Bay fleet in the Bay of Fundy has adopted an ITQ program since 1998 in which both permanent and temporary transfers are allowed. In the Northern Gulf, along the upper and mid North Shore and north of Anticosti Island, there is also a mixture of competitive, IQ and ITQ fleets. All these fisheries are subject to industry-funded full-scale DMP.
Offshore Surf Clam
83. The Canadian offshore surf clam (also known as Stimpson’s surf clam) fishery was originally developed in response to a thriving U.S. market for the Atlantic surf or “bar” clam. The fishery first started on Banquereau Bank with developmental surveys conducted by DFO in 1980-83. After a three-month test fishery in 1986, a commercial fishery emerged in 1987. In 1989, an exploratory fishery was authorized for the Grand Banks. Now the offshore fishery is conducted by three large freezer processors using hydraulic dredges. The fishery targets clams in the 10-15 year-old range and main market is for the foot portion of the clam, which goes to the sushi and sashimi market in Japan. The offshore fishery is year round and managed by limited entries, area TACs, gear restrictions, and restricted fishing areas.
84. TACs and EAs were introduced in 1987 when a three-year offshore fishery program was developed with industry consensus. They were based on biological information provided by the surveys and test fishery, and an economic break-even analysis on the amount of resource required to make an operation viable. In 1990, a new multi-year management plan was developed and approved in 1991 for the years 1990-1994. It featured the equal sharing of the TAC for each fishing bank (Banquereau and Grand Banks) among the existing licence holders. The EA Program was continued under a new Agreement for the years 1995-1997. The Plan committed the industry through a JPA to cost-sharing scientific studies of the resource, funding a third-party economic study of this fishery, and an industry-funded full-scale DMP. The current multi-year plan (1998-2002) also considers dredge selectivity studies, and the introduction and implementation of electronic monitoring and reporting technologies in the fishery. Permanent transfers of allocation between the enterprises are prohibited. Temporary transfers are permitted within a single fishing season. The Offshore Clam Advisory Committee, consisting of representatives of DFO, industry, and relevant provinces (Nova Scotia and Newfoundland), is the main consultative body to address issues affecting the offshore clam fishery including the development of the multi-year management plan.
Shrimp
85. The Canadian shrimp fishery is primarily based on the northern shrimp (or pink shrimp), one of several cold water species of shrimp found north of latitude 40° N in the Atlantic, Pacific and Arctic oceans. The Atlantic fishery has been managed in three broad areas: stocks off eastern Newfoundland and Labrador, stocks of the Gulf of St. Lawrence, and stocks on the Eastern Scotian Shelf. The fishery is managed by limited entries, fleet and area quotas, gear restrictions, minimum mesh size, and the use of an exclusion device known as the Nordmore grate to reduce groundfish by-catches.

19
86. The fishery off eastern Newfoundland and Labrador takes place from 46º N to Baffin Bay in the far north. The fishery is managed in eight management units known as Shrimp Fishing Areas (SFA) 0-7 from north to south. The individual fishing areas vary considerably in their contribution to the commercial fishery. SFAs 2, 4, 5 and 6 comprising NAFO 0B, 2 and 3K are the principal fishing grounds, accounting for over 70% of the total TAC in recent years. Fishing in SFAs 0 and 1 (0A) in the north is usually hampered by ice and weather conditions. SFA 7 (3L) is a NAFO managed stock of which Canada is allocated a major portion of the TAC. The fishery in SFA 3 (Eastern Hudson Strait and Ungava Bay) is directed exclusively toward striped shrimp, which occurs as by-catch elsewhere in the northern shrimp fishery. Northern shrimp has been traditionally fished by large offshore factory freezer trawlers. Since 1997, quota increases in southern areas (SFAs 5-7) have been shared with inshore fishers and aboriginal groups on a temporary basis.
87. In the Gulf, the shrimp fishery is concentrated in the northern part of the Gulf and the St. Lawrence estuary. The fishery is managed in four management units, i.e. Esquiman (SFA 8), Anticosti (SFA 9), Sept-Îles (SFA 10), and Estuary (SFA 12) to take into account the production areas and the species’ geographic distribution. Most of the fishing is done by two groups of fleets: Group A consisting of vessels from the Lower North Shore of Quebec and West Coast of Newfoundland, and Group B for the rest of Quebec and New Brunswick. The shrimp fishery usually opens on April 1 in every Gulf of St. Lawrence fishing areas. Fishing generally continues until the fall. More intensive fishing usually occurs in the spring, when the shrimp stocks congregate near the coast to release larvae. Since 1997, temporary allocations have been granted to inshore groundfish mobile gear fishers without permanent licences.
88. The trawl fishery on the Scotian Shelf (SFAs 13-15) concentrates during summer in offshore deep water areas or “holes” known as the Louisbourg, Misaine and Canso holes, and on an inshore area near the Bad Neighbor Shoal. The fleet is divided into two sectors, a midshore sector consisting of vessels 65 – 100 ft. based in New Brunswick on the Gulf of St. Lawrence side, and an inshore sector consisting of vessels less than 65 ft. based on the Atlantic coast of Nova Scotia. In addition, there is an inshore trap fishery in the near-shore areas adjacent to the shrimp holes fished by the mobile gear fleet.
89. The offshore northern shrimp fishery off eastern Newfoundland and Labrador is a capital intensive operation employing a fleet of modern freezer trawlers. In 1987, the industry agreed to adopt a two-year experimental EA program with the objective of allowing optimal utilization and assuring a fair and equitable sharing of the resource, which later became a permanent program. EAs are based on an equal sharing arrangement among the participating licence holders for each of the northern shrimp fishing areas. Permanent transfers between enterprises are not allowed. Inter-enterprise transfers of EAs are permitted on a temporary basis within the fishing season and subject to DFO approval. The number of offshore licences has been kept constant at seventeen since 1991. The traditional offshore northern shrimp licence holders are represented by four organizations. The Canadian Association of Prawn Producers represents nine licence holders and the Northern Coalition represent six licence holders and the Labrador Inuit Development Corporation. The remaining two licence holders are not members of either of these organizations. The Northern Coalition licences are in effect community-based because its membership includes aboriginal, regional and cooperative based groups. The Northern Shrimp Advisory Committee composed of representatives of DFO, the northern shrimp industry (offshore licence holders and inshore temporary new entrants), the Nunavut Wildlife Management Board, and provincial and territorial governments meets at least once annually to discuss issues with regard to the program. There is full observer coverage and random dockside monitoring within the program, costs of which are borne by industry. Highgrading continues to be an issue of enforcement concern.
90. For the Gulf fishery, an ITQ program was put in place in 1991 at the request of Group B fleet. Each participant received a shrimp quota based on catch history from 1987 to 1989, within established lower and upper limits. Since 1993, this program has permitted the permanent transfer of individual

20
allocations and there has been evidence of capacity reduction in the fleet. However, no permanent transfers are authorized between different provinces. In 1996, the Group A fleet agreed to the establishment of an IQ program. A full-scale DMP, paid for entirely by the industry, has been in operation since 1991. The Gulf Shrimp Advisory Committee, composed of representatives from DFO, fishers’ associations, processing industry, and provincial governments, advises the Minister on shrimp-related issues. There exists a JPA between the Group B fleet and DFO dealing with management and research aspects of the fishery.
91. For the Scotian Shelf fishery, in 1994, the Scotia-Fundy based fleet decided to move from a competitive fishery to the use of IQs of equal amounts per vessel. In 1996, they voted in favour of allowing these IQs to become transferable, within certain guidelines. This ITQ fishery was approved by DFO for 1996 as a trial year. The 1996 trial was deemed successful and permission was given to this fleet to arrange permanent transfers as of 1997. Also in 1996, the Gulf-based vessels moved from a competitive fishery to the use of IQs based on an agreed upon individual catch history. Temporary transferability of quotas has been permitted for this fleet since 1997 and became permanent in 1998. All landings of shrimp are subject to an industry-funded DMP. The main consultative body for this fishery is the Scotian Shelf Shrimp Advisory Committee involving DFO, fishers/processors and their associations, aboriginal groups and provincial governments. There is a JPA between the mobile gear licence holders through the Atlantic Mobile Shrimp Association and DFO dealing with management and research aspects of the fishery, including a cooperative DFO/industry trawl survey and commercial catch sampling by industry.
Green Sea Urchin
92. The green sea urchin is common to shallow rocky bottoms throughout Atlantic Canada and only began to develop in the late 1980s. Harvesting is mostly by divers whereas in southwestern New Brunswick, some licences are authorized to pursue their fishery with drags. The fishery is also regulated by limited entries, gear restrictions, a minimum urchin size, number of divers per boat, a participation clause for exploratory licences, fishing area restrictions and, in some cases, fishing seasons. The marketable product is gonads and the market is almost entirely Japan.
93. The New Brunswick side of the Bay of Fundy is the only area where TACs and an IQ program have been in place since 1995. Along the southwest and eastern coasts of Nova Scotia, after meeting specified guidelines, fishers can apply for an individual restricted zone (one licence per area) to provide individuals the opportunity to directly benefit from non-competitive fishing practices and to assess the feasibility and potential success of additional enhancement techniques.
Pacific Fisheries
Groundfish
94. The Pacific groundfish fishery involves over 50 species of fish, the majority of which are caught by bottom and mid-water trawl gear. The main species landed by trawl gear vessels include rockfish, Pacific hake, sole, pollock, dogfish and lingcod. The trawl fishery is a complex mixed-species fishery with as many as 15 different species caught in a single trawl. Trawl vessels have a limited ability to target on individual species or species aggregates. Thus, the mixed-species nature of this fishery creates several problems, as the species harvested have different levels of productivity. There have been ongoing concerns with the level of at-sea releases of groundfish occurring in all groundfish fisheries. Also, by-catch of halibut and sablefish by the trawl fleet creates conflicts with the fisheries licensed to target these species. Currently, trawlers are not allowed to retain any halibut and have a small sablefish allocation. Groundfish are also harvested in commercial, recreational and First Nations’ fisheries by traps and by hook and line gear. Commonly used management measures are limited entries, fleet/species/area quotas (except inshore
21
Pacific cod, skate, sole and flounder), trip/period and by-catch limits, mesh size/gear restrictions, and time and area closures.
95. The groundfish trawl fishery has been managed by limited entries and TACs since 1976 and trip limits introduced in the mid 1980s as well as quarterly management plans for most rockfishes in late 1980s and early 1990s. Fisheries managers and industry representatives, however, were concerned about at-sea dumping of rockfish when trawlers exceeded the trip limit, fishing for an increasingly complex list of groundfish species with differing trip limits, delivery gluts of fish at the beginning of each quarter, and trip-limit levels that made it difficult for larger trawlers to operate effectively. In 1997, the industry adopted area and species specific fully transferable Individual Vessel Quotas (IVQ), which were determined according to vessel length and catch history. Overall individual species caps and total licence IVQ holdings caps have been set to inhibit excessive consolidation of IVQs. The fishery is subject to an industry-funded full-scale DMP at a limited number of designated landing ports and at-sea-observer coverage. Since 2002, there has been an agreement between the groundfish trawl and sablefish commercial fishing sectors on a pilot program that allows temporary reallocations of IVQs between these two sectors. DFO consults on a regular basis with the Groundfish Trawl Advisory Committee (GTAC), which represents groundfish trawl licence fishers and holders, processors, First Nations and other non-industry representatives. GTAC meets a number of times during the year to review in-season progress of the fishery and receive or make recommendations regarding various management actions. In addition, through co-management, industry has been contributing funds to fisheries research and participating in joint research surveys. The overall IVQ program has provided an opportunity for the industry to organize fleet and processing operations to make better use of catch and reduce at-sea releases.
Halibut
96. The North American commercial halibut fishery started in 1888 and has been fished by Canadian and American fleets off some major concentrations off Alaska and British Columbia north of Vancouver Island. By 1920 it became evident that halibut stocks were suffering from over-fishing, and industry asked the governments of Canada and the US for international management of the resource. In 1923, Canada and the US signed the Convention for the Preservation of the Halibut Fishery of the North Pacific Ocean. Under this Convention, the International Fisheries Commission -- later to become the International Pacific Halibut Commission (IPHC) -- was formed. IPHC provides scientific assessments of the resource, devises regulations on gear restrictions, size limits, area catch quotas, and season and area closures. Enforcement of the regulations is the responsibility of the respective governments. In 1979, Canada and the US signed the Protocol to the Convention of 1923, bringing to an end fishing by each country in the other country’s waters. Canada immediately limited entry into its commercial halibut fishery. The commercial halibut fishery is mainly carried out by longline gear with a small percentage of catch taken by salmon trollers. Most of the vessels in the halibut fleet are multi-licensed with the majority also licensed to fish salmon, and a smaller percentage licensed for rockfish and sablefish. The Canadian halibut fishery is also regulated by rockfish by-catch limits and protected areas.
97. During the 1980s, the efficiency of the fleet increased to the point that only one tenth of the time was required to catch almost 50% more halibut. In 1989, a group of halibut vessel owners approached DFO for assistance in developing an IVQ program. After extensive input from industry, an IVQ system was implemented in the halibut fishery in 1991 for a two-year trial period. At the end of the trial period, an evaluation of the program indicated that the department’s conservation and management goals were being met. In addition, a survey of halibut vessel owners indicated 91% of the fleet was in favor of continuing the IVQ in 1994, which incorporated the full transferability with upper and lower individual holding limits. The program continues to the present with only minor modifications. Through a JPA, DFO and the Pacific Halibut Management Association (representing about 85% of the commercial halibut licence holders) have established roles and responsibilities, and planned expenditures towards the management of the fishery,

22
which include an industry-funded full-scale DMP at a limited number of designated landing ports and 15% (targeted) at-sea-observer coverage as well as other enforcement activities partially funded by industry. The IVQ program has resulted in significant rationalization of the halibut fleet, reduced operating costs and improved safety, as well as better prices due to consistent year-round supply of fresh fish. There is also evidence that IVQs have resulted in geographic redistribution of halibut landings.
Sablefish
98. The sablefish resource (also known as blackcod) extends from central Baja California to Japan and the Bering Sea. The movement of adults, however, is limited enough to allow assessment and management on a smaller scale. Differing patterns in recruitment and growth indicate the presence of northern and southern stocks in the British Columbia waters. The Canadian sablefish fishery began as early as 1913. Foreign fishing was conducted between 1968 and 1981, but was phased out after Canada’s extension of fisheries jurisdiction to the 200-mile limit in 1977. The directed sablefish fishery is carried out using trap or hook and line gear. Sablefish are also caught as by-catch in the groundfish trawl fishery. The fishery is mainly conducted in coastal waters with a limited amount of fishing on offshore seamounts. The coastal fishery is regulated by limited entries, TACs, gear restrictions, size limit, area closures and rockfish protected areas. Any vessel eligible for coastal fishing may apply for a licence amendment to fish for sablefish from the seamounts. Vessels fishing offshore seamounts may retain all legal sized sablefish caught each trip, but are further regulated by a fixed fishing season and rockfish by-catch limits.
99. In late 1989, in an effort to halt progressively shorter fishing seasons, deteriorating safety conditions, and increasing fishing costs and financial risks, industry members approached DFO and recommended that an IQ program be developed for the sablefish fishery. After extensive consultations between DFO and the industry, a trial IVQ program was put in place for the 1990 and 1991 fisheries. It has become a regular program since 1993. The initial allocation formula was based on the licence holders’ vessel length and historical catch. The current program allows vessel owners to make unlimited permanent and temporary reallocations of sablefish IVQs. The program is subject to an industry-funded full-scale DMP at a limited number of designated landing ports. The offshore seamount fishery is also subject to the requirement of carrying either an electronic monitoring system or a certified at-sea observer, costs of which are borne by the vessel. There exists a JPA between DFO and the Canadian Sablefish Association (representing commercial sablefish licence holders), under which the industry funds all incremental activities for stock assessment, research, management and monitoring. IVQ management has resulted in significant rationalization of the sablefish fleet and improved prices due to consistent year-round supply of fresh fish. There is also evidence that IVQs have resulted in geographic redistribution of sablefish landings.
Herring
100. Pacific herring populations migrate in the fall from offshore feeding grounds to inshore spawning areas for spawning in the following spring. The British Columbia herring fishery began in 1877 and developed in the early 1900s to satisfy the dry salt market and later the canned herring market. The dry-salt market was ended in 1934. The stocks then supported a large, unrestricted purse seine fishery whose catch went almost exclusively for reduction into meal and oil. Between 1968 and 1971, the reduction fishery was shut down due to the collapse of the B.C. herring stocks, but the food and bait fishery continued. Traditionally, the food and bait fishery take place during the winter. Since early 1970s onward, a major roe herring and a small-scale spawn-on-kelp (SOK) fishery has occurred for short periods between mid-February to end of April, just when herring spawn. This fishery was developed in response to the lucrative Japanese roe market. Purse seine and gillnet are gear used in harvesting roe. As well, seine gear is used in the harvest of food and bait herring and for live capture of herring for closed ponding operation in the SOK fishery. The herring fishery is managed by limited entries, fleet and area quotas, mesh size and gear restrictions, as well as area openings and closures. DFO manages the herring fishery through constant

23
consultations with the Herring Industry Advisory Board, representing the industry, First Nations and other interested stakeholders, to ensure open and inclusive decision making for integrated harvest planning for herring fisheries on the Pacific coast.
101. The SOK fishery has operated under an IQ system since its inception. From the start of the fishery, each licence holder was authorized to produce a set amount of product from the operation. Since 1978, the majority of licences have had an IQ of eight tons of drained product, adjusted subject to a quota carry-over provision. The Heiltsuk First Nation holds nine licences, with a total IQ of 120 tons. The current program allows on-ground transfers of SOK product between licence holders operating in the same stock assessment areas. Full-scale DMP at a number of designated landing ports and on-ground monitoring are essential ingredients of the program. The individual SOK fishery licence holders, represented by Spawn on Kelp Operators Association (SOKOA), contribute the funding required for a monitoring program. The program is administered by SOKOA, which hires an independent company to carry out monitoring activities. The Heiltsuk First Nation participates in an alternative monitoring program.
102. The roe herring fishery does not operate under a rights-based system but rather on a unique cooperative scheme that warrants reporting. It is a short, intense fishery that extends over about six weeks from late February to early April, but openings in individual areas can be as short as a few days. It had seen many vessels on the grounds rushing for fish in a very short period. This inevitably led to unsustainable and unsafe fishing operations and an impossible policing problem. After implementing various management measures such as limited-entry licences and area licensing, DFO introduced a pooling system for seiners in 1998, and subsequently for gillnets in 1999. Pooling is a management tool whereby a group of vessels (licenses) will form a “pool”. Each pool has its own quota depending on the TAC for the area and the number of licenses included in the pool. A pool captain is appointed for each pool, who works on ground with a DFO resource manager to determine how many vessels will be allowed to fish at any one time. The net profits of the pool are then divided among the pool members. If a pool exceeds its quota, then arrangements should be made to have another pool in the licensed area take the excess. The pooling system has eliminated the race for fish and reduced over-all operating cost within pools, reduced catch overages, and improved safety of vessels on the grounds. This also permits easier management of fishing effort on the grounds where large catches could be taken in very short periods of time. All commercial landings are required to be checked at dockside under a DMP funded by the licence holders. The industry also funds test fishing program to collect biological samples and spawn survey information.
103. The food and bait fishery operates under an IQ type of system, in which participants are selected from eligible applicants through an annual lottery draw. Each licence holder is then allowed an equal share of the coast-wide quota set for the year. Vessel owners are responsible for all monitoring costs including both the required full-scale dockside monitoring and at-sea observers. This is a smaller component of the Pacific herring fishery, where most of the available catch is allocated to the more profitable roe herring and spawn-on-kelp fisheries.
Geoduck
104. Geoducks have been fished commercially in British Columbia since 1976. The fishery began in the inside waters (between the mainland and Vancouver Island), expanded to the west coast of Vancouver Island the following year, and to the north coast in 1980. Geoducks are harvested commercially by divers using a directed water jet, which loosens the substrate around the clam and allows the diver to lift out live clams. Harvested geoducks are quickly shipped to processing plants where they are packed and usually delivered live to Asian markets. The fishery is conducted year round, but time-area closures do occur as a result of paralytic shellfish poison (PSP) contamination. A coast-wide TAC was introduced in 1979 and in 1983 the fishery came under a limited-entry licensing system. Other management measures include area

24
quotas, in-season area openings and closures, and seasonal area closures to avoid conflict herring fisheries and herring spawning activity.
105. In the spring of 1988, industry dissatisfied with unsafe and costly fishing operations under the old management system, approached DFO with a proposal recommending ITQs for the geoduck fishery. After extensive consultations between DFO, industry and the diving sector, a trial IVQ program was introduced for 1989 and 1990. It became a regular program since 1991. As part of this initiative, area licensing and a three-year area rotation period for the fishery was established. Geoduck licence quotas were set at 1/55 of the annual coast-wide quota, and fishers were required to select one of three licence areas in which to fish. Temporary quota transfers subject to a maximum limit between licences are permitted. The fishery is subject to an industry-funded full-scale DMP at a limited number of designated ports. Currently, the Underwater Harvesters Association (UHA) and DFO have a five-year JPA, which details the working relationship between DFO and the UHA including an annual work plan and the respective annual financial contributions to the science, management and enforcement programs. It is worth noting that, in addition to funding under JPA, UHA contributes funds to specific water quality surveys and a coast-wide PSP sampling program. Since the implementation of IVQs, there has been evidence of a decline in the number of active vessels and improved prices due to year round supply of live product.
Sea Urchins
106. Red and green sea urchins are the two sea urchin species fished commercially in British Columbia waters. Green sea urchins tend to have more patchy distributions and to be more mobile than red sea urchins. The commercial red sea urchin dive fishery began in the 1970s and has grown rapidly since 1982. Red sea urchins are harvested for their roe (gonad) which is extracted for commercial purposes at processing plants for shipment to fresh markets. The green sea urchin dive fishery began in 1987. Unlike red sea urchins, green sea urchins are shipped whole and live to Japan. The product quality and perishability has restricted the fishery primarily to accessible south coast areas. Both sea urchin fisheries are managed by limited-entry and area licensing, gear restrictions, conservative quotas, minimum size limits, as well as fishing season and area closures.
107. Following several years in a management regime that the commercial industry perceived to be causing processing and market gluts, poor quality landings and unsafe diving conditions, the red sea urchin industry voluntarily implemented an IQ program in 1994 and 1995 while an IQ program was initiated in the green sea urchin fishery in 1995. The coast-wide commercial TAC was divided equally among licences. In 1996, DFO formally sanctioned an IQ management regime for both sea urchin fisheries. Current IQ programs in both fisheries allow temporary quota transfers subject to a maximum limit between licences. All catches are required to be checked dockside at a number of designated landings ports through an industry-funded DMP. JPAs exist between DFO and the Pacific Urchin Harvesters’ Association (PUHA) and the West Coast Green Sea Urchin Association (WCGUA) for the red sea urchin fishery and green sea urchin fishery respectively, which ensure delivery of in-season catch monitoring and biological sampling programs. PUHA also funds the hiring of a biologist hired to co-ordinate research activities with DFO and a contract patrol for eight months a year to monitor and guide the harvest in the North Coast. Several coastal First Nations contribute time and expertise through collaborative research by providing biologists, vessels and divers.
Sea Cucumber
108. The British Columbia sea cucumber fishery is primarily based on the giant red sea cucumber (or California sea cucumber), one of approximately 30 sea cucumber species found in B.C. waters. The commercial fishery began in 1971 and expanded rapidly after 1980. Harvesting is performed by divers who remove the animals from the substrate by hand. Marketable products from commercially harvested sea

25
cucumbers include frozen muscle strips and dried skins, mainly destined for the Far-east Asia and some locations in Canada and the United States. The fishery is managed through limited-entry and area licensing, a precautionary fixed exploitation rate, area quotas, fishing season and area closures.
109. To address the data limited nature of the fishery and the continued commitment towards biologically-based management, DFO has implemented an adaptive management plan since 1997. Among various measures put in place is an IQ program. The coast-wide commercial TAC is divided equally among commercial licence holders; and fishers are required to develop and fund a catch monitoring and validation program (including a full-scale DMP at designated landing ports) to ensure that area quotas and IQs are not exceeded. The current IQ program allows temporary quota transfers subject to a maximum limit between licences. A JPA between DFO and the Pacific Sea Cucumber Harvesters Association ensures delivery of in-season catch validation and biological sampling programs. The PSCHA funds research and management programs, including stock assessment surveys, biological research surveys, and a biologist hired to co-ordinate research with DFO.

AG
R/F
I/R
D(2
004)
11
26
AN
NE
X 1
. Tab
le 1
. IN
VE
NT
OR
Y O
F F
ISH
ER
IES
MA
NA
GE
ME
NT
SY
STE
MS
IN C
AN
AD
A’S
MA
IN M
AR
INE
FIS
HE
RIE
S
Lim
ite
d
lice
nc
es
IEQ
Ge
ar/
ve
ss
el
res
tric
tio
ns
1,2
TA
C &
a
rea
/fle
et
qu
ota
Es
ca
pe
me
nt/
re
cru
itm
en
tIQ
ITQ
/IV
QE
AC
om
mu
nit
y
qu
ota
sT
rip
/pe
rio
d
limit
sA
tla
nti
c F
ish
eri
es
G
rou
nd
fis
h
L
ab
rad
or
Sh
elf
, G
an
d B
an
ks
& S
. N
fld
.
Fix
ed
ge
ar
< 6
5 f
t. (
co
d 2
J3
KL
, 3
Ps
5)
XX
XX
X4
F
ixe
d g
ea
r <
65
ft.
XX
XX
4
M
ob
ile g
ea
r <
65
ft.
(c
od
3P
s5)
XX
XX
X4
M
ob
ile g
ea
r <
65
ft.
XX
XX
4
A
ll v
es
se
ls >
65
ft.
XX
XX
3X
4
Sc
oti
an
Sh
elf
& G
eo
rge
s B
an
k
Fix
ed
ge
ar
< 4
5 f
t.X
XX
X6
X4
F
ixe
d g
ea
r 4
5 f
t. -
65
ft.
XX
XX
3X
4
M
ob
ile g
ea
r <
65
ft.
XX
XX
3,7
X6
X4
A
ll v
es
se
ls >
65
ft.
XX
XX
3X
4
Gu
lf o
f S
t. L
aw
ren
ce
F
ixe
d g
ea
r <
65
ft.
(G
ree
nla
nd
ha
libu
t, Q
ue
.)X
XX
XX
4
F
ixe
d g
ea
r <
65
ft.
XX
XX
4
M
ob
ile g
ea
r <
65
ft.
XX
XX
3,7
aX
4
A
ll v
es
se
ls >
65
ft.
XX
XX
3X
4
H
err
ing
Ea
st&
So
uth
Co
as
ts o
f N
fld
.
Pu
rse
se
ine
XX
XX
9
F
ixe
d g
ea
rX
XX
X9
We
st
Co
as
t o
f N
fld
.
Pu
rse
se
ine
> 6
5 f
t.X
XX
X3
X9
P
urs
e s
ein
e <
65
ft.
XX
XX
X9
F
ixe
d g
ea
r >
35
ft.
XX
XX
9
F
ixe
d g
ea
r <
35
ft.
XX
XX
9
Gu
lf o
f S
t. L
aw
ren
ce
P
urs
e s
ein
e >
65
ft.
XX
XX
3X
9
A
ll v
es
se
ls <
65
ft.
XX
XX
9a
Sc
oti
a-F
un
dy
L
arg
e G
ulf
se
ine
rs1
0X
XX
X3
X9
S
co
tia
-Fu
nd
y s
ein
ers
11
XX
XX
3,1
2
G
illn
et
XX
X1
3
W
eir
& t
rap
XX
X1
3
M
ac
ke
rel
M
ob
ile g
ea
r14
XX
XX
15
F
ixe
d g
ea
rX
XX
X1
5
C
ap
elin
4
R3
Pn
pu
rse
se
ine
XX
XX
M
ob
ile g
ea
rX
XX
X
Fix
ed
ge
ar
XX
X
Sw
ord
fis
h
Lo
ng
line
XX
XX
3,1
6X
17
H
arp
oo
nX
XX
X1
7
Fis
he
ry/F
lee
t
Inp
ut
Co
ntr
ol
Ou
tpu
t C
on
tro
l

A
GR
/FI/
RD
(200
4)11
27
Siz
e/s
ex
s
ele
cti
vit
yT
ime
/are
a
clo
su
res
Atl
an
tic
Fis
he
rie
s
Gro
un
dfi
sh
La
bra
do
r S
he
lf,
Ga
nd
Ba
nk
s &
S.
Nfl
d.
F
ixe
d g
ea
r <
65
ft.
(c
od
2J
3K
L,
3P
s5)
XX
X1
0%
10
0%
39
95
28
60
0
Fix
ed
ge
ar
< 6
5 f
t.X
XX
5-1
0%
10
0%
41
23
13
02
9
Mo
bile
ge
ar
< 6
5 f
t. (
co
d 3
Ps
5)
XX
X1
0%
10
0%
12
80
0
Mo
bile
ge
ar
< 6
5 f
t.X
XX
10
%1
00
%1
88
01
A
ll v
es
se
ls >
65
ft.
XX
X1
0-2
0%
10
0%
12
21
02
0
S
co
tia
n S
he
lf &
Ge
org
es
Ba
nk
F
ixe
d g
ea
r <
45
ft.
XX
XX
80
%2
51
42
23
92
F
ixe
d g
ea
r 4
5 f
t. -
65
ft.
XX
XX
10
0%
57
29
74
M
ob
ile g
ea
r <
65
ft.
XX
XX
10
0%
32
23
98
83
A
ll v
es
se
ls >
65
ft.
XX
X1
0-2
0%
10
0%
15
17
99
4
G
ulf
of
St.
La
wre
nc
e
Fix
ed
ge
ar
< 6
5 f
t. (
Gre
en
lan
d h
alib
ut,
Qu
e.)
XX
X5
%8
10
0%
10
62
68
0
Fix
ed
ge
ar
< 6
5 f
t.X
XX
5%
81
00
%4
24
11
92
27
M
ob
ile g
ea
r <
65
ft.
XX
X1
0%
81
00
%3
90
48
86
A
ll v
es
se
ls >
65
ft.
XX
X1
0-2
0%
81
00
%2
78
66
H
err
ing
Ea
st&
So
uth
Co
as
ts o
f N
fld
.
Pu
rse
se
ine
XX
X5
%1
00
%2
27
31
1
Fix
ed
ge
ar
XX
X1
55
62
34
We
st
Co
as
t o
f N
fld
.
Pu
rse
se
ine
> 6
5 f
t.X
XX
5%
10
0%
51
32
2
Pu
rse
se
ine
< 6
5 f
t.X
XX
5%
10
0%
15
48
7
Fix
ed
ge
ar
> 3
5 f
t.X
XX
52
1
Fix
ed
ge
ar
< 3
5 f
t.X
XX
64
92
39
Gu
lf o
f S
t. L
aw
ren
ce
P
urs
e s
ein
e >
65
ft.
XX
XX
X6
15
75
A
ll v
es
se
ls <
65
ft.
XX
X2
5-1
00
%3
59
11
42
66
9a
. D
aily
lim
its
(w
eig
ht)
an
d s
ma
ll-h
err
ing
c
atc
h l
imit
(%
by
co
un
t).
Sc
oti
a-F
un
dy
L
arg
e G
ulf
se
ine
rs1
0X
XX
XX
6N
o l
an
din
gs
in
S-F
10
. F
ish
ing
ov
erw
inte
rin
g 4
T h
err
ing
sto
ck
in
4
Vn
.
Sc
oti
a-F
un
dy
se
ine
rs1
1X
XX
XX
41
12
07
41
1.
Inc
lud
ing
on
e m
idw
ate
r tr
aw
l lic
en
ce
.1
2.
ITQ
ad
op
ted
fo
r S
WN
S/B
ay
of
Fu
nd
y
fis
he
ry.
G
illn
et
XX
XX
13
17
95
98
W
eir
& t
rap
XX
X2
80
38
41
M
ac
ke
rel
M
ob
ile g
ea
r14
XX
XX
10
0%
33
53
24
3
F
ixe
d g
ea
rX
XX
X9
41
35
39
6
C
ap
elin
4
R3
Pn
pu
rse
se
ine
XX
X5
%1
00
%1
48
74
M
ob
ile g
ea
rX
XX
5%
10
0%
23
61
30
5
Fix
ed
ge
ar
XX
XX
19
38
14
34
S
wo
rdfi
sh
L
on
glin
eX
XX
5-1
0%
10
0%
77
67
00
H
arp
oo
nX
XX
X1
00
%1
24
97
87
Fis
he
ry/F
lee
t
Te
ch
nic
al
Me
as
ure
s
Ca
tch
m
on
ito
rin
gA
t-s
ea
o
bs
erv
ers
Do
ck
sid
e
mo
nit
ori
ng
Lic
en
ce
s/
pe
rmit
s
iss
ue
d i
n
20
00
La
nd
ed
va
lue
in
20
00
($
00
0)
Co
mm
en
t
16
. IT
Q i
mp
lem
en
ted
in
20
02
.1
7.
Sm
all-
sw
ord
fis
h c
atc
h l
imit
(%
by
co
un
t);
lo
ng
line
rs a
lso
us
e t
rip
lim
it (
by
we
igh
t).
Mo
st
no
rth
ern
fis
he
rie
s (
ex
ce
pt
Gre
en
lan
d
ha
libu
t a
nd
3P
s c
od
) a
nd
Gu
lf f
ish
eri
es
(e
xc
ep
t fl
atf
ish
) a
re s
till
su
bje
ct
to m
ora
tori
um
o
r lim
ite
d f
ish
ing
.4
. W
ee
kly
lim
its
(w
eig
ht)
in
3P
s a
nd
4R
3P
n
c
od
fix
ed
ge
ar
< 6
5 f
t. f
ish
eri
es
, a
nd
by-
ca
tch
(%
by
we
igh
t) a
nd
sm
all-
fis
h c
atc
h
lim
its
(%
by
co
un
t) i
n m
os
t ih
se
rie
s.
5.
Ex
clu
din
g c
om
pe
titi
ve
ca
tch
es
fro
m 3
Pn
fi
sh
ers
.6
. In
clu
din
g a
bo
rig
ina
l c
om
me
rcia
l
c
om
mu
na
l lic
en
ce
s.
7.
Inc
lud
ing
28
ge
ne
ralis
ts f
ish
ing
po
ole
d
IT
Qs
.7
a.
Mix
ed
co
mp
eti
tiv
e a
nd
IT
Q s
yste
ms
.8
. 3
0%
sin
ce
20
03
.
9.
Sm
all-
he
rrin
g c
atc
h l
imit
(%
by
co
un
t).
13
. N
o c
atc
h l
imit
s f
or
NB
an
d N
S c
oa
sta
l
fis
he
rie
s.
14
. In
clu
din
g e
xp
lora
tory
lic
en
ce
s.
15
. S
ma
ll-m
ac
ke
rel
ca
tch
lim
it (
% b
y
co
un
t) a
nd
he
rrin
g b
y-c
atc
h l
imit
(%
by
w
eig
ht)
.
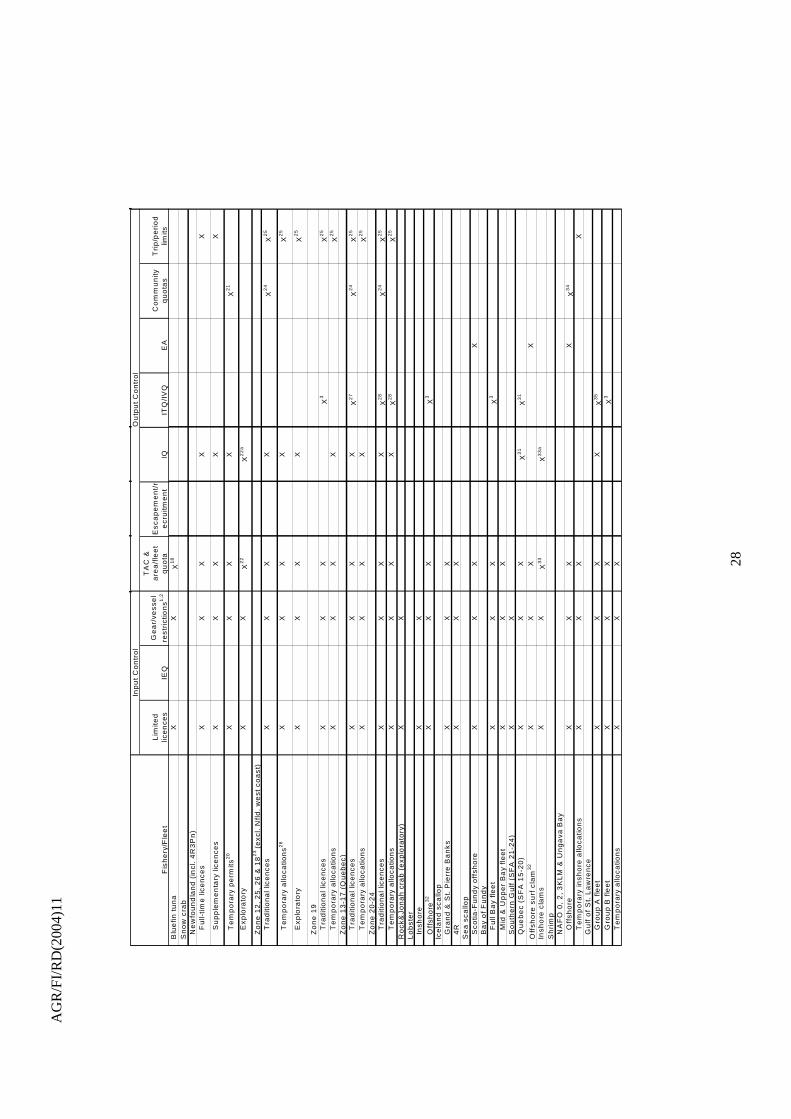
AG
R/F
I/R
D(2
004)
11
28
L
imite
d
lice
nce
sIE
Q
Ge
ar/
ves
sel
res
tric
tion
s1,2
TA
C &
a
rea
/fle
et
qu
ota
Es
ca
pe
me
nt/
re
cru
itme
nt
IQIT
Q/I
VQ
EA
Co
mm
un
ity
qu
ota
sT
rip
/pe
rio
d
limits
B
lue
fin t
un
aX
XX
18
S
no
w c
rab
Ne
wfo
un
dla
nd
(in
cl.
4R
3P
n)
F
ull-
time
lic
en
ce
sX
XX
XX
S
up
ple
me
nta
ry li
ce
nc
es
XX
XX
X
T
em
po
rary
pe
rmits
20
XX
XX
X2
1
E
xp
lora
tory
XX
X2
2X
22
a
Zo
ne
12
, 2
5,
26
& 1
82
3 (e
xcl
. N
fld
. w
est
co
as
t)
Tra
diti
on
al l
ice
nc
es
XX
XX
X2
4X
25
T
em
po
rary
allo
ca
tion
s2
6X
XX
XX
25
E
xp
lora
tory
XX
XX
X2
5
Zo
ne
19
T
rad
itio
na
l lic
en
ce
sX
XX
X3
X2
5
T
em
po
rary
allo
ca
tion
sX
XX
XX
25
Zo
ne
13
-17
(Q
ue
be
c)
T
rad
itio
na
l lic
en
ce
sX
XX
XX
27
X2
4X
25
T
em
po
rary
allo
ca
tion
sX
XX
XX
25
Zo
ne
20
-24
T
rad
itio
na
l lic
en
ce
sX
XX
XX
28
X2
4X
25
T
em
po
rary
allo
ca
tion
sX
XX
XX
28
X2
5
R
oc
k&
Jo
na
h c
rab
(e
xp
lora
tory
)X
X
Lo
bs
ter
Insh
ore
XX
Off
sho
re3
2X
XX
X3
Ic
ela
nd
sc
allo
p
G
ran
d &
St.
Pie
rre
Ba
nk
sX
XX
4R
XX
X
Se
a s
ca
llop
Sc
otia
-Fu
nd
y o
ffsh
ore
XX
XX
Ba
y o
f F
un
dy
F
ull
Ba
y fle
et
XX
XX
3
M
id &
Up
pe
r B
ay
fle
et
XX
X
S
ou
the
rn G
ulf
(S
FA
21
-24
)X
X
Q
ue
be
c (
SF
A 1
5-2
0)
XX
XX
31
X3
1
O
ffsh
ore
su
rf c
lam
32
XX
XX
In
sho
re c
lam
sX
XX
33
X3
3a
S
hri
mp
NA
FO
0,
2,
3K
LM
& U
ng
ava
Ba
y
Off
sh
ore
XX
XX
X3
4
T
em
po
rary
ins
ho
re a
lloc
atio
ns
XX
XX
Gu
lf o
f S
t. L
aw
ren
ce
G
rou
p A
fle
et
XX
XX
X3
5
G
rou
p B
fle
et
XX
XX
3
T
em
po
rary
allo
ca
tion
sX
XX
Fis
he
ry/F
lee
t
Inp
ut
Co
ntr
ol
Ou
tpu
t C
on
tro
l

A
GR
/FI/
RD
(200
4)11
29
Siz
e/s
ex
s
ele
cti
vit
yT
ime
/are
a
clo
su
res
B
lue
fin
tu
na
XX
X1
0%
10
0%
68
21
28
35
18
. F
ish
ca
ug
ht
are
in
div
idu
ally
ta
gg
ed
.
Sn
ow
cra
b
N
ew
fou
nd
lan
d (
inc
l. 4
R3
Pn
)
Fu
ll-ti
me
lic
en
ce
sX
X1
9X
10
%1
00
%7
13
91
50
S
up
ple
me
nta
ry l
ice
nc
es
XX
19
X1
0%
10
0%
69
11
59
57
3
T
em
po
rary
pe
rmit
s2
0X
X1
9X
10
%1
00
%2
50
96
04
51
E
xp
lora
tory
XX
19
XX
10
0%
68
88
28
Zo
ne
12
, 2
5,
26
& 1
82
3 (e
xc
l. N
fld
. w
es
t c
oa
st)
T
rad
itio
na
l lic
en
ce
sX
XX
X1
00
%1
90
92
01
9
T
em
po
rary
allo
ca
tio
ns
26
XX
XX
10
0%
E
xp
lora
tory
XX
XX
10
0%
49
66
42
Zo
ne
19
T
rad
itio
na
l lic
en
ce
sX
XX
X1
00
%1
11
18
66
6
Te
mp
ora
ry a
lloc
ati
on
sX
XX
X1
00
%7
34
52
1
Z
on
e 1
3-1
7 (
Qu
eb
ec
)
Tra
dit
ion
al
lice
nc
es
XX
XX
10
0%
13
03
93
31
T
em
po
rary
allo
ca
tio
ns
XX
XX
10
0%
65
26
45
Zo
ne
20
-24
T
rad
itio
na
l lic
en
ce
sX
XX
5-1
0%
10
0%
12
52
98
98
T
em
po
rary
allo
ca
tio
ns
XX
X5
-10
%1
00
%1
56
22
55
5
Ro
ck
&J
on
ah
cra
b (
ex
plo
rato
ry)
XX
X0
-10
0%
40
79
87
9
Lo
bs
ter
Ins
ho
reX
XX
10
14
35
32
40
3
Off
sh
ore
32
XX
XX
10
0%
2
Ice
lan
d s
ca
llop
Gra
nd
& S
t. P
ierr
e B
an
ks
X2
9X
X1
0-2
0%
10
0%
72
92
16
42
9.
Me
at
co
un
t lim
it.
4R
X2
9X
X1
0%
10
0%
10
51
58
9
Se
a s
ca
llop
Sc
oti
a-F
un
dy
off
sh
ore
X2
9X
X1
00
%3
01
00
%7
94
97
83
0.
Re
al
tim
e e
lec
tro
nic
mo
nit
ori
ng
.
B
ay
of
Fu
nd
y
Fu
ll B
ay
fle
et
X2
9X
XX
X9
99
97
9
Mid
& U
pp
er
Ba
y f
lee
tX
29
XX
XX
22
23
69
1
So
uth
ern
Gu
lf (
SF
A 2
1-2
4)
X2
9X
X7
56
39
28
Qu
eb
ec
(S
FA
15
-20
)X
XX
X8
03
76
33
1.
Mix
ed
co
mp
eti
tiv
e,
IQ a
nd
IT
Q s
yste
ms
.
O
ffs
ho
re s
urf
cla
m3
2X
X0
-10
%1
00
%3
25
44
03
2.
La
nd
ed
va
lue
in
clu
de
s o
ffs
ho
re l
ob
ste
r.
Ins
ho
re c
lam
sX
XX
10
0%
33
a4
84
91
23
64
33
. Q
ue
be
c S
tim
ps
on
su
rf c
lam
.3
3a
. Q
ue
be
c N
. S
ho
re S
tim
ps
on
su
rf c
lam
.
Sh
rim
p
N
AF
O 0
, 2
, 3
KL
M &
Un
ga
va
Ba
y
Off
sh
ore
XX
10
0%
X1
71
81
18
13
4.
Th
e N
ort
he
rn C
oa
litio
n i
nc
lud
es
Ab
ori
gin
al/
reg
ion
al
an
d c
oo
pe
rati
ve
ba
se
d g
rou
ps
.
Te
mp
ora
ry i
ns
ho
re a
lloc
ati
on
sX
X1
0%
10
0%
37
95
88
01
Gu
lf o
f S
t. L
aw
ren
ce
G
rou
p A
fle
et
XX
X1
0%
10
0%
53
88
54
35
. Q
ue
be
c f
lee
t a
do
pts
IT
Q s
yste
m.
G
rou
p B
fle
et
XX
XX
10
0%
60
29
17
4
Te
mp
ora
ry a
lloc
ati
on
sX
XX
X1
00
%4
44
42
2
Fis
he
ry/F
lee
t
Te
ch
nic
al
Me
as
ure
s
Ca
tch
m
on
ito
rin
gA
t-s
ea
o
bs
erv
ers
Do
ck
sid
e
mo
nit
ori
ng
Lic
en
ce
s/
pe
rmit
s
iss
ue
d i
n
20
00
La
nd
ed
va
lue
in
20
00
($
00
0)
Co
mm
en
t
28
. Z
on
e 2
4 f
ish
ers
ad
op
t IT
Q s
ys
tem
.
19
. In
clu
din
g a
re
gio
n-w
ide
clo
su
re t
o
pro
tec
t s
oft
-sh
ell
cra
b (
us
ua
lly A
ug
us
t).
20
. C
on
ve
rte
d t
o l
ice
nc
es
in
20
03
.2
1.
Inc
lud
ing
on
e a
bo
rig
ina
l c
om
me
rcia
l
co
mm
un
al
lice
nc
e.
22
. M
an
ag
ed
on
qu
ota
or
trip
-pe
rmit
ba
sis
.2
2a
. W
es
t c
oa
st
of
Nfl
d u
nd
er
IQs
.
23
. In
teg
rate
d i
nto
Zo
ne
12
in
20
03
.2
4.
Inc
lud
ing
ab
ori
gin
al
co
mm
erc
ial
c
om
mu
na
l lic
en
ce
s.
25
. S
oft
-sh
ell
ca
tch
lim
it (
% b
y w
eig
ht)
.2
6.
Co
nv
ert
ed
to
re
gu
lar
ac
ce
ss
in
20
03
.
No
allo
ca
tio
n
27
. Z
on
e 1
6 f
ish
ers
ad
op
t IT
Q s
ys
tem
.
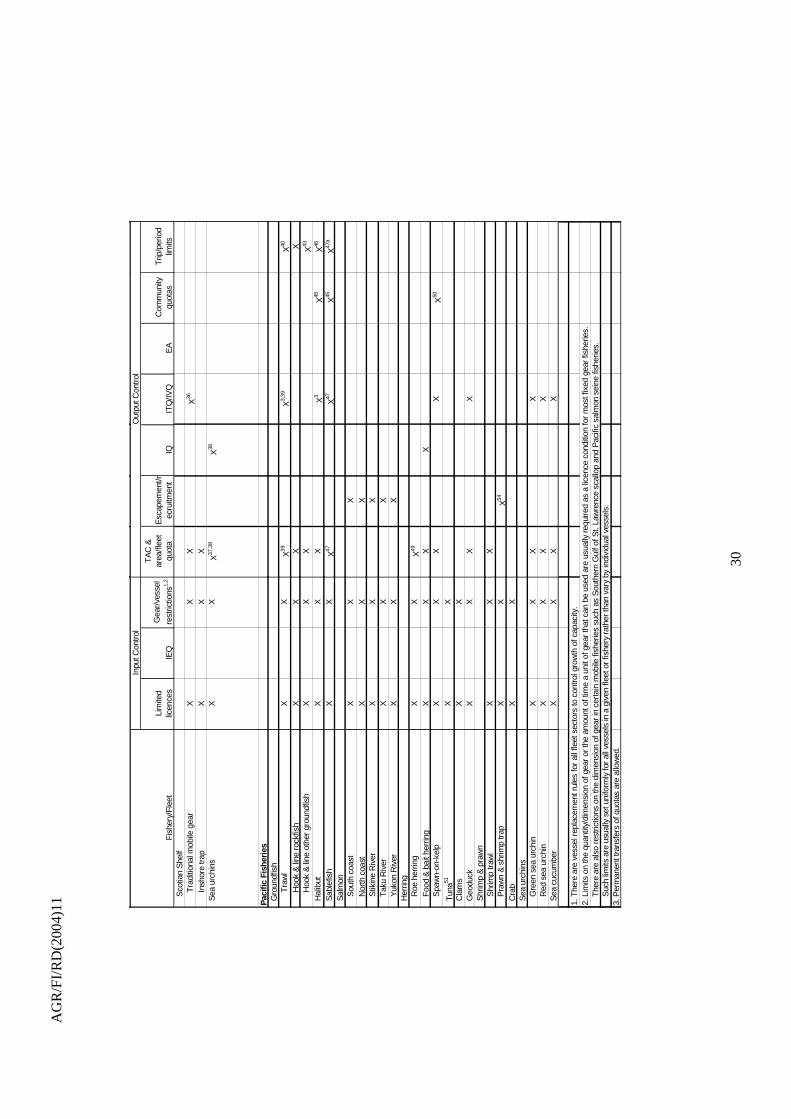
AG
R/F
I/R
D(2
004)
11
30
Lim
ited
licen
ces
IEQ
Gea
r/ves
sel
rest
rictio
ns1,
2
TA
C &
ar
ea/fl
eet
quot
aE
scap
emen
t/rec
ruitm
ent
IQIT
Q/IV
QE
AC
omm
unity
qu
otas
Trip
/per
iod
limits
S
cotia
n S
helf
Tra
ditio
nal m
obile
gea
rX
XX
X36
Insh
ore
trap
XX
X S
ea u
rchi
nsX
XX
37,3
8X
38
Pac
ific
Fish
erie
s G
roun
dfis
h
T
raw
lX
XX
39X
3,39
X40
Hoo
k &
line
rock
fish
XX
XX
Hoo
k &
line
oth
er g
roun
dfis
hX
XX
X43
Hal
ibut
XX
XX
3X
45X
46
Sab
lefis
hX
XX
47X
47X
45X
47a
Sal
mon
S
outh
coa
stX
XX
N
orth
coa
stX
XX
S
tikin
e R
iver
XX
X
Tak
u R
iver
XX
X
Yuk
on R
iver
XX
X H
errin
g
Roe
her
ring
XX
X49
F
ood
& b
ait h
errin
gX
XX
X
S
paw
n-on
-kel
pX
XX
X
X50
Tun
a51X
X C
lam
sX
X G
eodu
ckX
XX
X S
hrim
p &
pra
wn
S
hrim
p tra
wl
XX
X
Pra
wn
& s
hrim
p tra
pX
XX
54
Cra
bX
X S
ea u
rchi
ns
Gre
en s
ea u
rchi
nX
XX
X
Red
sea
urc
hin
XX
XX
Sea
cuc
umbe
rX
XX
X
1. T
here
are
ves
sel r
epla
cem
ent r
ules
for a
ll fle
et s
ecto
rs to
con
trol g
row
th o
f cap
acity
.2.
Lim
its o
n th
e qu
antit
y/di
men
sion
of g
ear o
r the
am
ount
of t
ime
a un
it of
gea
r tha
t can
be
used
are
usu
ally
requ
ired
as a
lice
nce
cond
ition
for m
ost f
ixed
gea
r fis
herie
s.
The
re a
re a
lso
rest
rictio
ns o
n th
e di
men
sion
of g
ear i
n ce
rtain
mob
ile fi
sher
ies
such
as
Sou
ther
n G
ulf o
f St.
Law
renc
e sc
allo
p an
d P
acifi
c sa
lmon
sei
ne fi
sher
ies.
S
uch
limits
are
usu
ally
set
uni
form
ly fo
r all
vess
els
in a
giv
en fl
eet o
r fis
hery
rath
er th
an v
ary
by in
divi
dual
ves
sels
.3.
Per
man
ent t
rans
fers
of q
uota
s ar
e al
low
ed.
Fish
ery/
Flee
t
Inpu
t Con
trol
Out
put C
ontro
l

A
GR
/FI/
RD
(200
4)11
31
S
ize
/se
x
se
lec
tiv
ity
Tim
e/a
rea
c
los
ure
s
S
co
tia
n S
he
lf
Tra
dit
ion
al
mo
bil
e g
ea
rX
X0
-5%
10
0%
29
88
32
36
. P
erm
an
en
t tr
an
sfe
rs a
llo
we
d i
n S
-F f
lee
t.
Ins
ho
re t
rap
XX
X2
23
68
S
ea
urc
hin
sX
XX
10
0%
38
a2
0-1
00
%3
8b
20
47
41
23
7.
Min
. la
nd
ing
s r
eq
uir
em
en
t in
mo
st
c
as
es
.3
8.
SW
NB
fis
he
rs a
do
pt
TA
Cs
an
d I
Qs
;
SW
NS
an
d E
NS
fis
he
rs a
do
pt
ind
ivid
ua
l
res
tric
ted
zo
ne
s.
38
a.
Fu
nd
y N
S o
nly
.3
8b
. 1
00
% f
or
SW
NB
an
d F
un
dy
NS
, 2
0%
for
EN
S a
nd
re
st
SW
NS
.P
ac
ific
Fis
he
rie
s
Gro
un
dfi
sh
T
raw
lX
X4
1X
10
0%
42
10
0%
14
04
87
35
39
. In
clu
din
g a
sm
all
all
oc
ati
on
of
sa
ble
fis
h.
40
. H
ali
bu
t b
y-c
atc
h l
imit
(%
by
we
igh
t).
41
. In
clu
din
g a
rea
clo
su
res
fo
r ro
ck
fis
h a
nd
s
po
ng
e r
ee
f p
rote
cti
on
.4
2.
10
% f
or
bo
tto
m t
raw
l fi
sh
ing
in
sid
e
wa
ters
of
the
so
uth
co
as
t/F
ras
er
Riv
er
a
nd
mid
-wa
ter
tra
wl
ha
ke
fis
hin
g.
H
oo
k &
lin
e r
oc
kfi
sh
XX
10
%1
00
%2
58
66
24
H
oo
k &
lin
e o
the
r g
rou
nd
fis
hX
44
XX
10
%1
00
%5
38
65
10
43
. T
rip
/pe
rio
d o
r b
y-c
atc
h l
imit
s d
ep
en
din
g
on
sp
ec
ies
.4
4.
Siz
e l
imit
fo
r li
ng
co
d.
H
ali
bu
tX
XX
15
%1
00
%4
35
38
37
34
5.
Inc
lud
ing
ab
ori
gin
al
co
mm
erc
ial
c
om
mu
na
l li
ce
nc
es
.4
6.
Ro
ck
fis
h b
y-c
atc
h l
imit
(w
eig
ht)
.
Sa
ble
fis
hX
XX
15
%4
7b
10
0%
48
32
29
74
7.
Ex
clu
din
g t
raw
l a
llo
ca
tio
n.
47
a.
Ro
ck
fis
h b
y-c
atc
h l
imit
fo
r o
ffs
ho
re
se
am
ou
nt
fis
he
ry.
47
b.
10
0%
at-
se
a o
bs
erv
ers
or
ele
ctr
on
ic
m
on
ito
rin
g f
or
off
sh
ore
se
am
ou
nt
fis
he
ry.
S
alm
on
XX
So
uth
co
as
tX
X4
8X
12
45
16
58
1
N
ort
h c
oa
st
XX
48
X9
66
34
85
6
S
tik
ine
Riv
er
XX
X2
23
30
Ta
ku
Riv
er
XX
X1
65
77
Yu
ko
n R
ive
rX
XX
29
No
fis
hin
g
He
rrin
g
R
oe
he
rrin
gX
XX
10
0%
15
35
48
17
54
9.
Th
e f
ish
ery
is
co
nd
uc
ted
by
po
oli
ng
lic
en
ce
s i
n d
es
ign
ate
d a
rea
s a
nd
ma
na
ge
d o
n g
rou
nd
by
in
du
str
y
p
art
icip
an
ts a
nd
DF
O m
an
ag
ers
.
F
oo
d &
ba
it h
err
ing
XX
X1
00
%1
00
%9
76
17
Sp
aw
n-o
n-k
elp
XX
10
0%
10
0%
46
13
16
55
0.
Ma
jori
ty a
re a
bo
rig
ina
l c
om
me
rcia
l
co
mm
un
al
lic
en
ce
s.
T
un
a5
1X
51
aX
38
75
19
51
. M
os
t v
es
se
l-b
as
ed
lic
en
ce
s a
re
au
tho
riz
ed
to
fis
h t
un
a.
Tu
na
lic
en
ce
s
are
on
ly r
eq
uir
ed
fo
r C
an
ad
ian
hig
hs
ea
s
fle
et.
51
a.
Als
o i
nc
lud
ing
in
-se
as
on
are
a c
los
ure
s
fo
r ro
ck
fis
h p
rote
cti
on
.
C
lam
sX
XX
98
12
97
5
Ge
od
uc
kX
52
XX
53
10
0%
55
39
52
45
2.
So
me
are
a-s
pe
cif
ic c
los
ure
s t
o a
vo
id
co
nfl
ict
wit
h h
err
ing
fis
he
rie
s.
53
. F
un
din
g o
f o
n-g
rou
nd
mo
nit
ori
ng
.
Sh
rim
p &
pra
wn
Sh
rim
p t
raw
lX
XX
XX
24
25
45
4
P
raw
n &
sh
rim
p t
rap
XX
X2
49
31
88
55
4.
Sp
aw
ne
r in
de
x.
C
rab
XX
55
XX
21
92
16
14
55
. S
om
e a
rea
-sp
ec
ific
clo
su
res
to
pro
tec
t
so
ft-s
he
ll c
rab
or
av
oid
co
nfl
ict
wit
h
h
err
ing
fis
he
rie
s.
S
ea
urc
hin
s
G
ree
n s
ea
urc
hin
XX
X1
00
%4
96
84
Re
d s
ea
urc
hin
XX
XX
53
10
0%
11
08
11
9
Se
a c
uc
um
be
rX
X1
00
%8
51
74
7
Fis
he
ry/F
lee
t
Te
ch
nic
al
Me
as
ure
s
Ca
tch
m
on
ito
rin
gA
t-s
ea
o
bs
erv
ers
48
. S
om
e a
rea
-sp
ec
ific
clo
su
res
to
p
rote
ct
ins
ho
re r
oc
kfi
sh
.
Do
ck
sid
e
mo
nit
ori
ng
Lic
en
ce
s/
pe
rmit
s
iss
ue
d i
n
20
00
La
nd
ed
va
lue
in
20
00
($
00
0)
Co
mm
en
t

AGR/FI/RD(2004)11
32
ANNEX 2. LIST OF FISHERIES MANAGEMENT MEASURES
The following classification and description of management measures are adopted from those used in the OECD publication “Towards Sustainable Fisheries – Economic Aspects of the Management of Living marine Resources”.
Input Controls
Limited licences -- The limited licences programs attempt to control the capacity of fishing units (vessel and gear) by restricting the number of licences issued. Licences are given or sold to each fishing unit or producer in the fishery and are tied to either the fishing unit or the producer who can choose to use the licence with the fishing unit. Licences may be transferable or non-transferable.
Individual effort quotas (IEQ) -- Individual effort quotas set a maximum on the amount of effort each producer can apply to the fishery during the year. Such quotas are allocated and usually vary among individual fishing units. In the case of mobile gear, an effort quota may set a maximum on days at sea, days fishing or trips. In the case of fixed gear, an effort quota may set a maximum on the number of gear units or the amount of time a gear unit can be in the water during the course of the fishing season. Individual effort quotas may or may not be transferable.
Gear and vessel restrictions -- Gear and vessel restrictions include measures that attempt to reduce or constrain the productivity of fishing units (other than size and sex selectivity). The measures can take the form of limiting the dimensions of vessel, the number and size of gear (e.g., length of gillnets, number of hooks, pots or traps), or the amount of time a gear unit spends fishing during the year. Such restrictions are usually set uniformly within a given fleet or fishery rather than vary by individual vessels. In some instances the regulation entirely bans the use of certain gear and equipment.
Output Controls
Total allowable catch (TAC) -- The total allowable catch measure sets a maximum on the total catch for specific species in a specific area for a given season or period. It attempts to directly constrain the total catch of the active fleet. Catches or landings are monitored, and when the actual or projected catch reaches the TAC he fishery is closed for the season, usually a year. When TAC is set for a large stock area, it is usually further divided into smaller area and fleet quotas.
Escapement/recruitment -- Some fisheries are managed with the objective of meeting escapement targets (Pacific salmon) in terms of the number of adult fish returning to the spawning grounds, or increasing the survival rate of the female population (Pacific prawn and Atlantic lobster). If the prescribed management objectives are not met, in-season closures of the fishery or mandatory reduction in effort may occur and/or more stringent measures will be introduced for the following fishing season.
Individual quotas -- An individual quota (IQ) on catch gives an individual producer or fishing unit the right to catch a specified quantity and species of fish in a specific location during a specific period of time, in most cases, as a share of each year’s TAC. The quota share is assured from year to year, but the annual catch quota varies with the TAC. If transfers are allowed, IQ becomes individual transferable quota (ITQ) which may be assigned, traded, and exchanged on a temporary or permanent basis depending on
AGR/FI/RD(2004)11
33
management programs. In certain fisheries, there are transferable individual vessel quotas (IVQ) and Enterprise Allocations (EA). At a more aggregate level, there are community-based quotas where temporary quota transfers are permitted between communities.
Trip/period limits -- Vessel catch limits restrict the amount each vessel can catch per trip, or for a short period of time such as a day, week or month. Once the limit is reached, a vessel is required to either stop fishing or move to other fishing grounds.
Technical Measures
Size/sex selectivity -- Size and sex selectivity measures attempt to control the size and sex of fish that are caught and landed. Size selective gear restrictions, such as minimum mesh size, affect the minimum size at which fish are caught; and minimum fish size measures set the minimum size of fish that can be legally retained or landed if caught. Sex selective measures restrict the catch of mature, or egg-bearing, females.
Time/area closures -- Time and area closures prohibit fishing in an area during a specific time interval. Time and area closures are often applied to protect resource stocks when and where they are particularly vulnerable, are of poor quality for market, and/or to prevent young fish from being captured too soon.