Embed Size (px)
Citation preview
Council WorkshopFebruary 6th, 2012
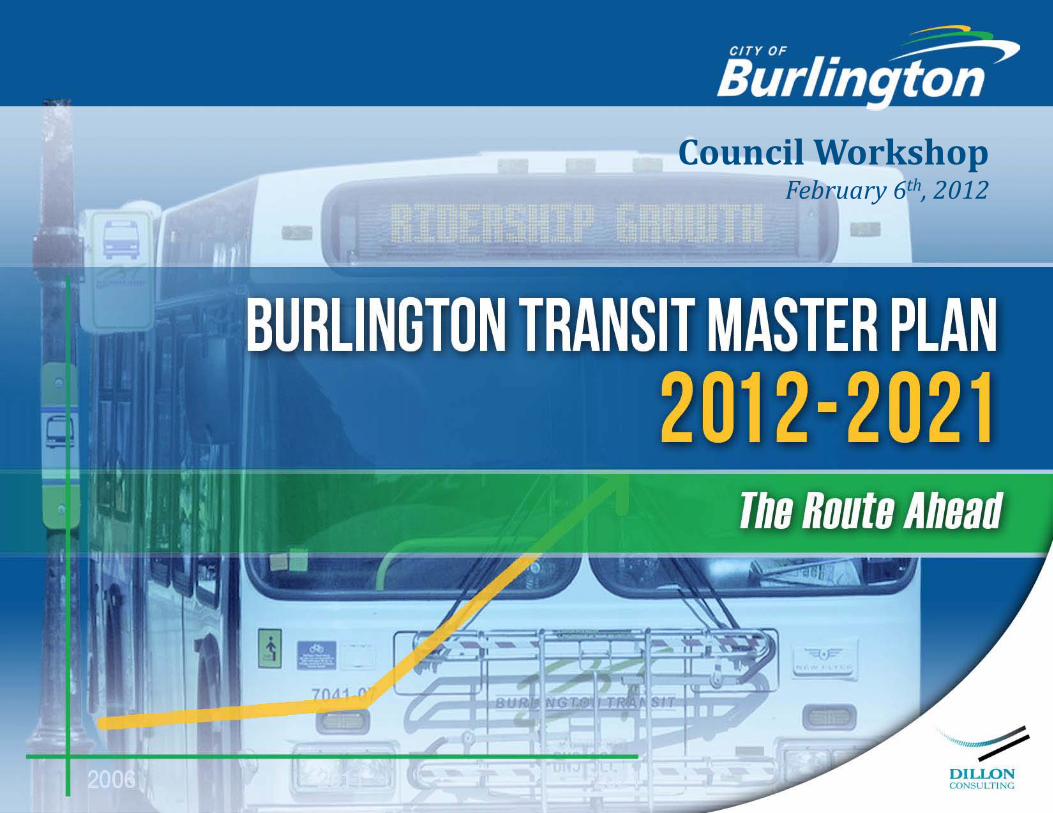
Workshop Agenda• Opening Remarks & Introduction
• Mike Spicer, Transit Manager/TMP Project Manager
• Scott Stewart, GM Community Services Division
• Presentations• Challenges & Directions for Transit in Small to Mid-Size
Communities• Jeffrey Casello, PhD, PE, Assoc. Professor, Univ. of Waterloo
• TMP Findings and Draft Recommendations• Richard Puccini, P.Eng, Dillon Consulting
• Dennis Kar, Associate, Dillon Consulting
• Next Steps• Donna Shepherd, Director of Transit
BURLINGTON TRANSIT MASTER PLAN 2012 – 2021 The Route Ahead
BURLINGTON TRANSIT MASTER PLAN 2012 – 2021 The Route Ahead
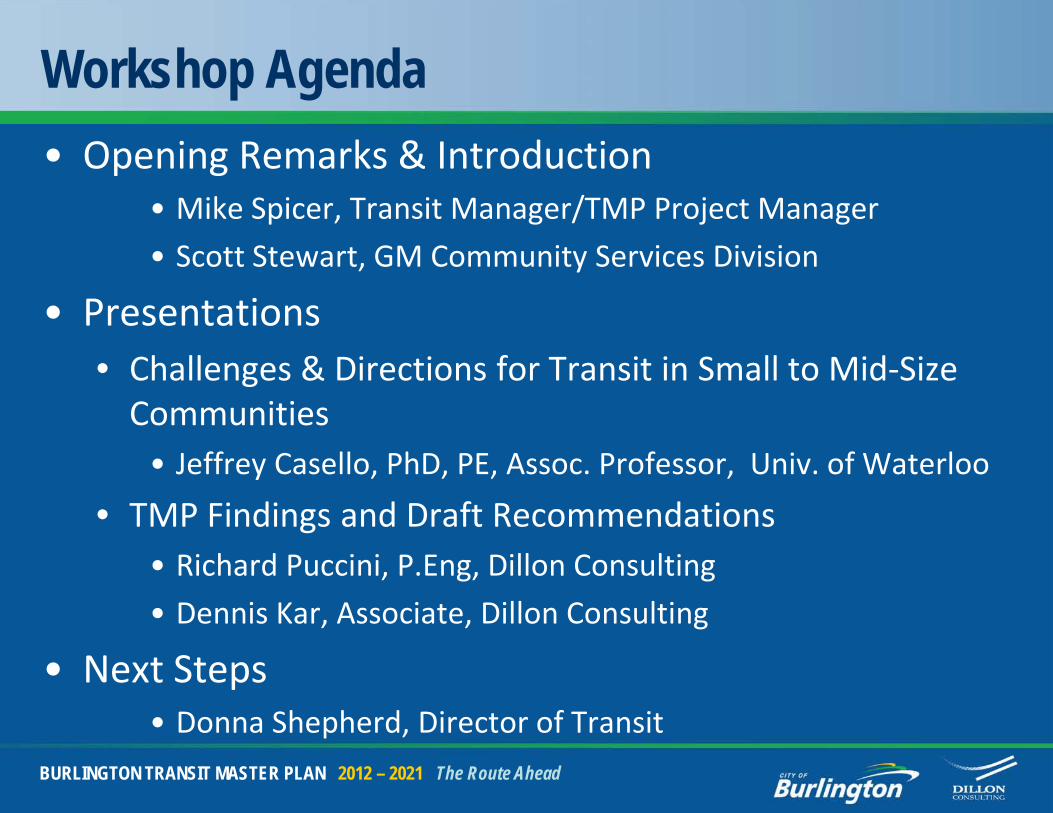
Transit Master Plan Steering Committee
• Councillor Rick Craven
• Councillor Blair Lancaster
• Councillor Paul Sharman
• Doug Brown, Citizen Member
• Jaime Garcia, Citizen Member
• Peggy Russell, BTAC Representative
• Tim Dennis/Maureen Van Ravens, Halton Region
BURLINGTON TRANSIT MASTER PLAN 2012 – 2021 The Route Ahead
Transit Master Plan Steering Committee
• Scott Stewart, GM Community Services
• Donna Shepherd, Director of Transit
• Mike Spicer, Transit Manager (Project Manager)
• Alan Gummo, Manager of Policy & Research
• Andrea Tang, Senior Planner
• Reena Bajwa, Acting Manager Budgets & Policy
• Vito Tolone, Senior Transportation Planner
BURLINGTON TRANSIT MASTER PLAN 2012 – 2021 The Route Ahead
Presentation Agenda
• Study Activities
• Survey Results
• Diagnostic and Strategic Directions
• Draft Route and Service Plan
• Related Strategies
Transit Master Plan Activities• Ridership Growth Plan (5 and 10 years)
• Community Consultation
• Service Standards and Performance Measures
• Transit Fare Strategy
• AODA Impacts
• Marketing Plan
• Financial Plan
• Downtown Terminal Evaluation
• Technology Review
• Transit Priority Measures/Dundas BRT Impacts
• Asset Management Plan
The REAL Agenda – Support Planning and Policy
Burlington and HaltonPlans and Directions
• The Strategic Plan 2011-2014
• The Official Plan
• Shape Burlington: Creating an Engaged Community
• Halton Transportation Master Plan
Provincial Policy and Legislation
• Provincial Policy Statements
• Provincial Growth Plan (Places to Grow)
• Metrolinx Regional Transportation Plan (The Big Move)
• Transit Supportive Development Guidelines
• Mobility Hub Guidelines
• AODA Legislation
BURLINGTON TRANSIT MASTER PLAN 2012 – 2021 The Route Ahead
BURLINGTON TRANSIT MASTER PLAN 2012 – 2021 The Route Ahead
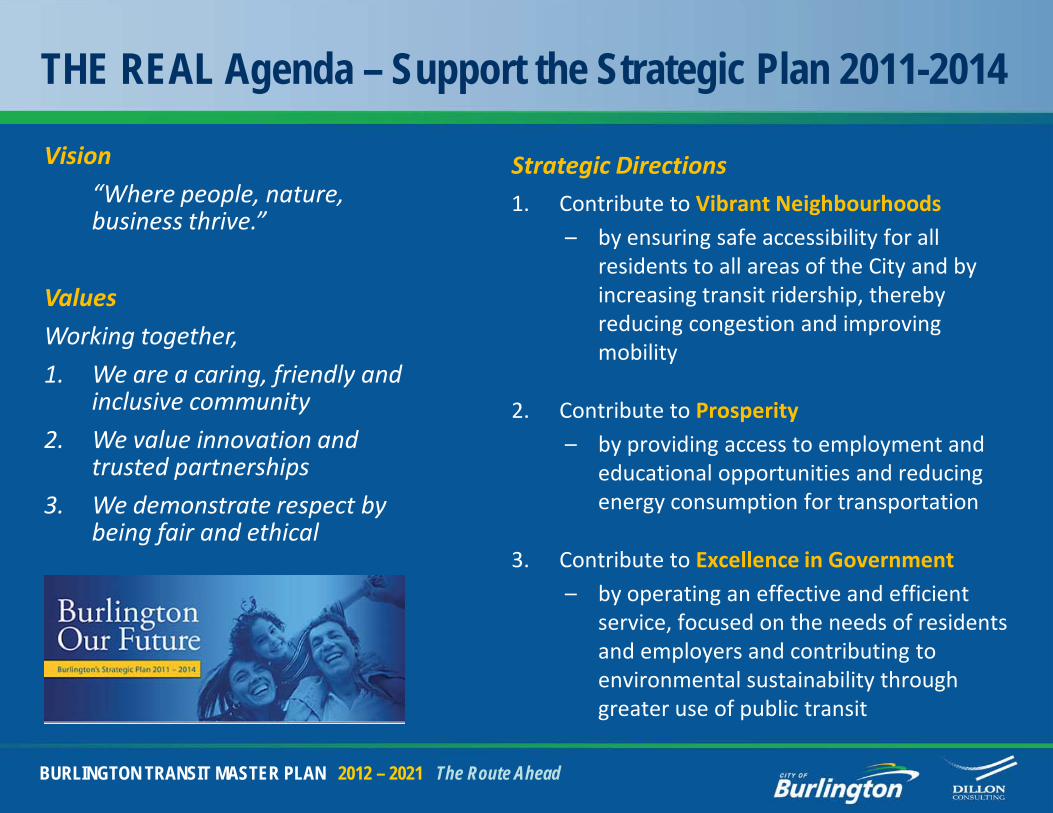
THE REAL Agenda – Support the Strategic Plan 2011-2014
Strategic Directions1. Contribute to Vibrant Neighbourhoods
– by ensuring safe accessibility for all residents to all areas of the City and by increasing transit ridership, thereby reducing congestion and improving mobility
2. Contribute to Prosperity– by providing access to employment and
educational opportunities and reducing energy consumption for transportation
3. Contribute to Excellence in Government– by operating an effective and efficient
service, focused on the needs of residents and employers and contributing to environmental sustainability through greater use of public transit
Vision
“Where people, nature, business thrive.”
Values
Working together,
1. We are a caring, friendly and inclusive community
2. We value innovation and trusted partnerships
3. We demonstrate respect by being fair and ethical
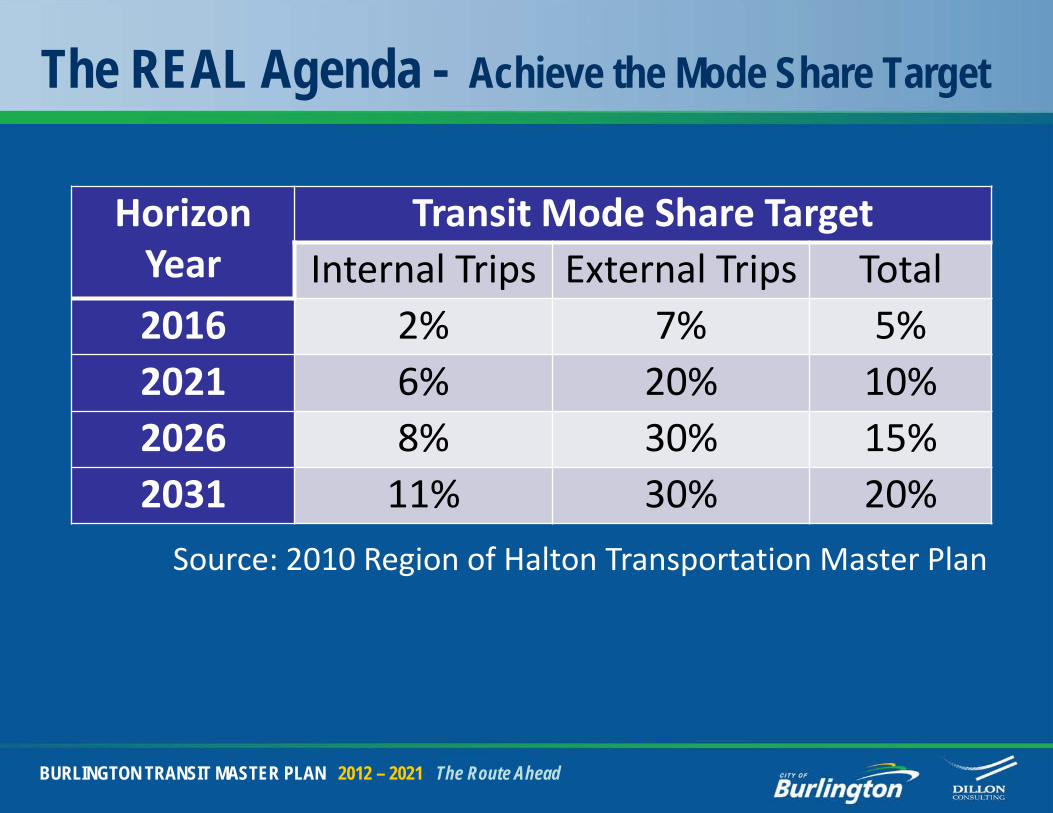
The REAL Agenda - Achieve the Mode Share Target
Horizon Year
Transit Mode Share TargetInternal Trips External Trips Total
2016 2% 7% 5%2021 6% 20% 10%2026 8% 30% 15%2031 11% 30% 20%
BURLINGTON TRANSIT MASTER PLAN 2012 – 2021 The Route Ahead
Source: 2010 Region of Halton Transportation Master Plan
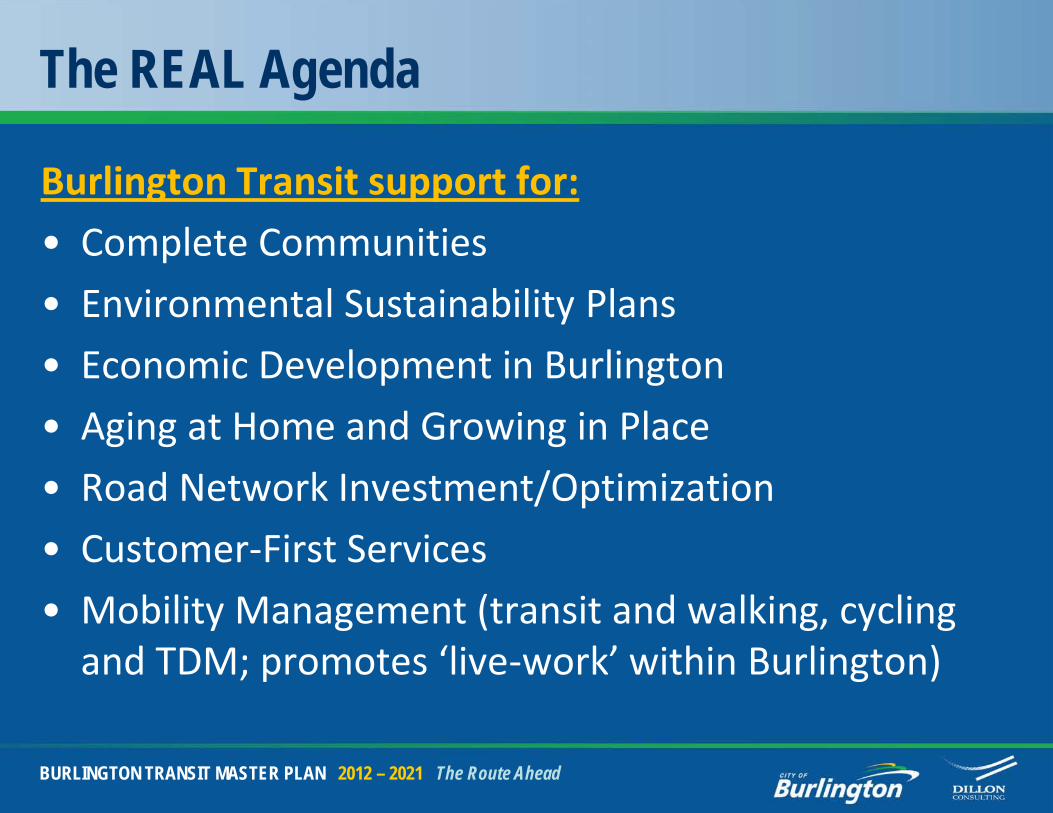
The REAL Agenda
Burlington Transit support for:
• Complete Communities
• Environmental Sustainability Plans
• Economic Development in Burlington
• Aging at Home and Growing in Place
• Road Network Investment/Optimization
• Customer-First Services
• Mobility Management (transit and walking, cycling and TDM; promotes ‘live-work’ within Burlington)
BURLINGTON TRANSIT MASTER PLAN 2012 – 2021 The Route Ahead
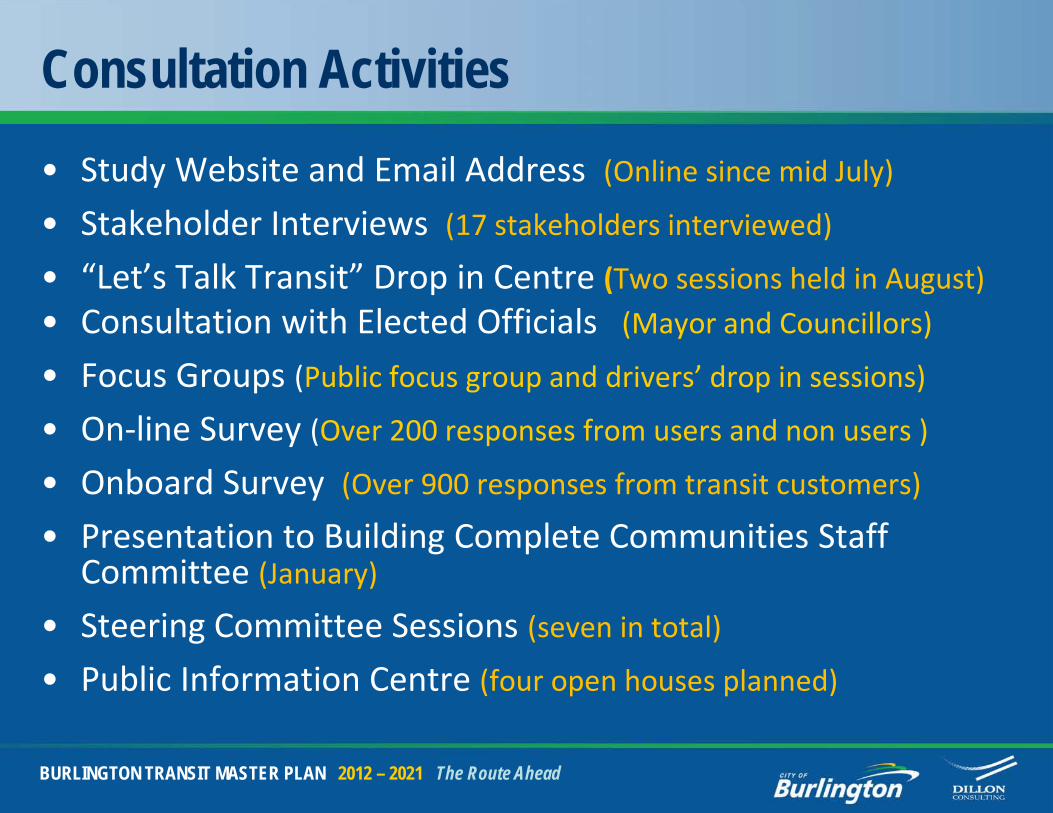
Consultation Activities• Study Website and Email Address (Online since mid July)
• Stakeholder Interviews (17 stakeholders interviewed)
• “Let’s Talk Transit” Drop in Centre (Two sessions held in August)• Consultation with Elected Officials (Mayor and Councillors)
• Focus Groups (Public focus group and drivers’ drop in sessions)
• On-line Survey (Over 200 responses from users and non users )
• Onboard Survey (Over 900 responses from transit customers)
• Presentation to Building Complete Communities Staff Committee (January)
• Steering Committee Sessions (seven in total)
• Public Information Centre (four open houses planned)
BURLINGTON TRANSIT MASTER PLAN 2012 – 2021 The Route Ahead
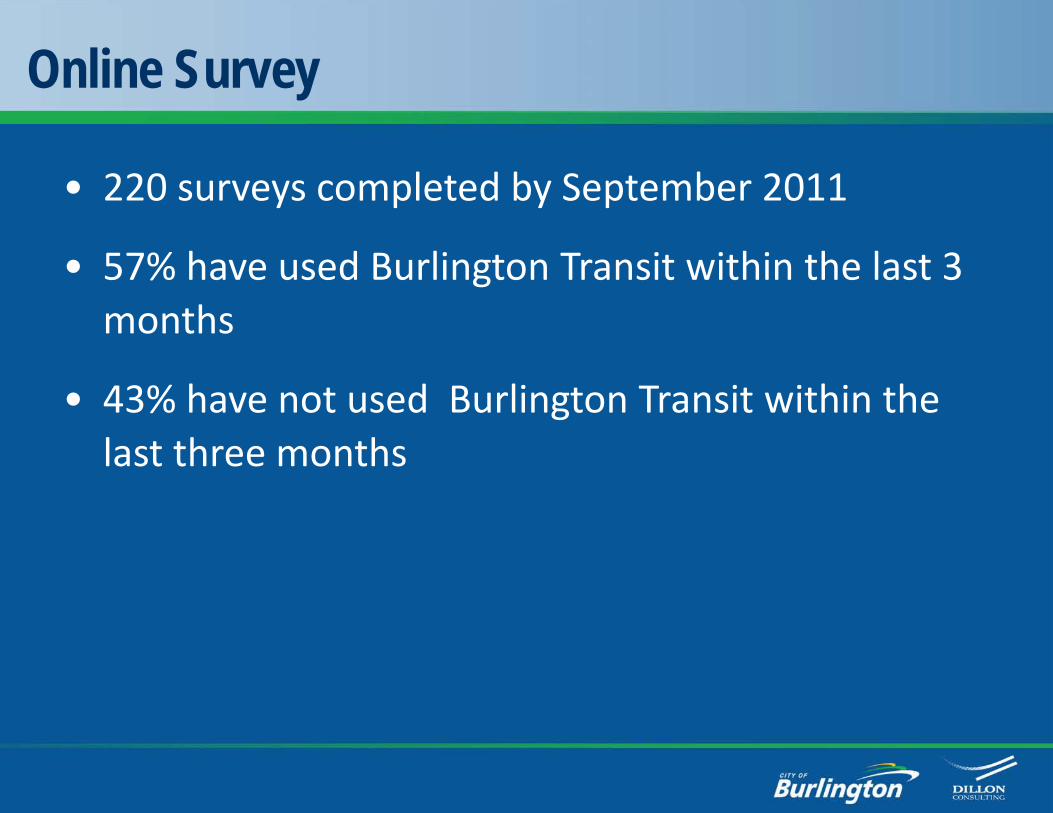
Online Survey
• 220 surveys completed by September 2011
• 57% have used Burlington Transit within the last 3 months
• 43% have not used Burlington Transit within the last three months
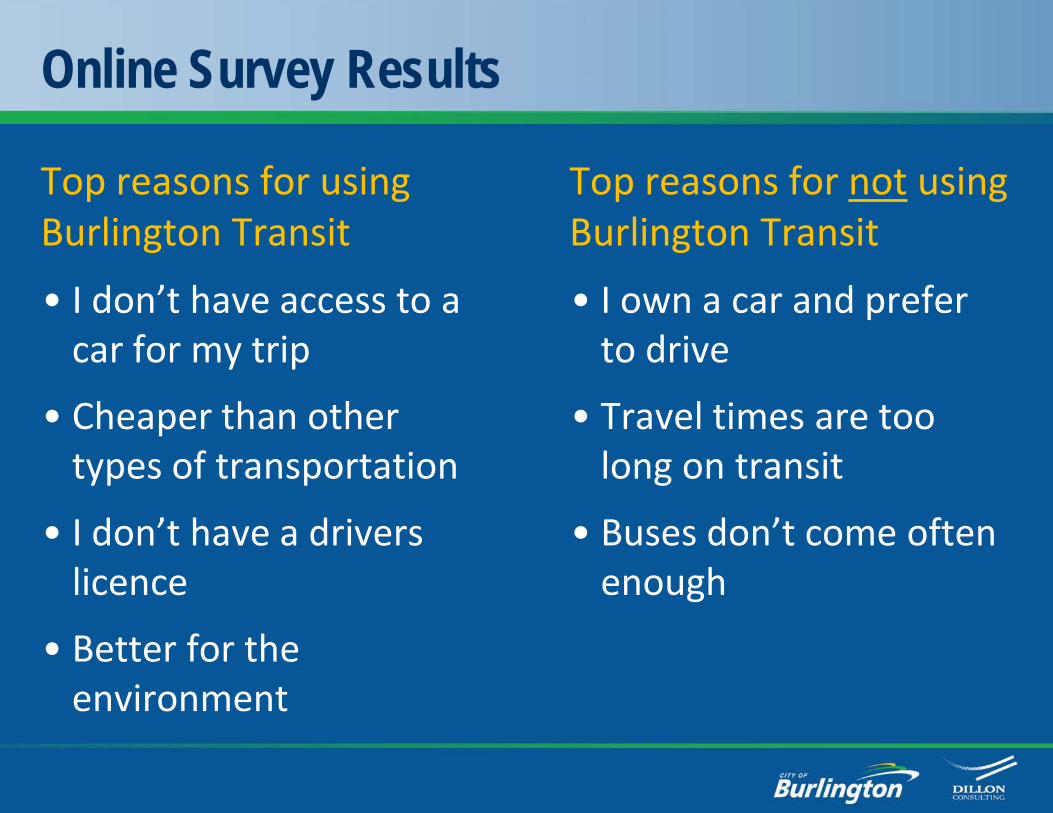
Online Survey Results
Top reasons for using Burlington Transit
• I don’t have access to a car for my trip
• Cheaper than other types of transportation
• I don’t have a drivers licence
• Better for the environment
Top reasons for not using Burlington Transit
• I own a car and prefer to drive
• Travel times are too long on transit
• Buses don’t come often enough
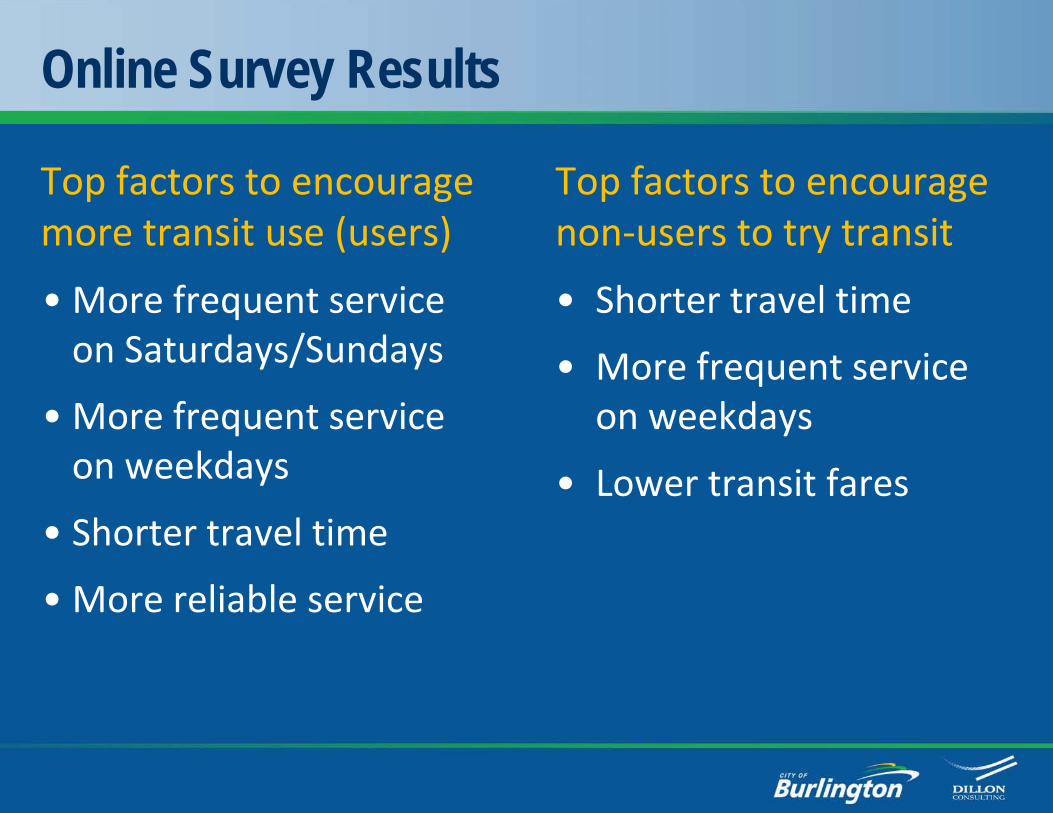
Online Survey Results
Top factors to encourage more transit use (users)
• More frequent service on Saturdays/Sundays
• More frequent service on weekdays
• Shorter travel time
• More reliable service
Top factors to encourage non-users to try transit
• Shorter travel time
• More frequent service on weekdays
• Lower transit fares
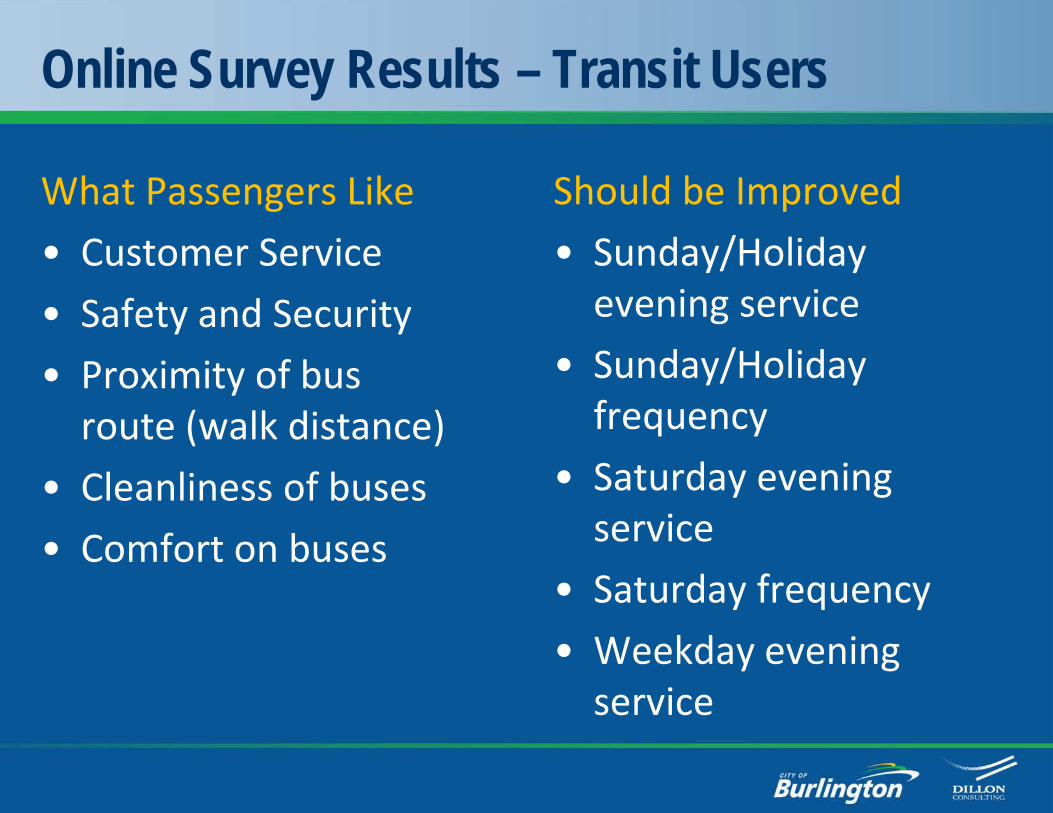
Online Survey Results – Transit Users
What Passengers Like
• Customer Service
• Safety and Security
• Proximity of bus route (walk distance)
• Cleanliness of buses
• Comfort on buses
Should be Improved
• Sunday/Holiday evening service
• Sunday/Holiday frequency
• Saturday evening service
• Saturday frequency
• Weekday evening service
Onboard Survey - Transit Users
• Conducted September 14, 2011
• 921 completed surveys were analysed
• 850 surveys were required for a 95% confidence rate (accurate to +/- 3%)
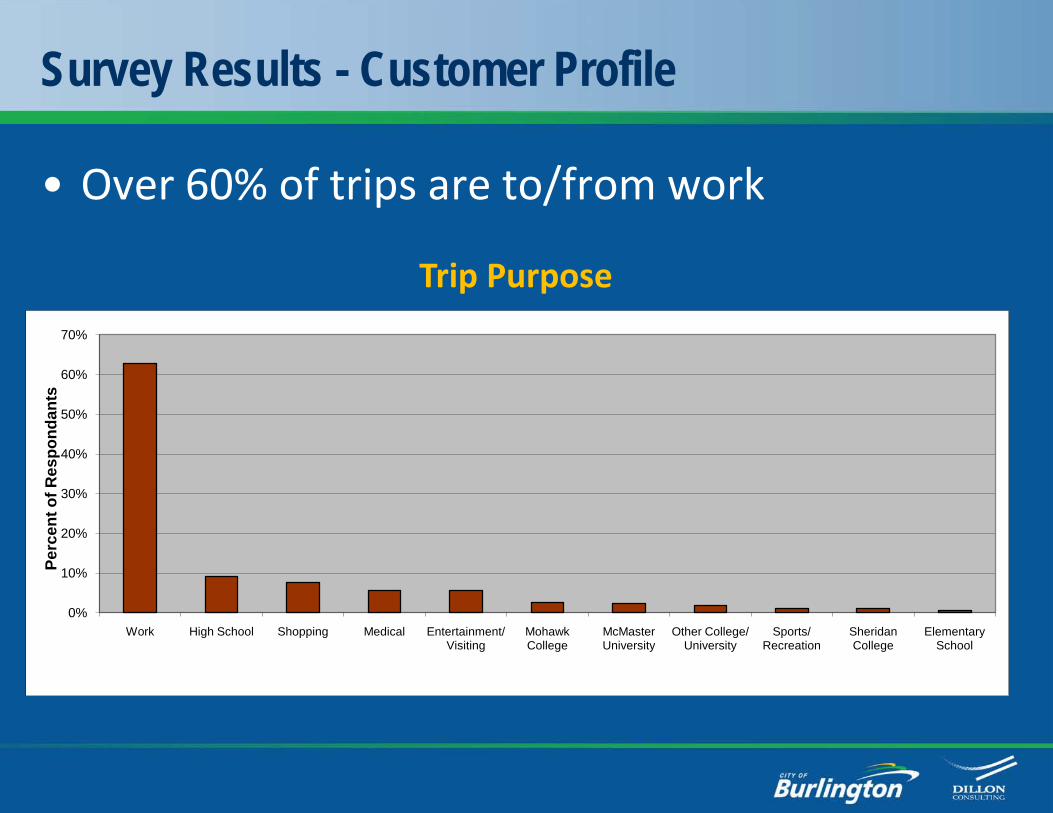
Survey Results - Customer Profile
• Over 60% of trips are to/from work
Trip Purpose
0%
10%
20%
30%
40%
50%
60%
70%
Work High School Shopping Medical Entertainment/ Visiting
Mohawk College
McMaster University
Other College/ University
Sports/ Recreation
Sheridan College
Elementary School
Perc
ent o
f Res
pond
ants
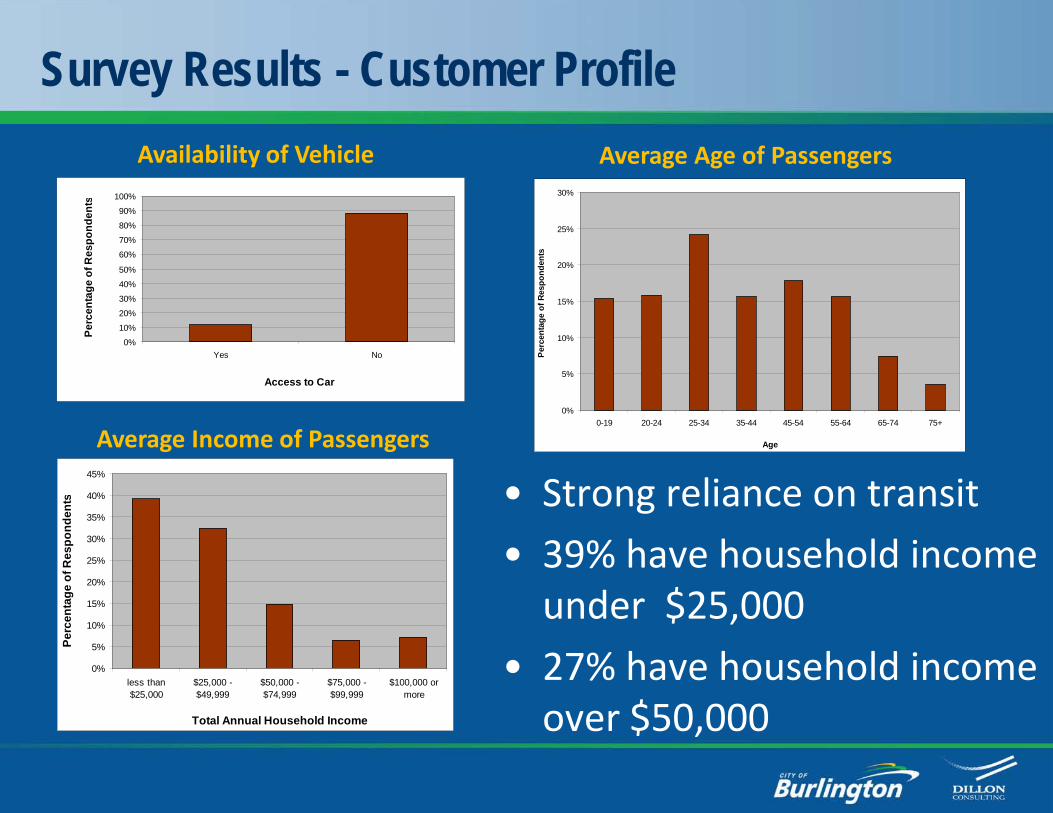
Survey Results - Customer Profile
• Strong reliance on transit
• 39% have household income under $25,000
• 27% have household income over $50,000
0%
10%
20%
30%
40%
50%
60%
70%
80%
90%
100%
Yes No
Access to Car
Perc
enta
ge o
f Res
pond
ents
0%
5%
10%
15%
20%
25%
30%
0-19 20-24 25-34 35-44 45-54 55-64 65-74 75+
Age
Perc
enta
ge o
f Res
pond
ents
Availability of Vehicle Average Age of Passengers
Average Income of Passengers
0%
5%
10%
15%
20%
25%
30%
35%
40%
45%
less than$25,000
$25,000 -$49,999
$50,000 -$74,999
$75,000 -$99,999
$100,000 ormore
Total Annual Household Income
Perc
enta
ge o
f Res
pond
ents
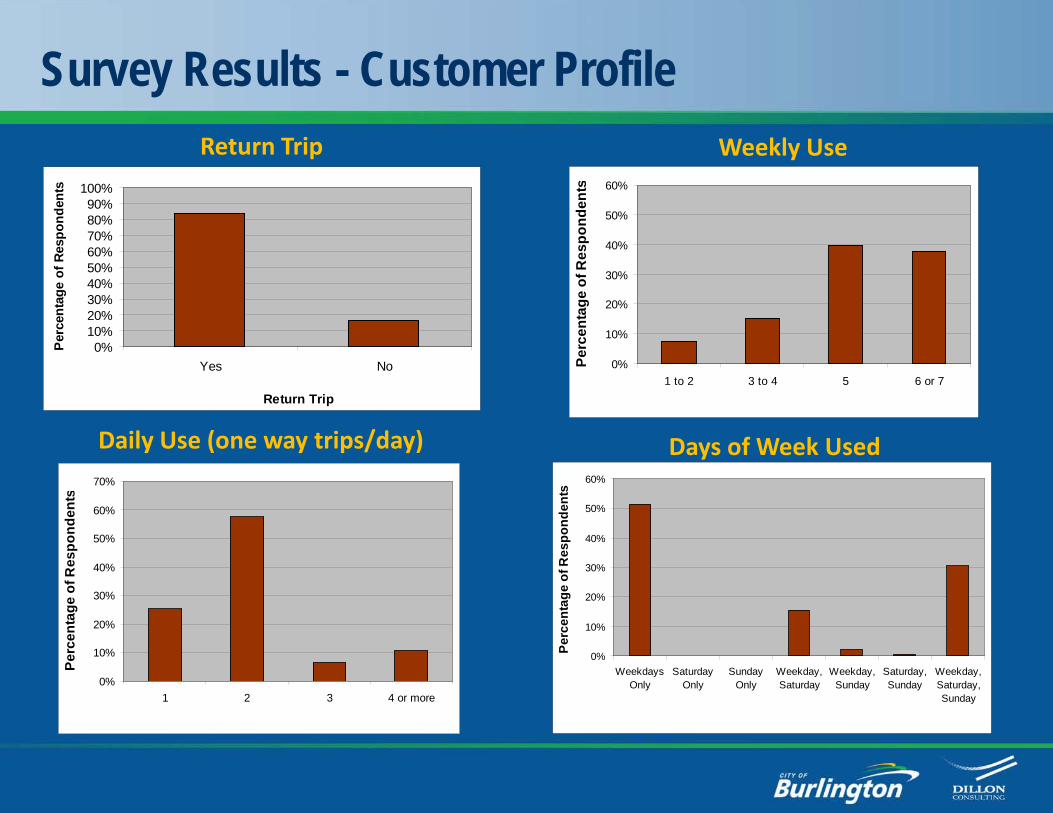
Survey Results - Customer Profile
0%10%20%30%40%50%60%70%80%90%
100%
Yes No
Return Trip
Perc
enta
ge o
f Res
pond
ents
0%
10%
20%
30%
40%
50%
60%
1 to 2 3 to 4 5 6 or 7
Perc
enta
ge o
f Res
pond
ents
Return Trip
0%
10%
20%
30%
40%
50%
60%
70%
1 2 3 4 or more
Perc
enta
ge o
f Res
pond
ents
Weekly Use
Daily Use (one way trips/day) Days of Week Used
0%
10%
20%
30%
40%
50%
60%
WeekdaysOnly
SaturdayOnly
SundayOnly
Weekday,Saturday
Weekday,Sunday
Saturday,Sunday
Weekday,Saturday,Sunday
Perc
enta
ge o
f Res
pond
ents
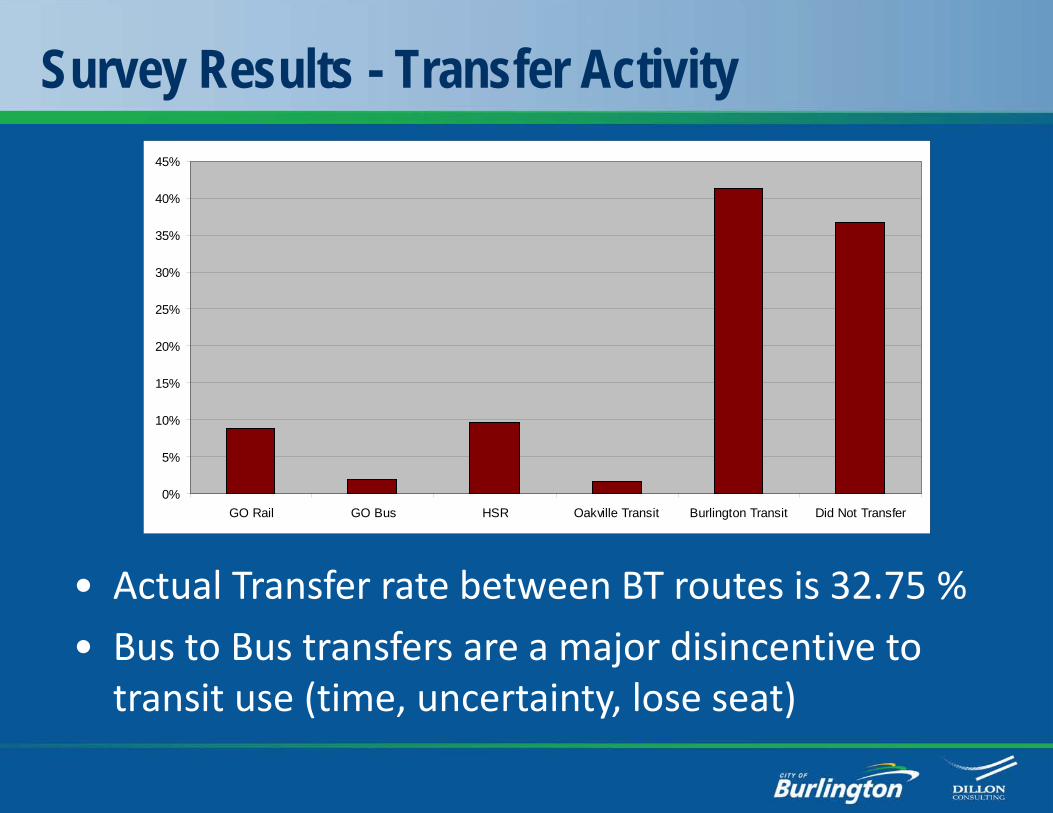
Survey Results - Transfer Activity
0%
5%
10%
15%
20%
25%
30%
35%
40%
45%
GO Rail GO Bus HSR Oakville Transit Burlington Transit Did Not Transfer
• Actual Transfer rate between BT routes is 32.75 %
• Bus to Bus transfers are a major disincentive to transit use (time, uncertainty, lose seat)
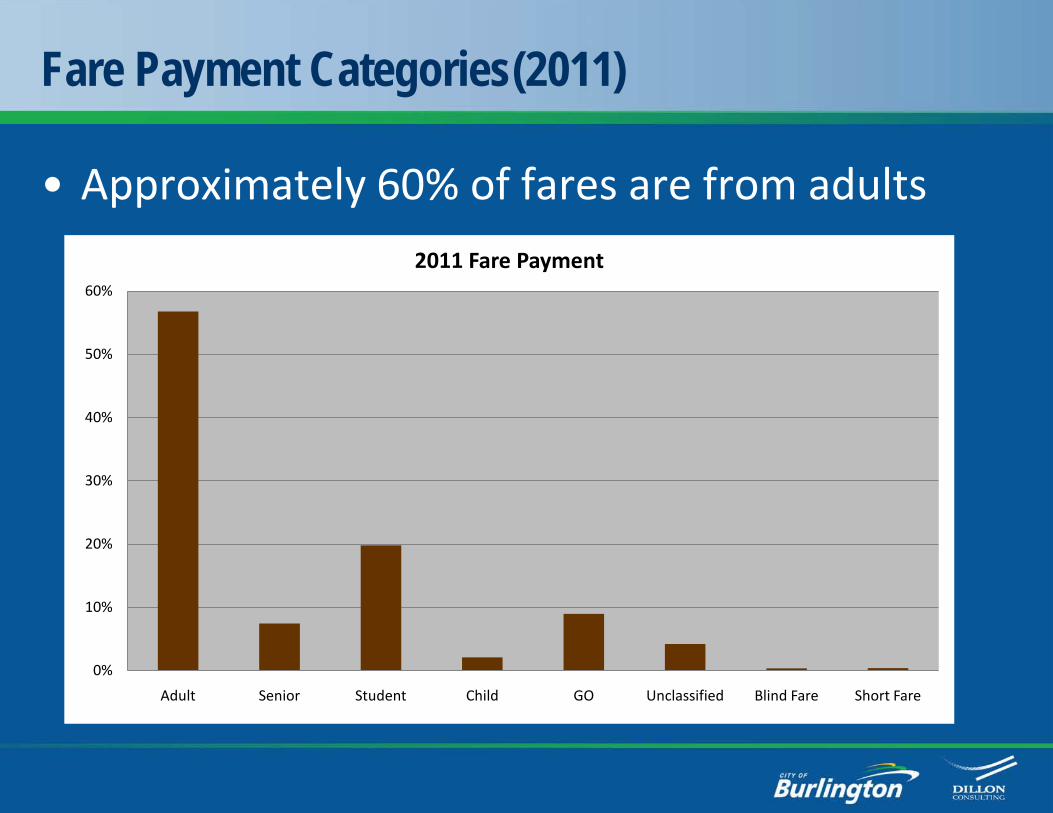
Fare Payment Categories(2011)
• Approximately 60% of fares are from adults
0%
10%
20%
30%
40%
50%
60%
Adult Senior Student Child GO Unclassified Blind Fare Short Fare
2011 Fare Payment
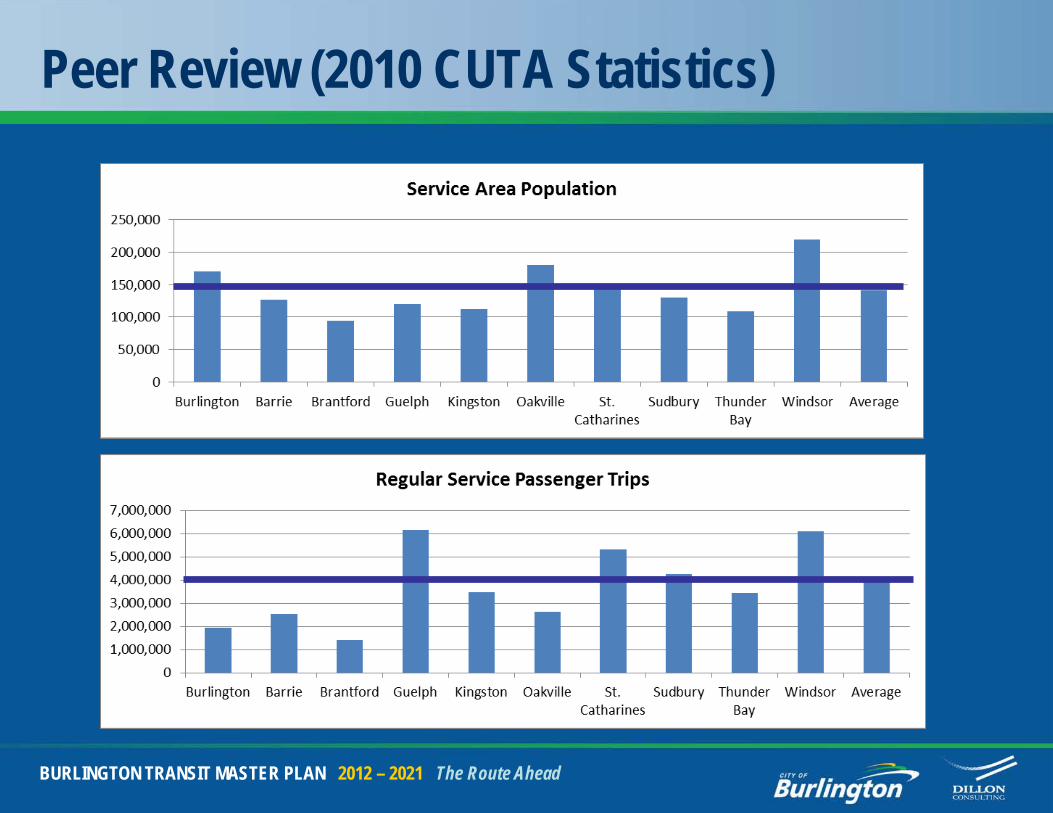
Peer Review (2010 CUTA Statistics)
BURLINGTON TRANSIT MASTER PLAN 2012 – 2021 The Route Ahead
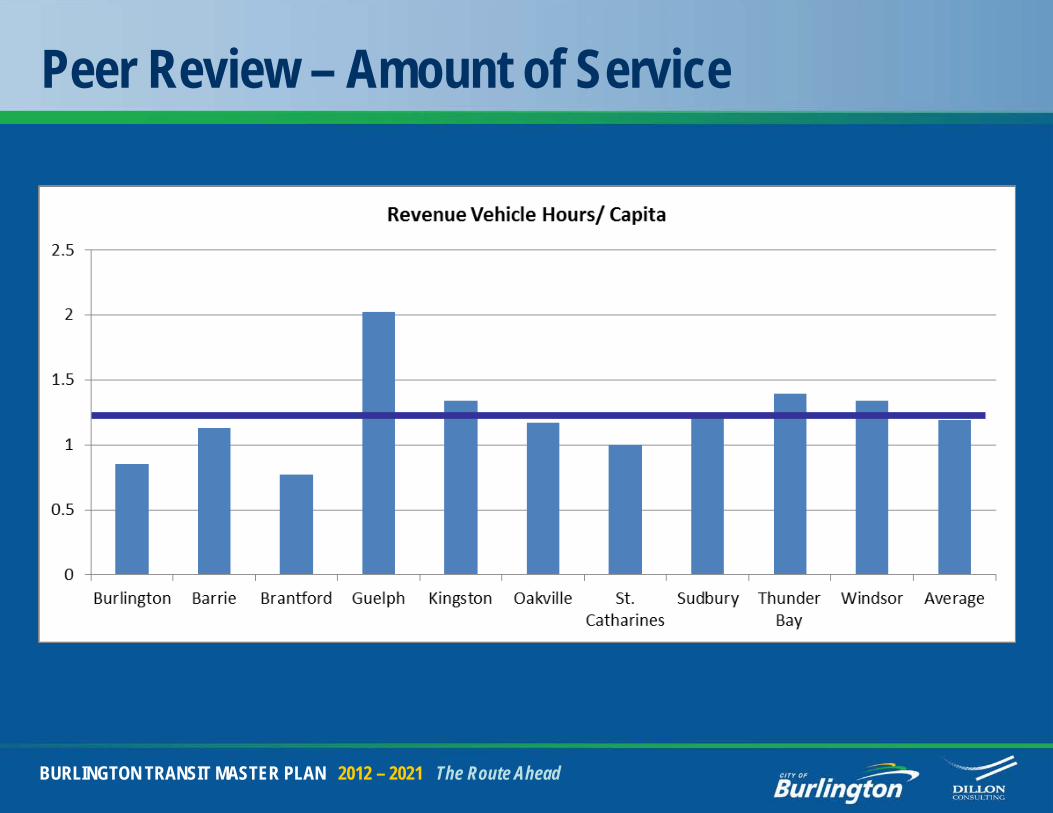
Peer Review – Amount of Service
BURLINGTON TRANSIT MASTER PLAN 2012 – 2021 The Route Ahead
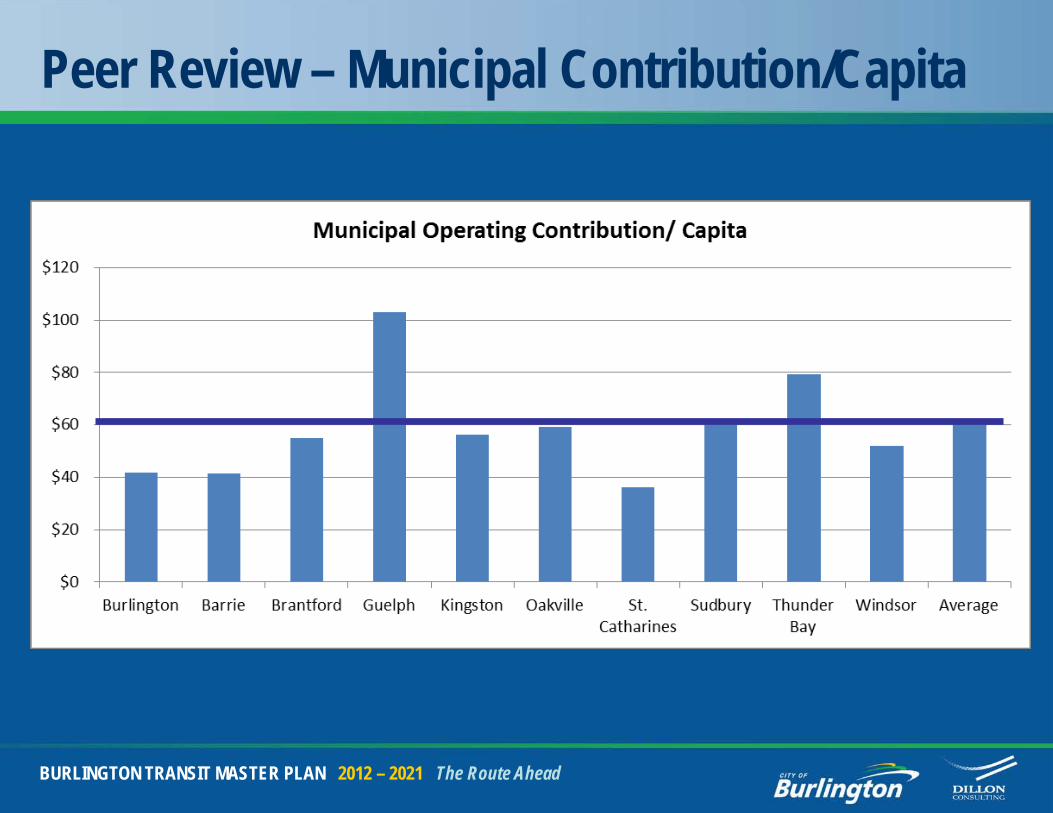
Peer Review – Municipal Contribution/Capita
BURLINGTON TRANSIT MASTER PLAN 2012 – 2021 The Route Ahead
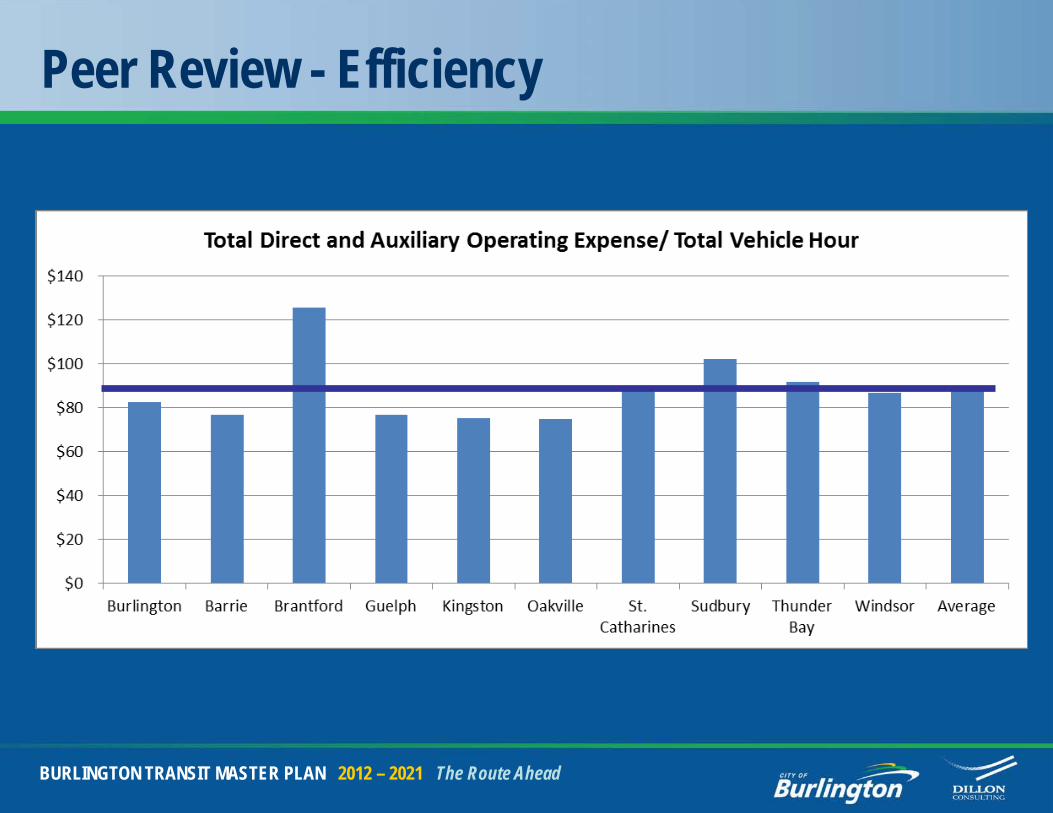
Peer Review - Efficiency
BURLINGTON TRANSIT MASTER PLAN 2012 – 2021 The Route Ahead
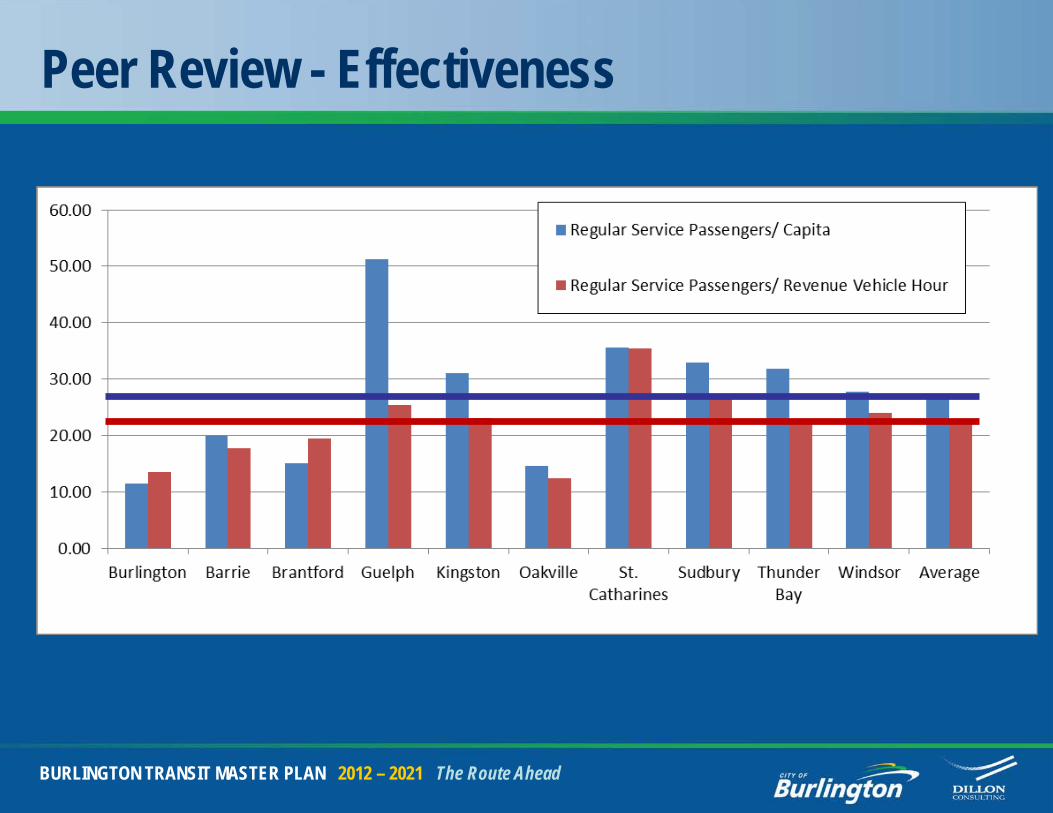
Peer Review - Effectiveness
BURLINGTON TRANSIT MASTER PLAN 2012 – 2021 The Route Ahead
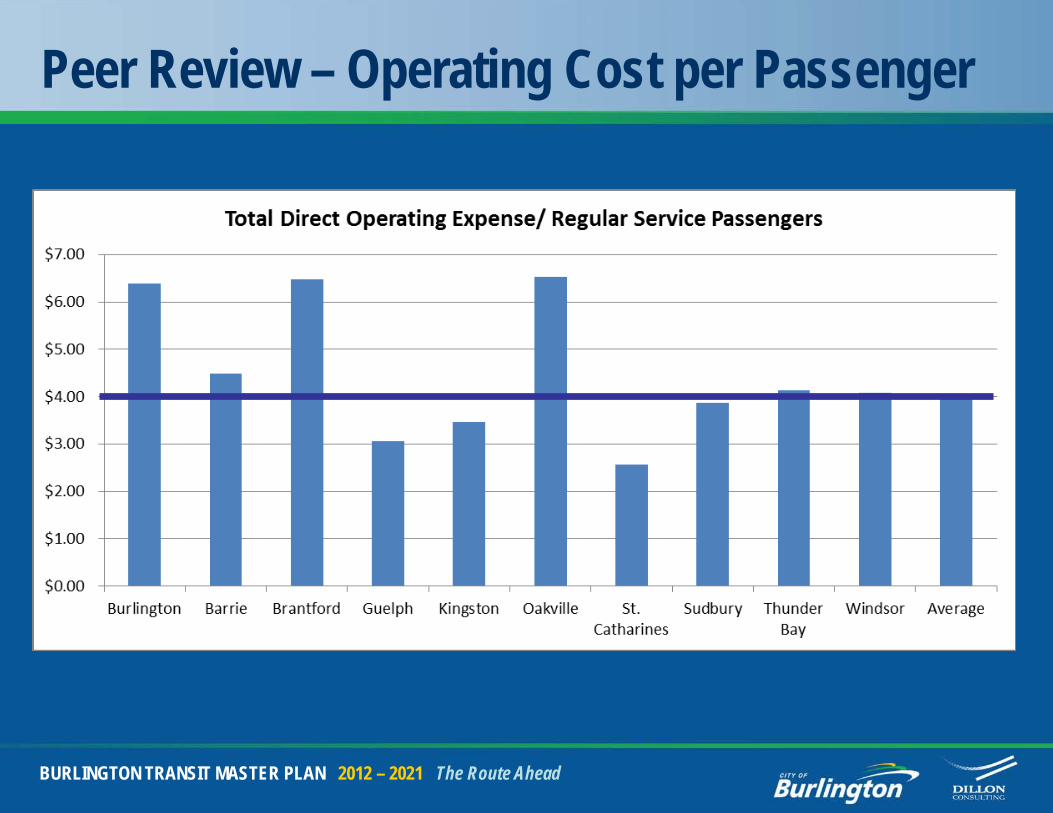
Peer Review – Operating Cost per Passenger
BURLINGTON TRANSIT MASTER PLAN 2012 – 2021 The Route Ahead
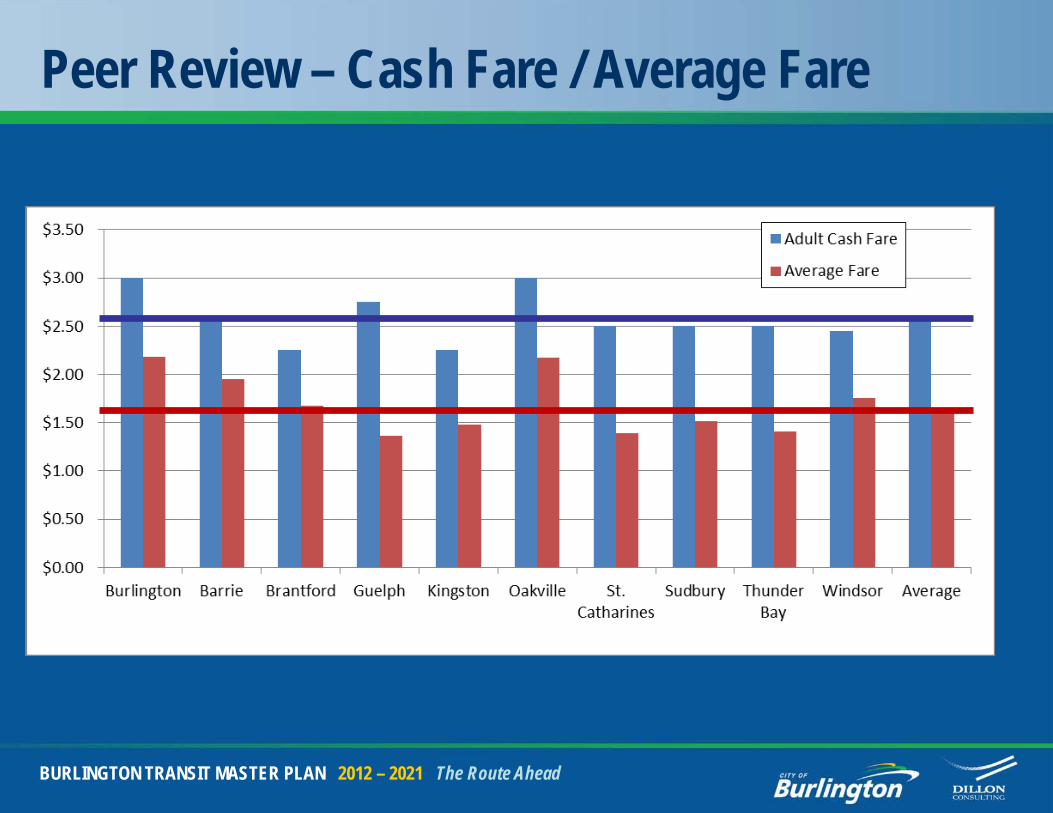
Peer Review – Cash Fare / Average Fare
BURLINGTON TRANSIT MASTER PLAN 2012 – 2021 The Route Ahead
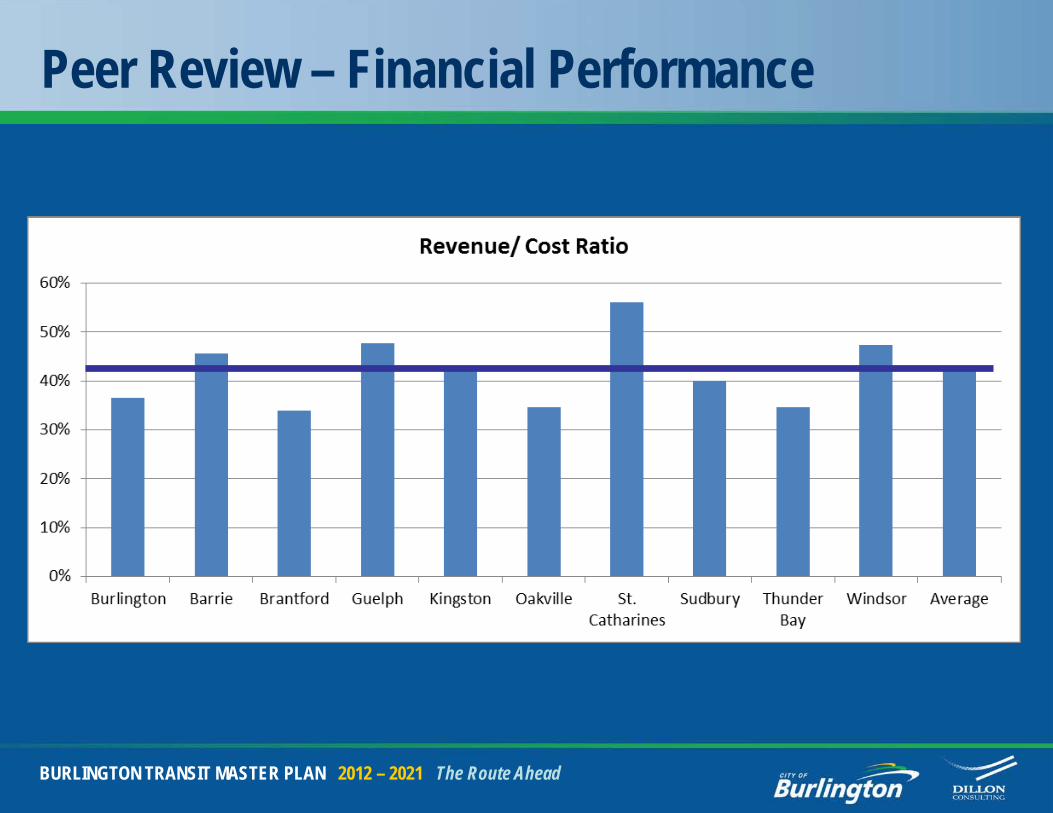
Peer Review – Financial Performance
BURLINGTON TRANSIT MASTER PLAN 2012 – 2021 The Route Ahead
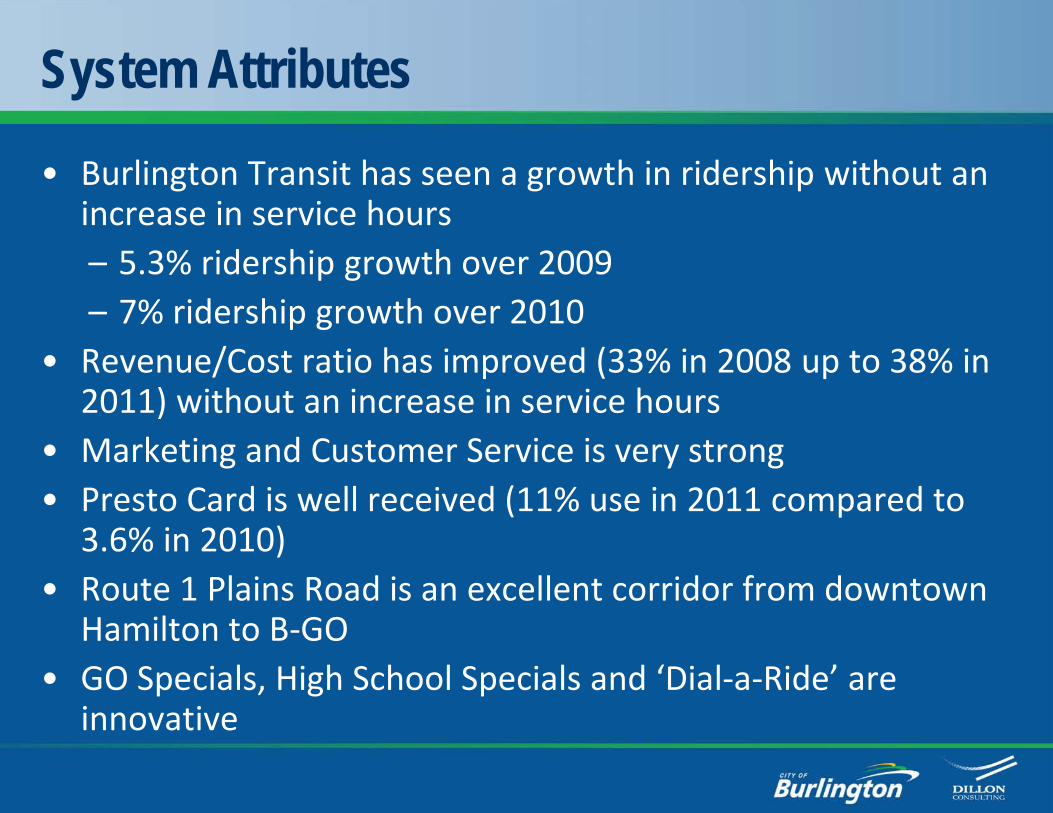
System Attributes
• Burlington Transit has seen a growth in ridership without an increase in service hours – 5.3% ridership growth over 2009– 7% ridership growth over 2010
• Revenue/Cost ratio has improved (33% in 2008 up to 38% in 2011) without an increase in service hours
• Marketing and Customer Service is very strong • Presto Card is well received (11% use in 2011 compared to
3.6% in 2010)• Route 1 Plains Road is an excellent corridor from downtown
Hamilton to B-GO• GO Specials, High School Specials and ‘Dial-a-Ride’ are
innovative
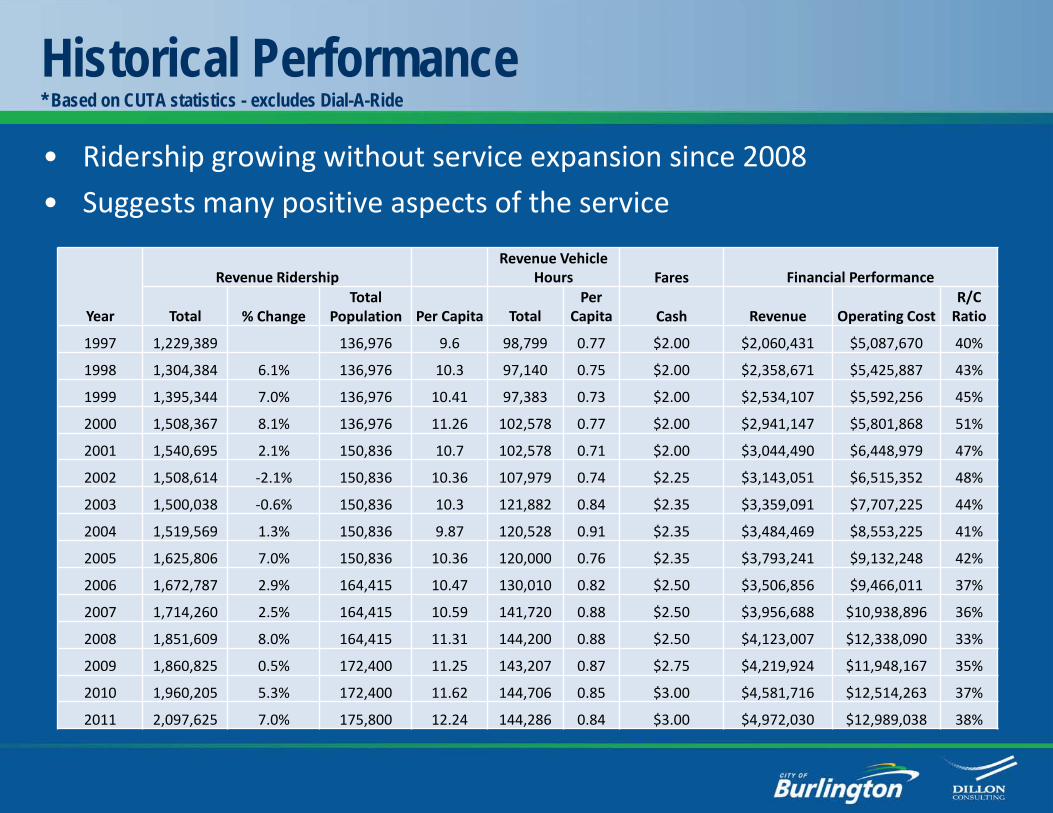
Historical Performance* Based on CUTA statistics - excludes Dial-A-Ride
• Ridership growing without service expansion since 2008
• Suggests many positive aspects of the service
Year
Revenue RidershipRevenue Vehicle
Hours Fares Financial Performance
Total % ChangeTotal
Population Per Capita TotalPer
Capita Cash Revenue Operating CostR/C
Ratio
1997 1,229,389 136,976 9.6 98,799 0.77 $2.00 $2,060,431 $5,087,670 40%
1998 1,304,384 6.1% 136,976 10.3 97,140 0.75 $2.00 $2,358,671 $5,425,887 43%
1999 1,395,344 7.0% 136,976 10.41 97,383 0.73 $2.00 $2,534,107 $5,592,256 45%
2000 1,508,367 8.1% 136,976 11.26 102,578 0.77 $2.00 $2,941,147 $5,801,868 51%
2001 1,540,695 2.1% 150,836 10.7 102,578 0.71 $2.00 $3,044,490 $6,448,979 47%
2002 1,508,614 -2.1% 150,836 10.36 107,979 0.74 $2.25 $3,143,051 $6,515,352 48%
2003 1,500,038 -0.6% 150,836 10.3 121,882 0.84 $2.35 $3,359,091 $7,707,225 44%
2004 1,519,569 1.3% 150,836 9.87 120,528 0.91 $2.35 $3,484,469 $8,553,225 41%
2005 1,625,806 7.0% 150,836 10.36 120,000 0.76 $2.35 $3,793,241 $9,132,248 42%
2006 1,672,787 2.9% 164,415 10.47 130,010 0.82 $2.50 $3,506,856 $9,466,011 37%
2007 1,714,260 2.5% 164,415 10.59 141,720 0.88 $2.50 $3,956,688 $10,938,896 36%
2008 1,851,609 8.0% 164,415 11.31 144,200 0.88 $2.50 $4,123,007 $12,338,090 33%
2009 1,860,825 0.5% 172,400 11.25 143,207 0.87 $2.75 $4,219,924 $11,948,167 35%
2010 1,960,205 5.3% 172,400 11.62 144,706 0.85 $3.00 $4,581,716 $12,514,263 37%
2011 2,097,625 7.0% 175,800 12.24 144,286 0.84 $3.00 $4,972,030 $12,989,038 38%
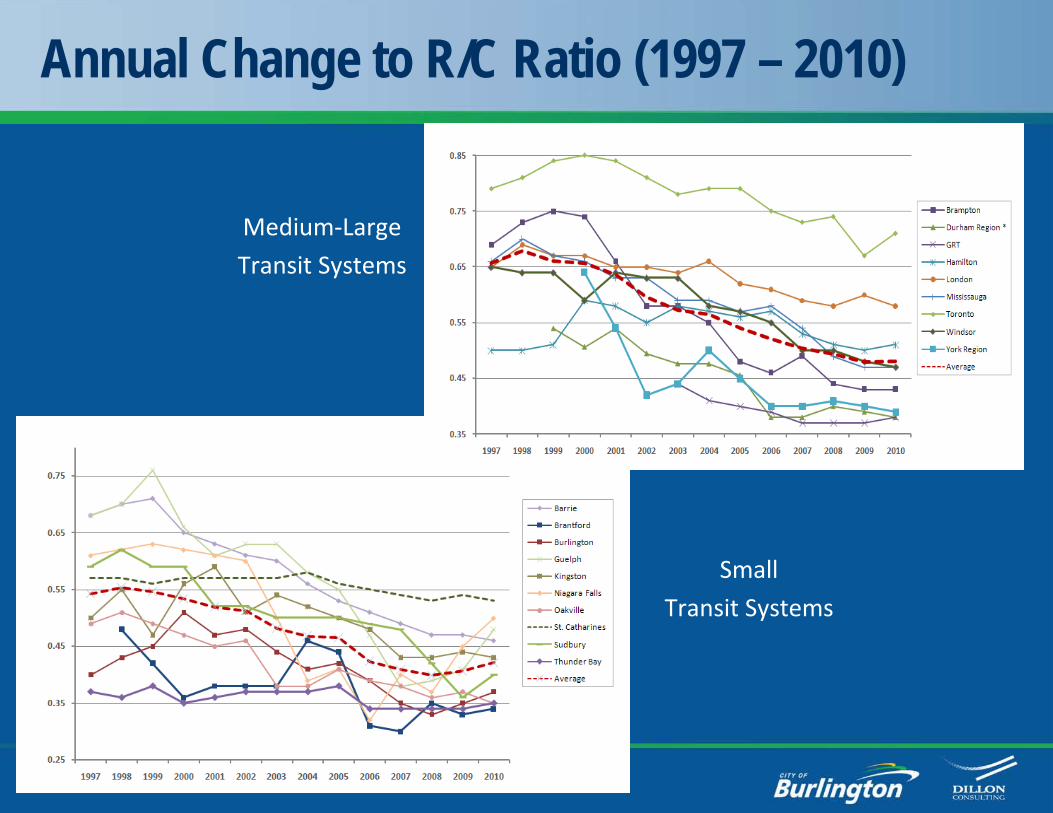
Annual Change to R/C Ratio (1997 – 2010)
Medium-Large
Transit Systems
Small
Transit Systems
Market Assessment
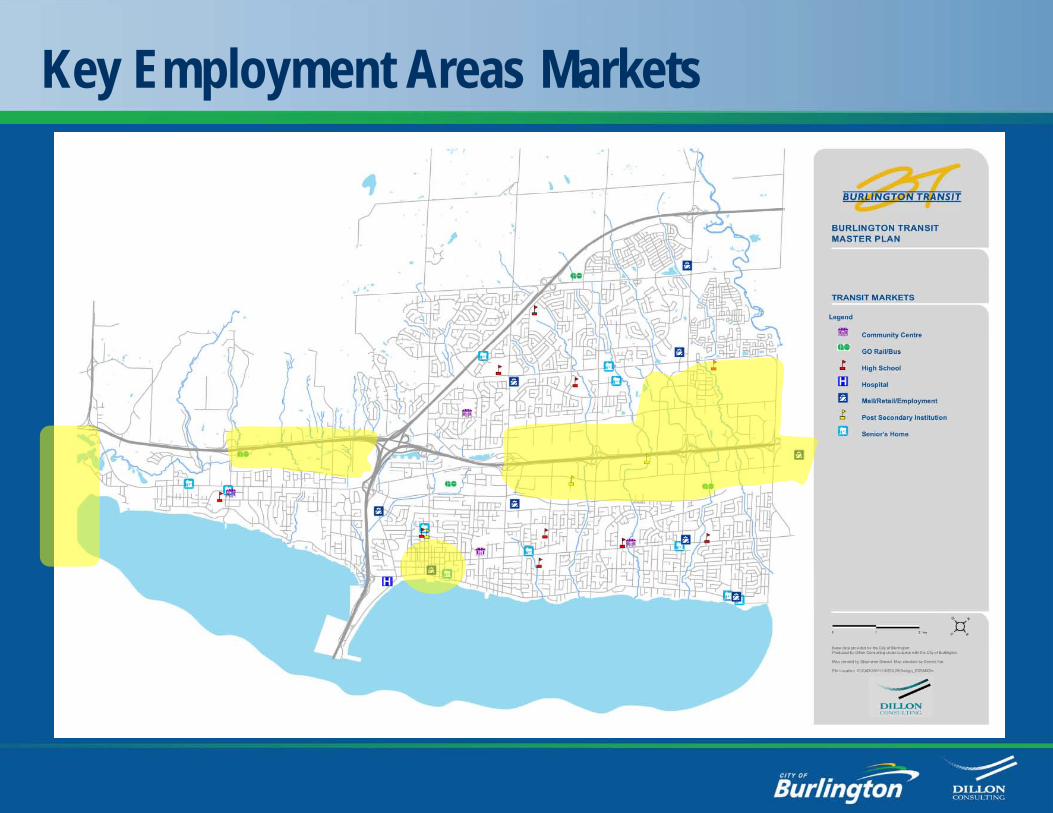
Key Employment Areas Markets
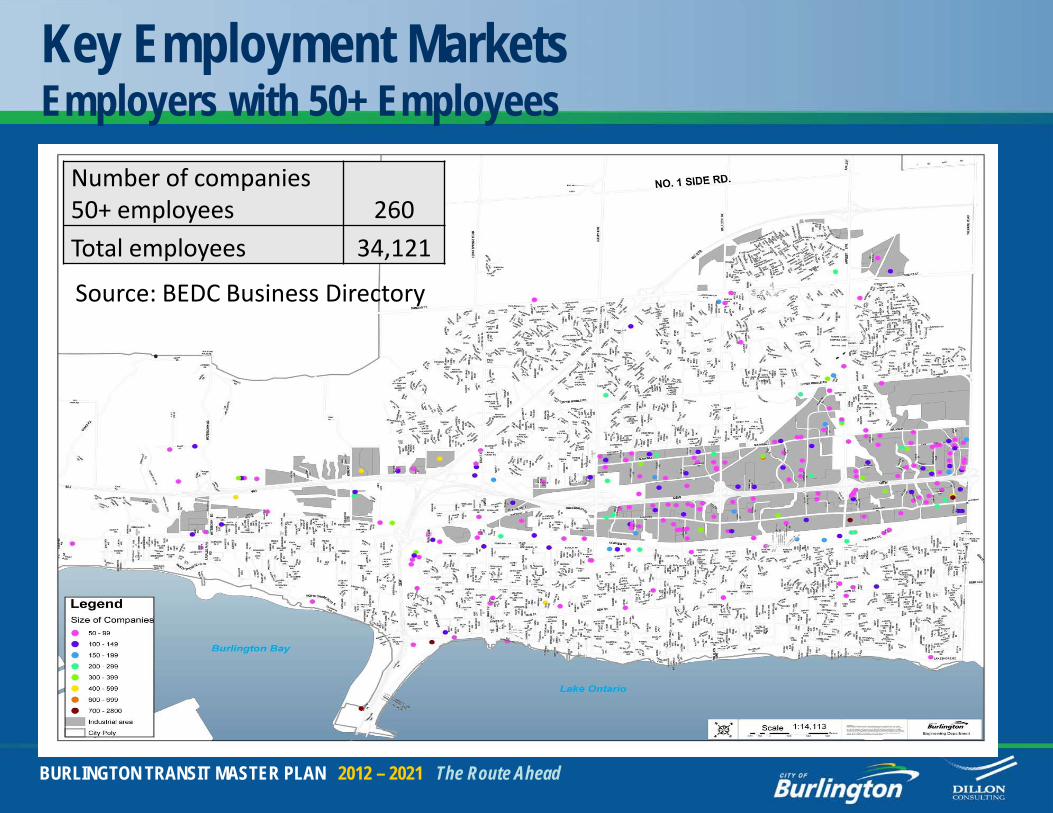
Key Employment Markets Employers with 50+ Employees
BURLINGTON TRANSIT MASTER PLAN 2012 – 2021 The Route Ahead
Number of companies50+ employees 260
Total employees 34,121
•
Source: BEDC Business Directory
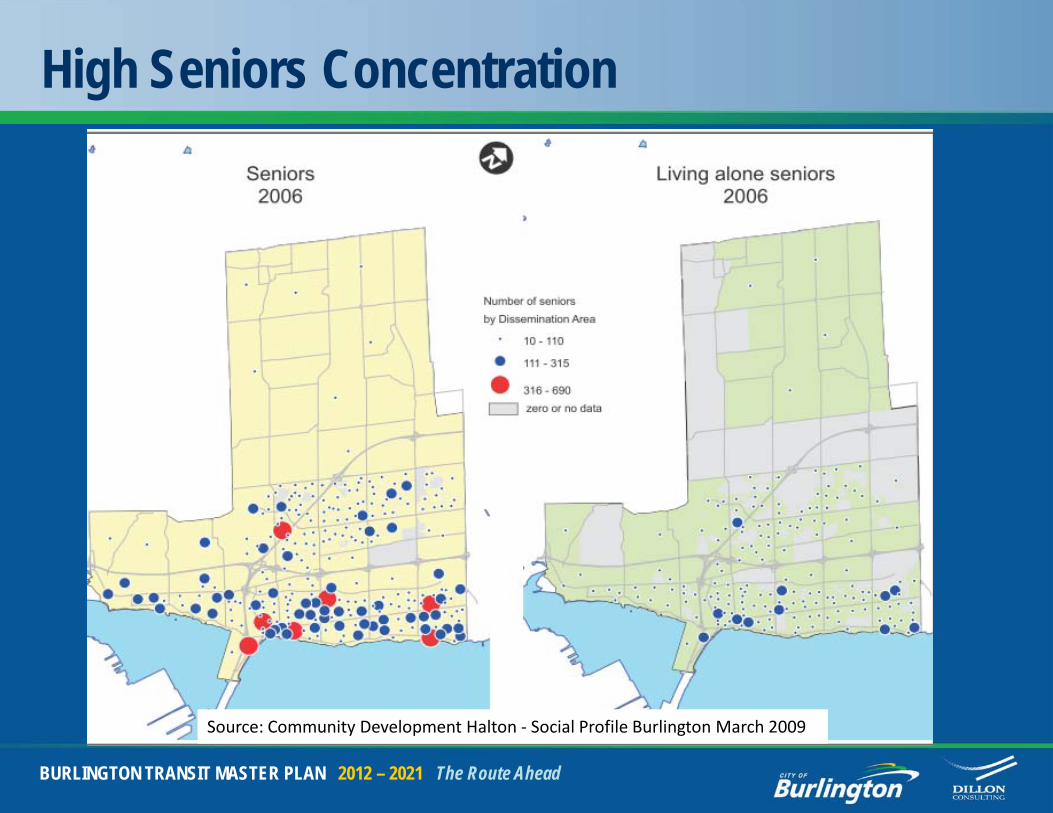
High Seniors Concentration
BURLINGTON TRANSIT MASTER PLAN 2012 – 2021 The Route Ahead
Source: Community Development Halton - Social Profile Burlington March 2009
Senior Population
• There are over 25,000 seniors living in Burlington representing about 15% of the total population
• Seniors need mobility for their independence
• That proportion is higher than the regional average (12%) and the provincial average (14%)
• The city also has a greater share of the Region’s senior population than the total population (46% versus 33%)
BURLINGTON TRANSIT MASTER PLAN 2012 – 2021 The Route Ahead
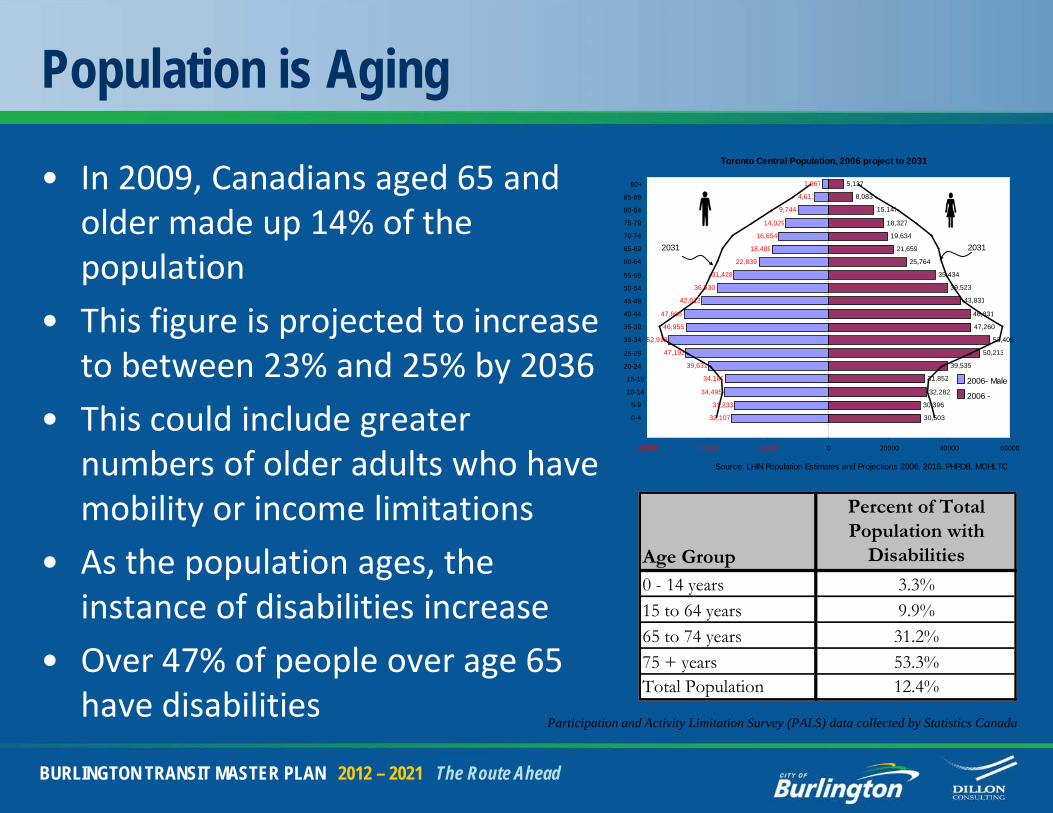
Population is Aging
• In 2009, Canadians aged 65 and older made up 14% of the population
• This figure is projected to increase to between 23% and 25% by 2036
• This could include greater numbers of older adults who have mobility or income limitations
• As the population ages, the instance of disabilities increase
• Over 47% of people over age 65 have disabilities
BURLINGTON TRANSIT MASTER PLAN 2012 – 2021 The Route Ahead
32,107
31,233
34,495
34,180
39,631
47,193
52,918
46,955
47,606
42,013
36,530
31,428
22,839
18,489
16,654
14,029
9,744
4,611
1,967
30,503
30,396
32,282
31,852
39,535
50,213
53,405
47,260
46,831
43,831
39,523
35,434
25,764
21,659
19,634
18,327
15,147
8,083
5,137
60000 40000 20000 0 20000 40000 60000
0-4
5-9
10-14
15-19
20-24
25-29
30-34
35-39
40-44
45-49
50-54
55-59
60-64
65-69
70-74
75-79
80-84
85-89
90+
Toronto Central Population, 2006 project to 2031
Source: LHIN Population Estimates and Projections 2006, 2016. PHPDB, MOHLTC
2006- Male
2006 -
2031 2031
Age Group
Percent of Total Population with
Disabilities0 - 14 years 3.3%15 to 64 years 9.9%65 to 74 years 31.2%75 + years 53.3%Total Population 12.4%
Participation and Activity Limitation Survey (PALS) data collected by Statistics Canada
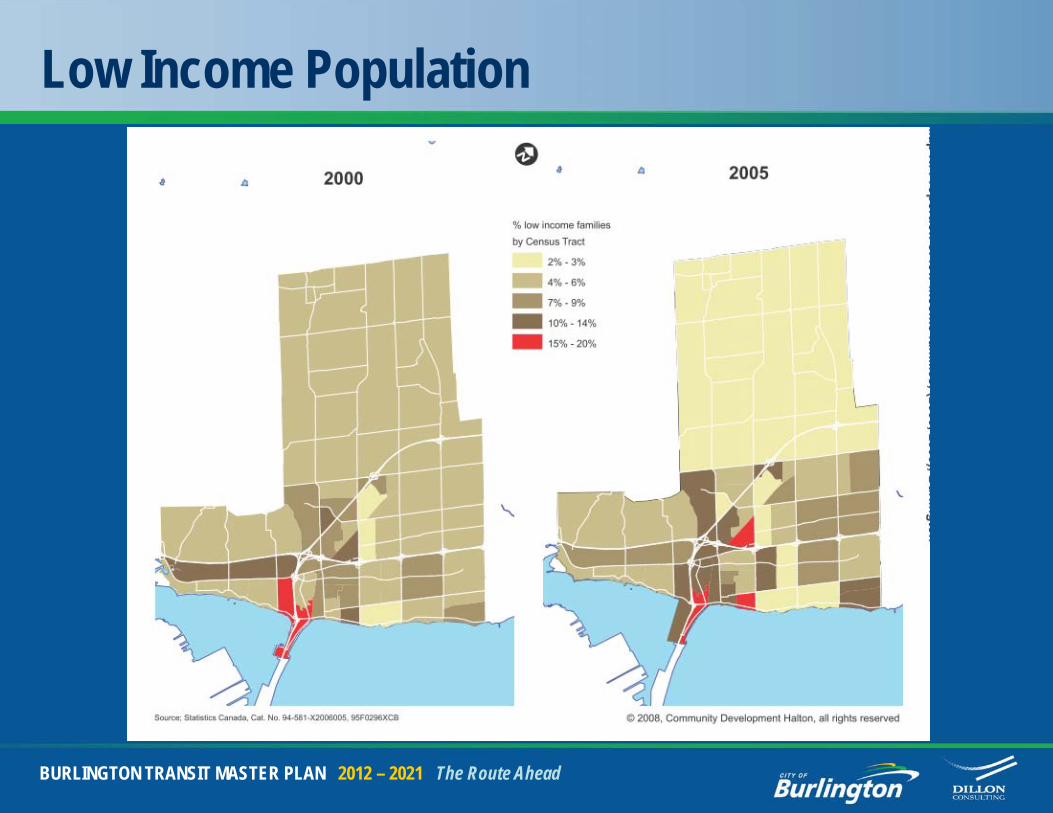
Low Income Population
BURLINGTON TRANSIT MASTER PLAN 2012 – 2021 The Route Ahead
Low Income
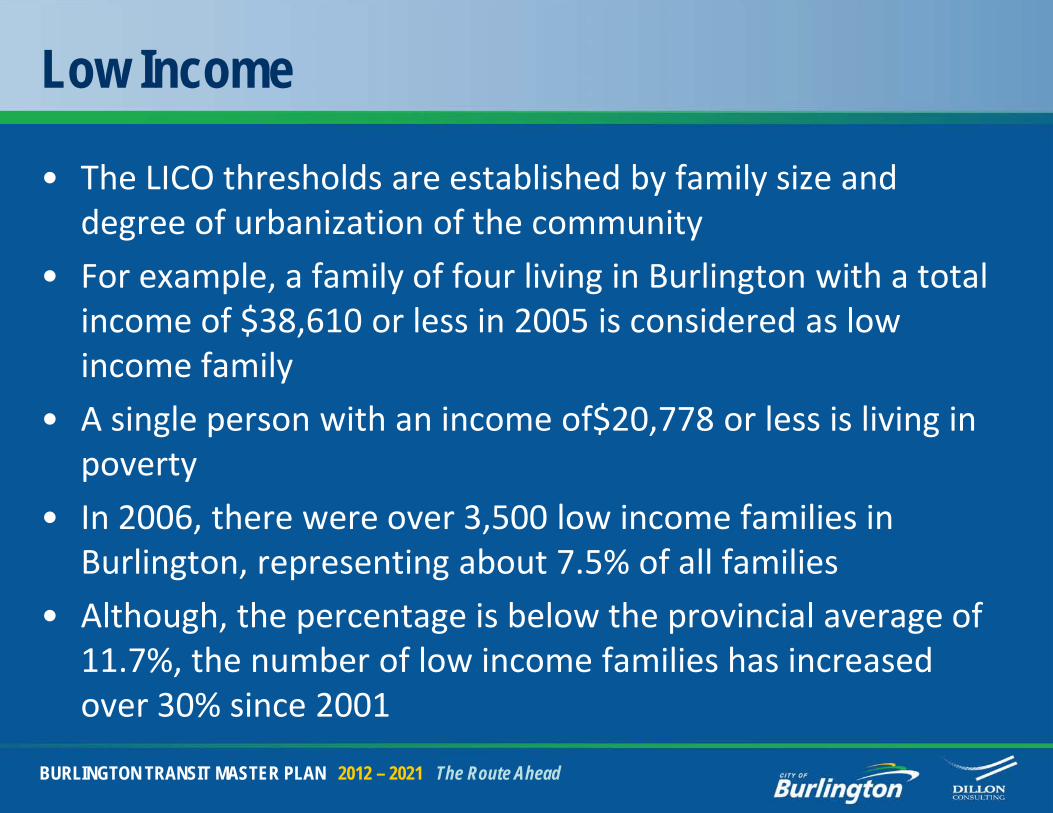
• The LICO thresholds are established by family size and degree of urbanization of the community
• For example, a family of four living in Burlington with a total income of $38,610 or less in 2005 is considered as low income family
• A single person with an income of$20,778 or less is living in poverty
• In 2006, there were over 3,500 low income families in Burlington, representing about 7.5% of all families
• Although, the percentage is below the provincial average of 11.7%, the number of low income families has increased over 30% since 2001
BURLINGTON TRANSIT MASTER PLAN 2012 – 2021 The Route Ahead
Low Income
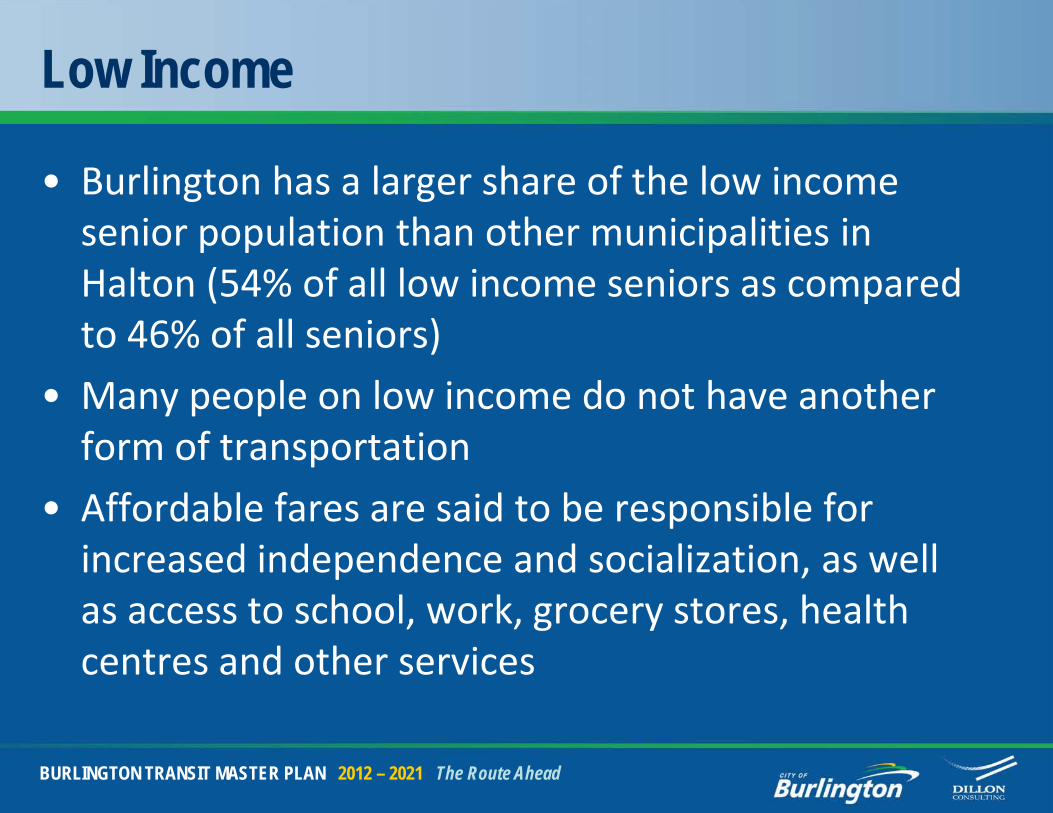
• Burlington has a larger share of the low income senior population than other municipalities in Halton (54% of all low income seniors as compared to 46% of all seniors)
• Many people on low income do not have another form of transportation
• Affordable fares are said to be responsible for increased independence and socialization, as well as access to school, work, grocery stores, health centres and other services
BURLINGTON TRANSIT MASTER PLAN 2012 – 2021 The Route Ahead
Diagnostic and Strategic Directions
Service Assessment Methodology
• The existing route and service structure was assessed through a review of:– Ridership performance on routes (utilization and seated
capacity) weekdays and weekends
– Potential markets (i.e. seniors, students, employees in Burlington jobs, inter-regional commuters)
– Feedback from council, drivers, customers, the public and Steering Committee
– Municipal policies and strategies (intensification, strategic plan, mode share and R/C targets)
– Regional plans and infrastructure (i.e. Dundas BRT)
BURLINGTON TRANSIT MASTER PLAN 2012 – 2021 The Route Ahead
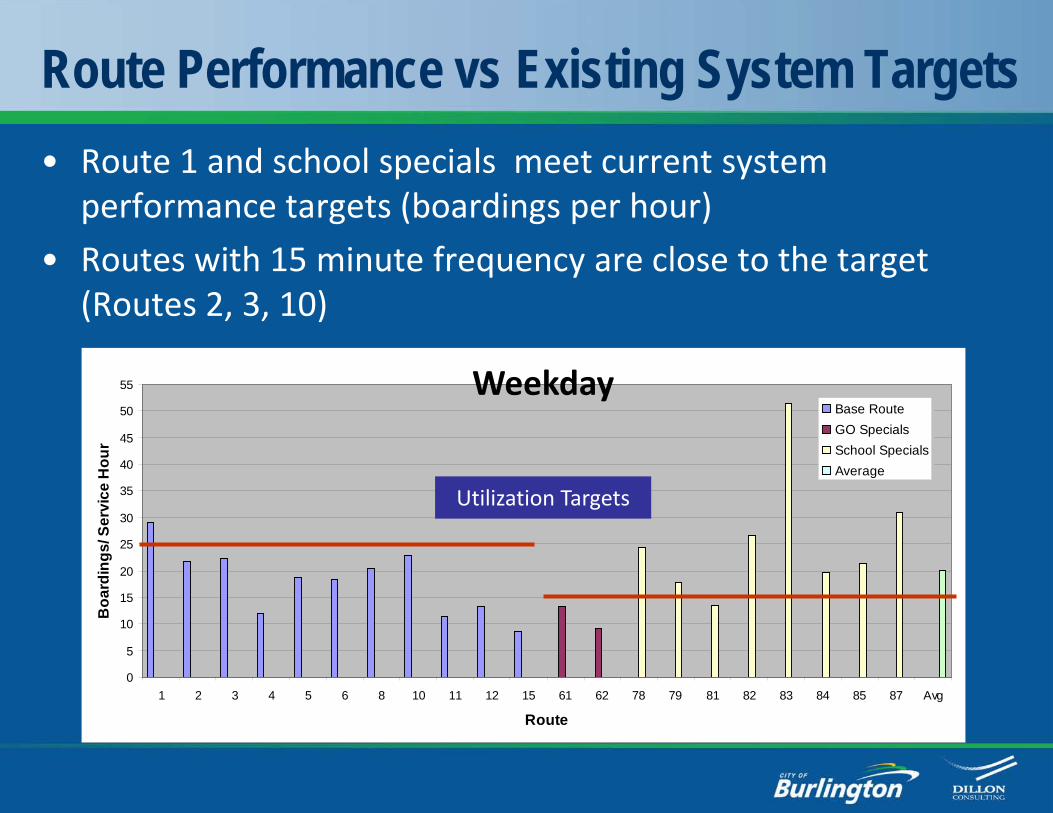
Route Performance vs Existing System Targets• Route 1 and school specials meet current system
performance targets (boardings per hour)
• Routes with 15 minute frequency are close to the target (Routes 2, 3, 10)
0
5
10
15
20
25
30
35
40
45
50
55
1 2 3 4 5 6 8 10 11 12 15 61 62 78 79 81 82 83 84 85 87 Avg
Route
Boa
rdin
gs/ S
ervi
ce H
our
Base RouteGO SpecialsSchool SpecialsAverage
Weekday
Utilization Targets
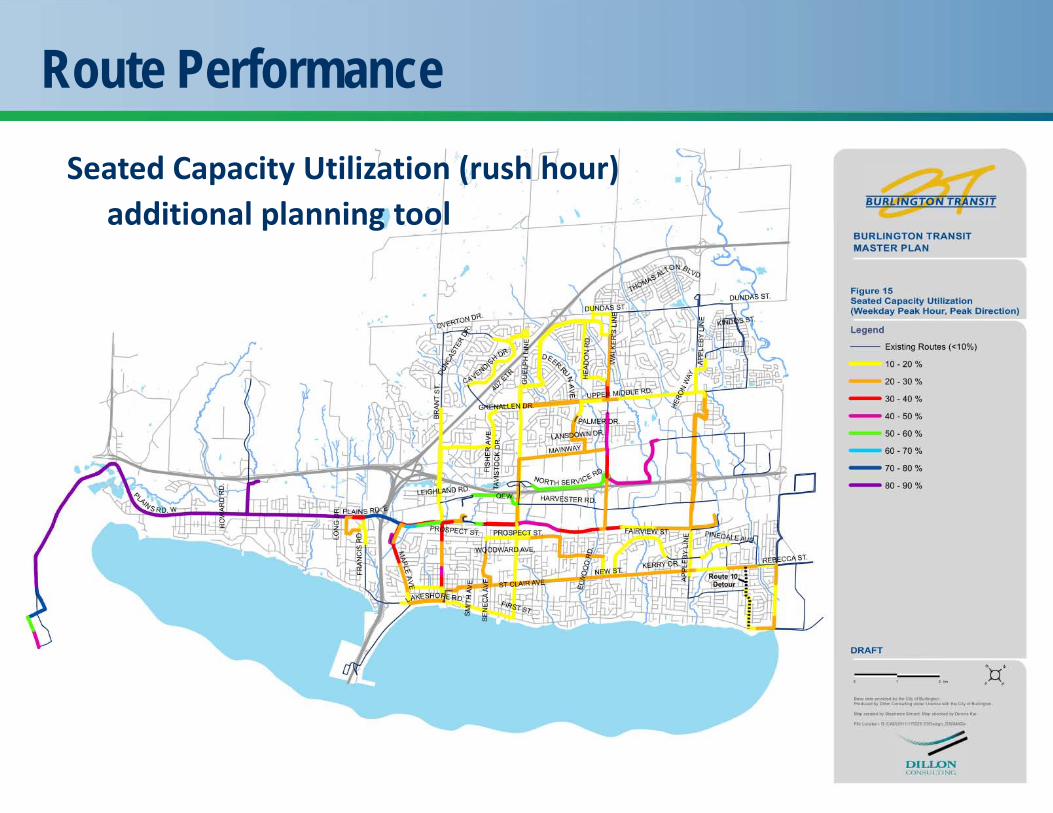
Route PerformanceSeated Capacity Utilization (rush hour)
additional planning tool
Route Design
Strategic Directions
• Adjust poor performing routes where appropriate (focus on key and growing destinations)
• Ensure adequate coverage is provided
• Good service design will require a minimum level of service that will attract new users
Service Hours/Frequency - Diagnostic
• Level of Sunday service (frequency, service hours and coverage) is a major complaint of current users
• Saturday service level is also a concern of users
• Hourly service is a challenge for transit customers to accommodate daily trip needs and can be a strong disincentive to transit commitment
• Transit users increasingly need longer service hours 7 days a week for work/shopping/social trips
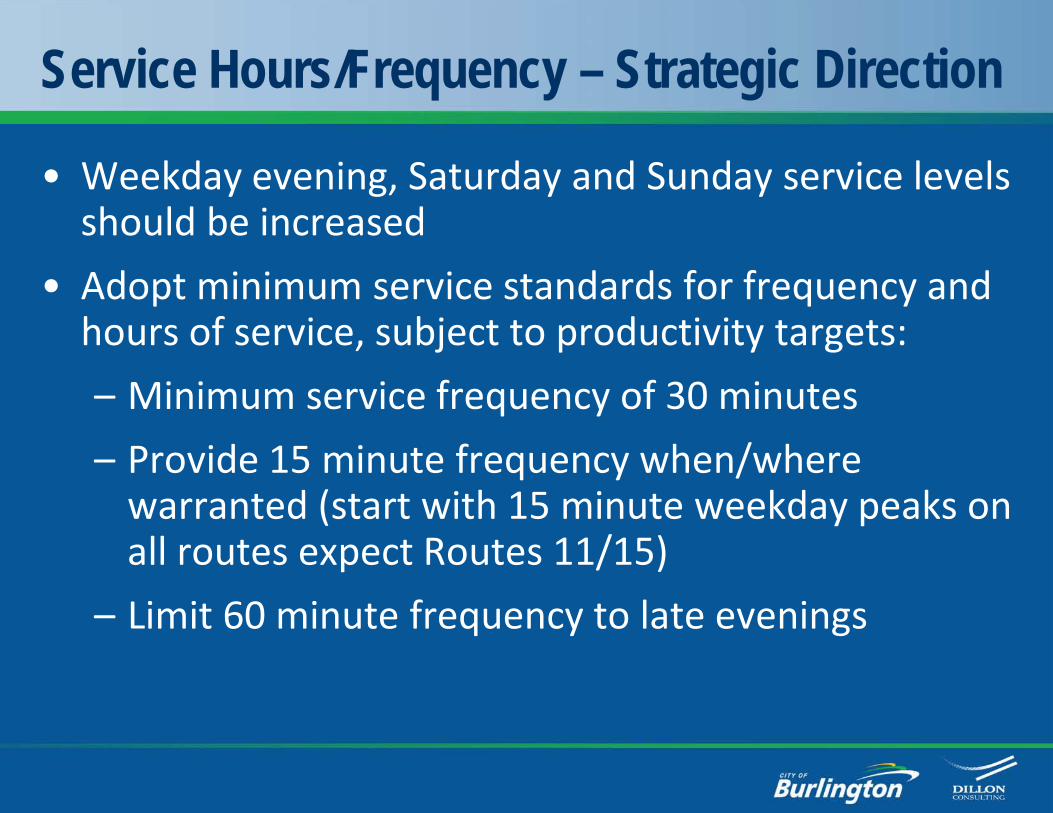
Service Hours/Frequency – Strategic Direction
• Weekday evening, Saturday and Sunday service levels should be increased
• Adopt minimum service standards for frequency and hours of service, subject to productivity targets:
– Minimum service frequency of 30 minutes
– Provide 15 minute frequency when/where warranted (start with 15 minute weekday peaks on all routes expect Routes 11/15)
– Limit 60 minute frequency to late evenings
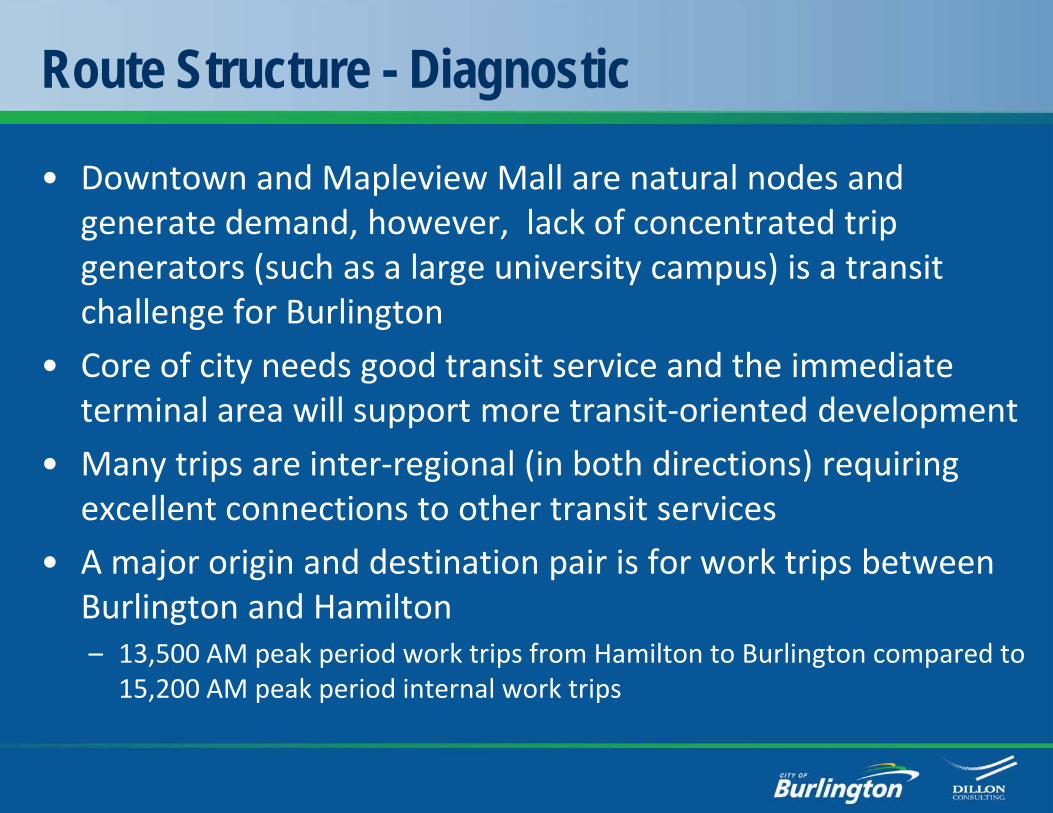
Route Structure - Diagnostic
• Downtown and Mapleview Mall are natural nodes and generate demand, however, lack of concentrated trip generators (such as a large university campus) is a transit challenge for Burlington
• Core of city needs good transit service and the immediate terminal area will support more transit-oriented development
• Many trips are inter-regional (in both directions) requiring excellent connections to other transit services
• A major origin and destination pair is for work trips between Burlington and Hamilton– 13,500 AM peak period work trips from Hamilton to Burlington compared to
15,200 AM peak period internal work trips
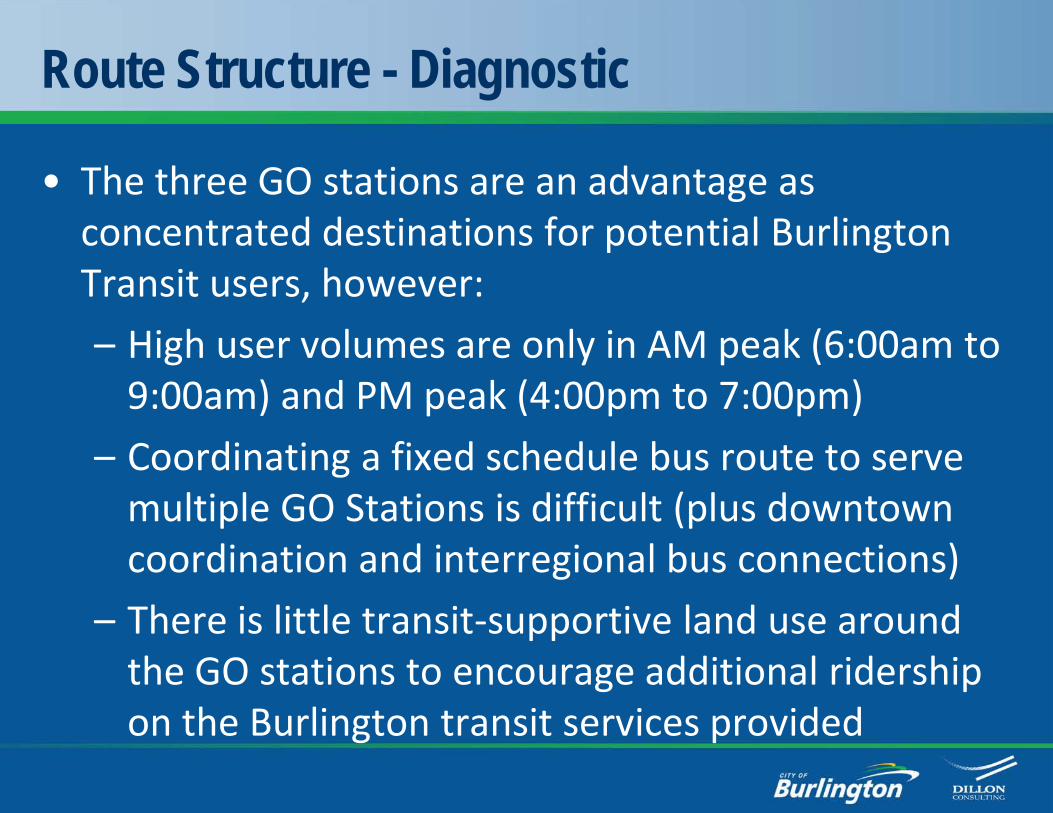
Route Structure - Diagnostic
• The three GO stations are an advantage as concentrated destinations for potential Burlington Transit users, however:
– High user volumes are only in AM peak (6:00am to 9:00am) and PM peak (4:00pm to 7:00pm)
– Coordinating a fixed schedule bus route to serve multiple GO Stations is difficult (plus downtown coordination and interregional bus connections)
– There is little transit-supportive land use around the GO stations to encourage additional ridership on the Burlington transit services provided
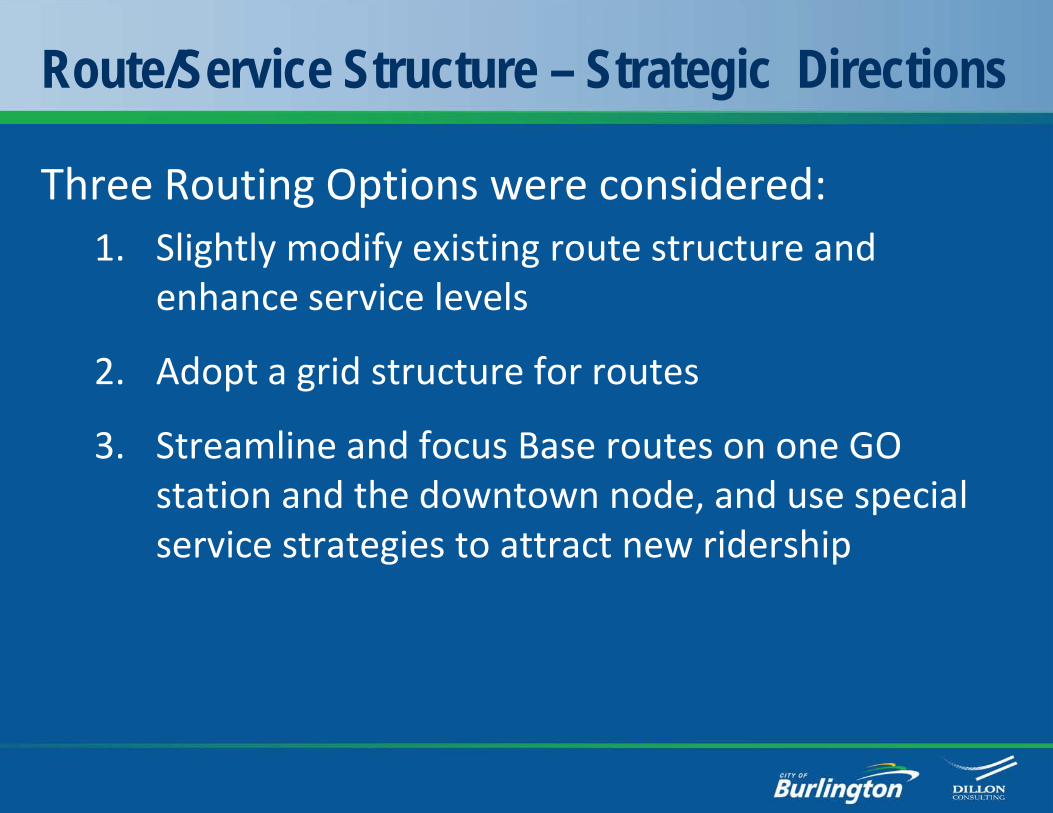
Route/Service Structure – Strategic Directions
Three Routing Options were considered:1. Slightly modify existing route structure and
enhance service levels
2. Adopt a grid structure for routes
3. Streamline and focus Base routes on one GO station and the downtown node, and use special service strategies to attract new ridership
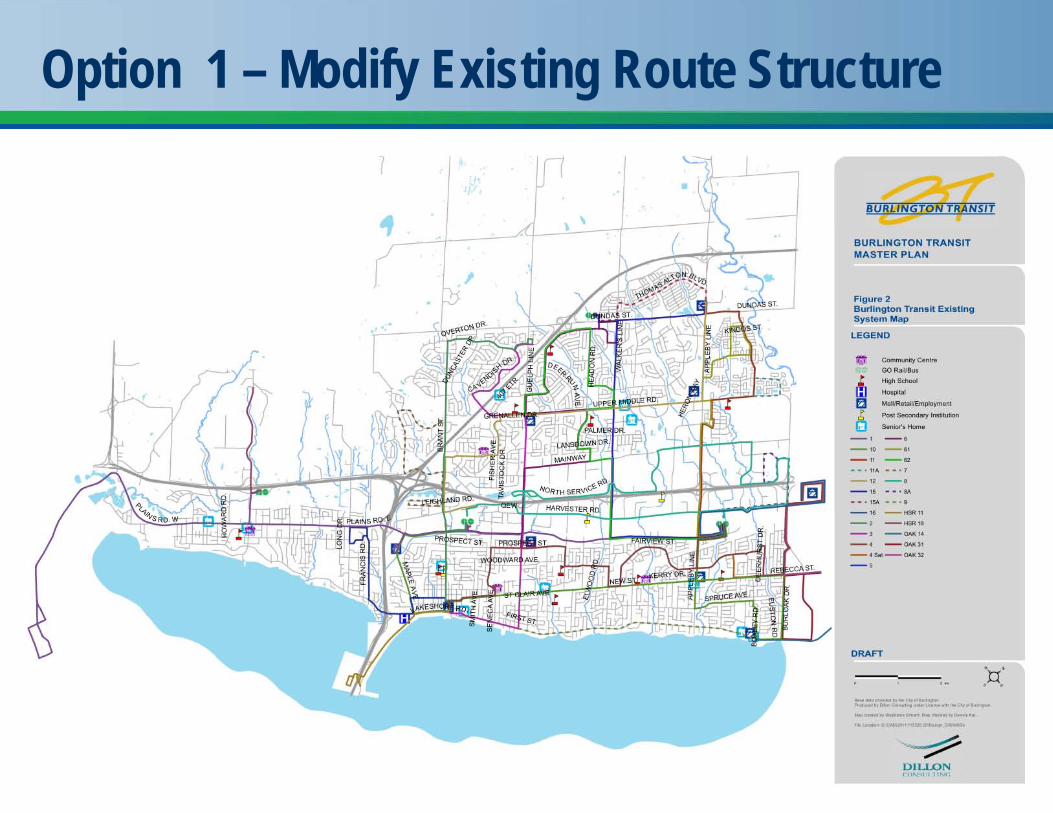
Option 1 – Modify Existing Route Structure
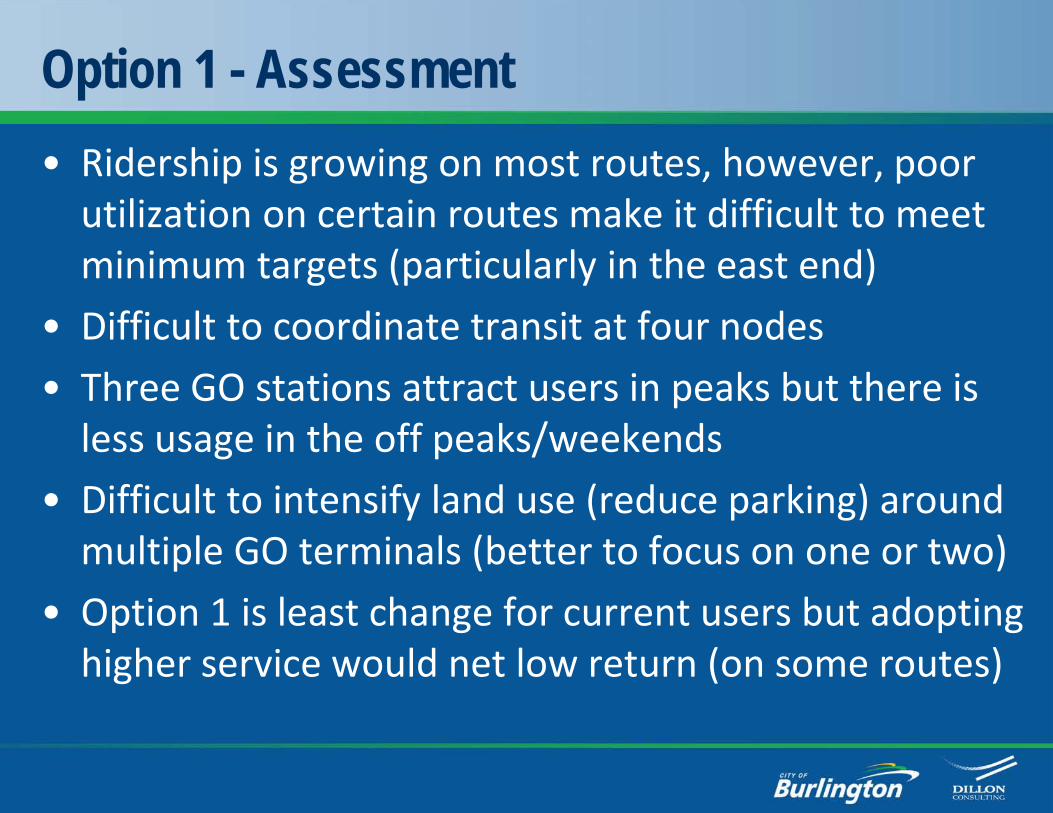
Option 1 - Assessment• Ridership is growing on most routes, however, poor
utilization on certain routes make it difficult to meet minimum targets (particularly in the east end)
• Difficult to coordinate transit at four nodes
• Three GO stations attract users in peaks but there is less usage in the off peaks/weekends
• Difficult to intensify land use (reduce parking) around multiple GO terminals (better to focus on one or two)
• Option 1 is least change for current users but adopting higher service would net low return (on some routes)
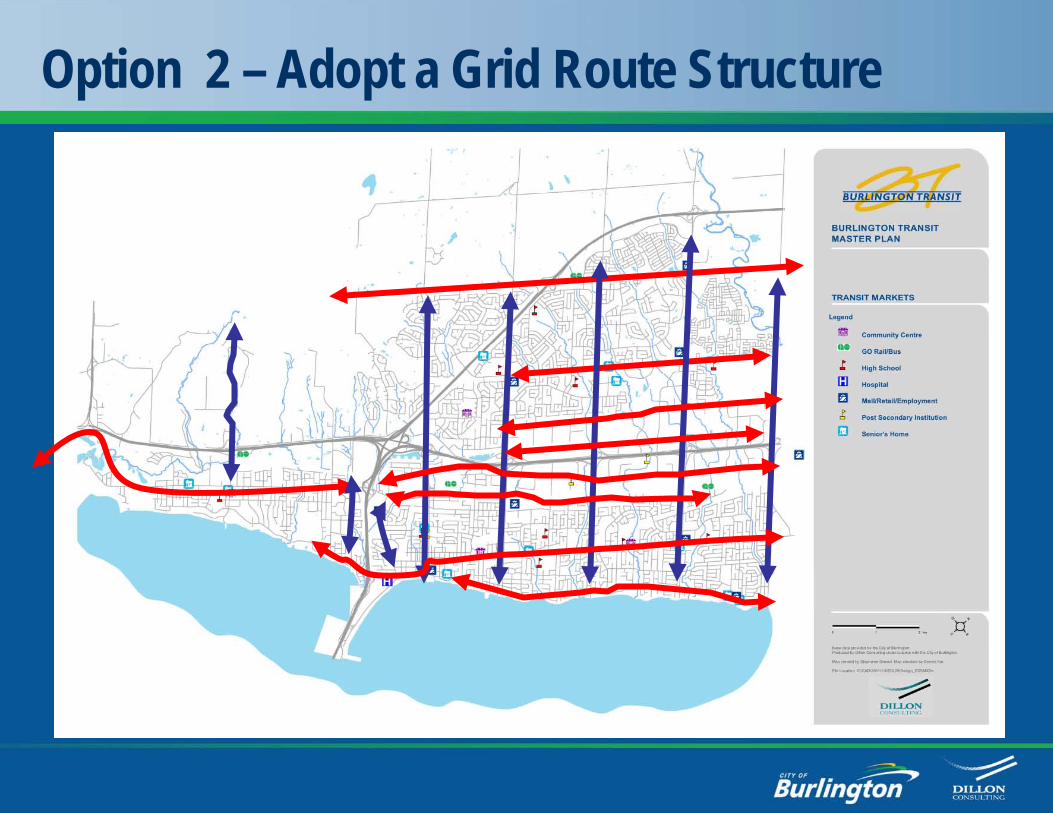
Option 2 – Adopt a Grid Route Structure
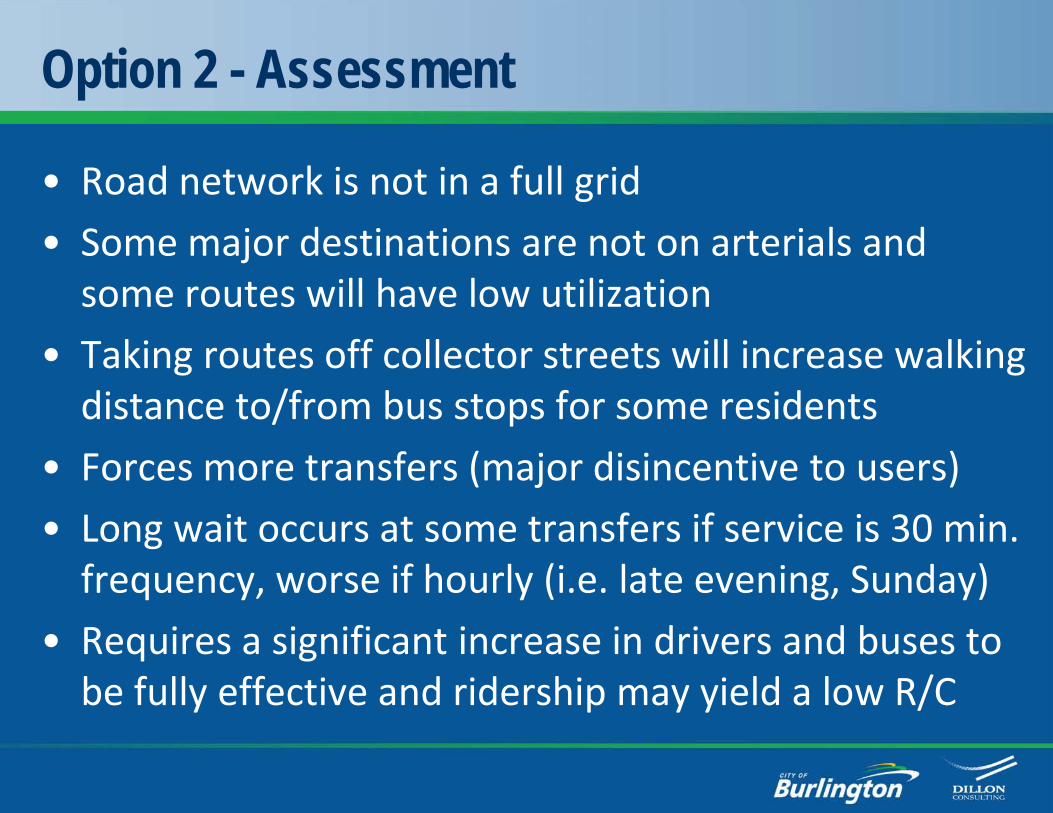
Option 2 - Assessment
• Road network is not in a full grid
• Some major destinations are not on arterials and some routes will have low utilization
• Taking routes off collector streets will increase walking distance to/from bus stops for some residents
• Forces more transfers (major disincentive to users)
• Long wait occurs at some transfers if service is 30 min. frequency, worse if hourly (i.e. late evening, Sunday)
• Requires a significant increase in drivers and buses to be fully effective and ridership may yield a low R/C
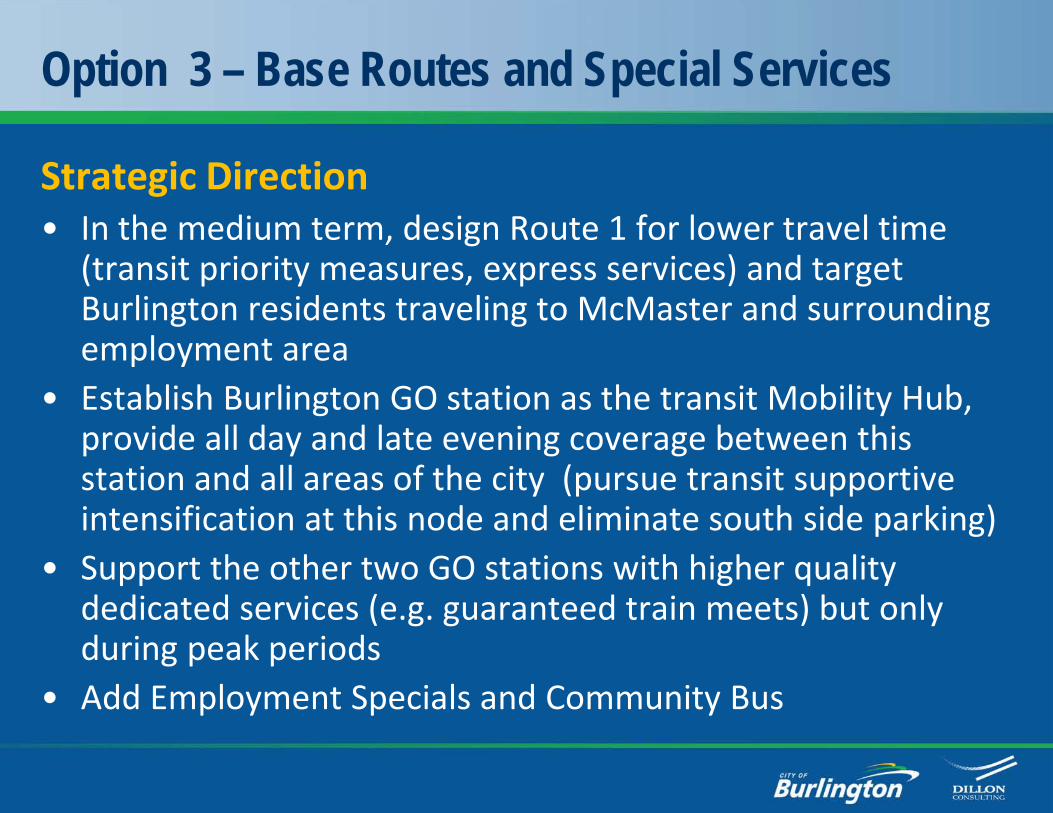
Option 3 – Base Routes and Special Services
Strategic Direction• In the medium term, design Route 1 for lower travel time
(transit priority measures, express services) and target Burlington residents traveling to McMaster and surrounding employment area
• Establish Burlington GO station as the transit Mobility Hub, provide all day and late evening coverage between this station and all areas of the city (pursue transit supportive intensification at this node and eliminate south side parking)
• Support the other two GO stations with higher quality dedicated services (e.g. guaranteed train meets) but only during peak periods
• Add Employment Specials and Community Bus
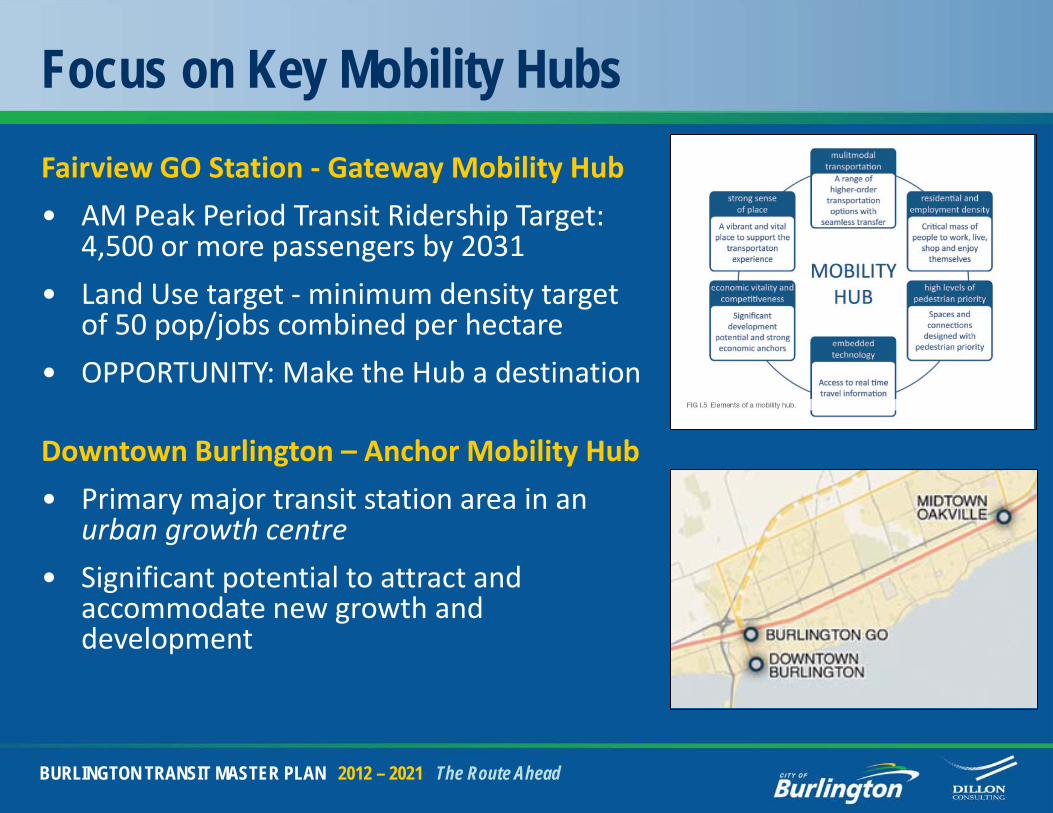
Focus on Key Mobility Hubs
BURLINGTON TRANSIT MASTER PLAN 2012 – 2021 The Route Ahead
Fairview GO Station - Gateway Mobility Hub
• AM Peak Period Transit Ridership Target: 4,500 or more passengers by 2031
• Land Use target - minimum density target of 50 pop/jobs combined per hectare
• OPPORTUNITY: Make the Hub a destination
Downtown Burlington – Anchor Mobility Hub
• Primary major transit station area in an urban growth centre
• Significant potential to attract and accommodate new growth and development
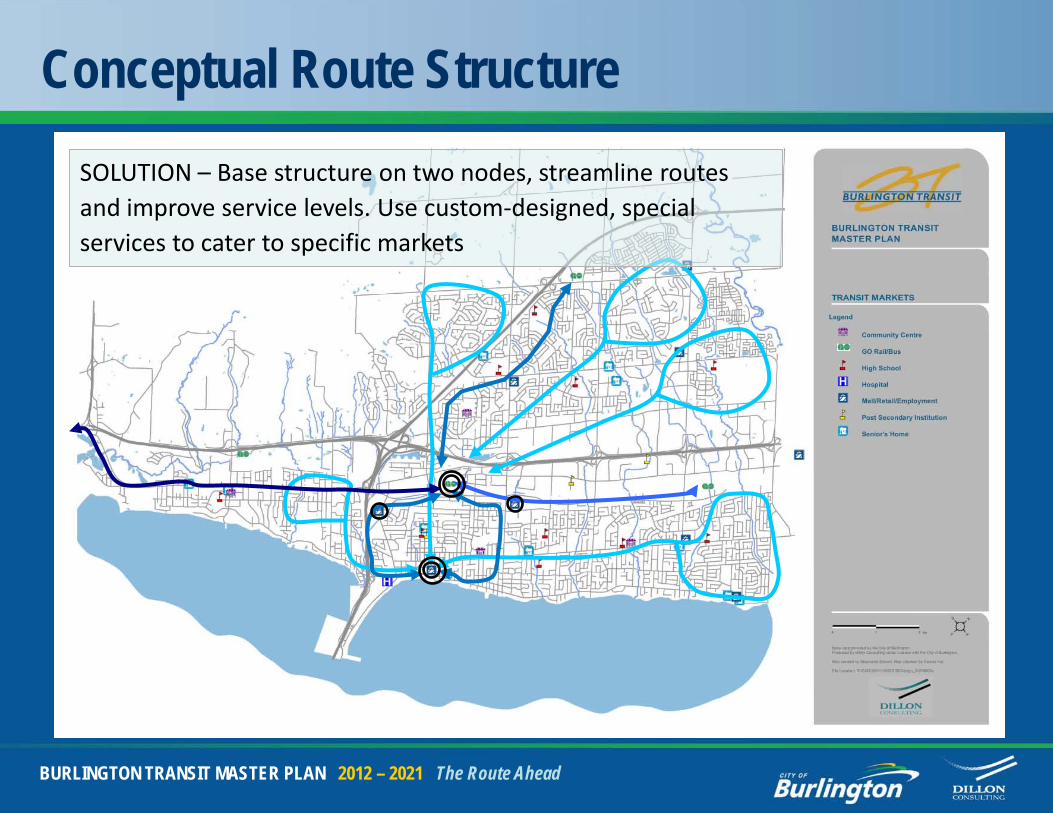
Conceptual Route Structure
BURLINGTON TRANSIT MASTER PLAN 2012 – 2021 The Route Ahead
SOLUTION – Base structure on two nodes, streamline routes and improve service levels. Use custom-designed, special services to cater to specific markets
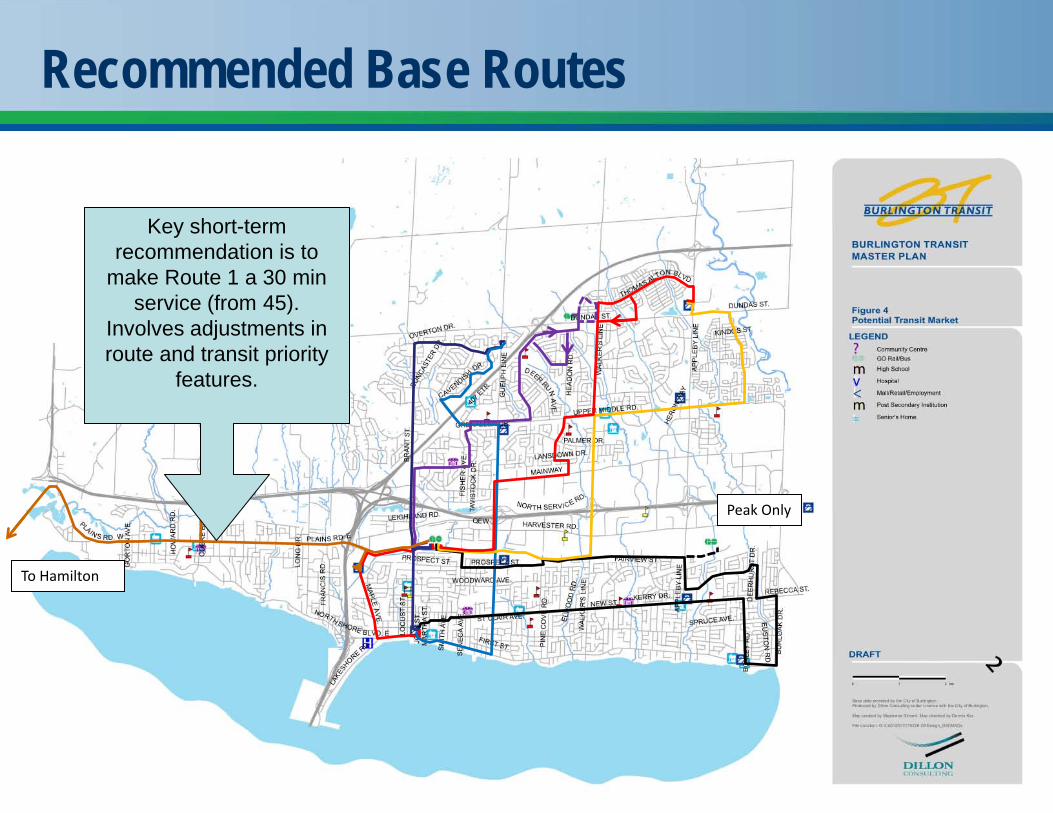
Recommended Base Routes
Peak Only
To Hamilton
Key short-term recommendation is to
make Route 1 a 30 min service (from 45).
Involves adjustments in route and transit priority
features.
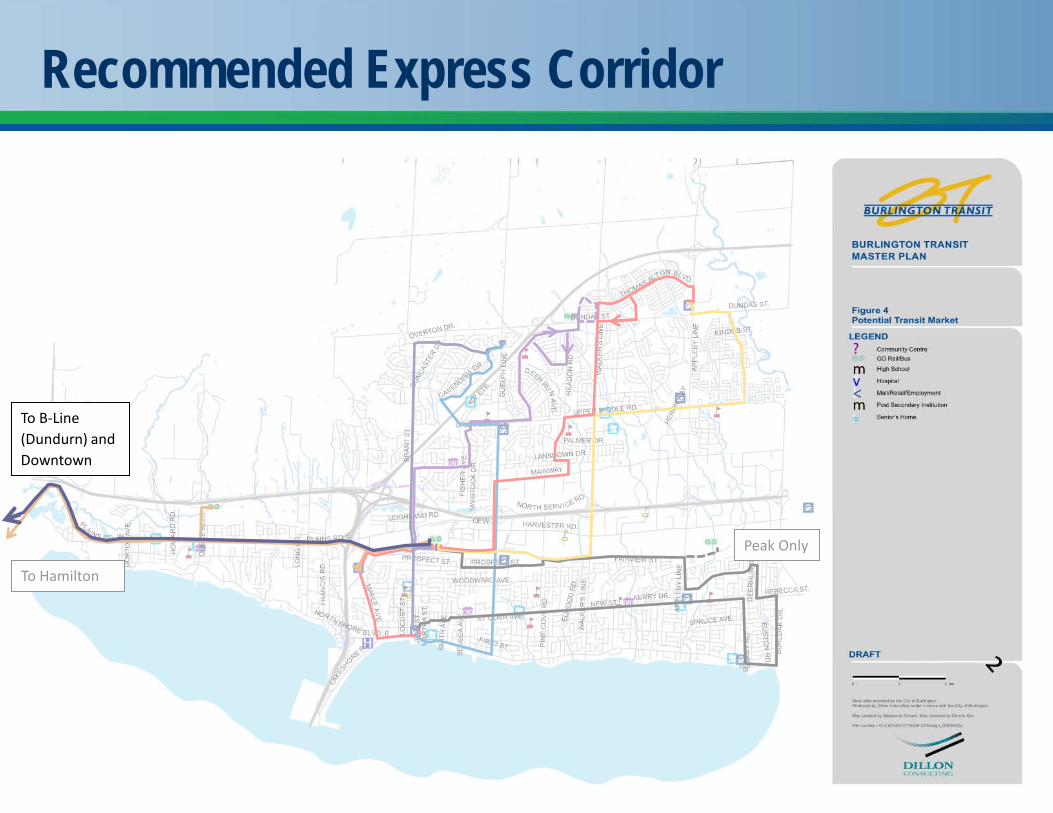
Recommended Express Corridor
Peak Only
To Hamilton
To B-Line (Dundurn) and Downtown

Recommended GO Specials
Peak Only
To Hamilton
To B-Line (Dundurn) and Downtown
Aldershot GO - To be implemented year 3 with adjustment of Route 1 to 30 minutes
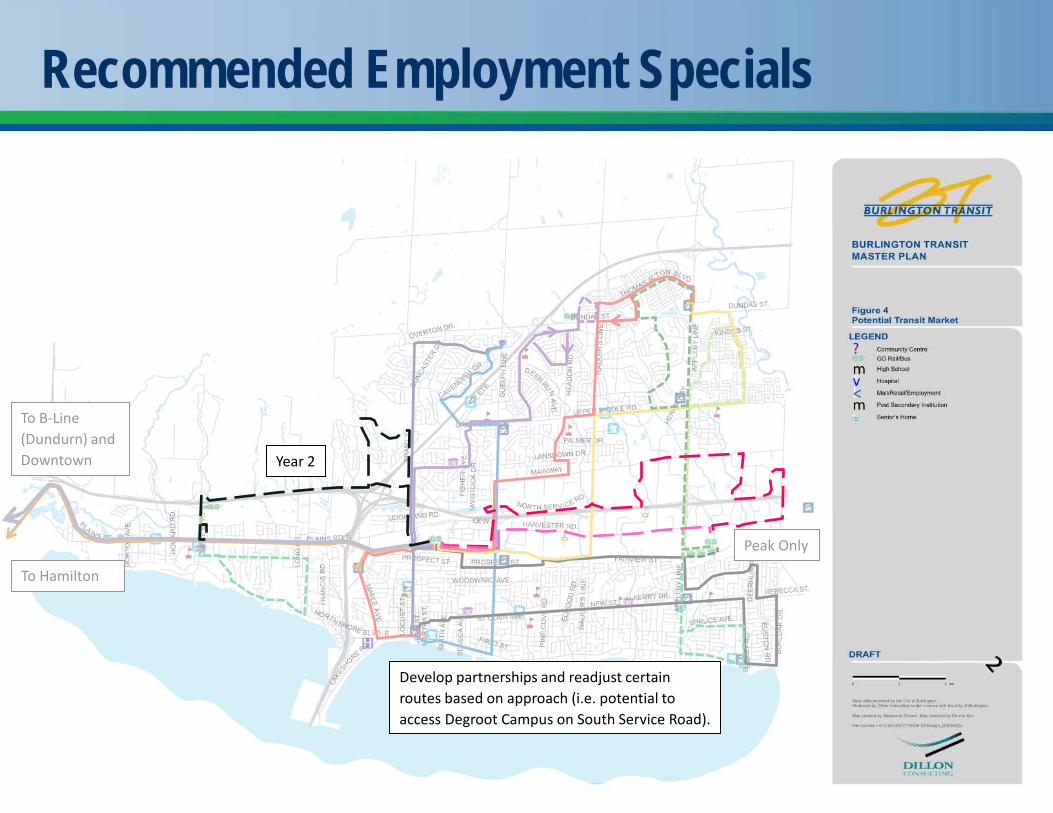
Recommended Employment Specials
Peak Only
To Hamilton
To B-Line (Dundurn) and Downtown Year 2
Develop partnerships and readjust certain routes based on approach (i.e. potential to access Degroot Campus on South Service Road).
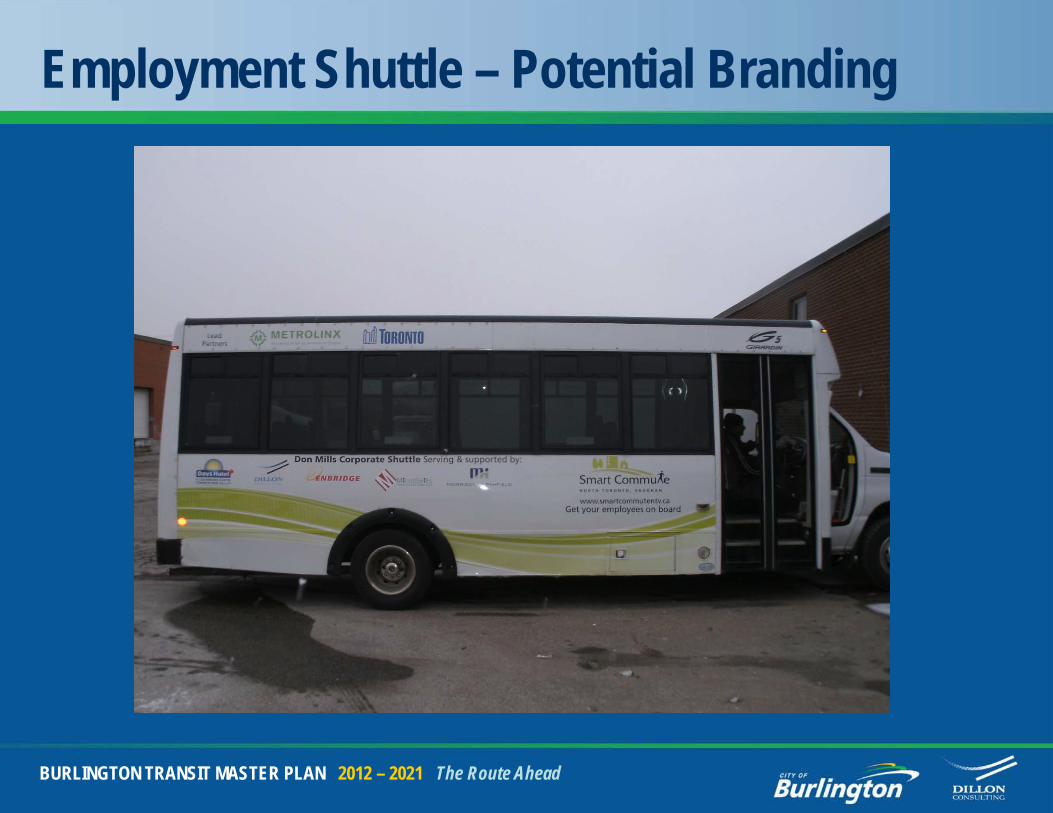
Employment Shuttle – Potential Branding
BURLINGTON TRANSIT MASTER PLAN 2012 – 2021 The Route Ahead
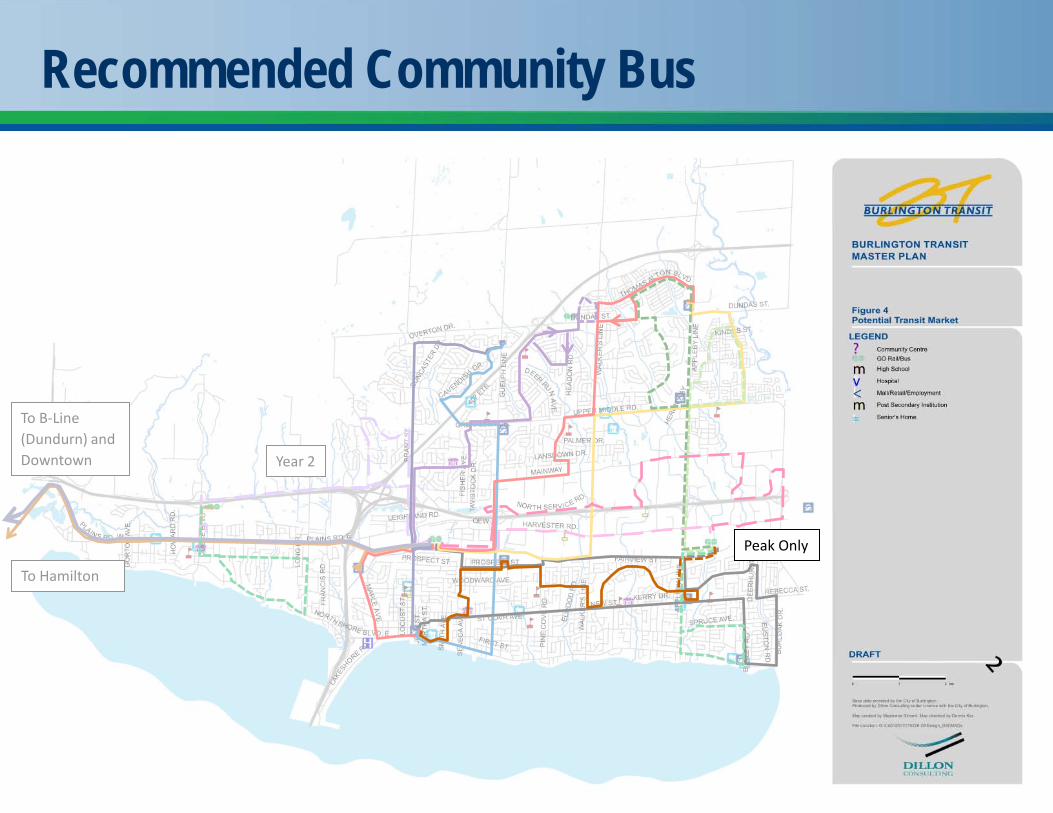
Recommended Community Bus
To Hamilton
To B-Line (Dundurn) and Downtown Year 2
Peak Only
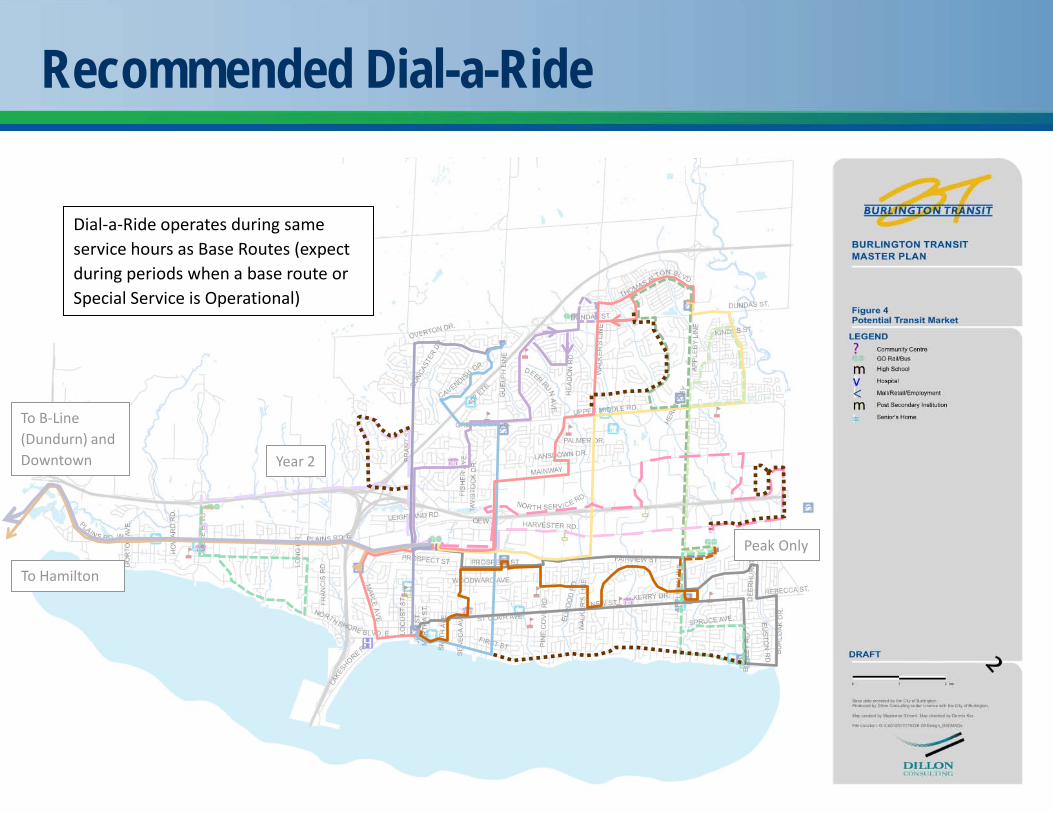
Recommended Dial-a-Ride
To Hamilton
To B-Line (Dundurn) and Downtown Year 2
Peak Only
Dial-a-Ride operates during same service hours as Base Routes (expect during periods when a base route or Special Service is Operational)
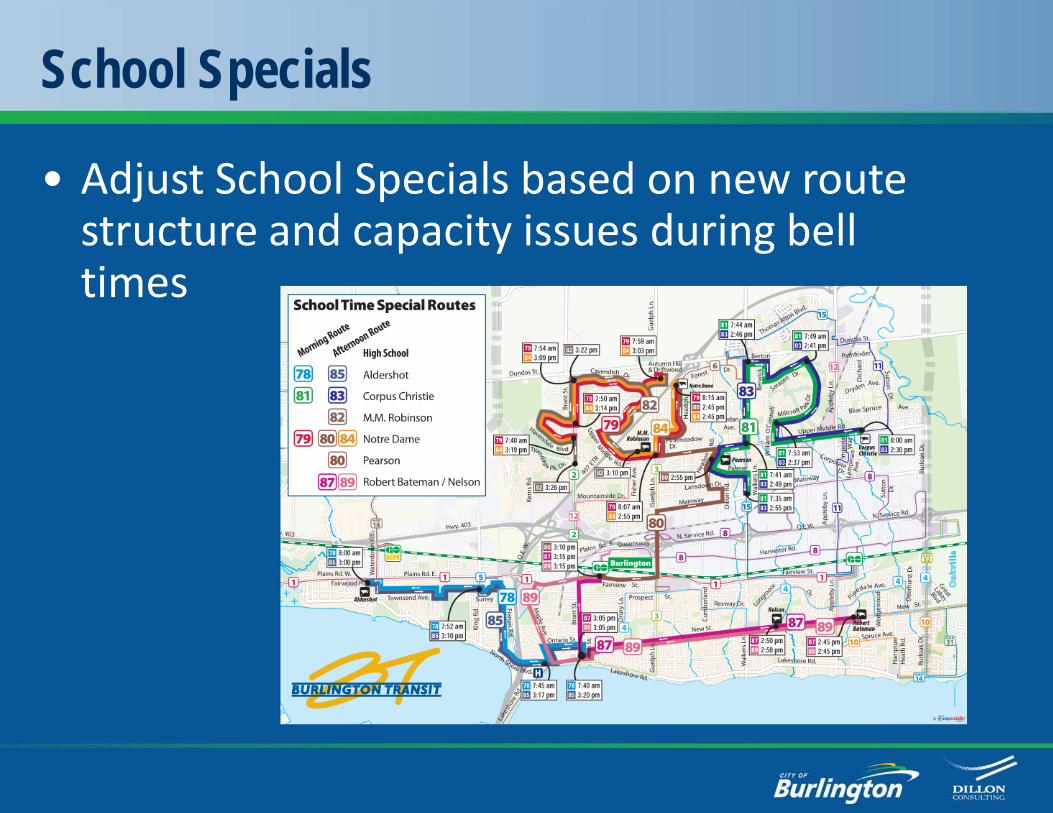
School Specials
• Adjust School Specials based on new route structure and capacity issues during bell times
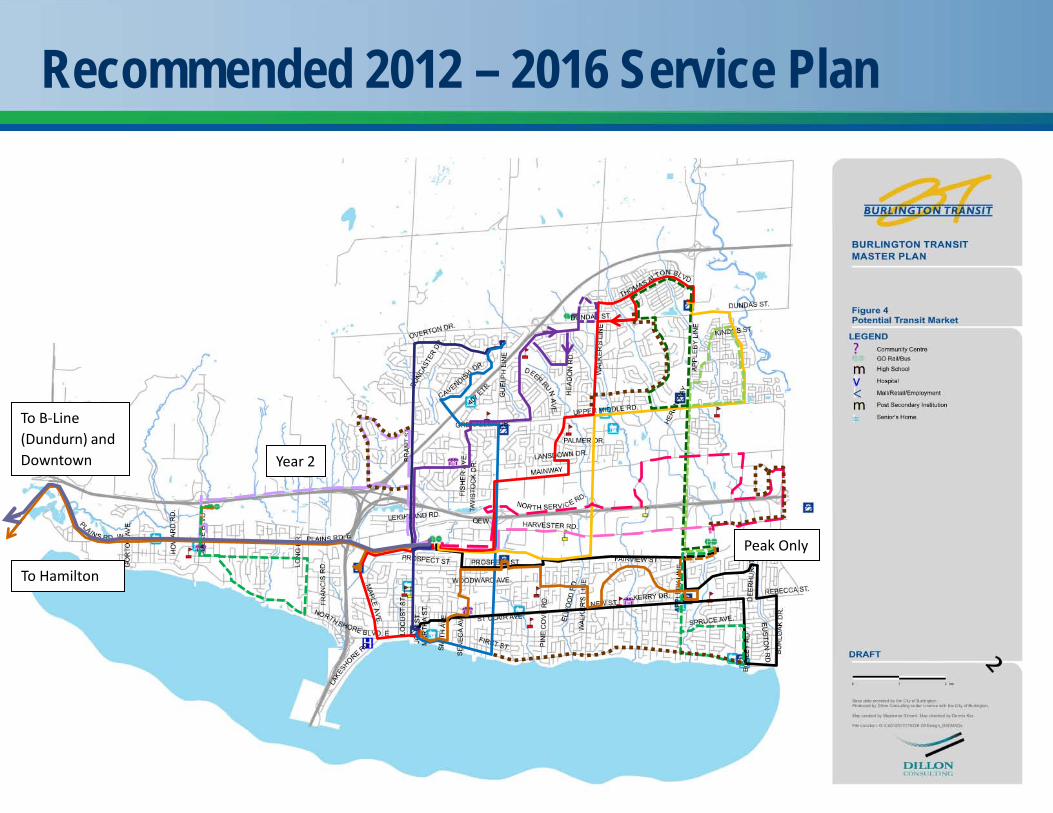
Recommended 2012 – 2016 Service Plan
To Hamilton
To B-Line (Dundurn) and Downtown Year 2
Peak Only
Option 3 - Assessment
• Focus Base Routes on Burlington GO and downtown terminal– major destinations
• Route 1 is enhanced and new Express service supports land use plan for Plains Road corridor
• Greater opportunity to intensify land use in area around Burlington GO (new Burlington ‘uptown’)
• Expect higher utilization on base routes• Use special services to attract new riders• More ridership return from transit investment• More operational flexibility with 6 business lines
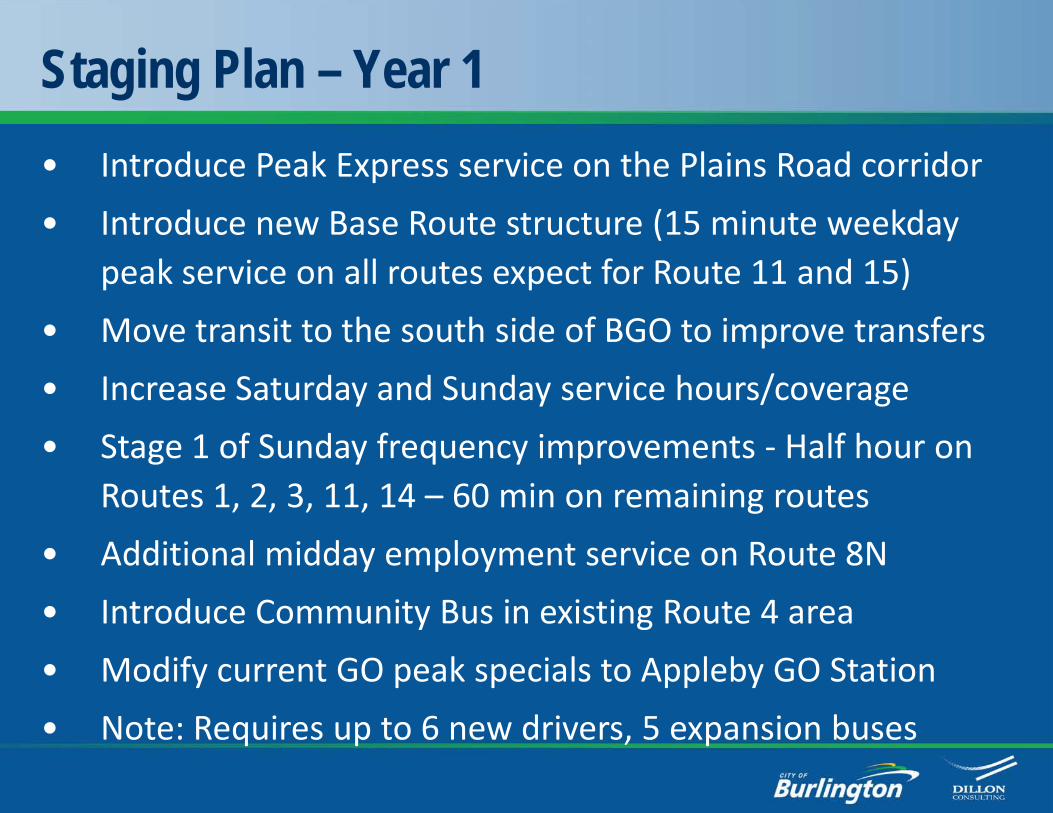
Staging Plan – Year 1 • Introduce Peak Express service on the Plains Road corridor
• Introduce new Base Route structure (15 minute weekday peak service on all routes expect for Route 11 and 15)
• Move transit to the south side of BGO to improve transfers
• Increase Saturday and Sunday service hours/coverage
• Stage 1 of Sunday frequency improvements - Half hour on Routes 1, 2, 3, 11, 14 – 60 min on remaining routes
• Additional midday employment service on Route 8N
• Introduce Community Bus in existing Route 4 area
• Modify current GO peak specials to Appleby GO Station
• Note: Requires up to 6 new drivers, 5 expansion buses
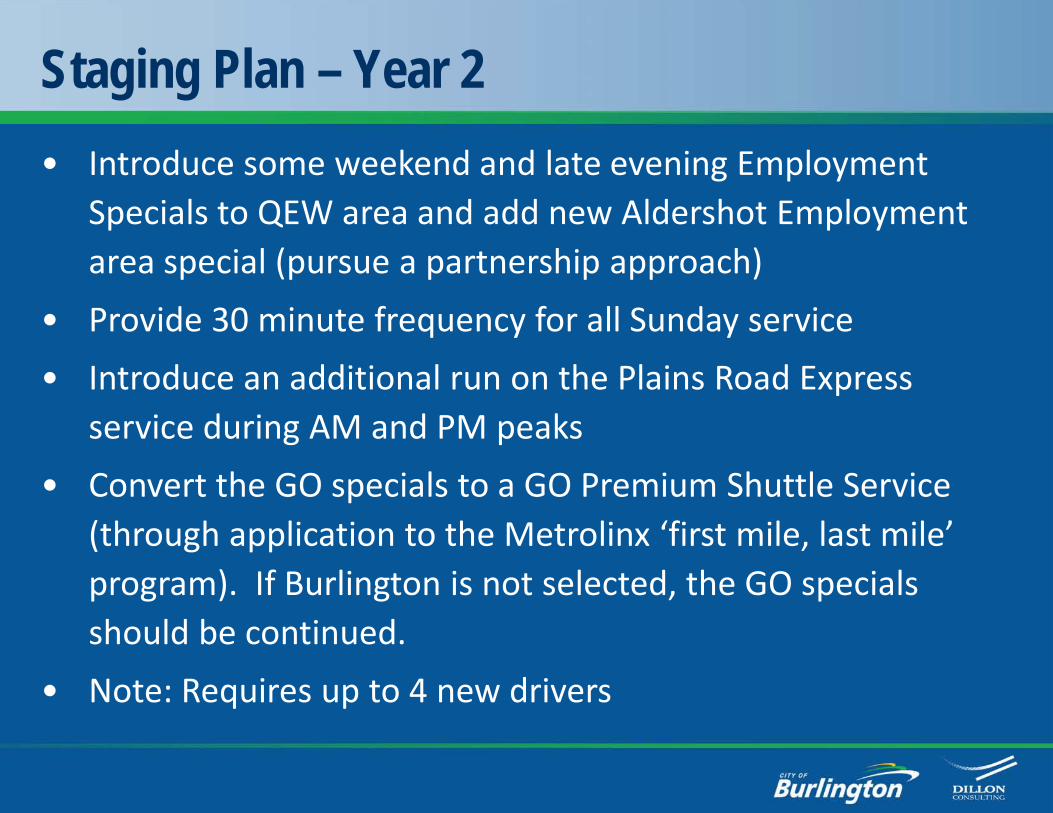
Staging Plan – Year 2 • Introduce some weekend and late evening Employment
Specials to QEW area and add new Aldershot Employment area special (pursue a partnership approach)
• Provide 30 minute frequency for all Sunday service
• Introduce an additional run on the Plains Road Express service during AM and PM peaks
• Convert the GO specials to a GO Premium Shuttle Service (through application to the Metrolinx ‘first mile, last mile’ program). If Burlington is not selected, the GO specials should be continued.
• Note: Requires up to 4 new drivers
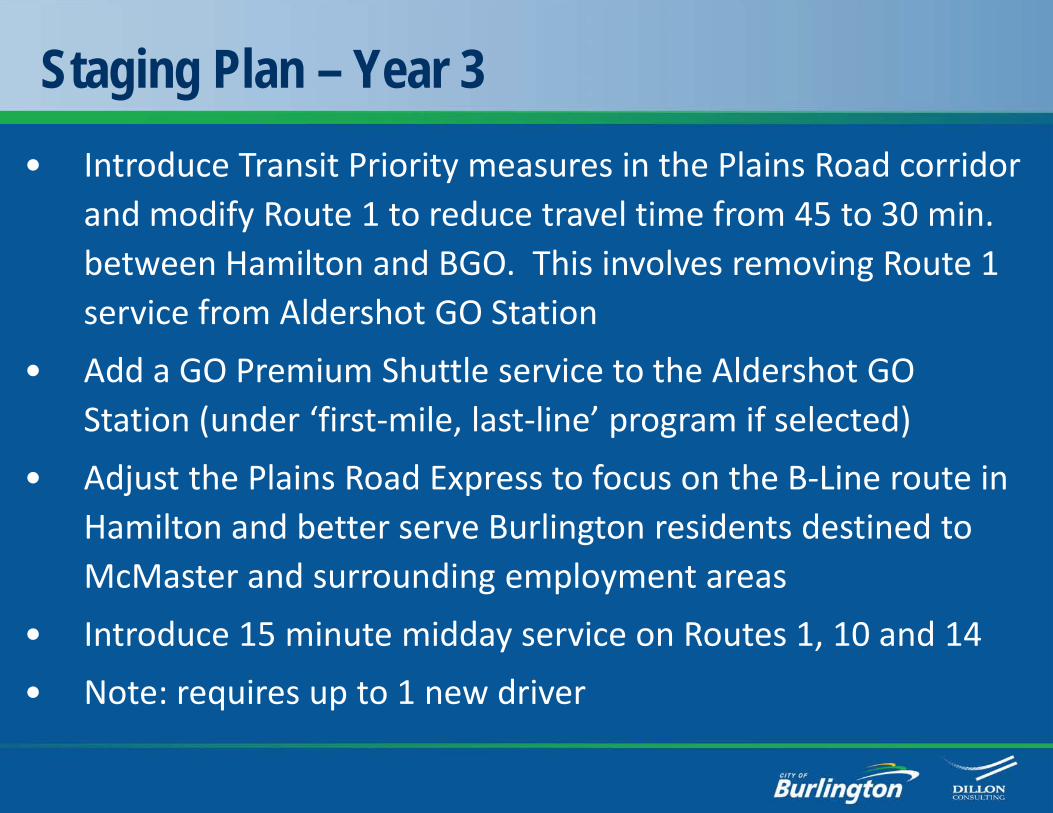
Staging Plan – Year 3 • Introduce Transit Priority measures in the Plains Road corridor
and modify Route 1 to reduce travel time from 45 to 30 min. between Hamilton and BGO. This involves removing Route 1 service from Aldershot GO Station
• Add a GO Premium Shuttle service to the Aldershot GO Station (under ‘first-mile, last-line’ program if selected)
• Adjust the Plains Road Express to focus on the B-Line route in Hamilton and better serve Burlington residents destined to McMaster and surrounding employment areas
• Introduce 15 minute midday service on Routes 1, 10 and 14
• Note: requires up to 1 new driver
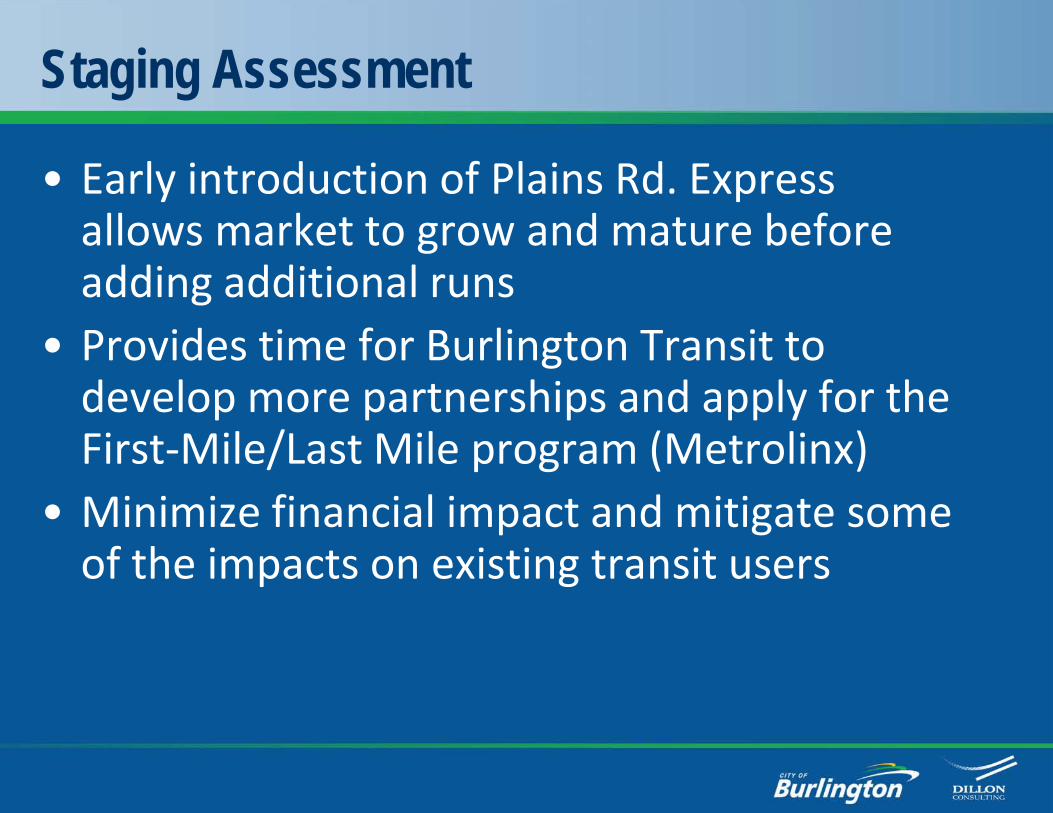
Staging Assessment
• Early introduction of Plains Rd. Express allows market to grow and mature before adding additional runs
• Provides time for Burlington Transit to develop more partnerships and apply for the First-Mile/Last Mile program (Metrolinx)
• Minimize financial impact and mitigate some of the impacts on existing transit users
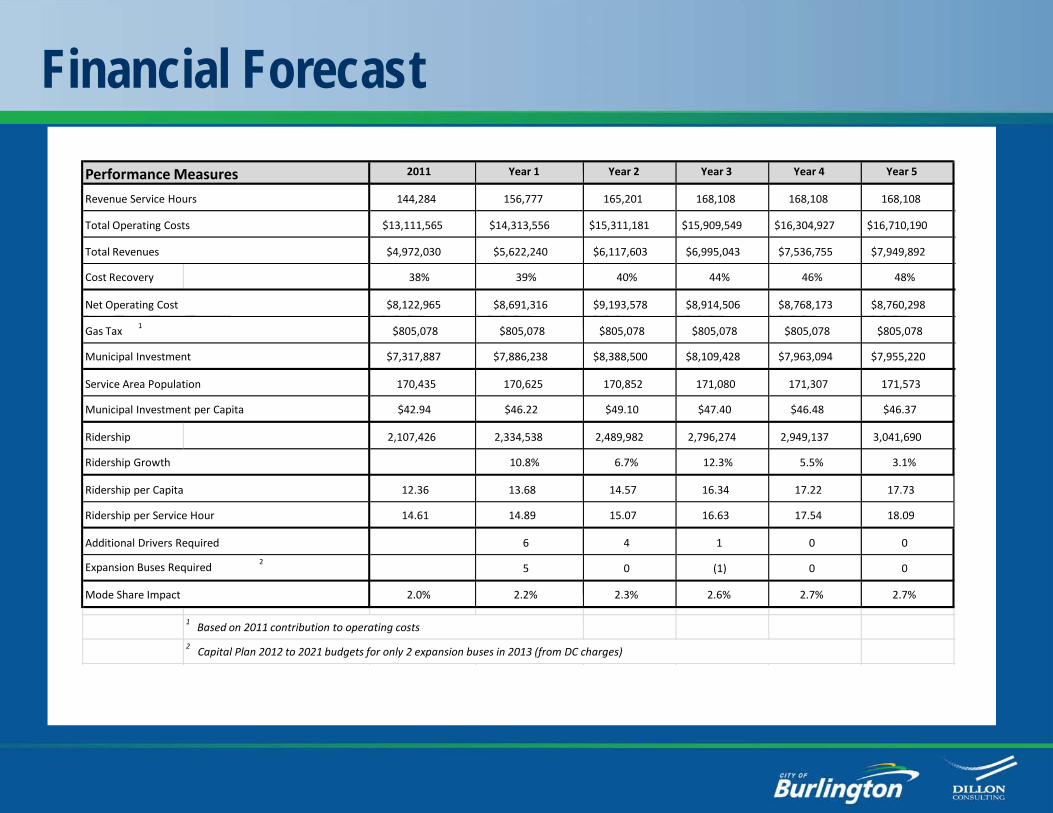
Financial ForecastPerformance Measures 2011 Year 1 Year 2 Year 3 Year 4 Year 5
Revenue Service Hours 144,284 156,777 165,201 168,108 168,108 168,108
Total Operating Costs $13,111,565 $14,313,556 $15,311,181 $15,909,549 $16,304,927 $16,710,190
Total Revenues $4,972,030 $5,622,240 $6,117,603 $6,995,043 $7,536,755 $7,949,892
Cost Recovery 38% 39% 40% 44% 46% 48%
Net Operating Cost $8,122,965 $8,691,316 $9,193,578 $8,914,506 $8,768,173 $8,760,298
$805,078 $805,078 $805,078 $805,078 $805,078 $805,078
Municipal Investment $7,317,887 $7,886,238 $8,388,500 $8,109,428 $7,963,094 $7,955,220
Service Area Population 170,435 170,625 170,852 171,080 171,307 171,573
Municipal Investment per Capita $42.94 $46.22 $49.10 $47.40 $46.48 $46.37
Ridership 2,107,426 2,334,538 2,489,982 2,796,274 2,949,137 3,041,690
Ridership Growth 10.8% 6.7% 12.3% 5.5% 3.1%
Ridership per Capita 12.36 13.68 14.57 16.34 17.22 17.73
Ridership per Service Hour 14.61 14.89 15.07 16.63 17.54 18.09
Additional Drivers Required 6 4 1 0 0
Expansion Buses Required2
5 0 (1) 0 0
Mode Share Impact 2.0% 2.2% 2.3% 2.6% 2.7% 2.7%
1 Based on 2011 contribution to operating costs
2Capital Plan 2012 to 2021 budgets for only 2 expansion buses in 2013 (from DC charges)
Gas Tax 1
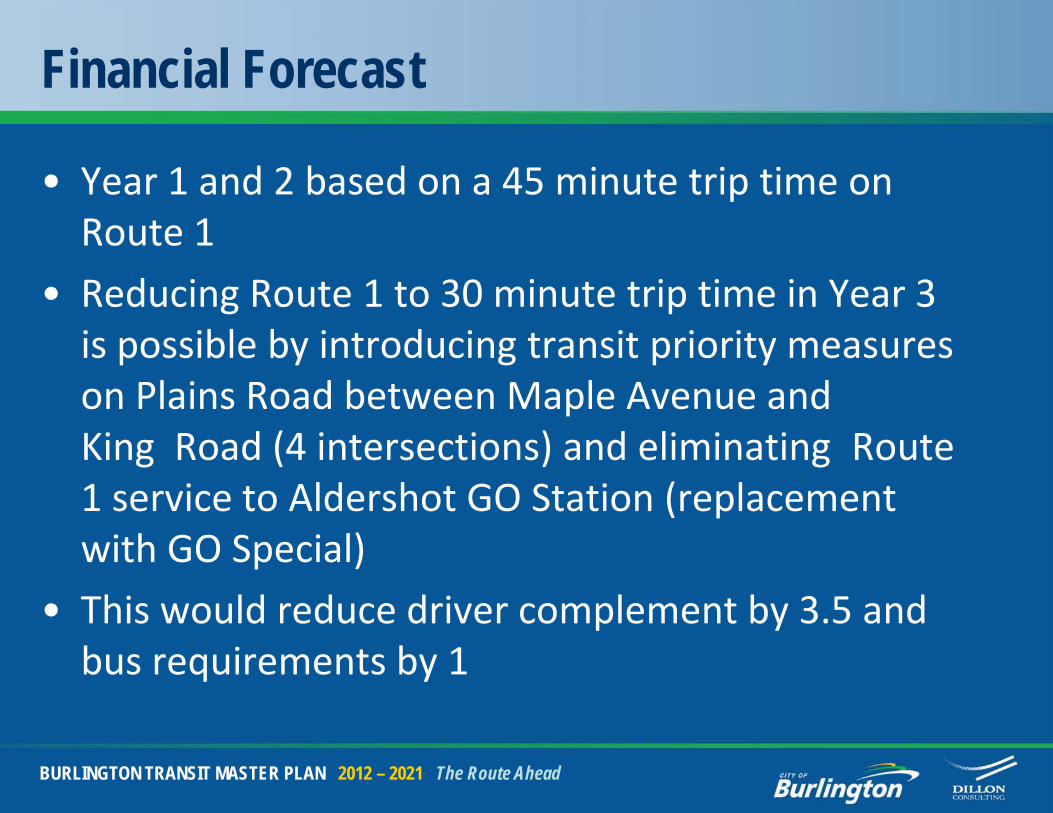
Financial Forecast
BURLINGTON TRANSIT MASTER PLAN 2012 – 2021 The Route Ahead
• Year 1 and 2 based on a 45 minute trip time on Route 1
• Reducing Route 1 to 30 minute trip time in Year 3 is possible by introducing transit priority measures on Plains Road between Maple Avenue and King Road (4 intersections) and eliminating Route 1 service to Aldershot GO Station (replacement with GO Special)
• This would reduce driver complement by 3.5 and bus requirements by 1
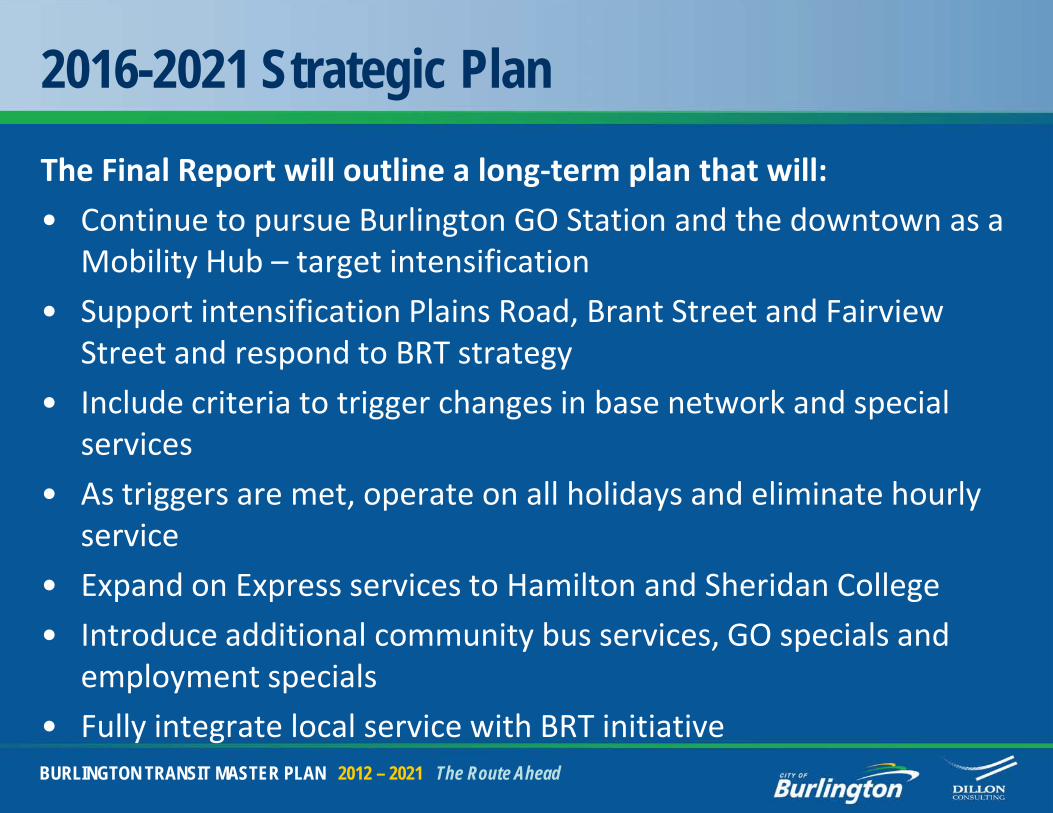
2016-2021 Strategic PlanThe Final Report will outline a long-term plan that will:
• Continue to pursue Burlington GO Station and the downtown as a Mobility Hub – target intensification
• Support intensification Plains Road, Brant Street and Fairview Street and respond to BRT strategy
• Include criteria to trigger changes in base network and special services
• As triggers are met, operate on all holidays and eliminate hourly service
• Expand on Express services to Hamilton and Sheridan College
• Introduce additional community bus services, GO specials and employment specials
• Fully integrate local service with BRT initiativeBURLINGTON TRANSIT MASTER PLAN 2012 – 2021 The Route Ahead
Related Strategies
Service Standards
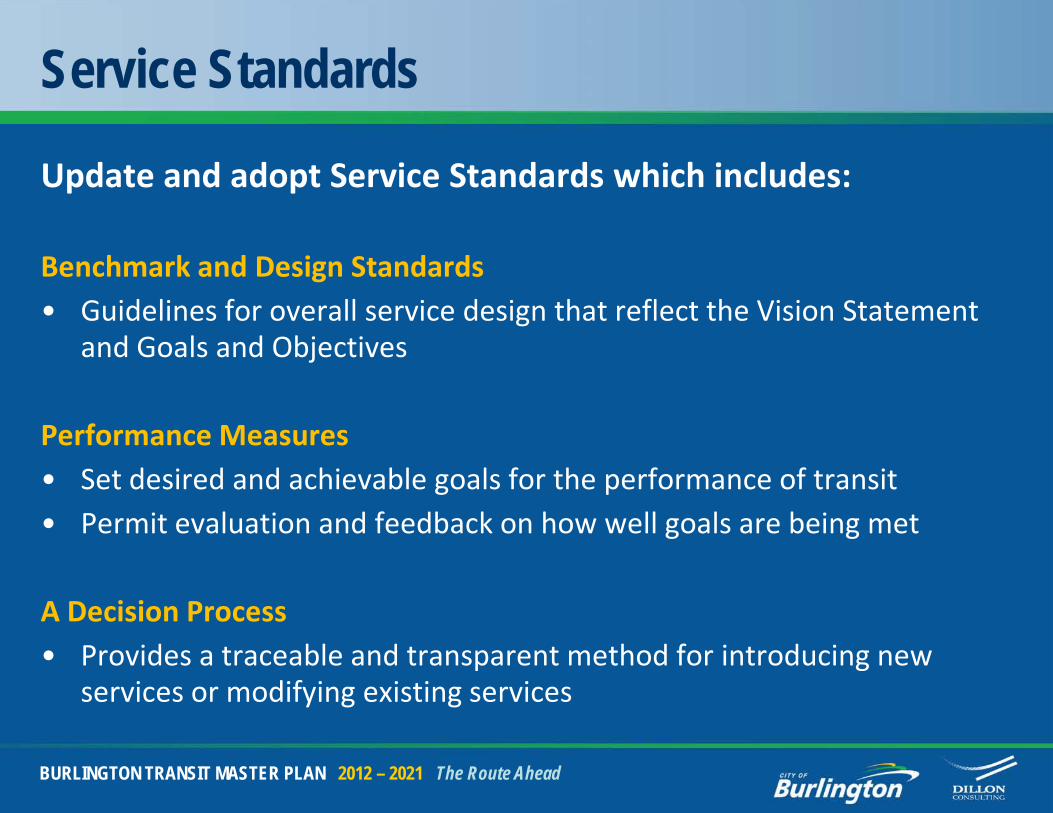
Update and adopt Service Standards which includes:
Benchmark and Design Standards• Guidelines for overall service design that reflect the Vision Statement
and Goals and Objectives
Performance Measures• Set desired and achievable goals for the performance of transit • Permit evaluation and feedback on how well goals are being met
A Decision Process• Provides a traceable and transparent method for introducing new
services or modifying existing services
BURLINGTON TRANSIT MASTER PLAN 2012 – 2021 The Route Ahead
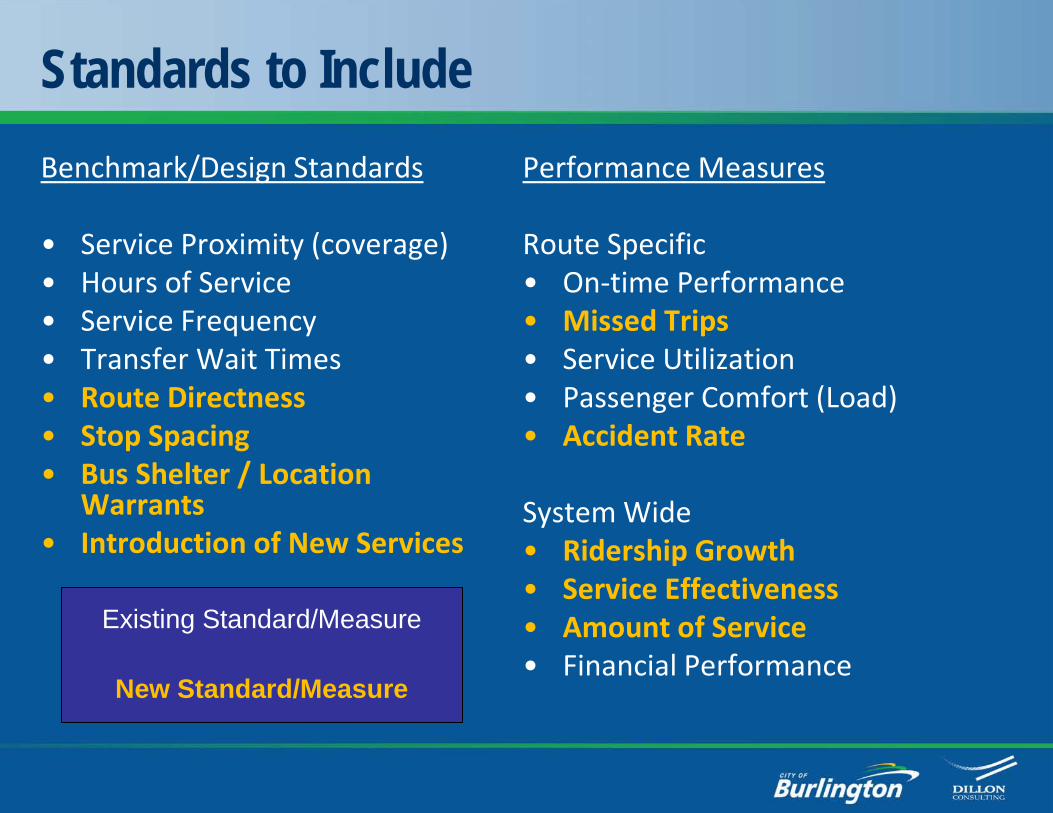
Standards to IncludeBenchmark/Design Standards
• Service Proximity (coverage)• Hours of Service• Service Frequency• Transfer Wait Times• Route Directness• Stop Spacing• Bus Shelter / Location
Warrants• Introduction of New Services
Performance Measures
Route Specific • On-time Performance• Missed Trips• Service Utilization• Passenger Comfort (Load)• Accident Rate
System Wide• Ridership Growth• Service Effectiveness• Amount of Service• Financial Performance
Existing Standard/Measure
New Standard/Measure
Customer Service - Downtown Terminal
• A review was completed of the customer service function, with the following conclusion reached:
– The BT Customer Service function should be centralized at the Harvester Road offices
– On a permanent basis “face to face” customer services should continue to be provided at the Downtown Terminal, or at a new location integrated with any approved development in the downtown core
– Burlington GO Station is not considered a viable location for the BT Customer Service Centre (provide customer service technology at BGO)
Technology Assessment
• Burlington is behind its peers in the GTHA in deploying the most current transit technologies
• Recommend to implement a Smart Bus Transit ITS system:
– Computer-aided dispatch with automatic vehicle location through GPS (CAD / AVL)
– Automatic Vehicle Announcements (AVA), including audio-visual internal next stop announcements, and external route announcements to meet AODA
– Provide Automatic Passenger Counters (APC) on at least 20% of the fleet and use related software for producing standard reports and diagnostics
– On-board CCTV security system
Dundas BRT and Other Transit Priority
• Identify Plains Road and Fairview Street as a Transit Priority corridors in the upcoming Official Plan update
• Identify and protect long-term opportunities to connect to the Dundas BRT
• Implement Transit Priority measures in the short-term, with a focus on Plains Road, Mapleview Mall, bus terminal areas and on arterials near congestion locations
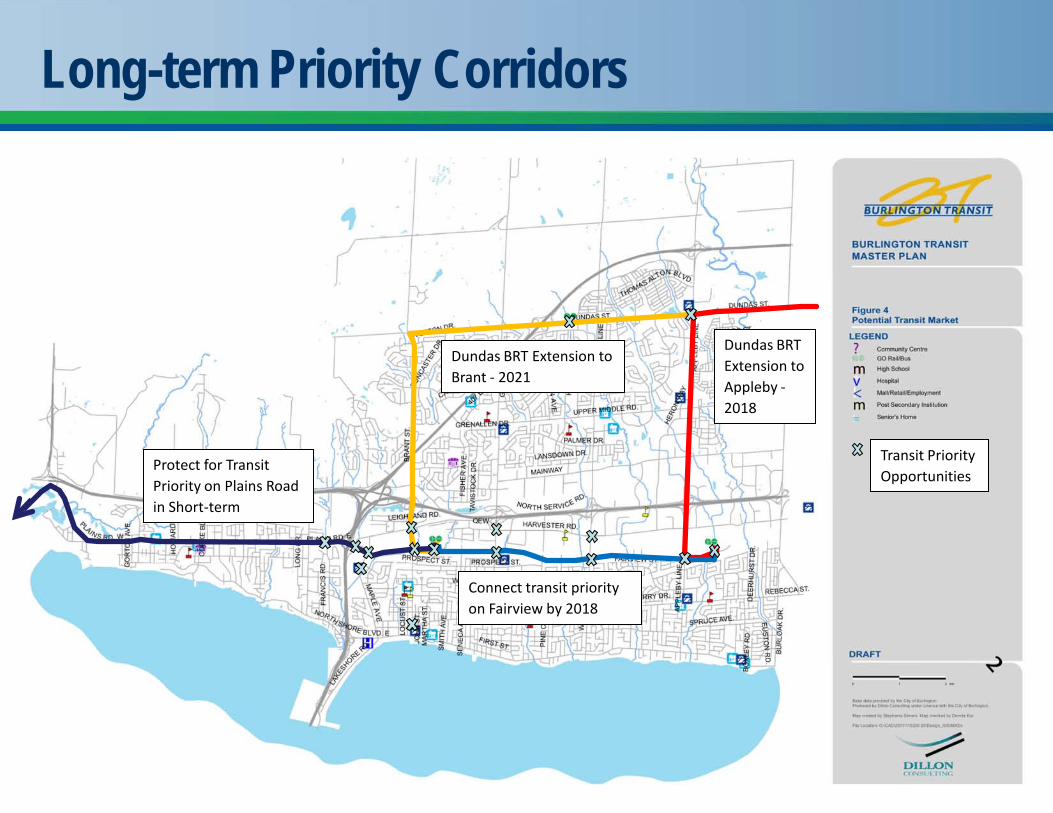
Long-term Priority Corridors
BURLINGTON TRANSIT MASTER PLAN 2012 – 2021 The Route Ahead
Protect for Transit Priority on Plains Road in Short-term
Dundas BRT Extension to Brant - 2021
Dundas BRT Extension to Appleby -2018
Connect transit priority on Fairview by 2018
Transit Priority Opportunities
Other Strategies for Ridership Growth
• Improve transit access for all high school students (e.g. after class, evenings/weekends) while building a process with the school boards toward a more integrated service for ‘eligible’ students
• Implement more Employment specials through partnerships with signature employers
Transit Fare Strategy
• Current fares are at the higher end of peer range • Users comment that Burlington fares are high,
especially considering the service levels• Apply regular annual increase in average fare to
reflect inflation (wages, fuel). Consider larger fare increase when major service improvements occur
• Raise Cash fare only in $0.25 increments, move gradually to single cash fare (Child fare)
• Halton Region transit affordability program is in one-year pilot stage - 50% discount off Adult monthly pass price for all members of low income household
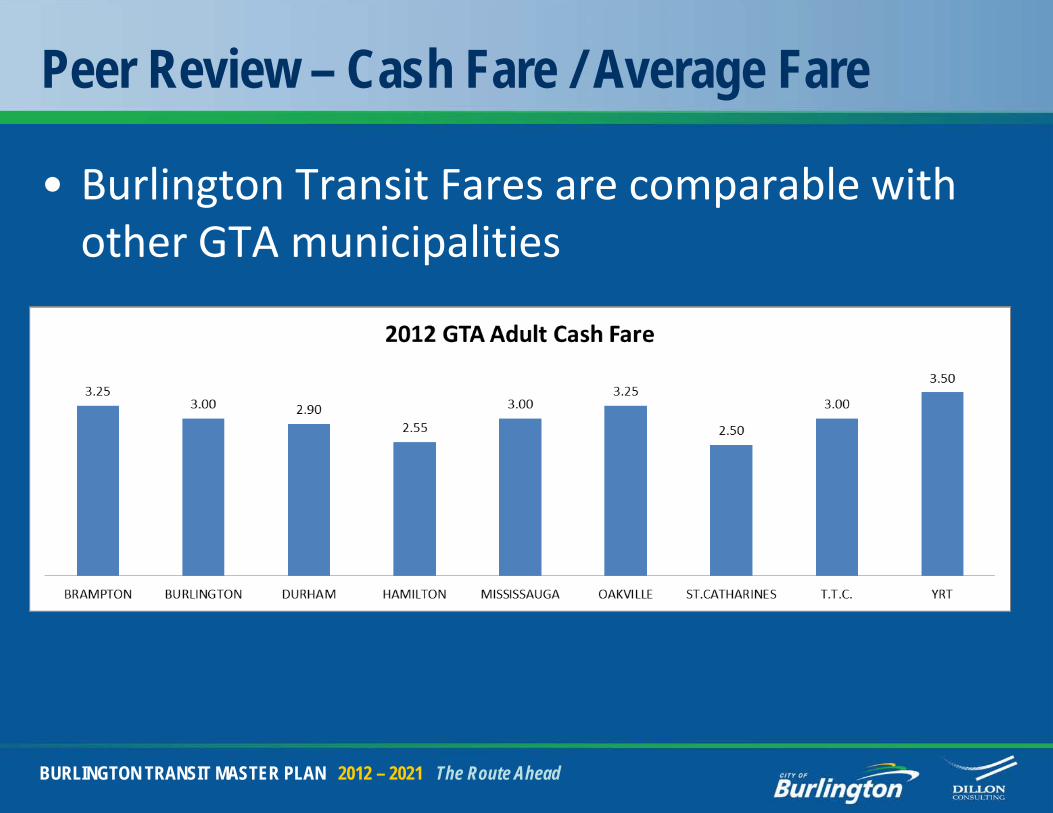
Peer Review – Cash Fare / Average Fare
BURLINGTON TRANSIT MASTER PLAN 2012 – 2021 The Route Ahead
• Burlington Transit Fares are comparable with other GTA municipalities
Related Strategies – Work on the Demand Side
• Student Freedom Pass
– Activate pass at 4:00pm instead of 5:00pm to make it more attractive
• Employer Pass Programs
– Work with the Smart Commute program
– Target 10 to 15% fare discount based on employer matching contribution and achieving minimum uptake
• Municipal leadership – Employee Pass Program
– Consistency between transit and parking policy
– Push for all employees to have transit pass (similar to University U-Pass programs)
Related Strategies – Ensure Coordination of:
• Transit and Traffic– Transit signal priority, queue jump lanes where possible– Need for faster transit on key corridors (more
competitive with car)• Transit and Mobility Management
– Transit to act as a ‘broker’ fitting service offering to market need
– Potential integration with City’s parking supply/pricing and encourage Metrolinx to adopt parking disincentives at key stations
– Joint efforts with TDM coordinator
Related Strategies – Ensure Coordination of:
• Transit and Land Use– Transit is essential in achieving the City’s vision for
neighbourhoods– Adopt complete streets approach (i.e. the Plains Road
corridor)– The upcoming Official Plan review is an ideal opportunity
to put in place policies to strengthen these connections.– Pursue transit supportive development guidelines– Support for downtown and potential new uptown as well
as City’s intensification corridors and nodes• Transit and the Strategic Plan
– Help achieve the goals of Vibrant Neighbourhoods, Prosperity and Excellence in Government
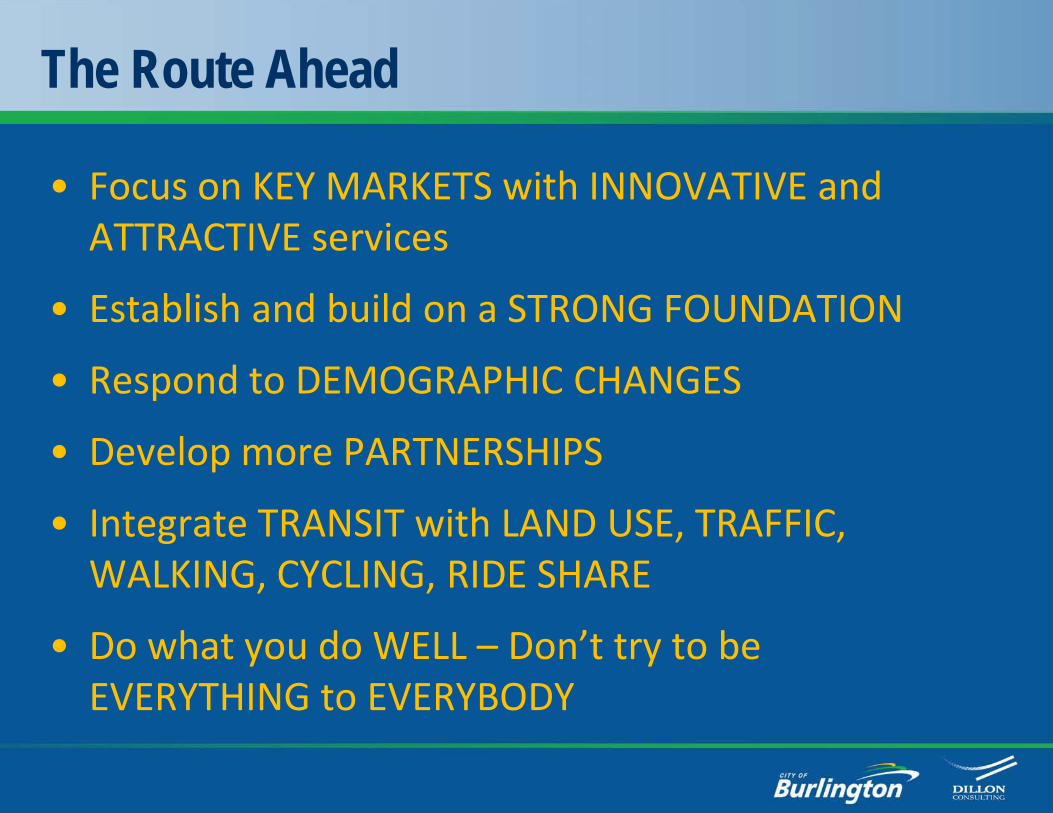
The Route Ahead
• Focus on KEY MARKETS with INNOVATIVE and ATTRACTIVE services
• Establish and build on a STRONG FOUNDATION
• Respond to DEMOGRAPHIC CHANGES
• Develop more PARTNERSHIPS
• Integrate TRANSIT with LAND USE, TRAFFIC, WALKING, CYCLING, RIDE SHARE
• Do what you do WELL – Don’t try to be EVERYTHING to EVERYBODY
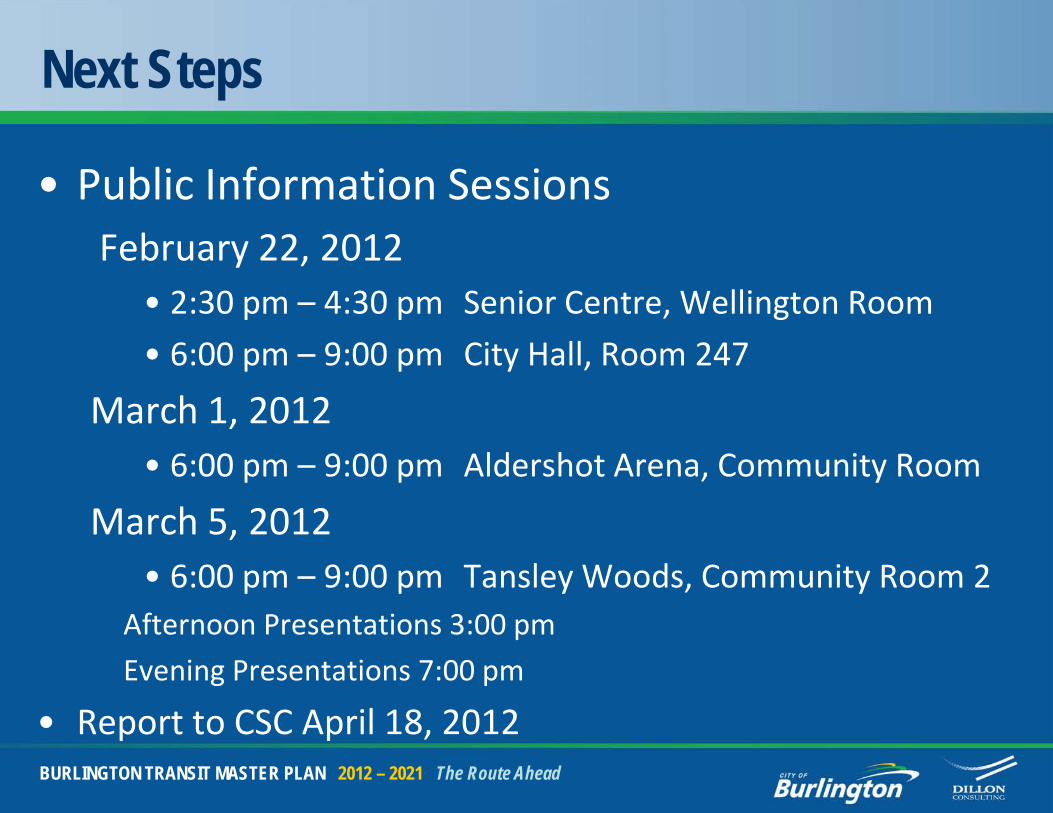
Next Steps
• Public Information SessionsFebruary 22, 2012
• 2:30 pm – 4:30 pm Senior Centre, Wellington Room
• 6:00 pm – 9:00 pm City Hall, Room 247
March 1, 2012• 6:00 pm – 9:00 pm Aldershot Arena, Community Room
March 5, 2012• 6:00 pm – 9:00 pm Tansley Woods, Community Room 2
Afternoon Presentations 3:00 pm
Evening Presentations 7:00 pm
• Report to CSC April 18, 2012BURLINGTON TRANSIT MASTER PLAN 2012 – 2021 The Route Ahead
The Route Ahead
Discussion