Embed Size (px)
Citation preview

For an email subscription, click here to register: https://public.govdelivery.com/accounts/USDAFAS/subscriber/ new.
Approved by the World Agricultural Outlook Board/USDA
Global Production, Consumption, Ending Stocks Raised
USDA’s June forecasts show an upward revision for consumption growth from 2.2 percent last month to
2.6 percent. This consumption revision is smaller than the upward revision to global production, resulting
in higher forecast ending stocks. Furthermore, global trade forecasts are lowered, driven by lower import
demand in producer countries, especially Pakistan. These higher forecast 2017/18 ending stocks are
located outside of China (where forecasts of the degree of destocking have been increased), with the result
that USDA continues to expect pressure on prices, forecasting a year-over-year decline in the U.S. farm
price.
USDA’s June forecasts show an upward revision in global production, from 113.2 million bales to 114.7,
or about 1.3 percent. In combination with some slight revisions in the current and previous crop years,
production is forecast to grow 8.2 percent from 2016/17 to 2017/18, rather than 6.9 percent as forecast in
the previous WASDE. These changes reflect price-driven area increases for most major cotton producers,
and significant improvements in the outlook for a few countries, namely Pakistan, China, and Mexico.
Despite this improving outlook, however, global production remains below the levels seen before the
extremely poor-yielding 2015/16 crops. Recovery in production has varied by region, but it is notable
that almost alone among major cotton-producing regions, the African Franc Zone is forecast to yield its
largest crop ever obtained, at about 5.2 million bales.
Consumption, meanwhile, is forecast higher in several large consumer-producer countries. Forecasts for
China, India, and Pakistan were all raised appreciably, boosting the forecast growth rate for consumption
without greatly increasing forecast demand for imports, especially as China and Pakistan have larger
forecast 2017/18 production, and thus comparatively ample expected supplies.
United States Department of Agriculture Foreign Agricultural Service June 2017
Cotton:
World Markets and Trade
Overview
For 2017/18 global production is forecast up on higher area; yield is essentially unchanged. Consumption
is forecast higher also, especially in China. Global ending stocks are raised, especially outside of China.
Trade is forecast down, led by lower imports in Pakistan. U.S. exports are reduced, raising ending stocks.
The U.S. season-average farm price forecast is unchanged at 64 cents per pound.
For 2016/17, production and use are raised, resulting in ending stocks being reduced. Global trade is
down marginally. The U.S. balance sheet is unchanged. The U.S. season-average farm price forecast is
reduced half a cent to 68.5 cents per pound.
For current prices received by farmers click here; NASS farm price
Prices
The A-Index has
declined slightly in
recent weeks, but
remains relatively high,
following recent
declines in the futures
contract.
For more information
on U.S. spot price click
here; AMS Cotton
Market News
Foreign Agricultural Service/USDA June 2017Office of Global Analysis
2017/18 TRADE OUTLOOK
Major Importers:
Pakistan is cut 600,000 bales to 2.0 million on a much larger expected crop as sowings have
proceeded at a very rapid pace.
Bangladesh is raised 100,000 bales to 7.1 million on abundant supplies among trade partners.
Mexico is lowered 125,000 bales to 850,000 on a larger expected crop.
Major Exporters:
United States is dropped 500,000 bales to 13.5 million on less global import demand given strong
and improving crop forecasts in many import partners.
India is reduced 300,000 bales to 4.2 million on less global import demand, particularly in one of
its major export markets in recent years, Pakistan.
Pakistan is raised 100,000 bales to 450,000 on a larger expected crop.
2016/17 TRADE OUTLOOK
Major Importers:
China is raised 200,000 bales to 5.0 million on the strong pace of trade to date, possibly reflecting
more quota used earlier in the year or more imports under the processing regime.
Pakistan is down 100,000 bales to 2.6 million on weakening nearby demand reflected in Bank of
Pakistan data; Bank data remains substantially above trade data reported by the Pakistan Bureau of
Statistics.
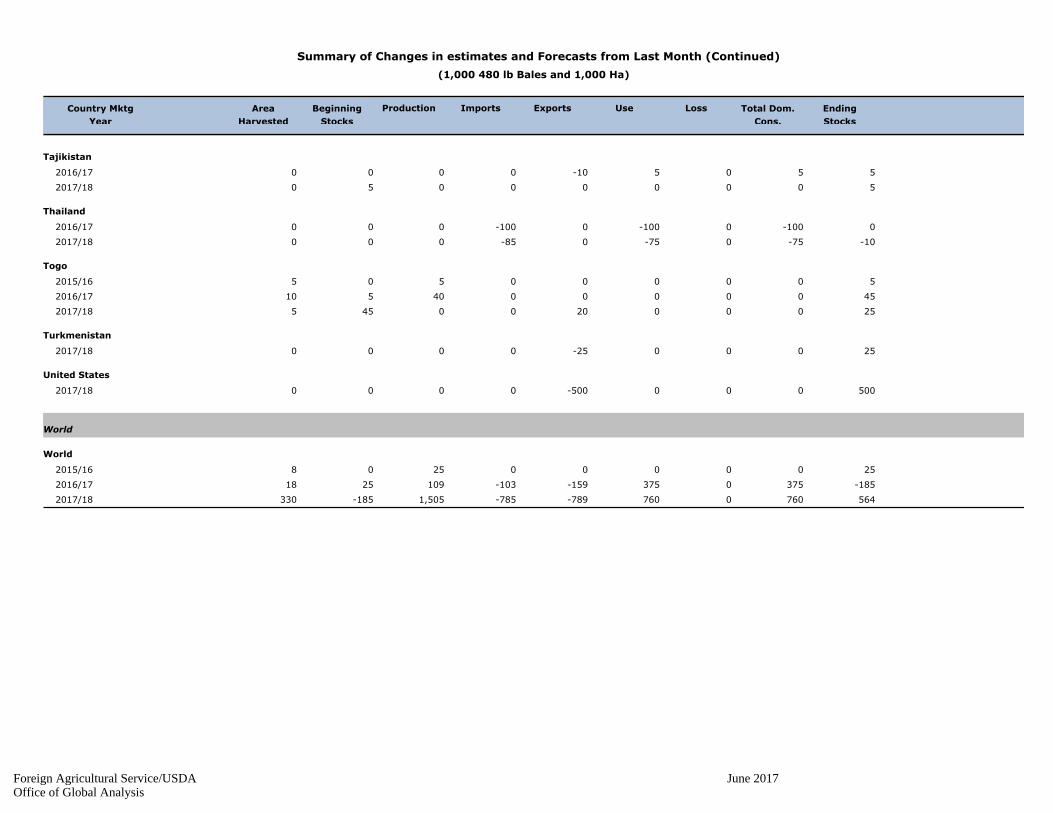
Thailand is down 100,000 bales to 1.2 million on a weak pace of trade to date.
Major Exporters:
No 2016/17 export changes in excess of 100,000 bales.
Foreign Agricultural Service/USDA June 2017Office of Global Analysis

The Foreign Agricultural Service (FAS) updates its production, supply and distribution (PSD) database
for cotton, oilseeds, and grains at 12:00 p.m. on the day the World Agricultural Supply and Demand
Estimates (WASDE) report is released. This circular is released by 12:15 p.m.
FAS Reports and Databases:
Current World Market and Trade and World Agricultural Production Reports:
https://apps.fas.usda.gov/psdonline/app/index.html#/app/downloads
Archives World Market and Trade and World Agricultural Production Reports:
http://usda.mannlib.cornell.edu/MannUsda/viewTaxonomy.do?taxonomyID=7
Production, Supply and Distribution Database (PSD Online):
https://apps.fas.usda.gov/psdonline/app/index.html#/app/home
Global Agricultural Trade System (U.S. Exports and Imports):
http://apps.fas.usda.gov/gats/default.aspx
Export Sales Report:
http://apps.fas.usda.gov/esrquery/
Global Agricultural Information Network (Agricultural Attaché Reports):
http://gain.fas.usda.gov/Pages/Default.aspx
Other USDA Reports:
World Agricultural Supply and Demand Estimates (WASDE):
http://www.usda.gov/oce/commodity/wasde/
Economic Research Service:
http://www.ers.usda.gov/topics/crops
National Agricultural Statistics Service:
http://www.nass.usda.gov/Publications/
Questions may be directed to:
James Johnson (202) 690-1546 [email protected]
Lyman Stone (202) 720-0683 [email protected]
Foreign Agricultural Service/USDA June 2017Office of Global Analysis

Summary of Changes in estimates and Forecasts from Last Month
(1,000 480 lb Bales and 1,000 Ha)
Country Mktg
Year
Area
Harvested
Beginning
Stocks
Production Imports Exports Use Loss Total Dom.
Cons.
Ending
Stocks
Argentina
45000-450000 2016/17
45000000450 2017/18
Australia
50000-500000 2017/18
Bangladesh
1000000100000 2017/18
Benin
50000-500000 2016/17
250002500500 2017/18
Brazil
25000-50-25000 2016/17
125000-10000250 2017/18
Burkina
50000-500000 2016/17
250002500500 2017/18
Cameroon
25000-250000 2017/18
Central African Republic
5000-50000 2016/17
500000050 2017/18
China
-30050005000200000 2016/17
-300500050000500-30050 2017/18
Cote d'Ivoire
-10000100000 2016/17
-10000000-100 2017/18
Egypt
-500000-500 2016/17
-5000000-50 2017/18
Greece
-25000250000 2016/17
-25000000-250 2017/18
Foreign Agricultural Service/USDA June 2017Office of Global Analysis

Summary of Changes in estimates and Forecasts from Last Month (Continued)
(1,000 480 lb Bales and 1,000 Ha)
Country Mktg
Year
Area
Harvested
Beginning
Stocks
Production Imports Exports Use Loss Total Dom.
Cons.
Ending
Stocks
Hong Kong
100012000 2016/17
000010010 2017/18
India
1002000200-3000000 2017/18
Kazakhstan
100002503505 2016/17
4000025055105 2017/18
Malawi
20000-200000 2016/17
100001000200 2017/18
Mali
-1500000-1500 2015/16
-15000000-150 2016/17
10000-2500-150 2017/18
Mexico
35000003503 2015/16
-12502525-2539353 2016/17
-100025-125150-120 2017/18
Morocco
0-50-50-5000 2016/17
0-50-50-5000 2017/18
Mozambique
20000-200000 2016/17
100001000200 2017/18
Pakistan
-1000000-100000 2016/17
-2002000200100-600800-100250 2017/18
Russia
0-500-500-50000 2016/17
-10-600-600-70000 2017/18
Spain
-500050000 2016/17
0000-500-50 2017/18
Foreign Agricultural Service/USDA June 2017Office of Global Analysis
Summary of Changes in estimates and Forecasts from Last Month (Continued)
(1,000 480 lb Bales and 1,000 Ha)
Country Mktg
Year
Area
Harvested
Beginning
Stocks
Production Imports Exports Use Loss Total Dom.
Cons.
Ending
Stocks
Tajikistan
5505-100000 2016/17
500000050 2017/18
Thailand
0-1000-1000-100000 2016/17
-10-750-750-85000 2017/18
Togo
500000505 2015/16
450000040510 2016/17
250002000455 2017/18
Turkmenistan
25000-250000 2017/18
United States
500000-5000000 2017/18
World
World
25000002508 2015/16
-1853750375-159-1031092518 2016/17
5647600760-789-7851,505-185330 2017/18
Foreign Agricultural Service/USDA June 2017Office of Global Analysis
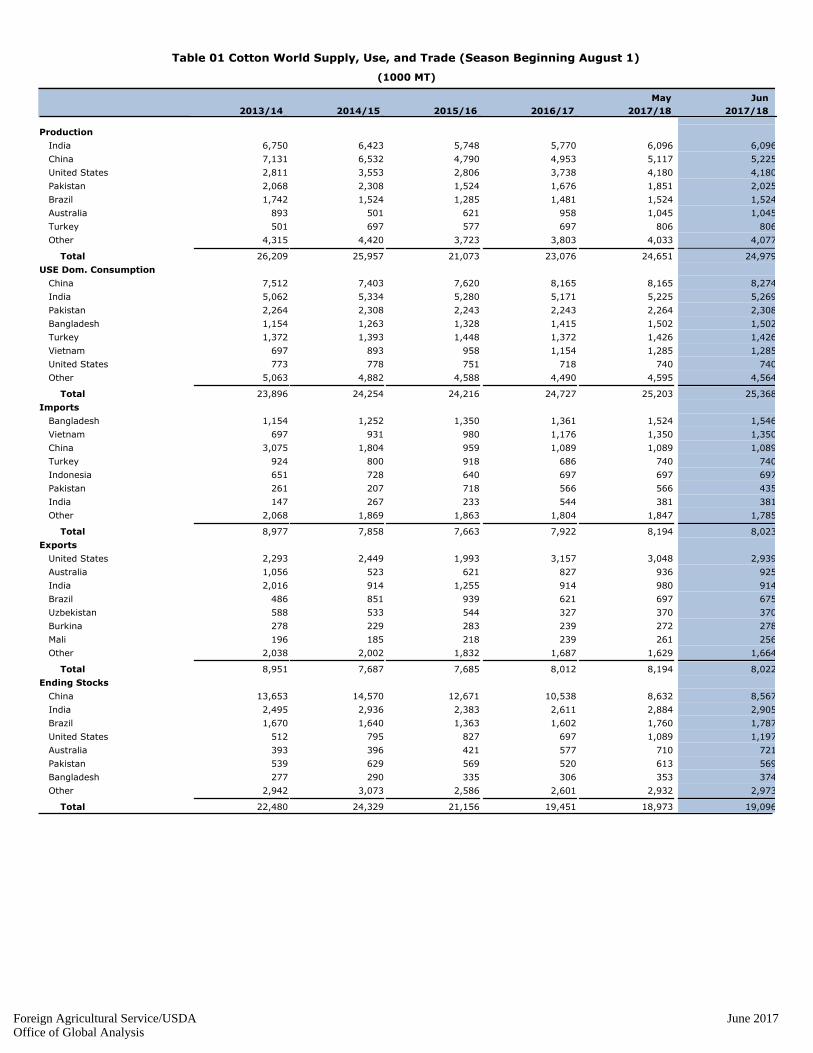
Table 01 Cotton World Supply, Use, and Trade (Season Beginning August 1)
(1000 MT)
2013/14 2014/15 2015/16 2016/17
May
2017/18
Jun
2017/18
Production none
6,750 India 6,423 5,748 5,770 6,096 6,096
7,131 China 6,532 4,790 4,953 5,117 5,225
2,811 United States 3,553 2,806 3,738 4,180 4,180
2,068 Pakistan 2,308 1,524 1,676 1,851 2,025
1,742 Brazil 1,524 1,285 1,481 1,524 1,524
893 Australia 501 621 958 1,045 1,045
501 Turkey 697 577 697 806 806
4,315 Other 4,420 3,723 3,803 4,033 4,077
26,209 Total 25,957 21,073 23,076 24,651 24,979
USE Dom. Consumption none
7,512 China 7,403 7,620 8,165 8,165 8,274
5,062 India 5,334 5,280 5,171 5,225 5,269
2,264 Pakistan 2,308 2,243 2,243 2,264 2,308
1,154 Bangladesh 1,263 1,328 1,415 1,502 1,502
1,372 Turkey 1,393 1,448 1,372 1,426 1,426
697 Vietnam 893 958 1,154 1,285 1,285
773 United States 778 751 718 740 740
5,063 Other 4,882 4,588 4,490 4,595 4,564
23,896 Total 24,254 24,216 24,727 25,203 25,368
Imports none
1,154 Bangladesh 1,252 1,350 1,361 1,524 1,546
697 Vietnam 931 980 1,176 1,350 1,350
3,075 China 1,804 959 1,089 1,089 1,089
924 Turkey 800 918 686 740 740
651 Indonesia 728 640 697 697 697
261 Pakistan 207 718 566 566 435
147 India 267 233 544 381 381
2,068 Other 1,869 1,863 1,804 1,847 1,785
8,977 Total 7,858 7,663 7,922 8,194 8,023
Exports none
2,293 United States 2,449 1,993 3,157 3,048 2,939
1,056 Australia 523 621 827 936 925
2,016 India 914 1,255 914 980 914
486 Brazil 851 939 621 697 675
588 Uzbekistan 533 544 327 370 370
278 Burkina 229 283 239 272 278
196 Mali 185 218 239 261 256
2,038 Other 2,002 1,832 1,687 1,629 1,664
8,951 Total 7,687 7,685 8,012 8,194 8,022
Ending Stocks none
13,653 China 14,570 12,671 10,538 8,632 8,567
2,495 India 2,936 2,383 2,611 2,884 2,905
1,670 Brazil 1,640 1,363 1,602 1,760 1,787
512 United States 795 827 697 1,089 1,197
393 Australia 396 421 577 710 721
539 Pakistan 629 569 520 613 569
277 Bangladesh 290 335 306 353 374
2,942 Other 3,073 2,586 2,601 2,932 2,973
22,480 Total 24,329 21,156 19,451 18,973 19,096
Foreign Agricultural Service/USDA June 2017Office of Global Analysis

Table 02 Cotton World Supply, Use, and Trade (Season Beginning August 1)
(1000 Bales)
2013/14 2014/15 2015/16 2016/17
May
2017/18
Jun
2017/18
Production none
4,100 Australia 2,300 2,850 4,400 4,800 4,800
8,000 Brazil 7,000 5,900 6,800 7,000 7,000
32,750 China 30,000 22,000 22,750 23,500 24,000
31,000 India 29,500 26,400 26,500 28,000 28,000
9,500 Pakistan 10,600 7,000 7,700 8,500 9,300
2,300 Turkey 3,200 2,650 3,200 3,700 3,700
12,909 United States 16,319 12,888 17,170 19,200 19,200
19,817 Other 20,300 17,099 17,467 18,522 18,727
120,376 Total 119,219 96,787 105,987 113,222 114,727
USE Dom. Consumption none
5,300 Bangladesh 5,800 6,100 6,500 6,900 6,900
4,200 Brazil 3,400 3,100 3,200 3,300 3,300
34,500 China 34,000 35,000 37,500 37,500 38,000
23,250 India 24,500 24,250 23,750 24,000 24,200
3,050 Indonesia 3,250 3,000 3,100 3,200 3,200
1,850 Mexico 1,850 1,850 1,750 1,800 1,800
10,400 Pakistan 10,600 10,300 10,300 10,400 10,600
6,300 Turkey 6,400 6,650 6,300 6,550 6,550
3,550 United States 3,575 3,450 3,300 3,400 3,400
3,200 Vietnam 4,100 4,400 5,300 5,900 5,900
14,152 Other 13,923 13,123 12,571 12,804 12,664
109,752 Total 111,398 111,223 113,571 115,754 116,514
Imports none
5,300 Bangladesh 5,750 6,200 6,250 7,000 7,100
14,122 China 8,284 4,406 5,000 5,000 5,000
675 India 1,226 1,072 2,500 1,750 1,750
2,989 Indonesia 3,345 2,941 3,200 3,200 3,200
1,286 Korea, South 1,321 1,175 1,000 975 975
1,040 Mexico 830 975 1,000 975 850
1,200 Pakistan 950 3,300 2,600 2,600 2,000
1,546 Thailand 1,475 1,275 1,200 1,360 1,275
4,246 Turkey 3,675 4,218 3,150 3,400 3,400
3,200 Vietnam 4,275 4,500 5,400 6,200 6,200
5,627 Other 4,958 5,132 5,086 5,173 5,098
41,231 Total 36,089 35,194 36,386 37,633 36,848
Exports none
4,852 Australia 2,404 2,850 3,800 4,300 4,250
475 Benin 525 725 675 650 675
2,230 Brazil 3,910 4,314 2,850 3,200 3,100
1,275 Burkina 1,050 1,300 1,100 1,250 1,275
1,285 Greece 1,168 959 975 950 950
9,261 India 4,199 5,764 4,200 4,500 4,200
900 Mali 850 1,000 1,100 1,200 1,175
1,625 Turkmenistan 1,500 1,250 850 675 650
10,530 United States 11,246 9,153 14,500 14,000 13,500
2,700 Uzbekistan 2,450 2,500 1,500 1,700 1,700
5,977 Other 6,003 5,480 5,250 5,208 5,369
41,110 Total 35,305 35,295 36,800 37,633 36,844
Ending Stocks none
1,807 Australia 1,818 1,933 2,648 3,263 3,313
1,271 Bangladesh 1,331 1,540 1,405 1,620 1,720
7,668 Brazil 7,532 6,259 7,359 8,084 8,209
62,707 China 66,920 58,198 48,398 39,648 39,348
11,459 India 13,486 10,944 11,994 13,244 13,344
2,475 Pakistan 2,890 2,615 2,390 2,815 2,615
2,350 United States 3,650 3,800 3,200 5,000 5,500
13,514 Other 14,116 11,878 11,944 13,468 13,657
103,251 Total 111,743 97,167 89,338 87,142 87,706
Foreign Agricultural Service/USDA June 2017Office of Global Analysis
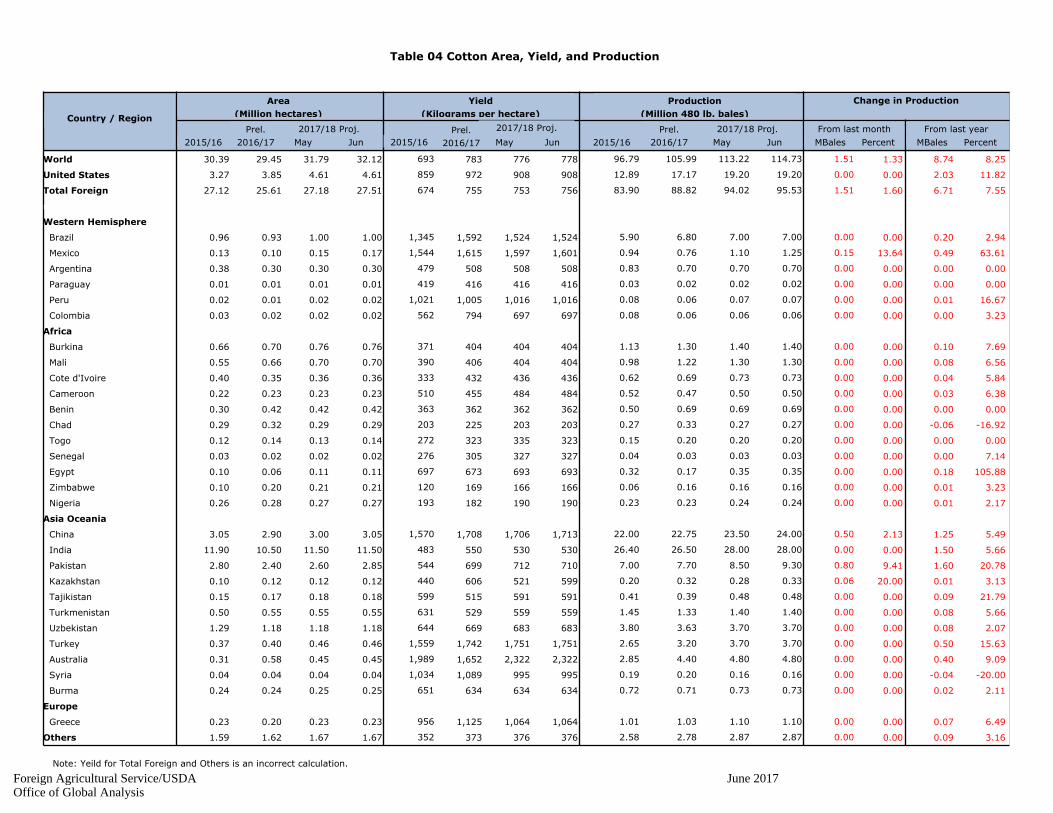
Table 04 Cotton Area, Yield, and Production
From last month From last year
MBalesPercent
Yield
(Kilograms per hectare)
Jun 2015/16 MBales
Country / Region
Area
(Million hectares)
Production
(Million 480 lb. bales)
Change in Production
2015/16
Prel.
2016/17 May May
Prel.
2016/17 Jun
Prel.
2016/17 May Jun Percent
2017/18 Proj.2017/18 Proj. 2017/18 Proj.
2015/16
30.39World 8.258.741.331.51114.7329.45 31.79 32.12 693 783 776 778 96.79 105.99 113.22
3.27United States 11.822.030.000.0019.203.85 4.61 4.61 859 972 908 908 12.89 17.17 19.20
27.12Total Foreign 7.556.711.601.5195.5325.61 27.18 27.51 674 755 753 756 83.90 88.82 94.02
none
Western Hemisphere
0.96 Brazil 2.940.200.000.007.000.93 1.00 1.00 1,345 1,592 1,524 1,524 5.90 6.80 7.00
0.13 Mexico 63.610.4913.640.151.250.10 0.15 0.17 1,544 1,615 1,597 1,601 0.94 0.76 1.10
0.38 Argentina 0.000.000.000.000.700.30 0.30 0.30 479 508 508 508 0.83 0.70 0.70
0.01 Paraguay 0.000.000.000.000.020.01 0.01 0.01 419 416 416 416 0.03 0.02 0.02
0.02 Peru 16.670.010.000.000.070.01 0.02 0.02 1,021 1,005 1,016 1,016 0.08 0.06 0.07
0.03 Colombia 3.230.000.000.000.060.02 0.02 0.02 562 794 697 697 0.08 0.06 0.06
Africa
0.66 Burkina 7.690.100.000.001.400.70 0.76 0.76 371 404 404 404 1.13 1.30 1.40
0.55 Mali 6.560.080.000.001.300.66 0.70 0.70 390 406 404 404 0.98 1.22 1.30
0.40 Cote d'Ivoire 5.840.040.000.000.730.35 0.36 0.36 333 432 436 436 0.62 0.69 0.73
0.22 Cameroon 6.380.030.000.000.500.23 0.23 0.23 510 455 484 484 0.52 0.47 0.50
0.30 Benin 0.000.000.000.000.690.42 0.42 0.42 363 362 362 362 0.50 0.69 0.69
0.29 Chad -16.92-0.060.000.000.270.32 0.29 0.29 203 225 203 203 0.27 0.33 0.27
0.12 Togo 0.000.000.000.000.200.14 0.13 0.14 272 323 335 323 0.15 0.20 0.20
0.03 Senegal 7.140.000.000.000.030.02 0.02 0.02 276 305 327 327 0.04 0.03 0.03
0.10 Egypt 105.880.180.000.000.350.06 0.11 0.11 697 673 693 693 0.32 0.17 0.35
0.10 Zimbabwe 3.230.010.000.000.160.20 0.21 0.21 120 169 166 166 0.06 0.16 0.16
0.26 Nigeria 2.170.010.000.000.240.28 0.27 0.27 193 182 190 190 0.23 0.23 0.24
Asia Oceania
3.05 China 5.491.252.130.5024.002.90 3.00 3.05 1,570 1,708 1,706 1,713 22.00 22.75 23.50
11.90 India 5.661.500.000.0028.0010.50 11.50 11.50 483 550 530 530 26.40 26.50 28.00
2.80 Pakistan 20.781.609.410.809.302.40 2.60 2.85 544 699 712 710 7.00 7.70 8.50
0.10 Kazakhstan 3.130.0120.000.060.330.12 0.12 0.12 440 606 521 599 0.20 0.32 0.28
0.15 Tajikistan 21.790.090.000.000.480.17 0.18 0.18 599 515 591 591 0.41 0.39 0.48
0.50 Turkmenistan 5.660.080.000.001.400.55 0.55 0.55 631 529 559 559 1.45 1.33 1.40
1.29 Uzbekistan 2.070.080.000.003.701.18 1.18 1.18 644 669 683 683 3.80 3.63 3.70
0.37 Turkey 15.630.500.000.003.700.40 0.46 0.46 1,559 1,742 1,751 1,751 2.65 3.20 3.70
0.31 Australia 9.090.400.000.004.800.58 0.45 0.45 1,989 1,652 2,322 2,322 2.85 4.40 4.80
0.04 Syria -20.00-0.040.000.000.160.04 0.04 0.04 1,034 1,089 995 995 0.19 0.20 0.16
0.24 Burma 2.110.020.000.000.730.24 0.25 0.25 651 634 634 634 0.72 0.71 0.73
Europe
0.23 Greece 6.490.070.000.001.100.20 0.23 0.23 956 1,125 1,064 1,064 1.01 1.03 1.10
1.59Others 3.160.090.000.002.871.62 1.67 1.67 352 373 376 376 2.58 2.78 2.87
Note: Yeild for Total Foreign and Others is an incorrect calculation.
Foreign Agricultural Service/USDA June 2017Office of Global Analysis
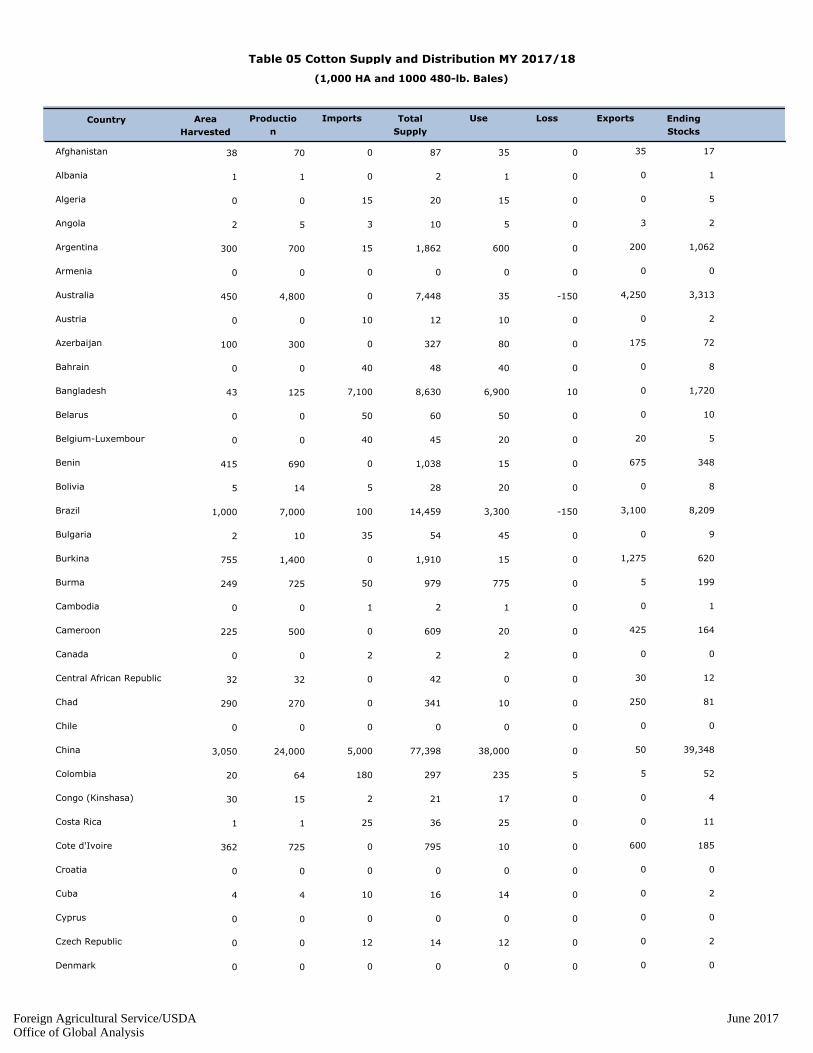
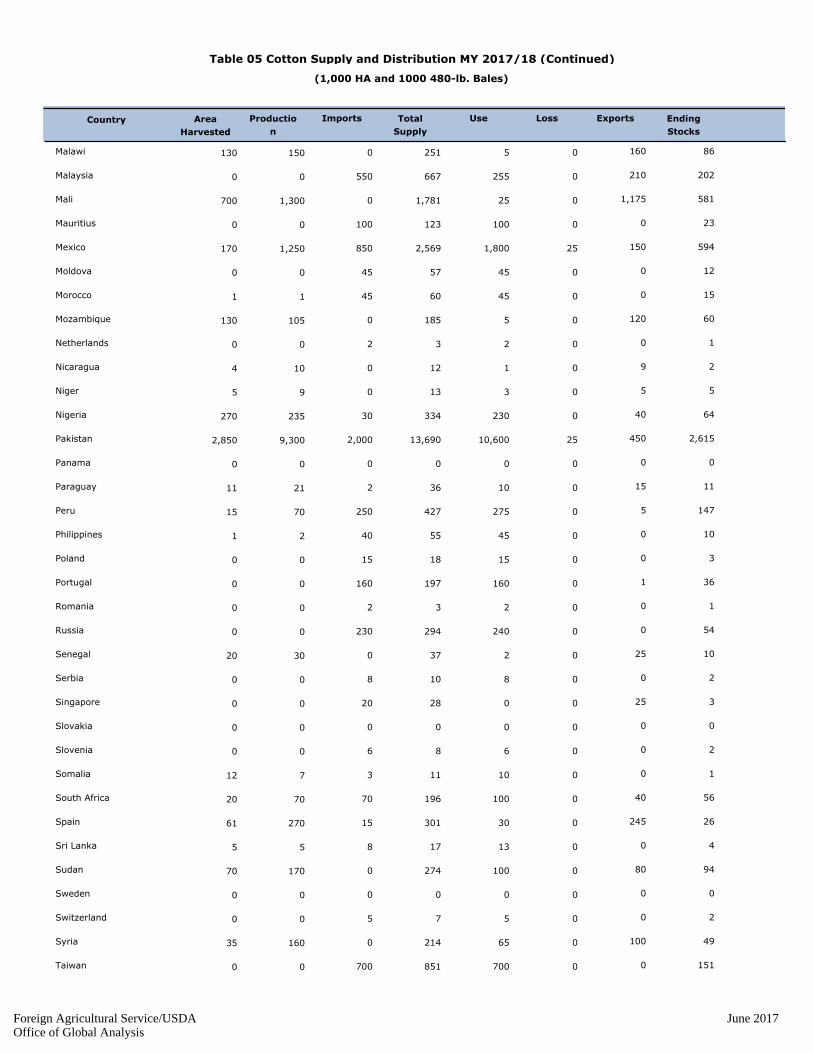
(1,000 HA and 1000 480-lb. Bales)
Table 05 Cotton Supply and Distribution MY 2017/18
Area
Harvested
Ending
Stocks
ExportsLossUseTotal
Supply
ImportsProductio
n
Country
0 35035877038 Afghanistan 17
0 001211 Albania 1
15 00152000 Algeria 5
3 3051052 Angola 2
15 20006001,862700300 Argentina 1,062
0 000000 Armenia 0
0 4,250-150357,4484,800450 Australia 3,313
10 00101200 Austria 2
0 175080327300100 Azerbaijan 72
40 00404800 Bahrain 8
7,100 0106,9008,63012543 Bangladesh 1,720
50 00506000 Belarus 10
40 200204500 Belgium-Luxembour 5
0 6750151,038690415 Benin 348
5 002028145 Bolivia 8
100 3,100-1503,30014,4597,0001,000 Brazil 8,209
35 004554102 Bulgaria 9
0 1,2750151,9101,400755 Burkina 620
50 50775979725249 Burma 199
1 001200 Cambodia 1
0 425020609500225 Cameroon 164
2 002200 Canada 0
0 3000423232 Central African Republic 12
0 250010341270290 Chad 81
0 000000 Chile 0
5,000 50038,00077,39824,0003,050 China 39,348
180 552352976420 Colombia 52
2 0017211530 Congo (Kinshasa) 4
25 00253611 Costa Rica 11
0 600010795725362 Cote d'Ivoire 185
0 000000 Croatia 0
10 00141644 Cuba 2
0 000000 Cyprus 0
12 00121400 Czech Republic 2
0 000000 Denmark 0
Foreign Agricultural Service/USDA June 2017Office of Global Analysis

(1,000 HA and 1000 480-lb. Bales)
Table 05 Cotton Supply and Distribution MY 2017/18 (Continued)
Area
Harvested
Ending
Stocks
ExportsLossUseTotal
Supply
ImportsProductio
n
Country
1 004534 Dominican Republic 1
65 00759393 Ecuador 18
480 20010600994350110 Egypt 184
160 0016520711 El Salvador 42
10 00101200 Estonia 2
75 0027032620080 Ethiopia 56
50 50455800 France 8
140 25011516100 Germany 21
0 15010332816 Ghana 8
25 95025901,2051,100225 Greece 140
110 0011013532 Guatemala 25
0 1400171412 Guinea 3
5 00101157 Haiti 1
20 00242942 Honduras 5
0 100100 Hong Kong 0
3 300300 Hungary 0
1,750 4,200024,20041,74428,00011,500 India 13,344
3,200 503,2003,83132 Indonesia 626
300 150550715280100 Iran 150
35 0050731510 Iraq 23
2 002200 Ireland 0
2 700493708 Israel 19
185 10017520800 Italy 23
270 0026531000 Japan 45
0 185080408330120 Kazakhstan 143
20 0035471820 Kenya 12
95 001502055519 Korea, North 55
975 509501,19400 Korea, South 239
0 3502484015 Kyrgyzstan 11
3 003400 Latvia 1
5 005600 Lebanon 1
65 00658500 Lesotho 20
0 000000 Lithuania 0
5 005600 Macedonia 1
0 10050716030 Madagascar 11
Foreign Agricultural Service/USDA June 2017Office of Global Analysis
(1,000 HA and 1000 480-lb. Bales)
Table 05 Cotton Supply and Distribution MY 2017/18 (Continued)
Area
Harvested
Ending
Stocks
ExportsLossUseTotal
Supply
ImportsProductio
n
Country
0 16005251150130 Malawi 86
550 210025566700 Malaysia 202
0 1,1750251,7811,300700 Mali 581
100 0010012300 Mauritius 23
850 150251,8002,5691,250170 Mexico 594
45 00455700 Moldova 12
45 00456011 Morocco 15
0 12005185105130 Mozambique 60
2 002300 Netherlands 1
0 90112104 Nicaragua 2
0 5031395 Niger 5
30 400230334235270 Nigeria 64
2,000 4502510,60013,6909,3002,850 Pakistan 2,615
0 000000 Panama 0
2 15010362111 Paraguay 11
250 502754277015 Peru 147
40 00455521 Philippines 10
15 00151800 Poland 3
160 1016019700 Portugal 36
2 002300 Romania 1
230 0024029400 Russia 54
0 2502373020 Senegal 10
8 0081000 Serbia 2
20 25002800 Singapore 3
0 000000 Slovakia 0
6 006800 Slovenia 2
3 001011712 Somalia 1
70 4001001967020 South Africa 56
15 24503030127061 Spain 26
8 00131755 Sri Lanka 4
0 80010027417070 Sudan 94
0 000000 Sweden 0
5 005700 Switzerland 2
0 10006521416035 Syria 49
700 0070085100 Taiwan 151
Foreign Agricultural Service/USDA June 2017Office of Global Analysis

(1,000 HA and 1000 480-lb. Bales)
Table 05 Cotton Supply and Distribution MY 2017/18 (Continued)
Area
Harvested
Ending
Stocks
ExportsLossUseTotal
Supply
ImportsProductio
n
Country
0 350060850475175 Tajikistan 440
0 1100175649250350 Tanzania 364
1,275 1251,2501,47621 Thailand 200
0 180015277200135 Togo 82
30 004053102 Tunisia 13
3,400 27506,5508,4583,700460 Turkey 1,633
0 65006752,0541,400545 Turkmenistan 729
0 1100521512575 Uganda 100
9 0091200 Ukraine 3
2 002300 United Kingdom 1
10 13,500103,40022,41019,2004,605 United States 5,500
0 000000 Uruguay 0
0 1,70001,7504,9733,7001,180 Uzbekistan 1,523
15 001001238515 Venezuela 23
6,200 005,9007,08531 Vietnam 1,185
0 2025322818 Yemen 5
0 16505338185175 Zambia 168
0 1001425244160210 Zimbabwe 105
World
36,848 36,844-151116,514240,913114,72732,117 World 87,706
Foreign Agricultural Service/USDA June 2017Office of Global Analysis
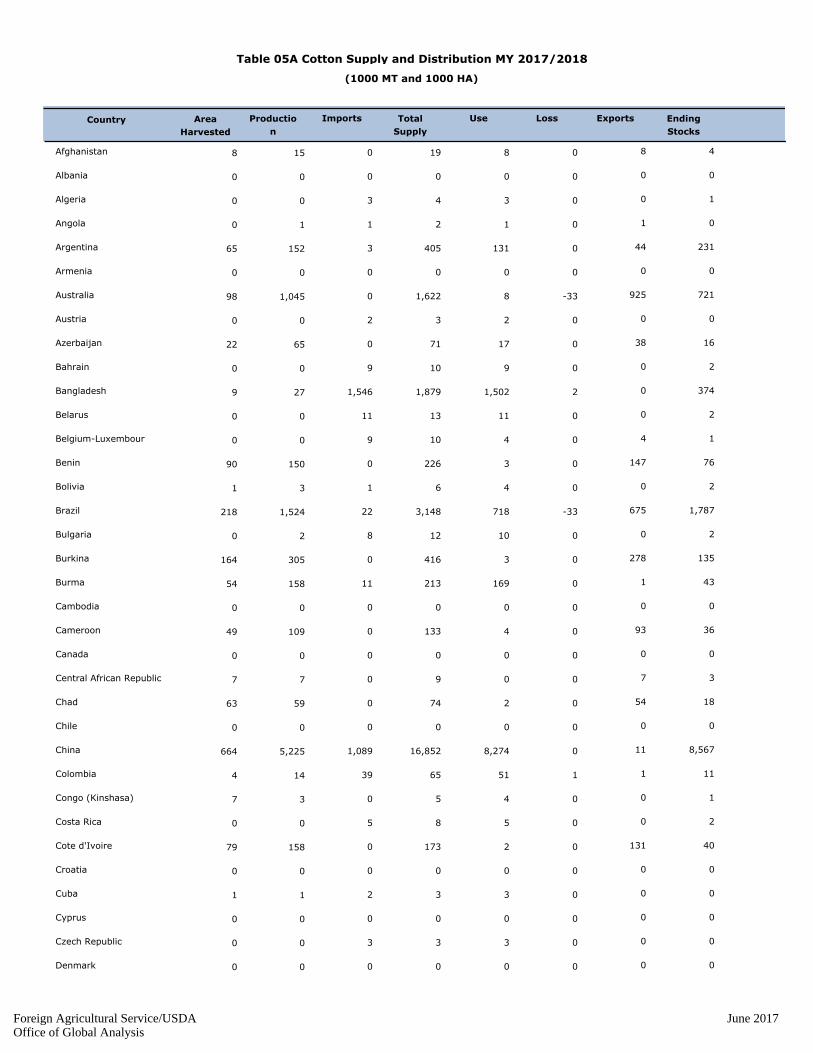
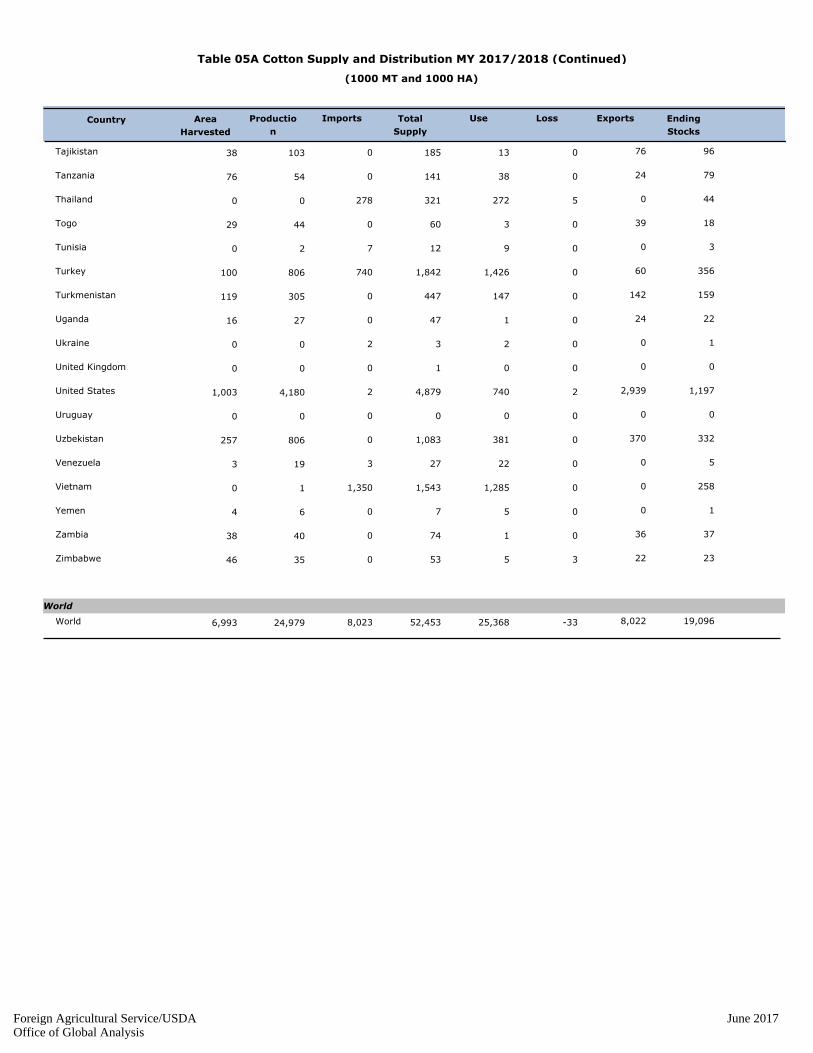
(1000 MT and 1000 HA)
Table 05A Cotton Supply and Distribution MY 2017/2018
Area
Harvested
Ending
Stocks
ExportsLossUseTotal
Supply
ImportsProductio
n
Country
0 80819158 Afghanistan 4
0 000000 Albania 0
3 003400 Algeria 1
1 101210 Angola 0
3 44013140515265 Argentina 231
0 000000 Armenia 0
0 925-3381,6221,04598 Australia 721
2 002300 Austria 0
0 38017716522 Azerbaijan 16
9 0091000 Bahrain 2
1,546 021,5021,879279 Bangladesh 374
11 00111300 Belarus 2
9 4041000 Belgium-Luxembour 1
0 1470322615090 Benin 76
1 004631 Bolivia 2
22 675-337183,1481,524218 Brazil 1,787
8 00101220 Bulgaria 2
0 27803416305164 Burkina 135
11 1016921315854 Burma 43
0 000000 Cambodia 0
0 930413310949 Cameroon 36
0 000000 Canada 0
0 700977 Central African Republic 3
0 5402745963 Chad 18
0 000000 Chile 0
1,089 1108,27416,8525,225664 China 8,567
39 115165144 Colombia 11
0 004537 Congo (Kinshasa) 1
5 005800 Costa Rica 2
0 1310217315879 Cote d'Ivoire 40
0 000000 Croatia 0
2 003311 Cuba 0
0 000000 Cyprus 0
3 003300 Czech Republic 0
0 000000 Denmark 0
Foreign Agricultural Service/USDA June 2017Office of Global Analysis
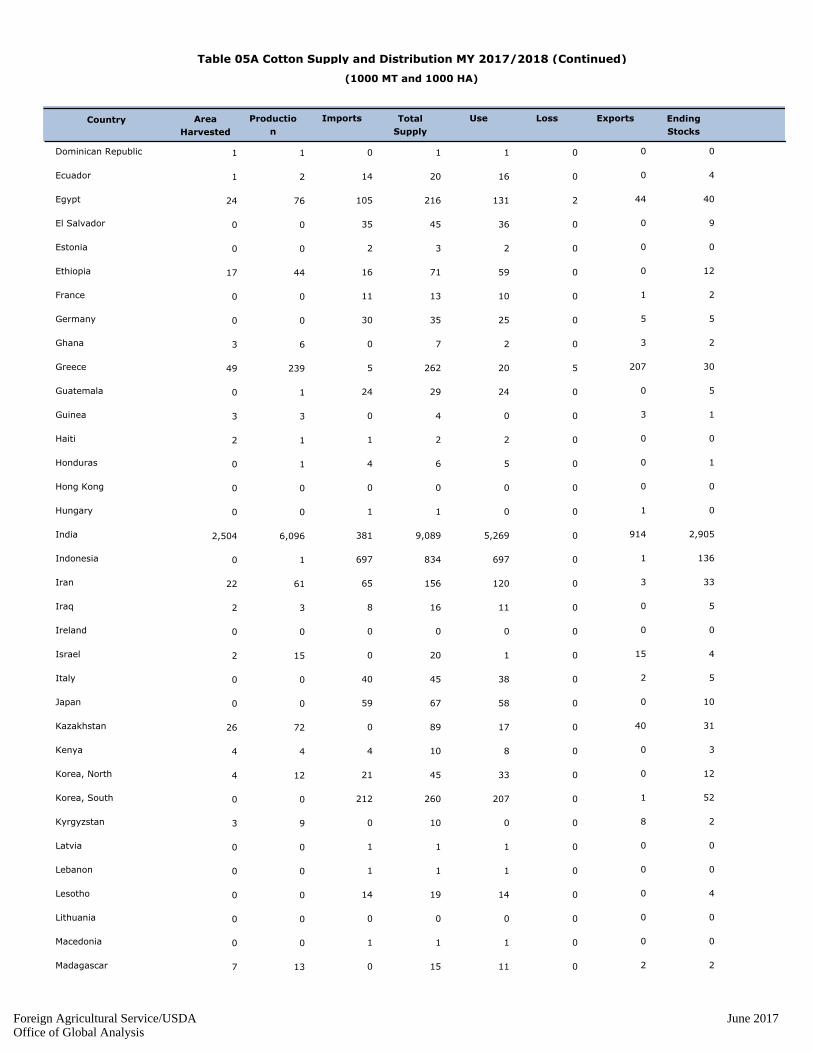
(1000 MT and 1000 HA)
Table 05A Cotton Supply and Distribution MY 2017/2018 (Continued)
Area
Harvested
Ending
Stocks
ExportsLossUseTotal
Supply
ImportsProductio
n
Country
0 001111 Dominican Republic 0
14 00162021 Ecuador 4
105 4421312167624 Egypt 40
35 00364500 El Salvador 9
2 002300 Estonia 0
16 0059714417 Ethiopia 12
11 10101300 France 2
30 50253500 Germany 5
0 302763 Ghana 2
5 20752026223949 Greece 30
24 00242910 Guatemala 5
0 300433 Guinea 1
1 002212 Haiti 0
4 005610 Honduras 1
0 000000 Hong Kong 0
1 100100 Hungary 0
381 91405,2699,0896,0962,504 India 2,905
697 1069783410 Indonesia 136
65 301201566122 Iran 33
8 00111632 Iraq 5
0 000000 Ireland 0
0 150120152 Israel 4
40 20384500 Italy 5
59 00586700 Japan 10
0 40017897226 Kazakhstan 31
4 0081044 Kenya 3
21 003345124 Korea, North 12
212 1020726000 Korea, South 52
0 8001093 Kyrgyzstan 2
1 001100 Latvia 0
1 001100 Lebanon 0
14 00141900 Lesotho 4
0 000000 Lithuania 0
1 001100 Macedonia 0
0 201115137 Madagascar 2
Foreign Agricultural Service/USDA June 2017Office of Global Analysis
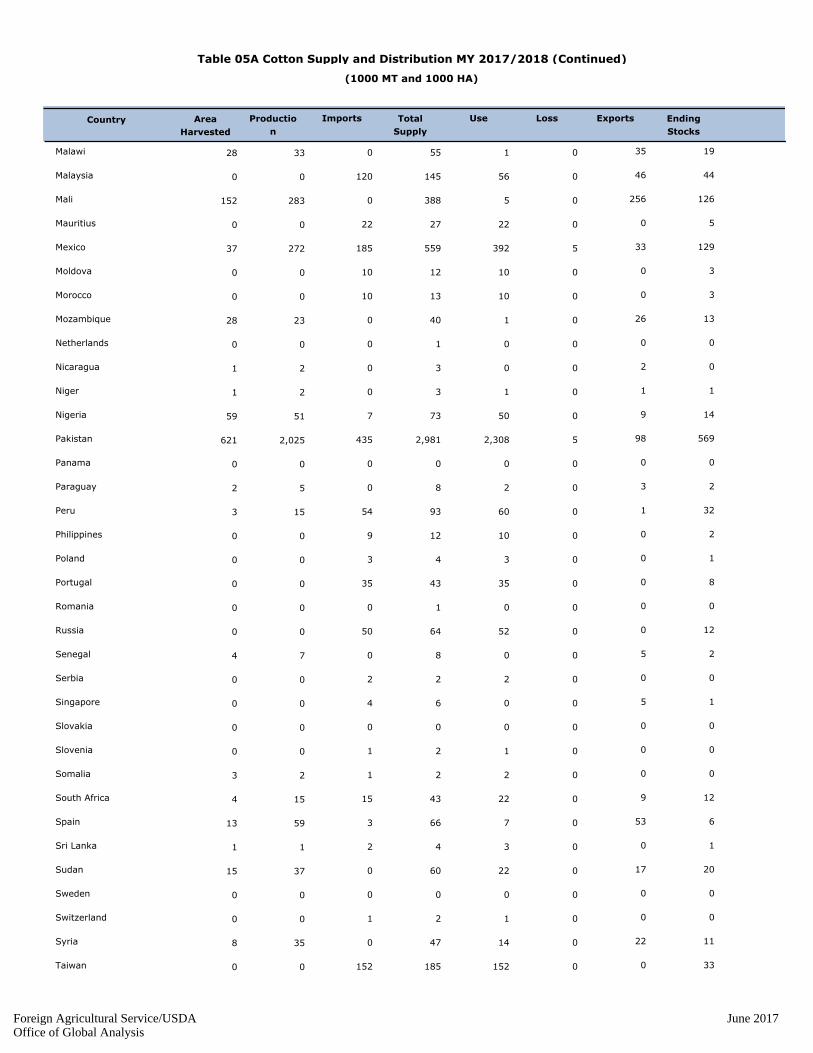
(1000 MT and 1000 HA)
Table 05A Cotton Supply and Distribution MY 2017/2018 (Continued)
Area
Harvested
Ending
Stocks
ExportsLossUseTotal
Supply
ImportsProductio
n
Country
0 3501553328 Malawi 19
120 4605614500 Malaysia 44
0 25605388283152 Mali 126
22 00222700 Mauritius 5
185 33539255927237 Mexico 129
10 00101200 Moldova 3
10 00101300 Morocco 3
0 2601402328 Mozambique 13
0 000100 Netherlands 0
0 200321 Nicaragua 0
0 101321 Niger 1
7 9050735159 Nigeria 14
435 9852,3082,9812,025621 Pakistan 569
0 000000 Panama 0
0 302852 Paraguay 2
54 106093153 Peru 32
9 00101200 Philippines 2
3 003400 Poland 1
35 00354300 Portugal 8
0 000100 Romania 0
50 00526400 Russia 12
0 500874 Senegal 2
2 002200 Serbia 0
4 500600 Singapore 1
0 000000 Slovakia 0
1 001200 Slovenia 0
1 002223 Somalia 0
15 902243154 South Africa 12
3 5307665913 Spain 6
2 003411 Sri Lanka 1
0 17022603715 Sudan 20
0 000000 Sweden 0
1 001200 Switzerland 0
0 2201447358 Syria 11
152 0015218500 Taiwan 33
Foreign Agricultural Service/USDA June 2017Office of Global Analysis
(1000 MT and 1000 HA)
Table 05A Cotton Supply and Distribution MY 2017/2018 (Continued)
Area
Harvested
Ending
Stocks
ExportsLossUseTotal
Supply
ImportsProductio
n
Country
0 7601318510338 Tajikistan 96
0 240381415476 Tanzania 79
278 0527232100 Thailand 44
0 3903604429 Togo 18
7 0091220 Tunisia 3
740 6001,4261,842806100 Turkey 356
0 1420147447305119 Turkmenistan 159
0 2401472716 Uganda 22
2 002300 Ukraine 1
0 000100 United Kingdom 0
2 2,93927404,8794,1801,003 United States 1,197
0 000000 Uruguay 0
0 37003811,083806257 Uzbekistan 332
3 002227193 Venezuela 5
1,350 001,2851,54310 Vietnam 258
0 005764 Yemen 1
0 3601744038 Zambia 37
0 2235533546 Zimbabwe 23
World
8,023 8,022-3325,36852,45324,9796,993 World 19,096
Foreign Agricultural Service/USDA June 2017Office of Global Analysis

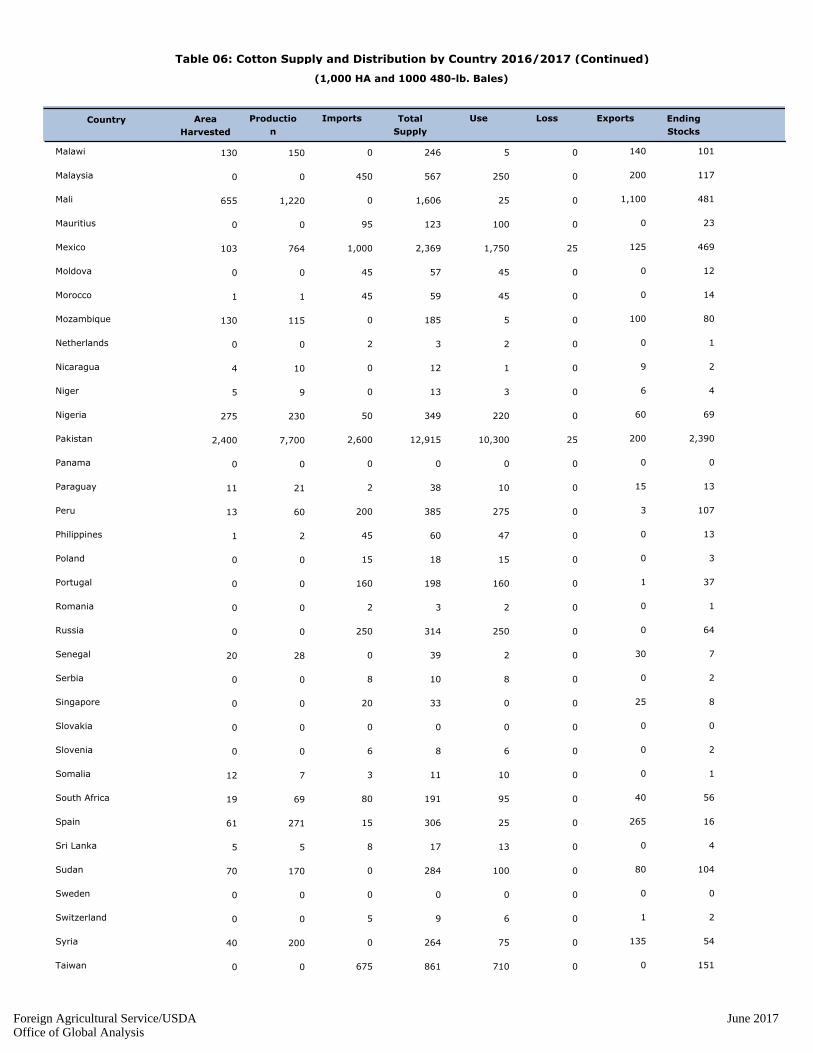
(1,000 HA and 1000 480-lb. Bales)
Table 06: Cotton Supply and Distribution by Country 2016/2017
Area
Harvested
Ending
Stocks
ExportsLossUseTotal
Supply
ImportsProductio
n
Country
0 40040978243 Afghanistan 17
2 004511 Albania 1
15 00152000 Algeria 5
3 3051052 Angola 2
15 28006002,027700300 Argentina 1,147
0 000000 Armenia 0
0 3,800-150356,3334,400580 Australia 2,648
10 00111300 Austria 2
0 8007017715052 Azerbaijan 27
50 00505800 Bahrain 8
6,250 0106,5007,91512543 Bangladesh 1,405
50 00506000 Belarus 10
35 180204300 Belgium-Luxembour 5
0 6750151,038690415 Benin 348
6 002029145 Bolivia 9
200 2,850-1503,20013,2596,800930 Brazil 7,359
35 004554102 Bulgaria 9
0 1,1000151,6251,300700 Burkina 510
50 50775984710244 Burma 204
1 001200 Cambodia 1
0 4751120615470225 Cameroon 109
2 002200 Canada 0
0 2505403232 Central African Republic 10
0 300010381325315 Chad 71
0 000000 Chile 0
5,000 50037,50085,94822,7502,900 China 48,398
175 552352986217 Colombia 53
2 0017211530 Congo (Kinshasa) 4
25 00253511 Costa Rica 10
0 710010790685345 Cote d'Ivoire 70
0 000000 Croatia 0
10 00141644 Cuba 2
0 000000 Cyprus 0
12 00121400 Czech Republic 2
0 000000 Denmark 0
Foreign Agricultural Service/USDA June 2017Office of Global Analysis

(1,000 HA and 1000 480-lb. Bales)
Table 06: Cotton Supply and Distribution by Country 2016/2017 (Continued)
Area
Harvested
Ending
Stocks
ExportsLossUseTotal
Supply
ImportsProductio
n
Country
1 004534 Dominican Republic 1
70 00759493 Ecuador 19
525 1201058087417055 Egypt 164
165 0016521111 El Salvador 46
10 00101200 Estonia 2
65 0026031120080 Ethiopia 51
50 80456100 France 8
135 25011516100 Germany 21
0 20010352816 Ghana 5
35 97525901,1701,033200 Greece 80
107 0011013232 Guatemala 22
0 1400171412 Guinea 3
5 00101157 Haiti 1
20 00242942 Honduras 5
2 100200 Hong Kong 1
3 300300 Hungary 0
2,500 4,200023,75039,94426,50010,500 India 11,994
3,200 503,1003,73353 Indonesia 628
280 150550700300100 Iran 135
30 0050732313 Iraq 23
2 002200 Ireland 0
2 8004105658 Israel 21
185 10017520800 Italy 23
260 0026530500 Japan 40
0 225080383320115 Kazakhstan 78
15 0035441820 Kenya 9
95 001502055519 Korea, North 55
1,000 501,0251,24900 Korea, South 219
0 3502454015 Kyrgyzstan 8
3 003400 Latvia 1
5 005600 Lebanon 1
65 00658500 Lesotho 20
0 000000 Lithuania 0
5 005600 Macedonia 1
0 10050716030 Madagascar 11
Foreign Agricultural Service/USDA June 2017Office of Global Analysis
(1,000 HA and 1000 480-lb. Bales)
Table 06: Cotton Supply and Distribution by Country 2016/2017 (Continued)
Area
Harvested
Ending
Stocks
ExportsLossUseTotal
Supply
ImportsProductio
n
Country
0 14005246150130 Malawi 101
450 200025056700 Malaysia 117
0 1,1000251,6061,220655 Mali 481
95 0010012300 Mauritius 23
1,000 125251,7502,369764103 Mexico 469
45 00455700 Moldova 12
45 00455911 Morocco 14
0 10005185115130 Mozambique 80
2 002300 Netherlands 1
0 90112104 Nicaragua 2
0 6031395 Niger 4
50 600220349230275 Nigeria 69
2,600 2002510,30012,9157,7002,400 Pakistan 2,390
0 000000 Panama 0
2 15010382111 Paraguay 13
200 302753856013 Peru 107
45 00476021 Philippines 13
15 00151800 Poland 3
160 1016019800 Portugal 37
2 002300 Romania 1
250 0025031400 Russia 64
0 3002392820 Senegal 7
8 0081000 Serbia 2
20 25003300 Singapore 8
0 000000 Slovakia 0
6 006800 Slovenia 2
3 001011712 Somalia 1
80 400951916919 South Africa 56
15 26502530627161 Spain 16
8 00131755 Sri Lanka 4
0 80010028417070 Sudan 104
0 000000 Sweden 0
5 106900 Switzerland 2
0 13507526420040 Syria 54
675 0071086100 Taiwan 151
Foreign Agricultural Service/USDA June 2017Office of Global Analysis

(1,000 HA and 1000 480-lb. Bales)
Table 06: Cotton Supply and Distribution by Country 2016/2017 (Continued)
Area
Harvested
Ending
Stocks
ExportsLossUseTotal
Supply
ImportsProductio
n
Country
0 290045710390165 Tajikistan 375
0 1350175709280350 Tanzania 399
1,200 1251,1751,40021 Thailand 199
0 150015242200135 Togo 77
30 004053102 Tunisia 13
3,150 27506,3007,9333,200400 Turkey 1,358
0 85006502,1541,325545 Turkmenistan 654
0 1000519512573 Uganda 90
10 0091200 Ukraine 3
2 002300 United Kingdom 1
10 14,500-203,30020,98017,1703,848 United States 3,200
0 000000 Uruguay 0
0 1,50001,7004,4733,6251,180 Uzbekistan 1,273
15 001001238515 Venezuela 23
5,400 005,3006,18231 Vietnam 882
0 2030362818 Yemen 4
0 21505373170175 Zambia 153
0 801525204155200 Zimbabwe 84
World
36,386 36,800-169113,571239,540105,98729,454 World 89,338
Foreign Agricultural Service/USDA June 2017Office of Global Analysis

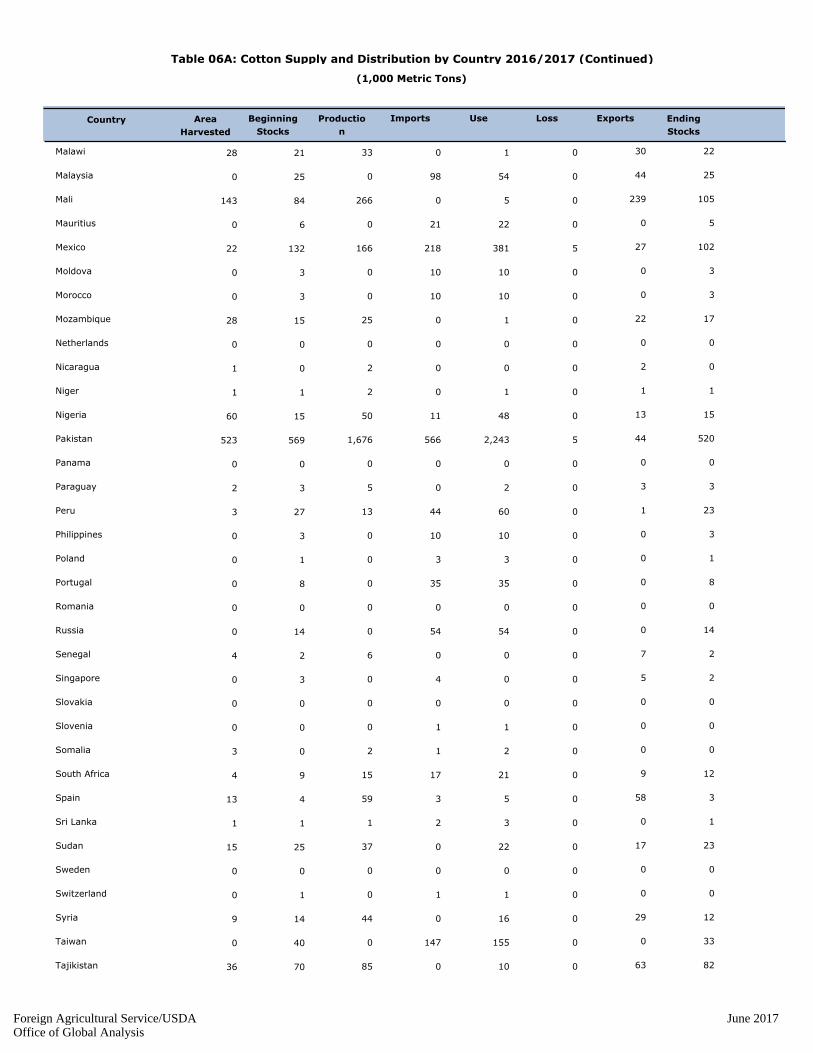
(1,000 Metric Tons)
Table 06A: Cotton Supply and Distribution by Country 2016/2017
Area
Harvested
Ending
Stocks
ExportsLossUseImportsProductio
n
Beginning
Stocks
Country
18 909039 Afghanistan 4
0 001000 Albania 0
0 003310 Algeria 1
1 101100 Angola 0
152 610131328665 Argentina 250
0 000000 Armenia 0
958 827-3380421126 Australia 577
0 002210 Austria 0
33 170150611 Azerbaijan 6
0 00111120 Bahrain 2
27 021,4151,3613359 Bangladesh 306
0 00111120 Belarus 2
0 404820 Belgium-Luxembour 1
150 1470307690 Benin 76
3 004121 Bolivia 2
1,481 621-33697441,363202 Brazil 1,602
2 0010820 Bulgaria 2
283 23903071152 Burkina 111
155 10169114953 Burma 44
0 000000 Cambodia 0
102 1032403249 Cameroon 24
0 000000 Canada 0
7 501027 Central African Republic 2
71 650201269 Chad 15
0 000000 Chile 0
4,953 1108,1651,08912,671631 China 10,538
13 115138134 Colombia 12
3 004017 Congo (Kinshasa) 1
0 005520 Costa Rica 2
149 1550202375 Cote d'Ivoire 15
0 000000 Croatia 0
1 003201 Cuba 0
0 000000 Cyprus 0
0 003300 Czech Republic 0
0 000000 Denmark 0
Foreign Agricultural Service/USDA June 2017Office of Global Analysis

(1,000 Metric Tons)
Table 06A: Cotton Supply and Distribution by Country 2016/2017 (Continued)
Area
Harvested
Ending
Stocks
ExportsLossUseImportsProductio
n
Beginning
Stocks
Country
1 001001 Dominican Republic 0
2 00161531 Ecuador 4
37 2621261143912 Egypt 36
0 003636100 El Salvador 10
0 002200 Estonia 0
44 0057141017 Ethiopia 11
0 20101120 France 2
0 50252960 Germany 5
6 402023 Ghana 1
225 21252082244 Greece 17
1 00242350 Guatemala 5
3 300013 Guinea 1
1 002102 Haiti 0
1 005410 Honduras 1
0 000000 Hong Kong 0
0 100100 Hungary 0
5,770 91405,1715442,3832,286 India 2,611
1 106756971151 Indonesia 137
65 30120612622 Iran 29
5 0011743 Iraq 5
0 000000 Ireland 0
14 1701082 Israel 5
0 20384050 Italy 5
0 005857100 Japan 9
70 4901701425 Kazakhstan 17
4 008324 Kenya 2
12 003321124 Korea, North 12
0 10223218540 Korea, South 48
9 800013 Kyrgyzstan 2
0 001100 Latvia 0
0 001100 Lebanon 0
0 00141440 Lesotho 4
0 000000 Lithuania 0
0 001100 Macedonia 0
13 2011027 Madagascar 2
Foreign Agricultural Service/USDA June 2017Office of Global Analysis
(1,000 Metric Tons)
Table 06A: Cotton Supply and Distribution by Country 2016/2017 (Continued)
Area
Harvested
Ending
Stocks
ExportsLossUseImportsProductio
n
Beginning
Stocks
Country
33 300102128 Malawi 22
0 4405498250 Malaysia 25
266 23905084143 Mali 105
0 00222160 Mauritius 5
166 27538121813222 Mexico 102
0 00101030 Moldova 3
0 00101030 Morocco 3
25 220101528 Mozambique 17
0 000000 Netherlands 0
2 200001 Nicaragua 0
2 101011 Niger 1
50 13048111560 Nigeria 15
1,676 4452,243566569523 Pakistan 520
0 000000 Panama 0
5 302032 Paraguay 3
13 106044273 Peru 23
0 00101030 Philippines 3
0 003310 Poland 1
0 00353580 Portugal 8
0 000000 Romania 0
0 005454140 Russia 14
6 700024 Senegal 2
0 500430 Singapore 2
0 000000 Slovakia 0
0 001100 Slovenia 0
2 002103 Somalia 0
15 90211794 South Africa 12
59 58053413 Spain 3
1 003211 Sri Lanka 1
37 1702202515 Sudan 23
0 000000 Sweden 0
0 001110 Switzerland 0
44 290160149 Syria 12
0 00155147400 Taiwan 33
85 6301007036 Tajikistan 82
Foreign Agricultural Service/USDA June 2017Office of Global Analysis

(1,000 Metric Tons)
Table 06A: Cotton Supply and Distribution by Country 2016/2017 (Continued)
Area
Harvested
Ending
Stocks
ExportsLossUseImportsProductio
n
Beginning
Stocks
Country
61 2903809376 Tanzania 87
0 05256261430 Thailand 43
44 33030929 Togo 17
2 009730 Tunisia 3
697 6001,37268634587 Turkey 296
288 18501420180119 Turkmenistan 142
27 220101516 Uganda 20
0 002200 Ukraine 1
0 000000 United Kingdom 0
3,738 3,157-47182827838 United States 697
0 000000 Uruguay 0
789 32703700185257 Uzbekistan 277
19 0022353 Venezuela 5
1 001,1541,1761700 Vietnam 192
6 007024 Yemen 1
37 470104438 Zambia 33
34 173501144 Zimbabwe 18
World
23,076 8,012-3724,7277,92221,1566,413 World 19,451
Foreign Agricultural Service/USDA June 2017Office of Global Analysis

Table 09: World Cotton Supply and Distribution
(1,000 HA and 1000 480-lb. Bales)
Country Mktg
Year
Beginning
Stocks
Area
Harvested
Production Imports Total
Supply
Exports Use Loss Total Dom.
Cons.
Ending
Stocks
Stock to
Use %
World
4335,41782,27417982,09533,350151,04133,09370,35929,34747,589 1986/87
3932,60984,68053484,14630,103147,39230,52981,44630,87135,417 1987/88
3631,05085,88064285,23833,481150,41133,58284,22033,83132,609 1988/89
2924,97887,13923486,90531,357143,47432,70379,72131,69631,050 1989/90
3227,46785,69417085,52429,560142,72130,57887,16533,15324,978 1990/91
4336,96586,55636886,18828,204151,72529,02495,23434,75827,467 1991/92
4034,50486,4006386,33725,435146,33927,06782,30732,64336,965 1992/93
3327,82785,70314385,56026,620140,15027,96777,67930,71834,504 1993/94
3832,01484,292-33084,62228,118144,42430,30086,29732,25027,827 1994/95
4740,12985,396-54485,94027,396152,92127,00493,90335,92032,014 1995/96
5144,63387,351-58587,93626,777158,76128,57990,05333,74040,129 1996/97
5749,46786,686-58187,26726,777162,93025,92992,36833,79744,633 1997/98
6252,85283,651-1,11484,76523,517160,02024,48086,07332,88549,467 1998/99
5651,14090,485-60291,08727,126168,75127,97687,92332,35052,852 1999/00
5449,57090,754-1,42492,17826,156166,48026,22989,11132,01251,140 2000/01
5854,68293,636-78194,41729,081177,39929,32298,50733,71949,570 2001/02
4947,92397,618-80498,42230,400175,94130,23391,02630,77954,682 2002/03
4948,50697,134-90998,04333,152178,79234,17596,69432,26347,923 2003/04
5661,104107,955-1,245109,20034,949204,00833,985121,51735,75948,506 2004/05
5362,045115,163-1,793116,95644,922222,13044,693116,33334,50361,104 2005/06
5163,419122,528-1,715124,24337,416223,36338,305123,01334,71362,045 2006/07
5162,868121,673-2,094123,76738,918223,45939,463120,57732,88963,419 2007/08
5762,764108,820-1,536110,35630,207201,79130,623108,30030,63062,868 2008/09
4047,822119,463-62119,52535,779203,06436,916103,38430,19862,764 2009/10
4551,406115,4509115,44134,906201,76236,300117,64033,73047,822 2010/11
7274,652103,866-370104,23646,011224,52945,460127,66336,07551,406 2011/12
8592,143107,632-798108,43046,451246,22647,664123,91034,37874,652 2012/13
94103,251109,389-363109,75241,110253,75041,231120,37632,63992,143 2013/14
100111,743111,511113111,39835,305258,55936,089119,21934,215103,251 2014/15
8797,167111,26239111,22335,295243,72435,19496,78730,387111,743 2015/16
7989,338113,402-169113,57136,800239,54036,386105,98729,45497,167 2016/17
7587,706116,363-151116,51436,844240,91336,848114,72732,11789,338 2017/18
Foreign Agricultural Service/USDA June 2017Office of Global Analysis
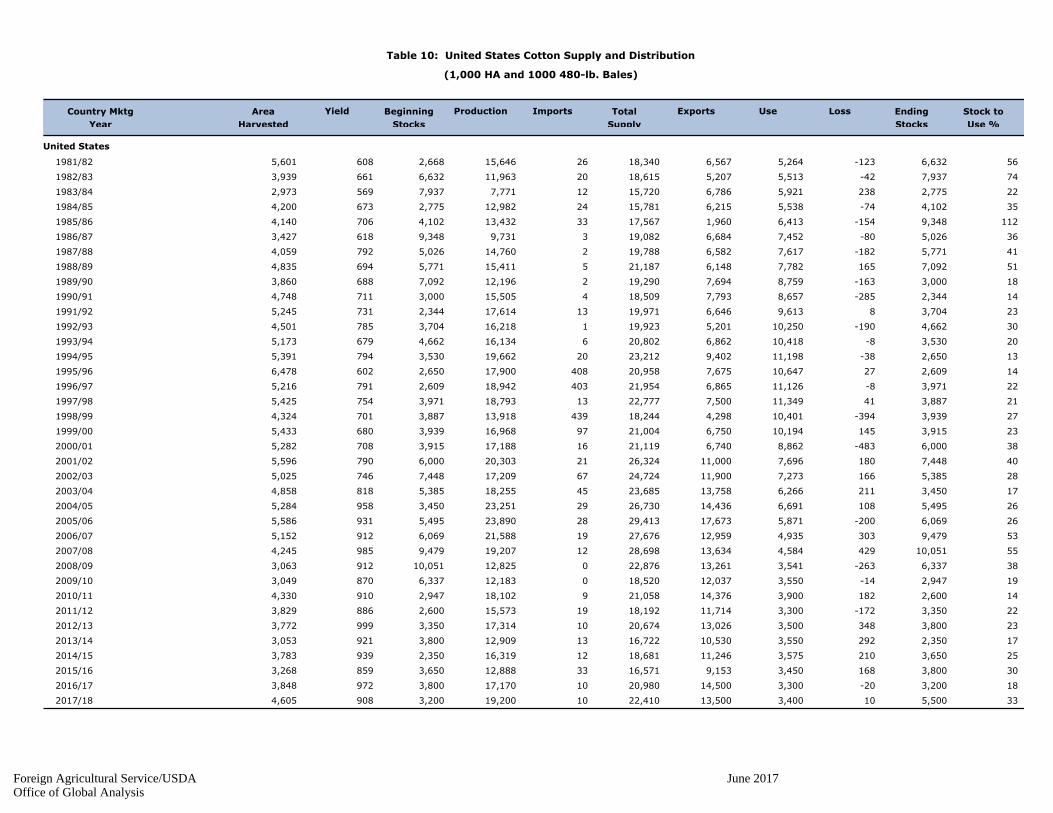
Table 10: United States Cotton Supply and Distribution
(1,000 HA and 1000 480-lb. Bales)
Country Mktg
Year
Area
Harvested
Yield Beginning
Stocks
Production Imports Total
Supply
Exports Use Loss Ending
Stocks
Stock to
Use %
United States
566,632-1235,2646,56718,3402615,6462,6686085,601 1981/82
747,937-425,5135,20718,6152011,9636,6326613,939 1982/83
222,7752385,9216,78615,720127,7717,9375692,973 1983/84
354,102-745,5386,21515,7812412,9822,7756734,200 1984/85
1129,348-1546,4131,96017,5673313,4324,1027064,140 1985/86
365,026-807,4526,68419,08239,7319,3486183,427 1986/87
415,771-1827,6176,58219,788214,7605,0267924,059 1987/88
517,0921657,7826,14821,187515,4115,7716944,835 1988/89
183,000-1638,7597,69419,290212,1967,0926883,860 1989/90
142,344-2858,6577,79318,509415,5053,0007114,748 1990/91
233,70489,6136,64619,9711317,6142,3447315,245 1991/92
304,662-19010,2505,20119,923116,2183,7047854,501 1992/93
203,530-810,4186,86220,802616,1344,6626795,173 1993/94
132,650-3811,1989,40223,2122019,6623,5307945,391 1994/95
142,6092710,6477,67520,95840817,9002,6506026,478 1995/96
223,971-811,1266,86521,95440318,9422,6097915,216 1996/97
213,8874111,3497,50022,7771318,7933,9717545,425 1997/98
273,939-39410,4014,29818,24443913,9183,8877014,324 1998/99
233,91514510,1946,75021,0049716,9683,9396805,433 1999/00
386,000-4838,8626,74021,1191617,1883,9157085,282 2000/01
407,4481807,69611,00026,3242120,3036,0007905,596 2001/02
285,3851667,27311,90024,7246717,2097,4487465,025 2002/03
173,4502116,26613,75823,6854518,2555,3858184,858 2003/04
265,4951086,69114,43626,7302923,2513,4509585,284 2004/05
266,069-2005,87117,67329,4132823,8905,4959315,586 2005/06
539,4793034,93512,95927,6761921,5886,0699125,152 2006/07
5510,0514294,58413,63428,6981219,2079,4799854,245 2007/08
386,337-2633,54113,26122,876012,82510,0519123,063 2008/09
192,947-143,55012,03718,520012,1836,3378703,049 2009/10
142,6001823,90014,37621,058918,1022,9479104,330 2010/11
223,350-1723,30011,71418,1921915,5732,6008863,829 2011/12
233,8003483,50013,02620,6741017,3143,3509993,772 2012/13
172,3502923,55010,53016,7221312,9093,8009213,053 2013/14
253,6502103,57511,24618,6811216,3192,3509393,783 2014/15
303,8001683,4509,15316,5713312,8883,6508593,268 2015/16
183,200-203,30014,50020,9801017,1703,8009723,848 2016/17
335,500103,40013,50022,4101019,2003,2009084,605 2017/18
Foreign Agricultural Service/USDA June 2017Office of Global Analysis
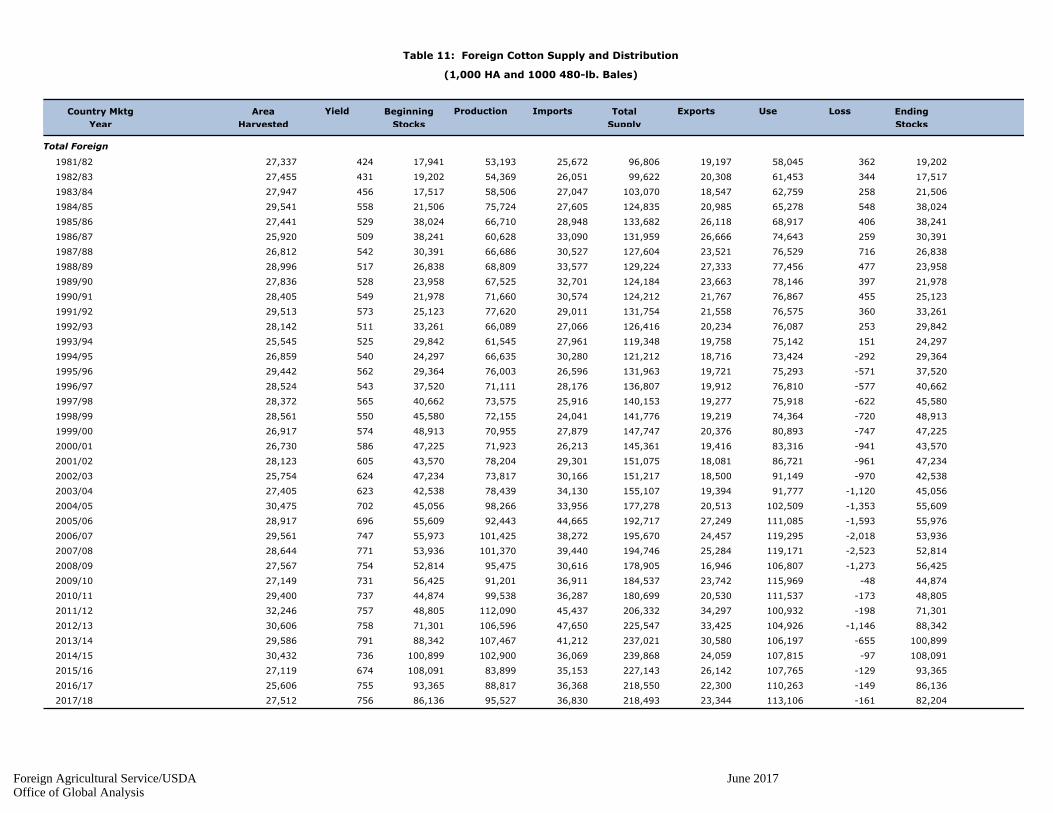
Table 11: Foreign Cotton Supply and Distribution
(1,000 HA and 1000 480-lb. Bales)
Country Mktg
Year
Area
Harvested
Yield Beginning
Stocks
Production Imports Total
Supply
Exports Use Loss Ending
Stocks
Total Foreign
19,20236258,04519,19796,80625,67253,19317,94142427,337 1981/82
17,51734461,45320,30899,62226,05154,36919,20243127,455 1982/83
21,50625862,75918,547103,07027,04758,50617,51745627,947 1983/84
38,02454865,27820,985124,83527,60575,72421,50655829,541 1984/85
38,24140668,91726,118133,68228,94866,71038,02452927,441 1985/86
30,39125974,64326,666131,95933,09060,62838,24150925,920 1986/87
26,83871676,52923,521127,60430,52766,68630,39154226,812 1987/88
23,95847777,45627,333129,22433,57768,80926,83851728,996 1988/89
21,97839778,14623,663124,18432,70167,52523,95852827,836 1989/90
25,12345576,86721,767124,21230,57471,66021,97854928,405 1990/91
33,26136076,57521,558131,75429,01177,62025,12357329,513 1991/92
29,84225376,08720,234126,41627,06666,08933,26151128,142 1992/93
24,29715175,14219,758119,34827,96161,54529,84252525,545 1993/94
29,364-29273,42418,716121,21230,28066,63524,29754026,859 1994/95
37,520-57175,29319,721131,96326,59676,00329,36456229,442 1995/96
40,662-57776,81019,912136,80728,17671,11137,52054328,524 1996/97
45,580-62275,91819,277140,15325,91673,57540,66256528,372 1997/98
48,913-72074,36419,219141,77624,04172,15545,58055028,561 1998/99
47,225-74780,89320,376147,74727,87970,95548,91357426,917 1999/00
43,570-94183,31619,416145,36126,21371,92347,22558626,730 2000/01
47,234-96186,72118,081151,07529,30178,20443,57060528,123 2001/02
42,538-97091,14918,500151,21730,16673,81747,23462425,754 2002/03
45,056-1,12091,77719,394155,10734,13078,43942,53862327,405 2003/04
55,609-1,353102,50920,513177,27833,95698,26645,05670230,475 2004/05
55,976-1,593111,08527,249192,71744,66592,44355,60969628,917 2005/06
53,936-2,018119,29524,457195,67038,272101,42555,97374729,561 2006/07
52,814-2,523119,17125,284194,74639,440101,37053,93677128,644 2007/08
56,425-1,273106,80716,946178,90530,61695,47552,81475427,567 2008/09
44,874-48115,96923,742184,53736,91191,20156,42573127,149 2009/10
48,805-173111,53720,530180,69936,28799,53844,87473729,400 2010/11
71,301-198100,93234,297206,33245,437112,09048,80575732,246 2011/12
88,342-1,146104,92633,425225,54747,650106,59671,30175830,606 2012/13
100,899-655106,19730,580237,02141,212107,46788,34279129,586 2013/14
108,091-97107,81524,059239,86836,069102,900100,89973630,432 2014/15
93,365-129107,76526,142227,14335,15383,899108,09167427,119 2015/16
86,136-149110,26322,300218,55036,36888,81793,36575525,606 2016/17
82,204-161113,10623,344218,49336,83095,52786,13675627,512 2017/18
Foreign Agricultural Service/USDA June 2017Office of Global Analysis