Embed Size (px)
Citation preview
`
Costing and Analysis of Transfer Levels for
The Malawi Social Cash Transfer Programme
Ronald Mangani
Robert White
April 2012
Acknowledgements
This study was conducted for the Government of Malawi with financial support from UNICEF Malawi.
The authors sincerely appreciate the close guidance and support provided by Harry Mwamlima (Director,
Division of Poverty Reduction and Social Protection, in the Ministry of Economic Planning and
Development) and Maki Kato, Chief of Social Police at UNICEF Malawi. The technical guidance provided
by staff of the Division (especially Tom Mtenje and Imran Nedi) as well as staff at UNICEF Malawi
(especially Sophie Shawa and Tayllor Renee Spadafora) is gratefully acknowledged.
The authors would like to extend their thanks to all individuals and organisations consulted during the
course of the study. A full list of the people consulted is provided in Annexes to the report.
The views expressed in this report are those of the authors and do not necessarily represent the views of the
Government of Malawi or UNICEF Malawi
1
Acronyms and Abbreviations
AIDS - Acquired Immuno Deficiency Syndrome
CCT - Conditional Cash Transfers
CRC - Convention on the Rights of the Child
CSSC - Community Social Support Committee
EU - European Union
FGD - Focus Group Discussions
FISP - Farm Input Subsidy Programme
GDP - Gross Domestic Product
GMI - Guaranteed Minimum Income
GoM - Government of Malawi
HIV - Human Immune Virus
IHS - Integrated Household Survey
K - Malawi kwacha
KII - Key Informant Interviews
KfW - Kreditanstalt für Wiederaufbau (Reconstruction Credit Institute of Germany)
MASAF - Malawi Social Action Fund
MDG - Millennium Development Goals
MGDS - Malawi Growth and Development Strategy
MK - Malawi Kwacha
MPVA - Malawi Poverty and Vulnerability Assessment
NAC - National AIDS Commission
NSNP - National Safety Net Programme
NSSP - National Social Support Programme
PN - Perceived Needs
PPP - Purchasing Power Parity
PRSP - Poverty Reduction Strategy Paper
PWP - Public Works Programme
SB - Subsistence Basket
SCT - Social Cash Transfer
SCTP - Social Cash Transfer Programme
$ - United States dollar
UNICEF - United Nations Children Education Fund
USD - United States Dollars
WFP - World Food Programme
WMS - Welfare Monitoring Survey
2
Contents
Acknowledgements ..............................................................................................................................
Acronyms and Abbreviations ............................................................................................................. 1
Contents .............................................................................................................................................. 2
Executive Summary ........................................................................................................................... 4
1. Introduction ................................................................................................................................ 7
1.1 Background ...................................................................................................................... 7
1.2 Purpose and Scope of the Study....................................................................................... 8
1.3 Methodologies.................................................................................................................. 8
1.4 Study Limitations ............................................................................................................. 9
1.5 Organisation of the Report ............................................................................................... 9
2. A Contextual Background of the Malawi SCTP ...................................................................... 10
2.1 Poverty and Vulnerabilities in Malawi .......................................................................... 10
2.2 Consequences and Impacts of Poverty .......................................................................... 11
2.3 Interventions and Intervention Linkages ....................................................................... 11
2.4 The Policy and Regulatory Environment ....................................................................... 12
3. National Poverty Profile and SCTP Beneficiary Targeting ..................................................... 14
3.1 Measures of Poverty in Malawi ..................................................................................... 14
3.2 Beneficiary Targeting in the SCTP ................................................................................ 15
3.3 Determination of Target Beneficiary Households ......................................................... 16
4. Determination of Cash Transfer Levels ................................................................................... 19
4.1 The Literature................................................................................................................. 19
4.2 Appraisal of the determination of the current SCTP transfer levels .............................. 20
4.3 Alternative Transfer Level Determination Procedures .................................................. 23
4.4 Comparisons and Propositions ....................................................................................... 27
4.5 Revision of Transfer Levels ........................................................................................... 30
5. Cost Implications...................................................................................................................... 32
5.1 Introduction .................................................................................................................... 32
5.2 Assumptions ................................................................................................................... 33
5.3 Costing Outcomes .......................................................................................................... 33
5. Conclusion ................................................................................................................................ 35
3
Tables
Table 1: SCTP Beneficiary Chart – August 2011 8
Table 2: Gender Categories for Key Informants 9
Table 3: Age Categories of the Beneficiary Key Informants 9
Table 4: Incidence of Poverty in Malawi (2004 – 2009) 15
Table 5: Estimates of Beneficiary Households Per District 18
Table 6: Calculating Malawi SCTP Generosity in Terms of the Ultra-Poverty Line 20
Table 7: Transfers Levels Proposed by the GoM (2010) 22
Table 8: US Dollar-Stable Transfers 23
Table 9: US Dollar-Stable Transfers after Devaluation 24
Table 10: Inflation-Adjusted Transfers 24
Table 11: IHS Ultra-Poverty Gap Transfer Levels 24
Table 12: Cost of the Monthly Subsistence Basket at 2012 Prices 26
Table13: Cost of Perceived Needs per Month 26
Table 14: Desired Transfer Levels by Current Beneficiaries 27
Table 15: Convergence between Large and Small Transfers 29
Table 16: Transfer Levels Proposed by the IHS Ultra-poverty Gap Plus 10% Methodology 30
Table 17: Summary of Costing Outcomes 34
Figures
Figure 1: Derived Monthly Transfer Levels for the Largest Household 28
Figure 2: The Proposed Transfer Level Determination Tool 31
Figure 3: Cash Transfer Costs in 12 Countries 35
Boxes
Box 1: Data Improvements and SCTP Beneficiary Targeting 18
Box 2: Education-Related Expenses in Public Schools 30
Annexes
Annex 1: References 37
Annex 2: List of National Level Key Informants 39
Annex 3: List of Key Informants at District Level 40
Annex 4: List of FGD Participants 41
Annex 5: Guiding Questions for National Level Consultations 42
Annex 6: Questionnaire for Beneficiaries – Field Work 44
Annex 7: Guiding Questions for FGD 47
Annex 8: Incidence of Poverty by District (% of population) 49
Annex 9: Targeting Methods 50
Annex 10: Monthly Cost Implications of Transfer Level Determination Approaches (kwacha) 51
Annex 11: Annual Cost Implications of Transfer Level Determination Approaches (kwacha) 55
Annex 12: Annual Cost Implications of Transfer Level Determination Approaches (kwacha) 60
4
Executive Summary
This study on the costing and analysis of transfer levels for the Malawi Social Cash Transfer Programme
(SCTP) was commissioned by UNICEF Malawi on behalf of the Government of Malawi. The study
accomplishes three main things summarised in this report, as follows. First, it formalises the framework for
determining the target number of beneficiary household of the SCTP, and presents such estimated for 2012.
Second, it explores and appraises the various methodologies for determining transfer levels, and
recommends an appropriate tool for revising the transfer levels in the programme which is easy, flexible
and relatively prudent in terms of its demand on public resources. Finally, the study estimates the monthly
and annual direct costs implied by the various transfer level determination frameworks.
The main recommendations and implications of this analysis are as follows:
I. The determination of target beneficiary households in each district should be based on the following
general procedure:
a. Calculate the intercensal (1998 – 2008) annual growth rate in the number of households for each
district by iteratively solving for r in:
10
9808 1 rPP
where P08 = number of households in the district in 2008
P98 = number of households in the district in 1998.
b. Compound the total number of households per district in 2008 at the rate of r, to obtain an estimate
of the number of households per district in 2012.
c. Sum up the numbers of households per district to obtain the estimated total number of households
in Malawi in 2012.
d. Calculate the estimated total number of beneficiary households in 2012 as 10% of the estimated
total number of households in Malawi in 2012, in line with the SCTP design.
e. Calculate the number of ultra-poor households per district by multiplying each district‟s ultra-
poverty headcount ratio by the estimated number of households in the district.
f. Sum up the numbers of ultra-poor households in all districts to obtain the total number of ultra-poor
households in Malawi.
g. Obtain each district‟s share of ultra-poor households by dividing each district‟s number of ultra-
poor households by the national number of ultra-poor households.
h. Obtain the number of beneficiary households per district by multiplying each district‟s share of
ultra-poor households by the total number of beneficiaries in Malawi.
In order to improve the framework for determining beneficiary households, it is recommended that the
National Statistical Office should readily supply the following data in standard reports:
a. intercensal growth in the numbers of households per district,
b. ultra-poverty headcount ratios per district per annum, and
c. labour-constrained and non-labour-constrained ultra-poor households per district per annum.
5
II. The revision of cash transfer levels should be based on the IHS ultra-poverty gap approach. The
following transfer level determination tool should be used:
a. Step 1: Determine the ultra-poverty gap. This is the difference between the nominal ultra-poverty
line for the poorest household of a given size, and the average expenditure by the poorest segment
of the population.
b. Step 2: Adjust the ultra-poverty gap for inflation. The rural annual headline inflation rates for the
period between the latest IHS period and the current period should be applied. Previous year
inflation should be used to adjust the previous year ultra-poverty gap to obtain the current year‟s
ultra-poverty gap.
c. Step 3: Increase the inflation-adjusted ultra-poverty gap by a basic non-food expenditures inflator
of 10%. The result obtained at this stage becomes the transfer level payable to the largest household
of at least four members.
d. Step 4: Adjust other transfer levels based on household size by pre-determined growth rates:
Assuming that the transfer to the largest household increased g kwacha between two periods, adjust
transfer levels due to smaller households by the following constants (rounded up accordingly):
One-person household: increase by (g×0.7) kwacha
Two-person household: increase by (g×0.8 ) kwacha
Three-person household: increase by (g×0.9) kwacha
Four-person plus household: increase by g kwacha
e. Step 5: Set the primary school bonus. This should be equal to one-third of the new transfer level
payable to the one-person household.
f. Step 6: Set the secondary school bonus. This should be equal to double the primary school bonus.
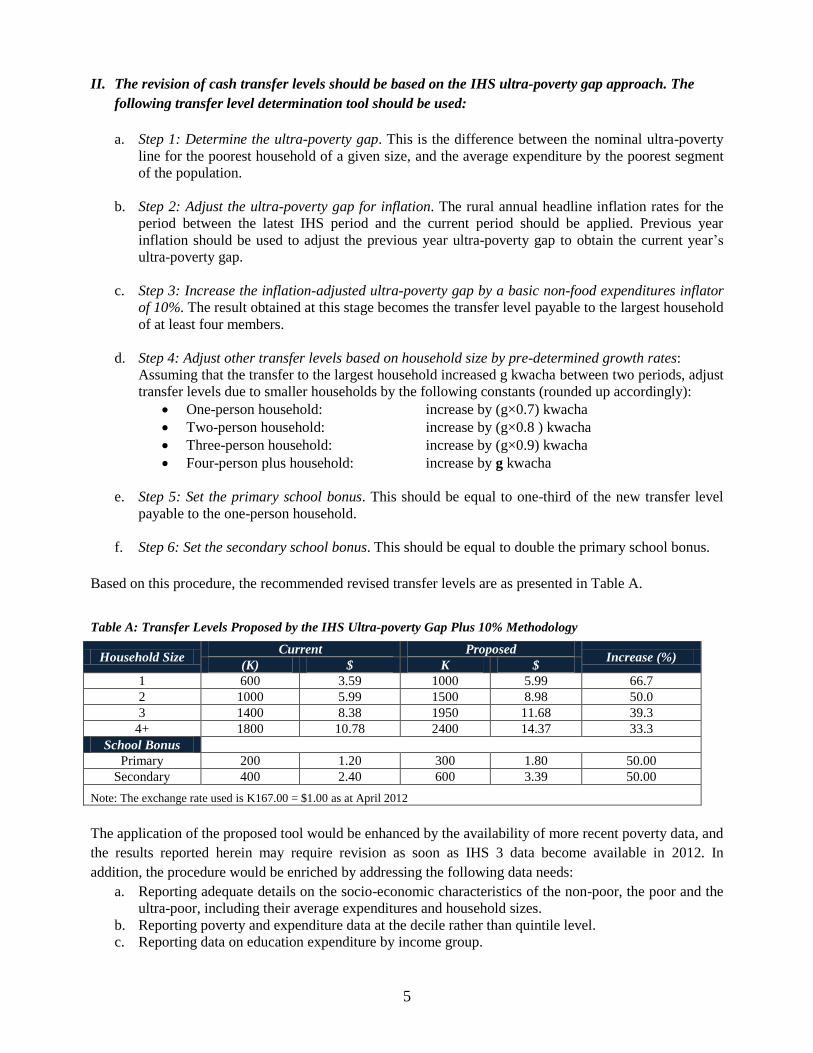
Based on this procedure, the recommended revised transfer levels are as presented in Table A.
Table A: Transfer Levels Proposed by the IHS Ultra-poverty Gap Plus 10% Methodology
Household Size Current Proposed
Increase (%) (K) $ K $
1 600 3.59 1000 5.99 66.7
2 1000 5.99 1500 8.98 50.0
3 1400 8.38 1950 11.68 39.3
4+ 1800 10.78 2400 14.37 33.3
School Bonus
Primary 200 1.20 300 1.80 50.00
Secondary 400 2.40 600 3.39 50.00
Note: The exchange rate used is K167.00 = $1.00 as at April 2012
The application of the proposed tool would be enhanced by the availability of more recent poverty data, and
the results reported herein may require revision as soon as IHS 3 data become available in 2012. In
addition, the procedure would be enriched by addressing the following data needs:
a. Reporting adequate details on the socio-economic characteristics of the non-poor, the poor and the
ultra-poor, including their average expenditures and household sizes.
b. Reporting poverty and expenditure data at the decile rather than quintile level.
c. Reporting data on education expenditure by income group.
6
III. Conduct annual reviews of transfer levels.
Apart from ensuring responsiveness to changes, annual reviews have the advantage that costs are likely
to adjust slowly from year to year, especially when rural inflation remains low.
If the application of the adjustment tool in a given review period results in an adjustment of less than
5% to the prevailing transfer due the largest household, it is our view that the transfer levels need not be
revised in that period.
IV. The direct cost implications of these recommendations as at April 2012 are as follows:
a. A national programme roll-out based on the current transfer levels would cost K638.22 million
($3.82 million) per month, or K7.66 billion ($45.9 million) per annum in direct costs.
b. A national programme roll-out based on the proposed ultra-poverty gap plus 10% approach would
cost K861.59 million ($5.16 million) per month, and K10.34 billion ($61.91 million) per annum in
direct costs.
c. Therefore, implementation of the proposed transfer level determination tool would cost 35% more
than the current framework at today‟s prices. Given the objectives and design of the SCTP, this is
appears to be the most cost-effective of the procedures explored in the study.
d. Additionally, the direct costs due to the proposed approach would be 3.45% of the current Malawi
Government Budget, and 1.04% of GDP. These are lower than figures reported for other
developing countries, notwithstanding that the SCTP is only one of several other public social
security programmes being implemented in Malawi.
7
1. Introduction
1.1 Background
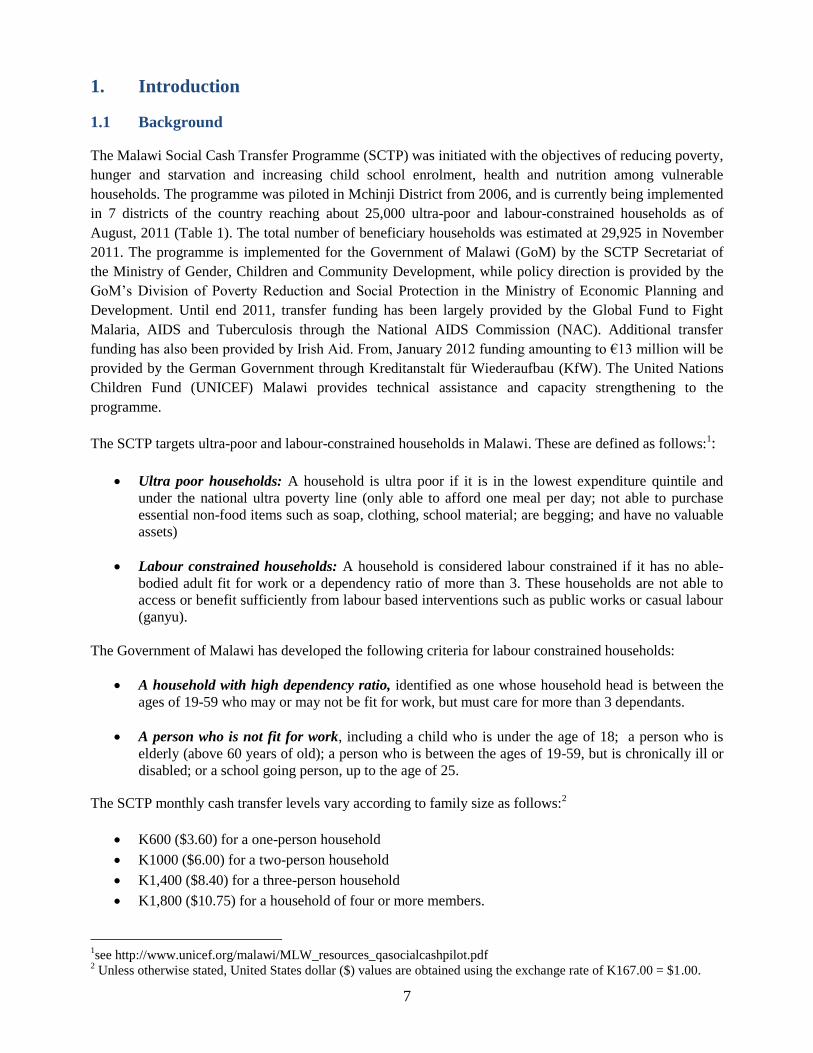
The Malawi Social Cash Transfer Programme (SCTP) was initiated with the objectives of reducing poverty,
hunger and starvation and increasing child school enrolment, health and nutrition among vulnerable
households. The programme was piloted in Mchinji District from 2006, and is currently being implemented
in 7 districts of the country reaching about 25,000 ultra-poor and labour-constrained households as of
August, 2011 (Table 1). The total number of beneficiary households was estimated at 29,925 in November
2011. The programme is implemented for the Government of Malawi (GoM) by the SCTP Secretariat of
the Ministry of Gender, Children and Community Development, while policy direction is provided by the
GoM‟s Division of Poverty Reduction and Social Protection in the Ministry of Economic Planning and
Development. Until end 2011, transfer funding has been largely provided by the Global Fund to Fight
Malaria, AIDS and Tuberculosis through the National AIDS Commission (NAC). Additional transfer
funding has also been provided by Irish Aid. From, January 2012 funding amounting to €13 million will be
provided by the German Government through Kreditanstalt für Wiederaufbau (KfW). The United Nations
Children Fund (UNICEF) Malawi provides technical assistance and capacity strengthening to the
programme.
The SCTP targets ultra-poor and labour-constrained households in Malawi. These are defined as follows:1:
Ultra poor households: A household is ultra poor if it is in the lowest expenditure quintile and
under the national ultra poverty line (only able to afford one meal per day; not able to purchase
essential non-food items such as soap, clothing, school material; are begging; and have no valuable
assets)
Labour constrained households: A household is considered labour constrained if it has no able-
bodied adult fit for work or a dependency ratio of more than 3. These households are not able to
access or benefit sufficiently from labour based interventions such as public works or casual labour
(ganyu).
The Government of Malawi has developed the following criteria for labour constrained households:
A household with high dependency ratio, identified as one whose household head is between the
ages of 19-59 who may or may not be fit for work, but must care for more than 3 dependants.
A person who is not fit for work, including a child who is under the age of 18; a person who is
elderly (above 60 years of old); a person who is between the ages of 19-59, but is chronically ill or
disabled; or a school going person, up to the age of 25.
The SCTP monthly cash transfer levels vary according to family size as follows:2
K600 ($3.60) for a one-person household
K1000 ($6.00) for a two-person household
K1,400 ($8.40) for a three-person household
K1,800 ($10.75) for a household of four or more members.
1see http://www.unicef.org/malawi/MLW_resources_qasocialcashpilot.pdf
2 Unless otherwise stated, United States dollar ($) values are obtained using the exchange rate of K167.00 = $1.00.
8
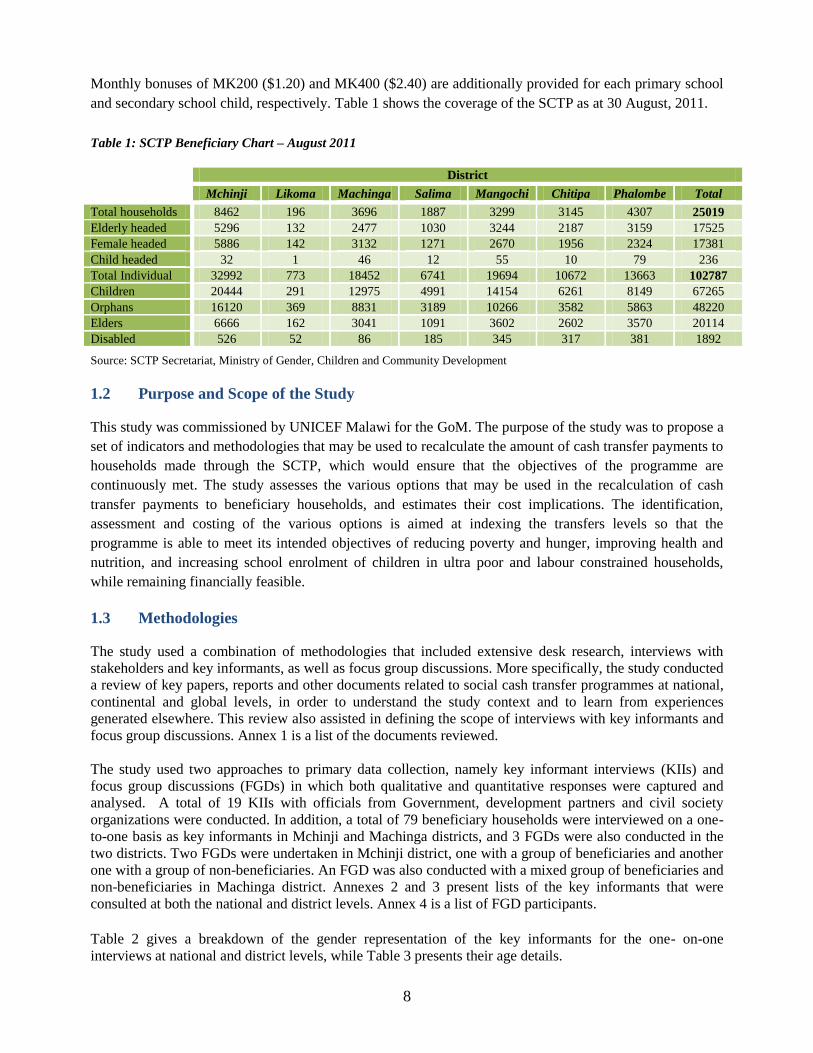
Monthly bonuses of MK200 ($1.20) and MK400 ($2.40) are additionally provided for each primary school
and secondary school child, respectively. Table 1 shows the coverage of the SCTP as at 30 August, 2011.
Table 1: SCTP Beneficiary Chart – August 2011
District
Mchinji Likoma Machinga Salima Mangochi Chitipa Phalombe Total
Total households 8462 196 3696 1887 3299 3145 4307 25019
Elderly headed 5296 132 2477 1030 3244 2187 3159 17525
Female headed 5886 142 3132 1271 2670 1956 2324 17381
Child headed 32 1 46 12 55 10 79 236
Total Individual 32992 773 18452 6741 19694 10672 13663 102787
Children 20444 291 12975 4991 14154 6261 8149 67265
Orphans 16120 369 8831 3189 10266 3582 5863 48220
Elders 6666 162 3041 1091 3602 2602 3570 20114
Disabled 526 52 86 185 345 317 381 1892
Source: SCTP Secretariat, Ministry of Gender, Children and Community Development
1.2 Purpose and Scope of the Study
This study was commissioned by UNICEF Malawi for the GoM. The purpose of the study was to propose a
set of indicators and methodologies that may be used to recalculate the amount of cash transfer payments to
households made through the SCTP, which would ensure that the objectives of the programme are
continuously met. The study assesses the various options that may be used in the recalculation of cash
transfer payments to beneficiary households, and estimates their cost implications. The identification,
assessment and costing of the various options is aimed at indexing the transfers levels so that the
programme is able to meet its intended objectives of reducing poverty and hunger, improving health and
nutrition, and increasing school enrolment of children in ultra poor and labour constrained households,
while remaining financially feasible.
1.3 Methodologies
The study used a combination of methodologies that included extensive desk research, interviews with
stakeholders and key informants, as well as focus group discussions. More specifically, the study conducted
a review of key papers, reports and other documents related to social cash transfer programmes at national,
continental and global levels, in order to understand the study context and to learn from experiences
generated elsewhere. This review also assisted in defining the scope of interviews with key informants and
focus group discussions. Annex 1 is a list of the documents reviewed.
The study used two approaches to primary data collection, namely key informant interviews (KIIs) and
focus group discussions (FGDs) in which both qualitative and quantitative responses were captured and
analysed. A total of 19 KIIs with officials from Government, development partners and civil society
organizations were conducted. In addition, a total of 79 beneficiary households were interviewed on a one-
to-one basis as key informants in Mchinji and Machinga districts, and 3 FGDs were also conducted in the
two districts. Two FGDs were undertaken in Mchinji district, one with a group of beneficiaries and another
one with a group of non-beneficiaries. An FGD was also conducted with a mixed group of beneficiaries and
non-beneficiaries in Machinga district. Annexes 2 and 3 present lists of the key informants that were
consulted at both the national and district levels. Annex 4 is a list of FGD participants.
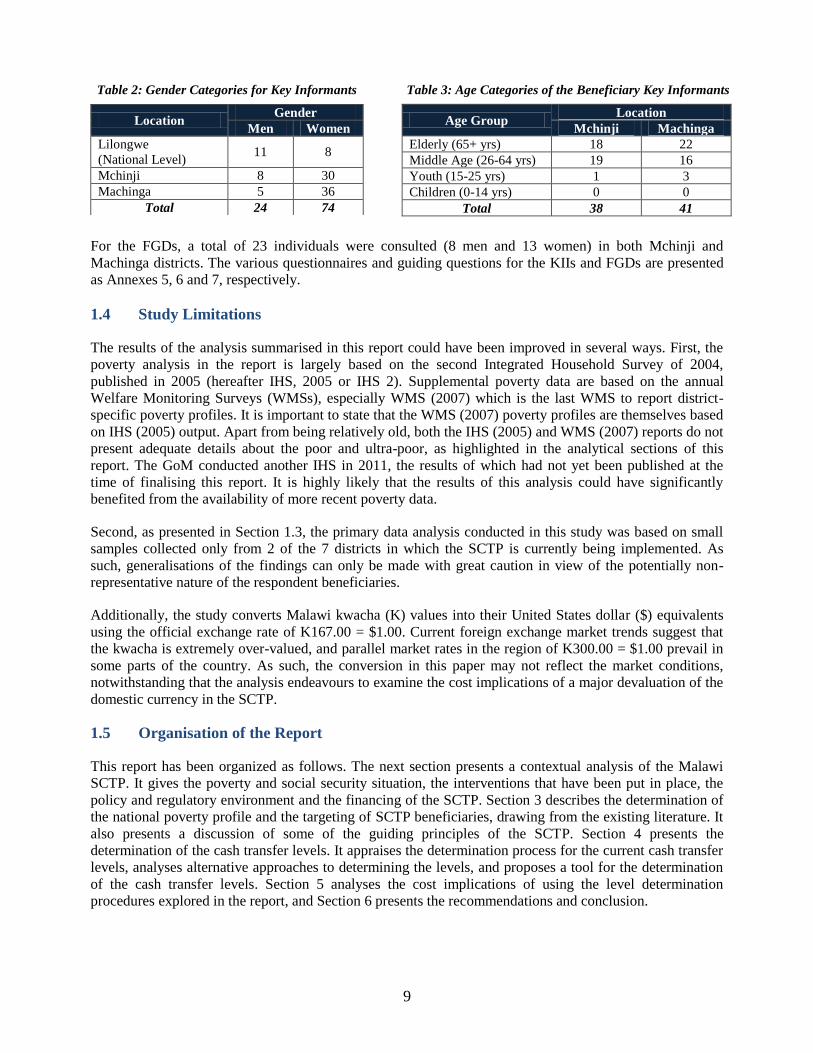
Table 2 gives a breakdown of the gender representation of the key informants for the one- on-one
interviews at national and district levels, while Table 3 presents their age details.
9
Table 2: Gender Categories for Key Informants
Table 3: Age Categories of the Beneficiary Key Informants
Location Gender
Men Women
Lilongwe
(National Level) 11 8
Mchinji 8 30
Machinga 5 36
Total 24 74
Age Group
Location
Mchinji Machinga
Elderly (65+ yrs) 18 22
Middle Age (26-64 yrs) 19 16
Youth (15-25 yrs) 1 3
Children (0-14 yrs) 0 0
Total 38 41
For the FGDs, a total of 23 individuals were consulted (8 men and 13 women) in both Mchinji and
Machinga districts. The various questionnaires and guiding questions for the KIIs and FGDs are presented
as Annexes 5, 6 and 7, respectively.
1.4 Study Limitations
The results of the analysis summarised in this report could have been improved in several ways. First, the
poverty analysis in the report is largely based on the second Integrated Household Survey of 2004,
published in 2005 (hereafter IHS, 2005 or IHS 2). Supplemental poverty data are based on the annual
Welfare Monitoring Surveys (WMSs), especially WMS (2007) which is the last WMS to report district-
specific poverty profiles. It is important to state that the WMS (2007) poverty profiles are themselves based
on IHS (2005) output. Apart from being relatively old, both the IHS (2005) and WMS (2007) reports do not
present adequate details about the poor and ultra-poor, as highlighted in the analytical sections of this
report. The GoM conducted another IHS in 2011, the results of which had not yet been published at the
time of finalising this report. It is highly likely that the results of this analysis could have significantly
benefited from the availability of more recent poverty data.
Second, as presented in Section 1.3, the primary data analysis conducted in this study was based on small
samples collected only from 2 of the 7 districts in which the SCTP is currently being implemented. As
such, generalisations of the findings can only be made with great caution in view of the potentially non-
representative nature of the respondent beneficiaries.
Additionally, the study converts Malawi kwacha (K) values into their United States dollar ($) equivalents
using the official exchange rate of K167.00 = $1.00. Current foreign exchange market trends suggest that
the kwacha is extremely over-valued, and parallel market rates in the region of K300.00 = $1.00 prevail in
some parts of the country. As such, the conversion in this paper may not reflect the market conditions,
notwithstanding that the analysis endeavours to examine the cost implications of a major devaluation of the
domestic currency in the SCTP.
1.5 Organisation of the Report
This report has been organized as follows. The next section presents a contextual analysis of the Malawi
SCTP. It gives the poverty and social security situation, the interventions that have been put in place, the
policy and regulatory environment and the financing of the SCTP. Section 3 describes the determination of
the national poverty profile and the targeting of SCTP beneficiaries, drawing from the existing literature. It
also presents a discussion of some of the guiding principles of the SCTP. Section 4 presents the
determination of the cash transfer levels. It appraises the determination process for the current cash transfer
levels, analyses alternative approaches to determining the levels, and proposes a tool for the determination
of the cash transfer levels. Section 5 analyses the cost implications of using the level determination
procedures explored in the report, and Section 6 presents the recommendations and conclusion.
10
2. A Contextual Background of the Malawi SCTP
2.1 Poverty and Vulnerabilities in Malawi
The WMS (2009), the Malawi Poverty and Vulnerability Assessment (2007) and the IHS (2005) are the
most recent sources of information on the poverty levels in the country. The WMS and the IHS define a
household as poor if its annual per capita consumption expenditure is below a threshold or a poverty line.
The poverty line is a subsistence minimum expressed in Malawi kwacha based on a cost of basic needs
methodology which has two parts: (a) minimum food expenditure based on the food requirements of an
individual, and (b) critical non-food consumption. Individuals or households whose consumption is lower
than the total poverty line are defined as poor, while those whose total expenditure falls short of that
necessary to meet the minimum food requirements are categorized as ultra-poor. This process provides an
absolute measure of poverty where the poverty and ultra-poverty lines were respectively established as
K16,165 and K10,029 per person per year in 2004 (IHS, 2005).
According to the WMS (2009), the proportion of the population living below the poverty line in Malawi
fell from 52.4% in 2004 (IHS, 2005) to about 39% in 2009. The ultra-poor and moderately poor proportions
were estimated at 15% and 25% respectively in 2009. The proportion of the ultra-poor in Malawi declined
in the period 2004 - 2009 from 22% (IHS, 2005) to 15% (WMS, 2009).
Poverty is dynamic, with individuals and households shifting frequently from one category to another. This
could be due to a harvest shock which can tip large numbers of the non-poor into poverty. In order to
understand poverty in Malawi, it is also important to understand how vulnerability has contributed to the
poverty dynamics. Vulnerability is defined as the inability of households to deal with shocks to their
livelihoods. The following are the key vulnerabilities affecting Malawians at national level:
1. Agricultural vulnerabilities that are caused by erratic rainfall, shortage of land for agricultural
production, limited access to farm inputs and credit, and lack of livestock as assets.
2. Economic shocks and processes resulting from undiversified livelihoods, weak markets, interaction
between transitory shocks and chronic poverty.
3. Demographic vulnerabilities due to high population growth, increasing number of households
headed by women, children and the elderly.
4. Health and nutrition risks including HIV and AIDS
According to the GoM (2011), there are two main causes of poverty in Malawi, namely:
Limited livelihood sources where most households earn their livelihood only from their household
farm and fishing. However, the average household farm sizes are declining with population
increase and with declining agricultural productivity caused by deteriorating soil fertility, among
other factors. In addition, over-fishing is causing declining catches and affecting the earnings from
the fish. Seasonality in time use is another factor that is contributing to poor livelihood because of
the substantial underemployment of the people for most of the year. Poor infrastructure is another
factor that is adversely affecting access to centres of economic activities such as markets hence
leading to limited livelihood sources.
Pervasive risks and high vulnerability to shocks which include rainfall and food price variability
and volatility in space and time, illnesses and deaths. Frequent and widespread existence of shocks
results into large movements into and out of poverty in Malawi. Most households have limited ex
ante strategies to mitigate risks due to lack of access to financial services and poorly functioning
food markets which place a premium on staple production. Households are therefore forced to
11
resort to ex-post coping mechanisms which often deplete household assets and entail permanent
damage to the household‟s ability to engage in productive activities.
In addition to the above two factors, overdependence on rain fed agriculture and limited access to farm
inputs and produce markets have compounded the poverty situation in the country. The Malawi Poverty
and Vulnerability Assessment (GoM/World Bank, 2007) reported that poverty in Malawi manifests itself
through the following: high mortality rates; low life expectancy; and malnutrition. Low school attainment
and poor health and nutritional status during childhood are other major causes of poverty in Malawi.
Although poverty is widespread in Malawi, it is more concentrated in the rural areas and in the southern
region of the country.
2.2 Consequences and Impacts of Poverty
Individuals and households caught up in poverty often face a multitude of problems which have dire
consequences on their livelihoods. Often times the consequences of poverty are pervasive and mutually
reinforcing in that the many effects of poverty lead into its persistence. In Malawi, the poor lack and have
limited access to social and economic services such as health, education, water and sanitation, and food
security. They face high disease burden due to common illnesses such as malaria, diarrhoea, as well as HIV
and AIDS related illnesses. This leads to loss of wellbeing due to loss of productivity from the illnesses
and/or from taking care of the sick. The resultant deaths cause loss of human capital. Children from poor
households tend to have no or limited access to education, which affects their future development and the
earning potential of the households, leading to a vicious cycle of intergenerational poverty.
The level of poverty influences the nutritional status of individuals and households. Extremely poor
households are more likely to suffer from chronic and acute malnutrition due to constant exposure to
hunger and food insecurity. Malnutrition leads to reduced immunity, resulting into increased risk of
morbidity and mortality. Malnutrition also leads to reduced mental and physical development of children,
resulting in poor performance in schools and, therefore, low academic and professional achievements. It is
estimated that productivity losses due to disease, death and reduced earnings potential caused by low
academic achievement will cost Malawi about $446 million between 2006 and 2015 (GoM, 2011).
In Malawi, most poor households earn their livelihoods from on-farm employment. However, with limited
access to land, declining productivity of the land, effects of climate change and environmental degradation,
as well as depressed crop prices and substantial underemployment due to seasonality of the agricultural
sector, there is a substantial proportion of the population which still remains cut off from major economic
activity and livelihood opportunities. From desperation and lack of viable sources of livelihoods, people
that are trapped in poverty engage in coping strategies that are further destructive and harmful to their
livelihoods and the external environment such as selling productive assets, violent crime, prostitution,
burning charcoal, brewing illicit alcoholic beverages and child labour - strategies that exacerbate poverty
in the long term.
2.3 Interventions and Intervention Linkages
Social protection in Malawi is defined in the context of social support which includes all public and private
initiatives that provide income or consumption transfers to the poor, protect the vulnerable against
livelihood risks, and enhance social status and rights of the marginalized. The overall objective is to reduce
ultra-poverty as well as the economic and social vulnerability of poor and marginalized groups (GoM,
2009). The social protection instruments in Malawi are categorized into the following: direct welfare
instruments, productivity enhancing instruments, market interventions and transformative policy changes
(Chirwa, 2010). These can be looked at as a package that is used to target the poor and ultra poor
individuals and households, in order to address their livelihood needs.
12
2.3.1 Direct Welfare Programmes
Direct welfare instruments in Malawi include both conditional and unconditional cash transfers,
supplementary feeding programmes and food aid. There are currently two direct welfare schemes in
Malawi at various levels, as follows:
The SCTP implemented by the GoM at local council levels as described in Section 1 of this report.
The Supplementary Feeding Programmes, particularly the school feeding programmes
implemented in various districts of the country by the Ministry of Education with support from the
World Food Programme (WFP), Mary Meals, Millennium Village Project Zomba and Land O‟
Lakes. These are aimed at improving school enrolment, attendance, retention and the nutrition
status of children of school going age. The WFP‟s School Meals Programme started in 1999 as a
pilot in one district and is currently being implemented in thirteen districts in the southern and
central regions of the country. Mary Meals School Feeding Programme started in 2000 and it
targets districts that are not targeted by the WFP‟s School Feeding Programme.
2.3.2 Productivity Enhancing Programmes
These are Public Works Programmes (PWPs) and Agricultural Subsidy Programmes implemented by the
GoM with support from development partners. Examples of the Productivity Enhancing Programmes in
Malawi include the following:
Public Works Programmes where individuals and households with labor are engaged in various
public works initiatives, and earn income for their labor. An example is the Local Development
Fund Public Works programme (formerly known as MASAF PWP) implemented through local
councils with support from the World Bank. This is a safety net for poor households as a cash
transfer strategy through labor intensive public works that create employment. The main activities
include rehabilitation and construction of economic infrastructures. Another example is the Income
Generating Public Works Programme supported by the European Union, whose main aim is to
achieve durable poverty alleviation and food security by improving the overall socio-economic
status of households through such initiatives as addressing lack of accessibility to rural areas;
developing sustainable fuel wood and timber supplies; improving dry season gardening and
providing an alternative to the distribution of food to needy communities and to replace these food
handouts with projects and activities that enable communities to achieve longer term food security
(Chirwa, 2010).
Farm Input Subsidy Programme (FISP) which aims at promoting access to and use of farm inputs
(mostly fertilizers and improved seed) among smallholder farmers, in order to increase agricultural
productivity. The FISP is largely financed by the GoM with support from development partners
especially through the purchase of improved seed, and the main objective of FISP is to achieve
household food self sufficiency and increased income through increased food and cash crop
production.
2.4 The Policy and Regulatory Environment
The GoM, with support from development partners, developed the National Safety Net Strategy in 2000
and the National Safety Nets Programme (NSNP) in 2001 within the context of the Vision 2020 and the
Poverty Reduction Strategy Paper (PRSP) developed in 2002 to address chronic poverty and vulnerability.
The key objective of the NSNP was to reduce poverty and vulnerability of the poor and most vulnerable
sections of the Malawi society, and it comprised the following sub programmes: Public Works Programme,
Targeted Nutrition Programme, Targeted Inputs Programme, and Direct Welfare Transfer Programme
(GoM, 2011). Implementation of the NSNP faced a number of challenges including poor coordination,
13
inadequate funding, programme design and capacity limitations, and lack of policy guidelines for
implementation of interventions.
Given these challenges, the GoM, in consultation with stakeholders, shifted focus from addressing poverty
and vulnerabilities through safety nets to the social support approach. This change culminated into the
inclusion of the Social Protection and Disaster Risk Reduction theme into the first Malawi Growth and
Development Strategy (MGDS I), a second generation PRSP which was formulated for the period 2006 -
2011. The GoM is also in the process of finalizing the National Social Support Policy whose aim is to
facilitate the implementation of public and private programmes that will provide income or consumption
transfers, protect against vulnerability and enhance the social status and rights of the ultra-poor and the
moderately poor. The policy is yet to be adopted for implementation by Cabinet. In order to support the
implementation of the National Social Protection Policy, the GoM developed the National Social Support
Programme 2011 – 2016 (NSSP) in 2011. The NSSP has the purpose of guiding all social support
stakeholders, including Government, civil society and faith based organizations, the private sector as well
as development partners in championing government priorities on social support. Specifically, the NSSP is
aimed at achieving the following:
Defining key strategies to improve the socio-economic status of the poor and vulnerable.
Providing reference guidelines to all stakeholders in the design, implementation and monitoring of
social support programmes.
Providing guidelines for cost effective, predictable and sustainable interventions to the benefit of
beneficiaries, implementers and financiers.
Establishing an institutional framework with the mandate to initiate, coordinate, implement,
monitor and evaluate social support programmes.
The development and envisaged implementation of the NSSP has strong linkages with other national
economic and social policies and with disaster risk reduction strategies, including the following: the revised
National HIV and AIDS Policy; The National Youth Policy; the Agriculture and Food Security Policy; The
National Gender Policy; the National Policy on Orphans and Vulnerable Children; the Sexual and
Reproductive Health Policy; Early Childhood Care and Development Policy; the National Environment
Policy; the National Land Policy; the Equalisation of Opportunities (Disability) Policy; the Decentralization
Policy; the National Nutrition Policy and Strategy; and other relevant programmes in agriculture, education,
health and labour. It is expected that through synergies with these policies, the NSSP will contribute to
asset creation and protection, income generation; strengthen human capital and stimulate economic
activities; promote social empowerment, reduce income inequality and break intergenerational cycle of
poverty; and ensure social and political stability and fulfilment of human rights and freedoms (GoM, 2011).
The NSSP also recognises the existence of global and regional development frameworks such as the
Millennium Development Goals (MDGs), the Universal Declaration on Human Rights, the Convention on
the Rights of the Child (CRC), and the Convention on the Elimination of all forms of Discrimination
against Women.
In the MGDS II which succeeded the MGDS I, Government has also included a theme on Social Support
and Disaster Risk Management. The interventions on poverty and vulnerabilities in the MGDS are closely
related to the interventions under other themes, especially on Sustainable Economic Growth, Social
Development and cross cutting issues.
There is concern among stakeholders, however, that extended delays in the adoption of the National Social
Protection Policy reflect the GoM‟s lack of commitment to social protection. It is speculated that the
adoption of the policy could unlock resources into social protection.
14
3. National Poverty Profile and SCTP Beneficiary Targeting
3.1 Measures of Poverty in Malawi
Malawi principally uses a national measure of poverty and equality that compares the income measure of an
individual‟s consumption-related expenditure with a cost-of-basic-needs threshold. This is a common
procedure adopted by the World Bank for developing countries. In practice, this poverty assessment
procedure uses a household welfare indicator defined as the total annual per capita consumption
expenditure (including implicit expenditure of own production) reported by a household. This is expressed
in Malawi kwacha, deflated to February/March 2004 prices3. Second, a threshold level of welfare that
distinguishes between poor and non-poor households is established, and defines the poverty line. The
poverty line is technically a subsistence minimum based on the cost-of-basic-needs methodology, and
comprises two parts as already described in Section 2.1 above: (a) minimum food expenditure based on the
food requirements of an individual, tied to the recommended daily calorie requirement - which defines the
ultra-poverty line; and (b) critical non-food consumption, estimated based on the expenditure patterns of
households whose total expenditure is close the minimum food expenditure. The sum of the minimum food
and non-food expenditures define the poverty line. Individuals or households whose consumption is lower
than the poverty line are poor, while those whose total expenditure falls short of that necessary to meet the
minimum food requirements are ultra-poor. This process provides an absolute measure of poverty. The
poverty and ultra-poverty lines were established as K16,165 and K10,029 per person per year in 2004 (IHS,
2005). The poverty gap4 in Malawi was estimated at 17.8% overall and 5.3% among the ultra poor. This
meant that the poor on average were subsisting on 17.8% less than the poverty line, and the ultra poor on
average survived on 5.3% less than the ultra-poverty line. The poverty line of K16,165 was equal to K44.3
or US$0.5 per person per day, and the ultra-poor were subsisting on less than K26.40 per person per day.
As an alternative, the World Bank commonly measures national poverty in terms of the ability of a person
to live on at least the local currency equivalent of $1.25 per day at 2005 international prices (i.e., adjusted
for purchasing power parity (PPP) at the dollar value in 2005). Using the latest available PPP conversion
factor of K58.597 = $1.00, the implied poverty line for Malawi is K19,468 per person per annum. It is clear
that this measure is in respect of poverty per se, and cannot be compared with the ultra-poverty measure
that is most relevant in the context of the SCTP.
A poverty headcount ratio measures the proportion of the population that lives below the defined poverty
line. Based on IHS (2005) computations and subsequent data annually generated through the WMSs, the
National Statistical Office releases poverty headcount ratios for Malawi. The available headcount ratio
based on the $1.25/day measure is for 2004. The ratios based on IHS and WMS are also available by region
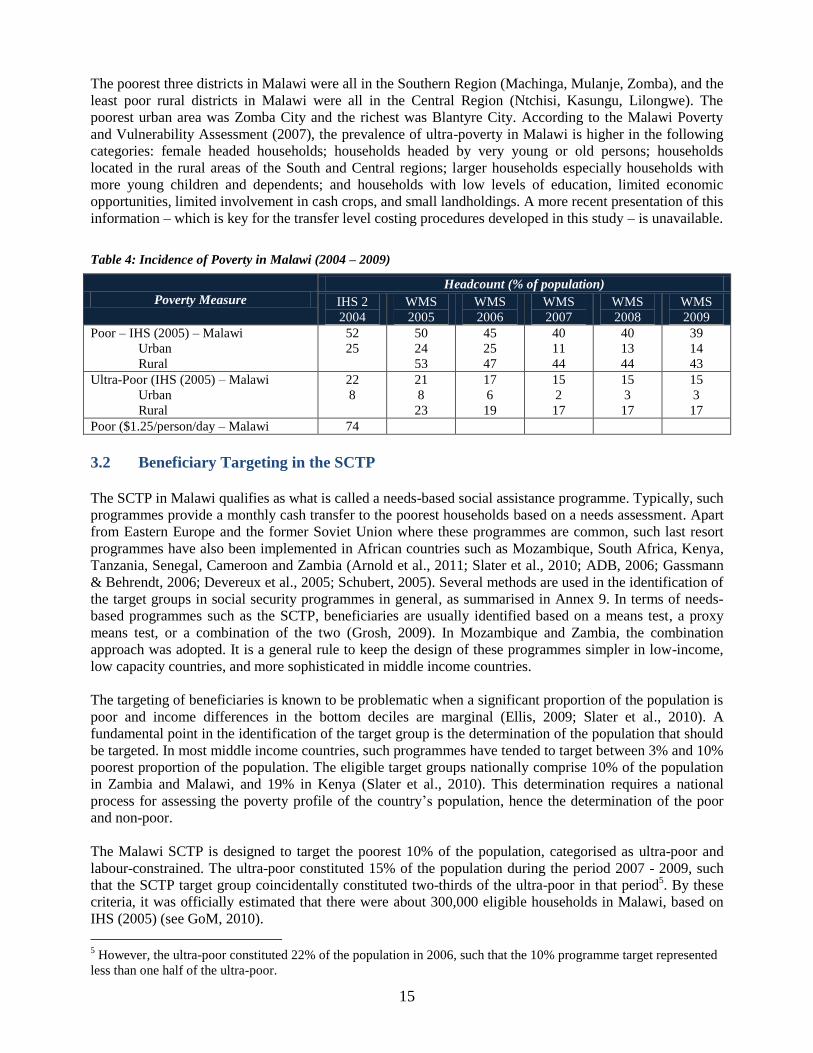
and rural-urban split up to 2009, and by district up to 2007. Table 4 shows the available published ratios for
Malawi. Significant progress was made in reducing poverty between 2004 and 2006, but this slowed down
thereafter. Most of the poor live in rural areas, but a possible increase in urban poverty is discernible. Since
the poverty line based on the $1.25/person/day measure is generally higher, this measure tends to report
higher poverty incidence than the national measure. Moreover, because the post-2004 poverty statistics are
based on IHS (2005), their reliability tends to decline over time. It is anticipated that the latest IHS
conducted in 2011, whose outcomes have not yet been published, will provide a better picture of the status
of poverty in Malawi.
Table 4 also shows that the incidence of poverty has a geographical perspective in Malawi. More
specifically, Annex 8 shows the poverty incidence by district in 2007. The southern region has a greater
share of the poor with poverty and ultra-poverty incidences being higher than anywhere else in the country.
3The IHS (2005) upon which the calculations are based was conducted in this period.
4 The poverty gap is defined in terms of how far below the poverty line households are found, on average, expressed
as a percentage of the poverty line. Those households that are close to the poverty line could be improved out of
poverty with less effort than those that are far below the line
15
The poorest three districts in Malawi were all in the Southern Region (Machinga, Mulanje, Zomba), and the
least poor rural districts in Malawi were all in the Central Region (Ntchisi, Kasungu, Lilongwe). The
poorest urban area was Zomba City and the richest was Blantyre City. According to the Malawi Poverty
and Vulnerability Assessment (2007), the prevalence of ultra-poverty in Malawi is higher in the following
categories: female headed households; households headed by very young or old persons; households
located in the rural areas of the South and Central regions; larger households especially households with
more young children and dependents; and households with low levels of education, limited economic
opportunities, limited involvement in cash crops, and small landholdings. A more recent presentation of this
information – which is key for the transfer level costing procedures developed in this study – is unavailable.
Table 4: Incidence of Poverty in Malawi (2004 – 2009)
Poverty Measure
Headcount (% of population)
IHS 2
2004
WMS
2005
WMS
2006
WMS
2007
WMS
2008
WMS
2009
Poor – IHS (2005) – Malawi
Urban
Rural
52
25
50
24
53
45
25
47
40
11
44
40
13
44
39
14
43
Ultra-Poor (IHS (2005) – Malawi
Urban
Rural
22
8
21
8
23
17
6
19
15
2
17
15
3
17
15
3
17
Poor ($1.25/person/day – Malawi 74
3.2 Beneficiary Targeting in the SCTP
The SCTP in Malawi qualifies as what is called a needs-based social assistance programme. Typically, such
programmes provide a monthly cash transfer to the poorest households based on a needs assessment. Apart
from Eastern Europe and the former Soviet Union where these programmes are common, such last resort
programmes have also been implemented in African countries such as Mozambique, South Africa, Kenya,
Tanzania, Senegal, Cameroon and Zambia (Arnold et al., 2011; Slater et al., 2010; ADB, 2006; Gassmann
& Behrendt, 2006; Devereux et al., 2005; Schubert, 2005). Several methods are used in the identification of
the target groups in social security programmes in general, as summarised in Annex 9. In terms of needs-
based programmes such as the SCTP, beneficiaries are usually identified based on a means test, a proxy
means test, or a combination of the two (Grosh, 2009). In Mozambique and Zambia, the combination
approach was adopted. It is a general rule to keep the design of these programmes simpler in low-income,
low capacity countries, and more sophisticated in middle income countries.
The targeting of beneficiaries is known to be problematic when a significant proportion of the population is
poor and income differences in the bottom deciles are marginal (Ellis, 2009; Slater et al., 2010). A
fundamental point in the identification of the target group is the determination of the population that should
be targeted. In most middle income countries, such programmes have tended to target between 3% and 10%
poorest proportion of the population. The eligible target groups nationally comprise 10% of the population
in Zambia and Malawi, and 19% in Kenya (Slater et al., 2010). This determination requires a national
process for assessing the poverty profile of the country‟s population, hence the determination of the poor
and non-poor.
The Malawi SCTP is designed to target the poorest 10% of the population, categorised as ultra-poor and
labour-constrained. The ultra-poor constituted 15% of the population during the period 2007 - 2009, such
that the SCTP target group coincidentally constituted two-thirds of the ultra-poor in that period5. By these
criteria, it was officially estimated that there were about 300,000 eligible households in Malawi, based on
IHS (2005) (see GoM, 2010).
5 However, the ultra-poor constituted 22% of the population in 2006, such that the 10% programme target represented
less than one half of the ultra-poor.
16
As reported by Miller et al. (2008), the SCTP in Malawi uses a community based, multi-stage participatory
targeting process. Community volunteers determine the eligible households in their villages, guided by the
programme‟s Manual of Operations which provides “proxies” of poverty for community members to
consider (e.g., the poorest households eat only one meal per day). The procedure involves household
interviews conducted by the Community Social Support Committee (CSSC) trained by the district SCT
secretariat; verification of the interview results by a community meeting at which eligible households are
identified; verification of the eligibility of households by extension workers; and consideration and
approval of the proposed list of eligible households by a district-level Social Support Committee. Ideally,
this process aims at selecting the neediest households up to a cut-off point, which currently ought to be two-
thirds of the ultra-poverty incidence for the district in order to ensure that the poorest and labour-
constrained 10% of the population is targeted. Miller (2009) notes that proxy means testing is somewhat
used in the Malawi SCTP, but there is need to ensure that the proxy is appropriate, well-understood, easy to
identify and field-tested. The GoM (2010) also proposes that the targeting process should be formally
verified by a proper proxy means test, in order to increase objectivity.
Evidence on the ground suggests that the Malawi SCTP targeting process simply seeks to identify the
poorest 10% of the population in each district, without regard for the district‟s poverty profile in relation to
other districts in the country. This suggests that the programme may not be targeting the poorest households
when the national picture is considered. Additionally, while the normal procedure is to start with
programme implementation among the poorest individuals, households and geographical areas (Arnold,
2011, Samson et al., 2006), it is the case that the project was initially piloted in Mchinji which had only the
ninth highest incidence of ultra-poverty in 2004 and the sixth lowest incidence in 2007. Apart from
Machinga (highest incidence in 2007), the inclusion of the ultra-poorest districts in the piloting phase has
not been high. It is understood that, among other considerations, Mchinji was chosen in order to facilitate
the administration of the piloting phase, because it was then the poorest among districts that are close to
Lilongwe.
3.3 Determination of Target Beneficiary Households
This study estimates the total number of eligible beneficiary households for 2012 using the following
procedure. Let i denote a specific district and t denote the current period (year). Recognise that, currently,
the published census data do not report the annual intercensal growth rates in the number of households per
district, and that these are inherently different from the annual intercensal growth rates in the „population‟
per district. Then:
a. The annual growth rate in the number of households for each district i is calculated by iteratively
solving for the district-specific compound rate ( ir ) in the compounding formula:
10
98,08, 1 iii rPP
where ir = annual intercensal growth rate in the number of households for district i
08,iP = number of households in district i in 2008
98,iP = number of households in district i in 1998
National Census data are used to obtain 08,iP and 98,iP
b. The total number of households per district in 2008 obtained from the 2008 Population and
Housing Census is compounded at the rate of ir as calculated above, to obtain an estimate of the
number of households per district in 2012, say 12,ihh . For Neno, Balaka and the four cities, where
necessary, data splitting is accomplished in relation to Mwanza, Machinga and the corresponding
host districts for the cities respectively, by assuming constant population proportions.
17
c. The estimated number of households per district is summed up to obtain the estimated total number
of households in Malawi in 2012, say 12HH . The available data yield:
083,191,312,12 i
ihhHH
d. We take 10% of 12HH as the SCTP national target number of beneficiary households in 2012
(denoted 12T ), in line with the SCTP design. The available data yield:
108,3191.0 1212 HHT
e. Let u
ih be the ultra-poverty headcount ratio for each district i . The number of ultra-poor
households per district in 2012 (say u
ihh 12, ) is calculated by multiplying the number of households
per district obtained in (b) above by the ultra-poverty headcount ratio for the district. That is,
12,12, i
u
i
u
i hhhhh . Since u
ih are not reported annually for each district, the latest available ultra-
poverty headcount ratios established in the WMS (2007) are used.6 For Likoma and Neno, the
respective percentages applied relate to Nkhata Bay and Mwanza7.
f. We sum up the numbers of ultra-poor households across districts to obtain the total number of
ultra-poor households in Malawi in 2012 (say uHH12 ). The available data yield:
370,47812,12 i
u
i
u hhHH .
g. Since data on labour-constrained ultra-poor households is not reported (see Box 1), we propose that
the national target number of beneficiary households should be distributed across districts on the
basis of ultra-poverty headcount ratios. Therefore, we calculate each district‟s share (proportion) of
ultra-poor households in Malawi in 2012 as:
u
u
iu
iHH
hhp
12
12,
12, .
h. Determine the number of STCS target beneficiary households per district in 2012 (say 12,it ) as
being equal to 1212,12, Tpt u
ii , such that the sum of these district households equals the total
national target number of beneficiary households. Thus:
i
i Tt 108.3191212,
The procedure described above can improve with the availability of data as described in Box 1. It is
recommended that the National Statistical Office should consider addressing these data requirements.
6Just as the growth rate in population does not necessarily correspond with the growth rate in the number of
households, the poverty incidences may differ between population and households. We do not have adequate data to
calculate the ultra-poverty incidence at the household level in 2012. This discrepancy may, however, be very minimal. 7While this is a reasonable assumption in relation to Neno, it may not be equally reasonable for Likoma whose socio-
economic profile is typically different from that of Nkhata Bay.
18
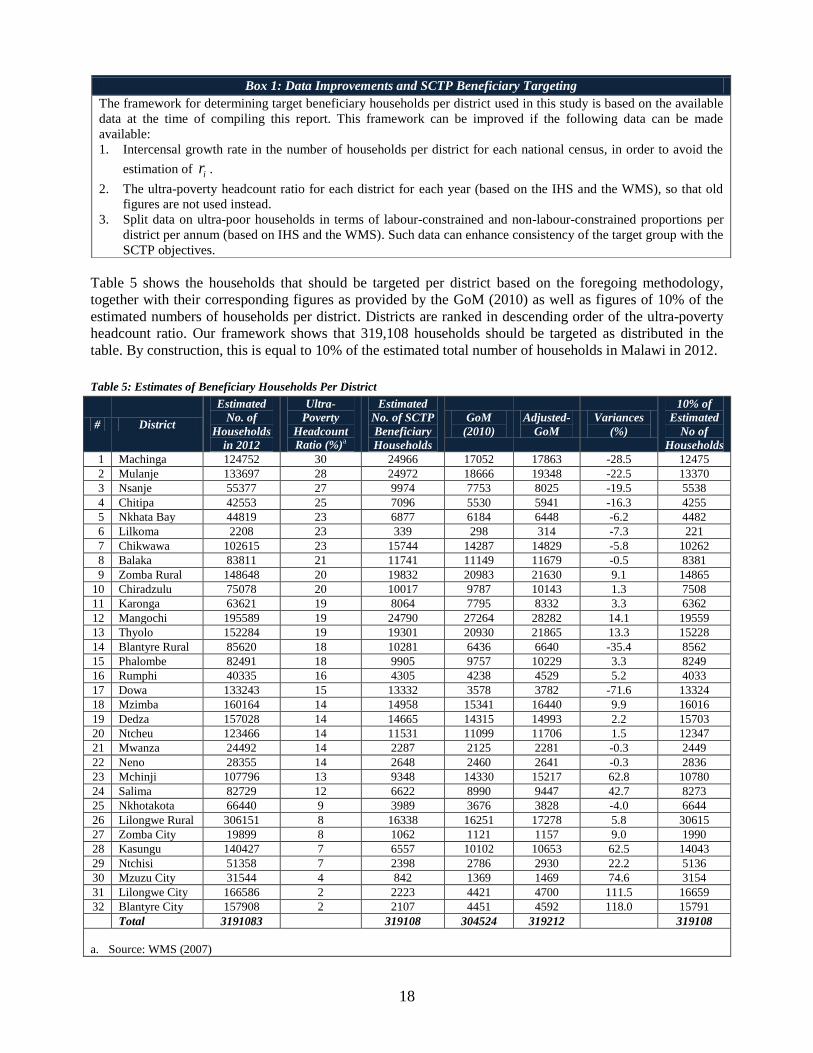
Table 5 shows the households that should be targeted per district based on the foregoing methodology,
together with their corresponding figures as provided by the GoM (2010) as well as figures of 10% of the
estimated numbers of households per district. Districts are ranked in descending order of the ultra-poverty
headcount ratio. Our framework shows that 319,108 households should be targeted as distributed in the
table. By construction, this is equal to 10% of the estimated total number of households in Malawi in 2012.
Table 5: Estimates of Beneficiary Households Per District
# District
Estimated
No. of
Households
in 2012
Ultra-
Poverty
Headcount
Ratio (%)a
Estimated
No. of SCTP
Beneficiary
Households
GoM
(2010)
Adjusted-
GoM
Variances
(%)
10% of
Estimated
No of
Households
1 Machinga 124752 30 24966 17052 17863 -28.5 12475
2 Mulanje 133697 28 24972 18666 19348 -22.5 13370
3 Nsanje 55377 27 9974 7753 8025 -19.5 5538
4 Chitipa 42553 25 7096 5530 5941 -16.3 4255
5 Nkhata Bay 44819 23 6877 6184 6448 -6.2 4482
6 Lilkoma 2208 23 339 298 314 -7.3 221
7 Chikwawa 102615 23 15744 14287 14829 -5.8 10262
8 Balaka 83811 21 11741 11149 11679 -0.5 8381
9 Zomba Rural 148648 20 19832 20983 21630 9.1 14865
10 Chiradzulu 75078 20 10017 9787 10143 1.3 7508
11 Karonga 63621 19 8064 7795 8332 3.3 6362
12 Mangochi 195589 19 24790 27264 28282 14.1 19559
13 Thyolo 152284 19 19301 20930 21865 13.3 15228
14 Blantyre Rural 85620 18 10281 6436 6640 -35.4 8562
15 Phalombe 82491 18 9905 9757 10229 3.3 8249
16 Rumphi 40335 16 4305 4238 4529 5.2 4033
17 Dowa 133243 15 13332 3578 3782 -71.6 13324
18 Mzimba 160164 14 14958 15341 16440 9.9 16016
19 Dedza 157028 14 14665 14315 14993 2.2 15703
20 Ntcheu 123466 14 11531 11099 11706 1.5 12347
21 Mwanza 24492 14 2287 2125 2281 -0.3 2449
22 Neno 28355 14 2648 2460 2641 -0.3 2836
23 Mchinji 107796 13 9348 14330 15217 62.8 10780
24 Salima 82729 12 6622 8990 9447 42.7 8273
25 Nkhotakota 66440 9 3989 3676 3828 -4.0 6644
26 Lilongwe Rural 306151 8 16338 16251 17278 5.8 30615
27 Zomba City 19899 8 1062 1121 1157 9.0 1990
28 Kasungu 140427 7 6557 10102 10653 62.5 14043
29 Ntchisi 51358 7 2398 2786 2930 22.2 5136
30 Mzuzu City 31544 4 842 1369 1469 74.6 3154
31 Lilongwe City 166586 2 2223 4421 4700 111.5 16659
32 Blantyre City 157908 2 2107 4451 4592 118.0 15791
Total 3191083 319108 304524 319212 319108
a. Source: WMS (2007)
Box 1: Data Improvements and SCTP Beneficiary Targeting
The framework for determining target beneficiary households per district used in this study is based on the available
data at the time of compiling this report. This framework can be improved if the following data can be made
available:
1. Intercensal growth rate in the number of households per district for each national census, in order to avoid the
estimation of ir .
2. The ultra-poverty headcount ratio for each district for each year (based on the IHS and the WMS), so that old
figures are not used instead.
3. Split data on ultra-poor households in terms of labour-constrained and non-labour-constrained proportions per
district per annum (based on IHS and the WMS). Such data can enhance consistency of the target group with the
SCTP objectives.
19
Although our estimate of eligible households is slightly higher than that of 304,524 reported by the GoM
(2010), the GoM figure becomes a close 319,212 when the district target numbers of households are
compounded for two years at the intercensal household growth rates derived in this study, to obtain the
Adjusted-GoM estimates reported in the table. However, there are discernible variations in terms of target
beneficiaries in specific districts when our estimates are compared with the Adjusted-GoM estimates.
Relative to our framework, the Adjusted-GoM framework proposes significantly more households to be
targeted in the cities of Blantyre, Lilongwe and Mzuzu as well as the relatively well-off districts of Mchinji
and Salima. On the other hand, the Adjusted-GoM framework includes much fewer target households in the
poorer districts of Machinga, Mulanje, Nsanje, and Chitipa, but lower quotas are also suggested for Dowa
and Blantyre Rural. Reconciling these deviations can be a matter of necessity in order to enhance targeting
objectivity.
Currently, the SCTP targets 10% of each district‟s population regardless of district-specific poverty
profiles. The current procedure advantages districts with low poverty ultra-incidences and disadvantages
the poorest (hence most eligible) districts. Foe example, our procedure suggests that 24,966 households
should be targeted in Machinga (about twice as many as those suggested by the flat 10% rule), while only
2,107 households should benefit in Blantyre City (compared with 15,791 households by the current
practice). Clearly, the proposed procedure would enhance objectivity in the identification of beneficiaries.
4. Determination of Cash Transfer Levels
4.1 The Literature
No clear answer exists in the literature regarding what the appropriate transfer level should be (or how
generous the programme should be to the target group). Teslius et al. (2010) notes that, ultimately, the
transfer level becomes one of the products of designing the programme in the sense that the level should fit
within the programme‟s budgetary, administrative and political constraints, while also maximising
outcomes on its intended objectives. In general, last resort programmes such as the SCTP aim to reduce
poverty, such that the benefit level is typically set as a fraction of the income (or poverty) gap of expected
beneficiaries. Variations exist to this general rule. For instance, in low income countries, it is common to
set benefits relative to the cost of an “adequate” food basket or the food poverty line. The cash transfer
programme for Kalomo in Zambia pays $10 per month to a beneficiary household, equivalent to the cost of
a 50 kilogram bag of maize. Some guaranteed minimum income (GMI) programmes in Europe and Central
Asia provide a transfer equivalent to the difference between the eligibility threshold and the income of each
family. Procedures that compensate beneficiaries for one element of expenditure – called gap formulas –
are also used for family allowances that cover a portion of the cost of such expenditure, such as the cost of
raising or educating a child, or food stamps that cover the food poverty gap. Conditional cash transfer
(CCT) programmes encourage poor beneficiaries to invest in children‟s human capital by conditioning the
benefit on the use of school, nutrition and/or health services. Thus, the level of benefits in CCT
programmes reflects two objectives: reducing beneficiaries‟ poverty (as in last resort programmes) and
providing incentives for human capital accumulation (typically through education, nutrition or health
grants). In the Family Allowance Programme in Honduras and the Social Protection Network in Nicaragua,
supply grants were offered to the service providers – schools and health facilities (Teslius et al., 2010).
The programme‟s overall budget constraint is the key second consideration in setting the transfer level.
Once information on the number of „deserving‟ beneficiaries and their corresponding income gaps is
obtained, policy makers can estimate the overall resource deficit among the poor, and determine whether or
not covering such a deficit is affordable. The initial estimate of the financial effort required to eliminate
poverty is usually larger that the available resources. This imbalance is typically dealt with through an
iterative process where the generosity and/or the coverage of the programme is typically restricted to the
poorest and most destitute (Teslius et al., 2010 p15). The ultimate programme design also has to consider
the need to balance between finding a transfer level that is neither too high to generate dependency, nor too
20
low to lack impact. Too generous a transfer level may have adverse consequences, such as reducing work
incentives or crowding out private transfers. Too low a benefit would prevent the programme from
achieving its intended objectives. As an illustration, a transfer value limited to 10% to 30% of the ultra-
poverty line has become an accepted practice in several programmes in Africa, irrespective of national or
local poverty profiles or income levels. However, limiting the transfer in this way, while making it
affordable, carries the risk that it may not have a significant impact on poverty, and may undermine the
purpose of the programme (Slater et al., 2010).
Comprehensive SCT programmes can be quite expensive. In 2009, South Africa invested over 3% of its
national income and more than 10% of government spending on its comprehensive social grants system.
However, there is evidence that adequate political will is key to the affordability of SCT programmes, and
that these programmes can be made affordable in many low income countries when there is such will
(Samson, 2009).
Other considerations in the determination of benefit formulas include whether these should be tailor-made
to the characteristics of beneficiaries. Benefit formulas may be flat (i.e. giving the same benefit to all
beneficiaries) or they may vary according to beneficiary characteristics. Benefits may vary by several
criteria, including household size, age of household members, gender, time of year, geographical area,
longevity in the programme, and promotion of preferred behavioural changes (Teslius et al., 2010 p16).
In Kenya‟s three SCT programmes evaluated by Slater et al. (2010), real transfer levels were set at 10% -
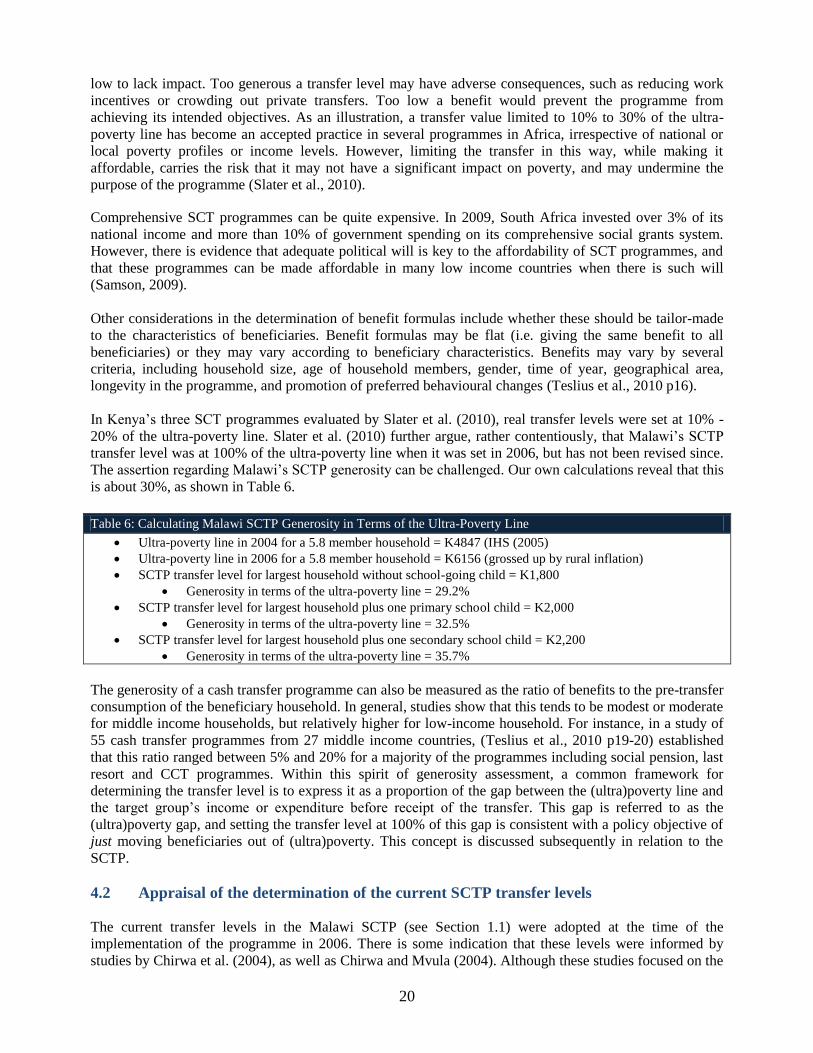
20% of the ultra-poverty line. Slater et al. (2010) further argue, rather contentiously, that Malawi‟s SCTP
transfer level was at 100% of the ultra-poverty line when it was set in 2006, but has not been revised since.
The assertion regarding Malawi‟s SCTP generosity can be challenged. Our own calculations reveal that this
is about 30%, as shown in Table 6.
Table 6: Calculating Malawi SCTP Generosity in Terms of the Ultra-Poverty Line
Ultra-poverty line in 2004 for a 5.8 member household = K4847 (IHS (2005)
Ultra-poverty line in 2006 for a 5.8 member household = K6156 (grossed up by rural inflation)
SCTP transfer level for largest household without school-going child = K1,800
Generosity in terms of the ultra-poverty line = 29.2%
SCTP transfer level for largest household plus one primary school child = K2,000
Generosity in terms of the ultra-poverty line = 32.5%
SCTP transfer level for largest household plus one secondary school child = K2,200
Generosity in terms of the ultra-poverty line = 35.7%
The generosity of a cash transfer programme can also be measured as the ratio of benefits to the pre-transfer
consumption of the beneficiary household. In general, studies show that this tends to be modest or moderate
for middle income households, but relatively higher for low-income household. For instance, in a study of
55 cash transfer programmes from 27 middle income countries, (Teslius et al., 2010 p19-20) established
that this ratio ranged between 5% and 20% for a majority of the programmes including social pension, last
resort and CCT programmes. Within this spirit of generosity assessment, a common framework for
determining the transfer level is to express it as a proportion of the gap between the (ultra)poverty line and
the target group‟s income or expenditure before receipt of the transfer. This gap is referred to as the
(ultra)poverty gap, and setting the transfer level at 100% of this gap is consistent with a policy objective of
just moving beneficiaries out of (ultra)poverty. This concept is discussed subsequently in relation to the
SCTP.
4.2 Appraisal of the determination of the current SCTP transfer levels
The current transfer levels in the Malawi SCTP (see Section 1.1) were adopted at the time of the
implementation of the programme in 2006. There is some indication that these levels were informed by
studies by Chirwa et al. (2004), as well as Chirwa and Mvula (2004). Although these studies focused on the
21
determination of the minimum wage for PWPs, their wage determination procedure recognised that the
PWPs implemented in Malawi have explicit poverty reduction and livelihoods objectives. As such, the
studies used a poverty line analysis, which derived the following outcomes at 2004 prices:
The IHS poverty line: Grossing up the IHS (1998) poverty line with rural inflation, the monthly
household food poverty line was K4,099, and increased to K5,465 when non-food costs (estimated
at 20%) were included.
The subsistence basket poverty line: Basing on the cost of purchasing a basket of subsistence
consumption food items that would provide a household with 2,100 calories per person per day as
required by WFP, a monthly household subsistence basket (SB) poverty line of K2,917 was
obtained, which increased to K3,501 when non-food costs were added at 20%.
The perceived needs poverty line: Using information on the cost of a bundle of goods considered
necessary for subsistence obtained from workers in a sample PWP implemented by the Malawi
Social Action Fund (MASAF), a perceived needs (PN) poverty line of K2,125 per six-member
household per month for food only was derived, which increased to K2,745 when non-food cost
were added.
The foregoing studies also considered other sources of household income as well as own production in the
determination of the PWP wage rate. The respective monthly wages required to meet subsistence needs
after adjusting for other income sources in the three scenarios (IHS, SB, and PN poverty lines) were
K2,900, K2,075 and K1,500 when food costs only were considered. These increased to K4,275, K2,675 and
K2,100 when non-food costs were added, respectively. Ultimately, the study based its recommendations on
the outcome of the perceived needs analysis, with the implication that the PWP daily wage rate should be
between K83 and K107 at 2004 prices.
The link between this framework and the determination of the transfer levels adopted by the SCTP remains
unclear, but can possibly be constructed. For instance, a household of at least 4 members with one primary
school child and one secondary school child would earn K2,400 in the SCTP, which falls within the
monthly wage range of K2,075 - K2,675 proposed under the PN poverty line approach.
However, in Miller et al. (2008) and during interviews in the context of this study, it was established that
the average transfer to a household was K2,000, which is at the lower end of the monthly wage range
suggested by the perceived needs approach. Moreover, since the SCTP targets the ultra-poor and labour-
constrained, it is also clear that the adjustment for additional sources of income and own production was
necessary in the context of the PWP, but not the SCTP. Instead, the monthly wages implied by these
procedures should have been adjusted for the average monthly household expenditures of the relevant target
group.
There are indications, substantiated during this study, that the actual determination of the SCTP transfer
levels may have been guided by the reasoning that it should afford a six-member household the equivalent
of some 2 bags of maize weighing 50 kilograms each. The cost of such a bag was around K900 during
2006, which establishes the maximum value of the transfer level based on the household size (i.e., K1,800).
To determine the transfer level for a one-person household, moral consideration was made that such a
transfer should be lower than the lowest pension paid to a retired public servant, then estimated at K700 per
month. In 2011-2012, the minimum cost of a 50 kilogram bag of maize was K1,500, while the lowest
pension paid was in the region of K1,400. These statistics would suggest a 2012 transfer level of, say,
K1,300 for a one-person household and K3,000 for the largest household. These are 116.7% and 66.7%
higher than the current levels.
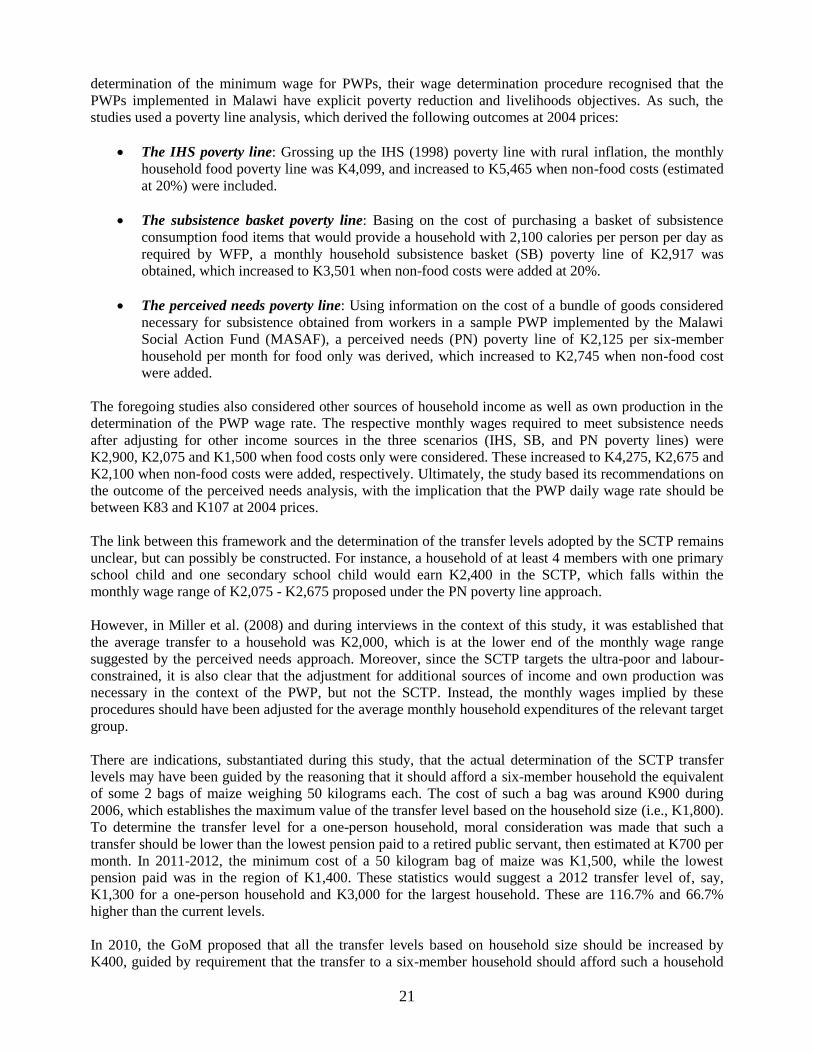
In 2010, the GoM proposed that all the transfer levels based on household size should be increased by
K400, guided by requirement that the transfer to a six-member household should afford such a household
22
some 2 bags of 50 kilogram of maize at January 2010 prices, as determined by the Centre Social Concern
Basic Needs Basket.8 The resulting transfer levels are as shown in Table 7. Since the average transfer level
per household was estimated at K2000 in 2010 (Miller et al., 2010), the proposal concluded that this
average would also increase by the constant of K400 to K2,400. The GoM (2010) proposal does not
provide justification for keeping the educational bonuses fixed at their 2006 levels.
Table 7: Transfers Levels Proposed by the GoM (2010)
Household Size Current Proposed
Increase (%) K $ K $
1 600 3.59 1000 5.99 66.67
2 1000 5.99 1400 8.38 40.00
3 1400 8.38 1800 10.78 28.57
4+ 1800 10.78 2200 13.17 22.22
Note: The 2012 exchange rate used is K167.00 = $1.00
The procedure of increasing all transfer levels based on household size by the same constant is arguable. On
the one hand, the cost of subsistence may not increase by the same amount for households of different
sizes. In other words, this procedure may be too generous to small households and overly penalise big
households: the increase is about 67% for a one person household and only 22% for a household of four or
more members. Since the transfer level per person already declines as the household size increases – and
the levels are capped at a household size of 4 – it appears that an adjustment framework that is based on the
current levels need not impose such undue penalties on large households. Additionally, such a procedure
could result in a convergence of the transfer levels over time. On the other hand, the „labour-constrained‟
element of the SCTP target group is a much more likely attribute of smaller households than larger ones,
such that coping mechanisms and graduation potential are quite high in larger households. Moreover,
rewarding households for their increasing sizes is not consistent with poverty reduction strategies.
Increasing transfer levels by some constant is also much simpler in practical applications than increasing
them by a variable, hence consistent with the observation that programme designs ought to be kept simple
in low income countries and relatively more complicated in middle income countries.
An argument commonly made in support of the transfer levels adopted by the SCTP is that the resulting
average transfer per household could cover the gap between the ultra-poverty line and the average monthly
expenditure for the household in the lowest expenditure quintile. Schubert and Huijbregts (2006) estimated
that this gap was equal to $9.6, while the average transfer level was $12.0. Thus, SCTP generosity in terms
of the poverty gap was estimated at 125%. This reasoning provides promise for deriving a scientific
framework for determining and periodically adjusting transfer levels, especially if equally credible
frameworks for determining transfers to smaller households and educational bonuses can be established.
Although the manner in which the current transfer levels were determined remains vague, there appears to
be a consensus that they were appropriate for the period in which they were implemented, given competing
needs for public resources. Restoring purchasing power parity relative to the transfers made in 2006 could
therefore be a feasible way forward, yet one that is challenged by the fact that public resources may not
always increase such as to restore such parity at all times. The procedure followed in this analysis is to
explore several methodologies for achieving realism in the transfer levels, and to develop a framework that
roughly delivers the desired outcomes.
This analysis is guided by the discourse regarding the trade-off between high transfer levels that can only
reach out to a few beneficiaries on the one hand, and low transfer levels that are ineffective in achieving
programme objectives. During interviews, there was a general consensus among respondents that an
upward adjustment of the transfer levels was necessary. This was largely justified on the basis that the
8 See GoM (2010), Malawi Social Cash Transfer Programme, Ministry of Gender, Children and Community
Development, Government of Malawi.
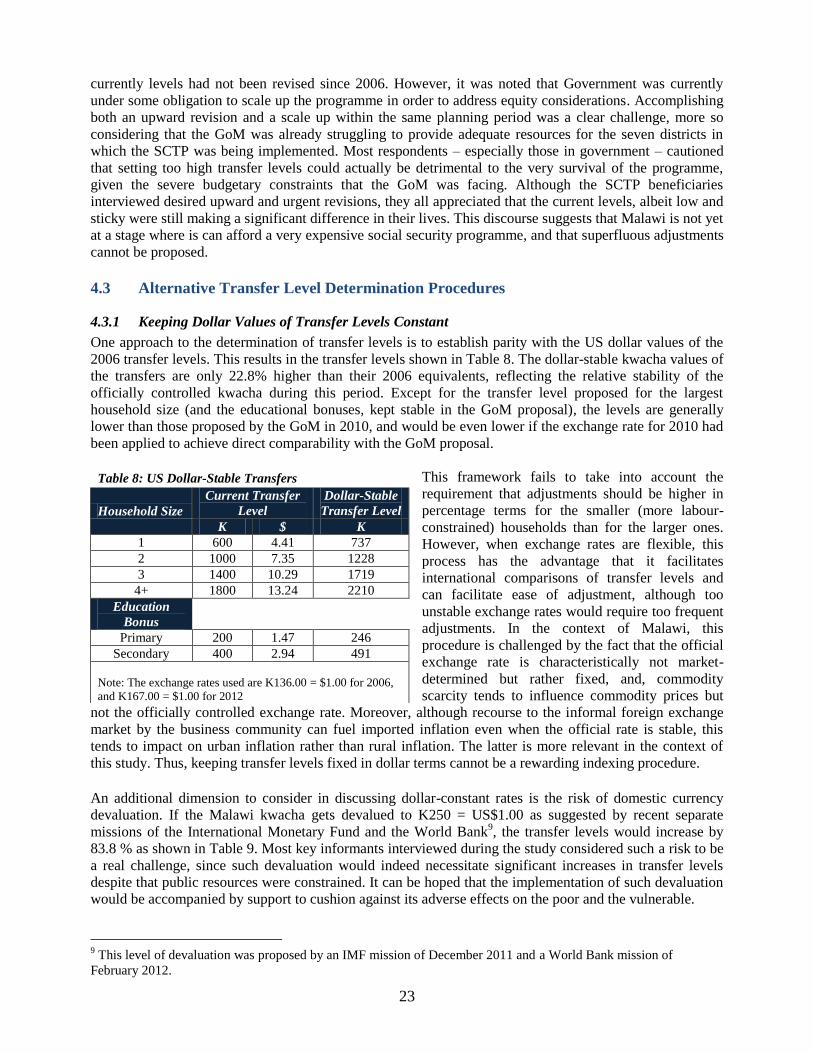
23
currently levels had not been revised since 2006. However, it was noted that Government was currently
under some obligation to scale up the programme in order to address equity considerations. Accomplishing
both an upward revision and a scale up within the same planning period was a clear challenge, more so
considering that the GoM was already struggling to provide adequate resources for the seven districts in
which the SCTP was being implemented. Most respondents – especially those in government – cautioned
that setting too high transfer levels could actually be detrimental to the very survival of the programme,
given the severe budgetary constraints that the GoM was facing. Although the SCTP beneficiaries
interviewed desired upward and urgent revisions, they all appreciated that the current levels, albeit low and
sticky were still making a significant difference in their lives. This discourse suggests that Malawi is not yet
at a stage where is can afford a very expensive social security programme, and that superfluous adjustments
cannot be proposed.
4.3 Alternative Transfer Level Determination Procedures
4.3.1 Keeping Dollar Values of Transfer Levels Constant
One approach to the determination of transfer levels is to establish parity with the US dollar values of the
2006 transfer levels. This results in the transfer levels shown in Table 8. The dollar-stable kwacha values of
the transfers are only 22.8% higher than their 2006 equivalents, reflecting the relative stability of the
officially controlled kwacha during this period. Except for the transfer level proposed for the largest
household size (and the educational bonuses, kept stable in the GoM proposal), the levels are generally
lower than those proposed by the GoM in 2010, and would be even lower if the exchange rate for 2010 had
been applied to achieve direct comparability with the GoM proposal.
This framework fails to take into account the
requirement that adjustments should be higher in
percentage terms for the smaller (more labour-
constrained) households than for the larger ones.
However, when exchange rates are flexible, this
process has the advantage that it facilitates
international comparisons of transfer levels and
can facilitate ease of adjustment, although too
unstable exchange rates would require too frequent
adjustments. In the context of Malawi, this
procedure is challenged by the fact that the official
exchange rate is characteristically not market-
determined but rather fixed, and, commodity
scarcity tends to influence commodity prices but
not the officially controlled exchange rate. Moreover, although recourse to the informal foreign exchange
market by the business community can fuel imported inflation even when the official rate is stable, this
tends to impact on urban inflation rather than rural inflation. The latter is more relevant in the context of
this study. Thus, keeping transfer levels fixed in dollar terms cannot be a rewarding indexing procedure.
An additional dimension to consider in discussing dollar-constant rates is the risk of domestic currency
devaluation. If the Malawi kwacha gets devalued to K250 = US$1.00 as suggested by recent separate
missions of the International Monetary Fund and the World Bank9, the transfer levels would increase by
83.8 % as shown in Table 9. Most key informants interviewed during the study considered such a risk to be
a real challenge, since such devaluation would indeed necessitate significant increases in transfer levels
despite that public resources were constrained. It can be hoped that the implementation of such devaluation
would be accompanied by support to cushion against its adverse effects on the poor and the vulnerable.
9 This level of devaluation was proposed by an IMF mission of December 2011 and a World Bank mission of
February 2012.
Table 8: US Dollar-Stable Transfers
Household Size
Current Transfer
Level
Dollar-Stable
Transfer Level
K $ K
1 600 4.41 737
2 1000 7.35 1228
3 1400 10.29 1719
4+ 1800 13.24 2210
Education
Bonus
Primary 200 1.47 246
Secondary 400 2.94 491
Note: The exchange rates used are K136.00 = $1.00 for 2006,
and K167.00 = $1.00 for 2012
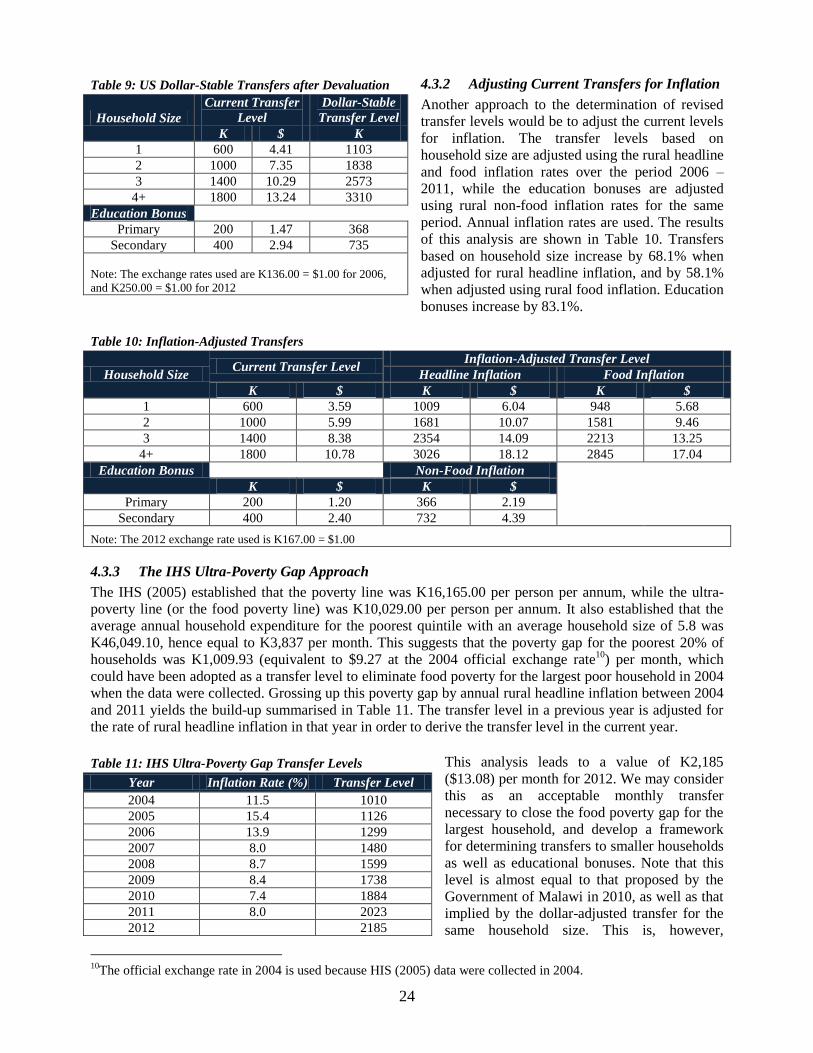
24
4.3.2 Adjusting Current Transfers for Inflation
Another approach to the determination of revised
transfer levels would be to adjust the current levels
for inflation. The transfer levels based on
household size are adjusted using the rural headline
and food inflation rates over the period 2006 –
2011, while the education bonuses are adjusted
using rural non-food inflation rates for the same
period. Annual inflation rates are used. The results
of this analysis are shown in Table 10. Transfers
based on household size increase by 68.1% when
adjusted for rural headline inflation, and by 58.1%
when adjusted using rural food inflation. Education
bonuses increase by 83.1%.
Table 10: Inflation-Adjusted Transfers
Household Size Current Transfer Level
Inflation-Adjusted Transfer Level
Headline Inflation Food Inflation
K $ K $ K $
1 600 3.59 1009 6.04 948 5.68
2 1000 5.99 1681 10.07 1581 9.46
3 1400 8.38 2354 14.09 2213 13.25
4+ 1800 10.78 3026 18.12 2845 17.04
Education Bonus Non-Food Inflation
K $ K $
Primary 200 1.20 366 2.19
Secondary 400 2.40 732 4.39
Note: The 2012 exchange rate used is K167.00 = $1.00
4.3.3 The IHS Ultra-Poverty Gap Approach
The IHS (2005) established that the poverty line was K16,165.00 per person per annum, while the ultra-
poverty line (or the food poverty line) was K10,029.00 per person per annum. It also established that the
average annual household expenditure for the poorest quintile with an average household size of 5.8 was
K46,049.10, hence equal to K3,837 per month. This suggests that the poverty gap for the poorest 20% of
households was K1,009.93 (equivalent to $9.27 at the 2004 official exchange rate10
) per month, which
could have been adopted as a transfer level to eliminate food poverty for the largest poor household in 2004
when the data were collected. Grossing up this poverty gap by annual rural headline inflation between 2004
and 2011 yields the build-up summarised in Table 11. The transfer level in a previous year is adjusted for
the rate of rural headline inflation in that year in order to derive the transfer level in the current year.
This analysis leads to a value of K2,185
($13.08) per month for 2012. We may consider
this as an acceptable monthly transfer
necessary to close the food poverty gap for the
largest household, and develop a framework
for determining transfers to smaller households
as well as educational bonuses. Note that this
level is almost equal to that proposed by the
Government of Malawi in 2010, as well as that
implied by the dollar-adjusted transfer for the
same household size. This is, however,
10
The official exchange rate in 2004 is used because HIS (2005) data were collected in 2004.
Table 9: US Dollar-Stable Transfers after Devaluation
Household Size
Current Transfer
Level
Dollar-Stable
Transfer Level
K $ K
1 600 4.41 1103
2 1000 7.35 1838
3 1400 10.29 2573
4+ 1800 13.24 3310
Education Bonus
Primary 200 1.47 368
Secondary 400 2.94 735
Note: The exchange rates used are K136.00 = $1.00 for 2006,
and K250.00 = $1.00 for 2012
Table 11: IHS Ultra-Poverty Gap Transfer Levels
Year Inflation Rate (%) Transfer Level
2004 11.5 1010
2005 15.4 1126
2006 13.9 1299
2007 8.0 1480
2008 8.7 1599
2009 8.4 1738
2010 7.4 1884
2011 8.0 2023
2012 2185
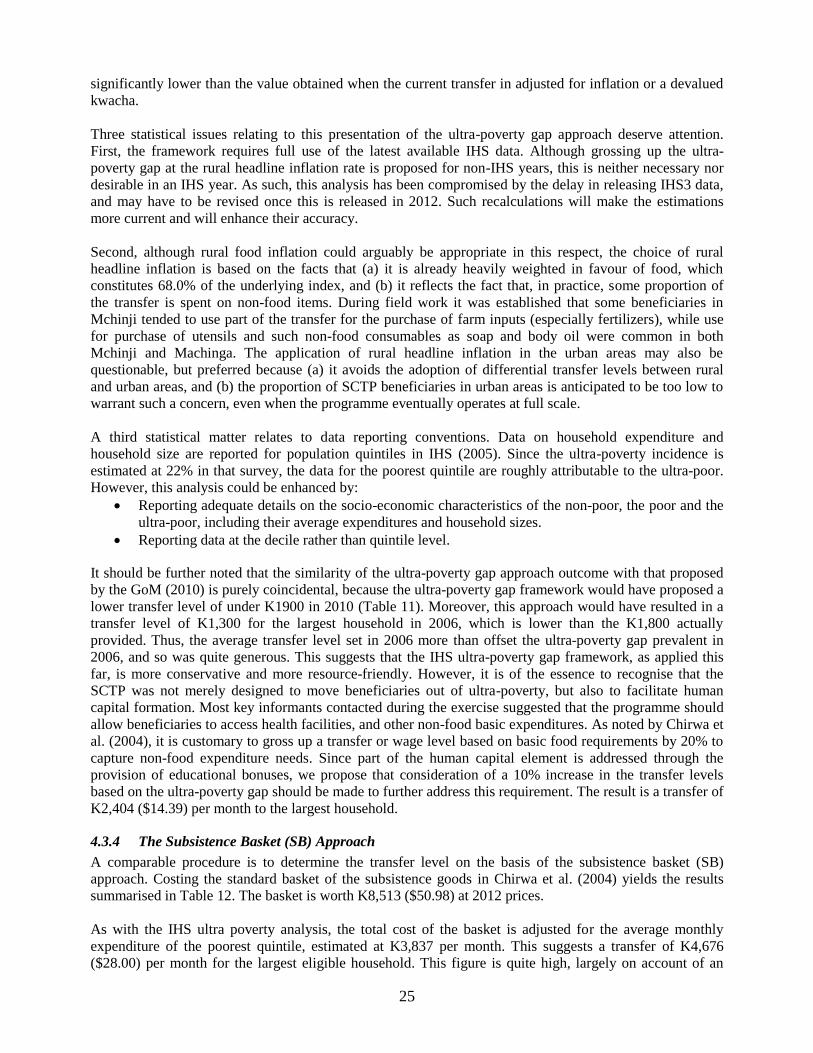
25
significantly lower than the value obtained when the current transfer in adjusted for inflation or a devalued
kwacha.
Three statistical issues relating to this presentation of the ultra-poverty gap approach deserve attention.
First, the framework requires full use of the latest available IHS data. Although grossing up the ultra-
poverty gap at the rural headline inflation rate is proposed for non-IHS years, this is neither necessary nor
desirable in an IHS year. As such, this analysis has been compromised by the delay in releasing IHS3 data,
and may have to be revised once this is released in 2012. Such recalculations will make the estimations
more current and will enhance their accuracy.
Second, although rural food inflation could arguably be appropriate in this respect, the choice of rural
headline inflation is based on the facts that (a) it is already heavily weighted in favour of food, which
constitutes 68.0% of the underlying index, and (b) it reflects the fact that, in practice, some proportion of
the transfer is spent on non-food items. During field work it was established that some beneficiaries in
Mchinji tended to use part of the transfer for the purchase of farm inputs (especially fertilizers), while use
for purchase of utensils and such non-food consumables as soap and body oil were common in both
Mchinji and Machinga. The application of rural headline inflation in the urban areas may also be
questionable, but preferred because (a) it avoids the adoption of differential transfer levels between rural
and urban areas, and (b) the proportion of SCTP beneficiaries in urban areas is anticipated to be too low to
warrant such a concern, even when the programme eventually operates at full scale.
A third statistical matter relates to data reporting conventions. Data on household expenditure and
household size are reported for population quintiles in IHS (2005). Since the ultra-poverty incidence is
estimated at 22% in that survey, the data for the poorest quintile are roughly attributable to the ultra-poor.
However, this analysis could be enhanced by:
Reporting adequate details on the socio-economic characteristics of the non-poor, the poor and the
ultra-poor, including their average expenditures and household sizes.
Reporting data at the decile rather than quintile level.
It should be further noted that the similarity of the ultra-poverty gap approach outcome with that proposed
by the GoM (2010) is purely coincidental, because the ultra-poverty gap framework would have proposed a
lower transfer level of under K1900 in 2010 (Table 11). Moreover, this approach would have resulted in a
transfer level of K1,300 for the largest household in 2006, which is lower than the K1,800 actually
provided. Thus, the average transfer level set in 2006 more than offset the ultra-poverty gap prevalent in
2006, and so was quite generous. This suggests that the IHS ultra-poverty gap framework, as applied this
far, is more conservative and more resource-friendly. However, it is of the essence to recognise that the
SCTP was not merely designed to move beneficiaries out of ultra-poverty, but also to facilitate human
capital formation. Most key informants contacted during the exercise suggested that the programme should
allow beneficiaries to access health facilities, and other non-food basic expenditures. As noted by Chirwa et
al. (2004), it is customary to gross up a transfer or wage level based on basic food requirements by 20% to
capture non-food expenditure needs. Since part of the human capital element is addressed through the
provision of educational bonuses, we propose that consideration of a 10% increase in the transfer levels
based on the ultra-poverty gap should be made to further address this requirement. The result is a transfer of
K2,404 ($14.39) per month to the largest household.
4.3.4 The Subsistence Basket (SB) Approach
A comparable procedure is to determine the transfer level on the basis of the subsistence basket (SB)
approach. Costing the standard basket of the subsistence goods in Chirwa et al. (2004) yields the results
summarised in Table 12. The basket is worth K8,513 ($50.98) at 2012 prices.
As with the IHS ultra poverty analysis, the total cost of the basket is adjusted for the average monthly
expenditure of the poorest quintile, estimated at K3,837 per month. This suggests a transfer of K4,676
($28.00) per month for the largest eligible household. This figure is quite high, largely on account of an
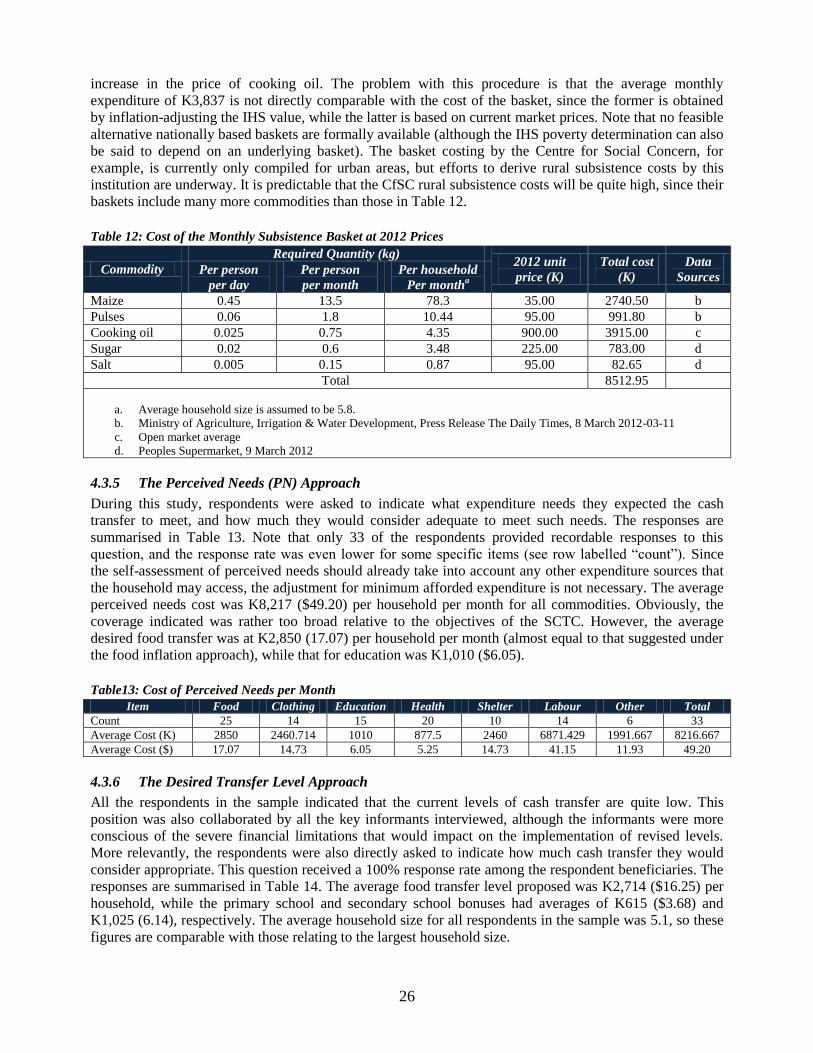
26
increase in the price of cooking oil. The problem with this procedure is that the average monthly
expenditure of K3,837 is not directly comparable with the cost of the basket, since the former is obtained
by inflation-adjusting the IHS value, while the latter is based on current market prices. Note that no feasible
alternative nationally based baskets are formally available (although the IHS poverty determination can also
be said to depend on an underlying basket). The basket costing by the Centre for Social Concern, for
example, is currently only compiled for urban areas, but efforts to derive rural subsistence costs by this
institution are underway. It is predictable that the CfSC rural subsistence costs will be quite high, since their
baskets include many more commodities than those in Table 12.
Table 12: Cost of the Monthly Subsistence Basket at 2012 Prices
Commodity
Required Quantity (kg) 2012 unit
price (K)
Total cost
(K)
Data
Sources Per person
per day
Per person
per month
Per household
Per montha
Maize 0.45 13.5 78.3 35.00 2740.50 b
Pulses 0.06 1.8 10.44 95.00 991.80 b
Cooking oil 0.025 0.75 4.35 900.00 3915.00 c
Sugar 0.02 0.6 3.48 225.00 783.00 d
Salt 0.005 0.15 0.87 95.00 82.65 d
Total 8512.95
a. Average household size is assumed to be 5.8.
b. Ministry of Agriculture, Irrigation & Water Development, Press Release The Daily Times, 8 March 2012-03-11
c. Open market average
d. Peoples Supermarket, 9 March 2012
4.3.5 The Perceived Needs (PN) Approach
During this study, respondents were asked to indicate what expenditure needs they expected the cash
transfer to meet, and how much they would consider adequate to meet such needs. The responses are
summarised in Table 13. Note that only 33 of the respondents provided recordable responses to this
question, and the response rate was even lower for some specific items (see row labelled “count”). Since
the self-assessment of perceived needs should already take into account any other expenditure sources that
the household may access, the adjustment for minimum afforded expenditure is not necessary. The average
perceived needs cost was K8,217 ($49.20) per household per month for all commodities. Obviously, the
coverage indicated was rather too broad relative to the objectives of the SCTC. However, the average
desired food transfer was at K2,850 (17.07) per household per month (almost equal to that suggested under
the food inflation approach), while that for education was K1,010 ($6.05).
Table13: Cost of Perceived Needs per Month
Item Food Clothing Education Health Shelter Labour Other Total
Count 25 14 15 20 10 14 6 33
Average Cost (K) 2850 2460.714 1010 877.5 2460 6871.429 1991.667 8216.667
Average Cost ($) 17.07 14.73 6.05 5.25 14.73 41.15 11.93 49.20
4.3.6 The Desired Transfer Level Approach
All the respondents in the sample indicated that the current levels of cash transfer are quite low. This
position was also collaborated by all the key informants interviewed, although the informants were more
conscious of the severe financial limitations that would impact on the implementation of revised levels.
More relevantly, the respondents were also directly asked to indicate how much cash transfer they would
consider appropriate. This question received a 100% response rate among the respondent beneficiaries. The
responses are summarised in Table 14. The average food transfer level proposed was K2,714 ($16.25) per
household, while the primary school and secondary school bonuses had averages of K615 ($3.68) and
K1,025 (6.14), respectively. The average household size for all respondents in the sample was 5.1, so these
figures are comparable with those relating to the largest household size.
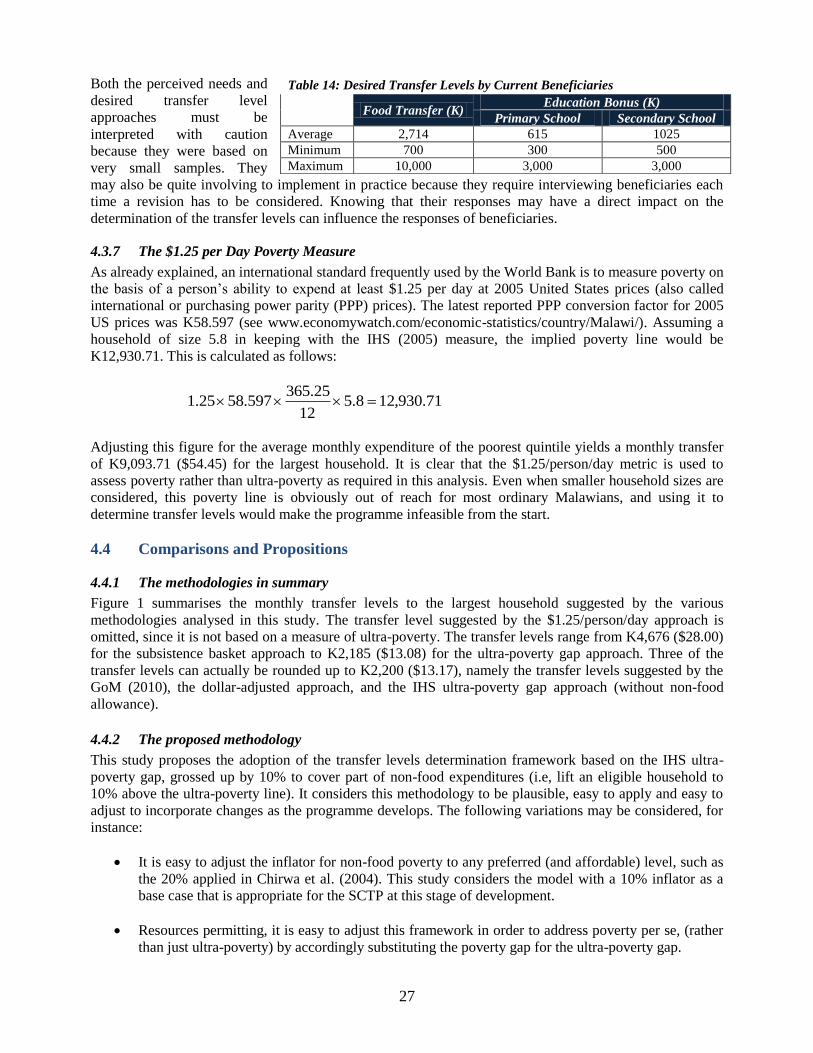
27
Both the perceived needs and
desired transfer level
approaches must be
interpreted with caution
because they were based on
very small samples. They
may also be quite involving to implement in practice because they require interviewing beneficiaries each
time a revision has to be considered. Knowing that their responses may have a direct impact on the
determination of the transfer levels can influence the responses of beneficiaries.
4.3.7 The $1.25 per Day Poverty Measure
As already explained, an international standard frequently used by the World Bank is to measure poverty on
the basis of a person‟s ability to expend at least $1.25 per day at 2005 United States prices (also called
international or purchasing power parity (PPP) prices). The latest reported PPP conversion factor for 2005
US prices was K58.597 (see www.economywatch.com/economic-statistics/country/Malawi/). Assuming a
household of size 5.8 in keeping with the IHS (2005) measure, the implied poverty line would be
K12,930.71. This is calculated as follows:
71.930,128.512
25.365597.5825.1
Adjusting this figure for the average monthly expenditure of the poorest quintile yields a monthly transfer
of K9,093.71 ($54.45) for the largest household. It is clear that the $1.25/person/day metric is used to
assess poverty rather than ultra-poverty as required in this analysis. Even when smaller household sizes are
considered, this poverty line is obviously out of reach for most ordinary Malawians, and using it to
determine transfer levels would make the programme infeasible from the start.
4.4 Comparisons and Propositions
4.4.1 The methodologies in summary
Figure 1 summarises the monthly transfer levels to the largest household suggested by the various
methodologies analysed in this study. The transfer level suggested by the $1.25/person/day approach is
omitted, since it is not based on a measure of ultra-poverty. The transfer levels range from K4,676 ($28.00)
for the subsistence basket approach to K2,185 ($13.08) for the ultra-poverty gap approach. Three of the
transfer levels can actually be rounded up to K2,200 ($13.17), namely the transfer levels suggested by the
GoM (2010), the dollar-adjusted approach, and the IHS ultra-poverty gap approach (without non-food
allowance).
4.4.2 The proposed methodology
This study proposes the adoption of the transfer levels determination framework based on the IHS ultra-
poverty gap, grossed up by 10% to cover part of non-food expenditures (i.e, lift an eligible household to
10% above the ultra-poverty line). It considers this methodology to be plausible, easy to apply and easy to
adjust to incorporate changes as the programme develops. The following variations may be considered, for
instance:
It is easy to adjust the inflator for non-food poverty to any preferred (and affordable) level, such as
the 20% applied in Chirwa et al. (2004). This study considers the model with a 10% inflator as a
base case that is appropriate for the SCTP at this stage of development.
Resources permitting, it is easy to adjust this framework in order to address poverty per se, (rather
than just ultra-poverty) by accordingly substituting the poverty gap for the ultra-poverty gap.
Table 14: Desired Transfer Levels by Current Beneficiaries
Food Transfer (K)
Education Bonus (K)
Primary School Secondary School
Average 2,714 615 1025
Minimum 700 300 500
Maximum 10,000 3,000 3,000
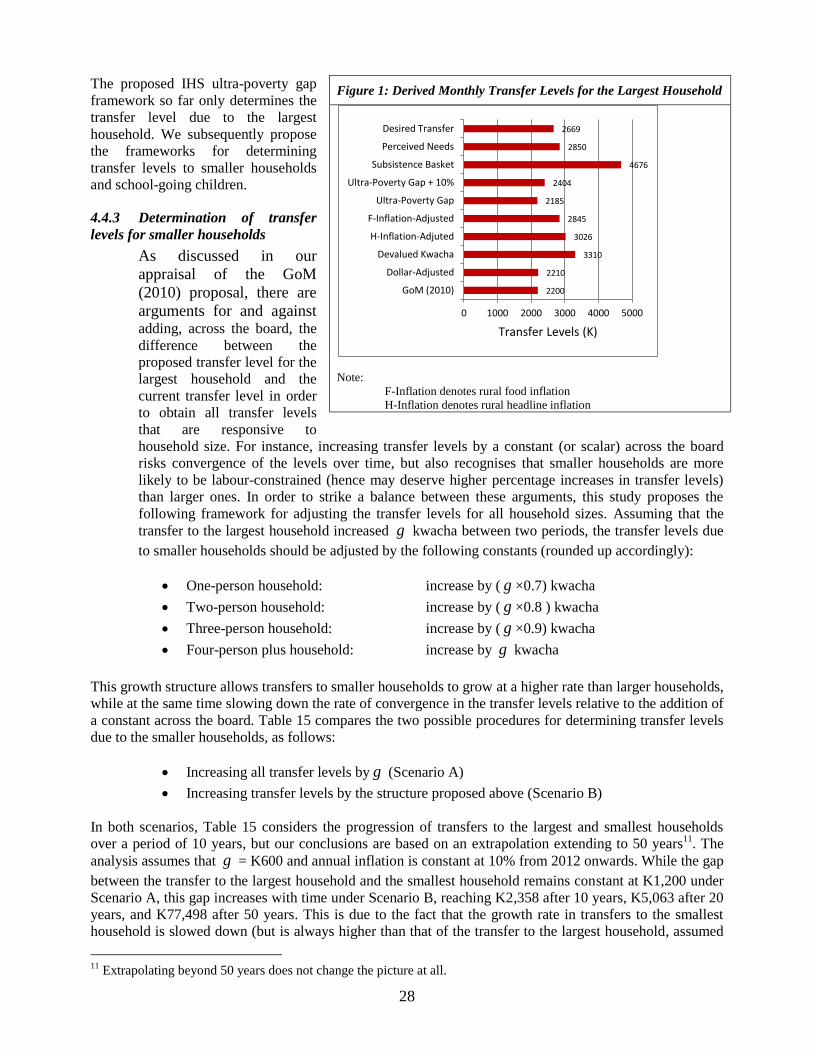
28
The proposed IHS ultra-poverty gap
framework so far only determines the
transfer level due to the largest
household. We subsequently propose
the frameworks for determining
transfer levels to smaller households
and school-going children.
4.4.3 Determination of transfer
levels for smaller households
As discussed in our
appraisal of the GoM
(2010) proposal, there are
arguments for and against adding, across the board, the
difference between the
proposed transfer level for the
largest household and the
current transfer level in order
to obtain all transfer levels
that are responsive to
household size. For instance, increasing transfer levels by a constant (or scalar) across the board
risks convergence of the levels over time, but also recognises that smaller households are more
likely to be labour-constrained (hence may deserve higher percentage increases in transfer levels)
than larger ones. In order to strike a balance between these arguments, this study proposes the
following framework for adjusting the transfer levels for all household sizes. Assuming that the
transfer to the largest household increased g kwacha between two periods, the transfer levels due
to smaller households should be adjusted by the following constants (rounded up accordingly):
One-person household: increase by ( g ×0.7) kwacha
Two-person household: increase by ( g ×0.8 ) kwacha
Three-person household: increase by ( g ×0.9) kwacha
Four-person plus household: increase by g kwacha
This growth structure allows transfers to smaller households to grow at a higher rate than larger households,
while at the same time slowing down the rate of convergence in the transfer levels relative to the addition of
a constant across the board. Table 15 compares the two possible procedures for determining transfer levels
due to the smaller households, as follows:
Increasing all transfer levels by g (Scenario A)
Increasing transfer levels by the structure proposed above (Scenario B)
In both scenarios, Table 15 considers the progression of transfers to the largest and smallest households
over a period of 10 years, but our conclusions are based on an extrapolation extending to 50 years11
. The
analysis assumes that g = K600 and annual inflation is constant at 10% from 2012 onwards. While the gap
between the transfer to the largest household and the smallest household remains constant at K1,200 under
Scenario A, this gap increases with time under Scenario B, reaching K2,358 after 10 years, K5,063 after 20
years, and K77,498 after 50 years. This is due to the fact that the growth rate in transfers to the smallest
household is slowed down (but is always higher than that of the transfer to the largest household, assumed
11
Extrapolating beyond 50 years does not change the picture at all.
Figure 1: Derived Monthly Transfer Levels for the Largest Household
Note:
F-Inflation denotes rural food inflation
H-Inflation denotes rural headline inflation
2200
2210
3310
3026
2845
2185
2404
4676
2850
2669
0 1000 2000 3000 4000 5000
GoM (2010)
Dollar-Adjusted
Devalued Kwacha
H-Inflation-Adjuted
F-Inflation-Adjusted
Ultra-Poverty Gap
Ultra-Poverty Gap + 10%
Subsistence Basket
Perceived Needs
Desired Transfer
Transfer Levels (K)
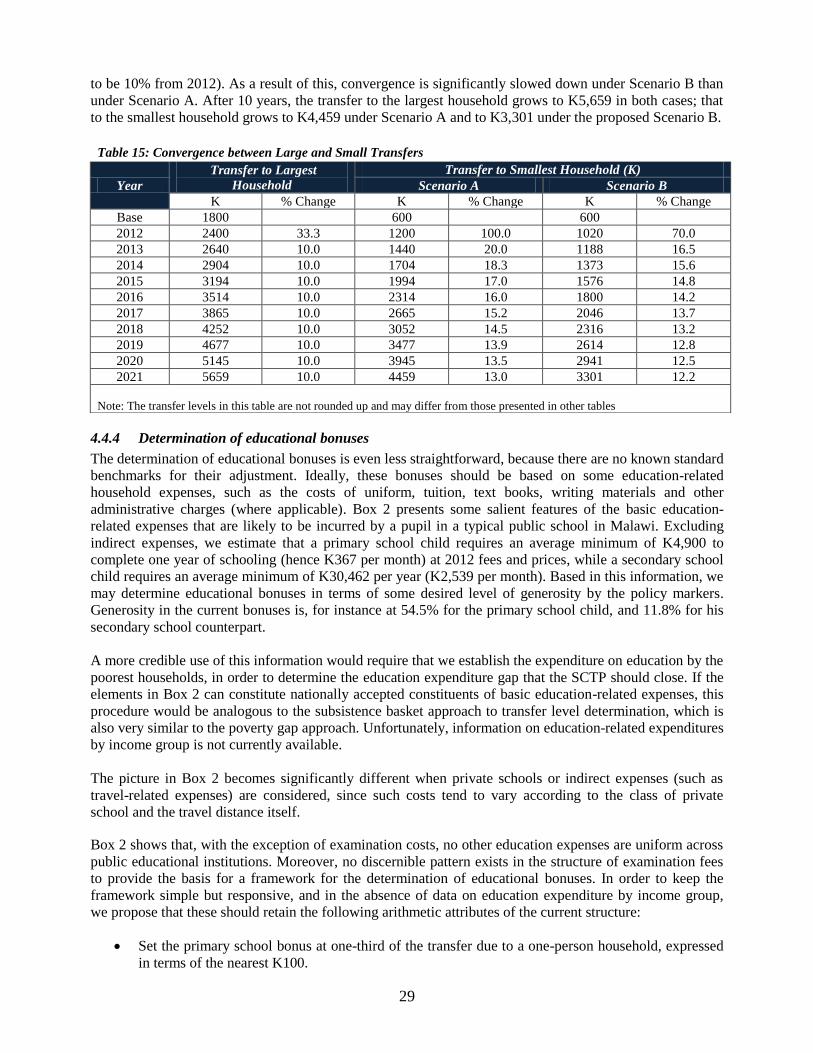
29
to be 10% from 2012). As a result of this, convergence is significantly slowed down under Scenario B than
under Scenario A. After 10 years, the transfer to the largest household grows to K5,659 in both cases; that
to the smallest household grows to K4,459 under Scenario A and to K3,301 under the proposed Scenario B.
4.4.4 Determination of educational bonuses
The determination of educational bonuses is even less straightforward, because there are no known standard
benchmarks for their adjustment. Ideally, these bonuses should be based on some education-related
household expenses, such as the costs of uniform, tuition, text books, writing materials and other
administrative charges (where applicable). Box 2 presents some salient features of the basic education-
related expenses that are likely to be incurred by a pupil in a typical public school in Malawi. Excluding
indirect expenses, we estimate that a primary school child requires an average minimum of K4,900 to
complete one year of schooling (hence K367 per month) at 2012 fees and prices, while a secondary school
child requires an average minimum of K30,462 per year (K2,539 per month). Based in this information, we
may determine educational bonuses in terms of some desired level of generosity by the policy markers.
Generosity in the current bonuses is, for instance at 54.5% for the primary school child, and 11.8% for his
secondary school counterpart.
A more credible use of this information would require that we establish the expenditure on education by the
poorest households, in order to determine the education expenditure gap that the SCTP should close. If the
elements in Box 2 can constitute nationally accepted constituents of basic education-related expenses, this
procedure would be analogous to the subsistence basket approach to transfer level determination, which is
also very similar to the poverty gap approach. Unfortunately, information on education-related expenditures
by income group is not currently available.
The picture in Box 2 becomes significantly different when private schools or indirect expenses (such as
travel-related expenses) are considered, since such costs tend to vary according to the class of private
school and the travel distance itself.
Box 2 shows that, with the exception of examination costs, no other education expenses are uniform across
public educational institutions. Moreover, no discernible pattern exists in the structure of examination fees
to provide the basis for a framework for the determination of educational bonuses. In order to keep the
framework simple but responsive, and in the absence of data on education expenditure by income group,
we propose that these should retain the following arithmetic attributes of the current structure:
Set the primary school bonus at one-third of the transfer due to a one-person household, expressed
in terms of the nearest K100.
Table 15: Convergence between Large and Small Transfers
Year
Transfer to Largest
Household
Transfer to Smallest Household (K)
Scenario A Scenario B
K % Change K % Change K % Change
Base 1800 600 600
2012 2400 33.3 1200 100.0 1020 70.0
2013 2640 10.0 1440 20.0 1188 16.5
2014 2904 10.0 1704 18.3 1373 15.6
2015 3194 10.0 1994 17.0 1576 14.8
2016 3514 10.0 2314 16.0 1800 14.2
2017 3865 10.0 2665 15.2 2046 13.7
2018 4252 10.0 3052 14.5 2316 13.2
2019 4677 10.0 3477 13.9 2614 12.8
2020 5145 10.0 3945 13.5 2941 12.5
2021 5659 10.0 4459 13.0 3301 12.2
Note: The transfer levels in this table are not rounded up and may differ from those presented in other tables
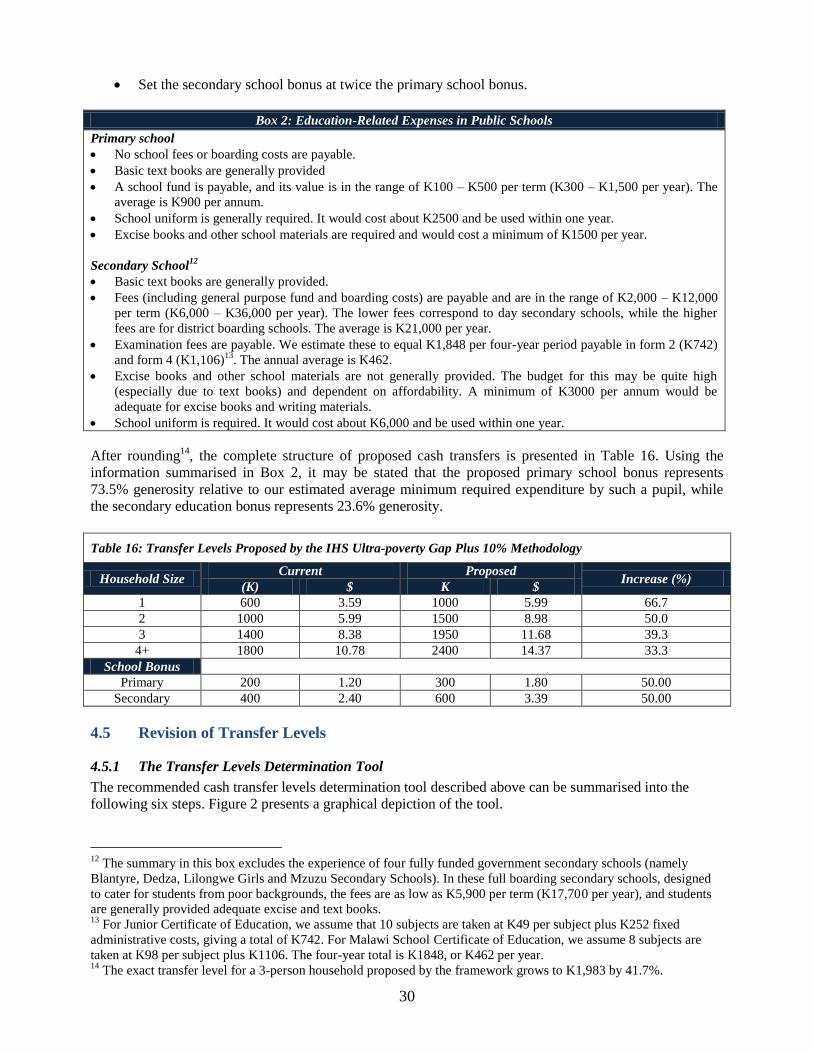
30
Set the secondary school bonus at twice the primary school bonus.
Box 2: Education-Related Expenses in Public Schools
Primary school
No school fees or boarding costs are payable.
Basic text books are generally provided
A school fund is payable, and its value is in the range of K100 – K500 per term (K300 – K1,500 per year). The
average is K900 per annum.
School uniform is generally required. It would cost about K2500 and be used within one year.
Excise books and other school materials are required and would cost a minimum of K1500 per year.
Secondary School12
Basic text books are generally provided.
Fees (including general purpose fund and boarding costs) are payable and are in the range of K2,000 – K12,000
per term (K6,000 – K36,000 per year). The lower fees correspond to day secondary schools, while the higher
fees are for district boarding schools. The average is K21,000 per year.
Examination fees are payable. We estimate these to equal K1,848 per four-year period payable in form 2 (K742)
and form 4 (K1,106)13
. The annual average is K462.
Excise books and other school materials are not generally provided. The budget for this may be quite high
(especially due to text books) and dependent on affordability. A minimum of K3000 per annum would be
adequate for excise books and writing materials.
School uniform is required. It would cost about K6,000 and be used within one year.
After rounding14
, the complete structure of proposed cash transfers is presented in Table 16. Using the
information summarised in Box 2, it may be stated that the proposed primary school bonus represents
73.5% generosity relative to our estimated average minimum required expenditure by such a pupil, while
the secondary education bonus represents 23.6% generosity.
Table 16: Transfer Levels Proposed by the IHS Ultra-poverty Gap Plus 10% Methodology
Household Size Current Proposed
Increase (%) (K) $ K $
1 600 3.59 1000 5.99 66.7
2 1000 5.99 1500 8.98 50.0
3 1400 8.38 1950 11.68 39.3
4+ 1800 10.78 2400 14.37 33.3
School Bonus
Primary 200 1.20 300 1.80 50.00
Secondary 400 2.40 600 3.39 50.00
4.5 Revision of Transfer Levels
4.5.1 The Transfer Levels Determination Tool
The recommended cash transfer levels determination tool described above can be summarised into the
following six steps. Figure 2 presents a graphical depiction of the tool.
12
The summary in this box excludes the experience of four fully funded government secondary schools (namely
Blantyre, Dedza, Lilongwe Girls and Mzuzu Secondary Schools). In these full boarding secondary schools, designed
to cater for students from poor backgrounds, the fees are as low as K5,900 per term (K17,700 per year), and students
are generally provided adequate excise and text books. 13
For Junior Certificate of Education, we assume that 10 subjects are taken at K49 per subject plus K252 fixed
administrative costs, giving a total of K742. For Malawi School Certificate of Education, we assume 8 subjects are
taken at K98 per subject plus K1106. The four-year total is K1848, or K462 per year. 14
The exact transfer level for a 3-person household proposed by the framework grows to K1,983 by 41.7%.
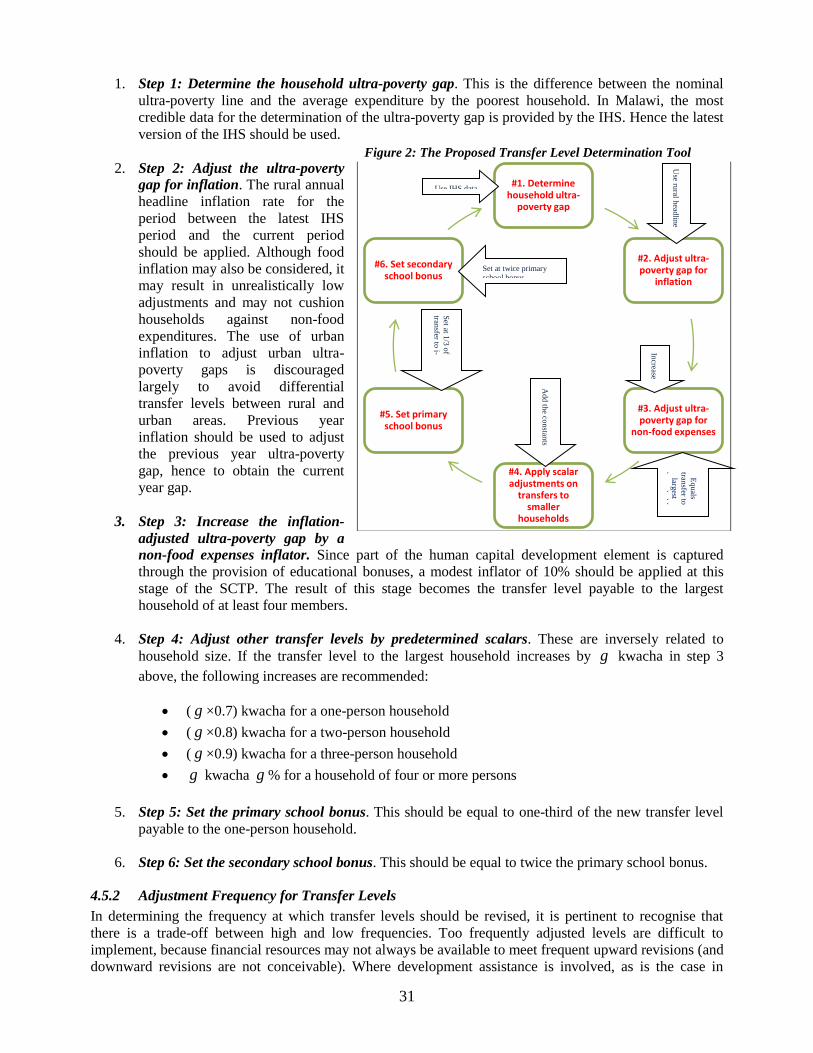
31
1. Step 1: Determine the household ultra-poverty gap. This is the difference between the nominal
ultra-poverty line and the average expenditure by the poorest household. In Malawi, the most
credible data for the determination of the ultra-poverty gap is provided by the IHS. Hence the latest
version of the IHS should be used.
2. Step 2: Adjust the ultra-poverty
gap for inflation. The rural annual
headline inflation rate for the
period between the latest IHS
period and the current period
should be applied. Although food
inflation may also be considered, it
may result in unrealistically low
adjustments and may not cushion
households against non-food
expenditures. The use of urban
inflation to adjust urban ultra-
poverty gaps is discouraged
largely to avoid differential
transfer levels between rural and
urban areas. Previous year
inflation should be used to adjust
the previous year ultra-poverty
gap, hence to obtain the current
year gap.
3. Step 3: Increase the inflation-
adjusted ultra-poverty gap by a
non-food expenses inflator. Since part of the human capital development element is captured
through the provision of educational bonuses, a modest inflator of 10% should be applied at this
stage of the SCTP. The result of this stage becomes the transfer level payable to the largest
household of at least four members.
4. Step 4: Adjust other transfer levels by predetermined scalars. These are inversely related to
household size. If the transfer level to the largest household increases by g kwacha in step 3
above, the following increases are recommended:
( g ×0.7) kwacha for a one-person household
( g ×0.8) kwacha for a two-person household
( g ×0.9) kwacha for a three-person household
g kwacha g % for a household of four or more persons
5. Step 5: Set the primary school bonus. This should be equal to one-third of the new transfer level
payable to the one-person household.
6. Step 6: Set the secondary school bonus. This should be equal to twice the primary school bonus.
4.5.2 Adjustment Frequency for Transfer Levels
In determining the frequency at which transfer levels should be revised, it is pertinent to recognise that
there is a trade-off between high and low frequencies. Too frequently adjusted levels are difficult to
implement, because financial resources may not always be available to meet frequent upward revisions (and
downward revisions are not conceivable). Where development assistance is involved, as is the case in
Figure 2: The Proposed Transfer Level Determination Tool
#1. Determine household ultra-
poverty gap
#2. Adjust ultra-poverty gap for
inflation
#3. Adjust ultra-poverty gap for
non-food expenses
#4. Apply scalar adjustments on
transfers to smaller
households
#5. Set primary school bonus
#6. Set secondary school bonus
Use IHS data
Use ru
ral head
line
inflatio
n rate
Increase
by 1
0%
Add th
e constan
ts
determ
ined
in stu
dy
Set at 1
/3 o
f
transfer to
i-
perso
n h
ouseh
old
Set at twice primary
school bonus
Equals
transfer to
largest
househ
old
32
Malawi, donors would usually require a lead period of at least one year (and usually more) to programme.
At the pilot phase with low coverage, resource limitations usually make it less feasible to revise levels
upwards too frequently, because of the associated trade-off between scaling up and coping with changes in
the cost of living. On the other hand, very sticky transfer levels tend to lose their purchasing power in an
inflationary environment, thereby compromising the accomplishment of programme objectives. This is
particularly so when transfer levels are set too low at the time of programme introduction.
In five out of ten key informant meetings where the question of frequency was discussed, annual reviews
were considered appropriate. Reviews every two or three years were proposed in three such meetings, while
interviewees in the remaining two meetings could not suggest a frequency. The annual review process was
considered a potentially feasible part of the annual budgeting process, especially if a clear framework for
revising transfer levels can be developed. Where two or three years were suggested, the need to respond to
triggers such as episodes of very high rural inflation was also suggested.
This study recommends that:
a) Annual reviews should be adopted for the purpose of re-examining transfer levels. Apart from
ensuring that transfer levels are responsive to changes, annual reviews have the advantage that
costs will adjust quite slowly from year to year under normal conditions (especially when rural
inflation remains low). This increases the likelihood that such revisions can be accommodated in
financial planning, both by the GoM and development partners.
b) If the application of the adjustment tool in a given review period results in an adjustment of less
than 5% to the prevailing ultra-poverty gap, the transfer levels need not be revised in that period.
5. Cost Implications
5.1 Introduction
This section presents the cost implications of the proposed transfer level determination framework (IHS
ultra-poverty gap plus 10%), alongside the following selection of alternative frameworks discussed above:
The current approach (i.e., the transfer levels currently applicable)
The GoM approach
The food-inflation-adjusted approach
The headline-inflation-adjusted approach
The devalued kwacha approach
The desired transfer level approach
The IHS ultra-poverty gap approach (without the 10% increase)
The current approach used in the payment of transfers is included for comparison of cost implications. The
analysis ignores costing the dollar-adjusted approach because it is nested in the ultra-poverty gap approach
(without the 10% grossing) in terms of the proposed transfer level for the largest household, and yields too
low transfers for smaller households. The perceived needs approach is equally ignored because it is nested
in the food inflation approach. The subsistence basket approach is ignored because it is a clear outliner in
the class of frameworks considered, and cannot generate a bankable proposal of transfer levels. Although
the GoM (2010) proposed approach has the same transfer level for the largest family as the ultra-poverty
line approach, it is included in this analysis because of the fixed education banuses suggested, and because
the distribution of beneficiary households is different in this study relative to the GoM proposal. Finally, we
include the devalued kwacha approach in order to examine the potential risk that may arise from this
possibility.
33
The transfer levels for the largest household determined in this study are rounded up for convenience, as
follows:
The IHS ultra-poverty gap plus 10% approach: K2,400
The IHS ultra-poverty gap approach: K2,200
The food-inflation-adjusted approach: K2,800
The headline-inflation-adjusted approach: K3,000
The desired transfer level approach: K2,700
The devalued kwacha approach: K3,300
5.2 Assumptions
5.2.1 Educational bonuses
We assume that the educational bonuses proposed in the context of the ultra-poverty gap plus 10%
approach can be applied in all other approaches derived in this study, viz: K300 per month for each primary
school child, and K600 per month for each secondary school child. The GoM (2010) proposal retains
educational bonuses at K200 and K300, respectively.
5.2.1 Average transfer level per household
To estimate the cost implications, we must assume an average transfer level per household. In practice, this
can only be established after implementation, and has been a variable from around K1,750 to K2,000 in the
Malawi SCTP. We assume that this will be equal to the transfer level payable to the largest household plus
one primary school bonus per month. Hence the following average transfer levels are assumed:
The current approach : K2,000
The GoM approach: K2,400
The ultra-poverty gap approach: K2,500
The ultra-poverty gap plus 10% approach: K2,700
The desired transfer level approach: K3,000
The food-inflation-adjusted approach: K3,100
The headline-inflation-adjusted approach: K3,300
The devalued kwacha approach: K3,700
5.2.3 Sequencing of target districts We assume that the programme will start by scaling up delivery in the present pilot districts, and
sequentially add new districts on the basis of their ultra-poverty headcount ratios as provided in the Welfare
Monitoring Survey (2007)15
.
5.2.4 Indirect Costs This analysis does not explicitly include indirect or administrative costs of implementing or scaling up the
programme. Only direct costs (i.e., actual transfers to households) are considered. Where comparability
requires that administrative costs be considered, however, these are set at 14.5% of direct costs in line with
the GoM (2010) proposal.
5.3 Costing Outcomes
The results of this costing process are presented in Annex 10 for the monthly cost implications, and Annex
11 for the annual costs. Policy makers may decide how many districts they can afford to cover given
15
As indicated, this is the latest available information on district-level poverty. This should be updated when more
recent data becomes available.
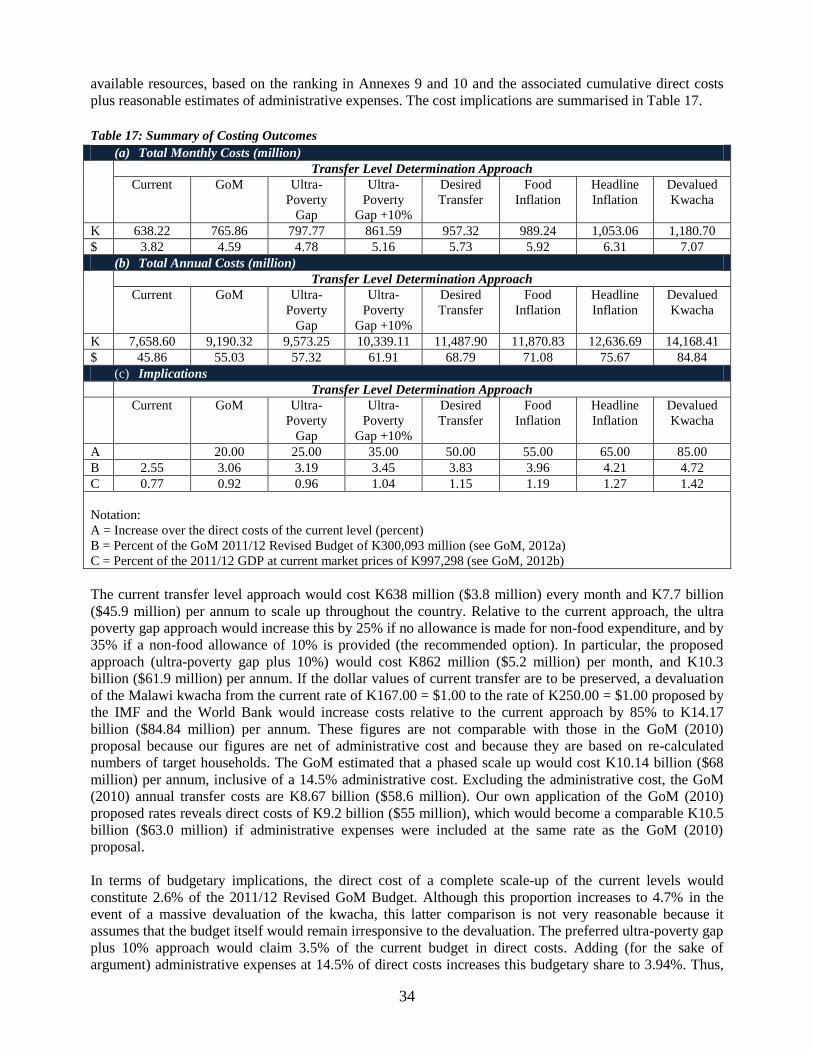
34
available resources, based on the ranking in Annexes 9 and 10 and the associated cumulative direct costs
plus reasonable estimates of administrative expenses. The cost implications are summarised in Table 17.
Table 17: Summary of Costing Outcomes
(a) Total Monthly Costs (million)
Transfer Level Determination Approach
Current GoM Ultra-
Poverty
Gap
Ultra-
Poverty
Gap +10%
Desired
Transfer
Food
Inflation
Headline
Inflation
Devalued
Kwacha
K 638.22 765.86 797.77 861.59 957.32 989.24 1,053.06 1,180.70
$ 3.82 4.59 4.78 5.16 5.73 5.92 6.31 7.07
(b) Total Annual Costs (million)
Transfer Level Determination Approach
Current GoM Ultra-
Poverty
Gap
Ultra-
Poverty
Gap +10%
Desired
Transfer
Food
Inflation
Headline
Inflation
Devalued
Kwacha
K 7,658.60 9,190.32 9,573.25 10,339.11 11,487.90 11,870.83 12,636.69 14,168.41
$ 45.86 55.03 57.32 61.91 68.79 71.08 75.67 84.84
(c) Implications
Transfer Level Determination Approach
Current GoM Ultra-
Poverty
Gap
Ultra-
Poverty
Gap +10%
Desired
Transfer
Food
Inflation
Headline
Inflation
Devalued
Kwacha
A 20.00 25.00 35.00 50.00 55.00 65.00 85.00
B 2.55 3.06 3.19 3.45 3.83 3.96 4.21 4.72
C 0.77 0.92 0.96 1.04 1.15 1.19 1.27 1.42
Notation:
A = Increase over the direct costs of the current level (percent)
B = Percent of the GoM 2011/12 Revised Budget of K300,093 million (see GoM, 2012a)
C = Percent of the 2011/12 GDP at current market prices of K997,298 (see GoM, 2012b)
The current transfer level approach would cost K638 million ($3.8 million) every month and K7.7 billion
($45.9 million) per annum to scale up throughout the country. Relative to the current approach, the ultra
poverty gap approach would increase this by 25% if no allowance is made for non-food expenditure, and by
35% if a non-food allowance of 10% is provided (the recommended option). In particular, the proposed
approach (ultra-poverty gap plus 10%) would cost K862 million ($5.2 million) per month, and K10.3
billion ($61.9 million) per annum. If the dollar values of current transfer are to be preserved, a devaluation
of the Malawi kwacha from the current rate of K167.00 = $1.00 to the rate of K250.00 = $1.00 proposed by
the IMF and the World Bank would increase costs relative to the current approach by 85% to K14.17
billion ($84.84 million) per annum. These figures are not comparable with those in the GoM (2010)
proposal because our figures are net of administrative cost and because they are based on re-calculated
numbers of target households. The GoM estimated that a phased scale up would cost K10.14 billion ($68
million) per annum, inclusive of a 14.5% administrative cost. Excluding the administrative cost, the GoM
(2010) annual transfer costs are K8.67 billion ($58.6 million). Our own application of the GoM (2010)
proposed rates reveals direct costs of K9.2 billion ($55 million), which would become a comparable K10.5
billion ($63.0 million) if administrative expenses were included at the same rate as the GoM (2010)
proposal.
In terms of budgetary implications, the direct cost of a complete scale-up of the current levels would
constitute 2.6% of the 2011/12 Revised GoM Budget. Although this proportion increases to 4.7% in the
event of a massive devaluation of the kwacha, this latter comparison is not very reasonable because it
assumes that the budget itself would remain irresponsive to the devaluation. The preferred ultra-poverty gap
plus 10% approach would claim 3.5% of the current budget in direct costs. Adding (for the sake of
argument) administrative expenses at 14.5% of direct costs increases this budgetary share to 3.94%. Thus,
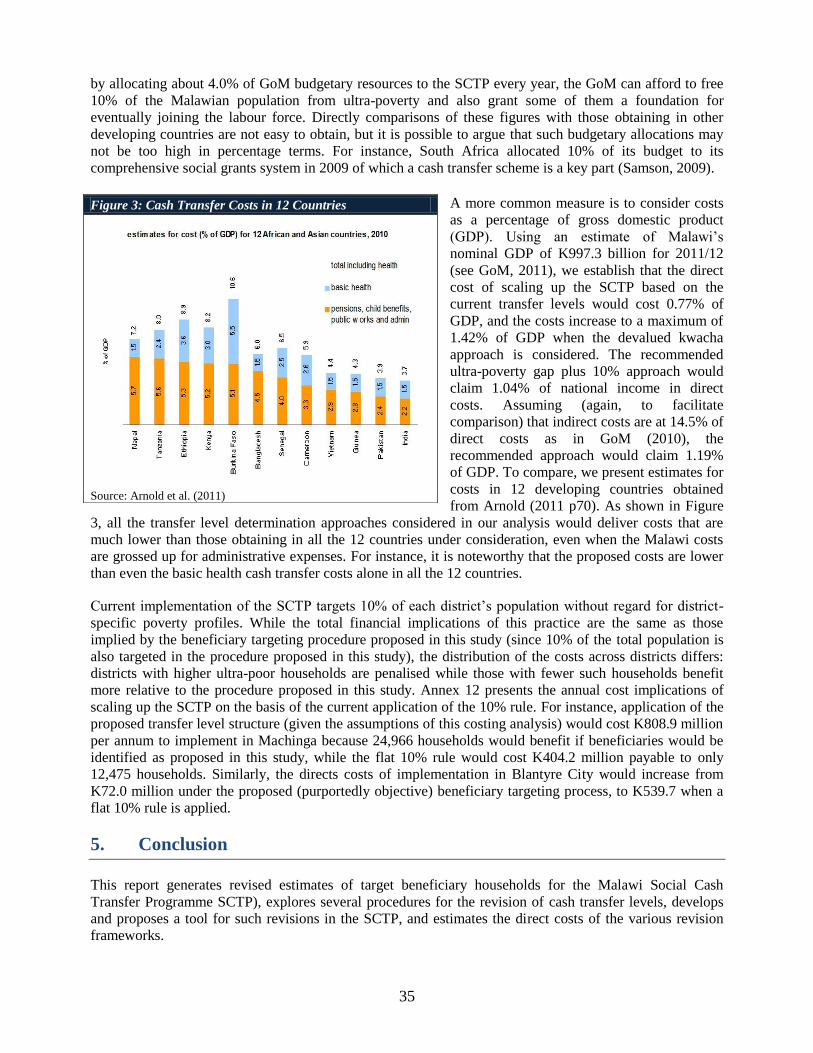
35
by allocating about 4.0% of GoM budgetary resources to the SCTP every year, the GoM can afford to free
10% of the Malawian population from ultra-poverty and also grant some of them a foundation for
eventually joining the labour force. Directly comparisons of these figures with those obtaining in other
developing countries are not easy to obtain, but it is possible to argue that such budgetary allocations may
not be too high in percentage terms. For instance, South Africa allocated 10% of its budget to its
comprehensive social grants system in 2009 of which a cash transfer scheme is a key part (Samson, 2009).
A more common measure is to consider costs
as a percentage of gross domestic product
(GDP). Using an estimate of Malawi‟s
nominal GDP of K997.3 billion for 2011/12
(see GoM, 2011), we establish that the direct
cost of scaling up the SCTP based on the
current transfer levels would cost 0.77% of
GDP, and the costs increase to a maximum of
1.42% of GDP when the devalued kwacha
approach is considered. The recommended
ultra-poverty gap plus 10% approach would
claim 1.04% of national income in direct
costs. Assuming (again, to facilitate
comparison) that indirect costs are at 14.5% of
direct costs as in GoM (2010), the
recommended approach would claim 1.19%
of GDP. To compare, we present estimates for
costs in 12 developing countries obtained
from Arnold (2011 p70). As shown in Figure
3, all the transfer level determination approaches considered in our analysis would deliver costs that are
much lower than those obtaining in all the 12 countries under consideration, even when the Malawi costs
are grossed up for administrative expenses. For instance, it is noteworthy that the proposed costs are lower
than even the basic health cash transfer costs alone in all the 12 countries.
Current implementation of the SCTP targets 10% of each district‟s population without regard for district-
specific poverty profiles. While the total financial implications of this practice are the same as those
implied by the beneficiary targeting procedure proposed in this study (since 10% of the total population is
also targeted in the procedure proposed in this study), the distribution of the costs across districts differs:
districts with higher ultra-poor households are penalised while those with fewer such households benefit
more relative to the procedure proposed in this study. Annex 12 presents the annual cost implications of
scaling up the SCTP on the basis of the current application of the 10% rule. For instance, application of the
proposed transfer level structure (given the assumptions of this costing analysis) would cost K808.9 million
per annum to implement in Machinga because 24,966 households would benefit if beneficiaries would be
identified as proposed in this study, while the flat 10% rule would cost K404.2 million payable to only
12,475 households. Similarly, the directs costs of implementation in Blantyre City would increase from
K72.0 million under the proposed (purportedly objective) beneficiary targeting process, to K539.7 when a
flat 10% rule is applied.
5. Conclusion
This report generates revised estimates of target beneficiary households for the Malawi Social Cash
Transfer Programme SCTP), explores several procedures for the revision of cash transfer levels, develops
and proposes a tool for such revisions in the SCTP, and estimates the direct costs of the various revision
frameworks.
Figure 3: Cash Transfer Costs in 12 Countries
Source: Arnold et al. (2011)
36
The key recommendation of the study is that the revision of transfer levels should be based on the ultra-
poverty gap approach inflated by 10%. It is argued herein that this is easy to apply, easy to incorporate
revisions, and prudent in the use of public resources. The proposed approach involves expressing the
transfer level payable to the largest household as being equal to the ultra-poverty gap after adjusting for
inflation and increasing by 10% to meet part of non-food expenses necessary for human capital formation.
The report further proposes a structure for revising transfer levels for smaller households. These are
inversely related to household size, and are set to slow down the process of convergence of transfer levels
over time. Moreover, the structure still retains the attribute that transfers payable to smaller households
should grow at a relatively higher rate than those payable to larger households. The primary school bonus is
determined as being equal to one-third of the transfer payable to a one-person household, while the
secondary school bonus is equal to twice that payable to a primary school child.
Annual reviews of transfer levels are recommended, but levels should only change if the ultra-poverty gap
changes by at least 5%.
The study establishes that a 319, 108 households would be targeted in a full scale-up of the SCTP in 2012.
Application of the proposed tool in a programme scale-up would imply K861.6 million ($5.16 million) per
month or K10.3 billion ($61.91 million) per annum in direct costs. This is 35% higher than the cost of
rolling out based on the current transfer levels. The cost of implementing the proposed framework is also
equivalent to 3.45% of the GoM Revised Budget for 2011/12, and 1.04% of GDP.
37
Annex 1: References
ADB (Asian Development Bank). (2006), ‘Social Protection Index for Committed Poverty Reduction’,
Manila, ADB.
Arnold, C., and Conway, T. (2011), ‘Cash Transfers: Literature Review’, Department for International
Development.
Chirwa, E (2010), „Exploring the Scope of Social Protection as an Instrument for Achieving MDGs in
Malawi‟, Economic Commission for Africa.
Chirwa, E., and Mvula, P. (2004), ‘ Study to inform the selection of an appropriate wage rate for for
public works programmes in Malawi’ Malawi Social Action Fund, Lilongwe
Chirwa, E., McCord, A., and Mvula, P., and Pinder, C., (2004), ‘ Study to inform the selection of an
appropriate wage rate for pur public works programmes in Malawi’ Malawi Social Action Fund,
Lilongwe
Devereux, S., Marshall, J., MacAskill, J., and Pelham, L. (2005), ‘Making Cash Count: Lessons from
Cash Transfer Skills in Eastern and Southern Africa for Supporting the Most Vulnerable Children
and Households”. UNICEF.
Ellis, F., Devereux, S. and White, P. (2009) ‘Social Protection in Africa‟, Cheltenham: Edward Elgar.
Gassmann, F., and Behrendt, C. (2006), Cash benefits in low income countries: simulating the effects on
poverty for Senegal and Tanzania, Issues in Social Protection, International Labour Office, Geneva.
GoM/World Bank (2007), „Malawi Poverty and Vulnerability Assessment: Investing in Our Future –
Full Report, Government of Malawi and the World Bank, Lilongwe
GoM (2009), „The Malawi Growth and Development Strategy: Annual Review 2009’, Ministry of
Development Planning and Cooperation, Lilongwe.
Government of Malawi (2010), „Malawi Social Cash Transfer Programme‟, Ministry of Gender,
Children and Community Development, Lilongwe.
Government of Malawi (2011), „National Social Support Programme: Final Report‟, Ministry of
Development Planning and Cooperation, Lilongwe.
Government of Malawi (2011), ‘National Social Support Policy’, Draft, Ministry of Finance and
Development Planning, Lilongwe.
Grosh, M., del Ninno, C., Tesliuc, E., and Ouerghi, A. (2009) ‘For Protection and Promotion: The
Design and Implementation of Effective Safety Nets.‟ Washington DC: The World Bank
IHS (2005): Government of Malawi (2005), „Integrated Household Survey 2004-05‟, National Statistical
Office, Zomba
Miller, C. (2009), ‘Economic Impact Report of the Mchinji Social Cash Transfer Pilot’, Boston
University and Centre for Social Research.
Miller, C., Tsoka, M., and Reichert, K. (2008), ‘External Evaluation of the Mchinji Social Cash
Transfer Pilot’, Boston University and Centre for Social Research.
38
Samson, M., Niekerk, van I., and Quene, K. (2006), ‘Designing and Implementing Social Transfer
Programmes’, EPRI Press, Cape Town.
Samson, M. (2009), ‘Social Cash Transfers and Pro-Poor Growth’, OECD Paper.
Schubert, B., and Huijbregts, M. (2006), ‘The Malawi Social Cash Transfer Pilot Scheme, Preliminary
Lessons Learned‟. Paper presented at the Conference on “Social Protection Initiatives for Children,
Women and Families: An Analysis of Recent Experiences” New York, 30-31 October 2006
Slater, R., Holmes, R., and McCord, A. (2010), Cash Transfers and Poverty Reduction in Sub Saharan
Africa: Pragmatism or Wishful Thinking?, CPRC Conference Presentation, ODI.
Teslius, E., Grosh, M., and del Ninno, C. (2010), ‘Social Assistance Schemes Across the World:
Eligibility Conditions and Benefits’, downloaded at
http://umdcipe.org/conferences/oecdumd/conf_papers/Papers/Tesliuc_Grosh_DelNinno.pdf on 10 January
2012.
WMS (2007): Government of Malawi (2007), „Welfare Monitoring Survey 2007’, National Statistical
Office, Zomba.
WMS (2009): Government of Malawi (2009), „Welfare Monitoring Survey 2009’, National Statistical
Office, Zomba
39
Annex 2: List of National Level Key Informants
Name Organization Maki Kato Chief Social Policy, UNICEF Sophie Shawa Social Protection Officer, UNICEF Harry Mwamlima Director for Poverty Reduction and Social
Protection, Ministry of Economic Planning and
Development Ann Namagonya Programme Coordinator, Social Cash Transfer
Secretariat, Ministry of Gender, Child Development
and Community Development Mr. Kansinjiro Principal Social Welfare Officer (Capacity
Building), Social Cash Transfer Secretariat,
Ministry of Gender, Child Development and
Community Development Faida Mbwana Social Welfare Officer (Community Case
Management), Social Cash Transfer Secretariat,
Ministry of Gender, Child Development and
Community Development Jessie Nyirenda Advocacy, Partnership and Communications
Officer, Social Cash Transfer Secretariat, Ministry
of Gender, Child Development and Community
Development Adrian Fitzgerard Head of Development, Irish Aid Lovely Chizimba Vulnerability Advisor, Irish Aid Maria Winnubst Attache, Delegation of the European Union to the
Republic of Malawi Duncan Ndhlovu Programme Officer (Food Security), World Food
Programme Ted Sitimawina Principal Secretary for Economic Planning and
Development Chiyambi Mataya Programme Officer, Joint Oxfam Programme in
Malawi Fumakazi Munthali Social Policy Advisor, Department for International
Development of the UK Government Patience Kanjere KfW Lemekezani Mukiwa, Project Manager, CARE Malawi Mrs H. Kulemeka Director of Child Development Affairs, Ministry of
Gender, Child Development and Community
Development Mr. R.W. Malemia Chief Labour Officer (Labour Relations), Ministry
of Labour Mr. B.M. Chirwa Chief Labour Officer, Ministry of Labour
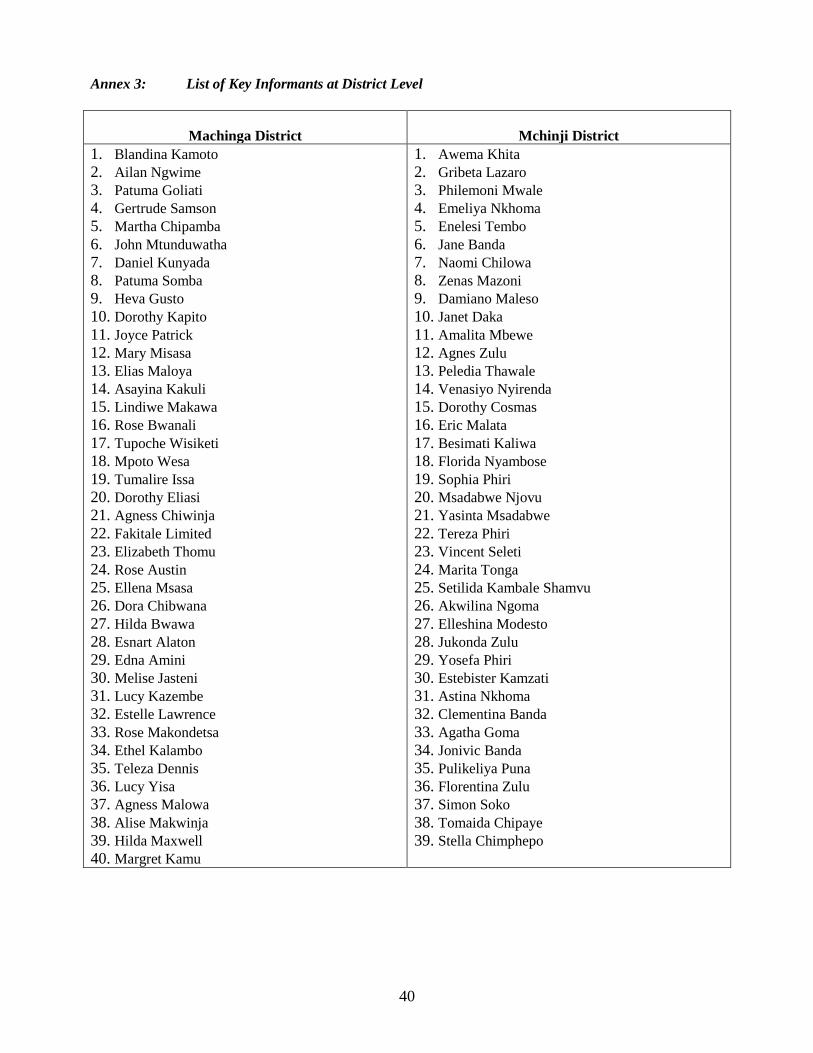
40
Annex 3: List of Key Informants at District Level
Machinga District Mchinji District
1. Blandina Kamoto 2. Ailan Ngwime 3. Patuma Goliati 4. Gertrude Samson 5. Martha Chipamba
6. John Mtunduwatha 7. Daniel Kunyada 8. Patuma Somba 9. Heva Gusto 10. Dorothy Kapito
11. Joyce Patrick 12. Mary Misasa 13. Elias Maloya 14. Asayina Kakuli 15. Lindiwe Makawa 16. Rose Bwanali
17. Tupoche Wisiketi 18. Mpoto Wesa 19. Tumalire Issa 20. Dorothy Eliasi 21. Agness Chiwinja
22. Fakitale Limited 23. Elizabeth Thomu 24. Rose Austin 25. Ellena Msasa 26. Dora Chibwana
27. Hilda Bwawa 28. Esnart Alaton 29. Edna Amini 30. Melise Jasteni 31. Lucy Kazembe 32. Estelle Lawrence
33. Rose Makondetsa 34. Ethel Kalambo 35. Teleza Dennis 36. Lucy Yisa 37. Agness Malowa
38. Alise Makwinja 39. Hilda Maxwell 40. Margret Kamu
1. Awema Khita 2. Gribeta Lazaro 3. Philemoni Mwale 4. Emeliya Nkhoma 5. Enelesi Tembo
6. Jane Banda 7. Naomi Chilowa 8. Zenas Mazoni 9. Damiano Maleso 10. Janet Daka
11. Amalita Mbewe 12. Agnes Zulu 13. Peledia Thawale 14. Venasiyo Nyirenda 15. Dorothy Cosmas 16. Eric Malata
17. Besimati Kaliwa 18. Florida Nyambose 19. Sophia Phiri 20. Msadabwe Njovu 21. Yasinta Msadabwe
22. Tereza Phiri 23. Vincent Seleti 24. Marita Tonga 25. Setilida Kambale Shamvu 26. Akwilina Ngoma
27. Elleshina Modesto 28. Jukonda Zulu 29. Yosefa Phiri 30. Estebister Kamzati 31. Astina Nkhoma 32. Clementina Banda
33. Agatha Goma 34. Jonivic Banda 35. Pulikeliya Puna 36. Florentina Zulu 37. Simon Soko
38. Tomaida Chipaye 39. Stella Chimphepo
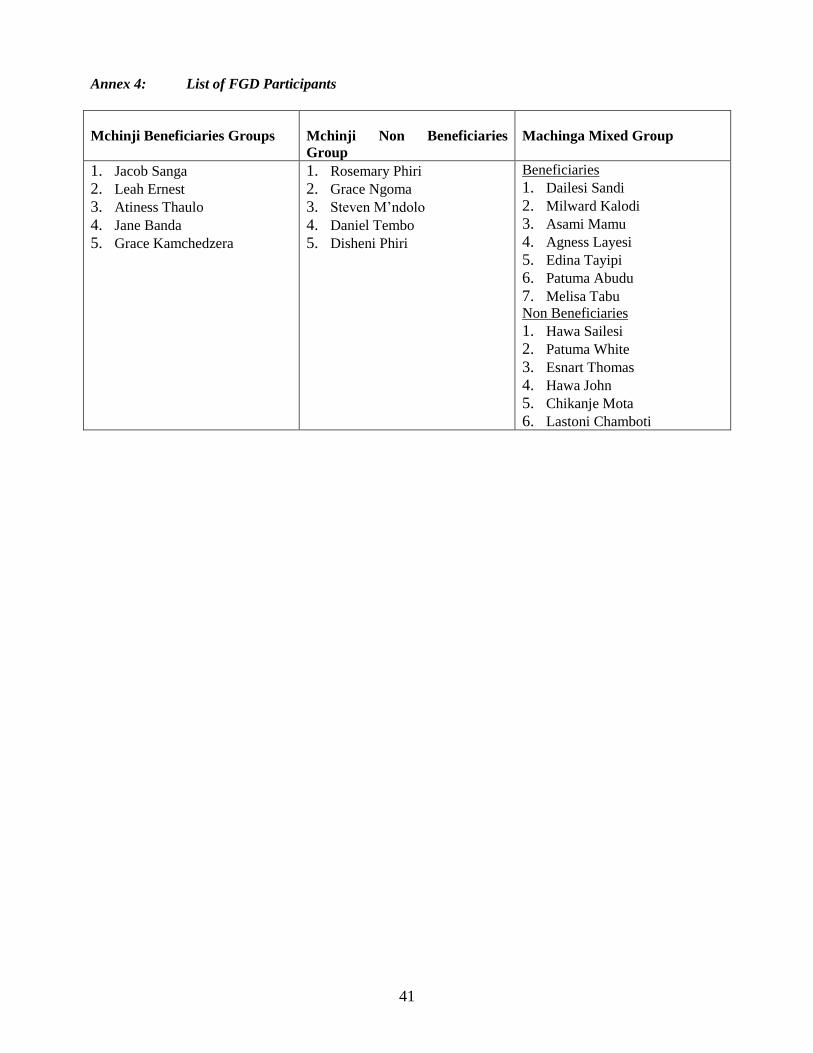
41
Annex 4: List of FGD Participants
Mchinji Beneficiaries Groups Mchinji Non Beneficiaries
Group Machinga Mixed Group
1. Jacob Sanga 2. Leah Ernest 3. Atiness Thaulo
4. Jane Banda 5. Grace Kamchedzera
1. Rosemary Phiri 2. Grace Ngoma 3. Steven M‟ndolo
4. Daniel Tembo 5. Disheni Phiri
Beneficiaries 1. Dailesi Sandi
2. Milward Kalodi 3. Asami Mamu 4. Agness Layesi 5. Edina Tayipi 6. Patuma Abudu
7. Melisa Tabu Non Beneficiaries 1. Hawa Sailesi 2. Patuma White
3. Esnart Thomas 4. Hawa John 5. Chikanje Mota 6. Lastoni Chamboti
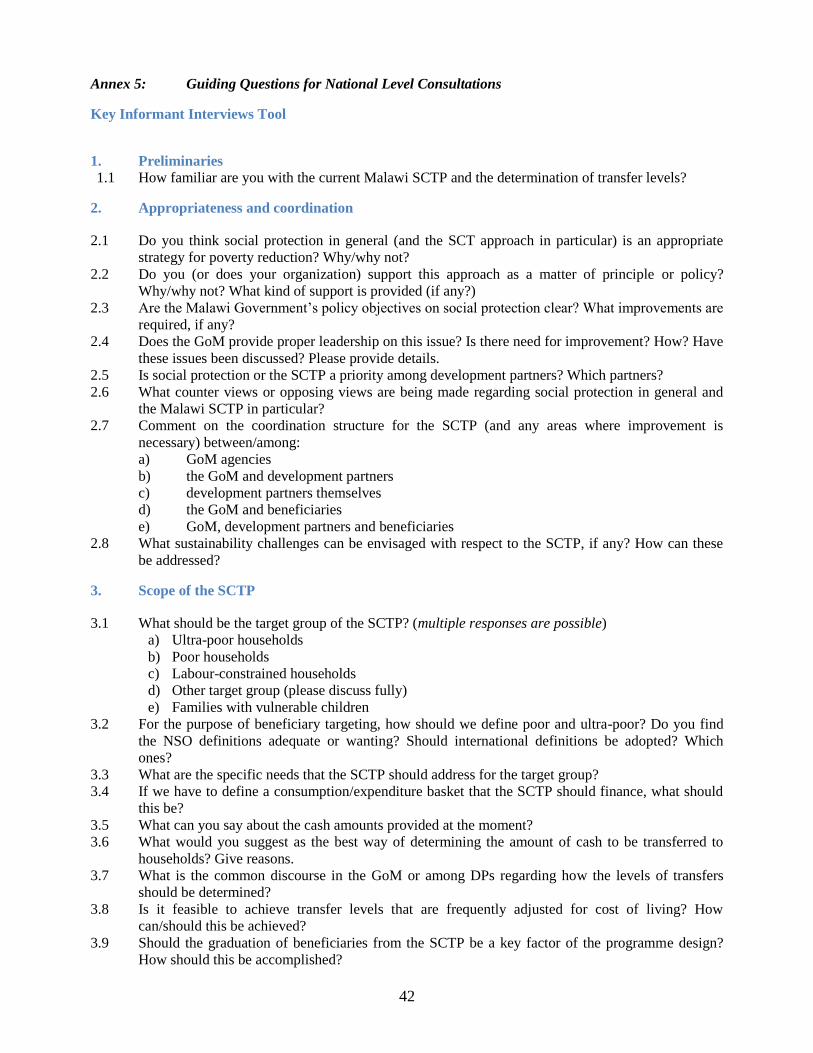
42
Annex 5: Guiding Questions for National Level Consultations
Key Informant Interviews Tool
1. Preliminaries
1.1 How familiar are you with the current Malawi SCTP and the determination of transfer levels?
2. Appropriateness and coordination
2.1 Do you think social protection in general (and the SCT approach in particular) is an appropriate
strategy for poverty reduction? Why/why not?
2.2 Do you (or does your organization) support this approach as a matter of principle or policy?
Why/why not? What kind of support is provided (if any?)
2.3 Are the Malawi Government‟s policy objectives on social protection clear? What improvements are
required, if any?
2.4 Does the GoM provide proper leadership on this issue? Is there need for improvement? How? Have
these issues been discussed? Please provide details.
2.5 Is social protection or the SCTP a priority among development partners? Which partners?
2.6 What counter views or opposing views are being made regarding social protection in general and
the Malawi SCTP in particular?
2.7 Comment on the coordination structure for the SCTP (and any areas where improvement is
necessary) between/among:
a) GoM agencies
b) the GoM and development partners
c) development partners themselves
d) the GoM and beneficiaries
e) GoM, development partners and beneficiaries
2.8 What sustainability challenges can be envisaged with respect to the SCTP, if any? How can these
be addressed?
3. Scope of the SCTP
3.1 What should be the target group of the SCTP? (multiple responses are possible)
a) Ultra-poor households
b) Poor households
c) Labour-constrained households
d) Other target group (please discuss fully)
e) Families with vulnerable children
3.2 For the purpose of beneficiary targeting, how should we define poor and ultra-poor? Do you find
the NSO definitions adequate or wanting? Should international definitions be adopted? Which
ones?
3.3 What are the specific needs that the SCTP should address for the target group?
3.4 If we have to define a consumption/expenditure basket that the SCTP should finance, what should
this be?
3.5 What can you say about the cash amounts provided at the moment?
3.6 What would you suggest as the best way of determining the amount of cash to be transferred to
households? Give reasons.
3.7 What is the common discourse in the GoM or among DPs regarding how the levels of transfers
should be determined?
3.8 Is it feasible to achieve transfer levels that are frequently adjusted for cost of living? How
can/should this be achieved?
3.9 Should the graduation of beneficiaries from the SCTP be a key factor of the programme design?
How should this be accomplished?
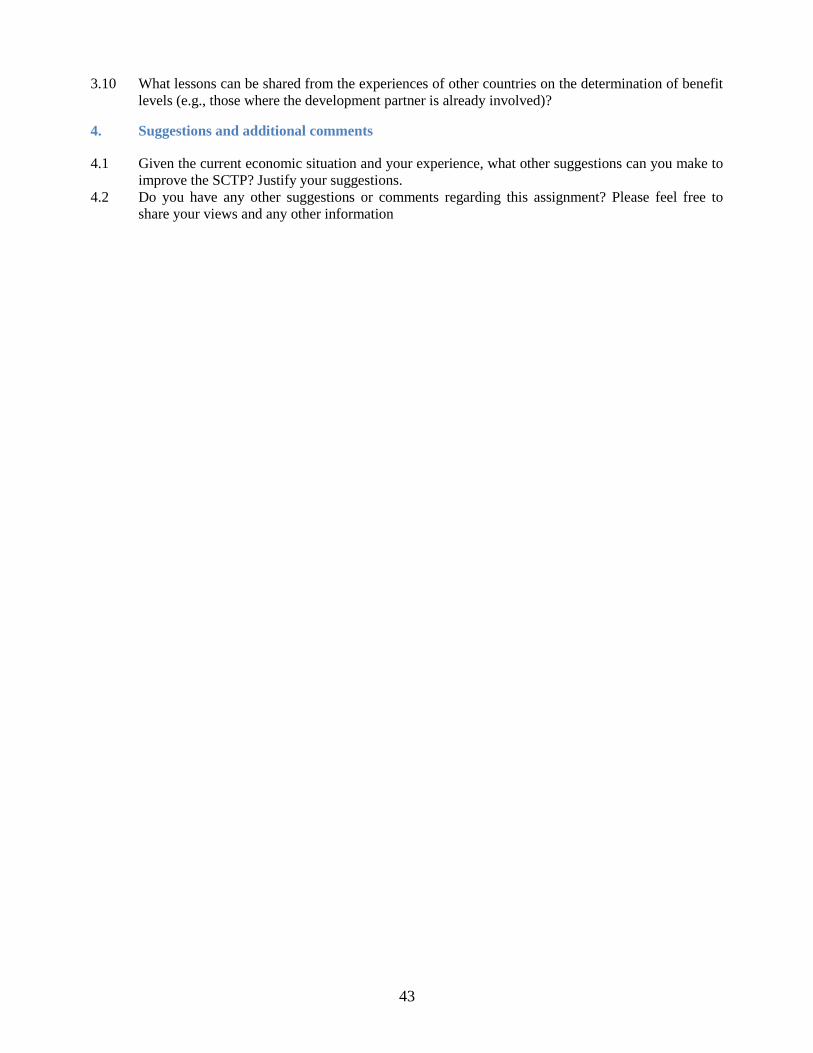
43
3.10 What lessons can be shared from the experiences of other countries on the determination of benefit
levels (e.g., those where the development partner is already involved)?
4. Suggestions and additional comments
4.1 Given the current economic situation and your experience, what other suggestions can you make to
improve the SCTP? Justify your suggestions.
4.2 Do you have any other suggestions or comments regarding this assignment? Please feel free to
share your views and any other information
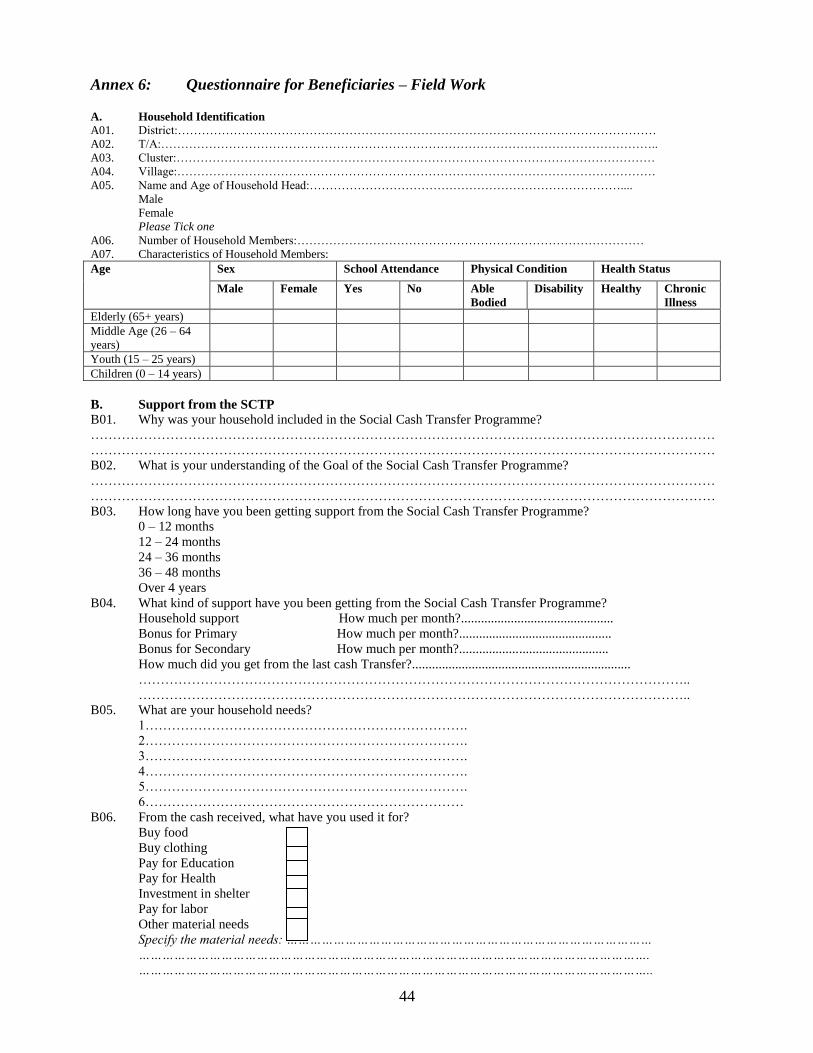
44
Annex 6: Questionnaire for Beneficiaries – Field Work
A. Household Identification
A01. District:…………………………………………………………………………………………………………
A02. T/A:……………………………………………………………………………………………………………..
A03. Cluster:…………………………………………………………………………………………………………
A04. Village:…………………………………………………………………………………………………………
A05. Name and Age of Household Head:……………………………………………………………………....
Male
Female
Please Tick one
A06. Number of Household Members:……………………………………………………………………………
A07. Characteristics of Household Members:
Age Sex School Attendance Physical Condition Health Status
Male Female Yes No Able
Bodied
Disability Healthy Chronic
Illness
Elderly (65+ years)
Middle Age (26 – 64
years)
Youth (15 – 25 years)
Children (0 – 14 years)
B. Support from the SCTP
B01. Why was your household included in the Social Cash Transfer Programme?
……………………………………………………………………………………………………………………………
……………………………………………………………………………………………………………………………
B02. What is your understanding of the Goal of the Social Cash Transfer Programme?
……………………………………………………………………………………………………………………………
……………………………………………………………………………………………………………………………
B03. How long have you been getting support from the Social Cash Transfer Programme?
0 – 12 months
12 – 24 months
24 – 36 months
36 – 48 months
Over 4 years
B04. What kind of support have you been getting from the Social Cash Transfer Programme?
Household support How much per month?..............................................
Bonus for Primary How much per month?..............................................
Bonus for Secondary How much per month?.............................................
How much did you get from the last cash Transfer?..................................................................
……………………………………………………………………………………………………………..
……………………………………………………………………………………………………………..
B05. What are your household needs?
1……………………………………………………………….
2……………………………………………………………….
3……………………………………………………………….
4……………………………………………………………….
5……………………………………………………………….
6………………………………………………………………
B06. From the cash received, what have you used it for?
Buy food
Buy clothing
Pay for Education
Pay for Health
Investment in shelter
Pay for labor
Other material needs
Specify the material needs: …………………………………………………………………………………
………………………………………………………………………………………………………………….
…………………………………………………………………………………………………………………..
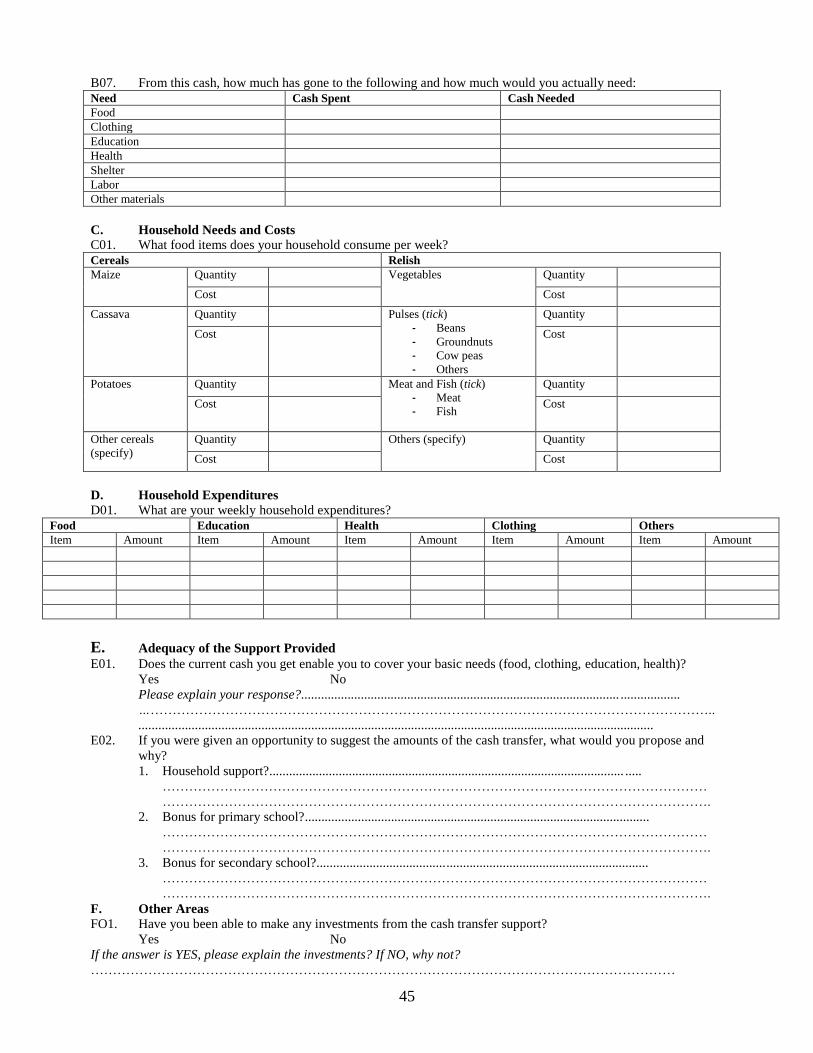
45
B07. From this cash, how much has gone to the following and how much would you actually need:
Need Cash Spent Cash Needed
Food
Clothing
Education
Health
Shelter
Labor
Other materials
C. Household Needs and Costs
C01. What food items does your household consume per week?
Cereals Relish
Maize Quantity Vegetables Quantity
Cost Cost
Cassava Quantity Pulses (tick)
- Beans
- Groundnuts
- Cow peas
- Others
Quantity
Cost Cost
Potatoes Quantity Meat and Fish (tick)
- Meat
- Fish
Quantity
Cost Cost
Other cereals
(specify)
Quantity Others (specify) Quantity
Cost Cost
D. Household Expenditures
D01. What are your weekly household expenditures?
Food Education Health Clothing Others
Item Amount Item Amount Item Amount Item Amount Item Amount
E. Adequacy of the Support Provided
E01. Does the current cash you get enable you to cover your basic needs (food, clothing, education, health)?
Yes No
Please explain your response?................................................................................................ ..................
…………………………………………………………………………………………………………………..
...........................................................................................................................................................
E02. If you were given an opportunity to suggest the amounts of the cash transfer, what would you propose and
why?
1. Household support?........................................................................................................... .....
……………………………………………………………………………………………………………
…………………………………………………………………………………………………………….
2. Bonus for primary school?........................................................................................................
……………………………………………………………………………………………………………
…………………………………………………………………………………………………………….
3. Bonus for secondary school?....................................................................................................
……………………………………………………………………………………………………………
…………………………………………………………………………………………………………….
F. Other Areas
FO1. Have you been able to make any investments from the cash transfer support?
Yes No
If the answer is YES, please explain the investments? If NO, why not?
……………………………………………………………………………………………………………………
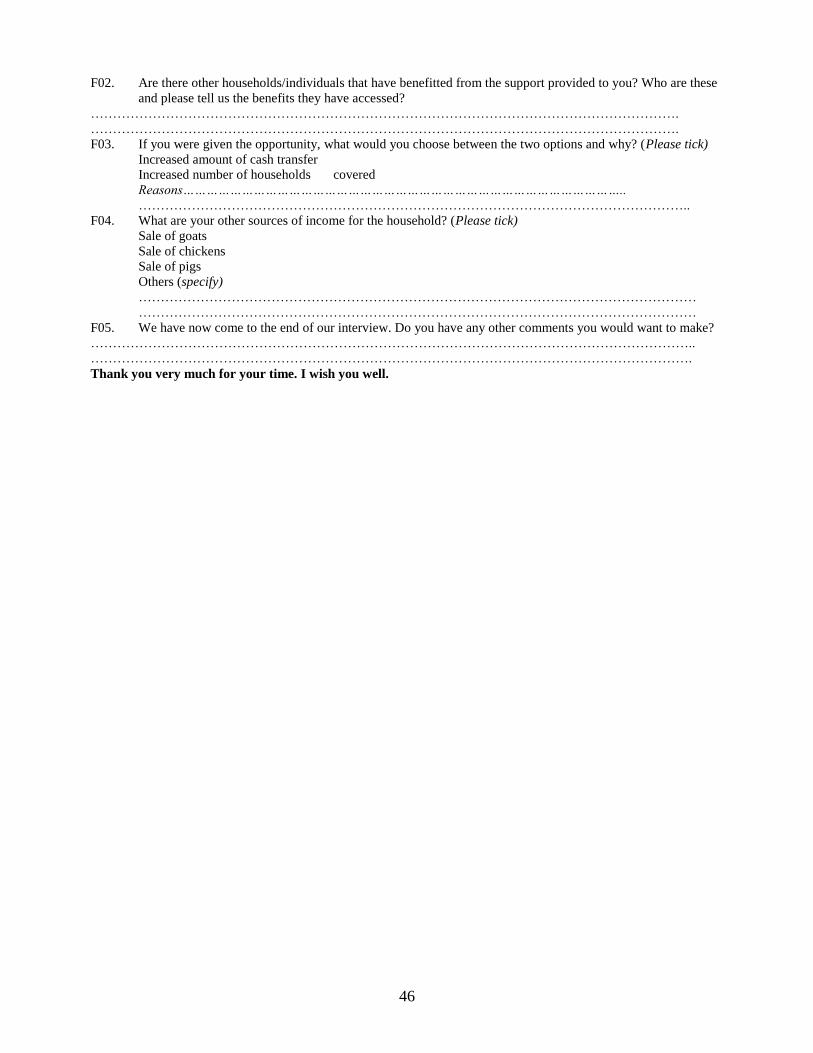
46
F02. Are there other households/individuals that have benefitted from the support provided to you? Who are these
and please tell us the benefits they have accessed?
…………………………………………………………………………………………………………………….
…………………………………………………………………………………………………………………….
F03. If you were given the opportunity, what would you choose between the two options and why? (Please tick)
Increased amount of cash transfer
Increased number of households covered
Reasons…………………………………………………………………………………………………..
……………………………………………………………………………………………………………..
F04. What are your other sources of income for the household? (Please tick)
Sale of goats
Sale of chickens
Sale of pigs
Others (specify)
………………………………………………………………………………………………………………
………………………………………………………………………………………………………………
F05. We have now come to the end of our interview. Do you have any other comments you would want to make?
………………………………………………………………………………………………………………………..
……………………………………………………………………………………………………………………….
Thank you very much for your time. I wish you well.
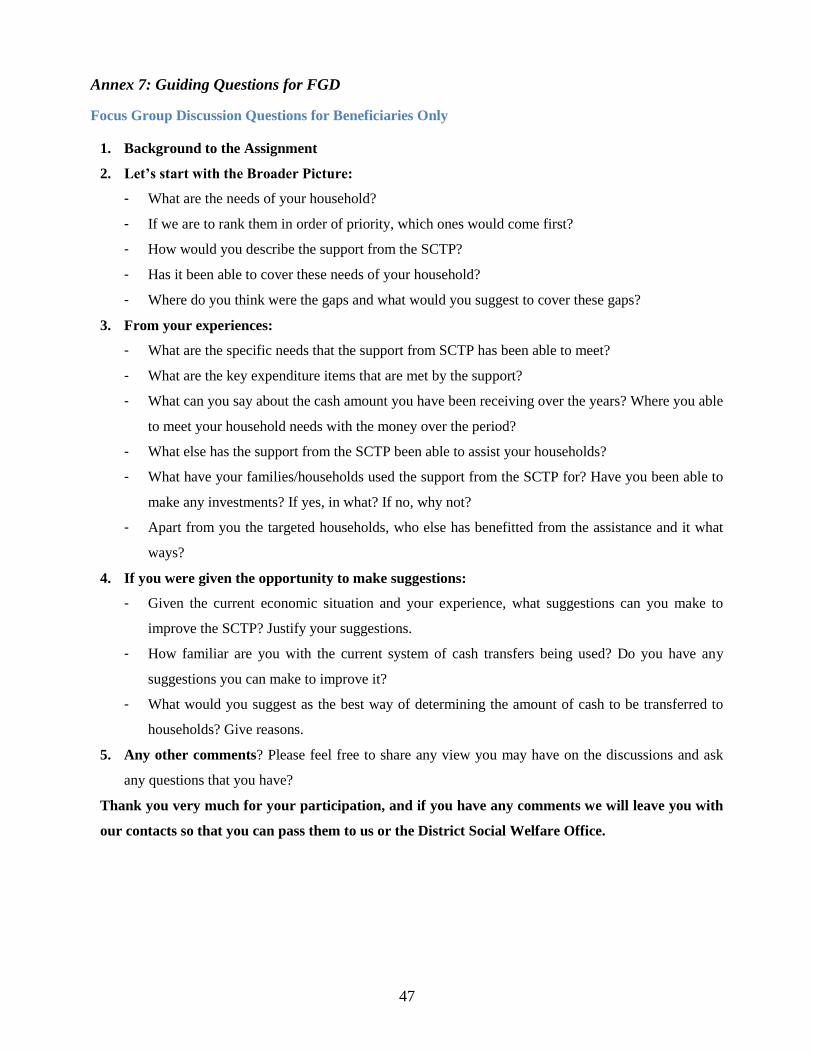
47
Annex 7: Guiding Questions for FGD
Focus Group Discussion Questions for Beneficiaries Only
1. Background to the Assignment
2. Let’s start with the Broader Picture:
- What are the needs of your household?
- If we are to rank them in order of priority, which ones would come first?
- How would you describe the support from the SCTP?
- Has it been able to cover these needs of your household?
- Where do you think were the gaps and what would you suggest to cover these gaps?
3. From your experiences:
- What are the specific needs that the support from SCTP has been able to meet?
- What are the key expenditure items that are met by the support?
- What can you say about the cash amount you have been receiving over the years? Where you able
to meet your household needs with the money over the period?
- What else has the support from the SCTP been able to assist your households?
- What have your families/households used the support from the SCTP for? Have you been able to
make any investments? If yes, in what? If no, why not?
- Apart from you the targeted households, who else has benefitted from the assistance and it what
ways?
4. If you were given the opportunity to make suggestions:
- Given the current economic situation and your experience, what suggestions can you make to
improve the SCTP? Justify your suggestions.
- How familiar are you with the current system of cash transfers being used? Do you have any
suggestions you can make to improve it?
- What would you suggest as the best way of determining the amount of cash to be transferred to
households? Give reasons.
5. Any other comments? Please feel free to share any view you may have on the discussions and ask
any questions that you have?
Thank you very much for your participation, and if you have any comments we will leave you with
our contacts so that you can pass them to us or the District Social Welfare Office.
48
Focus Group Discussion Questions with Non Beneficiaries
6. Background to the Assignment
7. Let’s start with the Broader Picture:
- How would you describe the support from the SCTP?
- Has it been able to cover the needs of the households targeted?
- Where do you think were the gaps and what would you suggest to cover these gaps?
8. From your experiences:
- What are the social and economic needs of the households/families being targeted?
- How has the SCTP assisted them to meet these needs?
- What else has the support from the SCTP been able to assist the household?
- What have the families/households used the support from the SCTP for? Have they been able to
make any investments? If yes, in what? If no, why not?
- Apart from the targeted households, who else has benefitted from the assistance and it what
ways?
9. If you were given the opportunity to make suggestions:
- Given the current economic situation and your experience, what suggestions can you make to
improve the SCTP? Justify your suggestions.
- How familiar are you with the current system of cash transfers being used? Do you have any
suggestions you can make to improve it?
- What would you suggest as the best way of determining the amount of cash to be transferred to
households? Give reasons.
10. Any other comments? Please feel free to share any view you may have on the discussions and ask
any questions that you have?
Thank you very much for your participation, and if you have any comments we will leave you with
our contacts so that you can pass them to us or the District Social Welfare Office.
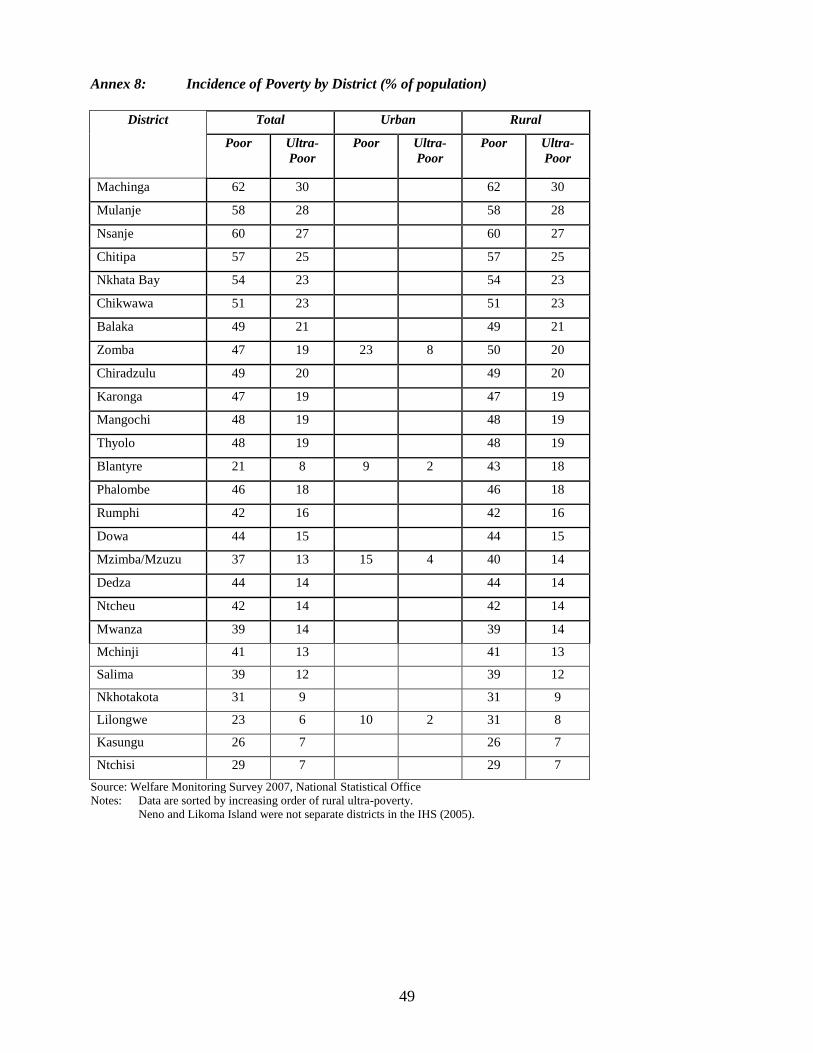
49
Annex 8: Incidence of Poverty by District (% of population)
District Total Urban Rural
Poor Ultra-
Poor
Poor Ultra-
Poor
Poor Ultra-
Poor
Machinga 62 30 62 30
Mulanje 58 28 58 28
Nsanje 60 27 60 27
Chitipa 57 25 57 25
Nkhata Bay 54 23 54 23
Chikwawa 51 23 51 23
Balaka 49 21 49 21
Zomba 47 19 23 8 50 20
Chiradzulu 49 20 49 20
Karonga 47 19 47 19
Mangochi 48 19 48 19
Thyolo 48 19 48 19
Blantyre 21 8 9 2 43 18
Phalombe 46 18 46 18
Rumphi 42 16 42 16
Dowa 44 15 44 15
Mzimba/Mzuzu 37 13 15 4 40 14
Dedza 44 14 44 14
Ntcheu 42 14 42 14
Mwanza 39 14 39 14
Mchinji 41 13 41 13
Salima 39 12 39 12
Nkhotakota 31 9 31 9
Lilongwe 23 6 10 2 31 8
Kasungu 26 7 26 7
Ntchisi 29 7 29 7
Source: Welfare Monitoring Survey 2007, National Statistical Office
Notes: Data are sorted by increasing order of rural ultra-poverty.
Neno and Likoma Island were not separate districts in the IHS (2005).
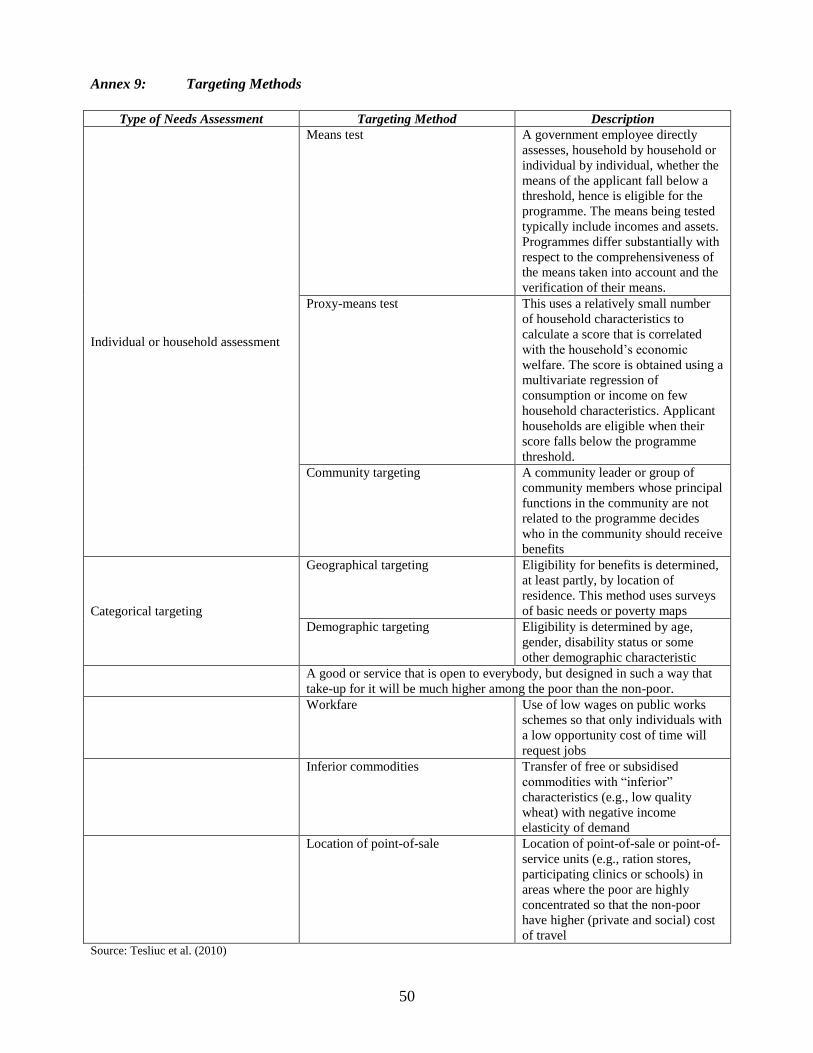
50
Annex 9: Targeting Methods
Type of Needs Assessment Targeting Method Description
Individual or household assessment
Means test A government employee directly
assesses, household by household or
individual by individual, whether the
means of the applicant fall below a
threshold, hence is eligible for the
programme. The means being tested
typically include incomes and assets.
Programmes differ substantially with
respect to the comprehensiveness of
the means taken into account and the
verification of their means.
Proxy-means test This uses a relatively small number
of household characteristics to
calculate a score that is correlated
with the household‟s economic
welfare. The score is obtained using a
multivariate regression of
consumption or income on few
household characteristics. Applicant
households are eligible when their
score falls below the programme
threshold.
Community targeting A community leader or group of
community members whose principal
functions in the community are not
related to the programme decides
who in the community should receive
benefits
Categorical targeting
Geographical targeting Eligibility for benefits is determined,
at least partly, by location of
residence. This method uses surveys
of basic needs or poverty maps
Demographic targeting Eligibility is determined by age,
gender, disability status or some
other demographic characteristic
A good or service that is open to everybody, but designed in such a way that
take-up for it will be much higher among the poor than the non-poor.
Workfare Use of low wages on public works
schemes so that only individuals with
a low opportunity cost of time will
request jobs
Inferior commodities Transfer of free or subsidised
commodities with “inferior”
characteristics (e.g., low quality
wheat) with negative income
elasticity of demand
Location of point-of-sale Location of point-of-sale or point-of-
service units (e.g., ration stores,
participating clinics or schools) in
areas where the poor are highly
concentrated so that the non-poor
have higher (private and social) cost
of travel Source: Tesliuc et al. (2010)
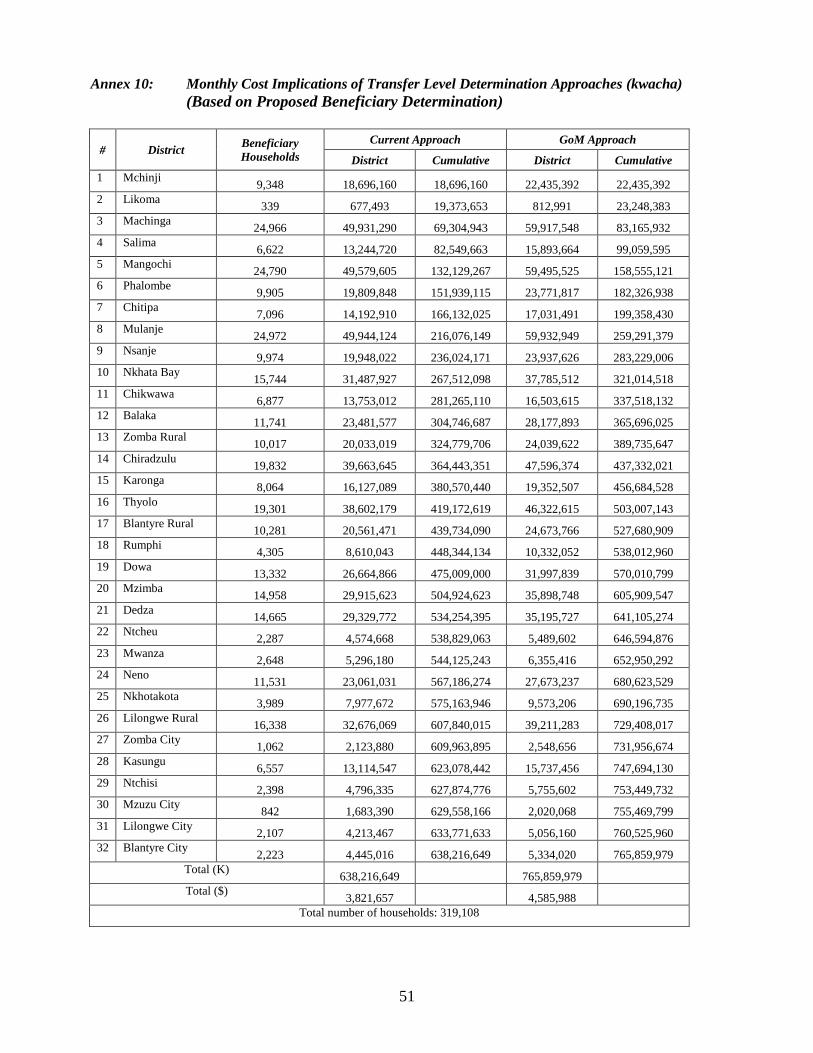
51
Annex 10: Monthly Cost Implications of Transfer Level Determination Approaches (kwacha)
(Based on Proposed Beneficiary Determination)
# District Beneficiary
Households
Current Approach GoM Approach
District Cumulative District Cumulative
1 Mchinji 9,348 18,696,160 18,696,160 22,435,392 22,435,392
2 Likoma 339 677,493 19,373,653 812,991 23,248,383
3 Machinga 24,966 49,931,290 69,304,943 59,917,548 83,165,932
4 Salima 6,622 13,244,720 82,549,663 15,893,664 99,059,595
5 Mangochi 24,790 49,579,605 132,129,267 59,495,525 158,555,121
6 Phalombe 9,905 19,809,848 151,939,115 23,771,817 182,326,938
7 Chitipa 7,096 14,192,910 166,132,025 17,031,491 199,358,430
8 Mulanje 24,972 49,944,124 216,076,149 59,932,949 259,291,379
9 Nsanje 9,974 19,948,022 236,024,171 23,937,626 283,229,006
10 Nkhata Bay 15,744 31,487,927 267,512,098 37,785,512 321,014,518
11 Chikwawa 6,877 13,753,012 281,265,110 16,503,615 337,518,132
12 Balaka 11,741 23,481,577 304,746,687 28,177,893 365,696,025
13 Zomba Rural 10,017 20,033,019 324,779,706 24,039,622 389,735,647
14 Chiradzulu 19,832 39,663,645 364,443,351 47,596,374 437,332,021
15 Karonga 8,064 16,127,089 380,570,440 19,352,507 456,684,528
16 Thyolo 19,301 38,602,179 419,172,619 46,322,615 503,007,143
17 Blantyre Rural 10,281 20,561,471 439,734,090 24,673,766 527,680,909
18 Rumphi 4,305 8,610,043 448,344,134 10,332,052 538,012,960
19 Dowa 13,332 26,664,866 475,009,000 31,997,839 570,010,799
20 Mzimba 14,958 29,915,623 504,924,623 35,898,748 605,909,547
21 Dedza 14,665 29,329,772 534,254,395 35,195,727 641,105,274
22 Ntcheu 2,287 4,574,668 538,829,063 5,489,602 646,594,876
23 Mwanza 2,648 5,296,180 544,125,243 6,355,416 652,950,292
24 Neno 11,531 23,061,031 567,186,274 27,673,237 680,623,529
25 Nkhotakota 3,989 7,977,672 575,163,946 9,573,206 690,196,735
26 Lilongwe Rural 16,338 32,676,069 607,840,015 39,211,283 729,408,017
27 Zomba City 1,062 2,123,880 609,963,895 2,548,656 731,956,674
28 Kasungu 6,557 13,114,547 623,078,442 15,737,456 747,694,130
29 Ntchisi 2,398 4,796,335 627,874,776 5,755,602 753,449,732
30 Mzuzu City 842 1,683,390 629,558,166 2,020,068 755,469,799
31 Lilongwe City 2,107 4,213,467 633,771,633 5,056,160 760,525,960
32 Blantyre City 2,223 4,445,016 638,216,649 5,334,020 765,859,979
Total (K) 638,216,649
765,859,979
Total ($) 3,821,657
4,585,988
Total number of households: 319,108
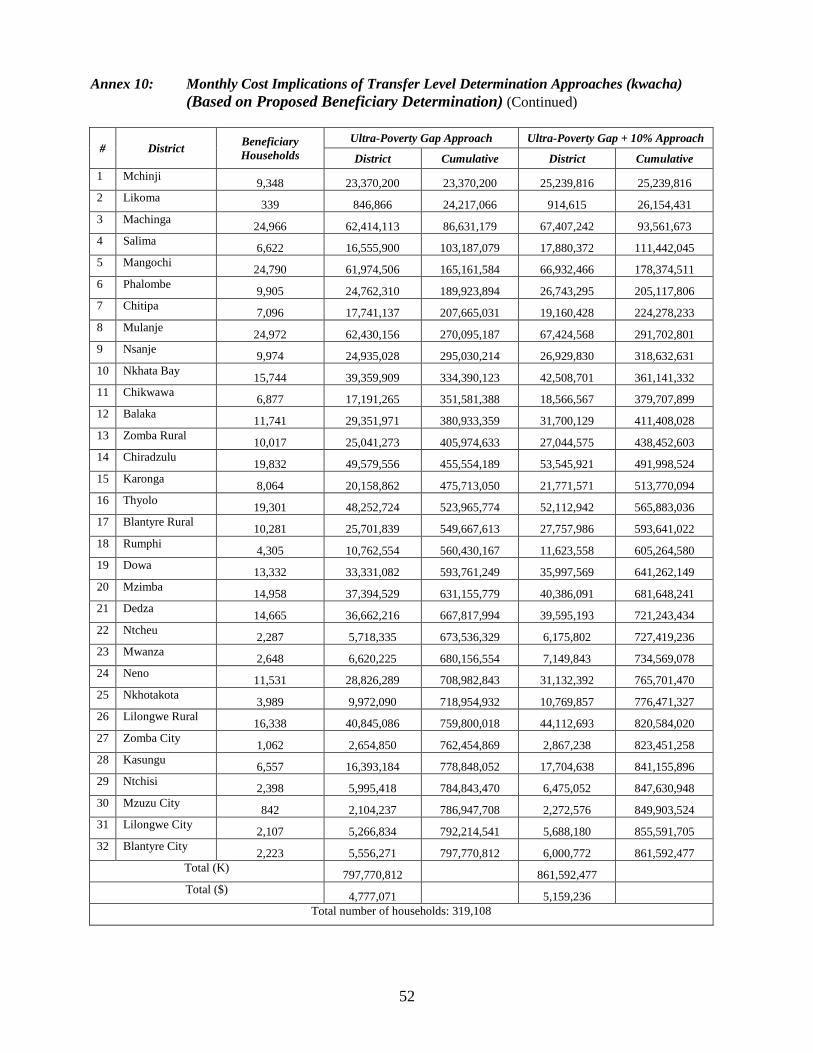
52
Annex 10: Monthly Cost Implications of Transfer Level Determination Approaches (kwacha)
(Based on Proposed Beneficiary Determination) (Continued)
# District Beneficiary
Households
Ultra-Poverty Gap Approach Ultra-Poverty Gap + 10% Approach
District Cumulative District Cumulative
1 Mchinji 9,348 23,370,200 23,370,200 25,239,816 25,239,816
2 Likoma 339 846,866 24,217,066 914,615 26,154,431
3 Machinga 24,966 62,414,113 86,631,179 67,407,242 93,561,673
4 Salima 6,622 16,555,900 103,187,079 17,880,372 111,442,045
5 Mangochi 24,790 61,974,506 165,161,584 66,932,466 178,374,511
6 Phalombe 9,905 24,762,310 189,923,894 26,743,295 205,117,806
7 Chitipa 7,096 17,741,137 207,665,031 19,160,428 224,278,233
8 Mulanje 24,972 62,430,156 270,095,187 67,424,568 291,702,801
9 Nsanje 9,974 24,935,028 295,030,214 26,929,830 318,632,631
10 Nkhata Bay 15,744 39,359,909 334,390,123 42,508,701 361,141,332
11 Chikwawa 6,877 17,191,265 351,581,388 18,566,567 379,707,899
12 Balaka 11,741 29,351,971 380,933,359 31,700,129 411,408,028
13 Zomba Rural 10,017 25,041,273 405,974,633 27,044,575 438,452,603
14 Chiradzulu 19,832 49,579,556 455,554,189 53,545,921 491,998,524
15 Karonga 8,064 20,158,862 475,713,050 21,771,571 513,770,094
16 Thyolo 19,301 48,252,724 523,965,774 52,112,942 565,883,036
17 Blantyre Rural 10,281 25,701,839 549,667,613 27,757,986 593,641,022
18 Rumphi 4,305 10,762,554 560,430,167 11,623,558 605,264,580
19 Dowa 13,332 33,331,082 593,761,249 35,997,569 641,262,149
20 Mzimba 14,958 37,394,529 631,155,779 40,386,091 681,648,241
21 Dedza 14,665 36,662,216 667,817,994 39,595,193 721,243,434
22 Ntcheu 2,287 5,718,335 673,536,329 6,175,802 727,419,236
23 Mwanza 2,648 6,620,225 680,156,554 7,149,843 734,569,078
24 Neno 11,531 28,826,289 708,982,843 31,132,392 765,701,470
25 Nkhotakota 3,989 9,972,090 718,954,932 10,769,857 776,471,327
26 Lilongwe Rural 16,338 40,845,086 759,800,018 44,112,693 820,584,020
27 Zomba City 1,062 2,654,850 762,454,869 2,867,238 823,451,258
28 Kasungu 6,557 16,393,184 778,848,052 17,704,638 841,155,896
29 Ntchisi 2,398 5,995,418 784,843,470 6,475,052 847,630,948
30 Mzuzu City 842 2,104,237 786,947,708 2,272,576 849,903,524
31 Lilongwe City 2,107 5,266,834 792,214,541 5,688,180 855,591,705
32 Blantyre City 2,223 5,556,271 797,770,812 6,000,772 861,592,477
Total (K) 797,770,812
861,592,477
Total ($) 4,777,071
5,159,236
Total number of households: 319,108
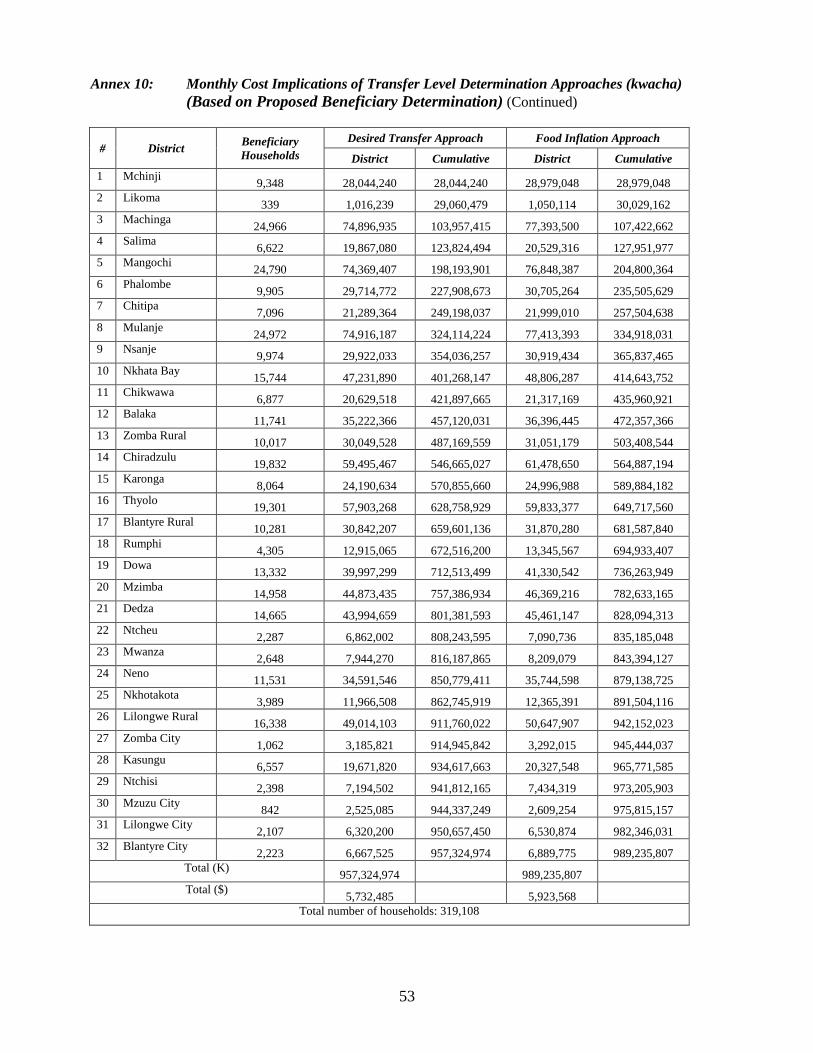
53
Annex 10: Monthly Cost Implications of Transfer Level Determination Approaches (kwacha)
(Based on Proposed Beneficiary Determination) (Continued)
# District Beneficiary
Households
Desired Transfer Approach Food Inflation Approach
District Cumulative District Cumulative
1 Mchinji 9,348 28,044,240 28,044,240 28,979,048 28,979,048
2 Likoma 339 1,016,239 29,060,479 1,050,114 30,029,162
3 Machinga 24,966 74,896,935 103,957,415 77,393,500 107,422,662
4 Salima 6,622 19,867,080 123,824,494 20,529,316 127,951,977
5 Mangochi 24,790 74,369,407 198,193,901 76,848,387 204,800,364
6 Phalombe 9,905 29,714,772 227,908,673 30,705,264 235,505,629
7 Chitipa 7,096 21,289,364 249,198,037 21,999,010 257,504,638
8 Mulanje 24,972 74,916,187 324,114,224 77,413,393 334,918,031
9 Nsanje 9,974 29,922,033 354,036,257 30,919,434 365,837,465
10 Nkhata Bay 15,744 47,231,890 401,268,147 48,806,287 414,643,752
11 Chikwawa 6,877 20,629,518 421,897,665 21,317,169 435,960,921
12 Balaka 11,741 35,222,366 457,120,031 36,396,445 472,357,366
13 Zomba Rural 10,017 30,049,528 487,169,559 31,051,179 503,408,544
14 Chiradzulu 19,832 59,495,467 546,665,027 61,478,650 564,887,194
15 Karonga 8,064 24,190,634 570,855,660 24,996,988 589,884,182
16 Thyolo 19,301 57,903,268 628,758,929 59,833,377 649,717,560
17 Blantyre Rural 10,281 30,842,207 659,601,136 31,870,280 681,587,840
18 Rumphi 4,305 12,915,065 672,516,200 13,345,567 694,933,407
19 Dowa 13,332 39,997,299 712,513,499 41,330,542 736,263,949
20 Mzimba 14,958 44,873,435 757,386,934 46,369,216 782,633,165
21 Dedza 14,665 43,994,659 801,381,593 45,461,147 828,094,313
22 Ntcheu 2,287 6,862,002 808,243,595 7,090,736 835,185,048
23 Mwanza 2,648 7,944,270 816,187,865 8,209,079 843,394,127
24 Neno 11,531 34,591,546 850,779,411 35,744,598 879,138,725
25 Nkhotakota 3,989 11,966,508 862,745,919 12,365,391 891,504,116
26 Lilongwe Rural 16,338 49,014,103 911,760,022 50,647,907 942,152,023
27 Zomba City 1,062 3,185,821 914,945,842 3,292,015 945,444,037
28 Kasungu 6,557 19,671,820 934,617,663 20,327,548 965,771,585
29 Ntchisi 2,398 7,194,502 941,812,165 7,434,319 973,205,903
30 Mzuzu City 842 2,525,085 944,337,249 2,609,254 975,815,157
31 Lilongwe City 2,107 6,320,200 950,657,450 6,530,874 982,346,031
32 Blantyre City 2,223 6,667,525 957,324,974 6,889,775 989,235,807
Total (K) 957,324,974
989,235,807
Total ($) 5,732,485
5,923,568
Total number of households: 319,108
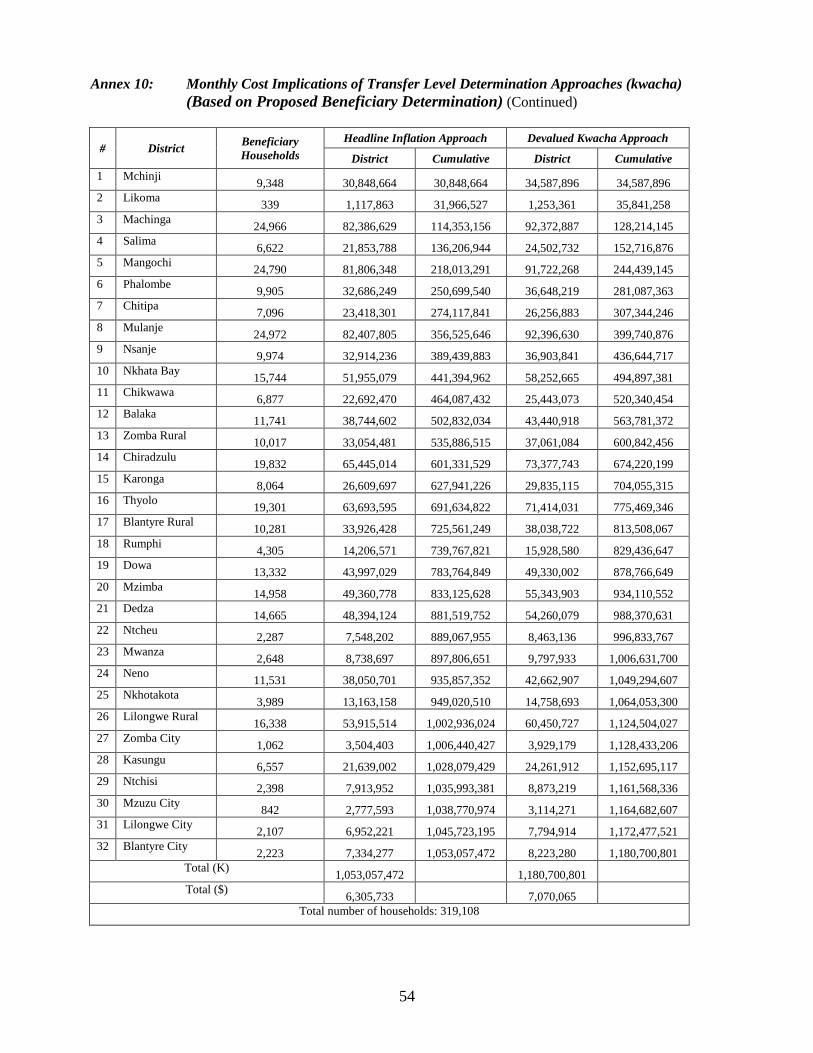
54
Annex 10: Monthly Cost Implications of Transfer Level Determination Approaches (kwacha)
(Based on Proposed Beneficiary Determination) (Continued)
# District Beneficiary
Households
Headline Inflation Approach Devalued Kwacha Approach
District Cumulative District Cumulative
1 Mchinji 9,348 30,848,664 30,848,664 34,587,896 34,587,896
2 Likoma 339 1,117,863 31,966,527 1,253,361 35,841,258
3 Machinga 24,966 82,386,629 114,353,156 92,372,887 128,214,145
4 Salima 6,622 21,853,788 136,206,944 24,502,732 152,716,876
5 Mangochi 24,790 81,806,348 218,013,291 91,722,268 244,439,145
6 Phalombe 9,905 32,686,249 250,699,540 36,648,219 281,087,363
7 Chitipa 7,096 23,418,301 274,117,841 26,256,883 307,344,246
8 Mulanje 24,972 82,407,805 356,525,646 92,396,630 399,740,876
9 Nsanje 9,974 32,914,236 389,439,883 36,903,841 436,644,717
10 Nkhata Bay 15,744 51,955,079 441,394,962 58,252,665 494,897,381
11 Chikwawa 6,877 22,692,470 464,087,432 25,443,073 520,340,454
12 Balaka 11,741 38,744,602 502,832,034 43,440,918 563,781,372
13 Zomba Rural 10,017 33,054,481 535,886,515 37,061,084 600,842,456
14 Chiradzulu 19,832 65,445,014 601,331,529 73,377,743 674,220,199
15 Karonga 8,064 26,609,697 627,941,226 29,835,115 704,055,315
16 Thyolo 19,301 63,693,595 691,634,822 71,414,031 775,469,346
17 Blantyre Rural 10,281 33,926,428 725,561,249 38,038,722 813,508,067
18 Rumphi 4,305 14,206,571 739,767,821 15,928,580 829,436,647
19 Dowa 13,332 43,997,029 783,764,849 49,330,002 878,766,649
20 Mzimba 14,958 49,360,778 833,125,628 55,343,903 934,110,552
21 Dedza 14,665 48,394,124 881,519,752 54,260,079 988,370,631
22 Ntcheu 2,287 7,548,202 889,067,955 8,463,136 996,833,767
23 Mwanza 2,648 8,738,697 897,806,651 9,797,933 1,006,631,700
24 Neno 11,531 38,050,701 935,857,352 42,662,907 1,049,294,607
25 Nkhotakota 3,989 13,163,158 949,020,510 14,758,693 1,064,053,300
26 Lilongwe Rural 16,338 53,915,514 1,002,936,024 60,450,727 1,124,504,027
27 Zomba City 1,062 3,504,403 1,006,440,427 3,929,179 1,128,433,206
28 Kasungu 6,557 21,639,002 1,028,079,429 24,261,912 1,152,695,117
29 Ntchisi 2,398 7,913,952 1,035,993,381 8,873,219 1,161,568,336
30 Mzuzu City 842 2,777,593 1,038,770,974 3,114,271 1,164,682,607
31 Lilongwe City 2,107 6,952,221 1,045,723,195 7,794,914 1,172,477,521
32 Blantyre City 2,223 7,334,277 1,053,057,472 8,223,280 1,180,700,801
Total (K) 1,053,057,472
1,180,700,801
Total ($) 6,305,733
7,070,065
Total number of households: 319,108
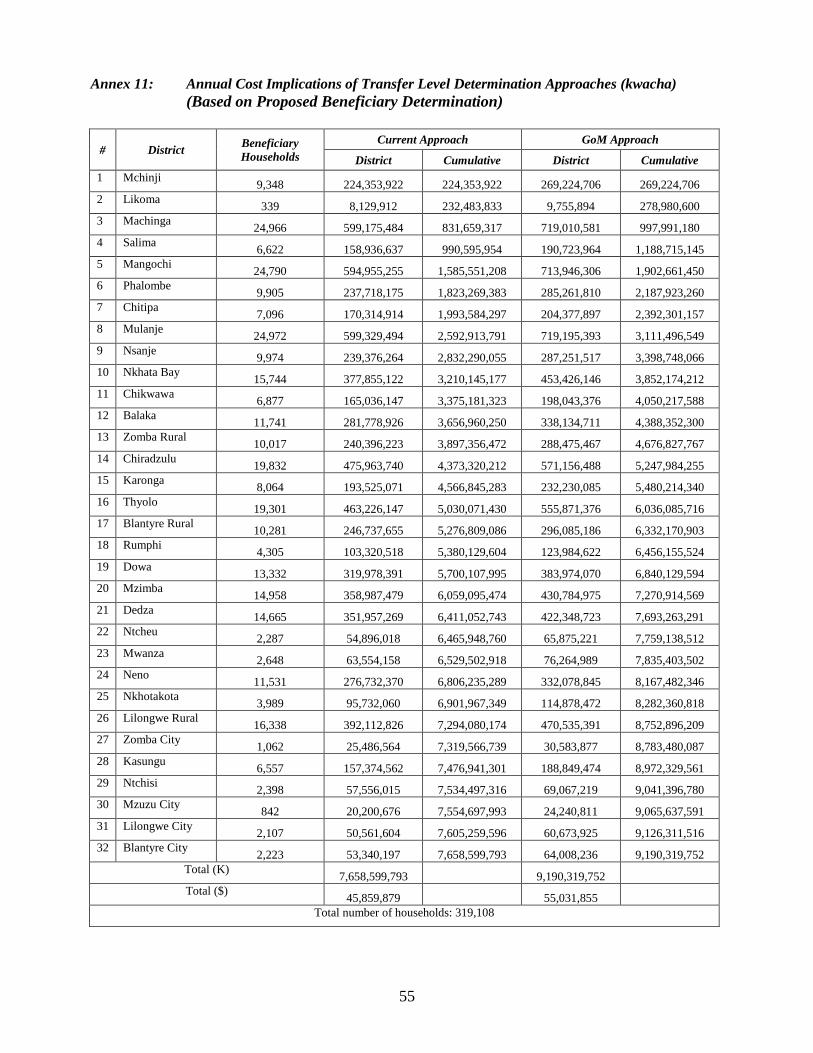
55
Annex 11: Annual Cost Implications of Transfer Level Determination Approaches (kwacha)
(Based on Proposed Beneficiary Determination)
# District Beneficiary
Households
Current Approach GoM Approach
District Cumulative District Cumulative
1 Mchinji 9,348 224,353,922 224,353,922 269,224,706 269,224,706
2 Likoma 339 8,129,912 232,483,833 9,755,894 278,980,600
3 Machinga 24,966 599,175,484 831,659,317 719,010,581 997,991,180
4 Salima 6,622 158,936,637 990,595,954 190,723,964 1,188,715,145
5 Mangochi 24,790 594,955,255 1,585,551,208 713,946,306 1,902,661,450
6 Phalombe 9,905 237,718,175 1,823,269,383 285,261,810 2,187,923,260
7 Chitipa 7,096 170,314,914 1,993,584,297 204,377,897 2,392,301,157
8 Mulanje 24,972 599,329,494 2,592,913,791 719,195,393 3,111,496,549
9 Nsanje 9,974 239,376,264 2,832,290,055 287,251,517 3,398,748,066
10 Nkhata Bay 15,744 377,855,122 3,210,145,177 453,426,146 3,852,174,212
11 Chikwawa 6,877 165,036,147 3,375,181,323 198,043,376 4,050,217,588
12 Balaka 11,741 281,778,926 3,656,960,250 338,134,711 4,388,352,300
13 Zomba Rural 10,017 240,396,223 3,897,356,472 288,475,467 4,676,827,767
14 Chiradzulu 19,832 475,963,740 4,373,320,212 571,156,488 5,247,984,255
15 Karonga 8,064 193,525,071 4,566,845,283 232,230,085 5,480,214,340
16 Thyolo 19,301 463,226,147 5,030,071,430 555,871,376 6,036,085,716
17 Blantyre Rural 10,281 246,737,655 5,276,809,086 296,085,186 6,332,170,903
18 Rumphi 4,305 103,320,518 5,380,129,604 123,984,622 6,456,155,524
19 Dowa 13,332 319,978,391 5,700,107,995 383,974,070 6,840,129,594
20 Mzimba 14,958 358,987,479 6,059,095,474 430,784,975 7,270,914,569
21 Dedza 14,665 351,957,269 6,411,052,743 422,348,723 7,693,263,291
22 Ntcheu 2,287 54,896,018 6,465,948,760 65,875,221 7,759,138,512
23 Mwanza 2,648 63,554,158 6,529,502,918 76,264,989 7,835,403,502
24 Neno 11,531 276,732,370 6,806,235,289 332,078,845 8,167,482,346
25 Nkhotakota 3,989 95,732,060 6,901,967,349 114,878,472 8,282,360,818
26 Lilongwe Rural 16,338 392,112,826 7,294,080,174 470,535,391 8,752,896,209
27 Zomba City 1,062 25,486,564 7,319,566,739 30,583,877 8,783,480,087
28 Kasungu 6,557 157,374,562 7,476,941,301 188,849,474 8,972,329,561
29 Ntchisi 2,398 57,556,015 7,534,497,316 69,067,219 9,041,396,780
30 Mzuzu City 842 20,200,676 7,554,697,993 24,240,811 9,065,637,591
31 Lilongwe City 2,107 50,561,604 7,605,259,596 60,673,925 9,126,311,516
32 Blantyre City 2,223 53,340,197 7,658,599,793 64,008,236 9,190,319,752
Total (K) 7,658,599,793
9,190,319,752
Total ($) 45,859,879
55,031,855
Total number of households: 319,108
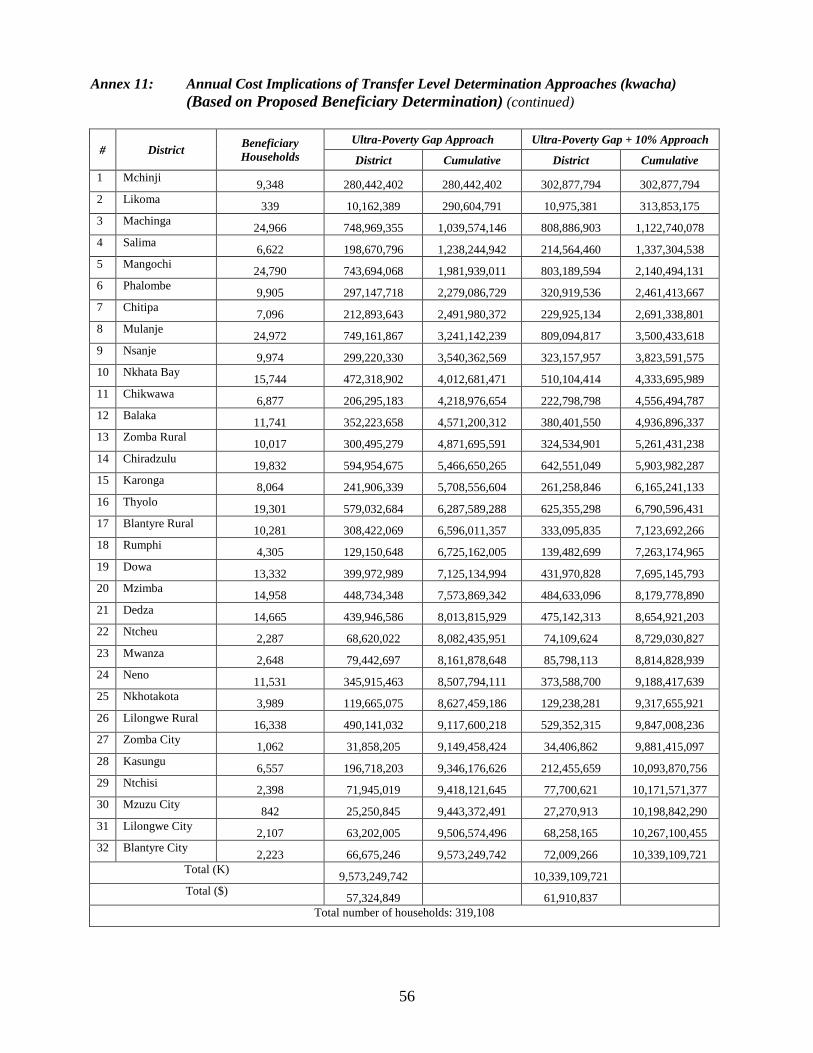
56
Annex 11: Annual Cost Implications of Transfer Level Determination Approaches (kwacha)
(Based on Proposed Beneficiary Determination) (continued)
# District Beneficiary
Households
Ultra-Poverty Gap Approach Ultra-Poverty Gap + 10% Approach
District Cumulative District Cumulative
1 Mchinji 9,348 280,442,402 280,442,402 302,877,794 302,877,794
2 Likoma 339 10,162,389 290,604,791 10,975,381 313,853,175
3 Machinga 24,966 748,969,355 1,039,574,146 808,886,903 1,122,740,078
4 Salima 6,622 198,670,796 1,238,244,942 214,564,460 1,337,304,538
5 Mangochi 24,790 743,694,068 1,981,939,011 803,189,594 2,140,494,131
6 Phalombe 9,905 297,147,718 2,279,086,729 320,919,536 2,461,413,667
7 Chitipa 7,096 212,893,643 2,491,980,372 229,925,134 2,691,338,801
8 Mulanje 24,972 749,161,867 3,241,142,239 809,094,817 3,500,433,618
9 Nsanje 9,974 299,220,330 3,540,362,569 323,157,957 3,823,591,575
10 Nkhata Bay 15,744 472,318,902 4,012,681,471 510,104,414 4,333,695,989
11 Chikwawa 6,877 206,295,183 4,218,976,654 222,798,798 4,556,494,787
12 Balaka 11,741 352,223,658 4,571,200,312 380,401,550 4,936,896,337
13 Zomba Rural 10,017 300,495,279 4,871,695,591 324,534,901 5,261,431,238
14 Chiradzulu 19,832 594,954,675 5,466,650,265 642,551,049 5,903,982,287
15 Karonga 8,064 241,906,339 5,708,556,604 261,258,846 6,165,241,133
16 Thyolo 19,301 579,032,684 6,287,589,288 625,355,298 6,790,596,431
17 Blantyre Rural 10,281 308,422,069 6,596,011,357 333,095,835 7,123,692,266
18 Rumphi 4,305 129,150,648 6,725,162,005 139,482,699 7,263,174,965
19 Dowa 13,332 399,972,989 7,125,134,994 431,970,828 7,695,145,793
20 Mzimba 14,958 448,734,348 7,573,869,342 484,633,096 8,179,778,890
21 Dedza 14,665 439,946,586 8,013,815,929 475,142,313 8,654,921,203
22 Ntcheu 2,287 68,620,022 8,082,435,951 74,109,624 8,729,030,827
23 Mwanza 2,648 79,442,697 8,161,878,648 85,798,113 8,814,828,939
24 Neno 11,531 345,915,463 8,507,794,111 373,588,700 9,188,417,639
25 Nkhotakota 3,989 119,665,075 8,627,459,186 129,238,281 9,317,655,921
26 Lilongwe Rural 16,338 490,141,032 9,117,600,218 529,352,315 9,847,008,236
27 Zomba City 1,062 31,858,205 9,149,458,424 34,406,862 9,881,415,097
28 Kasungu 6,557 196,718,203 9,346,176,626 212,455,659 10,093,870,756
29 Ntchisi 2,398 71,945,019 9,418,121,645 77,700,621 10,171,571,377
30 Mzuzu City 842 25,250,845 9,443,372,491 27,270,913 10,198,842,290
31 Lilongwe City 2,107 63,202,005 9,506,574,496 68,258,165 10,267,100,455
32 Blantyre City 2,223 66,675,246 9,573,249,742 72,009,266 10,339,109,721
Total (K) 9,573,249,742
10,339,109,721
Total ($) 57,324,849
61,910,837
Total number of households: 319,108

57
Annex 11: Annual Cost Implications of Transfer Level Determination Approaches (kwacha)
(Based on Proposed Beneficiary Determination) (continued)
# District Beneficiary
Households
Desired Transfer Approach Food Inflation Approach
District Cumulative District Cumulative
1 Mchinji 9,348 336,530,882 336,530,882 347,748,578 347,748,578
2 Likoma 339 12,194,867 348,725,750 12,601,363 360,349,941
3 Machinga 24,966 898,763,226 1,247,488,976 928,722,000 1,289,071,941
4 Salima 6,622 238,404,955 1,485,893,931 246,351,787 1,535,423,728
5 Mangochi 24,790 892,432,882 2,378,326,813 922,180,645 2,457,604,373
6 Phalombe 9,905 356,577,262 2,734,904,075 368,463,171 2,826,067,544
7 Chitipa 7,096 255,472,371 2,990,376,446 263,988,117 3,090,055,661
8 Mulanje 24,972 898,994,241 3,889,370,687 928,960,715 4,019,016,376
9 Nsanje 9,974 359,064,396 4,248,435,083 371,033,209 4,390,049,586
10 Nkhata Bay 15,744 566,782,682 4,815,217,765 585,675,439 4,975,725,024
11 Chikwawa 6,877 247,554,220 5,062,771,985 255,806,027 5,231,531,051
12 Balaka 11,741 422,668,389 5,485,440,374 436,757,336 5,668,288,387
13 Zomba Rural 10,017 360,594,334 5,846,034,709 372,614,145 6,040,902,532
14 Chiradzulu 19,832 713,945,610 6,559,980,318 737,743,797 6,778,646,329
15 Karonga 8,064 290,287,607 6,850,267,925 299,963,860 7,078,610,189
16 Thyolo 19,301 694,839,220 7,545,107,145 718,000,528 7,796,610,717
17 Blantyre Rural 10,281 370,106,483 7,915,213,628 382,443,366 8,179,054,083
18 Rumphi 4,305 154,980,777 8,070,194,406 160,146,803 8,339,200,886
19 Dowa 13,332 479,967,587 8,550,161,992 495,966,506 8,835,167,392
20 Mzimba 14,958 538,481,218 9,088,643,211 556,430,592 9,391,597,984
21 Dedza 14,665 527,935,904 9,616,579,114 545,533,767 9,937,131,751
22 Ntcheu 2,287 82,344,026 9,698,923,141 85,088,827 10,022,220,579
23 Mwanza 2,648 95,331,236 9,794,254,377 98,508,944 10,120,729,523
24 Neno 11,531 415,098,556 10,209,352,933 428,935,174 10,549,664,697
25 Nkhotakota 3,989 143,598,090 10,352,951,023 148,384,693 10,698,049,390
26 Lilongwe Rural 16,338 588,169,239 10,941,120,262 607,774,880 11,305,824,270
27 Zomba City 1,062 38,229,847 10,979,350,108 39,504,175 11,345,328,445
28 Kasungu 6,557 236,061,843 11,215,411,951 243,930,571 11,589,259,016
29 Ntchisi 2,398 86,334,023 11,301,745,975 89,211,824 11,678,470,840
30 Mzuzu City 842 30,301,014 11,332,046,989 31,311,048 11,709,781,888
31 Lilongwe City 2,107 75,842,406 11,407,889,395 78,370,486 11,788,152,374
32 Blantyre City 2,223 80,010,296 11,487,899,690 82,677,305 11,870,829,680
Total (K) 11,487,899,690
11,870,829,680
Total ($) 68,789,819
71,082,812
Total number of households: 319,108
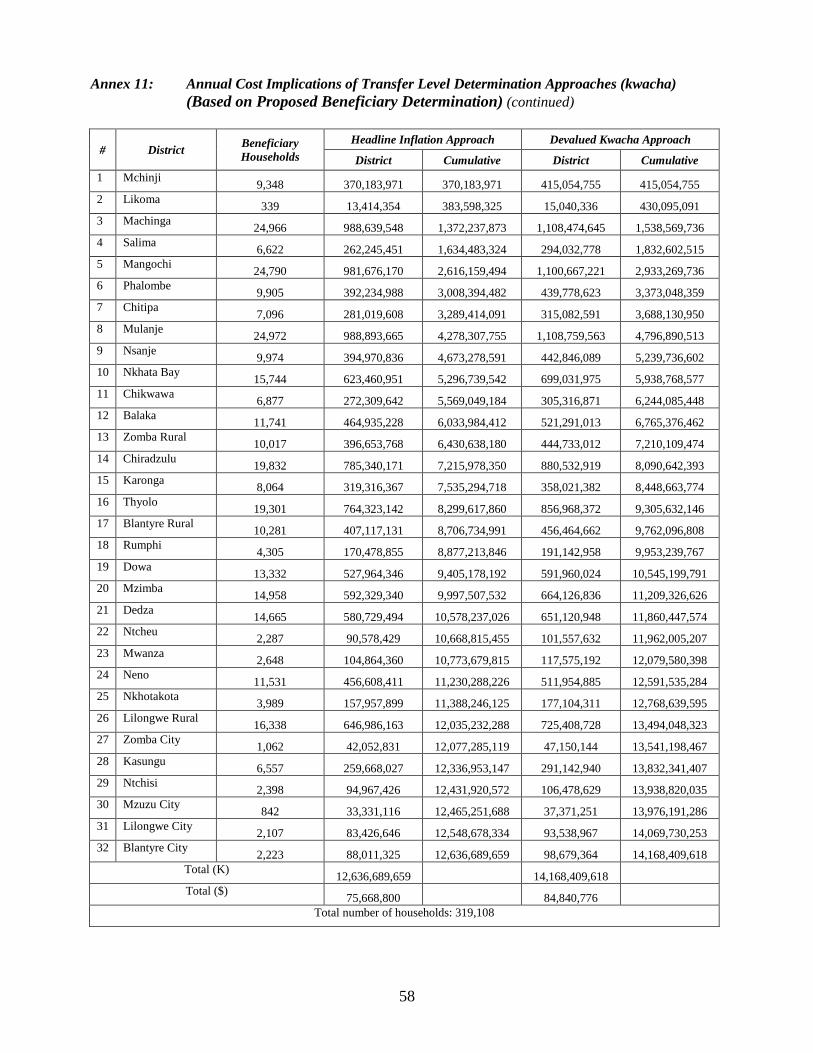
58
Annex 11: Annual Cost Implications of Transfer Level Determination Approaches (kwacha)
(Based on Proposed Beneficiary Determination) (continued)
# District Beneficiary
Households
Headline Inflation Approach Devalued Kwacha Approach
District Cumulative District Cumulative
1 Mchinji 9,348 370,183,971 370,183,971 415,054,755 415,054,755
2 Likoma 339 13,414,354 383,598,325 15,040,336 430,095,091
3 Machinga 24,966 988,639,548 1,372,237,873 1,108,474,645 1,538,569,736
4 Salima 6,622 262,245,451 1,634,483,324 294,032,778 1,832,602,515
5 Mangochi 24,790 981,676,170 2,616,159,494 1,100,667,221 2,933,269,736
6 Phalombe 9,905 392,234,988 3,008,394,482 439,778,623 3,373,048,359
7 Chitipa 7,096 281,019,608 3,289,414,091 315,082,591 3,688,130,950
8 Mulanje 24,972 988,893,665 4,278,307,755 1,108,759,563 4,796,890,513
9 Nsanje 9,974 394,970,836 4,673,278,591 442,846,089 5,239,736,602
10 Nkhata Bay 15,744 623,460,951 5,296,739,542 699,031,975 5,938,768,577
11 Chikwawa 6,877 272,309,642 5,569,049,184 305,316,871 6,244,085,448
12 Balaka 11,741 464,935,228 6,033,984,412 521,291,013 6,765,376,462
13 Zomba Rural 10,017 396,653,768 6,430,638,180 444,733,012 7,210,109,474
14 Chiradzulu 19,832 785,340,171 7,215,978,350 880,532,919 8,090,642,393
15 Karonga 8,064 319,316,367 7,535,294,718 358,021,382 8,448,663,774
16 Thyolo 19,301 764,323,142 8,299,617,860 856,968,372 9,305,632,146
17 Blantyre Rural 10,281 407,117,131 8,706,734,991 456,464,662 9,762,096,808
18 Rumphi 4,305 170,478,855 8,877,213,846 191,142,958 9,953,239,767
19 Dowa 13,332 527,964,346 9,405,178,192 591,960,024 10,545,199,791
20 Mzimba 14,958 592,329,340 9,997,507,532 664,126,836 11,209,326,626
21 Dedza 14,665 580,729,494 10,578,237,026 651,120,948 11,860,447,574
22 Ntcheu 2,287 90,578,429 10,668,815,455 101,557,632 11,962,005,207
23 Mwanza 2,648 104,864,360 10,773,679,815 117,575,192 12,079,580,398
24 Neno 11,531 456,608,411 11,230,288,226 511,954,885 12,591,535,284
25 Nkhotakota 3,989 157,957,899 11,388,246,125 177,104,311 12,768,639,595
26 Lilongwe Rural 16,338 646,986,163 12,035,232,288 725,408,728 13,494,048,323
27 Zomba City 1,062 42,052,831 12,077,285,119 47,150,144 13,541,198,467
28 Kasungu 6,557 259,668,027 12,336,953,147 291,142,940 13,832,341,407
29 Ntchisi 2,398 94,967,426 12,431,920,572 106,478,629 13,938,820,035
30 Mzuzu City 842 33,331,116 12,465,251,688 37,371,251 13,976,191,286
31 Lilongwe City 2,107 83,426,646 12,548,678,334 93,538,967 14,069,730,253
32 Blantyre City 2,223 88,011,325 12,636,689,659 98,679,364 14,168,409,618
Total (K) 12,636,689,659
14,168,409,618
Total ($) 75,668,800
84,840,776
Total number of households: 319,108
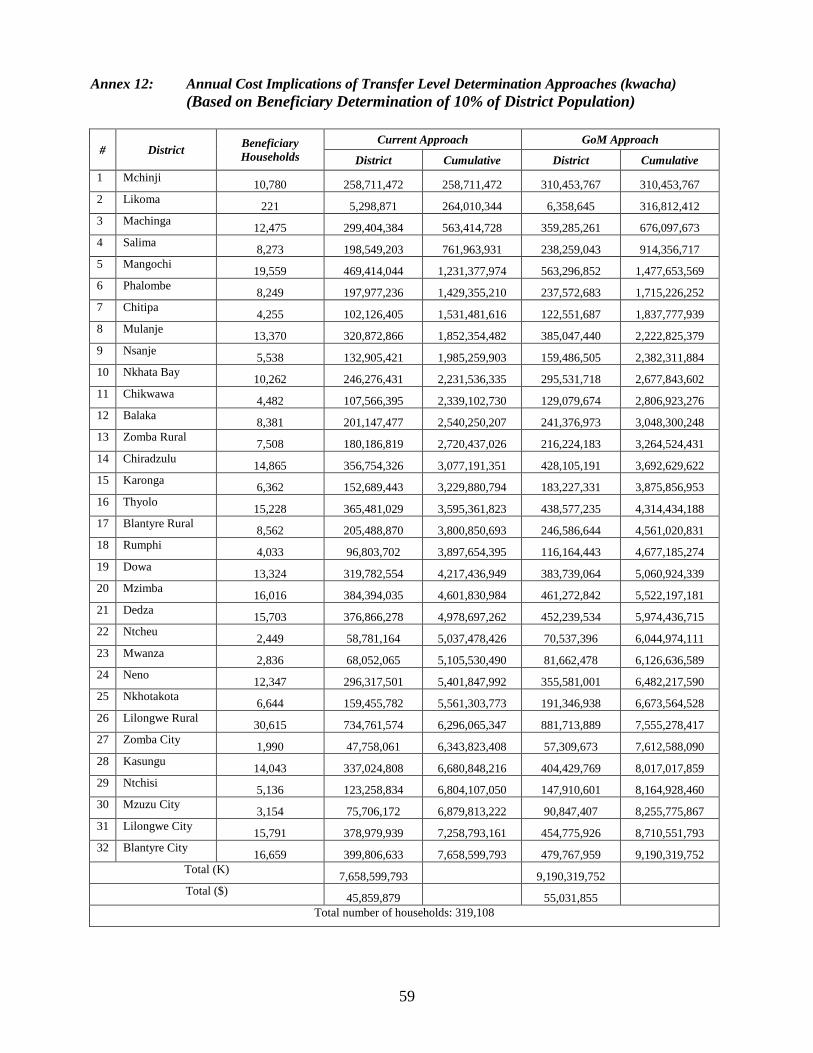
59
Annex 12: Annual Cost Implications of Transfer Level Determination Approaches (kwacha)
(Based on Beneficiary Determination of 10% of District Population)
# District Beneficiary
Households
Current Approach GoM Approach
District Cumulative District Cumulative
1 Mchinji 10,780 258,711,472 258,711,472 310,453,767 310,453,767
2 Likoma 221 5,298,871 264,010,344 6,358,645 316,812,412
3 Machinga 12,475 299,404,384 563,414,728 359,285,261 676,097,673
4 Salima 8,273 198,549,203 761,963,931 238,259,043 914,356,717
5 Mangochi 19,559 469,414,044 1,231,377,974 563,296,852 1,477,653,569
6 Phalombe 8,249 197,977,236 1,429,355,210 237,572,683 1,715,226,252
7 Chitipa 4,255 102,126,405 1,531,481,616 122,551,687 1,837,777,939
8 Mulanje 13,370 320,872,866 1,852,354,482 385,047,440 2,222,825,379
9 Nsanje 5,538 132,905,421 1,985,259,903 159,486,505 2,382,311,884
10 Nkhata Bay 10,262 246,276,431 2,231,536,335 295,531,718 2,677,843,602
11 Chikwawa 4,482 107,566,395 2,339,102,730 129,079,674 2,806,923,276
12 Balaka 8,381 201,147,477 2,540,250,207 241,376,973 3,048,300,248
13 Zomba Rural 7,508 180,186,819 2,720,437,026 216,224,183 3,264,524,431
14 Chiradzulu 14,865 356,754,326 3,077,191,351 428,105,191 3,692,629,622
15 Karonga 6,362 152,689,443 3,229,880,794 183,227,331 3,875,856,953
16 Thyolo 15,228 365,481,029 3,595,361,823 438,577,235 4,314,434,188
17 Blantyre Rural 8,562 205,488,870 3,800,850,693 246,586,644 4,561,020,831
18 Rumphi 4,033 96,803,702 3,897,654,395 116,164,443 4,677,185,274
19 Dowa 13,324 319,782,554 4,217,436,949 383,739,064 5,060,924,339
20 Mzimba 16,016 384,394,035 4,601,830,984 461,272,842 5,522,197,181
21 Dedza 15,703 376,866,278 4,978,697,262 452,239,534 5,974,436,715
22 Ntcheu 2,449 58,781,164 5,037,478,426 70,537,396 6,044,974,111
23 Mwanza 2,836 68,052,065 5,105,530,490 81,662,478 6,126,636,589
24 Neno 12,347 296,317,501 5,401,847,992 355,581,001 6,482,217,590
25 Nkhotakota 6,644 159,455,782 5,561,303,773 191,346,938 6,673,564,528
26 Lilongwe Rural 30,615 734,761,574 6,296,065,347 881,713,889 7,555,278,417
27 Zomba City 1,990 47,758,061 6,343,823,408 57,309,673 7,612,588,090
28 Kasungu 14,043 337,024,808 6,680,848,216 404,429,769 8,017,017,859
29 Ntchisi 5,136 123,258,834 6,804,107,050 147,910,601 8,164,928,460
30 Mzuzu City 3,154 75,706,172 6,879,813,222 90,847,407 8,255,775,867
31 Lilongwe City 15,791 378,979,939 7,258,793,161 454,775,926 8,710,551,793
32 Blantyre City 16,659 399,806,633 7,658,599,793 479,767,959 9,190,319,752
Total (K) 7,658,599,793
9,190,319,752
Total ($) 45,859,879
55,031,855
Total number of households: 319,108
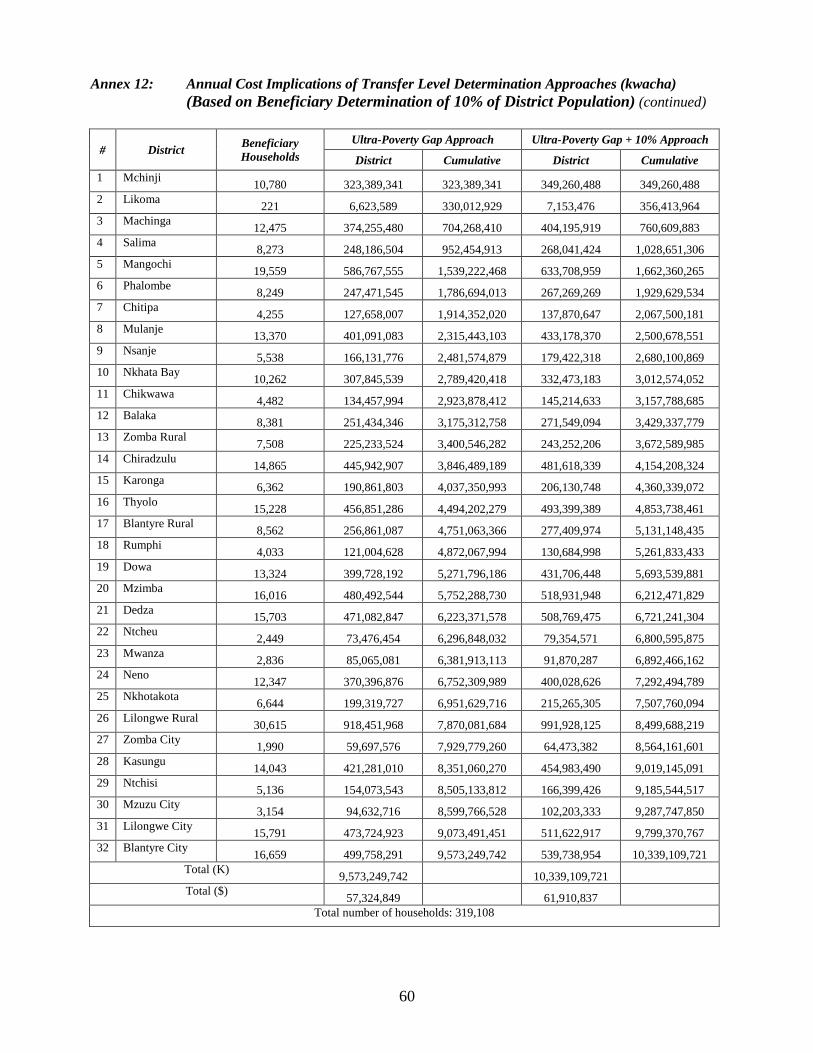
60
Annex 12: Annual Cost Implications of Transfer Level Determination Approaches (kwacha)
(Based on Beneficiary Determination of 10% of District Population) (continued)
# District Beneficiary
Households
Ultra-Poverty Gap Approach Ultra-Poverty Gap + 10% Approach
District Cumulative District Cumulative
1 Mchinji 10,780 323,389,341 323,389,341 349,260,488 349,260,488
2 Likoma 221 6,623,589 330,012,929 7,153,476 356,413,964
3 Machinga 12,475 374,255,480 704,268,410 404,195,919 760,609,883
4 Salima 8,273 248,186,504 952,454,913 268,041,424 1,028,651,306
5 Mangochi 19,559 586,767,555 1,539,222,468 633,708,959 1,662,360,265
6 Phalombe 8,249 247,471,545 1,786,694,013 267,269,269 1,929,629,534
7 Chitipa 4,255 127,658,007 1,914,352,020 137,870,647 2,067,500,181
8 Mulanje 13,370 401,091,083 2,315,443,103 433,178,370 2,500,678,551
9 Nsanje 5,538 166,131,776 2,481,574,879 179,422,318 2,680,100,869
10 Nkhata Bay 10,262 307,845,539 2,789,420,418 332,473,183 3,012,574,052
11 Chikwawa 4,482 134,457,994 2,923,878,412 145,214,633 3,157,788,685
12 Balaka 8,381 251,434,346 3,175,312,758 271,549,094 3,429,337,779
13 Zomba Rural 7,508 225,233,524 3,400,546,282 243,252,206 3,672,589,985
14 Chiradzulu 14,865 445,942,907 3,846,489,189 481,618,339 4,154,208,324
15 Karonga 6,362 190,861,803 4,037,350,993 206,130,748 4,360,339,072
16 Thyolo 15,228 456,851,286 4,494,202,279 493,399,389 4,853,738,461
17 Blantyre Rural 8,562 256,861,087 4,751,063,366 277,409,974 5,131,148,435
18 Rumphi 4,033 121,004,628 4,872,067,994 130,684,998 5,261,833,433
19 Dowa 13,324 399,728,192 5,271,796,186 431,706,448 5,693,539,881
20 Mzimba 16,016 480,492,544 5,752,288,730 518,931,948 6,212,471,829
21 Dedza 15,703 471,082,847 6,223,371,578 508,769,475 6,721,241,304
22 Ntcheu 2,449 73,476,454 6,296,848,032 79,354,571 6,800,595,875
23 Mwanza 2,836 85,065,081 6,381,913,113 91,870,287 6,892,466,162
24 Neno 12,347 370,396,876 6,752,309,989 400,028,626 7,292,494,789
25 Nkhotakota 6,644 199,319,727 6,951,629,716 215,265,305 7,507,760,094
26 Lilongwe Rural 30,615 918,451,968 7,870,081,684 991,928,125 8,499,688,219
27 Zomba City 1,990 59,697,576 7,929,779,260 64,473,382 8,564,161,601
28 Kasungu 14,043 421,281,010 8,351,060,270 454,983,490 9,019,145,091
29 Ntchisi 5,136 154,073,543 8,505,133,812 166,399,426 9,185,544,517
30 Mzuzu City 3,154 94,632,716 8,599,766,528 102,203,333 9,287,747,850
31 Lilongwe City 15,791 473,724,923 9,073,491,451 511,622,917 9,799,370,767
32 Blantyre City 16,659 499,758,291 9,573,249,742 539,738,954 10,339,109,721
Total (K) 9,573,249,742
10,339,109,721
Total ($) 57,324,849
61,910,837
Total number of households: 319,108
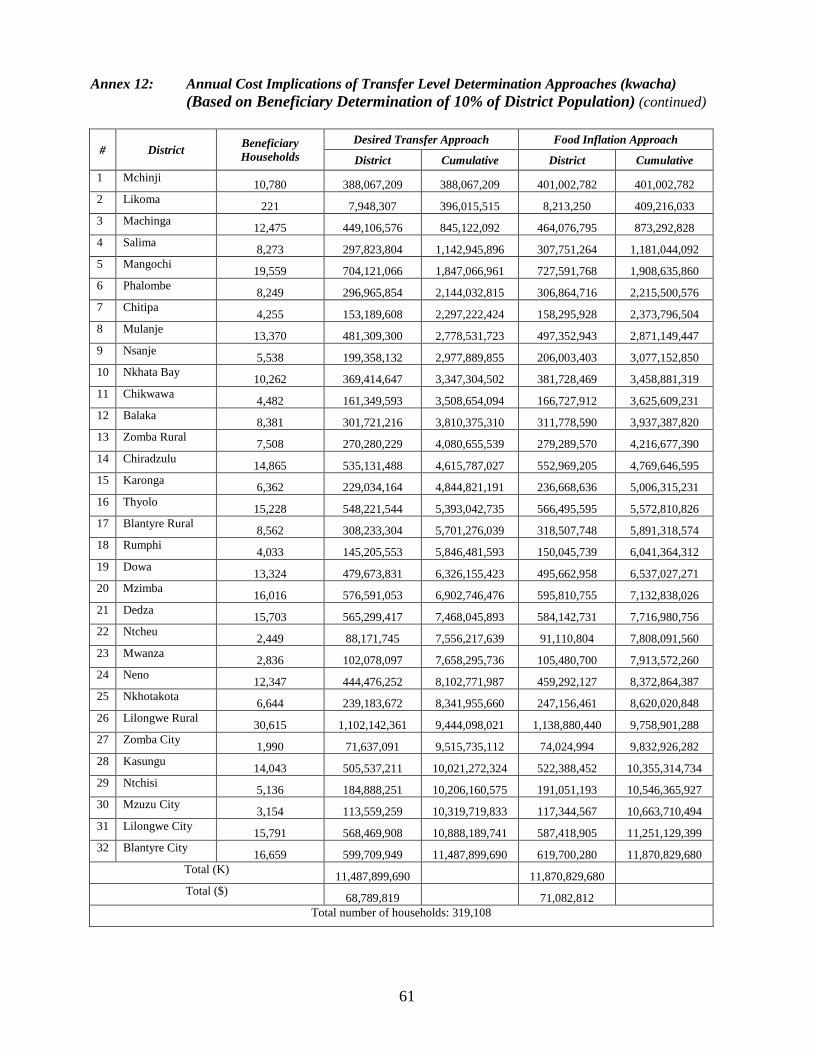
61
Annex 12: Annual Cost Implications of Transfer Level Determination Approaches (kwacha)
(Based on Beneficiary Determination of 10% of District Population) (continued)
# District Beneficiary
Households
Desired Transfer Approach Food Inflation Approach
District Cumulative District Cumulative
1 Mchinji 10,780 388,067,209 388,067,209 401,002,782 401,002,782
2 Likoma 221 7,948,307 396,015,515 8,213,250 409,216,033
3 Machinga 12,475 449,106,576 845,122,092 464,076,795 873,292,828
4 Salima 8,273 297,823,804 1,142,945,896 307,751,264 1,181,044,092
5 Mangochi 19,559 704,121,066 1,847,066,961 727,591,768 1,908,635,860
6 Phalombe 8,249 296,965,854 2,144,032,815 306,864,716 2,215,500,576
7 Chitipa 4,255 153,189,608 2,297,222,424 158,295,928 2,373,796,504
8 Mulanje 13,370 481,309,300 2,778,531,723 497,352,943 2,871,149,447
9 Nsanje 5,538 199,358,132 2,977,889,855 206,003,403 3,077,152,850
10 Nkhata Bay 10,262 369,414,647 3,347,304,502 381,728,469 3,458,881,319
11 Chikwawa 4,482 161,349,593 3,508,654,094 166,727,912 3,625,609,231
12 Balaka 8,381 301,721,216 3,810,375,310 311,778,590 3,937,387,820
13 Zomba Rural 7,508 270,280,229 4,080,655,539 279,289,570 4,216,677,390
14 Chiradzulu 14,865 535,131,488 4,615,787,027 552,969,205 4,769,646,595
15 Karonga 6,362 229,034,164 4,844,821,191 236,668,636 5,006,315,231
16 Thyolo 15,228 548,221,544 5,393,042,735 566,495,595 5,572,810,826
17 Blantyre Rural 8,562 308,233,304 5,701,276,039 318,507,748 5,891,318,574
18 Rumphi 4,033 145,205,553 5,846,481,593 150,045,739 6,041,364,312
19 Dowa 13,324 479,673,831 6,326,155,423 495,662,958 6,537,027,271
20 Mzimba 16,016 576,591,053 6,902,746,476 595,810,755 7,132,838,026
21 Dedza 15,703 565,299,417 7,468,045,893 584,142,731 7,716,980,756
22 Ntcheu 2,449 88,171,745 7,556,217,639 91,110,804 7,808,091,560
23 Mwanza 2,836 102,078,097 7,658,295,736 105,480,700 7,913,572,260
24 Neno 12,347 444,476,252 8,102,771,987 459,292,127 8,372,864,387
25 Nkhotakota 6,644 239,183,672 8,341,955,660 247,156,461 8,620,020,848
26 Lilongwe Rural 30,615 1,102,142,361 9,444,098,021 1,138,880,440 9,758,901,288
27 Zomba City 1,990 71,637,091 9,515,735,112 74,024,994 9,832,926,282
28 Kasungu 14,043 505,537,211 10,021,272,324 522,388,452 10,355,314,734
29 Ntchisi 5,136 184,888,251 10,206,160,575 191,051,193 10,546,365,927
30 Mzuzu City 3,154 113,559,259 10,319,719,833 117,344,567 10,663,710,494
31 Lilongwe City 15,791 568,469,908 10,888,189,741 587,418,905 11,251,129,399
32 Blantyre City 16,659 599,709,949 11,487,899,690 619,700,280 11,870,829,680
Total (K) 11,487,899,690
11,870,829,680
Total ($) 68,789,819
71,082,812
Total number of households: 319,108
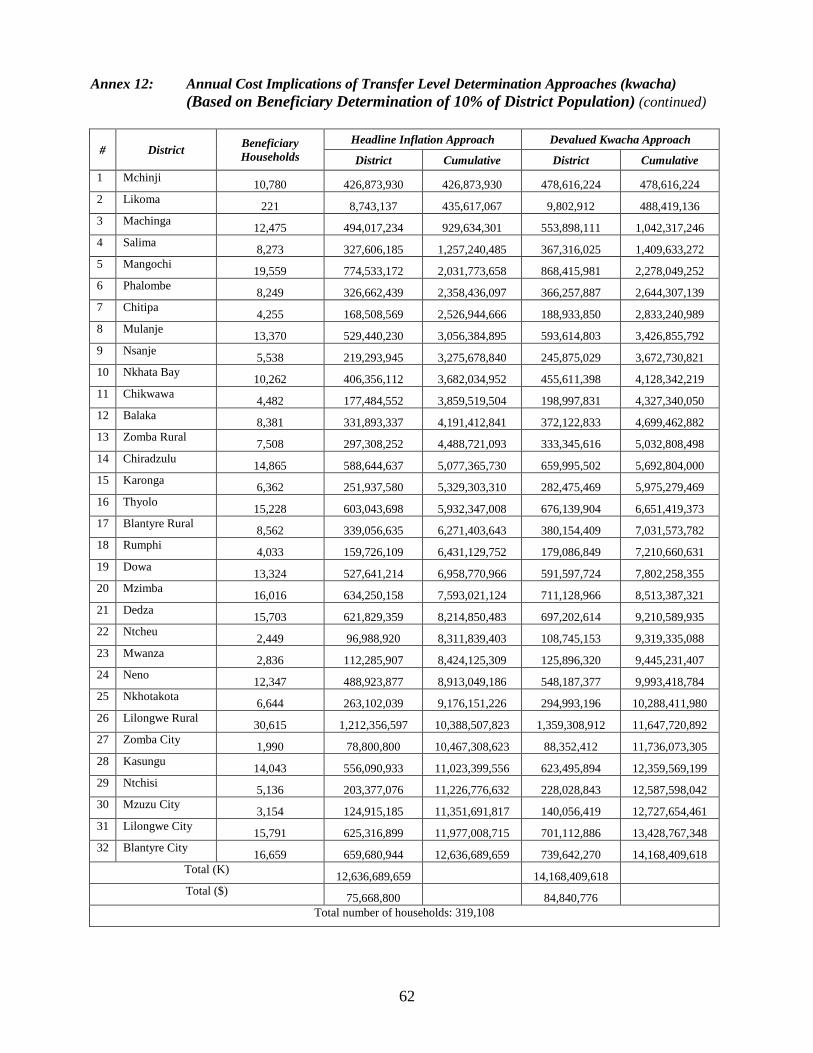
62
Annex 12: Annual Cost Implications of Transfer Level Determination Approaches (kwacha)
(Based on Beneficiary Determination of 10% of District Population) (continued)
# District Beneficiary
Households
Headline Inflation Approach Devalued Kwacha Approach
District Cumulative District Cumulative
1 Mchinji 10,780 426,873,930 426,873,930 478,616,224 478,616,224
2 Likoma 221 8,743,137 435,617,067 9,802,912 488,419,136
3 Machinga 12,475 494,017,234 929,634,301 553,898,111 1,042,317,246
4 Salima 8,273 327,606,185 1,257,240,485 367,316,025 1,409,633,272
5 Mangochi 19,559 774,533,172 2,031,773,658 868,415,981 2,278,049,252
6 Phalombe 8,249 326,662,439 2,358,436,097 366,257,887 2,644,307,139
7 Chitipa 4,255 168,508,569 2,526,944,666 188,933,850 2,833,240,989
8 Mulanje 13,370 529,440,230 3,056,384,895 593,614,803 3,426,855,792
9 Nsanje 5,538 219,293,945 3,275,678,840 245,875,029 3,672,730,821
10 Nkhata Bay 10,262 406,356,112 3,682,034,952 455,611,398 4,128,342,219
11 Chikwawa 4,482 177,484,552 3,859,519,504 198,997,831 4,327,340,050
12 Balaka 8,381 331,893,337 4,191,412,841 372,122,833 4,699,462,882
13 Zomba Rural 7,508 297,308,252 4,488,721,093 333,345,616 5,032,808,498
14 Chiradzulu 14,865 588,644,637 5,077,365,730 659,995,502 5,692,804,000
15 Karonga 6,362 251,937,580 5,329,303,310 282,475,469 5,975,279,469
16 Thyolo 15,228 603,043,698 5,932,347,008 676,139,904 6,651,419,373
17 Blantyre Rural 8,562 339,056,635 6,271,403,643 380,154,409 7,031,573,782
18 Rumphi 4,033 159,726,109 6,431,129,752 179,086,849 7,210,660,631
19 Dowa 13,324 527,641,214 6,958,770,966 591,597,724 7,802,258,355
20 Mzimba 16,016 634,250,158 7,593,021,124 711,128,966 8,513,387,321
21 Dedza 15,703 621,829,359 8,214,850,483 697,202,614 9,210,589,935
22 Ntcheu 2,449 96,988,920 8,311,839,403 108,745,153 9,319,335,088
23 Mwanza 2,836 112,285,907 8,424,125,309 125,896,320 9,445,231,407
24 Neno 12,347 488,923,877 8,913,049,186 548,187,377 9,993,418,784
25 Nkhotakota 6,644 263,102,039 9,176,151,226 294,993,196 10,288,411,980
26 Lilongwe Rural 30,615 1,212,356,597 10,388,507,823 1,359,308,912 11,647,720,892
27 Zomba City 1,990 78,800,800 10,467,308,623 88,352,412 11,736,073,305
28 Kasungu 14,043 556,090,933 11,023,399,556 623,495,894 12,359,569,199
29 Ntchisi 5,136 203,377,076 11,226,776,632 228,028,843 12,587,598,042
30 Mzuzu City 3,154 124,915,185 11,351,691,817 140,056,419 12,727,654,461
31 Lilongwe City 15,791 625,316,899 11,977,008,715 701,112,886 13,428,767,348
32 Blantyre City 16,659 659,680,944 12,636,689,659 739,642,270 14,168,409,618
Total (K) 12,636,689,659
14,168,409,618
Total ($) 75,668,800
84,840,776
Total number of households: 319,108


![Costing Allocation Presentation vFOC web [Read-Only]...Costing Allocation Levels • In many instances, the Costing Allocation Level should be set at Worker-Position, not Worker-Position-Earning](https://img.pdfslide.us/doc/110x75/5fa0fc3a9b280a7c18535011/costing-allocation-presentation-vfoc-web-read-only-costing-allocation-levels.jpg)