Embed Size (px)
Citation preview
Costa Rica´s Mechanical Empirical Design Software for Flexible 1
Pavements, CRME 2 (Paper #18-05459) 3
4 By 5
6 Christopher Trejos-Castillo(Corresponding Author) 7
Researcher 8 National Laboratory of Materials and Structural Models (LanammeUCR) 9
University of Costa Rica, P.O. Box 11501-2060, UCR, San José, Costa Rica 10 Phone: + (506) 2511-2794 11
E-mail: [email protected] 12 13
Tania Ávila-Esquivel 14 Researcher 15
National Laboratory of Materials and Structural Models (LanammeUCR) 16 University of Costa Rica, P.O. Box 11501-2060, UCR, San José, Costa Rica 17
Phone: +(506) 2511-2794 18 E-mail: [email protected] 19
20 JoséP. Aguiar-Moya, Ph.D. 21
Research Program Coordinator 22 National Laboratory of Materials and Structural Models (LanammeUCR) 23
University of Costa Rica, P.O. Box 11501-2060, UCR, San José, Costa Rica 24 Phone: + (506) 2511-2529 25
Fax: + (506) 2511-4442 26 E-mail: [email protected] 27
28 Luis G. Loría-Salazar, Ph.D. 29
Pavement Infrastructure Program Director 30 National Laboratory of Materials and Structural Models (LanammeUCR) 31
University of Costa Rica, P.O.Box 11501-2060, UCR, San José, Costa Rica 32 Phone: + (506) 2511-4122 33
Fax: + (506) 2511-4442 34 E-mail: [email protected] 35
36 37
Word Count: 3632+ 9*250 + 5*250= 7132 38 Submission Date: August 1, 2017 39
TRB 2018 Annual Meeting Paper revised from original submittal.
C. Trejos-Castillo, T. Ávila-Esquivel, J.P. Aguiar-Moya, L.G. Loría-Salazar 2
ABSTRACT 1 2 Traditionally, the design of flexible pavements in Costa Rica and countries in the region, has been 3 performed with the empirical methodology defined by AASHTO in 1993. This methodology was 4 developed for the climatic conditions and materials from Illinois, which are different from those found in 5 tropical countries. 6 The new methodologies for flexible pavements design are based on the use of solid mechanics, 7 which computes the responses of a pavement (stresses, strains and deflections) as a result of traffic 8 loading, and with this, estimate the performance of the pavement through its service life by means of 9 transfer functions. 10 To improve the local pavement design methodology University of Costa Rica has worked on 11 several research lines (materials characterization, traffic, climate, software development, mathematical 12 modeling, accelerated pavement testing and performance models) to develop its own mechanistic-13 empirical methodology (CRME). The research developed includes predictive models for determining the 14 hot-mix asphalt dynamic modulus, unbound layers non-linear resilient modulus models, axle load spectra, 15 lateral wander, moisture and temperature effect on the materials constituting the pavement structure. 16 A comparison was made between the CRME and two other design computational tools (MEPDG 17 and AASHTOWare) to evaluate the results obtained with the software, also the mathematical background 18 of some models differs from one application to the other. Differences were found between the outputs 19 obtained, because of the way in which the climatic and traffic variables were considered. However, it was 20 possible to note that the results obtained with the CRME are realistic and more representative of regional 21 conditions. 22
TRB 2018 Annual Meeting Paper revised from original submittal.
C. Trejos-Castillo, T. Ávila-Esquivel, J.P. Aguiar-Moya, L.G. Loría-Salazar 3
INTRODUCTION 1 2 The mechanistic-empirical Pavement Design Guide (MEPDG) provides transfer functions to predict the 3 performance of the pavement structure through its service life. These functions were calibrated for each 4 country or region (1-3), reason why the results obtain from using them will not always apply for our own 5 conditions. 6
Costa Rica has developed a computational tool to design flexible pavements using the 7 mechanistic-empirical method, after a broad line of research, which includes the development of models 8 to estimate the resilient modulus of the unbound layers, the dynamic modulus of the hot mix asphalt layer, 9 and calibrated models using accelerated pavement testing to predict the distress after a determined 10 quantity of load applications (4,5). 11
The software for mechanistic-empirical design of flexible pavement in Costa Rica, CRME, is a 12 easy-to-use computational tool to predict the performance of the pavement structure, considering all the 13 variables that will affect the behavior of the pavement. 14
To produce accurate designs, CRME includes models that consider the climate, the effect of 15 traffic and the materials properties. The method is initially based on calibrated models to predict fatigue 16 cracking and permanent deformation in the structure (4-8). 17
Besides the mentioned another important factor to develop CRME is due to the high cost of the 18 software developed by AASHTO (AASHTOWare Pavement ME Design) and it's prohibition for local 19 use. 20
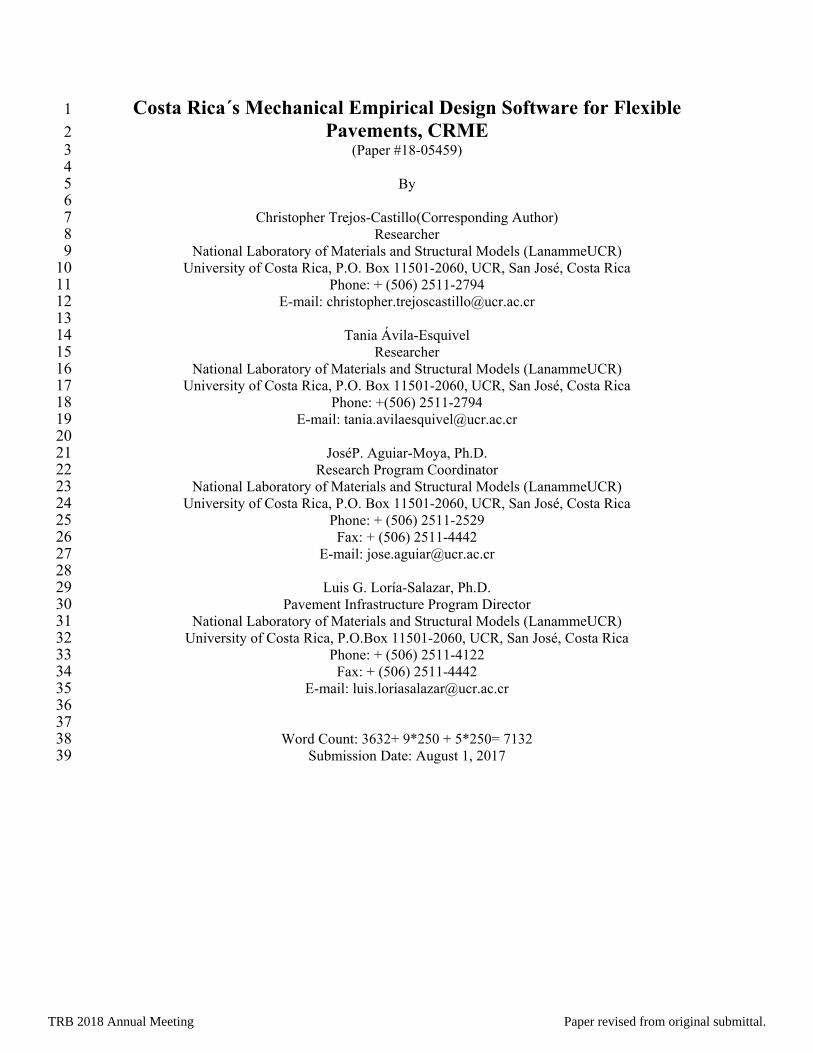
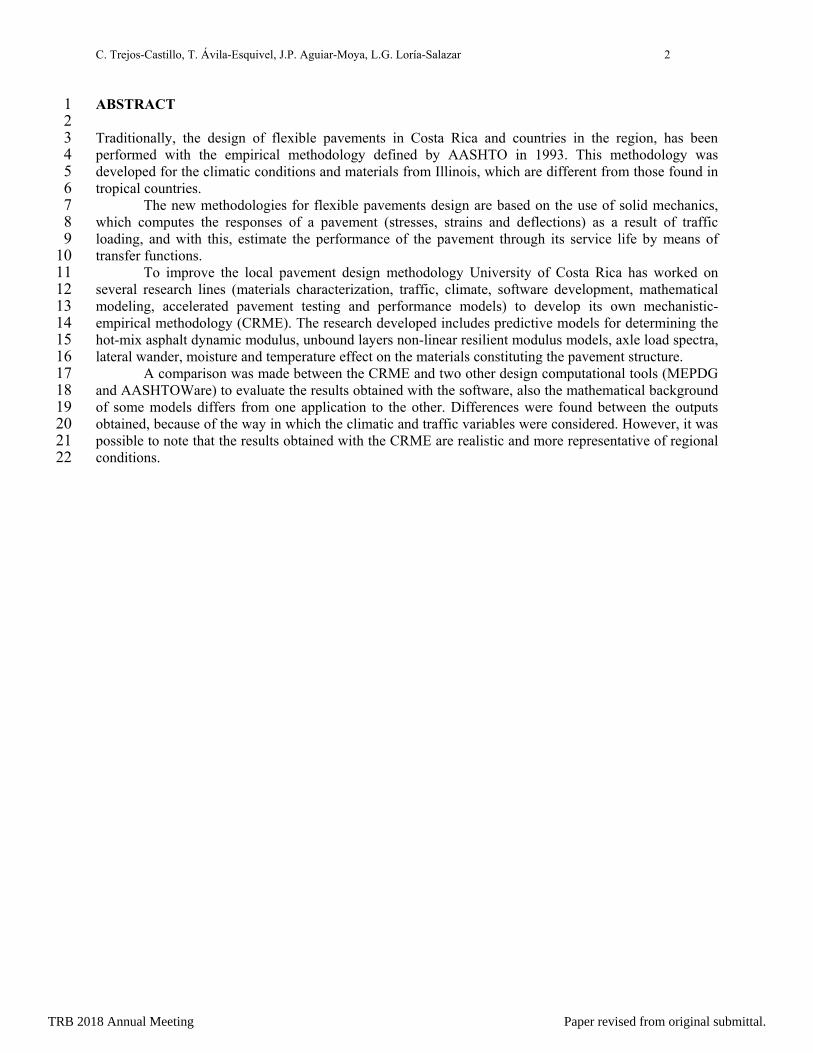
21 OBJECTIVE 22 23 The aim of this research project is to create a computational tool to design flexible pavement structures by 24 the mechanistic-empirical approach, able to predict the pavement performance through a period of time, 25 to this end, an extensive effort was made to cluster all the efforts developed in Costa Rica for pavement 26 design such as material characterization, climatic analysis, traffic data collection and performance 27 determined using accelerated pavement testing. 28 29 SOFTWARE GENERAL DESCRIPTION 30 31 CRME is related to the design approach of the AASHTOWare Pavement ME Design (Pavement ME) 32 software, by taking into consideration the climatic conditions, the traffic, and the material properties in 33 the computation of pavement responses (stresses, strains and displacements) produced by traffic loads 34 using MLET. With the responses, the software predicts the distress of the pavement with mechanic-based 35 performance models based on the full-scale accelerated pavement testing (APT) experiment (9). The 36 diagram in Figure 1, shows how the variables are used in the pavement design procedure. 37 The software result reports the rutting and cracking obtained on the pavement structure, product 38 of the input variables and the level of knowledge selected for each variable. More accurate models are 39 used for level 1 and simplified models for level 3. The software was developed with the Integrated 40 Development Environment (IDE) Visual Basic 6.0. Further projects will migrate the software to a Java 41 platform. 42 The designer should select the initial thicknesses for the layers of the pavement to be analyzed, 43 and then establish the characteristics of the materials, which will be later affected by the climatic 44 conditions, to compute the responses due to the traffic loading. Using the developed performance models, 45 the designer should decide whether the design is approved (9). 46 Figure 2 shows the main window of the program, in which the user must include the project 47 information. Every input requirement will be enabled after the user fills the information in the previous 48 module. The “Run” button will generate the permanent deformation, the top-down and bottom-up fatigue 49 damage, as well as the percentage of cracking area and longitudinal cracking. 50 51
TRB 2018 Annual Meeting Paper revised from original submittal.
C. Trejos-Castillo, T. Ávila-Esquivel, J.P. Aguiar-Moya, L.G. Loría-Salazar 4
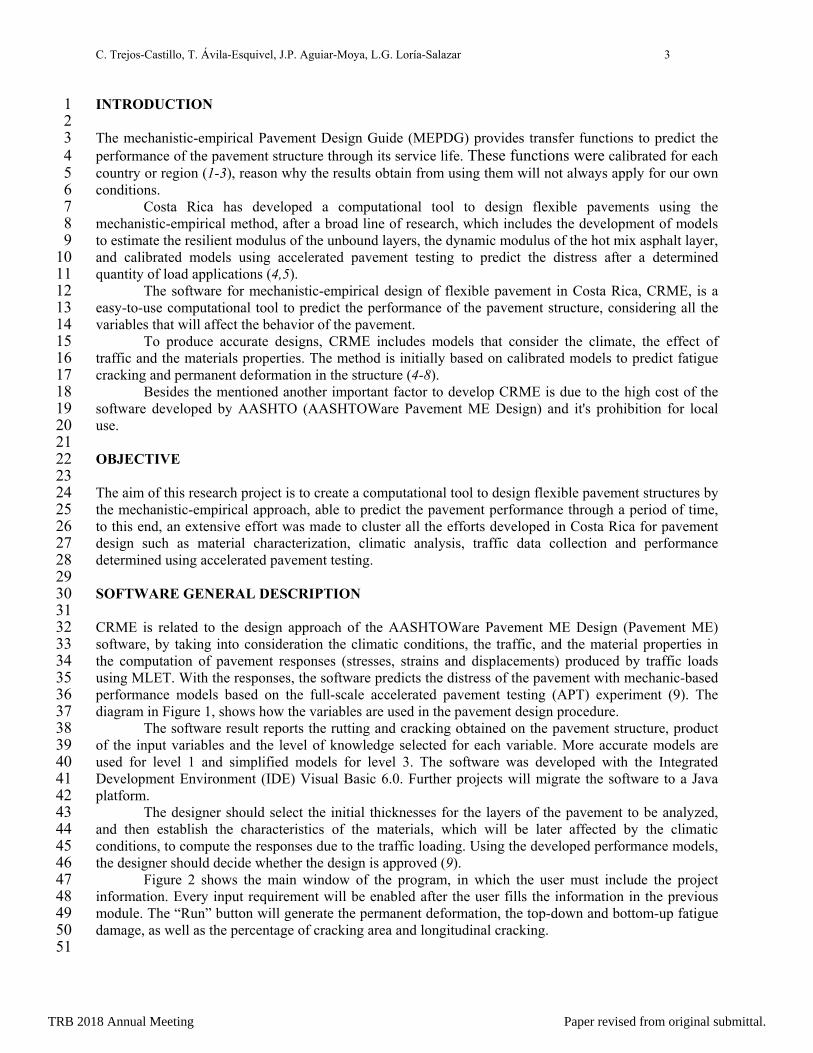
1 FIGURE 1 Conceptual design methodology. 2
3
4 FIGURE 1 Main screen of the CRME software. 5
6 SOLUTION TO MULTILAYER ELASTIC THEORY (MLET) 7 8 MLET was used to compute the responses of the pavement due to the load since it does not require an 9 excessive computational time to calculate the stresses, strains and deflections in the positions required for 10 the design. A method to solve the MLET was developed and programmed into the software, with the aid 11 of the equations specified by Huang (10). 12 The Hankel transformation method was used to determine the responses of a distributed load q on 13 a circular area of radius a, as shown in equation 1. The numerical method based on the Gaussian 14 quadrature rule was used to solve the integral, by means of the Bessel function; obtaining similar 15 responses to the ones generated by tools such as 3D Move or Open Pave. 16
17 ∗
[1] 18
TRB 2018 Annual Meeting Paper revised from original submittal.

C. Trejos-Castillo, T. Ávila-Esquivel, J.P. Aguiar-Moya, L.G. Loría-Salazar 5
where ∗ is the response due to loading = , m is a model parameter, is the first 1 kind Bessel function of order 0, / , r is the cylindrical coordinate for radial direction, H is the 2 depth to the subgrade layer, is the first kind Bessel function of order one, / , and R is the 3 response due to load q. 4
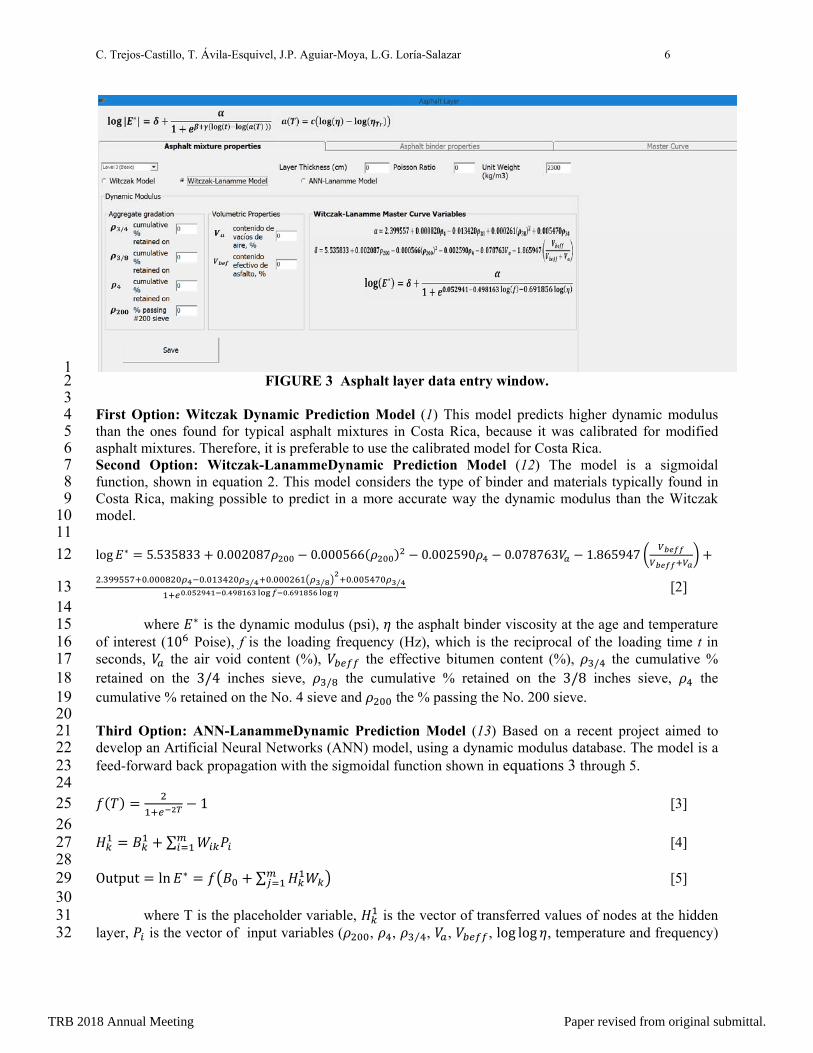
5 TRAFFIC 6 7 The software allows two means to account for traffic. The typical Equivalent Axle Load method is used 8 for the basic level. The second method that can be used to perform the analysis is by using the traffic load 9 spectra, which can be obtained from field measurements or based on a load spectrum of similar 10 roads(regional spectra). Within the tool the user must input the representative load for each of the load 11 ranges given by the software and the total number of repetitions associated. 12 In Costa Rica, regular weight measurements are performed on the main national routes of the 13 country, or by means of mobile load stations used where required, making it possible to obtain the axle 14 load spectrum (11). 15 16 CLIMATE 17 18 The climatic factors are considered by means of the monthly minimum, average, and maximum 19 temperature, and the Thornwaite Moisture Index (TMI). Both must be entered by the user. Resilient 20 modulus models that take into consideration climatic conditions are included in CRME (1). 21 It is possible to include the degree of saturation as a function of the TMI or through the soil water 22 characteristic curve (SWCC). Also, the software can estimate the monthly average dynamic modulus of 23 the asphalt mix as a function of the monthly average temperature. 24 25 MATERIALS 26 27 Asphalt Layer 28 29 The software allows estimation of the dynamic modulus of the asphalt layer depending of the design level 30 established by the designer. 31 32 Design Level 3 (Basic) 33 34 The software provides three options to estimate the dynamic modulus for the basic level. Figure 3 shows 35 the asphalt layer data input window for this design level. 36 37
TRB 2018 Annual Meeting Paper revised from original submittal.
C. Trejos-Castillo, T. Ávila-Esquivel, J.P. Aguiar-Moya, L.G. Loría-Salazar 6
1 FIGURE 3 Asphalt layer data entry window. 2
3 First Option: Witczak Dynamic Prediction Model (1) This model predicts higher dynamic modulus 4 than the ones found for typical asphalt mixtures in Costa Rica, because it was calibrated for modified 5 asphalt mixtures. Therefore, it is preferable to use the calibrated model for Costa Rica. 6 Second Option: Witczak-LanammeDynamic Prediction Model (12) The model is a sigmoidal 7 function, shown in equation 2. This model considers the type of binder and materials typically found in 8 Costa Rica, making possible to predict in a more accurate way the dynamic modulus than the Witczak 9 model. 10 11
log ∗ 5.535833 0.002087 0.000566 0.002590 0.078763 1.86594712
. . . ⁄ . ⁄ . ⁄. . . [2] 13
14 where ∗ is the dynamic modulus (psi), the asphalt binder viscosity at the age and temperature 15 of interest (10 Poise), f is the loading frequency (Hz), which is the reciprocal of the loading time t in 16 seconds, the air void content (%), the effective bitumen content (%), / the cumulative % 17 retained on the 3/4 inches sieve, / the cumulative % retained on the 3/8 inches sieve, the 18 cumulative % retained on the No. 4 sieve and the % passing the No. 200 sieve. 19 20 Third Option: ANN-LanammeDynamic Prediction Model (13) Based on a recent project aimed to 21 develop an Artificial Neural Networks (ANN) model, using a dynamic modulus database. The model is a 22 feed-forward back propagation with the sigmoidal function shown in equations 3 through 5. 23 24
1 [3] 25 26
∑ [4] 27 28 Output ln ∗ ∑ [5] 29 30 where T is the placeholder variable, is the vector of transferred values of nodes at the hidden 31 layer, is the vector of input variables ( , , ⁄ , , , log log , temperature and frequency) 32
TRB 2018 Annual Meeting Paper revised from original submittal.
C. Trejos-Castillo, T. Ávila-Esquivel, J.P. Aguiar-Moya, L.G. Loría-Salazar 7
as defined previously for equation 2, is the matrix of weight factors for the hidden layer, is the 1 vector of weight factors for the output layer, is the vector of bias factors for the first layer, is the 2 bias factor for outer layer and m is the number of nodes in hidden layer. 3 4 Design Level 2 5 6 At this level, the asphalt mixture master curve is used to compute the dynamic modulus. The shift factor 7 of the master curve is estimated using the Arrhenius Equation (equation 6). The advantage of this model 8 is that it allows the computation on the asphalt mixture dynamic modulus E* without further binder 9 testing. 10 The symmetrical sigmoidal function used to obtain the dynamic modulus at specific temperatures 11 and frequencies is shown in equation 7 (14). 12 13 log
∆
. [6] 14
15 where ∆ is the apparent activation energy, typically 250 KJ/mol, R is the universal gas constant 16 = 8.314 J/K-mol, T is the temperature in Kelvin, and is the reference temperature in Kelvin. 17 18 log ∗ [7] 19
20 where , , , and ∆ are regression coefficients and f is the frequency (Hz). 21 22 Design Level 1 23 24 The most accurate method to estimate the dynamic modulus is described in level 1of the MEPDG guide 25 (1). This methodology considers the binder viscosity to estimate the effect of temperature in the dynamic 26 modulus, as shown in equation 8. 27 28 log log log [8] 29 30 where is the viscosity in cPoise, A and VTS are regression parameters and T is the temperature 31 of the asphalt mixture in Rankine. If the obtained viscosity values are higher than 2.7 10 Poise, this 32 value should be used instead. This often happens when evaluating low temperatures in the equation. 33 34 Asphalt Binder 35 36 The software offers the possibility of estimating A and VTS values using three different methods. For the 37 basic level, the designer can input default values suggested depending on the Superpave Binder 38 Performance Grade (PG), the Conventional AC Grade or the Conventional Penetration Grade. For 39 intermediate level, these values can be determined from at least four points acquired from conventional 40 binder testing, and for advanced level, the engineer can use at least three points obtained from 41 SuperpavePG binder testing. 42 The shift factor in equation 9 depends on the viscosity calculated as function of the temperature. 43 The symmetrical sigmoidal model is shown in equation 10. 44 45 log log log [9] 46 47 where is the viscosity at the reference temperature in cPoise. 48 49
TRB 2018 Annual Meeting Paper revised from original submittal.
C. Trejos-Castillo, T. Ávila-Esquivel, J.P. Aguiar-Moya, L.G. Loría-Salazar 8
log ∗ [10] 1
2 where , , , and c are regression parameters and t is the loading time in seconds. 3 4 Equation 11 is used to estimate the loading time t (s) as a function of the speed v (km/h) and the depth d 5 (m) (15). 6 7 log 0.5 0.2 0.94 log [11] 8 9 Unbound Layers 10 11 The software allows two methods to estimate the resilient modulus of the unbound layers (base, subbase 12 and subgrade); for the basic level (level 3) it is possible to use the California Bearing Ratio (CBR) to 13 approximate the value or to input the resilient modulus directly. For level 1, the modulus will be 14 calculated through the Universal Model (equation 12) (16), which considers the stress dependency of the 15 granular and soil materials. 16 17
1 [12] 18
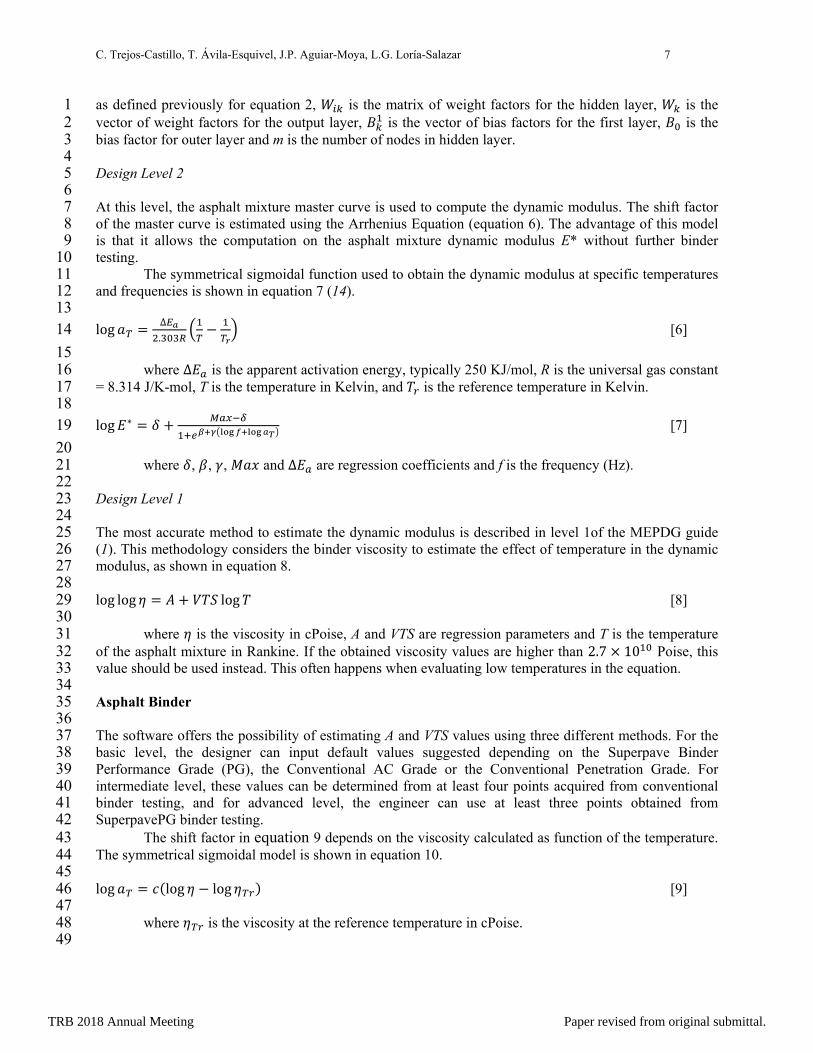
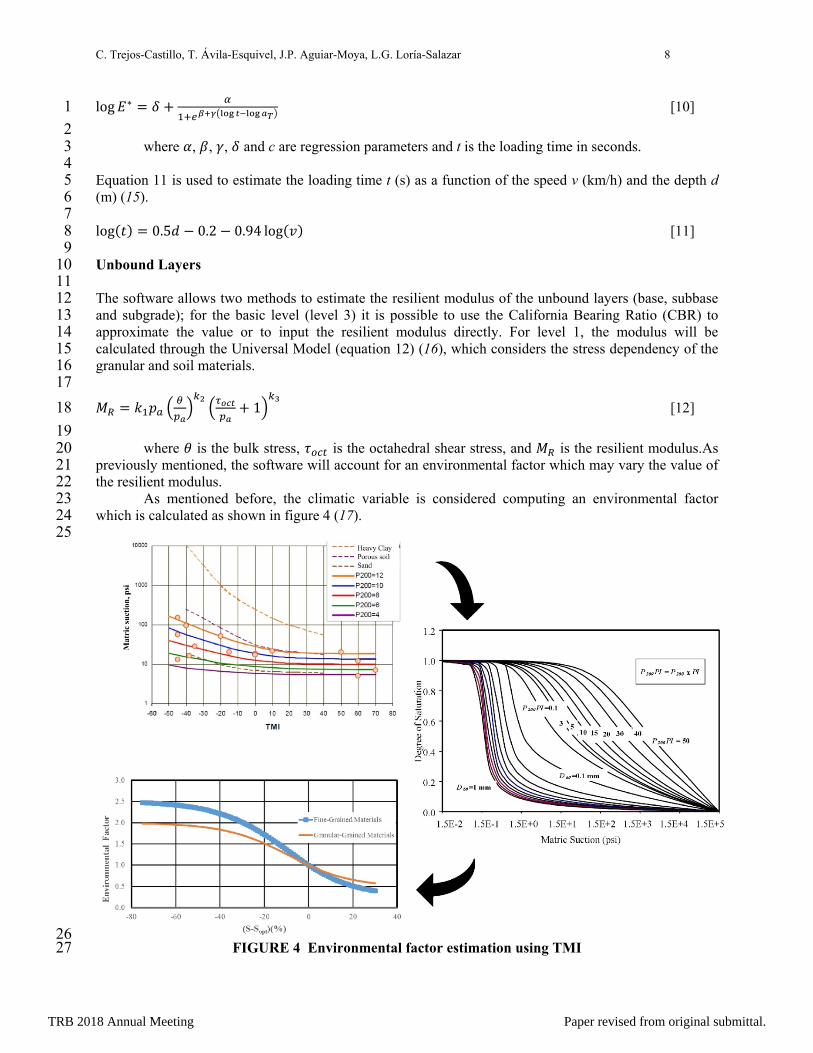
19 where is the bulk stress, is the octahedral shear stress, and is the resilient modulus.As 20 previously mentioned, the software will account for an environmental factor which may vary the value of 21 the resilient modulus. 22 As mentioned before, the climatic variable is considered computing an environmental factor 23 which is calculated as shown in figure 4 (17). 24 25
26 FIGURE 4 Environmental factor estimation using TMI 27
TRB 2018 Annual Meeting Paper revised from original submittal.
C. Trejos-Castillo, T. Ávila-Esquivel, J.P. Aguiar-Moya, L.G. Loría-Salazar 9
PERFORMANCE MODELS CALIBRATED WITH APT DATA 1 2 The way in which damage is predicted over the lifetime of a pavement structure, is of great importance 3 within a design method based on a mechanistic-empirical approach. The performance models were 4 calibrated using laboratory and full scale APT (PaveLab-University of Costa Rica) tests. 5 Fatigue models were determined with an incremental-recursive approach, considering the 6 dynamic modulus decrease of the asphalt layer, as shown in equation 13; and with an approach like that 7 of the MEPDG guide, as shown in equation 14 (18). 8 9
. . . [13] 10 11
0.0925 .. .
. [14] 12 13 where is the tangential strain at the bottom of the asphalt layer, T is the temperature of the mix 14 (°C), is the allowed load repetitions, MN is the allowed load repetitions in millions, E is the dynamic 15 modulus of the asphalt mixture in (MPa), and is the damage. These models were developed for plant 16 mixtures and can be manually included in the CRME. 17 The development of the fatigue models has gone through several stages, starting with the 18 formulation of laboratory data models, such as the one shown in equation 15 (19). 19 20
4,345 10 ∙ , [15] 21 22 SOFTWARE COMPARISONS 23 24 To evaluate the results obtained with the CRME, a comparison has been done with other design 25 computational tools: MEPDG and AASHTOWare Pavement Design ME. In this regard, to the end of 26 covering a wide range of conditions, different input data were used for both examples. 27 To allow a direct comparison between the methods, it was necessary to process the data, due to 28 the way in which the information is requested for each computational tool. 29
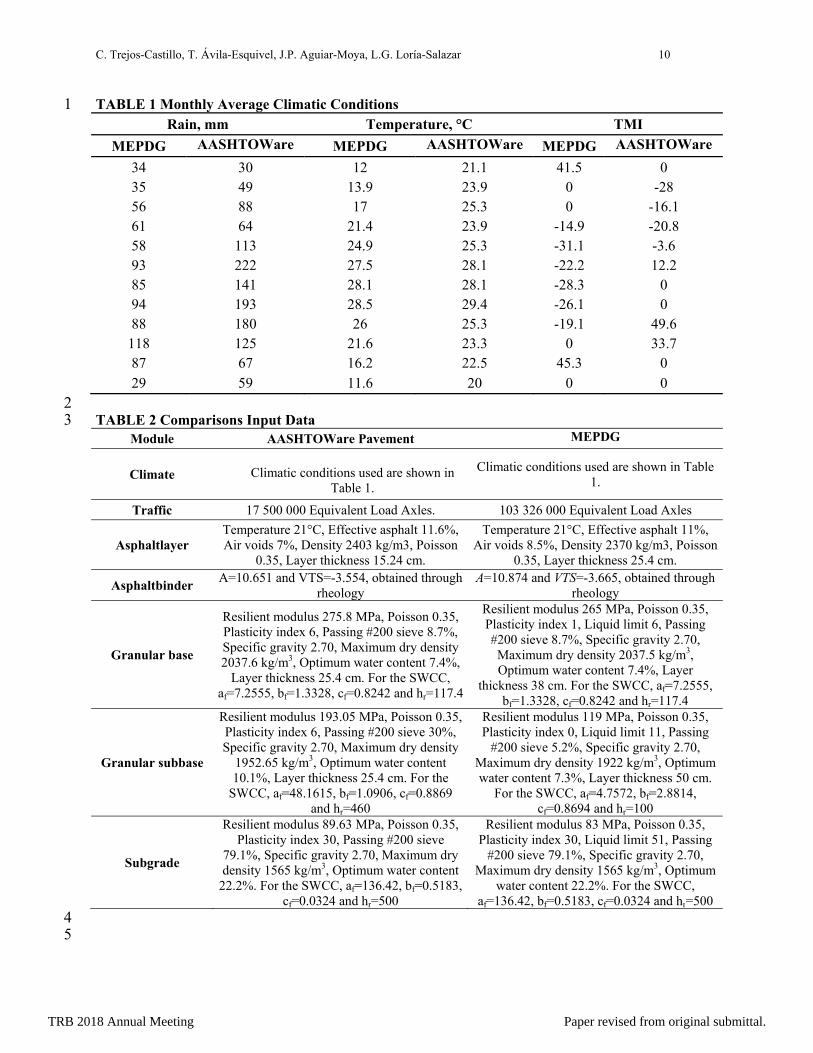
Table 1 shows the climatic conditions incorporated in both software for each one of the two 30 comparisons. Table 2 shows the input data for traffic, the asphalt layer, asphalt binder, and for each of 31 the unbound layers. Table 3 shows the gradation used for estimating the dynamic modulus of the asphalt 32 layer with the Witczak model for the comparison done between the AASHTOWare Pavement software 33 and the Costa Rican mechanistical empirical pavement design software, and Table 4 shows the input data 34 of AASHTO T340 test for the master curve used to estimate the dynamic modulus of the hot mix asphalt 35 layer (HMA) for the comparison between the previous MEPDG software version with the CRME 36 software. 37 38 39
TRB 2018 Annual Meeting Paper revised from original submittal.
C. Trejos-Castillo, T. Ávila-Esquivel, J.P. Aguiar-Moya, L.G. Loría-Salazar 10
TABLE 1 Monthly Average Climatic Conditions 1 Rain, mm Temperature, °C TMI
MEPDG AASHTOWare MEPDG AASHTOWare MEPDG AASHTOWare
34 30 12 21.1 41.5 0 35 49 13.9 23.9 0 -28 56 88 17 25.3 0 -16.1 61 64 21.4 23.9 -14.9 -20.8 58 113 24.9 25.3 -31.1 -3.6 93 222 27.5 28.1 -22.2 12.2 85 141 28.1 28.1 -28.3 0 94 193 28.5 29.4 -26.1 0 88 180 26 25.3 -19.1 49.6
118 125 21.6 23.3 0 33.7 87 67 16.2 22.5 45.3 0 29 59 11.6 20 0 0
2 TABLE 2 Comparisons Input Data 3
Module AASHTOWare Pavement MEPDG
Climate Climatic conditions used are shown in Table 1.
Climatic conditions used are shown in Table 1.
Traffic 17 500 000 Equivalent Load Axles. 103 326 000 Equivalent Load Axles
Asphaltlayer Temperature 21°C, Effective asphalt 11.6%, Air voids 7%, Density 2403 kg/m3, Poisson
0.35, Layer thickness 15.24 cm.
Temperature 21°C, Effective asphalt 11%, Air voids 8.5%, Density 2370 kg/m3, Poisson
0.35, Layer thickness 25.4 cm.
Asphaltbinder A=10.651 and VTS=-3.554, obtained through
rheology A=10.874 and VTS=-3.665, obtained through
rheology
Granular base
Resilient modulus 275.8 MPa, Poisson 0.35, Plasticity index 6, Passing #200 sieve 8.7%, Specific gravity 2.70, Maximum dry density 2037.6 kg/m3, Optimum water content 7.4%,
Layer thickness 25.4 cm. For the SWCC, af=7.2555, bf=1.3328, cf=0.8242 and hr=117.4
Resilient modulus 265 MPa, Poisson 0.35, Plasticity index 1, Liquid limit 6, Passing #200 sieve 8.7%, Specific gravity 2.70, Maximum dry density 2037.5 kg/m3, Optimum water content 7.4%, Layer
thickness 38 cm. For the SWCC, af=7.2555, bf=1.3328, cf=0.8242 and hr=117.4
Granular subbase
Resilient modulus 193.05 MPa, Poisson 0.35, Plasticity index 6, Passing #200 sieve 30%, Specific gravity 2.70, Maximum dry density
1952.65 kg/m3, Optimum water content 10.1%, Layer thickness 25.4 cm. For the
SWCC, af=48.1615, bf=1.0906, cf=0.8869 and hr=460
Resilient modulus 119 MPa, Poisson 0.35, Plasticity index 0, Liquid limit 11, Passing
#200 sieve 5.2%, Specific gravity 2.70, Maximum dry density 1922 kg/m3, Optimum water content 7.3%, Layer thickness 50 cm.
For the SWCC, af=4.7572, bf=2.8814, cf=0.8694 and hr=100
Subgrade
Resilient modulus 89.63 MPa, Poisson 0.35, Plasticity index 30, Passing #200 sieve
79.1%, Specific gravity 2.70, Maximum dry density 1565 kg/m3, Optimum water content
22.2%. For the SWCC, af=136.42, bf=0.5183, cf=0.0324 and hr=500
Resilient modulus 83 MPa, Poisson 0.35, Plasticity index 30, Liquid limit 51, Passing
#200 sieve 79.1%, Specific gravity 2.70, Maximum dry density 1565 kg/m3, Optimum
water content 22.2%. For the SWCC, af=136.42, bf=0.5183, cf=0.0324 and hr=500
4 5
TRB 2018 Annual Meeting Paper revised from original submittal.
C. Trejos-Castillo, T. Ávila-Esquivel, J.P. Aguiar-Moya, L.G. Loría-Salazar 11
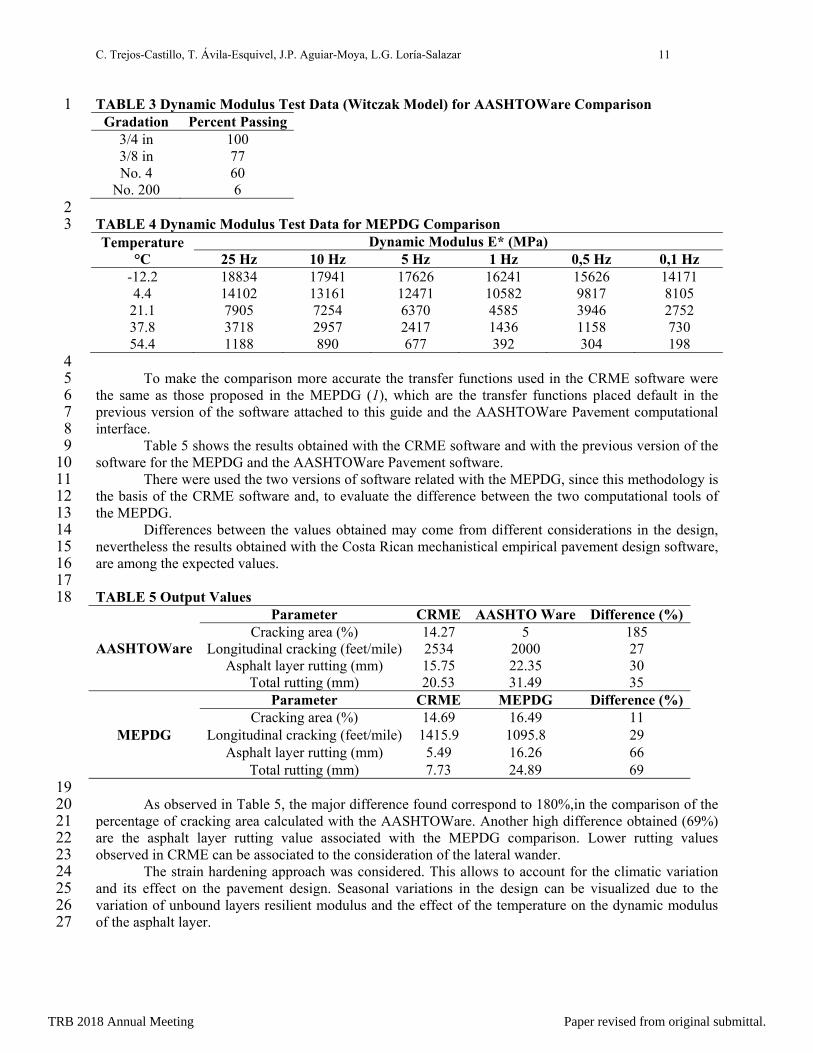
TABLE 3 Dynamic Modulus Test Data (Witczak Model) for AASHTOWare Comparison 1 Gradation Percent Passing
3/4 in 100 3/8 in 77 No. 4 60
No. 200 6 2 TABLE 4 Dynamic Modulus Test Data for MEPDG Comparison 3 Temperature
°C Dynamic Modulus E* (MPa)
25 Hz 10 Hz 5 Hz 1 Hz 0,5 Hz 0,1 Hz -12.2 18834 17941 17626 16241 15626 14171 4.4 14102 13161 12471 10582 9817 8105
21.1 7905 7254 6370 4585 3946 2752 37.8 3718 2957 2417 1436 1158 730 54.4 1188 890 677 392 304 198
4 To make the comparison more accurate the transfer functions used in the CRME software were 5
the same as those proposed in the MEPDG (1), which are the transfer functions placed default in the 6 previous version of the software attached to this guide and the AASHTOWare Pavement computational 7 interface. 8 Table 5 shows the results obtained with the CRME software and with the previous version of the 9 software for the MEPDG and the AASHTOWare Pavement software. 10
There were used the two versions of software related with the MEPDG, since this methodology is 11 the basis of the CRME software and, to evaluate the difference between the two computational tools of 12 the MEPDG. 13
Differences between the values obtained may come from different considerations in the design, 14 nevertheless the results obtained with the Costa Rican mechanistical empirical pavement design software, 15 are among the expected values. 16 17 TABLE 5 Output Values 18
AASHTOWare
Parameter CRME AASHTO Ware Difference (%)Cracking area (%) 14.27 5 185
Longitudinal cracking (feet/mile) 2534 2000 27 Asphalt layer rutting (mm) 15.75 22.35 30
Total rutting (mm) 20.53 31.49 35
MEPDG
Parameter CRME MEPDG Difference (%)Cracking area (%) 14.69 16.49 11
Longitudinal cracking (feet/mile) 1415.9 1095.8 29 Asphalt layer rutting (mm) 5.49 16.26 66
Total rutting (mm) 7.73 24.89 69 19
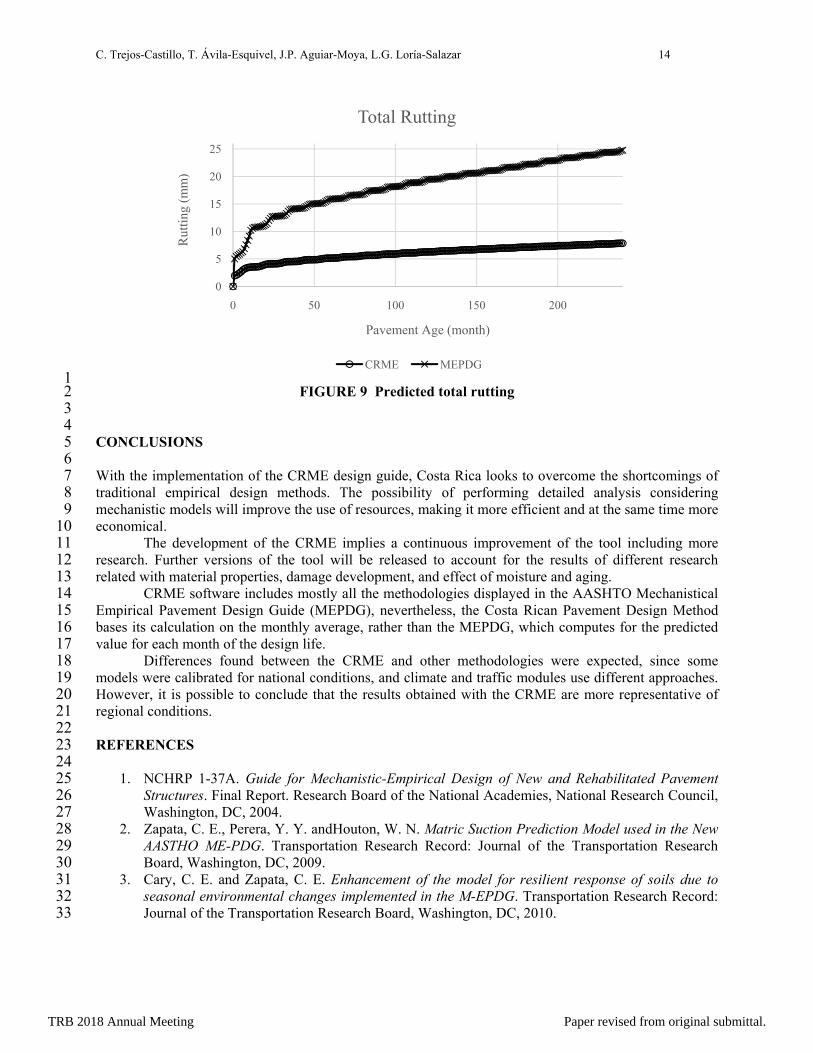
As observed in Table 5, the major difference found correspond to 180%,in the comparison of the 20 percentage of cracking area calculated with the AASHTOWare. Another high difference obtained (69%) 21 are the asphalt layer rutting value associated with the MEPDG comparison. Lower rutting values 22 observed in CRME can be associated to the consideration of the lateral wander. 23 The strain hardening approach was considered. This allows to account for the climatic variation 24 and its effect on the pavement design. Seasonal variations in the design can be visualized due to the 25 variation of unbound layers resilient modulus and the effect of the temperature on the dynamic modulus 26 of the asphalt layer. 27
TRB 2018 Annual Meeting Paper revised from original submittal.
C. Trejos-Castillo, T. Ávila-Esquivel, J.P. Aguiar-Moya, L.G. Loría-Salazar 12
Figure 5 shows the monthly average dynamic modulus used within the CRME software and the 1 MEPDG software. The last one has a big discrepancy with the Costa Rican computational tool, estimates 2 a dynamic modulus at different depths of the asphalt layer for each month of the design period. 3 4
5 FIGURE 5 Monthly average dynamic modulus 6
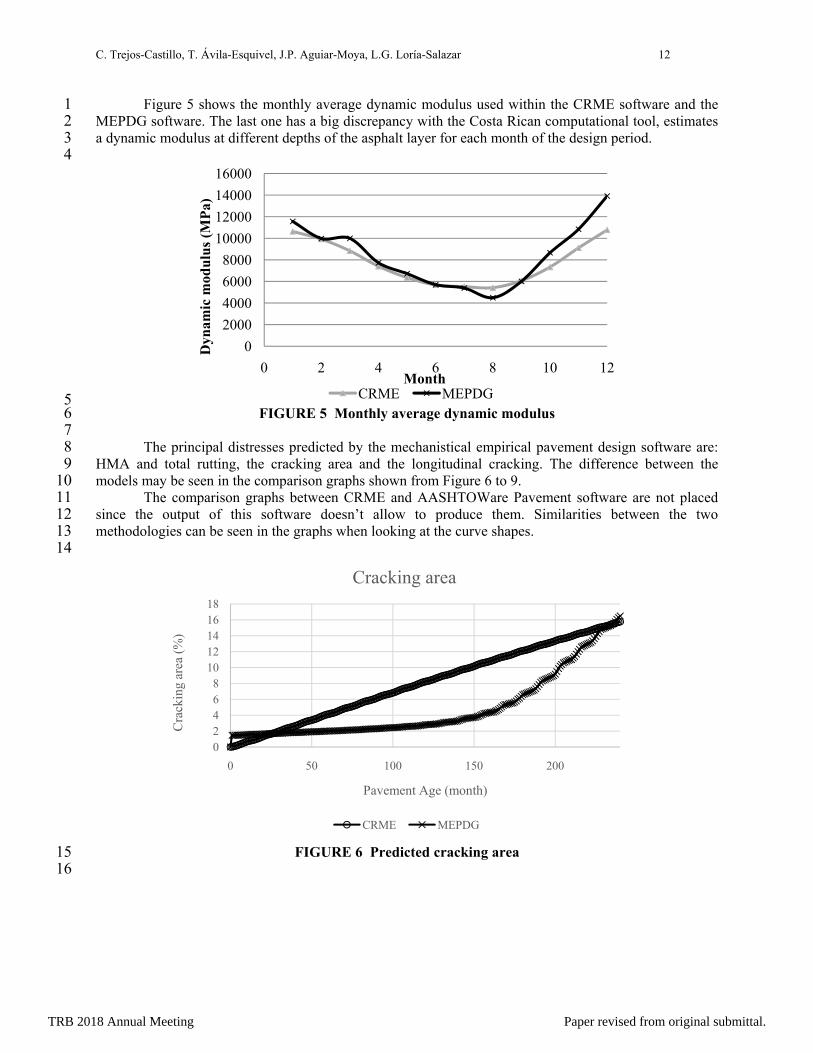
7 The principal distresses predicted by the mechanistical empirical pavement design software are: 8
HMA and total rutting, the cracking area and the longitudinal cracking. The difference between the 9 models may be seen in the comparison graphs shown from Figure 6 to 9. 10
The comparison graphs between CRME and AASHTOWare Pavement software are not placed 11 since the output of this software doesn’t allow to produce them. Similarities between the two 12 methodologies can be seen in the graphs when looking at the curve shapes. 13 14
FIGURE 6 Predicted cracking area 15 16
0
2000
4000
6000
8000
10000
12000
14000
16000
0 2 4 6 8 10 12
Dyn
amic
mod
ulu
s (M
Pa)
MonthCRME MEPDG
02468
1012141618
0 50 100 150 200
Cra
ckin
g ar
ea (
%)
Pavement Age (month)
Cracking area
CRME MEPDG
TRB 2018 Annual Meeting Paper revised from original submittal.
C. Trejos-Castillo, T. Ávila-Esquivel, J.P. Aguiar-Moya, L.G. Loría-Salazar 13
1 FIGURE 7 Predicted longitudinal cracking 2
3 4
5 FIGURE 8 Predicted HMA rutting 6
7
0
200
400
600
800
1000
1200
1400
1600
0 50 100 150 200
Lon
gitu
dina
l cra
ckin
g (f
t/mile
)
Pavement Age (month)
Longitudinal Cracking
CRME MEPDG
0
2
4
6
8
10
12
14
16
0 50 100 150 200
Rut
ting
(mm
)
Pavement Age (month)
HMA Rutting
CRME MEPDG
TRB 2018 Annual Meeting Paper revised from original submittal.
C. Trejos-Castillo, T. Ávila-Esquivel, J.P. Aguiar-Moya, L.G. Loría-Salazar 14
1 FIGURE 9 Predicted total rutting 2
3 4 CONCLUSIONS 5
6 With the implementation of the CRME design guide, Costa Rica looks to overcome the shortcomings of 7 traditional empirical design methods. The possibility of performing detailed analysis considering 8 mechanistic models will improve the use of resources, making it more efficient and at the same time more 9 economical. 10 The development of the CRME implies a continuous improvement of the tool including more 11 research. Further versions of the tool will be released to account for the results of different research 12 related with material properties, damage development, and effect of moisture and aging. 13 CRME software includes mostly all the methodologies displayed in the AASHTO Mechanistical 14 Empirical Pavement Design Guide (MEPDG), nevertheless, the Costa Rican Pavement Design Method 15 bases its calculation on the monthly average, rather than the MEPDG, which computes for the predicted 16 value for each month of the design life. 17 Differences found between the CRME and other methodologies were expected, since some 18 models were calibrated for national conditions, and climate and traffic modules use different approaches. 19 However, it is possible to conclude that the results obtained with the CRME are more representative of 20 regional conditions. 21
22 REFERENCES 23 24
1. NCHRP 1-37A. Guide for Mechanistic-Empirical Design of New and Rehabilitated Pavement 25 Structures. Final Report. Research Board of the National Academies, National Research Council, 26 Washington, DC, 2004. 27
2. Zapata, C. E., Perera, Y. Y. andHouton, W. N. Matric Suction Prediction Model used in the New 28 AASTHO ME-PDG. Transportation Research Record: Journal of the Transportation Research 29 Board, Washington, DC, 2009. 30
3. Cary, C. E. and Zapata, C. E. Enhancement of the model for resilient response of soils due to 31 seasonal environmental changes implemented in the M-EPDG. Transportation Research Record: 32 Journal of the Transportation Research Board, Washington, DC, 2010. 33
0
5
10
15
20
25
0 50 100 150 200
Rut
ting
(mm
)
Pavement Age (month)
Total Rutting
CRME MEPDG
TRB 2018 Annual Meeting Paper revised from original submittal.
C. Trejos-Castillo, T. Ávila-Esquivel, J.P. Aguiar-Moya, L.G. Loría-Salazar 15
4. Leiva-Villacorta, F., Aguiar-Moya, J. P. andLoría-Salazar, L. G. Accelerated pavement testing 1 first results at the LanammeUCR APT facility. Transportation Research Board 94th Annual 2 Meeting Proceedings, 2015. 3
5. Leiva-Villacorta, F., Vargas-Nordcbeck, A., Aguiar-Moya, J. P. andLoría-Salazar, L. G. 4 Development and Calibration of Permanent Deformation Models.The Roles of Accelerated 5 Pavement Testing in Pavement Sustainability. Engineering, Environment, and Economics, pp. 6 573-587.2016. 7
6. Leiva-Villacorta, F., Loría-Salazar, L. G. andCamacho-Garita, E. Evaluating Nonlineartiy on 8 Granular Materials and Soils Through the Use of Deflection Techniques. The Roles of 9 Accelerated Pavement Testing in Pavement Sustainability. Engineering, Environment, and 10 Economics, pp. 111-129, 2016. 11
7. Loria, L. G., Badilla, G., Jimenez Acuna, M., Elizondo, F., and Aguiar-Moya, J. P. Experiences 12 in the Characterization of Materials Used in the Calibration of the AASHTO Mechanistic-13 Empirical Pavement Design Guide (MEPDG) for Flexible Pavement for Costa 14 Rica. Transportation Research Board 90th Annual Meeting,2011. 15
8. Aguiar-Moya, J. P., Corrales, J. P., Elizondo, F. andLoría-Salazar, L. G. PaveLab and heavy 16 vehicle simulator implementation at the National Laboratory of Materials and Testing Models of 17 the University of Costa Rica. Advances in pavement design through full-scale accelerated 18 pavement testing, pp. 25-32, 2012. 19
9. Trejos-Castillo, C., Aguiar-Moya, J. P. and Loría-Salazar, L. G. Desarrollo de software de 20 análisis y diseño de pavimentos para Costa Rica.Programa Infraestructura del Transporte 21 (PITRA), LanammeUCR, 2016. 22
10. Huang, Y. H. Pavement design and analysis. Pearson/Prentice Hall, 2004. 23 11. Ulloa, Á., Badilla, G., Allen-Monge, J. and Sibaja-Obando, D. Encuesta de Carga. 24
LanammeUCR, 2007. 25 12. Elizondo, F.; Ulloa, Á. and Badilla, G.Predicción de módulos resilientes en mezclas asfálticas 26
mediante el modelo de Witczak. Infraestructura Vial, Vol. 10, no 3, 2007. 27 13. Leiva-Villacorta, F.; Loria-Salazar, L. G. and Aguiar-Moya, J. P. Development of an Improved 28
and More Effective Dynamic Modulus E* Model for Mixtures in Costa Rica by Means of 29 Artificial Neural Networks. Transportation Research Board 92nd Annual Meeting, 2013. 30
14. Zhao, Y. and Kim, Y. Time-temperature superposition for asphalt mixtures with growing damage 31 and permanent deformation in compression. Transportation Research Record: Journal of the 32 Transportation Research Board, no 1832, pp. 161-172, 2003. 33
15. Hu, X., Zhou, F., Hu, S., and Walubita, L. F. Proposed loading waveforms and loading time 34 equations for mechanistic-empirical pavement design and analysis. Journal of Transportation 35 Engineering, vol. 136, no 6, pp. 518-527, 2009. 36
16. Andrei, D., Witczak, M., Schwartz, C. and Uzan, J. Harmonized resilient modulus test method for 37 unbound pavement materials. Transportation Research Record: Journal of the Transportation 38 Research Board, 29-37, 2004. 39
17. Witczak, M. W., Zapata, C. E., & Houston, W. N. Models incorporated into the current enhanced 40 integrated climatic model: NCHRP 9-23 project findings and additional changes after version 41 0.7. Final Report, Project NCHRP 9-23, 2006. 42
18. Leiva-Villacorta, F., Vargas-Nordcbeck, A., Aguiar-Moya, J. P. andLoria-Salazar, L. G. 43 Calibration of a Mechanistic-Empirical Fatigue Model Using the PaveLab Heavy Vehicle 44 Simulator.TransportationResearchBoard 95th Annual Meeting (No. 16-3509), 2016. 45
19. Aguiar-Moya, J. P. and Loria-Salazar, L. G. Desarrollo de modelos de fatiga para capas 46 asfálticas. Revista de Infraestructura Vial, pp. 18-22. LanammeUCR, 2006. 47
TRB 2018 Annual Meeting Paper revised from original submittal.