Embed Size (px)
Citation preview

October 2000
WS Atkins
Woodcote Grove, Ashley Road, Epsom, Surrey KT18 5BWTel: (01372) 726140 Fax: (01372) 740055
National Economic and Social The World Bank
Development Board
Cost Structure of Major ThaiIndustries
Final Report

JOB NUMBER: BJ0346 DOCUMENT REF:
08
With minor comments fromNESDB and Dr. Juanjai
IT IT IT SDR 20/10/00
07
With comments from SDR,Dr. Juanjai, Dr. Ronyoot,Khun Khem.
IT JA/RC SDR SDR 26/9/00
06 With comments from NESDB IT JA/RC SDR SDR 13/9/00
05 With comments from Dr.Ronyoot and Dr. Juanjai
JA/RC IT SDR SDR 16/8/00
01 For submission IT sdr sdr 2/8/00
00 Rough draft for discussion IT/BMS 25/7
Originated Checked Reviewed Authorised Date
Revision PurposeDescription
WS ATKINS CONSULTANTS LIMITED

Cost Structure of Major Thai Industries Final Report
BJ0346/Report/FinalLast printed 27/11/02 15:05
i
CONTENTS
EXECUTIVE SUMMARY viBackground, Objectives and Scope viThe selected sectors and company case studies viExport performance, competitors and competitiveness gap viiiFood processing – ready to eat meals ixElectronic appliances xiGarments xiiiAutomotive parts – pressed metal goods xivPlastic products xvRubber goods xviiLeather goods xixConclusions on cost structure and competitiveness xxiiIndustrial policy, impact and recommendations xxiv
1. INTRODUCTION 1-1
Background to the Study 1-1Methodology 1-2Objectives and scope 1-3The issue: competitiveness and its relationship with cost structure 1-3The context: background to the selected industries 1-4The agents: companies as engines of competitiveness 1-12Survey Sampling for Company Survey and breakdown of surveyed sample 1-16
2. THAI INITIATIVES RELATING TO COMPETITIVENESS 2-1
Industrial Policies 2-1Effect of industrial policies on sectoral and national competitivenes 2-4Company views on the effect of industrial policies on the competitiveness of the firm2-4Impact of Trade liberalisation on Thai industry 2-8Summary and Conclusions 2-9

Cost Structure of Major Thai Industries Final Report
BJ0346/Report/FinalLast printed 27/11/02 15:05
ii
3. THE POSITION OF THAI INDUSTRIES IN THE WORLD MARKET 3-1
Introduction 3-1Relative Exports as Measures of Competitiveness 3-1Main competitor nations 3-3Processed foods 3-4Electronic appliances 3-10Garments Industry 3-16Automotive Pressed Metal Parts 3-23Plastic products 3-28Rubber goods 3-33Leather goods 3-39
4. COMPETITIVENESS GAP 4-1
Introduction 4-1Competitiveness trends 4-1Comparison of competitiveness indices with main competitor nations 4-4Closing the gap: how and time frame 4-12
5. FACTORS AFFECTING COST COMPETITIVENESS 5-1
Introduction 5-1Critical cost Factors 5-1Overall cost structures 5-2Skilled Labour and Technology 5-3Changes in production capacity utilisation 5-4Financing 5-5
6. POLICY RECOMMENDATIONS 6-1
Introduction 6-1Summary of Policy Options 6-1Firm/Industry Level 6-3Macro-economic level 6-9

Cost Structure of Major Thai Industries Final Report
BJ0346/Report/FinalLast printed 27/11/02 15:05
iii
APPENDIX 1: SUMMARY OF INDUSTRIAL DEVELOPMENT PLANSTRATEGIES AND SME DEVELOPMENT MASTER PLAN
APPENDIX 2: METHODOLOGY APPLIED TO THE QUALITATIVEQUESTIONS
APPENDIX 3: COMPANY LEVEL COMPETITIVE PERFORMANCE
APPENDIX 4: ASSESSMENT OF UTILITIES COST
APPENDIX 5: RESULTS OF THE CONSULTATIVE SEMINAR

Cost Structure of Major Thai Industries Final Report
BJ0346/Report/FinalLast printed 27/11/02 15:05
iv
LIST OF TABLES
PageTable 1-1. Some Quantitative Selection Criteria (in million Baht - 1996) 1-4Table 1-2. Selected Industries and Sectors 1-5Table 1-3: Number of Survey Firms classified by Size 1-17Table 1-4: Number of Survey Firms classified by Ownership 1-17Table 2-1: Rough Comparative Table of Import Duties ranges in ASEAN countries for
selected Industries’ raw materials (%) 2-1Table 2-2: Breakdown of products being granted BOI promotional privileges on different
sectors. 2-5Table 2-3: Perceived Effect of Reduction or Termination of BOI incentives on Costs 2-6Table 2-4: Effect of Reduction or Termination of BOI incentives on Costs by company size2-7Table 2-5: Effect of Reduction or Termination of BOI incentives on Costs by company
ownership 2-7Table 2-6: Effect of Reduction or Termination of trade privileges by company ownership 2-8Table 3-1: 1998 Imports into NAFTA, EU and JAPAN (Million US Dollars) 3-2Table 3-2: Thailand’s Main Direct Competitors 3-4Table 3-3: 1998 Food Imports into Main Markets (Million US Dollars) 3-5Table 3-4: Major markets – volume sales of frozen ready meals 1992-1996 3-6Table 3-5: Benchmarking of Average Thai Companies against Best Practice 3-8Table 3-6: SWOT analysis of Ready-to-Eat Meals 3-9Table 3-7: 1998 Electronics Imports into Main Markets (Million US Dollars) 3-11Table 3-8: Main Producing Countries of Electronic Equipment and Components 3-12Table 3-9: Benchmarking of Thai Companies against Best Practice 3-13Table 3-10: SWOT analysis of Hard Disk Drive Companies 3-14Table 3-11: SWOT analysis of Office Automation Equipment Companies 3-15Table 3-12: 1998 Knitwear Imports into Main Markets (Million US Dollars) 3-17Table 3-13: 1998 Other Garment Imports into Main Markets (Million US Dollars) 3-17Table 3-14: Clothing Markets - Value of Sales by Selected Countries (US$ Million) 3-18Table 3-15: Clothing and footwear: consumers' expenditures by country, 2000f and 2005f,
and shares of total expenditure. 3-20Table 3-16: Benchmarking of Average Thai Companies against Best Practice 3-21Table 3-17: Summary SWOT analysis of the Thai Garment Industry 3-22Table 3-18: 1998 Automotive Imports into Main Markets (Million US Dollars) 3-24Table 3-19: Benchmarking of Average Thai Companies against Best Practice 3-26Table 3-20. Summary SWOT analysis of the Thai Pressed Metal Auto Parts Industry 3-27Table 3-21: 1998 Plastic Products Imports into Main Markets (Million US Dollars) 3-29
Cost Structure of Major Thai Industries Final Report
BJ0346/Report/FinalLast printed 27/11/02 15:05
v
Table 3-22: Main Engineering Plastic Resins Manufacturers 3-29Table 3-23: Production and Consumption of Plastic Materials 1997 3-30Table 3-24: Benchmarking of Average Thai Plastic Moulding Companies against Best
Practice 3-31Table 3-25: Summary SWOT analysis of the Thai Plastic Products Industry 3-32Table 3-26: 1998 Rubber Imports into Main Markets (Million US Dollars) 3-34Table 3-27: Benchmarking of Average Thai Rubber Goods Companies (qualitative indicators
relative to best practice) 3-36Table 3-28: Summary SWOT analysis of the Thai Rubber Products Industry 3-37Table 3-29: 1998 Footwear Imports into Main Markets (Million US Dollars) 3-39Table 3-30: 1998 Furniture Imports into Main Markets (Million US Dollars) 3-40Table 3-31: Benchmarking of Average Footwear Companies against Best Practice 3-42Table 3-32: Summary SWOT analysis of the Thai Leather Footwear Industry 3-43Table 3-33: Summary SWOT analysis of the Thai Leather Upholstery Industry 3-45Table 4-1: Economic Competitiveness Ranking 1995-99 4-2Table 4-2: Export Value, Percentage Change and Market Destinations during Nine Months,
1999 4-3Table 4-3: Export of prepared food, during 1996-1998 and percentage change 4-4Table 4-4: Competitiveness Comparison for the Food Processing Industry 4-5Table 4-5: Competitiveness Comparisons for the Electronics Industry 4-6Table 4-6: Competitiveness Comparisons for the Garment Industry 4-7Table 4-7: Competitiveness Comparisons for the Automotive Industry 4-8Table 4-8: Competitiveness Comparisons for the Plastics Industry 4-9Table 4-9: Competitiveness Comparisons for the Rubber Industry 4-10Table 4-10: Competitiveness Comparisons for the Footwear Industry 4-11Table 4-11: Competitiveness Comparisons for the Furniture sector 4-12Table 4-12: Rough Benchmarking of Cost Structures - % of Output for latest year 4-13Table 4-13: Rough estimation of competitiveness gap with main competitors 4-14Table 5-1: Factors adversely affecting cost competitiveness 5-1Table 5-2: Average Reject Rates (%) 5-4Table 5-3: Average Capacity Utilisation 1998-1999 (%) 5-5
LIST OF FIGURESFigure 4-1: Competitiveness Gap 4-15Figure 5-1: Comparisons of Cost Structures of Industries studied 5-2

Cost Structure of Major Thai Industries Final Report
BJ0346/Report/FinalLast printed 27/11/02 15:05
vi
EXECUTIVE SUMMARY
BACKGROUND, OBJECTIVES AND SCOPE
This report is based on research carried out on seven industry sectors during August 1999 andmid 2000. It included a series of enterprise reviews (2 companies per sector) by specialistinternational industry consultants, a questionnaire survey of a wide sample of enterprises(449 with 126 useable responses, mainly face-to-face), and interviews with industryassociations and government representatives. The results were presented at a consultativeSeminar held in August 2000 primarily to representatives of Thai industry and suggestionsreceived have been taken into account in the final analysis.
The objective is to identify the key factors affecting cost structure and competitiveness, andpropose policy measures to improve competitiveness. Factors considered includemanagement, quality, technology, human resource, financial, market, supply chain and inputcost factors.
THE SELECTED SECTORS AND COMPANY CASE STUDIES
The industry sectors were selected from the 13 priority sectors of the National IndustryRestructuring Plan. Within each industry, two sub-sectors were selected for the detailedenterprise review and survey.

Cost Structure of Major Thai Industries Final Report
BJ0346/Report/FinalLast printed 27/11/02 15:05
vii
Table S.1. Selected Industries and Sectors using 1996 data
Industry and selected samplesector
No
of fi
rms
Em
ploy
men
tin
the
indu
stry
% sm
all
firm
s (<5
0em
ploy
ees)
Val
ue a
dded
(Bt m
illio
n)
Out
put a
s %of
Indu
stry
GD
P (%
)
% S
hare
of
expo
rts
Food Processing(Ready-to-Eat meals; DairyProducts1)
3,140 352,201 75.99 113,563 10.49 46
Electronic appliances(Computer Hard Drives andMicromotors; Automated OfficeEquipment)
316 592,019 26.90 76,001 7.36 7
Textiles and Garments(Knitwear; Garments (n.e.)
3,381 401,168 64.74 70,134 5.70 13
Automotive parts(Pressed Metal Parts (filters);Pressed Metal Parts (n.e.))
1,095 107,965 73.33 139,653 10.14 N/A
Plastic products(Household Goods; Specialty andEngineering plastic products)
1,272 113,596 61.95 27,039 2.03 0.7
Rubber products(Rubber Gloves; Non-passengerTyres)
540 79,374 51.11 36,043 3.04 10
Leather productsFootwear; Leather Furniture
832 89,531 68.99 15,752 1.05 2
Source : Report of the 1997 Industrial Census Whole Kingdom, National Statistical Office, Published in Mid-1999.Notes: Dairy products was incorporated and one in-depth study visit of a milk manufacturer was undertaken. No survey was undertaken offirms in this sector.
Some of the key reasons for selection of the sectors are:
• Processed food: Thailand’s most successful export industry.
Ready-to-eat meals: rapidly growing world segment of the foodindustry, with the possibility of providing higher value-added for theThai food sector.
Dairy products: there is excess supply of fresh milk, with at the sametime imports of dried milk. There are a limited number of dairyproducts firms.
• Electrical and electronic appliances: a major area of foreign investment, withpotential for diversification into other growing product sectors in informationtechnology and telecom equipment
Cost Structure of Major Thai Industries Final Report
BJ0346/Report/FinalLast printed 27/11/02 15:05
viii
Hard disk drives (HDD) and parts: the main export of electronic goods,and growing, but still with mainly imported materials and components.
Office automation equipment (fax machines, photocopiers etc):important exports, with several major foreign-owned companies
• Garments (knitwear; other garments): labour intensive, with large number of firmsand establishments, but declining exports due to decreasing labour cost advantage.Links with textile production and other sectors, but dependent on imported fibres.
• Pressed metal automotive components: autoparts is one of the biggest industries interms of value-added, with strong linkages. Filters and other pressed metal parts havea large after-market as well as OEM customers, with growth potential, and themanufacturing technology is simple.
• Plastic products (household goods; specialty and engineering products): largeindustry with growing demand, moving into higher value specialty and engineeringproducts which is a feeder industry to many other sectors including electricalappliances and automotive parts.
• Rubber goods: based on a major raw material resource; potential for moving intohigher value-added goods:
latex gloves: raw material advantages, growing world market, and newtechnologies
non-passenger tyres: large user of natural rubber (other rubber goodsuse mainly synthetic rubber). Brand names are also less important fornon-passenger tyres.
• Leather goods: major exporter, with potential for increasing supply of treated hides.Footwear is subject to promotion campaigns; leather upholstery and furniture canbenefit from Thai capabilities in wooden furniture
EXPORT PERFORMANCE, COMPETITORS AND COMPETITIVENESS GAP
As indicated by value of exports into the three main trading blocs – NAFTA, EU and Japan,Thailand’s main competitors in the seven selected industries are shown in table S.2.Thailand’s performance is very creditable: it is in the world’s top ten exporters in each ofthese sectors and most competitors are much larger and more industrialised nations.

Cost Structure of Major Thai Industries Final Report
BJ0346/Report/FinalLast printed 27/11/02 15:05
ix
Table S.2: Thailand’s main export competitors(Value of exports to NAFTA, EU and Japan, US$ million)
Food Electronics KnitwearExporter Exports to 3 Blocs Exporter Exports to 3 Blocs Exporter Exports to 3 Blocs
United States 6,112 United States 22,572 China 8,376Canada 4,319 Japan 12,275 Mexico 3,334Thailand 3,585 China 4,699 Hong Kong 3,256China 2,968 Mexico 4,013 Korean Republic 2,058Korean Republic 1,430 Canada 2,449 United States 1,929Indonesia 1,303 Taiwan 1,360 Bangladesh 1,860Chile 1,179 Korean Republic 1,247 Taiwan 1,525Argentina 1,043 Singapore 1,136 Thailand 1,335Taiwan 980 Hong Kong 857 India 1,100Brazil 819 Thailand 770 Indonesia 988India 817 Malaysia 719 Macau 898Mexico 711 Philippines 442 Philippines 893
Other garments Automotive Plastic productsExporter Exports to 3 Blocs Exporter Exports to 3 Blocs Exporter Exports to 3 Blocs
China 12,817 United States 196,285 United States 18,019Mexico 4,508 Japan 147,421 Canada 5,911Hong Kong 3,648 Canada 89,999 China 4,720Bangladesh 2,713 Mexico 74,376 Japan 2,649India 2,116 China 47,171 Taiwan 1,909Indonesia 2,096 Taiwan 41,374 Korean Republic 1,515United States 1,825 Korean Republic 38,149 Mexico 1,129Korean Republic 1,589 Singapore 30,627 Thailand 516Sri Lanka 1,285 Malaysia 30,189 Indonesia 333Philippines 1,254 Philippines 14,866 Malaysia 278Thailand 1,071 Thailand 12,855 Hong Kong 248Taiwan 826 Hong Kong 6,141 India 198
Rubber products Footwear FurnitureExporter Exports to 3 Blocs Exporter Exports to 3 Blocs Exporter Exports to 3 Blocs
United States 5,229 China 11,568 China 7,805Japan 2,912 Indonesia 1,367 Canada 4,904Canada 2,273 Brazil 1,174 United States 3,782Malaysia 1,353 Vietnam 1,063 Mexico 3,687Thailand 1,265 Thailand 646 Taiwan 2,086Indonesia 940 Korean Republic 458 Indonesia 1,169Korean Republic 939 India 441 Malaysia 836Taiwan 612 United States 255 Thailand 748Mexico 558 Taiwan 241 Philippines 438Brazil 362 Hong Kong 164 India 242China 186 Malaysia 91 Brazil 231Sri Lanka 166 Philippines 79 Vietnam 176Compiled by WS Atkins using the World Trade Atlas Database for USA, Canada, Mexico and Japan and Eurostat database for countries inthe EU. Year-end currency exchange rate was used for translation. Notes: It was estimated that the reported data probably includes somedouble counting of re-exported products. In particular we suspect that exports from countries without manufacturing, such as in the case ofthe automotive industry in Singapore, may include products shipped from other countries in the region through Singapore or Hong Kong.This must be taken into account when studying the tables of imports into NAFTA, EU and JAPAN.
The performance and challenges of each sector in turn are summarised in the followingsections.
FOOD PROCESSING – READY TO EAT MEALS
World market trends, success factors and future challenges
Ready meals are one of the fastest growing sectors of the processed food market, with rapid

Cost Structure of Major Thai Industries Final Report
BJ0346/Report/FinalLast printed 27/11/02 15:05
x
product and process developments in both product and packaging. There is little domesticmarket, so firms depend on the export markets and need to develop their direct marketingcapabilities and links to major distributors and supermarket chains. The main problem is lackof international brands.
Company benchmarking
Margins are low on average, but margins at the best firms are comparable to world norms.Product cost tends to be relatively high because of lack of specialisation, and weakprocurement and supply chain management.
Table S.3: Benchmarking of Thai food processing companies against best practice
Benchmark Thai Companies Best Practice
Quality Control/Quality expenditure 10% 4.9%Marketing/Sales Exp. (% of gross sales) 1-2% direct saleGross margin 13-22% 13.5 %Liquidity ratio 3.29 times 2.0 timesOperating cost/Total Cost 77-86% 60-80%Import tax for materials 12 –20% 5%(Vietnam)
SWOT analyses
Table S.4: SWOT analysis of Ready-to-Eat Meals
Strengths Weaknesses
• Companies are experienced exporters• Good management, engineers and skilled labour• Good quality products at competitive prices• Some firms with good gross margins• Capability to continuously upgrade itself
• Small domestic market;• Average poor margins• Lack of brand names: mainly subcontract supply
to international brand names or private labels• Many small companies with niche markets which
are disregarded by international distributors• Lack of appropriate manpower training• Slow to adopt new processing techniques
Opportunities Threats
• Rapidly growing world market• Development of larger companies capable of
competing internationally• Sales to food services such as restaurants and deli
counters• Use of versatile equipment to produce a wide
range of recipes without additional investment anddevelop economies of scale
• Acquisitions by international brands to gainmarket share in high-end products
• Price wars in branded ranges (rather than ownlabels)
• Increasing number of international standards,certifications and labelling requirements to be met
• NAFTA member countries (mainly Mexico) ascompetitors in the US
• Countries with ACP status enjoy 16-24% tariffadvantage

Cost Structure of Major Thai Industries Final Report
BJ0346/Report/FinalLast printed 27/11/02 15:05
xi
ELECTRONIC APPLIANCES
World market trends, success factors and future challenges
The market for electronic hardware is growing rapidly, but not as rapidly in the past, becausenew technology reduces hardware requirements. Thailand has many competitors at similarlevels of labour cost and development, but the range of products is enormous with room forspecialisation.
The computer industry is driven by cost reduction, and firms have to continuously andrapidly improve productivity and control their supply chain. The main challenges are toimprove productivity through investment, R&D, and human resources development; toimprove efficiency in materials usage and recycling; and to develop co-operative agreementsboth between local producers, and with international manufacturers.
Company benchmarking
Table S.5: Benchmarking of Thai electronic appliance companies against best practice
Benchmark Thai Companies Best Practice
Claims Received 6 Per Month 2 Per MonthClaims Resolved 100% 100%Recruits Staying 1 Year 70% 98%Product Cost / Sales 72% 60%Invoices Paid within 60 days 85% 98%Maintenance Headcount 1% 2%Stock Turn over (times) 10 24% Rejection Rate 4% 0.5%Indirect Hours 24% 12%Average Age Equipment 4 Years 2 YearsCustomer Contact Time 6% 32%Inspection/Direct Labour 30% 6%Labour Turnover 14% 2%
The main problems are high labour turnover leading to low skills and productivity, highrejects and claims, and low level of customer contact.

Cost Structure of Major Thai Industries Final Report
BJ0346/Report/FinalLast printed 27/11/02 15:05
xii
SWOT analyses
Table S.6: SWOT analysis of Hard Disk Drive Companies
Strengths Weaknesses
• Good worldwide market shares• Financial backing by international Parent
companies• Located close to customer• Cheap labour costs• Leading product technology from parent company• ISO systems implemented• Good internal technical training• Simple production and purchasing planning• No material shortages
• Lack of professional marketing• High labour turnover• Low margins• Long lead times for purchasing• High inspection costs (30% labour)• Poor management skills/training
Opportunities Threats
• More automation to de-skill/remove labour• Develop new markets and new applications
• Single source for specialised raw material• Computer prices falling further• Competitors setting up in China (cheaper)
Table S.7: SWOT analysis of Office Automation Equipment Companies
Strengths Weaknesses
• Cheap labour costs• Many customers world-wide• ISO certified and use of quality improvement
concepts• Possibility of 100% exporting of output• Excellent sales growth prospects
• Some dated products• Some very long lead time purchases• Low value added• Some business functions duplicated due to
strong control from overseas partners/headquarters
• Some single source suppliers• Lack of skilled engineers
Opportunities Threats
• Possible to increase Thai components purchase• Diversify into other electronic products
• Production moving to lower costs suppliers(e.g. China)
Cost Structure of Major Thai Industries Final Report
BJ0346/Report/FinalLast printed 27/11/02 15:05
xiii
GARMENTS
World market trends, success factors and future challenges
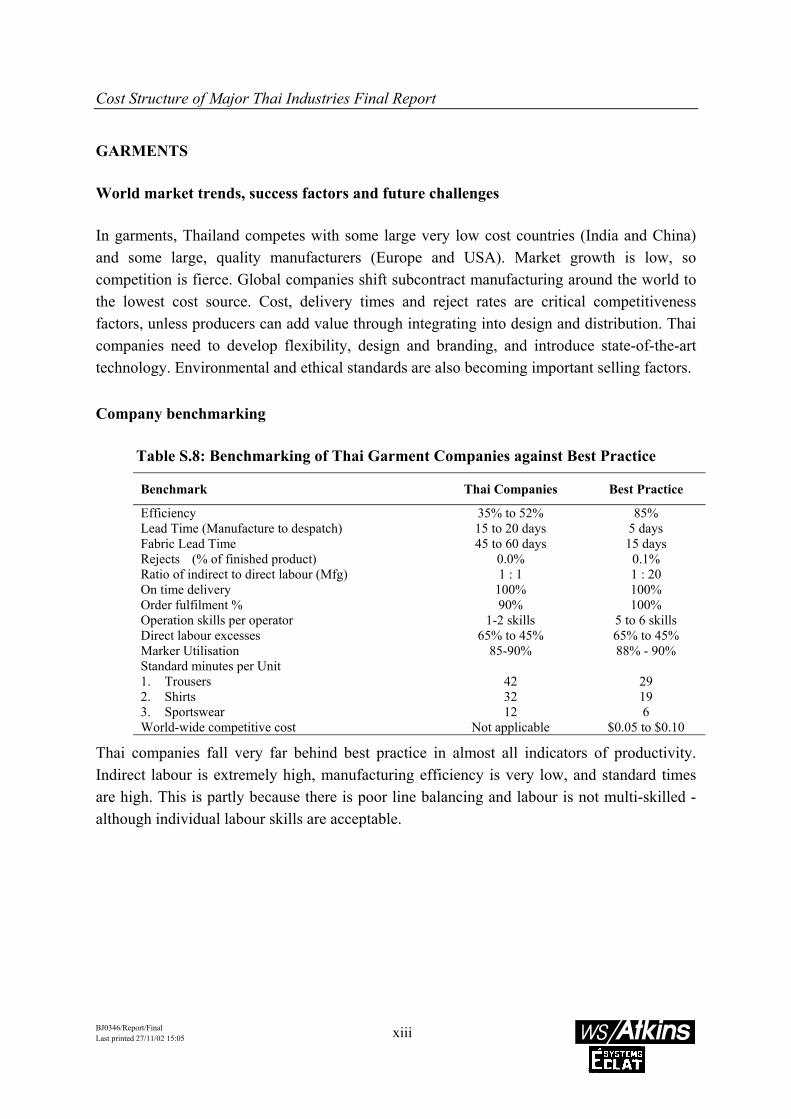
In garments, Thailand competes with some large very low cost countries (India and China)and some large, quality manufacturers (Europe and USA). Market growth is low, socompetition is fierce. Global companies shift subcontract manufacturing around the world tothe lowest cost source. Cost, delivery times and reject rates are critical competitivenessfactors, unless producers can add value through integrating into design and distribution. Thaicompanies need to develop flexibility, design and branding, and introduce state-of-the-arttechnology. Environmental and ethical standards are also becoming important selling factors.
Company benchmarking
Table S.8: Benchmarking of Thai Garment Companies against Best Practice
Benchmark Thai Companies Best Practice
Efficiency 35% to 52% 85%Lead Time (Manufacture to despatch) 15 to 20 days 5 daysFabric Lead Time 45 to 60 days 15 daysRejects (% of finished product) 0.0% 0.1%Ratio of indirect to direct labour (Mfg) 1 : 1 1 : 20On time delivery 100% 100%Order fulfilment % 90% 100%Operation skills per operator 1-2 skills 5 to 6 skillsDirect labour excesses 65% to 45% 65% to 45%Marker Utilisation 85-90% 88% - 90%Standard minutes per Unit1. Trousers 42 292. Shirts 32 193. Sportswear 12 6World-wide competitive cost Not applicable $0.05 to $0.10
Thai companies fall very far behind best practice in almost all indicators of productivity.Indirect labour is extremely high, manufacturing efficiency is very low, and standard timesare high. This is partly because there is poor line balancing and labour is not multi-skilled -although individual labour skills are acceptable.

Cost Structure of Major Thai Industries Final Report
BJ0346/Report/FinalLast printed 27/11/02 15:05
xiv
SWOT analyses
Table S.9: Summary SWOT analysis of the Thai Garment Industry
Strengths Weaknesses
• Suitable geographical location of Thailand inthe Asia Pacific region.
• Abundant supply of skilled labour.• Wages are not excessively high whilst skill
content is good.• High degree of vertical integration.• Good collaboration amongst companies and
between the private and public sectors.• Purchasers trust the quality and timely delivery
of Thai products.
• High number of SMEs, which are inefficient and noteffectively managed.
• Lack of information especially on the rivals’ cost andproducts and of export possibilities for SMEs.
• Lack of high skill in production and marketing• No multi-skilling• Lack of information and networking in sourcing
materials and products from overseas.• Poor R&D in the designing stage of production.• Use of outdated equipment and technologies.• High tariffs for raw materials and machinery lead to
prices marginally higher than those of competitors.• No strong world-wide brandnames.
Opportunities Threats
• Export of high-end products where the cost ofproduction is relatively higher elsewhere.
• Many quota categories are under-utilised dueto poor quality.
• Exploit the short-term benefits of currencydevaluation by looking at medium and long-term benefits of creating brandnames in theexport markets.
• Use of direct marketing channels to enhancethe earnings accrued to producers.
• Quota allocation under the MFA which sometimeslimits the ability to expand the export volume.
• The manufacturers’ lack of awareness of code ofconduct of major brands buyers.
• Additional product certification including EN ISO9000 and EN ISO 14000.
• Fast track tariff reduction (to 0% and 5% by the year2000) industry within ASEAN. Low-end garmentswill face stiffer competition from Indonesian andVietnamese factories.
AUTOMOTIVE PARTS – PRESSED METAL GOODS
World market trends, success factors and future challenges
Although world automotive markets are growing, the after-market demand for autoparts isaffected by increasing life and reliability. The components industry is restructuring toincrease efficiency, driven by improvements in supply chain management by the big automanufacturers. There is rapid consolidation, increasing technical alliances and joint ventures,relocation of subassembly and parts plants to be near vehicle assemblers for JIT delivery, andcreation of a network of super-suppliers who will dominate the auto components industry inthe next century.
The technology of filters is developing, driven by environmental concerns. Thaimanufacturers need to invest in R&D to keep products up to date and improve efficiency andcost.

Cost Structure of Major Thai Industries Final Report
BJ0346/Report/FinalLast printed 27/11/02 15:05
xv
Company benchmarking
Table S.10: Benchmarking of Average Thai Companies against Best PracticeBenchmark Thai Pressed Metal
Part CompaniesThai Filter Companies Best Practice
Stock turns (for OEM customer) 11:1 Not applicable 15:1Stock turns (for after-market) Not applicable 4:1 12:1Lead time (manufacture) 3 days 2-3 days <24 hrsTool Change time 7-10 minutes 20-30 minutes <10 minutesCustomer Rejects Approx. 1% <1% 0On time delivery Approx. 97% Approx. 70% 100%Absenteeism 6% 3% <1%Productivity (value added peremployee)
$12,181 $16,624 >$60,000
SWOT analyses
Table S.11:Summary SWOT analysis of the Thai Pressed Metal Auto Parts Industry
Strengths Weaknesses
• Modern equipment.• Good relationship with OEMs.• Good support from Joint Venture partners.• Some high margin products.• Strong presence in the after-market sector.• Local stockists can supply steel.• Brands being developed.
• A high percentage of raw materials have long leadtimes.
• Workforce not well educated or experienced.• Lack of shop-floor involvement.• Over-manning.• Limited production management expertise.• Some critical raw materials supplies from overseas.• High inventory levels.• Poor customer service.• Domestic market saturated.
Opportunities Threats
• Overseas OEMs.• Growing after-market.• Large export market.•
• Dependency on local OEMs.• New Japanese competition about to enter Thailand.• Development of car industries in developing
countries.• Pirate products.
PLASTIC PRODUCTS
World market trends, success factors and future challenges
The markets for plastic products are growing worldwide, as plastic products substitute formany other materials – particularly metals and timber – in many applications, includingconstruction and vehicle manufacture. This is accompanied by an increase in the use of high

Cost Structure of Major Thai Industries Final Report
BJ0346/Report/FinalLast printed 27/11/02 15:05
xvi
specification and high performance plastics, particularly engineering plastics.
Thai best practice injection moulding is probably somewhere around the 1970's "state of theart". It is likely that the average company is typical of even earlier stages. Technology needsto be updated, including increased moulding speeds, use of multi-cavity tooling, moreautomated product handling and finishing, robot moulding extraction. Modern machines arededicated, faster, more efficient and consistent, and include techniques such as moulding intwo materials. Firms need to be more specialised by product or by industry. Better blendingprocesses are also needed. Process control and quality control also needs improving.
There have been many joint ventures with foreign technological know-how as a means tosourcing these expensive technologies, but technological transfer is far from complete
Company benchmarking
In many firms, performance is comparable to best practice, but there is wide variation. Ingeneral reject and scrap rates are too high, and production runs too short to be competitive.Companies enjoy very low labour costs. However, raw material costs are around westernlevels and power charges are higher than western. The plastics industry world-wide aims at agross margin of at least 50%. Product costings in the industry reveal very low gross margins,sometimes barely acceptable. It appears that companies should overhaul their pricingestimation methods: some companies would have to charge up to 50% more to obtainpositive margins. Ultimately, the market dictates the sale price, so firms must cut costs ormove up-market.
Table S.12: Benchmarking of Thai Plastic Moulding Companies against Best Practice
Benchmark Thai Companies Best Practice
Number of employees 288-337 staff 250-300 staffCapacity utilisation 40-85% 60-85%Customer order to delivery 15-30 days Up to 30 daysDelivery time of raw materials 2-90 days Average 7 daysStocks of raw materials Up to 38 days Max 20% of raw materials needed for
60-90 daysStocks of finished goods 15-56 days Up to 30 daysTypical injection run length Too short (e.g. 2 days) Depends on tool set up time and
urgency in productionProduct defect 2.5%-3% 1%Scrap rate 0.5-5% Max. 1-2%

Cost Structure of Major Thai Industries Final Report
BJ0346/Report/FinalLast printed 27/11/02 15:05
xvii
SWOT analyses
Table S.13: Summary SWOT analysis of the Thai Plastic Products Industry
Strengths Weaknesses
• Spare capacity.• Quality certification for specific markets (e.g.
UL listing for exporting to the US).
• Lack of mould making technology in Thailand.• High production costs, resulting from small orders
and therefore higher set-up costs.• High raw material costs• High working capital, due to paying cash for
materials, but sales on 60 days credit terms.• wide variety of products, and lack of specialisation
leading to rather high losses.• Specialty and some other resins have to be imported.
Opportunities Threats
• The number of competitors is decreasing dueto harsh economic conditions. This is afavourable trend for the expansion of Thaicompanies’ customer base, both domesticallyand abroad.
• Increased substitution of plastic material forother substances.
• Downstream integration of pellet and resinmanufacturers into moulding.
• The cancellation of Local Content regulations in theyear 2000
• slowdowns in the automotive industry• high prices for domestic raw materials• high import duties for raw materials• price-cutting by competitors to get work.• technology development of materials and conversion
processes is based firmly in Northern and CentralEurope.
RUBBER GOODS
World market trends, success factors and future challenges
Tyres: The world tyre industry is worth $50 billion a year. 5 big groups dominate theindustry but they are increasingly being challenged from manufacturers from emergingcountries (South Korea, India and China). Tyre companies have been faced with cost-cuttingprogrammes in an over-supplied industry, while making better and safer tyres. Mergers andacquisitions have been increasing in recent years and further rationalisation of the brandedworld tyre industry is expected. For the Japanese manufacturers, the trend towards increasingexport volumes has forced them into alliances to avoid the costs of building additionalfactories and sales networks.
Because of the proliferation of vehicle models and manufacturers, tyre makers have beendeveloping new technology for more automated and more flexible tyre factories. Thaimanufacturers cannot compete in car tyres without alliances with the market leaders. Thecross-ply tyres produced in Thailand still have a market in the industrial and agricultural uses,

Cost Structure of Major Thai Industries Final Report
BJ0346/Report/FinalLast printed 27/11/02 15:05
xviii
but Thailand needs to move into radial-ply tyres, which requires much higher capitalinvestment and more advanced technology.
Latex gloves: Thailand has increased latex goods production capacity and is attractinginternational manufacturers to relocate production from USA and Europe, but exports to theUS and Europe are proving difficult. In the case of latex gloves, growing concerns overallergies to latex have led to a move towards powder-free medical gloves, dermashieldprocessing technology, as well as polyurethane gloves. The Thai producers need to developthese new technologies and move in to higher value products, as well as reducing coststhrough improved productivity.
Company benchmarking
Table S.14: Benchmarking of Average Thai Rubber Goods Companies(qualitative indicators relative to best practice)
Benchmark Glove Companies Tyre Companies Best Practice
Efficiency 0.85-0.90 Not available 1Equipment 0.85 0.60 1Human Resource 0.90 0.40 1Technological capability 0.85 0.60 1R&D capability 0.80 0.40 1Rejects 1 0.90 1Production management 1 0.30 1Quality system 1 0.65 1
The profit margin for latex products companies is around 10-15%, which is about theindustry norm. Companies have reasonable efficiency rates, slightly below best practice.However, production overhead expenses are considerably higher than would be expected.Tyre companies reported low profits margins (about 5%) which is well below those of bestpractice. Although most raw materials are acquired from local sources, long lead-times forboth local and imported materials still causes high working capital costs.

Cost Structure of Major Thai Industries Final Report
BJ0346/Report/FinalLast printed 27/11/02 15:05
xix
SWOT analyses
Table S.15: Summary SWOT analysis of the Thai Rubber Products Industry
Strengths Weaknesses
• Thailand has an excess supply of rubber, atlower cost than in Malaysia.
• Thai producers have foreign partners in theproduction of rubber tyres, condoms, andrubber gloves.
• Thai producers are experienced and willperform better with support from thegovernment
• Small-scale rubber plantations hinder quality control.• Shortage of good technicians.• Lack of good R&D and slow product development
amongst SMEs.• Underdeveloped infrastructure.• Shortage of synthetic rubber technology.• General lack of access to financial markets.• Lack of technical support for SMEs• Narrow range of rubber grades available to producers.
Opportunities Threats
• There are opportunities for those producerswilling to embrace environmental issues.
• Malaysia’s reduction of rubber planting areas.• A softer Baht should provide short-term
benefit to exporters.• The importing countries continue to grow• Room for further value-added by processing
rubber into rubber products.
• Price intervention in the rubber market causesirregular supply of latex, and increases latex prices.
• Tariffs on raw materials and chemicals do notencourage production of rubber products.
• Certain types of products require a foreign partner toprovide both technologies and brand names.
• Interventionist policies and political change makelong term planning difficult
LEATHER GOODS
World market trends, success factors and future challenges
World trade of footwear is around US$40 billion. The main footwear producing regions are:
Region Share of worldproduction
Asia 47%Europe 24%Americas 18%Other 11%
Producers in developed countries have virtually abandoned the low end of the market. Theycontinually consolidate and restructure their manufacturing facilities to produce higher-quality products for niche markets, so there are growing opportunities for low cost producers.
The main challenges for the footwear industry are to upgrade skills in production workers inorder to create new market opportunities; develop strategic alliances with footwear producersin other countries; and provide firms to access to up-to-date market intelligence.
Leather upholstery for both furniture and automobiles is a growing industry world wide.

Cost Structure of Major Thai Industries Final Report
BJ0346/Report/FinalLast printed 27/11/02 15:05
xx
Many changes are taking place in the furniture industry. The most important, is innovativeways of marketing to reduce the cost of floor space in shops. The furniture industry by-and-large is not a brand driven industry, so schemes such as co-operative advertising and showrooms are quite successful.
The main challenge is the application of industrial engineering techniques to manufacturing.These include the use of automated production lines, production cells, inventory control,tracking labour productivity, and optimising material usage.
Leather supply also needs to be improved. Poor quality local hides show putrefaction,parasite attack, bad preservation, poor flay and damage from hand fleshing. Many hides forupholstery are imported, as local hides are too small.
Company benchmarking
Table S.16: Benchmarking of Footwear Companies against Best Practice
Benchmark Thai FootwearCompanies
Best Practice
Supplier lead Times (scores) NA 3.2Lead time – Order processing (days) 14-21 4.4Lead time – manufacturing (days) NA 8.8Despatch time (days) 30 (by sea) 3.8Despatch cost (%) NA 0.9On-time deliveries (%) NA 91.8Production per hour (sq. ft/ hour/man) 160 110Plant utilisation (%) 95% 80%Value added per direct employee Baht 300 Baht 4 millionSale returns (%) 0.5-0.6 1.5Rate of stock turnover 2.4 8Raw material costs (%) 65% 62Direct labour costs (%) 7% 6.5Lead time for new product development (days) 2-3 Weeks Not measureWastage level of leather 45% 10%
Leather companies have relatively high standard costs per unit. Margins per unit are around4-11% against international averages of 10%. Mainly because leather wastage can be as highas 45% in some areas of the shoe manufacturing sector. Marketing activity and intelligence isalso low.

Cost Structure of Major Thai Industries Final Report
BJ0346/Report/FinalLast printed 27/11/02 15:05
xxi
SWOT Analysis
Table S.17: Summary SWOT analysis of the Thai Leather Footwear Industry
Strengths Weaknesses
• Modern equipment.• Good relationship with international
brands.• Good support from suppliers• Some high margin products.• Brands being developed.
• High inventory levels: A high percentage ofraw materials have long lead times.
• Some critical raw materials supplied fromoverseas.
• Mostly low margin products• Very poor material usage
Opportunities Threats
• Large export market.• Use of locally treated leather
• Dependency on international orders• Dependency on cheap labour• Development of footwear manufacturing in
other developing countries.• Pirate products.
Table S.18: Summary SWOT analysis of the Thai Leather Upholstery Industry
Strengths Weaknesses
• Use of established furniture marketingchannels
• Poor quality of local raw hides• Old equipment• High cost of imported hides• No original design• Low volumes• Industry dominated by families in the
tannery business• Dependency on foreign know how and
technology
Opportunities Threats
• Highly skilled labour force in furnituredesign and production – could betransferred to upholstery design
• Large export market.• Use of locally treated leather, if quality is
improved• Some high margin products.
• Further cost reductions in leatherupholstery manufactured, particularly inEastern Europe
• Increasing establishment of largercompeting manufacturers that have linkswith large retailers in target markets
In Footwear, the managerial skills of Thai businessmen and the manual and manufacturingskills of labour force are world class. The level of quality available in the finished article ishigh. Where there has been partnership between manufacturer and customer, best practicesand current technology has been acquired. There are high standards of production control.These products are marketed by the brand owner for premium prices, but manufacturing isglobally a high-volume, low-margin
Companies have spare manufacturing capacity. Using this potential is prevented by poor

Cost Structure of Major Thai Industries Final Report
BJ0346/Report/FinalLast printed 27/11/02 15:05
xxii
commercial expertise, including lack of know-how, market intelligence, and vision, with arelaxed attitude to the overheads burden of unused factory space and a failure to demand areturn on investment. Volumes can be increased by marginal costing goods and even loss-leaders.
In Upholstery Manufacturing, although the export market shows high potential, lack oforiginal design and international marketing skills hamper the prospects of Thai upholsterycompanies. Designers concentrate on copying European styles rather than developing ownmodels. This results in companies not being able to take advantage on this trend in exports,because not all have skills in international business.
CONCLUSIONS ON COST STRUCTURE AND COMPETITIVENESS
Compared to world best practice, most Thai firms have low margins because of:
• Low levels of skilled labour. This keeps them in labour intensive and old technology, andleads to high reject rates and poor quality
• Products in low quality ranges, with low value of output
• High materials cost because of high reject rates and poor material yields
• Some good technology but generally technology of the 1970s and 1980s.
These translate into increased production costs for industries in relation to those of their maincompetitors, shown in Table S19. The table above shows the comparison of Thailand withspecific countries. In particular, it shows that:
• the share of materials and utilities costs are higher than for competing industries in allindustries shown except for leather products (excluding footwear)
• the share of labour costs is quite similar to competing industries, except for leatherproducts.
As Thailand has the lowest operating surplus as percentage of total output, for the industriesstudied excluding leather products (without footwear), the industries are facing strongchallenges even before taking into account differences in marketing and administrationcharges and practices– and in taxation and financial charges.

Cost Structure of Major Thai Industries Final Report
BJ0346/Report/FinalLast printed 27/11/02 15:05
xxiii
Table S.19: Rough Benchmarking of Cost Structures - % of Output for latest yearavailable
Industry/Country Materials andUtilities (%)
Labour (%) OperatingSurplus (%)
Food ProcessingThailand 73.0 5.8 21.3Korea 60.7 8.5 30.9The Philippines 64.3 5.7 30.0GarmentsThailand 71.4 19.2 9.3Korea 50.9 17.3 31.9Mexico 46.0 25.5 28.4Indonesia 60.8 12.3 26.8India 71.2 5.7 23.1Plastic ProductsThailand 68.0 9.8 22.2Korea 57.6 9.0 33.5Malaysia 64.1 11.9 23.9Rubber ProductsThailand 78.9 4.6 16.5Korea 52.3 13.3 34.3Malaysia 71.4 8.3 20.3Indonesia 79.5 4.5 16.0Leather FootwearThailand 55.6 19.2 25.2Korea 53.3 19.4 27.3Leather productsThailand 55.3 15.7 29.0Indonesia 64.0 7.8 28.1Korea 66.6 10.1 23.3India 88.1 4.4 7.5
Source: Several Industrial Statistical SourcesNote: Lack of recent data for many competing countries resulted in the use of mostly 1996 for consistencyreasons. Data for Auto Components and Electric appliances was too incomplete.
The estimated cost structures of the industries studied are shown in Table S20, as apercentage of reported revenue. The data are drawn from case study companies visited andfrom survey data, but after rejected any survey data which was not considered reliable.

Cost Structure of Major Thai Industries Final Report
BJ0346/Report/FinalLast printed 27/11/02 15:05
xxiv
Table S.20: Estimated 1998 Cost Structure of Thai Industries (% of Revenue)Industry/ Cost
ItemMaterial Direct
labourEnergy Indirect
Labour+ OH
Selling Admin. Financialcharges
Profit afterinterest
Plastics –engineering
75.50 6.05 3.52 2.04 1.53 5.13 8.66 -2.43
Rubber – NPCtyres
67.04 4.12 12.1 5.00 2.51 6.1 19.1 -15.97
Garments –Knit 63.75 9.11 0.67 3.18 7.53 1.23 0.6 13.93Garments – woven 59.75 15.03 4.56 0.98 3.66 9.02 0.01 6.99Auto - Pressed 58.53 5.98 3.09 7.86 8.49 5.83 9.57 0.65Plastics –household
57.60 9.40 5.43 4.86 13.79 8.78 9.57 -9.43
Auto – filters 56.64 10.94 1.31 15.17 6.17 4.69 2.73 2.35Leather –furniture
47.70 8.72 2.23 5.64 9.36 4.77 6.05 15.53
Electronics – OA 46.97 1.61 0.4 41.55 0.83 0.57 0.41 7.66Leather –footwear
46.45 3.15 0.22 1.64 1.73 1.6 3.78 41.43
Electornics – HD 45.81 4.86 2.17 12 0 10.51 4.03 20.62Food –RTEM 38.87 27.13 0.18 11.38 4.12 6.07 0 12.25Rubber – Gloves 31.45 12.15 18.02 4.97 2.82 9.98 1.09 19.52Source: Information provided by case studies and companies surveyed by WS Atkins.
Past industry policies favoured investment in labour intensive, low capital and ageingtechnologies because of Thailand’s low labour cost and technology heritage. Labour costs arerising rapidly but technology and management systems are not advancing because ofdependence on foreign technology sources and lack of R&D and qualified scientists andengineers. Consequently labour costs per unit of output are already as high as Taiwan andKorea and sometimes as high as Japan – and much higher than China, India and some otherASEAN nations. If labour costs increase without continuous improvement in productivity andquality, Thailand will become increasingly uncompetitive.
INDUSTRIAL POLICY, IMPACT AND RECOMMENDATIONS
The AFTA agreement is opening up the ASEAN market to free internal trade, but there isstill protection from non-ASEAN imports. Thailand has moved from an import substitutionpolicy in the 1980s to an export promotion policy during the 1990s. There are still elementsof domestic protection, however, which create additional costs for exporters, through dutieson imported materials and higher prices of inputs from protected domestic suppliers.
BOI incentives for new investors (mainly corporate tax holidays and import duty exemptions,along with other benefits and protection) have in the past favoured industries dependent on

Cost Structure of Major Thai Industries Final Report
BJ0346/Report/FinalLast printed 27/11/02 15:05
xxv
imported materials and components and fostered industrial development unsustainable in thelong term. Regulations on local content requirements ameliorated to some extent thedependency on imported raw materials.
The basis for industrial restructuring is the Industrial Restructuring Plan, approved in April2000, with programmes for productivity, technology, labour skill enhancement, SMEs,product development, job distribution, foreign investment, and pollution reduction. Itidentifies 13 priority sectors (seven of which are in this study). BOI incentives are beingadapted to these new sectoral and geographical priorities. The SME programmes are ofspecial relevance to the selected sectors. It seems, however, that programmes for relocation,upgrading and skills development have had a slow uptake due to the cost and availability offinancing especially for SMEs, the poor financial situation of firms, and the complexity of thesupport programmes.
Companies were concerned about the impact of the withdrawal of their existing BOIprivileges (at the end of the incentive period, or because of changed priorities) on:
cost of imported materials (especially for electronic appliances, leathergoods, and plastic products)
cost of imported equipment (especially for garments, electronics andplastic products), and
corporation tax (all except electronics and plastic products).
This is a symptom of the development of inappropriate investment, too heavily reliant onimports, without adequate improvement in their own performance during the start up yearsand without adequate development of feeder industries. Wholly Thai-owned companies wereless concerned about cost of imports and more about corporation tax. Firms were alsoconcerned about potential loss of revenue and export markets as a result of loss of tradeprivileges (e.g. the GSP preference into USA).
Policies to improve competitiveness and to improve the effectiveness of the IRP include:
(i) development of feeder industries
(ii) provision of business services, including industrial engineering services
(iii) cheaper government loans and better access to financing.

Cost Structure of Major Thai Industries Final Report
BJ0346/Report/FinalLast printed 27/11/02 15:05
xxvi
The real problems of industry, however, are low productivity of labour and high wastage ofmaterials and energy because of poor quality control, with consequent low margins. Theobjectives of policy should be:
• to improve performance at the enterprise level:
(i) Increase the proportion of skilled labour (from 20%) including technical training andEnglish proficiency (create and/or support technical training institutes; fund industrytraining);
(ii) Increase number of scientists and engineers (e.g. encouraging technical universities);
(iii) Support R&D for productivity improvement, product design and patentable works(e.g. research funding; creation of research centres, testing centres);
(iv) Support upstream (feeder) industries which are potential source of raw materials oressential industrial inputs (e.g. leather, textiles, toolmaking);
(v) Support schemes for technology transfer or upgrading of equipment;
(vi) Promote the creation of industrial clusters when beneficial;
(vii) Structure electricity and telecom tariffs to reflect more competitive pricing forindustry.
• at the level of industry policy:
(i) Develop Merger and Acquisition Laws, Anti-monopoly laws, etc. to allowrationalisation and economies of scale;
(ii) Draft industrial policies that foster competition and tackle the entire supply chainwithin one sector;
(iii) Support intellectual property rights, to promote research and product development;
(iv) Create industry research, testing and information centres;
(v) Guarantee that small financing requirements can be met by the stock exchange (e.g.by developing a junior stock exchange);
(vi) Set realistic cost allowances for capital to truly reflect depreciation rates (e.g. higherdepreciation rates in electronics industry);
(vii) Simplify support schemes and reduce bureaucracy.

Cost Structure of Major Thai Industries Final Report
BJ0346/Report/FinalLast printed 27/11/02 15:05
xxvii
• at the macro-economy level:
(i) Up-grade the public sector’s capabilities to assist industry;
(ii) Develop basic infrastructure for IT and water services;
(iii) Fiscal reform: companies’ capital base and financing – devise a system thatcompensates firms for high registered capital and high retained earnings;
(iv) Taxation: simplify and speed up VAT returns; reduce/harmonise import tariffs;implement audit trails at customs to minimise the effects of transfer pricing.

Cost Structure of Major Thai Industries Final Report
BJ0346/Report/FinalLast printed 27/11/02 15:05
1-1
1. INTRODUCTION
BACKGROUND TO THE STUDY
1.1 In August 1999, the National Economic and Social Development Board (NESDB)appointed WS Atkins to identify key factors influencing the cost structure of sevenmajor Thai industries and to advise on government measures and initiatives toimprove the performance of Thai industry.
1.2 Based on the 1st meeting with the Steering Committee, a series of industrial sectorswere agreed to be the focus of this study. Sector working reports covering theselected industrial sectors were produced. The purpose of these reports was to presentthe initial findings of a short diagnostic review of two case studies of companies persector. The case study interviews investigated the real causes of cost differences,including management, cultural and organisational factors, and investigated to whatextent these factors are outside the control of management. This aimed to shed lighton the real drivers behind the cost factors, and on their impact on the operations ofcompanies.
1.3 The interim report on cost survey results summarised the findings of a cost structurequestionnaire survey of enterprises in the industries using postal and face-to-faceinterviews. The purpose of this report was to provide quantitative evidence on coststructures to supplement the analysis presented in the sector working reports. As faras there was comparative information available, the cost structure data compiled inthe interim report was benchmarked against main competitors.
1.4 This final report summarises the findings of the whole project. It contributes to thestudy aim, by presenting specific policy options to improve the cost structure of Thaiindustries, assessing their relative importance and likely impact on industrialcompetitiveness. A consultative seminar was held on the results of the study at theHilton Hotel in Bangkok on the 23rd of August 2000. It was primarily aimed atrepresentatives of Thai industry and reported on the overall findings of the study. Thepolicy options considered by the Consultants were presented, and the participantswere invited to give their views on the policy options, their viability and theirperceived benefits and the impact on particular interest groups. The results of theconsultative seminar are included in Appendix 5 to this report.

Cost Structure of Major Thai Industries Final Report
BJ0346/Report/FinalLast printed 27/11/02 15:05
1-2
1.5 The full scope and objectives of the project are set out in the Terms of Referenceattached to the contract documents. The Offer of Consultancy Services was submittedin March 1999. Signature of the contract between WS Atkins, The World Bank andNESDB was completed in August 1999.
METHODOLOGY
1.6 A staged and structured approach was adopted in this project to examine the realimpact of cost and non-cost factors on industrial performance and competitiveness.Three complementary sets of empirical analyses were performed:
• first at sector/ industry level (quantitative data);
• secondly, at enterprise/sector level (both qualitative and quantitative databased on case studies and interviews);
• thirdly at enterprise/plant level (quantitative data using a questionnairesurvey).
1.7 This multi-level approach enabled us to compare the insights gained from theseanalyses.
1.8 At the sector level, the study procedure incorporated extensive consultation with bothgovernment and non-government agencies concerned with industrial policy and theissue of competitiveness, as well as review of the extensive previous studies andreports, and the expert knowledge of the Thai Team Leader.
1.9 At the enterprise level, two complementary approaches were also adopted:
• an expert and wide-ranging review of selected case-study companies by WSAtkins’ standard company review procedure, using a team of consultantsincluding an experienced foreign industry expert with knowledge of similarindustries in other countries, and a local Thai industry economist, and
• a wider questionnaire survey of enterprises in the industry using postal andface-to-face interviews focusing on narrower cost structure issues.

Cost Structure of Major Thai Industries Final Report
BJ0346/Report/FinalLast printed 27/11/02 15:05
1-3
OBJECTIVES AND SCOPE
1.10 The study aims to contribute to the industrial restructuring programme by establishinga reference point on the cost structure of major industries to which policy makers canrefer during the development of industrial policies.
1.11 The focus of this project is therefore on identifying key factors influencing the coststructure of Thai industry. This leads to the formulation of specific measures andinitiatives to improve the cost structure of Thai industry, and therefore overallcompetitiveness.
THE ISSUE: COMPETITIVENESS AND ITS RELATIONSHIP WITH COSTSTRUCTURE
1.12 According to NESDB’s terms of reference for this project, “Thailand has entered anew phase of development, where continuing competitiveness requires increasedproductivity of all factors of production. This includes increased skill intensity at alllevels, improved efficiency of investment, more efficient resource utilisation, andtransition to more efficient and effective production processes and structures in bothtraditional and emerging industries. In this context, it appears essential, over themedium term, to improve the operating efficiency of Thai industry, as a key input tocompetitive performance.
1.13 A key dimension of operating efficiency relates to the cost structure of industry. Inthis context, both cost and non-cost factors influence a firm’s operations andcompetitive performance. Although the boundary between the cost and non-costfactors is increasingly imprecise as these factors become increasingly inter-related,non-cost factors generally refer to factors such as quality of the firm’s products,related services, response time, etc. In practice, these factors are directly related tocost structure, and should be assessed from that perspective.
1.14 Cost-related factors involve macro-economic factors, industry factors and firm-levelfactors. At the macro level, costs are influenced by the general institutional,regulatory and legal framework, for example, the tax system, role of rules andregulations and their enforcement, as well as by economy-wide factors such as thegeneral state of infrastructure. At the industry level factors relating to the industry-specific institutional and regulatory environment play a role (e.g. industry-specific

Cost Structure of Major Thai Industries Final Report
BJ0346/Report/FinalLast printed 27/11/02 15:05
1-4
programmes and constraints, competition policies, as well as the level of industryspecific inputs and services such as the level of industry-specific infrastructureservices).
1.15 Ultimately, the cost structure of industry means the cost structure of firms and itsimpact on their competitive performance. This relates to all phases of moving aproduct from its raw material source through every intermediate processing stage to aconsumer: the concept of “operations management”. Addressing inefficiencies in theset up of materials, acquisition, production and distribution to the end markets canhave a significant impact on the competitive performance of firms, industries and theeconomy as a whole.”
THE CONTEXT: BACKGROUND TO THE SELECTED INDUSTRIES
1.16 Seven out of the 13 priority sectors of the National Industry Restructuring Plan wereselected for inclusion in this study. It was required that the industries selectedreflected firstly, those industries which contribute to economic growth (output/contribution to GDP growth/exports); secondly, those industries which aim at theproduction of higher value-added products; thirdly, those industries that reflect thereal side of the economy (income distribution/employment/resource usage/privateconsumption), and fourthly, those industries which have a high percentage of SMEs tofoster entrepreneurship. Table 1.1 lists the selected industries and some quantitativeselection criteria. The sectors selected are presented in Table 1.2. The main reasonswhy these industries and sectors were the focus of the study are summarised below.
Table 1-1. Some Quantitative Selection Criteria (in million Baht - 1996)
Industry Output1 Share ofindustryVA (%)
Value added1 Approx. Share ofExports (%)
Food Processing 482,335 10.49 113,563 46Electronic appliances 338,305 7.36 76,001 7Textiles and Garments 262,175 5.70 70,134 13Automotive parts 466,264 10.14 139,653 N/APlastic products 93,189 2.03 27,039 0.7Rubber products 139,758 3.04 36,043 10Leather products 48,309 1.05 15,752 2

Cost Structure of Major Thai Industries Final Report
BJ0346/Report/FinalLast printed 27/11/02 15:05
1-5
Industry No. offirms
Share ofSMEs2
(%)
Share ofSmall
Firms3 (%)
Employment Labour costas % of total
cost
Food Processing 3,140 99.33 75.99 352,201 1.87Electronic appliances 316 68.67 26.90 592,019 8.55Textiles and Garments 3,381 95.24 64.74 401,168 16.25Automotive parts 1,095 95.34 73.33 107,965 3.97Plastic products 1,272 97.41 61.95 113,596 14.85Rubber products 540 93.33 51.11 79,374 5.84Leather products 832 94.95 68.99 89,531 8.06Source : Report of the 1997 Industrial Census Whole Kingdom, National Statistical Office1Figures were compared to GDP originating from industries obtained by NESDB2SMEs are firms with employees less than 500 persons3Small firms are firms with employees less than 50 persons
Table 1-2. Selected Industries and SectorsIndustry sector 1 Sector 2Food Processing Ready-to-Eat meals Dairy Products1
Electronic appliances Computer Hard Drives and Micromotors Automated OfficeEquipment
Textiles and Garments Apparel (Knitwear) Garments (n.e.)Automotive parts Pressed Metal Parts (filters) Pressed Metal Parts (n.e.)Plastic products Household Goods Specialty and Engineering
plasticsRubber products Rubber Gloves Non-passenger TyresLeather products Footwear Leather Furniture
Notes:(1) Dairy products was incorporated and one in-depth study visit of a milk manufacturer was undertaken. No survey was
undertaken of firms in this sector.
Food Processing
1.17 The food processing industry creates value added due to the abundance of rawmaterials and the ability of manufacturers to improve food processing technology. Itis one of the country’s top export earners and employment creators. There are over3,000 firms in this sector and it has the highest percentage of small companies.
1.18 The industry has inherent comparative advantage, but manufacturers need to improvetheir yields and continuously up-date their strategy to maintain their leading positionin the world market. Their competitiveness is constantly being eroded by theincreasing cost of wages, by new competitors and by policies of importers - e.g.proliferation of free trade areas with external tariff barriers, changing administrativepractices amongst importing countries, a plethora of technical trade barriers, etc.

Cost Structure of Major Thai Industries Final Report
BJ0346/Report/FinalLast printed 27/11/02 15:05
1-6
Ready-to-Eat Meals
1.19 The main food processing sub-sectors (including processed chicken, canned tuna,frozen vegetable, frozen shrimps), which are major Thai industries, have been widelystudied. It was agreed to study studying ready-to-eat-meals, which is dependent uponthese primary food sectors. In addition, many former producers of theseprocessed/frozen foods have now moved into ready-to-eat meals, in line with generalworldwide consumer preferences. There is the possibility of producing higher-valueadded products and profit from the high growth rate in the demand of these products.
Dairy Products
1.20 The dairy products sector was included as a case study only, despite the fact that itstill requires further development. There are only a total of 58 medium and large firmsoperating in this sector which makes the survey sample too small to be suitable forstatistical inference - not a good basis for analysis using the survey and case studymethodologies proposed in this study.
1.21 Presently there is excess supply of fresh milk in the domestic market but the absenceof good co-operatives in several areas prevents the full use of surplus milk. At thesame time, there are imports of spray-dried milk into the country. The production ofdairy products ranging from spray dried milk powder, yogurt, butter, and cheese couldimprove the utilization of surplus milk, if production was cost effective andexportable. Whether or not this is the case could be studied in the future.
Electronic Appliances
1.22 The electronic appliances industry has switched from import-substituting to export-oriented products. It employs the highest number of people and produces net exportvalue (i.e. the export value of products is in excess of the import value of intermediateparts).
1.23 Thai companies tend to focus on assembly and production of basic metal and plasticparts, using medium technologies in their production. State of the art parts areproduced by parent companies and hence, the assembly of most intermediate partsbegins with semi knock down kit (SKD) parts.
Computer Hard Disk Drives and parts

Cost Structure of Major Thai Industries Final Report
BJ0346/Report/FinalLast printed 27/11/02 15:05
1-7
1.24 Previously, integrated circuits (IC) were the major exports but have been overtaken byhard disk drive (HDD) exports. Currently, parts of hard disk are the main exportsoriginating from direct foreign investment and Thailand ranks second to Singapore inproducing hard disk drives. There are approximately 500 suppliers of hard disk drivesand components, and about 100 of related products. American and Japanesecompanies operate in this segment of the industry.
1.25 About 70 percent of a hard disk drive’s total cost can be attributed to imported partswith the motor and the printed circuit board (PCB) assembly being the majorimported parts. Even for local produced PCBs, major parts are imported: Copper CladLaminate (CCL) and Impregnated fibreglass represent some 40-50 percent of the totalcost of production of the PCB. Germany and Japan supply epoxy and fibre glass.Chemical suppliers (the US, Singapore and Japan) supply phenolic resin, epoxy resin,polyamide and polyphenylene. Micromotors are an interesting product for futureproduction in Thailand as they are the most important imported components.
Office Automation Equipment (faxes, photocopiers, etc)
1.26 Production of office appliances is intended for both domestic and overseas markets.Equipment such as fax machines and copying machines will soon be importantexports. Photocopiers are made in Thailand by companies such Hitachi and Cannonand destined for the markets in Japan and the US. Sharp Appliances (Thailand), Cal-Com Electronics (Thailand), and Hitachi produce facsimile machines. Thesemachines are also exported to the US and Japan.
1.27 Thai firms have expertise in both computer peripherals and office automationequipment, which puts them in a unique position to take advantage of new businesstechnology, which is incorporating the principles of e-commerce.
Textile and Garments
1.28 The textile and garment industry comprises upstream production (e.g. synthetic fibreproduction, which requires high capital and technology-intensive processes),midstream production (spinning, weaving, dying and finishing processes, which alsorequire capital-intensive techniques, but lower technology) and downstreamproduction (garment production, which is labour-intensive).
1.29 The textile and garment industry has strong links with many other related industries,such as those manufacturing zippers, buttons and elastic. It creates employment and

Cost Structure of Major Thai Industries Final Report
BJ0346/Report/FinalLast printed 27/11/02 15:05
1-8
produces substantial foreign exchange earnings. Thailand exported textiles andgarments worth US$4.6 billion from January to November 1999. Following therecession after 1997, there have been significant factory closures, which make itdifficult to estimate current employment in the sector, although it is estimate thataround 40-50,000 jobs were lost during the recession. Before the slump, the garmentindustry had 1.2 million workers and the textile industry had 500,000.
Garment
1.30 The garment industry is labour intensive and has the highest number of firms. About880,000 persons are employed in 3,000 factories manufacturing garment andgarments. Garment export has been declining since 1995 due to higher wages (low-end garments cannot compete with products from China, Vietnam and Indonesia) andto the recent economic recession. The Thai garment industry has forecast exports ofUS$4.8 billion in 2000. The United States and the European Union are the largestmarkets for Thai garments. Around 50% of Thai exports go to the US, while exportsto the EU account for around 23% of Thai exports.
1.31 There are export opportunities in the garment sub-sector, including knitwear andgarments made of woven fabrics, as cost advantage is not eroding as quickly as inother sectors. Synthetic fibres and blended yarns are the predominant fabrics with silk,wool, other fibres used in some cases. These are mostly imported and tend not to beregularly available from stockholders in the country, only through purchasers’ orders.Other materials such as zippers, buttons and fabrics are either imported or locallysourced.
Automotive Components
1.32 The automotive components and assembly sub-sectors, within the automobileindustry, are combined in the national statistics. It is one of the top value-addingindustries. The parts industry is catering for two segments: Original EquipmentManufacturer (OEM) and Replacement Equipment Manufacturer (REM). The sectorhas a sufficient capacity to supply the large market, and a good range of products. TheThai production of auto components supplies roughly 44 percent of the ASEANmarket for these parts.
1.33 The sector has potential for growth and is supported by existing capacity in feederindustries such as casting, metal pressing, and mould injection. Technologicalprogress in the auto components sector feeds through to these feeder sectors. Thus the
Cost Structure of Major Thai Industries Final Report
BJ0346/Report/FinalLast printed 27/11/02 15:05
1-9
overall value added of Thai industry can be increased in future if technologicalprogress in the auto components sector is nurtured.
Pressed Metal Parts
1.34 The study focused on pressed metal products. This is an important sector, with fairlysimilar cost factors. Within this sector, the manufacture of filters is fast growingindustry in Thailand. Thai manufacturers of automotive filters today produce some500 types of oil, fuel, hydraulic oil and air filters, for automobiles, trucks, buses,tractors, marine engines, and air compressors. There is market potential for theseproducts, which has a large replacement market where cost is more important thanbrand name. Environmental regulation on automotive emissions is driving filtercompanies to innovate and produce higher-value added products, so Thaimanufacturers need to invest well in R&D and product development.
Plastic products
1.35 The plastic products industry generally strengthens as per capita income grows. It islabour intensive whilst needing considerable capital investment, and it has furtherexport possibilities as the large companies within the sector are competitive.
Household plastic goods
1.36 Whilst small and medium sized firms in the household goods sector produce a largevariety of products for domestic use, many large companies produce for exportsbringing in valuable exchange into the economy. A substantial percentage of thesecompanies are now involved in precision moulding and sophisticated extrusionprocesses.
1.37 Household goods from plastics have good prospects in the medium term. There isfurther room for exports as demand grows in other newly industrialising countries.
Specialty and engineering plastic products
1.38 An important growth segment of the plastic products industry is specialty plastics andengineering plastics. Future appliances will use more of these plastics. Sectors thatdemand more specialty plastic products include the electrical appliances andelectronics industry, the food processing industry, the automotive parts industry, andcable and wire producers.
Cost Structure of Major Thai Industries Final Report
BJ0346/Report/FinalLast printed 27/11/02 15:05
1-10
Rubber products
1.39 Thailand is the world’s largest producer of rubber. The rubber products industry isamongst the top ten Thai foreign exchange earners and has a good potential in thefuture in terms of higher value added, number of firms and employment. Importantrubber products include rubber tyres, latex gloves, condoms, and rubber bands. Inpercentage of total production, Thailand exports 33 percent of tyres, 35 percent ofrubber gloves, 7 percent of rubber bands and 25 percent of other rubber products.
Latex Gloves
1.40 Latex glove is now the number one rubber product exported from Thailand and itsfuture potential remains high. Latex gloves, which include examination, surgical andhousehold gloves, are manufactured from concentrated natural rubber latex (CNRL).Since the initial development of the latex industry in Thailand just over ten years ago,the industry has made considerable progress. The quality of concentrated latexproduced in Thailand is acceptable, and as a result Thailand has started exportingconcentrated latex.
1.41 CNRL contains approximately 40% water, so it becomes increasingly less costeffective for manufacturers outside Thailand to import CNRL from Thailand tomanufacture products in their own countries. Therefore, there is an advantage ofmanufacturing latex gloves in rubber producing countries like Thailand, Malaysia andIndonesia. In addition, Malaysian manufacturers are at a cost disadvantage, as theyface a shortage of labour and have to import latex from Thailand.
1.42 The glove manufacturing sector, which has overcome the initial manufacturingproblems 10 years ago, now possesses the necessary technology to manufacture goodquality products. However, the industry still needs R&D to further develop itsproducts. The world requirements at present are focused on low protein, powder-freegloves and puncture resistant gloves for medical use. The technology formanufacturing of such products is still lacking amongst the latex glove manufacturersin Thailand but this can technically be overcome without much problem.
Non-passenger tyres
1.43 A large proportion of rubber products is destined for exports (80 percent). The rubbertyre-manufacturing sector, which supplies up to 80 percent of total production for thedomestic market, is the exception. In general, Thai rubber processors have to import

Cost Structure of Major Thai Industries Final Report
BJ0346/Report/FinalLast printed 27/11/02 15:05
1-11
synthetic rubber. In contrast non-passenger tire manufacturers mainly use locallygrown natural rubber and so have a competitive advantage in world markets.
1.44 The non-passenger car tyre sector includes truck tyres, industrial vehicle tyres andtyres used in the agricultural sector. There is a large market potential for these tyresboth at home and overseas, as brand name is not as important as it is for passenger cartyres. Furthermore, since this group of tyres consumes a high percentage of naturalrubber, expansion of this industry will also ensure increasing usage of natural rubberin the future. At present the export of heavy-duty tyres is second to latex gloves, but ifgiven suitable support for expansion, it can become the most important exportedrubber product.
1.45 Presently the volume of export of heavy-duty tyres is second to latex gloves but if thisindustry is given suitable support for expansion, it can become the most importantexported rubber product.
Leather goods
1.46 The leather goods industry comprises tanned leather, leather footwear, leather bags,leather furniture and leather toys for pets. In 1995 the Thai share of the world marketfor leather footwear stood at 5.2 percent; leather bags at 3.1 percent; and tannedleather at 1.8 percent.
1.47 The Asian Free Trade Agreement (AFTA) scheme classifies leather goods asqualifiers for fast-track tariff reduction. Those goods with tariff below 20 percentwere reduced to 5 percent in 1998 and those with tariff exceeding 20 percent arebeing reduced to below 5 percent by 2000. The domestic market for leather goods isnot affected by this reduction of tariff rates, as consumers in Thailand prefer betterquality products, but the reduction of tariff rates within ASEAN should boost exportsof Thai products.
1.48 The leather goods industry turned into one of the top ten foreign exchange earnerswhen foreign companies began to invest in treatment plants in Thailand which turnraw hide into quality leather. Most Thai leather goods exports are holding theirmarket shares in medium and high-end goods. It has a good potential in the future forthe production and export of higher value added products and for the development ofown brands.

Cost Structure of Major Thai Industries Final Report
BJ0346/Report/FinalLast printed 27/11/02 15:05
1-12
Leather Footwear
1.49 Leather footwear for the low-end & medium-end market is performing well in someexport markets. Whilst overall export value decreased last year, footwear export valuecontinues increasing. The government has promoted leather footwear exports via taxrebates and funding of exhibitions, and the export value has increased in recent years.Thus, these efforts seem to have paid off. Important markets are the US, Denmark,and UAE.
Leather furniture and upholstery
1.50 Leather furniture in general has a mixed future as some firms export to stores such asIkea but will increasingly face stiff competition from central European countries.Indeed, traditional designs, which are bulky, heavy and expensive to transport, are at adisadvantage. But, new modern, light innovative designs are sought after in Europeanand American markets. As the competitiveness of Thai wooden furniture decreases,this is a timely opportunity for Thai firms, to combine their expertise and skill inwooden furniture design with the leather upholstery skill, and manufacture with goodquality leather furniture for export.
THE AGENTS: COMPANIES AS ENGINES OF COMPETITIVENESS
1.51 The competitiveness of a sector depends on the competitiveness of its individualfirms. For policy analysis, the economic analysis of competitiveness has beenwidened to include studies of the competitiveness of the firm. The management of adynamic and prosperous company contributes to the competitiveness of that firm’scountry of origin. Firms, therefore, become the crucial engine of nationalcompetitiveness, through the relationships amongst them.
Companies used as Case Studies
1.52 Two representative companies per industry were selected to be used as case studies.Of special interest to this study were examples of increased competitiveness throughoptimum cost management. The requirements of increased competitiveness are: first,recruitment of better quality people; second, innovation and quality improvementgenerated from cumulative experience; third, increased financial stability; fourth,implementation of improved management and organisational techniques; and finally,more effective allocation of resources.

Cost Structure of Major Thai Industries Final Report
BJ0346/Report/FinalLast printed 27/11/02 15:05
1-13
1.53 The companies visited are:
(i) Food Processing:
• An average-sized Thai manufacturer of canned fruit juice, canned tuna andready-to-eat meals. Despite its extensive diversification, the firm is consideredto be a small manufacturer in comparison with the other three major players inthis industry. This company is representative of the firms in the sector forvarious reasons. First, the company has the production capacity of an averagelarge processor in the industry. Second, the company, like the majority offirms in the industry, is 100% owned and managed by Thai nationals.
• A large joint venture manufacturer of pasteurised milk, yogurt, and UHT milkto be distributed nation wide. This company is representative of the firms inthe industry because most firms in this sector are joint ventures with foreigncounterparts. In this case, the local partner is active in managing theproduction functions, but local management practices are instilled into thiscompany.
(ii) Electronic and electric appliances
• A large foreign manufacturer of components used for computer hard diskproduction and other products. The company has been set up in Thailand as amanufacturing operation by the parent group based in Japan. Because thecompany’s main product has a proprietary license by an international group,the company holds 50% share of the world market. The firms in the sector aremostly foreign-owned, and located in specialised R&D centres. The majordifference between the company in the case study and small and medium sizedhard disk part manufacturing companies is that this company has adequatetechnical and financial strengths. SMEs would lack such capability.
• A large foreign manufacturer (assembler) of fax machines, printers andintegrated circuits. The company is fairly representative of companiesoperating in this sector, as most firms in the office appliances sector areforeign assemblers. The company has been set up in Thailand by the Japaneseparent group as an assembly operation. It appears that there are a few firmswhich manufacture products for office automation, but most of them are alsoJapanese.
(iii) Garment

Cost Structure of Major Thai Industries Final Report
BJ0346/Report/FinalLast printed 27/11/02 15:05
1-14
• A large Thai manufacturer of shirts, trousers and suits (smaller manufacturerof the ten large shirt producers in Thailand), and
• A small Thai manufacturer of sports and leisurewear.
The two companies visited have a relatively high level of investment, which isnot typical of other low cost producing nations, as these countries rely on thepeople rather than on the technology as their main resource. However, itappears that these firms are representative in so far as Thailand is not a verylow cost producing nation. Its labour cost is 4 to 5 times higher than inBangladesh and China, as shown by Sanjaya Lall in his work for the Ministryof Industry (1998). The level of investment also seems representative as aresult of 10 years of high steady economic growth and very high levels offoreign investment. Both companies are contractors and have no originaldesign or product development capability. This is typical of manufacturers indeveloping economies. However, value is being added due to own fabricpurchases allowing potential increase in margins.
(iv) Automotive Components
• A large Thai manufacturer of automotive components, and
• A large Thai manufacturer of automotive filters.
Both are family run. Their management and production styles depictthe distinct character of Thai firms, but it is unusual for such familyfirms to have large market shares. It is normal for Thai firms to havesome family influence in management and to focus on labour rathercapital-intensive process.
(v) Plastics
• A small Thai manufacturer of pallets, crates, furniture, industrial andautomotive parts, and
• A small Thai manufacturer of automotive and motorcycle parts.
Although both firms visited are public companies, the management andownership structures of the companies visited clearly demonstrate thestrong family influence which is characteristic of Thai firms. Thefamily group owns the majority of shares in each case.

Cost Structure of Major Thai Industries Final Report
BJ0346/Report/FinalLast printed 27/11/02 15:05
1-15
Unavailability of data makes it difficult to establish the size of a typicalinjection moulder and also to obtain the industry breakdown bycompany size. Nevertheless, it is known that there are several hundredsmall moulders, some with only 2 employees. Thus, it appears that thecompanies visited are representative of this industry, which ispopulated mainly by small companies.
(vi) Rubber products
• A small foreign-owned manufacturer of latex gloves. The company is a smallfirm with both domestic and international business, which is characteristic ofThai firms in the gloves industry. The major difference between this companyand most other small and medium size Thai glove manufacturing companies isthat this company has the capability to design or adapt production or testequipment, whereas their Thai counterparts would lack such capability. Mostother manufacturers would have to buy turnkey equipment packages, whichincreases their technology cost, or make do with inefficiently designedequipment which means more defects or lower production output.
• A large Thai manufacturer of non-passenger car tyres. Although mostcompanies in rubber tyre manufacturing are joint venture with foreignpartners, and the company visited is fully owned by Thais, the company isfairly representative of Thai companies operating in this sector, although somemay not own their own transport vehicles. The major difference between thiscompany and most other tyre manufacturing companies is that, this companyhas developed its know how by itself, whilst other firms rely on their foreigncounterparts in this area.
(vii) Leather products
• One large Thai sports shoe manufacturer that makes premium products forhigh profile international brand names was visited. Related companiesmanufacturing soles and tanned leather were included in the case study.
Compared to other players in this industry, this company is verycompetitive and well above average. One main reason for selectingthis firm is that it possesses sophisticated production and managementsystems, whilst SMEs mainly have basic systems which are notcompetitive world-wide. Another reason was the possibility toinvestigate the supply chain of the company. As one of its subsidiarycompanies is one if its main suppliers, this has enabled us to get the

Cost Structure of Major Thai Industries Final Report
BJ0346/Report/FinalLast printed 27/11/02 15:05
1-16
full picture of leather footwear industry in Thailand.
• A small furniture manufacturer that operates as a contractor. The company isrepresentative of small manufacturers in the leather furniture sector inThailand. Not only is it a small scale operation, but also it is registered as alimited company, although its operation is identical to a single proprietorship.The management is strictly under the control of a single owner or one of hisfamily members.
SURVEY SAMPLING FOR COMPANY SURVEY AND BREAKDOWN OFSURVEYED SAMPLE
1.54 An extensive survey was carried out using a combination of postal, telephone andface-to-face interviews. The selection of a representative sample of Thai companies,and the origin of the 449 possible respondents, was based on the breakdown of thepopulation of companies by registered capital and by size given in the "The report ofIndustrial Census Whole Kingdom, 1997". It was ensured that the sample wasrepresentative of the entire population of companies, including locally controlled,foreign-controlled, large, medium and small.
1.55 Out of the 449 firms contacted 121 firms were interviewed, mainly during face-to-face and some during telephone interviews. It was impossible to interview somecompanies, mainly very small or with some foreign ownership. Seven responses werereceived by mail, which were later followed up by telephone interviews. Five wereacceptable.
1.56 The empirical findings are derived from a detailed questionnaire-based survey of 126companies in Thailand, 65% owned by Thais and 21% locally controlled. 73% offirms were SMEs (under 500 employees), so it was considered that the respondents’composition was satisfactory enough to represent these companies. Tables 1-3 and 1-4 show the detail breakdown of the survey sample.
1.57 The majority of companies focus on one main revenue-earning activity.

Cost Structure of Major Thai Industries Final Report
BJ0346/Report/FinalLast printed 27/11/02 15:05
1-17
Table 1-3: Number of Survey Firms classified by Size
Sector Small Firms(< 50 employees)
MediumFirms (50-500)
Large Firms(>500)
Ready Meals 3 7 8Electronic appliancesHard Disk parts 0 0 4Office Equipment 1 2 2GarmentsKnitwear 0 7 3Woven garments 1 12 4Automotive partsFilters 2 0 1Pressed parts 1 18 1Plastic productsEngineering 0 2 1Household 6 7 1Rubber productsLatex Gloves 1 5 1Rubber Tyres 0 1 1Leather productsShoes 4 5 5Furniture 3 4 2Total 22 70 34
Table 1-4: Number of Survey Firms classified by Ownership
Sector F o r e i g n -controlled
L o c a l l y -controlled
Thai Owned
Ready Meals 1 4 13Electronic appliancesHard Disk parts 4 0 0Office Equipment 3 1 1GarmentsKnitwear 0 4 6Woven garments 0 6 11Automotive partsFilters 0 0 3Pressed parts 5 4 11Plastic productsEngineering 0 1 2Household 1 0 13Rubber productsLatex Gloves 0 3 4Rubber Tyres 0 1 1Leather productsShoes 3 1 10Furniture 0 2 7Total 17 27 82

Cost Structure of Major Thai Industries Final Report
BJ0346/Report/FinalLast printed 27/11/02 15:05
2-1
2. THAI INITIATIVES RELATING TO COMPETITIVENESS
2.1 This chapter describes how Thai industrial policies affect the competitiveness of thefirm, of the sector and of the nation. The first section reports on current industrialpolicies, measures and implementing agencies, mainly included in the IndustrialRestructuring Plan approved by Royal Thai Government Cabinet in April 2000. Thefollowing short section reviews the impact of these policies at the national andsectoral level. The remainder of the chapter summarises key issues reported byenterprises on the impact of the industrial policies, particularly the BOI incentives.
INDUSTRIAL POLICIES
General Background
2.2 Industrial policies have gravitated around the import-substitution period, semi-importsubstitution period, and gradual opening to export promotion. The period from mid-1990 is regarded as the gradual opening to export promotion.
2.3 Thailand has not progressed from the import-substitution regime into the exportpromotion regime in full - opening of the markets came after 1995. The objective wasto encouraged exporters by removing the internal tax burden embedded in theproduction of exportable products, by for example:
• providing tax-rebates, and tax refunds under the Article 19 (2) of the CustomsAct;
• encouraging the use of export credit from financial institutions including theEXIM Bank of Thailand at concessional rates;
• providing some domestic protection to start-up companies to improve thechance of survival (through BOI).
• providing another form of protection by local content requirements on foreign-owned manufacturers (through the Ministry of Industry).
2.4 The overall effect of a trade regime that is neither truly export-promoting nor import-substituting is clear: domestic consumers face high prices for most productsconsumed. There is still protection on the domestic market which leads to highprices, and at the same time producers selling to the local market are bearing a highertax burden in order to give tax concessions to exporters. The policy has been

Cost Structure of Major Thai Industries Final Report
BJ0346/Report/FinalLast printed 27/11/02 15:05
2-2
successful in encouraging exports but detrimental for companies producing for thedomestic market. Negative effects ultimately include reducing the rate at whichdomestic business will grow.
2.5 It is clear that the national competitiveness of Thailand was deteriorating throughoutthe 1990s, and that the overall cost of business activities could not measure up tocompeting countries. First, there was a huge deficit in the trade account stemmingfrom heavy import of consumption goods, raw-materials and intermediate products,and equipment. Second, the mirror image of this trade deficit was showing up in thebudget deficit due to non-productive investment. Third, Thailand was inviting manyforeign companies to participate in the economic growth without looking at the realnet benefit. For example, many semi-conductor companies gave little or no value-added to the economy due to huge import of parts, and limited employment. Fourth,wages in Thailand were rising faster than its partners in many labour-intensiveactivities. Fifth, the cost of doing business in Thailand rose proportionately fasterthan many countries in the region.
2.6 In other words, the net effect of giving tax concessions and incentives to exporterswhile at the same time protecting domestic producers from competition was togenerate foreign investments which were not related to Thailand’s resourceadvantages. They are mainly assembly industries, capital intensive, and importing rawand intermediate products and equipment.
2.7 The 1997 economic and financial crisis clearly indicated that not only should policydirections of the Thai government change, but also that Thai industries should bracethemselves to restructure their production, quality control, marketing, financialmanagement and general administration of their organisations. Firms must be leaner,with higher productivity, in order to trade competitively around the world. Withoutthese radical changes in firms, it would be difficult for them to compete in the future.
2.8 Since 1998, the government toyed with two options to jump-start the real side of theeconomy. These are through a) internal demand and/or b) exports. Rejuvenatinginternal demand during recession faced a daunting prospect with shortage of funds inthe public sector and limited ability of government borrowings from multilateralagencies and private sources. The Miyazawa Fund available from Japan is anexception to this statement. In the end, the financial cost of borrowings appears tooverwhelm the social rate of return by a wide margin. The investment impetus fromthe private sector has been hampered by widespread non-performing loans in thecommercial banks. Commercial banks thus have been reluctant to extend credits to

Cost Structure of Major Thai Industries Final Report
BJ0346/Report/FinalLast printed 27/11/02 15:05
2-3
the real sector. The clear alternative was to help the exporting sector to become thelocomotive pulling other sectors out of the recession.
2.9 In doing so, the Industrial Restructuring Plan (see Appendix 1), an ambitious set ofstrategies and measures for industrial restructuring, has been approved by Royal ThaiGovernment Cabinet in April 2000. Import taxes and duties have been modified sincethe crisis in 1997. Promotional privileges extended by the Board of Investments(BOI) have been reshaped so as to help attract investment of the desired type and tothe target industries and geographical areas.
2.10 Besides facilitation of industrial strengthening by the government, an additional pointof consideration is the changing AFTA scheme (Asian Free Trade Agreement) in2000 which has opened up more competition within ASEAN, and prior WTO tradeagreements which will ultimately result in deeper tariff cuts. Indeed, although theWTO ministerial agenda could not be concluded in Seattle in 1999, it is likely thatdeveloped countries will continue with the tariff reduction trend. Meanwhile, despitesome difficulties with delays in reducing tariffs, ASEAN members have agreed inprinciple to implement the AFTA targets by 2003, with tariffs for intra-ASEAN tradecut to 0-5%.
Import Duties and Taxes
2.11 In an effort to further increase industrial competitiveness and reduce costs for localindustry, imported taxes and duties were changed for most of imported items in May1998. Since then, raw material is taxed at 0-1 percent and intermediate products at 1-5 percent. Import taxes and duties were again lowered for some items at the beginningof July 2000. However, the following table shows that Thailand’s import duties arestill rather uncompetitive in the ASEAN region in some cases. These taxes are forASEAN countries excluding Cambodia for which data was available and for theperiod 1998-2003. The products and countries for which there was data beyond 2003show the year in brackets. The table does not show Most Favoured Nation status oradjustments to import duties such as when raw materials have sensitive, normal track,fast track and exception status.

Cost Structure of Major Thai Industries Final Report
BJ0346/Report/FinalLast printed 27/11/02 15:05
2-1
Table 2-1: Rough Comparative Table of Import Duties ranges in ASEAN countries for selected Industries’ raw materials (%)
Year 1998 2003
Sector
Tha
iland
Indo
nesi
a
Mal
aysi
a
Phili
ppin
es
Vie
tnam
Lao
s
Mya
nmar
Sing
apor
e
Bru
nei D
ar.
Tha
iland
Indo
nesi
a
Mal
aysi
a
Phili
ppin
es
Vie
tnam
Lao
s
Mya
nmar
Sing
apo
Bru
nei D
ar.
Ready Meals 5 -20 5 0 -11 0-20 - - - 0 0 5 5 0 -5 0 - - - - 0 0
Electronic appliances
Hard Disk parts 0 - 5 0 - 3 - - - 0 - 0 - 5 0 - 3 - - - 0 -
Office Equipment 2.5 – 5 0 0 3 - - 1.5 0 - 2.5 0 0 3 - - 1.5 0 -
Garments 1-15 0-15 0-11 0-20 5-45 5 0-10 0 0 1-5 0-5 0-5 0-5 0-5 0-5 0-5 0 0
Automotive parts
Filters 5 – 10 0 - 5 5 – 20 - - - - - - 5 0 - 5 0 - 5 - - - - - -
Pressed parts 5 – 20 0 - 5 5 -20 - 0 - 1.0 - 3 0 0 –20 5 0 -5 - - 0 - 1.0-3 0 0 -20
Plastic products 5-20 2.5-5 0-11 3-10 0-5 5 0-1.5 0 0-5 5 2.5-5 0-5 3-5 0-5 5 0-1.5 0 0-5
Rubber products
Latex Gloves 5-10 0-5 0-5 10 2-15 - - 0 0 5 0-5 0-5 5 2-5 - - 0 0
Rubber Tyres 0-15 0-20 0-20 0-15 5 - - 0 0 0-5 0-5 0-5 0-5 5 - - 0 0Source: Compiled by WSA using data from Ministry of Finance (Thailand), Fiscal Policy Office, International Economic Policy Division, AFTA Section.Note: – means N/A.

Cost Structure of Major Thai Industries Final Report
BJ0346/Report/FinalLast printed 27/11/02 15:05
2-1
2.12 The VAT rate was increased from 7 to 10 percent but in an effort to increaseconsumer spending the increase will only be effective from October 2000.
Promotional Privileges by the BOI
2.13 The usual BOI incentives include tax and tariff exemptions for machinery and rawmaterials, and exemptions on corporate income tax for 3-8 years. The privileges aregeared towards those industries that are economically and technologically appropriate,and have adequate preventive measures against damage to the environment. Flexiblemeasures have been recently introduced not only to help industry comply with WTOregulations but also to attract more Thai and foreign investment. For the first time,investment incentives are only granted to firms if they make commitments to researchand development, staff training and compliance with international quality standardswithin a certain period after commencing operations.
2.14 The main privileges are:
• Tax-based incentives (tax holidays and tax exemptions) depend on projectlocation, industry and investment conditions. Projects in priority areas (basictransportation systems, public utilities, environmental protection/restoration,direct investment in technological development, basic industries) receivecorporate income tax exemption for eight years, and import dutyexemption/reduction on machinery depending on location. Projects located inlocations denominated zones 1, 2 or 3 may receive additional incentivesincluding further tax and duty reductions, as well as allowances forinfrastructure investments.
• Non-tax privileges (guarantees, protections, permissions and services).
2.15 The BOI has introduced zoning privileges to push industries into disadvantagedremote areas. For the purpose of granting tax incentives the BOI continue to divideThailand into three zones. Zone 1 which is Bangkok and five neighbouring provincesusually receive the least promotion privileges. Zone 2 which comprises 12 provincesreceive more privileges than Zone 1 but less than Zone 3. Geographical areasclassified as Zone 3 are those least attractive to investors, with low per capita incomeand inadequate investment facilities. Firms which locate in Zone 3 areas are eligiblefor privileges such as tax exemption for machinery imports, corporate income taxexemption for up to eight years, and tax free raw material imports for five years.
Cost Structure of Major Thai Industries Final Report
BJ0346/Report/FinalLast printed 27/11/02 15:05
2-2
2.16 During 1998 - 1999, less investment was recorded in terms of capitalisation despiteincreased numbers of applications to BOI for promotional privileges.
Other Incentives
2.17 The Department of Customs operates under the Customs Law (B.E. 2464) which is 80years old law. The Article 19 (2) of that law permits the exporters to refund their tariffpreviously paid for raw-materials imported and now included in finished exporteditems. It is stipulated that waiving taxes is at the discretion of the Customs DirectorGeneral.
2.18 The Customs Department also operates the bonded warehouse system. At eachbonded warehouse, customs officials inspect incoming goods and outgoing goods.Usually these incoming and outgoing goods are sealed in containers. Bondedwarehouses are ideal for 100% export business.
2.19 The Ministry of Industry through its Industrial Estate Authority also operates schemeslike the bonded warehouse system.
2.20 The above shows that the applicability of tax exemptions and bonded warehousessystems is somewhat limited. In order to obtain a more general coverage, theproposed structure for waiving taxes under the Customs Law can be broaden to coverimported raw materials and intermediate goods for the manufacture of exportedproducts.
Industrial Restructuring Plan – April 2000
2.21 The Industrial Restructuring Plan approved by the Royal Thai Government Cabinet inApril, 2000 comprises strategies, measures and implementing agencies to direct theoverall industrial restructuring plan of 13 industries (see appendix 1). Three differentphases are considered: a) 1999 - September 2000, b) 2000 - 2001 and c) completionby 2004.
2.22 The first phase focuses on improving production processes and labour skills,developing small and medium-size enterprises (SMEs) and relocating factories toregional industrial estates along with upgrading machinery to less environmentallydamaging technology. Target industries include, food and animal feed, textile andgarments, footwear and leather, electrical appliances and electronics, and vehicles and

Cost Structure of Major Thai Industries Final Report
BJ0346/Report/FinalLast printed 27/11/02 15:05
2-3
autoparts (excluding those made of rubber and plastic).
2.23 The second phase focuses on promotion of business consulting services and research& development. Target industries include all 13 industries in the industrialrestructuring plan. No specific plans have been laid out for phase three.
Industrial Policies Particular to SMEs
2.24 Various laws and plans have been approved to assists SMEs in particular in the areaof manufacturing relocation, machinery and equipment overhaul, business consulting,and research and development promotion. The SME Development Master Plan –with particular reference to the manufacturing sector – comprises seven strategies,details of which are included in Appendix 1. These are:
• upgrade technological and management capabilities of SMEs;
• develop entrepreneurs and human resource of SMEs;
• enhance SME’s access to markets;
• strengthen financial support systems for SMEs;
• provide a conducive business environment;
• develop micro-enterprises and community enterprises;
• develop networking of SMEs and clusters;
2.25 The SMEs Act 2000 has been in existence since February 2000 to enhance andsupport the development of SMEs. A newly established SMEs Office will be formedto coordinate and implement the plan. Financial support has also been approved sinceAugust 1999 including:
• 1 billion baht venture capital fund;
• special SMEs loan program being extended by commercial banks;
• Thailand Recovery Fund being managed by the ADB,
• extension of SMEs credit guarantee and loans being extended by SmallIndustrial Financial Corporation.
2.26 One key strategy of the 1st phase of the SMEs plan aims at improving productionprocesses. It is the first time that this type of strategy is linked to BOI’s investmentincentives. Though the response by industry has been slow, it is believed that much

Cost Structure of Major Thai Industries Final Report
BJ0346/Report/FinalLast printed 27/11/02 15:05
2-4
improvement in production efficiency will take place in the later phases.
EFFECT OF INDUSTRIAL POLICIES ON SECTORAL AND NATIONALCOMPETITIVENES
Benefits derived from the Industrial Restructuring Plan
2.27 Production and export of the country’s major industries such as electronics,automobile, latex gloves, construction and toys has improved significantly. Thoseindustries with sluggish growth are steel, petrochemicals, textiles, ceramics, and pulpand paper.
2.28 In general, the first-phase initiatives have been quite successful in attracting largefirms which are relocating and upgrading their machinery. Many firms, however, havenot joined the programme for relocating and upgrading due to concerns on how toundertake further loan repayments whilst they are severely short of liquidity andburdened by high debts. SMEs, in particular, need strong support from thegovernment if industrial restructuring is to be successfully completed. For this, thegovernment approved 3.77 billion baht worth of loans, but only 1.59 billion baht wasavailable during the first phase through the Industrial Finance Corporation ofThailand (IFCT) and Small Industry Finance Corporation (SIFC). In addition, thegovernment allocated 667 million baht for the skill development program but only364 million baht were drawn and four training projects were given with limitedparticipation from industry. Some firms, particularly in the garment industries wheremuch progress has been recorded in upgrading machinery, have used private capitaland loans extended by commercial banks at more competitive rates, rather thangovernment loans.
2.29 Despite the slow response by industry to the stimulus driven by government duringthe first phase, it appears that if implementation problems can be overcome during thefirst phase, much improvement in production efficiency will take shape.
COMPANY VIEWS ON THE EFFECT OF INDUSTRIAL POLICIES ON THECOMPETITIVENESS OF THE FIRM
2.30 The effect of industrial policies on the competitiveness of the firm is somewhatdifferent to the effects at the sector and national level. As BOI incentives have beenreceived by companies for some time now, firms were asked how a reduction ortermination of BOI incentives would affect their company and its cost structure. Thisshed light on how prepared companies were for facing more competition and less

Cost Structure of Major Thai Industries Final Report
BJ0346/Report/FinalLast printed 27/11/02 15:05
2-5
protective business environments in the future. In general, the companies stated thatthe effect, in order of importance, would take the form:
• increases in raw material costs;• increases in the cost of imported machinery;• increases in corporate income tax;• lower production efficiency due to inability to import modern equipment;
2.31 The number of companies interviewed that had products being granted promotionalprivileges, is shown in Table 2.1.
Table 2-2: Breakdown of products being granted BOI promotional privileges ondifferent sectors.
Sector No. of firms interviewedin the survey
Food processing Ready to eat meals 8
Electronicappliances
Hard disk drive parts
Office Equipment
3
4
Garments Knit wear
Garments
2
3
Automotive Filter
Pressed metal Part
1
6
Plastic products Engineering
Household
2
1
Rubber products Glove
Tire
3
1
Leather products Shoes
Furniture
6
Impact by sector
2.32 The following table 2-3 shows the effect of reduction or termination of BOIincentives for the industries studied, based on the opinions of the managersinterviewed.
2.33 Most managers thought the main impact of BOI incentives was on their cost of rawmaterials or imported machinery, via import tariff reductions and refunds. The rubberproducts and garment industries did not see the impact on materials as important (they

Cost Structure of Major Thai Industries Final Report
BJ0346/Report/FinalLast printed 27/11/02 15:05
2-6
have mainly domestic sources of supply) and the autoparts, food and leather industriesdid not see the impact on equipment costs as important. Four sectors thought theimpact on corporate income tax was the most important suggesting that tax breakscould be gradually removed to avoid abrupt ends to promotional periods.
2.34 The conclusion from this would seem to be that the main impact of BOI incentives isto support the import of raw materials and equipment – i.e. promoting inappropriateforms of investment. The corollary is that when after 5 years these concessions arewithdrawn these firms will suffer a shock to their competitiveness unless they havehelped to develop supplier industries in the meantime.
2.35 The same incentives, however, are hindering the development of firms supplying todomestic customers, so they are preventing the development of essential feederindustries. For example, according to managers in the leather sector, somegovernment incentives designed to promote export activity in the private sector, arereducing the rate at which domestic businesses will collaborate and grow. This affectstheir suppliers of hides.
Table 2-3: Perceived Effect of Reduction or Termination of BOI incentives on Costs
Industry Increase in rawmaterial costs
Increase in cost ofimportedmachinery
Increase in corporateincome tax
All sectors studied
Garments
Automotive
Electronics
Food
Leather
Plastics
Rubber
Source: interviews and survey of enterprises
Effects by Company Size
2.36 The effect of industrial policies on companies’ cost structure appears to vary by size.The tables below depict the effects of reduction or termination of BOI privilegesaccording to companies interviewed. The general trend is followed, but medium sized

Cost Structure of Major Thai Industries Final Report
BJ0346/Report/FinalLast printed 27/11/02 15:05
2-7
firms regard the main impact as increase in the cost of machinery rather than theincrease in raw material costs. This may reflect the need of medium sized firms toupgrade their equipment as a prerequisite to increases in production capacity.
Table 2-4: Effect of Reduction or Termination of BOI incentives on Costs by company size
Industry Increase in rawmaterial costs
Increase in costof importedmachinery
Increase incorporate incometax
All firms surveyed
Small
Medium
Large
Source: WS Atkins survey. Only the top three impacts mentioned are included in the table. No of indicates importance givenby the industry to reduction or termination of the BOI privileges.
Effects by Company Ownership
2.37 Fully Thai owned firms regard the main impact as increase in corporate income taxrather than the increase in raw material costs and are less concerned about materialscosts. The opposite is true for foreign owned firms. This may be because foreignowned investments tend to rely most on imported equipment, materials or kits fromtheir parent, and are also able to minimise tax payments by transfer pricing – i.e.setting the prices at which components and materials are sold from the parentcompany, or prices at which finished goods are sold to parent company or traders, tominimise profits and tax.
Table 2-5: Effect of Reduction or Termination of BOI incentives on Costs by companyownership
Industry Increase in rawmaterial costs
Increase in costof importedmachinery
Increase in corporateincome tax
All firms surveyed
Foreign controlled
Thai controlled
Fully Thai Owned
2.38 Different corporate attitudes among owners and employees may also account for thesedifferent perceptions between Thai and foreign companies. Most managers for

Cost Structure of Major Thai Industries Final Report
BJ0346/Report/FinalLast printed 27/11/02 15:05
2-8
foreign firms are employees whilst managers of Thai firms are also owners. Mgrs offoreign owned firms are therefore more connected with operating margins, and notwith corporate profits and tax.
IMPACT OF TRADE LIBERALISATION ON THAI INDUSTRY
2.39 One of the main threats presented to industry at the moment is the reduction ortermination or privileges for exports, such as the American General System ofPreference (GSP) and similar schemes. To shed light on this issue, companies wereasked about the effects on its cost structure if these privileges were terminated. Ingeneral, they think main effect would be loss of revenues followed by increased incost per unit. Small companies considered the main effect to be increase in costs perunit followed by decrease in revenues.
2.40 The perceived effect of trade liberalisation on companies’ cost structure appears tovary by ownership. The tables below shows that although decrease in revenues is ingeneral the main effect, foreign controlled companies see the loss of overseas marketsas important.
Table 2-6: Effect of Reduction or Termination of trade privileges by companyownership
Industry Increase in costper unit
Decrease inrevenue
Loss ofoverseasmarkets
All firmssurveyed
Foreigncontrolled
Thai controlled
Thai fully owned
Source: WS Atkins survey
Notes: The number of denotes the importance given by industry to the effect of reduction ortermination of trade privileges. Only the top three effects mentioned are included in the table.

Cost Structure of Major Thai Industries Final Report
BJ0346/Report/FinalLast printed 27/11/02 15:05
2-9
SUMMARY AND CONCLUSIONS
2.41 Production and export of the country’s major industries such as electronics,automotive parts, and latex gloves has improved significantly. In general, the first-phase initiatives have been quite successful in attracting large foreign-owned firms,which are relocating and upgrading their machinery.
2.42 Several constraints still exists which impede the full benefits of the restructuringprogramme from being accrued. These include:
• Companies are severely short of liquidity and burdened by high debts.Concern over further loan payments stops firms taking advantage of theprogrammes.
• More competitive interest rates than those offered by the government for therestructuring programme appear to be offered by the private sector.
• The implementation of the programme can be improved by reducing thenumber of agencies involved and creating a forum to facilitate the expositionof private sector views.
2.43 The export promotion policy has been successful in encouraging exports andincreasing employment but detrimental for companies producing for the domesticmarket, including for companies manufacturing raw materials which are declined infavour of imports for which there are import duty exemptions. Import taxes and dutieshave been modified since the crisis in 1997 and promotional privileges extended bythe Board of Investments (BOI) have been reshaped so as to help attract investment ofthe desired type and to the target industries and geographical areas.
2.44 Much still needs to be done to prepare companies in the incentive programmes for thetime when privileges are terminated (or companies stop qualifying for them). Ingeneral, the companies stated that the three main effects, in order of importance,would take the form:
• increases in raw material costs;
• increases in the cost of imported machinery;
• increases in corporate income tax.
2.45 If industrial policies are to target these issues, and help to make the existing export

Cost Structure of Major Thai Industries Final Report
BJ0346/Report/FinalLast printed 27/11/02 15:05
2-10
industries more competitive and able to survive the withdrawal of incentives, thepolicies will need to:
(i) Promote the development of the feeder industries: the production of semi-finished products and equipment used by the leader industries. These shouldbe based on indigenous materials and technology, so remission of importduties and privileged imports are not appropriate;
(ii) Provide business services, including the engineering design of productionfacilities and production engineering services, to reduce dependence onimported machinery and make existing facilities more productive.
NESDB - Cost Structures Thailand
BJ0346/Report/FinalLast printed 27/11/02 15:05
3-1
3. THE POSITION OF THAI INDUSTRIES IN THE WORLDMARKET
INTRODUCTION
3.1 This section describes the competitive position of Thailand vis a vis that of its maincompetitors. The first section indicates the competitiveness of Thai industry bycomparing the value of exports with those of competitor nations. For each of theindustry sectors, the main competitor nations are then identified. The followingsections gives a brief description of the world industry and its trends, and Thailand’sposition in the world industry, for each of the product sectors. Data from the casestudies are then used to show how Thailand’s productivity and performance comparesto world class performance. Thailand’s strengths, weaknesses, opportunities andthreats are then summarised and future challenges are summarised.
RELATIVE EXPORTS AS MEASURES OF COMPETITIVENESS
3.2 This section illustrates Thai industry competitiveness by comparing its export levelwith that of other nations.
3.3 The tables below present country exports into the three main markets (EU, NAFTA1
and Japan) mainly by countries at a similar level of development as Thailand.Although there is a degree of inaccuracy in these calculations (due to the level ofaggregation of data at industry level), it is sufficient to indicate general magnitudesand trends. The statistics made it difficult to calculate equivalent tables for ASEANcountries, as complete data was only available for Malaysia. The lack of consistencyof trade statistics for ASEAN markets made it impossible to compute imports by thesub-sector level for all markets bar the EU. Thus, the tables shown here represent thechapters to which the sub-sectors belong. It is assumed that most products within thechapter heading will follow the general trend in trade. This was checked for importsinto the EU. Whilst the top main exporters were the same, the ranking was slightlydifferent to that achieved using statistics by chapter.
3.4 It was estimated that the reported data probably includes some double counting of re-exported products. In particular we suspect that exports from countries withoutmanufacturing, such as in the case of the automotive industry in Singapore, may
1 North American Free Trade Area – USA, Canada, Mexico

NESDB - Cost Structures Thailand
BJ0346/Report/FinalLast printed 27/11/02 15:05
3-2
include products shipped from other countries in the region through Singapore orHong Kong. This must be taken into account when studying the tables of imports intoNAFTA, EU and JAPAN.
Exports of the Main Thai Industries Studied
3.5 Table 3-1 shows the main exports into the EU, NAFTA and Japan.
Table 3-1: 1998 Imports into NAFTA, EU and JAPAN (Million US Dollars)Industry Food Plastics Rubber Garments
KnitwearGarments
NotKnitwear
Leatherfootwear
Auto-motive
Elec-tronics
Plasticand
leatherfurniture
Total
United States 6,112 18,019 5,229 1,929 1,825 255 196,285 22,572 3,782 256,008Japan 44 2,649 2,912 17 41 4 147,421 12,275 50 165,413Canada 4,319 5,911 2,273 38 42 7 89,999 2,449 4,904 109,943China 2,968 4,720 186 8,376 12,817 11,568 47,171 4,699 7,805 100,310Mexico 711 1,129 558 3,334 4,508 38 74,376 4,013 3,687 92,354Taiwan 980 1,909 612 1,525 826 241 41,374 1,360 2,086 50,913Korean Republic 1,430 1,515 939 2,058 1,589 458 38,149 1,247 74 47,458Malaysia 186 278 1,353 658 550 91 30,189 719 836 34,860Singapore 247 198 155 328 90 5 30,627 1,136 16 32,802Thailand 3,585 516 1,265 1,335 1,071 646 12,855 770 748 22,792Philippines 444 102 30 893 1,254 79 14,866 442 438 18,548Hong Kong 70 248 10 3,256 3,648 164 6,141 857 71 14,465Indonesia 1,303 333 940 988 2,096 1,367 4,446 337 1,169 12,978Brazil 819 69 362 12 7 1,174 4,434 195 231 7,305India 817 198 112 1,100 2,116 441 1,257 68 242 6,351Bangladesh 229 1 0 1,860 2,713 42 26 6 1 4,878Vietnam 614 25 32 192 716 1,063 244 27 176 3,090Sri Lanka 50 19 166 570 1,285 40 77 25 7 2,239Macau 8 0 0 898 601 65 65 3 17 1,657Argentina 1,043 31 58 1 1 4 249 17 108 1,513Pakistan 60 5 2 731 484 20 26 65 22 1,416Chile 1,179 8 28 3 7 2 90 4 49 1,371Cambodia 13 0 5 425 635 29 0 0 0 1,107Colombia 198 73 0 151 258 6 43 4 1 734Venezuela 155 44 45 0 0 0 237 4 0 484North Korea 184 11 1 3 77 0 117 1 1 396Burma 52 0 0 128 69 5 3 0 0 256Mongolia 0 0 0 33 36 0 1 73 0 143Bhutan 0 0 0 17 119 0 1 0 0 137Brunei 0 0 0 120 2 0 10 4 0 136Myanmar 17 0 0 40 49 1 2 0 4 113Iran, IslamicRepublic
46 0 4 3 1 1 33 7 1 96
Maldives Islands 23 0 0 37 24 0 0 0 0 84Laos 0 0 0 37 40 1 2 0 0 80Nepal 0 0 0 7 12 0 1 0 0 20Afganistan 0 0 0 0 0 0 2 0 0 2Iraq 1 0 0 0 0 0 0 0 0 1
Source: Compiled by WS Atkins using the World Trade Atlas Database for USA, Canada, Mexico and Japan and Eurostat database forcountries in the EU. Year end currency exchange rate was used for translation.
NESDB - Cost Structures Thailand
BJ0346/Report/FinalLast printed 27/11/02 15:05
3-3
3.6 In general, Thai exports are competing with those from China, Mexico, Taiwan,Korea, Malaysia and Singapore. Exports from developed countries, such as the USA,Japan and Canada are thought not to be competing directly with those form Thailand:there are significant differences in the levels of quality and in the types of productsoffered by these markets and by Thai industry. Within the ASEAN-4 (Indonesia,Malaysia, the Philippines and Thailand), Thailand is more competitive (in terms ofexports), than the Philippines and Indonesia.
MAIN COMPETITOR NATIONS
3.7 To focus the benchmarking analyses, Thailand’s direct competitors were identified bystudying their export structures (shown above) and by gathering qualitativeinformation form sector experts and Thai industrial associations. In principle, thecountries which export to the same markets as Thailand are considered as directcompetitor unless qualitative reasons suggest that they are not exporting similarproducts. The exceptions were detected by qualitative information provided byindustry associations through interviews, and by our Thai industrial experts. Forexample, in the case of food processing (particularly ready meals) Singapore can notbe regarded as a direct competitor since it does not have any manufacturing activities.Normally, it has production bases in other countries such as Malaysia or Hong Kongand it just acts as an export agent – Singapore has the funding to buy brand nameproducts.
3.8 As a result of this process, it appears that the main direct competitors of the Thaiindustries studied are those shown in Table 3.2. Those in bold are the most important.
3.9 The following sections analyse, for each of the selected sectors in turn:
• their export performance,
• industry trends and opportunities,
• the competitiveness of the sector in terms of company performance,profitability and cost constraints,
• their strengths and weaknesses, opportunities and threats, and finally
• the issues the sector must fact to improve competitiveness.

NESDB - Cost Structures Thailand
BJ0346/Report/FinalLast printed 27/11/02 15:05
3-4
Table 3-2: Thailand’s Main Direct Competitors
Industry Sub-sector Competitors
Food Processed Ready-to-eat Meals China, Vietnam and thePhilippines
Electronics Hard Disk Components Malaysia, Singapore,Philippines and China
Office Automation China, Taiwan, Malaysia, andIndonesia
Garments Knitwear and Woven In USA markets: China, Korea,Taiwan and Mexico.
In Middle-Eastern markets:Indonesia, India and Vietnam
Automotive Pressed Metal Parts and Filters India and China
Plastics Engineering Korea and Taiwan
Household China and Malaysia
Rubber and Latex Rubber Tyres Malaysia and Indonesia
Latex Gloves Malaysia
Leather Furniture Indonesia and China
Footwear China, Brazil, India and Italy
PROCESSED FOODS
Exports of Food Products into Main Markets
3.10 Table 3-3 shows the main food exports by country into the main markets. Thai foodindustry is the 3rd exporter of processed food into main markets and the mostcompetitive amongst countries with the same level of development. Thailand iscompeting mainly with China and Korea in the EU and Japan. Other competitorsfrom Asia include Taiwan, India, Vietnam and the Philippines. The competitiveness(i.e. export levels) of Thailand and each competitor for each main market separately(EU, Nafta and Japan) is showed in the table below.

NESDB - Cost Structures Thailand
BJ0346/Report/FinalLast printed 27/11/02 15:05
3-5
Table 3-3: 1998 Food Imports into Main Markets (Million US Dollars)
Exporter All EU NAFTA Japan Exporter All EU NAFTA Japan
United States 6,112 705 1,065 4,342 Colombia 198 147 41 10Canada 4,319 293 2,981 1,045 Malaysia 186 97 0 89Thailand 3,585 694 1,738 1,153 North Korea 184 0 0 184China 2,968 308 48 2,612 Venezuela 155 35 120 0Korean Republic 1,430 120 2 1,308 Hong Kong 70 30 13 27Indonesia 1,303 163 322 818 Pakistan 60 33 11 16Chile 1,179 182 390 607 Burma 52 0 10 42Argentina 1,043 683 249 111 Sri Lanka 50 15 10 25Taiwan 980 74 223 683 Iran, Islamic Republic 46 32 0 14Brazil 819 484 140 195 Japan 44 44 0 0India 817 109 206 502 Maldives Islands 23 16 0 7Mexico 711 54 468 189 Myanmar 17 17 0 0Vietnam 614 82 155 377 Cambodia 13 5 1 7Phillipines 444 79 183 182 Macau 8 0 2 6Singapore 247 63 59 125 Iraq 1 1 0 0Bangladesh 229 67 120 42
Source: Compiled by WS Atkins using the World Trade Atlas Database for USA, Canada, Mexico and Japan and Eurostat database forcountries in the EU. Year end currency exchange rate was used for translation.
World Industry Trends Food Processing – Ready Meals
3.11 The world market for frozen ready meals was approximately 1.95 million tonnes in1996 and was forecast to grow by 20% to reach 15.4 million tonnes in 2001. Thefrozen ready meals market is most developed in the US, where volume sales reached734,000 tonnes in 1996 (see Table 3-4). The market is relatively mature, however,having risen by only 9% since 1992. Although the UK already constitutes a largefrozen ready meals market, sales are still growing strongly, having increased by 43%between 1992 and 1996 to reach 332,000 tonnes. Indeed, ready meals in general havebeen one of the success stories of the UK food industry in recent years. Frozenvarieties have been the focus of much product innovation including new internationalrecipes, plated meals and light meals.
3.12 In many countries, ready meals still represent a young and fast growing market.Three-digit growth occurred over the 1992-1996 period in Italy, Sweden, Portugal andGreece. Germany represents the third largest market for frozen ready meals at232,000 tonnes in 1996. However, the German market has remained virtually static in1996, buoyed only by steady new product launches. Growth rates in Europe for 1997remain very high, confirming strong opportunities.

NESDB - Cost Structures Thailand
BJ0346/Report/FinalLast printed 27/11/02 15:05
3-6
Table 3-4: Major markets – volume sales of frozen ready meals 1992-1996
1992 1993 1994 1995 1996 % change1992/1996
US 672 702 724 730 734 9.2UK 233 268 286 310 332 42.5Germany 202 224 236 231 232 14.9France 113 132 145 175 195 72.6Japan 71 81 83 92 105 47.9Denmark 33 43 47 53 58 75.8Italy 20 24 32 43 56 180.0Canada 41 45 49 52 56 36.6Spain 26 28 33 40 42 61.5Sweden 16 20 24 29 36 125.0Netherlands 29 30 30 31 31 6.9Australia 20 20 21 20 20 0Belgium 16 17 18 19 19 18.8Norway 11 10 14 16 18 63.6Ireland 8 8 8 9 9 12.5Portugal 3 3 4 4 5 66.7Greece 1 1 1 1 2 100TOTAL 1,515 1,656 1,755 1,855 1,950 28.7
Source: Euromonitor
3.13 The sector is dominated by the following multinational and large national companies:Apetito AG, ConAgra, Frosta AG, HJ Heinz, Mccain, the Pillsbury company(Diageo), Sara Lee, Schöller, Sharwood RHM Frozen Food, Unilever. Some majorretailers, such as Fleming, Marks & Spencer, Carrefour, and Tesco, are driving themarket, with many dedicated suppliers.
Sector Trends – ready meals
3.14 Ready meals are one of the fastest growing sectors of the frozen food market in bothmajor and emerging markets. Their growth has been fuelled by the following factors:
• Busier lifestyles
• The increase in single person households
• The growing number of working women
• The trend towards supermarket shopping
• A high level of new product activity and high investment by internationalmanufacturers.
3.15 Frozen ready meals provide a wealth of opportunities for new product development,and markets where they are most developed are experiencing trends towards ethnic(see insert/box below) and speciality meals, as well as higher segmentation withregard to packaging formats. In the UK, manufacturers have successfully launched

NESDB - Cost Structures Thailand
BJ0346/Report/FinalLast printed 27/11/02 15:05
3-7
both larger portion meals and small “snack pots”. In the more mature markets, privatelabel ready meals have been extremely successful at penetrating markets, which wereoriginally dominated by more low cost, standard products such as frozen vegetables(e.g. in the UK private label accounts for a market share of 97.7% in the leadingchilled ready meals category).
European Ethnic ready meals
The European ethnic ready meals market was worth £407m in 1997 (excluding Spain and Italy as these marketsare too small to quantify). The UK represents the largest market with sales of £307m, followed by France with £56m and Germany with £34m. The UK accounts for 75% of the sector, as a result of its having the mostdeveloped and well established ready-meals market in Europe. In other countries, there tends to be a greaterrange of ambient/dried meals, with frozen and chilled meals only beginning to make an impression on theoverall ready meals market.
Multinational companies such as Nestle with its Maggi and Findus brands, and Mars with its Suzi Wan brand(except the UK) have the strongest presence in the ready meals market with their products available in all fiveEuropean countries. Within each country, national companies are also important, e.g. Soprat in France andFrosta and Dr Oetker in Germany. Smaller specialist ethnic companies are also present in this market withmore found in the larger and more developed market such as the UK and France, e.g. Patak and DiscoveryFoods. Within the chilled ready meals segment, own label penetration is very high, especially in the UK. Own-brands dominate this segment, with very few brands present. Chilled branded ready meals include the Shahi(Indian) and Ken Hom (Chinese) ranges from S&A Foods in the UK, and the Taureau Aile range from Skalli inFrance.
Source: The European Ethnic Foods Market, 1998, Leatherhead Food RA
3.16 Success in the ready meals industry depends on balancing the convenience aspectwith individuals increasing demands for health, quality and taste, and variety. Recentnew product developments have included the following:
• Restaurant quality ready meals• More involved ready meals aimed at customers who want to do more than just
re-heat food, e.g. “Create a Meal”• Vegetarian meals in countries where the concept is underdeveloped, such as
France• Ethnic meals such as Indian, Chinese and Mexican dishes• New variety of pizza with more original toppings• Fast food type snacks and ready meals, such as chicken nuggets and take-
aways• Ready meals made with more exotic meat and game, such as venison• More practical packaging, such as re-sealable bags
3.17 Future industry trends are sure to involve new distribution strategies, bypassingretailers by using the internet and home delivery to sell and deliver ready meals.Also, “the emergence of ‘sub-groups’ of consumers will make it increasinglycomplicated for mass market operators to tailor their product to these individualneeds. While offering new opportunities to more specialised niche players, NPD and
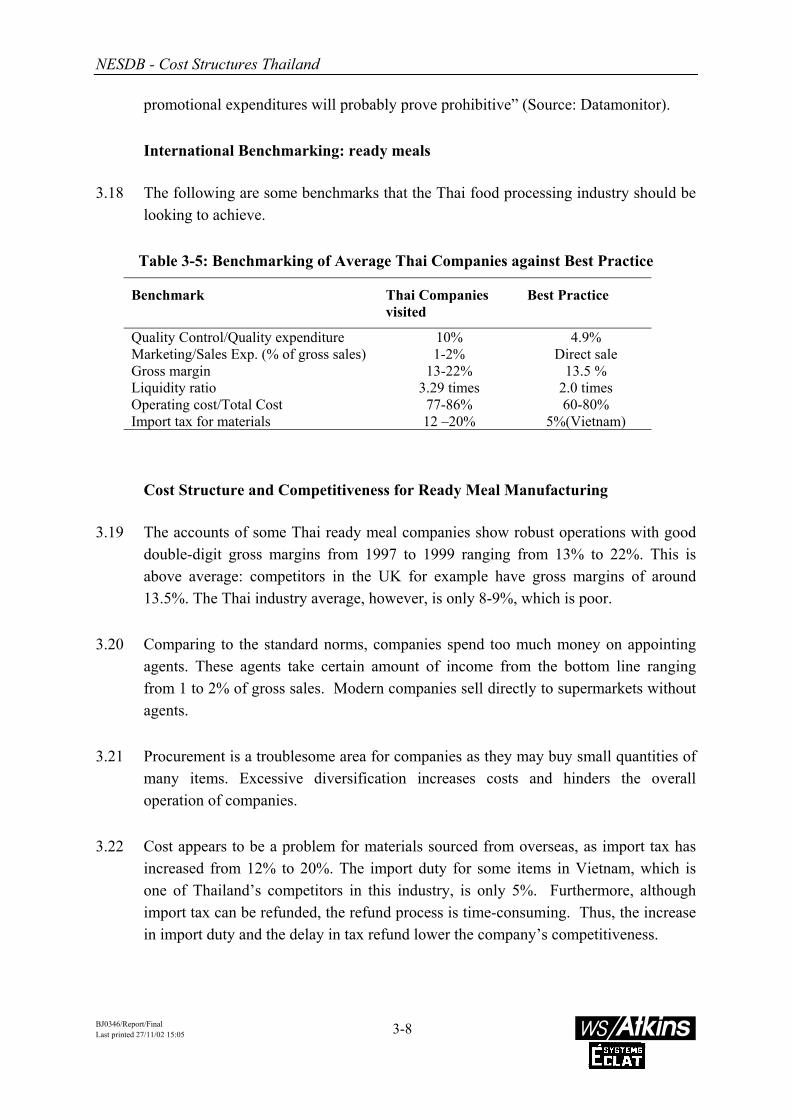
NESDB - Cost Structures Thailand
BJ0346/Report/FinalLast printed 27/11/02 15:05
3-8
promotional expenditures will probably prove prohibitive” (Source: Datamonitor).
International Benchmarking: ready meals
3.18 The following are some benchmarks that the Thai food processing industry should belooking to achieve.
Table 3-5: Benchmarking of Average Thai Companies against Best Practice
Benchmark Thai Companiesvisited
Best Practice
Quality Control/Quality expenditure 10% 4.9%Marketing/Sales Exp. (% of gross sales) 1-2% Direct saleGross margin 13-22% 13.5 %Liquidity ratio 3.29 times 2.0 timesOperating cost/Total Cost 77-86% 60-80%Import tax for materials 12 –20% 5%(Vietnam)
Cost Structure and Competitiveness for Ready Meal Manufacturing
3.19 The accounts of some Thai ready meal companies show robust operations with gooddouble-digit gross margins from 1997 to 1999 ranging from 13% to 22%. This isabove average: competitors in the UK for example have gross margins of around13.5%. The Thai industry average, however, is only 8-9%, which is poor.
3.20 Comparing to the standard norms, companies spend too much money on appointingagents. These agents take certain amount of income from the bottom line rangingfrom 1 to 2% of gross sales. Modern companies sell directly to supermarkets withoutagents.
3.21 Procurement is a troublesome area for companies as they may buy small quantities ofmany items. Excessive diversification increases costs and hinders the overalloperation of companies.
3.22 Cost appears to be a problem for materials sourced from overseas, as import tax hasincreased from 12% to 20%. The import duty for some items in Vietnam, which isone of Thailand’s competitors in this industry, is only 5%. Furthermore, althoughimport tax can be refunded, the refund process is time-consuming. Thus, the increasein import duty and the delay in tax refund lower the company’s competitiveness.

NESDB - Cost Structures Thailand
BJ0346/Report/FinalLast printed 27/11/02 15:05
3-9
SWOT Analysis – ready meals
3.23 Table 3.6 summarises the strengths, weaknesses, opportunities and threats (SWOTanalysis) for the ready meals sector.
Table 3-6: SWOT analysis of Ready-to-Eat Meals
Strengths Weaknesses
• Companies are experienced exporters• Good management, engineers and skilled labour• Good quality products at competitive prices• Some firms with good gross margins• Capability to continuously upgrade itself
• Small domestic market;• Average poor margins• Lack of international brandnames: mainly
subcontract supply to international brand names orprivate labels.
• Many small companies with niche markets whichare disregarded by international distributors
• Lack of appropriate manpower training• Slow to adopt new processing techniques
Opportunities Threats
• Rapidly growing world market• Development of larger companies capable of
competing internationally• Sales to food services such as restaurants and deli
counters• Use of versatile equipment to produce a wide
range of recipes without additional investment anddevelop economies of scale
• Acquisitions by international brands to gainmarket share in high-end products
• Price wars in branded ranges (rather than ownlabels)
• Increasing number of international standards,certifications and labelling requirements to be met
• NAFTA member countries (mainly Mexico) ascompetitors in the US
• Countries with ACP status enjoy 16-24% tariffadvantage
Current and Future Competitive Challenges for Thai Ready-to-Eat MealsIndustry
3.24 As Thai people prefer to consume their food in fresh form, the processed foodindustry has to concentrate on the overseas market predominantly. The free-traderegime has honed the skill of the management, engineers, and skilled labour to adaptto international requirements. Thai industry has continually upgraded itself to producequality product at affordable prices. This is considered to be a distinct advantage ofthe processed food industry. The downside is that average gross margin attributed tothe industry cannot be impressive. It is usual to see single digit gross margins.
3.25 One of the many reasons that keeps the gross margin down to a single digit is the lackof international brand names in the most competitive markets. Almost all companiesproduce for private labels and international brand names. Although some firms havepurchased brands overseas (e.g. in 1989, Unicord Public Company purchased BumbleBee Seafoods). Other firms in the processed food industry have not embarked on this

NESDB - Cost Structures Thailand
BJ0346/Report/FinalLast printed 27/11/02 15:05
3-10
route to attain the elusive double digits gross margin. Thus, the high-end products arebeyond their reach.
3.26 The Thai Processed food industry consists of firms of medium size. There are fewSMEs co-existing in the industry. If any, they tend to be small companies that searchfor their niche market and not derivatives of big companies. In fact, it is difficult tooperate small companies to supply to the world. Large customers prefer to purchasefrom large companies so that they do not have to split total procurement into severallots. From the suppliers’ side, large companies are convenient in terms of largedeliveries of their products. In addition, the majority of the processed food industry,except for a few foreign owned companies, has been slow to adopt the new processingtechniques.
3.27 Whilst skilled labour is available widely in the industry, manpower training is perhapslacking in most factories. Workers are measured in terms of yield - X kilograms perworker per day - but they are put through the work without sufficient training in mostcases. Because the skill component is crucial, the food industry pays higher than theprevailing minimum wage.
3.28 In summary, the sector has considerable strengths, including good human resources(in contrast to many Thai industries). The main weakness is the lack of brands, thesmall size of companies, and threat from large branded manufacturers. This leads toreal weakness in marketing. One solution to this would be for marketing activities atcompanies to be centralised for each division (including outside ready to eat meals) topromote each other’s products and benefit from synergies. A possible way forward isto promote a small number of leading firms with strong export skills, who woulddevelop brands, and procure from many of the other smaller firms in the sector.
ELECTRONIC APPLIANCES
Exports of Electronics Products into Main Markets
3.29 Table 3-7 shows the main electronics exports by country into the main markets.Thailand is the 10th exporter of electronic goods and the Thai electronic industrycompetes mainly with China, Mexico, Taiwan, Korea, Singapore and Hong Kong,amongst others. Thailand provides a significant proportion of exports to NAFTA, andin this region, Thai industry has additional competitors including Canada, Malaysia,the Philippines and Indonesia. The competitiveness (i.e. export levels) of Thailandand each competitor for each main market separately (EU, NAFTA and Japan) isshowed in the table below.

NESDB - Cost Structures Thailand
BJ0346/Report/FinalLast printed 27/11/02 15:05
3-11
Table 3-7: 1998 Electronics Imports into Main Markets (Million US Dollars)
Industry All EU NAFTA Japan Industry All EU NAFTA Japan
United States 22,572 9,927 7,560 5,085 Mongolia 73 0 73 0Japan 12,275 3,931 8,344 India 68 58 3 7China 4,699 1,201 2,539 959 Pakistan 65 32 29 4Mexico 4,013 116 3,872 25 Vietnam 27 11 1 15Canada 2,449 368 1,975 106 Sri Lanka 25 7 3 15Taiwan 1,360 329 741 290 Argentina 17 11 6 0Korean Republic 1,247 225 550 472 Iran, Islamic Republic 7 7 0 0Singapore 1,136 279 654 203 Bangladesh 6 2 0 4Hong Kong 857 290 429 138 Colombia 4 3 1 0Thailand 770 200 324 246 Chile 4 4 0 0Malaysia 719 226 293 200 Venezuela 4 4 0 0Philippines 442 146 173 123 Brunei 4 4 0 0Indonesia 337 72 178 87 Macau 3 2 1 0Brazil 195 52 140 3 North Korea 1 0 1 0
Source: Compiled by WS Atkins using the World Trade Atlas Database for USA, Canada, Mexico and Japan and Eurostat database forcountries in the EU. Year end currency exchange rate was used for translation.
World Industry Trends: Electronic appliances - Hard Disks and OfficeAutomation Equipment
3.30 The total output of the electronic equipment and components industry was US$ 1,180billion in 1998 compared with US$ 1,133 billion in 1997, a growth of 4.1%.
3.31 The world computer (EDP) market, which grew by 8% in 1997, continued to bebuoyant in 1998 with a growth of 15.5%. Some of this increase may have been due tothe increasing trend to incorporate additional equipment into computers, particularlycommunications associated products such as modems. Lower growth of 3.9% wasforecast in 1999 as the market is affected by the trend to cheap “no frills” computerand modest growth is forecast for the next 3 years.
3.32 Production of electronic equipment and components was US$232 billion in 1998compared with US$218 billion in 1997 (see Table 3-8 for producing countries). Thisrepresents an increase of 6.4% in current dollars or a real growth of 6.0%. The fastestgrowing sector was again radio communications (incl. Mobiles) with a growth of13%. Component production increased by 8.2% and computer equipment by 4.8%.

NESDB - Cost Structures Thailand
BJ0346/Report/FinalLast printed 27/11/02 15:05
3-12
Table 3-8: Main Producing Countries of Electronic Equipment and Components
Country Production US$ million
USA 338,879Japan 268,473Germany 54,698China 49,268South Korea 47,594Singapore 44,946UK 42,251Taiwan 38,752Total Western Europe 250,734Total World 1,180,000
Source: Yearbook of World Electronics Data 98/99
3.33 The electronics sector is so diverse in the range of products manufactured, that itwould be extremely complex to list the main companies in each sub-sector. Ingeneral, large manufacturing companies have a wide range of electronic productsincluding computer hardware and automated office equipment.
3.34 Electronics are at the leading edge of a nation’s move toward a fully developedeconomy – service/knowledge-based- as it reinforces the nation’s strength. Computerhardware manufacturers are one of the fastest growing sectors of the electronicsmarket in both major and emerging markets. Their growth has been fuelled by thefollowing factors:
• Convergence of computers and telecommunications generates newtechnologies which drive markets to expand.
• Increasing household demand for computers to be used as communicationtools due to user-friendly computer programmes, lower costs and easy accessto the internet.
• Faster and better internet access due to improved data communicationssystems such as ISDN and cable networks.
3.35 The following are the main challenges faced by this industry:
• Continued improvement in productivity can only be achieved through R&D,capital investment, human resources investment and market development.
• Small players must recognise niche markets and capitalise on them.

NESDB - Cost Structures Thailand
BJ0346/Report/FinalLast printed 27/11/02 15:05
3-13
• Cooperative agreements between domestic and foreign companies.
• The need to become more efficient in its use of both energy and materialsparticularly through recycling of precious and toxic metals used andmanagement of toxic wastes produced in the manufacturing process.
International Benchmarking – electronic appliances
3.36 The following are some benchmarks that the Thai Electronics industry should belooking to achieve. Data is from company visits and interviews.
Table 3-9: Benchmarking of Thai Companies against Best Practice
Benchmark Thai Companies Best Practice
Claims Received 6 Per Month 2 Per MonthClaims Resolved 100% 100%Recruits Staying 1 Year 70% 98%Product Cost / Sales 72% 60%Invoices Paid within 60 days 85% 98%Maintenance Headcount 1% 2%Stock Turns 10 24% Rejection Rate 4% 0.5%Indirect Hours 24% 12%Average Age Equipment 4 Years 2 YearsCustomer Contact Time 6% 32%Inspection/Direct Labour 30% 6%Labour Turnover 14% 2%
3.37 The main problems of the Thai industry are seen to be:
• High levels of indirect labour and high labour turnover, yet low levels ofmaintenance manpower.
• High levels of complaints and rejects
• Low stock turnover – i.e. high levels of stocks
• Low levels of customer contact.
Cost Structure and Competitiveness for Hard Disk Part Manufacturing
3.38 Gross margins per unit are around 14%, which is good, but out of this selling and
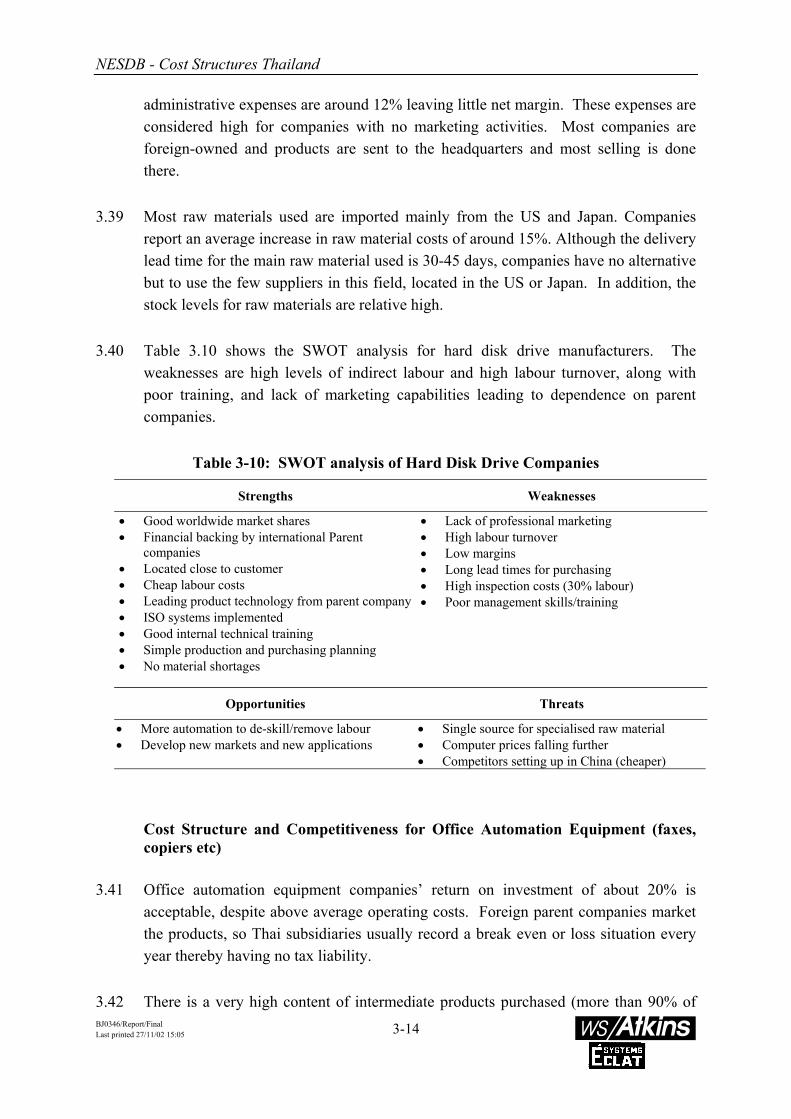
NESDB - Cost Structures Thailand
BJ0346/Report/FinalLast printed 27/11/02 15:05
3-14
administrative expenses are around 12% leaving little net margin. These expenses areconsidered high for companies with no marketing activities. Most companies areforeign-owned and products are sent to the headquarters and most selling is donethere.
3.39 Most raw materials used are imported mainly from the US and Japan. Companiesreport an average increase in raw material costs of around 15%. Although the deliverylead time for the main raw material used is 30-45 days, companies have no alternativebut to use the few suppliers in this field, located in the US or Japan. In addition, thestock levels for raw materials are relative high.
3.40 Table 3.10 shows the SWOT analysis for hard disk drive manufacturers. Theweaknesses are high levels of indirect labour and high labour turnover, along withpoor training, and lack of marketing capabilities leading to dependence on parentcompanies.
Table 3-10: SWOT analysis of Hard Disk Drive Companies
Strengths Weaknesses
• Good worldwide market shares• Financial backing by international Parent
companies• Located close to customer• Cheap labour costs• Leading product technology from parent company• ISO systems implemented• Good internal technical training• Simple production and purchasing planning• No material shortages
• Lack of professional marketing• High labour turnover• Low margins• Long lead times for purchasing• High inspection costs (30% labour)• Poor management skills/training
Opportunities Threats
• More automation to de-skill/remove labour• Develop new markets and new applications
• Single source for specialised raw material• Computer prices falling further• Competitors setting up in China (cheaper)
Cost Structure and Competitiveness for Office Automation Equipment (faxes,copiers etc)
3.41 Office automation equipment companies’ return on investment of about 20% isacceptable, despite above average operating costs. Foreign parent companies marketthe products, so Thai subsidiaries usually record a break even or loss situation everyyear thereby having no tax liability.
3.42 There is a very high content of intermediate products purchased (more than 90% of
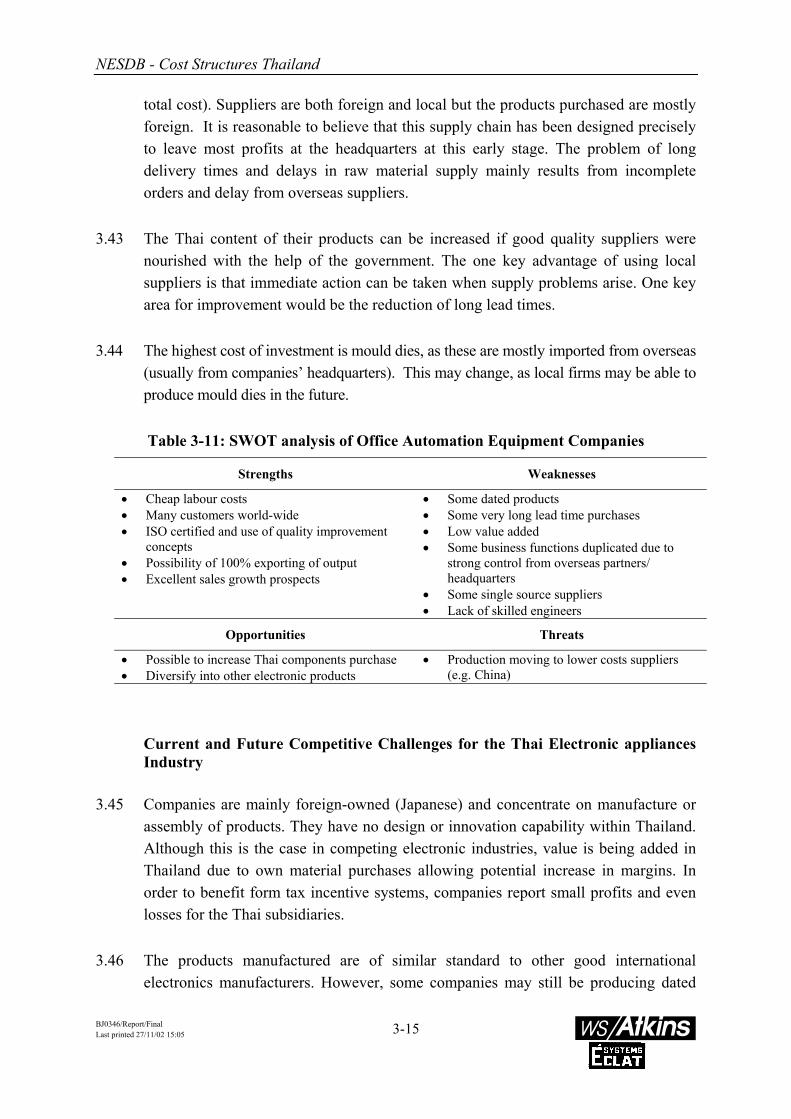
NESDB - Cost Structures Thailand
BJ0346/Report/FinalLast printed 27/11/02 15:05
3-15
total cost). Suppliers are both foreign and local but the products purchased are mostlyforeign. It is reasonable to believe that this supply chain has been designed preciselyto leave most profits at the headquarters at this early stage. The problem of longdelivery times and delays in raw material supply mainly results from incompleteorders and delay from overseas suppliers.
3.43 The Thai content of their products can be increased if good quality suppliers werenourished with the help of the government. The one key advantage of using localsuppliers is that immediate action can be taken when supply problems arise. One keyarea for improvement would be the reduction of long lead times.
3.44 The highest cost of investment is mould dies, as these are mostly imported from overseas(usually from companies’ headquarters). This may change, as local firms may be able toproduce mould dies in the future.
Table 3-11: SWOT analysis of Office Automation Equipment Companies
Strengths Weaknesses
• Cheap labour costs• Many customers world-wide• ISO certified and use of quality improvement
concepts• Possibility of 100% exporting of output• Excellent sales growth prospects
• Some dated products• Some very long lead time purchases• Low value added• Some business functions duplicated due to
strong control from overseas partners/headquarters
• Some single source suppliers• Lack of skilled engineers
Opportunities Threats
• Possible to increase Thai components purchase• Diversify into other electronic products
• Production moving to lower costs suppliers(e.g. China)
Current and Future Competitive Challenges for the Thai Electronic appliancesIndustry
3.45 Companies are mainly foreign-owned (Japanese) and concentrate on manufacture orassembly of products. They have no design or innovation capability within Thailand.Although this is the case in competing electronic industries, value is being added inThailand due to own material purchases allowing potential increase in margins. Inorder to benefit form tax incentive systems, companies report small profits and evenlosses for the Thai subsidiaries.
3.46 The products manufactured are of similar standard to other good internationalelectronics manufacturers. However, some companies may still be producing dated

NESDB - Cost Structures Thailand
BJ0346/Report/FinalLast printed 27/11/02 15:05
3-16
equipment (particularly fax and printer machines). Companies appeared to be poor onproduct costing and variance analysis.
3.47 The organisation structure of companies is dominated by foreign managers, andcompanies are poor at developing and training local managers.
3.48 The computer market they supply has been on a cost-down strategy for the last 20years. It appears that further reductions may have serious implications on theprofitability of Thai companies. They should consider using current skills andequipment to serve other market sectors as well as the computer industry. Companiesneed to consider ways of adding value to its products.
3.49 As the price of electronics equipment has steadily reduced, it is paramount for firmsto improve production efficiency. Thailand can be a prosperous HDD centre, if humanresources and R&D are nourished in order to improve productivity and reduce cost.
3.50 There appears to very little activity to develop and improve the supply chain ofcompanies although the material content can be as high as 90%. It is possible todevelop local suppliers to be based near these companies. This could reducetransportation costs and reduce lead times considerably. Government assistance wouldbe required to provide the investment and labour skill development.
GARMENTS INDUSTRY
Exports of Garments into Main Markets
3.51 Tables 3-12 and 3-13 show the main garment exports by country into the mainmarkets. Thailand is the 8th main exporter of knitwear and the 11th main exporter ofother garments. China is by far the main competitor in all main markets. Thailandprovides a high proportion of knitwear to NAFTA, as all other main competitorsincluding China, Mexico, Hong Kong, Korea, Bangladesh and Taiwan.

NESDB - Cost Structures Thailand
BJ0346/Report/FinalLast printed 27/11/02 15:05
3-17
Table 3-12: 1998 Knitwear Imports into Main Markets (Million US Dollars)
Industry All EU NAFTA Japan Industry All EU NAFTA Japan
China 8,376 1,888 2,192 4,296 Vietnam 192 62 14 116Mexico 3,334 8 3,309 17 Colombia 151 4 147 0Hong Kong 3,256 833 2,381 42 Burma 128 128 0Korean Republic 2,058 302 1,064 692 Brunei 120 0 120 0United States 1,929 190 1,474 265 Myanmar 40 40 0Bangladesh 1,860 653 1,203 4 Canada 38 20 3 15Taiwan 1,525 256 1,232 37 Laos 37 28 9 0Thailand 1,335 323 860 152 Maldives Islands 37 5 32 0India 1,100 540 547 13 Mongolia 33 3 23 7Indonesia 988 460 454 74 Bhutan 17 0 17Macau 898 230 649 19 Japan 17 16 1Phillipines 893 124 737 32 Brazil 12 11 0 1Pakistan 731 194 535 2 Nepal 7 6 0 1Malaysia 658 209 399 50 North Korea 3 1 0 2Sri Lanka 570 233 332 5 Iran, Islamic Republic 3 3 0 0Cambodia 425 91 333 1 Chile 3 1 2 0Singapore 328 55 266 7 Argentina 1 1 0 0
Source: Compiled by WS Atkins using the World Trade Atlas Database for USA, Canada, Mexico and Japan and Eurostat database forcountries in the EU. Year end currency exchange rate was used for translation.
Table 3-13: 1998 Other Garment Imports into Main Markets (Million US Dollars)
Industry All EU NAFTA Japan Industry All EU NAFTA Japan
China 12,817 2,672 4,165 5,980 Colombia 258 18 239 1Mexico 4,508 14 4,488 6 Bhutan 119 0 119Hong Kong 3,648 1,399 2,209 40 Singapore 90 13 75 2Bangladesh 2,713 740 1,962 11 North Korea 77 22 0 55India 2,116 801 1,242 73 Burma 69 67 2Indonesia 2,096 647 1,325 124 Myanmar 49 49 0United States 1,825 216 1,450 159 Canada 42 30 12 0Korean Republic 1,589 192 1,221 176 Japan 41 40 1Sri Lanka 1,285 264 1,014 7 Laos 40 35 5 0Phillipines 1,254 92 1,089 73 Mongolia 36 0 36 0Thailand 1,071 207 756 108 Maldives Islands 24 0 24 0Taiwan 826 87 718 21 Nepal 12 9 2 1Vietnam 716 378 44 294 Chile 7 1 6 0Cambodia 635 37 597 1 Brazil 7 5 0 2Macau 601 216 379 6 Brunei 2 0 2 0Malaysia 550 126 406 18 Argentina 1 1 0 0Pakistan 484 225 255 4 Iran, Islamic Republic 1 1 0 0
Source: Compiled by WS Atkins using the World Trade Atlas Database for USA, Canada, Mexico and Japan and Eurostat database forcountries in the EU. Year end currency exchange rate was used for translation.
3.52 It appears that Thailand is more competitive in knitwear than in other garments. Inaddition to the competitors listed above, Thailand must compete against thePhilippines, Sri Lanka and India. The competitiveness (i.e. export levels) of Thailandand each competitor for each main market separately (EU, NAFTA and Japan) isshowed in the tables.

NESDB - Cost Structures Thailand
BJ0346/Report/FinalLast printed 27/11/02 15:05
3-18
World Industry Trends: Knitwear and other Garments
3.53 In terms of value of total garment sales, the USA, India, China and Japan are the mostimportant consuming countries (See Table 3-14). Growth is expected to be highestfor China and later on high for Indonesia, Turkey and Brazil. The devaluation ofcurrencies throughout the developing world after 1997 helped to increase the export-competitiveness of many of these countries.
3.54 The garment and textiles industry remains relatively fragmented. Although there areseveral very well-known and important brands, these companies hardly play the samerole in the clothing industry as, for example, the top automotive manufacturers, andprocure from very many sources. On the one hand, because of the nature of theindustry and technology, there is vast scope for niche producers. Furthermore, in suchregions as Southeast Asia and Eastern Europe, the power of brand companies, such asLevis, etc., is undermined by product piracy. Major industry companies include:Levis Straus Associates Inc (US), Marks and Spencer (UK); Benetton Group (Italy),Industrias De Diseno Textil (Inditex) (Spain), Burton Group PLC (UK), Coats/Viyella(UK), Liz Claiborne (US). Most of these are marketing companies which procurefrom the lowest cost world suppliers for a given quality. They tend to stratifycountries according to quality: Thailand for example is considered lower quality thansome competitors.
Table 3-14: Clothing Markets - Value of Sales by Selected Countries(US$ Million)
Country 1999 2002f 2005f
USA 122,366 127,268 130,000Japan 81,645 86,609 89,507China 51,511 65,447 79,269India 20,156 21,536 23,086Vietnam 9,341 10,075 10,881Brazil 9,161 9,871 10,629Canada 6,127 6,480 6,811South Africa 5,648 6,420 6,917Mexico 3,656 4,060 4,462Taiwan 3,553 3,996 4,397Argentina 2,223 2,411 2,579Israel 2,220 2,386 2,551Colombia 2,158 2,346 2,545Indonesia 1,783 1,908 2,134Hong Kong 611 619 623Venezuala 607 707 826Turkey 486 527 569Source: Euromonitor.

NESDB - Cost Structures Thailand
BJ0346/Report/FinalLast printed 27/11/02 15:05
3-19
Sector Trends - Garments
3.55 According to EIU forecasts, global consumption of garments will grow at around 2%per annum from 2000-2005. Growth in demand for clothing is driven by growth inconsumer spending as a whole but it is also highly cyclical, as spending on clothingtends to grow at a faster rate during boom times and can decline sharply duringrecessions.
3.56 As a total of consumers' expenditure, clothing tends to decline in the most developedmarkets. For example, while in China, Russia and Poland clothing purchasesrepresent from 10-12% of consumer spending, in Canada and Taiwan, it representsless than 5% (See Table 3-15)
3.57 Within Europe, the dominant trend in the past decade has been the rise of low costimports from the Middle East and Asia. However, a contrary trend is also apparent:there has also been solid demand for very high-quality, more individual clothes,especially in such countries as Italy and the UK.
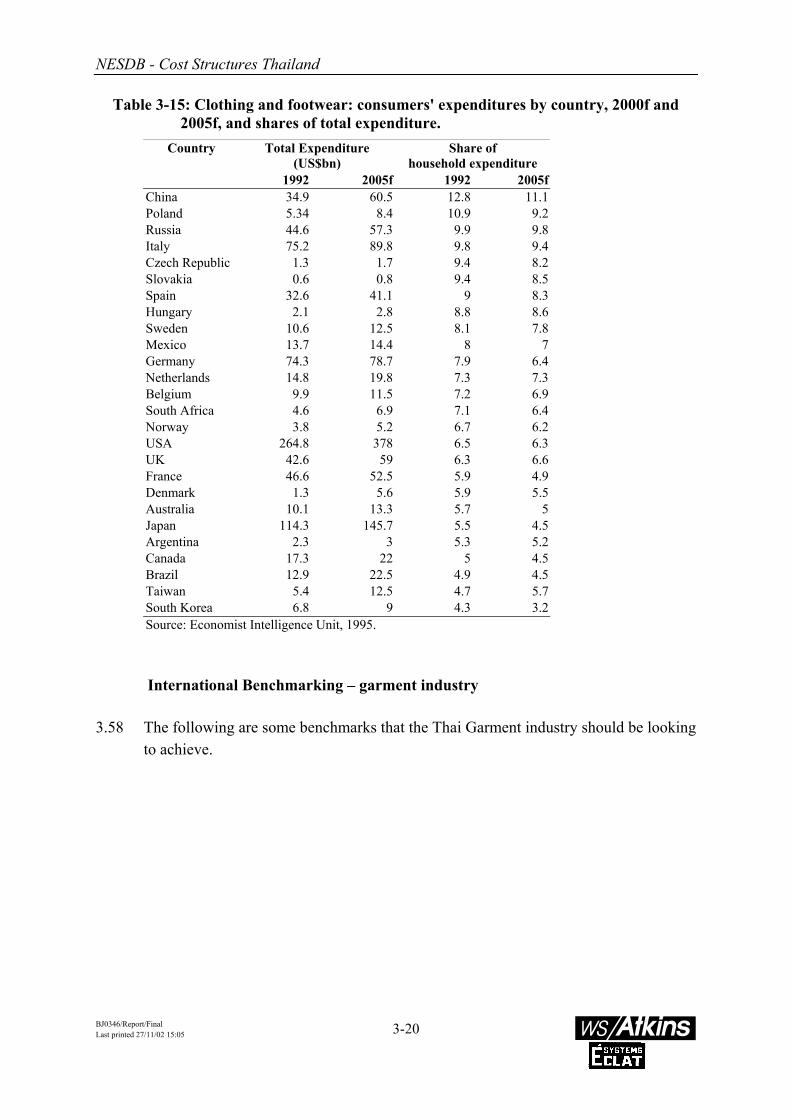
NESDB - Cost Structures Thailand
BJ0346/Report/FinalLast printed 27/11/02 15:05
3-20
Table 3-15: Clothing and footwear: consumers' expenditures by country, 2000f and2005f, and shares of total expenditure.
Country Total Expenditure(US$bn)
Share ofhousehold expenditure
1992 2005f 1992 2005fChina 34.9 60.5 12.8 11.1Poland 5.34 8.4 10.9 9.2Russia 44.6 57.3 9.9 9.8Italy 75.2 89.8 9.8 9.4Czech Republic 1.3 1.7 9.4 8.2Slovakia 0.6 0.8 9.4 8.5Spain 32.6 41.1 9 8.3Hungary 2.1 2.8 8.8 8.6Sweden 10.6 12.5 8.1 7.8Mexico 13.7 14.4 8 7Germany 74.3 78.7 7.9 6.4Netherlands 14.8 19.8 7.3 7.3Belgium 9.9 11.5 7.2 6.9South Africa 4.6 6.9 7.1 6.4Norway 3.8 5.2 6.7 6.2USA 264.8 378 6.5 6.3UK 42.6 59 6.3 6.6France 46.6 52.5 5.9 4.9Denmark 1.3 5.6 5.9 5.5Australia 10.1 13.3 5.7 5Japan 114.3 145.7 5.5 4.5Argentina 2.3 3 5.3 5.2Canada 17.3 22 5 4.5Brazil 12.9 22.5 4.9 4.5Taiwan 5.4 12.5 4.7 5.7South Korea 6.8 9 4.3 3.2Source: Economist Intelligence Unit, 1995.
International Benchmarking – garment industry
3.58 The following are some benchmarks that the Thai Garment industry should be lookingto achieve.

NESDB - Cost Structures Thailand
BJ0346/Report/FinalLast printed 27/11/02 15:05
3-21
Table 3-16: Benchmarking of Average Thai Companies against Best Practice
Benchmark Thai Companies Best Practice
Efficiency 35% to 52% 85%Lead Time (Manufacture to despatch) 15 to 20 days 5 daysFabric Lead Time 45 to 60 days 15 daysRejects (% of finished product) 0.0% 0.1%Ratio of indirect to direct labour (Manfg) 1 : 1 1 : 20On time delivery 100% 100%Order fulfilment% 90% 100%Operation skills per operator 1-2 skills 5 to 6 skillsDirect labour excesses 65% to 45% 65% to 45%Marker Utilisation 85-90% 88% - 90%Standard minutes per Unit• Trousers 42 29• Shirts 32 19• Sportswear 12 6World-wide competitive cost Not applicable $0.05 to $0.10
3.59 Thai companies fall very far behind best practice in almost all indicators ofproductivity. Indirect labour is extremely high, manufacturing efficiency is very low,and standard times are high. This is partly because labour skills are low.
Cost Structure and Competitiveness for Garment Manufacturing
3.60 The low efficiency and low productivity are the main cost problems for the sector.This is not serious yet, as labour costs are very low, but it will become increasinglydifficult for Thailand to compete with low labour cost countries unless efficiency andproductivity are improved. At present, companies charge international competitiverates for their products, but they are often manufacturing at a loss. A major problem isthe lack of proper costing systems: their costing mechanisms do not properly takeaccount of overheads and can lead to over- or under-pricing.
3.61 Companies tend to supply a ‘Full Package’ garment, where the contractor isresponsible for the purchase and supply of all raw material and technical input, withthe exception of design. The ability to purchase/supply raw material for customersorders is a competitive advantage over many companies operating from North Africa,the Middle East, and Eastern Europe. These companies often do not have good accessto the supply chain or do not have the capital/ability to fund large raw materialpurchases, and therefore are at some disadvantage on maximising margins.
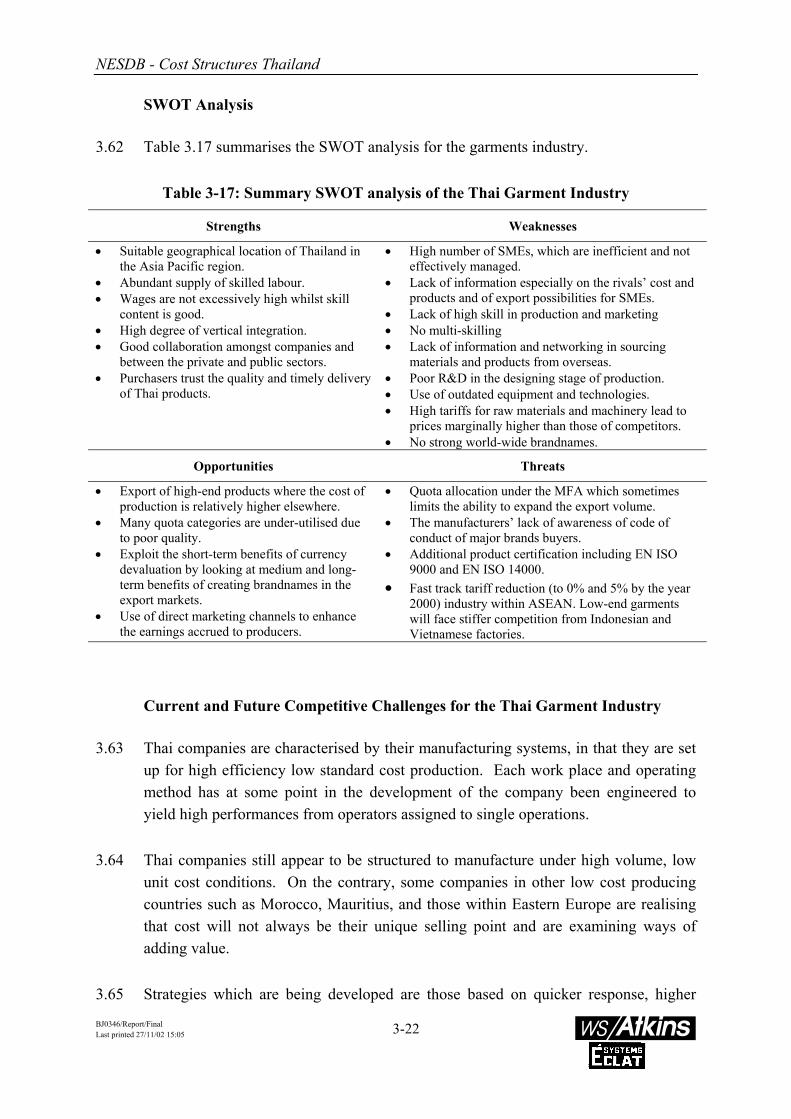
NESDB - Cost Structures Thailand
BJ0346/Report/FinalLast printed 27/11/02 15:05
3-22
SWOT Analysis
3.62 Table 3.17 summarises the SWOT analysis for the garments industry.
Table 3-17: Summary SWOT analysis of the Thai Garment Industry
Strengths Weaknesses
• Suitable geographical location of Thailand inthe Asia Pacific region.
• Abundant supply of skilled labour.• Wages are not excessively high whilst skill
content is good.• High degree of vertical integration.• Good collaboration amongst companies and
between the private and public sectors.• Purchasers trust the quality and timely delivery
of Thai products.
• High number of SMEs, which are inefficient and noteffectively managed.
• Lack of information especially on the rivals’ cost andproducts and of export possibilities for SMEs.
• Lack of high skill in production and marketing• No multi-skilling• Lack of information and networking in sourcing
materials and products from overseas.• Poor R&D in the designing stage of production.• Use of outdated equipment and technologies.• High tariffs for raw materials and machinery lead to
prices marginally higher than those of competitors.• No strong world-wide brandnames.
Opportunities Threats
• Export of high-end products where the cost ofproduction is relatively higher elsewhere.
• Many quota categories are under-utilised dueto poor quality.
• Exploit the short-term benefits of currencydevaluation by looking at medium and long-term benefits of creating brandnames in theexport markets.
• Use of direct marketing channels to enhancethe earnings accrued to producers.
• Quota allocation under the MFA which sometimeslimits the ability to expand the export volume.
• The manufacturers’ lack of awareness of code ofconduct of major brands buyers.
• Additional product certification including EN ISO9000 and EN ISO 14000.
• Fast track tariff reduction (to 0% and 5% by the year2000) industry within ASEAN. Low-end garmentswill face stiffer competition from Indonesian andVietnamese factories.
Current and Future Competitive Challenges for the Thai Garment Industry
3.63 Thai companies are characterised by their manufacturing systems, in that they are setup for high efficiency low standard cost production. Each work place and operatingmethod has at some point in the development of the company been engineered toyield high performances from operators assigned to single operations.
3.64 Thai companies still appear to be structured to manufacture under high volume, lowunit cost conditions. On the contrary, some companies in other low cost producingcountries such as Morocco, Mauritius, and those within Eastern Europe are realisingthat cost will not always be their unique selling point and are examining ways ofadding value.
3.65 Strategies which are being developed are those based on quicker response, higher
NESDB - Cost Structures Thailand
BJ0346/Report/FinalLast printed 27/11/02 15:05
3-23
flexibility, design and branding, partnerships and joint ventures (both with customersand suppliers) and the introduction of state of the art information technology.Successful companies must therefore implement new technology as it becomesavailable, but more importantly, they must optimise human resources.
3.66 The vision for garment manufacturing is that companies must move towards highlyflexible, fast, responsive manufacturing configurations. These configurations will beset up towards zero, highly customised and extremely fast production.
3.67 There is now a greater awareness and perception of environmental issues and thesewill continue to strengthen over the next few years. Many of the major European (andsome American) retailers are using the environment as a selling mechanism bypromoting environmentally friendly processing. In Europe where legislation willsoon be passed banning the use of certain processes in the production of fabric,particularly dyeing and finishing. The standard that will be imposed is Oeko-Tex, andcurrently is only a voluntary scheme. It has however been adopted by majorEuropean retailers, and all their swing tickets and product labels now state that theyconform to this standard.
3.68 Other issues which will continue to affect the competitive element will be theincreasing demands placed on ethical trading and compliance to Westernmanufacturing standards on health and safety and employment conditions.
AUTOMOTIVE PRESSED METAL PARTS
Exports of Automotive Pressed Metal Parts into Main Markets
3.69 Tables 3-18 shows the main automotive pressed metal parts exports by country intothe main markets. Mexico, China, Taiwan and Korea are in a different league toThailand, due to the large volumes provided to the main markets. Competitors withcloser volumes to those supplied by Thai industry are Thailand, Singapore, Malaysiaand the Philippines. The competitiveness (i.e. export levels) of Thailand and eachcompetitor for each main market separately (EU, Nafta and Japan) is showed in thetable below.

NESDB - Cost Structures Thailand
BJ0346/Report/FinalLast printed 27/11/02 15:05
3-24
Table 3-18: 1998 Automotive Imports into Main Markets (Million US Dollars)
Industry All EU NAFTA Japan Industry All EU NAFTA Japan
United States 196,285 53,046 122,184 21,055 Venezuela 237 36 201 0Japan 147,421 40,541 106,880 North Korea 117 11 90 16Canada 89,999 3,051 86,418 530 Chile 90 15 75 0Mexico 74,376 1,270 72,718 388 Sri Lanka 77 46 14 17China 47,171 10,152 28,749 8,270 Macau 65 31 33 1Taiwan 41,374 10,245 24,475 6,654 Colombia 43 24 19 0Korean Republic 38,149 8,307 24,550 5,292 Iran, Islamic Republic 33 31 2 0Singapore 30,627 8,052 15,814 6,761 Bangladesh 26 20 0 6Malaysia 30,189 6,751 18,681 4,757 Pakistan 26 26 0 0Philippines 14,866 2,687 9,202 2,977 Brunei 10 10 0 0Thailand 12,855 3,071 6,747 3,037 Burma 3 2 1Hong Kong 6,141 2,818 2,627 696 Laos 2 2 0 0Indonesia 4,446 893 2,419 1,134 Myanmar 2 2 0Brazil 4,434 1,420 2,974 40 Afganistan 2 0 2India 1,257 664 554 39 Mongolia 1 0 1 0Argentina 249 133 112 4 Nepal 1 1 0 0Vietnam 244 63 15 166 Bhutan 1 0 1
Source: Compiled by WS Atkins using the World Trade Atlas Database for USA, Canada, Mexico and Japan and Eurostat database forcountries in the EU. Year end currency exchange rate was used for translation.
World Industry Trends: Automotive Metal Parts – Pressed
3.70 The market for replacement car parts is relatively mature and shows little growth.With the main players – at both the manufacturer and distributor level – trying toincrease their share of the market and their profitability, competition is intense.Motor vehicles parts main importers are USA, Canada, Germany, UK, Benelux,France and Mexico and the main exporters USA, Germany, Japan, France, Canada,Italy and UK. (International Trade Statistics Yearbook – United Nations – Vol IITrade by Commodity)
3.71 In the case of filters, the fuel filter market segment is set to grow, but improvedquality and longer service intervals are negatively impacting the sales of oil and airfilters. (European Car Filters 2000 Datamonitor). The main car filter manufacturersare Filtrauto, Mann & Hummel, Fram/Fiaam, and Mahle/Knecht. Leading playerssuch as Champion and Quinton Hazell have recently been subsumed within largerautomotive component groups. Developments in the automotive filters segment areoverwhelmingly dominated by environmental considerations. Key developmentsinclude the creation of filters with the potential to optimise the air fuel mixture inorder to improve fuel consumption and to reduce emissions (e.g. Knecht/Mahleoptimising filter). Similarly, filters have been developed where only the insert ischanged (e.g. Mahle eco-inserts).

NESDB - Cost Structures Thailand
BJ0346/Report/FinalLast printed 27/11/02 15:05
3-25
3.72 Overall the key trends affecting the automotive components sector are as follows:
• The globalisation of components operations in line with the globalisation ofthe automotive industry.
• The restructuring of operations to ensure greater efficiency. This includes theintroduction of measures to improve profitability, the reorganisation ofmanagement structures to take account of the increasing demand for globalsupply and increased focus on areas of core competence.
• A rapidly increasing requirement for components suppliers to supply acomplete systems capability.
• An increase in the positioning of sub-assembly plants adjacent to vehiclefactories due to the above mentioned need to offer a systems capability as wellas an increased requirement for just in time deliveries and flexibility inproduction runs.
• The rapid consolidation of the components sector through take-overs andmergers.
• An increased number of technical alliances and joint ventures.
• The creation of a network of super-suppliers who are expected to dominate theglobal automotive components market in the next century.
International Benchmarking
3.73 In Thailand, current annual estimate of new motor vehicle production is close to300,000 units (220,000 units were produced in the first 7 months of 2000). Highannual growth levels (35%) are expected in the key automotive sector up to 2003,according to sources such as the Economist Intelligence Unit. Thus, with such stronggrowth prospects, Thai industry should drive itself to achieve best practice standards.The following are some benchmarks that the Thai Automotive Parts industry shouldbe looking to achieve.

NESDB - Cost Structures Thailand
BJ0346/Report/FinalLast printed 27/11/02 15:05
3-26
Table 3-19: Benchmarking of Average Thai Companies against Best PracticeBenchmark Thai Pressed Metal
Part CompaniesThai FilterCompanies
Best Practice
Stock turns (for OEM customer) 11:1 Not applicable 15:1Stock turns (for aftermarket) Not applicable 4:1 12:1Lead time (manufacture) 3 days 2-3 days <24 hrsTool Change time 7-10 minutes 20-30 minutes <10 minutesCustomer Rejects Approx. 1% <1% 0On time delivery Approx. 97% Approx. 70% 100%Absenteeism 6% 3% <1%Productivity (value added peremployee)
$12,181 $16,624 >$60,000
3.74 Best practice is not the best achieved by any one company but the high standards thatworld class companies are setting themselves. The main problem of Thai companiesis low productivity of labour.
Cost Structure and Competitiveness for Automotive Pressed Metal Parts
3.75 The products manufactured are of a standard similar to other good internationalmanufacturers, but companies have very high standard costs per unit – even thosecompanies manufacturing high-margin products. Margins per unit are low (12%-20%). They are unable to increase margins because they work on a sub-contract basiswhere the customer controls their costs and pays on a cost-plus basis. Companies usea universally-accepted cost system determined by the customer, that is the same forthe customer’s suppliers any where in the world. This costing system is subject to therequirements of individual customers. For example, Japanese customers fix the costfor the company, and some others do not allow any margin on raw material costs. Inaddition, 80% of customers own the tooling, because the ownership of the tool givesthe customer the freedom to change sub-contractors.
3.76 Throughout most of the automobile industry there is a cost down culture that requiressuppliers to annually decrease their costs. In some instances the price paid for theproduct is based on costs plus a percentage. This is being applied in Thailand by someOEMs but it has made little difference to working practices when compared toJapanese or Western companies.
3.77 Manning levels are much higher than one would expect elsewhere and asset utilisationis low. There is also tolerance of poor service from local suppliers that leavecompanies with additional costs. The value adding process of companies can also beseverely constrained by the need to buy overseas materials, particularly from Japanand to sell them locally. They can be caught between high cost material and low cost

NESDB - Cost Structures Thailand
BJ0346/Report/FinalLast printed 27/11/02 15:05
3-27
buyers.
SWOT Analysis
3.78 The SWOT analysis for pressed metal autoparts is summarised in table 3.20.
Table 3-20. Summary SWOT analysis of the Thai Pressed Metal Auto Parts Industry
Strengths Weaknesses
• Modern equipment.• Good relationship with OEMs.• Good support from Joint Venture partners.• Some high margin products.• Strong presence in the after-market sector.• Local stockists can supply steel.• Brands being developed.
• A high percentage of raw materials have long leadtimes.
• Workforce not well educated or experienced.• Lack of shop-floor involvement.• Over-manning.• Limited production management expertise.• Some critical raw materials supplies from overseas.• High inventory levels.• Poor customer service.• Domestic market saturated.
Opportunities Threats
• Overseas OEMs.• Growing after-market.• Large export market.•
• Dependency on local OEMs.• New Japanese competition about to enter Thailand.• Development of car industries in developing
countries.• Pirate products.
Current and Future Competitive Challenges for the Thai Auto Parts Industry
3.79 Local parts manufacturers (around 600 firms) will increasingly compete for orders bylocal assembly plants. There are some concerns over the cancellation of local contentrequirements in the year 2000, the slowdown of the automotive industry, theincreasing price trend of domestic raw material price and high import tariffs. In thelong term, Thai automobile assembly expects to reach 600,000 units during the nextfive years (2004). If so, it will have a positive impact on automotive parts then.
3.80 Industries appear to manufacture products with lower value added per employee thanworld standards, which indicates high levels of over manning. In addition, companieshave very high standard costs per unit, although some do manufacture high-marginproducts. It appears that companies can increase their output and capacity utilisationsubstantially, without investing in new equipment, which would improve unit costs.
3.81 Speed of production is directly related to work in progress, working capital and oftenservice levels. As much time is spent on waiting, the cost of production increases.This is due to inefficient suppliers, and transport problems, and as a result service

NESDB - Cost Structures Thailand
BJ0346/Report/FinalLast printed 27/11/02 15:05
3-28
levels are not as good as they could be. Thai companies already subcontract some ofproduction activities, and best practice companies would like to sub-contract morework to improve manufacturing efficiency, but are unable to do so as this extendsmanufacturing time with all of the problems mentioned above.
3.82 The heavy dependency of companies on the domestic market would indicate that theirgrowth would depend directly upon the health of the Thai economy and the marketsof the local OEMs. They have to compete with world suppliers, however. Innovativeproduct design in the automotive component industry is a particularly importantcompetitive factor: new designs are often only required when the OEM designs atotally new vehicle, and is driven by the OEMs themselves. Innovation is howeverapplied in production processes, management processes and supply chainmanagement. This is often cost or service driven and Thai companies will need toinvest sufficiently in R&D to keep improving their processes and remain competitive.
3.83 Companies could benefit from some investment in marketing, particularly for exportwhere early sales have been made through customers approaching the companies.
PLASTIC PRODUCTS
Exports of plastic products into main markets
3.84 Table 3-21 shows the main plastic exports by country into the main markets.Thailand appears to be the 8th exporter in terms of value of exports after China,Taiwan, Korea and Mexico. Mexico and China are strong in the NAFTA markets.Thailand exports a higher volume of plastics that the other ASEAN-4 economies(Indonesia, Malaysia, and the Philippines). The competitiveness (i.e. export levels) ofThailand and each competitor for each main market separately (EU, NAFTA andJapan) is showed in the table below.

NESDB - Cost Structures Thailand
BJ0346/Report/FinalLast printed 27/11/02 15:05
3-29
Table 3-21: 1998 Plastic Products Imports into Main Markets (Million US Dollars)
Exporter All EU NAFTA Japan Exporter All EU NAFTA Japan
United States 18,019 3,407 13,374 1,238 Singapore 198 67 46 85Canada 5,911 130 5,744 37 Philippines 102 15 31 56China 4,720 1,355 2,720 645 Colombia 73 7 66 0Japan 2,649 850 1,799 0 Brazil 69 55 13 1Taiwan 1,909 390 1,024 495 Venezuela 44 27 17 0Korean Republic 1,515 390 630 495 Argentina 31 3 28 0Mexico 1,129 51 1,048 30 Vietnam 25 16 1 8Thailand 516 171 150 195 Sri Lanka 19 5 8 6Indonesia 333 119 97 117 North Korea 11 1 10 0Malaysia 278 129 9 140 Chile 8 2 4 2Hong Kong 248 102 130 16 Pakistan 5 2 3 0India 198 93 103 2 Bangladesh 1 1 0 0
Source: Compiled by WS Atkins using the World Trade Atlas Database for USA, Canada, Mexico and Japan and Eurostatdatabase for countries in the EU. Year end currency exchange rate was used for translation.
World Industry Trends: Plastics – Engineering and Household plastic products
3.85 This paragraph gives an indication of the size and trends in markets for plasticproducts, by way of data on the trade in the raw material plastic resins. The market forengineering plastics is worth approximately £7 billion (Chemical and EngineeringNews, Oct. 5 1998). The US, Japan and Germany are by far the largest producers andconsumers of plastic resins – the raw material for plastic products (see Table 3-22.).The fastest growing markets – i.e. producers of plastic products - are in EasternEurope (i.e. Hungary) and South America (i.e. Brazil). The supply of engineeringplastic resins is dominated by six very large companies who together account for over60% of the market (see table 3-23).
Table 3-22: Main Engineering Plastic Resins Manufacturers
Name of company Market shareGE Plastics 22DuPont 12Ticona 11Bayer 9BASF 5Mitsubishi Gas 4Other 37Source: Chemical & Engineering News-Oct 98

NESDB - Cost Structures Thailand
BJ0346/Report/FinalLast printed 27/11/02 15:05
3-30
Table 3-23: Production and Consumption of Plastic Materials 1997
1997 Production (Kt) %change
96/97
1997 Consumption (Kt) %change
96/97
USA 42119 5.4 38923 2.5Japan 15209 3.7 12264 3.7Germany 11858 9.2 9895 7.3France 5800 9.2 4483 9.7Belgium 4400 2.3 1597 8.6Italy 3740 4.3 5810 7.4Canada 3508 2.9 2888 5.6UK 3046 3 4407 4.9Brazil 2988 9.4 2950 10.3Spain 2949 11.2 3181 9.8Malaysia 950 35.7 1000 5.3Hungary 828 14 539 21.2Israel 465 22 601 7.3Slovenia 155 20.3 175 -1.2
Source: IPAD
Sector Trends – plastic products
3.86 The markets for plastic products are growing worldwide, as plastic products substitutefor many other materials – particularly metals and timber – in many applications,including construction and vehicle manufacture. This is accompanied by an increasein the use of high specification and high performance plastics, particularlyengineering plastics. Engineering plastics are particularly used in the automotiveindustry, and provide greater durability, lower vehicle weight and manufacturingefficiency, often replacing vehicle components formerly made of metal. Consideringthe advantages that plastics have in the area of cost, manufacturing efficiency,durability, weight and recyclability, it is expected that an all-plastic car ultimately willbe produced by an original equipment manufacturer, opening huge markets forengineering plastics manufacturers.
International Benchmarking
3.87 The following are some benchmarks that the Thai Plastic industry should be lookingto achieve.

NESDB - Cost Structures Thailand
BJ0346/Report/FinalLast printed 27/11/02 15:05
3-31
Table 3-24: Benchmarking of Average Thai Plastic Moulding Companies against BestPractice
Benchmark Thai Companies Best Practice
Number of employees 288-337 staff 250-300 staffCapacity utilisation 40-85% 60-85%Customer order to delivery 15-30 days Up to 30 daysDelivery time of raw materials 2-90 days Average 7 daysStocks of raw materials Up to 38 days Max 20% of raw materials needed
for 60-90 daysStocks of finished goods 15-56 days Up to 30 daysTypical injection run length Too short (e.g. 2 days) Depends on tool set up time and
urgency in productionProduct defect 2.47%-3% 1%Scrap rate 0.5-5% Max. 1-2%
3.88 In many firms, performance is comparable to best practice, but there is wide variation.In general reject and scrap rates are too high, and production runs too short to becompetitive.
Cost Structure and Competitiveness of Plastics (injection moulding)manufacturing
3.89 Companies enjoy very low labour costs. However, raw material costs are aroundwestern levels and power charges are higher than western. The plastics industryworld-wide aims at a gross margin of at least 50%. Product costings in the industryreveal very low gross margins, sometimes barely acceptable. It appears thatcompanies should overhaul their pricing estimation methods. We estimated that somecompanies would have to charge more for their products (up to 50% in some cases) tobe worth accepting the order. Ultimately, the market dictates the sale price thus theonly alternative for survival is cost reduction. A move upmarket would of course helpmargins if this were really possible.
SWOT Analysis
3.90 Table 3.25 summarises the SWOT analysis for plastic products.

NESDB - Cost Structures Thailand
BJ0346/Report/FinalLast printed 27/11/02 15:05
3-32
Table 3-25: Summary SWOT analysis of the Thai Plastic Products Industry
Strengths Weaknesses
• Spare capacity.• Quality certification for specific markets (e.g.
UL listing for exporting to the US).
• Lack of mould making technology in Thailand.• High production costs, resulting from small orders
and therefore higher set-up costs.• High raw material costs• High working capital, due to paying cash for
materials, but sales on 60 days credit terms.• wide variety of products, and lack of specialisation
leading to rather high losses.• Specialty and some other resins have to be imported.
Opportunities Threats
• The number of competitors is decreasing dueto harsh economic conditions. This is afavourable trend for the expansion of Thaicompanies’ customer base, both domesticallyand abroad.
• Increased substitution of plastic material forother substances.
• Downstream integration of pellet and resinmanufacturers into moulding.
• The cancellation of Local Content regulations in theyear 2000
• slowdowns in the automotive industry• high prices for domestic raw materials• high import duties for raw materials• price-cutting by competitors to get work.• technology development of materials and conversion
processes is based firmly in Northern and CentralEurope.
Current and Future Competitive Challenges for the Thai Plastics Industry
3.91 Plastic injection moulding in Thailand has already started to follow the Europeanevolution. In this evolution, Thai best practice injection moulding is probablysomewhere around the 1970's "state of the art".
3.92 In the 1970's, European moulding speeds increased. Multi-cavity tooling for smallcomponents became common. Considerable attention was paid to finished producthandling methods and reduction in manual finishing methods to reduce labour costs.Specialisms by product or industry continued.
3.93 It appears that Thai companies need to catch up with competitors world-wide whichhave evolved even further since then. Indeed, since the 1980's, the material rangeused in Europe increased. Labour cost reduction and recycling of in-company wasteand ex-consumer waste became important. Robot moulding extraction wasintroduced. Machines became more dedicated, faster, more efficient and product-consistent. Statistical process control methods became common for product quality.Specialist machines were introduced that could mould a component in more than onematerial, e.g. a transparent panel but with a strong opaque edge. The concept of the"contractual inter-face" being shifted towards the injection moulder was introduced by
NESDB - Cost Structures Thailand
BJ0346/Report/FinalLast printed 27/11/02 15:05
3-33
automotive industry customers.
3.94 It is likely that the average company in the industry is somewhat typical of evenearlier stages. In the 1960's, for example, plastics companies split into separateprocesses of which injection moulding is a major element. When mouldings wereproduced for engineering companies, difficulties were common as sufficient qualitycould not be obtained from tools owned by the customer. Multi-cavity injectionmoulding, where several components are moulded simultaneously, became commonand was followed by "hot runner" tooling (where the feed lines to each component areleft permanently liquid inside the tool). As a result, injection moulding companiessplit into various specialisms, such as big slow mouldings, small fast mouldings, uni-material, uni-product, uni-industry (such as food or pharmaceuticals or health care) orown products (like toys or houseware). Some remained as "trade-moulders"supplying specialist parts in any material and becoming heavily involved in tooldesign. Tool making that was integrated into a moulding operation or under the samecompany ownership ceased to be viable.
3.95 To summarise, the future development of the plastic industry requires mould-makingtechnology, compounding and blending process. As Thailand has no indigenoustechnology, the industry must rely on imported technologies which are expensive.There have been many joint ventures with foreign technological know-how as ameans to sourcing these expensive technologies. As technological transfer is far fromcomplete, this results in an inherent technological void in the industry which must beovercome.
RUBBER GOODS
Exports of Rubber into Main Markets
3.96 Table 3-26 shows the main rubber exports by country into the main markets.Thailand appears to be the 5th exporter. The export value of Thai rubber is quitesimilar to that of the Malaysian industry, although Thai exports have a larger share ofthe Japanese market and Malaysian exports of the EU market. Indonesia is also aclose competitor but the Philippines export little in terms of rubber products. Thecompetitiveness (i.e. export levels) of Thailand and each competitor for each mainmarket separately (EU, Nafta and Japan) is showed in the table below.

NESDB - Cost Structures Thailand
BJ0346/Report/FinalLast printed 27/11/02 15:05
3-34
Table 3-26: 1998 Rubber Imports into Main Markets (Million US Dollars)
Industry All EU NAFTA Japan Industry All EU NAFTA Japan
United States 5,229 1,031 3,862 336 Singapore 155 70 76 9Japan 2,912 940 1,972 India 112 36 75 1Canada 2,273 35 2,224 14 Argentina 58 12 46 0Malaysia 1,353 549 686 118 Venezuela 45 1 44 0Thailand 1,265 340 506 419 Vietnam 32 21 5 6Indonesia 940 235 569 136 Philippines 30 9 0 21Korean Republic 939 390 489 60 Chile 28 0 28 0Taiwan 612 173 381 58 Hong Kong 10 9 0 1Mexico 558 38 519 1 Cambodia 5 4 1 0Brazil 362 79 278 5 Iran, Islamic Republic 4 4 0 0China 186 117 10 59 Pakistan 2 2 0 0Sri Lanka 166 87 69 10 North Korea 1 0 1 0
Source: Compiled by WS Atkins using the World Trade Atlas Database for USA, Canada, Mexico and Japan and Eurostatdatabase for countries in the EU. Year end currency exchange rate was used for translation.
World Industry Trends: Rubber products – Tyres and Latex Gloves
Tyres
3.97 The world tyre industry is worth $50 billion a year, representing a production ofapproximately 700 million units (in year 2000). Main importers of rubber tyres andtubes are USA, Germany, UK, France, Italy and Netherlands; main exporters areJapan, France, Germany USA, Korea, UK and Spain. Big 5 group dominate theindustry but they are increasingly being challenged from manufacturers fromemerging countries (South Korea, India and China). Main manufacturers of tyres areGoodyear (acquired Sumitomo Rubber Industries in 1999), Michelin, Bridgestone,Continental, and Pirelli.
3.98 Mergers and acquisitions, which have already been increasing in recent years, wereparticularly important during 1998. Asia’s economic turmoil, global over-capacityand poor prospects for growth have forced companies in many industries into mergerand acquisition deals. Mergers in the tyre industry give benefits from economies ofscale, increased market share, brand recognition and reduced competition. TheGoodyear/Sumitomo alliance will give the former better access to the Japanesemarket and strengthen the latter’s financial position. The Economic Intelligence Unitforecasts further rationalisation of the branded world tyre industry.
3.99 Tyre companies have been faced with cost-cutting programmes in an over-suppliedindustry. They have been squeezed by the car industry to reduce costs, while makingbetter and safer tyres. For the Japanese manufacturers, the trend towards increasingexport volumes and production overseas has forced them into alliances to avoid the

NESDB - Cost Structures Thailand
BJ0346/Report/FinalLast printed 27/11/02 15:05
3-35
costs of building additional factories and sales networks.
3.100 Because of the proliferation of vehicle models and manufacturers, tyre makers havebeen developing new technology for more automated and more flexible tyre factories.Goodyear’s Impact, Michelin’s C3M and Pirelli’s Flexi are three of the newtechnologies. Bridgestone and Continental are also developing new productiontechnologies.
Latex gloves
3.101 In the case of latex gloves, growing concerns over allergies to natural rubber have ledthe US government to seek solutions via legislation (following legal cases for productliability involving latex allergies). There is a move towards powder-free medicalexamination gloves, gloves manufactured using dermashield processing technology aswell as growing popularity of polyurethane gloves.
3.102 Despite the economic problems, Asia still attracts manufacturers to establish latexgoods production plants in its region. Safeskin plans to close factories in Californiaand Malaysia and to open a new one in Thailand, while London International is toeliminate two US gloves lines and to increase condom manufacturing capacity inThailand. Thailand has increased latex goods production capacity, but exports to theUS and Europe are proving difficult.
International Benchmarking
3.103 The following are some benchmarks (qualitative rankings based on experts’knowledge) that the Thai Rubber industry should be looking to achieve.
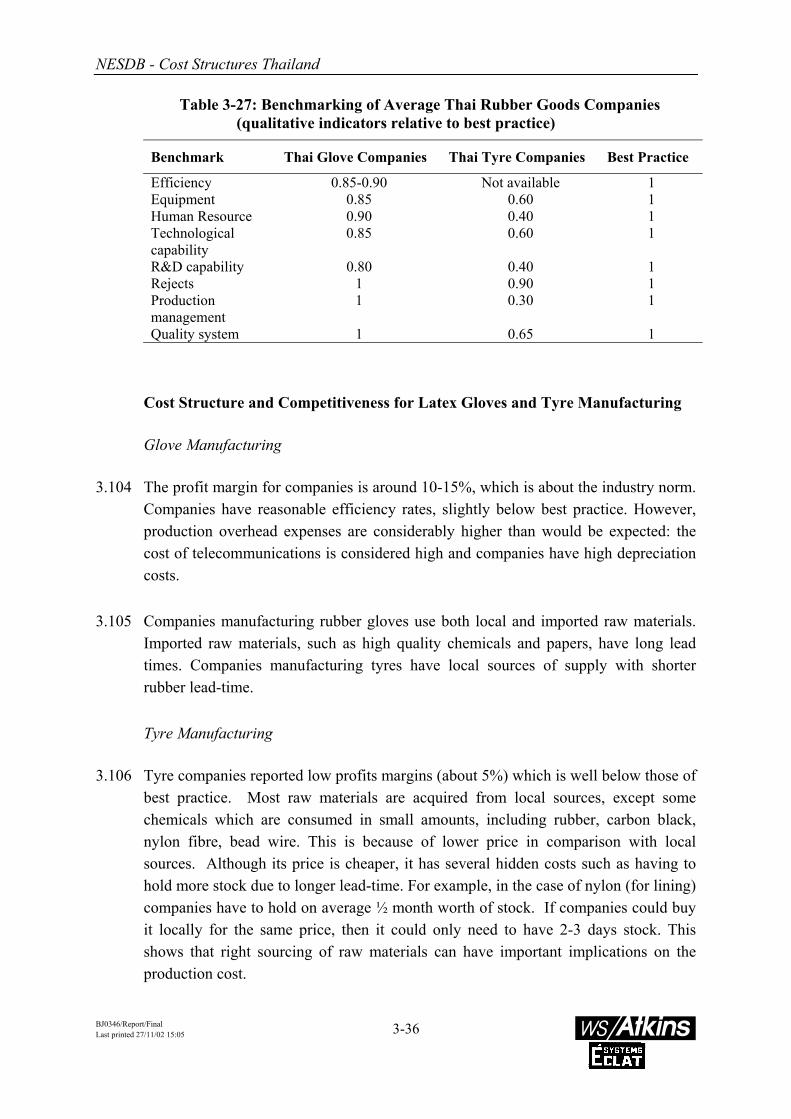
NESDB - Cost Structures Thailand
BJ0346/Report/FinalLast printed 27/11/02 15:05
3-36
Table 3-27: Benchmarking of Average Thai Rubber Goods Companies(qualitative indicators relative to best practice)
Benchmark Thai Glove Companies Thai Tyre Companies Best Practice
Efficiency 0.85-0.90 Not available 1Equipment 0.85 0.60 1Human Resource 0.90 0.40 1Technologicalcapability
0.85 0.60 1
R&D capability 0.80 0.40 1Rejects 1 0.90 1Productionmanagement
1 0.30 1
Quality system 1 0.65 1
Cost Structure and Competitiveness for Latex Gloves and Tyre Manufacturing
Glove Manufacturing
3.104 The profit margin for companies is around 10-15%, which is about the industry norm.Companies have reasonable efficiency rates, slightly below best practice. However,production overhead expenses are considerably higher than would be expected: thecost of telecommunications is considered high and companies have high depreciationcosts.
3.105 Companies manufacturing rubber gloves use both local and imported raw materials.Imported raw materials, such as high quality chemicals and papers, have long leadtimes. Companies manufacturing tyres have local sources of supply with shorterrubber lead-time.
Tyre Manufacturing
3.106 Tyre companies reported low profits margins (about 5%) which is well below those ofbest practice. Most raw materials are acquired from local sources, except somechemicals which are consumed in small amounts, including rubber, carbon black,nylon fibre, bead wire. This is because of lower price in comparison with localsources. Although its price is cheaper, it has several hidden costs such as having tohold more stock due to longer lead-time. For example, in the case of nylon (for lining)companies have to hold on average ½ month worth of stock. If companies could buyit locally for the same price, then it could only need to have 2-3 days stock. Thisshows that right sourcing of raw materials can have important implications on theproduction cost.

NESDB - Cost Structures Thailand
BJ0346/Report/FinalLast printed 27/11/02 15:05
3-37
SWOT Analysis
3.107 Table 3-28 summarises the SWOT analysis for rubber products manufacturers.
Table 3-28: Summary SWOT analysis of the Thai Rubber Products Industry
Strengths Weaknesses
• Thailand has an excess supply of rubber, atlower cost than in Malaysia.
• Thai producers have foreign partners in theproduction of rubber tyres, condoms, andrubber gloves.
• Thai producers are experienced and willperform better with support from thegovernment
• Small-scale rubber plantations hinder quality control.• Shortage of good technicians.• Lack of good R&D and slow product development
amongst SMEs.• Underdeveloped infrastructure.• Shortage of synthetic rubber technology.• General lack of access to financial markets.• Lack of technical support for SMEs• Narrow range of rubber grades available to producers.
Opportunities Threats
• There are opportunities for those producerswilling to embrace environmental issues.
• Malaysia’s reduction of rubber planting areas.• A softer Baht should provide short-term
benefit to exporters.• The importing countries continue to grow• Room for further value-added by processing
rubber into rubber products.
• Price intervention in the rubber market causesirregular supply of latex, and increases latex prices.
• Tariffs on raw materials and chemicals do notencourage production of rubber products.
• Certain types of products require a foreign partner toprovide both technologies and brand names.
• Interventionist policies and political change makelong term planning difficult
Current and Future Competitive Challenges for Thai Rubber Glove Industry
3.108 The rubber glove industry will always be a competitive industry for manufacturers inThailand as the raw material (i.e. concentrated latex which contain 40% water inaddition to 60% rubber) is local. This saves transportation cost of raw material whichcontain 40% water. Two other countries, Malaysia and Indonesia, are also majorproducers of natural rubber but production of latex in Malaysia is declining due tolabour shortage for tapping the rubber trees. At present Malaysia already has to importlatex from Thailand. Indonesia may not have labour shortage problems but theinfrastructure for rubber product manufacturing industry in not as good as inThailand.
3.109 Rubber gloves is already the top exported rubber product for Thailand, ahead of cartyre. There is very good potential for Thailand to develop into the major latex productmanufacturer in the world, not only for gloves but also for other latex products suchas balloons, condoms, and rubber thread. Future opportunities exist for the Thairubber glove industry as stated above. However, the following must be done:
NESDB - Cost Structures Thailand
BJ0346/Report/FinalLast printed 27/11/02 15:05
3-38
• Develop technology for manufacturing low proteins or hypoallergenic rubbergloves and also powder free gloves.
• Improve on productivity in order to lower production cost as the prices of therubber glove are very competitive.
• The industry should also develop innovative products such as punctureresistant glove and improve research and development on quality of rubbergloves in order to increase competitiveness, by:
• Shift from commodity products (medical examination glove, household gloveetc.) to specialty products (clean room glove, medical surgical glove, andindustrial glove).
• Improve on comfort and convenience of uses. (e.g. softer glove, better-fit sizeand shape etc.).
Current and Future Competitive Challenges for Thai Rubber Tyre Industry
3.110 The truck tyres and other heavy-duty industrial and agricultural machine tyres,particularly solid tyres, are manufactured from natural rubber as a major component(typically 80% of the total rubber used). Being a natural rubber producing country, itis obvious that this type of rubber product should be one of the targeted products formanufacturing promotion.
3.111 Also, the markets for truck tyres, industrial tyres and other heavy-duty tyres are lessconcerned with brand names, as compared with passenger car tyres. Therefore,opportunity exists for expansion of this market sector.
3.112 At present all the medium size manufacturers of truck tyres in Thailand manufacturecross-plied or biased tyres. This is an old technology. Eventhough there is stillmarket for cross-plied tyres and for quite some time to come (5-10 years), the localmanufacturers should aim to upgrade themselves to production of radial tyres. Thetechnology of radial tyre is more advanced and capital intensive, the latter being theprimary obstacle to the changing over for most companies in this product sector.However, this should seriously be the future target of this industry, in order toincrease their competitiveness in the international scene.
3.113 There are markets for cross-plied truck tyres and pneumatic and solid tyres forindustrial and agricultural uses in many parts of the world which the Thaimanufacturers have not explored. Therefore, opportunity still

NESDB - Cost Structures Thailand
BJ0346/Report/FinalLast printed 27/11/02 15:05
3-39
exists for these products. What that may need to be done by the Thai manufacturersin order to fulfil the opportunity that exists is to improve on efficiency of productionand management.
3.114 Developing marketing strategy is also the other big challenge and government supportis essential to be successful.
LEATHER GOODS
Exports of footwear and furniture (including leather) into Main Markets
3.115 Tables 3-29 and 3-30 show the main footwear and furniture exports by country intothe main markets. Thailand appears to be the 5th exporter of footwear and the 8th offurniture. Main competitors for Thai footwear industry are China, Indonesia, Brazil,Vietnam, Korea and India. Within ASEAN-4, Malaysia and the Philippines exportonly about a third of Thai’s exports. Main competitors for Thai furniture are Mexico,Taiwan, Indonesia, Malaysia and the Philippines. The competitiveness (i.e. exportlevels) of Thailand and each competitor for each main market separately (EU, Naftaand Japan) is showed in the table below.
Table 3-29: 1998 Footwear Imports into Main Markets (Million US Dollars)
Industry All EU NAFTA Japan Industry All EU NAFTA Japan
China 11,568 1,083 8,877 1,608 Sri Lanka 40 23 17 0Indonesia 1,367 501 798 68 Mexico 38 16 20 2Brazil 1,174 161 1,001 12 Cambodia 29 10 0 19Vietnam 1,063 823 200 40 Pakistan 20 19 1 0Thailand 646 273 342 31 Canada 7 6 0 1Korean Republic 458 94 166 198 Colombia 6 6 0 0India 441 321 118 2 Burma 5 0 5United States 255 86 72 97 Singapore 5 4 0 1Taiwan 241 179 9 53 Argentina 4 4 0 0Hong Kong 164 97 65 2 Japan 4 4 0Malaysia 91 24 63 4 Chile 2 0 2 0Phillipines 79 64 1 14 Iran, Islamic Republic 1 1 0 0Macau 65 50 15 0 Laos 1 1 0 0Bangladesh 42 31 0 11 Myanmar 1 1 0
Source: Compiled by WS Atkins using the World Trade Atlas Database for USA, Canada, Mexico and Japan and Eurostatdatabase for countries in the EU. Year end currency exchange rate was used for translation.

NESDB - Cost Structures Thailand
BJ0346/Report/FinalLast printed 27/11/02 15:05
3-40
Table 3-30: 1998 Furniture Imports into Main Markets (Million US Dollars)
Industry All EU NAFTA Japan Industry All EU NAFTA Japan
China 7,805 1,121 5,958 726 Korean Republic 74 7 3 64Canada 4,904 65 4,745 94 Hong Kong 71 55 8 8United States 3,782 491 2,884 407 Japan 50 40 10Mexico 3,687 51 3,633 3 Chile 49 3 46 0Taiwan 2,086 284 1,355 447 Pakistan 22 7 15 0Indonesia 1,169 478 463 228 Macau 17 0 17 0Malaysia 836 134 528 174 Singapore 16 13 0 3Thailand 748 113 308 327 Sri Lanka 7 4 2 1Phillipines 438 68 315 55 Myanmar 4 4 0India 242 95 145 2 Colombia 1 1 0 0Brazil 231 138 93 0 Bangladesh 1 0 1 0Vietnam 176 83 7 86 Iran, Islamic Republic 1 1 0 0Argentina 108 1 107 0 North Korea 1 0 1 0
Source: Compiled by WS Atkins using the World Trade Atlas Database for USA, Canada, Mexico and Japan and Eurostatdatabase for countries in the EU. Year end currency exchange rate was used for translation.
World industry trends: Leather Footwear and Furniture
3.116 World trade of footwear is around US$40 billion. Developing countries account for60% of all exports. The main importers of leather goods are Italy with 17% of allimports, China with 12.6%, USA (12.1%), Germany (7.7%), France (4.4%) and Japan(4.1%); the main exporters are China (14.5), Italy (14.1%), USA, Korea, India andGermany. On a global scale, it is estimated that shoes with leather uppers account forapproximately 45% of the total world-wide footwear production in 1998. Thisamounted to around 4990 million pairs of shoes, which used roughly 1170 millionsquare foot of upper leather.
3.117 The main footwear producing regions are:
Region Share of worldproduction
Asia 47%Europe 24%Americas 18%Other 11%
Source: Satra’s Information Centre: World Footwear Markets 2000
Sector Trends
3.118 Producers in developed countries have virtually abandoned the low end of the market.They continually consolidate and restructure their manufacturing facilities to produce

NESDB - Cost Structures Thailand
BJ0346/Report/FinalLast printed 27/11/02 15:05
3-41
higher-quality products for niche markets.
3.119 The main challenges for the footwear industry are:
• upgrade skills in production workers in order to create new marketopportunities;
• develop strategic alliances with footwear producers in other countries;
• provide firms to access to up-to-date market intelligence.
3.120 Leather upholstery for both furniture and automobiles is a growing industry worldwide. Many changes are taking place in the furniture industry. The most important,is the alliances and innovative ways of marketing devised by companies in order toavoid having to rent floor space in shops. The furniture industry by-and-large is not abrand driven industry, so schemes such as co-operative advertising and show roomsare quite successful.
3.121 In general, the leather furniture industry should embrace technology in order toautomate production lines. The main challenges that the leather furniture industryfaces world-wide relate to the application of industrial engineering techniques tomanufacturing. These include the use of production cells, deciding when to produceto order or for inventory, tracking labour productivity, and tracking material wastage.
International Benchmarking - footwear
3.122 The following are some benchmarks that the Thai footwear and upholstery industryshould be looking to achieve.

NESDB - Cost Structures Thailand
BJ0346/Report/FinalLast printed 27/11/02 15:05
3-42
Table 3-31: Benchmarking of Average Footwear Companies against Best Practice
Benchmark Thai FootwearCompanies
Best Practice
Supplier lead Times (scores) NA 3.2Lead time - Order processing (days) 14-21 4.4Lead time – manufacturing (days) NA 8.8Despatch time (days) 30 (by sea) 3.8Despatch cost (%) NA 0.9On-time deliveries (%) NA 91.8Production per hour (sq. ft/ hour/man) 160 110Plant utilisation (%) 95% 80%Value added per direct employee Baht 300 Baht 4 millionSale returns (%) 0.5-0.6 1.5Rate of stock turnover 2.4 8Raw material costs (%) 65% 62Direct labour costs (%) 7% 6.5Lead time for new product development (days) 2-3 Weeks Not measureWastage level of leather 45% 10%
Leather - Footwear
Cost Structure and Competitiveness for Footwear Manufacturing
3.123 Leather companies have relatively high standard costs per unit. Margins per unit arearound 4-11% against international averages of 10%. It has been reported by a recentsurvey into the proportion of solid waste generated by shoe factories, that the wastagelevel of leather can be as high as 45% in some areas of the shoe manufacturing sector.Although in a well run factory, this would be viewed as excessive, if such a figurewere applied to large operations, the results would be alarming. Thus, somecompanies have in place incentive schemes whereby if the operator achieves therequired number of panels from the leather he uses, he can earn a bonus of up to 15%of his standard wage.
3.124 Those companies which are producing for main international customers have indirectaccess to information on future market trends. Quick adjustments to the Companies’strategy and production plan are therefore made. This close relationship results in theprivilege to receive six month advanced purchase orders and one-year advancedpurchasing plans. This enables companies to lower production cost substantially andto select especially high-end models with high demand.
3.125 The finished sole unit contributes up to 40% - in the case of sport shoes - to themanufacturing cost of the completed shoe. There is a potential

NESDB - Cost Structures Thailand
BJ0346/Report/FinalLast printed 27/11/02 15:05
3-43
saving of 10-15% if companies applied more advanced technology in themanufacturing of sole units. An example is the matching of pigments for plastics bycolour computers equipped rather than manually. The benefits derived from this aredirect savings in chemical purchasing because of the effectiveness of the numericalsystems against the inefficiency of the human method.
SWOT Analysis
3.126 Table 3-32 summarises the SWOT analysis for leather footwear.
Table 3-32: Summary SWOT analysis of the Thai Leather Footwear Industry
Strengths Weaknesses
• Modern equipment.• Good relationship with international
brands.• Good support from suppliers• Some high margin products.• Brands being developed.
• High inventory levels: A high percentage ofraw materials have long lead times.
• Some critical raw materials supplied fromoverseas.
• Mostly low margin products• Very poor material usage
Opportunities Threats
• Large export market.• Use of locally treated leather
• Dependency on international orders• Dependency on cheap labour• Development of footwear manufacturing in
other developing countries.• Pirate products.
Current and Future Competitive Challenges for Thai Footwear Industry
3.127 The managerial skills of Thai businessmen and the manual and manufacturing skillsembodied by the labour force are observed to be the equivalent of those in the West.This is borne-out by the sheer weight of world class companies and internationalbrand names having goods made in the vicinity of Bangkok for global distribution.The level of quality available in the finished article is high.
3.128 Where there has been a high level of co-operation and partnership betweenmanufacturer and customer, knowledge of best practices in processing and the use ofcurrent technology has been acquired by the local company through a process oftechnology transfer. There are high standards of production control and intimateattention to detail. Making a diverse range of complex products for sports shoecompanies for example, underwrites the ability of the manufacturer to design-inleading edge performance to their products, rendering them highly desirable in theinternational marketplace. These products are marketed and sold on by the owner ofthe brand for premium prices following export from Thailand.
3.129 Globally a high-volume, low-margin product in the manufacture, shoes and leather

NESDB - Cost Structures Thailand
BJ0346/Report/FinalLast printed 27/11/02 15:05
3-44
goods rarely command more than a 5% gross margin for the factor. Foreign-ownedconglomerate labels have the largest slice of the cake, and are fickle in their policieswhen it comes to placing their interests and orders for manufacture. This is also thecase for Thai industry.
3.130 Companies have a large quantity of spare manufacturing capacity. The potential hereis un-tapped currently and would, if brought back to life:
• Create employment• Improve the performance of companies/groups by making a bigger
contribution to operating costs/overheads• Develop into an expansion of existing profit centres• Potentially reduce imports by providing more of what the local market needs• Increase company turnovers• Contribute more to Government through taxation
3.131 What appears to be preventing this is:
• A lack of know-how in many cases• A lack of quality market intelligence on needs and sales potentials within the
home market• A lack of vision• A relaxed resignation to carry the overheads burden of unused factory space• A failure to demand a return on investment• A lack of understanding of how marginal costed goods and even loss-leaders
can add to the company’s activities, spreading the load of the operating costswithin the business
Cost Structure and Competitiveness for Upholstery Manufacturing
3.132 Although the export market shows high potential, lack of original design andinternational marketing skills hamper the prospects of Thai upholstery companies.Designers concentrate on copying European styles rather than developing ownmodels. This results in companies not being able to take advantage on this trend inexports, because not all have skills in international business.
3.133 Leather is seen to be the main opportunity to improve perception of quality andprice/margins, so will probably increase in use in the future. Some companies employlocal hides displaying classical poor quality including putrefaction, parasite attack,bad preservation, poor flay and damage from hand fleshing. Other companies workwith imported hides for upholstery, as local humped cattle do not produce suitablecutting area (i.e. they are not big enough). Wet blue is mainly imported fromAustralia.

NESDB - Cost Structures Thailand
BJ0346/Report/FinalLast printed 27/11/02 15:05
3-45
SWOT analysis for leather upholstery
3.134 Table 3-33 summarises the SWOT analysis for leather upholstery.
Table 3-33: Summary SWOT analysis of the Thai Leather Upholstery Industry
Strengths Weaknesses
• Use of established furniture marketingchannels
• Poor quality of local raw hides• Old equipment• High cost of imported hides• No original design• Low volumes• Industry dominated by families in the
tannery business• Dependency on foreign know how and
technology
Opportunities Threats
• Highly skilled labour force in furnituredesign and production – could betransferred to upholstery design
• Large export market.• Use of locally treated leather, if quality is
improved• Some high margin products.
• Further cost reductions in leatherupholstery manufactured, particularly inEastern Europe
• Increasing establishment of largercompeting manufacturers that have linkswith large retailers in target markets
Current and Future Competitive Challenges for Thai Upholstery LeatherIndustry
3.135 Thai Tanneries are entering into exclusive agreements with furniture manufacturers,so it is becoming more difficult to enter the industry and be accepted as anindependent agent, for fear that the design, technology or business might be stolen.Leather is seen to be the main opportunity to improve perception of quality andprice/margins, so will probably increase in use in the future.
3.136 It is apparent from the availability of spare capacity in the upholstery leather sector ofThailand’s manufacturing base that current resources are under utilised. The skill-baseis highly developed among the labour force. The managerial and commercial acumenis evident in staff. The prevailing climate however dictates that companies focus onexport markets using largely foreign raw materials rather than looking toopportunities of using domestic hides or foreign hides treated in Thailand.
3.137 The companies gathered in the Km 30 tanning district area display a wide range ofancient and modern practices, and differing levels of technology in use. Some of thecompanies need to update their technology, particularly the wet processing as it is

NESDB - Cost Structures Thailand
BJ0346/Report/FinalLast printed 27/11/02 15:05
3-46
about 50 years out of date. This gives ample opportunity for an improvement inmethods through technology transfer. There can be a number of technology transferinitiatives identified as wanting for the full exploitation of the possibilities.
3.138 While it was stated that in some cases, a home market did not exist for certainproducts, drawing economic comparisons with near neighbours, the Thai economy isdeveloping and growing partly due to the interest and confidence placed in Thailandby International Conglomerates.
3.139 A number of factors impact on development of exports. These involves assistingtanners to make the products most in demand in the most effective and profitable way.The breeds that are reared, and what the potential is for the conversion into the mostlucrative products must be assessed. Indeed, many Western countries have failed tocapitalise on hide treatment (basis of all leather manufacture) as a high value bi-product of the meat production industry.
3.140 The result of this is that there are currently many hide improvement schemes worldwide (including in India) seeking to drive up the quality. Starting with husbandrymethods, schemes in Europe, America and Australia, organised groups with technicaland governmental backing are taking the inactive to assign a higher value to thismaterial. This is a slow evolutionary process, thus it may be possible for the ThaiGovernment to plan a more effective way to build an invigorated industry from theground up.
3.141 Tanneries are mostly family run and in some cases the decisions are still taken by thehead of the family. Current management practices will be therefore difficult toimplement unless younger generations are given the power and responsibility to takethese businesses forward into the next century.

NESDB - Cost Structures Thailand
BJ0346/Report/FinalLast printed 27/11/02 15:05
4-1
4. COMPETITIVENESS GAP
INTRODUCTION
4.1 This section assesses the competitiveness gap between Thailand and its maincompetitors world-wide and in East Asia in terms of labour productivity, whichprevious sections have shown is the critical factor in Thailand’s decliningcompetitiveness. For this, the most recent published data on output per employee andvalue added per employee is used. Then, the section presents our views on how andat what speed the gap can be closed.
4.2 Due to the limitation of the available published international benchmarking data, wehave to rely on two main sources: the 1998 Manufacturing Worldwide: IndustryAnalyses, Statistics, Products & Leading Companies & Countries, and the expertreport on the sub-sector visit. Unfortunately recent data for Thailand are availableonly for 1991 and 1994. Thai industry in 1994 will be compared to the competitorsgiven in Table 2.1, and East Asia (Japan, Republic of Korea, and Taiwan) in the sameyear and in 1995 as to look at the improvement in the competing countries. Morerecent consistent data for all countries is not yet available.
COMPETITIVENESS TRENDS
4.3 It has been shown that Thailand's competitiveness was eroding in the mid-1990s.Table 4.1 shows the World Competitiveness Index in 1995-1999 and indicates thisclearly. By 1997 Thailand's competitiveness index was better than those of Korea, thePhilippines, and Indonesia. At the same time, its index was worse than that of HongKong, Singapore and Malaysia. As economic crisis deepened in 1998, thecompetitiveness index plunged to all-time low at 39. Thailand was only better thanIndonesia in that year. In 1999 after the lowest point in economic activities, the indexhad improved but it was still a long way from the early 1990's period.

NESDB - Cost Structures Thailand
BJ0346/Report/FinalLast printed 27/11/02 15:05
4-2
Table 4-1: Economic Competitiveness Ranking 1995-99
Country 1995 1996 1997 1998 1999
Singapore 2 2 2 2 2Hong Kong 3 3 3 3 3Japan 4 4 9 18 16Malaysia 23 23 17 20 27China PRC 31 26 27 24 29Philippines 36 31 31 32 32South Korea 26 27 30 35 39Thailand 27 30 29 39 34Indonesia 34 41 39 40 46
Source: World Competitiveness Index 1999
The index is a ranking based on a weighted average of many quantitative and qualitativefactors such as literacy, communications, law and order, education, social and political factors,as well as cost and economic indicators. Most competitive country = 1.
4.4 Thailand’s economy is now seen as firmly in recovery mode, with GDP growthestimated by the IMF in 1999 to have been at 4%; the Thai Council of EconomicMinisters estimated in February that GDP growth would amount to 4.4% in 2000, andthe Economic Policy Committee that it would amount to 5%. Manufacturing growthis seen to be growing at an even faster rate. Manufacturing growth in December wasat 15% in the last quarter of 1999. At the same time, exports have soared by 30% inthe same period.
4.5 There are some concerns from such bodies as the IMF that structural problems withthe Thai economy and financial system remain, such as the prevalence of bad debtsand non-performing loans in the financial sector and continuing budget deficits.Nonetheless, it appears that the key industries will post continued growth as thecountry stages a recovery and returns to pre-crisis manufacturing levels.
4.6 Export values rose by 7.3% to US$58.5 billion during 1999 and to US$32.9 in thefirst half of 2000. This can be attributed to two major factors: world economic growthand increased demand in intra-Asian trade. In response to these factors, Thai exportspicked up substantially in the second quarter of 1999.
4.7 Table 4-2 shows the recent trend in exports of the selected sectors. The future looksgood for high-technology goods but there is increasing concern that electronics relyheavily on imported parts. Exports of automobiles and parts are on the rise despitehigh tariff barriers and regulation in Asian countries. Industries that suffer are those

NESDB - Cost Structures Thailand
BJ0346/Report/FinalLast printed 27/11/02 15:05
4-3
relying on intensive labour such as garment and leather manufacturing.
4.8 Table 4-3 shows export trends in more detail for processed foods. Most preparedfoods managed to increase exports during 1996 – 1998, with particularly largeincreases for canned fish. These exports may suffer non-trade barriers such asinternational sanitary standards in major markets like the US and EU, unless Thaiindustry quickly manages to comply with these standards.
Table 4-2: Export Value, Percentage Change and Market Destinations during NineMonths, 1999
Item Million(US$)
Change (%) Market
- Rising ExportsVehicles and Parts 1,358 63.8 Australia, USA, Japan and GermanyFurniture and parts 599 24.5 Japan, USA, and UKElectric circuits 2,958 21.9 USA, Netherlands, Malaysia and TaiwanComputer and parts 5,955 5.2 Singapore, Taiwan, Netherlands, the
Philippines and UKPlastic products 532 0.4 Japan, Malaysia, Vietnam and Taiwan
- Declining ExportsRubber products 769 -23 Japan, USA, China and MalaysiaFrozen shrimp 904 -8.3 Japan, China, Singapore and AustraliaGarments 2,130 -6.0 USA, Japan, Saudi Arabia, UAE, Hong
Kong and PolandFootwear and parts 646 -3.4 USA, Germany, Italy and Hong KongCanned seafood 1,190 -0.2 UK, Germany and Saudi ArabiaSource: Business Economics Department, Thailand
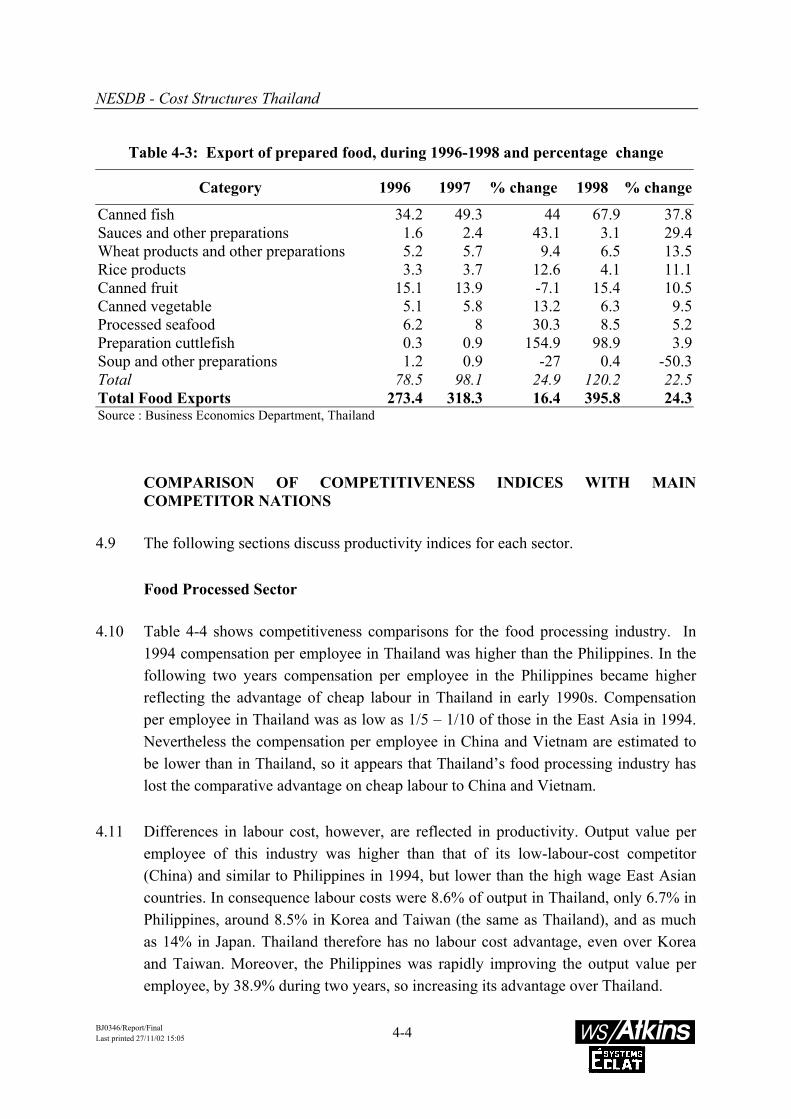
NESDB - Cost Structures Thailand
BJ0346/Report/FinalLast printed 27/11/02 15:05
4-4
Table 4-3: Export of prepared food, during 1996-1998 and percentage change
Category 1996 1997 % change 1998 % change
Canned fish 34.2 49.3 44 67.9 37.8Sauces and other preparations 1.6 2.4 43.1 3.1 29.4Wheat products and other preparations 5.2 5.7 9.4 6.5 13.5Rice products 3.3 3.7 12.6 4.1 11.1Canned fruit 15.1 13.9 -7.1 15.4 10.5Canned vegetable 5.1 5.8 13.2 6.3 9.5Processed seafood 6.2 8 30.3 8.5 5.2Preparation cuttlefish 0.3 0.9 154.9 98.9 3.9Soup and other preparations 1.2 0.9 -27 0.4 -50.3Total 78.5 98.1 24.9 120.2 22.5Total Food Exports 273.4 318.3 16.4 395.8 24.3Source : Business Economics Department, Thailand
COMPARISON OF COMPETITIVENESS INDICES WITH MAINCOMPETITOR NATIONS
4.9 The following sections discuss productivity indices for each sector.
Food Processed Sector
4.10 Table 4-4 shows competitiveness comparisons for the food processing industry. In1994 compensation per employee in Thailand was higher than the Philippines. In thefollowing two years compensation per employee in the Philippines became higherreflecting the advantage of cheap labour in Thailand in early 1990s. Compensationper employee in Thailand was as low as 1/5 – 1/10 of those in the East Asia in 1994.Nevertheless the compensation per employee in China and Vietnam are estimated tobe lower than in Thailand, so it appears that Thailand’s food processing industry haslost the comparative advantage on cheap labour to China and Vietnam.
4.11 Differences in labour cost, however, are reflected in productivity. Output value peremployee of this industry was higher than that of its low-labour-cost competitor(China) and similar to Philippines in 1994, but lower than the high wage East Asiancountries. In consequence labour costs were 8.6% of output in Thailand, only 6.7% inPhilippines, around 8.5% in Korea and Taiwan (the same as Thailand), and as muchas 14% in Japan. Thailand therefore has no labour cost advantage, even over Koreaand Taiwan. Moreover, the Philippines was rapidly improving the output value peremployee, by 38.9% during two years, so increasing its advantage over Thailand.

NESDB - Cost Structures Thailand
BJ0346/Report/FinalLast printed 27/11/02 15:05
4-5
4.12 Value added per employee in the Thai food processing sector was about 27.2% of theoutput value in 1994. It was even higher in Philippines, and in Japan and Korea it wasas much as 40%. This indicates that either Thailand’s products are much lowervalue/quality, or its material and services costs are higher – probably a combination ofboth. The competitors have been increasing their value added rapidly. In 1995 valueadded per employee in China increased by 97.8% and in the Philippines it wasincreased by 94.9% in 1993, a rapid improvement.
4.13 In general, Thailand will not be able to compete in terms of cheap labour any longer.Development in R&D and market development are the key factors for Thai foodprocessing industry to increase her output value per employee and value added peremployee. Plant capacity utilisation and procurement of raw materials have to beimproved in order to maintain Thailand’s competitiveness.
Table 4-4: Competitiveness Comparison for the Food Processing Industry
Compensationper Employee ($)
Output perEmployee ($)
Value added perEmployee ($)
Thailand 2,600 (94) 30,377 (94) 12,400 (94)
China NA 15,024 2,632WorldCompetitors
Vietnam NA NA NA
Philippines 2,458 (93) 36,261 (93) 12,662 (93)
Japan 31,977 233,289 94,512East AsianComparison
Republic ofKorea
13581 160,171 63,005
Taiwan 14277 162,532 32,610
Source: Arsen J Daney (ed), 1998, Manufacturing Worldwide: Industry Analyses, Statistics, Products& Leading Companies & Countries, 3rd edition, The Gale Group, MI.. Notes: Number is bracket is yearwhen before 1995
Electronics Sector
4.14 Table 4-5 shows competitiveness comparisons for the electronics industry. In 1994compensation per employee in the electronics industry in Thailand was lower than foralmost all its world competitors (Singapore, Malaysia and Indonesia). Compensationper employee in Singapore was almost ten times that of Thailand, implying betterquality of employment. Such high wages may not be high enough to attract skill

NESDB - Cost Structures Thailand
BJ0346/Report/FinalLast printed 27/11/02 15:05
4-6
workers into this industry resulting in a lag in technological improvement relative toneighbouring countries such as Singapore and perhaps, Malaysia. It is noticed thatcompensation per employee rapidly increased in this industry. Cheap labour is not themain advantage in the case of high technology industries. The skill of labour is moreimportant for its competitiveness
4.15 Output value per employee of Thai electronics industry was relatively low whencompared to its world competitors. In 1994 it was as low as almost one-third of outputper employee in Malaysia, and lower than that in Indonesia. This was not always thecase and Malaysia’s values used to be lower than Thailand’s at the beginning of1990s. Indeed, Malaysia output per employee increased by 74.4% within three yearsbetween 1991-1994, an increase of more than twenty percent annually.
4.16 Among its world competitors, only Singapore has a high rate of increase in valueadded per employee. There has not been much improvement in value added peremployee in Indonesia or Malaysia.
Table 4-5: Competitiveness Comparisons for the Electronics Industry
Compensation perEmployee ($)
Output perEmployee ($)
Value added perEmployee ($)
Thailand 1,447 (94) 25,000 (94) 7,237 (94)
China NA NA NAWorldCompetitors
Singapore 13,880 (94) 369,915 (94) 92,833 (94)
Malaysia 3,715(94) 78,796 (94) 11,241 (94)
Indonesia 1,650 42,661 5,824
Japan 39,627 (93) 371,358 (93) 122,050 (93)East AsianComparison
R of Korea 15,941 209,512 64,031
Taiwan NA NA NA
Source: Arsen J Daney (ed), 1998, Manufacturing Worldwide: Industry Analyses, Statistics, Products& Leading Companies & Countries, 3rd edition, The Gale Group, MI. Notes: Number is bracket is yearwhen before 1995.

NESDB - Cost Structures Thailand
BJ0346/Report/FinalLast printed 27/11/02 15:05
4-7
Garment Sector
4.17 Table 4-6 shows competitiveness comparisons for the garment industry. In 1994compensation per employee of garment industry in Thailand was less than half of thatin Taiwan, and much lower than those in Japan and Korea indicating competitivenessin cheaper labour. Data for China is not available but it is expected to be lower thanThailand. In 1995 the compensation per employee of garment industry in the threeEast Asian countries increased by more than half in Japan (53.3%), and Korea(66.9%), and by about one-third in Taiwan (31.7%). 1995 data for Thailand was notavailable, but was expected to be lower than those three East Asian countries.Nevertheless cost of labour in China remains lower than in Thailand.
4.18 Value of output per employee in Thailand was lower than for the three East Asiancountries in 1995 due to the cheaper cost and the low-end products. In 1994 valueadded in Thai garments was more than half of the output value (66.0%). The ratio washigher to Japan’s (32%) and Korea (39.0%), and Taiwan (32%) indicating thecompetitiveness of Thai garments by that time. Despite rising costs, the three EastAsian countries had been able to maintain value added by increasing their productionvalue per employee.
Table 4-6: Competitiveness Comparisons for the Garment Industry
Compensation perEmployee ($)
Output perEmployee ($)
Value added perEmployee ($)
Thailand 3,600 (94) 12,557 (94) 14,504 (91)
WorldCompetitors
China NA NA NA
Japan 22,574 73,195 39,875East AsianComparison
Republic ofKorea
12,523 72,580 35,651
Taiwan 9,933 56,907 20,018
Source: Arsen J Daney (ed), 1998, Manufacturing Worldwide: Industry Analyses, Statistics, Products& Leading Companies & Countries, 3rd edition, The Gale Group, MI.. Notes: Number is bracket is yearwhen before 1995.
Automotive Parts Sector
4.19 Table 4-7 shows competitiveness comparisons for the automotive parts industry. In1991 compensation per employee of the automotive parts industry in Thailand was

NESDB - Cost Structures Thailand
BJ0346/Report/FinalLast printed 27/11/02 15:05
4-8
much lower than those in Japan, Korea and Taiwan but still higher than its competitor,India. Compensation per employee in India was less than half of that in Thailand in1991 and there was a small increase in 1995 (only 9.9% during 5 years or 2%annually). Thailand does not have competitiveness in cheaper labour in this industry,but the skill level of labour is much higher. Thus, value of output per employee inThailand was more than six times of that in India in 1994 and was even higher whencompared to China in 1991.
4.20 Value added in Thailand was a very high 66.9% of output value in 1994 reflectinghigh kills and efficiency in this industry. Thai value added per employee was muchhigher than that of competitors, China and Taiwan. The increase in output value andvalue added per employee in China, India and Taiwan in 1995 did not surpassedThailand’s position even back in 1994. Thus, this Thai industry has maintained itsproductivity which has resulted in sustained competitiveness.
Table 4-7: Competitiveness Comparisons for the Automotive Industry
Compensationper Employee ($)
Output perEmployee ($)
Value added perEmployee ($)
Thailand 3,817 (91) 75,322 (91) 50,424 (91)
China NA 10,690 2,606WorldCompetitors
India 1,797 14,578 3,285
Japan 37,828 (91) 520,488 163,624East AsiaComparison
Republic ofKorea
23,175 192,211 75,714
Taiwan 17,183 117,690 38,478
Source: Arsen J Daney (ed), 1998, Manufacturing Worldwide: Industry Analyses, Statistics, Products& Leading Companies & Countries, 3rd edition, The Gale Group, MI.. Notes: Number is bracket is yearwhen before 1995.
Plastics Sector
4.21 Table 4-8 shows competitiveness comparisons for the plastics industry. In 1994compensation per employee of plastics industry in Thailand was much lower than thatin Japan, Korea and Taiwan. It was still lower than its competitor; Malaysia. In 1995compensation per employee in Malaysian plastics industry increased by 71.6%.Compensation per employee in Japan, Korea, and Taiwan increased at a slower rate

NESDB - Cost Structures Thailand
BJ0346/Report/FinalLast printed 27/11/02 15:05
4-9
than in Malaysia.
4.22 Output per employee in Thailand in 1994 was lower than in Malaysia but higher thanin China. Value added per employee in Thailand was higher than in China andslightly lower than in Malaysia. As a ratio to total output value, Thailand had a highershare of value added (48% compared to 20% and 38%). This share was close toJapan’s and higher than those of Korea and Taiwan. Thus, it appears that Thailandstarted increasing its competitiveness in plastics since 1991.
4.23 Once again, investment per establishment is very much lower than its competitors.
Table 4-8: Competitiveness Comparisons for the Plastics Industry
Compensation perEmployee ($)
Output perEmployee ($)
Value added perEmployee ($)
Thailand 2,600 (94) 17,650 (94) 8,500 (94)
China NA 12,388 2,472WorldCompetitors
Malaysia 4,154 33,750 12,769
Japan 38,756 (94) 248,467 110,305East AsiaComparison
Republic ofKorea
16,812 187,491 79,536
Taiwan 13,565 63,555 20,029
Source: Arsen J Daney (ed), 1998, Manufacturing Worldwide: Industry Analyses, Statistics, Products& Leading Companies & Countries, 3rd edition, The Gale Group, MI.. Notes: Number is bracket is yearwhen before 1995.
Rubber Sector
4.24 Table 4-9 shows competitiveness comparisons for the rubber industry. In 1994compensation per employee of rubber industry in Thailand was lower than inMalaysia but much higher than in Indonesia, the two main competitors. In 1995compensation per employee in Malaysia increased by 50% and was more than doublethan that in Indonesia. Thus Thailand does have competitiveness in terms of cheaplabour in this industry.
4.25 Output per employee in Thailand in 1994 was much higher than Indonesia but lowerthan in Malaysia. For Malaysia the value of output per employee increased by 37.7%.
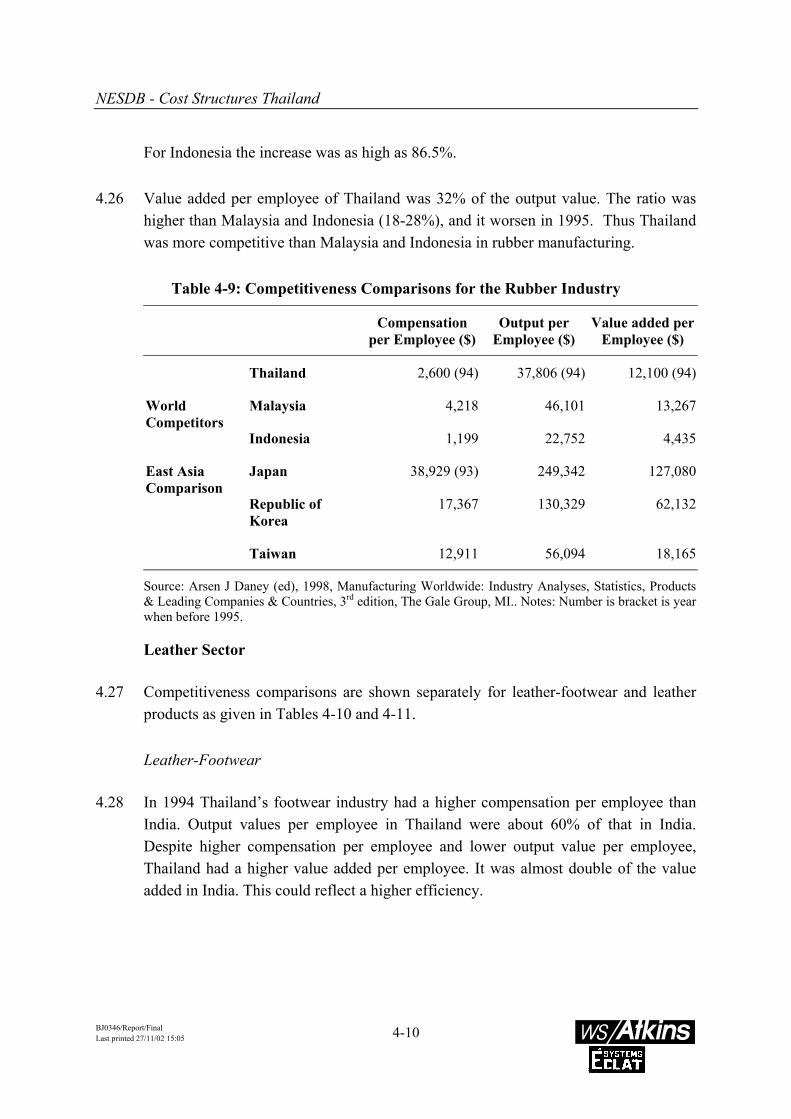
NESDB - Cost Structures Thailand
BJ0346/Report/FinalLast printed 27/11/02 15:05
4-10
For Indonesia the increase was as high as 86.5%.
4.26 Value added per employee of Thailand was 32% of the output value. The ratio washigher than Malaysia and Indonesia (18-28%), and it worsen in 1995. Thus Thailandwas more competitive than Malaysia and Indonesia in rubber manufacturing.
Table 4-9: Competitiveness Comparisons for the Rubber Industry
Compensationper Employee ($)
Output perEmployee ($)
Value added perEmployee ($)
Thailand 2,600 (94) 37,806 (94) 12,100 (94)
Malaysia 4,218 46,101 13,267WorldCompetitors
Indonesia 1,199 22,752 4,435
Japan 38,929 (93) 249,342 127,080East AsiaComparison
Republic ofKorea
17,367 130,329 62,132
Taiwan 12,911 56,094 18,165
Source: Arsen J Daney (ed), 1998, Manufacturing Worldwide: Industry Analyses, Statistics, Products& Leading Companies & Countries, 3rd edition, The Gale Group, MI.. Notes: Number is bracket is yearwhen before 1995.
Leather Sector
4.27 Competitiveness comparisons are shown separately for leather-footwear and leatherproducts as given in Tables 4-10 and 4-11.
Leather-Footwear
4.28 In 1994 Thailand’s footwear industry had a higher compensation per employee thanIndia. Output values per employee in Thailand were about 60% of that in India.Despite higher compensation per employee and lower output value per employee,Thailand had a higher value added per employee. It was almost double of the valueadded in India. This could reflect a higher efficiency.

NESDB - Cost Structures Thailand
BJ0346/Report/FinalLast printed 27/11/02 15:05
4-11
Table 4-10: Competitiveness Comparisons for the Footwear Industry
Compensationper Employee ($)
Output perEmployee ($)
Value added perEmployee ($)
Thailand 2,300 (94) 7,918 (94) 5,300 (94)
China NA NA NAWorldCompetitors
Brazil NA NA NA
India 739 13,112 3,323
Italy 20,571 (94) 117,952 (94) 31,455 (94)
Japan 31,690 144,957 64,811East AsiaComparison
Republic ofKorea
12,066 62,171 29,036
Taiwan 10,131 54,790 11,276
Source: Arsen J Daney (ed), 1998, Manufacturing Worldwide: Industry Analyses, Statistics, Products& Leading Companies & Countries, 3rd edition, The Gale Group, MI.. Notes: Number is bracket is yearwhen before 1995.
Leather Products (including Furniture)
4.29 In 1994 Thailand had a higher compensation per employee than Indonesia bur muchlower than those of other competitors such as Japan, Korea and Taiwan. Value addedof Thai manufacturing was more than half of output value but it was only 32% inIndonesia. This indicates the competitiveness of Thailand over Indonesia.

NESDB - Cost Structures Thailand
BJ0346/Report/FinalLast printed 27/11/02 15:05
4-12
Table 4-11: Competitiveness Comparisons for the Furniture sector
Compensationper Employee ($)
Output perEmployee ($)
Value added perEmployee ($)
Thailand 2,000 (94) 8,267 (94) 5,600 (94)
China NA 11,785 2,437WorldCompetitors
Indonesia 1,114 13,409 4,354
Japan 34,325 186,507 75,332East AsiaComparison
Republic Korea 15,067 149,646 49,974
Taiwan 13,250 44,023 15,044
Source: Arsen J Daney (ed), 1998, Manufacturing Worldwide: Industry Analyses, Statistics, Products& Leading Companies & Countries, 3rd edition, The Gale Group, MI.. Notes: Number is bracket is yearwhen before 1995.
CLOSING THE GAP: HOW AND TIME FRAME
4.30 Compared to world best practice, most Thai firms have low margins because of:
• Low levels of skilled labour. This keeps them in labour intensive and old technology, andleads to high reject rates and poor quality
• Products in low quality ranges, with low value of output
• High materials cost because of high reject rates and poor material yields
• Some good technology but generally technology of the 1970s and 1980s.
4.31 These translate into increased production costs for industries in relation to those oftheir main competitors, shown in Table 4.12. The table above shows the comparisonof Thailand with specific countries. In particular, it shows that:
• the share of materials and utilities costs are higher than for competing industries in allindustries shown except for leather products (excluding footwear)
• the share of labour costs is quite similar to competing industries, except for leatherproducts.
4.32 As Thailand has the lowest operating surplus as percentage of total output, for theindustries studied excluding leather products (without footwear), the industries arefacing strong challenges even before taking into account differences in marketing andadministration charges and practices– and in taxation and financial charges.

NESDB - Cost Structures Thailand
BJ0346/Report/FinalLast printed 27/11/02 15:05
4-13
Table 4-12: Rough Benchmarking of Cost Structures - % of Output for latest yearavailable
Industry/Country Materials andUtilities (%)
Labour (%) OperatingSurplus (%)
Food ProcessingThailand 73.0 5.8 21.3Korea 60.7 8.5 30.9The Philippines 64.3 5.7 30.0GarmentsThailand 71.4 19.2 9.3Korea 50.9 17.3 31.9Mexico 46.0 25.5 28.4Indonesia 60.8 12.3 26.8India 71.2 5.7 23.1Plastic ProductsThailand 68.0 9.8 22.2Korea 57.6 9.0 33.5Malaysia 64.1 11.9 23.9Rubber ProductsThailand 78.9 4.6 16.5Korea 52.3 13.3 34.3Malaysia 71.4 8.3 20.3Indonesia 79.5 4.5 16.0Leather FootwearThailand 55.6 19.2 25.2Korea 53.3 19.4 27.3Leather productsThailand 55.3 15.7 29.0Indonesia 64.0 7.8 28.1Korea 66.6 10.1 23.3India 88.1 4.4 7.5
Source: Several Industrial Statistical SourcesNote: Lack of recent data for many competing countries resulted in the use of mostly 1996 for consistencyreasons. Data for Auto Components and Electric appliances was too incomplete.
4.33 In each of the sectors it is clear that has one group of competitors with much lowerwage rates (China, sometimes India, Vietnam); other ASEAN countries with similarwage rates (Malaysia with slightly higher rates, and also Indonesia and Philippineswith lower rates), then a group of East Asian nations (Japan, Korea, Taiwan) with bigmarkets, efficient firms and high wage rates. Not surprisingly, the low wage countrieshave lower productivity, because they tend to use more labour intensive processes.The unit labour cost is the product of these two factors, and at least in the early 1990sThailand had an overall lower labour cost per unit of output than either its low-wagecompetitors or its high wage competitors, so it had a competitive labour advantage (insome cases as much as a half that of some competitors and a third of that of Japan).Our conclusions from the study, however, is that this has been eroded since the early

NESDB - Cost Structures Thailand
BJ0346/Report/FinalLast printed 27/11/02 15:05
4-14
1990s because wages rose faster than productivity.
4.34 The value added as percent of output value in Thailand is frequently as good or betterthan competitors. This is an indication of a combination of efficient use of materialsand services, and high yields and value of product. A high level of value added isneeded in order to pay labour costs and the cost of capital and to leave a surplus forprofits and taxes.
4.35 The data show that Thailand tends to have much lower levels of investment perestablishment than its close competitors. This may be a difference in the way data isreported, but if true, shows that Thailand has relatively small manufacturing units andpoor levels of investment, indicating that Thailand is likely to be losing relativecompetitiveness through under-investment.
4.36 Table 4-13 shows a rough estimation of the competitiveness gap between Thailandand its main competitors for the industries studied. This estimation was derived fromthe comparisons shown above plus our own expert assessment of the industries’situation. The comparisons are with those competitors performing better thanThailand – in most cases this includes Japan, Taiwan and Korea, and also Malaysia(for electronics, plastic products and rubber products) Indonesia (for electronics),Philippines (for processed food), India and Italy (for leather footwear), and China (forfurniture)
Table 4-13: Rough estimation of competitiveness gap with main competitors
Industry Compensation perEmployee ($)
Output perEmployee ($)
Value added perEmployee ($)
Food Processed 8-19% 19-28% 13-97%
Electronics 3-87% 6-58% 6-64%
Garments 16-36% 39-50% 36-72%
Automotive 10-22% 14-64% 30-66%
Plastics 7-62% 7-52% 8-66%
Rubber 7-61% 15-82% 9-96%
Leather – Footwear 7-22% 7-75% 8-47%
Leather Products (inc. furniture) 6-15% 4-70% 7-37%

NESDB - Cost Structures Thailand
BJ0346/Report/FinalLast printed 27/11/02 15:05
4-15
4.37 From this, it is clear that as a rough average, Thailand needs to improve its valueadded per employee by at least 3 times (relative to its competitors, who are alsoincreasing output and efficiency) and its output per employee by 5 times in theindustries studied.
Figure 4-1: Competitiveness Gap
4.38 The levels of value added and output are the result of a combination of factorsincluding levels of technology and skill of the labour force, levels of capacityutilisation, levels of employment and use of energy and other utilities. These factors,and the way they affect costs are analysed in Section 5 of this report. The relevantways in which value added and output can be increased through proper managementof these costs are also depicted in Section 5.
4.39 It is difficult to estimate how long it would take the industry to catch up with its maincompetitors in terms of these indicators of competitiveness. The challenge isenormous, and will require raising the value of products by moving to higher producttechnology and more up-market goods, as well as investment in new processtechnology to reduce costs.
4.40 From Table 4.1, it is clear that Thailand must take some years to catch up with itscompetitors. Assuming that the state of technology is increasing at a nominal rate, thecatch up period may vary between 3 to 5 years. Large firms will take less time thansmaller firms. Nevertheless, the competitors are also moving ahead rapidly at thesame time so the gap to be closed in widening. It must be recalled, however, that
TThhaaiillaanndd
CClloosseesstt BBeessttHHAALLFF WWAAYY
33XX VVAALLUUEE AADDDDEEDD55XX OOUUTTPPUUTT
PPEERR EEMMPPLLOOYYEEEE

NESDB - Cost Structures Thailand
BJ0346/Report/FinalLast printed 27/11/02 15:05
4-16
Thailand does still have a huge wage rate advantage over the East Asian competitors,so that its unit labour costs are still below these competitors. The stumbling block islack of financial support as financial institutions are waiting for economic growth torestart before extending credits. Indeed, most financial institutions are not extendinglong term or short term loans to manufacturers at the moment – domestic firms haveless chance of securing loans than exporters. As the cost of upgrading machinery andequipment will be enormous (e.g. textile machinery is now 10 times more expensivethan before – not counting the change in value of the US dollar), the support fromfinancial institutions is fundamental. Until this is in place, industry ell lack thenecessary technology to reduce costs and the gap to be closed will continue to widen.

NESDB - Cost Structures Thailand
BJ0346/Report/FinalLast printed 27/11/02 15:05
5-1
5. FACTORS AFFECTING COST COMPETITIVENESS
INTRODUCTION
5.1 This section summarises the main factors affecting cost competitiveness in Thaiindustry.
CRITICAL COST FACTORS
5.2 Table 5.1 summarises, in general terms, those factors that are adversely affecting thecost competitiveness of Thai industry. It can be seen that there is room forimprovement in many areas.
Table 5-1: Factors adversely affecting cost competitivenessFactors Processed
FoodElectr. Appl. Garments A u t o -
partsP l a s t i c products
Rubber products
Lea ther products
MaterialsUtilitiesLabour skillInvestment andFinancingTechnologyR&DScale EfficiencyCapacityUtilisationProductionControlProduct QualitySales/ MarketingManagement

NESDB - Cost Structures Thailand
BJ0346/Report/FinalLast printed 27/11/02 15:05
5-2
OVERALL COST STRUCTURES
Figure 5-1: Comparisons of Cost Structures of Industries studied
5.3 Figure 5.1 illustrates the cost structures of the sectors studied, as a percentage ofreported revenue. The data are drawn from case study companies visited and fromsurvey data, but after rejected any survey data which was not considered reliable.
Profitability
5.4 Few firms reported profitability accurately, but based on the reported data most firmsreported net profit after depreciation and interest of 10-13% of turnover. It is expectedthat most firms would tend to under- rather than over-state profits. Only plastics andrubber tyres, however, reported net losses.
-40.00
-20.00
0.00
20.00
40.00
60.00
80.00
100.00
120.00
140.00
Plastic
s - e
ngine
ering
Rubbe
r - N
PC tyre
s
Garm
ents
-Knit
Garm
ents
- wov
en
Auto
- Pre
ssed
Plastic
s - h
ouse
hold
Auto
- filte
rs
Leat
her -
furn
iture
Electro
nics -
OA
Leat
her -
foot
wear
Electo
rnics
- HD
Food
-RTEM
Rubbe
r - G
loves
Cos
t/Sal
es (%
)
Profit after interest
Financial charges
Administration
Selling
Indirect Labour + OH
Energy
Direct labour
Materials

NESDB - Cost Structures Thailand
BJ0346/Report/FinalLast printed 27/11/02 15:05
5-3
Materials
5.5 All sectors have relatively high raw material costs: 50-75% of revenue for all exceptfood and rubber gloves. This is because all are final product manufacturers, with littlevertical integration – i.e. they buy in most of their materials and components.
5.6 If the government is to support garments, autoparts, leather, and plastic, the cost ofraw material can be lowered through:
• schemes of improving local raw material quality and productivity (e.g. leather,textiles)
• reducing import duties, especially on sophisticated material (e.g. some used inautomotive and plastics).
Energy and utilities
5.7 It appears that the expenditure in utilities is average for these industries. Comparisonswere made with typical water, electricity and gas consumption for comparable UKindustries and Thai industries’ consumption are within the expected range.
5.8 The most important elements of energy cost are electricity and then fuel oil. In termsof cost, Thailand has relatively high prices for heavy fuel oil, compared for exampleto countries in central and eastern Europe, but less than Hong Kong and South Korea.Electricity prices are similar to or slightly lower than other SE Asian and developedcountries at around US$0.05/kWh. Most countries have average industrial powerprices in the range US$0.04 to 0.06/kWh.
SKILLED LABOUR AND TECHNOLOGY
5.9 The survey has shown that the low proportion of skilled workers, low employment ofQSEs, and low expenditure on R&D ultimately affect the operation efficiency of Thaiindustry.
5.10 Reject rates of products (by production manager and by customers) are given here is ameasure of skill and technology. On average, 3.8% of products are rejected becausethey do not meet production standards and customers reject 1.5% of products. This ismuch higher than industry averages and these reject rates translate into higher costs.The following table shows the reject rates of the industries studied based on surveyed

NESDB - Cost Structures Thailand
BJ0346/Report/FinalLast printed 27/11/02 15:05
5-4
companies.
Table 5-2: Average Reject Rates (%)
Industry At plant B yCustomer
Industry At plant B yCustomer
Knitwear 3.8 0.6 Ready Meals 4.5 2.0
Other garments 5.9 1.4 Leather Furniture 2.8 2.0
Automotive filters 3.0 1.7 Leather footwear 2.7 0.4
Automotive pressedparts
3.2 0.8 Engineeringplastics
4.0 0.7
Office Equipment 0.5 0.4 Household plastics 3.3 1.7
Hard disks 3.4 3.4 Latex gloves 3.7 1.4
Rubber tyres 10.5 10.5
CHANGES IN PRODUCTION CAPACITY UTILISATION
5.11 In general, capacity utilisation has improved since 1998. Eight of the sub-sectorsstudied showed improvement. The following table shows the average capacityutilisation reported by the firms interviewed. Indeed, great improvement in the rate ofproduction capacity utilisation has occurred since the economic crisis. By the end of1999, the average production capacity utilised was reported to have increased to 63%.(Bangkok Post, January 4 2000, page 16, Economic Review). This, however, is stillwell below economic levels and represents a high cost for industry.

NESDB - Cost Structures Thailand
BJ0346/Report/FinalLast printed 27/11/02 15:05
5-5
Table 5-3: Average Capacity Utilisation 1998-1999 (%)
Industry 1998 1999 Industry 1998 1999Knitwear 86 86 Ready Meals 61 60Other garments 82 77 Leather Furniture 54 47Automotive filters 52 58 Leather footwear 79 80Automotive pressed parts 53 67 Engineering plastics 47 53Office Equipment 73 76 Household plastics 61 65Hard disks 62 71 Latex gloves 65 63
Rubber tyres 64 71
FINANCING
5.12 Financing charges are generally not a large element of costs in the sectors studied, butit is significant that in the four subsectors where financing charges are highest(household and engineering plastics, rubber tyres and auto parts), accounting foraround 10% of revenues, the sectors are loss-making or near breakeven.
5.13 In general the problem is excessive financial leverage, but the electronic industry hasdifficulty in obtaining debt financing for firms. This exemplifies the importance ofhaving a well functioning public equities market in Thailand. Because these industries(e.g. electronics - mainly computer hardware industry) are relatively new, most SMEsrely on outside financing for their capital requirements. The increasingly moreintangible nature of these firms’ assets (e.g. brandnames) makes financing computerfirms difficult relative to more traditional industries. Debt financing is difficult forthese industries, since companies often lack substantial tangible assets and do nothave a long corporate tradition.
5.14 Although the public equity market has been traditionally the preserve of large hightech firms, smaller firms in high tech industry in the West are increasingly goingpublic to finance their growth – including product development and internationalmarketing. Proceeds from an initial public offering add equity to the firm. Inaddition, companies as important means of attracting, retaining and motivating staffuse stock options and purchase plans. For example, over 40% of companies in thisindustry in Canada offer these schemes to most employees.

NESDB - Cost Structures Thailand
BJ0346/Report/FinalLast printed 27/11/02 15:05
6-1
6. POLICY RECOMMENDATIONS
INTRODUCTION
6.1 The economic and financial crisis of 1997 and subsequent events indicate clearly thatnot only must policy directions change, but also Thai industries must bracethemselves to restructure their organisation, production, quality control, marketing,financial management and general administration. Without these radical changes infirms, it is difficult to compete in the new environment. Firms must be leaner andmore productive to compete with world imports and exports.
6.2 In general, the first phase initiative of the Industrial Restructuring Plan has been quitesuccessful (mainly with larger firms). Export values rose by 7.3% to US$58.5 billionduring 1999 and to US$32.9 in the first half of 2000. Export growth has beenexperienced in automotive components, furniture, plastic products and computerparts, but exports have declined in footwear, rubber products, garments and somefood processed products.
6.3 This section summarises the main recommendations. These are aimed at correctinginherent weaknesses in the Thai economic system, and comprise factors at thenational level and at the level of industry and the firm. Although it is quite risky tosuggest priorities for policies (best results can be expected when improvements aresought in tandem) the relatively more needed policies are shown first in the list below.
SUMMARY OF POLICY OPTIONS
6.4 Our recommendations at the firm level are:
• Increase the proportion of skilled labour (from 20%) including technicaltraining and English proficiency;
• Increase number of scientists and engineers (e.g. encouraging universities);
• Support R&D for productivity improvement, product design and patentableworks (e.g. creation of research centres, testing centres);

NESDB - Cost Structures Thailand
BJ0346/Report/FinalLast printed 27/11/02 15:05
6-2
• Support upstream (feeder) industries which are potential source of rawmaterials or essential industrial inputs (e.g. leather, textiles, toolmaking);
• Support schemes for technology transfer or upgrading of equipment;
• Promote the creation of industrial clusters when beneficial;
• Structure electricity and telecom tariffs to reflect more competitive pricing forindustry.
6.5 Our recommendations at the industry level are:
• Draft industrial policies that foster competition and tackle the entire supplychain within one sector;
• Guarantee that small financing requirements can be met by the stock exchange(e.g. junior stock exchange);
• Set realistic cost allowances for capital to truly reflect depreciation rates (e.g.high in electronics industry);
• Develop Merger and Acquisition Laws, Anti-monopoly laws, etc.;
• Support intellectual property rights;
• Minimise low-value adding official procedures.
6.6 Our recommendations at the macro-economy level are:
• Develop basic infrastructure for IT and water services;
• Taxation: simplify and speed up VAT returns; reduce/harmonise importtariffs; implement audit trails at customs to minimise the effects of transferpricing;
• Fiscal reform: companies’ capital base and financing;
• Devise system that compensates firms for high registered capital and highretained earnings.
• Up-grade the public sector’s capabilities;
6.7 A detailed elaboration of these policies is shown below.

NESDB - Cost Structures Thailand
BJ0346/Report/FinalLast printed 27/11/02 15:05
6-3
FIRM/INDUSTRY LEVEL
6.8 Improving production, upgrading product quality, improving loss-control systems andupgrading machinery are the only long-term solutions for keeping the Thai industrycompetitive. It may pave way to the success as they can move into the high end of themarket instead of directly compete with the lower labour cost countries of China,India and Vietnam.
6.9 The benchmarking exercises have shown that the main problems preventing increasedcompetitiveness at the firm/ industry level are:
• Low skills leading to low labour productivity and low utilisation of equipmentand capacity, and low technology;
• Technology which is not at the forefront of latest practice, partly resultingfrom the shortage of skills and low R&D input;
• High rates of rejects, low material yields, high levels of complaints resultingfrom both the above factors, and also from a lack of quality assurance andquality control;
• Some high cost inputs, e.g. power, although this is not the main problem, anddependence on many imported components and materials.
6.10 These four main groups of factors need to be tackled at the firm and industry level.
Skill factor among labour force
6.11 In 1980s Thailand was touted as a cheap-labour haven for foreign investors. Since1990s money wage has risen and Thai labour wage is no longer cheap regionally. Themoney wage in the Philippines, Indonesia, India, China PRC, Myanmar, Vietnam andLaos is lower than the Thai wage. While there is no labour survey to determine theskill factor embodied in the labour force, experts estimate that only around 20 percentof all workers are skilled labour leaving the bulk of labour force to be unskilled. Lackof skilled labour has been the usual complaint among foreign companies. Foreigncompanies expect Thai workers to be technically equipped to be trained to operatesophisticated equipment, and for that they must also be literate in English.
6.12 The Ministry of Labour and Social Welfare should implement programmes to remedythe shortage of skills immediately. More vocational training and short-courses totrain new skills must be established. In view of the long process, the government

NESDB - Cost Structures Thailand
BJ0346/Report/FinalLast printed 27/11/02 15:05
6-4
must set aside a budget to train people on a long term basis. This must mainly beoriented at the development of vocational training schools and colleges. In addition,the quality of current technical training could be improved following successfulexperiences in other countries such as in Malaysia. Indeed, the Malaysian TechnologyDevelopment Corporation (MTDC) offers, amongst other services, training of highquality tailored to specific industry needs. Additionally, the MTDC and hostuniversities have set up technology centres (innovation centres and incubationcentres). The Incubation centres, in particular, aim at profiting from latentopportunities in the spin off companies originated from MTDC/University knowledgeand cooperation.
6.13 Mechanisms used in western countries to promote skills and training include:
• Industry training boards, which raise a training levy from all firms in aparticular industry, design training courses and materials, work with localcolleges to set up courses, and reimburse companies who send workers onapproved courses (internally or externally);
• Job creation schemes by which government pays part of the cost of firms whoemploy and provide training for previously unemployed persons;
• Grants to new investment projects which reimburse part the cost of trainingworkers;
• Subsidised consultancy schemes for training need analysis and developingtraining programmes in firms.
Technology, R&D and Education
6.14 It was found that around less than 1 percent of GDP of Thailand is dedicated toresearch and development. This is far too small to make any impact on the spin-offsto commerce in general. Firms that were interviewed in the studies have indicated acertain amount of R&D. A closer look at firms' R&D activities indicate that they donot focus on productivity improvement, product design, and patentable product orprocess development. Most Thai firms do not take a long-term view of the importanceof technology development, and tend to use well-known technologies in theirproduction.
6.15 When we survey the number of scientists and engineers involved in production ofmanufactured goods, the number of scientists and engineers are low. In Kao Shungalone, there are 50,000 engineers involved in technology-related researches that

NESDB - Cost Structures Thailand
BJ0346/Report/FinalLast printed 27/11/02 15:05
6-5
spawn electronics industry of Taiwan. Government needs to redirect publicexpenditure to increase the output and employment of qualified scientists andengineers (QSEs). Public and private universities have concentrated on non-sciencesubjects. Private universities are not likely to concentrate on science and engineeringsubjects because the investment cost is high. Public universities must redirect theirefforts (and budget) towards science and technology. This also points to the reductionof non-science in general.
6.16 The move towards a more technology-oriented industrial structure will needgovernment support. To attract more QSEs, their salary levels need to be raised.Individual firms will not themselves drive the increased employment of QSEs. MostThai industry sectors consist of many SMEs, so research, testing and productdevelopment work will need to be performed by industry research centres, which aswell as publicly funded product and process research and market intelligence, canprovide commercial testing, quality assurance, certification, consultancy, design andgeneral information services to their sector. The establishment of testing centres is agood idea particularly given the capital cost of equipment required to carry out thetests. In some industries the cost of equipment is not that high but there are no skilledscientists to run the centres and perform the tests. This should not be carried out bythe Government but by independent private companies. This will minimisebureaucracy.
6.17 One-stop-shop schemes involving simplified flotation procedures (IPOs - InitialPublic Offerings), logistics advice, R&D support in Singapore and Hong Kong werementioned by industry as good examples to follow that support industrial production.These schemes have encouraged automation of suppliers by promoting IT-basedlogistics and business-process enhancement through automation. Advice is given tocompanies on the best financing for the specific technology needed. These schemesmay provide medium to long term benefits mostly by encouraging the use of the righttechnology to the right market. In addition, these schemes have arose awareness ofkey elements of risk management including foreign exchange risks in companies(particularly SMEs) through their exposure to new methods of assessing risk.
Quality related issues
6.18 International competitiveness in modern world markets is largely related to qualityissues. This is why very high labour cost countries like Germany and USA are stillmajor exporters of manufactured goods. Thai industry needs to move graduallytowards higher value high quality products, and it needs to move rapidly to reduce

NESDB - Cost Structures Thailand
BJ0346/Report/FinalLast printed 27/11/02 15:05
6-6
rejects and increase yields for the products it already exports.
6.19 There are three main routes to this:
• Widespread move to implementation of quality assurance (QA) systems byfirms – that is, management systems for good practices throughout thebusiness processes (marketing and sales, production, dispatch and distribution,maintenance, human resources, finance etc). This must be enforced throughthe promotion of 3rd party certification of companies to the ISO9000 series ofquality standards;
• Improved quality control (QC) systems in firms – that is the systems ofinspection of materials, work in progress and finished goods, with propertesting procedures and procedures for taking corrective action before defectivematerial reaches the finished product, or worse still the customer;
• Quality labelling of the products themselves. There may be opportunities todevelop specific Thai quality labels which could gain worldwide acceptancefor some products (e.g. rubber goods) but in most cases international labelswill be required. More and more this will include the European CE marking,essential for selling into the EU and it will become important in other marketstoo. Other important marks include HACCP, UL, GAP, GMP, OU and FCCapproved mark. Nutrition labels are becoming increasingly important (e.g. allfood exported to the USA must have nutrition labels), which takes 3-6 monthsto develop.
6.20 Government assistance will be needed, with the strong support of the industryassociations, to promote these various quality schemes. Most countries have had aprogramme of subsidised consultancy to help firms – e.g. by paying half of the cost ofa consultancy programme to assist firms to gain ISO9000 or a quality mark, whichalso help develop the domestic capability of quality consultancy firms. Major firmscan also be assisted to implement quality schemes in their suppliers, and governmentshould impose quality assurance requirements on its own suppliers through publicprocurement rules.
Feeder industries and industrial infrastructure
6.21 The government has mainly relied on the promotion system (e.g. BOI) which is theearlier Japanese model. In the meantime, the Japanese have shied away from this

NESDB - Cost Structures Thailand
BJ0346/Report/FinalLast printed 27/11/02 15:05
6-7
system and adopted other systems to make their industries competitive, includingdeveloping clusters to combat industry inefficiency2.
6.22 One of the weaknesses this study has detected is that incentives given by government(BOI, Customs Law, Bonded Warehouses, etc) have been used by firms mainly toreduce the cost of imported materials and equipment, so that the export orientedindustry remain dependent on imported inputs. Manufacturers use imported parts,which are reliable and arrive on time, when they are of good quality. Competing partslocally made are of inferior quality and sometimes are in short supply. Thus exportindustries are dependent upon the foreign investor, and do not increase their long-termviability or generate new linkages or induce development in their feeder industries.These incentives are not necessarily to blame for the import dependency. The systemwas set up to perform the task that was relevant in the 1970s. The presentrequirements may not fit with the provisions.
6.23 To become independent of imports, incentives generally should be moved away fromimport duty reduction to more general support for investment (for example throughaccelerated depreciation, investment allowances, training grants, provision ofsubsidised land and buildings, subsidised consultancy support, etc). Additionally, thegovernment must provide incentives on the value chain by providing incentives forfeeder industries as well as for the main industries. The automotive industry, forexample, has taken this route without government intervention as Ford and other largeauto companies set up their parts suppliers to complement their assembly activities.Important auto companies have found out earlier that they cannot rely on locally makeparts. Support could also be given specifically for investments which provide feederinputs to the targeted export industries. Examples of important feeder industries are:
• Semi-finished materials: tanned leather, rubber, plastic parts, precision metalcastings and pressings, paints and dyes, industrial chemicals and plastics,packaging;
• Tooling and equipment: die making, machinery industries;
• Parts: fasteners, spare parts, subcontract component assembly;
• Services: industrial design consultancy, testing laboratories, market research,training consultants and specialist training.
2 Porter, Michael E., Can Japan Compete?.

NESDB - Cost Structures Thailand
BJ0346/Report/FinalLast printed 27/11/02 15:05
6-8
6.24 The development of industrial clusters has been shown in many countries to createproductivity gains, innovation and generate new business start ups by creatingcompetition between firms, transfer of know-how, and reducing the cost of provisionof common industrial infrastructure services such as training, design, consultancy,testing etc. It promotes inward investment by providing n assured supply of trainedand experienced labour, and generates new small businesses by the spin off ofactivities and new ideas from the existing firms. Clusters can be promoted by settingup government owned and promoted technology parks or industrial estates targeted atspecific sectors (Malaysia’s Technopolis for IT related businesses is one of the bestknown examples). They can also be created around a government research centre orsector training centre, or by the use of planning regulations to give preferential.
6.25 Each of the sectors in this study would be suitable for encouraging clusters. The SMEDevelopment Master Plan includes a strategy for the development of networking ofSMEs and clusters. The Ministry of Industry aims to conduct studies of variouscluster models to provide lessons on which models are suited to Thai conditions. Inaddition , the MoI aims at supporting pilot projects to develop clusters in each region.Similarly, the Department of Industrial Promotion and the Institute of SMEDevelopment aim at promoting business relationships as stepping stones towardcluster relationships.
Infrastructure and Cost of utilities
6.26 Modern and reliable infrastructure, lacking at the moment in Thailand, is of greatimportance for the development of cost competitive industries. Whilst the provisionof basic services such as water is paramount for all industries today, the provision ofadvanced infrastructure such as IT is fundamental for the formation of conduciveenvironments that facilitate innovation across all activities.
6.27 Thai industry faces higher electricity, energy and telecoms tariffs than some of itscompetitors, but it is not significantly disadvantaged against most of its SE and EAsian competitors. While these utility suppliers must be able to make a proper returnon investment, and there should be no encouragement to waste energy, tariffs to majorindustries should be set with a view to (a) the prices of utilities in competing countriesand (b) the long-term marginal cost of supply. It has not been within the scope of thisstudy to investigate detailed energy and utilities pricing structures, but there may beways to adapt the tariff to industries needs, e.g. through variable tariffs according totime of day and week, or through long term supply agreements, or through variationin the maximum demand/total demand structure. Industry should, however, be

NESDB - Cost Structures Thailand
BJ0346/Report/FinalLast printed 27/11/02 15:05
6-9
encouraged to save energy, and some incentives (such as grants or low cost loans) forenergy conservation investments would both help industry and fit with internationalenvironmental policy.
MACRO-ECONOMIC LEVEL
6.28 At the macroeconomic level there are three objectives in order to increase thecompetitiveness of Thai industries:
• To open up the economy so that the competitive Thai industries have freeaccess to world markets for their products and to the most appropriatetechnology and raw materials, and so that the most efficient industries flourishand inefficient ones either improve their performance or give way to efficientones;
• To provide a financial system which enables firms to finance investmentsefficiently and which exerts a proper control over the governance of firms sothat funds are not directed into non-viable projects;
• To create a tax system which does not inhibit companies’ development.
Openness of the economy to trade and investment
6.29 Thailand’s competitors are major trading nations which are gaining from the globalliberalisation, first under GATT and now under WTO, and from the development ofmajor free market areas such as the EU and NAFTA. Thailand also stands to gainfrom liberalisation in the long-run, and must not miss out on the development ofworld trade.
6.30 Liberalisation at the global level is being accompanied by liberalisation withinASEAN under the AFTA scheme. In fact, by 2000 many commodities on the normaltrack have to be liberalised. Thailand could not unilaterally liberalise many items onthe list, and needs to support ASEAN objectives. Recently members trying to removecommodities from the inclusion list to the temporary exclusion list have bogged downthe ASEAN liberalisation - although somewhat limited in scope and range ofproducts.
6.31 Thailand stands to gain many valuable opportunities in the world market, and willalso become more flexible and responsive to any future fluctuations in the world

NESDB - Cost Structures Thailand
BJ0346/Report/FinalLast printed 27/11/02 15:05
6-10
economy. The openness to the external economic influence should not be heldresponsible for the slow response to the 1997 economic collapse. The true culprit wasthe state of readiness to respond to volatile changes at the global level. It was clearthat policy changes were sluggish. For example, an open economy needs a flexibleexchange rate, yet it took the government almost 7 months to unpeg the currency afternumerous speculative attacks against the Thai baht between December 1996 and June1997, even though the shadow exchange rate in 1995 already exceeded the officialexchange rate by a considerable margin. A timely response would have saved theeconomy billions of US dollars in international reserves. Thailand lacks an earlywarning system that indicates to policy makers that policy changes must be executed.It also lacks good monitoring system by the Bank of Thailand as manifested in thewidespread irregularities in banking practices. Thus, Thailand must upgrade thepublic sector's capabilities in managing and monitoring global changes. Likewise,policy makers must be encouraged to decide swiftly in response to global and regionalchanges.
6.32 The severity of the economic collapse in 1997 was to a large extent due to many yearsof bad investment decisions in the private sector. Companies were actually operatingon 'false' gross margins throughout the entire period, because of the protection givento domestic industries. Without protection the 'true' gross margins of most companieswould be halved, and many products were being produced at very low or evennegative value-added.
6.33 Companies tend to blame government agencies for committing to the tradeliberalisation without their prior consultations. This was the usual accusation to Thaitrade negotiators in Geneva. The private sector knew all along, however, thatliberalisation would come sooner and hoped that their political connections wouldhave delayed the liberalisation for few years. Meanwhile the companies did notupgrade their productivity, or move out of uncompetitive products. To increase theproblem, companies rolled over their debts by creating new projects through thebanking system. It was a miracle that this roll-over could go on for an extendedperiod without intervention. Entrepreneurs and bankers alike were to be blamed forextending credits to projects which were not economically viable.
Financial markets
6.34 To operate a successful economic system and a healthier industrial sector, a deeperreform must be implemented. The accounting practice in Thailand has beenconsidered as sub-standard in relation to international practice. Firms do not disclose

NESDB - Cost Structures Thailand
BJ0346/Report/FinalLast printed 27/11/02 15:05
6-11
every detail on their balance sheets even amongst the listed companies. A lack ofsystematic cost accounting was found to be widespread amongst the companiesstudied. Where present, accounting records appear to have been developed toaccommodate different government regulations (e.g. SEC for public companies) andnot to suit the business needs. This hinders companies’ evaluation and analysis oftheir own performance. This encourages lack of transparency and accountabilityfacilitating high financial leverage. In reviewing the capital base of Thai companies,it is found that most Thai local companies have low registered capital, and tend toborrow heavily from banks and financial institutions, often on short term (commonthroughout SE Asia). Because financial leverage is very high, firms are veryvulnerable to a down-turn in activity. This excessive use of debt financing resultsfrom:
• the predominance of private and family ownership of firms who are unwillingto risk their own funds;
• a weak capital market for stocks and shares, and an underdeveloped stockmarket;
• banks need to find a home for their funds without the resources to properlyevaluate projects and business plans, monitor their investments or to exercisecontrol over the companies they finance.
6.35 It is very difficult for small and start up companies to obtain financing through thestock market. As a result, most SMEs source their funds from informal andunregulated markets. An example of this is the traditional “playing share”3 allocationof cash within a corporate group – an issue that could be addressed by Government.There are signs that even premium companies such as technology companies will notseek listing in the Thai stock market. This could partly stem from the under-valuationof the Thai stocks by foreigners such as Morgan Stanley Capital Market Index. Infact in the first quarter of 2000, the Thai stocks have outperformed the benchmark by17 percent. Until Morgan Stanley revises its MSCI index and its weighting, the stockmarket will not assist Thai companies in the capital funding.
3 Chinese style "fund raising" with a view to pooling money from closed business entities. It is called "playingshare" because everyone owns one share in the pool. The money is allocated to the highest return bidder andthen rotated until all entities have benefited from the resources. Members of the group can bid for the lump sumevery month, but those who have won bidding the last month or previously are not allowed to make a bid. Thisscheme is very popular among Chinese business specially when bank financing is scarce.

NESDB - Cost Structures Thailand
BJ0346/Report/FinalLast printed 27/11/02 15:05
6-12
6.36 While it is typical of Asian companies to borrow heavily from the financialinstitutions, debt financing is often not a sound financial proposition. Manycompanies earns around 17 percent gross margins, with net profit after amortisationaround a single digit and consequently if sales volumes fall returns are insufficient tocover financing charges. Most companies in the Western Hemisphere have highregistered share capital and solid retained earnings. After reviewing corporation taxpractice of Thailand (flat rate of 30%), we have found that because of the tax system,companies prefer to record low profits to avoid high corporate tax payment – there isan incentive to avoid declaring high profits. In addition, companies prefer to registerlow capital, as it is difficult to reduce capital without court ruling. The RevenueDepartment considers the size of capital to be an important yardstick in assessing tax.It will be a great benefit to the economy if fiscal reform in this direction. In addition,the Revenue Department could allow firms to increase their capital without taxing thecompany in question unless they distribute their dividends in full. Currently, theRevenue Department collects corporate tax before distribution of profits andsubsequently they collect dividend tax from shareholders. For the listed firms on thestock market, the current law does not permit firms to buy back their stocks fromother investors. Should this be allowed, there would be great benefit to companies.In short, private companies should have sufficient capital base and should financemore of their investment through retained earnings. Thailand should aim to reduce theoverall debt/equity ratio to below 3 in 5 years and progress to around 2 in ten years.The Thai government can contribute to more efficient financing of SMEs industry by:
• Guaranteeing that the stock exchange accommodates financing requirementsin small ranges (say $100,000-$500,000) for SMEs. If this is not possible,explore the possibility of creating a junior stock exchange, commonly used indeveloped economies. These junior exchanges are very important in the earlydevelopments of SMEs in technology-related industries.
• Guarantee that the stock exchange develops some unique public offerings andprivate placement initiatives for smaller companies, which safeguard theinterest of investors.
• Offering extra financing to SMEs (in the form of affordable loans) for productdevelopment and international marketing. These loans may have differentterms and conditions to those offered to large firms (e.g. smaller collateralmay be requested if projects have high export potential) which may result inthe need for closer monitoring of performance of loans. Additionally, loanappraisal methods for large firms may not be appropriately applied to SMEs.
• Setting up a single and simple standard for cost accounting and facilitating the

NESDB - Cost Structures Thailand
BJ0346/Report/FinalLast printed 27/11/02 15:05
6-13
elaboration of affordable software packages that comply with the standard.Ultimately, this will impact on loan approval procedures by financialinstitutions and on financing of SMEs.
• Allowing for Thai capital cost allowances to have the capacity to truly reflectthe real depreciation within the industry – for example, given the acceleratingrates of obsolescence of electronics manufacturing equipment.
Fiscal Reform
6.37 Many reforms that took place since 1997 have focused on necessary financialreforms, foreclosure law, and bankruptcy laws. It is natural to initiate financialreforms as the poor response to the crisis stemmed from inadequacies in the financialdomain. There have also been fiscal reforms. The Ministry of Finance has revisedtariffs in accordance to the GATT commitments, and it has also revised excise tax ongasoline upward. Likewise, it has changed value-added tax on two occasions and itwill also continue to adjust value-added tax to replenish the revenue shortfall. Fiscalreforms of this nature are necessary, but should have a marginal impact on industrycompetitiveness.
6.38 Overall, there remain major bottlenecks to the improvement and strengthening ofcompetitiveness of firms, resulting from a complicated and cumbersome tax system.A tax structure that compensates for high registered capital and high retained earningscould include a reduction of the corporate tax rate across the board or theincorporation of a lower tax bracket for high registered capital-high profit firms(along the lines of the American system structured retrogressively). Tax Reformsmay comprise many dimensions:
• First, the corporate tax reform could provide level laying fields for all firms inthe same sector regardless of size and age of firms. Currently firms of thesame business do not pay the same rate of corporate tax.
• Second, the Department of Revenue could make it easier for firms to reducetheir capital base if firms have suffered from proven financial losses.Currently it requires a court ruling to be able to achieve this and certainly it istime consuming.
• Third, the current practice of permitting certain minimum number of years towrite off assets is quite impractical. The government could update thedepreciation allowances to reflect the true nature of business. This ismanifested in the frequent tooling in the electronics industry. The allowancesare old fashioned and should be improved.
• Fourth, VAT reform may be achieved ideally to avoid the current pay-and-

NESDB - Cost Structures Thailand
BJ0346/Report/FinalLast printed 27/11/02 15:05
6-14
claim system or at least to refund quickly to exporters. Currently exporters payVAT to the government and claim it back. Exporters must wait to receive theirrefunds for many months from the Revenue Department while they continueto pay the VAT tax even when they are not supposed to pay the tax in thebeginning. This increases the production cost of exporters. In recent years,dishonest people tried to claim the VAT return from false documents. Totalexemption will do away with this abuse and avoid this inefficient pay-and-claim system. Alternatively, the Revenue Department could allow the amountto be refurbished to the exporters to cancel out the fresh amount of the VATtax. At the same time, speeding up refunds of value-added tax to exporterscould help them improve their cash flow.
• Fifth, import tax on raw materials and machinery can be waived instead ofenforcing the tax credit scheme which is inefficient and counterproductive. Itshould not be waived or reduced arbitrarily due to political reasons such as inthe case of lower import tax on cold rolled plate of 1% in order to supportlocal tin plate and canning manufacturing. Similarly, tariff harmonisation ofthe import duty on machinery spare parts and machinery appears to beimportant. Currently the spares attract a duty of 5-30% compared with 5% onmachinery that cannot be produced in Thailand (there is a new measure thatreduces this tax further to 3%). As a consequence, sometimes it is moreeconomic to replace a machine rather than repairing it.
Effectiveness of Legal and Political Institutions
6.39 The 1998 World Economic Forum reported that corruption in the customsadministration was a particularly severe problem for exporters and other business thatneed imported machinery and inputs in order to participate in the internationaldivision of labour. The logic behind this political development is pointing totransparency and less corruption among the officialdom. Good governance mustbegin with the public sector to avoid unnecessary extra costs to industry. Thailandhas been slow in reforming its legal institutions and political institutions. The pace ofreforms after 1998 has been rapid and several new commercial codes have beenpassed by the parliament. It is certain that new laws will be added to the long listsuch as the Merger and Acquisition (M&A) laws and Anti-Monopoly Laws. Theselaws will assist Thai companies to consolidate their businesses.
6.40 Thai companies have been afraid of a foreign invasion. This is natural, as mostbusinesses have been preserved for Thai companies for a long time. In order tostrengthen their competitiveness vis-a-vis foreign firms, industrial sectors need toconsolidate, and M&A should be deployed as an option. Additionally the governmentshould improve response by the Foreign Trade Department (Ministry of Commerce)

NESDB - Cost Structures Thailand
BJ0346/Report/FinalLast printed 27/11/02 15:05
6-15
when a Thai manufacturer files a complaint against dumping price practices byforeign importers – Anti-Dumping (AD) and Countervailing duty (CVD law).Indeed, the current Thai law is following the procedure agreed upon by the GATT andthe WTO. A critical difference between proving dumping prices in Thailand and inmajor western countries is who has to provide the evidence to the Authority. UnderThai laws, the plaintiff in a civil suit must provide the authority with sufficientevidence to prove beyond reasonable doubt that there has been a dumping practice. Inother countries, the responsibility to clear the case lies in the defendant’s corner. Thatis, foreign importers must provide evidence that there has not been a dumping practiceby them. Thus, legal procedures to prove the case set forth under Thai law hampersthe investigation into dumping practices. However, as few foreign imports sell inThailand at dumping prices (the exception being commodity petrochemicals such aspolyethylene or polypropylene), the cost of changing the legal procedure will faroutweigh the benefits.
6.41 The government has established several new courts to cover intellectual propertyrights and bankruptcy cases. It is premature to say whether they are effective inhandling cases. Court judges must be trained to be versed in accounting and othermanagerial science to understand the complications of the commercial world.Landmark cases should be forthcoming and establish the standards that provide clearguidelines for future references.

NESDB - Cost Structures Thailand
BJ0346/Report/FinalLast printed 27/11/02 15:05
1
APPENDIX 1: SUMMARY OF INDUSTRIAL DEVELOPMENT PLANSTRATEGIES AND SME DEVELOPMENT MASTER PLAN

NESDB - Cost Structures Thailand
BJ0346/Report/FinalLast printed 27/11/02 15:05
2
Summary of Industrial Development Plan Strategies (1998-2002)Industrial Sector Programme to which the industrial sector gives an importance
Productivity Technology Labour skill SMEs ProductDevelopment
Job Distr./incomeearning
FDI Pollutionreduction
Food and animalfeedTextile and garmentFootwear andleatherWooden productsand furniturePharmaceutical andchemical
X
Rubber and Rubberproducts
X
Plastic productsCeramic andglasswareElectrical appliancesand electronic
X
Vehicles and parts XGems and jewelryIron and steelPetrochemical X
Source: Executive Summary Industrial Development Plan, National Industrial Development Committee, June 15, 1998.
Notes: : More importance given, : Less importance given, X: No importance

NESDB - Cost Structures Thailand
BJ0346/Report/FinalLast printed 27/11/02 15:05
3
Definitions of Programmes
Productivity: improving productivity and streamlining production processes to enhance c\ompetitiveness in cost and delivery of theproducts
Technology: upgrading the technological capabilities and modernizing the technologies and amchinery in the target industries
Labour skill: upgrading the labour skills in the target industries
SMEs: incubating and strengthening the small and medium supporting industries
Product Development: promoting product development, product design and marketing channels
Job distribution/income earning: distribution and relocation of labour-intensive and less prollution production units to rural areas in orderto support job distribution and income earning
FDI: persuading foreign direct investment in the strategic industries with technology for the future.
Pollution reduction: relocating the high production industry to specific zones and promoting the application of clean technologies in orderto reduce pollution.
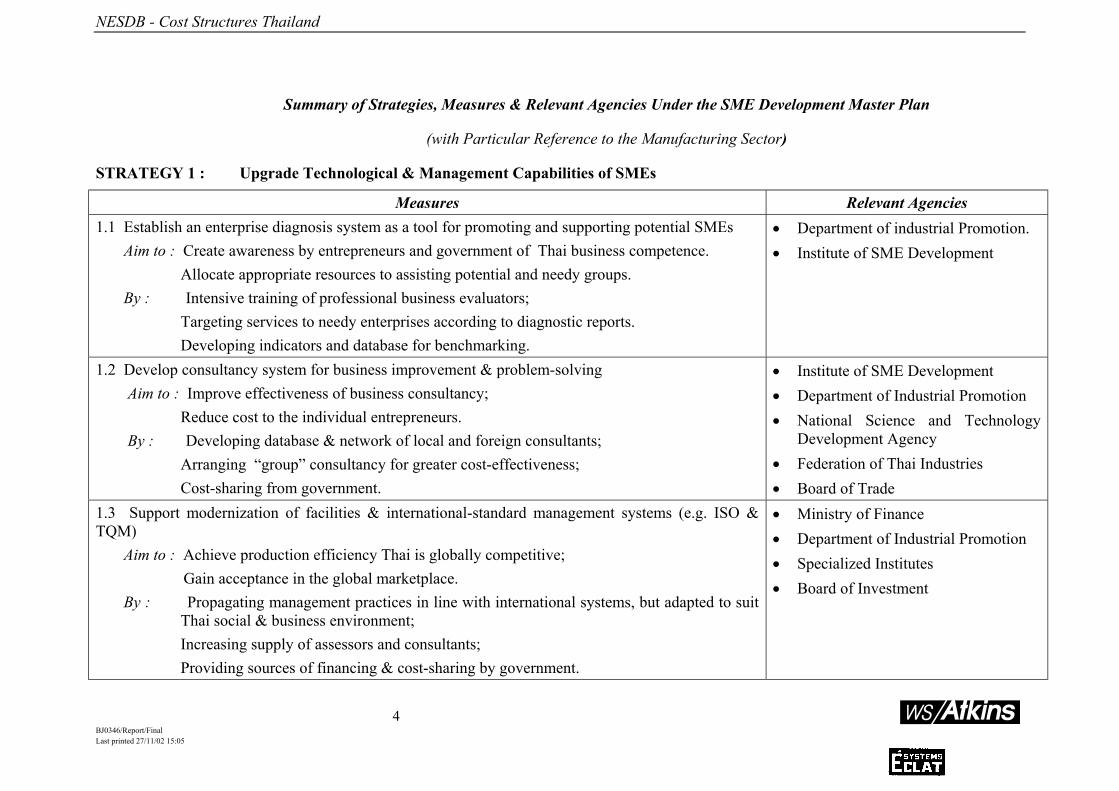
NESDB - Cost Structures Thailand
BJ0346/Report/FinalLast printed 27/11/02 15:05
4
Summary of Strategies, Measures & Relevant Agencies Under the SME Development Master Plan
(with Particular Reference to the Manufacturing Sector)
STRATEGY 1 : Upgrade Technological & Management Capabilities of SMEs
Measures Relevant Agencies1.1 Establish an enterprise diagnosis system as a tool for promoting and supporting potential SMEs Aim to : Create awareness by entrepreneurs and government of Thai business competence.
Allocate appropriate resources to assisting potential and needy groups. By : Intensive training of professional business evaluators;
Targeting services to needy enterprises according to diagnostic reports.Developing indicators and database for benchmarking.
• Department of industrial Promotion.• Institute of SME Development
1.2 Develop consultancy system for business improvement & problem-solving Aim to : Improve effectiveness of business consultancy;
Reduce cost to the individual entrepreneurs. By : Developing database & network of local and foreign consultants;
Arranging “group” consultancy for greater cost-effectiveness;Cost-sharing from government.
• Institute of SME Development• Department of Industrial Promotion• National Science and Technology
Development Agency• Federation of Thai Industries• Board of Trade
1.3 Support modernization of facilities & international-standard management systems (e.g. ISO &TQM) Aim to : Achieve production efficiency Thai is globally competitive; Gain acceptance in the global marketplace. By : Propagating management practices in line with international systems, but adapted to suit
Thai social & business environment;Increasing supply of assessors and consultants;Providing sources of financing & cost-sharing by government.
• Ministry of Finance• Department of Industrial Promotion• Specialized Institutes• Board of Investment

NESDB - Cost Structures Thailand
BJ0346/Report/FinalLast printed 27/11/02 15:05
5
1.4 Support improvement of product quality towards international standard. Aim to : Gain acceptance in the global marketplace. By : Enhancing capabilities of technical institutes to provide laboratory testing & inspection
services to SMEs at nominal costs;Expediting Mutual Recognition Agreement (MRA) for the testing service-providers;Targeting quality-upgrading consultancy services in addordance with testing results.
• Specialized Institutes
1..5 Develop networking and improve efficiency of R&D institutes. Aim to : Overcome limited capacity of SMEs to invest in R&D;
Facilitate innovations by Thai SMEs, with appropriate management of intellectual property rights.
By : Co-ordinating R&D programs responsive to the needs of SMEs; Supporting procurement of equipment suitable for R&D for SMEs; Providing opportunities for SMEs to experiment using public equipment; Developing appropriate measures to protect intellectual property rights.
• National Science and TechnologyDevelopment Agency
• Ministry of University Affairs• Government research
centers/institutes

NESDB - Cost Structures Thailand
BJ0346/Report/FinalLast printed 27/11/02 15:05
6
Summary of Strategies, Measures & Relevant Agencies Under the SME Development Master Plan
(with Particular Reference to the Manufacturing Sector)
STRATEGY 2: Develop Entrepreneurs and Human Resource of SMEs
Measures Relevant Agencies2.1 Create & incubate new entrepreneurs and develop existing entrepreneurs; Aim to : Develop the “global-oriented” Thai entrepreneurs;
Instill entrepreneurial spirits & business experience in the younger, technology-orientedgeneration.
By : Introducing entrepreneurship development curriculum in formal education;Promoting activities for sharing of experience;Providing information & advisory support, facilities & financing especially forinvestments in new products, new market entries, etc.
• Institute of SME Development• Department of Industrial Promotion
2.2 Enhance efficiency and flexibility of training services.Aim to : Improve learning effectiveness;
Provide convenience to prospective trainees;Reduce cost and disruption to businesses.
By : Developing specific curricula for each business / job position / region;Utilizing innovative teaching methods & media ;Providing flexible hours of attendance;Reducing costs through tax credit, etc.
• Institute of SME Development• Department of Industrial Promotion• Department of Skill Development

NESDB - Cost Structures Thailand
BJ0346/Report/FinalLast printed 27/11/02 15:05
7
2.3 Improve efficiency & coverage of industrial skill standards certification system.Aim to : Improve labor productivity;
Gain the global buyers’ confidence;Improve earnings of skilled workers,
By : Increasing coverage of skills with defined standards in accordance with industry’srequirements;Expanding skill testing & certification services;Providing fiscal incentives;Developing database of certified skilled workers.
• Department of Skill Development• Specialized Institutes
2.4 Improve curriculum & methods in educational establishments to meet industry’s needs. Aim to : Alleviate problems of new workers lacking necessary skills & knowledge;
Utilize existing facilities for re-training industrial workers for new technologies or re-deployment
By : Promoting co-operation between industry and educational institutions to develop curricularelevant to industry’s needs;Expanding dual-training & re-training schemes by providing incentives to participatingenterprises.
• Ministry of Education• Ministry of University Affairs
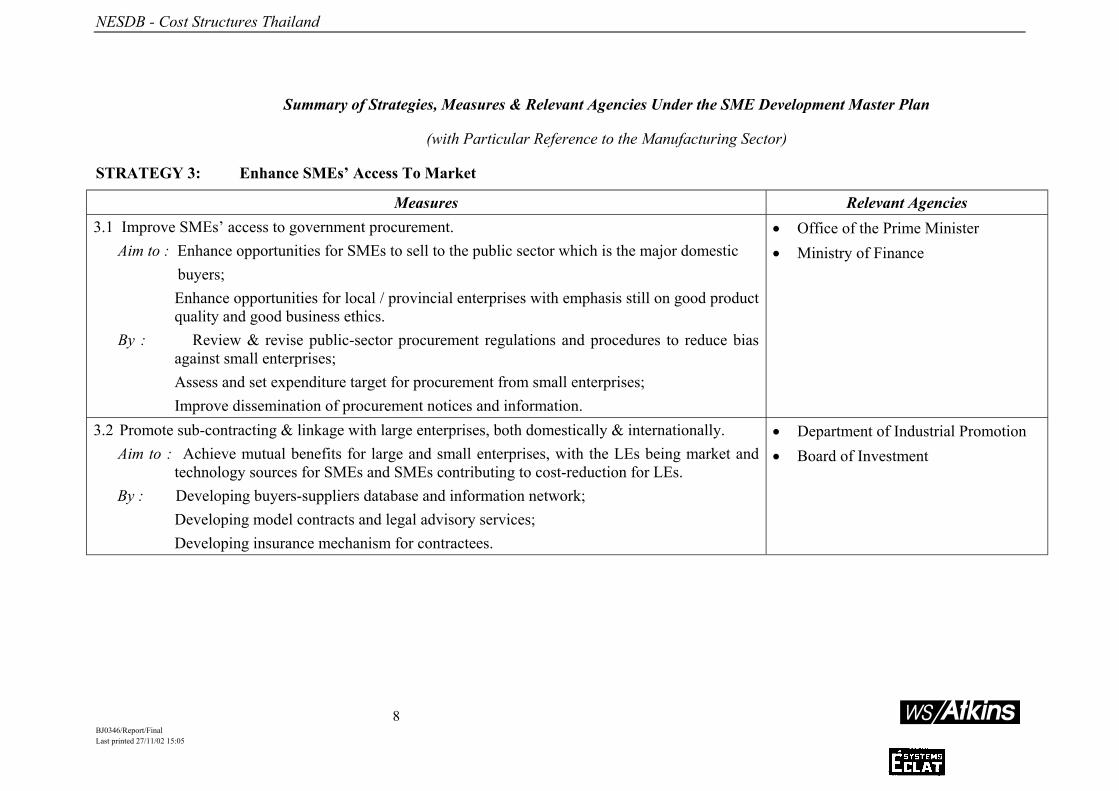
NESDB - Cost Structures Thailand
BJ0346/Report/FinalLast printed 27/11/02 15:05
8
Summary of Strategies, Measures & Relevant Agencies Under the SME Development Master Plan
(with Particular Reference to the Manufacturing Sector)
STRATEGY 3: Enhance SMEs’ Access To Market
Measures Relevant Agencies3.1 Improve SMEs’ access to government procurement.
Aim to : Enhance opportunities for SMEs to sell to the public sector which is the major domestic buyers;
Enhance opportunities for local / provincial enterprises with emphasis still on good productquality and good business ethics.
By : Review & revise public-sector procurement regulations and procedures to reduce biasagainst small enterprises;Assess and set expenditure target for procurement from small enterprises;Improve dissemination of procurement notices and information.
• Office of the Prime Minister• Ministry of Finance
3.2 Promote sub-contracting & linkage with large enterprises, both domestically & internationally.Aim to : Achieve mutual benefits for large and small enterprises, with the LEs being market and
technology sources for SMEs and SMEs contributing to cost-reduction for LEs. By : Developing buyers-suppliers database and information network;
Developing model contracts and legal advisory services;Developing insurance mechanism for contractees.
• Department of Industrial Promotion• Board of Investment

NESDB - Cost Structures Thailand
BJ0346/Report/FinalLast printed 27/11/02 15:05
9
3.3 Expand & strengthen export promotion activities for SMEs.Aim to : Improve access to export market for SMEs at reasonable costs;
Overcome limitations of SME personnel in handling custom procedure, communication inforeign-languages, etc.
By : Developing buyers-suppliers database;Organizing study missions & trade fair missions;Providing financial & technical support for product & packaging development;Establishing centres to provide assistance in exporting procedure, communications, e-commerce, etc.
• Department of Export Promotion
3.4 Promote cross-border trade and linkage with trading companies. Aim to : Enable SMEs to benefit from sub-regional economic co-operation; Overcome limitations of SMEs in undertaking marketing activities.
By : Supporting linkage between the trading sector and manufacturing SMEs; Utilizing existing trading firms to spearhead entry into new markets; Disseminating information on market preferences to SME producers.
• Ministry of Commerce• Board of Investment

NESDB - Cost Structures Thailand
BJ0346/Report/FinalLast printed 27/11/02 15:05
10
Summary of Strategies, Measures & Relevant Agencies Under the SME Development Master Plan
(With Particular Reference to the manufacturing Sector)
STRATEGY 4: Strengthen Financial Support System for SMEs
Measures Relevant Agencies4.1 Expand & develop credit guarantee system for SMEs4.2 Develop existing specialized financial Institution into an SME bank
Aim to: Enable commercially-viable SMEs to obtain adequate funding and other financial servicesmore easilyReduce reliance on collateral
By: Recapitalizing SIFC and SICGC;Setting up branches in the provinces;Enhancing credit risk assessment capabilities;Linking up with enterprise diagnosis & business consultancy systems.
• Ministry of Finance• Small Industry Credit Guarantee
Corporation• Small Industry Finance Corporation
4.3 Establish Venture Capital Fund for SMEsAim to: Encourage investments in strategic SMEs;
Enable strengthened SMEs to get listed in the capital market
• Ministry of Finance• Ministry of Industry
4.4 Establish SME Promotion Fund.Aim to: Facilitate expansion of effective SME projects under government & non-government
organizations;Encourage & support groups/associations of SMEs to invest in common facilities & jointactivities.
• Ministry of Industry• SME Promotion Office

NESDB - Cost Structures Thailand
BJ0346/Report/FinalLast printed 27/11/02 15:05
11
4.5 Strengthen financial advisory services for SMEsAim to: Enable SMEs to obtain pertinent advice from local service centres regarding suitable
sources of funds;Enable SMEs to obtain pertinent advice from financial institutions regarding business plandevelopment.
• Specialized financial institutions• Federation of Thai Industries• Chambers of Commerce

NESDB - Cost Structures Thailand
BJ0346/Report/FinalLast printed 27/11/02 15:05
12
Summary of Strategies, Measures & Relevant Agencies Under the SME Development Master Plan
(With Particular Reference to the manufacturing Sector)
STRATEGY 5: Provide Conductive Business Environment
Measures Relevant Agencies5.1 Establish and strengthen local information centres for SMEs
Aim to: Enable SMEs to gain faster & less costly access to information which are important andnecessary for conduct of business
By: Producing information contents, media, reference materials;Supporting acquisition of information media and equipment for local service centres.
• Institute of SME Development• Ministry of Industry• Ministry of Commerce• Board of Trade• Federation of Thai Industries
5.2 Develop mechanism for review & revision of laws, regulations & administrative procedures toredress disadvantages of SMEs.Aim to: Improve competitiveness of SMEs through reduction of disproportionate fiscal burdens
and regulatory obligations.
• Ministry of commerce• Ministry of Industry• Office of the Jurisdical Council
5.3 Support SMEs’ preparedness for the IT age.Aim to: Enable SMEs to take full advantage of information technology in accessing information
and presenting their products & services to wider target customers.By: Training;
Developing application software suitable for Thai SMEs;Providing source of funds/loans for investing in IT equipment.
• Institute of SME Development
5.4 Improve efficiency of distribution channels.Aim to: Reduce product distribution costs to SMEs;
Enable SMEs to reach wider markets.
• Ministry of Commerce
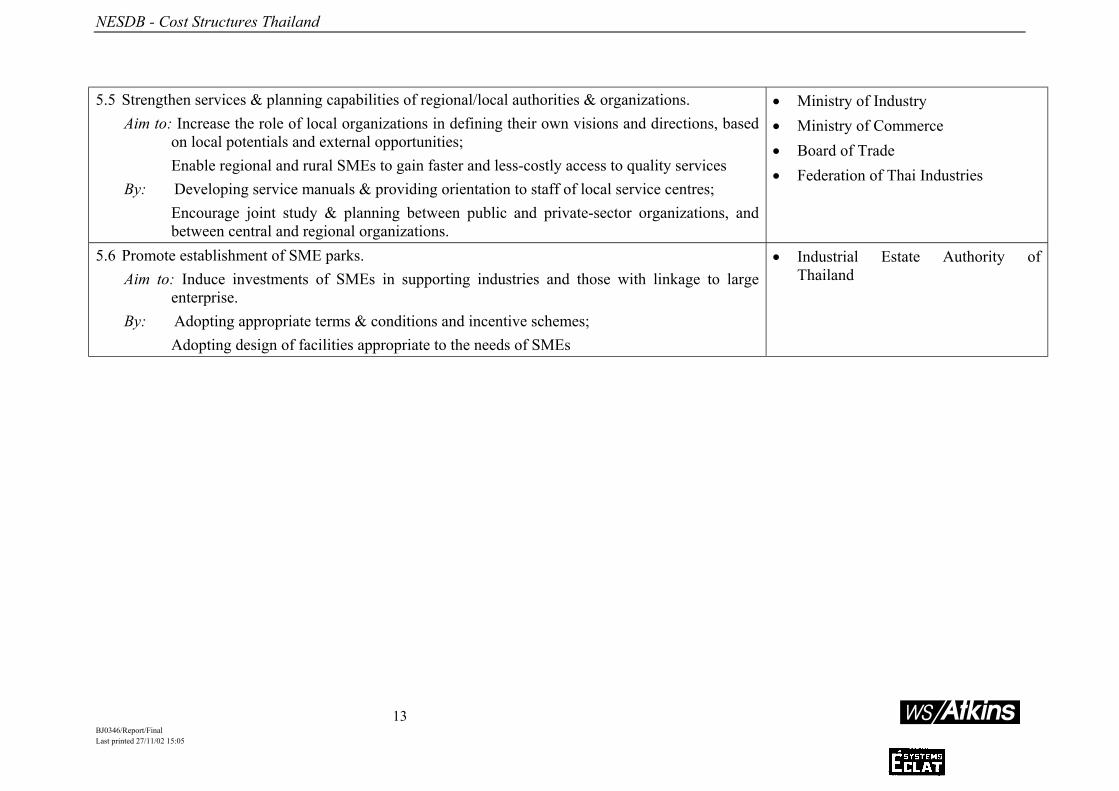
NESDB - Cost Structures Thailand
BJ0346/Report/FinalLast printed 27/11/02 15:05
13
5.5 Strengthen services & planning capabilities of regional/local authorities & organizations.Aim to: Increase the role of local organizations in defining their own visions and directions, based
on local potentials and external opportunities;Enable regional and rural SMEs to gain faster and less-costly access to quality services
By: Developing service manuals & providing orientation to staff of local service centres;Encourage joint study & planning between public and private-sector organizations, andbetween central and regional organizations.
• Ministry of Industry• Ministry of Commerce• Board of Trade• Federation of Thai Industries
5.6 Promote establishment of SME parks.Aim to: Induce investments of SMEs in supporting industries and those with linkage to large
enterprise.By: Adopting appropriate terms & conditions and incentive schemes;
Adopting design of facilities appropriate to the needs of SMEs
• Industrial Estate Authority ofThailand
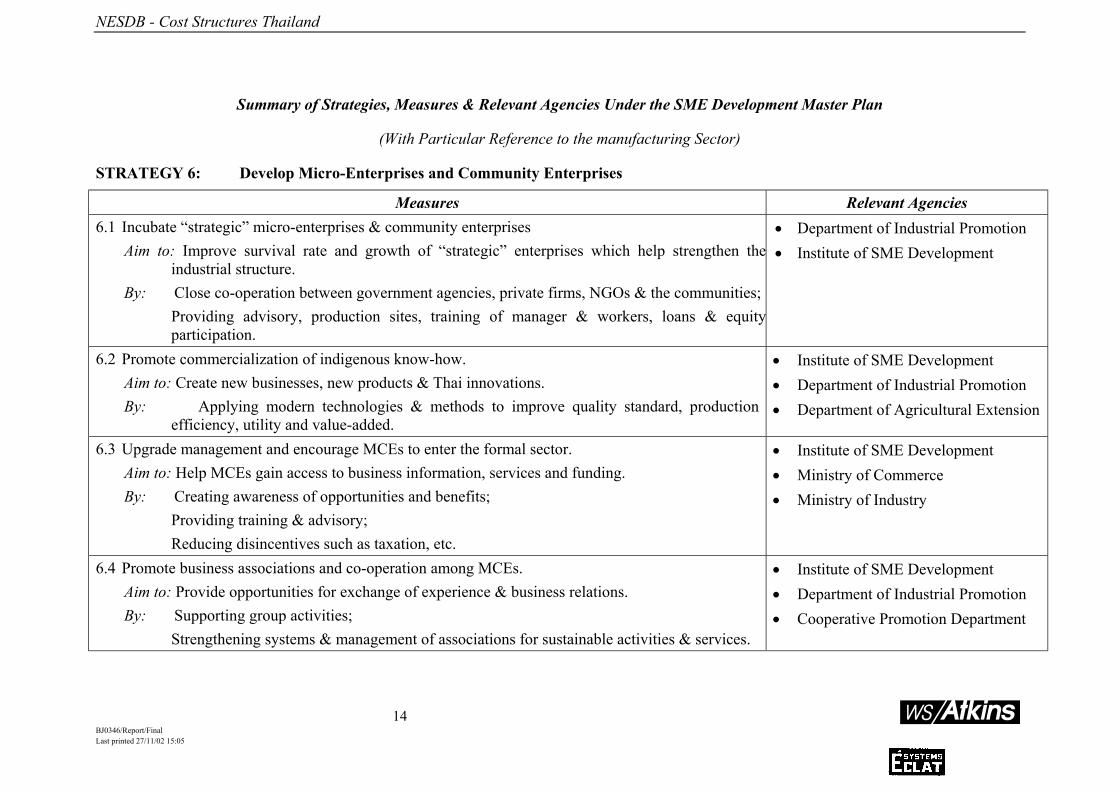
NESDB - Cost Structures Thailand
BJ0346/Report/FinalLast printed 27/11/02 15:05
14
Summary of Strategies, Measures & Relevant Agencies Under the SME Development Master Plan
(With Particular Reference to the manufacturing Sector)
STRATEGY 6: Develop Micro-Enterprises and Community Enterprises
Measures Relevant Agencies6.1 Incubate “strategic” micro-enterprises & community enterprises
Aim to: Improve survival rate and growth of “strategic” enterprises which help strengthen theindustrial structure.
By: Close co-operation between government agencies, private firms, NGOs & the communities;Providing advisory, production sites, training of manager & workers, loans & equityparticipation.
• Department of Industrial Promotion• Institute of SME Development
6.2 Promote commercialization of indigenous know-how.Aim to: Create new businesses, new products & Thai innovations.By: Applying modern technologies & methods to improve quality standard, production
efficiency, utility and value-added.
• Institute of SME Development• Department of Industrial Promotion• Department of Agricultural Extension
6.3 Upgrade management and encourage MCEs to enter the formal sector.Aim to: Help MCEs gain access to business information, services and funding.By: Creating awareness of opportunities and benefits;
Providing training & advisory;Reducing disincentives such as taxation, etc.
• Institute of SME Development• Ministry of Commerce• Ministry of Industry
6.4 Promote business associations and co-operation among MCEs.Aim to: Provide opportunities for exchange of experience & business relations.By: Supporting group activities;
Strengthening systems & management of associations for sustainable activities & services.
• Institute of SME Development• Department of Industrial Promotion• Cooperative Promotion Department

NESDB - Cost Structures Thailand
BJ0346/Report/FinalLast printed 27/11/02 15:05
15
Summary of Strategies, Measures & Relevant Agencies Under the SME Development Master Plan
(With Particular Reference to the manufacturing Sector)
STRATEGY 7: Develop Networking of SMEs and Clusters
Measures Relevant Agencies7.1 Conduct studies of various cluster models which enhance overall efficiency.
Aim to: Provide lessons from which model(s) suited to Thai conditions may be selected/developed.By: Analytical studies and observations of existing clusters in Thailand and other countries.
• Ministry of Industry
7.2 Support pilot projects to develop clusters in each region.Aim to: Assess potential for improving efficiency of local economies;
Gain experience regarding barriers and limitations to the development of clusters in Thailand.
By: Inducing suggestions and co- operation from private-sector organizations, local authorities,and financial institutions, to support the necessary investments.
• Ministry of Industry
7.3 Promote association and business relations as stepping-stone towards cluster relationship.Aim to: Foster foundation of trusting business relationship.By: Providing facilitation and financial support for underlying activities.
• Department of Industrial Promotion• Institute of SME Development
7.4 Provide infrastructure support, incentives, and financing.Aim to: Induce cluster growth in potential localities and business sectors.
• Industrial Estate Authority ofThailand
• Board of Investment

NESDB - Cost Structures Thailand
BJ0346/Report/FinalLast printed 27/11/02 15:05
16
APPENDIX 2: METHODOLOGY APPLIED TO THE QUALITATIVEQUESTIONS
METHOD OF ANALYSIS OF QUALITATIVE SURVEY QUESTIONS
Data processing and validation was carried out by computer using the commercial packageSPSS\PC+ Statistical Package, version 9. The statistical unit used is the company but thetabulation of the information was performed by percentage of cases and not by percentage ofrespondents, using different filters. This methodology provides a consistent and reliableprocedure to detect systematic behaviour.
Descriptive Statistics
For the questions with only two alternative answers the procedure was straightforward,mainly relying on the analysis of frequencies, cross-tabulations and correlations based oncases.
For the questions based on companies’ rankings, an index number was used. The numbercalled ‘Index of Importance” is a simple measure that assesses the overall importance of eachof the alternatives in a question, for the whole group of respondents.
Index of Importance
The ‘Index of Importance’ is a measure that takes into account both the order of importanceof a characteristic and the number of firms, in relation to the whole sample of respondents,that have assessed a particular characteristic as having that importance. The higher the indexnumber, the more important the characteristic will be considered by the entire sample.
Consider the general 3x3 (ixj) cross-tabulation of the number of respondents (N) who assess agiven characteristic (e.g. criteria taken into account in decision process), by applying a scalepoint according to their declining importance (i.e., importance ranking first, importanceranking second, etc.).
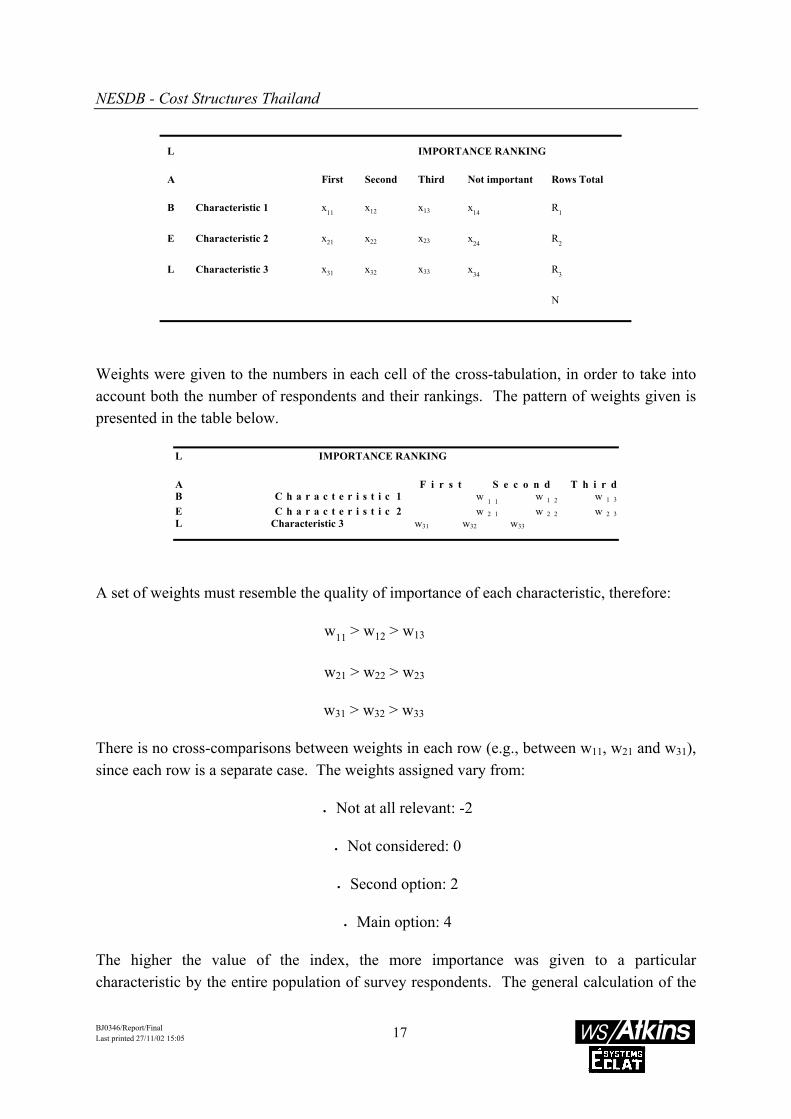
NESDB - Cost Structures Thailand
BJ0346/Report/FinalLast printed 27/11/02 15:05
17
Weights were given to the numbers in each cell of the cross-tabulation, in order to take intoaccount both the number of respondents and their rankings. The pattern of weights given ispresented in the table below.
A set of weights must resemble the quality of importance of each characteristic, therefore:
w11 > w12 > w13
w21 > w22 > w23
w31 > w32 > w33
There is no cross-comparisons between weights in each row (e.g., between w11, w21 and w31),since each row is a separate case. The weights assigned vary from:
• Not at all relevant: -2
• Not considered: 0
• Second option: 2
• Main option: 4
The higher the value of the index, the more importance was given to a particularcharacteristic by the entire population of survey respondents. The general calculation of the
L IMPORTANCE RANKING
A First Second Third Not important Rows Total
B Characteristic 1 x11 x12 x13 x14 R1
E Characteristic 2 x21 x22 x23 x24 R2
L Characteristic 3 x31 x32 x33 x34 R3
N
L IMPORTANCE RANKING
A F i r s t S e c o n d T h i r dB C h a r a c t e r i s t i c 1 w 1 1 w 1 2 w 1 3
E C h a r a c t e r i s t i c 2 w 2 1 w 2 2 w 2 3L Characteristic 3 w31 w32 w33

NESDB - Cost Structures Thailand
BJ0346/Report/FinalLast printed 27/11/02 15:05
18
index of importance takes the form of:
Note that if every respondent puts the first choice for a specific characteristic, the value of theindex can not be computed, since we will have to divide by zero. However, if all the sampledfirms did value a specific factor as the most important, calculation of the index is not needed,since its assessment in relation to the other factors with various distribution of answers isstraight forward.
Characteristic 1 M = (w1j x1j/(Nx1j)) for j=1,2,3
Characteristic 2 M = (w2j x2j/(Nx2j)) for j=1,2,3
Characteristic 3 M = (w3j x3j/(Nx3j)) for j=1,2,3

NESDB - Cost Structures Thailand
BJ0346/Report/FinalLast printed 27/11/02 15:05
19
APPENDIX 3: COMPANY-LEVEL COMPETITIVE PERFORMANCE

NESDB - Cost Structures Thailand
BJ0346/Report/FinalLast printed 27/11/02 15:05
20
APPENDIX 3: COMPANY-LEVEL COMPETITIVE PERFORMANCE
Food Processed Sector
Table A3-1: Cost and technical competitiveness of Thai Food Processing CompanyReady to Eat Meal company Dairy Product Company
T e c h n o l o g y and R&D
• Lack of trained foodtechnologist
• Should narrow range of tasks• Do not possess any patent for
food technology
• Provided by foreign partner, noR&D for new product
• No industrial R&D, R&Dpeople may lack the R&Dscientific knowledge
Equipment • Machine idleness• Need modern machine with less
labor(skilled)
• GOOD condition
Plant size ands c a l eefficiency
• Complicated resulting highoperation cost
NA
C a p a c i t y utilization
• 20% of sales under utilized dueto seasonal
• Should apply more automationfor cost improvement
• Excess capacity
I n f o r ma t i on technology
• No evidence of application • Sufficient• Little integration
P r o d u c t i o n control
• No process control system• Inventory = 100 days• Inventory turnover = 3.6
times/yr• Inventory to turnover = 22.8%
• Computerized• Inventory = 25 days• Inventory turnover = 14.8
times/yr• Inventory to turnover = 10.7%• GOOD stock management
Product ivi ty measurement and growth
• No productivity measurementmechanism
• NA but expect to achieveforeign standard
QC/QA • GMP. HACCP, ISO9002• 10%QC against norm of
4.9%
• GMP, HACCP• Fully aware, expected best
practice
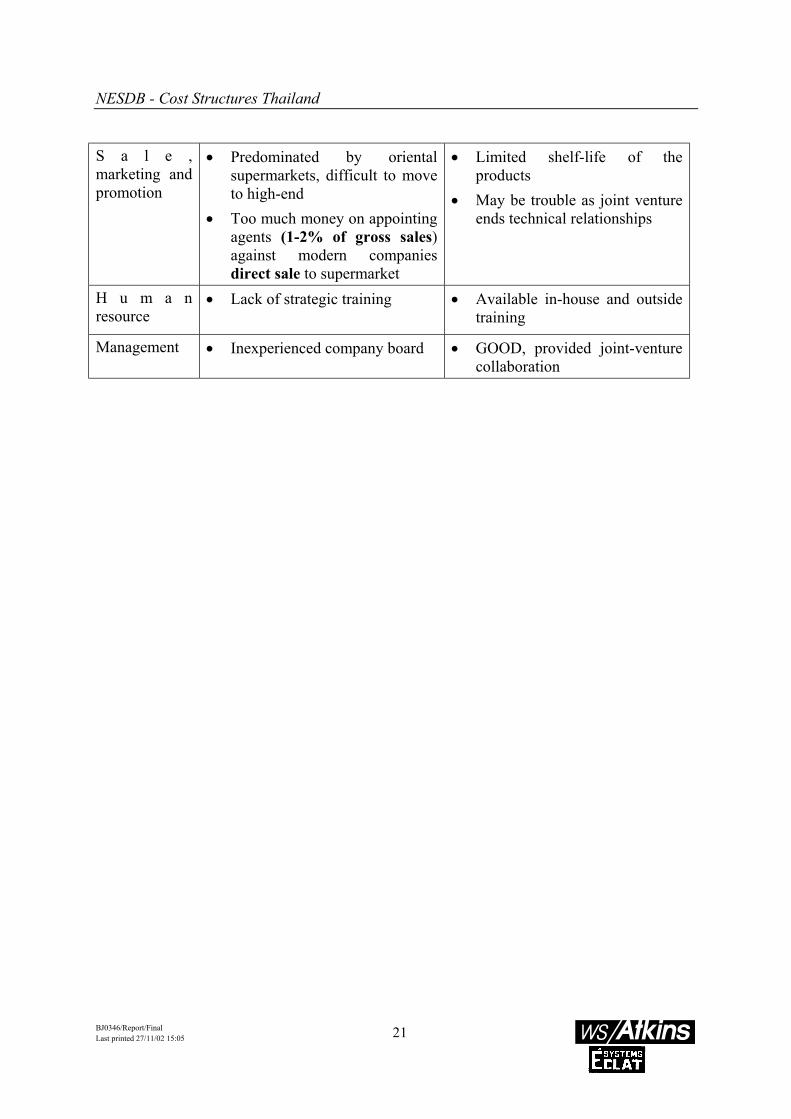
NESDB - Cost Structures Thailand
BJ0346/Report/FinalLast printed 27/11/02 15:05
21
S a l e ,marketing andpromotion
• Predominated by orientalsupermarkets, difficult to moveto high-end
• Too much money on appointingagents (1-2% of gross sales)against modern companiesdirect sale to supermarket
• Limited shelf-life of theproducts
• May be trouble as joint ventureends technical relationships
H u m a nresource
• Lack of strategic training • Available in-house and outsidetraining
Management • Inexperienced company board • GOOD, provided joint-venturecollaboration

NESDB - Cost Structures Thailand
BJ0346/Report/FinalLast printed 27/11/02 15:05
22
Table A3-2 Financial and cost structure competitiveness of Thai Food ProcessingCompany
Ready to Eat Meal Company Dairy Product CompanyF i n a n c i a l s u m m a r y , turnover andprofitability
• FAIR Gross margins 1997-99 =13-22% , UK 13.5% andaverage 8-9 %
• POOR Net profits in someyears (1997 = 7%)
• FAIR Return on investment19.4%
• GOOD Liquidity ratio = 3.29times, norm = 2.0 times
• GOOD Debt/equity ratio12.3%, Thai 40% and UK60%
• POOR velocity of capital = 1.61times
• FAIR Return on investment= 15.4%
• POOR Liquidity ratio =0.17 times
• POOR Debt/equity ratio =88% ,Thai 40% and UK60%
• POOR velocity of capital =2.32 times
• Should trim down theproducts focusing on thosecontributes to highest grossmargin
I n v e s t m e n t and financing
• Recommend fixed capitalinvestment rather than depositwith financial institution
• Loss from tuna is the hindrance
• Fully made use of domesticcredit lines and also hasaccess to internationalcredit
Cost structure • POOR Operating cost = 77.56%(1998), 86.01%(1999), norms60% and 80%
• Too much variety, swinginggross margin and net profit
• POOR Cost of utilities
• POOR Operating cost,almost 80%sales, norms of60% and 80%
• Weak products should beleft out
• Gross margin 21%• Profit before tax < 4%• POOR General and
administrative cost =15%sales, int’l <7%
Materials • No report of waste fromprocurement
• Do not know competitors’material costs
• Troublesome procurement• POOR import tax = 12 –20,
Vietnam 5%• Time consuming tax refund
process
• High price local supply ofraw milk

NESDB - Cost Structures Thailand
BJ0346/Report/FinalLast printed 27/11/02 15:05
23
Electronics Sector
Table A3-3 Cost and technical competitiveness of Thai Electronics CompanyHard Disk Company Office Automation Equipment
CompanyT e c h n o l o g y and R&D
• R&D is handled by foreignheadquarter, does not have itsown design capability
• Part of Japanese group• HIGH rank of world production• Relatively labor intensive
Equipment • POOR average age = 4 yrs ,norm = 2 yrs
• GOOD quality, well automated• BOI privileges lead to importing
equipment, better to buy newmachines
• WORSE average age = 4 yrs ,norm = 2 yrs
• BOI privileges, should considerbuying new machines
Plant size ands c a l eefficiency
• Functional manner • GOOD design with good layout,ample space for expansion
C a p a c i t y utilization
• 8 million and 4 million piecesper month , for 90% officeautomation and 10% auto parts
• 80% capacity utilization
I n f o r ma t i on technology
• Fully automated but noapplication in related functions
• IT for stock control• No integration between
production and related activities

NESDB - Cost Structures Thailand
BJ0346/Report/FinalLast printed 27/11/02 15:05
24
P r o d u c t i o n control
• POOR Claims received = 6/mth,best = 2/mth
• FAIR Claims resolved 100%,best = 100%
• POOR Stock turns = 10,best = 24
• POOR Customer contact time6% , best 32%
• POOR Inspection/direct labor =30%, best = 6%
• POOR Customer order todelivery = 60 days, averagedelivery time of raw materialfrom US = 45 days, production= 1 days
• Inventory = 35 days• Inventory turnover = 14 times/yr• Inventory to turnover = 6.6%• Scrap rate =3%
• POOR Claims received = 6/mth,best = 2/mth
• FAIR Claims resolved 100%best = 100%
• POOR Stock turns = 10,best = 24
• POOR Customer contact time6% , best 32%
• POOR Inspection/direct labor =30%, best = 6%
• Not achieving just-in-timestrategy
• Production line time = 2 days• Inventory = 54 days• Inventory turnover =6.8 times/yr• Inventory to turnover = 14.7%• Cash tied in production process
Product ivi ty measurement and growth
• GOOD Order cycle time• FAIR Stock availability• GOOD Order size constraints• FAIR Ordering convenience• GOOD Frequency of delivery• FAIR Quality of document• GOOD Product Quality• FAIR Delivery reliability• FAIR Claims procedure• POOR Order completeness• POOR Technical support• POOR Order status information• GOOD Price• POOR After sales customer care• Lack of best practice productivity
indicators
• GOOD Order cycle time• GOOD Stock availability• GOOD Order size constraints• GOOD Ordering convenience• GOOD Frequency of delivery• GOOD Quality of document• GOOD Product Quality• FAIR Delivery reliability• FAIR Claims procedure• POOR Order completeness• GOOD Technical support• FAIR Order status information• GOOD Price• FAIR After sales customer care• Lack of best practice productivity
indicators• Lewer performance for best
practice benchmarking

NESDB - Cost Structures Thailand
BJ0346/Report/FinalLast printed 27/11/02 15:05
25
QC/QA • ISO9002 • ISO9002, ISO14001• Advanced quality systems• Product safety APPROVALS• Defect rate = 0.3%• Customer rejection rate = 0.1-
0.2% as recorded by foreign headoffice
• POOR Rejection rate = 4%,best = 0.5%
S a l e ,marketing andpromotion
• Handled by foreign headquarter • Supplying volume products ofdated technology at a lower price
H u m a nresource
• POOR Recruit staying/yr = 70%,best = 98%
• POOR Maintenance headcount =1%, best = 2%
• POOR Indirect hours 24% ,best =12%
• POOR Labor turnover 14%,best = 2%
• Fair quality
• POOR Recruit staying/yr = 70%best = 98%
• POOR Maintenance headcount =1%, best = 2%
• POOR Indirect hours = 24%,best 12%
• POOR Labor turnover =14%,best = 2%
• Only in-house training
Management • Centralized • No marketing function• Centralized
.

NESDB - Cost Structures Thailand
BJ0346/Report/FinalLast printed 27/11/02 15:05
26
Table A3-4 Financial and cost structure competitiveness of Thai Electronics CompanyHard Disk Company Office Automation Equipment
CompanyF i n a n c i a l s u m m a r y , turnover andprofitability
• GOOD Return oninvestment >500%
• POOR Liquidity ratio= 1.07 times, norm =2.0 times
• GOOD velocity ofcapital = 20.11 times
• FAIR Return on investment =20.6%
• POOR Liquidity ratio = 0.5 times ,norm 2.0 times
• WORSE debt/equity ratio = 800%against Thai 40%
• GOOD velocity of capital = 18.39times
• May face difficulty if externalfinance is requested
I n v e s t m e n t and financing
• High outside partyfinancing
• Finance support from parentcompany
Cost structure • POOR Invoices paidw/i 60 days = 85%,best 98%
• POOR Productcost/sales = 72%,best 60%
• POOR Operating cost= 72.81%(1998),64.82%(1999), norms= 60% and 80%
• POOR Selling anda d m i n i s t r a t i v e expenses
• POOR Invoices paid w/i 60 days =85%, best 98%
• POOR Product cost/sales =72%,best = 60%
• POOR Content of intermediateproducts = 93%total costs
Materials • Imported from US andJapan
• POOR Delivery leadtime = 30-45 days,average = 15 days
• 60 days credit toclients, impact on cashflow
• Bargaining power overother raw materials
• Long delivery times• Delay in raw material supply• Can increase Thai content• High cost of imported mould die

NESDB - Cost Structures Thailand
BJ0346/Report/FinalLast printed 27/11/02 15:05
27
Depreciation • POOR Depreciation,investment inmachinery andequipment = 67.6%total fixed assets
• POOR Depreciation, investment inbuilding, machinery and equipment= 92.2% total fixed assets

NESDB - Cost Structures Thailand
BJ0346/Report/FinalLast printed 27/11/02 15:05
28
Apparel Sector
TableA3-5 Cost and technical competitiveness of Thai Apparel CompanyShirt, Trouser and Suit Company Sport and Leisurewear Company
T e c h n o l o g y and R&D
• Using sophisticated equipmentwith greater demand onmaintenance
• Mis-managing the technology• No product design or
development capability• Need development in skills
and technology
• Using sophisticated equipmentwith greater demand onmaintenance
• Mis-managing the technology• No product design or
development capability• Need development in skills and
technologyEquipment • GOOD sewing and finishing
equipment• GOOD working order and
maintenance
• Well invested in all areas ofproduction
Plant size ands c a l eefficiency
• Confused workflow andinefficient method ofmatching parts prior to finalassembly
• Workflow can be improved byreducing number of machines
• Better organized• Equipped with a computer-aided
management information system
C a p a c i t y utilization
• 1,500 – 2,000 trousers/day• Underutilized machines, thus
excess capacity
• Plan to extend capacity
I n f o r ma t i on technology
• No computer generatedmanagement informationsystems in integrating allelements of manufacturing
• Lack of a very good IT system
• No computer generatedmanagement information systemsin integrating all elements ofmanufacturing
• Lack of a very good IT system• Investing in a new account
package (TEGA)

NESDB - Cost Structures Thailand
BJ0346/Report/FinalLast printed 27/11/02 15:05
29
P r o d u c t i o n control
• Customer order to delivery =150 days
• Delivery time of raw materials= 105 days
• Production line = 30 days• Inventory = 82 days• Inventory turnover = 4.4
times/yr• Inventory to turnover = 19.0%• Under-performing stock
management• Require $1.25 – 1.5 mill.
Investment in capital for shirtmanufacturing to meet worldbest standard
• Require $0.6-0.75 mill.Investment in capital fortrouser manufacturing to meetworld best standard
• Should have a stronger controlto monitor production andoutput
• Customer order to delivery = 95-110 days
• Delivery time of raw materials =45-60 days
• Production line = 5 days• Inventory = 10 days• Inventory turnover = 35.3
times/yr• Inventory to turnover = 8.7%• Acceptable stock management• A little cash tied up• Investment plan to re-equip and
use updated technology• Should have a stronger control to
monitor production and output
Product ivi ty measurement and growth
• Unable to measureproductivity
• POOR Efficiency: trouser35%, shirt 52%, garment 41%; best 85%
• Unable to measure productivity
QC/QA • POOR EN ISO9001best practice “Quality atOrigin”
• 100% inspection on finishingprocess
• Emphasis on inspection andrectification than prevention
• POOR EN ISO9001 bestpractice “Quality at Origin”
• Typical quality managementsystem
S a l e ,marketing andpromotion
• Licensed USA-based brand• Subcontractor, without own
brand name
• Licensed USA-based brand• Subcontractor, without own
brand name

NESDB - Cost Structures Thailand
BJ0346/Report/FinalLast printed 27/11/02 15:05
30
H u m a nresource
• GOOD Absenteeism = 3%,world standard 8-12%
• Management lack of basicunderstanding of productionprocess
• No evidence on formaloperator skill training
• Lack of normal productionmanagement skill
• FAIR Absenteeism = 8%world standard 8-12%
• No evidence on formal operatorskill training
• Lack of normal productionmanagement skill
Management • More decentralized • Centralized

NESDB - Cost Structures Thailand
BJ0346/Report/FinalLast printed 27/11/02 15:05
31
Table A3-6 Financial and cost structure competitiveness of Thai Apparel CompanyShirt, Trouser and Suit Company Sport and Leisurewear Company
F i n a n c i a l s u m m a r y , turnover andprofitability
• Profitability = 22.13%• POOR Liquidity ratio = 0.48
times, norm = 2.0 times• POOR Debt/equity ratio =
50.2% ,Thai 40%• POOR Velocity of capital =
1.39 times
• Profitability = 22.02%• POOR Liquidity ratio = 0.51
times, norm 2.0 times• POOR Debt/equity ratio =
234% ,Thai 40%• GOOD velocity of capital =
10.48 times• FAIR Mark up = 12%,
contractor 15%, Western Europe 8-12%,
branded >30%I n v e s t m e n t and financing
• Should direct investmentdecision with confidence
• Clear policies in investment
Cost structure • FAIR Charge out rate/sm forshirt = $0.145, for trousers =$0.064, world $0.05-0.10
• POOR efficiency• POOR selling and
administrative expenses = 9.3 –15.1%, average 10% at most
• POOR Standard cost/unit• FAIR Operating cost 78%,
norms of 60-80%• POOR Direct labor to turnover
= 9-16%, norm 3.85-5.75%
• FAIR Charge out rate/sm =$0.096, world $0.05-0.10
• POOR Standard cost/unit• POOR Operating cost 89%,
norms of 60-80%• POOR Direct labor to
turnover = 9-16%,norm 3.85-5.75%
Materials • Local with some costdisadvantage , highly importproportion
• Complicated and time-consuming refund
• Local with some costdisadvantage , highly importproportion
• Complicated and time-consuming refund
Utility • Average mostly, except highcost of localtelecommunications = 3 ฿/mnUK 1.59-2.02 ฿/mn
• Average mostly, except highcost of localtelecommunications = 3 /mn,UK 1.59-2.02 ฿/mn

NESDB - Cost Structures Thailand
BJ0346/Report/FinalLast printed 27/11/02 15:05
32
Automotive Parts Sector
Table A3-7 Cost and technical competitiveness of Thai Automotive Parts CompanyPressed Metal Part Company Filter Company
Technology and R&D
• Long time design, production andtest
• Bottleneck in productionknowledge
• Lack of innovate design• Unsophisticated cost system,
unable to measure cost activity• Existed product endurance test
• Long time design, production and test• Bottleneck in production knowledge• Lack of innovate design• Unsophisticated cost system, unable
to measure cost activity• Existed product endurance test
Equipment • GOOD technology by Westernstd.
• GOOD maintenance
• GOOD technology by Western std.• GOOD maintenance
Plant sizeand scaleefficiency
• Cost of distance and non-valueadded activity
• Over-manned• Subcontracting coating and
cutting
• Insufficient space• Subcontracting coating
C a p a c i t y utilization
• 40% spare capacity• Saturated market• Over-manned, work one shift• High investment in equipment
• Excess capacity• Saturated domestic market• Poor delivery performance due to
insufficient capacity• Existing export demand
Information technology
• No MRP• Less evidence of computer on
shop• No evidence of operator’s access
to computer
• Partly implementing MRP• Less evidence of computer on shop• No evidence of operator’s access to
computer

NESDB - Cost Structures Thailand
BJ0346/Report/FinalLast printed 27/11/02 15:05
33
Produc t ion control
• POOR Stock turns = 11:1 Best = 15:1• POOR Lead time (mft.) = 3 d Best < 24 hrs• FAIR Tool change time = 7-10
mn best < 10 mn• POOR On time delivery = 97% best = 100%• Customer order to delivery = 1d• Delivery time of raw materials
= 30 days• Time on production line = 7-10 d• 6 months forecasts on demand• Relatively lower working capital• Inventory = 19 days
• POOR Stock turns = 4:1 best = 15:1• POOR Lead time (mft.) = 2-3 d best < 24 hrs• POOR Tool change time = 20-30 mn best < 10 mn• POOR On time delivery = 70% best = 100%• Customer order to delivery = 2-30d• Delivery time of raw materials = 7-45 days• Time on production line = 3-14 d• Estimate demand for aftermarket• Relatively higher working capital• Inventory = 7 days
Productivity measurement and growth
• POOR Value added/E = $12,181 best = $60,000 UK = $47,974• No measures of efficiency
• POOR Value added/E = $16,624 best = $60,000 UK = $47,974• No measures of efficiency
QC/QA • FAIR Customer rejects = 1% best = 0• NA Span of control, best = 25:1• Manager to employee = 24:1• ISO 9002• Data existing but have not been
much used• Once/week scrap report• Every 6 months random check on
raw materials
• FAIR Customer rejects < 1% best = 0• NA Span of control, best = 25:1• Manager to employee = 6.5:1• ISO 9002• Standard process inspection• Incoming, in process, and outgoing
inspection• Standard laboratory testing
S a l e ,m a r k e t i n g a n dpromotion
• Front end marketing and salestasks
• Foreign competitors with 3-4 majorcompetitors
• Insufficiency to meet current demandhinders the investment in marketing.

NESDB - Cost Structures Thailand
BJ0346/Report/FinalLast printed 27/11/02 15:05
34
H u m a nresource
• POOR Absenteeism = 6% best < 1%• Overstaffed on shop floor and in
office• Problem of employee turnover,
an investment of ฿10,000/newemployee
• Cultural barrier to improvement
• POOR Absenteeism = 3% best < 1%• POOR Employee turnover = 10%• Need more practical training• Cultural barrier to improvement
Management • Family-run firm, withdecentralization, and willingnessto accept new management skills
• Family-own business

NESDB - Cost Structures Thailand
BJ0346/Report/FinalLast printed 27/11/02 15:05
35
Table 8 Financial and cost structure competitiveness of Thai Automotive companyPressed Metal Part Company Filter Company
F i n a n c i a l s u m m a r y , turnover andprofitability
• GOOD Return on investment= 41.2%
• POOR Liquidity ratio = 0.39 ,norm = 2.0 times
• POOR Debt/equity ratio =309%, Thai 40%
• POOR velocity of capital = 2.62times
• POOR Return on investment =14.5%
• POOR Liquidity ratio = 1.43,norm 2.0 times
• POOR Debt/equity ratio =213% , Thai 40%
• FAIR velocity of capital = 4.13times
I n v e s t m e n t and financing
• Mainly on fixed assets• Domestic borrowing
• Mainly on fixed assets• Domestic borrowing
Cost structure • Profit = 12%• POOR Standard cost/unit• GOOD Selling and
administrative expenses= 4-5%, average 10% at most
• POOR Operating cost 89%,norms 60-80%
• Profit = 10-31%• POOR Standard cost/unit• GOOD Selling and
administrative expenses= 4-5%, average 10% at most
• POOR Operating cost 90%,norms 60-80%
Cost control • POOR Energy cost 686 ฿/sqm/yr,DoE 122.6 ฿/sqm/yr
Materials • Imported• Long time on waiting
• Local and overseas
Depreciation • POOR Depreciation cost due tohigh investment in machineryand equipment
• Declining balance at 20% ayear
• 80% already fully depreciatedas all machines are more than30 years old

NESDB - Cost Structures Thailand
BJ0346/Report/FinalLast printed 27/11/02 15:05
36
Plastics Sector
Table A3-9 Cost and technical competitiveness of Thai Plastics CompanyPallet, Crate, Furniture, Industrialand Automotive Part Company
Automotive and Motorcycle PartCompany
Technology and R&D
• One of the best mouldinginjection companies in Thailand
• Mostly suitable technology incurrent market
• Future thread of high wage rate• No clear separation of R&D staff• Suspected low and unbudgeted
R&D expenditure• No investment in R&D for
downstream vertical integration
• Mainly rely on Japan• No evidence of product/process
related R&D
Equipment • 2nd Grade quality and technologymoulding machine
• POOR tooling technology
Plant sizeand scaleefficiency
• Generous working areas leadingto high operating cost
• Generous working areas leading tohigh operating cost
C a p a c i t y utilization
• FAIR Production capacity= 40-85%, best = 60-85%
• Underutilized, constrained totalmoulding capacity since eachmachine can only run certain ofthe tools
• FAIR Production capacity= 40-85%, best = 60-85%
• Underutilized, constrained totalmoulding capacity since eachmachine can only run certain ofthe tools
Information technology
• Limited the investment onproduction area
• FAIR Use of IT• Implementing MRP for production
control• Use computer systems for shop
floor and managementcommunication

NESDB - Cost Structures Thailand
BJ0346/Report/FinalLast printed 27/11/02 15:05
37
Produc t ion control
• FAIR Customer order to delivery= 15-30 days, best up to 30 days
• POOR Delivery time of rawmaterials = 2-90 days, best =7 d
• POOR Stock of raw materials =up to 38 days, best = 20% ofneeded 60-90 days
• POOR Stock of finished goods =15-56 days, best up to 30 days
• POOR Typical injection runlength, too short = 2 days, bestdepends on tool set time andurgency in production
• POOR Scrap rate = 0.5-5%,best = 1-2% at maximum
• Underperforming stockmanagement
• FAIR Customer order to delivery= 15-30 days, best up to 30 days
• POOR Delivery time of rawmaterials = 2-90 days, best =7 d
• POOR Stock of raw materials = upto 38 days, best = 20% of needed60-90 days
• POOR Stock of finished goods =15-56 days, best up to 30 days
• POOR Typical injection runlength, too short = 2 days, bestdepends on tool set time andurgency in production
• POOR Scrap rate = 0.5-5%,best = 1-2% at maximum
• Acceptable stock management• Difficult control on many different
jobs running at onceProductivity measurement and growth
• POOR Product defect = 3%,best = 1%
• No advanced productivitymeasurement
• POOR Product defect = 2.47%,best = 1%
• No advanced productivitymeasurement
QC/QA • EN ISO 9002• No evidence of SPC• Adequate control, few customer
complaints
• EN ISO 9002• UL listing and certification from
American Laboratory• Adequate for small products• Insufficient for the majority
productsS a l e ,m a r k e t i n g a n dpromotion
• Target on export while defendingThai market
• 5 staff in marketing
• Buyers lost confidence in productquality
• 97% sales to domestic market• Few “own products” but plans to
have more.• 5 staff in marketing

NESDB - Cost Structures Thailand
BJ0346/Report/FinalLast printed 27/11/02 15:05
38
H u m a nresource
• FAIR Number of employee = 337, best = 250-300 staff• Over manning level due to bad
experience from machines andtools
• Slender training facility
• FAIR Number of employee = 288, best = 250-300 staff• Slender training facility
Management • Very hierarchical • Slovenly and under-utilizedappearance
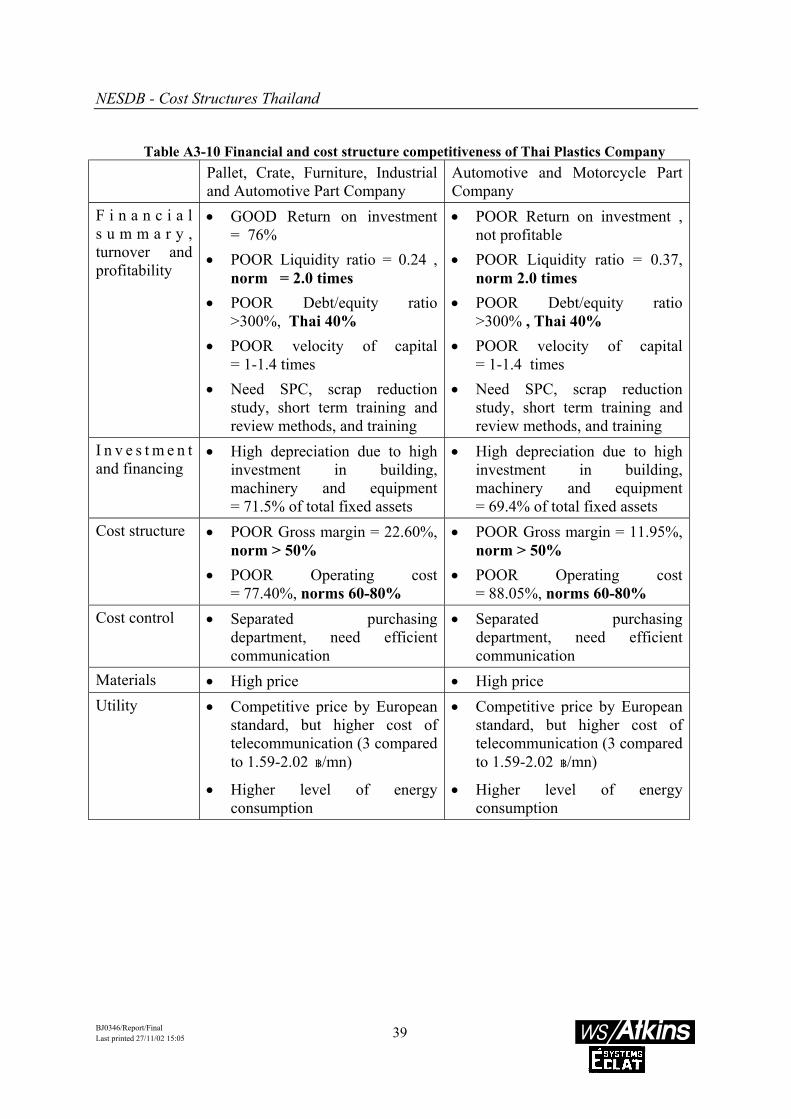
NESDB - Cost Structures Thailand
BJ0346/Report/FinalLast printed 27/11/02 15:05
39
Table A3-10 Financial and cost structure competitiveness of Thai Plastics CompanyPallet, Crate, Furniture, Industrialand Automotive Part Company
Automotive and Motorcycle PartCompany
F i n a n c i a l s u m m a r y , turnover andprofitability
• GOOD Return on investment= 76%
• POOR Liquidity ratio = 0.24 ,norm = 2.0 times
• POOR Debt/equity ratio>300%, Thai 40%
• POOR velocity of capital= 1-1.4 times
• Need SPC, scrap reductionstudy, short term training andreview methods, and training
• POOR Return on investment ,not profitable
• POOR Liquidity ratio = 0.37,norm 2.0 times
• POOR Debt/equity ratio>300% , Thai 40%
• POOR velocity of capital= 1-1.4 times
• Need SPC, scrap reductionstudy, short term training andreview methods, and training
I n v e s t m e n t and financing
• High depreciation due to highinvestment in building,machinery and equipment= 71.5% of total fixed assets
• High depreciation due to highinvestment in building,machinery and equipment= 69.4% of total fixed assets
Cost structure • POOR Gross margin = 22.60%,norm > 50%
• POOR Operating cost= 77.40%, norms 60-80%
• POOR Gross margin = 11.95%,norm > 50%
• POOR Operating cost= 88.05%, norms 60-80%
Cost control • Separated purchasingdepartment, need efficientcommunication
• Separated purchasingdepartment, need efficientcommunication
Materials • High price • High priceUtility • Competitive price by European
standard, but higher cost oftelecommunication (3 comparedto 1.59-2.02 ฿/mn)
• Higher level of energyconsumption
• Competitive price by Europeanstandard, but higher cost oftelecommunication (3 comparedto 1.59-2.02 ฿/mn)
• Higher level of energyconsumption

NESDB - Cost Structures Thailand
BJ0346/Report/FinalLast printed 27/11/02 15:05
40
Rubber Sector
Table A3-11 Cost and technical competitiveness of Thai Rubber CompanyLatex Glove Company Non-passenger Car Tyre Company
Technology and R&D
• POOR Technological capability= 0.85, best =1
• POOR R&D capability = 0.80,best =1
• No agency for biological test• Ability to design/adjust
production or test equipment• Has R&D laboratory and well-
qualified personnel• Able to develop own new
product or process• Should be more towards
improving/enlarging productquality, to be competitive
• POOR Technological capability =0.60, best =1
• POOR R&D capability = 0.40,best =1
• Old technology• Rely on self-learning, Taiwanese
technologist, ex-worker of largetyre manufacturers
• Good enough technology for low-end products
• Need R&D on compounding toreduce cost
• Lack of financing hindersimprovement in technology
Equipment • POOR Equipment = 0.85,best =1
• No microprocessor controlleddipping lines
• POOR Equipment = 0.60, best =1• Taiwanese and Chinese made• No modern technology system to
control stock/production planning• Mostly old machines (6-10 yrs)• Need ฿320 mill. investment to
reduce cost by 10%Plant sizeand scaleefficiency
• Well designed, well-protectedenvironment
• Shorter particularly designeddipping machine
• Old plan• Should redesign plant layout
C a p a c i t y utilization
• Smaller output using batchdipping
• Lack of personnel to deal withconstant changes
• Under-utilized plant, only 33%capacity utilization due toshrinking market
Information technology
• No indication on computersystem application in relatedfunctions
• Not found

NESDB - Cost Structures Thailand
BJ0346/Report/FinalLast printed 27/11/02 15:05
41
Produc t ion control
• FAIR Quality system = 1,best=1
• Stringent advanced computerizedsystem
• POOR Customer order todelivery = 30-115 days
• POOR Average delivery time forraw materials = 30-60 days
• Average time in production line= 1 hour
• Inventory = 89 days• FAIR Inventory turnover = 4.1
times/yr• FAIR Inventory to turnover =
17.4%
• POOR Quality system = 0.65,best=1
• Stock hold of raw materials = 1mth
• Poor raw material warehouse• Lack of production management
technology and planning• Average customer order to
delivery = 14 days• Average raw material delivery = 1
day• POOR Average production line
= 12days – 3 months• Waste time in working process• POOR Inventory = 231 days• POOR Inventory turnover = 5.7
times/yr• POOR inventory to turnover =
46.5%• Under-performing stock
management, cash tied upProductivity measurement and growth
• FAIR Efficiency = 0.85-0.90,best = 1
• FAIR Rejects = 1, best = 1• Not aware of productivity
measurement by computerizedsystem
• Overall productivity is 15-20%lower than the best
• NA Efficiency• POOR Rejects = 0.90, best = 1• NA Assessment on efficiency and
productivity, only product quality• 0.5% sales rejected, 0.5%
production cannot be dispatched• No attention to measure human
resource issuesQC/QA • Certificate on biological
compatibility• ISO 9001, EN 460001, ISO 9002
Canada• Stringent but better than local
SME norm• Rejection rates = 6%
• ISO 9002, TSI certificate, USDOT 1Z(tyre standard)
• Laboratory testing for quality ofrubber compounds
• Artificial road test, Taiwanesemachine, above local norm
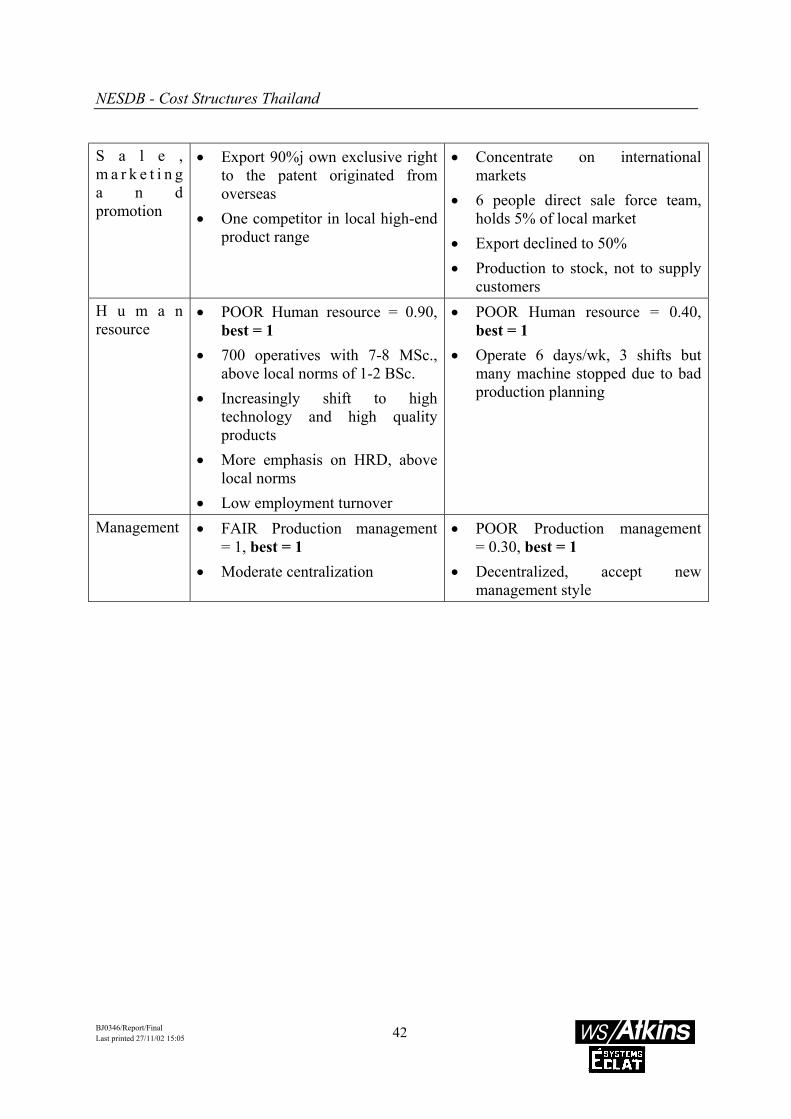
NESDB - Cost Structures Thailand
BJ0346/Report/FinalLast printed 27/11/02 15:05
42
S a l e ,m a r k e t i n g a n dpromotion
• Export 90%j own exclusive rightto the patent originated fromoverseas
• One competitor in local high-endproduct range
• Concentrate on internationalmarkets
• 6 people direct sale force team,holds 5% of local market
• Export declined to 50%• Production to stock, not to supply
customersH u m a nresource
• POOR Human resource = 0.90,best = 1
• 700 operatives with 7-8 MSc.,above local norms of 1-2 BSc.
• Increasingly shift to hightechnology and high qualityproducts
• More emphasis on HRD, abovelocal norms
• Low employment turnover
• POOR Human resource = 0.40,best = 1
• Operate 6 days/wk, 3 shifts butmany machine stopped due to badproduction planning
Management • FAIR Production management= 1, best = 1
• Moderate centralization
• POOR Production management= 0.30, best = 1
• Decentralized, accept newmanagement style

NESDB - Cost Structures Thailand
BJ0346/Report/FinalLast printed 27/11/02 15:05
43
Table A3-12 Financial and cost structure competitiveness of Thai Rubber CompanyLatex Glove Company Non-passenger Car Tyre Company
F i n a n c i a l s u m m a r y , turnover andprofitability
• GOOD Profitability = 22.27%• FAIR Liquidity ratio = 1.73 ,
norm = 2.0 times• GOOD Debt/equity ratio
> 22.69%, Thai 40%• Normal velocity of capital
• POOR Return on investment =4.63%. nearly no margin
• POOR Liquidity ratio = 0.67,norm 2.0 times
• POOR Debt/equity ratio= 279% , Thai 40%
• POOR velocity of capital= 0.46 times
• High risk situation
I n v e s t m e n t and financing
• NA • Investment in factory expansion
Cost structure • FAIR Profit margin/item = 10-15%, same as int’l std• FAIR Operating cost
= 78.54%, norms 60-80%
• POOR Profit margin = 5%,• POOR Operating cost
= 94.38%, norms 60-80%
Cost control • Found on production side only • Quite strict, several a/c sectionsMaterials • Local and overseas
• Not vertically integrated• 30-60 days raw material lead
time, considerable investment• Import chemicals and papers
due to higher quality
• Major cost item = 65%• Only 6 day rubber lead time• Mostly local except some
chemicals• Right sourcing will be benifits
Utility • Reasonalbe utility consumption= 10.3%
• Compettive by Europeanstandard but high price oftelecommunication = 3 ฿/mnUK = 1.59-2.02 ฿/mn
Depreciation • High, 84% investment inmachinery and equipment
• High, 68% investment inmachinery and equipment
• High cost of petrol and carrelated expenses
• High overhead expenses due topurchase of spare parts andfactory supply
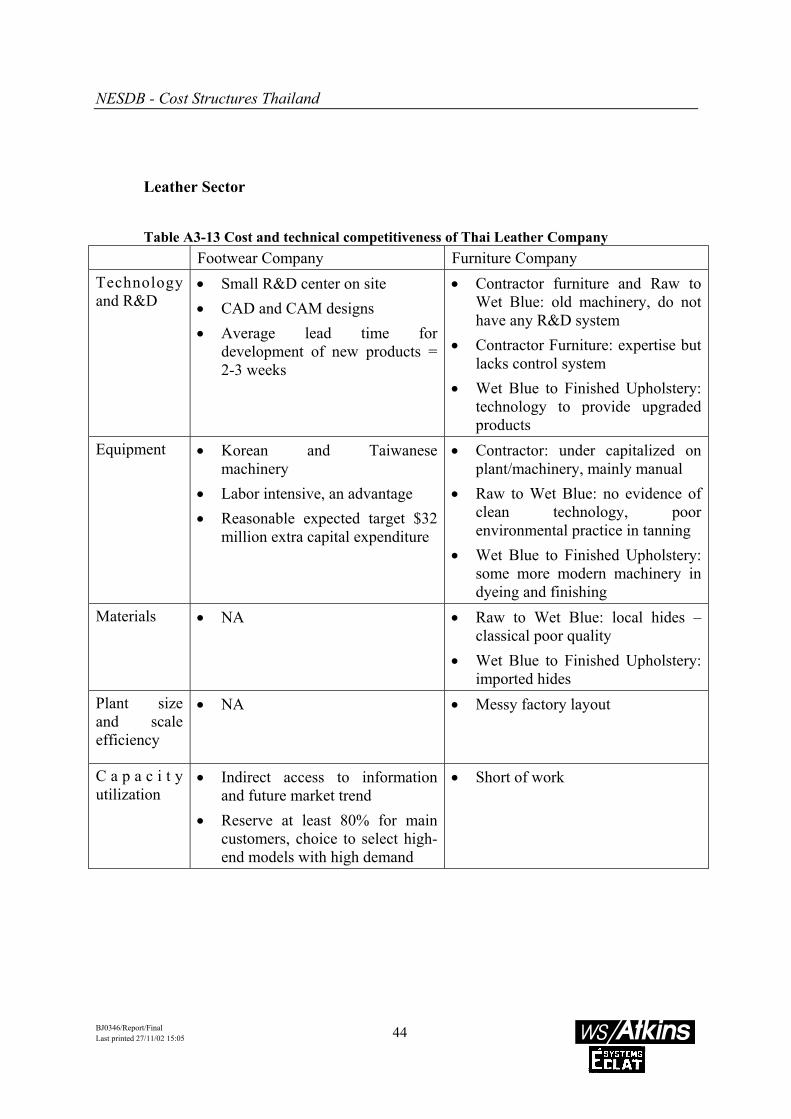
NESDB - Cost Structures Thailand
BJ0346/Report/FinalLast printed 27/11/02 15:05
44
Leather Sector
Table A3-13 Cost and technical competitiveness of Thai Leather CompanyFootwear Company Furniture Company
Technology and R&D
• Small R&D center on site• CAD and CAM designs• Average lead time for
development of new products =2-3 weeks
• Contractor furniture and Raw toWet Blue: old machinery, do nothave any R&D system
• Contractor Furniture: expertise butlacks control system
• Wet Blue to Finished Upholstery:technology to provide upgradedproducts
Equipment • Korean and Taiwanesemachinery
• Labor intensive, an advantage• Reasonable expected target $32
million extra capital expenditure
• Contractor: under capitalized onplant/machinery, mainly manual
• Raw to Wet Blue: no evidence ofclean technology, poorenvironmental practice in tanning
• Wet Blue to Finished Upholstery:some more modern machinery indyeing and finishing
Materials • NA • Raw to Wet Blue: local hides –classical poor quality
• Wet Blue to Finished Upholstery:imported hides
Plant sizeand scaleefficiency
• NA • Messy factory layout
C a p a c i t y utilization
• Indirect access to informationand future market trend
• Reserve at least 80% for maincustomers, choice to select high-end models with high demand
• Short of work

NESDB - Cost Structures Thailand
BJ0346/Report/FinalLast printed 27/11/02 15:05
45
Information technology
• No distinct indication of ITapplication
• Labor intensive operation• Tendency to gradually apply
more• Started to use CAD/CAM in
R&D functions
• Little evidence of IT
Produc t ion control
• NA Supplier lead time score.best = 3.2
• POOR Order processing leadtime = 14-21 d, best =4.4 days
• NA Manufacturing lead time,best = 8.8 days
• POOR Dispatch time (by sea)= 30 days, best = 3.8 days
• NA On time delivery,best = 91.8%
• Variety of different combinationsof products at once
• Highly systemized controlpractices
• Raw to Wet Blue: low level ofobservable control system
• Wet Blue to Finished Upholstery:built in process control system,visible attention to details
Productivity measurement and growth
• GOOD Production/hr= 163.72 sq. ft/hr/man,best = 112.2 sq. ft/hr/man
• POOR Value added per directemployee = 306.74 Baht,best = 4.23 mil.Baht
• Working very slowly, low level ofactivity
QC/QA • Internationally approved• ISO 9002• 100% raw material batch test• Notable quality• Little scrap
• Raw to Wet Blue: no complete QCsystem
• Wet Blue to Finished Upholstery:more concern, focus on QC

NESDB - Cost Structures Thailand
BJ0346/Report/FinalLast printed 27/11/02 15:05
46
S a l e ,m a r k e t i n g a n dpromotion
• Three shoe types: Low tech FOBprice $8-10, Medium tech $12-14, High tech $14-22
• 95% exported to main customers,5% retail domestic market
• Joint venture with foreignmarketing company
• High export potential contrainedby lack of original design andinternational marketing skill
H u m a nresource
• Labor intensive• Established a training system to
maintain the competitiveness• In-house training system• No training program on
marketing function
• Labor intensive• No formal training
Management • Decentralized managementsystem
• Expand upstream anddownstream industries
• Family business

NESDB - Cost Structures Thailand
BJ0346/Report/FinalLast printed 27/11/02 15:05
47
Table A3-14 Financial and cost structure competitiveness of Thai Leather Company
Footwear Company Furniture Company
F i n a n c i a l s u m m a r y , turnover andprofitability
• GOOD Return on capitalinvested = 83%
• POOR Liquidity ratio = 0.26,norm = 2.0 times
• POOR Debt/equity ratio>600%, Thai 40%
• High risk of indebtedness
• NA
I n v e s t m e n t and financing
• Share capital in related parties
• Foreign debts and domesticborrowings
• NA
Cost structure • Sport shoe: POOR Margin/unit= 4%. Selling and admin. 7%,net loss
• Sole Unit: Margin/unit – 18%,GOOD Net margin = 11%.average 10% at most
• Sport shoe: FAIR Operatingcost = 74.35%, norms 60-80%
• Sole Unit: POOR Operatingcost = 83.41%, norms 60-80%
• Electricity = 90% utility cost
• Machinery related = 96%maintenance cost
• NA
Cost control • Sport Shoe: Recommendcellular manufacturing system
• Sole Unit: Spectrophotometercolor computer measuringdevice
• NA

NESDB - Cost Structures Thailand
BJ0346/Report/FinalLast printed 27/11/02 15:05
48
Materials • Sport Shoe: difficulty inreturning good outsidespecification
• NA

NESDB - Cost Structures Thailand
BJ0346/Report/FinalLast printed 27/11/02 15:05
49
APPENDIX 4 – ASSESSMENT OF UTILITIES COSTS
In order to assess the level of utilities costs vis a vis expected costs elsewhere, theconsumption of water, electricity and telecommunications was estimated on an annual basisaccording to the manufacturing area (in sq. meters) or the number of employees for thecompanies visited. The maximum demand levels were not considered since these relatechiefly to the pattern of demand and the adequacy of infrastructure and not, a priori, to asimplified model of the running costs of the industrial units.
Energy: Electricity and Gas
The Department of the Environment in the UK has issued a document Introduction to EnergyEfficiency in Factories and Warehouses as part of its Best Practice Programme, which setsbenchmarks for energy use for a number of different categories of industrial activity. Unlessconsumption figures for an existing plant are considered (which would quickly becomeinappropriate for products with differing characteristics) it is necessary to make a number ofassumptions which clearly permit consumption figures to be modified in the future to reflectchanges in circumstances, such as additional shift working. On the basis of this information,energy consumption yardsticks are developed which provide median figures that are used toestimate consumption of electricity and gas.
Water
According to WS Atkins' experts the amount of water consumed varies between 25 and 40litres per person per day. It was therefore assumed that general manufacturing wouldconsume the least water, at 25 litres per person per day of 7.5 hours. This equates to 3.33litres per employee per hour. These figures were then applied to the number of employeesengaged in each operation to determine the annual water consumption given the workingpractices assumed in the DoE report (used for the estimation of electricity) - assuming 52weeks worked per year
Telecommunications
The WS Atkins Telecommunications experts base their assumptions about consumption ofthis service on the number of office staff that are employed. They estimate that as a generalrule 10% of office staff time is spent on the telephone, and that in manufacturing industriesthe average breakdown is 50% for incoming calls and 50% for outgoing calls. Thetelecommunications consumption figures on an annual basis amount to 5% of total staffoffice time. It is assumed that these figures include fax and Internet operations. As the cost

NESDB - Cost Structures Thailand
BJ0346/Report/FinalLast printed 27/11/02 15:05
50
per call within Bangkok is 3 Baht irrespective of the duration, all calls are assumed to be on aregional basis. The cost per call within Thailand varies between 6 Baht and 30 Baht perminute for daytime calls.
In summary, the aggregate expected cost of utilities is much lower than that provided by thecompanies. Since the consumption rate is average for the industries (or slightly aboveaverage in some cases), the rate charged by the Thai service providers is much higher thanwhat is expected elsewhere. Indeed, a good indicator of utility costs is the actual rate chargedin Thailand vis a vis what other firms around the world face. The following table shows theprices charged in North Wales (UK). This region has been selected as a benchmark becauseWS Atkins staff concluded after a study completed in July 1999, that North Wales appearedto face above average charges for public utilities than most of the other regions within theEuropean countries examined (Spain, France, Belgium, Germany, Eire, and UK).
Table A4-1: Benchmarking Prices of Utilities against North Wales
B e n c h m a r k i n g Region
Electricity (Baht/kWh)
Water (Baht/cubicMt)
Local Telecommunications(Baht/minute)
Thailand 2.173 11.51 35
North Wales (UK) 3.324 50.22 1.59-2.026
Notes: (1): Type 2 rate being applied to state enterprises and any industrial activities. Itrepresents bulk sale excluding VAT. (2): The amounts of water involved are relatively smalland hence are charged at standard domestic water rates. Larger consumption would lead tolower prices per unit but with a fixed front-end charge. (3): Average unit price sold toindustrial endusers. (4): Amounts over 500,00 kWh p.a. are subject to individual negotiation;the indications are that the unit cost would go down to circa 3 Baht per kWh for day use. (5):Price per call irrespective of duration. (6): There are substantial reductions for large volumedemand. (7): Annual consumption of 1 million kWh or more is at a negotiated price. It isestimated that prices could be negotiated down as low as 0.8p per kWh.
It appears that the companies visited purchase electricity at a slightly lower price than thatprovided by the Department of Energy. According to the companies, electric power isslightly cheaper at an average of 1.825 Baht/kW-hr than 2.17 Baht/kW-hr.
The above table shows that prices charged in Thailand are similar to those in European andtherefore high for the region. It is clear, however, that slightly high consumption rate than

NESDB - Cost Structures Thailand
BJ0346/Report/FinalLast printed 27/11/02 15:05
51
expected arises from over-staffing. For example, it can be assumed by European standardsthat office staff account for approximately 10% of a single shift. The number of office staff(all non-manufacturing) for the companies visited is therefore higher than the numberexpected in manufacturing environments elsewhere.

NESDB - Cost Structures Thailand
BJ0346/Report/FinalLast printed 27/11/02 15:05
52
APPENDIX 5. RESULTS OF THE CONSULTATIVE SEMINAR

NESDB - Cost Structures Thailand
BJ0346/Report/FinalLast printed 27/11/02 15:05
53
RESULTS OF THE CONSULTATIVE SEMINAR
INTRODUCTION
The consultative seminar held on the results of the study was primarily aimed atrepresentatives of Thai industry and reported on the overall findings of the study, includingthe findings on cost structure, qualitative factors in competitiveness, and the strengthsweaknesses opportunities and threats of each sector. The policy options considered by theConsultants were presented, and additional suggestions invited. The participants were invitedto give their views on the policy options, their viability and their perceived benefits and theimpact on particular interest groups.
Overall, the main priorities given by industry to needs/issues which at the present make theircost structure uncompetitive are:
• Training of skilled labour (mainly processed food, auto parts, rubber productsand leather goods);
• Tariff reduction (mainly processed food, rubber products and leather goods);• Development of local raw material sources and feeder industries (mainly
plastic products and leather goods);• Reduction of electricity rates (mainly processed food and plastic products);• Human resource development including engineering and management training
(mainly electronic appliances, garments, plastic products and rubber products);• Development of brands and marketing support (mainly garments and leather
goods);• Technology and R&D support in various forms (e.g. financing of technology
and know how transfer, setting up of testing centres, labs, etc).
In addition, industry sees a high number of normal business activities currently developed bythe private sector, as responsibility of government. This assumption may stop the privatesector being more innovative and taking charge of its own development. Increasingcompetition may act as a motivating force for companies to change the management culturecurrently in place, leading to an increase in competitiveness.
The rationale behind the recommendations suggested was sometimes quite unclear resultingfrom vague and generalised comments. Nevertheless, the key points raised andrecommendations suggested are reported in full.

NESDB - Cost Structures Thailand
BJ0346/Report/FinalLast printed 27/11/02 15:05
54
SUMMARY OF KEY POINTS RAISED ON FACTORS AFFECTING COSTSTRUCTURE OF INDUSTRIES
Processed Food Industry
The industry stated that it lacked raw materials of the right quality and trained personnel. Inaddition, some products face difficult product development stages. Overall, Thai companiesdo not appear to be experimenting with machinery or production processes but rather theytend to use substitutes for patented ingredients4 to attain better products. This is a commonpractice if scientific knowledge on food technology is limited. Firms would be better off bypurchasing strategic ingredients to jump-start their product development. The main factorsmentioned by industry as affecting competitiveness through costs are related to taxation,government policies, raw materials, and R&D. These are as follows:
• Operations Management: high levels of stocks of materials are a financialburden for companies.
• R&D: The industry lacks capability in food research, and the little informationavailable is not properly made use of.
• Taxation: Long delay in refund of Vat results in higher cost.• Basic Infrastructure: lack of tap water supply to zones other than BOI’s
increases the costs of water supply. Electricity rates are high formanufacturing facilities.
• Official procedures: Farmers and the FDA in other provinces take a longertime to register brand names and obtain FDA approval. This extra burden is acost burden to them and could be reduced if the government made thenecessary arrangements to facilitate registration and approval procedures inprovinces other than Bangkok.
Electronic Appliances
Industry stated that sometimes local intermediate materials might not meet the quality levelsdemanded by the market causing imports to take place. The purchase of these importedmaterials is expensive for industry because import tariffs are high and at the same timereduces cost competitiveness of the finished product because import tariffs for products arevery low and sometimes nil.
4 Specific ingredients (e.g. hydrolyzed protein which is a second derivative from milk) are patentable.Equipment can be patented under laws but product process is rarely patentable under laws in most countries.

NESDB - Cost Structures Thailand
BJ0346/Report/FinalLast printed 27/11/02 15:05
55
The main factors mentioned by industry as affecting competitiveness through costs arerelated to technology. The lack of an adequate IT infrastructure for e-commerce hinders theimplementation of modern logistic processes. In contrast, better IT infrastructure in othercountries results in lower logistic costs. The efficiency of these logistic systems is furtherenhanced by active contribution made by custom departments which act as service industrieswith genuine expertise in each individual sub-sector.
Garments
Due to rather short product life cycles, new product development lead-times are also veryshort. This forces manufacturers to choose carefully not only those products which arecompetitive, but also those which can be developed in a shorter time than competitors. As aresult, there is a trend towards use of higher value textiles, reduced may costs, increasedproductivity and production of higher value added garments. Indeed, the benefits ofproducing high value added garments (i.e. sportswear) are widely recognized and as a resultsome product lines have been developed. However, the types of products manufactured arerelatively limited. The industry has not developed enough to be able to establish internationalbrands or develop own designs, except for Thai Silk.
Currently, the industry associations led by the textile association coordinate skilldevelopment. The main factors mentioned by industry as affecting competitiveness throughcosts are related to technology. Technology is constantly changing which makes verydifficult and extremely costly the continuous training of employees. Similarly, the lack ofup-to-date technology results in a reduced number of new styles being produced by industryand in 40% less production efficiency of those standard products.
Auto Components
Best practice in Thai is still lower than international. The industry relies on intensive may dueto the lack of knowledge on the applicability of technology, and lacks good managementparticularly at SME level. This results in poor practices in these firms, and little training ofstaff because the local entrepreneurs are afraid that their workers will leave the company oncethey acquire the necessary skills. In addition, local industry feels a general lack of support bythe government at the same time as over encouragement and promotion of foreigninvestment.
The main factors mentioned by industry as affecting competitiveness through costs arerelated to technology mainly the lack of spare parts which have to be imported increasing

NESDB - Cost Structures Thailand
BJ0346/Report/FinalLast printed 27/11/02 15:05
56
costs.
Plastic Products
Industry did not think that the material costs from the Thai petrochemical industry weresignificantly higher than international levels. Import duties, in any case, will be reduced to5% in 2003.
The main factors mentioned by industry as affecting competitiveness through costs arerelated to the lack of product focus, the manufacturing of moulds, taxation, and high costs ofutilities (electricity and water). Industry recognises that increased product focus (byemphasizing on specific products) will boost productivity and increase production capacity.
Rubber Products
The rubber products industry sees itself as comprising two sectors; a large one, whichproduces for major international brands, and a smaller one, which caters for the domesticmarket under Thai brand names. The private sector feels that if the local rubber productsindustry is competitive, Thailand can evolve into a major rubber products' producing country.The main factors mentioned by industry as affecting competitiveness through costs arerelated to shortage of skill labour, high cost of raw materials and lack of market information.
Leather Goods
The leather products industry is currently emphasizing the need for manufacture of highfashion items and hopes to catch up with international competitors in the long term. For this,specialty leathers must be imported. The upholstery industry as well as the leather goodsindustry would benefit from the development of a high quality local tanning industry.Presently the raw materials of the local market are of low quality and lack of cooperationbetween the two industries, resulting in import of raw materials which causes the cost to behigh.
The main factors mentioned by industry as affecting competitiveness through costs arerelated to raw materials, technology, skilled may, cost of utilities, and own designs.Efficiency of the machinery is still low, which also causes production costs to be high.

NESDB - Cost Structures Thailand
BJ0346/Report/FinalLast printed 27/11/02 15:05
57
SUMMARY OF RECOMMENDATIONS GIVEN BY INDUSTRY
The following table summarises the priorities given by participants to the needs faced byindustry. Those for which industry had specific suggestions will be expanded below.

NESDB - Cost Structures Thailand
BJ0346/Report/FinalLast printed 27/11/02 15:05
58
Table A5-1: Priority given by Industry to recommendations suggested at the Consultative WorkshopIndustry Food Electronics Garments Automotive Plastics Rubber
TyresGloves Leather
FootwearLeather
Furnitureand
Tanneries
Smallleathergoods
Raw material – all including development ofLocal sources and feeder industries
1st 3rd 3rd 1st 1st
Abolition of Local contents – Extendadjustment period
5th
HR Development 2nd 3rd 6th
Training skilled labour 2nd 7th 3rd 2nd
Training – Engineering 4th 4th
Training – Management 5th 3rd
Training – Improve quality. Technical collegescan follow Malaysian model
1st
Technology – Financing for specialty tech 3rd
Technology – transfer of tech and know how 4th 4th 2nd
Technology upgrading and productivity ofsuppliers
3rd
Tariff reduction 1st 2nd 4th
Tariff harmonisation 1st
Environmental and ethical – non tariff barriers– need education mainly in SMEs
5th 5th
Marketing – Development of brands 2nd 3rd 1st
Marketing – Training 6th
Laboratory 4th
Testing Center 2nd
Distinction between patents and trademarksaccording to degree of innovationMarket Liberalisation – competition policy –for whole sector
1st
Simplify industry structure – emphasise supplychain management
7th 1st
Reclassification of industry 1st
Industry Food Electronics Garments Automotive Plastics Rubber Gloves Leather Leather Small

NESDB - Cost Structures Thailand
BJ0346/Report/FinalLast printed 27/11/02 15:05
59
Tyres Footwear Furnitureand
Tanneries
leathergoods
Creation of specific government department 3rd 5th
Establishment of centre for industryinformationDecentralisation of government agencies tosupport provinces
4th
IPO – Like schemes 4th
Communication government – private sector 2nd 5th
Draft Norms in line with international standardsand provide informationFinancial support – mainly SMEs 8th 6th
National IT infrastructure 7th
Losses due to transfer pricing – use of audittrails at customs, or force companies toglobalise re parent companies
8th
Lower electricity rates 6th 2nd
Guarantee of water supply to areas other thanBOI promotional zone
5th
Source: Compiled by the Federation of Thai Industries based on the discussions held at the Consultative Seminar.

NESDB - Cost Structures Thailand
BJ0346/Report/FinalLast printed 27/11/02 15:05
60
Food Processing
• Tariff reduction• Government support: draft policies taking into account the entire industry and
not only the processed side of it or the raw material side of it; decentralisegovernment agencies to support provinces better; provide one stop informationcenter particularly to make information available to farmers so that they willbecome more knowledgeable and understanding of what the processed foodindustry needs.
• Utilities: guarantee water supply and reduce electricity rates for manufacturingfacilities.
• Raw Materials: help in the outsourcing of quality materials and reasonableprice; give incentives to promote food processed products that Thailanddoesn’t have (selective policy planning).
• R&D: upgrade the National Food Research Institute and select individualproduct lines with increased budgets; support a science institution ordepartment including research work; promote and encourage the gathering ofinformation and know how of food industry.
Electronic Appliances
• Tariff: harmonise tariff for raw materials and finished products – current tariffdifferential gives a cost competitive advantage to imported finished productsbut also creates confusion in industry as the HS code used is difficult to applyfor the classification of items (raw materials, parts and finished products havedifferent tax rates).
• Suppliers’ technical capabilities: provide One-Stop service such as IPOschemes from Singapore which are useful in supporting production byupgrading technical capabilities of suppliers regarding stock control systems(BOI is already providing similar services).
• Feeder Industries: encourage growth of components’ manufacturing and of itslink with industry by promoting the location of suppliers near manufacturersof end products.
• Human resource development: provide tax incentives or subsidies for in-plantor in-house training.
• Earnings and capital investment: address transfer pricing used by foreigncompanies as means to reduce reported profits in Thailand by implementingadequate audit trailing mechanisms at Customs.
Garments
• Styles of products; support supply chain management so that better qualityfabrics are manufactured.
• Market: help the private sector in developing international markets; find newmarkets for entrepreneurs; give importance and funding to international tradeshows so that industry can learn about international standards and be updatedon market information.

NESDB - Cost Structures Thailand
BJ0346/Report/FinalLast printed 27/11/02 15:05
61
• R&D: provide support from related government agencies; attract expertisefrom Taiwan and Hong Kong which are seen to have the know how and thetechnology.
• The government: draft policies that address the whole industry; provideincentives for product lines which are competitive with a few to reducemanufacturing of product lines which are competitive.
Auto Components
• Government: give incentives to promote sectors that have low productioncosts.
• Technology: support the development of production processes that use lessmay in production; support the local production of spare parts to reduce costs.
• May: support development of may to meet international skill levels andencourage stronger social responsibility, establish a specialised centre onhuman resource development for the industry
Plastic Products
• Tariffs: equate the import duty on machinery spare parts and machinery.Currently the spares attract higher duty than machinery. As a consequence,sometimes it is more economic to replace a machine rather than repairing it.
• Technical Education: reform of technical colleges using Malaysia as a rolemodel for technical education. The Thai colleges suffer from having obsoletemachinery and shortages of good trainers. In Malaysia, there is a technicalcollege covering plastic products manufacture which provides operativetraining on “state of the art” equipment. Industry does not know how thiscentre is funded but the possibility of outsourcing technical colleges to theprivate sector with a detailed specification of the type and volume of trainingrequirements was discussed. Cheap student loans are available for youngpeople wanting to be trained technically.
• Management Training: make management training available especially incosting systems for SMEs
• Utilities: reduce energy costs as these are an important cost especially in PVCmanufacture (15-20% of total costs). Currently, electricity prices are relativelyhigh (twice that of neighbouring countries) but industry is hopeful that theimplementation of the “Power Pool” planned to start in 2 years time whichlead to lower prices. Similarly, price of water has been increasing in the lastyears.
• Raw materials: support local feeder industries which at the moment are notbeing able to supply special materials
• Finance: encourage financial restructuring as industry has high debts/financing charges.
• Government: provide information on opportunities in export markets (e.g.standards, commercial); help in marketing particularly for SMEs whichaccumulate large stocks of finished products; provide incentives on sales toThai customers who purchase and then export Thai products.
NESDB - Cost Structures Thailand
BJ0346/Report/FinalLast printed 27/11/02 15:05
62
Rubber Products
• R&D: encourage universities to train larger numbers of rubber technicians. Atthe moment, there are few universities and technical schools providingsuitable training for skilled engineers (Songkhla University does not turn outenough graduates specialised in the rubber industry). This results in low levelsof R&D performed in the industry.
• Labour Training: emphasise training on use of technology and qualitystandards, continuous upgrading of engineering knowledge, and spreadknowledge of international standards for management.
• Government: set up a Rubber Council comprising both private and publicsector representatives to look into the demand and supply side at the sametime. In the past the efforts have focused on the supply side; set up a singleorganisation looking after the special interests of the rubber industry.Presently the duties are being dissipated through out several governmentbodies without any linkage in their respective policies; sponsor visits fromforeign specialists in rubber industry.
Leather Products
• Technology: promote use of foreign technology to achieve fastermanufacturing times of leather goods; sponsor foreign expertise visiting thecountry with a view to increase the quality of the local leather via better use oftechnology.
• Raw materials: promote the use of local materials instead of importedmaterials; encourage quality upgrade of local raw material and reducedependency on imports.
• Management: promote power delegation to younger generations more in tunewith market requirements.
• Supply chain: encourage a regular forum between tannery and leather industryto have better coordination.
• Brand names: promote and encourage developing own brand name so theproduct development can meet needs of both local and international market.
• Government: promote the development of domestic market as well as theexport market; draft policies that relate the leather products industry to theleather tanning industry.
KEY CONCLUSIONS OF THE CONSULTATIVE SEMINAR
Liberalisation is seen as an important issue and industry would like to see governmentdepartments (which draft policies) taking into account all products involved in the supplychain and indeed in each sector. Although tax exemptions exist (for those importing rawmaterials for the export market and those investing in new technology), manufacturers feelthat it is not enough. It was also mentioned that government agencies could be decentralised

NESDB - Cost Structures Thailand
BJ0346/Report/FinalLast printed 27/11/02 15:05
63
enough to provide adequate support to industry located in the provinces. Malaysia wasmentioned as an example of such system and Malaysian policy in rubber encourages thedevelopment of the whole sector, not just rubber plantation. In Thailand, protection policiesfor planters are leading to higher cost of imported synthetic rubber which is required toproduce the variety of rubber products required by the industry.
Distinction between patents and trademarks according to degree of innovation was suggested.In our opinion, it appears by the comments made that the process of registration confusesindustry leaders. Current laws make a distinction between trademarks and patents and thechoice between the two is up to the interested company. Both patents and trademarks comeunder the jurisdiction of the Department of Intellectual Property (ministry of Commerce).The system appears to be fair and not biased against a bona fide Thai innovation. The costinvolved in registration is nominal (circa Baht 8-10,000 per application) but the time frameinvolved is expensive in terms of delays caused to production. It takes 10-14 months fromthe time the application is submitted to the Department – time mainly spent in verifying thatthe work has not already been registered in other major countries.
The issue of how to encourage automation with prevailing surplus is difficult for all policymakers. It appears that the requirement for importation of brand new machines instead ofsecond hand is expensive for industry. In addition, there is no appraisal service for second-hand machines and these machines cannot be used as collateral with financial institutions. Inour opinion, the BOI’s machine upgrading scheme points to the right direction but furtherhelp is needed such as the provision of appraisal services for second-hand machinery and theconsideration of these assets by financial institutions as collateral.
From the survey we conducted, the gross margins achieved by industry appear to be low.Industry confirmed that productivity improvement may not be enough to offset financialcharges faced by industry. In our opinion, companies should try to attain a debt/equity ratioof 1:2 at the maximum.