Embed Size (px)
Citation preview
8/4/2019 Cost Optimization & Diagonstic
http://slidepdf.com/reader/full/cost-optimization-diagonstic 1/70
Conducting Company Diagnostic &Cost Rohit Anand
Optimization Strategy 10BSP1025
Page 1
A
Conducting Company Diagnostic and
to develop Cost Optimization Strategy
for XYZ Company
Final Report
10th May, 2011
Rohit Anand, 10BSP1025
Interim Report submitted in partial fulfilments of requirement of PGPM Program of ICFAI Business School
8/4/2019 Cost Optimization & Diagonstic
http://slidepdf.com/reader/full/cost-optimization-diagonstic 2/70
Conducting Company Diagnostic &Cost Rohit Anand
Optimization Strategy 10BSP1025
Page 2
A
REPORT
ON
CONDUCTING COMPANY DIAGNOSTIC AND TO
DEVELOP COST OPTIMIZATION STRATEGY FOR XYZ
COMPANY
BY:
ROHIT ANAND
10BSP1025
FOR:
X.Y.Z. LIMITED
ON BEHALF OF
FINTEQ INDIA LIMITED.
A REPORT SUBMITTED ON PARTIAL FULFILLMENT OF THEREQUIREMENTS OF P.G.P.M. PROGRAM OF IBS KOLKATA
DISTRIBUTUION LIST:
SUBMITTTED TO:
Mr. ANUJ JAIN (FACULTY GUIDE);
Mr. SUMANTO GHOSH (COMPANY GUIDE)
DATE OF SUBMISSION: 10th
May 2011
8/4/2019 Cost Optimization & Diagonstic
http://slidepdf.com/reader/full/cost-optimization-diagonstic 3/70
Conducting Company Diagnostic &Cost Rohit Anand
Optimization Strategy 10BSP1025
Page 3
ACKNOWLEDGEMENT
To acknowledge all the persons who had helped for the fulfilment of the project is notpossible for any researcher but in spite of all that it becomes the foremost responsibility of the researcher and also the part of research ethics to acknowledge those who had playeda great role for the completion of the project.
I would also like to express my deepest gratitude to MR.JAYANTA CHATTERJEE, Chairman-
FINTEQ ENTERPRISE PVT. LTD, and my company guide MR. SUMANTO GHOSH , who
stood by me as a beacon of light, guiding me and believing in my convictions and calibre
and providing me a platform to learn and experience the real market challenges and the
corporate environment along with enhancing my financial knowledge and Interpersonal
skills.
I also express my special gratitude to ICFAI Business School, Kolkata (IBS, Kolkata) for
excellent facilities provided by the institute in the form of library and computer lab.
This project report and the learning process behind it would not have been possible
without the guidance of my faculty guide, Prof. Anuj Jain. He was able to impart me with
the right approach that my training required for its successful practical implication. I was
involved with FINTEQ ENTERPRISE PVT. LTD for three months and I came across a lot of
people who put in their time and effort towards acclimatizing me to the workings of the
organization. This Summer Internship Program was of utmost importance for me as this
program added value towards my path of knowledge.
Last but not the least, I would like to thank all my colleagues and friends who have directly
or indirectly contributed in my endeavour and helped me complete this project. Thanks a
lot.
So in the same sequence at very first, I would like to acknowledge my parents because of whom I got the existence in the world for the inception and the conception of this project.Rest all those people who helped me are not only matter of acknowledgment but alsoauthorized for sharing my success.
Rohit Anand
10BSP1025
IBS KOLKATA

8/4/2019 Cost Optimization & Diagonstic
http://slidepdf.com/reader/full/cost-optimization-diagonstic 4/70
Conducting Company Diagnostic &Cost Rohit Anand
Optimization Strategy 10BSP1025
Page 4
AUTHORISATION
This is to certify that an Final report titled ―‖Conducting Company Diagnostic and Cost
Optimization Strategy for X.Y.Z‖ ―
--- is being submitted as a component in the evaluationof Summer Internship Program for the requirement of PGPM program of ICFAI Business
School, Kolkata.
8/4/2019 Cost Optimization & Diagonstic
http://slidepdf.com/reader/full/cost-optimization-diagonstic 5/70
Conducting Company Diagnostic &Cost Rohit Anand
Optimization Strategy 10BSP1025
Page 5
TABLE OF CONTENT
EXECUTIVE SUMMARY 6
INTRODUCTION 7
PROCUREMENT & STORING 8-10
SUPPLY CHAIN 11-14
PRODUCTION & ITS DEFECT 15-18
STOCKING & LOGISTICS 19-24
XYZ AND ITS DEFECT 24-35
LEAD TIME REDUCTION WITH GRAPHS36-46
SUPPLY MANAGEMENT 47-52
OPTIMIZTION MODELS & TECHNIQUES 52-68
CONCLUSION & REFERENCE 69-70
8/4/2019 Cost Optimization & Diagonstic
http://slidepdf.com/reader/full/cost-optimization-diagonstic 6/70
Conducting Company Diagnostic &Cost Rohit Anand
Optimization Strategy 10BSP1025
Page 6
EXECUTIVE SUMMARY
Objective
To conduct Diagnostic study and to develop Cost Optimisation Strategy for X.Y.ZCompany.
Methodology
Data / Information Collection Desk research of the market Desk research of the various cost drivers Organization Structure and Segregation of Responsibility Studying various aspects of Variable Cost and its impact on the company. Projected Demand & Sales and Gap Analysis
Sensitivity Analysis, Variance Analysis and suggested solution BEP analysis Developing a full scale Financial Model Control design to mitigate risk Working On Cost Optimization Strategy. Discussion with XYZ Company Constant review and control to maintain cost under control
Limitation
Name of the company cannot be mentioned. We have to depend upon secondary data.
8/4/2019 Cost Optimization & Diagonstic
http://slidepdf.com/reader/full/cost-optimization-diagonstic 7/70
Conducting Company Diagnostic &Cost Rohit Anand
Optimization Strategy 10BSP1025
Page 7
Introduction
Your ultimate goal is to increase company profitability —either making unprofitable
customers profitable, or making profitable customers more profitable! If you don’t know anaccurate Cost-to-Serve for current customers and products, you can’t even get startedimproving profitability.
There are multiple methods and disciplines to achieve this, and the distinctions betweenthem are not always clear. The terms ―Activity -based Costing‖ (ABC) and ―Costto -Serve
Analysis‖ (CTSA) are used to describe two different cost modeling approaches, both of which require allocating indirect costs to cost drivers in a process or supply chain model.Further, Supply Chain Network Design and Cost-to-Serve Optimization are both supply chain optimization disciplines that can identify and reduce costs and increase profitability.
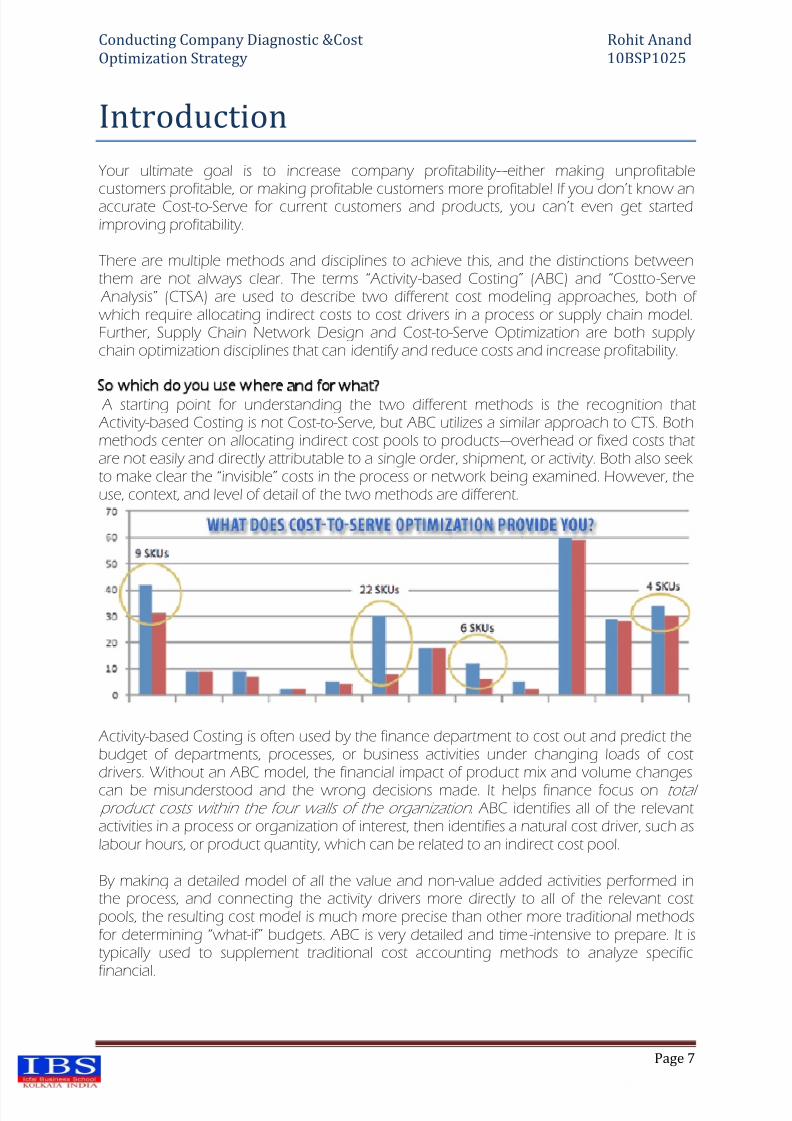
So which do you use where and for what? A starting point for understanding the two different methods is the recognition that Activity-based Costing is not Cost-to-Serve, but ABC utilizes a similar approach to CTS. Bothmethods center on allocating indirect cost pools to products —overhead or fixed costs thatare not easily and directly attributable to a single order, shipment, or activity. Both also seekto make clear the ―invisible‖ costs in the process or network being examined. However, theuse, context, and level of detail of the two methods are different.
Activity-based Costing is often used by the finance department to cost out and predict thebudget of departments, processes, or business activities under changing loads of costdrivers. Without an ABC model, the financial impact of product mix and volume changes
can be misunderstood and the wrong decisions made. It helps finance focus on total product costs within the four walls of the organization . ABC identifies all of the relevantactivities in a process or organization of interest, then identifies a natural cost driver, such aslabour hours, or product quantity, which can be related to an indirect cost pool.
By making a detailed model of all the value and non-value added activities performed inthe process, and connecting the activity drivers more directly to all of the relevant costpools, the resulting cost model is much more precise than other more traditional methodsfor determining ―what -if‖ budgets. ABC is very detailed and time -intensive to prepare. It istypically used to supplement traditional cost accounting methods to analyze specificfinancial.
8/4/2019 Cost Optimization & Diagonstic
http://slidepdf.com/reader/full/cost-optimization-diagonstic 8/70
Conducting Company Diagnostic &Cost Rohit Anand
Optimization Strategy 10BSP1025
Page 8
Task Assigned
Conducting Company Diagnostic and to develop Cost optimization Strategy for XYZ Company in termof following field:
Procurement & Storing. Production. Storage & Logistics.
Procurement & Storing
METHOD FOR RAW MATERIAL PROCUREMENT :
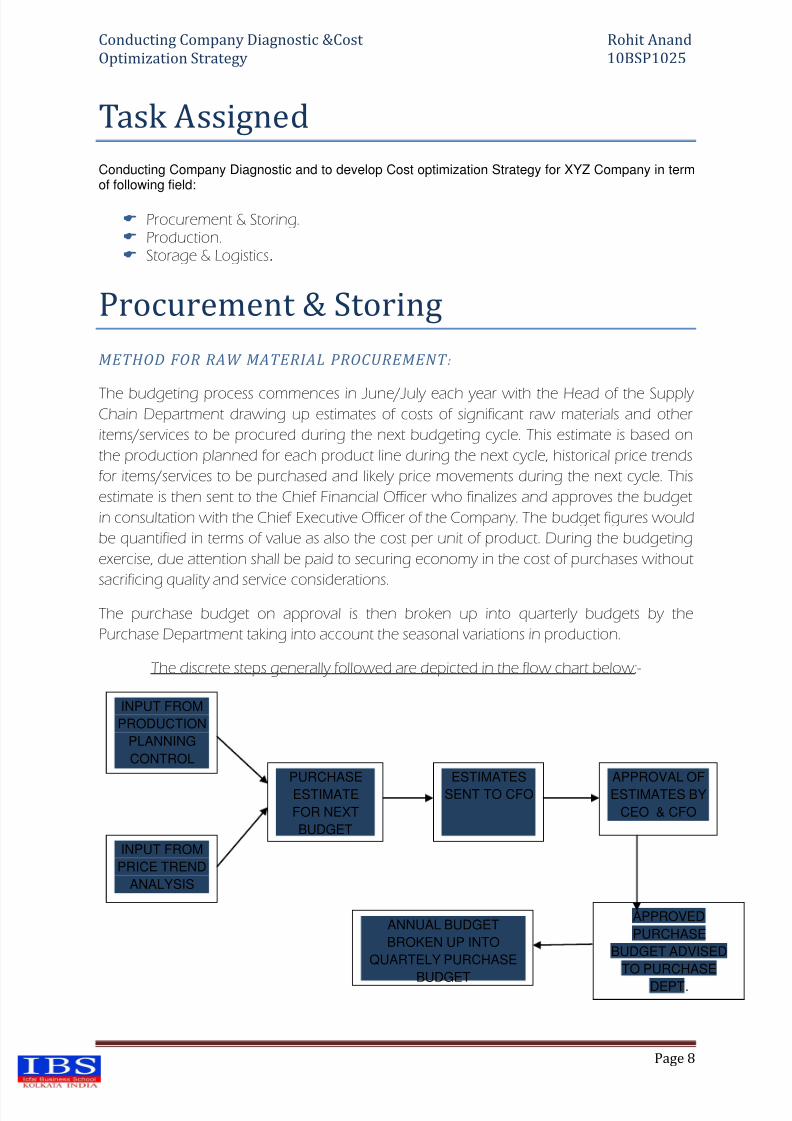
The budgeting process commences in June/July each year with the Head of the Supply Chain Department drawing up estimates of costs of significant raw materials and other
items/services to be procured during the next budgeting cycle. This estimate is based on
the production planned for each product line during the next cycle, historical price trends
for items/services to be purchased and likely price movements during the next cycle. This
estimate is then sent to the Chief Financial Officer who finalizes and approves the budget
in consultation with the Chief Executive Officer of the Company. The budget figures would
be quantified in terms of value as also the cost per unit of product. During the budgeting
exercise, due attention shall be paid to securing economy in the cost of purchases without
sacrificing quality and service considerations.
The purchase budget on approval is then broken up into quarterly budgets by the
Purchase Department taking into account the seasonal variations in production.
The discrete steps generally followed are depicted in the flow chart below:-
INPUT FROM
PRODUCTION
PLANNING
CONTROL
INPUT FROM
PRICE TREND
ANALYSIS
PURCHASE
ESTIMATE
FOR NEXT
BUDGET
ESTIMATES
SENT TO CFO
APPROVAL OF
ESTIMATES BY
CEO & CFO
APPROVED
PURCHASE
BUDGET ADVISED
TO PURCHASE
DEPT.
ANNUAL BUDGET
BROKEN UP INTO
QUARTELY PURCHASE
BUDGET
8/4/2019 Cost Optimization & Diagonstic
http://slidepdf.com/reader/full/cost-optimization-diagonstic 9/70
Conducting Company Diagnostic &Cost Rohit Anand
Optimization Strategy 10BSP1025
Page 9
Types of Purchase Contracts
Purchase Contracts or Purchase orders issued for purchase of goods or services are of two kinds:
One time purchase contracts or purchase orders
Where delivery of the goods and services purchased are to be completed in entirety at one time
or within a short time span.
Scheduled Agreements or purchase orders
where goods or services to be purchased are against the requirements of the Company over an
extended time period or for annual requirements. Deliveries against these contracts or orders
are to be staggered over the time period of the contract. Unit Prices of goods or services may
vary over the supply period depending on price movements. Quantities delivered under the
contract at various points of time may vary depending on requirements of the Company .
Enquiry/ Quotations/ Negotiations
Most of the RM/PM required and Initiating Systems are available only from a limited
number of vendors. This is due to the nature of these materials and also since the
manufacture of Capacitors maintaining quality of the finished product.
Accordingly the procurement system is essentially based on obtaining quotations
from the limited number of pre-qualified vendors who are capable of supplying
materials in conformity with prescribed standards.
Enquiries for quotations are floated to the approved vendors by email or fax, and
responses obtained. The company has an approved list of vendors with respect to
each RM/PM. Procurement department feels the necessity of inclusion of new
vendor or deleting any then it should follow the company’s vendor evaluation
process and seek approval as per the authority level of XYZ.
On receipt of quotations the supply officer negotiates with the vendors and selects
the final vendor considering their respective production capacities, delivery history
and other factors into account.
Strategies Adopted
Given are few ideas which can result in savings:
Opportunity BuyingMost of the commodities and raw material has seasonal cycle of prices as they peak and fall in intervals .Hence we can book maximum amount of ourrequirement when prices are low .
Local Vendors

8/4/2019 Cost Optimization & Diagonstic
http://slidepdf.com/reader/full/cost-optimization-diagonstic 10/70
Conducting Company Diagnostic &Cost Rohit Anand
Optimization Strategy 10BSP1025
Page 10
Vendors should be located in close vicinity of company which helps in keepinglow inventory as well as low freight cost.
Partnerships With Major VendorsIt is highly recommended to have partnership with vendors in either havingequity or technical collaboration so as to pass on savings to the customer. Which
results in cost reduction in manufacturing cost? Most of the Automobiles Majorshas this kind of arrangement with their vendors .Vendors is assured of business.
E ProcurementPutting up tenders and requirement on Internet and setting up auction forrequirement on web which helps in reaching out more numbers of vendorbases. This also helps in cutting cost when we opt for conventional way of askingtender /quotation. Most popular way of procurement strategy is reverse auction,where the lowest price bidder takes away the order.
Buying Material From Tax Exempted Area.In several countries the federal/ State govts provide tax heavens formanufactures for certain period say 10- 15 years .Hence buying from these area s
helps in cutting cost .In common parlance it is called TAX HOLIDAYS . Look outfor such places prior to placing orders.
Alternate MaterialSelect high cost items and replace it by some low cost material. eg ; steel by plastic/aluminium .
Try Merge In TransitThe concept of in-transit product merging —where, for example, two things areshipped from different locations and then married in transit so that they reach thecustomer as a single shipment —can be seen as a technique for reducinginventory if the need for the customer to simultaneously receive multiple SKUs is agiven. To some extent, merge-in-transit represents an extension of postponement
beyond the distribution centre walls. Vendor Managed Inventory (Vmi)
With the appropriate incentives, allowing suppliers to assume the responsibility for replenishment of your inventory, because of their visibility into both their owninventory and production schedule and your demand data can almost alwaysreduce your inventory.
Vendor Stocking Program (Vsp) Used primarily for maintenance inventories but applicable to all, VSPs require asupplier to commit to an extremely high service level for delivery of specific SKUswithin a fixed time at a predefined mark-up. VSPs can reduce or eliminateinventories for slow-moving products. There are numerous ways to take better
control of inventory and decrease its associated costs. The key to managinginventory successfully is to continuously measure your performance and look fornew ways to improve. These 25 strategies should get your organization thinkingabout what it can do to lower inventory costs.
8/4/2019 Cost Optimization & Diagonstic
http://slidepdf.com/reader/full/cost-optimization-diagonstic 11/70
Conducting Company Diagnostic &Cost Rohit Anand
Optimization Strategy 10BSP1025
Page 11
Three Ways to Trim Costs in the Supply Chain:
Eliminate Redundancies In The Supply ChainFor all supply chain partners, create a flow chart of all activities involved in theprocurement, set up, production, inspection, storage, and transportation of all
materials and components that go into the final product. You will likely find activitiesthat are repeated by different supply chain partners (e.g., outgoing inspection by one supply chain partner immediately followed by incoming inspection by another). If you can work with your supply chain partners to eliminate suchredundancies, you can reduce their costs and, as a result, your price.
Shift Tasks to the Most Efficient Supply Chain Partner. Sometimes the capabilities of supply chain partners overlap. Let's consider acustomer's purchase of engraved plaques. The customer's immediate supplier may do direct marketing, fulfilment, and engraving. That supplier's supplier may dodesign, manufacturing, and engraving. In this case, who should do the engraving?
The most efficient supply chain partner should, assuming that either can meetquality, delivery, and service standards. But this means that you have to question"the way we've always done it" so that you can do it the best way.
Leverage The Supply Chain's Buying Power. Often, the products and services purchased by second tier suppliers are alsopurchased by a first-tier supplier. Many times, that first-tier supplier gets a betterprice than the second-tier suppliers. In cases like these, the first-tier supplier cannegotiate to add second-tier suppliers' volume onto its agreements, thereby gettingeven deeper discounts for itself and reducing total cost throughout the supply chain.
Cost Reduction Ideas–
Procurement
Removing Intermediaries Wherever possible buy directly from manufacturers /authorised dealers /OEMnot from any agent /dealer or commission agent. Lesser the intermediarieslower the rate.
Non - Branded ItemsLook out for non branded items for non - critical areas as branded items has
premium attached to it .Sometimes you can get good items which are non -branded just in case of garments.
Recycling And Reuse All items come into some form of secondary packaging and out of which someof the items can be reused or recycled .Ask vendors to reuse /recycle packingitems. Eg cans, sacks, bottles, cores trays and pallets etc.
ConversionsBuying primary material then giving it to processor instead of buyingdirectly from the converter , it helps in two ways as we can avail modvat
exemption on the raw material and can eliminate the premium on conversionegKraft paper for cbbs .
8/4/2019 Cost Optimization & Diagonstic
http://slidepdf.com/reader/full/cost-optimization-diagonstic 12/70
Conducting Company Diagnostic &Cost Rohit Anand
Optimization Strategy 10BSP1025
Page 12
Make And Buy DecisionsFew items can be made in house rather getting it from outside eg groundedsugar, cashew nuts etc.
Negotiations
The price should always be negotiated with all information available. Prices arewhen you are informed and aware of options available .Always check priceswith alternate sources.
Economical Order Quantity ( Eoq) This is the maximum qty of item which you can place to a vendor taking intoaccount the frequency of items used.
InspectionBy eliminating inspection at factory and asking vendors to provide materials asper standards and completing inspections at their end we can eliminate delays
and manpower used in these kinds of activities.
Scrap ManagementSegregation of scrap generated in a manufacturing unit is important .It hasbeen observed that all scrap are sold as lot to scrap merchant who in turnsegregates it in different categories and sells it in at higher rates .
Achievements:
To Increase Further Utilization of SAP for the Supply Chain Management
A general comment was that the SAP system is either not fully customized or proper
utilization was not being made of the system. Also too much paperwork and manual effort
was being used. The following are worth mentioning:
The Company does not use SAP for processing its material requirement plans. The
production planning and the bill of materials required for each product line is
processed manually. Decisions on the quantity of order to be placed judgmental and
are done manually based on historical consumption patterns. MRP plan module can
be made operational on the SAP system
Requisition of all RM/PM and engineering items and services are not made out of the
SAP system. It is only after placing the Purchase Orders/service orders that relevantdata is entered into the SAP system.
Engineering spares are not entered into stores records until inspection is completed.
There are entered into Stores records only after inspection. This needs to be changed
and goods received pending inspection to be recorded as goods under inspection.
(For RM/PM this is not the case and goods under inspection are recorded as such).
Transportation services are not directly through the SAP system. A way about route is
taken using SAP. As such no Purchase orders are generated for transportation
services. The information like batch details therefore cannot be linked with the
transport orders. This may cause difficulties for excise refunds in case of rejections.
8/4/2019 Cost Optimization & Diagonstic
http://slidepdf.com/reader/full/cost-optimization-diagonstic 13/70
Conducting Company Diagnostic &Cost Rohit Anand
Optimization Strategy 10BSP1025
Page 13
Also information required by PESO of the CCE can be linked with the SAP system if
the transportation services module can be properly used.
The Company should utilize the full range of SAP facilities to reduce manual inputs to the
extent possible. Training of staff to utilize the SAP process can be made on periodic
intervals and suggestions from users can be sought periodically.
Procurement Planning Process
Production plans are generated over a 15 day time horizon and the procurement plans
are for one month only. Procurement plans are also done manually through BOM Excel
spreadsheet and is not generated by SAP. Company indicated that demand forecasting is
of limited use since the factory operates at close to 100% capacity and material
procurement is more production driven rather than demand driven.
No demand forecasting and as a follow on production planning is done over a 6 monthhorizon. Some procurement planning is done over a 3 month period.
The suggested approach is: The Annual procurement plan should be derived from the annual Production plan.
Since production department is the custodian of the recipes and BOM, dependingupon the annual Production plan of each finished item, the Material requirementplan is to be derived and provided to the procurement department. The productionshould provide the monthly breakdown of material required to the procurementdepartment at the start of the financial year..
The Procurement department based on the Stock levels, seasonality, criticality and
economic purchase decisions base their monthly Purchase Plan of each material forthe whole year.
When Procurement department receives the actual production plan for thefollowing month from the Production department, it shall only make adjustments totheir monthly procurement plans depending on the change of actual productionplan vis-à-vis the Budgeted monthly plans.
For engineering items coded, the procurement department can base itsassumptions based on inputs from various departments and past history.
For Project items the annual procurement plan can be based on the projectedCapex proposals.
Purchase Order Conditions
The General terms and conditions provided in the Purchase order in some items were
contradictory and do not cover many general issues.
A suggested format is proposed in Annexure 1 for review of the company and
implementation.
The issue of Performance guarantees to be incorporated in the General terms and
conditions for RM/ PM may not be practicable as the basic nature of RM/PM is to undergo
change in form and substance after use in a production process and therefore non
performance or under performance of that particular RM/PM is difficult to substantiate.
What can be introduced for certain RM/PM is the minimum shelf life period warranty from
8/4/2019 Cost Optimization & Diagonstic
http://slidepdf.com/reader/full/cost-optimization-diagonstic 14/70
Conducting Company Diagnostic &Cost Rohit Anand
Optimization Strategy 10BSP1025
Page 14
the vendors subject to certain storage conditions. A review of and tightening of the
specification conditions for each such RM/PM can be made to create better control of
input RM/PM. For which RM/PM such shelf life warranty can be introduced is a technical
question and the company’s R & QA department can decide with the Production
department.
However for certain engineering items, spares such performance guarantee can be
introduced. This again shall be judgment of the technical departments.
In case such shelf life conditions for RM/PM and performance guarantees for certain
engineering items be introduced it should be in the face of the Purchase order as Special
conditions and not as General terms and conditions.
Production
Productivity measures the efficiency with which resources such as labour or capital are
employed in the production process. There are two widely used productivity measures;
labour productivity.
Labour productivity is measured as real output per hour worked. Multifactor productivity, a
broader measure of efficiency, is measured as real output per unit of combined inputs
(capital, labour, etc).In essence, this is the efficiency of all or your factors of production.
A business wishing to improve its profitability must undertake certain steps that can
guarantee to provide the desired results. One of the things that the management staff
must give important notice is the production and productivity of the business as a whole.
As has been known, to increase the profitability of an enterprise, certain things must be
improved in the workplace.
Activity can be identified with production and consumption. Production is a process of
combining various immaterial and material inputs of production so as to produce tools for
consumption. The methods of combining the inputs of production in the process of
making output are called technology. Technology can be depicted mathematically by the
production function which describes the function between input and output. The
production function depicts production performance and productivity is the metric for it.Measures may be applied with, for example, different technology to improve productivity
and to raise production output.
Seven Wastes in a Production Line
Kaizen principles has have highlighted seven wastes in production line where companieslooses out time , money and productivity .Manufacturers have to eliminate these deadly wastes with modification ,low cost automation and asking question whether customerwould pay for the activity involved at shop floors.
8/4/2019 Cost Optimization & Diagonstic
http://slidepdf.com/reader/full/cost-optimization-diagonstic 15/70
Conducting Company Diagnostic &Cost Rohit Anand
Optimization Strategy 10BSP1025
Page 15
Here are the seven wastes in any manufacturing unit:
Over-production Waiting Transporting
Inappropriate Processing Unnecessary Inventory Unnecessary/Excess Motion Defects.
OVER PRODUCTION
Normally most of the manufacturers adopt these principles which works in pushsystem rather than pull system where production is plan in batch and items areproduced in excess to be kept as inventory .Reasons for Over production could be
non- availability of machines , wrong sales forecast stock out of certain raw material ,high change over time .Over production results in waste of money which could havebeen used for other useful activity. Stocks get deterioted if kept for longer time.Few Examples are Producing more than the customer needs right now Producing product to stock based on sales forecasts Producing more to avoid set-upsBatch process resulting in extra output Forecasting Long set-ups Solution could bePull system scheduling,Heijunka – level loading, Set-up reduction
WAITING:
Now this could be a finished product waiting for dispatch , items waiting for the next
phase on the production line or raw material procured in advance for any reason.Thus blocking companies money .Few Examples for waiting areIdle time created when material, information, people, or equipment is not ready
Waiting for partsWaiting for printsWaiting for inspectionWaiting for machinesWaiting for informationWaiting for machine repair
Solution could be Takt time production, In-process gauging,Jidoka,Office Kaizen,TPM
TRANSPORTING
This is due to wrong layout of the production flow as objects are kept at distancewhich has to be moved to production shop floor resulting in waste ( time , labour andcost ) . Care should be taken such that the time spent on transporting items to or fromwarehouse is minimum. Better examples are work stations in any automobile company where every thing is delivered at work station. Low automation on loading,unloading and transporting can save good amount of money.
8/4/2019 Cost Optimization & Diagonstic
http://slidepdf.com/reader/full/cost-optimization-diagonstic 16/70
Conducting Company Diagnostic &Cost Rohit Anand
Optimization Strategy 10BSP1025
Page 16
Few Examples Movement of product that does not add valueMoving parts in and out of storage. Moving material from one workstation to anotherBatch production Solution could be Pull system, Value Stream organizations.
INAPPROPRIATE PROCESSING
In appropriate processing comes into picture when manufacturers go for advance hi-tech machinery for normal job which could have done by conventional machine.These highly automated machines if not handled carefully tends to over produce .Thisalso includes items sourced from a wrong supplier.Few ExamplesOne-piece pullOffice Kaizen3PLean DesignSolution One-piece pull, Office Kaizen, 3P, Lean Design
UNNECESSARY INVENTORY
This happens due to faulty production planning, long lead times also contributes oninventory, long set up time .,Overproduction of finished goods ,WIP .This also happensdue lack of proper ordering procedure based on EOQ .Solution Supplier development, One-piece flow lines, Set-up reduction, Internal kanbanand External kanban
UNECESSARY/EXCESS MOTION:
Normally it is about ergonomics the worker s posture which results in unnecessary motion or few jobs which are done repetitively without adding any value to the job.Few examplesSearching for parts, tools, prints, etc.Sorting through materialsReaching for toolsLifting boxes of partsWorkplace disorganizationMissing itemsPoor workstation designUnsafe work area
5SSolution could be Point of Use Storage, Water Spider, One-piece flow, Workstationdesign
Defects
Defects are shear waste and has to minimised to zero as these are cost to company defective products consumes raw material fuel labour .Cost is incurred on rework on thesedefectives. .Few Examples
8/4/2019 Cost Optimization & Diagonstic
http://slidepdf.com/reader/full/cost-optimization-diagonstic 17/70
Conducting Company Diagnostic &Cost Rohit Anand
Optimization Strategy 10BSP1025
Page 17
VariationMissing partsProcess failureMis-loaded partBatch process
Inspect-in quality Incapable machines
Solution GembaSigma,Pokayoke,One-piece pull, Built-in quality,3P,Jidoka
Ways to Minimize Production :
Reducing waste should be on any manufacturer's list of priorities. There are three basictypes of waste produced by the manufacturing process. The first type, process wastes, isthose that result from transforming lower-value feed materials into higher-value products.
The second type, utility wastes, is those that result from the utility systems that are neededto power the manufacturing process. A third type results from start-ups and shutdowns,maintenance and other offhand operations.
Process wastes are the most costly of the three types and therefore should be the first typethat manufacturers attempt to reduce. By minimizing process wastes, manufacturers canlower the cost of making a certain product and also reduce their investment in treating thewastes that manufacturing the product creates. Furthermore, utility wastes, which can takethe form of released steam, an inefficient boiler, or air and nitrogen leaks, has a directcorrelation with how much process waste is produced.
The DuPont methodology analyzes each waste stream in four steps. The first step is to listall of the waste stream's components. Secondly, the components triggering the concernshould be identified, including hazardous air pollutants and carcinogenic compounds.Third, the highest volume materials (which are often diluents such as air, water, a carriergas or a solvent) must be identified. These materials often control the investment andoperating costs associated with end-treatment of the waste streams. The source of thesediluents within the process must be determined and then waste minimization options mustbe developed to reduce or eliminate them entirely. The fourth step is to identify the nextset of components that has an impact on the investment and operating costs of the end-treatment.
The ultimate goal of the methodology is to guide the manufacturer to a state of efficiency in which all of the materials that are added to or removed from a process are valuable. Inorder to do this, the raw materials that the manufacturer uses, the intermediates, or theproducts themselves, must perform the functions previously performed by input streamssuch as air, water and other catalysts. To come closer to achieving this ideal, themanufacturer needs to undertake a process analysis. The first step in this process analysis isto list all salable products, all raw materials reacting to salable products and any intermediates. The second step of the process analysis is to enumerate all of the othermaterials created in the process, such as non-saleable by-products (waste), on a second list.Third, for each compound in the second list, the process engineer should ask, "how canwe use a material from the first list to do the same function?" or "how can we modify the
process to eliminate the need for this material?" Finally, in considering the materials in thesecond list that result from producing non-saleable products, the process engineer should
8/4/2019 Cost Optimization & Diagonstic
http://slidepdf.com/reader/full/cost-optimization-diagonstic 18/70
Conducting Company Diagnostic &Cost Rohit Anand
Optimization Strategy 10BSP1025
Page 18
ask, "how can we modify the chemistry or process to minimize or eliminate these wastes?"This method of analysis, when correctly used in collaboration with the application of fundamental engineering and chemical practices, can help in developing a technology plan for achieving a manufacturing state that generates the minimum amount of waste.
The beauty of the DuPont methodology is that it uses a minimum amount of time andmoney to define process improvements and to conduct baseline analysis. In addition, ituses existing process information to define process improvement opportunities andprocess characteristics. And, last but not least, it has been proven to work.
Downtime
Downtime is the time from the first equipment breakdown to full running production.Clearly any time production is not producing quality product profits are being lost. That
alone is good reason to address the issues that cause downtime and it's not difficult to do.Simply exposing downtime when it occurs is a great start. The following strategies will help you get a grip on downtime:
• Expose Downtime and Set Goals for Reducing It • Reduce Downtime through Team Awareness • Find Out With OEE
The strategies below depict a few of the many problems our customers ask us to solve andthe solutions we provide. Always feel free to call us if you'd like to discuss a specificproblem or idea. We encourage you to use our application experience to help you reduce
your downtime.
Lean Manufacturing
Lean Manufacturing-- Every organisation is trying to imbibe concept of leanmanufacturing so as to reduce cost and optimum productivity.Basic principles of lean manufacturing are:
Cellular cell: Work places are divided into cells which are then placed in systematic way tohelp smooth flow of process.
5s : Proper management of work place
Kanban system: Pull system when orders move only when demand is present
Six sigma: Eliminating waste and defective through datas and scientific methods
Jit : removing waste from system and reducing inventories
8/4/2019 Cost Optimization & Diagonstic
http://slidepdf.com/reader/full/cost-optimization-diagonstic 19/70
Conducting Company Diagnostic &Cost Rohit Anand
Optimization Strategy 10BSP1025
Page 19
Storage
Receipt of Goods/ Inspection
The vendor shall deliver the goods or services to the desired location in terms of the
delivery instructions provided in the Purchase Order. Delivery not in accordance with
these delivery instructions shall render the vendor liable to non-acceptance of the
delivery. In such a case the vendor shall make arrangements to deliver the goods or
services to the appropriate location and within the time limits as specified in the
Purchase Order at without the Company being liable for any additional expenses that
may be incurred in this connection by the vendor. Also in all cases of deviations from
the delivery instructions provided, the Purchase Department should be informed and
their approval taken in advance.
All deliveries shall be accompanied by all the necessary documentation as mentioned
in the Purchase Order and the security pass shall be obtained at the factory gate. A
Pre inspection GRN is issued through the SAP system.
In the case of outbound logistics the vendor shall arrange for delivery to the relevant
sites and the means of transportation shall comply with all requirements laid down by
the Company in its Purchase Orders and in strict compliance with the norms laid
down by the CCE and other statutory requirements.
The Company carries out inspection testing of incoming materials only at its QA
facilities. No inspection or checks are normally undertaken at other locations or at the
vendors’ facilities and if such inspection and testing is to be carried out, vendorswould be suitably informed in advance or mentioned in the purchase order.
The Company usually insists that a test certificate be provided by the vendor from an
independent agency, or if this is not possible they should at least provide a
certification from their in-house testing facility. On the material being received at the
Stores, the materials are first tagged as under testing. Samples are drawn from the
material and specifications are checked at the QA laboratories. This inspection and
testing should be completed before the expiry of thirty days from the receipt of
materials at Stores.
Based on an inspection of a valid sample, XYZ may reject the goods or services in
whole or in part. If goods delivered or services performed by Vendor are found to be
defective, IEL shall have the right to require the correction thereof by Vendor. XYZ
may charge Vendor the cost of inspecting or re-inspecting rejected goods and/or
services.
Rejected goods will be returned to Vendor, with transportation charges being
collected from the vendor, or held by XYZ for disposition at Vendor's risk and expense.
Vendor shall have to arrange to take back the rejected goods within 90 days of
intimation of rejection by the XYZ and after arranging for all the necessary
documents/permission from statutory authorities. All rejected goods or part thereof
not lifted within 90 days shall be disposed off automatically by the XYZ as scrap andthe vendor will have no claim on them thereafter.
8/4/2019 Cost Optimization & Diagonstic
http://slidepdf.com/reader/full/cost-optimization-diagonstic 20/70
Conducting Company Diagnostic &Cost Rohit Anand
Optimization Strategy 10BSP1025
Page 20
Stocking/Issue
Goods qualifying QA certification is entered into the SAP system as unrestricted stock
and the GRN number is issued.
The total stock in stores can at any time be reviewed from SAP as the sum of QA Pre-
inspection stock, Blocked stock and unrestricted stock. Stocks are released to the
production based on the daily requisition slips from the Production department.
The total stock in stores cannot be fully assessed at any point of time from SAP as under
-inspection stock is not recorded in SAP. The unrestricted stock can be obtained from
the SAP system and the procurement department finds out physically the under-
inspection stocks and adds them to get the total stock. Stores issues engineering spares and consumables against requisition from the user
Departments.
Stocks of coded engineering spares and consumables are maintained separately for
each product group i.e, for Bulk explosives, Packaged Explosives and Initiating systems
and are also maintained separately for routine maintenance.
GRN numbers of items are issued after qualifying inspection but not recorded into the
SAP system.
The User departments are the custodian of these stock items whether it is temporarily
kept in the company’s stores or issued to User departments.
Storage are the godowns for keeping and storing of raw materials , components semi -finished goods , tools, maintenance , repairing and operating equipments and operatingequipments related to production functions. Storage warehouse may be located at any point but usually have strong relationship with production facilities .Operations of storageare all closely related to problems of demand and supply. Storages are most frequently used by firms to meet seasonal demands and supply patterns to level out productionactivities.
Warehouse
Warehouses are the god owns for keeping and storing finished goods facilitating to themarketing and distribution functions of firms.In logistics and supply chain perspective ,ware house performs the storing function ,wheregoods are stored in bulk quantities and from there a new and different small assortmentof goods is selected and moved forward to be dispersed to the next level . Hence,
ware house are generally located near the market for smooth and quick flow of finishedgoods to the customers.
Distribution Centres
The distribution centre is a new idea in supply chain management ,referring to dynamic ,
full service warehouse primarily related to the market .It emphasis on the movement of goods rather than their storage .The emphasis of distribution centres is on quick
8/4/2019 Cost Optimization & Diagonstic
http://slidepdf.com/reader/full/cost-optimization-diagonstic 21/70
Conducting Company Diagnostic &Cost Rohit Anand
Optimization Strategy 10BSP1025
Page 21
movement of goods as per customer requirement along with other logistical supportincluding documentation ,assortment , information sharing ,intact delivery of goods , creditfacility and located near to the market. Warehouse Strategy
Options for any firm for warehousing are
Centralised warehousing Decentralised warehousing
Factors for Selection of Number and Location of Warehouse:
Number of geographical locations of market targeted by the firm. Location of production centres
Transportation infrastructure facilities Nature, quality and quantity of goods stored.
Availability of financial resources Elements of Warehousing Costs: Cost of procurement/rental of space Handling and transfer cost Administrative cost Cost incurred in direct and direct physical facilities Taxes Insurances for risk coverage’s Pilferage , deterioration and obsolescence
Cross docking
This concepts have been used by all major retailers eg care four ,wal-mart, reliance fresh
etc.It requires good to transferred to vehicles scheduled for dispatch to customer s
immediately from goods received from manufacturer immediately .In other words goods
are moved from a receiving dock to a shipping dock without intermediate storage or
the most products are stationed for very Short Span.
Achievement
Stock Levels
Success of the procurement process is interlinked with the success of the storesmanagement. The company should review its Inventory Policies and Procedures to ensuregaps to be filled in this area. Some of the points identified are:
Bin cards are not maintained in the engineering items store
8/4/2019 Cost Optimization & Diagonstic
http://slidepdf.com/reader/full/cost-optimization-diagonstic 22/70
Conducting Company Diagnostic &Cost Rohit Anand
Optimization Strategy 10BSP1025
Page 22
Reorder levels, minimum and maximum levels of stocks are not regularly updated.In some cases such levels are not maintained.
Non coded engineering spares are not are not the responsibility of Stores though
they are received into Stores and are not part of store records. They are the
responsibility of user Departments.
The company should review the Inventory policies and Procedures.
Logistical Services- Outbound/Inbound
Selection of Vendor/Approved List
For selection of vendor the company employs an assessment procedure, through an
assessment form which assesses a number of factors including its valid explosives license
from the Chief Controller of Explosives (for Vans), number of tankers/vans/trucks it hasunder its own fleet all licensed, SHE capability and commitment as per Orica standards,
experience, history of default, capability of handling etc. The Assessment form is available
with the Supply chain department and is amended from time to time.
An approved list of such selected and approved vendors is maintained by the Supply chain
department and the Deputy Manager, is responsible to keep and update such records of
assessment. In most cases the tankers/Vans /Trucks are allotted with the type of material
they shall deliver.
Inclusion of any new vendor or deletion of any vendor from the approved list and any
change of the type of items that any specific vendor shall carry, will be on approval of the
Procurement manager and the Supply chain manager. The changeovers shall be done ina controlled way and the respective tankers/vans/trucks etc shall be re-inspected before
usage.
Agreement
Inbound and outbound logistical services Vendors are usually contracted for on an
annual basis by the Supply Chain Department. The annual agreements are approved
legally by the company’s legal cell or from legal consultants.
Routine assessment
All Tankers/Vans/trucks etc. for all vendors shall be assessed routinely at least once in a
year. An audit checklist is framed by the procurement department to undertake the said
audit procedure and on the basis of the Audit Report the Supply officer decides either to
continue or withdraw the services of the transporter or provide time and deadlines for
appropriate action by the transporter. For all such assessments Safety, Health and
environmental issues and delivery performance shall not be compromised.
In case a transporter or any of its tankers/vans/trucks are withdrawn temporarily or
permanently, the supply chain department shall forthwith inform all the different sites anddepartments and remove the vendor from the list of vendors.
8/4/2019 Cost Optimization & Diagonstic
http://slidepdf.com/reader/full/cost-optimization-diagonstic 23/70
Conducting Company Diagnostic &Cost Rohit Anand
Optimization Strategy 10BSP1025
Page 23
In case the vendor completes its corrective actions the supply chain department shall
undertake fresh assessment and compliance audit as if is a new vendor and if complied
shall re-introduce the vendor in the approved list.
Requisitions
For Outbound logistics, requisitions are usually planned by the Supply chain department
on the basis of the current production plan over a period of a fortnight in advance, and
any changes in actual production as advised by production departments are taken into
account while planning logistical needs.
Transport Orders
Transport orders are generated from SAP which contains the name and address of the
vendor, Order number, date, items to be transported, terms of variable charges, payment
terms, time of delivery, insurance, escalation clauses and specific standard clauses that thevendor should follow for the particular consignment. Besides a General terms and
conditions applicable to all vendors are also attached. The transport orders are usually
issued by the Assistant manager Purchase. For any change in terms and condition or for
transport orders in excess of budget approval is required from the Procurement manager/
supply chain manager.
For each single destination outbound transport order, an Entry sheet is created which
provides for the items/materials to be delivered, place and time of delivery, with estimated
distances in KM. For each such entry sheet a specific entry sheet number is generated in
the SAP system. Rate masters are available in the SAP master with respect to each
destination with respect to each vendor.For Multi destination transport orders similar entry sheets are prepared against an entry
sheet number. The only difference being in case of multi destination transfers in most cases
the estimated costs of the order may change depending on situations. For this additional
Entry sheets need to be generated for the excess budgeted amounts. For this approval of
the Procurement manager/supply chain manager is essential.
For in bound transportation the contracts are usually on a Per Unit of quantity basis. The
rate masters are entered in SAP vendor wise.
Delivery/Payment
Outbound transportation are either to client premises or stock transfer to inter units of the
company. For outbound delivery the company has a 29 point checklist at the security gate
of company premises. After necessary checks if found OK van is allowed to come inside the
factory to take load The van reports to magazine with the Loading Advice and accordingly
the van is loaded as per the product mentioned maintaining FIFO system of the magazine.
The van after completion of loading returns back to Logistics office with the batch details
for further generation of Invoice. The van is checked at the main gate by the security officer
and is released from the factory gate. The final documents are handed over to the driver
after getting endorsement on RE 12.
8/4/2019 Cost Optimization & Diagonstic
http://slidepdf.com/reader/full/cost-optimization-diagonstic 24/70
Conducting Company Diagnostic &Cost Rohit Anand
Optimization Strategy 10BSP1025
Page 24
For inbound delivery the company has a security inspection procedure at gate of
company premises. The security signs the inward challan after checking. The Stores
department checks the quantity after quality and specification checks are made by the QA
department. The transporter submits the Invoice along with the Receipted challan. The
procurement department submits the same along with the printed GRN to the Accounts
department for payment.
XYZ Defects & Its Remedies:
OBJECTIVE
1. Review of Process-wise Yield and Scrap generation for Mpet.
2. Scrap Generation Flow Diagram for MYLER.
FINDING
8/4/2019 Cost Optimization & Diagonstic
http://slidepdf.com/reader/full/cost-optimization-diagonstic 25/70
Conducting Company Diagnostic &Cost Rohit Anand
Optimization Strategy 10BSP1025
Page 25
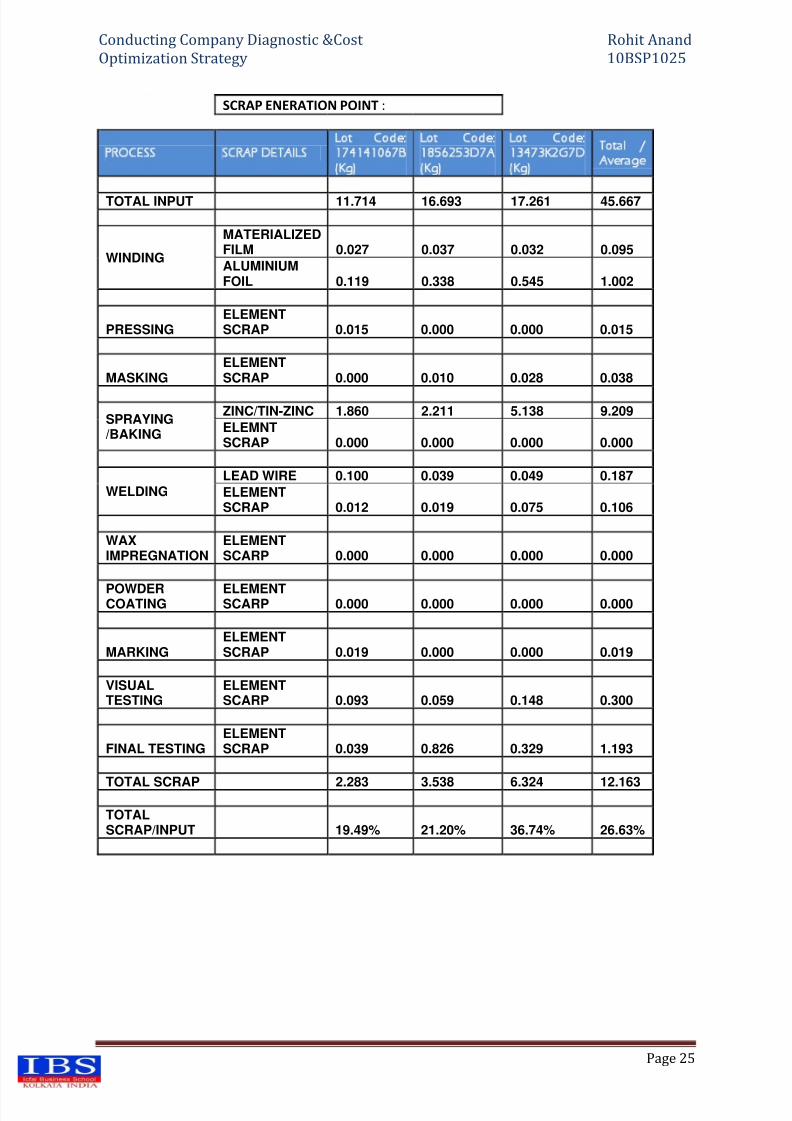
SCRAP ENERATION POINT :
PROCESS SCRAP DETAILSLot Code:174141067B(Kg)
Lot Code:1856253D7A(Kg)
Lot Code:13473K2G7D(Kg)
Total /Average
TOTAL INPUT 11.714 16.693 17.261 45.667
WINDING
MATERIALIZEDFILM 0.027 0.037 0.032 0.095
ALUMINIUMFOIL 0.119 0.338 0.545 1.002
PRESSINGELEMENTSCRAP 0.015 0.000 0.000 0.015
MASKINGELEMENTSCRAP 0.000 0.010 0.028 0.038
SPRAYING/BAKING
ZINC/TIN-ZINC 1.860 2.211 5.138 9.209
ELEMNTSCRAP 0.000 0.000 0.000 0.000
WELDINGLEAD WIRE 0.100 0.039 0.049 0.187
ELEMENTSCRAP 0.012 0.019 0.075 0.106
WAXIMPREGNATION
ELEMENTSCARP 0.000 0.000 0.000 0.000
POWDERCOATING
ELEMENTSCARP 0.000 0.000 0.000 0.000
MARKINGELEMENTSCRAP 0.019 0.000 0.000 0.019
VISUALTESTING
ELEMENTSCARP 0.093 0.059 0.148 0.300
FINAL TESTINGELEMENTSCRAP 0.039 0.826 0.329 1.193
TOTAL SCRAP 2.283 3.538 6.324 12.163
TOTALSCRAP/INPUT 19.49% 21.20% 36.74% 26.63%
8/4/2019 Cost Optimization & Diagonstic
http://slidepdf.com/reader/full/cost-optimization-diagonstic 26/70
Conducting Company Diagnostic &Cost Rohit Anand
Optimization Strategy 10BSP1025
Page 26
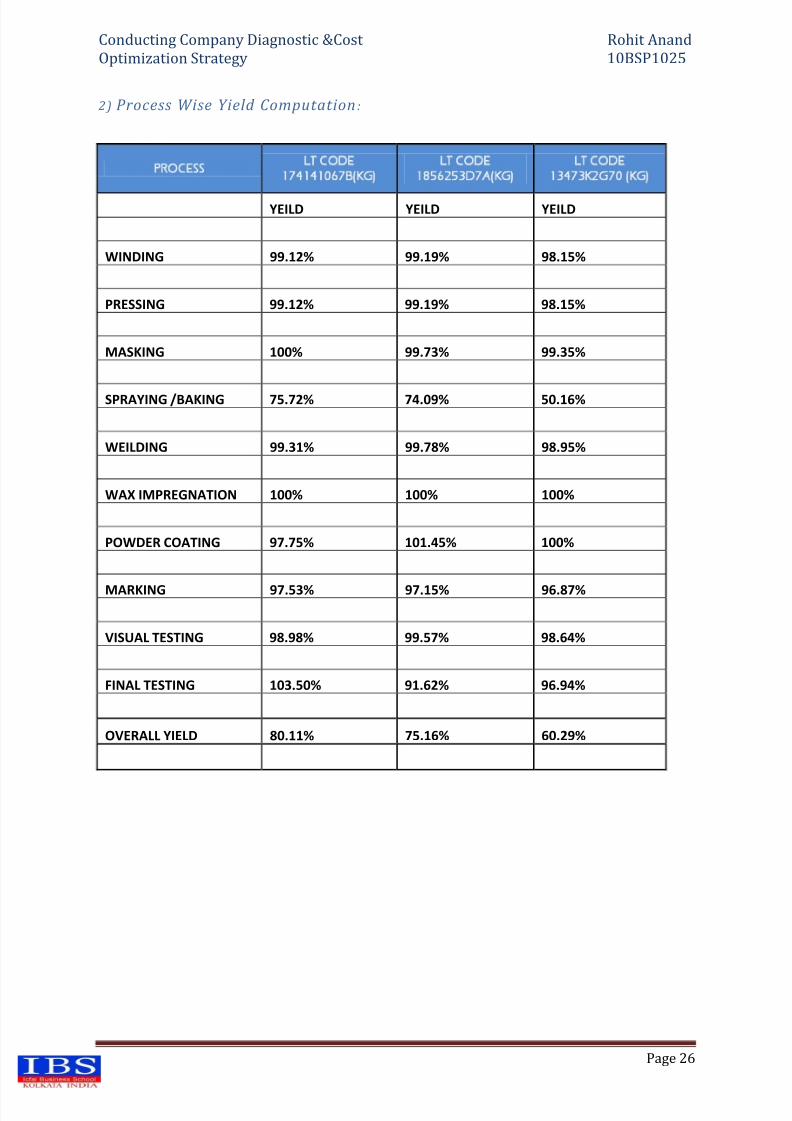
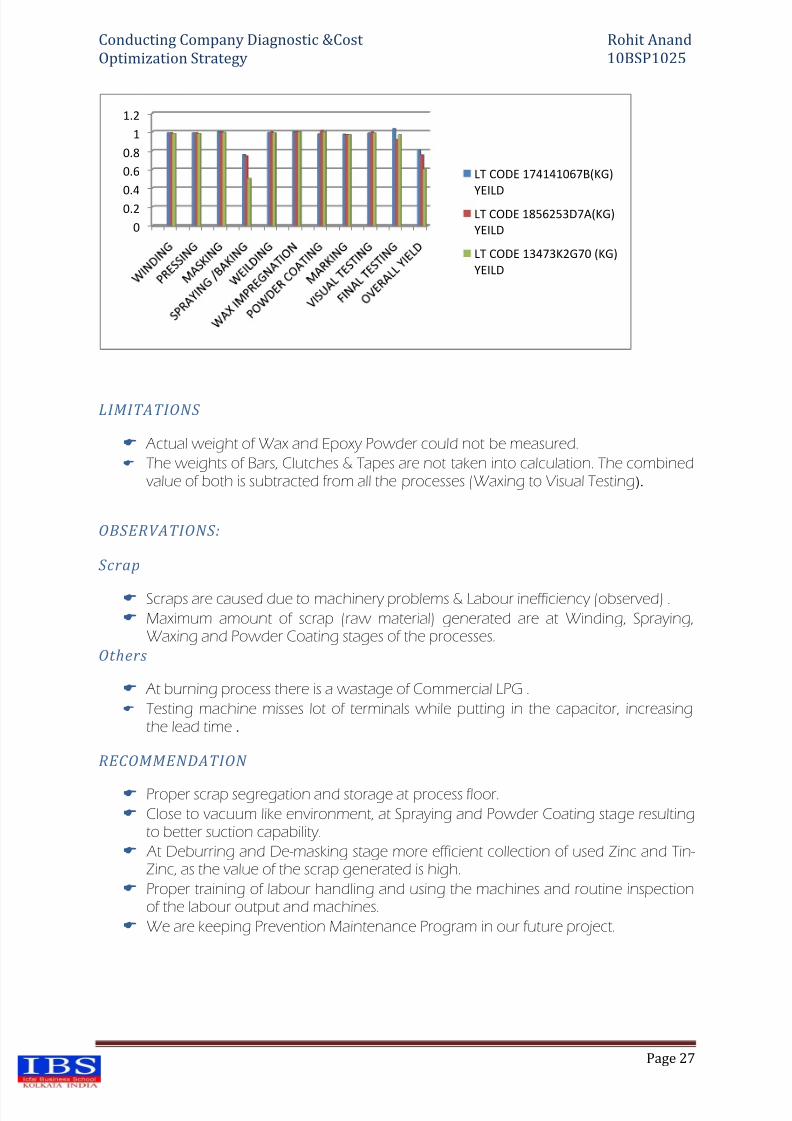
2) Process Wise Yield Computation :
PROCESSLT CODE
174141067B(KG)LT CODE
1856253D7A(KG)LT CODE
13473K2G70 (KG)
YEILD YEILD YEILD
WINDING 99.12% 99.19% 98.15%
PRESSING 99.12% 99.19% 98.15%
MASKING 100% 99.73% 99.35%
SPRAYING /BAKING 75.72% 74.09% 50.16%
WEILDING 99.31% 99.78% 98.95%
WAX IMPREGNATION 100% 100% 100%
POWDER COATING 97.75% 101.45% 100%
MARKING 97.53% 97.15% 96.87%
VISUAL TESTING 98.98% 99.57% 98.64%
FINAL TESTING 103.50% 91.62% 96.94%
OVERALL YIELD 80.11% 75.16% 60.29%
8/4/2019 Cost Optimization & Diagonstic
http://slidepdf.com/reader/full/cost-optimization-diagonstic 27/70
Conducting Company Diagnostic &Cost Rohit Anand
Optimization Strategy 10BSP1025
Page 27
LIMITATIONS
Actual weight of Wax and Epoxy Powder could not be measured.
The weights of Bars, Clutches & Tapes are not taken into calculation. The combinedvalue of both is subtracted from all the processes (Waxing to Visual Testing).
OBSERVATIONS:
Scrap
Scraps are caused due to machinery problems & Labour inefficiency (observed) .
Maximum amount of scrap (raw material) generated are at Winding, Spraying,Waxing and Powder Coating stages of the processes.
Others
At burning process there is a wastage of Commercial LPG .
Testing machine misses lot of terminals while putting in the capacitor, increasingthe lead time .
RECOMMENDATION
Proper scrap segregation and storage at process floor.
Close to vacuum like environment, at Spraying and Powder Coating stage resultingto better suction capability.
At Deburring and De-masking stage more efficient collection of used Zinc and Tin-Zinc, as the value of the scrap generated is high.
Proper training of labour handling and using the machines and routine inspectionof the labour output and machines.
We are keeping Prevention Maintenance Program in our future project.
0
0.20.4
0.6
0.8
1
1.2
LT CODE 174141067B(KG)
YEILDLT CODE 1856253D7A(KG)
YEILD
LT CODE 13473K2G70 (KG)
YEILD
8/4/2019 Cost Optimization & Diagonstic
http://slidepdf.com/reader/full/cost-optimization-diagonstic 28/70
Conducting Company Diagnostic &Cost Rohit Anand
Optimization Strategy 10BSP1025
Page 28
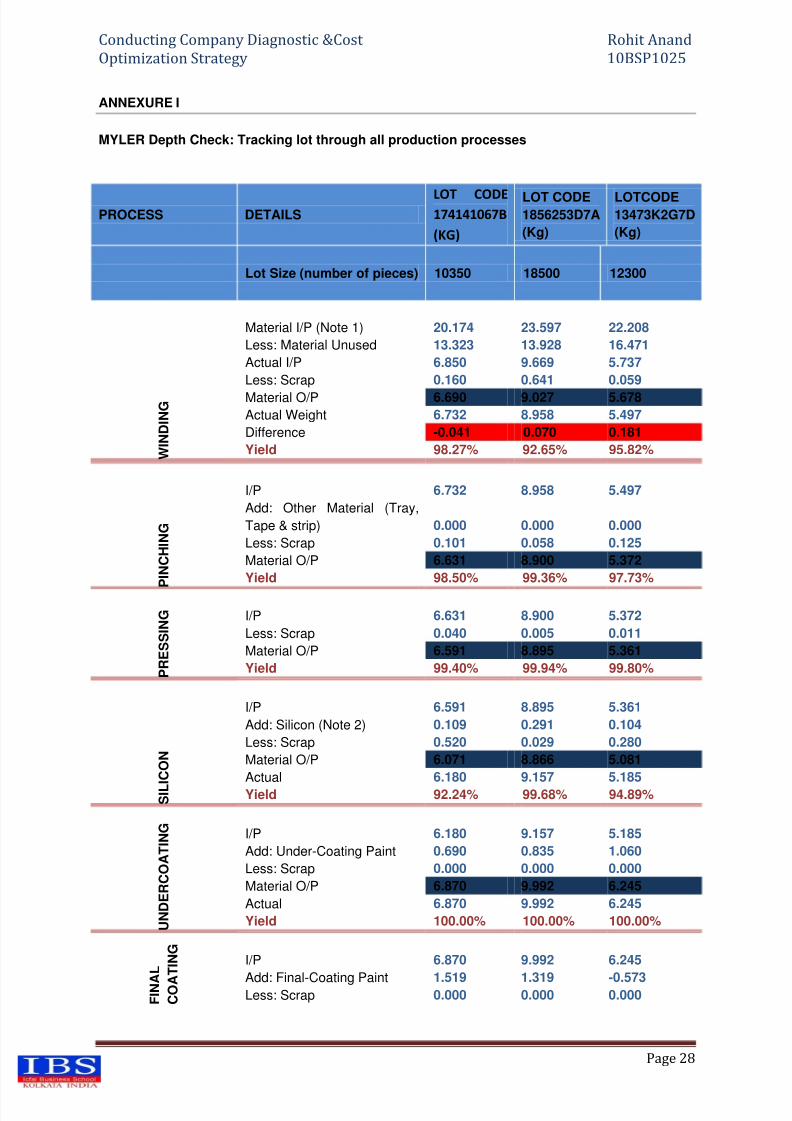
ANNEXURE I
MYLER Depth Check: Tracking lot through all production processes
PROCESS DETAILSLOT CODE174141067B
(KG)
LOT CODE1856253D7A
(Kg)
LOTCODE13473K2G7D
(Kg)
Lot Size (number of pieces) 10350 18500 12300
W I N D I N G
Material I/P (Note 1) 20.174 23.597 22.208
Less: Material Unused 13.323 13.928 16.471
Actual I/P 6.850 9.669 5.737
Less: Scrap 0.160 0.641 0.059
Material O/P 6.690 9.027 5.678
Actual Weight 6.732 8.958 5.497
Difference -0.041 0.070 0.181
Yield 98.27% 92.65% 95.82%
P I N C H I N G
I/P 6.732 8.958 5.497
Add: Other Material (Tray,
Tape & strip) 0.000 0.000 0.000
Less: Scrap 0.101 0.058 0.125
Material O/P 6.631 8.900 5.372
Yield 98.50% 99.36% 97.73%
P R E S S I N G
I/P 6.631 8.900 5.372
Less: Scrap 0.040 0.005 0.011
Material O/P 6.591 8.895 5.361
Yield 99.40% 99.94% 99.80%
S I L I C O N
I/P 6.591 8.895 5.361
Add: Silicon (Note 2) 0.109 0.291 0.104
Less: Scrap 0.520 0.029 0.280
Material O/P 6.071 8.866 5.081
Actual 6.180 9.157 5.185
Yield 92.24% 99.68% 94.89%
U N D E R C O A T I N G
I/P 6.180 9.157 5.185
Add: Under-Coating Paint 0.690 0.835 1.060
Less: Scrap 0.000 0.000 0.000
Material O/P 6.870 9.992 6.245
Actual 6.870 9.992 6.245
Yield 100.00% 100.00% 100.00%
F I N A
L
C O A
T I N G
I/P 6.870 9.992 6.245
Add: Final-Coating Paint 1.519 1.319 -0.573Less: Scrap 0.000 0.000 0.000
8/4/2019 Cost Optimization & Diagonstic
http://slidepdf.com/reader/full/cost-optimization-diagonstic 29/70
Conducting Company Diagnostic &Cost Rohit Anand
Optimization Strategy 10BSP1025
Page 29
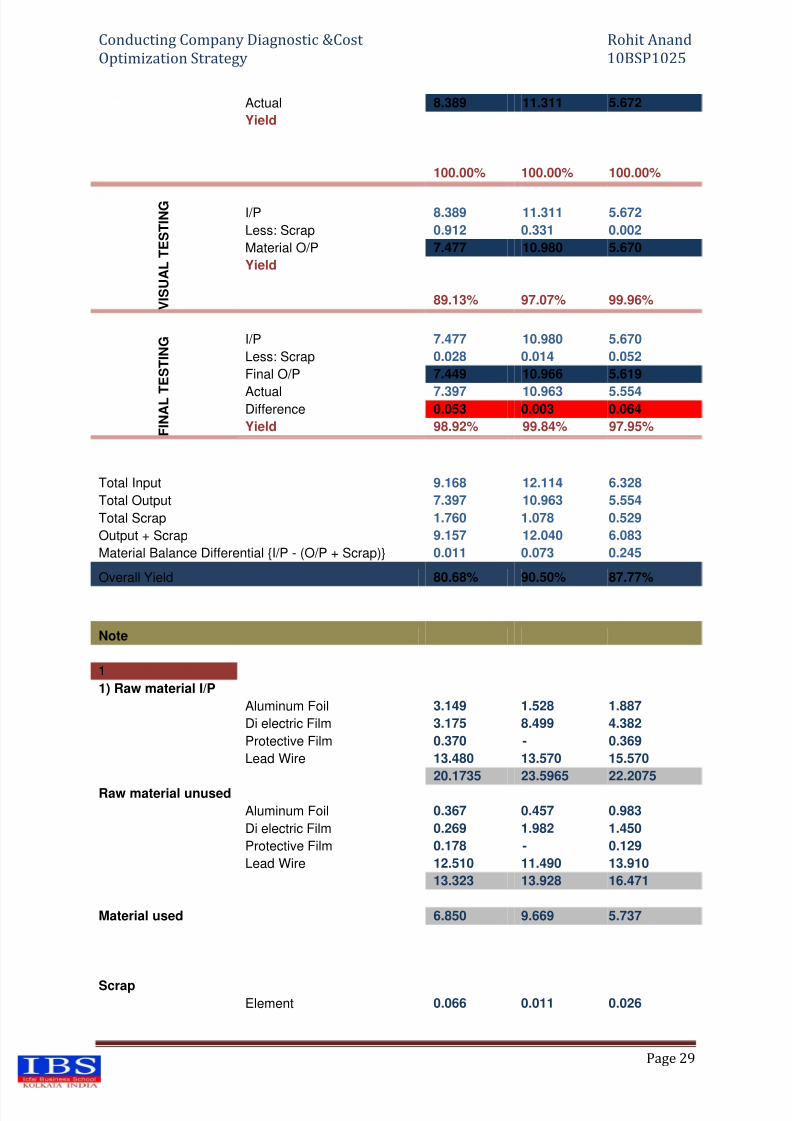
Actual 8.389 11.311 5.672
Yield
100.00% 100.00% 100.00%
V I S U A L T E S T I N G
I/P 8.389 11.311 5.672
Less: Scrap 0.912 0.331 0.002
Material O/P 7.477 10.980 5.670
Yield
89.13% 97.07% 99.96%
F I N A L T
E S T I N G
I/P 7.477 10.980 5.670
Less: Scrap 0.028 0.014 0.052
Final O/P 7.449 10.966 5.619
Actual 7.397 10.963 5.554Difference 0.053 0.003 0.064
Yield 98.92% 99.84% 97.95%
Total Input 9.168 12.114 6.328
Total Output 7.397 10.963 5.554
Total Scrap 1.760 1.078 0.529
Output + Scrap 9.157 12.040 6.083
Material Balance Differential {I/P - (O/P + Scrap)} 0.011 0.073 0.245
Overall Yield 80.68% 90.50% 87.77%
Note
1
1) Raw material I/P
Aluminum Foil 3.149 1.528 1.887
Di electric Film 3.175 8.499 4.382
Protective Film 0.370 - 0.369
Lead Wire 13.480 13.570 15.570
20.1735 23.5965 22.2075
Raw material unused
Aluminum Foil 0.367 0.457 0.983
Di electric Film 0.269 1.982 1.450
Protective Film 0.178 - 0.129
Lead Wire 12.510 11.490 13.910
13.323 13.928 16.471
Material used 6.850 9.669 5.737
ScrapElement 0.066 0.011 0.026
8/4/2019 Cost Optimization & Diagonstic
http://slidepdf.com/reader/full/cost-optimization-diagonstic 30/70
Conducting Company Diagnostic &Cost Rohit Anand
Optimization Strategy 10BSP1025
Page 30
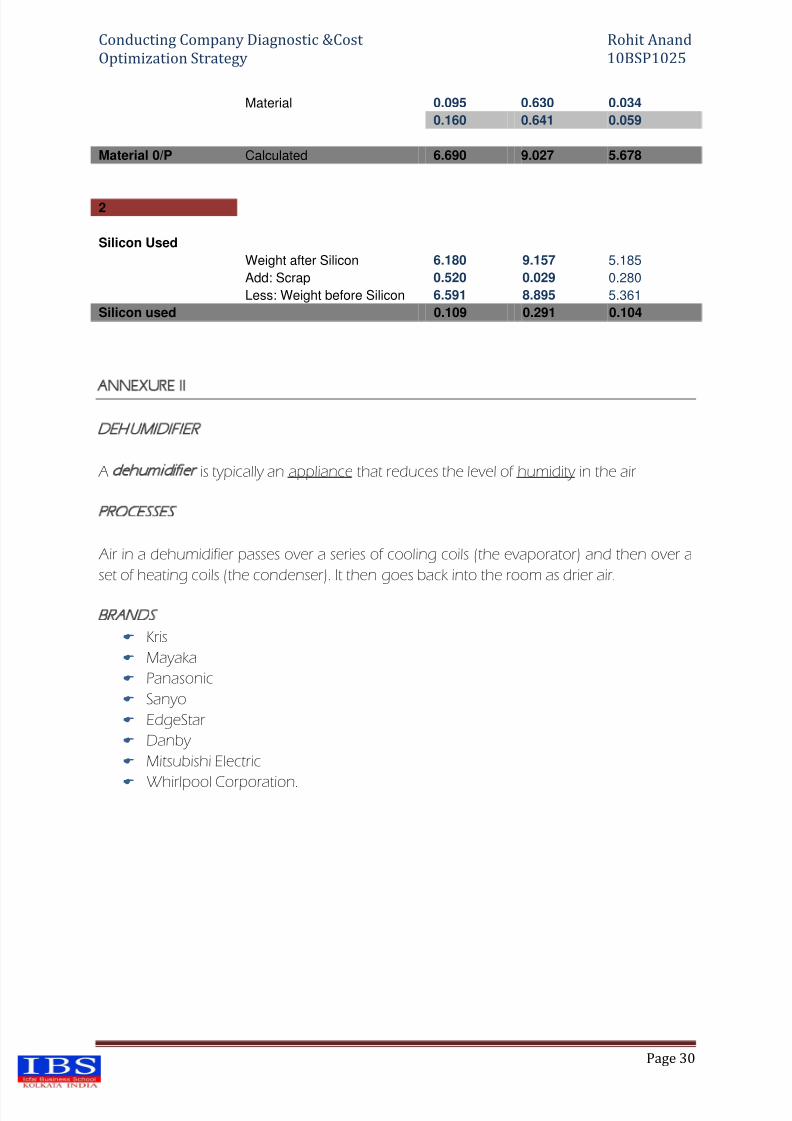
Material 0.095 0.630 0.034
0.160 0.641 0.059
Material 0/P Calculated 6.690 9.027 5.678
2
Silicon Used
Weight after Silicon 6.180 9.157 5.185
Add: Scrap 0.520 0.029 0.280
Less: Weight before Silicon 6.591 8.895 5.361
Silicon used 0.109 0.291 0.104
ANNEXURE II
DEHUMIDIFIER
A dehumidifier is typically an appliance that reduces the level of humidity in the air
PROCESSES
Air in a dehumidifier passes over a series of cooling coils (the evaporator) and then over a
set of heating coils (the condenser). It then goes back into the room as drier air.
BRANDS
Kris
Mayaka
Panasonic
Sanyo
EdgeStar
Danby
Mitsubishi Electric
Whirlpool Corporation.
8/4/2019 Cost Optimization & Diagonstic
http://slidepdf.com/reader/full/cost-optimization-diagonstic 31/70
Conducting Company Diagnostic &Cost Rohit Anand
Optimization Strategy 10BSP1025
Page 31
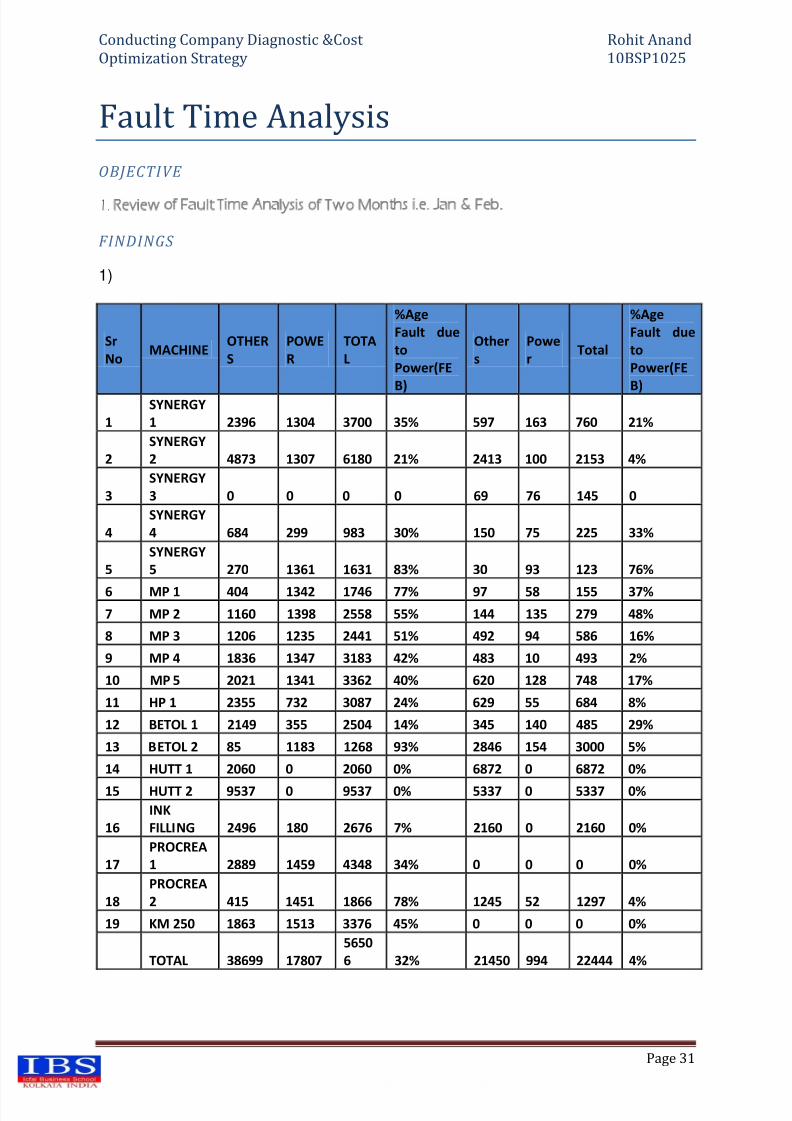
Fault Time Analysis
OBJECTIVE
1. Review of Fault Time Analysis of Two Months i.e. Jan & Feb.
FINDINGS
1)
Sr
NoMACHINE
OTHER
S
POWE
R
TOTA
L
%Age
Fault due
to
Power(FE
B)
Other
s
Powe
rTotal
%Age
Fault due
to
Power(FE
B)
1
SYNERGY
1 2396 1304 3700 35% 597 163 760 21%
2
SYNERGY
2 4873 1307 6180 21% 2413 100 2153 4%
3
SYNERGY
3 0 0 0 0 69 76 145 0
4
SYNERGY
4 684 299 983 30% 150 75 225 33%
5
SYNERGY
5 270 1361 1631 83% 30 93 123 76%
6 MP 1 404 1342 1746 77% 97 58 155 37%
7 MP 2 1160 1398 2558 55% 144 135 279 48%
8 MP 3 1206 1235 2441 51% 492 94 586 16%
9 MP 4 1836 1347 3183 42% 483 10 493 2%
10 MP 5 2021 1341 3362 40% 620 128 748 17%
11 HP 1 2355 732 3087 24% 629 55 684 8%
12 BETOL 1 2149 355 2504 14% 345 140 485 29%
13 BETOL 2 85 1183 1268 93% 2846 154 3000 5%
14 HUTT 1 2060 0 2060 0% 6872 0 6872 0%
15 HUTT 2 9537 0 9537 0% 5337 0 5337 0%
16
INK
FILLING 2496 180 2676 7% 2160 0 2160 0%
17
PROCREA
1 2889 1459 4348 34% 0 0 0 0%
18
PROCREA
2 415 1451 1866 78% 1245 52 1297 4%
19 KM 250 1863 1513 3376 45% 0 0 0 0%
TOTAL 38699 17807
5650
6 32% 21450 994 22444 4%
8/4/2019 Cost Optimization & Diagonstic
http://slidepdf.com/reader/full/cost-optimization-diagonstic 32/70
Conducting Company Diagnostic &Cost Rohit Anand
Optimization Strategy 10BSP1025
Page 32
2) FINDINGS FROM DATA
WE FIND THAT % FAULT DUE TO POWER IS MORE IN FEBURARY WHICH IS 32%
COMPARED TO THAT IN JANURARY WHICH IS 4% WHICH MIGHT BE DUE TO STOCK
OUT OF RAW MATERIAL IN MONTH OF FEBURARY 2011 WHICH CAN BE SEEN MARKEDRED IN COLOUR FOR CONVENIENCE FROM ABOVE TABLE .WE HAVE PLOTTED THE
CONSUMPTION (=ISSUE) VS STOCKING PATTERN TO ELABORATE THIS POINT .
3) RECOMMENDATION
Proper training of labour handling and using the machines and routineinspection of the labour output and machines.
We are keeping Prevention Maintenance Program in our future project.
Proper Maintenance of required Raw Material to avoid Stock out Of Raw
material. Ensuring suitable supply of Power to make proper use of Machine.
8/4/2019 Cost Optimization & Diagonstic
http://slidepdf.com/reader/full/cost-optimization-diagonstic 33/70
Conducting Company Diagnostic &Cost Rohit Anand
Optimization Strategy 10BSP1025
Page 33
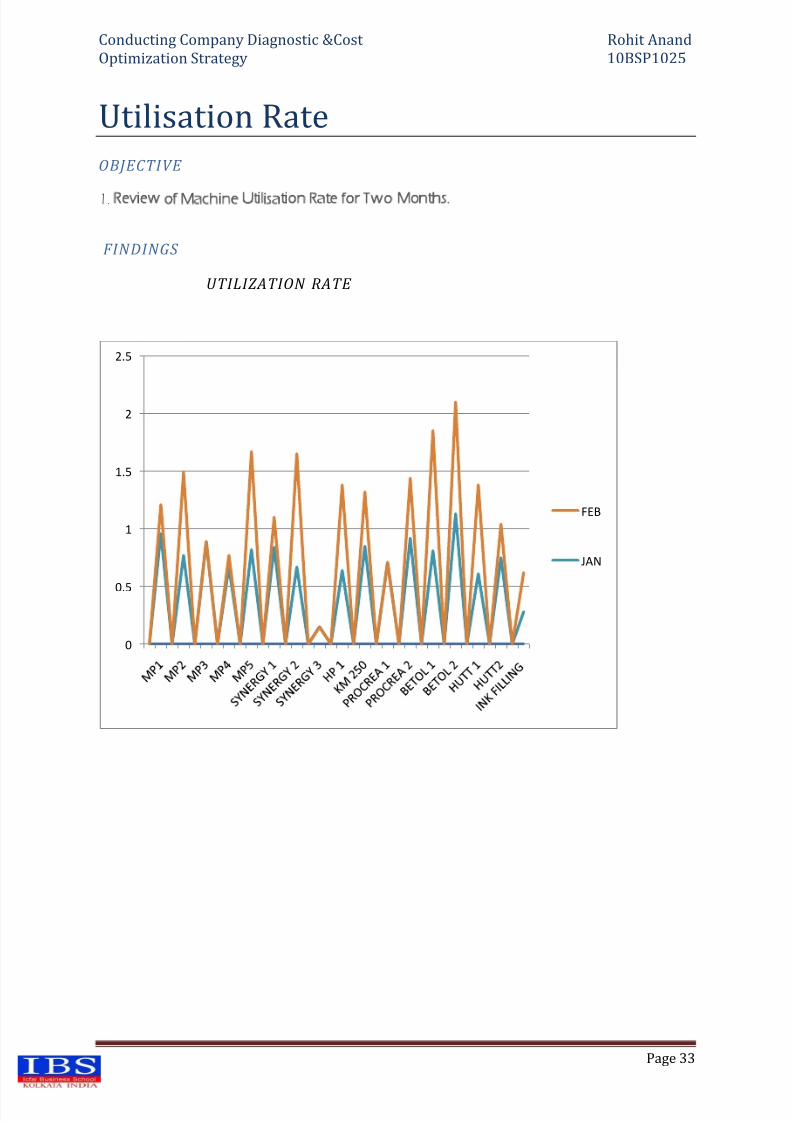
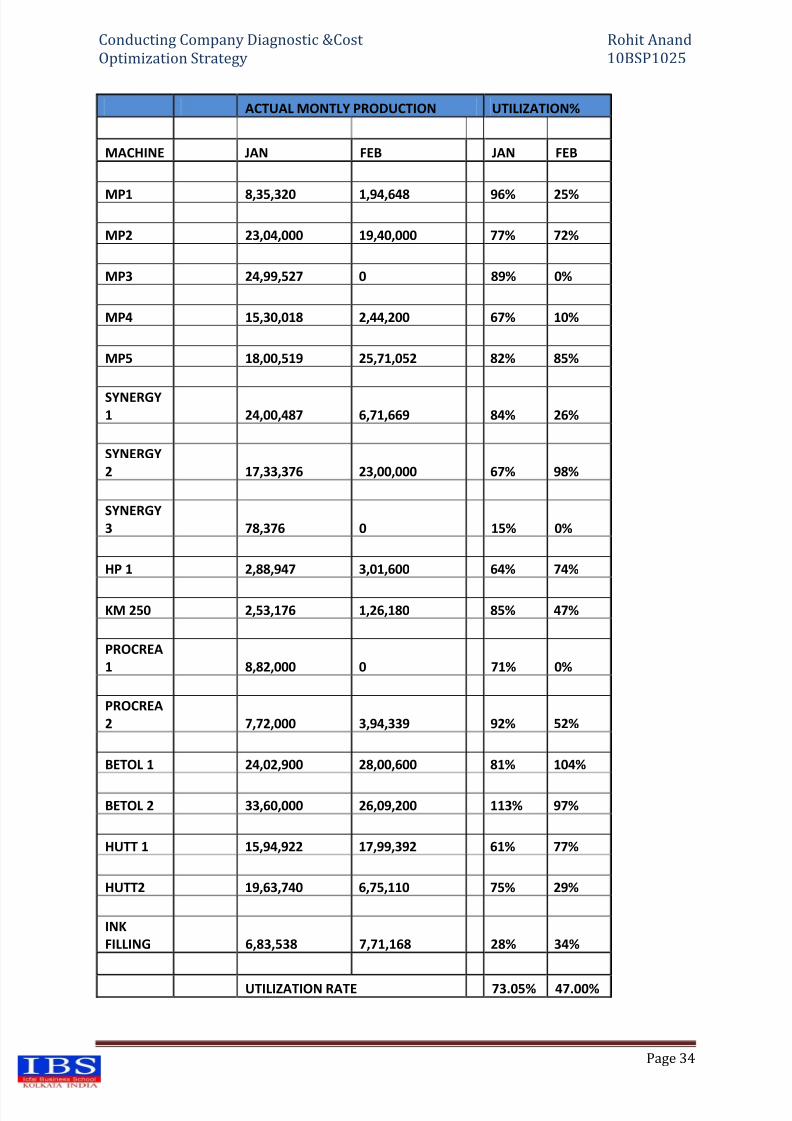
Utilisation Rate
OBJECTIVE
1. Review of Machine Utilisation Rate for Two Months.
FINDINGS
UTILIZATION RATE
0
0.5
1
1.5
2
2.5
FEB
JAN
8/4/2019 Cost Optimization & Diagonstic
http://slidepdf.com/reader/full/cost-optimization-diagonstic 34/70
Conducting Company Diagnostic &Cost Rohit Anand
Optimization Strategy 10BSP1025
Page 34
ACTUAL MONTLY PRODUCTION UTILIZATION%
MACHINE JAN FEB JAN FEB
MP1 8,35,320 1,94,648 96% 25%
MP2 23,04,000 19,40,000 77% 72%
MP3 24,99,527 0 89% 0%
MP4 15,30,018 2,44,200 67% 10%
MP5 18,00,519 25,71,052 82% 85%
SYNERGY1 24,00,487 6,71,669 84% 26%
SYNERGY
2 17,33,376 23,00,000 67% 98%
SYNERGY
3 78,376 0 15% 0%
HP 1 2,88,947 3,01,600 64% 74%
KM 250 2,53,176 1,26,180 85% 47%
PROCREA
1 8,82,000 0 71% 0%
PROCREA
2 7,72,000 3,94,339 92% 52%
BETOL 1 24,02,900 28,00,600 81% 104%
BETOL 2 33,60,000 26,09,200 113% 97%
HUTT 1 15,94,922 17,99,392 61% 77%
HUTT2 19,63,740 6,75,110 75% 29%
INK
FILLING 6,83,538 7,71,168 28% 34%
UTILIZATION RATE 73.05% 47.00%
8/4/2019 Cost Optimization & Diagonstic
http://slidepdf.com/reader/full/cost-optimization-diagonstic 35/70
Conducting Company Diagnostic &Cost Rohit Anand
Optimization Strategy 10BSP1025
Page 35
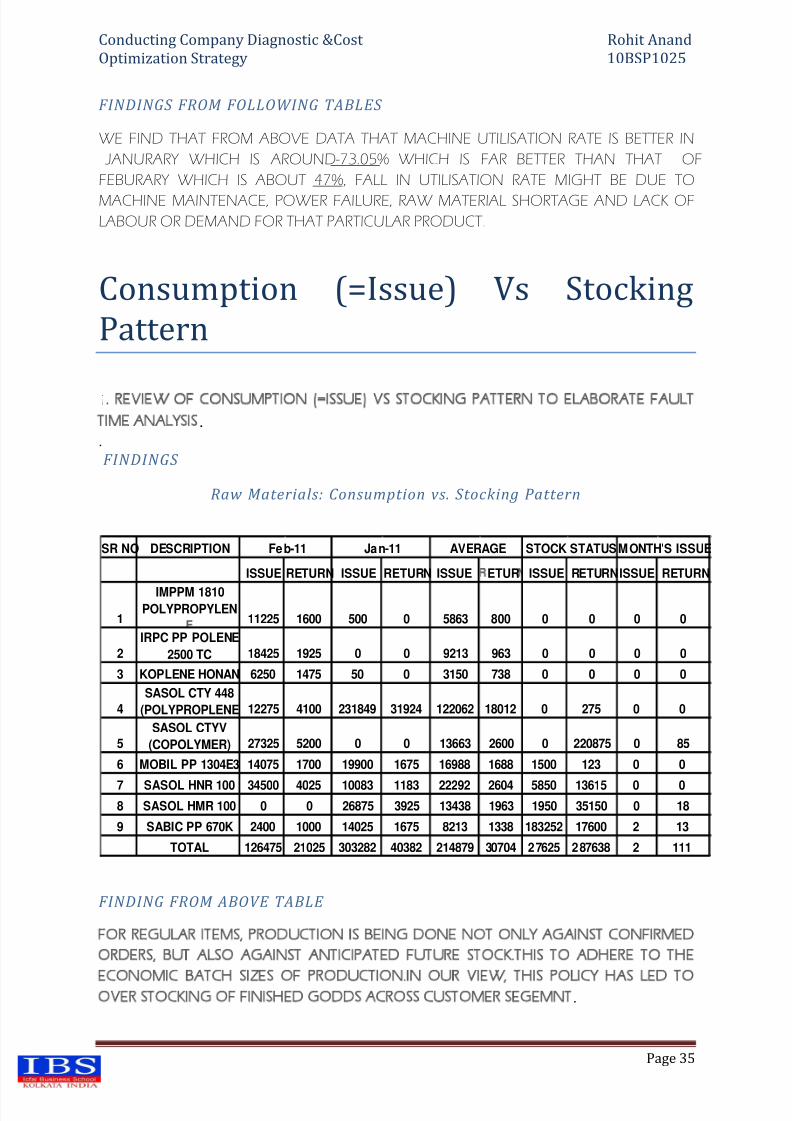
FINDINGS FROM FOLLOWING TABLES
WE FIND THAT FROM ABOVE DATA THAT MACHINE UTILISATION RATE IS BETTER IN
JANURARY WHICH IS AROUND-73.05% WHICH IS FAR BETTER THAN THAT OF
FEBURARY WHICH IS ABOUT 47%, FALL IN UTILISATION RATE MIGHT BE DUE TO
MACHINE MAINTENACE, POWER FAILURE, RAW MATERIAL SHORTAGE AND LACK OF
LABOUR OR DEMAND FOR THAT PARTICULAR PRODUCT .
Consumption (=Issue) Vs Stocking
Pattern
1. REVIEW OF CONSUMPTION (=ISSUE) VS STOCKING PATTERN TO ELABORATE FAULT
TIME ANALYSIS. .
FINDINGS
Raw Materials: Consumption vs. Stocking Pattern
FINDING FROM ABOVE TABLE
FOR REGULAR ITEMS, PRODUCTION IS BEING DONE NOT ONLY AGAINST CONFIRMED
ORDERS, BUT ALSO AGAINST ANTICIPATED FUTURE STOCK.THIS TO ADHERE TO THE
ECONOMIC BATCH SIZES OF PRODUCTION.IN OUR VIEW, THIS POLICY HAS LED TOOVER STOCKING OF FINISHED GODDS ACROSS CUSTOMER SEGEMNT.
SR NO DESCRIPTION
ISSUE RETURN ISSUE RETURN ISSUE ETUR ISSUE RETURNISSUE RETURN
1
IMPPM 1810POLYPROPYLEN
11225 1600 500 0 5863 800 0 0 0 0
2
IRPC PP POLENE
2500 TC 18425 1925 0 0 9213 963 0 0 0 0
3 KOPLENE HONAN 6250 1475 50 0 3150 738 0 0 0 0
4
SASOL CTY 448
(POLYPROPLENE 12275 4100 231849 31924 122062 18012 0 275 0 0
5
SASOL CTYV
(COPOLYMER) 27325 5200 0 0 13663 2600 0 220875 0 85
6 MOBIL PP 1304E3 14075 1700 19900 1675 16988 1688 1500 123 0 0
7 SASOL HNR 100 34500 4025 10083 1183 22292 2604 5850 13615 0 08 SASOL HMR 100 0 0 26875 3925 13438 1963 1950 35150 0 18
9 SABIC PP 670K 2400 1000 14025 1675 8213 1338 183252 17600 2 13
TOTAL 126475 21025 303282 40382 214879 30704 27625 287638 2 111
Feb-11 Jan-11 AVERAGE STOCK STATUSMONTH'S ISSUE

8/4/2019 Cost Optimization & Diagonstic
http://slidepdf.com/reader/full/cost-optimization-diagonstic 36/70
Conducting Company Diagnostic &Cost Rohit Anand
Optimization Strategy 10BSP1025
Page 36
Havells Capacitors a Step Further In
Energy Conservation
Today's world is dependent on electricity. For economic prosperity and securing the futureit is necessary that everyone should contribute to prevent themselves and environmentfrom the losses occurring due to distribution.
The prime concern of today's world is energy conservation in the most effective way,catering to this need of the society, in most modern world our dependency on thecapacitor is increasing day by day. Capacitors are designed to improve the power factor.These capacitors improve "Active Power" and reduce "Reactive Power" that helps in savingenergy.
Power saving is a vital issue today. An acute shortage of electrical power has been felt andmore importantly it has been very well accepted that the resources are limited. Therefore,energy saving need to be looked upon as one of the key initiative to mitigate the problemin near future.
Normal practice is to consider the parameter of actual amount of money spent on usageof electrical energy is considered and direct expenditure incurred on power becomes thepoint of focus and all the effort are taken to improve upon that. Normal efforts are alwaysoriented towards saving in Active Energy, i.e., kWh unless it is made mandatory by Electricity Board to control Power Factor.
In this process, the user is mostly unaware of problems that arise in the society. The adverseaffect of quality of power on saving and in generating electrical pollution are generally unknown to the industrial user. In their pursuit of energy saving, little attention is paid tothe issue of power quality.
The indirect effect of power quality poses problem not only to user but also on distributionand generation. Every day, we witness losses due to power failure, load shedding andgeneration, cascade failure of turbine in a grid, blowing up of transformers, sustain low voltage, etc. At the root of these problems is increasing pollution of electrical power causedby poor power factor, high harmonics content and high crest factor. This causestremendous strain on our power resources; therefore optimum use of power must be
exercised. Power saving in real sense cannot be achieved unless all these aspects areconsidered, studied and rectified.
Society needs to be cautious of all these factors, while using electricity in whichever form.Therefore, the perspective should not only from the point of direct saving but also asindirect and additional savings through power conservation.
Voltage and Current are two most important parameters on which quality of power canbe examined. While voltage is within the control of the power generation and distributionagency, current is under total control of the user. Maximum synchronisation of these twoparameters would achieve a goal of "saving" in totality and would ensure the best quality of power. These two parameters must go hand in hand and any shift between themwould lead to introduction of ineffective use of power and would results in monetary
8/4/2019 Cost Optimization & Diagonstic
http://slidepdf.com/reader/full/cost-optimization-diagonstic 37/70
Conducting Company Diagnostic &Cost Rohit Anand
Optimization Strategy 10BSP1025
Page 37
losses. In power saving and quality of power, Power Factor improvement is the mostimportant area, which needs to be focused on priority.
However, most of the electricity boards/distribution companies have made it compulsory to improve the Power Factor to a level of 0.90 minimum. This level varies for different states.
Power capacitor plays a vital role not only in power saving but also in improving the quality of power. The ordinary capacitor normally available in the Indian market is mainly in therange of 1 to 25 KVAr as single unit, which can be increased to any rating by the way of parallel connecting these capacitors. There are different technologies existing in thecapacitor like MPP, APP, mixed dielectric, etc.
The latest state-of-the-art technology is the metallised polypropylene capacitor, which ishaving self-healing property. It gets self-healed even in case of any puncture in thedielectric due to over voltage or over current. It has the lowest losses in the capacitor incomparison to other technologies of capacitor.
Now with these advances, MPP type capacitor is the best option for not only improvingpower quality but also act as a major component in optimum utilisation of electricalenergy. The entire range of MPP capacitors is meticulously made to provide consumers thebest and consistent performance.
In today's state, it has become very important to increase the use of MPP capacitors andimprove the power factor in all the areas, which will save energy at local level as well asnational level. This in turn will give us less load shedding and improved level of powersupply without disturbance with less price.
Low watt loss, less heating gives extra edge to life For a consistent and reliable product it isrequired to adopt the best practices, which requires following conditions in control:
Machinery Raw Material Control Process Control Environment
At Havells we have taken care of all the above mentioned parameters.
Winding Machine: Today the company has the worlds latest generation windingmachines. These machines are imported from Switzerland and are of very high speed.These machines are very useful from the customer point of view as these do not allow thecapacitor manufacturer to use low grade of polypropylene film in the capacitor, which waspossible with the earlier machines of same make. Thanks to the latest technologicaladvances, these machines even do automatic staggering and provide consistent outputquality. However, the earlier machines were also automatic in terms of winding, filmfeeding, core feeding, etc., but the staggering was required to be done manually so thechances of human error were possible.
Raw Material: The base film, i.e., polypropylene, which is the main part of any capacitorshould be of best quality. Thanks to world latest machines Havells customers can be restassured that lower grade MPP cannot be used. Presently the company is using films fromTreofan - Germany and Oji - Japan, which also have a very good break down voltage.
8/4/2019 Cost Optimization & Diagonstic
http://slidepdf.com/reader/full/cost-optimization-diagonstic 38/70
Conducting Company Diagnostic &Cost Rohit Anand
Optimization Strategy 10BSP1025
Page 38
Control Process: To have a control output quality, process needs to be controlled. AtHavells even the small process to make the notch mechanism is also fully automatic. Otherprocesses, which include testing, self clearing, spray painting all is fully automatic, wherethe function of the operator is only to load the job. Especially the zinc spray, which isanother very important process after winding, is fully automatic and spray process on both
the sides is completed in single operation.
Control Environment: Since moisture and dust are very much detrimental for the capacitor,it is very important that winding should be done in the controlled environment. Windingroom at Havells covers all the important factors, which include:
Air on the work area is controlled for its flow, temperature, humidity and dust. Winding room is equipped with air handle unit with risers, filters, pre-filters and
fresh air source. AHU is designed for 1000 Class Accuracy (300 particles/ft3 of 0.3 mm size and 100
particles/ft3 of 0.5 mm size).
The winding room is provided with air showers (1000 Class) that blast dust fromclothes. Also act as airlocks to prevent contaminants.
Entry into winding room only with air showers, aprons, hair caps and shoe covers.
With all the above controls, the company is able to achieve the lowest watt loss in theindustry. Where Industry norms are 0.5 watt/kVAr even the best of manufacturers couldnot be able to go beyond 0.35 Watt/kVAr, the per kVAr watt loss of Havells capacitor is tothe tune of 0.06 Watt/kVAr to 0.25 Watt/kVAr.
Thus, Havells has tried to do the basics right and the product output is consistent andcontrolled.
8/4/2019 Cost Optimization & Diagonstic
http://slidepdf.com/reader/full/cost-optimization-diagonstic 39/70
Conducting Company Diagnostic &Cost Rohit Anand
Optimization Strategy 10BSP1025
Page 39
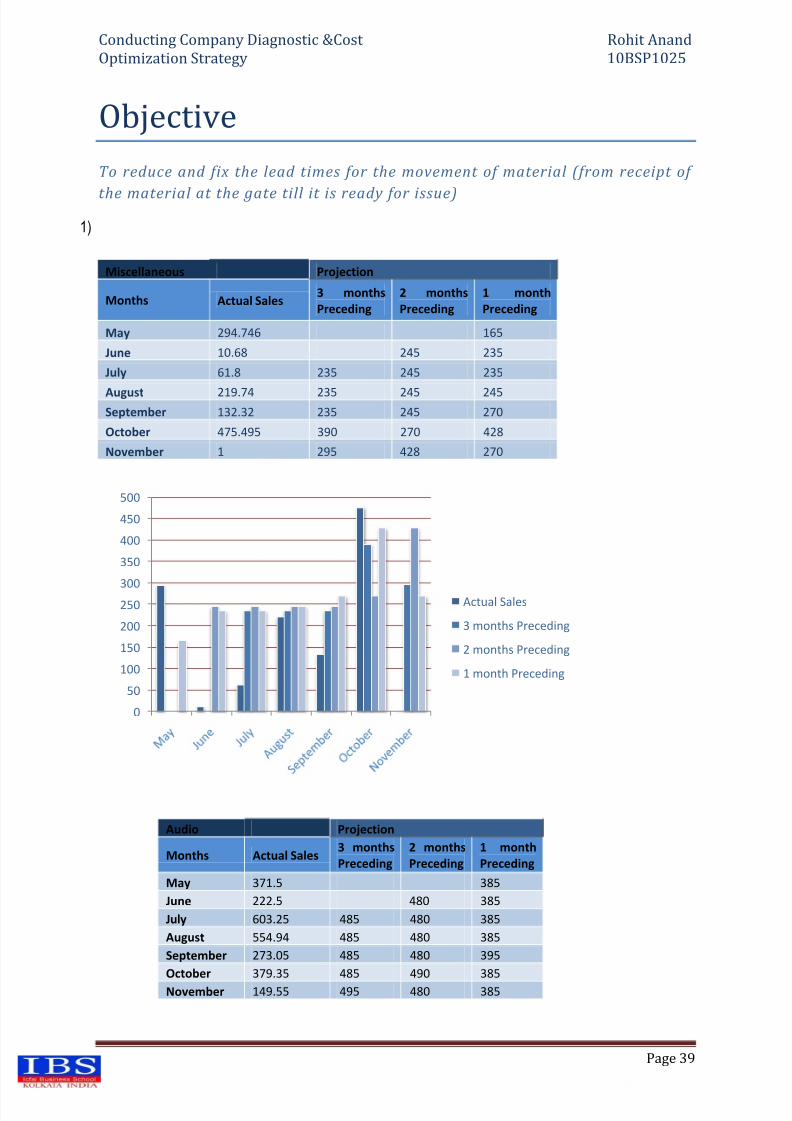
Objective
To reduce and fix the lead times for the movement of material (from receipt of
the material at the gate till it is ready for issue)
1)
Miscellaneous Projection
Months Actual Sales3 months
Preceding
2 months
Preceding
1 month
Preceding
May 294.746 165
June 10.68 245 235
July 61.8 235 245 235
August 219.74 235 245 245September 132.32 235 245 270
October 475.495 390 270 428
November 1 295 428 270
Audio Projection
Months Actual Sales3 months
Preceding
2 months
Preceding
1 month
Preceding
May 371.5 385
June 222.5 480 385
July 603.25 485 480 385
August 554.94 485 480 385
September 273.05 485 480 395
October 379.35 485 490 385
November 149.55 495 480 385
0
50
100
150
200
250300
350
400
450
500
Actual Sales
3 months Preceding
2 months Preceding
1 month Preceding
8/4/2019 Cost Optimization & Diagonstic
http://slidepdf.com/reader/full/cost-optimization-diagonstic 40/70
Conducting Company Diagnostic &Cost Rohit Anand
Optimization Strategy 10BSP1025
Page 40
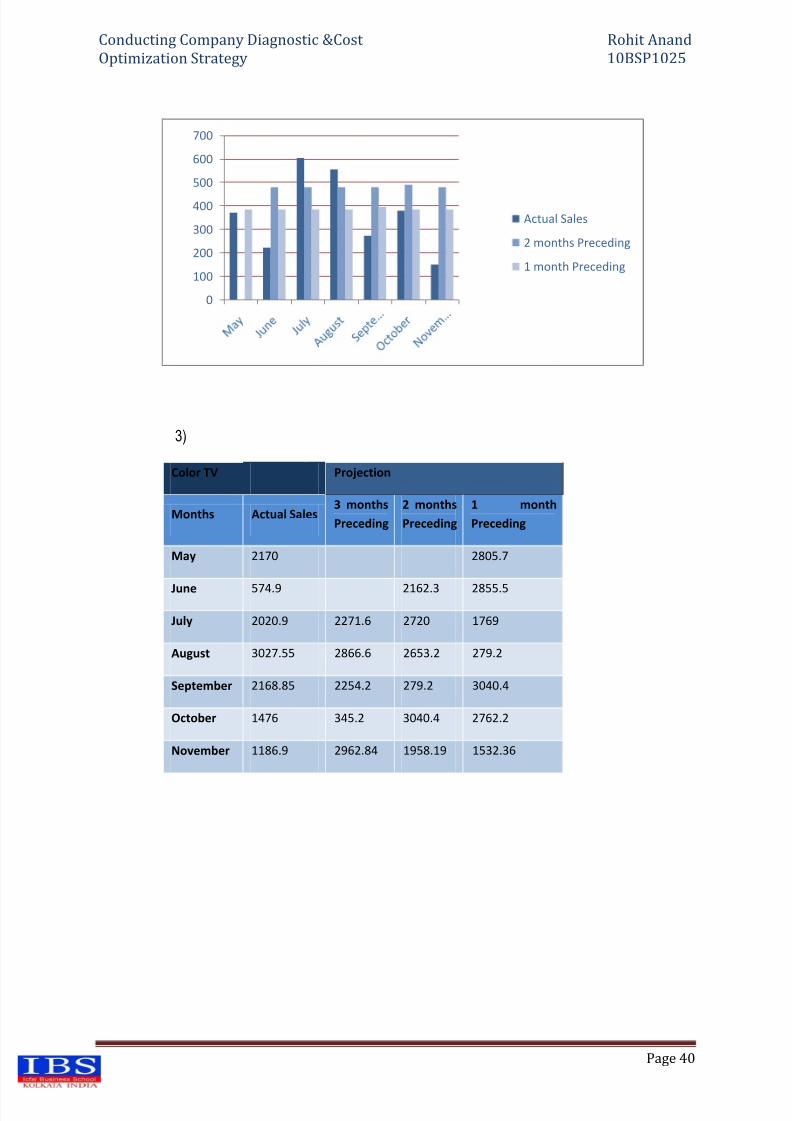
3)
Color TV Projection
Months Actual Sales3 months
Preceding
2 months
Preceding
1 month
Preceding
May 2170 2805.7
June 574.9 2162.3 2855.5
July 2020.9 2271.6 2720 1769
August 3027.55 2866.6 2653.2 279.2
September 2168.85 2254.2 279.2 3040.4
October 1476 345.2 3040.4 2762.2
November 1186.9 2962.84 1958.19 1532.36
0
100
200
300
400
500
600
700
Actual Sales
2 months Preceding
1 month Preceding
8/4/2019 Cost Optimization & Diagonstic
http://slidepdf.com/reader/full/cost-optimization-diagonstic 41/70
Conducting Company Diagnostic &Cost Rohit Anand
Optimization Strategy 10BSP1025
Page 41
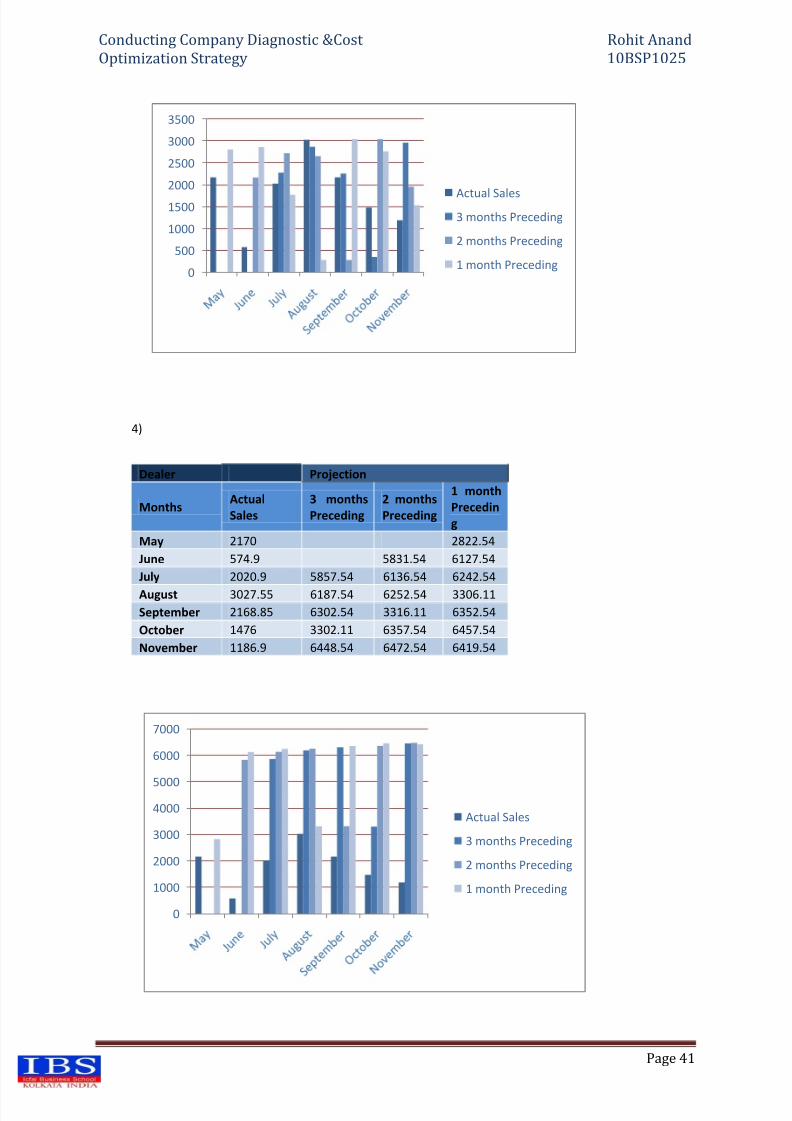
4)
Dealer Projection
MonthsActual
Sales
3 months
Preceding
2 months
Preceding
1 month
Precedin
g
May 2170 2822.54
June 574.9 5831.54 6127.54
July 2020.9 5857.54 6136.54 6242.54
August 3027.55 6187.54 6252.54 3306.11
September 2168.85 6302.54 3316.11 6352.54
October 1476 3302.11 6357.54 6457.54
November 1186.9 6448.54 6472.54 6419.54
0
500
1000
1500
2000
2500
3000
3500
Actual Sales
3 months Preceding
2 months Preceding
1 month Preceding
0
1000
2000
3000
4000
5000
6000
7000
Actual Sales
3 months Preceding
2 months Preceding
1 month Preceding
8/4/2019 Cost Optimization & Diagonstic
http://slidepdf.com/reader/full/cost-optimization-diagonstic 42/70
Conducting Company Diagnostic &Cost Rohit Anand
Optimization Strategy 10BSP1025
Page 42
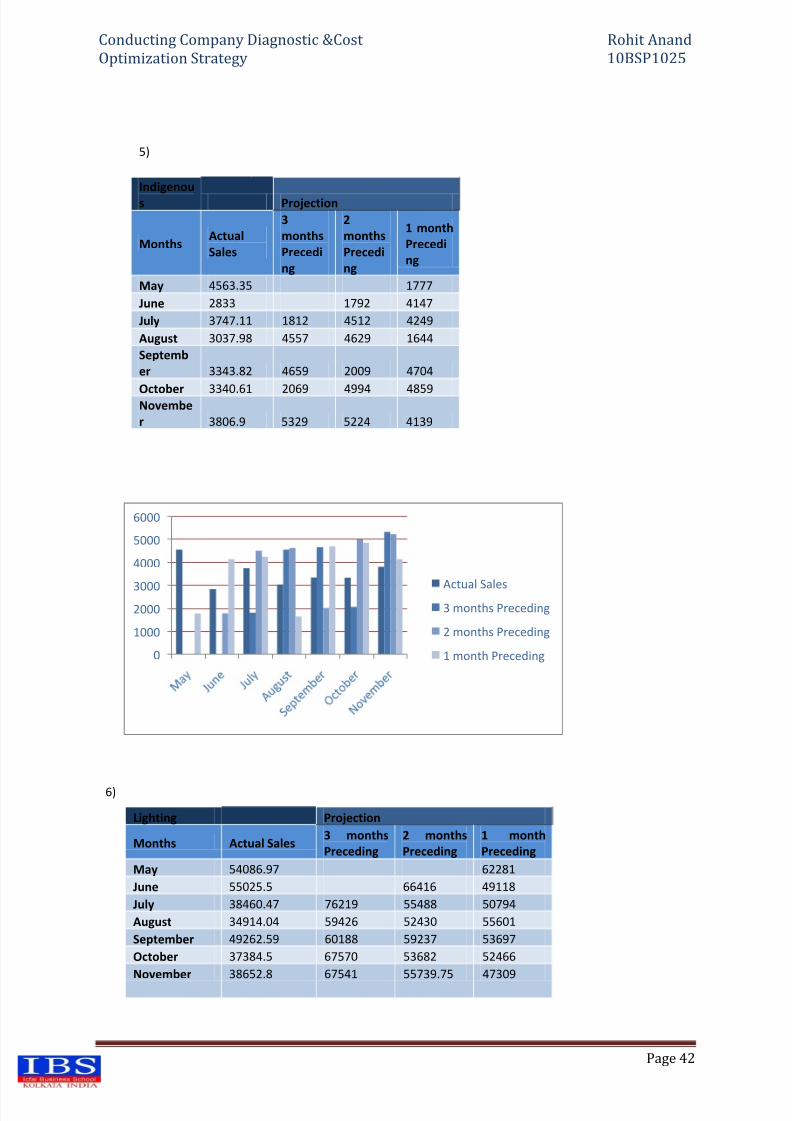
5)
Indigenou
s Projection
MonthsActual
Sales
3
months
Precedi
ng
2
months
Precedi
ng
1 month
Precedi
ng
May 4563.35 1777
June 2833 1792 4147
July 3747.11 1812 4512 4249
August 3037.98 4557 4629 1644
Septemb
er 3343.82 4659 2009 4704
October 3340.61 2069 4994 4859Novembe
r 3806.9 5329 5224 4139
6)
Lighting Projection
Months Actual Sales3 months
Preceding
2 months
Preceding
1 month
Preceding
May 54086.97 62281
June 55025.5 66416 49118
July 38460.47 76219 55488 50794
August 34914.04 59426 52430 55601
September 49262.59 60188 59237 53697
October 37384.5 67570 53682 52466
November 38652.8 67541 55739.75 47309
0
1000
2000
3000
4000
5000
6000
Actual Sales3 months Preceding
2 months Preceding
1 month Preceding
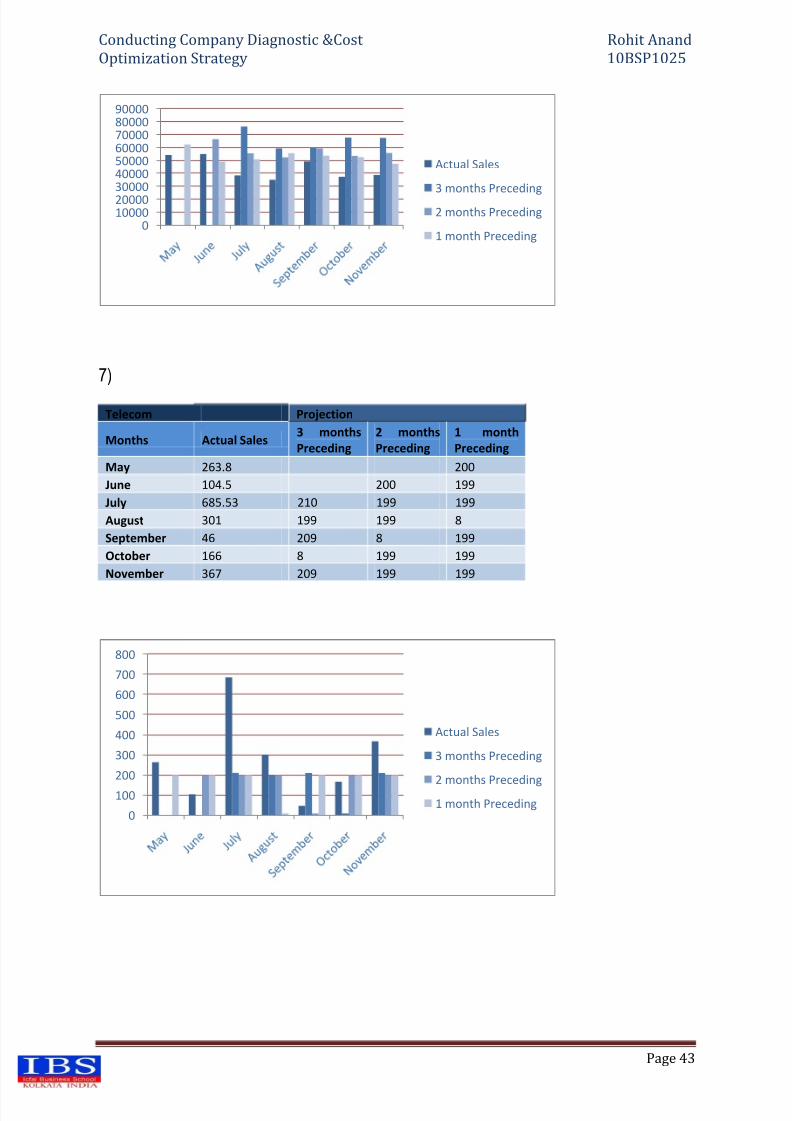
8/4/2019 Cost Optimization & Diagonstic
http://slidepdf.com/reader/full/cost-optimization-diagonstic 43/70
Conducting Company Diagnostic &Cost Rohit Anand
Optimization Strategy 10BSP1025
Page 43
7)
Telecom Projection
Months Actual Sales3 months
Preceding
2 months
Preceding
1 month
Preceding
May 263.8 200
June 104.5 200 199
July 685.53 210 199 199
August 301 199 199 8
September 46 209 8 199
October 166 8 199 199
November 367 209 199 199
01000020000
30000400005000060000700008000090000
Actual Sales
3 months Preceding
2 months Preceding
1 month Preceding
0
100
200
300
400
500
600
700
800
Actual Sales
3 months Preceding
2 months Preceding1 month Preceding
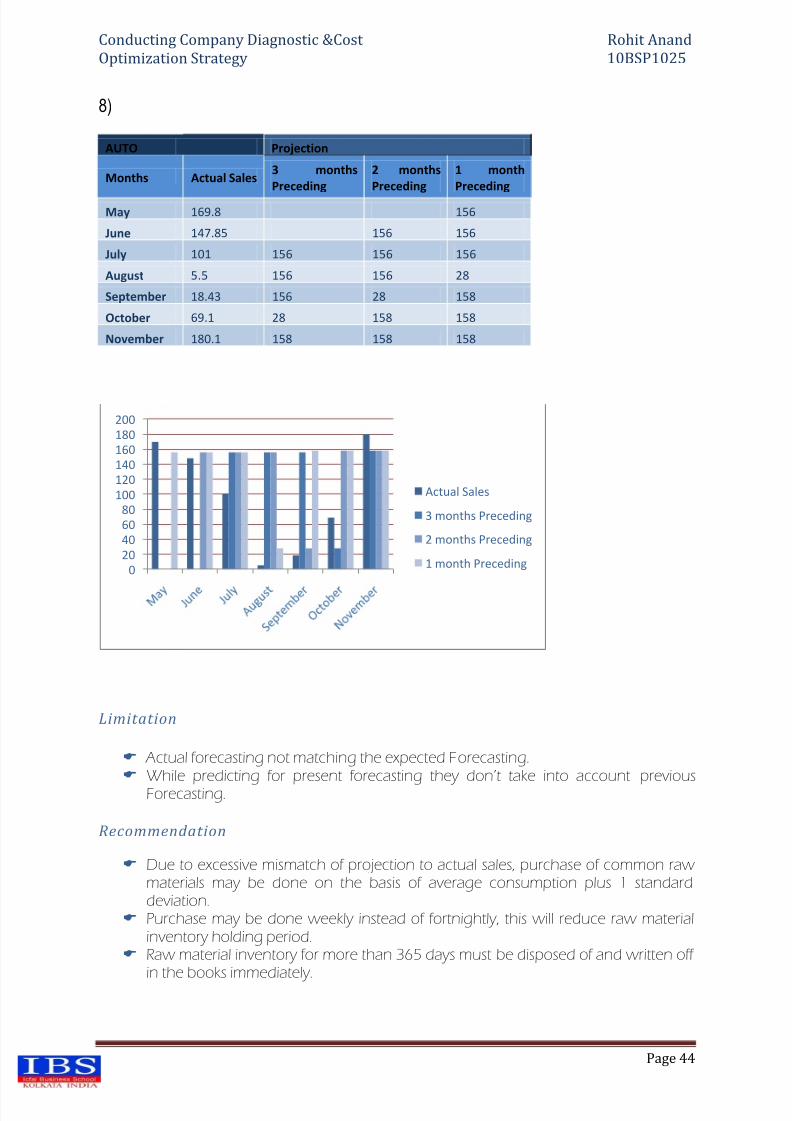
8/4/2019 Cost Optimization & Diagonstic
http://slidepdf.com/reader/full/cost-optimization-diagonstic 44/70
Conducting Company Diagnostic &Cost Rohit Anand
Optimization Strategy 10BSP1025
Page 44
8)
AUTO Projection
Months Actual Sales3 months
Preceding
2 months
Preceding
1 month
Preceding
May 169.8 156
June 147.85 156 156
July 101 156 156 156
August 5.5 156 156 28
September 18.43 156 28 158
October 69.1 28 158 158
November 180.1 158 158 158
Limitation
Actual forecasting not matching the expected Forecasting. While predicting for present forecasting they don’t take into account previous
Forecasting.
Recommendation
Due to excessive mismatch of projection to actual sales, purchase of common raw materials may be done on the basis of average consumption plus 1 standarddeviation.
Purchase may be done weekly instead of fortnightly, this will reduce raw materialinventory holding period.
Raw material inventory for more than 365 days must be disposed of and written off in the books immediately.
0
20
40
60
80
100
120
140
160
180
200
Actual Sales
3 months Preceding
2 months Preceding
1 month Preceding
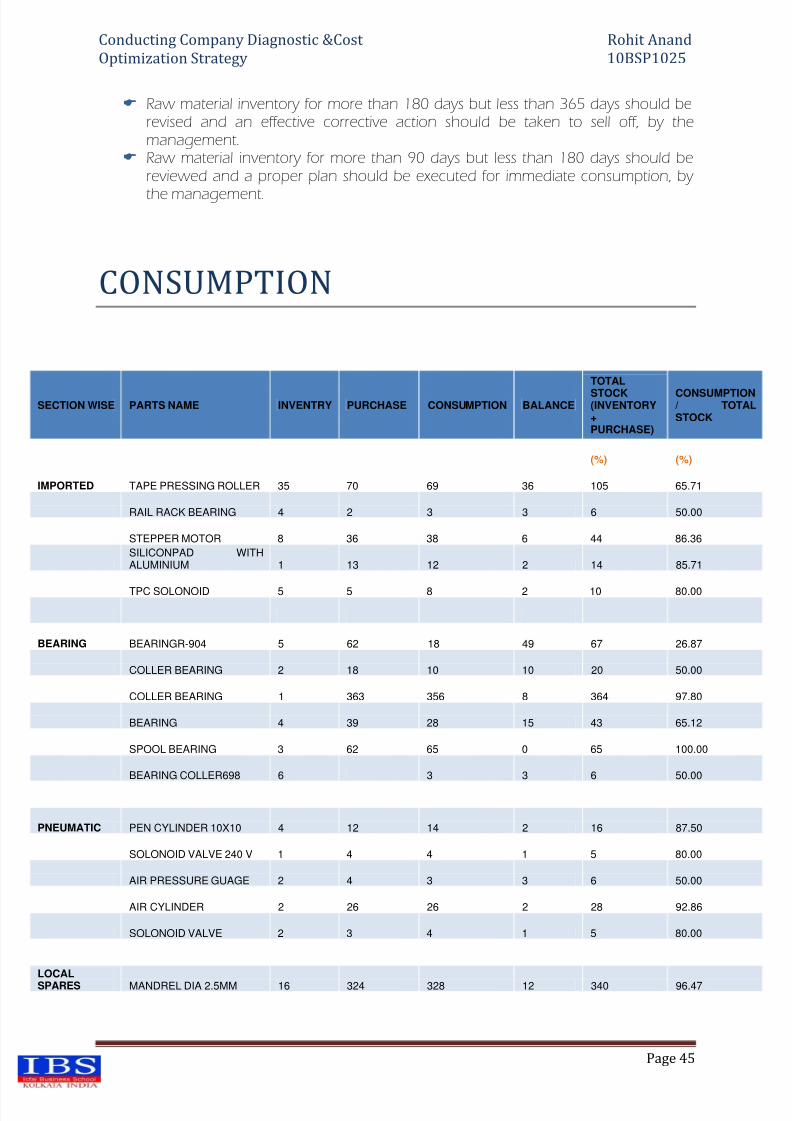
8/4/2019 Cost Optimization & Diagonstic
http://slidepdf.com/reader/full/cost-optimization-diagonstic 45/70
Conducting Company Diagnostic &Cost Rohit Anand
Optimization Strategy 10BSP1025
Page 45
Raw material inventory for more than 180 days but less than 365 days should berevised and an effective corrective action should be taken to sell off, by themanagement.
Raw material inventory for more than 90 days but less than 180 days should bereviewed and a proper plan should be executed for immediate consumption, by
the management.
CONSUMPTION
SECTION WISE PARTS NAME INVENTRY PURCHASE CONSUMPTION BALANCE
TOTAL
STOCK(INVENTORY+PURCHASE)
CONSUMPTION/ TOTALSTOCK
(%) (%)
IMPORTED TAPE PRESSING ROLLER 35 70 69 36 105 65.71
RAIL RACK BEARING 4 2 3 3 6 50.00
STEPPER MOTOR 8 36 38 6 44 86.36
SILICONPAD WITHALUMINIUM 1 13 12 2 14 85.71
TPC SOLONOID 5 5 8 2 10 80.00
BEARING BEARINGR-904 5 62 18 49 67 26.87
COLLER BEARING 2 18 10 10 20 50.00
COLLER BEARING 1 363 356 8 364 97.80
BEARING 4 39 28 15 43 65.12
SPOOL BEARING 3 62 65 0 65 100.00
BEARING COLLER698 6 3 3 6 50.00
PNEUMATIC PEN CYLINDER 10X10 4 12 14 2 16 87.50
SOLONOID VALVE 240 V 1 4 4 1 5 80.00
AIR PRESSURE GUAGE 2 4 3 3 6 50.00
AIR CYLINDER 2 26 26 2 28 92.86
SOLONOID VALVE 2 3 4 1 5 80.00
LOCAL
SPARES MANDREL DIA 2.5MM 16 324 328 12 340 96.47
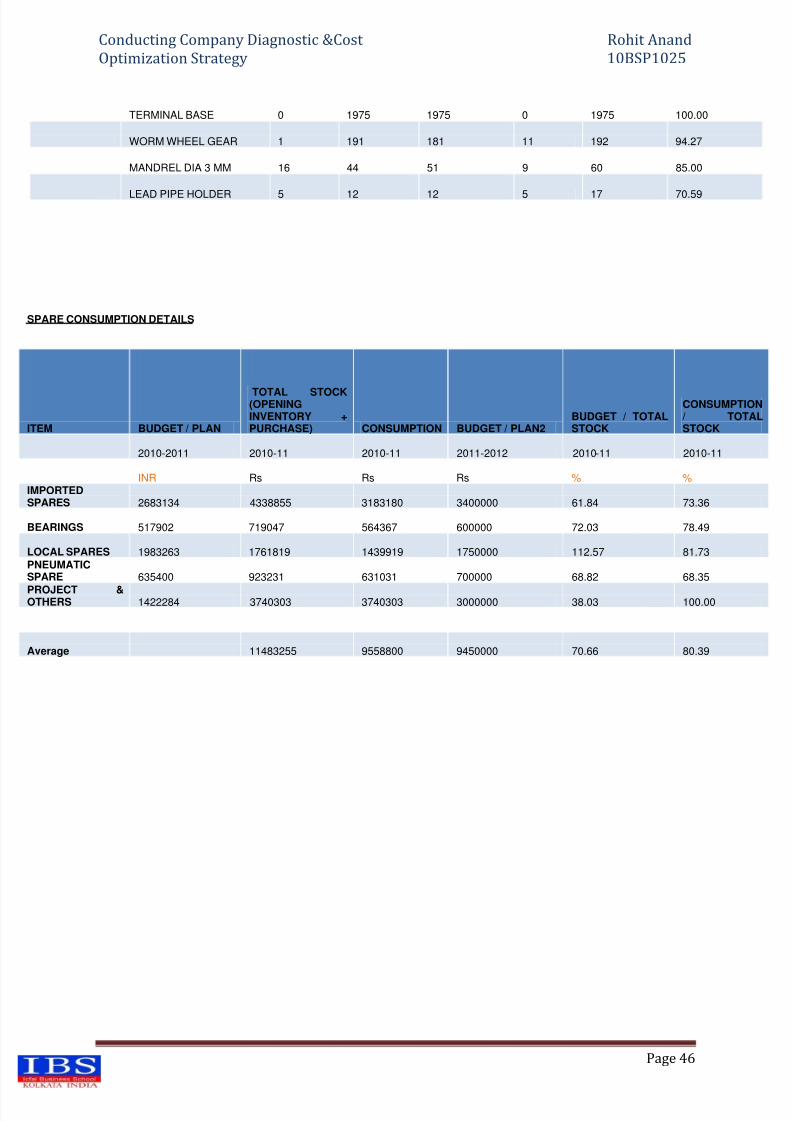
8/4/2019 Cost Optimization & Diagonstic
http://slidepdf.com/reader/full/cost-optimization-diagonstic 46/70
Conducting Company Diagnostic &Cost Rohit Anand
Optimization Strategy 10BSP1025
Page 46
TERMINAL BASE 0 1975 1975 0 1975 100.00
WORM WHEEL GEAR 1 191 181 11 192 94.27
MANDREL DIA 3 MM 16 44 51 9 60 85.00
LEAD PIPE HOLDER 5 12 12 5 17 70.59
SPARE CONSUMPTION DETAILS
ITEM BUDGET / PLAN
TOTAL STOCK(OPENINGINVENTORY +PURCHASE) CONSUMPTION BUDGET / PLAN2
BUDGET / TOTALSTOCK
CONSUMPTION/ TOTALSTOCK
2010-2011 2010-11 2010-11 2011-2012 2010-11 2010-11
INR Rs Rs Rs % %IMPORTEDSPARES 2683134 4338855 3183180 3400000 61.84 73.36
BEARINGS 517902 719047 564367 600000 72.03 78.49
LOCAL SPARES 1983263 1761819 1439919 1750000 112.57 81.73PNEUMATICSPARE 635400 923231 631031 700000 68.82 68.35
PROJECT &OTHERS 1422284 3740303 3740303 3000000 38.03 100.00
Average 11483255 9558800 9450000 70.66 80.39
8/4/2019 Cost Optimization & Diagonstic
http://slidepdf.com/reader/full/cost-optimization-diagonstic 47/70
Conducting Company Diagnostic &Cost Rohit Anand
Optimization Strategy 10BSP1025
Page 47
Supply Chain Management
The large and growing interest in Supply Chain Management is the result of two overlapping motivations:1) Managers are seeking models and business processes to support fact-based decision making in designing and operating their supply chains.
Fact-based decision making refers to the development, validation andapplication of data-driven models to analyze supply chain planning problems.Due to advances in IT, fact-based decision making has become possible andnecessary. It is possible because enterprise databases finally exist in many companies, although improvements in their flexibility and functionality are stillbeing sought. It is necessary because firms that fail to exploit their enterprisedatabases by creating and using models will find themselves at a seriouscompetitive disadvantage. New business processes are needed to fully explore and exploit insights provided by models.
2) Managers are seeking to integrate decisions across supply chain functions,across geographically dispersed facilities, and across time.
The essence of fact-based Supply Chain Management is integrated planning,
which has three important dimensions. The first dimension is functionalintegration involving decisions about purchasing, manufacturing anddistribution activities within the company and between the company and itssuppliers and customers. The second dimension is geographical integration of these functions across physical facilities located in one or several continents.The third dimension is inter-temporal integration of strategic, tactical andoperational supply chain decisions. Roughly speaking, strategic planning isconcerned with resource acquisition, tacticalplanning is concerned with resource allocation and refinement, and
operational planning is concerned with business execution.Models imbedded in easy-to-use modeling systems are critically needed tosupport integrated decision making. These systems employ descriptive modelsand optimization models.Descriptive models, such as those that forecast future demand or computedirect and indirect manufacturing costs are used to create supply chaindecision databases, which are the inputs to optimization models. Optimizationmodels allow managers to explore the space of decision options andconstraints to identify effective plans. Rigorous optimization models based onlinear and mixed integer programming are the only analytical tools capable of fully unravelling the complex interactions and ripple effects that make Supply
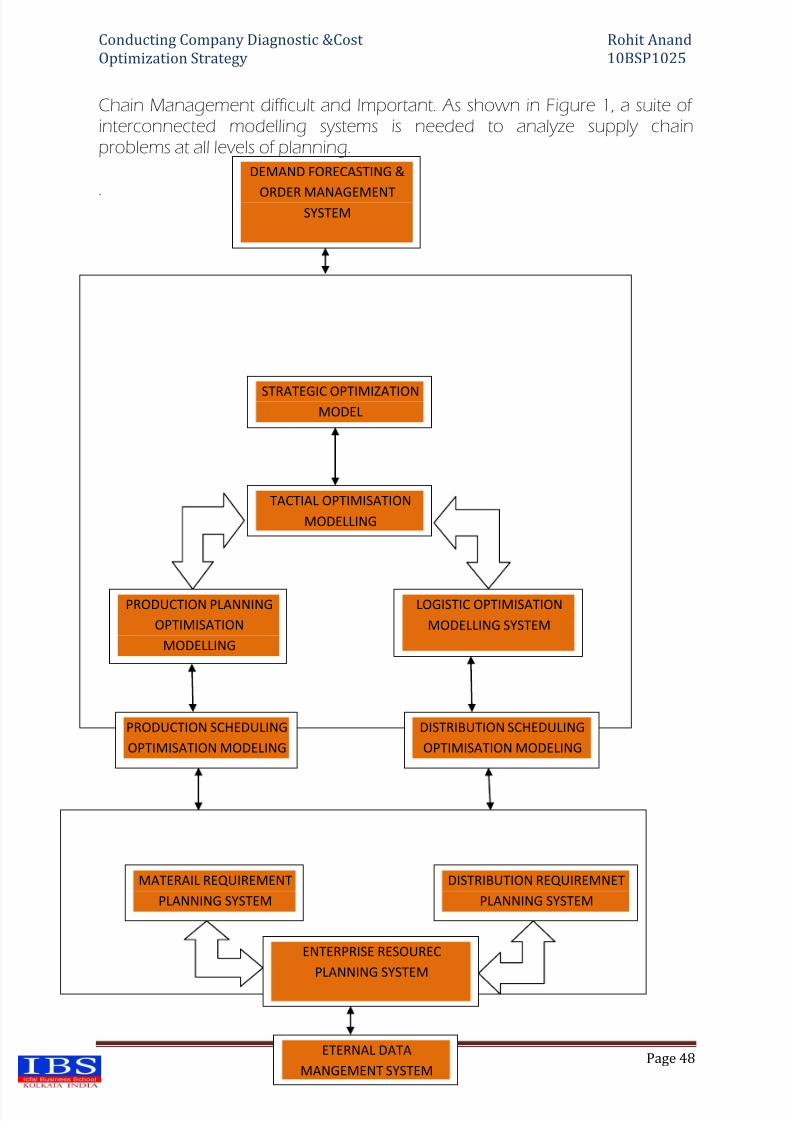
8/4/2019 Cost Optimization & Diagonstic
http://slidepdf.com/reader/full/cost-optimization-diagonstic 48/70
Conducting Company Diagnostic &Cost Rohit Anand
Optimization Strategy 10BSP1025
Page 48
Chain Management difficult and Important. As shown in Figure 1, a suite of interconnected modelling systems is needed to analyze supply chainproblems at all levels of planning.
.
DEMAND FORECASTING &
ORDER MANAGEMENTSYSTEM
STRATEGIC OPTIMIZATIONMODEL
TACTIAL OPTIMISATION
MODELLING
PRODUCTION PLANNING
OPTIMISATION
MODELLING
LOGISTIC OPTIMISATION
MODELLING SYSTEM
PRODUCTION SCHEDULING
OPTIMISATION MODELING
DISTRIBUTION SCHEDULING
OPTIMISATION MODELING
MATERAIL REQUIREMENT
PLANNING SYSTEM
DISTRIBUTION REQUIREMNET
PLANNING SYSTEM
ENTERPRISE RESOUREC
PLANNING SYSTEM
ETERNAL DATA
MANGEMENT SYSTEM
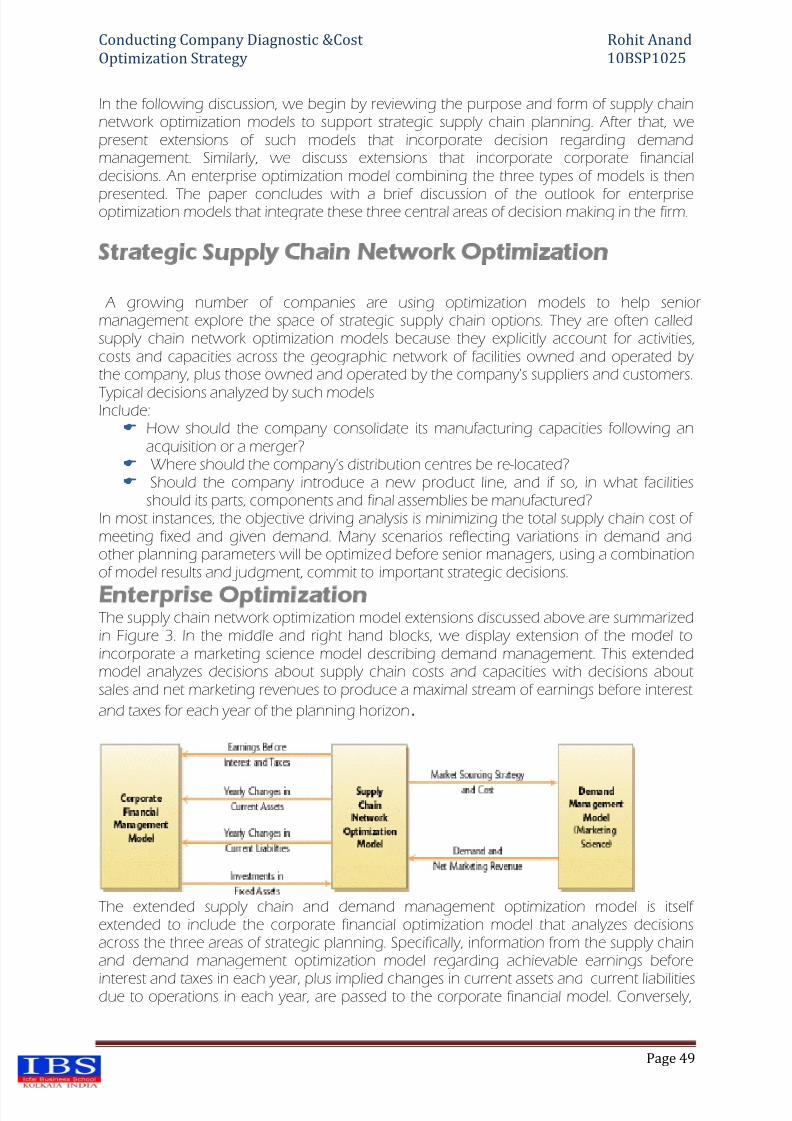
8/4/2019 Cost Optimization & Diagonstic
http://slidepdf.com/reader/full/cost-optimization-diagonstic 49/70
Conducting Company Diagnostic &Cost Rohit Anand
Optimization Strategy 10BSP1025
Page 49
In the following discussion, we begin by reviewing the purpose and form of supply chainnetwork optimization models to support strategic supply chain planning. After that, wepresent extensions of such models that incorporate decision regarding demandmanagement. Similarly, we discuss extensions that incorporate corporate financialdecisions. An enterprise optimization model combining the three types of models is then
presented. The paper concludes with a brief discussion of the outlook for enterpriseoptimization models that integrate these three central areas of decision making in the firm.
Strategic Supply Chain Network Optimization
A growing number of companies are using optimization models to help seniormanagement explore the space of strategic supply chain options. They are often calledsupply chain network optimization models because they explicitly account for activities,costs and capacities across the geographic network of facilities owned and operated by the company, plus those owned and operated by the company's suppliers and customers.
Typical decisions analyzed by such modelsInclude: How should the company consolidate its manufacturing capacities following an
acquisition or a merger? Where should the company's distribution centres be re-located? Should the company introduce a new product line, and if so, in what facilities
should its parts, components and final assemblies be manufactured?In most instances, the objective driving analysis is minimizing the total supply chain cost of meeting fixed and given demand. Many scenarios reflecting variations in demand andother planning parameters will be optimized before senior managers, using a combinationof model results and judgment, commit to important strategic decisions.
Enterprise OptimizationThe supply chain network optimization model extensions discussed above are summarizedin Figure 3. In the middle and right hand blocks, we display extension of the model toincorporate a marketing science model describing demand management. This extendedmodel analyzes decisions about supply chain costs and capacities with decisions aboutsales and net marketing revenues to produce a maximal stream of earnings before interest
and taxes for each year of the planning horizon.
The extended supply chain and demand management optimization model is itself extended to include the corporate financial optimization model that analyzes decisionsacross the three areas of strategic planning. Specifically, information from the supply chainand demand management optimization model regarding achievable earnings before
interest and taxes in each year, plus implied changes in current assets and current liabilitiesdue to operations in each year, are passed to the corporate financial model. Conversely,
8/4/2019 Cost Optimization & Diagonstic
http://slidepdf.com/reader/full/cost-optimization-diagonstic 50/70
Conducting Company Diagnostic &Cost Rohit Anand
Optimization Strategy 10BSP1025
Page 50
the financial model determines budgets for Investments in supply chain and other fixedassets over the planning horizon. This enterprise optimization model is driven by the goalof maximizing measures of the firm's economic performance, such as the present value of revenues or returns on assets generated for each year of the planning horizon. Methods of multi-objective optimization may be used to explore the efficient frontier of solutions to the
enterprise optimization model.
OBJECTIVES OF SUPPLY CHAIN MANAGEMENT The traditional objective of supply chain management is to minimize total supply chain cost to meet fixed and given demand. This total cost may be comprised of a numberof terms including raw material and other acquisition costs in-bound transportation costs facility investment costs direct and indirect manufacturing costs direct and indirect distribution center costs inventory holding costs inter-facility transportation costs out-bound transportation costs
In building a model for specific planning problems, we might decide to examine only aPortion of the company’s entire supply chain and associated costs.One can argue that total cost minimization is an inappropriate and timid objectiveFor the firm to pursue when it analyzes its strategic and tactical supply chain plans.Instead, the firm should seek to maximize net revenues whereNet revenues = gross revenues – total costIf demand is fixed and given, the implication is that gross revenues from meeting it are
also fixed and given, and therefore, that the firm will maximize net revenues by Minimizing total cost.Our objection to focusing only on cost control when using an optimization modelFor strategic or tactical planning is that the model provides insights into product costs thatshould be exploited to increase net revenues by suitable adjustments in sales. Forexample, when planning for next year, information provided by a model about themarginal costs of products delivered to various markets could be used to change theprojected sales plan. The company’s salesforce would be instructed to push products in markets with the highest margins, possibly at the expense of products in markets withlow margins if total manufacturing capacity is limited.The difficulty with trying to model decisions affecting demand management, even
in the modest way we just described, is that it requires the commitment of marketingpersonnel, who generally feel uneasy with quantitative analysis. Moreover, once wecommit to including marketing and sales decisions in a model, it is difficult to decide onthe scope that can or should be considered. Similarly, supply chain and demandmanagement decisions are closely linked to corporate financial decisions, especially whenplanning the firm’s strategy. Moreover, optimization models for exploring financialdecisions linked to the corporate balance sheet, such as yearly changes in fixed assets andequity or dividends paid, have been proposed by academics for over twenty-five years,although not yet widely applied. Since these models can be seamlessly integrated withsupply chain models, financial managers have recently become more interested inpursuing their implementation and use.
Of course, a company will also be concerned with non-monetary objectives, suchas customer service, product variety, quality, and time. Some authors even suggest that
8/4/2019 Cost Optimization & Diagonstic
http://slidepdf.com/reader/full/cost-optimization-diagonstic 51/70
Conducting Company Diagnostic &Cost Rohit Anand
Optimization Strategy 10BSP1025
Page 51
cost or revenues are relatively unimportant and that the company should focus insteadontime, product variety, or other attributes of their business to achieve competitiveadvantage. Such recommendations are misleading since the company exists to earnprofits. From an analytic perspective, it is not necessary to chose one objective overanother. Instead, optimization models can assist management in evaluating the tradeoffs
among objectives.
Conclusions
Relative to the current state of supply chain network optimization modeling, claims thatwidespread application of enterprise optimization models is just over the horizon may beunrealistic. Nevertheless, for the following reasons, we believe there is considerable merit in
contemplating such extensions.
1) Supply chain cost minimization is a timid and short-sighted approach to
strategic planning.
Although this point was made during our discussion of supply chain network optimizationmodels, it deserves further emphasis. Senior managers using models to analyze strategicsupply chain plans can and should incorporate demand and corporate financial decisionoptions, resources and constraints in their evaluations. Even if the extended fact-basedanalysis is informal, such as the specification of "what if" scenarios describing alternateborrowing limits on long-term debt, or alternate demand patterns and their net marketingrevenues, it can add significantly to the scope and meaning of the strategic decisions
identified by a model.
2) The growing success of fact-based decision making in Supply Chain
Management can and should be used to promote fact-based decision making in
other areas of strategic planning.
The commitment by an increasing number of supply chain managers to the application of modelling systems is already influencing open-minded marketing and corporate financialmanagers. A related development is the balanced scorecard methodology that has foundfavor in many companies. This methodology provides managers with a comprehensiverange of internal and external measures and metrics describing the company'sperformance. Specifically, the balanced scorecard links performance measures in four key areas: financial perspective, customer perspective (marketing), internal perspective (supply chain), and learning and growth (human resources). We believe the enterpriseoptimization models discussed here would add an important dimension to the balancedscorecard approach because the models would allow senior.
8/4/2019 Cost Optimization & Diagonstic
http://slidepdf.com/reader/full/cost-optimization-diagonstic 52/70
Conducting Company Diagnostic &Cost Rohit Anand
Optimization Strategy 10BSP1025
Page 52
3) Taken one at a time, the supply chain modelling extensions outlined above
are technically feasible and not difficult to implement, implying that models
customized to specific enterprise planning problems could be rapidly
developed and applied .
We applied a comprehensive, or deductive, approach in our discussions of new modellingmethodologies for enterprise optimization. In any business planning situation, however, itpays to follow a problem-solving or inductive approach. This means that the modellingsystem developers will use only those new concepts with significant relevance to theplanning problems at hand. Building on existing supply chain network optimizationmodels, model developers could, in many cases, readily add selected demand or corporatefinancial management variables and constraints to the model.
4) The major barriers to extended fact-based decision making in the firm are
organizational, not technical .
Organizational barriers include: Myopic managerial incentives that don't integratedplanning; lack of new business processes to support ongoing, fact-based decision makingat the strategic and tactical levels; poorly defined identities and career paths for analystswho use data and models to evaluate strategic and tactical planning problems; and,legacy thinking by managers that precludes the development and application of modellingsystems. Because supply chain decision making in many companies is performed afterimportant financial and demand management decisions have been made, there is reasonto hope that these organizational barriers will be more rapidly overcome when supply chain models are extended to other areas of strategic planning. In other words,recognition that strategic supply chain planning should be imbedded in larger enterpriseplanning exercises will serve to break down barriers to fact-based decision making in thefirm.
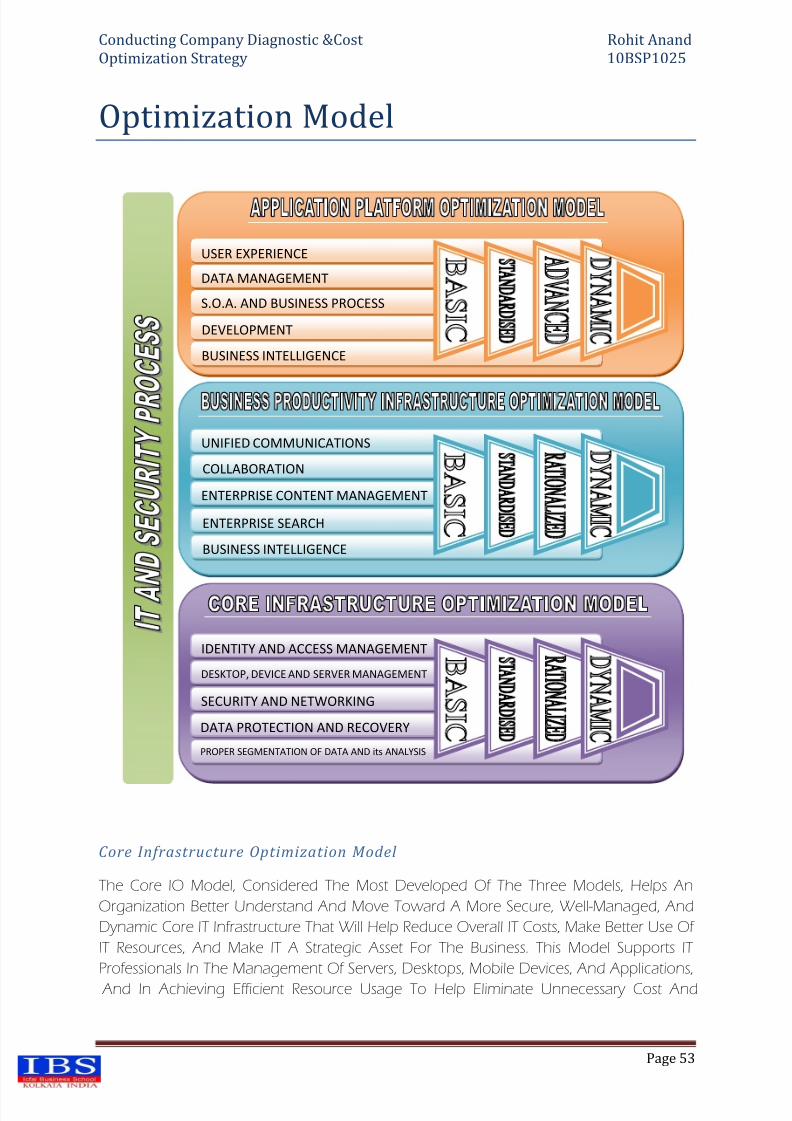
8/4/2019 Cost Optimization & Diagonstic
http://slidepdf.com/reader/full/cost-optimization-diagonstic 53/70
Conducting Company Diagnostic &Cost Rohit Anand
Optimization Strategy 10BSP1025
Page 53
Optimization Model
Core Infrastructure Optimization Model
The Core IO Model, Considered The Most Developed Of The Three Models, Helps An
Organization Better Understand And Move Toward A More Secure, Well-Managed, And
Dynamic Core IT Infrastructure That Will Help Reduce Overall IT Costs, Make Better Use Of
IT Resources, And Make IT A Strategic Asset For The Business. This Model Supports IT
Professionals In The Management Of Servers, Desktops, Mobile Devices, And Applications,
And In Achieving Efficient Resource Usage To Help Eliminate Unnecessary Cost And
USER EXPERIENCE
S.O.A. AND BUSINESS PROCESS
DATA MANAGEMENT
DATA PROTECTION AND RECOVERY
SECURITY AND NETWORKING
DESKTOP, DEVICE AND SERVER MANAGEMENT
IDENTITY AND ACCESS MANAGEMENT
BUSINESS INTELLIGENCE
ENTERPRISE SEARCH
ENTERPRISE CONTENT MANAGEMENT
COLLABORATION
UNIFIED COMMUNICATIONS
BUSINESS INTELLIGENCE
DEVELOPMENT
PROPER SEGMENTATION OF DATA AND its ANALYSIS
8/4/2019 Cost Optimization & Diagonstic
http://slidepdf.com/reader/full/cost-optimization-diagonstic 54/70
Conducting Company Diagnostic &Cost Rohit Anand
Optimization Strategy 10BSP1025
Page 54
Complexity, Ensure That The Business Is Always Up And Running, And Establish A
Responsive Infrastructure.
Core IO Model Capabilities
Identity & Access Management
This Capability Describes Ways An Organization Should Consider Managing
People And Asset Identities, Solutions That Should Be Implemented To Manage
And Protect Identity Data (Synchronization, Password Management, And User
Provisioning, To Mention Few), And How To Manage Access To Resources
From Corporate Mobile Users, Customers, And Partners Outside Of A Firewall.
Desktop, Device, And Server Management
This Capability Describes How Organizations Should Consider Managing Desktops, MobileDevices, And Servers As Well As How To Deploy Patches, Operating Systems, And
Applications Across The Network. It Also Provides Guidance On How To Leverage
Virtualization And Branch Office Technologies To Improve The IT Infrastructure.
Security and Networking
This Capability Describes What Organizations Should Consider Implementing In Their IT Infrastructure To Help Guarantee That Information And Communication Are Protected
From Unauthorized Access. This Capability Also Describes Mechanisms To Protect IT Infrastructure From Denial Attacks And Viruses While Preserving Access To CorporateResources.
Data Protection and Recovery
This Capability Provides Guidance On Structured Backup, Storage, And Restores
Management. As Information And Data Stores Proliferate, Organizations Are
Under Increasing Pressure To Protect That Information And Provide Cost-
Effective And Time-Efficient Recovery When Required. This Capability Provides
Guidance In This Area.
IT and Security Process
This Capability Provides Proven Best Practice Guidance On How To Cost-Effectively Design, Develop, Operate, And Support Solutions While Achieving High Reliability,
Availability, And Security. While Rock-Solid Technology Is Necessary To Meet Demands ForReliable, Available, And Highly Secure IT Services, Technology Alone Is Not Sufficient;
Excellence In Processes And People (Skills, Roles, And Responsibilities) Is Also Needed.
8/4/2019 Cost Optimization & Diagonstic
http://slidepdf.com/reader/full/cost-optimization-diagonstic 55/70
Conducting Company Diagnostic &Cost Rohit Anand
Optimization Strategy 10BSP1025
Page 55
Business Productivity IO Model
Capabilities
Unified Communications
Unified Communications Technologies Help Streamline Communications Between People And Organizations, Regardless Of Medium, Platform, Device Or Location. By EmpoweringEnd-Users With A Familiar Set Of Tools, Built On An Enterprise-Ready, Scalable And Easily-Managed Software-Powered Architecture, Unified Communications Breaks DownCommunication Silos And Extends Existing Communications Investments, While EnablingBusiness Process Innovation. This Capability Describes How Organizations Should ConsiderManaging And Securing Their Messaging Infrastructure To Protect Users From Viruses,SPAM, And Malware Coming From Other Users While Collaborating. As Structured And
Unstructured Data Converge With Other Types Of Communications Like Voice, Presence, And Conferencing, This Capability Provides A Framework On How IT Can Leverage TheirInfrastructure To Provide New (Or Improved) IT Services That Simplify How People WorkTogether
Collaboration
Collaboration Technologies Deliver Familiar, Pervasive, And Best-Of-Breed
Capabilities That Easily Integrate With Desktop Productivity Tools. By
Empowering End Users With A Familiar Set Of Tools, Built On A Scalable,
Security-Enhanced, And Easily Managed Platform, Collaboration Solutions FromMicrosoft Can Extend The Value Of Your Current IT Investments While Enabling
Business Process Innovation. This Capability Describes How To Use Work-
Spaces And Portals To Provide A Productive Collaboration Environment Where
IT Departments Can Define Processes And Standard Solutions That Can Be
Customized To Meet Specific Business Needs. This Capability Also Describes
How Infrastructure Can Be Extended To Provide Social Computing Capabilities,
Integration With Line-Of-Business Applications, And Federated Relationship
With Other Organizations.
Enterprise Content Management
Enterprise Content Management Technologies Deliver Well-Integrated Solutions toManage The End-To-End Life-Cycle Of A Wide Range Of Content And For StreamliningCollaborative Business Processes. This Capability Describes What Should Be ConsideredImplementing For Web Authoring, Forms, Documents, Web Content Management, AndRecord Management.
Enterprise Search
Enterprise Search Technologies Empower People To Find Information And Expertise
Anywhere In The Organization. By Optimizing The Enterprise Search Capability, IT Professionals Can Manage, Secure, Scale, And Extend Search As An Integrated Part Of A
8/4/2019 Cost Optimization & Diagonstic
http://slidepdf.com/reader/full/cost-optimization-diagonstic 56/70
Conducting Company Diagnostic &Cost Rohit Anand
Optimization Strategy 10BSP1025
Page 56
Broader Information Management Infrastructure. This Capability Describes How Organizations Should Consider Integrating Information With Standard Search CapabilitiesThat Take Into Consideration Different Formats, Data Sources, And Line-Of-Business
Applications From A Centralized And Standard Infrastructure.
Business Intelligence
Business Intelligence Technologies Provide Easy-To-Use Information Directly WhereIndividuals Work, Collaborate, And Make Decisions. This Capability Includes Reporting,
Analysis, And Performance Management Technologies That Can Improve Business InsightBy Allowing IT Department To Define Standard Reports, Methodologies, And Metrics ThatCan Be Exposed And Accessed By Users In A Rich User Interface And Based On Roles To
Assure That Information Is Available To People With The Right Set Of Permissions.
Content Creation
Rich, Open, Reusable Content Lies At The Heart Of Business Productivity - Gartner PredictsThat By 2013, More Than 25% Of Content That Workers See In A Day Will Be DominatedBy Pictures, Video Or Audio. The Cycle Of Content From Authoring Rich Content, Sharing
And Repurposing It Across The Enterprise Across Multiple Devices And Connecting It WithLine Of Business Information Is How Organizations Operate Today. Great CollaborationWithin The Enterprise Is Often On The Basis Of Great Content. Tagged, Relevant ContentLies At The Heart Of Your Content Management System.
Application Platform Optimization
Model Capabilities
User Experience
This Capability Defines How User Experience Should Be Included As Part Of Design AndDevelopment Of Applications To Improve Usability Of Applications While Providing ARicher Interface Regardless Of What Platform The Application Is Being Developed For(Web, Rich Client Applications, Smart Devices And More).
Business Intelligence
The Microsoft Vision For Business Intelligence (BI) Is To Help You Improve YourOrganization's Success By Providing Business Insights To All Employees Leading To Better,Faster, More Relevant Decisions. Key Investment Areas For BI Include PerformanceManagement, Collaboration, Visualization, Analysis And Reporting, Data Mining, DataIntegration, Data Warehousing, And Development.
Service-Oriented Architecture (SOA) and Business Process
Business Process Management (BPM) Technology Integrates Heterogeneous Systems(Enterprise Application Integration or EAI) Between Organizations And Trading Partners
And Manages Processes (Such As BPM) That Span People, Partners, And Software Services.

8/4/2019 Cost Optimization & Diagonstic
http://slidepdf.com/reader/full/cost-optimization-diagonstic 57/70
Conducting Company Diagnostic &Cost Rohit Anand
Optimization Strategy 10BSP1025
Page 57
Data Management
This Capability Describes Things That Should Be Considered When Implementing AnIntegrated Data Management And Analysis Solution That Can Enable Your OrganizationsTo Reliably Manage Mission-Critical Information And Confidently Run Today's Increasingly
Complex Business Applications.
Development
This Capability Addresses The Needs Of Information Technology Decision Makers AndDevelopers Working Alone Or In Teams To Deliver High Quality, Secure Applications That
Connect Business Processes.
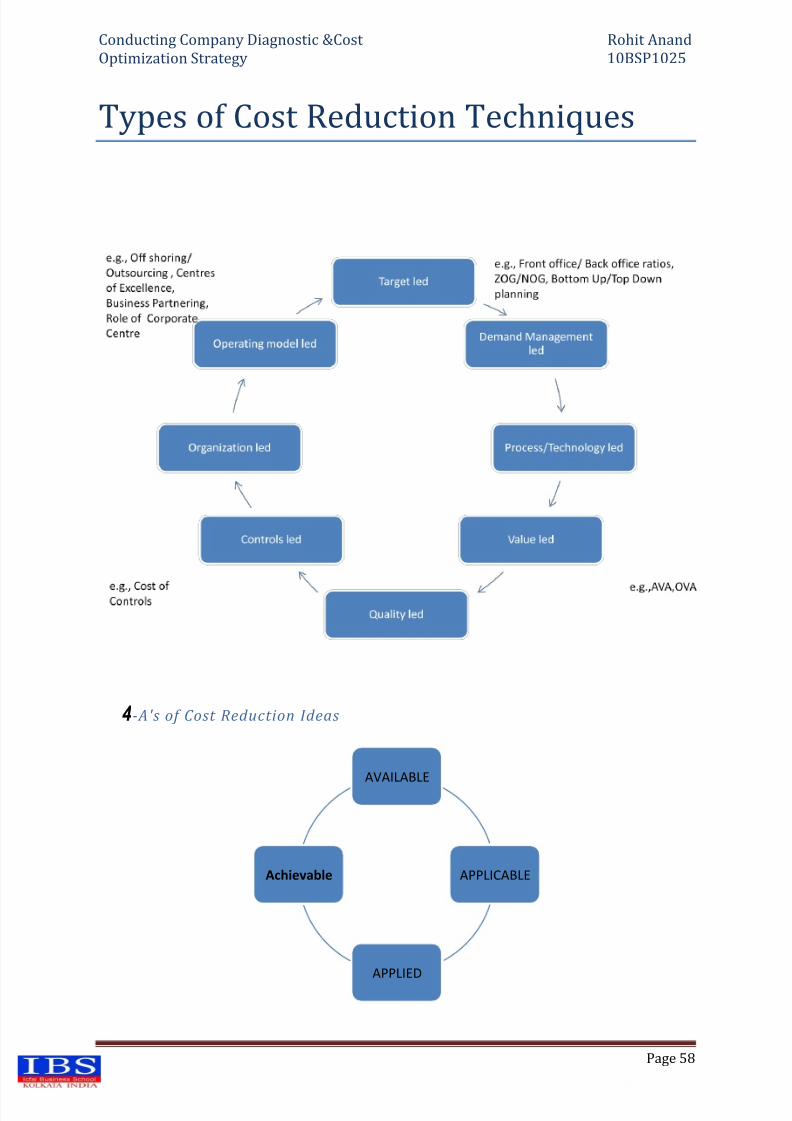
8/4/2019 Cost Optimization & Diagonstic
http://slidepdf.com/reader/full/cost-optimization-diagonstic 58/70
Conducting Company Diagnostic &Cost Rohit Anand
Optimization Strategy 10BSP1025
Page 58
Types of Cost Reduction Techniques
4-A's of Cost Reduction Ideas
AVAILABLE
APPLICABLE
APPLIED
Achievable
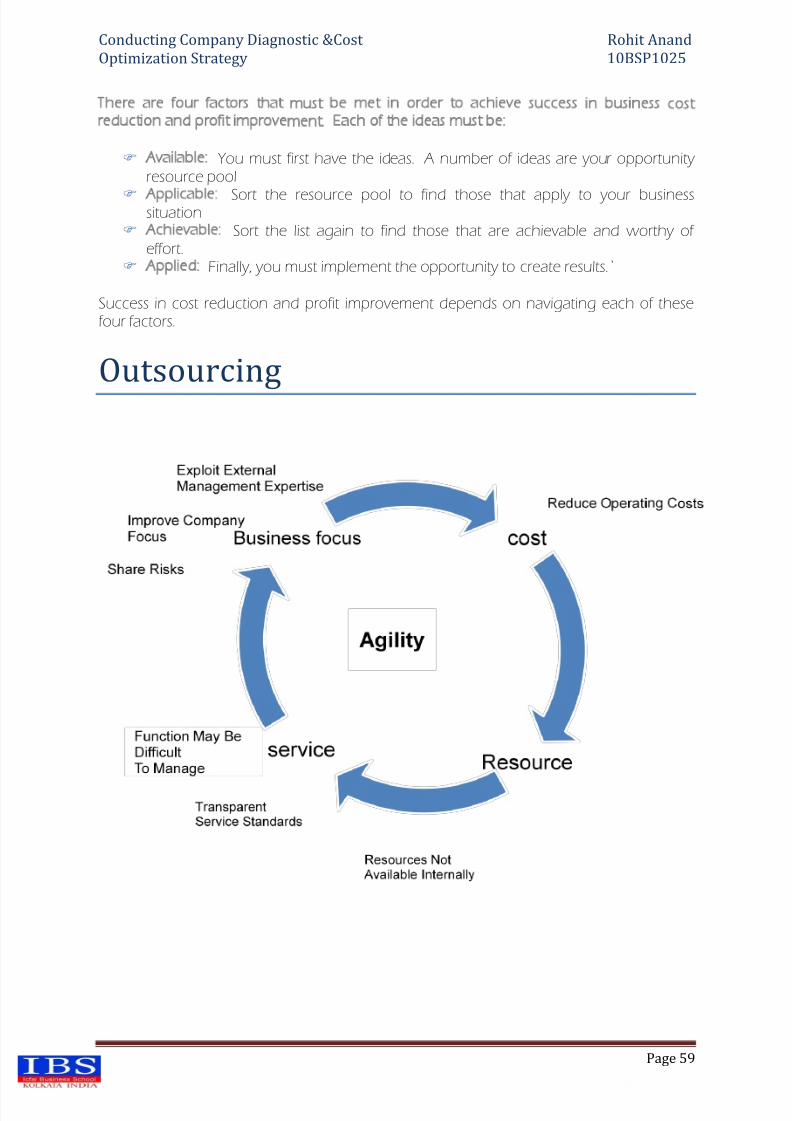
8/4/2019 Cost Optimization & Diagonstic
http://slidepdf.com/reader/full/cost-optimization-diagonstic 59/70
Conducting Company Diagnostic &Cost Rohit Anand
Optimization Strategy 10BSP1025
Page 59
There are four factors that must be met in order to achieve success in business costreduction and profit improvement. Each of the ideas must be:
Available: You must first have the ideas. A number of ideas are your opportunity resource pool
Applicable: Sort the resource pool to find those that apply to your businesssituation
Achievable: Sort the list again to find those that are achievable and worthy of effort.
Applied: Finally, you must implement the opportunity to create results.`
Success in cost reduction and profit improvement depends on navigating each of thesefour factors.
Outsourcing
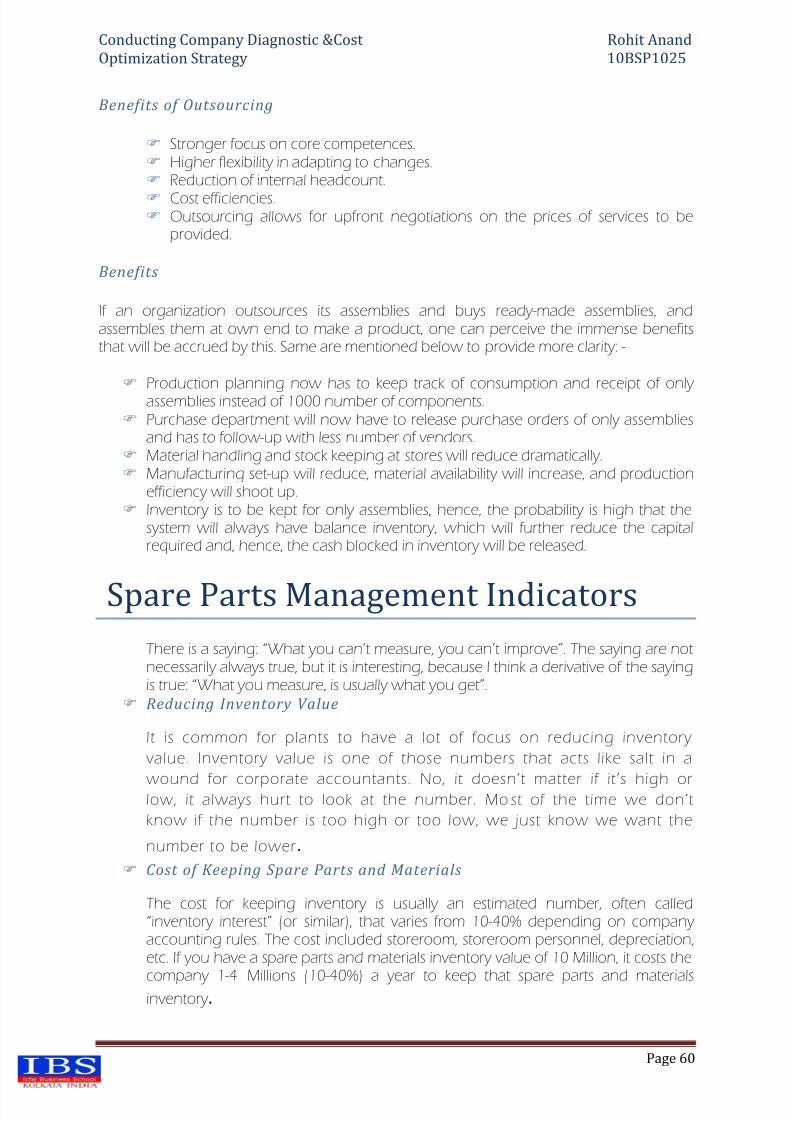
8/4/2019 Cost Optimization & Diagonstic
http://slidepdf.com/reader/full/cost-optimization-diagonstic 60/70
Conducting Company Diagnostic &Cost Rohit Anand
Optimization Strategy 10BSP1025
Page 60
Benefits of Outsourcing
Stronger focus on core competences. Higher flexibility in adapting to changes. Reduction of internal headcount.
Cost efficiencies. Outsourcing allows for upfront negotiations on the prices of services to be
provided.
Benefits
If an organization outsources its assemblies and buys ready-made assemblies, andassembles them at own end to make a product, one can perceive the immense benefitsthat will be accrued by this. Same are mentioned below to provide more clarity: -
Production planning now has to keep track of consumption and receipt of only assemblies instead of 1000 number of components.
Purchase department will now have to release purchase orders of only assembliesand has to follow-up with less number of vendors.
Material handling and stock keeping at stores will reduce dramatically. Manufacturing set-up will reduce, material availability will increase, and production
efficiency will shoot up. Inventory is to be kept for only assemblies, hence, the probability is high that the
system will always have balance inventory, which will further reduce the capitalrequired and, hence, the cash blocked in inventory will be released.
Spare Parts Management Indicators
There is a saying: ―What you can’t measure, you can’t improve‖. The saying are notnecessarily always true, but it is interesting, because I think a derivative of the sayingis true: ―What you measure, is usually what you get‖.
Reducing Inventory Value
It is common for plants to have a lot of focus on reducing inventory
value. Inventory value is one of those numbers that acts like salt in a
wound for corporate accountants. No, it doesn’t matter if it’s high orlow, it always hurt to look at the number. Mo st of the time we don’t
know if the number is too high or too low, we just know we want the
number to be lower.
Cost of Keeping Spare Parts and Materials
The cost for keeping inventory is usually an estimated number, often called―inventory interest‖ (or similar), that varies from 10-40% depending on company accounting rules. The cost included storeroom, storeroom personnel, depreciation,etc. If you have a spare parts and materials inventory value of 10 Million, it costs the
company 1-4 Millions (10-40%) a year to keep that spare parts and materialsinventory .
8/4/2019 Cost Optimization & Diagonstic
http://slidepdf.com/reader/full/cost-optimization-diagonstic 61/70
Conducting Company Diagnostic &Cost Rohit Anand
Optimization Strategy 10BSP1025
Page 61
The Problem
Since it is common that inventory value is the only number the plant really caresabout, it tends to get reduced. But, anyone can reduce inventory value very easily,IF it’s the only thing that matters. I can tell you to scrap all spare parts right now
bringing your spare parts and materials inventory to zero. But the consequenceswill be devastating to production since we don’t have any spare parts.
Measure a “Counterweight ”
Spare parts inventory value is important, but to effectively reduce spare partsinventory value, the ―counterweight‖ has to be measured as well. Thecounterweight to inventory value can be ―stock -outs‖ for example (times we get thespare part needed divided by total request for spare parts). When stock outs goover around 4-5%, you will start seeing signs of people not trusting the store room.These signs are spare parts in supervisor’s office, satellite stores, spare parts in crafts
people’s toolboxes etc.
Other Indicators
Other indicators that may be valuable for store room control are: · IRA – Inventory Record Accuracy · Turnover rate by Part · Number of Returned Parts to Stores ·
Service Level (inverse of stock out) · Critical Spares stock out.
Manufacturing Firms Now Turn To
Product Cost ReductionsIn recent years, manufacturing revenues have grown at the highest rates since the 1950s,as most firms in this sector have focused on increasing earnings by managing top-linegrowth. Reduction of product cost (cost of goods sold) and cost reduction in general tooka back seat.
Oliver Wyman recently conducted a comprehensive study on past and future cost-reduction practices of leading European manufacturers such as Siemens, ThyssenKrupp,Linde, Krones, Tognum, and Deutz. The study found that only 43% of the manufacturers’
total product cost was addressed through specific cost-reduction initiatives over the pastthree years. From a bottomline perspective, the average impact of these efforts waslimited —a 1.3% annual savings of the total cost base —while best-in-class companies wereable to achieve rates of 5% to 7% per year. by Henning Thormaehlen and Tobias SitteStrategic Cost Management Manufacturing Firms Now Turn to Product Cost Reductions Inthe current economic slowdown, the ability to raise prices is becoming more limited, andthe efficiencies of high volume are diminishing. Therefore, product cost reduction isbecoming a more important method to increase profitability. Oliver Wyman’s study revealed a significant opportunity to close the expected earnings gap caused by lowergrowth rates.
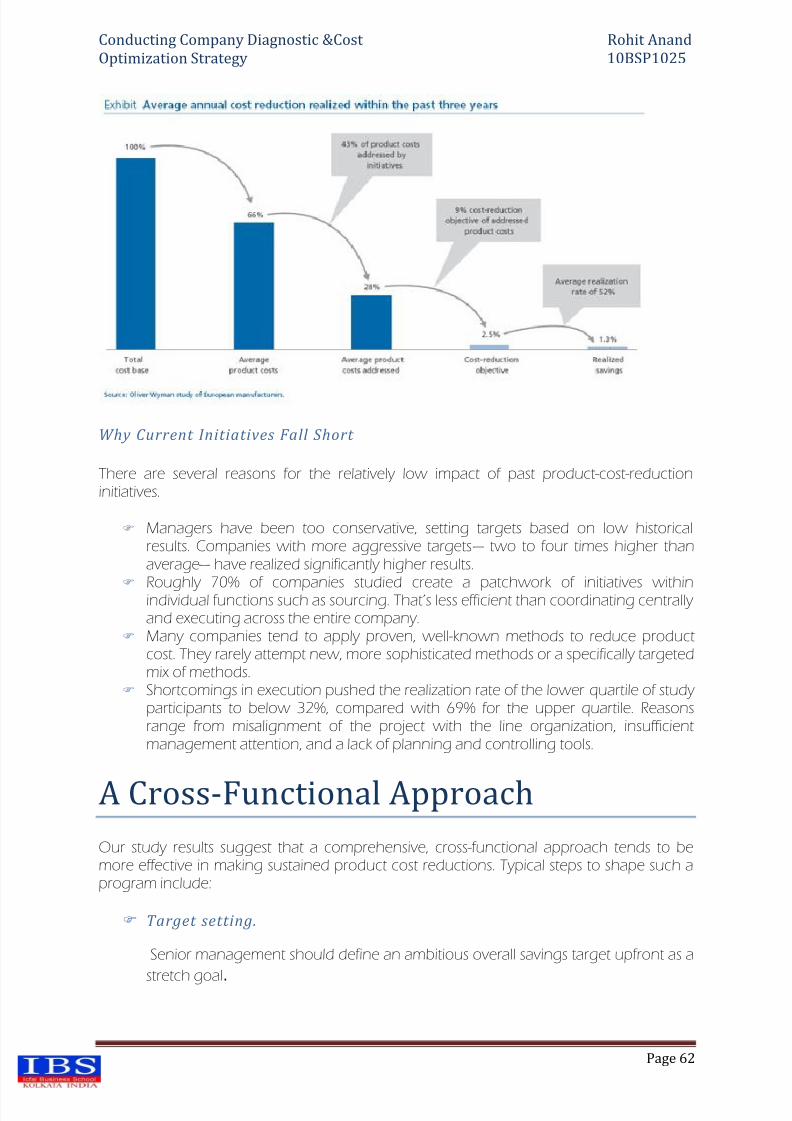
8/4/2019 Cost Optimization & Diagonstic
http://slidepdf.com/reader/full/cost-optimization-diagonstic 62/70
Conducting Company Diagnostic &Cost Rohit Anand
Optimization Strategy 10BSP1025
Page 62
Why Current Initiatives Fall Short
There are several reasons for the relatively low impact of past product-cost-reductioninitiatives.
Managers have been too conservative, setting targets based on low historicalresults. Companies with more aggressive targets — two to four times higher thanaverage — have realized significantly higher results.
Roughly 70% of companies studied create a patchwork of initiatives withinindividual functions such as sourcing. That’s less efficient than coordinating centrally and executing across the entire company.
Many companies tend to apply proven, well-known methods to reduce productcost. They rarely attempt new, more sophisticated methods or a specifically targetedmix of methods.
Shortcomings in execution pushed the realization rate of the lower quartile of study participants to below 32%, compared with 69% for the upper quartile. Reasonsrange from misalignment of the project with the line organization, insufficientmanagement attention, and a lack of planning and controlling tools.
A Cross-Functional Approach
Our study results suggest that a comprehensive, cross-functional approach tends to bemore effective in making sustained product cost reductions. Typical steps to shape such aprogram include:
Target setting.
Senior management should define an ambitious overall savings target upfront as a
stretch goal.
8/4/2019 Cost Optimization & Diagonstic
http://slidepdf.com/reader/full/cost-optimization-diagonstic 63/70
Conducting Company Diagnostic &Cost Rohit Anand
Optimization Strategy 10BSP1025
Page 63
Selecting relevant levers.
Depending on the individual situation and the proposed timeline, it may beappropriate to focus on strategic levers (e.g., product portfolio, modularization) or
operational levers (product design, sourcing, and manufacturing optimization). Choosing the most effective methods .
Assess and prioritize the different methods available, and select the best-fitting
methods with the right mix of levers, involved functions, and timeline. Scoping across functions.
Examine which functions and cross-functional teams should be involved. A cross-functional approach aims to build on synergies and improve communication so
that functions are not working at cross-purposes. Efficient execution.
One need skilled and trained project teams, senior management focus on theinitiatives, tailored controlling tools, and the proper incentives. One promising trendrevealed by our survey is that 80% of participants plan to use dedicated projectteams rather than just functional teams, compared to historical levels of 55%.
The right set of initiatives, executed through the right approach, can improve results fromstandard product cost reductions roughly five-fold. One firm we worked with using thisapproach is a machine tool builder that had identified product and process complexity as amajor cost centre and a limitation on growth. A cross-functional team redesigned key products and processes to make the firm more modular, and even created a ―module
manager‖ position alongside the product manager. The firm realized savings of 8% to 13%per machine line.
Cost optimization-a strategic initiative
to beat slow down
The global financial crisis, which started with sub-prime mortgages in the U.S. in late 2007,
has spread like a ripple effect across all businesses leading to a severe liquidity crunch. Theseverity of this can be seen in GDP numbers that has dropped from 9 per cent to about 7per cent in 2008-09 and the estimates for 2009-10 are at about 5 per cent. During theboom period several businesses pushed for high revenue growth with consequentialincrease in costs. As burn rates soared and the market plummeted, businesses becameconscious about their failed thoughts and strategies. It is time we contend with a slow down that may last longer than what was perceived in the early days of its impact.
Why cost reduction programs fail?
8/4/2019 Cost Optimization & Diagonstic
http://slidepdf.com/reader/full/cost-optimization-diagonstic 64/70
Conducting Company Diagnostic &Cost Rohit Anand
Optimization Strategy 10BSP1025
Page 64
Programs to reduce costs are the most difficult form of organizational change to maintain.It disrupts daily work rhythms by dampening morale, particularly when head counts arecut. The heart of any business's strategy is efficiency and cost optimization particularly when economic conditions are adverse. It is tough to ignore cost management issuesduring times of economic instability for trimming the fat. Many businesses are seized of the
growing cost base and their tactical response to squeeze their vendors. This is regarded asa simple measure, delivering a short-term remedy. It is such remedies that fail to make alasting impact on cost optimization. Thus businesses not only require change in behaviorbut also in their mindset or thinking to gear up for high performance that is measured by efficiency, and simplification of the business model.
Push cost optimization as a movement
Cost optimization should be a priority for all businesses regardless of the economic cycle.The higher a firm's costs are above those of close rivals, the more competitively vulnerableit becomes! A firm's competitiveness depends on how well it manages its value chain
relative to competitors. Costs of performing each value chain activity can be driven up ordown by two types of factors-
a) Structural cost drivers such as scale, experience curve, technology and capital intensity and b) executional cost drivers such as continuous improvement, quality, cycle time, capacity utilization, effectiveness of business processes, vendor/customer relationships It is thusadvisable that every business take a holistic look at their organizations to ensure that any changes have a broader perspective to tackle cost optimization from a strategic, enterprise-wide perspective and ensure its sustainability to achieve transformation withoutexperiencing a crisis.
Common problems for tackling this issue
Typically cost reduction programs deliver short-term tactical gains and do not deliver long-term sustainable improvements. The misplaced belief that genuine cost optimizationrequires too much investment is difficult to justify when revenues are slowing down. Thedegree of complexity in a business can be addressed by simplifying and streamlining theprocesses by empowering the team to perform. Mistakes and surprises are inevitable in any cost optimization process that is by nature transformatory. By streamlining financial andregulatory processes, costs can be reduced and time freed up for the management to play a more strategic role. In finding solutions, there may be the need to combine cost cuttingwith a focus on process optimization, anticipating the unexpected, streamlining the supply chain while investing in value-added technologies. The risk of failure can be disastrous,since a business whose cost optimization fails before it is complete rarely tries again.
No Quick Fixes
One of the first things to change is the mind-set of the organization. Cost optimization isnot a temporary weight-loss program on a crash diet- to maintain an ideal weight, there isa need to adopt a healthy lifestyle and diet over the long term. Likewise, businesses thattake the time to examine their cost structure and embed cost discipline within their
organization's culture will see gains that can be sustained over the long term. Ultimately,this means rethinking the entire business model around lower costs, possibly taking out
8/4/2019 Cost Optimization & Diagonstic
http://slidepdf.com/reader/full/cost-optimization-diagonstic 65/70
Conducting Company Diagnostic &Cost Rohit Anand
Optimization Strategy 10BSP1025
Page 65
whole layers of the organization or supply chain, examining customer interfaces, andconsidering outsourcing and shared services. The focus should be on creating a leaner,more efficient organization, with cost reduction as the consequence, not necessarily thetarget. Generating reliable cost data is crucial in order to make strategic decisions andmeasure improvements. Businesses must refrain from the temptation to go for the quick fix
due to insurmountable pressure from the investors as businesses that remain focused onthe big picture will see lasting results.
Discrete levels for cost optimization
In any cost framework there are two discrete levels to optimize business costs-the first levelis in reduction of procurement cost and the second level is on reduction of operating costsby focusing on innovation and business restructurings. Each level of this frameworkexplores cost optimization issues by technology, supporting facts /quantifications andestimates of savings and risk to track cost optimization programs as well as communicatingthe impact of cost optimization to the business. Mapping out cost optimization efforts to
the framework can help to determine whether an organization's overall initiative is out of balance (e.g., all cuts from cost savings in one cost element) or whether an organizationhas mixed costs with an appropriate amount of optimization techniques (such asinnovation/business restructuring) that can prepare an organization for a return togrowth. It is important for organizations to differentiate between cost optimization andcost-cutting. Arbitrary cost-cutting often delays optimization, because investments thatwould normally yield better results in the long-term are delayed.
Shape capabilities to strategy
Cost-cutting measures that hinder a company's growth objectives will possibly be reversedand those that add value to the operating units by sharpening its strategic focus are likely to be retained. Thus companies must examine the "what" (the value created by eachorganizational unit) before analyzing the "how" (the way the organization seeks to deliverthat value). There is no magic formula for determining waste without a detailed scrutiny on activities to keep and the ones to cut. Even companies in the same industry can havesharply different cost profiles if their strategies are distinct. In some cases, capability reviewscan highlight opportunities to reshape the business radically to sustain itself, survive, andgrow by focusing their attention on the positive aspects of change. To minimize thediscomfort associated with any cost initiative, all stakeholders must understand what's in itfor them. Without some visualization of the way the underlying goals are linked to overall
corporate strategy, a cost program can deteriorate into a "race for the numbers" and, in theprocess, lose the support of key stakeholders.
Push cost optimization as a movement
Cost optimization should be a priority for all businesses regardless of the economic cycle.The higher a firm's costs are above those of close rivals, the more competitively vulnerableit becomes! A firm's competitiveness depends on how well it manages its value chainrelative to competitors. Costs of performing each value chain activity can be driven up ordown by two types of factors-
a) structural cost drivers such as scale, experience curve, technology and capital intensity and
8/4/2019 Cost Optimization & Diagonstic
http://slidepdf.com/reader/full/cost-optimization-diagonstic 66/70
Conducting Company Diagnostic &Cost Rohit Anand
Optimization Strategy 10BSP1025
Page 66
b) executional cost drivers such as continuous improvement, quality, cycle time, capacity utilization, effectiveness of business processes, vendor/customer relationships It is thusadvisable that every business take a holistic look at their organizations to ensure that any
changes have a broader perspective to tackle cost optimization from a strategic, enterprise-wide perspective and ensure its sustainability to achieve transformation withoutexperiencing a crisis.
Common problems for tackling this issue
Typically cost reduction programs deliver short-term tactical gains and do not deliver long-term sustainable improvements. The misplaced belief that genuine cost optimizationrequires too much investment is difficult to justify when revenues are slowing down. Thedegree of complexity in a business can be addressed by simplifying and streamlining theprocesses by empowering the team to perform. Mistakes and surprises are inevitable in any
cost optimization process that is by nature transformatory. By streamlining financial andregulatory processes, costs can be reduced and time freed up for the management to play a more strategic role. In finding solutions, there may be the need to combine cost cuttingwith a focus on process optimization, anticipating the unexpected, streamlining the supply chain while investing in value-added technologies. The risk of failure can be disastrous,since a business whose cost optimization fails before it is complete rarely tries again.
No Quick Fixes
One of the first things to change is the mind-set of the organization. Cost optimization is
not a temporary weight-loss program on a crash diet- to maintain an ideal weight, there isa need to adopt a healthy lifestyle and diet over the long term. Likewise, businesses thattake the time to examine their cost structure and embed cost discipline within theirorganization's culture will see gains that can be sustained over the long term. Ultimately,this means rethinking the entire business model around lower costs, possibly taking outwhole layers of the organization or supply chain, examining customer interfaces, andconsidering outsourcing and shared services. The focus should be on creating a leaner,more efficient organization, with cost reduction as the consequence, not necessarily thetarget. Generating reliable cost data is crucial in order to make strategic decisions andmeasure improvements. Businesses must refrain from the temptation to go for the quick fixdue to insurmountable pressure from the investors as businesses that remain focused on
the big picture will see lasting results.
Discrete levels for cost optimization
In any cost framework there are two discrete levels to optimize business costs-the first levelis in reduction of procurement cost and the second level is on reduction of operating costsby focusing on innovation and business restructurings. Each level of this frameworkexplores cost optimization issues by technology, supporting facts /quantifications andestimates of savings and risk to track cost optimization programs as well as communicatingthe impact of cost optimization to the business. Mapping out cost optimization efforts tothe framework can help to determine whether an organization's overall initiative is out of
balance (e.g., all cuts from cost savings in one cost element) or whether an organizationhas mixed costs with an appropriate amount of optimization techniques (such as
8/4/2019 Cost Optimization & Diagonstic
http://slidepdf.com/reader/full/cost-optimization-diagonstic 67/70
Conducting Company Diagnostic &Cost Rohit Anand
Optimization Strategy 10BSP1025
Page 67
innovation/business restructuring) that can prepare an organization for a return togrowth. It is important for organizations to differentiate between cost optimization andcost-cutting. Arbitrary cost-cutting often delays optimization, because investments thatwould normally yield better results in the long-term are delayed.
Shape capabilities to strategy
Cost-cutting measures that hinder a company's growth objectives will possibly be reversedand those that add value to the operating units by sharpening its strategic focus are likely to be retained. Thus companies must examine the "what" (the value created by eachorganizational unit) before analyzing the "how" (the way the organization seeks to deliverthat value). There is no magic formula for determining waste without a detailed scrutiny on activities to keep and the ones to cut. Even companies in the same industry can havesharply different cost profiles if their strategies are distinct. In some cases, capability reviewscan highlight opportunities to reshape the business radically to sustain itself, survive, andgrow by focusing their attention on the positive aspects of change. To minimize the
discomfort associated with any cost initiative, all stakeholders must understand what's in itfor them. Without some visualization of the way the underlying goals are linked to overallcorporate strategy, a cost program can deteriorate into a "race for the numbers" and, in theprocess, lose the support of key stakeholders.
Solutions to tackle problem
Most common pitfalls in cost optimization revolve around cautious approach with lack of clarity/insight on the cost drivers. . While budget and headcount reductions provide short-term cost savings, reducing complexity and improving process efficiency can yieldsignificant and lasting benefits, but only if they are conducted rigorously. Some of the
solutions to tackle this problem are: 1. Optimize cost structure by embedding a culture of cost management throughout thebusiness for eliminating waste. 2. Focus on costs to create sustainable change and adopt bold strategies to retain cost-efficiency. 3. Rethink the business model to deploy a coherent vision, manage talent, acceleratedesign and innovation and execute change rapidly by balancing the supply chain
properly .
Summary
Cost reduction must focus on its sustainability and alignment with the business' overallstrategic objectives. One of the ways to mitigate the consequences of a slowdown is toarrest the reduction in available funds by changing existing operating budgets. Historically,hefty cash balances have tended to be a myth that can lead to managerial slackness- weare back to the age-old dictum that Cash is King. Effective strategy is all about stretchinglimited resources to fit ambitious aspirations. If a business is unable to optimize its cost baseit may need to think more radically for unlocking value by changing the way the businessoperates. This will require a radical change in the mindset by moving from rationalizationto seeking optimization.
8/4/2019 Cost Optimization & Diagonstic
http://slidepdf.com/reader/full/cost-optimization-diagonstic 68/70
Conducting Company Diagnostic &Cost Rohit Anand
Optimization Strategy 10BSP1025
Page 68
CONCLUSION
Manufacturing cost reduction through design optimization involves several steps to begin
with. As you would expect, each step poses unique challenges to be met. Outsourcingpart of the manufacturing work is one option that is often considered. Some more
complex product parts are often difficult to manufacture, particularly if it means buying
new equipment just to make one specific part. This by no means a new business practice,
but when trying to make a manufacturing cost reduction through design optimization,
one must consider the calibre of the output by an outsourcing company.
If you are certain you can trust the company and they can meet the schedule, then it is
most likely is a good idea. Nonetheless, a clear quality assurance program, co-ordination of
production and the resolution of any shipping issues should be the first steps in such a
relationship and handled throughout any job; long-term or short-term. Over-production by
the other company could lead to storage and material handling problems.
If this should occur while production is underway it could lead to your manufacturing
schedule being thrown into chaos. These types of relationship involve a deep trust, and
sometimes a few penalties for missing deadlines. Designing for manufacturing (or DFM) is
also a strategy that is frequently used to reach a manufacturing cost reduction through
design optimization. Rather than design a product and set up the machines and
production processes to best fit the design, designing for manufacturing works the other
way around. When incorporating the DFM strategy, the manufacturer will take intoaccount their current machine capabilities and design the product around what they are
already capable of doing. This will improve productivity and increase the profit margin by
reducing costs that would most likely be spent on new machinery. The results of DFM are
improved efficiency, an increased from design to market time and savings on research and
development.
Vendors can also play a big role in bringing about manufacturing cost reduction through
design optimization. With innovative new material production and shipping techniques
forever being a source of overhead, a good vender will have suggestions on all possible
cost cutters. While the manufacturer understands their production process better than
most vendors, the vendor will surely have a better grasp on materials than many
manufacturers. Even if they is unable to offer any immediate suggestions straight away,
they may be able to at some point in the future.
Understanding the needs of each and every department is another good way to cut costs
and optimize both productivity and quality. Nobody understands the needs of a
department better than the that work there every single day. Taking their suggestions on
how to cut costs can be a smart idea. Many companies now provide a bonus to staff
members that can answer the million-dollar question; how do we cut costs and increaseefficiency?

8/4/2019 Cost Optimization & Diagonstic
http://slidepdf.com/reader/full/cost-optimization-diagonstic 69/70
Conducting Company Diagnostic &Cost Rohit Anand
Optimization Strategy 10BSP1025
Page 69
The idea of manufacturing cost reduction through design optimization is to make money
and reduce the overhead. Keeping the manufacturing process simple, reducing the costs
of material and increasing the efficiency of the manufacturing process are the best ways to
do this. Manufacturing cost reduction through design optimization can benefit almost any
business. However, it is only justifiable if it does not reduce the quality of the product. A
decrease in production quality often turns out to be more expensive than the original
material was.

8/4/2019 Cost Optimization & Diagonstic
http://slidepdf.com/reader/full/cost-optimization-diagonstic 70/70
Conducting Company Diagnostic &Cost Rohit Anand
Optimization Strategy 10BSP1025
References
Website: www.emeraldinsight.com/researchregister.
www.finteq.com www.google.com
www.authorstream.com
www.shumaonline.com
www.gartner.com
www.squidoo.com/tags/cost+optimization
Finteq data base
Book: Efficient scheduling & Cost Optimisation by: Ehab Kamarah
Book: Plant Optimisation by: Dan Wiegandt.
Book: Cost Reduction through Design Optimisation by: Marc Anderes.