Embed Size (px)
Citation preview
Cost of residential housing development: A focus on building materialsFletcher Building Limited
December 2018
© 2018 Deloitte Touche Tohmatsu 1
Contents
Executive Summary 3
1. Introduction 14
2. Setting the scene 16
3. Contribution of key components to residential housing development costs – Four typologies and five cities 29
4. Cost differences between New Zealand and Australia 59
5. Building materials breakdown 70
6. Factors influencing building material prices- A focus on five key building materials 79
7. Regulation 108
8. Fletcher Building’s potential impact on residential development cost 111
9. Appendix: Detailed analysis on the cost components of residential housing development 114
10. References 121
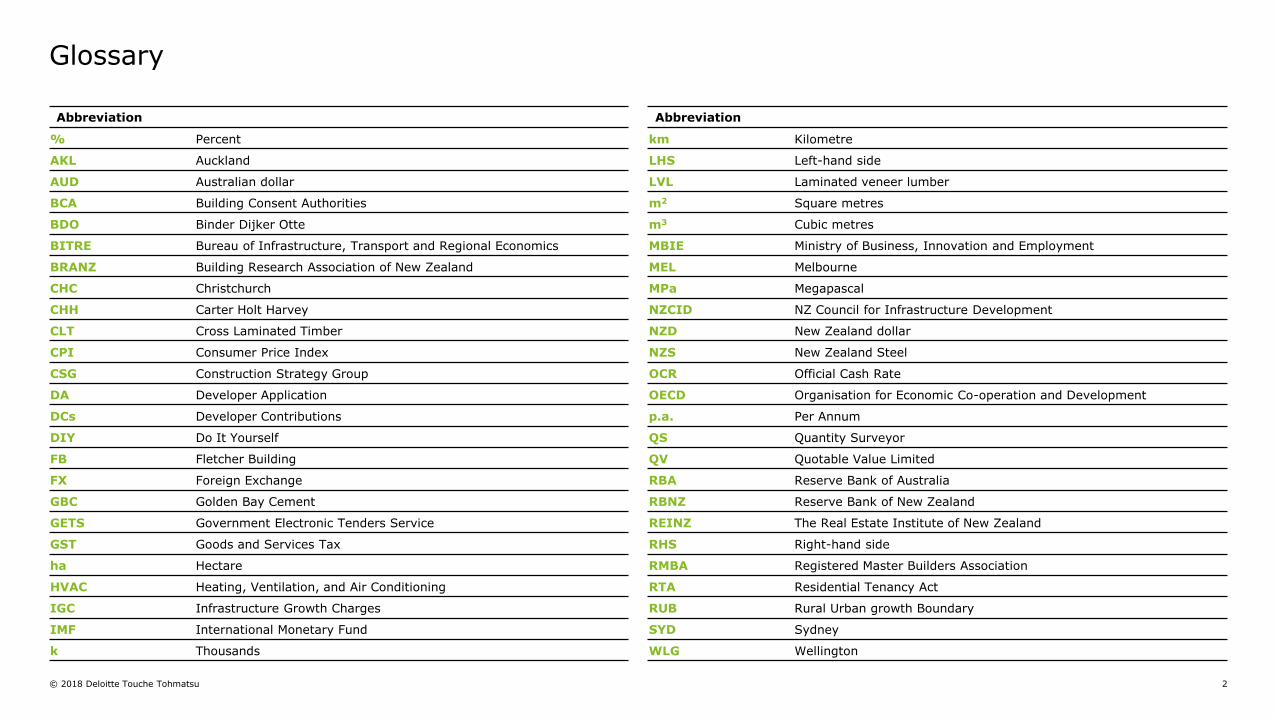
Glossary
© 2018 Deloitte Touche Tohmatsu 2
Abbreviation
% Percent
AKL Auckland
AUD Australian dollar
BCA Building Consent Authorities
BDO Binder Dijker Otte
BITRE Bureau of Infrastructure, Transport and Regional Economics
BRANZ Building Research Association of New Zealand
CHC Christchurch
CHH Carter Holt Harvey
CLT Cross Laminated Timber
CPI Consumer Price Index
CSG Construction Strategy Group
DA Developer Application
DCs Developer Contributions
DIY Do It Yourself
FB Fletcher Building
FX Foreign Exchange
GBC Golden Bay Cement
GETS Government Electronic Tenders Service
GST Goods and Services Tax
ha Hectare
HVAC Heating, Ventilation, and Air Conditioning
IGC Infrastructure Growth Charges
IMF International Monetary Fund
k Thousands
Glossary
Abbreviation
km Kilometre
LHS Left-hand side
LVL Laminated veneer lumber
m2 Square metres
m3 Cubic metres
MBIE Ministry of Business, Innovation and Employment
MEL Melbourne
MPa Megapascal
NZCID NZ Council for Infrastructure Development
NZD New Zealand dollar
NZS New Zealand Steel
OCR Official Cash Rate
OECD Organisation for Economic Co-operation and Development
p.a. Per Annum
QS Quantity Surveyor
QV Quotable Value Limited
RBA Reserve Bank of Australia
RBNZ Reserve Bank of New Zealand
REINZ The Real Estate Institute of New Zealand
RHS Right-hand side
RMBA Registered Master Builders Association
RTA Residential Tenancy Act
RUB Rural Urban growth Boundary
SYD Sydney
WLG Wellington
© 2018 Deloitte Touche Tohmatsu 3
Purpose of the report
This report focuses on the cost of new residential housing supply, and in particular the cost of building materials. This study aims to understand the costs associated with residential development (cost of supply), and not the cost of purchasing a new house (the market value).
Context to the study
The cost of building materials is a key contributor to the overall cost of residential housing development, although by no means the only cost-driver. Land and costs related to land such as civil works and infrastructure are equally or more important. Other significant costs include labour, GST and other government levies and charges, professional fees, and other costs relating to the developer including the cost of holding land and preliminary costs
Building and construction in New Zealand is a major industry. The industry employs 160,800 people directly in housing construction, contributing $29.8b directly to the economy in 2015 (Urban Economics, 2016). Beyond these headline figures, the manufacture and supply of building materials in New Zealand provides many more jobs. Quality building materials are an essential contributor to the supply of housing of a reasonable standard. Therefore, it is important to consider factors beyond price when discussing building materials.
Scope of the report
This report addresses three key questions:
1. What is the overall contribution of building materials to the cost of new residential housing development across a range of home types in Australia and New Zealand?
2. What explains cost differences in residential housing development between New Zealand and Australia?
3. To what extent does market structure drive the cost of building materials in New Zealand?
This study does not examine developer margins in detail. Contractor margins are considered. However, developer margins are much more complex as they are fundamentally a function of risk, including the appetite of lenders to finance new developments.
There are also very many different types of housing developers ranging from government as developer, community housing providers (CHPs) as developers, large and small scale private developers, iwi-Maori organisations as developers, and individual land-owners building their own homes. Each has a very different risk profile, source and cost of finance, and thus expectation as to return on investment. The same is also true in Australia, but there is even greater diversity there, making comparisons that much more difficult again.
Context
Executive Summary
© 2018 Deloitte Touche Tohmatsu 4
950
1000
1050
1100
1150
1200
1250
1300
1350
1400
1450
1500
1550
1600
2009.12 2010.12 2011.12 2012.12 2013.12 2014.12 2015.12 2016.12 2017.12
Indexed D
ecem
ber 2009=
1000
House price index
Wood and timber(includes framing anddressed timber)
Residential buildingconstruction inputs(producers price inputindex)
Construction sectorlabour cost index
Plasterboard, cement &concrete products
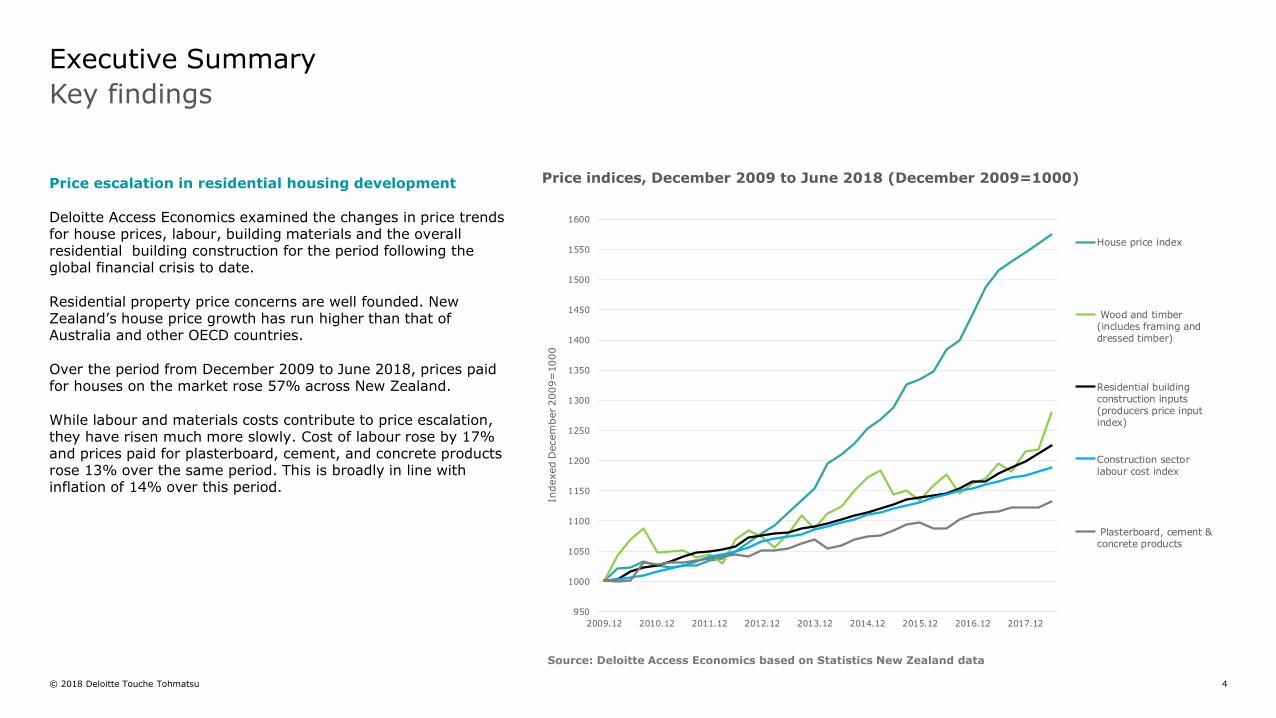
Price escalation in residential housing development
Deloitte Access Economics examined the changes in price trends for house prices, labour, building materials and the overall residential building construction for the period following the global financial crisis to date.
Residential property price concerns are well founded. New Zealand’s house price growth has run higher than that of Australia and other OECD countries.
Over the period from December 2009 to June 2018, prices paid for houses on the market rose 57% across New Zealand.
While labour and materials costs contribute to price escalation, they have risen much more slowly. Cost of labour rose by 17% and prices paid for plasterboard, cement, and concrete products rose 13% over the same period. This is broadly in line with inflation of 14% over this period.
Key findings
Executive Summary
Price indices, December 2009 to June 2018 (December 2009=1000)
Source: Deloitte Access Economics based on Statistics New Zealand data
© 2018 Deloitte Touche Tohmatsu 5
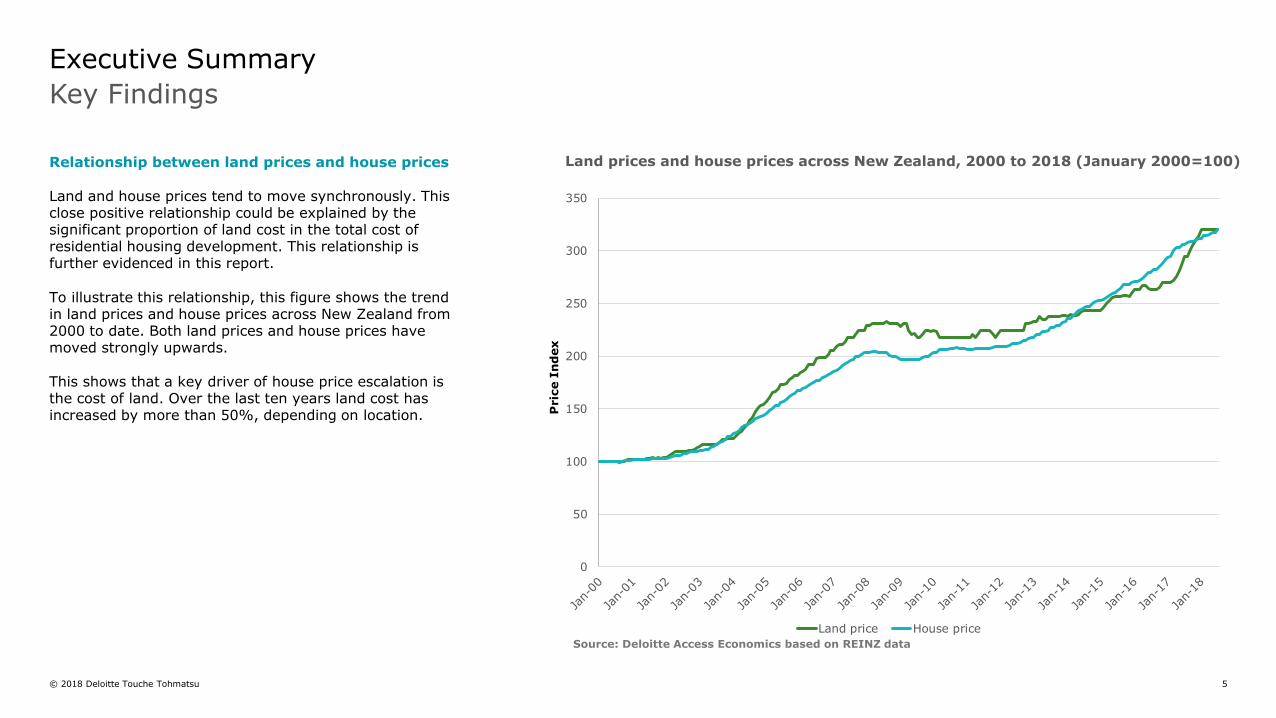
Relationship between land prices and house prices
Land and house prices tend to move synchronously. This close positive relationship could be explained by the significant proportion of land cost in the total cost of residential housing development. This relationship is further evidenced in this report.
To illustrate this relationship, this figure shows the trend in land prices and house prices across New Zealand from 2000 to date. Both land prices and house prices have moved strongly upwards.
This shows that a key driver of house price escalation is the cost of land. Over the last ten years land cost has increased by more than 50%, depending on location.
Source: Deloitte Access Economics based on REINZ data
Land prices and house prices across New Zealand, 2000 to 2018 (January 2000=100)
Key Findings
Executive Summary
0
50
100
150
200
250
300
350
Pric
e I
nd
ex
Land price House price
© 2018 Deloitte Touche Tohmatsu 6
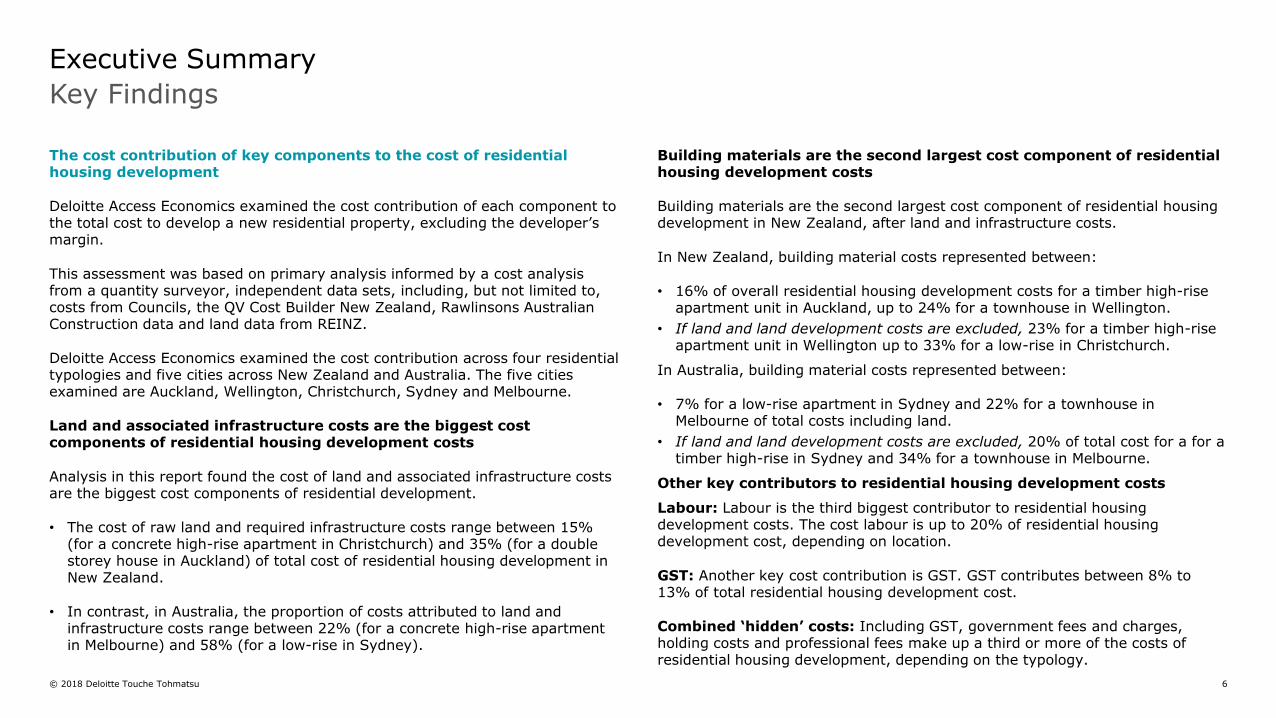
The cost contribution of key components to the cost of residential housing development
Deloitte Access Economics examined the cost contribution of each component to the total cost to develop a new residential property, excluding the developer’s margin.
This assessment was based on primary analysis informed by a cost analysis from a quantity surveyor, independent data sets, including, but not limited to, costs from Councils, the QV Cost Builder New Zealand, Rawlinsons Australian Construction data and land data from REINZ.
Deloitte Access Economics examined the cost contribution across four residential typologies and five cities across New Zealand and Australia. The five cities examined are Auckland, Wellington, Christchurch, Sydney and Melbourne.
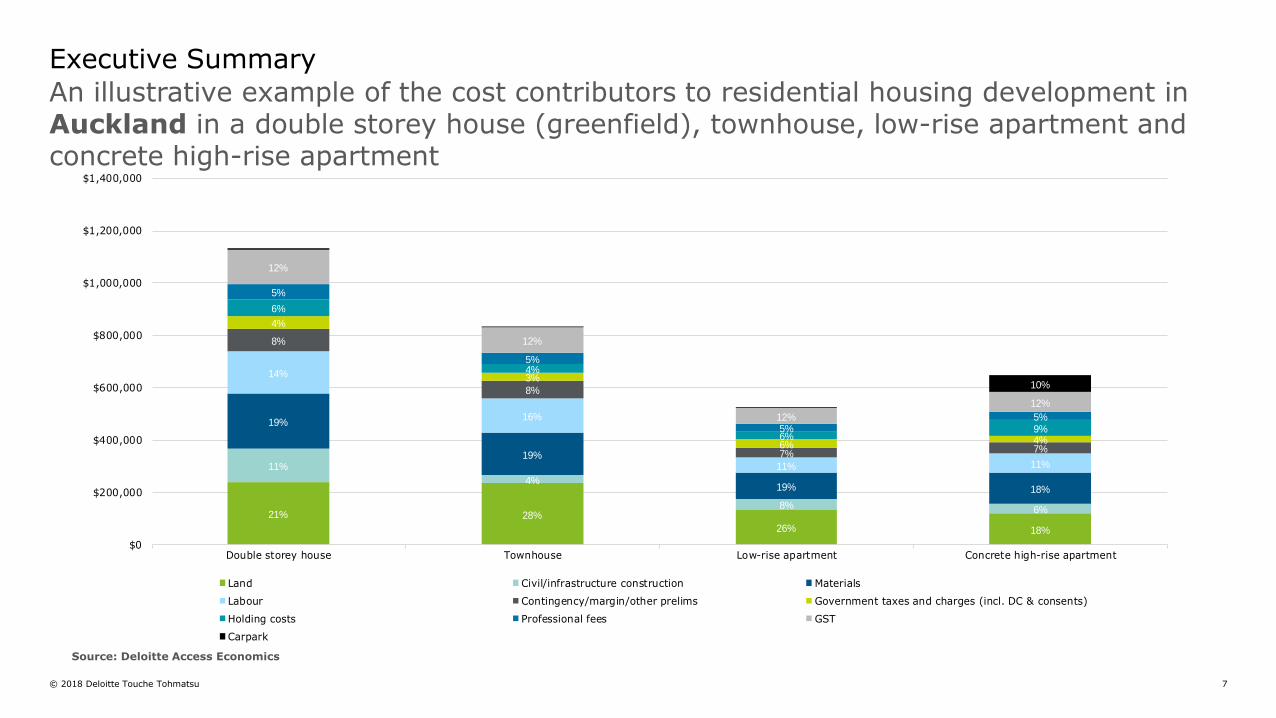
Land and associated infrastructure costs are the biggest cost components of residential housing development costs
Analysis in this report found the cost of land and associated infrastructure costs are the biggest cost components of residential development.
• The cost of raw land and required infrastructure costs range between 15% (for a concrete high-rise apartment in Christchurch) and 35% (for a double storey house in Auckland) of total cost of residential housing development in New Zealand.
• In contrast, in Australia, the proportion of costs attributed to land and infrastructure costs range between 22% (for a concrete high-rise apartment in Melbourne) and 58% (for a low-rise in Sydney).
Building materials are the second largest cost component of residential housing development costs
Building materials are the second largest cost component of residential housing development in New Zealand, after land and infrastructure costs.
In New Zealand, building material costs represented between:
• 16% of overall residential housing development costs for a timber high-rise apartment unit in Auckland, up to 24% for a townhouse in Wellington.
• If land and land development costs are excluded, 23% for a timber high-rise apartment unit in Wellington up to 33% for a low-rise in Christchurch.
In Australia, building material costs represented between:
• 7% for a low-rise apartment in Sydney and 22% for a townhouse in Melbourne of total costs including land.
• If land and land development costs are excluded, 20% of total cost for a for a timber high-rise in Sydney and 34% for a townhouse in Melbourne.
Other key contributors to residential housing development costs
Labour: Labour is the third biggest contributor to residential housing development costs. The cost labour is up to 20% of residential housing development cost, depending on location.
GST: Another key cost contribution is GST. GST contributes between 8% to 13% of total residential housing development cost.
Combined ‘hidden’ costs: Including GST, government fees and charges, holding costs and professional fees make up a third or more of the costs of residential housing development, depending on the typology.
Key Findings
Executive Summary
© 2018 Deloitte Touche Tohmatsu 7
Executive Summary
21% 28%
26% 18%
11%
4%
8% 6%
19%
19%
19% 18%
14%
16%
11% 11%
8%
8%
7% 7%
4%
3%
6% 4%
6%
4%
6%9%
5%
5%
5%5%
12%
12%
12%
12%
10%
$0
$200,000
$400,000
$600,000
$800,000
$1,000,000
$1,200,000
$1,400,000
Double storey house Townhouse Low-rise apartment Concrete high-rise apartment
Land Civil/infrastructure construction Materials
Labour Contingency/margin/other prelims Government taxes and charges (incl. DC & consents)
Holding costs Professional fees GST
Carpark
An illustrative example of the cost contributors to residential housing development in Auckland in a double storey house (greenfield), townhouse, low-rise apartment and concrete high-rise apartment
Source: Deloitte Access Economics
© 2018 Deloitte Touche Tohmatsu 8
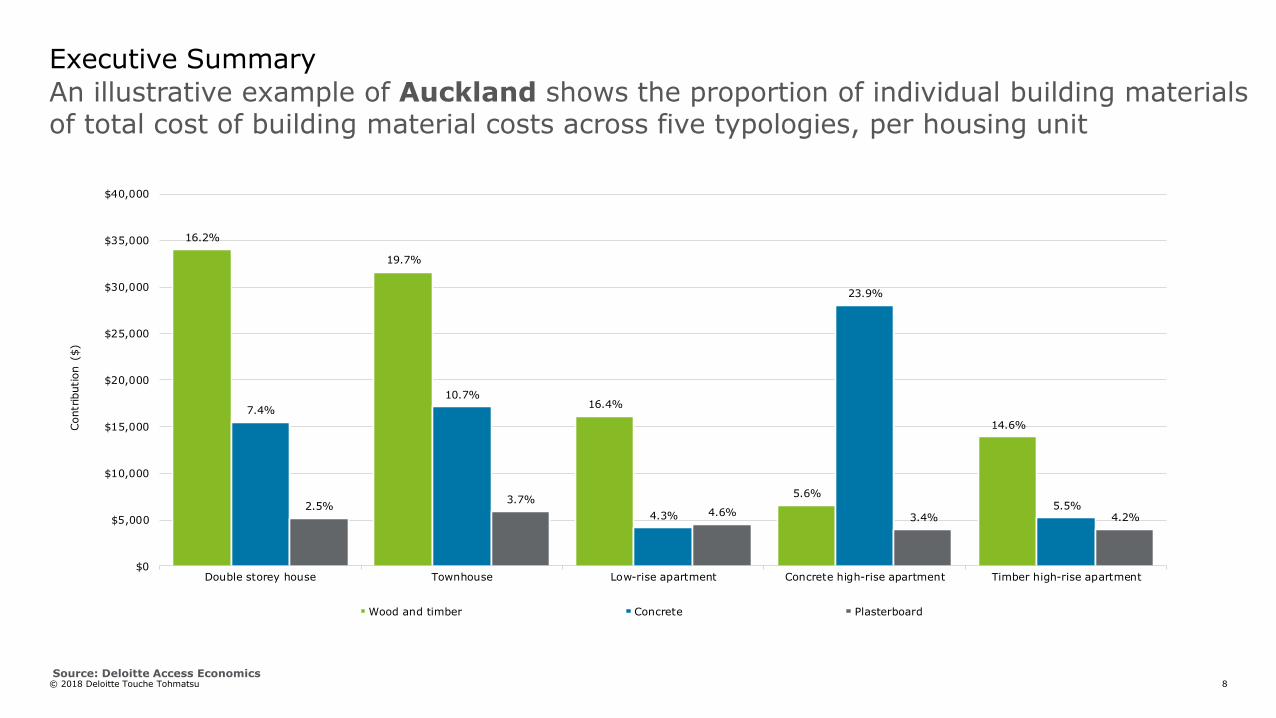
Executive Summary
An illustrative example of Auckland shows the proportion of individual building materials of total cost of building material costs across five typologies, per housing unit
Source: Deloitte Access Economics
16.2%
19.7%
16.4%
5.6%
14.6%
7.4%
10.7%
4.3%
23.9%
5.5%2.5%3.7%
4.6%3.4% 4.2%
$0
$5,000
$10,000
$15,000
$20,000
$25,000
$30,000
$35,000
$40,000
Double storey house Townhouse Low-rise apartment Concrete high-rise apartment Timber high-rise apartment
Contr
ibution ($
)
Wood and timber Concrete Plasterboard
© 2018 Deloitte Touche Tohmatsu 9
Key findings
Comparison of construction costs between New Zealand and Australia
Australia and New Zealand build differently – particularly double storeyand townhouses
For this report, we compared like for like typologies between Australia and New Zealand, using typical typologies for New Zealand. Our conclusions are that New Zealand is overall very similar – or in some cases cheaper – than Australia on a like for like basis. However, of course we do not build the same across the two countries for a variety of reasons, including historical (habitual), environmental (e.g. responding to local risks) and simply because it makes sense owing to to the nature of the local market. For all of these reasons, it can be unhelpful to make straight comparisons between Australia and New Zealand of things like per square metre building costs. This report aims to allow for an objective comparison on a like for like basis.
Construction cost per square metre is less in New Zealand relative to Australia for most typologies except for a double storey house
Based on the cost contribution of residential housing development, Deloitte Access Economics estimated the construction cost per square metre for each typology across the five cities. Construction cost includes the cost of building materials, labour, builders’ margin, construction contingency and preliminaries.
Analysis in this report shows that construction costs were cheaper overall in New Zealand with some exceptions:
• Relative to Sydney, construction costs for a double storey house is slightly (1.9%) higher in Auckland, but cheaper across all typologies in Wellington and Christchurch.
• Relative to Melbourne, construction costs for a double storey house are higher in Auckland (9.1%), Wellington (1.9%) and Christchurch (6.1%).
• Construction costs for a townhouse house are higher in Auckland (3.5%) relative to Melbourne, but lower in Wellington and Christchurch.
Reasons for cost differences in construction costs between New Zealand and Australia
There are a number of factors affecting cost differences for double storey and townhouse typologies between New Zealand and Australia:
• In New Zealand building materials and labour costs are cheaper overall, however builders’ margins and GST are key drivers for cost differences.
• The number of small building companies delivering residential housing is higher in New Zealand. This impacts more on stand-alone houses and townhouse.
• New Zealand builds differently, with a higher proportion of bespoke buildings.
• Based on industry interviews, it is evident that architects, builders and regulators tend to be risk averse which disincentivises innovation in the industry and like for like substitution.
• Although regulations and codes of compliance are similar across New Zealand and Australia, country specific factors result in varying applications. For example, houses in New Zealand must be able to withstand probable loads from earthquakes. In practice this could mean designing engineering systems and elements that comply with the building code. Relative to Australia, this compliance requirements increases the cost to design, consent, and build.
Key factors affecting cost differences between New Zealand and Australia across all typologies include:
• New Zealand is a smaller market and consequently does not benefit from economies of scale
• New Zealand has higher transportation supply costs compared to Australia. See page 69 of this report for more details.
Executive Summary
© 2018 Deloitte Touche Tohmatsu 10
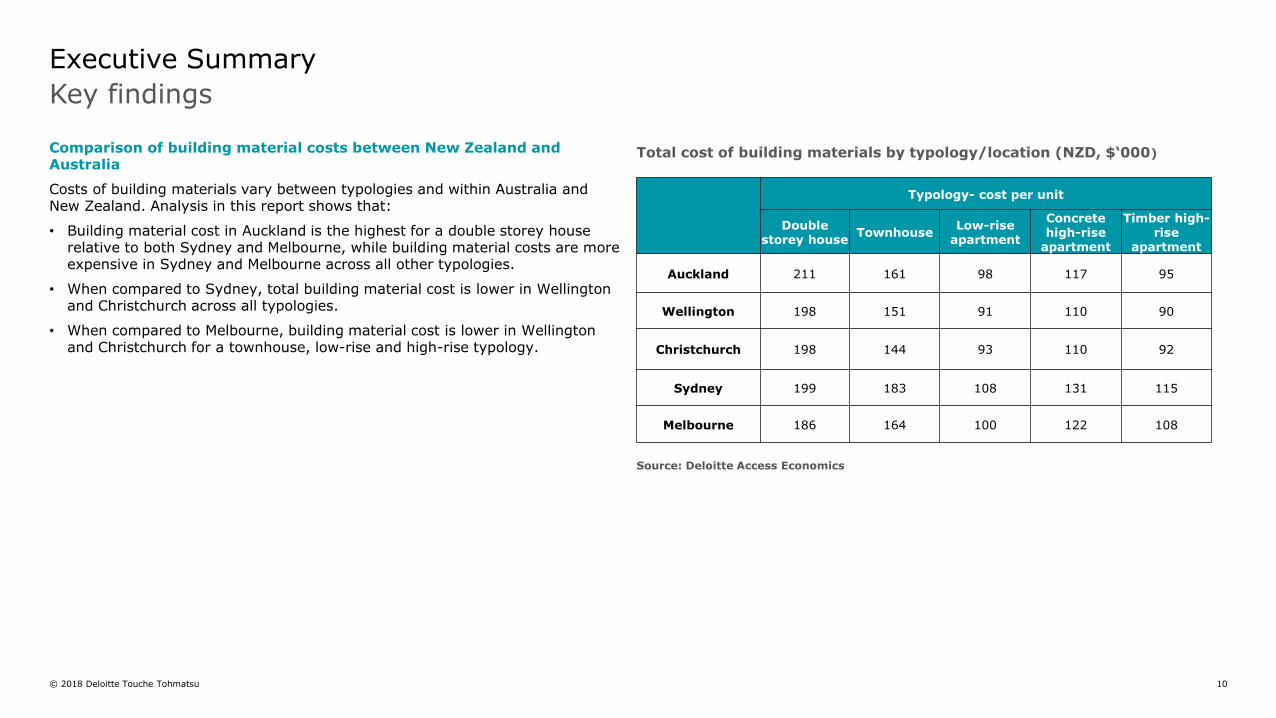
Comparison of building material costs between New Zealand and Australia
Costs of building materials vary between typologies and within Australia and New Zealand. Analysis in this report shows that:
• Building material cost in Auckland is the highest for a double storey house relative to both Sydney and Melbourne, while building material costs are more expensive in Sydney and Melbourne across all other typologies.
• When compared to Sydney, total building material cost is lower in Wellington and Christchurch across all typologies.
• When compared to Melbourne, building material cost is lower in Wellington and Christchurch for a townhouse, low-rise and high-rise typology.
Key findings
Executive Summary
Source: Deloitte Access Economics
Typology- cost per unit
Double storey house
TownhouseLow-rise
apartment
Concrete high-rise
apartment
Timber high-rise
apartment
Auckland 211 161 98 117 95
Wellington 198 151 91 110 90
Christchurch 198 144 93 110 92
Sydney 199 183 108 131 115
Melbourne 186 164 100 122 108
Total cost of building materials by typology/location (NZD, $‘000)
© 2018 Deloitte Touche Tohmatsu 11
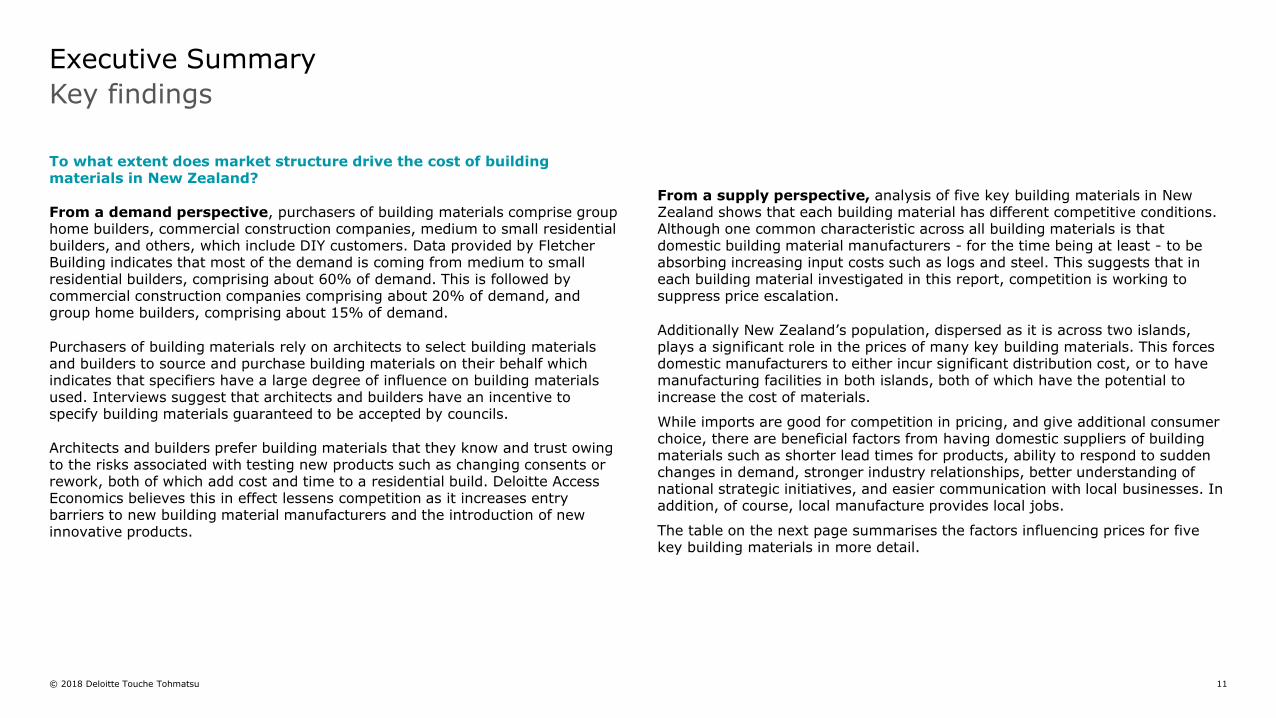
To what extent does market structure drive the cost of building materials in New Zealand?
From a demand perspective, purchasers of building materials comprise group home builders, commercial construction companies, medium to small residential builders, and others, which include DIY customers. Data provided by Fletcher Building indicates that most of the demand is coming from medium to small residential builders, comprising about 60% of demand. This is followed by commercial construction companies comprising about 20% of demand, and group home builders, comprising about 15% of demand.
Purchasers of building materials rely on architects to select building materials and builders to source and purchase building materials on their behalf which indicates that specifiers have a large degree of influence on building materials used. Interviews suggest that architects and builders have an incentive to specify building materials guaranteed to be accepted by councils.
Architects and builders prefer building materials that they know and trust owing to the risks associated with testing new products such as changing consents or rework, both of which add cost and time to a residential build. Deloitte Access Economics believes this in effect lessens competition as it increases entry barriers to new building material manufacturers and the introduction of new innovative products.
From a supply perspective, analysis of five key building materials in New Zealand shows that each building material has different competitive conditions. Although one common characteristic across all building materials is that domestic building material manufacturers - for the time being at least - to be absorbing increasing input costs such as logs and steel. This suggests that in each building material investigated in this report, competition is working to suppress price escalation.
Additionally New Zealand’s population, dispersed as it is across two islands, plays a significant role in the prices of many key building materials. This forces domestic manufacturers to either incur significant distribution cost, or to have manufacturing facilities in both islands, both of which have the potential to increase the cost of materials.
While imports are good for competition in pricing, and give additional consumer choice, there are beneficial factors from having domestic suppliers of building materials such as shorter lead times for products, ability to respond to sudden changes in demand, stronger industry relationships, better understanding of national strategic initiatives, and easier communication with local businesses. In addition, of course, local manufacture provides local jobs.
The table on the next page summarises the factors influencing prices for five key building materials in more detail.
Executive Summary
Key findings
© 2018 Deloitte Touche Tohmatsu 12
Executive Summary
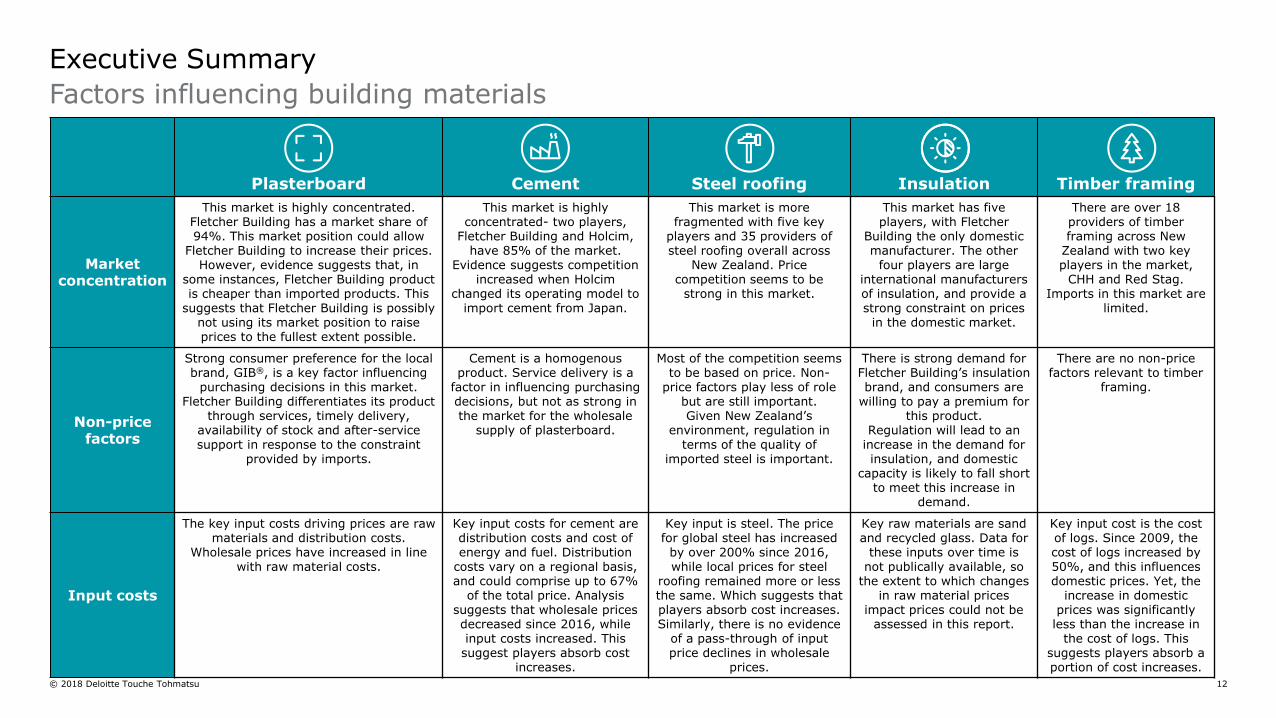
Factors influencing building materials
Plasterboard Cement Steel roofing Insulation Timber framing
Market concentration
This market is highly concentrated. Fletcher Building has a market share of 94%. This market position could allow
Fletcher Building to increase their prices. However, evidence suggests that, in
some instances, Fletcher Building product is cheaper than imported products. This
suggests that Fletcher Building is possibly not using its market position to raise prices to the fullest extent possible.
This market is highlyconcentrated- two players,
Fletcher Building and Holcim, have 85% of the market.
Evidence suggests competition increased when Holcim
changed its operating model to import cement from Japan.
This market is more fragmented with five key
players and 35 providers of steel roofing overall across
New Zealand. Price competition seems to be
strong in this market.
This market has five players, with Fletcher
Building the only domestic manufacturer. The other
four players are large international manufacturers of insulation, and provide a strong constraint on prices
in the domestic market.
There are over 18 providers of timber framing across New
Zealand with two key players in the market,
CHH and Red Stag. Imports in this market are
limited.
Non-price factors
Strong consumer preference for the local brand, GIB®, is a key factor influencing
purchasing decisions in this market.Fletcher Building differentiates its product
through services, timely delivery, availability of stock and after-service support in response to the constraint
provided by imports.
Cement is a homogenous product. Service delivery is a
factor in influencing purchasing decisions, but not as strong in the market for the wholesale
supply of plasterboard.
Most of the competition seemsto be based on price. Non-
price factors play less of role but are still important. Given New Zealand’s
environment, regulation in terms of the quality of
imported steel is important.
There is strong demand for Fletcher Building’s insulation brand, and consumers are
willing to pay a premium for this product.
Regulation will lead to an increase in the demand for insulation, and domestic
capacity is likely to fall short to meet this increase in
demand.
There are no non-pricefactors relevant to timber
framing.
Input costs
The key input costs driving prices are raw materials and distribution costs.
Wholesale prices have increased in line with raw material costs.
Key input costs for cement are distribution costs and cost of energy and fuel. Distribution
costs vary on a regional basis, and could comprise up to 67%
of the total price. Analysis suggests that wholesale prices decreased since 2016, while input costs increased. This suggest players absorb cost
increases.
Key input is steel. The price for global steel has increased
by over 200% since 2016, while local prices for steel
roofing remained more or less the same. Which suggests that players absorb cost increases. Similarly, there is no evidence
of a pass-through of input price declines in wholesale
prices.
Key raw materials are sand and recycled glass. Data for
these inputs over time is not publically available, so
the extent to which changes in raw material prices
impact prices could not be assessed in this report.
Key input cost is the cost of logs. Since 2009, the cost of logs increased by 50%, and this influences domestic prices. Yet, the
increase in domestic prices was significantly less than the increase in
the cost of logs. This suggests players absorb a portion of cost increases.
© 2018 Deloitte Touche Tohmatsu 13
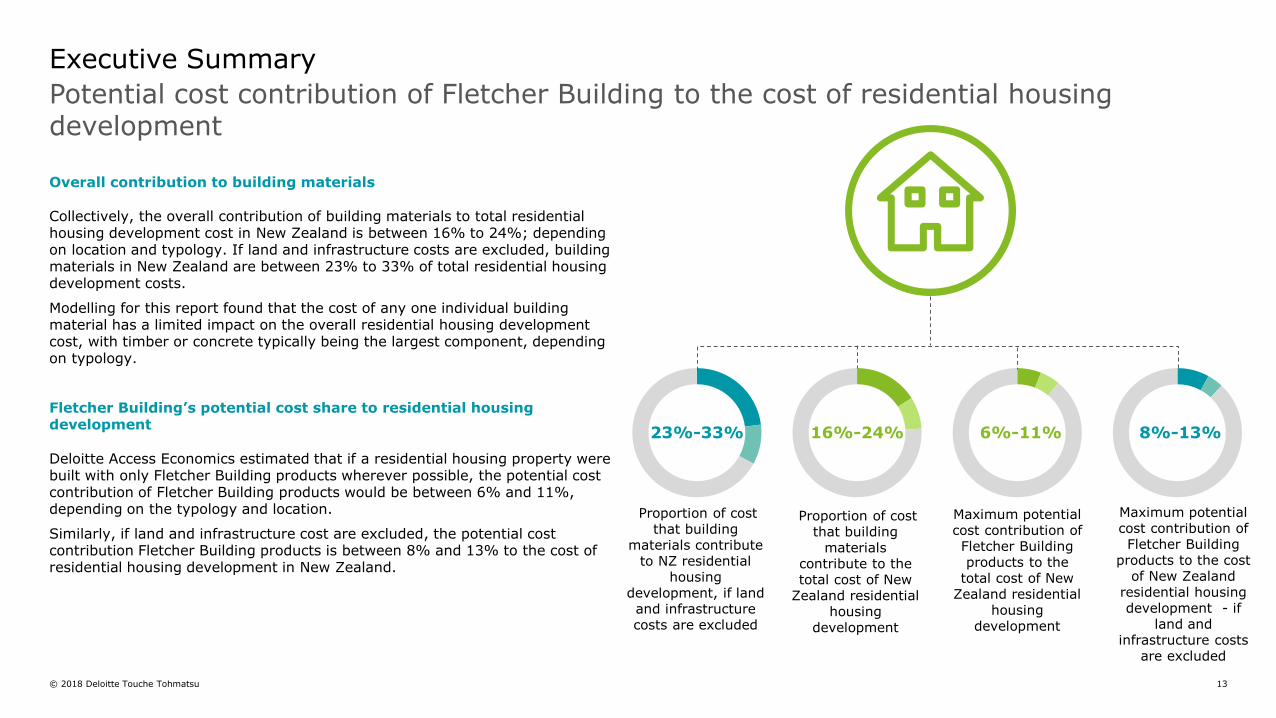
Overall contribution to building materials
Collectively, the overall contribution of building materials to total residential housing development cost in New Zealand is between 16% to 24%; depending on location and typology. If land and infrastructure costs are excluded, building materials in New Zealand are between 23% to 33% of total residential housing development costs.
Modelling for this report found that the cost of any one individual building material has a limited impact on the overall residential housing development cost, with timber or concrete typically being the largest component, depending on typology.
Fletcher Building’s potential cost share to residential housing development
Deloitte Access Economics estimated that if a residential housing property were built with only Fletcher Building products wherever possible, the potential cost contribution of Fletcher Building products would be between 6% and 11%, depending on the typology and location.
Similarly, if land and infrastructure cost are excluded, the potential cost contribution Fletcher Building products is between 8% and 13% to the cost of residential housing development in New Zealand.
Executive Summary
Potential cost contribution of Fletcher Building to the cost of residential housing development
Maximum potentialcost contribution of Fletcher Building products to the
total cost of New Zealand residential
housing development
6%-11%
Proportion of cost that building
materials contribute to the total cost of New
Zealand residential housing
development
16%-24%
Proportion of cost that building
materials contribute to NZ residential
housing development, if land and infrastructure costs are excluded
23%-33%
Maximum potential cost contribution of Fletcher Building
products to the cost of New Zealand
residential housing development - if
land and infrastructure costs
are excluded
8%-13%

© 2018 Deloitte Touche Tohmatsu 14
1. Introduction
© 2018 Deloitte Touche Tohmatsu 15
Fletcher Building Limited (Fletcher Building) commissioned Deloitte Access Economics to investigate the cost components of new residential buildings in New Zealand with an emphasis on building materials as a contributor to overall cost of residential housing development.
From the foundation to the roofing and finishes, the choice of building materials contributes materially to both the quality and the cost of housing. Unsurprisingly there is a relationship between quality and cost, including costs relating to warranties and service support. For example, when build costs per square metre in the region of $1,200 are quoted, it is critical to understand what sort of building this buys.
In New Zealand, building materials for residential housing development are typically weighted towards timber, concrete, steel, plasterboard, insulation, roofing, cladding, windows, and plastic piping, paint plus many other ancillary materials. Other key inputs to the cost of residential housing development include the cost of land, labour, horizontal infrastructure costs, the developer’s cost of capital, and costs relating to consenting and other regulatory processes.
For this report, we compared like for like typologies between Australia and New Zealand, using typical typologies for New Zealand. However, of course we do not build the same across the two countries for a variety of reasons, including historical (habitual), environmental (e.g. responding to local risks) and simply because it makes sense to owing to the nature of the local market. For all of these reasons, it can be unhelpful to make straight comparisons between Australia and New Zealand of things like per square metre building costs. This report aims to allow for an objective comparison on a like or like basis.
Scope of the study
This study addresses three key questions:
1. What is the overall contribution of building materials to the cost of new residential housing development across a range of home types in Australia and New Zealand?
2. What explains cost differences in residential housing development between New Zealand and Australia?
3. To what extent does market structure drive the cost of building materials in New Zealand?
This report details the findings of the study based on industry consultations, collection of primary data from market participants, and analysis of existing official and independent data sets to understand the building materials industry and its contribution to the cost of new residential housing development.
This study does not examine developer margins in detail. Contractor margins are considered. However, developer margins are much more complex as they are fundamentally a function of risk, including the appetite of lenders to finance new developments.
There are also very many different types of housing developers ranging from government as developer, community housing providers (CHPs) as developers, large and small scale private developers, iwi-Maori organisations as developers, and individual land-owners building their own homes. Each has a very different risk profile, source and cost of finance, and thus expectation as to return on investment. The same is true in Australia, but there is even greater diversity there, making comparisons that much more difficult again.
1. This report
Introduction

© 2018 Deloitte Touche Tohmatsu 16
2. Setting the scene
© 2018 Deloitte Touche Tohmatsu 17
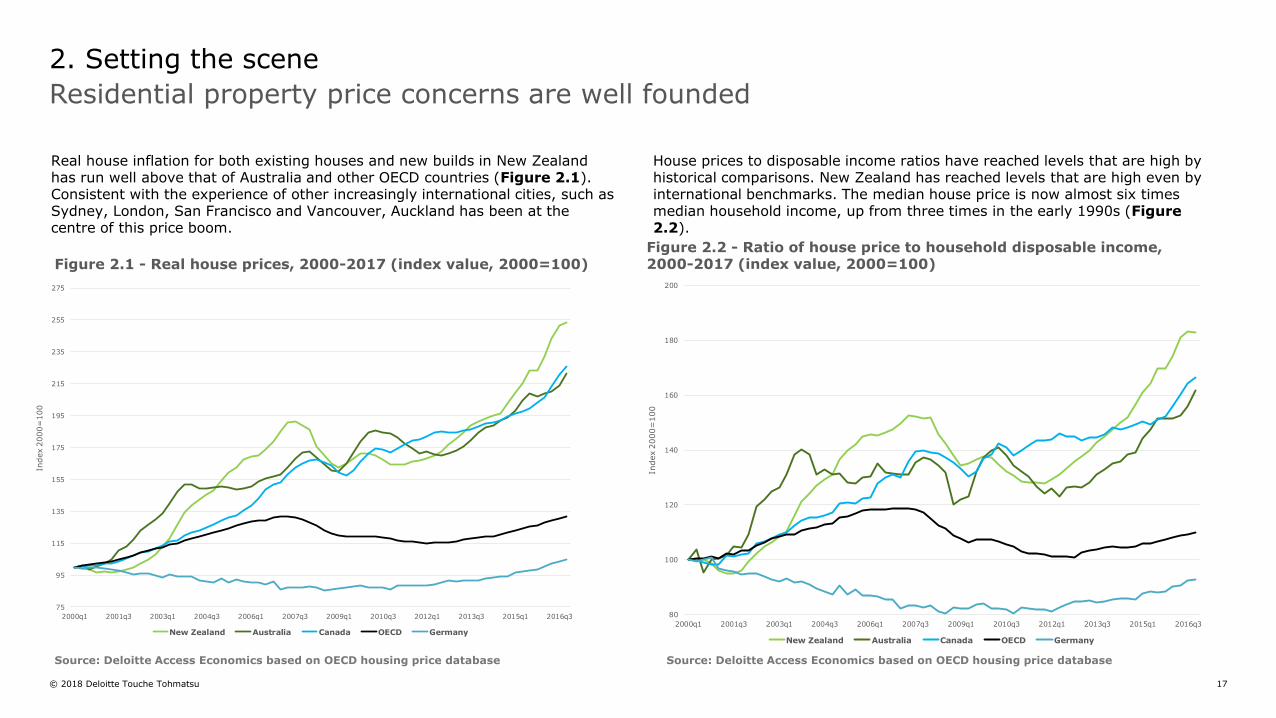
Real house inflation for both existing houses and new builds in New Zealand has run well above that of Australia and other OECD countries (Figure 2.1). Consistent with the experience of other increasingly international cities, such as Sydney, London, San Francisco and Vancouver, Auckland has been at the centre of this price boom.
House prices to disposable income ratios have reached levels that are high by historical comparisons. New Zealand has reached levels that are high even by international benchmarks. The median house price is now almost six times median household income, up from three times in the early 1990s (Figure 2.2).
2. Setting the scene
Residential property price concerns are well founded
Source: Deloitte Access Economics based on OECD housing price database
Figure 2.1 - Real house prices, 2000-2017 (index value, 2000=100)Figure 2.2 - Ratio of house price to household disposable income, 2000-2017 (index value, 2000=100)
Source: Deloitte Access Economics based on OECD housing price database
75
95
115
135
155
175
195
215
235
255
275
2000q1 2001q3 2003q1 2004q3 2006q1 2007q3 2009q1 2010q3 2012q1 2013q3 2015q1 2016q3
Index 2
000=
100
New Zealand Australia Canada OECD Germany
80
100
120
140
160
180
200
2000q1 2001q3 2003q1 2004q3 2006q1 2007q3 2009q1 2010q3 2012q1 2013q3 2015q1 2016q3
Index 2
000=
100
New Zealand Australia Canada OECD Germany
© 2018 Deloitte Touche Tohmatsu 18
2. Setting the scene
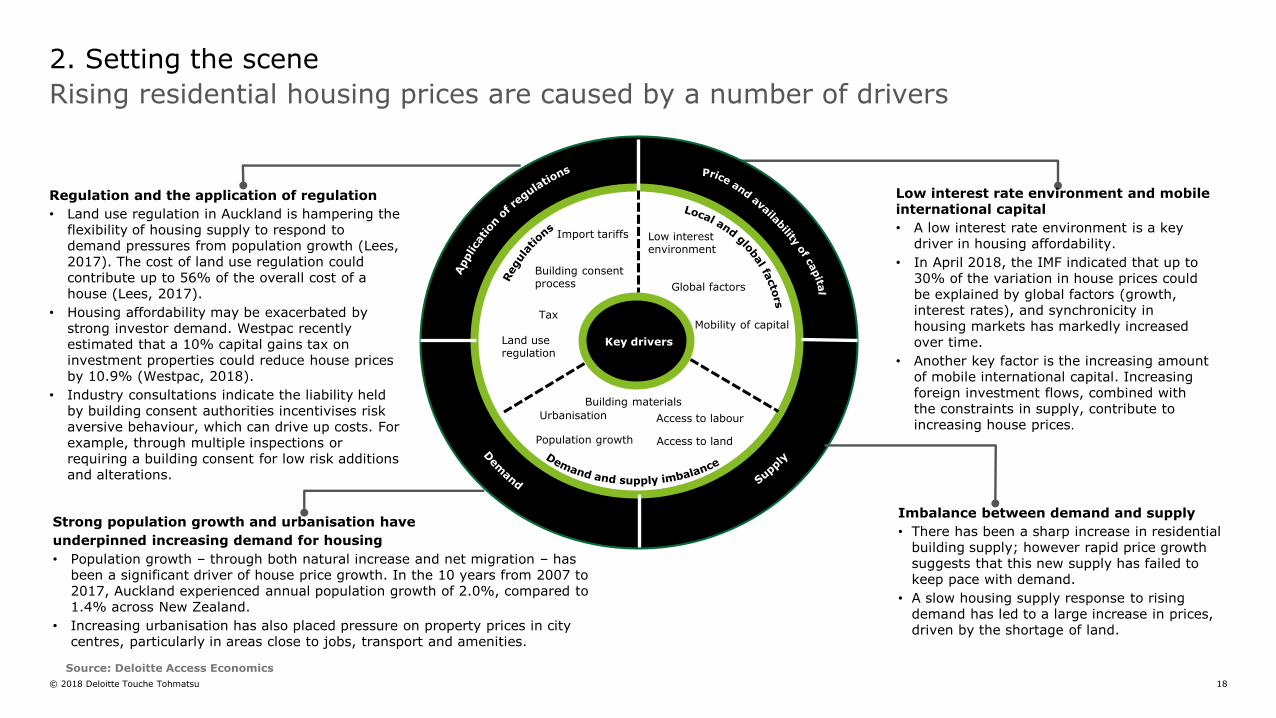
Rising residential housing prices are caused by a number of drivers
Low interest rate environment and mobile international capital
• A low interest rate environment is a key driver in housing affordability.
• In April 2018, the IMF indicated that up to 30% of the variation in house prices could be explained by global factors (growth, interest rates), and synchronicity in housing markets has markedly increased over time.
• Another key factor is the increasing amount of mobile international capital. Increasing foreign investment flows, combined with the constraints in supply, contribute to increasing house prices.
Imbalance between demand and supply
• There has been a sharp increase in residential building supply; however rapid price growth suggests that this new supply has failed to keep pace with demand.
• A slow housing supply response to rising demand has led to a large increase in prices, driven by the shortage of land.
Strong population growth and urbanisation have
underpinned increasing demand for housing
• Population growth – through both natural increase and net migration – has been a significant driver of house price growth. In the 10 years from 2007 to 2017, Auckland experienced annual population growth of 2.0%, compared to 1.4% across New Zealand.
• Increasing urbanisation has also placed pressure on property prices in city centres, particularly in areas close to jobs, transport and amenities.
Regulation and the application of regulation
• Land use regulation in Auckland is hampering the flexibility of housing supply to respond to demand pressures from population growth (Lees, 2017). The cost of land use regulation could contribute up to 56% of the overall cost of a house (Lees, 2017).
• Housing affordability may be exacerbated by strong investor demand. Westpac recently estimated that a 10% capital gains tax on investment properties could reduce house prices by 10.9% (Westpac, 2018).
• Industry consultations indicate the liability held by building consent authorities incentivises risk aversive behaviour, which can drive up costs. For example, through multiple inspections or requiring a building consent for low risk additions and alterations.
Key drivers
Low interest environment
Global factors
Mobility of capital
Import tariffs
Building consent process
Tax
Population growth
Urbanisation
Access to land
Access to labour
Building materials
Land use regulation
Source: Deloitte Access Economics
© 2018 Deloitte Touche Tohmatsu 19
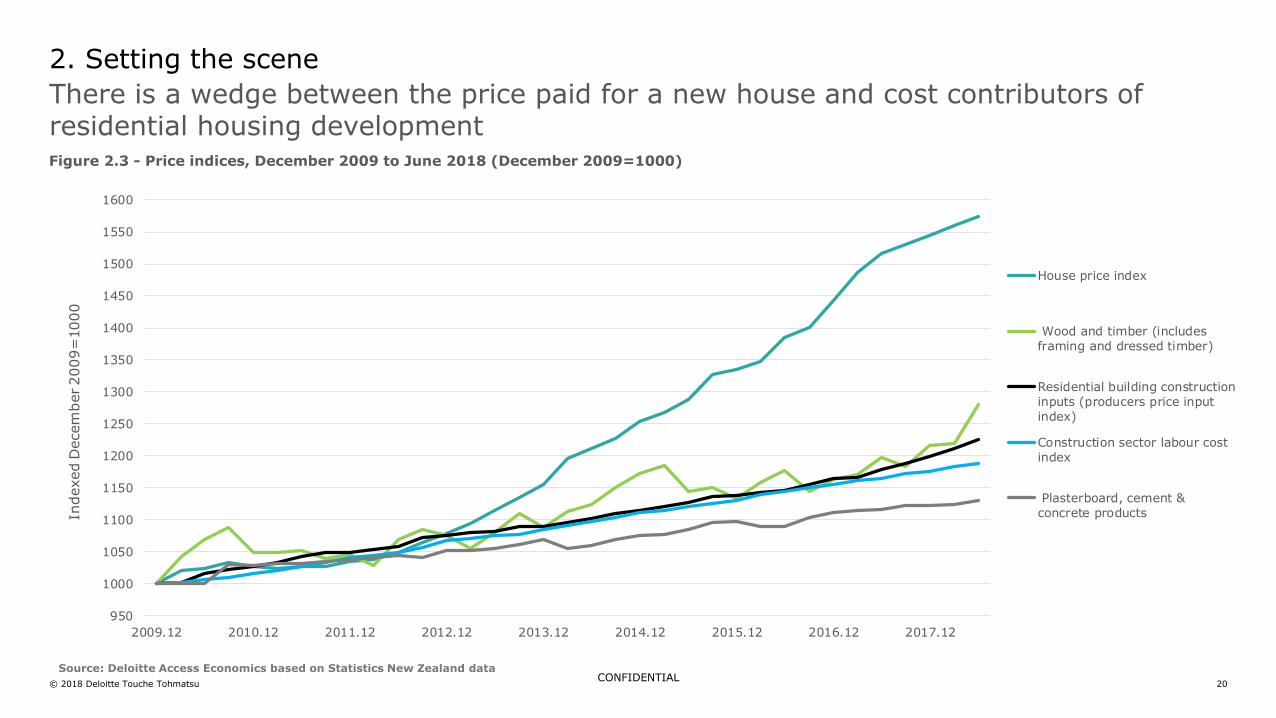
Deloitte Access Economics examined the changes in price trends for house prices, labour, building materials and overall residential building construction for the period following the global financial crisis to date. This analysis is presented in Figure 2.3 on the next page of the report for the period December 2009 to June 2018.
Over the period December 2009 to June 2018, prices paid for houses on the market rose 57% across New Zealand. The data in Figure 2.3 seems to suggest that a key driver of the increase in prices paid for houses is labour. Labour is increasing more rapidly than key building materials such as plasterboard, cement and concrete products.
The cost of labour and some building materials has risen closely inline with inflation. Data from StatsNZ shows that the consumer price index rose approximately 14% over the same period.
The labour cost index for the construction sector show that the cost of labour rose by 17% over the same period. The labour cost index is based on Statistics New Zealand data from a survey of employers in the construction industry.
The index for key building materials within residential construction reflects an increasing trend, and the extent of the change depends on the type of building material. For example, over December 2009 to June 2018:
• The prices paid for wood and timber, including framing and dressed timber, rose 28%.
• In contrast, the prices paid for plasterboard, cement, and concrete products rose 13% over the same period.
The cost of inputs for businesses in the residential construction sector (as measured by producer input prices) lifted 22% over the same period. This index captures the price of raw materials, fuel, and services but excludes labour and capital costs.
The significant gap between the price paid for a new house and the cost of residential building and key inputs such as labour and building materials raises the question: what else is driving prices? One answer is the cost of land, as shown in Figure 2.4 on page 20.
2. Setting the scene
Major price trends in residential housing development
© 2018 Deloitte Touche Tohmatsu 20
2. Setting the scene
CONFIDENTIAL
There is a wedge between the price paid for a new house and cost contributors of residential housing development
Source: Deloitte Access Economics based on Statistics New Zealand data
Figure 2.3 - Price indices, December 2009 to June 2018 (December 2009=1000)
950
1000
1050
1100
1150
1200
1250
1300
1350
1400
1450
1500
1550
1600
2009.12 2010.12 2011.12 2012.12 2013.12 2014.12 2015.12 2016.12 2017.12
Indexed D
ecem
ber 2009=
1000
House price index
Wood and timber (includesframing and dressed timber)
Residential building construction
inputs (producers price input
index)
Construction sector labour cost
index
Plasterboard, cement &concrete products
© 2018 Deloitte Touche Tohmatsu 21
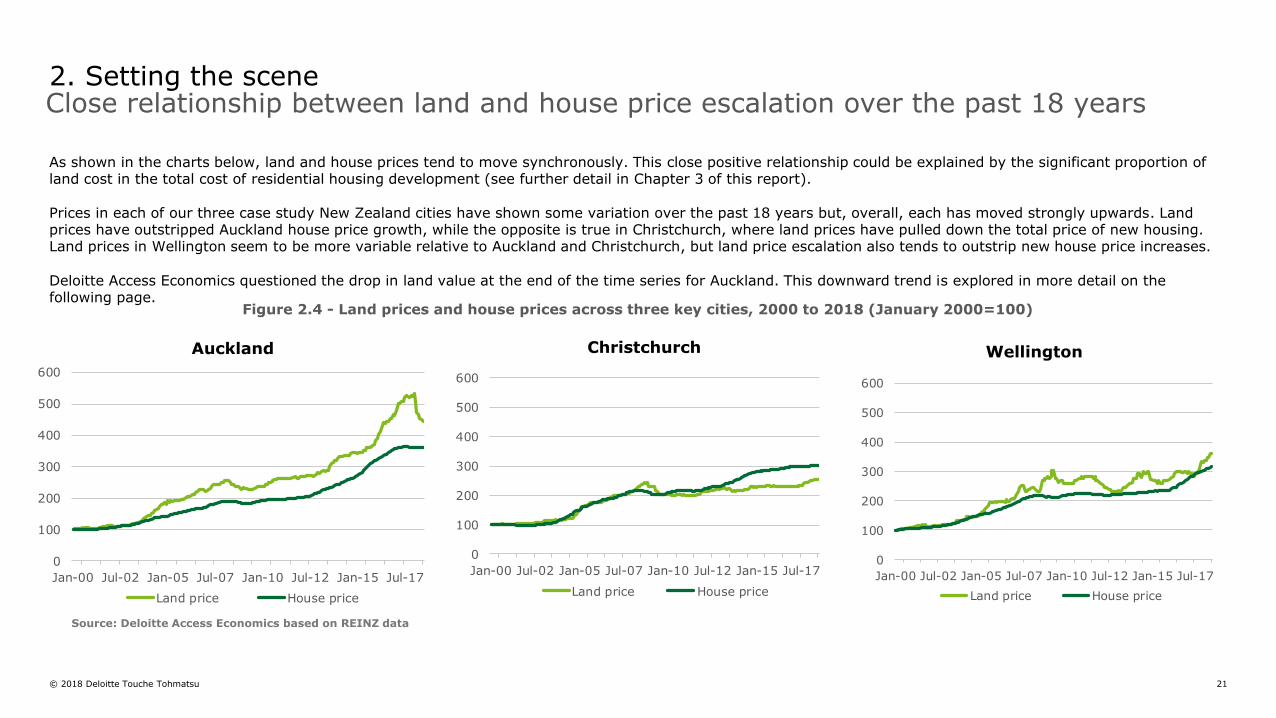
As shown in the charts below, land and house prices tend to move synchronously. This close positive relationship could be explained by the significant proportion of land cost in the total cost of residential housing development (see further detail in Chapter 3 of this report).
Prices in each of our three case study New Zealand cities have shown some variation over the past 18 years but, overall, each has moved strongly upwards. Land prices have outstripped Auckland house price growth, while the opposite is true in Christchurch, where land prices have pulled down the total price of new housing. Land prices in Wellington seem to be more variable relative to Auckland and Christchurch, but land price escalation also tends to outstrip new house price increases.
Deloitte Access Economics questioned the drop in land value at the end of the time series for Auckland. This downward trend is explored in more detail on the following page.
2. Setting the scene Close relationship between land and house price escalation over the past 18 years
Christchurch WellingtonAuckland
Source: Deloitte Access Economics based on REINZ data
Figure 2.4 - Land prices and house prices across three key cities, 2000 to 2018 (January 2000=100)
0
100
200
300
400
500
600
Jan-00 Jul-02 Jan-05 Jul-07 Jan-10 Jul-12 Jan-15 Jul-17
Land price House price
0
100
200
300
400
500
600
Jan-00 Jul-02 Jan-05 Jul-07 Jan-10 Jul-12 Jan-15 Jul-17
Land price House price
0
100
200
300
400
500
600
Jan-00 Jul-02 Jan-05 Jul-07 Jan-10 Jul-12 Jan-15 Jul-17
Land price House price
© 2018 Deloitte Touche Tohmatsu 22
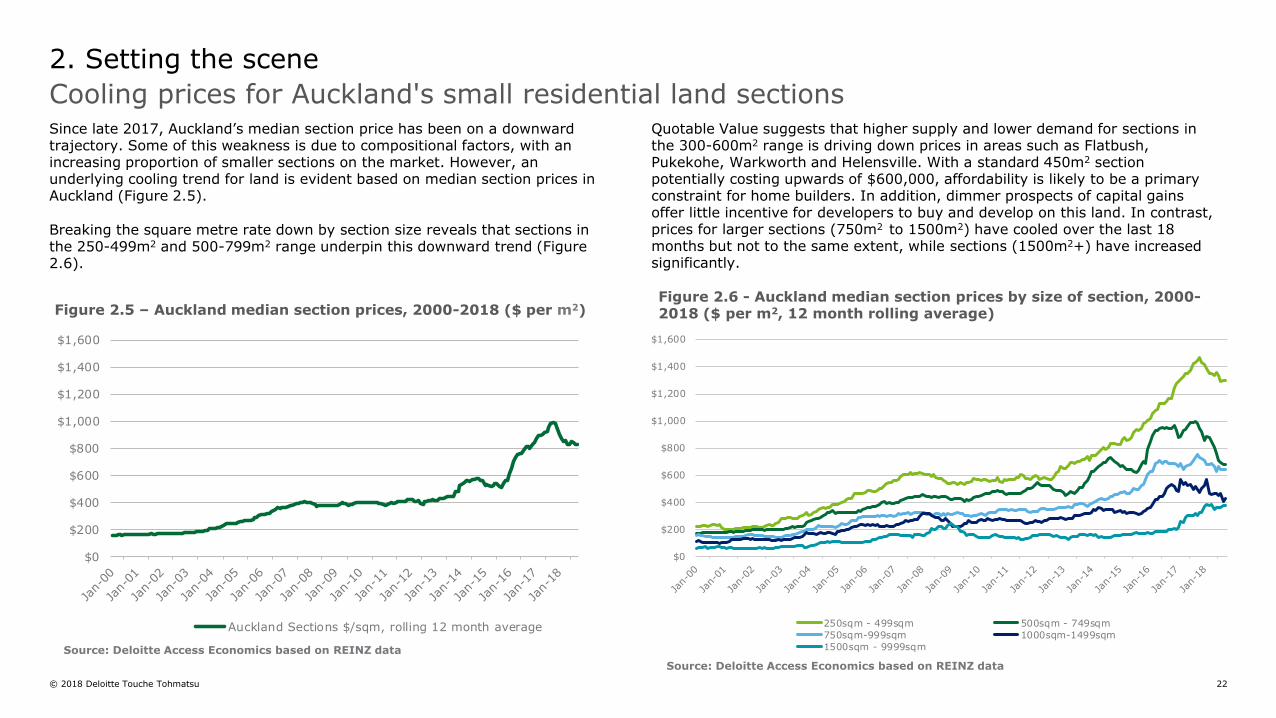
Since late 2017, Auckland’s median section price has been on a downward trajectory. Some of this weakness is due to compositional factors, with an increasing proportion of smaller sections on the market. However, an underlying cooling trend for land is evident based on median section prices in Auckland (Figure 2.5).
Breaking the square metre rate down by section size reveals that sections in the 250-499m2 and 500-799m2 range underpin this downward trend (Figure 2.6).
Quotable Value suggests that higher supply and lower demand for sections in the 300-600m2 range is driving down prices in areas such as Flatbush, Pukekohe, Warkworth and Helensville. With a standard 450m2 section potentially costing upwards of $600,000, affordability is likely to be a primary constraint for home builders. In addition, dimmer prospects of capital gains offer little incentive for developers to buy and develop on this land. In contrast, prices for larger sections (750m2 to 1500m2) have cooled over the last 18 months but not to the same extent, while sections (1500m2+) have increased significantly.
2. Setting the scene
Cooling prices for Auckland's small residential land sections
Source: Deloitte Access Economics based on REINZ data
Figure 2.5 – Auckland median section prices, 2000-2018 ($ per m2)Figure 2.6 - Auckland median section prices by size of section, 2000-2018 ($ per m2, 12 month rolling average)
Source: Deloitte Access Economics based on REINZ data
$0
$200
$400
$600
$800
$1,000
$1,200
$1,400
$1,600
Auckland Sections $/sqm, rolling 12 month average
$0
$200
$400
$600
$800
$1,000
$1,200
$1,400
$1,600
250sqm - 499sqm 500sqm - 749sqm
750sqm-999sqm 1000sqm-1499sqm
1500sqm - 9999sqm
© 2018 Deloitte Touche Tohmatsu 23
New Zealand is building fewer houses and more apartments
2. Setting the scene
90
110
130
150
170
190
210
230
2000 2002 2004 2006 2008 2010 2012 2014 2016 2018
Overall Standalones Townhouses
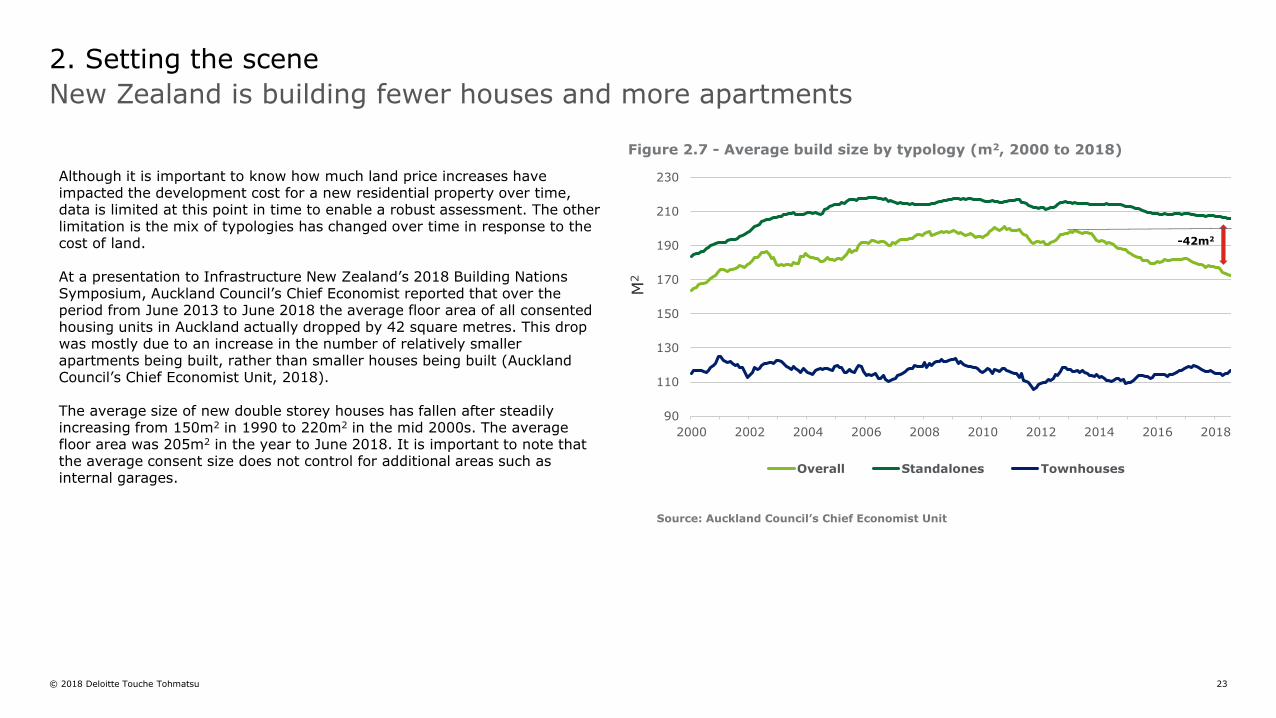
Although it is important to know how much land price increases have impacted the development cost for a new residential property over time, data is limited at this point in time to enable a robust assessment. The other limitation is the mix of typologies has changed over time in response to the cost of land.
At a presentation to Infrastructure New Zealand’s 2018 Building Nations Symposium, Auckland Council’s Chief Economist reported that over the period from June 2013 to June 2018 the average floor area of all consented housing units in Auckland actually dropped by 42 square metres. This drop was mostly due to an increase in the number of relatively smaller apartments being built, rather than smaller houses being built (Auckland Council’s Chief Economist Unit, 2018).
The average size of new double storey houses has fallen after steadily increasing from 150m2 in 1990 to 220m2 in the mid 2000s. The average floor area was 205m2 in the year to June 2018. It is important to note that the average consent size does not control for additional areas such as internal garages.
Figure 2.7 - Average build size by typology (m2, 2000 to 2018)
Source: Auckland Council’s Chief Economist Unit
-42m2
M2
© 2018 Deloitte Touche Tohmatsu 24
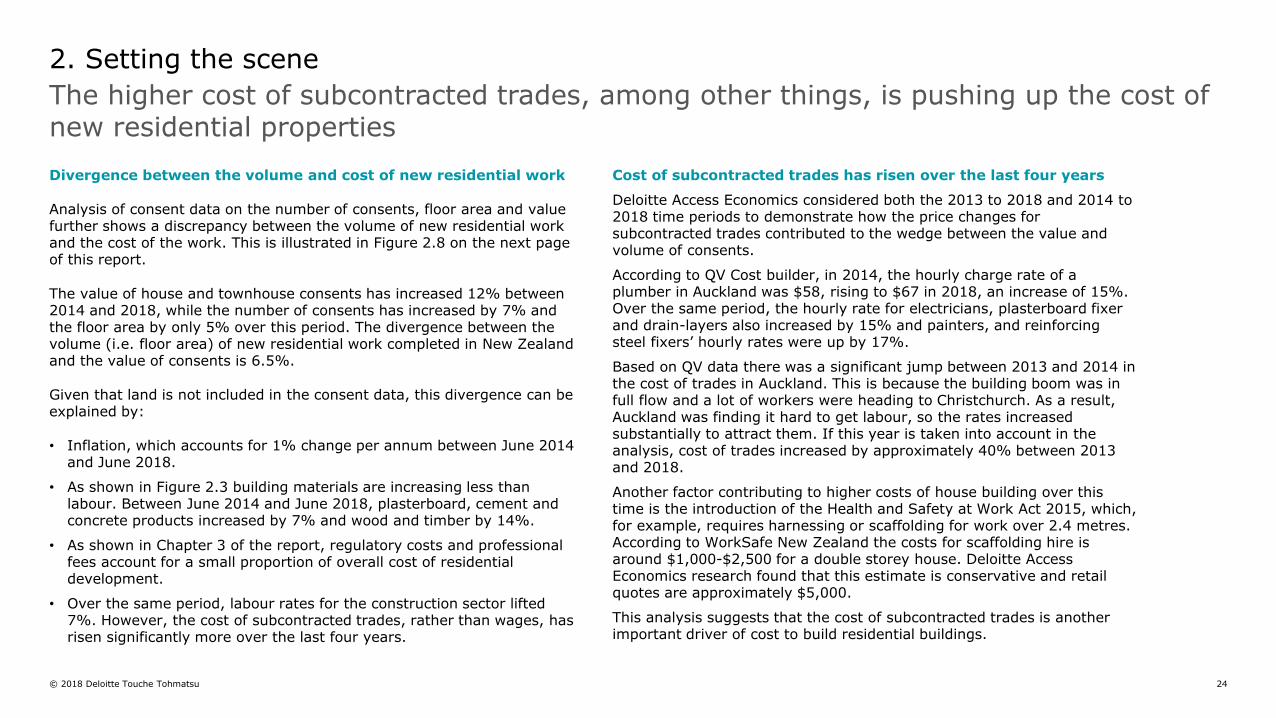
Divergence between the volume and cost of new residential work
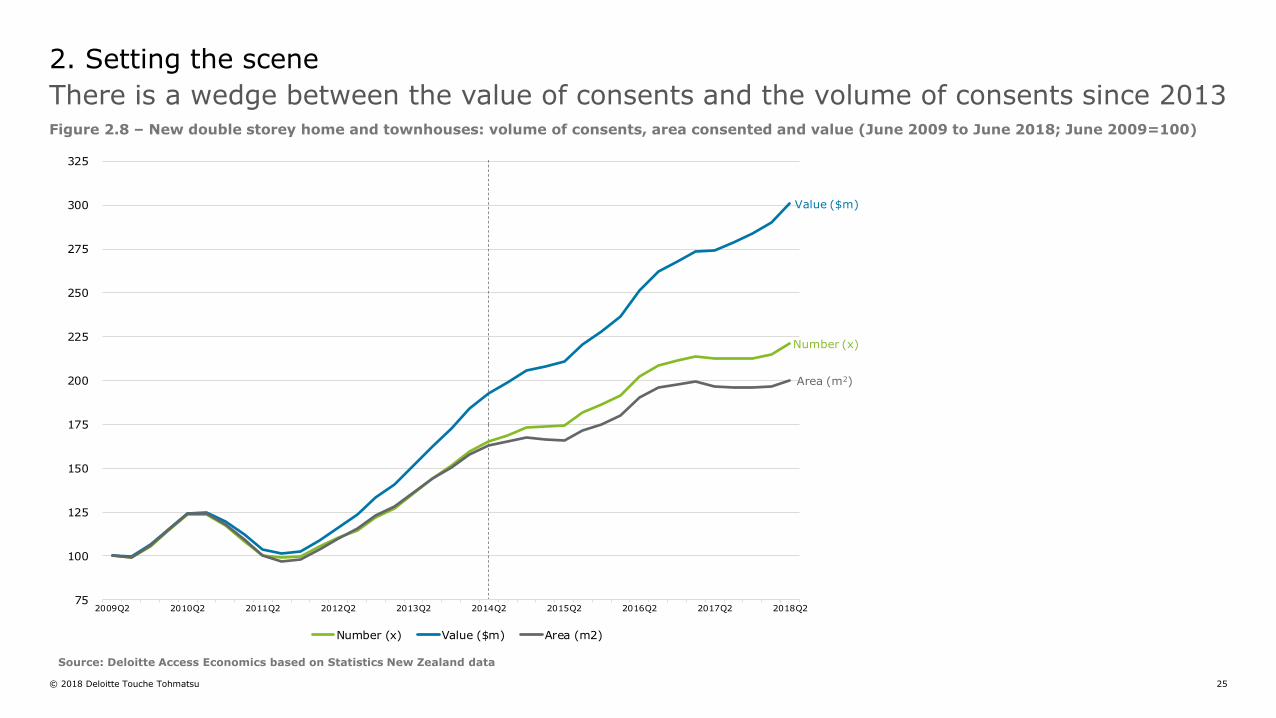
Analysis of consent data on the number of consents, floor area and value further shows a discrepancy between the volume of new residential work and the cost of the work. This is illustrated in Figure 2.8 on the next page of this report.
The value of house and townhouse consents has increased 12% between 2014 and 2018, while the number of consents has increased by 7% and the floor area by only 5% over this period. The divergence between thevolume (i.e. floor area) of new residential work completed in New Zealand and the value of consents is 6.5%.
Given that land is not included in the consent data, this divergence can be explained by:
• Inflation, which accounts for 1% change per annum between June 2014 and June 2018.
• As shown in Figure 2.3 building materials are increasing less than labour. Between June 2014 and June 2018, plasterboard, cement and concrete products increased by 7% and wood and timber by 14%.
• As shown in Chapter 3 of the report, regulatory costs and professional fees account for a small proportion of overall cost of residential development.
• Over the same period, labour rates for the construction sector lifted 7%. However, the cost of subcontracted trades, rather than wages, has risen significantly more over the last four years.
Cost of subcontracted trades has risen over the last four years
Deloitte Access Economics considered both the 2013 to 2018 and 2014 to 2018 time periods to demonstrate how the price changes for subcontracted trades contributed to the wedge between the value and volume of consents.
According to QV Cost builder, in 2014, the hourly charge rate of a plumber in Auckland was $58, rising to $67 in 2018, an increase of 15%. Over the same period, the hourly rate for electricians, plasterboard fixer and drain-layers also increased by 15% and painters, and reinforcing steel fixers’ hourly rates were up by 17%.
Based on QV data there was a significant jump between 2013 and 2014 in the cost of trades in Auckland. This is because the building boom was in full flow and a lot of workers were heading to Christchurch. As a result, Auckland was finding it hard to get labour, so the rates increased substantially to attract them. If this year is taken into account in the analysis, cost of trades increased by approximately 40% between 2013 and 2018.
Another factor contributing to higher costs of house building over this time is the introduction of the Health and Safety at Work Act 2015, which, for example, requires harnessing or scaffolding for work over 2.4 metres. According to WorkSafe New Zealand the costs for scaffolding hire is around $1,000-$2,500 for a double storey house. Deloitte Access Economics research found that this estimate is conservative and retail quotes are approximately $5,000.
This analysis suggests that the cost of subcontracted trades is another important driver of cost to build residential buildings.
2. Setting the scene
The higher cost of subcontracted trades, among other things, is pushing up the cost of new residential properties
© 2018 Deloitte Touche Tohmatsu 25
2. Setting the scene
There is a wedge between the value of consents and the volume of consents since 2013
Source: Deloitte Access Economics based on Statistics New Zealand data
Figure 2.8 – New double storey home and townhouses: volume of consents, area consented and value (June 2009 to June 2018; June 2009=100)
Number (x)
Value ($m)
Area (m2)
75
100
125
150
175
200
225
250
275
300
325
2009Q2 2010Q2 2011Q2 2012Q2 2013Q2 2014Q2 2015Q2 2016Q2 2017Q2 2018Q2
Number (x) Value ($m) Area (m2)
© 2018 Deloitte Touche Tohmatsu 26
2. Setting the scene
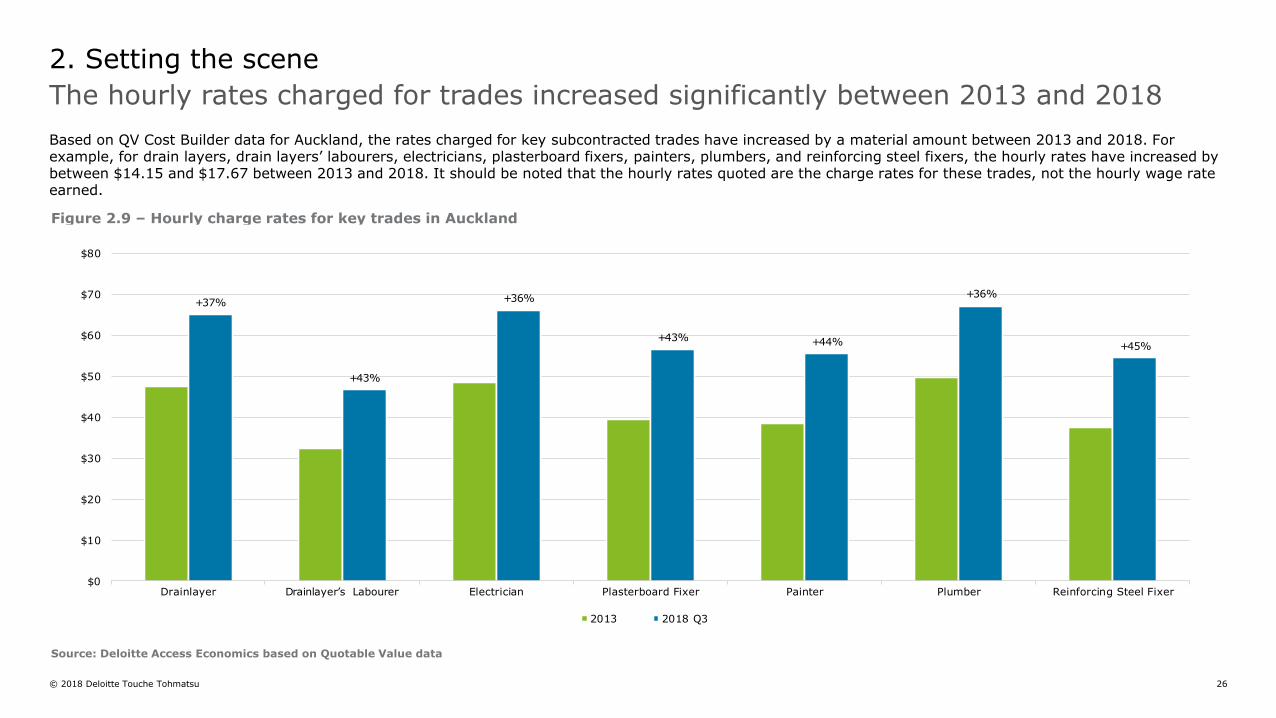
The hourly rates charged for trades increased significantly between 2013 and 2018
Based on QV Cost Builder data for Auckland, the rates charged for key subcontracted trades have increased by a material amount between 2013 and 2018. For example, for drain layers, drain layers’ labourers, electricians, plasterboard fixers, painters, plumbers, and reinforcing steel fixers, the hourly rates have increased by between $14.15 and $17.67 between 2013 and 2018. It should be noted that the hourly rates quoted are the charge rates for these trades, not the hourly wage rate earned.
Source: Deloitte Access Economics based on Quotable Value data
Figure 2.9 – Hourly charge rates for key trades in Auckland
+37%
+43%
+36%
+43% +44%
+36%
+45%
$0
$10
$20
$30
$40
$50
$60
$70
$80
Drainlayer Drainlayer’s Labourer Electrician Plasterboard Fixer Painter Plumber Reinforcing Steel Fixer
2013 2018 Q3
© 2018 Deloitte Touche Tohmatsu 27
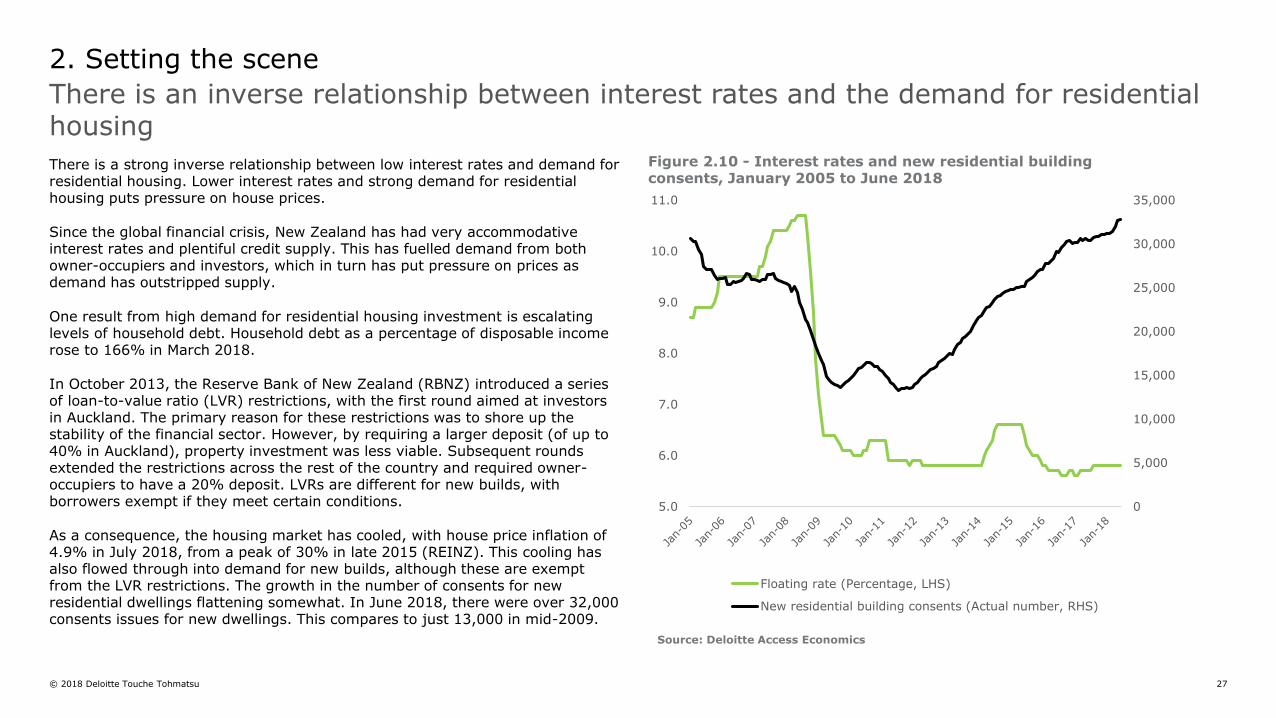
There is a strong inverse relationship between low interest rates and demand for residential housing. Lower interest rates and strong demand for residential housing puts pressure on house prices.
Since the global financial crisis, New Zealand has had very accommodative interest rates and plentiful credit supply. This has fuelled demand from both owner-occupiers and investors, which in turn has put pressure on prices as demand has outstripped supply.
One result from high demand for residential housing investment is escalating levels of household debt. Household debt as a percentage of disposable income rose to 166% in March 2018.
In October 2013, the Reserve Bank of New Zealand (RBNZ) introduced a series of loan-to-value ratio (LVR) restrictions, with the first round aimed at investors in Auckland. The primary reason for these restrictions was to shore up the stability of the financial sector. However, by requiring a larger deposit (of up to 40% in Auckland), property investment was less viable. Subsequent rounds extended the restrictions across the rest of the country and required owner-occupiers to have a 20% deposit. LVRs are different for new builds, with borrowers exempt if they meet certain conditions.
As a consequence, the housing market has cooled, with house price inflation of 4.9% in July 2018, from a peak of 30% in late 2015 (REINZ). This cooling has also flowed through into demand for new builds, although these are exempt from the LVR restrictions. The growth in the number of consents for new residential dwellings flattening somewhat. In June 2018, there were over 32,000 consents issues for new dwellings. This compares to just 13,000 in mid-2009.
There is an inverse relationship between interest rates and the demand for residential housing
2. Setting the scene
Source: Deloitte Access Economics
0
5,000
10,000
15,000
20,000
25,000
30,000
35,000
5.0
6.0
7.0
8.0
9.0
10.0
11.0
Floating rate (Percentage, LHS)
New residential building consents (Actual number, RHS)
Figure 2.10 - Interest rates and new residential building consents, January 2005 to June 2018
© 2018 Deloitte Touche Tohmatsu 28
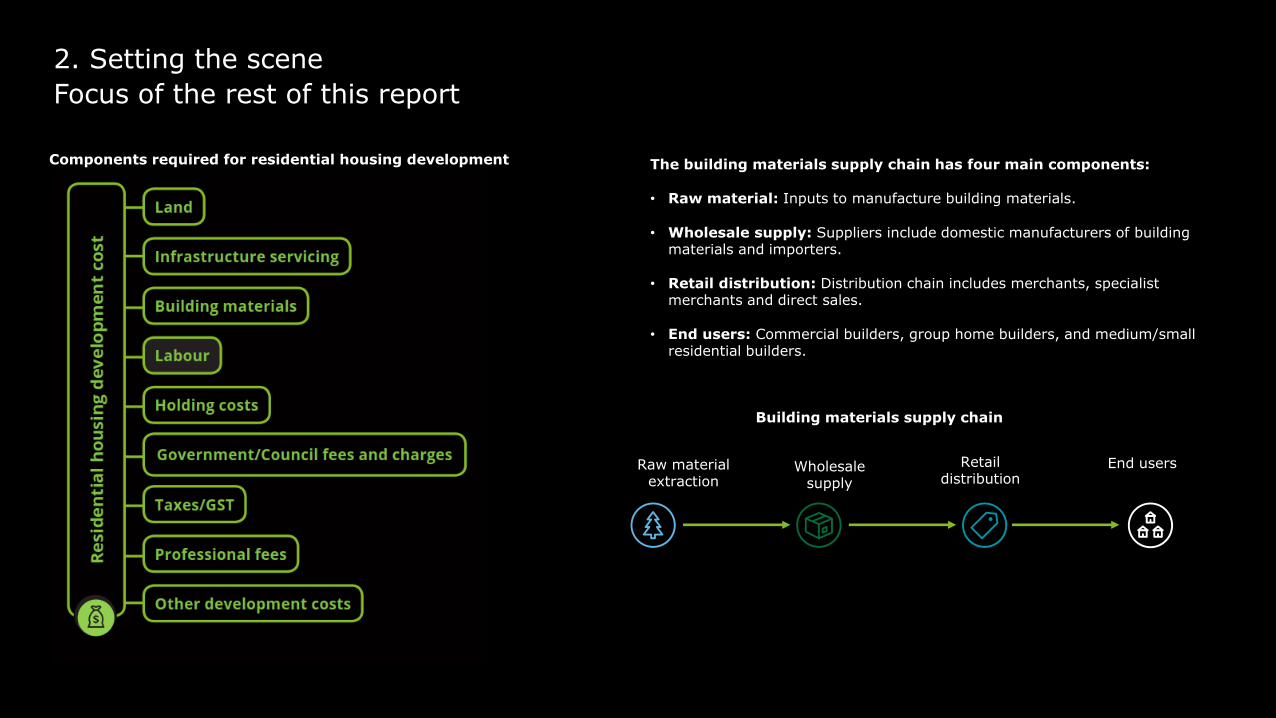
The building materials supply chain has four main components:
• Raw material: Inputs to manufacture building materials.
• Wholesale supply: Suppliers include domestic manufacturers of building materials and importers.
• Retail distribution: Distribution chain includes merchants, specialist merchants and direct sales.
• End users: Commercial builders, group home builders, and medium/small residential builders.
2. Setting the scene
Focus of the rest of this report
Raw material extraction
Wholesale supply
Retail distribution
End users
Building materials supply chain
Components required for residential housing development
© 2018 Deloitte Touche Tohmatsu 29
3. Contribution of key components to the cost of residential housing development –Four main typologies across five cities
© 2018 Deloitte Touche Tohmatsu 30
Components of residential housing development across five cities and four typologies
3. Contribution to residential housing development cost
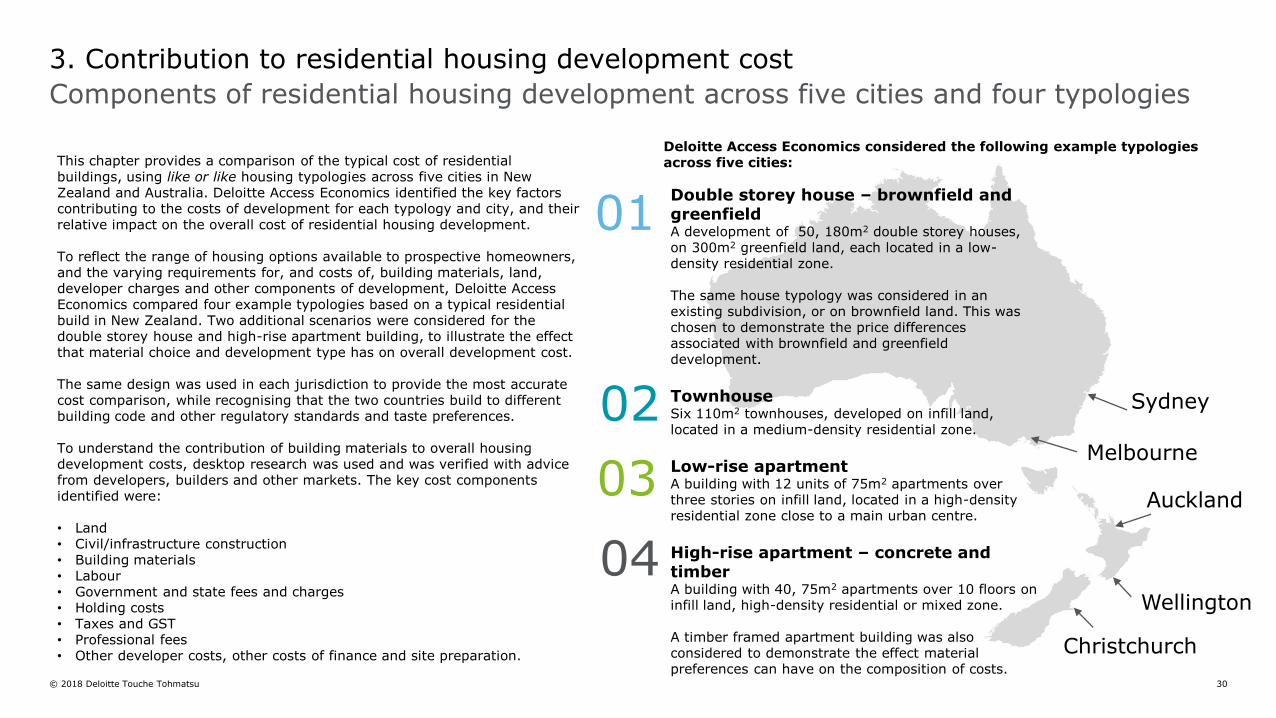
This chapter provides a comparison of the typical cost of residential buildings, using like or like housing typologies across five cities in New Zealand and Australia. Deloitte Access Economics identified the key factors contributing to the costs of development for each typology and city, and their relative impact on the overall cost of residential housing development.
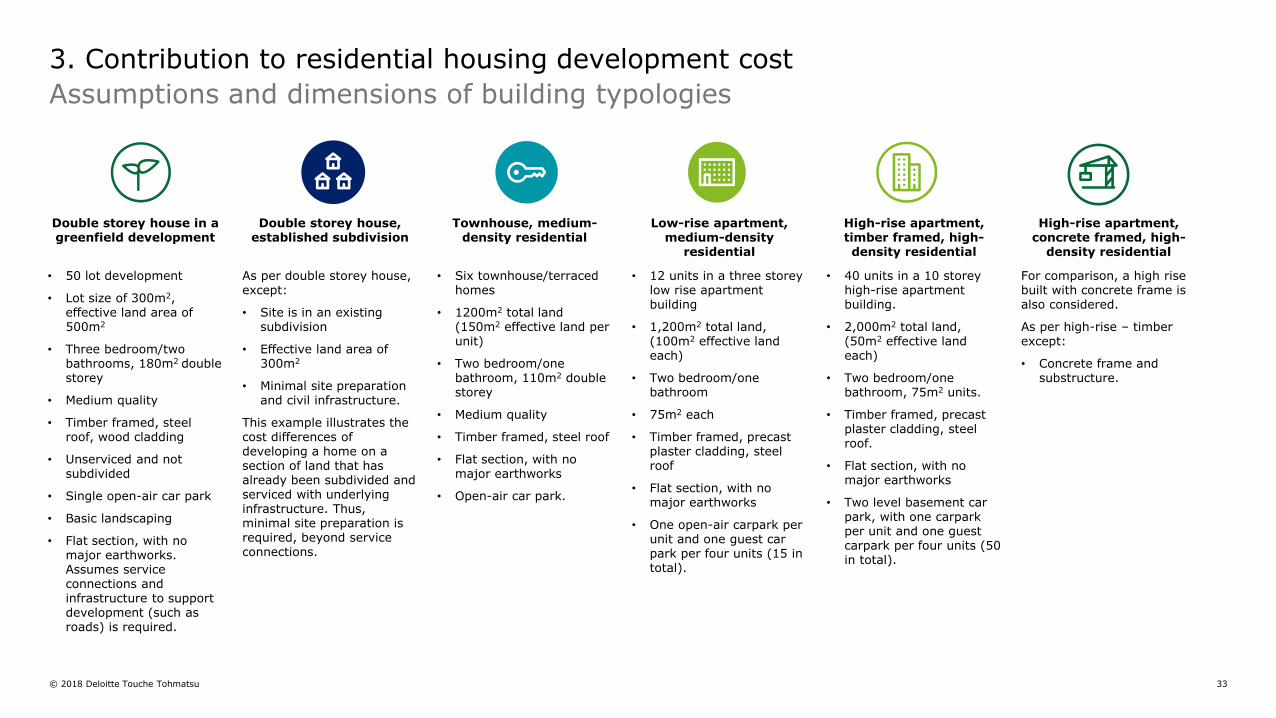
To reflect the range of housing options available to prospective homeowners, and the varying requirements for, and costs of, building materials, land, developer charges and other components of development, Deloitte Access Economics compared four example typologies based on a typical residential build in New Zealand. Two additional scenarios were considered for the double storey house and high-rise apartment building, to illustrate the effect that material choice and development type has on overall development cost.
The same design was used in each jurisdiction to provide the most accurate cost comparison, while recognising that the two countries build to different building code and other regulatory standards and taste preferences.
To understand the contribution of building materials to overall housing development costs, desktop research was used and was verified with advice from developers, builders and other markets. The key cost components identified were:
• Land• Civil/infrastructure construction • Building materials• Labour• Government and state fees and charges• Holding costs • Taxes and GST• Professional fees• Other developer costs, other costs of finance and site preparation.
Double storey house – brownfield and greenfieldA development of 50, 180m2 double storey houses, on 300m2 greenfield land, each located in a low-density residential zone.
The same house typology was considered in an existing subdivision, or on brownfield land. This was chosen to demonstrate the price differences associated with brownfield and greenfield development.
Townhouse Six 110m2 townhouses, developed on infill land, located in a medium-density residential zone.
Low-rise apartment A building with 12 units of 75m2 apartments over three stories on infill land, located in a high-density residential zone close to a main urban centre.
High-rise apartment – concrete and timberA building with 40, 75m2 apartments over 10 floors on infill land, high-density residential or mixed zone.
A timber framed apartment building was also considered to demonstrate the effect material preferences can have on the composition of costs.
01
02
03
04
Sydney
Melbourne
Auckland
Wellington
Christchurch
Deloitte Access Economics considered the following example typologies across five cities:
© 2018 Deloitte Touche Tohmatsu 31
Key cost components to the cost of residential housing development
3. Contribution to residential housing development cost
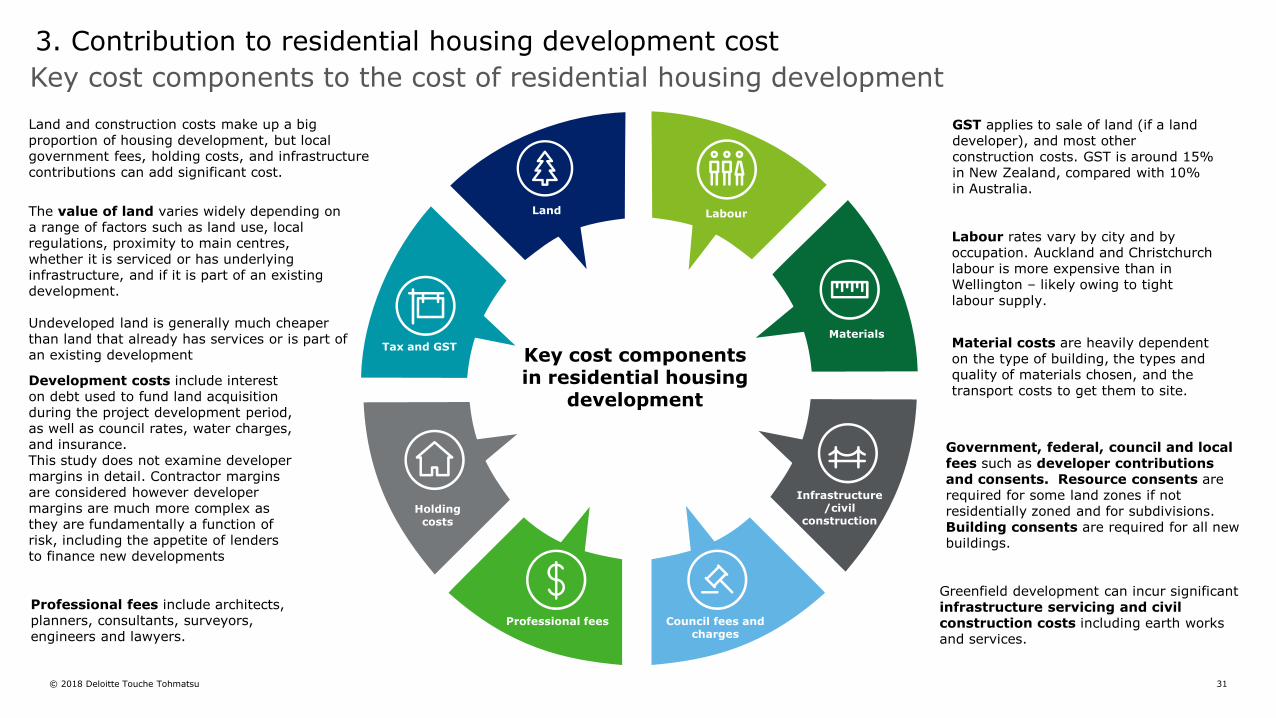
The value of land varies widely depending on a range of factors such as land use, local regulations, proximity to main centres, whether it is serviced or has underlying infrastructure, and if it is part of an existing development.
Undeveloped land is generally much cheaper than land that already has services or is part of an existing development Key cost components
in residential housing development
Land Labour
Materials
Infrastructure/civil
construction
Council fees and charges
Professional fees
Holding costs
Tax and GST
Development costs include interest on debt used to fund land acquisition during the project development period, as well as council rates, water charges, and insurance.This study does not examine developer margins in detail. Contractor margins are considered however developer margins are much more complex as they are fundamentally a function of risk, including the appetite of lenders to finance new developments
Land and construction costs make up a big proportion of housing development, but local government fees, holding costs, and infrastructure contributions can add significant cost.
Government, federal, council and local fees such as developer contributions and consents. Resource consents are required for some land zones if not residentially zoned and for subdivisions. Building consents are required for all new buildings.
Greenfield development can incur significant infrastructure servicing and civil construction costs including earth works and services.
GST applies to sale of land (if a land developer), and most other construction costs. GST is around 15% in New Zealand, compared with 10% in Australia.
Labour rates vary by city and by occupation. Auckland and Christchurch labour is more expensive than in Wellington – likely owing to tight labour supply.
Material costs are heavily dependent on the type of building, the types and quality of materials chosen, and the transport costs to get them to site.
Professional fees include architects, planners, consultants, surveyors, engineers and lawyers.
© 2018 Deloitte Touche Tohmatsu 32
Report methodology
3. Contribution to residential housing development cost
To assess the contribution of building materials to overall housing supply costs, Deloitte Access Economics used desktop research as well as advice from developers, builders and other market participants to report on the structure of overall costs of residential housing development in the chosen cities for New Zealand and Australia.
The approach to estimating the contribution of materials to overall cost of residential housing development was as follows.
1. Deloitte Access Economics developed definitions based on likely affordable housing options, such as smaller than average section and house size. The choice of materials within each house was based on the 2017 BRANZ New House Survey as well as through consultation with builders.
2. A material cost analysis was commissioned for each typology by a professional quantity surveyor from Emmitt Consulting.
3. Using the material and labour breakdown provided by the surveyors, desktop research, and advice from developers and market participants, Deloitte Access Economics assessed the other costs associated with the four types of developments in five comparable suburbs in Auckland, Wellington, Christchurch, Sydney and Melbourne.
The data contained within this report relies on a range of sources. Land data was sourced from public and subscription data (including QVNZ and REINZ) relating to recent sales in identified areas and was verified by conversations with land and building developers.
Construction and infrastructure costs were drawn from quantity surveyors, as well as QV Cost Builder New Zealand (QV Cost Builder) and the Rawlinsons Australian Construction Handbook (Rawlinsons). Australian construction costs were derived from international indices in Rawlinson's and applied to the quantity survey data. Other costs were from official Council and Government websites, in addition to conversations and consultation with industry players.
It is important to note that the figures in this report are not representative of all developments in New Zealand. Rather, the study aims to illustrate the key contributing costs to building new homes, based on practical examples, and in turn how these factors influence total development cost.
Land is a crucial element in the analysis of new home development. In order to consider a range of scenarios, Deloitte Access Economics considered greenfield, brownfield and infill developments. Brownfield and infill development are often used interchangeably.
The Ministry of Housing and Urban Development, established in October 2018, provides the following definitions to define and illustrates the difference between greenfield, brownfield and infill developments.
• Residential greenfield development land is land that has the ability to supply new, previously undeveloped sections onto the market.
• Brownfield development land is land with the ability to convert land that was used for industrial or commercial purposes to housing.
• Residential infill development is the creation of new dwelling opportunities through the use of spare land on existing residential sections.
It should be noted that, based on industry consultations, these definitions do not consider the importance of infrastructure cost. Modelling in this report explicitly includes infrastructure cost.
For brownfield development it is assumed that all infrastructure is available at the boundary of the property, and infrastructure cost is the connection and installation of infrastructure on the property. For greenfield development it is assumed that infrastructure cost includes installation of services and roads in the subdivision, which connects to existing bulk infrastructure outside of the subdivision.
For all developments, land is assumed to already be zoned residential. An important assumption made is that land is purchased at current market rates over the last one to two years. Land that was purchased more than two years ago, could have been purchased significantly cheaper.
© 2018 Deloitte Touche Tohmatsu 33
Double storey house in a greenfield development
Double storey house, established subdivision
Townhouse, medium-density residential
Low-rise apartment, medium-density
residential
High-rise apartment, timber framed, high-density residential
High-rise apartment, concrete framed, high-
density residential
• 50 lot development
• Lot size of 300m2, effective land area of 500m2
• Three bedroom/twobathrooms, 180m2 double storey
• Medium quality
• Timber framed, steel roof, wood cladding
• Unserviced and not subdivided
• Single open-air car park
• Basic landscaping
• Flat section, with no major earthworks. Assumes service connections and infrastructure to support development (such as roads) is required.
As per double storey house, except:
• Site is in an existing subdivision
• Effective land area of 300m2
• Minimal site preparation and civil infrastructure.
This example illustrates the cost differences of developing a home on a section of land that has already been subdivided and serviced with underlying infrastructure. Thus, minimal site preparation is required, beyond service connections.
• Six townhouse/terraced homes
• 1200m2 total land (150m2 effective land per unit)
• Two bedroom/one bathroom, 110m2 double storey
• Medium quality
• Timber framed, steel roof
• Flat section, with no major earthworks
• Open-air car park.
• 12 units in a three storey low rise apartment building
• 1,200m2 total land, (100m2 effective land each)
• Two bedroom/one bathroom
• 75m2 each
• Timber framed, precast plaster cladding, steel roof
• Flat section, with no major earthworks
• One open-air carpark per unit and one guest car park per four units (15 in total).
• 40 units in a 10 storey high-rise apartment building.
• 2,000m2 total land, (50m2 effective land each)
• Two bedroom/one bathroom, 75m2 units.
• Timber framed, precast plaster cladding, steel roof.
• Flat section, with no major earthworks
• Two level basement car park, with one carpark per unit and one guest carpark per four units (50 in total).
For comparison, a high rise built with concrete frame is also considered.
As per high-rise – timber except:
• Concrete frame and substructure.
Assumptions and dimensions of building typologies
3. Contribution to residential housing development cost
© 2018 Deloitte Touche Tohmatsu 34
Location criteria
3. Contribution to residential housing development cost
City Double storey house
Townhouse Low-rise apartment
High-rise apartment
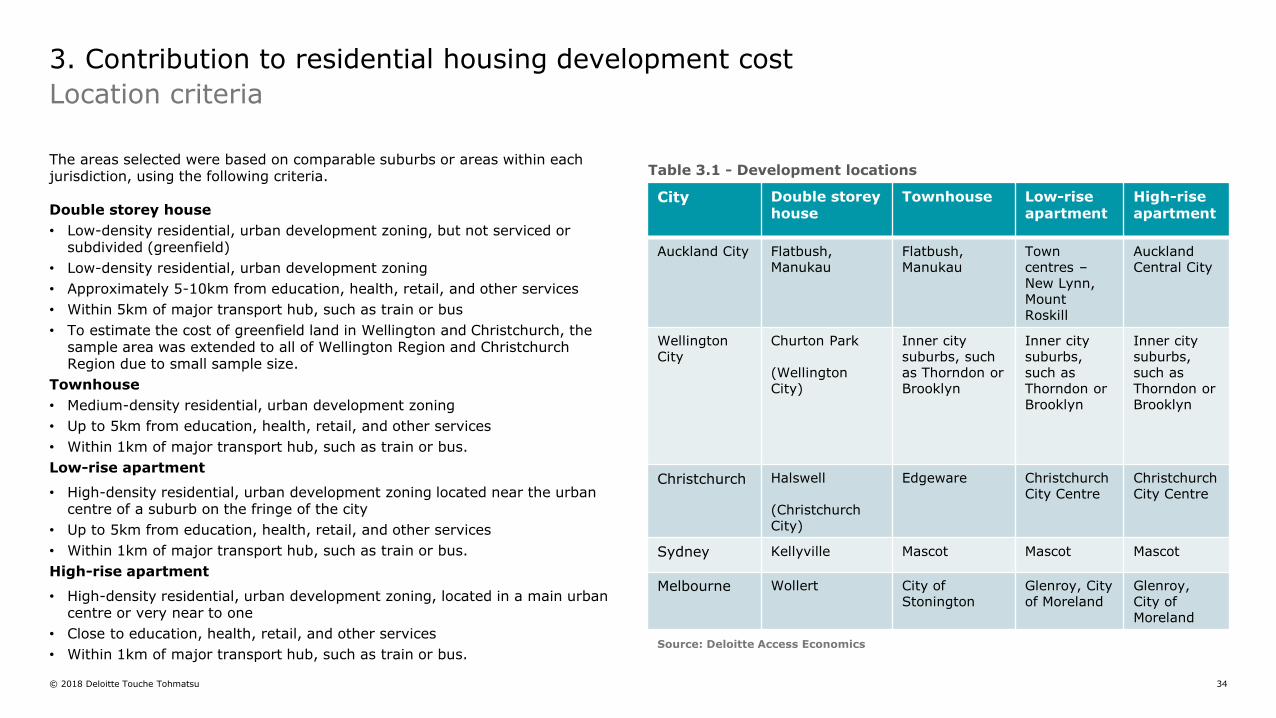
Auckland City Flatbush,Manukau
Flatbush,Manukau
Town centres –New Lynn, Mount Roskill
AucklandCentral City
Wellington City
Churton Park
(Wellington City)
Inner city suburbs, such as Thorndon or Brooklyn
Inner city suburbs, such as Thorndon or Brooklyn
Inner city suburbs, such as Thorndon or Brooklyn
Christchurch Halswell
(Christchurch City)
Edgeware Christchurch City Centre
Christchurch City Centre
Sydney Kellyville Mascot Mascot Mascot
Melbourne Wollert City of Stonington
Glenroy, City of Moreland
Glenroy, City of Moreland
The areas selected were based on comparable suburbs or areas within each jurisdiction, using the following criteria.
Double storey house
• Low-density residential, urban development zoning, but not serviced or subdivided (greenfield)
• Low-density residential, urban development zoning
• Approximately 5-10km from education, health, retail, and other services
• Within 5km of major transport hub, such as train or bus
• To estimate the cost of greenfield land in Wellington and Christchurch, the sample area was extended to all of Wellington Region and Christchurch Region due to small sample size.
Townhouse
• Medium-density residential, urban development zoning
• Up to 5km from education, health, retail, and other services
• Within 1km of major transport hub, such as train or bus.
Low-rise apartment
• High-density residential, urban development zoning located near the urban centre of a suburb on the fringe of the city
• Up to 5km from education, health, retail, and other services
• Within 1km of major transport hub, such as train or bus.
High-rise apartment
• High-density residential, urban development zoning, located in a main urban centre or very near to one
• Close to education, health, retail, and other services
• Within 1km of major transport hub, such as train or bus. Source: Deloitte Access Economics
Table 3.1 - Development locations
© 2018 Deloitte Touche Tohmatsu 35
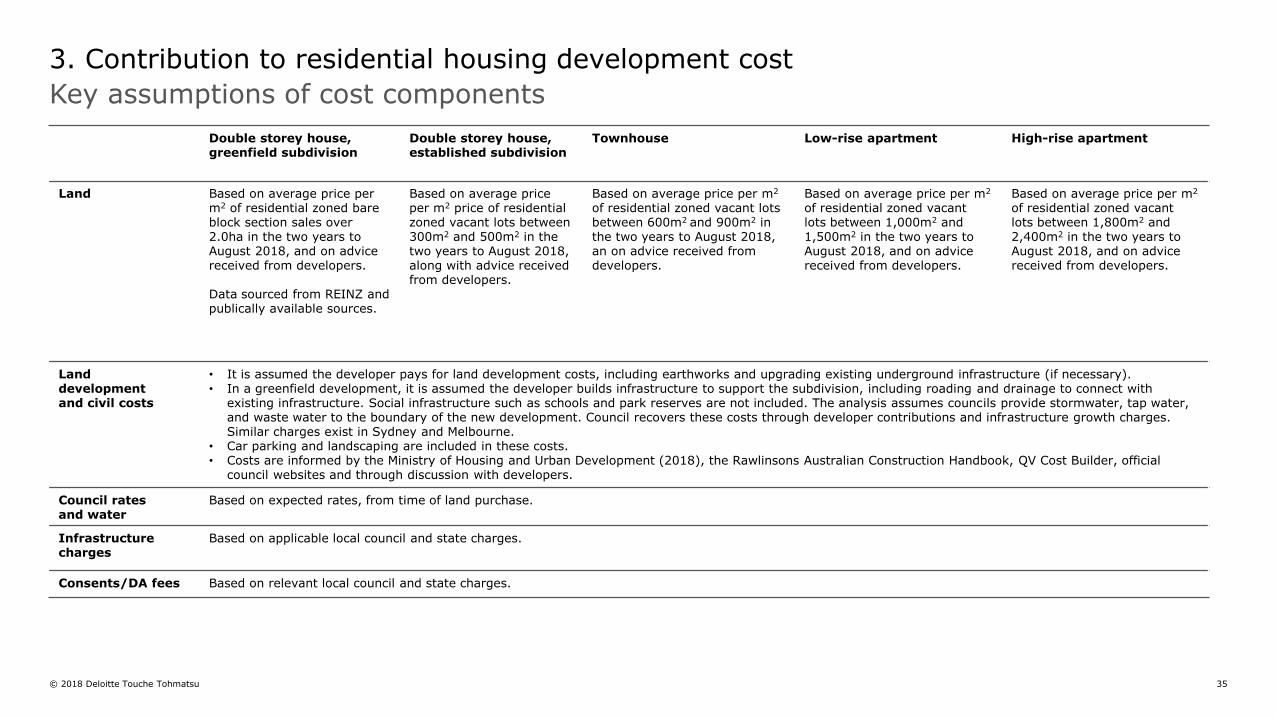
Key assumptions of cost components
3. Contribution to residential housing development cost
Double storey house, greenfield subdivision
Double storey house, established subdivision
Townhouse Low-rise apartment High-rise apartment
Land Based on average price per m2 of residential zoned bare block section sales over 2.0ha in the two years to August 2018, and on advice received from developers.
Data sourced from REINZ and publically available sources.
Based on average price per m2 price of residential zoned vacant lots between 300m2 and 500m2 in the two years to August 2018, along with advice received from developers.
Based on average price per m2
of residential zoned vacant lots between 600m2 and 900m2 in the two years to August 2018, an on advice received from developers.
Based on average price per m2
of residential zoned vacant lots between 1,000m2 and 1,500m2 in the two years to August 2018, and on advice received from developers.
Based on average price per m2
of residential zoned vacant lots between 1,800m2 and 2,400m2 in the two years to August 2018, and on advice received from developers.
Land developmentand civil costs
• It is assumed the developer pays for land development costs, including earthworks and upgrading existing underground infrastructure (if necessary). • In a greenfield development, it is assumed the developer builds infrastructure to support the subdivision, including roading and drainage to connect with
existing infrastructure. Social infrastructure such as schools and park reserves are not included. The analysis assumes councils provide stormwater, tap water, and waste water to the boundary of the new development. Council recovers these costs through developer contributions and infrastructure growth charges. Similar charges exist in Sydney and Melbourne.
• Car parking and landscaping are included in these costs. • Costs are informed by the Ministry of Housing and Urban Development (2018), the Rawlinsons Australian Construction Handbook, QV Cost Builder, official
council websites and through discussion with developers.
Council rates and water
Based on expected rates, from time of land purchase.
Infrastructurecharges
Based on applicable local council and state charges.
Consents/DA fees Based on relevant local council and state charges.
© 2018 Deloitte Touche Tohmatsu 36
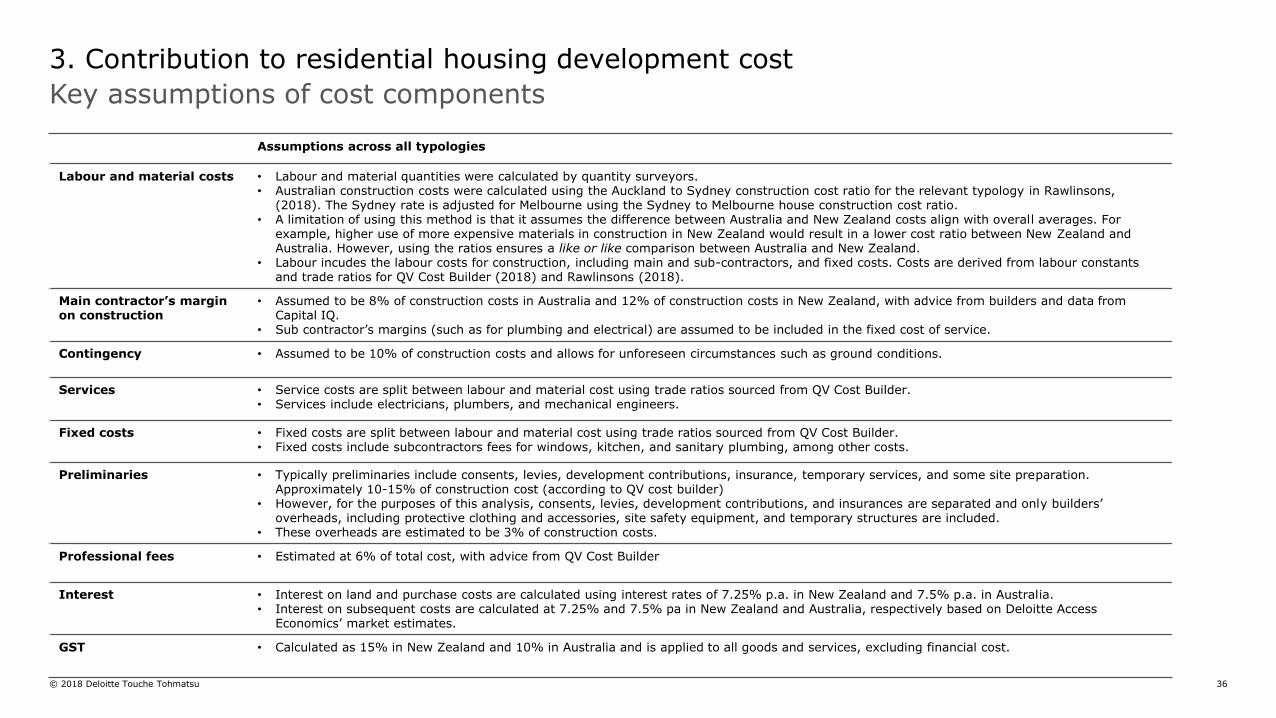
Assumptions across all typologies
Labour and material costs • Labour and material quantities were calculated by quantity surveyors.• Australian construction costs were calculated using the Auckland to Sydney construction cost ratio for the relevant typology in Rawlinsons,
(2018). The Sydney rate is adjusted for Melbourne using the Sydney to Melbourne house construction cost ratio. • A limitation of using this method is that it assumes the difference between Australia and New Zealand costs align with overall averages. For
example, higher use of more expensive materials in construction in New Zealand would result in a lower cost ratio between New Zealand and Australia. However, using the ratios ensures a like or like comparison between Australia and New Zealand.
• Labour incudes the labour costs for construction, including main and sub-contractors, and fixed costs. Costs are derived from labour constants and trade ratios for QV Cost Builder (2018) and Rawlinsons (2018).
Main contractor’s margin on construction
• Assumed to be 8% of construction costs in Australia and 12% of construction costs in New Zealand, with advice from builders and data from Capital IQ.
• Sub contractor’s margins (such as for plumbing and electrical) are assumed to be included in the fixed cost of service.
Contingency • Assumed to be 10% of construction costs and allows for unforeseen circumstances such as ground conditions.
Services • Service costs are split between labour and material cost using trade ratios sourced from QV Cost Builder. • Services include electricians, plumbers, and mechanical engineers.
Fixed costs • Fixed costs are split between labour and material cost using trade ratios sourced from QV Cost Builder. • Fixed costs include subcontractors fees for windows, kitchen, and sanitary plumbing, among other costs.
Preliminaries • Typically preliminaries include consents, levies, development contributions, insurance, temporary services, and some site preparation. Approximately 10-15% of construction cost (according to QV cost builder)
• However, for the purposes of this analysis, consents, levies, development contributions, and insurances are separated and only builders’ overheads, including protective clothing and accessories, site safety equipment, and temporary structures are included.
• These overheads are estimated to be 3% of construction costs.
Professional fees • Estimated at 6% of total cost, with advice from QV Cost Builder
Interest • Interest on land and purchase costs are calculated using interest rates of 7.25% p.a. in New Zealand and 7.5% p.a. in Australia.• Interest on subsequent costs are calculated at 7.25% and 7.5% pa in New Zealand and Australia, respectively based on Deloitte Access
Economics’ market estimates.
GST • Calculated as 15% in New Zealand and 10% in Australia and is applied to all goods and services, excluding financial cost.
3. Contribution to residential housing development cost
Key assumptions of cost components
© 2018 Deloitte Touche Tohmatsu 37
Land, building materials, GST and government fees are the largest contributors to residential housing development costs
3. Contribution to residential housing development cost
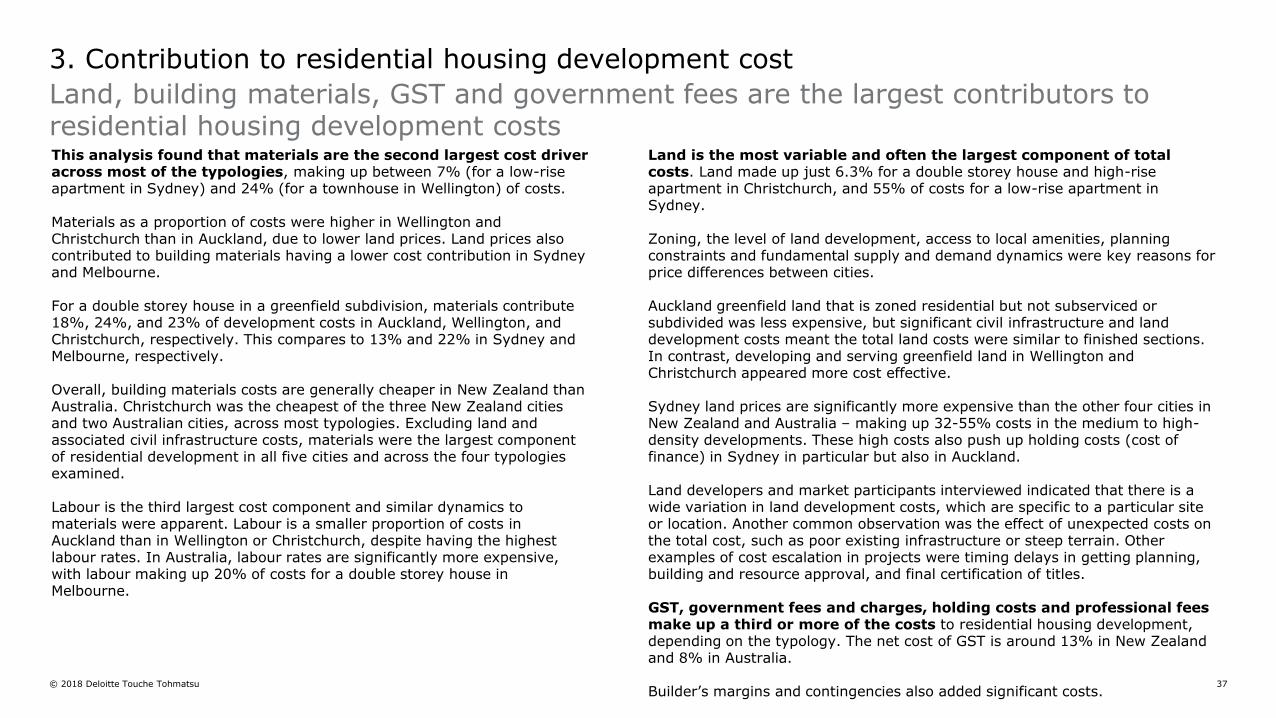
Land is the most variable and often the largest component of total costs. Land made up just 6.3% for a double storey house and high-rise apartment in Christchurch, and 55% of costs for a low-rise apartment in Sydney.
Zoning, the level of land development, access to local amenities, planning constraints and fundamental supply and demand dynamics were key reasons for price differences between cities.
Auckland greenfield land that is zoned residential but not subserviced or subdivided was less expensive, but significant civil infrastructure and land development costs meant the total land costs were similar to finished sections. In contrast, developing and serving greenfield land in Wellington and Christchurch appeared more cost effective.
Sydney land prices are significantly more expensive than the other four cities in New Zealand and Australia – making up 32-55% costs in the medium to high-density developments. These high costs also push up holding costs (cost of finance) in Sydney in particular but also in Auckland.
Land developers and market participants interviewed indicated that there is a wide variation in land development costs, which are specific to a particular site or location. Another common observation was the effect of unexpected costs on the total cost, such as poor existing infrastructure or steep terrain. Other examples of cost escalation in projects were timing delays in getting planning, building and resource approval, and final certification of titles.
GST, government fees and charges, holding costs and professional fees make up a third or more of the costs to residential housing development, depending on the typology. The net cost of GST is around 13% in New Zealand and 8% in Australia.
Builder’s margins and contingencies also added significant costs.
This analysis found that materials are the second largest cost driver across most of the typologies, making up between 7% (for a low-rise apartment in Sydney) and 24% (for a townhouse in Wellington) of costs.
Materials as a proportion of costs were higher in Wellington and Christchurch than in Auckland, due to lower land prices. Land prices also contributed to building materials having a lower cost contribution in Sydney and Melbourne.
For a double storey house in a greenfield subdivision, materials contribute 18%, 24%, and 23% of development costs in Auckland, Wellington, and Christchurch, respectively. This compares to 13% and 22% in Sydney and Melbourne, respectively.
Overall, building materials costs are generally cheaper in New Zealand than Australia. Christchurch was the cheapest of the three New Zealand cities and two Australian cities, across most typologies. Excluding land and associated civil infrastructure costs, materials were the largest component of residential development in all five cities and across the four typologies examined.
Labour is the third largest cost component and similar dynamics to materials were apparent. Labour is a smaller proportion of costs in Auckland than in Wellington or Christchurch, despite having the highest labour rates. In Australia, labour rates are significantly more expensive, with labour making up 20% of costs for a double storey house in Melbourne.
© 2018 Deloitte Touche Tohmatsu 38
Cost of new residential housing development is most expensive in Sydney and Auckland
3. Contribution to residential housing development cost
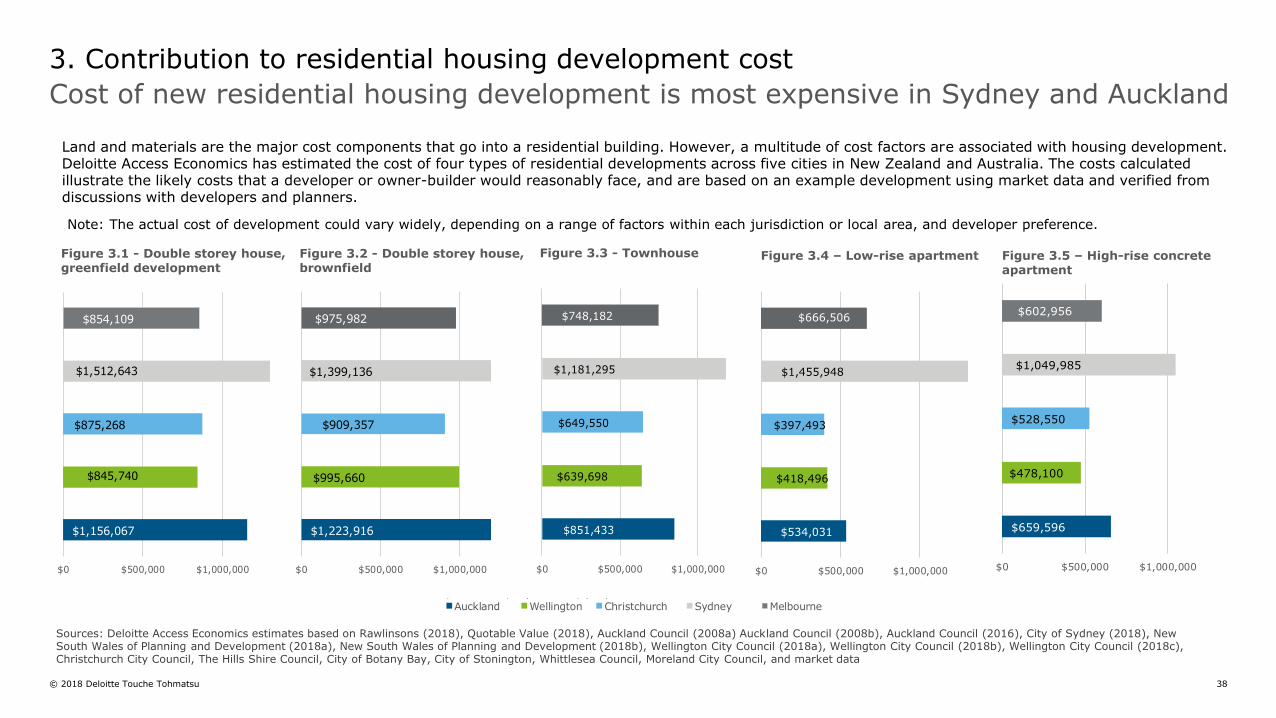
Land and materials are the major cost components that go into a residential building. However, a multitude of cost factors are associated with housing development. Deloitte Access Economics has estimated the cost of four types of residential developments across five cities in New Zealand and Australia. The costs calculated illustrate the likely costs that a developer or owner-builder would reasonably face, and are based on an example development using market data and verified from discussions with developers and planners.
Note: The actual cost of development could vary widely, depending on a range of factors within each jurisdiction or local area, and developer preference.
Sources: Deloitte Access Economics estimates based on Rawlinsons (2018), Quotable Value (2018), Auckland Council (2008a) Auckland Council (2008b), Auckland Council (2016), City of Sydney (2018), New South Wales of Planning and Development (2018a), New South Wales of Planning and Development (2018b), Wellington City Council (2018a), Wellington City Council (2018b), Wellington City Council (2018c), Christchurch City Council, The Hills Shire Council, City of Botany Bay, City of Stonington, Whittlesea Council, Moreland City Council, and market data
Figure 3.4 – Low-rise apartment
$534,031
$418,496
$397,493
$1,455,948
$666,506
$0 $500,000 $1,000,000
Figure 3.5 – High-rise concrete apartment
$659,596
$478,100
$528,550
$1,049,985
$602,956
$0 $500,000 $1,000,000
Figure 3.1 - Double storey house, greenfield development
$1,156,067
$845,740
$875,268
$1,512,643
$854,109
$0 $500,000 $1,000,000
Auckland Wellington Christchurch
Sydney Melbourne
Figure 3.2 - Double storey house, brownfield
$1,223,916
$995,660
$909,357
$1,399,136
$975,982
$0 $500,000 $1,000,000
Figure 3.3 - Townhouse
$851,433
$639,698
$649,550
$1,181,295
$748,182
$0 $500,000 $1,000,000
$1,156,067
$845,740
$875,268
$1,512,643
$854,109
$0 $500,000 $1,000,000
Auckland Wellington Christchurch
Sydney Melbourne
$1,156,067
$845,740
$875,268
$1,512,643
$854,109
$0 $500,000 $1,000,000
Auckland Wellington Christchurch
Sydney Melbourne
© 2018 Deloitte Touche Tohmatsu 39
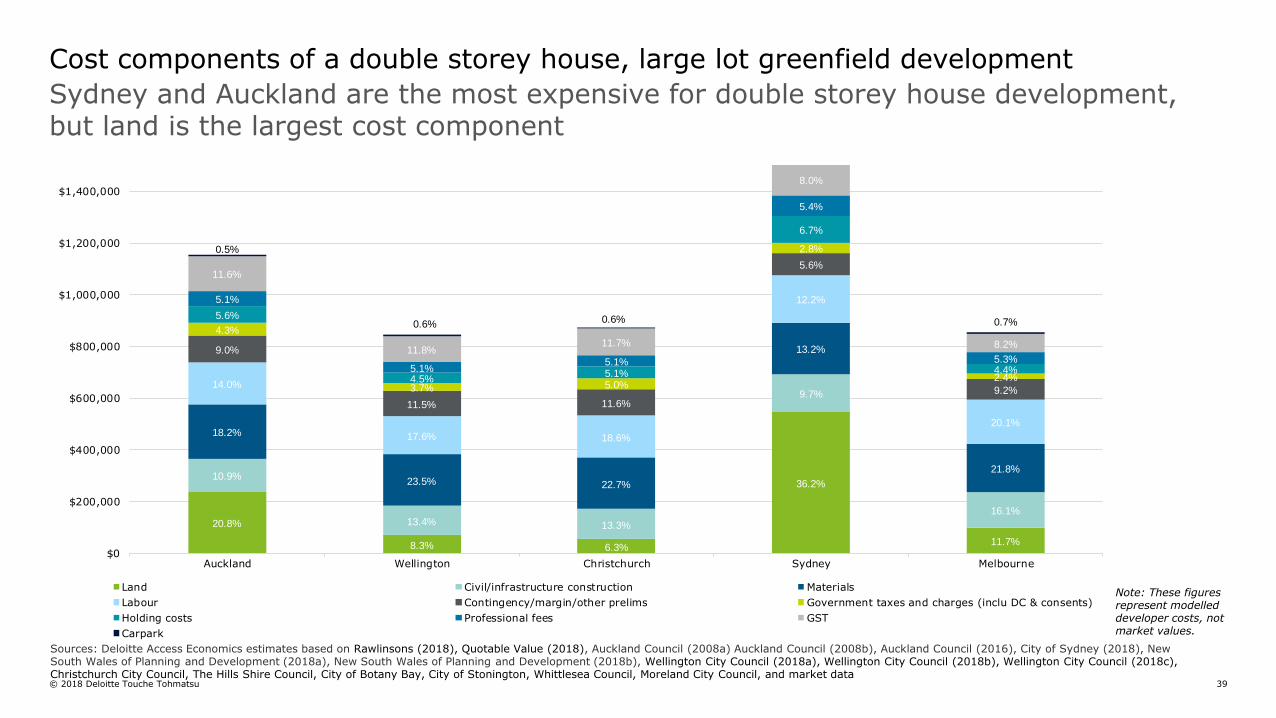
Sydney and Auckland are the most expensive for double storey house development, but land is the largest cost component
Cost components of a double storey house, large lot greenfield development
Sources: Deloitte Access Economics estimates based on Rawlinsons (2018), Quotable Value (2018), Auckland Council (2008a) Auckland Council (2008b), Auckland Council (2016), City of Sydney (2018), New South Wales of Planning and Development (2018a), New South Wales of Planning and Development (2018b), Wellington City Council (2018a), Wellington City Council (2018b), Wellington City Council (2018c), Christchurch City Council, The Hills Shire Council, City of Botany Bay, City of Stonington, Whittlesea Council, Moreland City Council, and market data
Note: These figures represent modelled developer costs, not market values.
20.8%
8.3% 6.3%
36.2%
11.7%
10.9%
13.4% 13.3%
9.7%
16.1%
18.2%
23.5% 22.7%
13.2%
21.8%
14.0%
17.6% 18.6%
12.2%
20.1%
9.0%
11.5% 11.6%
5.6%
9.2%
4.3%
3.7% 5.0%
2.8%
2.4%
5.6%
4.5%5.1%
6.7%
4.4%
5.1%
5.1%5.1%
5.4%
5.3%
11.6%
11.8%11.7%
8.0%
8.2%
0.5%
0.6% 0.6% 0.7%
$0
$200,000
$400,000
$600,000
$800,000
$1,000,000
$1,200,000
$1,400,000
Auckland Wellington Christchurch Sydney Melbourne
Land Civil/infrastructure construction Materials
Labour Contingency/margin/other prelims Government taxes and charges (inclu DC & consents)
Holding costs Professional fees GST
Carpark
© 2018 Deloitte Touche Tohmatsu 40
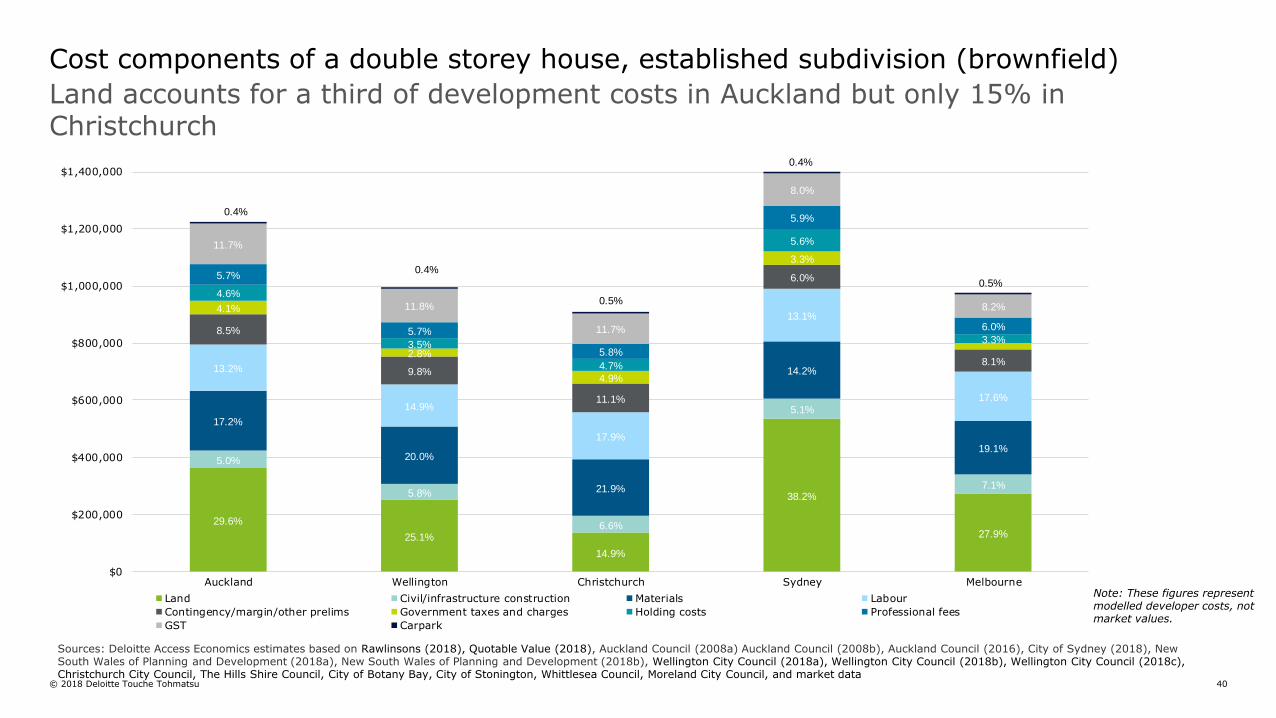
Land accounts for a third of development costs in Auckland but only 15% in Christchurch
Cost components of a double storey house, established subdivision (brownfield)
Sources: Deloitte Access Economics estimates based on Rawlinsons (2018), Quotable Value (2018), Auckland Council (2008a) Auckland Council (2008b), Auckland Council (2016), City of Sydney (2018), New South Wales of Planning and Development (2018a), New South Wales of Planning and Development (2018b), Wellington City Council (2018a), Wellington City Council (2018b), Wellington City Council (2018c), Christchurch City Council, The Hills Shire Council, City of Botany Bay, City of Stonington, Whittlesea Council, Moreland City Council, and market data
Note: These figures represent modelled developer costs, not market values.
29.6%
25.1%
14.9%
38.2%
27.9%
5.0%
5.8%
6.6%
5.1%
7.1%
17.2%
20.0%
21.9%
14.2%
19.1%
13.2%
14.9%
17.9%
13.1%
17.6%
8.5%
9.8%
11.1%
6.0%
8.1%
4.1%
2.8%
4.9%
3.3%
4.6%
3.5%
4.7%
5.6%
3.3%
5.7%
5.7%
5.8%
5.9%
6.0%
11.7%
11.8%
11.7%
8.0%
8.2%
0.4%
0.4%
0.5%
0.4%
0.5%
$0
$200,000
$400,000
$600,000
$800,000
$1,000,000
$1,200,000
$1,400,000
Auckland Wellington Christchurch Sydney Melbourne
Land Civil/infrastructure construction Materials Labour
Contingency/margin/other prelims Government taxes and charges Holding costs Professional fees
GST Carpark
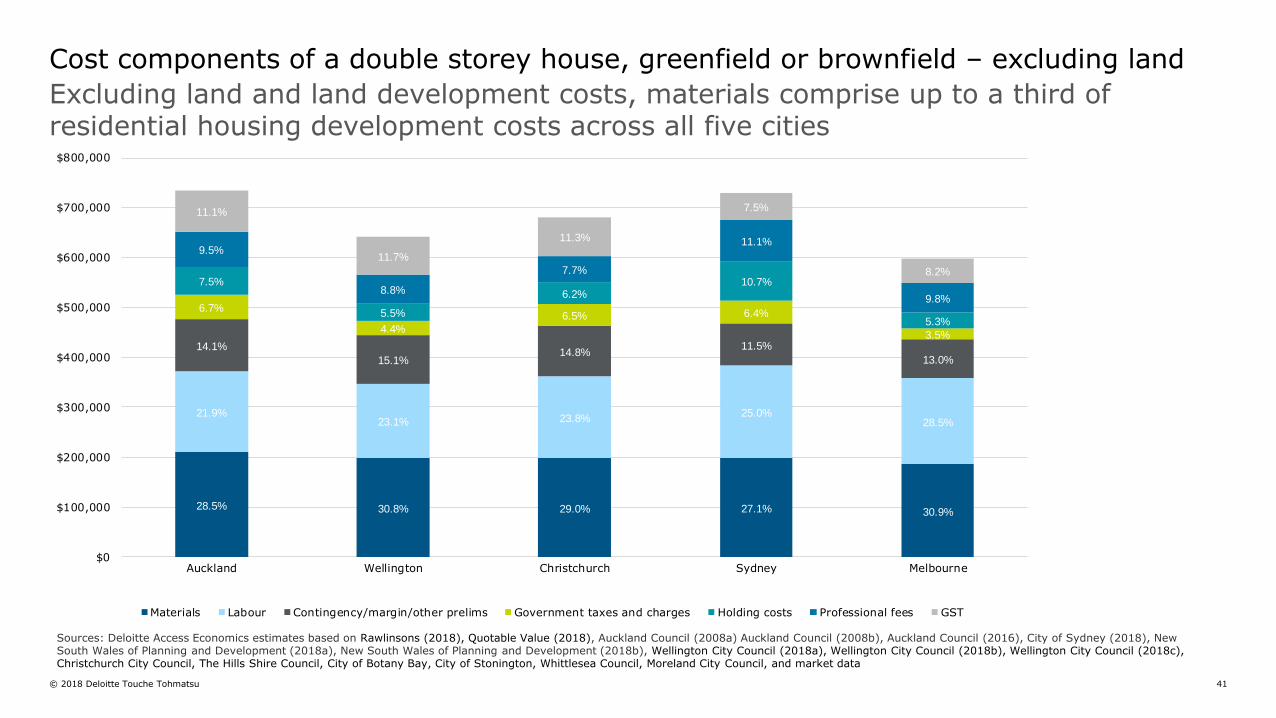
© 2018 Deloitte Touche Tohmatsu 41
Cost components of a double storey house, greenfield or brownfield – excluding land
Sources: Deloitte Access Economics estimates based on Rawlinsons (2018), Quotable Value (2018), Auckland Council (2008a) Auckland Council (2008b), Auckland Council (2016), City of Sydney (2018), New South Wales of Planning and Development (2018a), New South Wales of Planning and Development (2018b), Wellington City Council (2018a), Wellington City Council (2018b), Wellington City Council (2018c), Christchurch City Council, The Hills Shire Council, City of Botany Bay, City of Stonington, Whittlesea Council, Moreland City Council, and market data
Excluding land and land development costs, materials comprise up to a third of residential housing development costs across all five cities
28.5% 30.8% 29.0% 27.1% 30.9%
21.9%23.1% 23.8%
25.0%28.5%
14.1%
15.1%14.8%
11.5%
13.0%
6.7%
4.4%
6.5% 6.4%
3.5%
7.5%
5.5%
6.2%10.7%
5.3%
9.5%
8.8%
7.7%
11.1%
9.8%
11.1%
11.7%
11.3%
7.5%
8.2%
$0
$100,000
$200,000
$300,000
$400,000
$500,000
$600,000
$700,000
$800,000
Auckland Wellington Christchurch Sydney Melbourne
Materials Labour Contingency/margin/other prelims Government taxes and charges Holding costs Professional fees GST
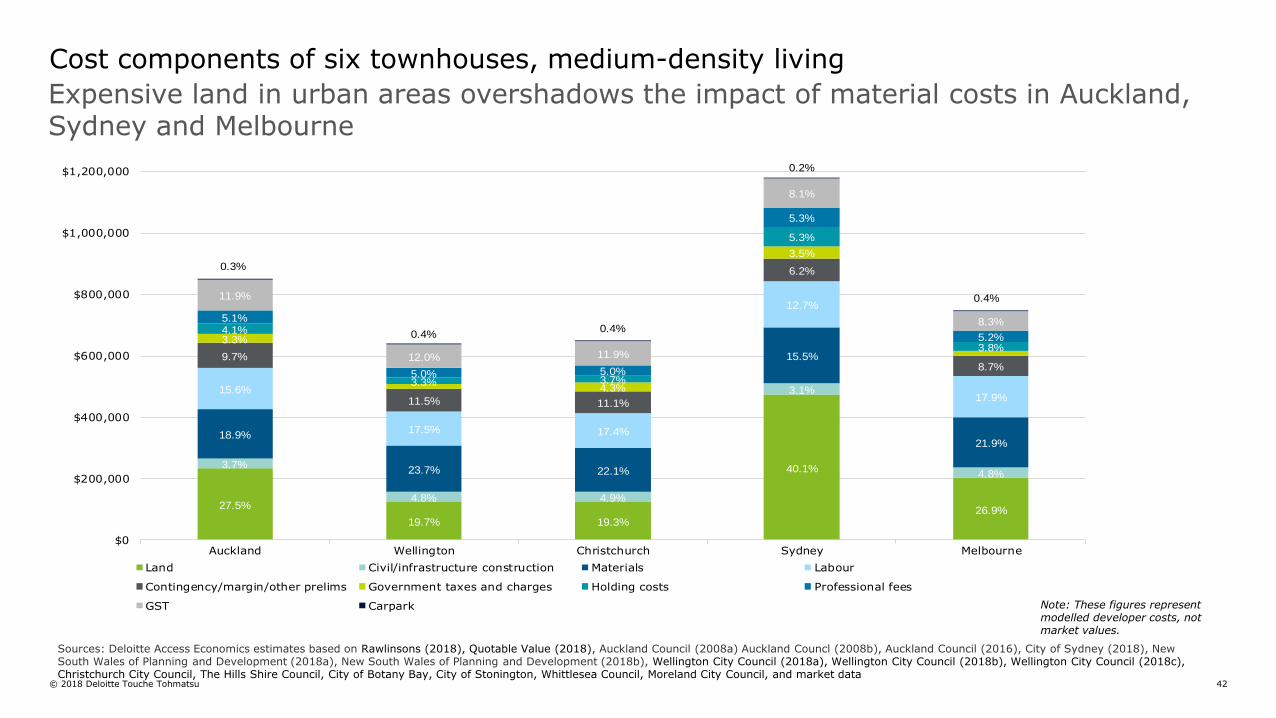
© 2018 Deloitte Touche Tohmatsu 42
Expensive land in urban areas overshadows the impact of material costs in Auckland, Sydney and Melbourne
Cost components of six townhouses, medium-density living
Sources: Deloitte Access Economics estimates based on Rawlinsons (2018), Quotable Value (2018), Auckland Council (2008a) Auckland Councl (2008b), Auckland Council (2016), City of Sydney (2018), New South Wales of Planning and Development (2018a), New South Wales of Planning and Development (2018b), Wellington City Council (2018a), Wellington City Council (2018b), Wellington City Council (2018c), Christchurch City Council, The Hills Shire Council, City of Botany Bay, City of Stonington, Whittlesea Council, Moreland City Council, and market data
27.5%
19.7% 19.3%
40.1%
26.9%
3.7%
4.8% 4.9%
3.1%
4.8%
18.9%
23.7% 22.1%
15.5%
21.9%
15.6%
17.5% 17.4%
12.7%
17.9%
9.7%
11.5% 11.1%
6.2%
8.7%
3.3%
4.3%
3.5%
4.1%
3.3% 3.7%
5.3%
3.8%
5.1%
5.0% 5.0%
5.3%
5.2%
11.9%
12.0% 11.9%
8.1%
8.3%
0.3%
0.4%0.4%
0.2%
0.4%
$0
$200,000
$400,000
$600,000
$800,000
$1,000,000
$1,200,000
Auckland Wellington Christchurch Sydney Melbourne
Land Civil/infrastructure construction Materials Labour
Contingency/margin/other prelims Government taxes and charges Holding costs Professional fees
GST Carpark Note: These figures represent modelled developer costs, not market values.
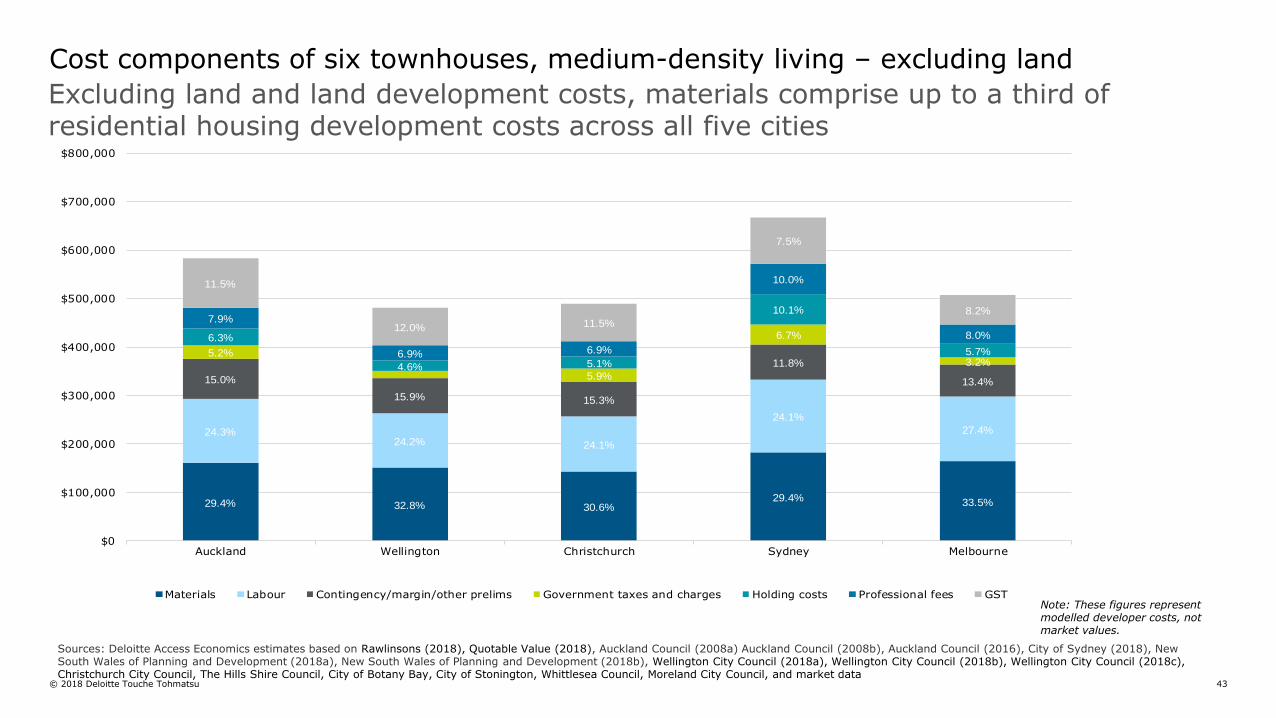
© 2018 Deloitte Touche Tohmatsu 43
Excluding land and land development costs, materials comprise up to a third of residential housing development costs across all five cities
Cost components of six townhouses, medium-density living – excluding land
Sources: Deloitte Access Economics estimates based on Rawlinsons (2018), Quotable Value (2018), Auckland Council (2008a) Auckland Council (2008b), Auckland Council (2016), City of Sydney (2018), New South Wales of Planning and Development (2018a), New South Wales of Planning and Development (2018b), Wellington City Council (2018a), Wellington City Council (2018b), Wellington City Council (2018c), Christchurch City Council, The Hills Shire Council, City of Botany Bay, City of Stonington, Whittlesea Council, Moreland City Council, and market data
Note: These figures represent modelled developer costs, not market values.
29.4% 32.8% 30.6%29.4% 33.5%
24.3%24.2% 24.1%
24.1%
27.4%
15.0%
15.9% 15.3%
11.8%
13.4%
5.2%
5.9%
6.7%
3.2%
6.3%
4.6% 5.1%
10.1%
5.7%
7.9%
6.9% 6.9%
10.0%
8.0%
11.5%
12.0% 11.5%
7.5%
8.2%
$0
$100,000
$200,000
$300,000
$400,000
$500,000
$600,000
$700,000
$800,000
Auckland Wellington Christchurch Sydney Melbourne
Materials Labour Contingency/margin/other prelims Government taxes and charges Holding costs Professional fees GST
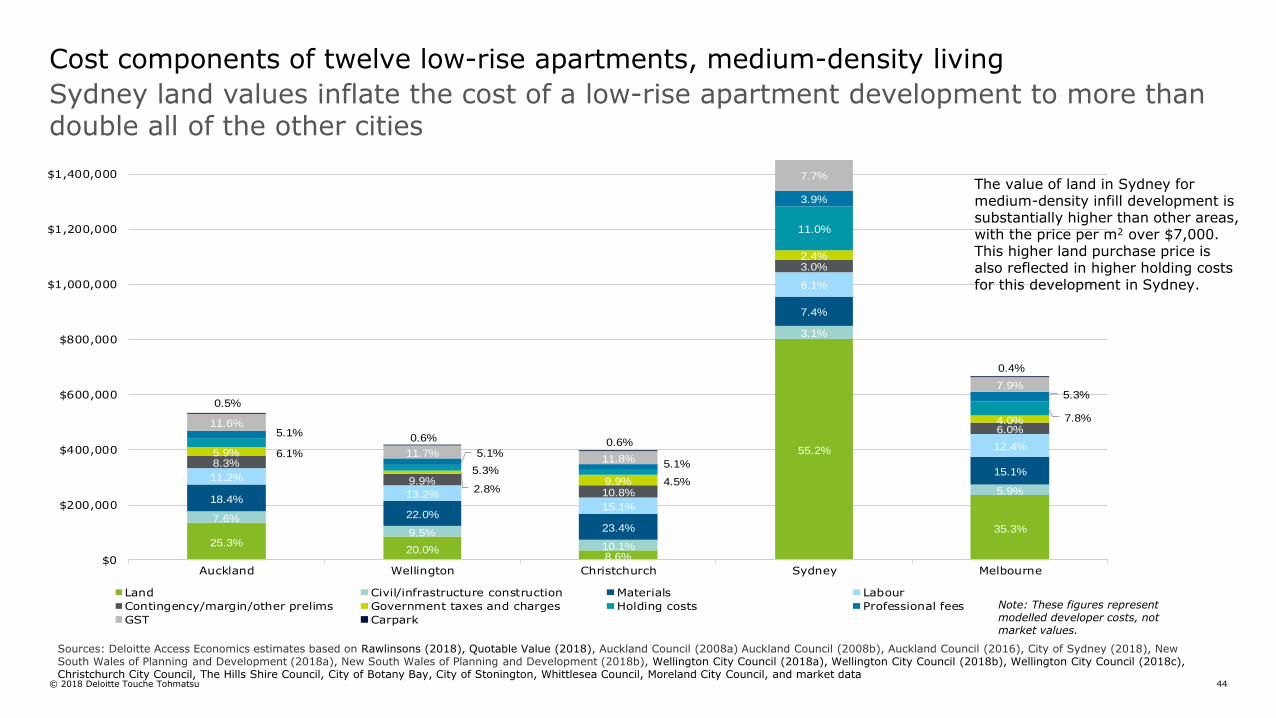
© 2018 Deloitte Touche Tohmatsu 44
25.3%20.0%
8.6%
55.2%
35.3%7.6%
9.5%
10.1%
3.1%
5.9%18.4%
22.0%
23.4%
7.4%
15.1%11.2%
13.2%
15.1%
6.1%
12.4%
8.3%
9.9%10.8%
3.0%
6.0%
5.9%
2.8%9.9%
2.4%
4.0%
6.1%
5.3%4.5%
11.0%
7.8%
5.1%
5.1%5.1%
3.9%
5.3%
11.6%
11.7%11.8%
7.7%
7.9%
0.5%
0.6% 0.6%
0.4%
$0
$200,000
$400,000
$600,000
$800,000
$1,000,000
$1,200,000
$1,400,000
Auckland Wellington Christchurch Sydney Melbourne
Land Civil/infrastructure construction Materials Labour
Contingency/margin/other prelims Government taxes and charges Holding costs Professional fees
GST Carpark
Sydney land values inflate the cost of a low-rise apartment development to more than double all of the other cities
Cost components of twelve low-rise apartments, medium-density living
The value of land in Sydney for medium-density infill development is substantially higher than other areas, with the price per m2 over $7,000. This higher land purchase price is also reflected in higher holding costs for this development in Sydney.
Sources: Deloitte Access Economics estimates based on Rawlinsons (2018), Quotable Value (2018), Auckland Council (2008a) Auckland Council (2008b), Auckland Council (2016), City of Sydney (2018), New South Wales of Planning and Development (2018a), New South Wales of Planning and Development (2018b), Wellington City Council (2018a), Wellington City Council (2018b), Wellington City Council (2018c), Christchurch City Council, The Hills Shire Council, City of Botany Bay, City of Stonington, Whittlesea Council, Moreland City Council, and market data
Note: These figures represent modelled developer costs, not market values.
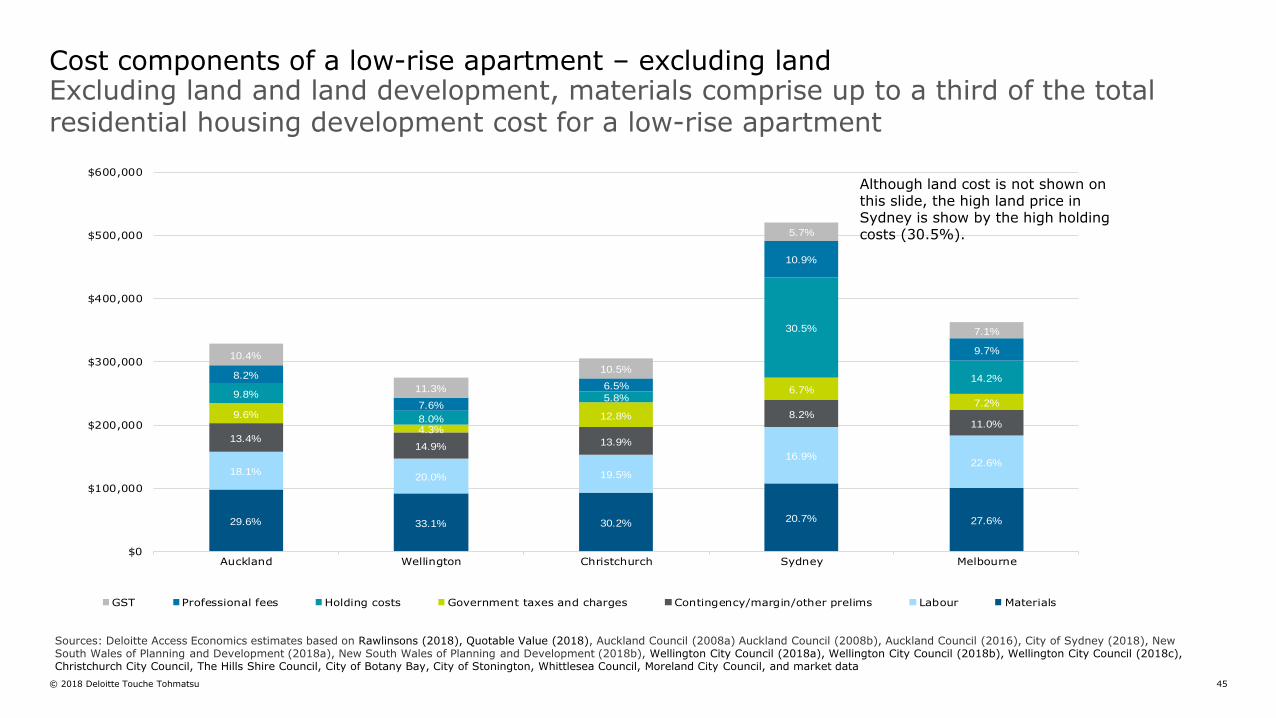
© 2018 Deloitte Touche Tohmatsu 45
Cost components of a low-rise apartment – excluding land
Sources: Deloitte Access Economics estimates based on Rawlinsons (2018), Quotable Value (2018), Auckland Council (2008a) Auckland Council (2008b), Auckland Council (2016), City of Sydney (2018), New South Wales of Planning and Development (2018a), New South Wales of Planning and Development (2018b), Wellington City Council (2018a), Wellington City Council (2018b), Wellington City Council (2018c), Christchurch City Council, The Hills Shire Council, City of Botany Bay, City of Stonington, Whittlesea Council, Moreland City Council, and market data
Excluding land and land development, materials comprise up to a third of the total residential housing development cost for a low-rise apartment
29.6% 33.1% 30.2%20.7% 27.6%
18.1%20.0% 19.5%
16.9%22.6%
13.4%14.9% 13.9%
8.2%11.0%
9.6%
4.3%
12.8%
6.7%
7.2%9.8%
8.0%
5.8%
30.5%
14.2%8.2%
7.6%
6.5%
10.9%
9.7%10.4%
11.3%
10.5%
5.7%
7.1%
$0
$100,000
$200,000
$300,000
$400,000
$500,000
$600,000
Auckland Wellington Christchurch Sydney Melbourne
GST Professional fees Holding costs Government taxes and charges Contingency/margin/other prelims Labour Materials
Although land cost is not shown on this slide, the high land price in Sydney is show by the high holding costs (30.5%).
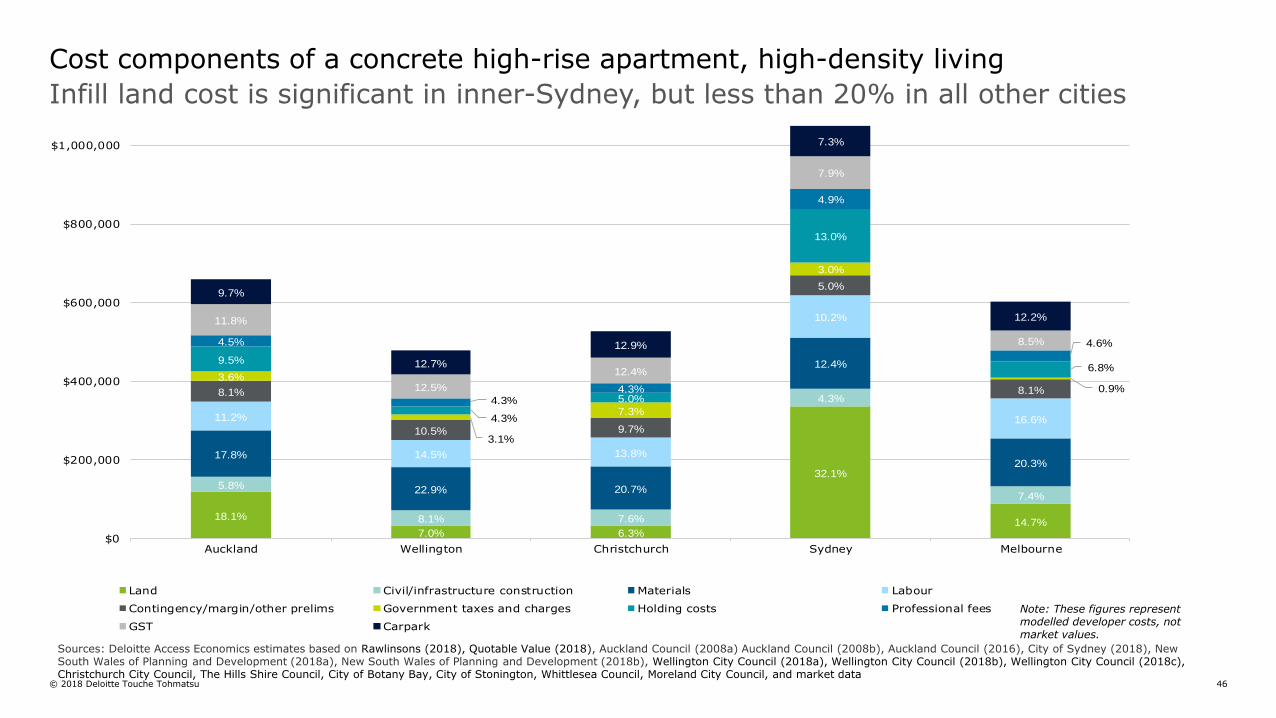
© 2018 Deloitte Touche Tohmatsu 46
18.1%
7.0% 6.3%
32.1%
14.7%
5.8%
8.1% 7.6%
4.3%
7.4%
17.8%
22.9% 20.7%
12.4%
20.3%
11.2%
14.5% 13.8%
10.2%
16.6%
8.1%
10.5% 9.7%
5.0%
8.1%
3.6%
3.1%
7.3%
3.0%
0.9%
9.5%
4.3%
5.0%
13.0%
6.8%
4.5%
4.3%4.3%
4.9%
4.6%
11.8%
12.5%
12.4%
7.9%
8.5%
9.7%
12.7%
12.9%
7.3%
12.2%
$0
$200,000
$400,000
$600,000
$800,000
$1,000,000
Auckland Wellington Christchurch Sydney Melbourne
Land Civil/infrastructure construction Materials Labour
Contingency/margin/other prelims Government taxes and charges Holding costs Professional fees
GST Carpark
Infill land cost is significant in inner-Sydney, but less than 20% in all other cities
Cost components of a concrete high-rise apartment, high-density living
Sources: Deloitte Access Economics estimates based on Rawlinsons (2018), Quotable Value (2018), Auckland Council (2008a) Auckland Council (2008b), Auckland Council (2016), City of Sydney (2018), New South Wales of Planning and Development (2018a), New South Wales of Planning and Development (2018b), Wellington City Council (2018a), Wellington City Council (2018b), Wellington City Council (2018c), Christchurch City Council, The Hills Shire Council, City of Botany Bay, City of Stonington, Whittlesea Council, Moreland City Council, and market data
Note: These figures represent modelled developer costs, not market values.
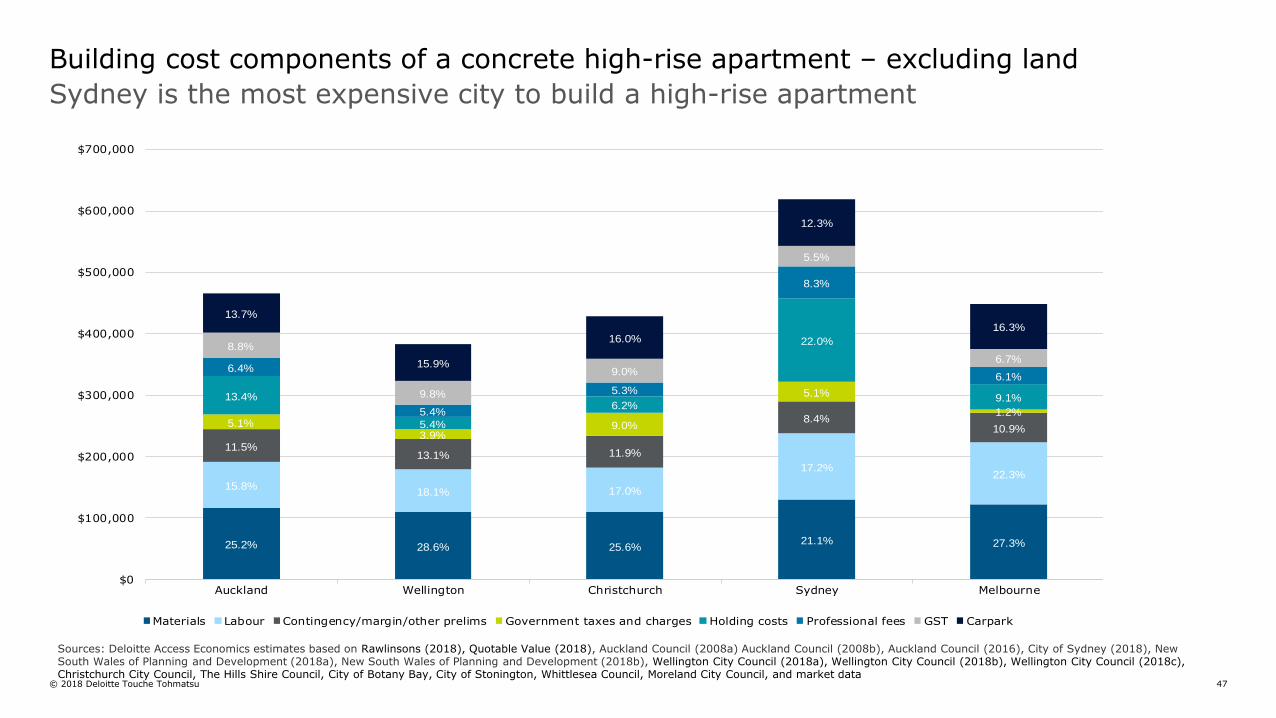
© 2018 Deloitte Touche Tohmatsu 47
Building cost components of a concrete high-rise apartment – excluding land
25.2% 28.6% 25.6%21.1% 27.3%
15.8%18.1% 17.0%
17.2%22.3%
11.5%13.1% 11.9%
8.4%10.9%
5.1%3.9%
9.0%
5.1%
1.2%
13.4%
5.4%
6.2%
22.0%
9.1%
6.4%
5.4%
5.3%
8.3%
6.1%
8.8%
9.8%
9.0%
5.5%
6.7%
13.7%
15.9%
16.0%
12.3%
16.3%
$0
$100,000
$200,000
$300,000
$400,000
$500,000
$600,000
$700,000
Auckland Wellington Christchurch Sydney Melbourne
Materials Labour Contingency/margin/other prelims Government taxes and charges Holding costs Professional fees GST Carpark
Sources: Deloitte Access Economics estimates based on Rawlinsons (2018), Quotable Value (2018), Auckland Council (2008a) Auckland Council (2008b), Auckland Council (2016), City of Sydney (2018), New South Wales of Planning and Development (2018a), New South Wales of Planning and Development (2018b), Wellington City Council (2018a), Wellington City Council (2018b), Wellington City Council (2018c), Christchurch City Council, The Hills Shire Council, City of Botany Bay, City of Stonington, Whittlesea Council, Moreland City Council, and market data
Sydney is the most expensive city to build a high-rise apartment
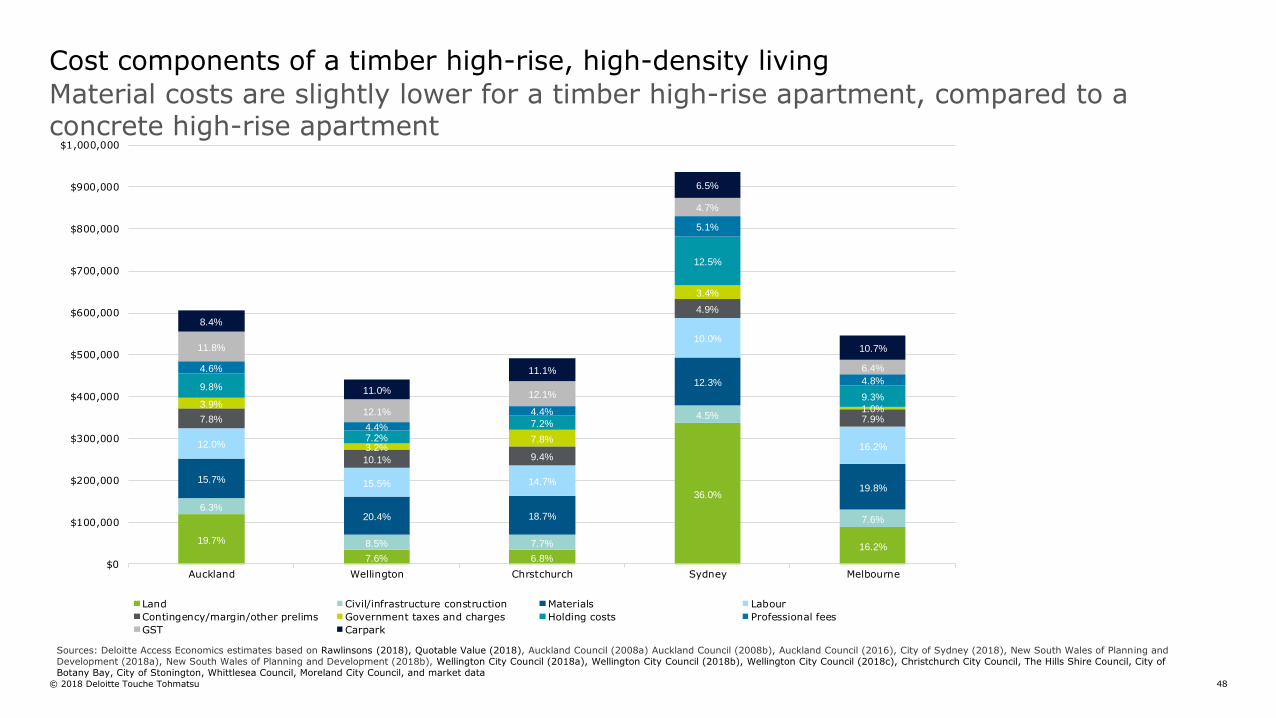
© 2018 Deloitte Touche Tohmatsu 48
Material costs are slightly lower for a timber high-rise apartment, compared to a concrete high-rise apartment
Cost components of a timber high-rise, high-density living
Sources: Deloitte Access Economics estimates based on Rawlinsons (2018), Quotable Value (2018), Auckland Council (2008a) Auckland Council (2008b), Auckland Council (2016), City of Sydney (2018), New South Wales of Planning and Development (2018a), New South Wales of Planning and Development (2018b), Wellington City Council (2018a), Wellington City Council (2018b), Wellington City Council (2018c), Christchurch City Council, The Hills Shire Council, City of Botany Bay, City of Stonington, Whittlesea Council, Moreland City Council, and market data
19.7%
7.6% 6.8%
36.0%
16.2%
6.3%
8.5% 7.7%
4.5%
7.6%
15.7%
20.4% 18.7%
12.3%
19.8%
12.0%
15.5% 14.7%
10.0%
16.2%
7.8%
10.1% 9.4%
4.9%
7.9%
3.9%
3.2%7.8%
3.4%
1.0%
9.8%
7.2%
7.2%
12.5%
9.3%
4.6%
4.4%
4.4%
5.1%
4.8%
11.8%
12.1%
12.1%
4.7%
6.4%
8.4%
11.0%
11.1%
6.5%
10.7%
$0
$100,000
$200,000
$300,000
$400,000
$500,000
$600,000
$700,000
$800,000
$900,000
$1,000,000
Auckland Wellington Chrstchurch Sydney Melbourne
Land Civil/infrastructure construction Materials Labour
Contingency/margin/other prelims Government taxes and charges Holding costs Professional fees
GST Carpark
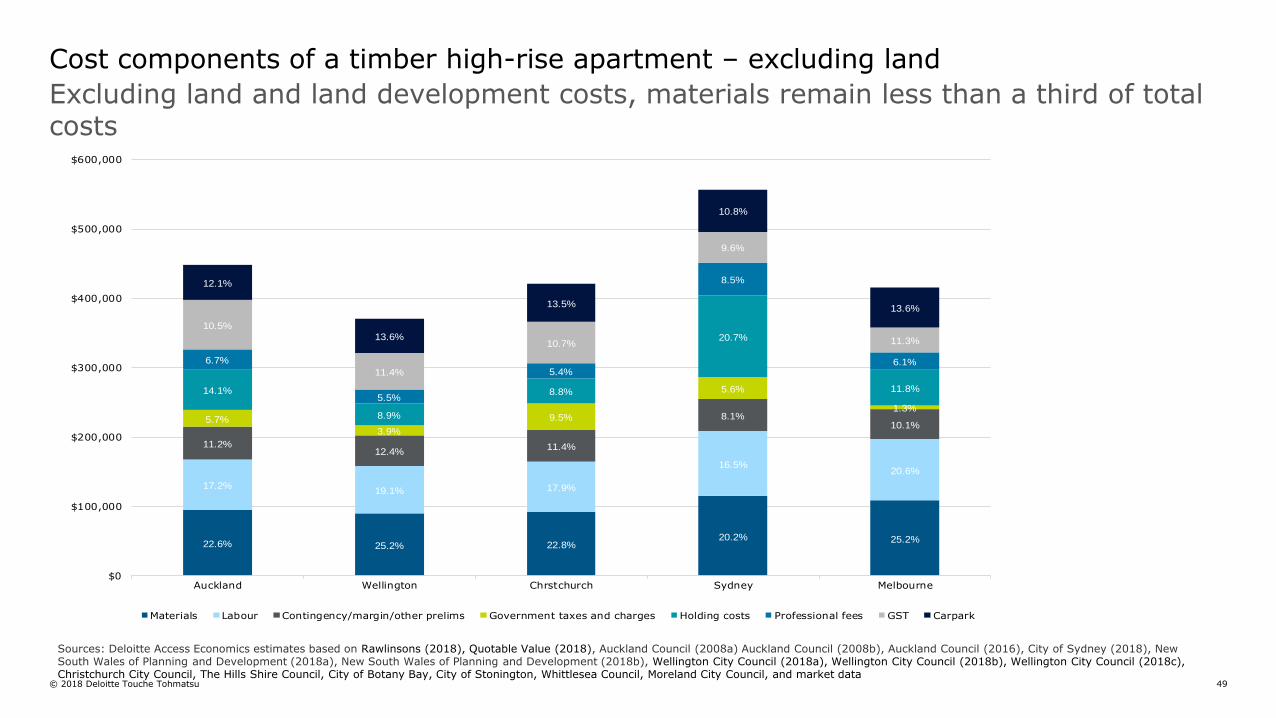
© 2018 Deloitte Touche Tohmatsu 49
Cost components of a timber high-rise apartment – excluding land
Sources: Deloitte Access Economics estimates based on Rawlinsons (2018), Quotable Value (2018), Auckland Council (2008a) Auckland Council (2008b), Auckland Council (2016), City of Sydney (2018), New South Wales of Planning and Development (2018a), New South Wales of Planning and Development (2018b), Wellington City Council (2018a), Wellington City Council (2018b), Wellington City Council (2018c), Christchurch City Council, The Hills Shire Council, City of Botany Bay, City of Stonington, Whittlesea Council, Moreland City Council, and market data
Excluding land and land development costs, materials remain less than a third of total costs
22.6% 25.2% 22.8%20.2% 25.2%
17.2%19.1% 17.9%
16.5%20.6%
11.2%12.4%
11.4%
8.1%10.1%
5.7%
3.9%
9.5%
5.6%
1.3%
14.1%
8.9%
8.8%
20.7%
11.8%
6.7%
5.5%
5.4%
8.5%
6.1%
10.5%
11.4%
10.7%
9.6%
11.3%
12.1%
13.6%
13.5%
10.8%
13.6%
$0
$100,000
$200,000
$300,000
$400,000
$500,000
$600,000
Auckland Wellington Chrstchurch Sydney Melbourne
Materials Labour Contingency/margin/other prelims Government taxes and charges Holding costs Professional fees GST Carpark
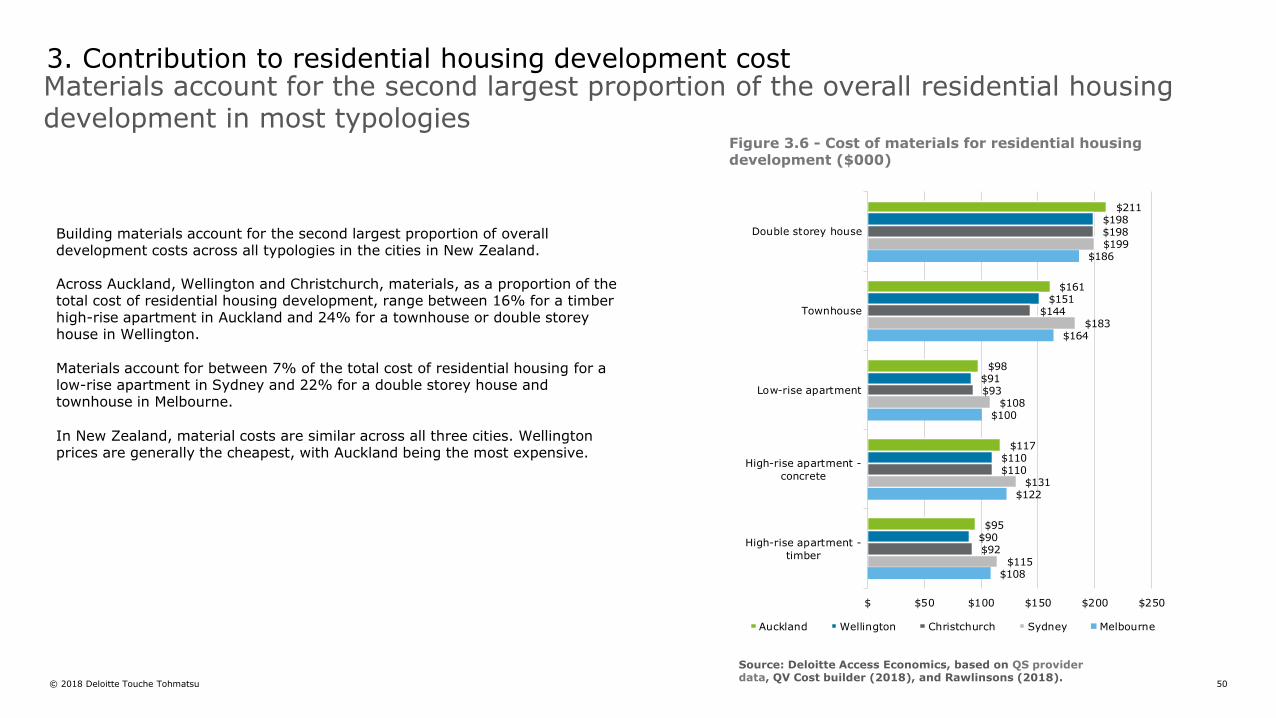
© 2018 Deloitte Touche Tohmatsu 50
$211
$161
$98
$117
$95
$198
$151
$91
$110
$90
$198
$144
$93
$110
$92
$199
$183
$108
$131
$115
$186
$164
$100
$122
$108
$ $50 $100 $150 $200 $250
Double storey house
Townhouse
Low-rise apartment
High-rise apartment -
concrete
High-rise apartment -
timber
Auckland Wellington Christchurch Sydney Melbourne
Materials account for the second largest proportion of the overall residential housing development in most typologies
Building materials account for the second largest proportion of overall development costs across all typologies in the cities in New Zealand.
Across Auckland, Wellington and Christchurch, materials, as a proportion of the total cost of residential housing development, range between 16% for a timber high-rise apartment in Auckland and 24% for a townhouse or double storey house in Wellington.
Materials account for between 7% of the total cost of residential housing for a low-rise apartment in Sydney and 22% for a double storey house and townhouse in Melbourne.
In New Zealand, material costs are similar across all three cities. Wellington prices are generally the cheapest, with Auckland being the most expensive.
Figure 3.6 - Cost of materials for residential housing development ($000)
3. Contribution to residential housing development cost
Source: Deloitte Access Economics, based on QS provider data, QV Cost builder (2018), and Rawlinsons (2018).
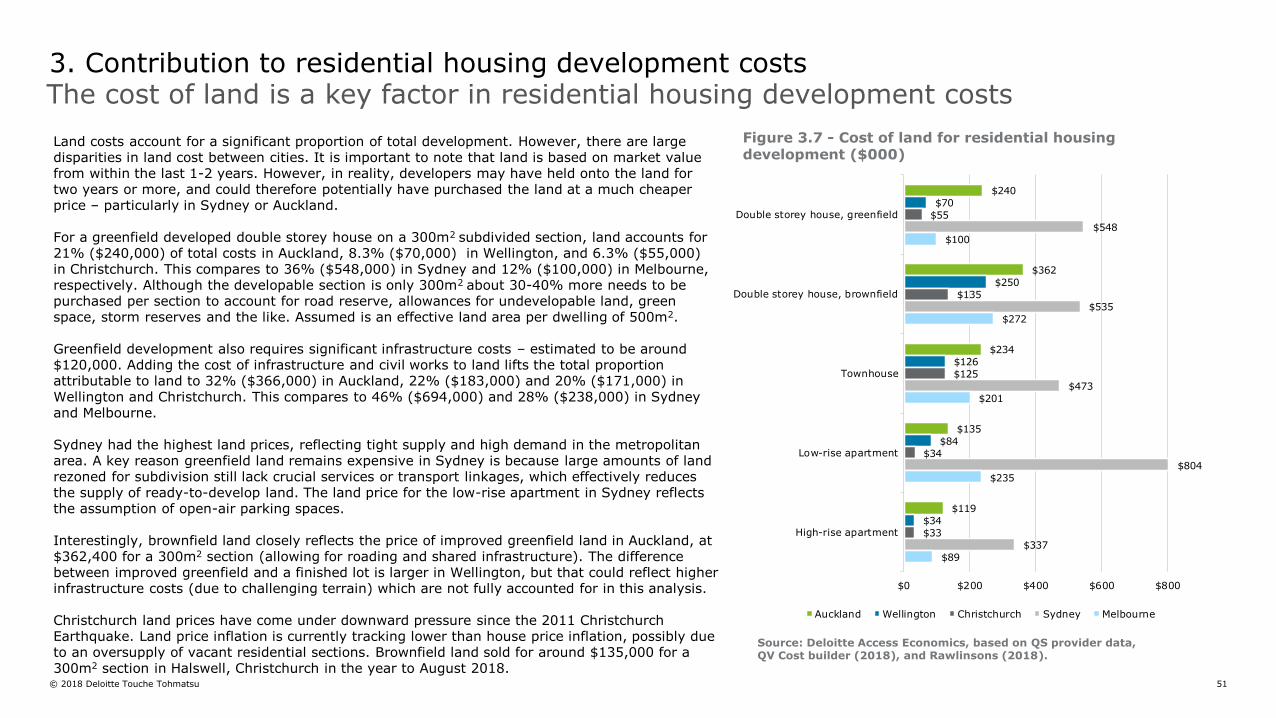
© 2018 Deloitte Touche Tohmatsu 51
$240
$362
$234
$135
$119
$70
$250
$126
$84
$34
$55
$135
$125
$34
$33
$548
$535
$473
$804
$337
$100
$272
$201
$235
$89
$0 $200 $400 $600 $800
Double storey house, greenfield
Double storey house, brownfield
Townhouse
Low-rise apartment
High-rise apartment
Auckland Wellington Christchurch Sydney Melbourne
The cost of land is a key factor in residential housing development costs3. Contribution to residential housing development costs
Land costs account for a significant proportion of total development. However, there are large disparities in land cost between cities. It is important to note that land is based on market value from within the last 1-2 years. However, in reality, developers may have held onto the land for two years or more, and could therefore potentially have purchased the land at a much cheaper price – particularly in Sydney or Auckland.
For a greenfield developed double storey house on a 300m2 subdivided section, land accounts for 21% ($240,000) of total costs in Auckland, 8.3% ($70,000) in Wellington, and 6.3% ($55,000) in Christchurch. This compares to 36% ($548,000) in Sydney and 12% ($100,000) in Melbourne, respectively. Although the developable section is only 300m2 about 30-40% more needs to be purchased per section to account for road reserve, allowances for undevelopable land, green space, storm reserves and the like. Assumed is an effective land area per dwelling of 500m2.
Greenfield development also requires significant infrastructure costs – estimated to be around $120,000. Adding the cost of infrastructure and civil works to land lifts the total proportion attributable to land to 32% ($366,000) in Auckland, 22% ($183,000) and 20% ($171,000) in Wellington and Christchurch. This compares to 46% ($694,000) and 28% ($238,000) in Sydney and Melbourne.
Sydney had the highest land prices, reflecting tight supply and high demand in the metropolitan area. A key reason greenfield land remains expensive in Sydney is because large amounts of land rezoned for subdivision still lack crucial services or transport linkages, which effectively reduces the supply of ready-to-develop land. The land price for the low-rise apartment in Sydney reflects the assumption of open-air parking spaces.
Interestingly, brownfield land closely reflects the price of improved greenfield land in Auckland, at $362,400 for a 300m2 section (allowing for roading and shared infrastructure). The difference between improved greenfield and a finished lot is larger in Wellington, but that could reflect higher infrastructure costs (due to challenging terrain) which are not fully accounted for in this analysis.
Christchurch land prices have come under downward pressure since the 2011 Christchurch Earthquake. Land price inflation is currently tracking lower than house price inflation, possibly due to an oversupply of vacant residential sections. Brownfield land sold for around $135,000 for a 300m2 section in Halswell, Christchurch in the year to August 2018.
Figure 3.7 - Cost of land for residential housing development ($000)
Source: Deloitte Access Economics, based on QS provider data, QV Cost builder (2018), and Rawlinsons (2018).
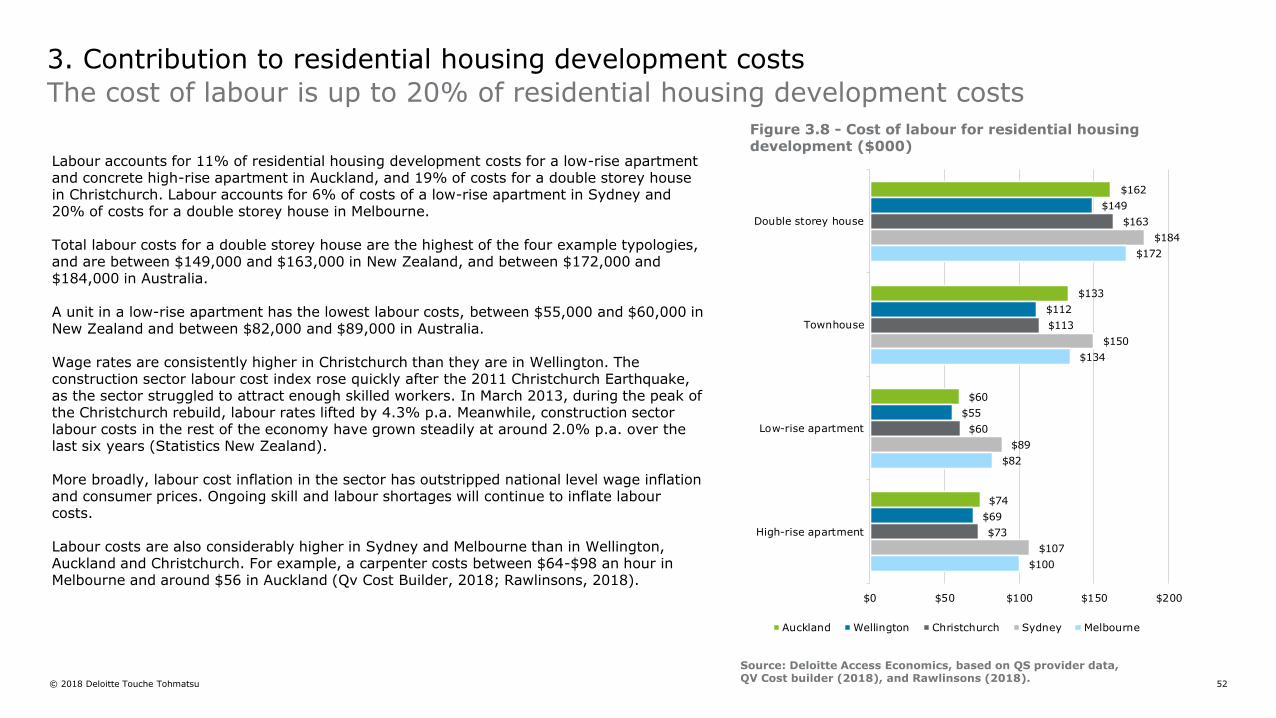
© 2018 Deloitte Touche Tohmatsu 52
$162
$133
$60
$74
$149
$112
$55
$69
$163
$113
$60
$73
$184
$150
$89
$107
$172
$134
$82
$100
$0 $50 $100 $150 $200
Double storey house
Townhouse
Low-rise apartment
High-rise apartment
Auckland Wellington Christchurch Sydney Melbourne
The cost of labour is up to 20% of residential housing development costs
Labour accounts for 11% of residential housing development costs for a low-rise apartment and concrete high-rise apartment in Auckland, and 19% of costs for a double storey house in Christchurch. Labour accounts for 6% of costs of a low-rise apartment in Sydney and 20% of costs for a double storey house in Melbourne.
Total labour costs for a double storey house are the highest of the four example typologies, and are between $149,000 and $163,000 in New Zealand, and between $172,000 and $184,000 in Australia.
A unit in a low-rise apartment has the lowest labour costs, between $55,000 and $60,000 in New Zealand and between $82,000 and $89,000 in Australia.
Wage rates are consistently higher in Christchurch than they are in Wellington. The construction sector labour cost index rose quickly after the 2011 Christchurch Earthquake, as the sector struggled to attract enough skilled workers. In March 2013, during the peak of the Christchurch rebuild, labour rates lifted by 4.3% p.a. Meanwhile, construction sector labour costs in the rest of the economy have grown steadily at around 2.0% p.a. over the last six years (Statistics New Zealand).
More broadly, labour cost inflation in the sector has outstripped national level wage inflation and consumer prices. Ongoing skill and labour shortages will continue to inflate labour costs.
Labour costs are also considerably higher in Sydney and Melbourne than in Wellington, Auckland and Christchurch. For example, a carpenter costs between $64-$98 an hour in Melbourne and around $56 in Auckland (Qv Cost Builder, 2018; Rawlinsons, 2018).
3. Contribution to residential housing development costs
Source: Deloitte Access Economics, based on QS provider data, QV Cost builder (2018), and Rawlinsons (2018).
Figure 3.8 - Cost of labour for residential housing development ($000)
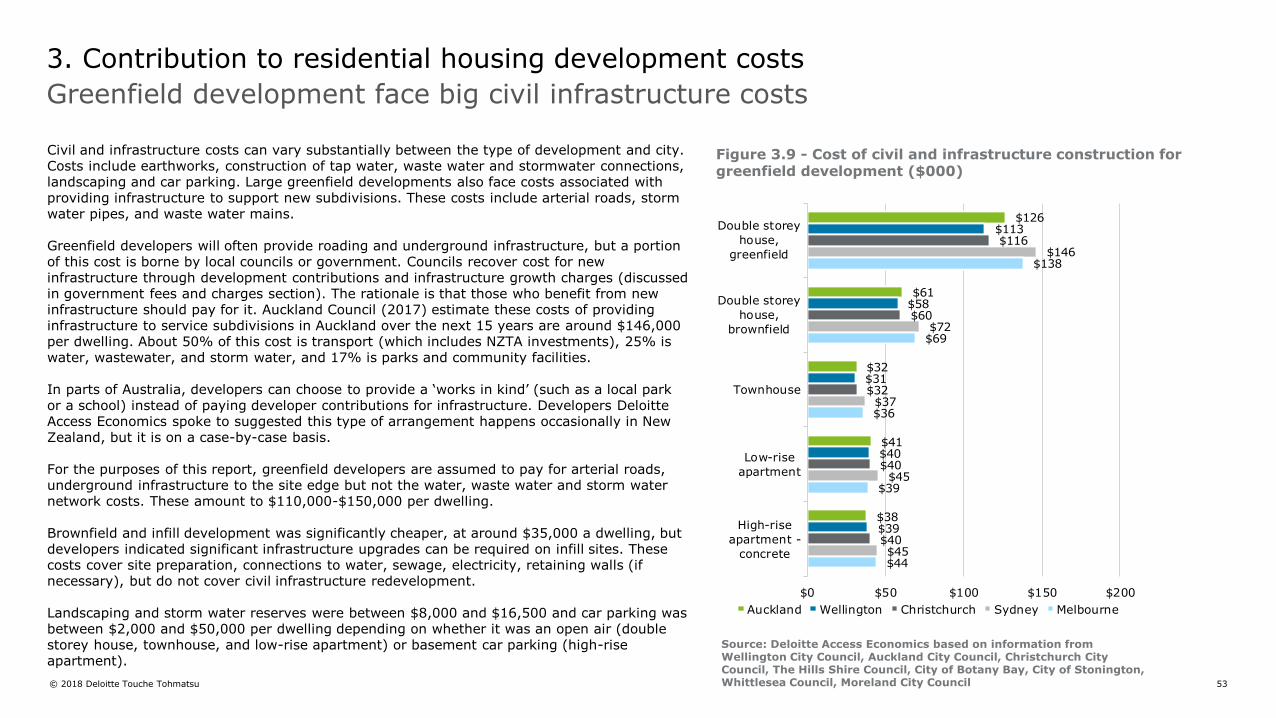
© 2018 Deloitte Touche Tohmatsu 53
Greenfield development face big civil infrastructure costs
3. Contribution to residential housing development costs
Civil and infrastructure costs can vary substantially between the type of development and city. Costs include earthworks, construction of tap water, waste water and stormwater connections, landscaping and car parking. Large greenfield developments also face costs associated with providing infrastructure to support new subdivisions. These costs include arterial roads, storm water pipes, and waste water mains.
Greenfield developers will often provide roading and underground infrastructure, but a portion of this cost is borne by local councils or government. Councils recover cost for new infrastructure through development contributions and infrastructure growth charges (discussed in government fees and charges section). The rationale is that those who benefit from new infrastructure should pay for it. Auckland Council (2017) estimate these costs of providing infrastructure to service subdivisions in Auckland over the next 15 years are around $146,000 per dwelling. About 50% of this cost is transport (which includes NZTA investments), 25% is water, wastewater, and storm water, and 17% is parks and community facilities.
In parts of Australia, developers can choose to provide a ‘works in kind’ (such as a local park or a school) instead of paying developer contributions for infrastructure. Developers Deloitte Access Economics spoke to suggested this type of arrangement happens occasionally in New Zealand, but it is on a case-by-case basis.
For the purposes of this report, greenfield developers are assumed to pay for arterial roads, underground infrastructure to the site edge but not the water, waste water and storm water network costs. These amount to $110,000-$150,000 per dwelling.
Brownfield and infill development was significantly cheaper, at around $35,000 a dwelling, but developers indicated significant infrastructure upgrades can be required on infill sites. These costs cover site preparation, connections to water, sewage, electricity, retaining walls (if necessary), but do not cover civil infrastructure redevelopment.
Landscaping and storm water reserves were between $8,000 and $16,500 and car parking was between $2,000 and $50,000 per dwelling depending on whether it was an open air (double storey house, townhouse, and low-rise apartment) or basement car parking (high-rise apartment).
Source: Deloitte Access Economics based on information from Wellington City Council, Auckland City Council, Christchurch City Council, The Hills Shire Council, City of Botany Bay, City of Stonington, Whittlesea Council, Moreland City Council
Figure 3.9 - Cost of civil and infrastructure construction for greenfield development ($000)
$126
$61
$32
$41
$38
$113
$58
$31
$40
$39
$116
$60
$32
$40
$40
$146
$72
$37
$45
$45
$138
$69
$36
$39
$44
$0 $50 $100 $150 $200
Double storey
house,
greenfield
Double storey
house,
brownfield
Townhouse
Low-rise
apartment
High-rise
apartment -
concrete
Auckland Wellington Christchurch Sydney Melbourne
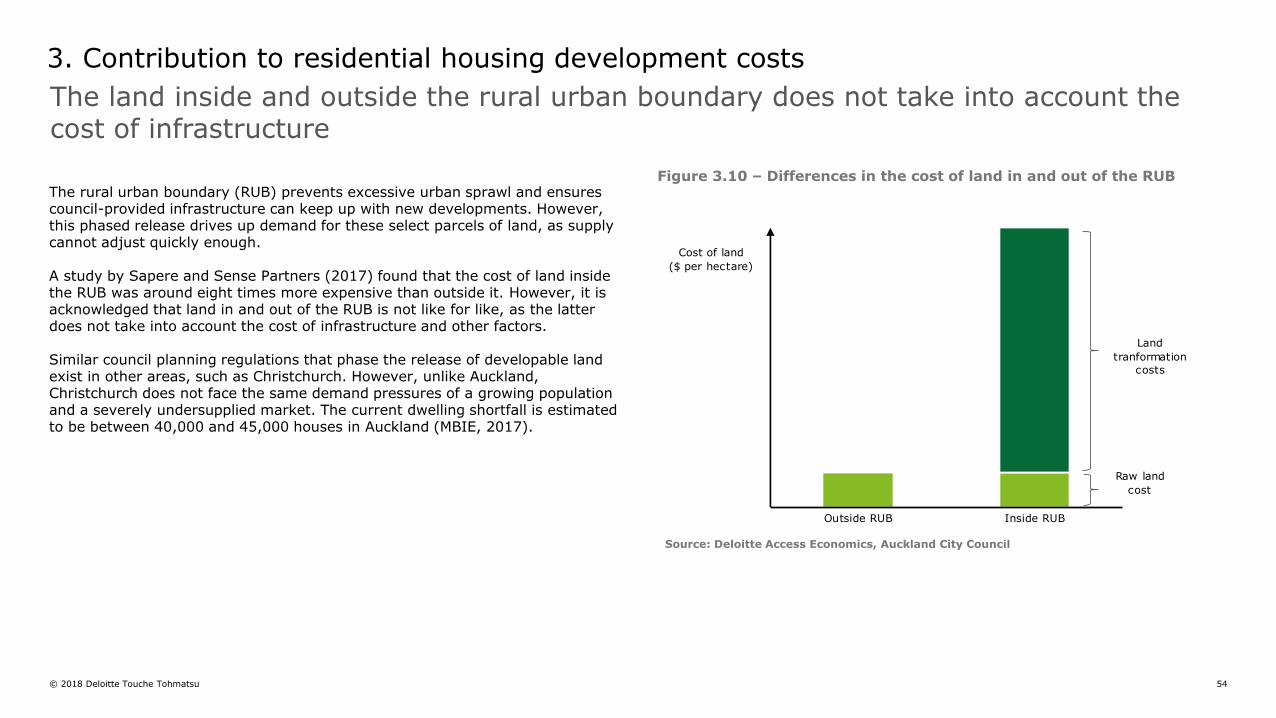
© 2018 Deloitte Touche Tohmatsu 54
Raw land
cost
Land
tranformation
costs
0
10
20
30
40
50
60
70
80
90
100
Outside RUB Inside RUB
Cost of land
($ per hectare)
The land inside and outside the rural urban boundary does not take into account the cost of infrastructure
3. Contribution to residential housing development costs
The rural urban boundary (RUB) prevents excessive urban sprawl and ensures council-provided infrastructure can keep up with new developments. However, this phased release drives up demand for these select parcels of land, as supply cannot adjust quickly enough.
A study by Sapere and Sense Partners (2017) found that the cost of land inside the RUB was around eight times more expensive than outside it. However, it is acknowledged that land in and out of the RUB is not like for like, as the latter does not take into account the cost of infrastructure and other factors.
Similar council planning regulations that phase the release of developable land exist in other areas, such as Christchurch. However, unlike Auckland, Christchurch does not face the same demand pressures of a growing population and a severely undersupplied market. The current dwelling shortfall is estimated to be between 40,000 and 45,000 houses in Auckland (MBIE, 2017).
Source: Deloitte Access Economics, Auckland City Council
Figure 3.10 – Differences in the cost of land in and out of the RUB
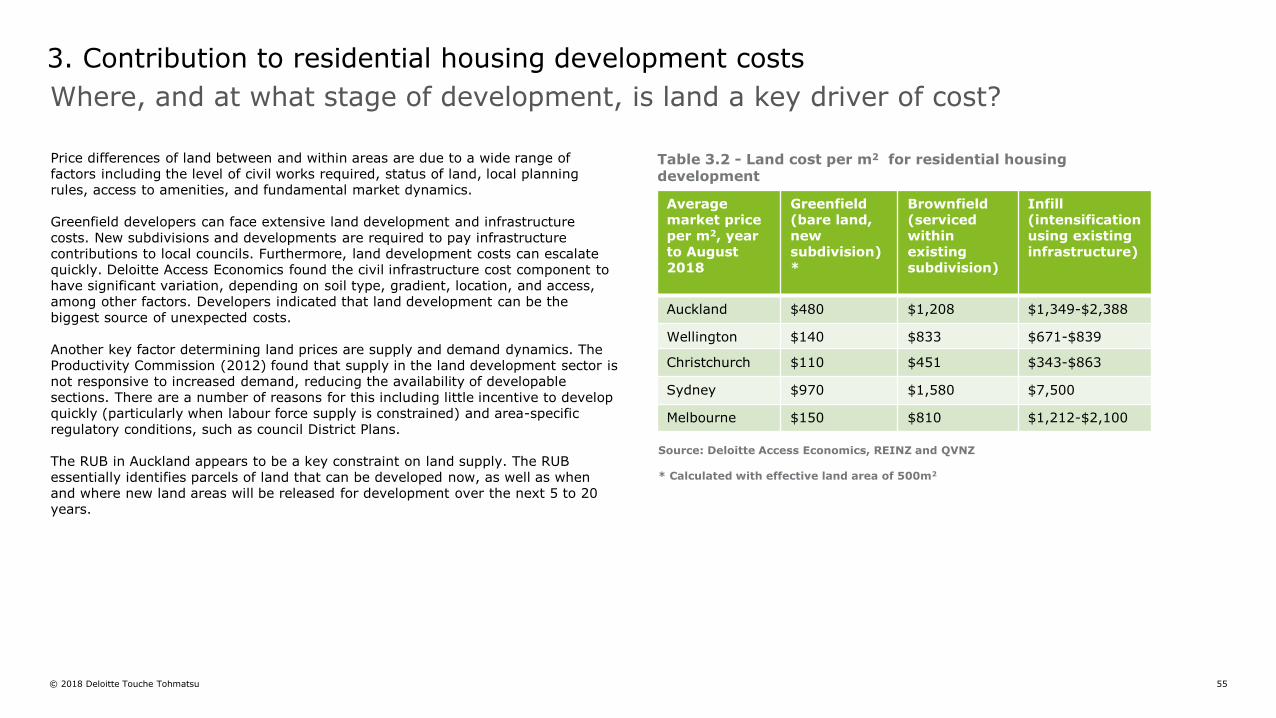
© 2018 Deloitte Touche Tohmatsu 55
Where, and at what stage of development, is land a key driver of cost?
3. Contribution to residential housing development costs
Price differences of land between and within areas are due to a wide range of factors including the level of civil works required, status of land, local planning rules, access to amenities, and fundamental market dynamics.
Greenfield developers can face extensive land development and infrastructure costs. New subdivisions and developments are required to pay infrastructure contributions to local councils. Furthermore, land development costs can escalate quickly. Deloitte Access Economics found the civil infrastructure cost component to have significant variation, depending on soil type, gradient, location, and access, among other factors. Developers indicated that land development can be the biggest source of unexpected costs.
Another key factor determining land prices are supply and demand dynamics. The Productivity Commission (2012) found that supply in the land development sector is not responsive to increased demand, reducing the availability of developable sections. There are a number of reasons for this including little incentive to develop quickly (particularly when labour force supply is constrained) and area-specific regulatory conditions, such as council District Plans.
The RUB in Auckland appears to be a key constraint on land supply. The RUB essentially identifies parcels of land that can be developed now, as well as when and where new land areas will be released for development over the next 5 to 20 years.
Source: Deloitte Access Economics, REINZ and QVNZ
* Calculated with effective land area of 500m2
Averagemarket price per m2, year to August 2018
Greenfield(bare land, new subdivision)*
Brownfield(serviced within existing subdivision)
Infill (intensificationusing existing infrastructure)
Auckland $480 $1,208 $1,349-$2,388
Wellington $140 $833 $671-$839
Christchurch $110 $451 $343-$863
Sydney $970 $1,580 $7,500
Melbourne $150 $810 $1,212-$2,100
Table 3.2 - Land cost per m2 for residential housing development
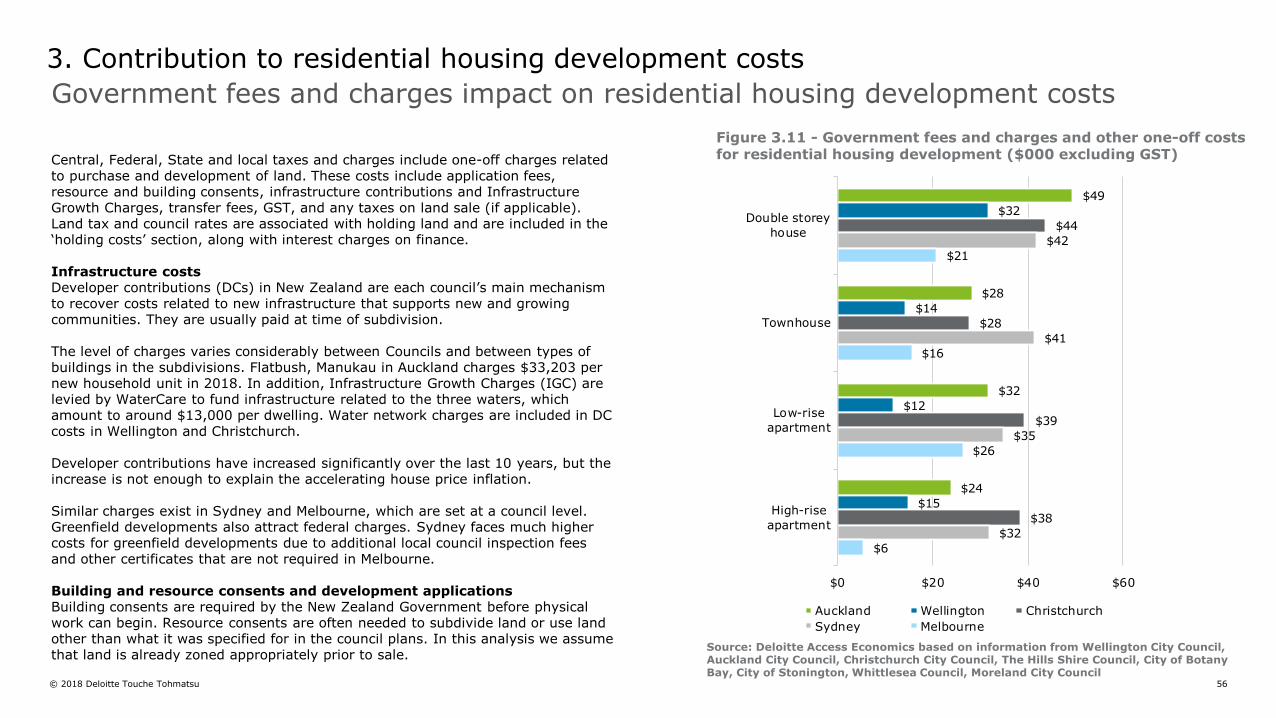
© 2018 Deloitte Touche Tohmatsu 56
$49
$28
$32
$24
$32
$14
$12
$15
$44
$28
$39
$38
$42
$41
$35
$32
$21
$16
$26
$6
$0 $20 $40 $60
Double storey
house
Townhouse
Low-rise
apartment
High-rise
apartment
Auckland Wellington Christchurch
Sydney Melbourne
Government fees and charges impact on residential housing development costs
Central, Federal, State and local taxes and charges include one-off charges related to purchase and development of land. These costs include application fees, resource and building consents, infrastructure contributions and Infrastructure Growth Charges, transfer fees, GST, and any taxes on land sale (if applicable). Land tax and council rates are associated with holding land and are included in the ‘holding costs’ section, along with interest charges on finance.
Infrastructure costs Developer contributions (DCs) in New Zealand are each council’s main mechanism to recover costs related to new infrastructure that supports new and growing communities. They are usually paid at time of subdivision.
The level of charges varies considerably between Councils and between types of buildings in the subdivisions. Flatbush, Manukau in Auckland charges $33,203 per new household unit in 2018. In addition, Infrastructure Growth Charges (IGC) are levied by WaterCare to fund infrastructure related to the three waters, which amount to around $13,000 per dwelling. Water network charges are included in DC costs in Wellington and Christchurch.
Developer contributions have increased significantly over the last 10 years, but the increase is not enough to explain the accelerating house price inflation.
Similar charges exist in Sydney and Melbourne, which are set at a council level. Greenfield developments also attract federal charges. Sydney faces much higher costs for greenfield developments due to additional local council inspection fees and other certificates that are not required in Melbourne.
Building and resource consents and development applications Building consents are required by the New Zealand Government before physical work can begin. Resource consents are often needed to subdivide land or use land other than what it was specified for in the council plans. In this analysis we assume that land is already zoned appropriately prior to sale.
Figure 3.11 - Government fees and charges and other one-off costs for residential housing development ($000 excluding GST)
3. Contribution to residential housing development costs
Source: Deloitte Access Economics based on information from Wellington City Council, Auckland City Council, Christchurch City Council, The Hills Shire Council, City of Botany Bay, City of Stonington, Whittlesea Council, Moreland City Council
© 2018 Deloitte Touche Tohmatsu 57
GST adds around 8%-13% to total costs
GSTThe Goods and Services Tax (GST) system differs between New Zealand and Australia. GST is applied at a rate of 15% in New Zealand, whereas GST is applied at rate of 10% in Australia. Further, sewage and drainage is a supply that is GST exempt in Australia, but does not share the same exemption in New Zealand. Based on the modelling conducted for this report, holding costs (holding costs on debt, land holding costs and finance charges) do not incur GST. For this reason, the contribution of GST varies across typologies and location.
GST applies to the sale of land if the vendor is registered for GST. GST is also applied to construction costs, professional fees, and government taxes and charges. The net contribution of GST is around 13% of the total cost in New Zealand and 8% in Australia.
Land taxLand tax applies to land sold in Australia. Victoria land tax is applied to land over a threshold of $250,000 (AUD). In New South Wales, land is taxed over a threshold of $629,000 (AUD).
Margins Builders margins are charged on top of costs. Margins can vary according to the complexity of project, size of company, and type of agreement, but are ideally around 10-15% of construction costs. Advice from builders in New Zealand and Australia, and Capital IQ data suggest that current margins in Australia are typically in the region of 8%, while in New Zealand they are closer to 12%. Margins for developers are not included in this analysis. This analysis assumes margins are also applied to land development costs, i.e. to the cost of building horizontal infrastructure such as roads and pipes.
Preliminaries Preliminaries typically include consents, council levies, development contributions, insurance, temporary services, and some site preparation. According to Cost Builder, they are around 10-15% of construction costs (QV Cost Builder New Zealand). However, for the purposes of this analysis, consents, levies, development contributions, insurance are included in government fees and charges. Other builders overheads, such as protective clothing and accessories, site safety equipment, and temporary structures are included in preliminaries. These overheads as estimated to be around 3% of construction costs.
Professional fees Professional fees include surveyors, architects/draftsmen, consultants, lawyers, structural engineers, and project managers. Fees range varying on the project requirements, level of service and project complexity. For a medium quality residential house, QV indicates that professional fees can range from 5-8% of project cost.
3. Contribution to residential housing development costs
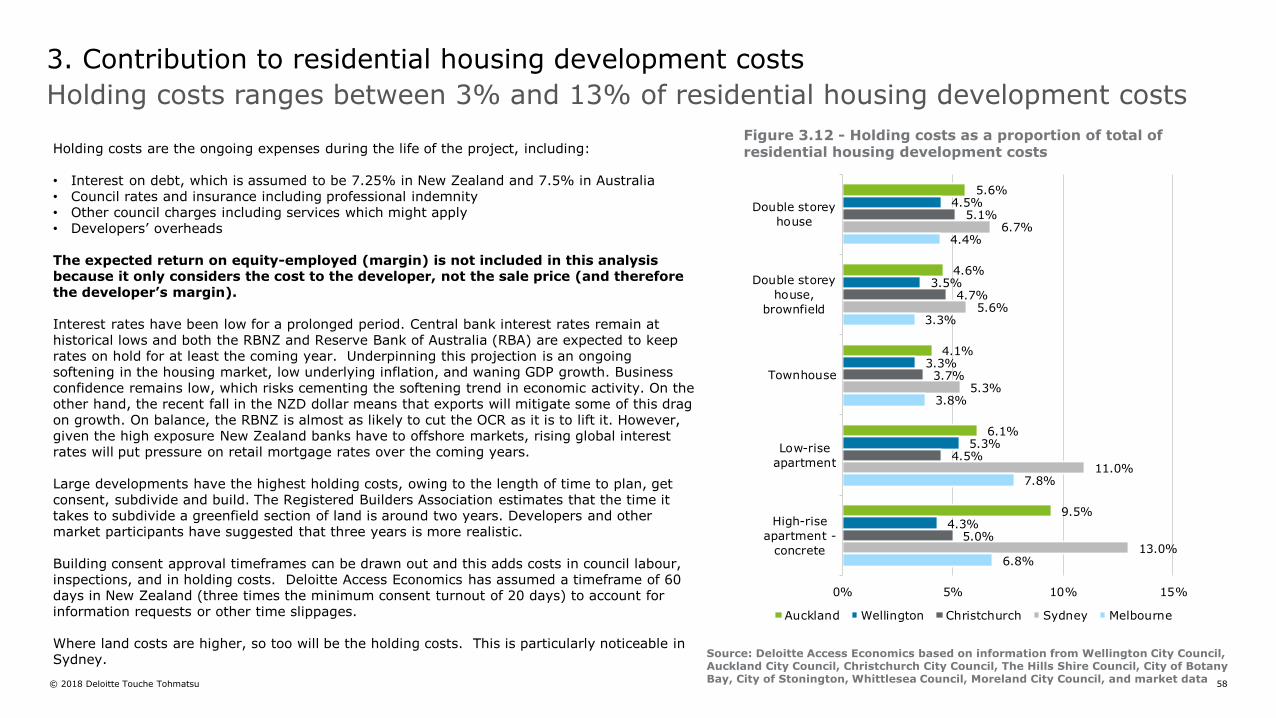
© 2018 Deloitte Touche Tohmatsu 58
5.6%
4.6%
4.1%
6.1%
9.5%
4.5%
3.5%
3.3%
5.3%
4.3%
5.1%
4.7%
3.7%
4.5%
5.0%
6.7%
5.6%
5.3%
11.0%
13.0%
4.4%
3.3%
3.8%
7.8%
6.8%
0% 5% 10% 15%
Double storey
house
Double storey
house,
brownfield
Townhouse
Low-rise
apartment
High-rise
apartment -
concrete
Auckland Wellington Christchurch Sydney Melbourne
Holding costs ranges between 3% and 13% of residential housing development costs
Holding costs are the ongoing expenses during the life of the project, including:
• Interest on debt, which is assumed to be 7.25% in New Zealand and 7.5% in Australia• Council rates and insurance including professional indemnity• Other council charges including services which might apply• Developers’ overheads
The expected return on equity-employed (margin) is not included in this analysis because it only considers the cost to the developer, not the sale price (and therefore the developer’s margin).
Interest rates have been low for a prolonged period. Central bank interest rates remain at historical lows and both the RBNZ and Reserve Bank of Australia (RBA) are expected to keep rates on hold for at least the coming year. Underpinning this projection is an ongoing softening in the housing market, low underlying inflation, and waning GDP growth. Business confidence remains low, which risks cementing the softening trend in economic activity. On the other hand, the recent fall in the NZD dollar means that exports will mitigate some of this drag on growth. On balance, the RBNZ is almost as likely to cut the OCR as it is to lift it. However, given the high exposure New Zealand banks have to offshore markets, rising global interest rates will put pressure on retail mortgage rates over the coming years.
Large developments have the highest holding costs, owing to the length of time to plan, get consent, subdivide and build. The Registered Builders Association estimates that the time it takes to subdivide a greenfield section of land is around two years. Developers and other market participants have suggested that three years is more realistic.
Building consent approval timeframes can be drawn out and this adds costs in council labour, inspections, and in holding costs. Deloitte Access Economics has assumed a timeframe of 60 days in New Zealand (three times the minimum consent turnout of 20 days) to account for information requests or other time slippages.
Where land costs are higher, so too will be the holding costs. This is particularly noticeable in Sydney.
Figure 3.12 - Holding costs as a proportion of total of residential housing development costs
3. Contribution to residential housing development costs
Source: Deloitte Access Economics based on information from Wellington City Council, Auckland City Council, Christchurch City Council, The Hills Shire Council, City of Botany Bay, City of Stonington, Whittlesea Council, Moreland City Council, and market data
© 2018 Deloitte Touche Tohmatsu 59
4. Comparison of construction cost for residential housing development across New Zealand and Australia
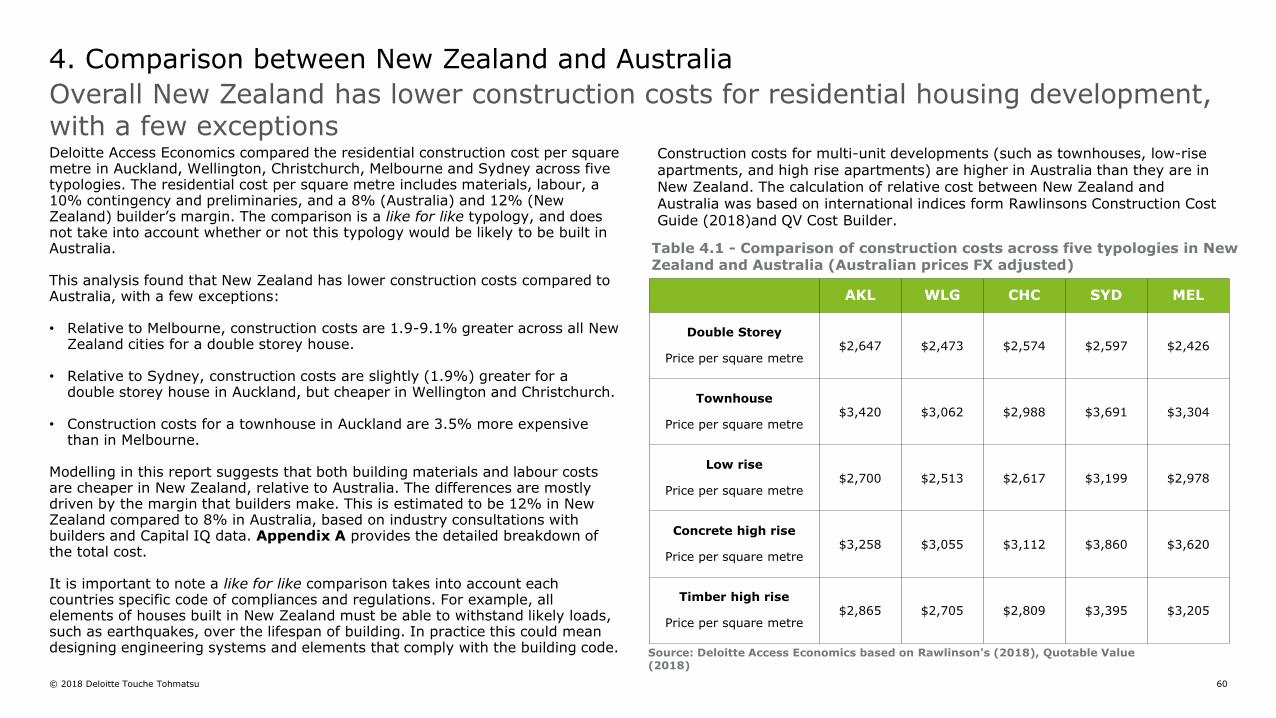
© 2018 Deloitte Touche Tohmatsu 60
Deloitte Access Economics compared the residential construction cost per square metre in Auckland, Wellington, Christchurch, Melbourne and Sydney across five typologies. The residential cost per square metre includes materials, labour, a 10% contingency and preliminaries, and a 8% (Australia) and 12% (New Zealand) builder’s margin. The comparison is a like for like typology, and does not take into account whether or not this typology would be likely to be built in Australia.
This analysis found that New Zealand has lower construction costs compared to Australia, with a few exceptions:
• Relative to Melbourne, construction costs are 1.9-9.1% greater across all New Zealand cities for a double storey house.
• Relative to Sydney, construction costs are slightly (1.9%) greater for a double storey house in Auckland, but cheaper in Wellington and Christchurch.
• Construction costs for a townhouse in Auckland are 3.5% more expensive than in Melbourne.
Modelling in this report suggests that both building materials and labour costs are cheaper in New Zealand, relative to Australia. The differences are mostly driven by the margin that builders make. This is estimated to be 12% in New Zealand compared to 8% in Australia, based on industry consultations with builders and Capital IQ data. Appendix A provides the detailed breakdown of the total cost.
It is important to note a like for like comparison takes into account each countries specific code of compliances and regulations. For example, all elements of houses built in New Zealand must be able to withstand likely loads, such as earthquakes, over the lifespan of building. In practice this could mean designing engineering systems and elements that comply with the building code.
Construction costs for multi-unit developments (such as townhouses, low-rise apartments, and high rise apartments) are higher in Australia than they are in New Zealand. The calculation of relative cost between New Zealand and Australia was based on international indices form Rawlinsons Construction Cost Guide (2018)and QV Cost Builder.
4. Comparison between New Zealand and Australia
Overall New Zealand has lower construction costs for residential housing development, with a few exceptions
AKL WLG CHC SYD MEL
Double Storey
Price per square metre$2,647 $2,473 $2,574 $2,597 $2,426
Townhouse
Price per square metre$3,420 $3,062 $2,988 $3,691 $3,304
Low rise
Price per square metre$2,700 $2,513 $2,617 $3,199 $2,978
Concrete high rise
Price per square metre$3,258 $3,055 $3,112 $3,860 $3,620
Timber high rise
Price per square metre$2,865 $2,705 $2,809 $3,395 $3,205
Table 4.1 - Comparison of construction costs across five typologies in New Zealand and Australia (Australian prices FX adjusted)
Source: Deloitte Access Economics based on Rawlinson's (2018), Quotable Value (2018)
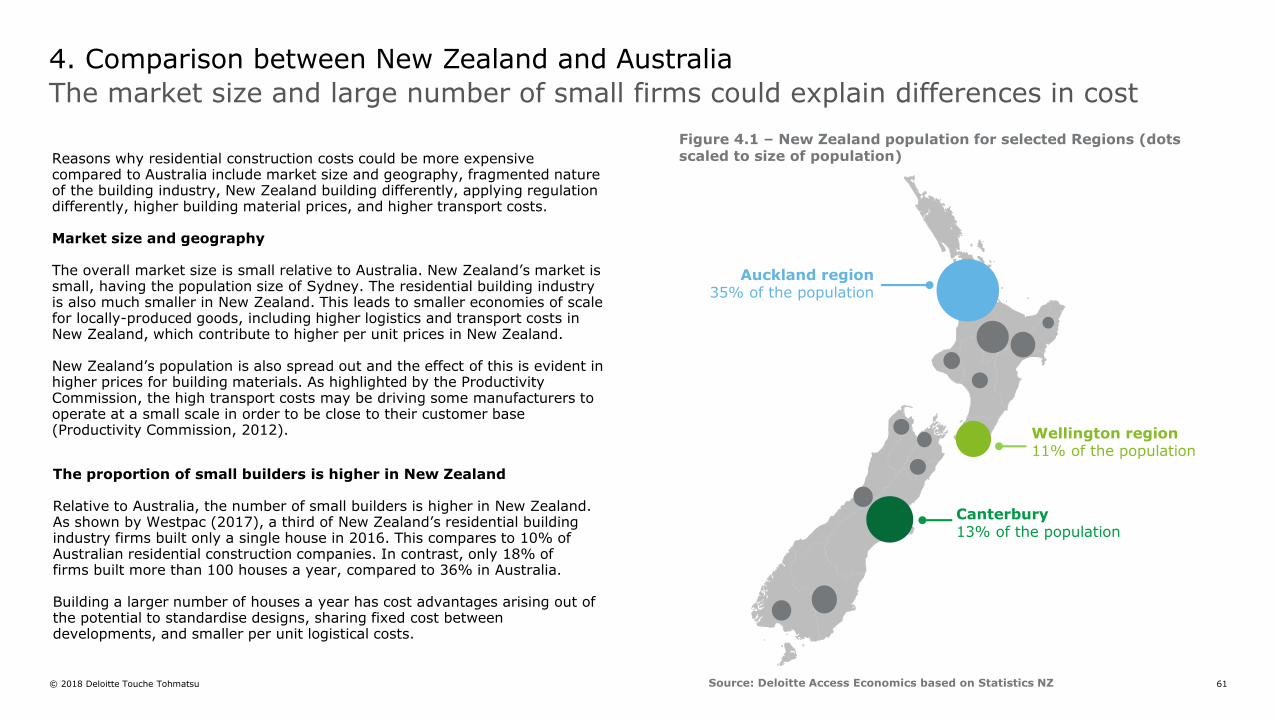
© 2018 Deloitte Touche Tohmatsu 61
Auckland region35% of the population
Canterbury13% of the population
Wellington region11% of the population
The market size and large number of small firms could explain differences in cost
4. Comparison between New Zealand and Australia
Reasons why residential construction costs could be more expensive compared to Australia include market size and geography, fragmented nature of the building industry, New Zealand building differently, applying regulation differently, higher building material prices, and higher transport costs.
Market size and geography
The overall market size is small relative to Australia. New Zealand’s market is small, having the population size of Sydney. The residential building industry is also much smaller in New Zealand. This leads to smaller economies of scale for locally-produced goods, including higher logistics and transport costs in New Zealand, which contribute to higher per unit prices in New Zealand.
New Zealand’s population is also spread out and the effect of this is evident in higher prices for building materials. As highlighted by the Productivity Commission, the high transport costs may be driving some manufacturers to operate at a small scale in order to be close to their customer base (Productivity Commission, 2012).
The proportion of small builders is higher in New Zealand
Relative to Australia, the number of small builders is higher in New Zealand. As shown by Westpac (2017), a third of New Zealand’s residential building industry firms built only a single house in 2016. This compares to 10% of Australian residential construction companies. In contrast, only 18% of firms built more than 100 houses a year, compared to 36% in Australia.
Building a larger number of houses a year has cost advantages arising out of the potential to standardise designs, sharing fixed cost between developments, and smaller per unit logistical costs.
Figure 4.1 – New Zealand population for selected Regions (dots scaled to size of population)
Source: Deloitte Access Economics based on Statistics NZ
© 2018 Deloitte Touche Tohmatsu 62
New Zealand builds different types of houses to Australia, and applies regulation differently
4. Comparison between New Zealand and Australia
New Zealand builds different houses
For this report, we compared like for like typologies between Australia and New Zealand, using typical typologies for New Zealand. However, of course we do not build the same across the two countries for a variety of reasons, including historical (habitual), environmental (e.g. responding to local risks) and simply because it makes sense to due to the nature of the local market. For all of these reasons, it can be unhelpful to make straight comparisons between Australia and New Zealand of things like per square metre building costs. This report aims to allow for an objective comparison on a like for like basis.
A typical for typical comparison would reveal that the average house in Australia looks different and is built with different materials than an average house in New Zealand. Therefore comparing prices across the two countries is challenging.
Both countries have varying preferences and the need to build homes that are suited to our climate and geography. New Zealand primarily builds bespoke homes, and even homes bought from developers plans often allow for major adjustments or additions. In contrast, a typical project home in Australia gives the buyer little scope for customisation beyond colour choice or quality of fittings.
Under the Act, only registered Building Consent Authorities (BCAs) are allowed to certify building work and issue consents. The vast majority are local councils. Inefficiencies arise from risk adverse behaviour, due to BCAs being liable if product or building work fails. Councils have no incentive to take on this risk and are therefore prone to overregulation. (The cost of over and under regulation is discussed in the following slides).
One market observer suggested that BCAs should adopt a risk driven approach, whereby high risk systems such as cladding should be more highly scrutinised, while low risk items could be certified by a third party.
Introducing new products was also suggested to be expensive and time consuming. This aversion to new products means there is an opportunity cost of adopting new technology. For example, cross laminated timber (CLT) in New Zealand requires full chemical penetration to guard against rot – this is not a requirement in Australia. Xlam is currently the only company which produces CLT in New Zealand and Red Stag is planning to open up a plant in mid-2019.
Application of building standards driving risk aversion
A common theme observed in consersations with industry players was the additional costs associated with New Zealand's building code – or rather how the building code is applied. One interviewee suggested that although New Zealand and Australia share similar building codes, the way they are applied differs. The Building Act 2004 (New Zealand) was introduced in response to the weather tightness issues of the early 2000s.
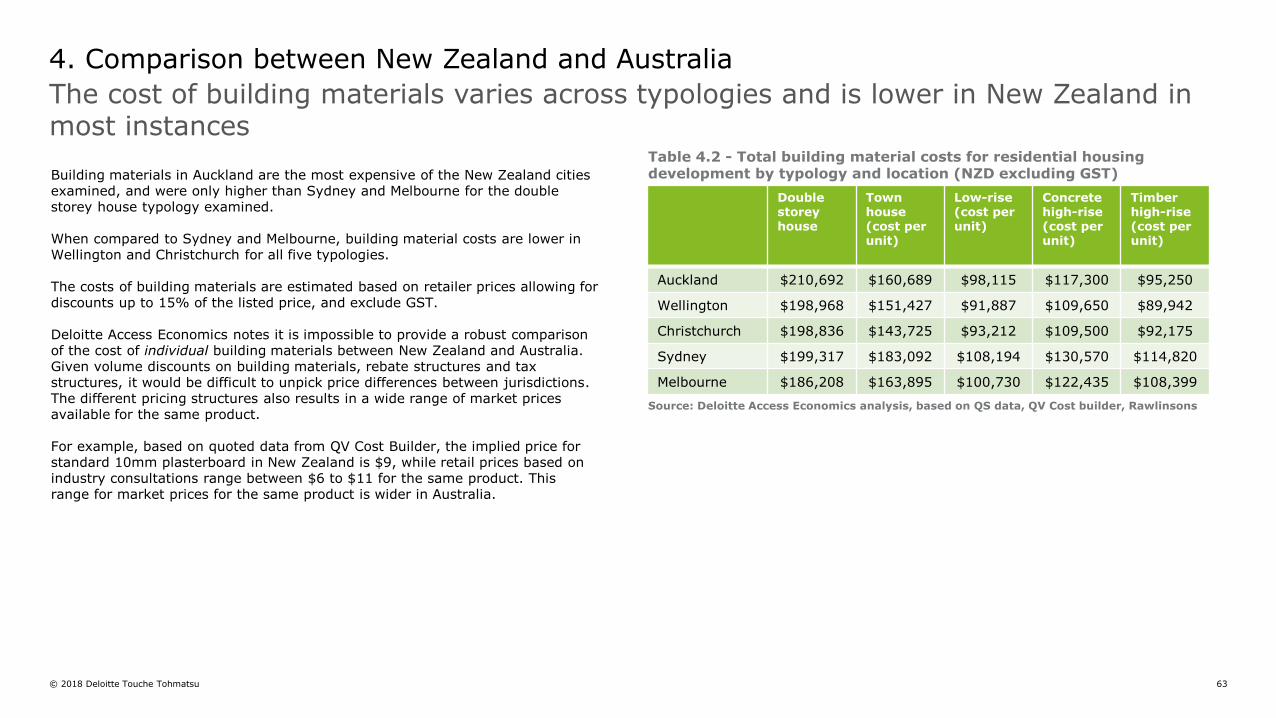
© 2018 Deloitte Touche Tohmatsu 63
4. Comparison between New Zealand and Australia
The cost of building materials varies across typologies and is lower in New Zealand in most instances
Building materials in Auckland are the most expensive of the New Zealand cities examined, and were only higher than Sydney and Melbourne for the double storey house typology examined.
When compared to Sydney and Melbourne, building material costs are lower in Wellington and Christchurch for all five typologies.
The costs of building materials are estimated based on retailer prices allowing for discounts up to 15% of the listed price, and exclude GST.
Deloitte Access Economics notes it is impossible to provide a robust comparison of the cost of individual building materials between New Zealand and Australia. Given volume discounts on building materials, rebate structures and tax structures, it would be difficult to unpick price differences between jurisdictions. The different pricing structures also results in a wide range of market prices available for the same product.
For example, based on quoted data from QV Cost Builder, the implied price for standard 10mm plasterboard in New Zealand is $9, while retail prices based on industry consultations range between $6 to $11 for the same product. This range for market prices for the same product is wider in Australia.
Doublestorey house
Town house (cost per unit)
Low-rise (cost per unit)
Concrete high-rise(cost per unit)
Timber high-rise (cost per unit)
Auckland $210,692 $160,689 $98,115 $117,300 $95,250
Wellington $198,968 $151,427 $91,887 $109,650 $89,942
Christchurch $198,836 $143,725 $93,212 $109,500 $92,175
Sydney $199,317 $183,092 $108,194 $130,570 $114,820
Melbourne $186,208 $163,895 $100,730 $122,435 $108,399
Source: Deloitte Access Economics analysis, based on QS data, QV Cost builder, Rawlinsons
Table 4.2 - Total building material costs for residential housing development by typology and location (NZD excluding GST)
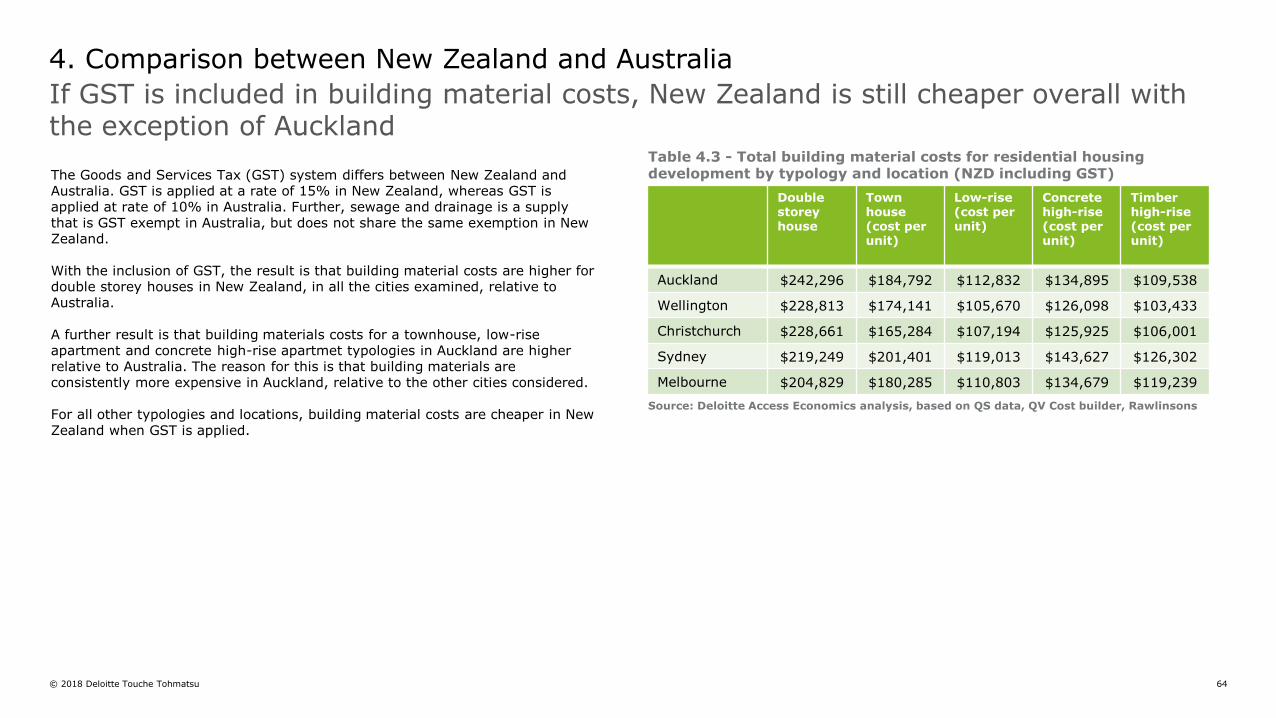
© 2018 Deloitte Touche Tohmatsu 64
4. Comparison between New Zealand and Australia
If GST is included in building material costs, New Zealand is still cheaper overall with the exception of Auckland
The Goods and Services Tax (GST) system differs between New Zealand and Australia. GST is applied at a rate of 15% in New Zealand, whereas GST is applied at rate of 10% in Australia. Further, sewage and drainage is a supply that is GST exempt in Australia, but does not share the same exemption in New Zealand.
With the inclusion of GST, the result is that building material costs are higher for double storey houses in New Zealand, in all the cities examined, relative to Australia.
A further result is that building materials costs for a townhouse, low-rise apartment and concrete high-rise apartmet typologies in Auckland are higher relative to Australia. The reason for this is that building materials are consistently more expensive in Auckland, relative to the other cities considered.
For all other typologies and locations, building material costs are cheaper in New Zealand when GST is applied.
Doublestorey house
Town house (cost per unit)
Low-rise (cost per unit)
Concrete high-rise(cost per unit)
Timber high-rise (cost per unit)
Auckland $242,296 $184,792 $112,832 $134,895 $109,538
Wellington $228,813 $174,141 $105,670 $126,098 $103,433
Christchurch $228,661 $165,284 $107,194 $125,925 $106,001
Sydney $219,249 $201,401 $119,013 $143,627 $126,302
Melbourne $204,829 $180,285 $110,803 $134,679 $119,239
Source: Deloitte Access Economics analysis, based on QS data, QV Cost builder, Rawlinsons
Table 4.3 - Total building material costs for residential housing development by typology and location (NZD including GST)
© 2018 Deloitte Touche Tohmatsu 65
New Zealand markets are generally more concentrated compared to Australian markets. It is therefore expected to see lower profit margins in Australia relative to countries with higher concentrated markets. Higher concentrated markets could see higher profit margin.
To test this hypothesis, Deloitte Access Economics looked at the profit margins of key building materials manufacturers operating in New Zealand and Australia.
The companies selected for comparison were chosen on the basis of being manufacturers of key building materials and having publically available financial statements.
The analysis is based on EBIT margins, rather than gross or net margins, to ensure the margins are comparable across companies.
We recognise a limitation of this analysis, in that some of the companies are vertically integrated with EBIT margin information not always available for segments of those firms, and the appropriate cost allocation between segments is complex. Therefore, it is difficult to compare margins of building material companies on a like for like basis.
The next page of this report shows the analysis of EBIT margins for building material companies in New Zealand and Australia. The analysis found margins are highly variable but overall New Zealand firms are comparable to those in Australia. This suggests that the profit margins obtained within New Zealand is comparable to a market where the market structure is less concentrated in the manufacturing of building materials.
Profit margins in New Zealand are comparable to margins in Australia for the manufacturing of key building materials
4. Comparison between New Zealand and Australia
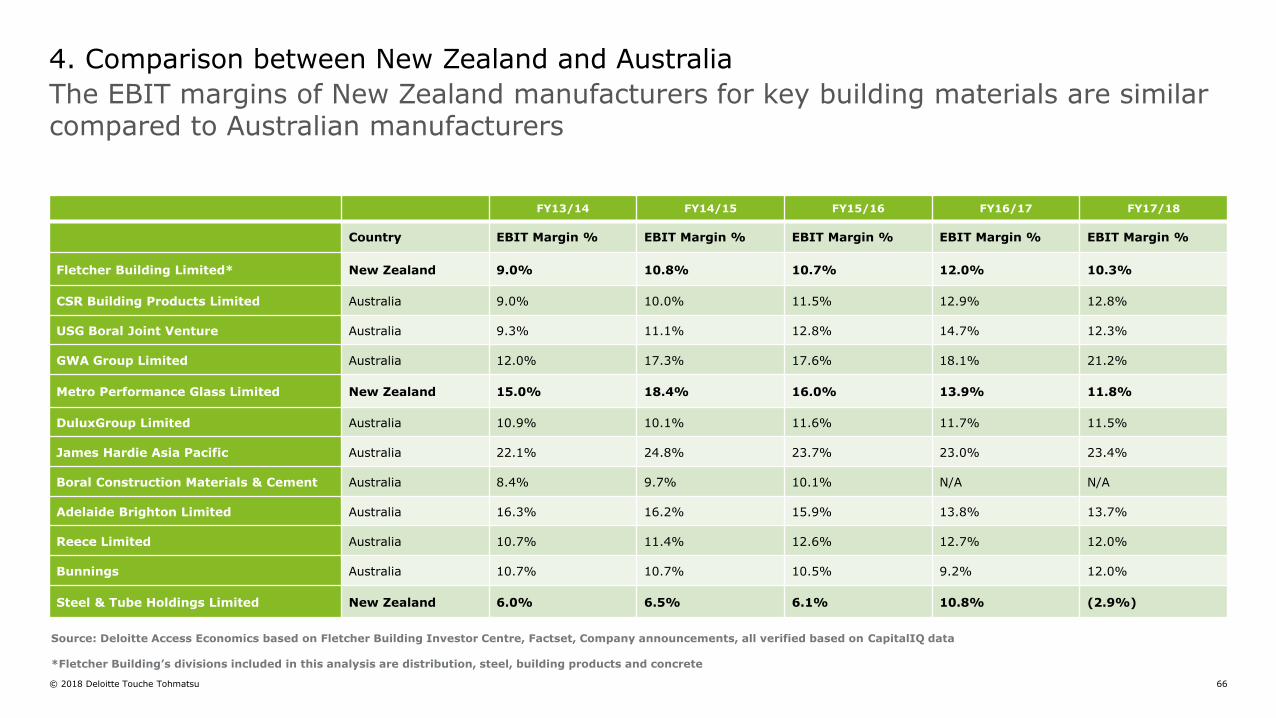
© 2018 Deloitte Touche Tohmatsu 66
The EBIT margins of New Zealand manufacturers for key building materials are similar compared to Australian manufacturers
4. Comparison between New Zealand and Australia
FY13/14 FY14/15 FY15/16 FY16/17 FY17/18
Country EBIT Margin % EBIT Margin % EBIT Margin % EBIT Margin % EBIT Margin %
Fletcher Building Limited* New Zealand 9.0% 10.8% 10.7% 12.0% 10.3%
CSR Building Products Limited Australia 9.0% 10.0% 11.5% 12.9% 12.8%
USG Boral Joint Venture Australia 9.3% 11.1% 12.8% 14.7% 12.3%
GWA Group Limited Australia 12.0% 17.3% 17.6% 18.1% 21.2%
Metro Performance Glass Limited New Zealand 15.0% 18.4% 16.0% 13.9% 11.8%
DuluxGroup Limited Australia 10.9% 10.1% 11.6% 11.7% 11.5%
James Hardie Asia Pacific Australia 22.1% 24.8% 23.7% 23.0% 23.4%
Boral Construction Materials & Cement Australia 8.4% 9.7% 10.1% N/A N/A
Adelaide Brighton Limited Australia 16.3% 16.2% 15.9% 13.8% 13.7%
Reece Limited Australia 10.7% 11.4% 12.6% 12.7% 12.0%
Bunnings Australia 10.7% 10.7% 10.5% 9.2% 12.0%
Steel & Tube Holdings Limited New Zealand 6.0% 6.5% 6.1% 10.8% (2.9%)
Source: Deloitte Access Economics based on Fletcher Building Investor Centre, Factset, Company announcements, all verified based on CapitalIQ data
*Fletcher Building’s divisions included in this analysis are distribution, steel, building products and concrete
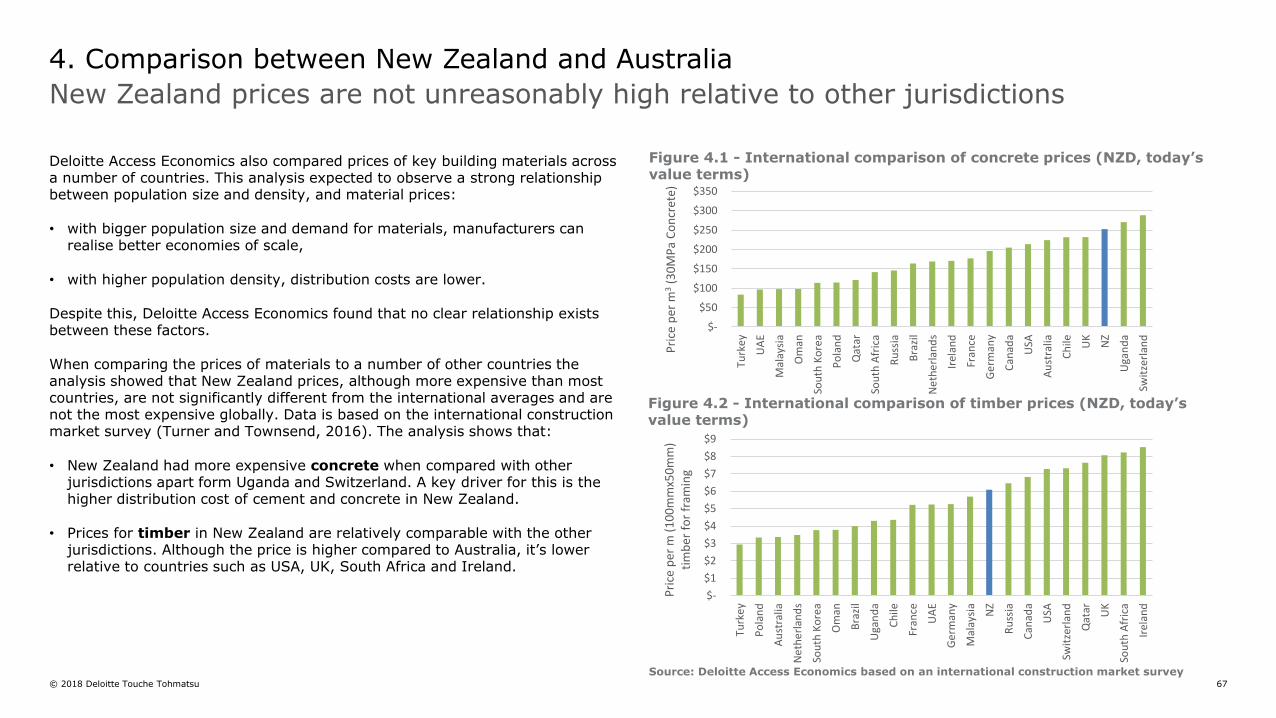
© 2018 Deloitte Touche Tohmatsu 67
$-
$1
$2
$3
$4
$5
$6
$7
$8
$9
Turk
ey
Po
lan
d
Au
stra
lia
Ne
the
rlan
ds
Sou
th K
ore
a
Om
an
Bra
zil
Uga
nd
a
Ch
ile
Fran
ce
UA
E
Ge
rman
y
Mal
aysi
a
NZ
Ru
ssia
Can
ada
USA
Swit
zerl
and
Qat
ar UK
Sou
th A
fric
a
Irel
and
Pri
ce p
er m
(1
00
mm
x50
mm
) ti
mb
er f
or
fram
ing
Deloitte Access Economics also compared prices of key building materials across a number of countries. This analysis expected to observe a strong relationship between population size and density, and material prices:
• with bigger population size and demand for materials, manufacturers can realise better economies of scale,
• with higher population density, distribution costs are lower.
Despite this, Deloitte Access Economics found that no clear relationship exists between these factors.
When comparing the prices of materials to a number of other countries the analysis showed that New Zealand prices, although more expensive than most countries, are not significantly different from the international averages and are not the most expensive globally. Data is based on the international construction market survey (Turner and Townsend, 2016). The analysis shows that:
• New Zealand had more expensive concrete when compared with other jurisdictions apart form Uganda and Switzerland. A key driver for this is the higher distribution cost of cement and concrete in New Zealand.
• Prices for timber in New Zealand are relatively comparable with the other jurisdictions. Although the price is higher compared to Australia, it’s lower relative to countries such as USA, UK, South Africa and Ireland.
4. Comparison between New Zealand and Australia
New Zealand prices are not unreasonably high relative to other jurisdictions
Source: Deloitte Access Economics based on an international construction market survey
$-
$50
$100
$150
$200
$250
$300
$350
Turk
ey
UA
E
Mal
aysi
a
Om
an
Sou
th K
ore
a
Po
lan
d
Qat
ar
Sou
th A
fric
a
Ru
ssia
Bra
zil
Ne
the
rlan
ds
Irel
and
Fran
ce
Ge
rman
y
Can
ada
USA
Au
stra
lia
Ch
ile UK
NZ
Uga
nd
a
Swit
zerl
and
Pri
ce p
er m
3(3
0M
Pa
Co
ncr
ete)
Figure 4.1 - International comparison of concrete prices (NZD, today’s value terms)
Figure 4.2 - International comparison of timber prices (NZD, today’s value terms)
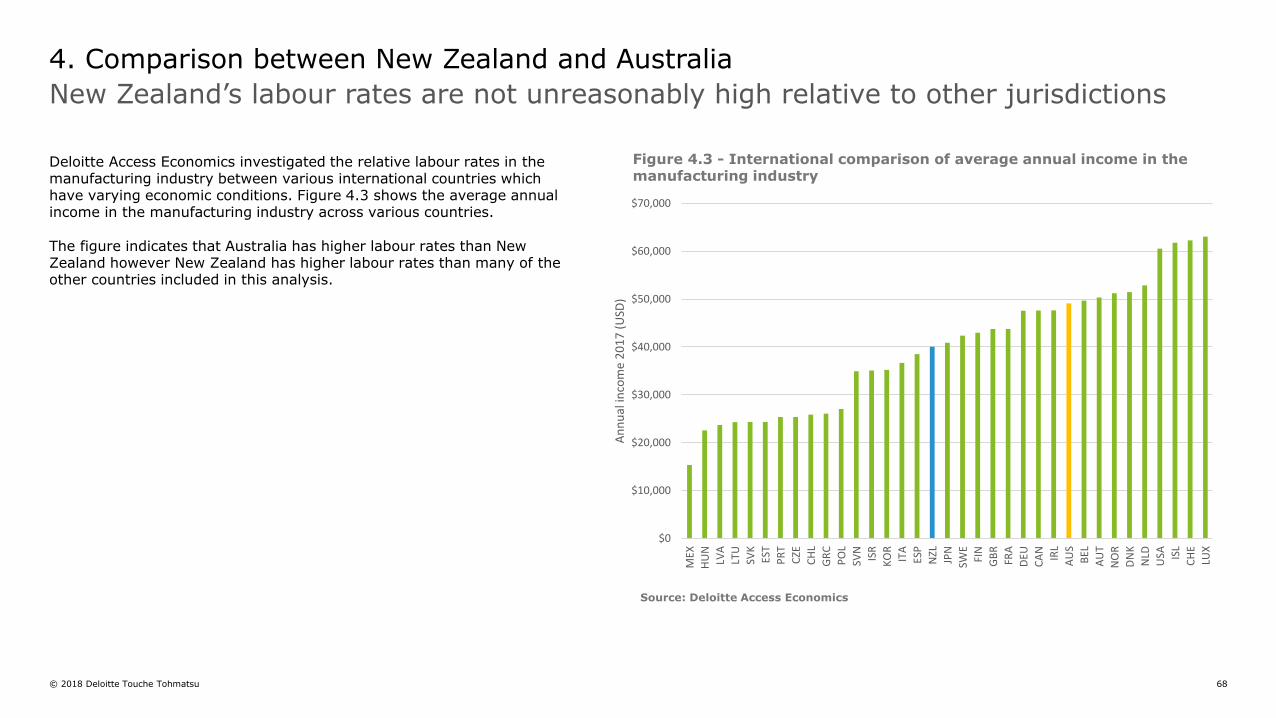
© 2018 Deloitte Touche Tohmatsu 68
4. Comparison between New Zealand and Australia
New Zealand’s labour rates are not unreasonably high relative to other jurisdictions
Source: Deloitte Access Economics
Deloitte Access Economics investigated the relative labour rates in the manufacturing industry between various international countries which have varying economic conditions. Figure 4.3 shows the average annual income in the manufacturing industry across various countries.
The figure indicates that Australia has higher labour rates than New Zealand however New Zealand has higher labour rates than many of the other countries included in this analysis.
$0
$10,000
$20,000
$30,000
$40,000
$50,000
$60,000
$70,000
MEX
HU
N
LVA
LTU
SVK
EST
PR
T
CZE
CH
L
GR
C
PO
L
SVN
ISR
KO
R
ITA
ESP
NZL
JPN
SWE
FIN
GB
R
FRA
DEU
CA
N
IRL
AU
S
BEL
AU
T
NO
R
DN
K
NLD
USA IS
L
CH
E
LUX
An
nu
al in
com
e 2
01
7 (
USD
)
Figure 4.3 - International comparison of average annual income in the manufacturing industry
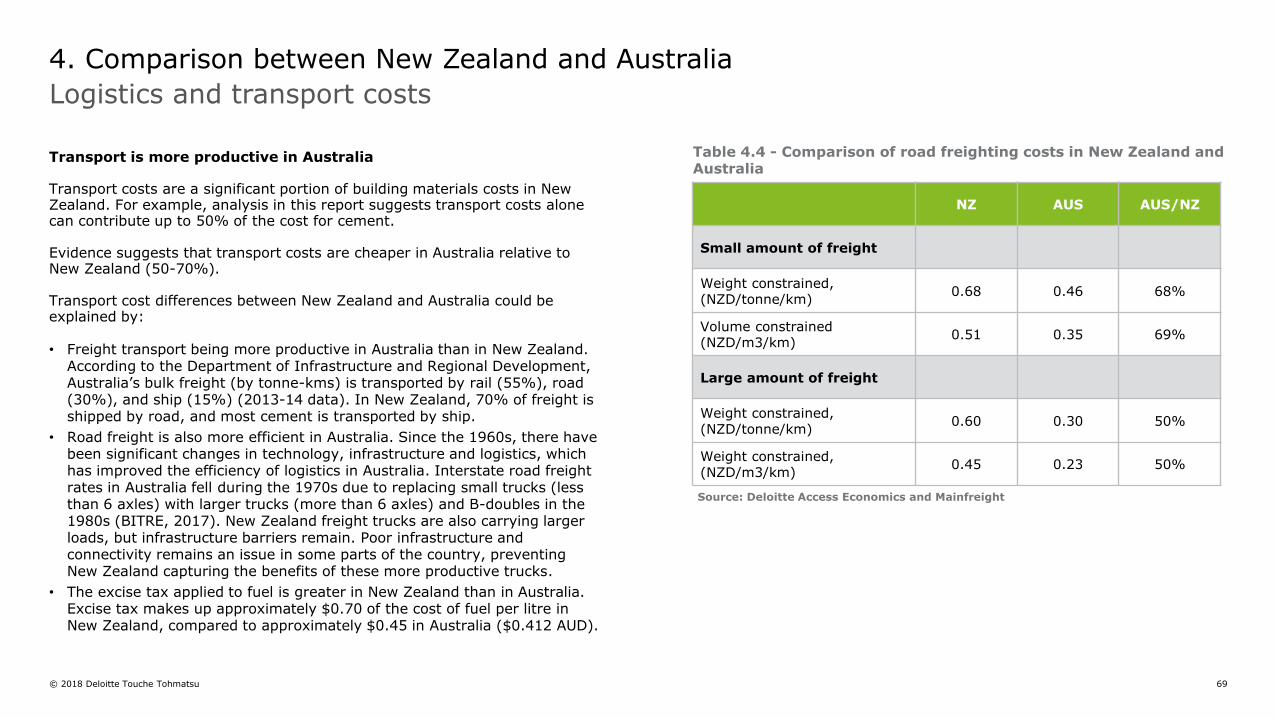
© 2018 Deloitte Touche Tohmatsu 69
Logistics and transport costs
4. Comparison between New Zealand and Australia
Transport is more productive in Australia
Transport costs are a significant portion of building materials costs in New Zealand. For example, analysis in this report suggests transport costs alone can contribute up to 50% of the cost for cement.
Evidence suggests that transport costs are cheaper in Australia relative to New Zealand (50-70%).
Transport cost differences between New Zealand and Australia could be explained by:
• Freight transport being more productive in Australia than in New Zealand. According to the Department of Infrastructure and Regional Development, Australia’s bulk freight (by tonne-kms) is transported by rail (55%), road (30%), and ship (15%) (2013-14 data). In New Zealand, 70% of freight is shipped by road, and most cement is transported by ship.
• Road freight is also more efficient in Australia. Since the 1960s, there have been significant changes in technology, infrastructure and logistics, which has improved the efficiency of logistics in Australia. Interstate road freight rates in Australia fell during the 1970s due to replacing small trucks (less than 6 axles) with larger trucks (more than 6 axles) and B-doubles in the 1980s (BITRE, 2017). New Zealand freight trucks are also carrying larger loads, but infrastructure barriers remain. Poor infrastructure and connectivity remains an issue in some parts of the country, preventing New Zealand capturing the benefits of these more productive trucks.
• The excise tax applied to fuel is greater in New Zealand than in Australia. Excise tax makes up approximately $0.70 of the cost of fuel per litre in New Zealand, compared to approximately $0.45 in Australia ($0.412 AUD).
NZ AUS AUS/NZ
Small amount of freight
Weight constrained, (NZD/tonne/km)
0.68 0.46 68%
Volume constrained (NZD/m3/km)
0.51 0.35 69%
Large amount of freight
Weight constrained, (NZD/tonne/km)
0.60 0.30 50%
Weight constrained, (NZD/m3/km)
0.45 0.23 50%
Source: Deloitte Access Economics and Mainfreight
Table 4.4 - Comparison of road freighting costs in New Zealand and Australia
© 2018 Deloitte Touche Tohmatsu 70
5. Building materials breakdown in New Zealand
© 2018 Deloitte Touche Tohmatsu 71
Residential buildings are made up of timber, concrete, and many other materials
5. Building materials breakdown
This section illustrates the material breakdown of the four residential typologies in New Zealand. Breaking the total material component into elements allows an understanding of the relative importance of various materials and ultimately how they contribute to overall residential development costs.
The difference in the cost of materials between Auckland, Wellington, and Christchurch is not significant in terms of the total cost of development. Therefore in this section, material costs are only broken down for Auckland.
The choice of floor plans and product specifications are based on the BRANZ physical characteristics of new houses in 2017 (BRANZ, 2018), which describes the materials used in all types of new houses.
Material quantities were estimated by a quantity surveyor from Emmitt Consulting and prices were applied using QV Cost Builder.
The key materials focussed on are:• Wood and timber (including framing timber and structural material), • Concrete,• Steel,• Insulation, and• Plasterboard.
Other materials or significant groups of materials are:• Materials associated with electrical and mechanical services, such as tools,
plastic parts, and wire,• Plumbing and drainage items, including plastic piping, hot water cylinder,
shower unit,• Cladding, usually timber or plaster,• Paint, • Floor coverings, such as carpet and particle board, • Lifts, which are made up of steel aluminium, glass, etc., and• Windows.
Building a house is complex and requires a vast amount of materials such as building paper, netting, glue, nails, fittings and fixtures, among others. Deloitte Access Economics understands that there are as many as 45,000 different products that could go into a house. As many materials are individually a very small component of the total, materials not specifically identified are combined into the ‘other’ category, making up around a quarter of overall material costs in each typology.
It is important to understand that the typologies do not represent an average across all buildings. Rather, this exercise illustrates the potential combination of materials across our four example building types.
A typical concrete framed high-rise building is compared to a high-rise made out of timber to illustrate the impact that the choice of materials can have on the overall cost.
© 2018 Deloitte Touche Tohmatsu 72
5. Building materials breakdown
Overall, plasterboard made up a relatively minor proportion of total material cost, at 2.5% to 4.6%.
Steel roofing was 2.6% of a cost of a double storey house. Had the example house been a single storey house, this proportion would have increased.
Multi-unit developments saw the proportion of steel roofing costs fall below 1.2%.
Other key components were plumbing and drainage items, windows, and materials relating to electrical and mechanical services.
The cost contribution of building materials differ across typologies for residential housing development
The cost contribution of each building material differ, according to typology or the materials chosen.
The largest cost component of timber framed houses was wood and timber, accounting for 16% of material costs in Auckland.
Concrete was the largest component of the concrete high-rise apartment building, making up 24% of material costs. In contrast, concrete made up 7.4% of the material costs for a double storey house and 4.3% of a low-rise apartment building. Concrete is a key material in some structural components and flooring. However, according to BRANZ (2018) other flooring types such as wood and particleboard are becoming more common, due to the higher proportion of double storey houses being built.
Cladding was also a significant individual cost component, with timber weatherboards accounting for 4.2% of costs in a double storey house. Over 40% of new houses built in 2017 were clad with timber weatherboards. The market share of brick clay and concrete has declined since 2013. However, we use a mix of plaster and concrete cladding in the four and 10-storey apartment buildings.
Insulation made up only a small proportion of costs, between 1.4% and 2.2%. This is despite a high R-value being used across all building types. Glass wool insulation was the dominant wall and ceiling insulation in new houses in 2017, at 90% (BRANZ, 2018).
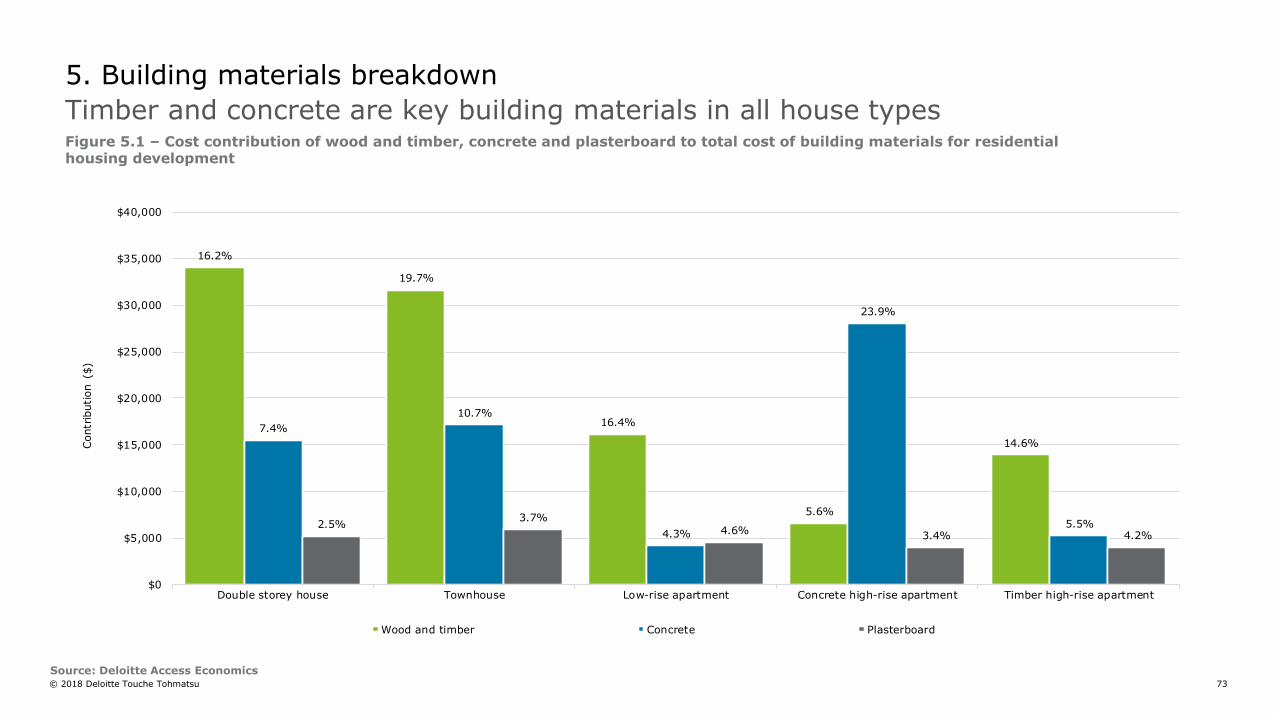
© 2018 Deloitte Touche Tohmatsu 73
5. Building materials breakdown
Timber and concrete are key building materials in all house types Figure 5.1 – Cost contribution of wood and timber, concrete and plasterboard to total cost of building materials for residential housing development
Source: Deloitte Access Economics
16.2%
19.7%
16.4%
5.6%
14.6%
7.4%
10.7%
4.3%
23.9%
5.5%2.5%3.7%
4.6%3.4% 4.2%
$0
$5,000
$10,000
$15,000
$20,000
$25,000
$30,000
$35,000
$40,000
Double storey house Townhouse Low-rise apartment Concrete high-rise apartment Timber high-rise apartment
Contr
ibution ($
)
Wood and timber Concrete Plasterboard
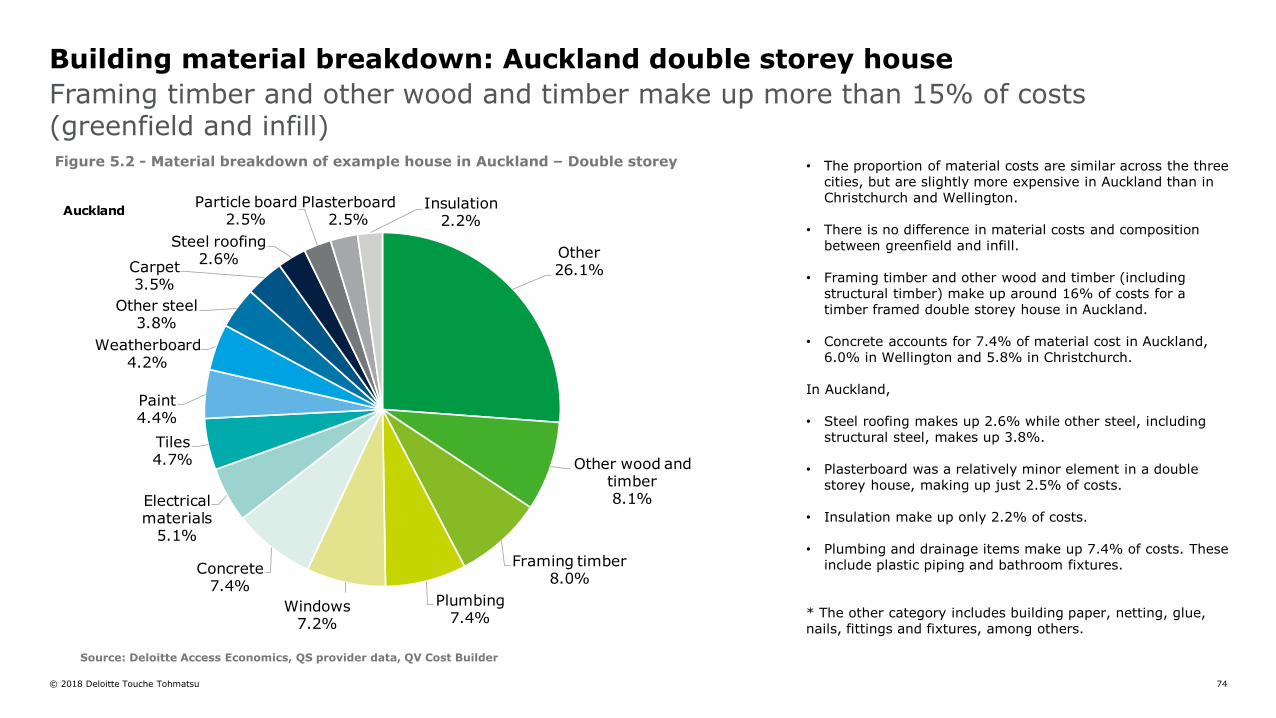
© 2018 Deloitte Touche Tohmatsu 74
Figure 5.2 - Material breakdown of example house in Auckland – Double storey
Framing timber and other wood and timber make up more than 15% of costs (greenfield and infill)
Building material breakdown: Auckland double storey house
• The proportion of material costs are similar across the three cities, but are slightly more expensive in Auckland than in Christchurch and Wellington.
• There is no difference in material costs and composition between greenfield and infill.
• Framing timber and other wood and timber (including structural timber) make up around 16% of costs for a timber framed double storey house in Auckland.
• Concrete accounts for 7.4% of material cost in Auckland, 6.0% in Wellington and 5.8% in Christchurch.
In Auckland,
• Steel roofing makes up 2.6% while other steel, including structural steel, makes up 3.8%.
• Plasterboard was a relatively minor element in a double storey house, making up just 2.5% of costs.
• Insulation make up only 2.2% of costs.
• Plumbing and drainage items make up 7.4% of costs. These include plastic piping and bathroom fixtures.
* The other category includes building paper, netting, glue, nails, fittings and fixtures, among others.
Source: Deloitte Access Economics based on data from Emmitt ConsultingSource: Deloitte Access Economics, QS provider data, QV Cost Builder
Other26.1%
Other wood and timber8.1%
Framing timber8.0%
Plumbing7.4%
Windows7.2%
Concrete7.4%
Electrical materials
5.1%
Tiles4.7%
Paint4.4%
Weatherboard4.2%
Other steel3.8%
Carpet3.5%
Steel roofing2.6%
Particle board2.5%
Plasterboard2.5%
Insulation2.2%
Auckland
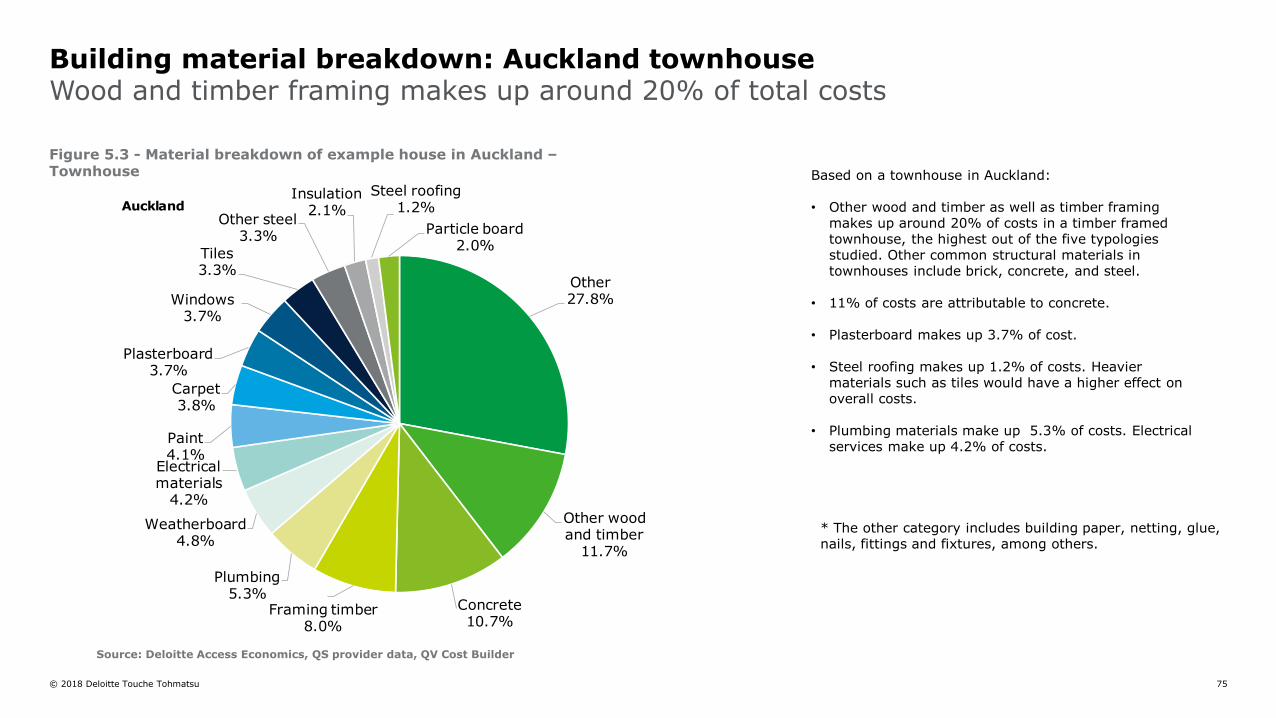
© 2018 Deloitte Touche Tohmatsu 75
Wood and timber framing makes up around 20% of total costsBuilding material breakdown: Auckland townhouse
* The other category includes building paper, netting, glue, nails, fittings and fixtures, among others.
Based on a townhouse in Auckland:
• Other wood and timber as well as timber framing makes up around 20% of costs in a timber framed townhouse, the highest out of the five typologies studied. Other common structural materials in townhouses include brick, concrete, and steel.
• 11% of costs are attributable to concrete.
• Plasterboard makes up 3.7% of cost.
• Steel roofing makes up 1.2% of costs. Heavier materials such as tiles would have a higher effect on overall costs.
• Plumbing materials make up 5.3% of costs. Electrical services make up 4.2% of costs.
Figure 5.3 - Material breakdown of example house in Auckland –Townhouse
Source: Deloitte Access Economics, QS provider data, QV Cost Builder
Other27.8%
Other wood and timber
11.7%
Concrete10.7%
Framing timber8.0%
Plumbing5.3%
Weatherboard4.8%
Electrical materials
4.2%
Paint4.1%
Carpet3.8%
Plasterboard3.7%
Windows3.7%
Tiles3.3%
Other steel3.3%
Insulation2.1%
Steel roofing1.2%
Particle board2.0%
Auckland
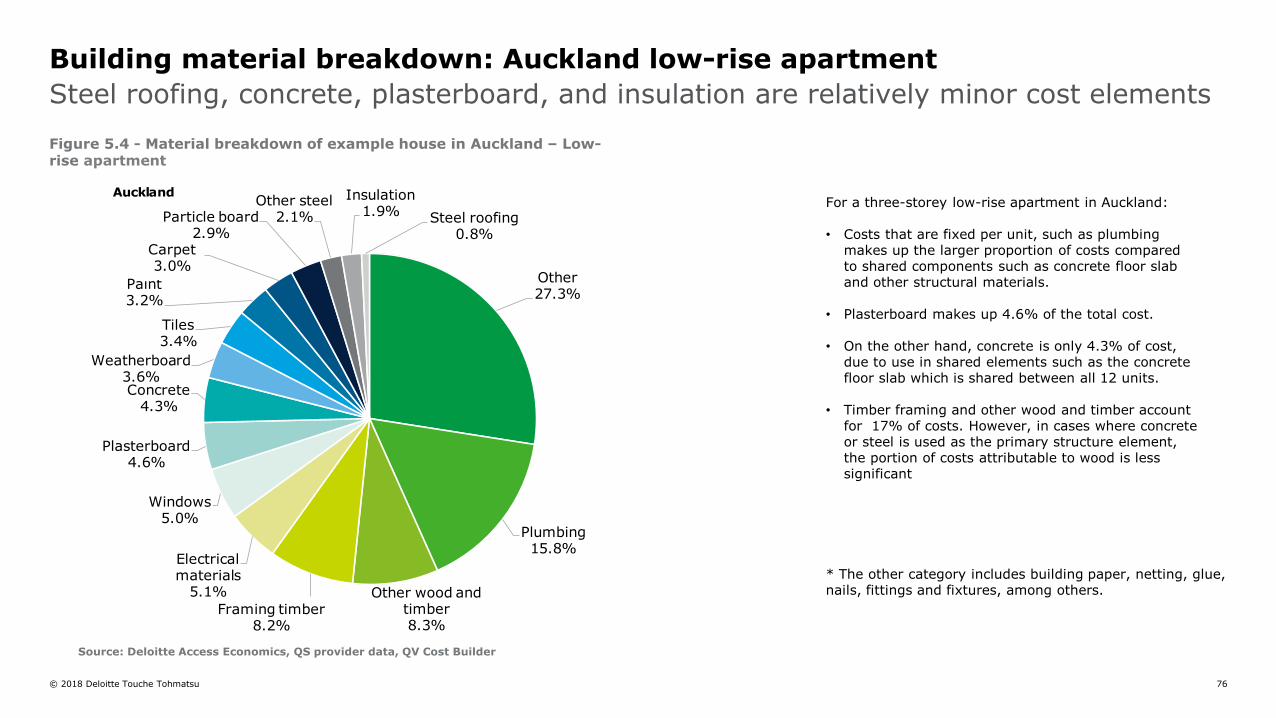
© 2018 Deloitte Touche Tohmatsu 76
Steel roofing, concrete, plasterboard, and insulation are relatively minor cost elements
Building material breakdown: Auckland low-rise apartment
For a three-storey low-rise apartment in Auckland:
• Costs that are fixed per unit, such as plumbing makes up the larger proportion of costs compared to shared components such as concrete floor slab and other structural materials.
• Plasterboard makes up 4.6% of the total cost.
• On the other hand, concrete is only 4.3% of cost, due to use in shared elements such as the concrete floor slab which is shared between all 12 units.
• Timber framing and other wood and timber account for 17% of costs. However, in cases where concrete or steel is used as the primary structure element, the portion of costs attributable to wood is less significant
* The other category includes building paper, netting, glue, nails, fittings and fixtures, among others.
Figure 5.4 - Material breakdown of example house in Auckland – Low-rise apartment
Source: Deloitte Access Economics, QS provider data, QV Cost Builder
Other27.3%
Plumbing15.8%
Other wood and timber8.3%
Framing timber8.2%
Electrical materials
5.1%
Windows5.0%
Plasterboard4.6%
Concrete4.3%
Weatherboard3.6%
Tiles3.4%
Paint3.2%
Carpet3.0%
Particle board2.9%
Other steel2.1%
Insulation1.9% Steel roofing
0.8%
Auckland
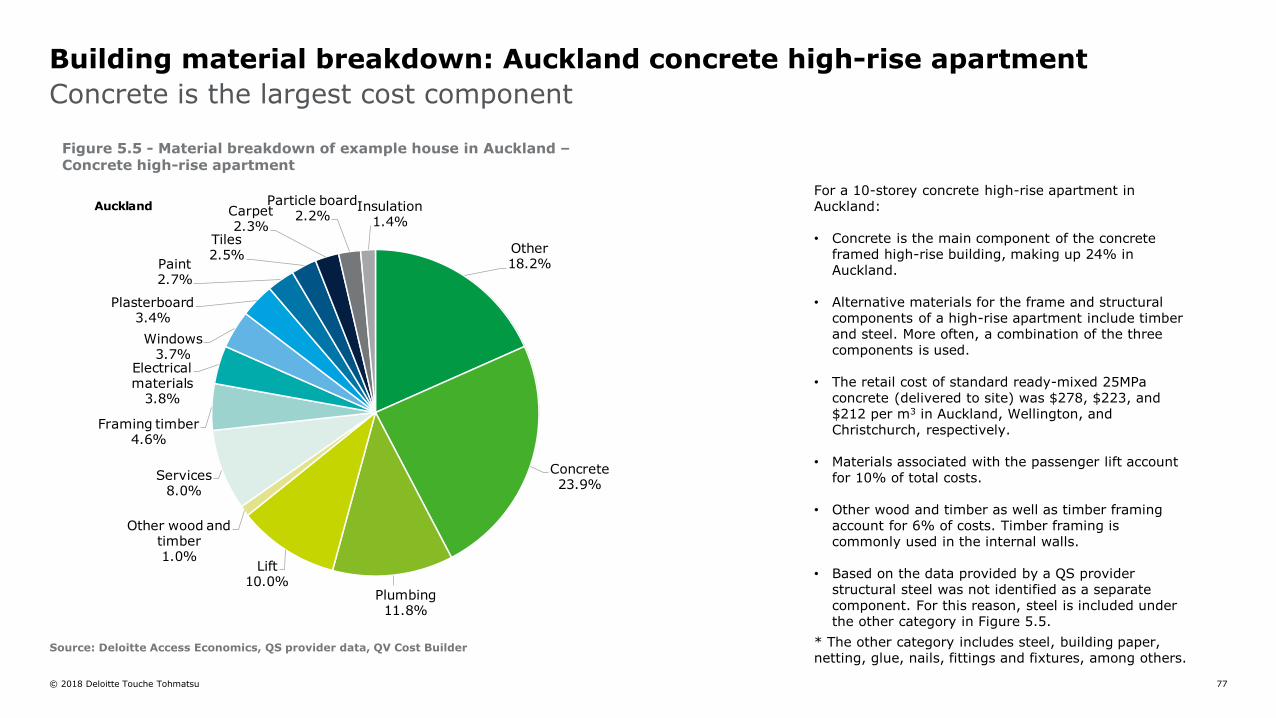
© 2018 Deloitte Touche Tohmatsu 77
Concrete is the largest cost component
Building material breakdown: Auckland concrete high-rise apartment
For a 10-storey concrete high-rise apartment in Auckland:
• Concrete is the main component of the concrete framed high-rise building, making up 24% in Auckland.
• Alternative materials for the frame and structural components of a high-rise apartment include timber and steel. More often, a combination of the three components is used.
• The retail cost of standard ready-mixed 25MPa concrete (delivered to site) was $278, $223, and $212 per m3 in Auckland, Wellington, and Christchurch, respectively.
• Materials associated with the passenger lift account for 10% of total costs.
• Other wood and timber as well as timber framing account for 6% of costs. Timber framing is commonly used in the internal walls.
• Based on the data provided by a QS provider structural steel was not identified as a separate component. For this reason, steel is included under the other category in Figure 5.5.
* The other category includes steel, building paper, netting, glue, nails, fittings and fixtures, among others.
Figure 5.5 - Material breakdown of example house in Auckland –Concrete high-rise apartment
Source: Deloitte Access Economics, QS provider data, QV Cost Builder
Other18.2%
Concrete23.9%
Plumbing11.8%
Lift10.0%
Other wood and timber1.0%
Services8.0%
Framing timber4.6%
Electrical materials
3.8%
Windows3.7%
Plasterboard3.4%
Paint2.7%
Tiles2.5%
Carpet2.3%
Particle board2.2%
Insulation1.4%
Auckland
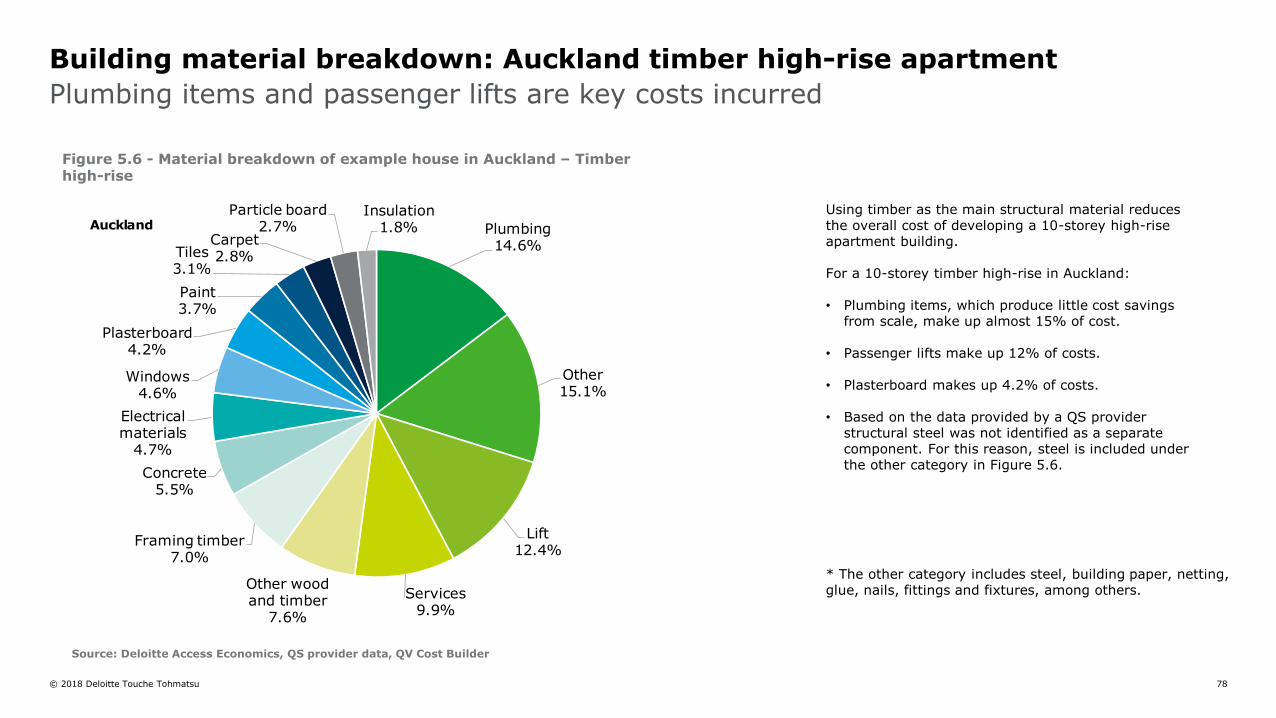
© 2018 Deloitte Touche Tohmatsu 78
Plumbing items and passenger lifts are key costs incurred
Building material breakdown: Auckland timber high-rise apartment
Using timber as the main structural material reduces the overall cost of developing a 10-storey high-rise apartment building.
For a 10-storey timber high-rise in Auckland:
• Plumbing items, which produce little cost savings from scale, make up almost 15% of cost.
• Passenger lifts make up 12% of costs.
• Plasterboard makes up 4.2% of costs.
• Based on the data provided by a QS provider structural steel was not identified as a separate component. For this reason, steel is included under the other category in Figure 5.6.
* The other category includes electrical items, fittings and fixtures, building paper, and tools, among others.
* The other category includes steel, building paper, netting, glue, nails, fittings and fixtures, among others.
Figure 5.6 - Material breakdown of example house in Auckland – Timber high-rise
Source: Deloitte Access Economics, QS provider data, QV Cost Builder
Plumbing14.6%
Other15.1%
Lift12.4%
Services9.9%
Other wood and timber
7.6%
Framing timber7.0%
Concrete5.5%
Electrical materials
4.7%
Windows4.6%
Plasterboard4.2%
Paint3.7%
Tiles3.1%
Carpet2.8%
Particle board2.7%
Insulation1.8%Auckland
© 2018 Deloitte Touche Tohmatsu 79
6. Factors influencing building material prices
© 2018 Deloitte Touche Tohmatsu 80
Deloitte Access Economics considered three questions to understand the factors influencing building material prices:
• To what extent is market structure a factor in driving prices of building materials?
• To what extent are input costs influencing building material prices?
• To what extent are other factors driving building material prices?
To answer these questions, Deloitte Access Economics investigated five key building materials, namely insulation, cement, steel roofing, timber framing, and plasterboard based on targeted interviews, publically available data and data provided by Fletcher Building.
To what extent is market structure a factor in driving prices of building materials?
From a demand perspective, the purchasers of building materials comprise of group home builders, commercial builders, medium to small residential builders, and other, which includes DIY customers. Data provided by Fletcher Building indicates that most of the demand is coming from medium to small residential builders, comprising about 50% of demand. This is followed by commercial builders comprising about 20% of demand, and group home builders, comprising about 15% of demand.
Consumers rely on architects and builders to select, source and purchase building materials on their behalf which indicates that specifiers have a large degree of influence on building materials purchased. Interviews suggested that architects and builders have an incentive to specify building materials guaranteed to be accepted by councils.
Architects and builders prefer building materials that they know and trust due to the risks associated with testing new products such as changing consents or rework, both of which add cost and time to a project. This in effect lessens competition as it increases entry barriers to new operators and new innovative products from entering the market.
From a supply perspective, at wholesale level, each building material has different competitive conditions. A common characteristic in the manufacture and wholesale supply of key building materials tends to be concentrated with limited players.
This market structure provides an incentive and ability for providers to price higher compared to markets with greater levels of competition. Based on this theory, if the prices are higher than those in a competitive market, new market entrants would be likely. However, this does not occur in those building materials markets where they are highly concentrated.
In some markets, imports tend to provide a credible constraint on domestic players, either through price competition, or through non-price competition – for example through a need for product differentiation such as sales and after-sales services.
The predominant retail channel for building materials is through merchants. There are five merchants, all operating on a national level. The merchants have different operating models and each have a revenue share of 10-25% on a national level. This indicates that merchants are unlikely to have market power.
6. Factors influencing building material prices
Key findings
© 2018 Deloitte Touche Tohmatsu 81
To what extent are input costs influencing building material prices?
Deloitte Access Economics explored the changes in key input costs for each building material. Overall, it seems that the change in wholesale prices are less than the increase in key input costs. This suggests that providers have been absorbing some of the input costs increases to supply the domestic market. This suggests competition is effective.
However, this benefit is not always observed in the retail level of the market and further research is required to understand why the efficiencies and benefits are not transparent for end users.
To what extent are other factors driving building material prices?
Two other key factors potentially driving building material prices are regulation and incentive structures.
Regulation. Analysis in this report suggests regulation is likely to promote and hinder competition:
• Suspension of import tariffs and the CodeMark scheme is intended to promote innovation, and thereby competition.
• Key regulatory barriers include brand specification, the cost of certifying materials, subjectivity in applying the building code, and risk aversion leading to over compliance with regulation.
Incentive structures. There are various incentive structures built into the building materials industry, on all levels of the supply chain:
• At the wholesale level, providers offer targeted discounts and rebates to merchants. While rebates are designed to attract volumes this also implies that merchants have countervailing power reflected in the rebates and discounts.
• At the retail level, larger merchants offer volume discounts on building material products, if the product is purchased under an account. Deloitte Access Economics notes that the discounts are offered on a similar basis to all customers.
In terms of rebates offered at wholesale level, the Commerce Commission (2014) found that the rebate structures are not resulting in exclusionary conduct or predatory pricing. Evidence suggests that the rebate structures used today are the similar to the rebate structure used in 2014.
Because the merchants are unlikely to have market power due to their low respective market shares, their conduct is unlikely to result in a exclusionary effect in the market. If, however, the discounts are only offered on higher priced products, this could incentivise end users to buy those materials and this could increase the cost of building materials.
6. Factors influencing building material prices
Key findings
82
Cement and ready-mix concrete
© 2018 Deloitte Touche Tohmatsu 83
What is cement?
Cement is made from a mixture of finely ground limestone or chalk (or other materials with a high calcium content), clay and sand (or other sources of silica and alumina), which is heated almost to melting point, creating an intermediate product, cement clinker. The finished cement is produced by grinding together cement clinker with additives to produce a fine powder. Most cement supplied in New Zealand is in bulk and among other uses, cement is mixed with aggregates and water to produce ready-mix concrete and other concrete products such as concrete blocks.
The analysis in this report focuses on the manufacture of bulk cement, rather than bagged cement. More than 80% of wholesale supply of cement is bulk cement.
Existing level of competition in the manufacture and wholesale supply of cement
There are four main players operating in the manufacture and wholesale supply of cement. Domestic manufacturers are Fletcher Building’s Golden Bay Cement (GBC) and HR Cement who face strong competition from importers, namely Holcim and Drymix.
HR cement domestically manufactures cement in Tauranga, while GBC has manufacturing plants in Whangarei and service centres in Auckland, Napier, Wellington, Nelson, Timaru and Dunedin.
This market has a high degree of concentration and is dominated by GBC and Holcim, the two companies combined serve approximately 85% of the national market.
Existing level of competition in the wholesale supply of ready-mix concrete
As part of our analysis of cement, Deloitte Access Economics also considered competitive conditions in ready-mix concrete, of which cement is a key input.
Most cement manufacturers are vertically integrated and manufacture and supply both cement and ready-mix concrete. Competition conditions also vary across regions in New Zealand. For example, estimated regional market shares suggests that Fletcher Building has a market share of around 90% in Northland, but 9% in Otago.
Product differentiation is based on service delivery
As there is a low degree of product differentiation, suppliers have a number of service factors which they employ which influence consumers’ decision to choose cement suppliers. For example that cement wholesale suppliers have a ‘backstop’ commitment that sees customers get a free load of cement if their silos run out.
Because Fletcher Building is a domestic manufacturer, it has a greater ability to respond to sudden changes in demand relative to its competitors who import cement into New Zealand.
6.1. Factors influencing the price of cement and ready-mix concrete
Competitiveness of the wholesale supply of cement and ready-mix concrete
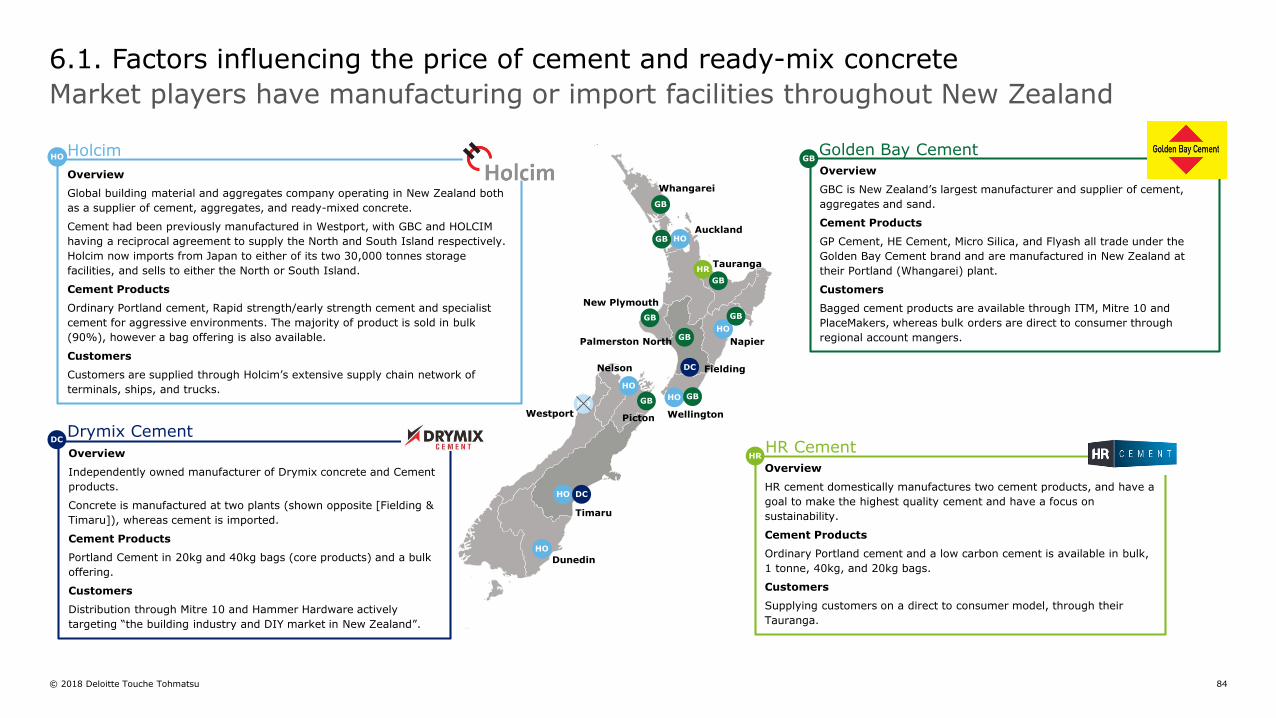
© 2018 Deloitte Touche Tohmatsu 84
6.1. Factors influencing the price of cement and ready-mix concrete
Market players have manufacturing or import facilities throughout New Zealand
Whangarei
Fielding
Tauranga
Timaru
Westport
Overview
Independently owned manufacturer of Drymix concrete and Cement
products.
Concrete is manufactured at two plants (shown opposite [Fielding &
Timaru]), whereas cement is imported.
Cement Products
Portland Cement in 20kg and 40kg bags (core products) and a bulk
offering.
Customers
Distribution through Mitre 10 and Hammer Hardware actively
targeting “the building industry and DIY market in New Zealand”.
Overview
HR cement domestically manufactures two cement products, and have a
goal to make the highest quality cement and have a focus on
sustainability.
Cement Products
Ordinary Portland cement and a low carbon cement is available in bulk,
1 tonne, 40kg, and 20kg bags.
Customers
Supplying customers on a direct to consumer model, through their
Tauranga.
Overview
GBC is New Zealand’s largest manufacturer and supplier of cement,
aggregates and sand.
Cement Products
GP Cement, HE Cement, Micro Silica, and Flyash all trade under the
Golden Bay Cement brand and are manufactured in New Zealand at
their Portland (Whangarei) plant.
Customers
Bagged cement products are available through ITM, Mitre 10 and
PlaceMakers, whereas bulk orders are direct to consumer through
regional account mangers.
HR
HR
DC
HOAuckland
HO
HO
DC
DC
HO
HO
HO
HO
Dunedin
Wellington
Napier
Nelson
GB
GB
GB
GB
GBGB
New Plymouth
GBPalmerston North
GBGB
Picton
Overview
Global building material and aggregates company operating in New Zealand both
as a supplier of cement, aggregates, and ready-mixed concrete.
Cement had been previously manufactured in Westport, with GBC and HOLCIM
having a reciprocal agreement to supply the North and South Island respectively.
Holcim now imports from Japan to either of its two 30,000 tonnes storage
facilities, and sells to either the North or South Island.
Cement Products
Ordinary Portland cement, Rapid strength/early strength cement and specialist
cement for aggressive environments. The majority of product is sold in bulk
(90%), however a bag offering is also available.
Customers
Customers are supplied through Holcim’s extensive supply chain network of
terminals, ships, and trucks.
HO Holcim
Drymix Cement
Golden Bay Cement
HR Cement
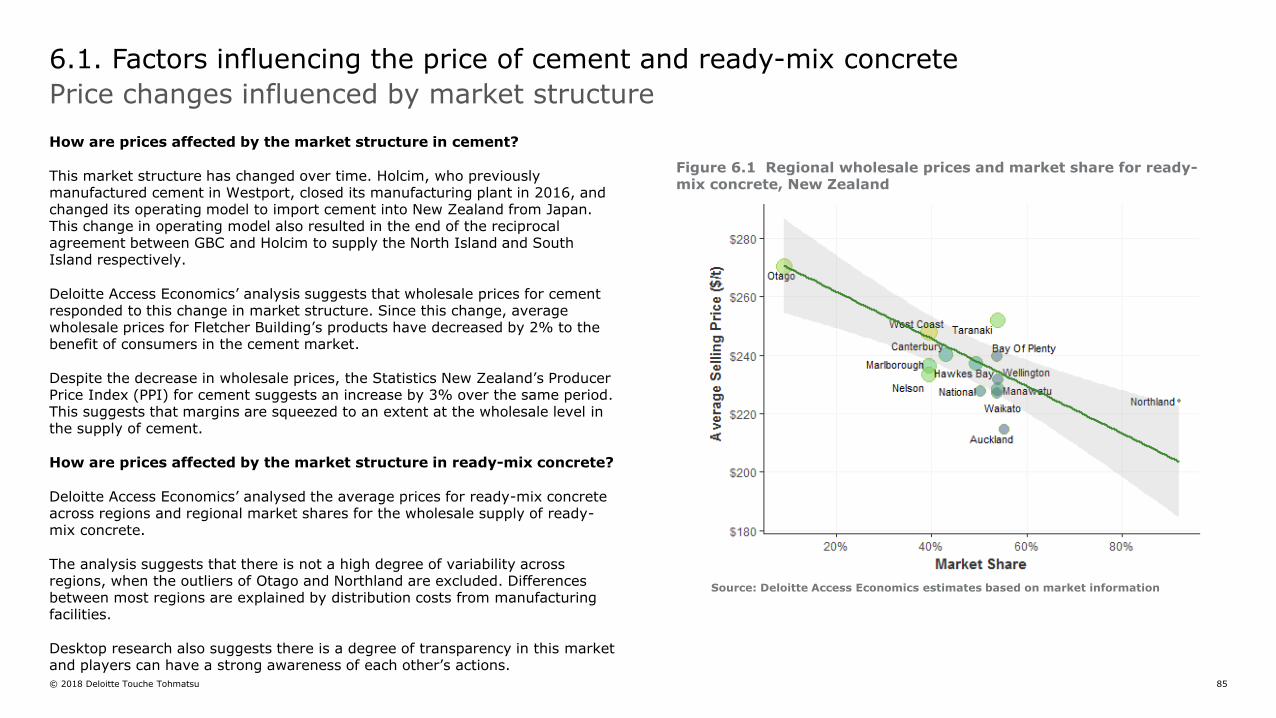
© 2018 Deloitte Touche Tohmatsu 85
How are prices affected by the market structure in cement?
This market structure has changed over time. Holcim, who previously manufactured cement in Westport, closed its manufacturing plant in 2016, and changed its operating model to import cement into New Zealand from Japan. This change in operating model also resulted in the end of the reciprocal agreement between GBC and Holcim to supply the North Island and South Island respectively.
Deloitte Access Economics’ analysis suggests that wholesale prices for cement responded to this change in market structure. Since this change, average wholesale prices for Fletcher Building’s products have decreased by 2% to the benefit of consumers in the cement market.
Despite the decrease in wholesale prices, the Statistics New Zealand’s Producer Price Index (PPI) for cement suggests an increase by 3% over the same period. This suggests that margins are squeezed to an extent at the wholesale level in the supply of cement.
How are prices affected by the market structure in ready-mix concrete?
Deloitte Access Economics’ analysed the average prices for ready-mix concrete across regions and regional market shares for the wholesale supply of ready-mix concrete.
The analysis suggests that there is not a high degree of variability across regions, when the outliers of Otago and Northland are excluded. Differences between most regions are explained by distribution costs from manufacturing facilities.
Desktop research also suggests there is a degree of transparency in this market and players can have a strong awareness of each other’s actions.
6.1. Factors influencing the price of cement and ready-mix concrete
Price changes influenced by market structure
Source: Deloitte Access Economics estimates based on market information
Figure 6.1 Regional wholesale prices and market share for ready-mix concrete, New Zealand
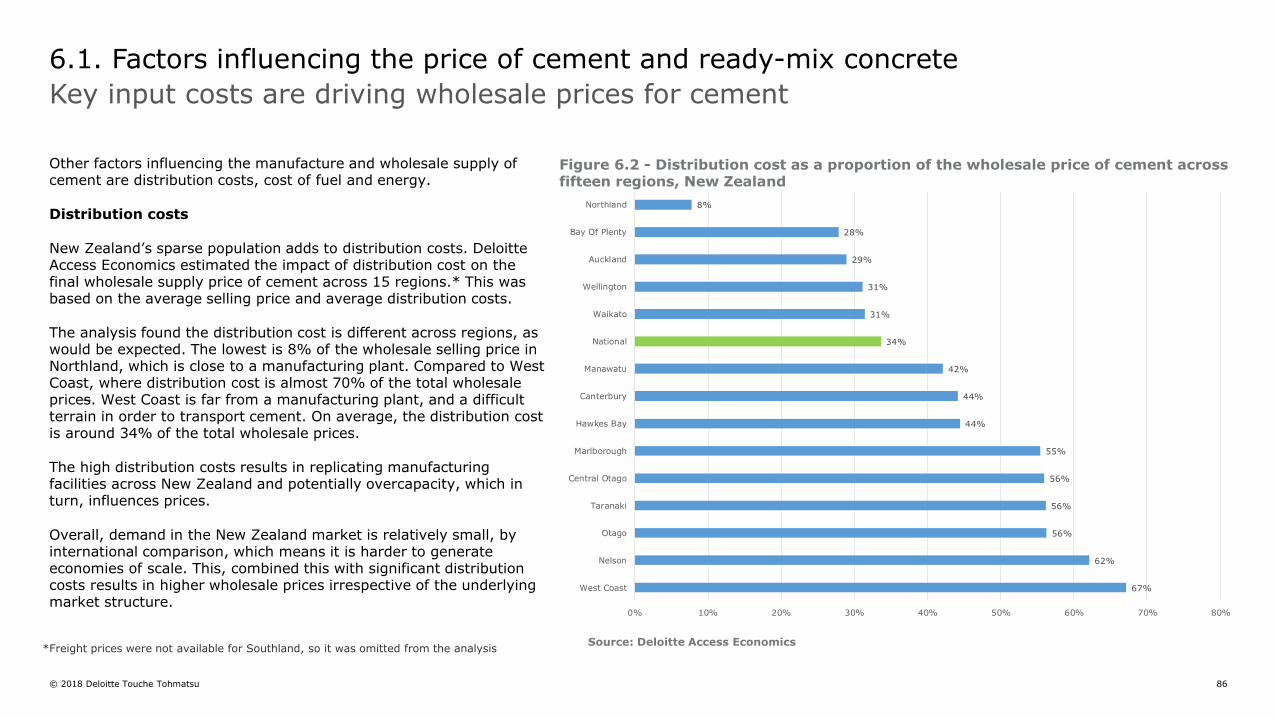
© 2018 Deloitte Touche Tohmatsu 86
Other factors influencing the manufacture and wholesale supply of cement are distribution costs, cost of fuel and energy.
Distribution costs
New Zealand’s sparse population adds to distribution costs. Deloitte Access Economics estimated the impact of distribution cost on the final wholesale supply price of cement across 15 regions.* This was based on the average selling price and average distribution costs.
The analysis found the distribution cost is different across regions, as would be expected. The lowest is 8% of the wholesale selling price in Northland, which is close to a manufacturing plant. Compared to West Coast, where distribution cost is almost 70% of the total wholesale prices. West Coast is far from a manufacturing plant, and a difficult terrain in order to transport cement. On average, the distribution cost is around 34% of the total wholesale prices.
The high distribution costs results in replicating manufacturing facilities across New Zealand and potentially overcapacity, which in turn, influences prices.
Overall, demand in the New Zealand market is relatively small, by international comparison, which means it is harder to generate economies of scale. This, combined this with significant distribution costs results in higher wholesale prices irrespective of the underlying market structure.
6.1. Factors influencing the price of cement and ready-mix concrete
Key input costs are driving wholesale prices for cement
67%
62%
56%
56%
56%
55%
44%
44%
42%
34%
31%
31%
29%
28%
8%
0% 10% 20% 30% 40% 50% 60% 70% 80%
West Coast
Nelson
Otago
Taranaki
Central Otago
Marlborough
Hawkes Bay
Canterbury
Manawatu
National
Waikato
Wellington
Auckland
Bay Of Plenty
Northland
Source: Deloitte Access Economics
Figure 6.2 - Distribution cost as a proportion of the wholesale price of cement across fifteen regions, New Zealand
*Freight prices were not available for Southland, so it was omitted from the analysis
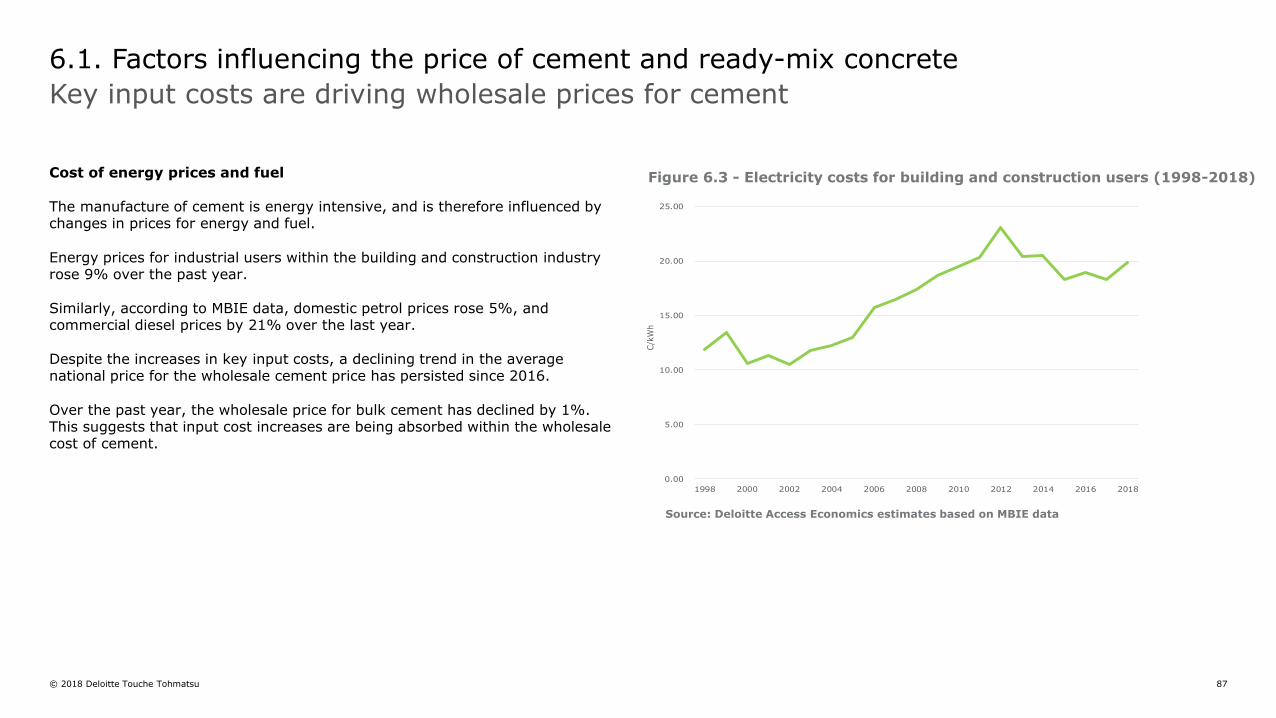
© 2018 Deloitte Touche Tohmatsu 87
Cost of energy prices and fuel
The manufacture of cement is energy intensive, and is therefore influenced by changes in prices for energy and fuel.
Energy prices for industrial users within the building and construction industry rose 9% over the past year.
Similarly, according to MBIE data, domestic petrol prices rose 5%, and commercial diesel prices by 21% over the last year.
Despite the increases in key input costs, a declining trend in the average national price for the wholesale cement price has persisted since 2016.
Over the past year, the wholesale price for bulk cement has declined by 1%. This suggests that input cost increases are being absorbed within the wholesale cost of cement.
6.1. Factors influencing the price of cement and ready-mix concrete
Key input costs are driving wholesale prices for cement
0.00
5.00
10.00
15.00
20.00
25.00
1998 2000 2002 2004 2006 2008 2010 2012 2014 2016 2018
C/k
Wh
Figure 6.3 - Electricity costs for building and construction users (1998-2018)
Source: Deloitte Access Economics estimates based on MBIE data

88
Plasterboard
© 2018 Deloitte Touche Tohmatsu 89
Competitiveness of the wholesale supply of plasterboard
What is plasterboard?
Plasterboard is a wall or ceiling lining product and is commonly used as a structural building product in residential building, providing part of the bracing for the building as a whole. This is almost unique to New Zealand. In the rest of the world including Australia , plasterboard is only used as a wall or ceiling lining product and must only support its own weight and that of any insulation or electrical products resting on it (Commerce Commission, 2014).
Existing level of competition
Deloitte Access Economics estimates that Fletcher Building has a national market share of 95% in the manufacture and supply of plasterboard. Fletcher Building is the only New Zealand manufacturer of plasterboard, and the largest wholesale supplier of plasterboard in New Zealand.
Competitors include importers ProRoc, USG Boral and Elephant Board. Importers’ collective share in the wholesale supply of plasterboard sales remain low. In the past five years, two companies (Knauf and USG Boral) have entered into the New Zealand market. Knauf has since exited the market, while USG Boral remains in the market with a certified product.
What are the key barriers to entry?
Deloitte Access Economics believes there are three key barriers to competition in this market:
Incumbent advantages of Fletcher Building. Fletcher Building’s large market presence, service delivery and strong industry relationships make it difficult for new entrants to the market to gain recognition.
Consumer preferences creates a barrier to entry. Industry consultations indicated that brand and the level of services are important drivers in this market and this influences preferences. Our understanding, based on industry consultations, is that architects are more likely to specify the use of GIB®
plasterboard in building plans, because product performance is well understood and strong after-sales services are available. This is in contrast to other building materials specifications within residential building plans where building materials are specified based on performance and not for a particular branded product. A building consent is provided based on the architects’ plans, and for any builder to deviate from the plan may be a time consuming and costly process.
Switching barriers. There is some evidence to suggest that alternative brandsmay not be easily available to consumers, and this may act as a barrier toswitching. For example, while collecting prices for this study:• Some PlaceMakers stores indicated PlaceMakers does not stock USG Boral
products in their stores. When asked why, one Christchurch store stated USGBoral is an imported board and the supplier is a direct competitor ofPlaceMakers.
• When comparing the retail prices provided by Bunnings, USG Boralplasterboards were on average 10% more expensive than GIB®
plasterboards.
Overall, the Commerce Commission’s finding in the 2014 investigation relatingto Fletcher Building’s rebates to merchants in the wholesale supply ofplasterboard stated: “We acknowledge that Winstone’s [Wallboards] marketshare is very high and has been for many years. This does not, however, appearto be driven by exclusive agreements with merchants, rebates offered tomerchants or builders, or an anti-competitive predatory strategy….Rather, aswell as entrants not making sufficiently attractive offers to merchants to inducethem to stock their product or for builders to request supply, it appears thatBuilding Code compliance, combined with the preferences of those involved indesigning, consenting and building houses, contribute to Winstone’s continuedhigh market share”
6.2. Factors influencing the price of plasterboard
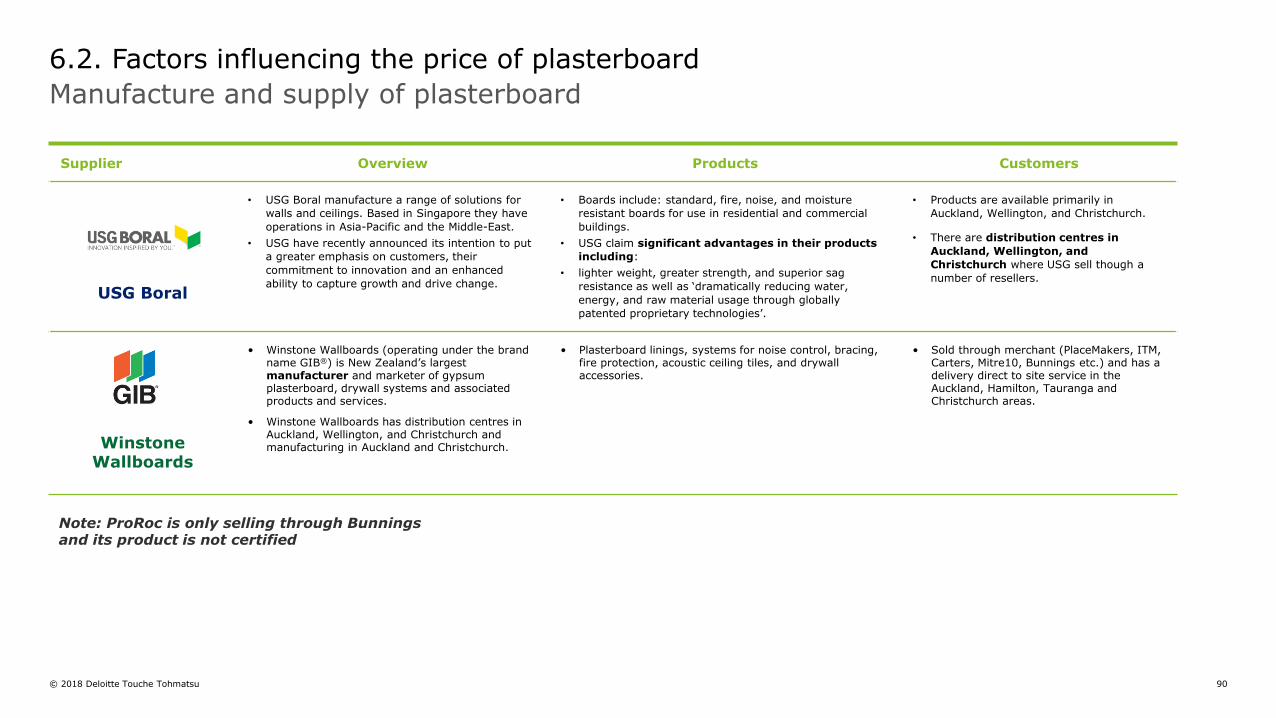
© 2018 Deloitte Touche Tohmatsu 90
6.2. Factors influencing the price of plasterboard
Manufacture and supply of plasterboard
Supplier Overview Products Customers
USG Boral
• USG Boral manufacture a range of solutions for
walls and ceilings. Based in Singapore they have
operations in Asia-Pacific and the Middle-East.
• USG have recently announced its intention to put
a greater emphasis on customers, their
commitment to innovation and an enhanced
ability to capture growth and drive change.
• Boards include: standard, fire, noise, and moisture
resistant boards for use in residential and commercial
buildings.
• USG claim significant advantages in their products
including:
• lighter weight, greater strength, and superior sag
resistance as well as ‘dramatically reducing water,
energy, and raw material usage through globally
patented proprietary technologies’.
• Products are available primarily in
Auckland, Wellington, and Christchurch.
• There are distribution centres in
Auckland, Wellington, and
Christchurch where USG sell though a
number of resellers.
Winstone Wallboards
• Winstone Wallboards (operating under the brand name GIB®) is New Zealand’s largest manufacturer and marketer of gypsum plasterboard, drywall systems and associated products and services.
• Winstone Wallboards has distribution centres in Auckland, Wellington, and Christchurch and manufacturing in Auckland and Christchurch.
• Plasterboard linings, systems for noise control, bracing, fire protection, acoustic ceiling tiles, and drywall accessories.
• Sold through merchant (PlaceMakers, ITM, Carters, Mitre10, Bunnings etc.) and has a delivery direct to site service in the Auckland, Hamilton, Tauranga and Christchurch areas.
Note: ProRoc is only selling through Bunnings and its product is not certified
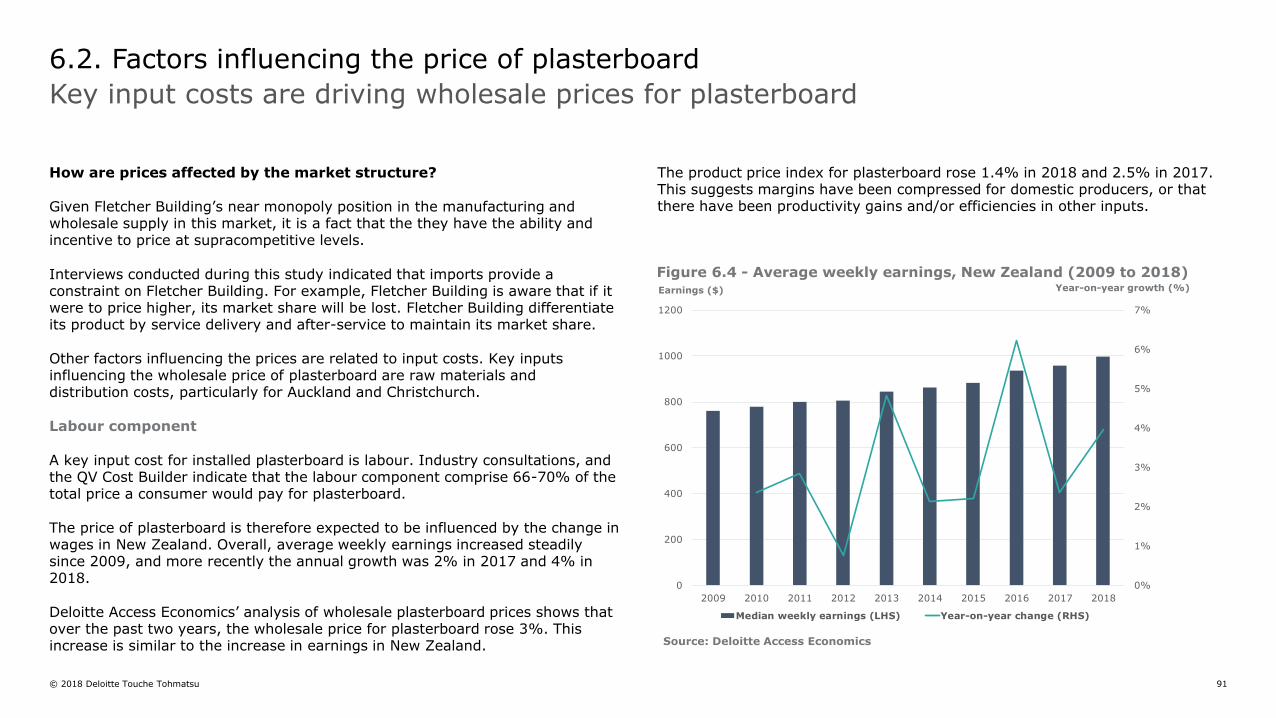
© 2018 Deloitte Touche Tohmatsu 91
How are prices affected by the market structure?
Given Fletcher Building’s near monopoly position in the manufacturing and wholesale supply in this market, it is a fact that the they have the ability and incentive to price at supracompetitive levels.
Interviews conducted during this study indicated that imports provide a constraint on Fletcher Building. For example, Fletcher Building is aware that if it were to price higher, its market share will be lost. Fletcher Building differentiate its product by service delivery and after-service to maintain its market share.
Other factors influencing the prices are related to input costs. Key inputs influencing the wholesale price of plasterboard are raw materials and distribution costs, particularly for Auckland and Christchurch.
Labour component
A key input cost for installed plasterboard is labour. Industry consultations, and the QV Cost Builder indicate that the labour component comprise 66-70% of the total price a consumer would pay for plasterboard.
The price of plasterboard is therefore expected to be influenced by the change in wages in New Zealand. Overall, average weekly earnings increased steadily since 2009, and more recently the annual growth was 2% in 2017 and 4% in 2018.
Deloitte Access Economics’ analysis of wholesale plasterboard prices shows that over the past two years, the wholesale price for plasterboard rose 3%. This increase is similar to the increase in earnings in New Zealand.
The product price index for plasterboard rose 1.4% in 2018 and 2.5% in 2017. This suggests margins have been compressed for domestic producers, or that there have been productivity gains and/or efficiencies in other inputs.
6.2. Factors influencing the price of plasterboard
Key input costs are driving wholesale prices for plasterboard
Figure 6.4 - Average weekly earnings, New Zealand (2009 to 2018)
Source: Deloitte Access Economics
Earnings ($) Year-on-year growth (%)
0%
1%
2%
3%
4%
5%
6%
7%
0
200
400
600
800
1000
1200
2009 2010 2011 2012 2013 2014 2015 2016 2017 2018
Median weekly earnings (LHS) Year-on-year change (RHS)
© 2018 Deloitte Touche Tohmatsu 92
Transport costs and manufacturing capacity
Approximately 70% of plasterboard is sold in the North Island and 30% in the South Island. To account for this demand, plasterboard is manufactured domestically in Auckland and Christchurch. This contributes to the cost in New Zealand to build manufacturing capacity in both the North Island and South Island - and potentially overcapacity.
The overall transport cost of plasterboard is relatively low, and depends on how the plasterboard is delivered to the customer:
• Ex-warehouse: The proportion of the transport cost to the wholesale price is zero because the customer picks the plasterboard up from Fletcher Building’s warehouse.
• Delivered to site: Deloitte Access Economics estimated the transport cost, based on Fletcher Building data, to range between 8% to 12% of the overall wholesale price if the plasterboard order is delivered directly to the building site.
• Delivered order to merchants: Deloitte Access Economics estimated the transport cost to range between 1% to 4% of the overall wholesale price if the plasterboard order is delivered to the merchant and the merchant unloads the order.
6.2. Factors influencing the price of plasterboard
Key input costs are driving wholesale prices for plasterboard
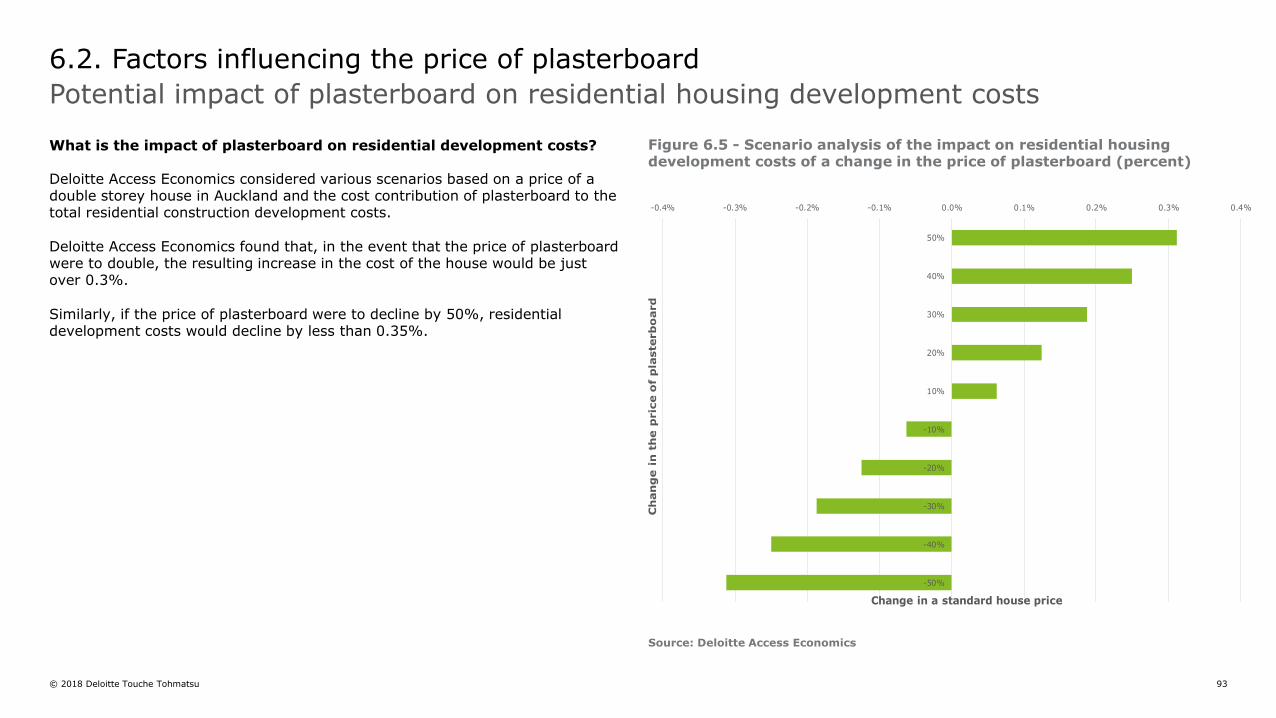
© 2018 Deloitte Touche Tohmatsu 93
What is the impact of plasterboard on residential development costs?
Deloitte Access Economics considered various scenarios based on a price of a double storey house in Auckland and the cost contribution of plasterboard to the total residential construction development costs.
Deloitte Access Economics found that, in the event that the price of plasterboard were to double, the resulting increase in the cost of the house would be just over 0.3%.
Similarly, if the price of plasterboard were to decline by 50%, residential development costs would decline by less than 0.35%.
6.2. Factors influencing the price of plasterboard
Potential impact of plasterboard on residential housing development costs
-0.4% -0.3% -0.2% -0.1% 0.0% 0.1% 0.2% 0.3% 0.4%
50%
40%
30%
20%
10%
-10%
-20%
-30%
-40%
-50%
Change in a standard house price
Ch
an
ge i
n t
he p
ric
e o
f p
laste
rb
oard
Figure 6.5 - Scenario analysis of the impact on residential housing development costs of a change in the price of plasterboard (percent)
Source: Deloitte Access Economics

94
Steel roofing
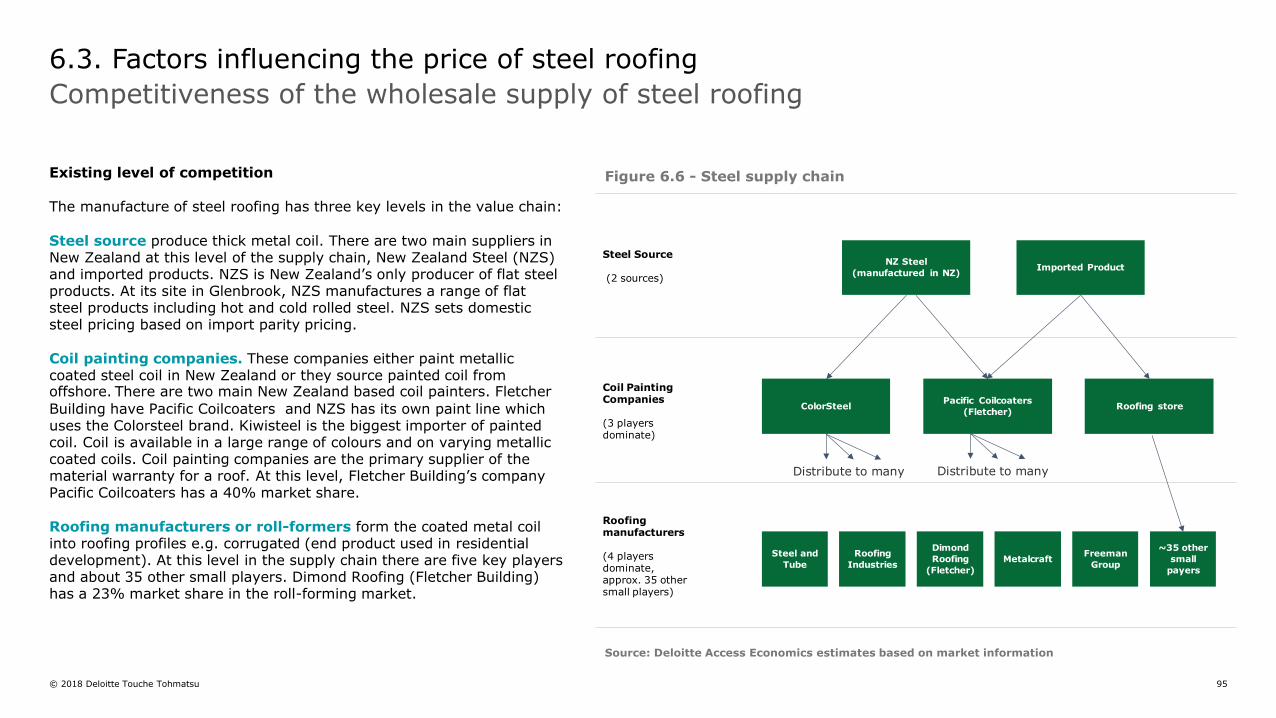
© 2018 Deloitte Touche Tohmatsu 95
Existing level of competition
The manufacture of steel roofing has three key levels in the value chain:
Steel source produce thick metal coil. There are two main suppliers in New Zealand at this level of the supply chain, New Zealand Steel (NZS) and imported products. NZS is New Zealand’s only producer of flat steel products. At its site in Glenbrook, NZS manufactures a range of flat steel products including hot and cold rolled steel. NZS sets domestic steel pricing based on import parity pricing.
Coil painting companies. These companies either paint metallic coated steel coil in New Zealand or they source painted coil from offshore. There are two main New Zealand based coil painters. Fletcher
Building have Pacific Coilcoaters and NZS has its own paint line which uses the Colorsteel brand. Kiwisteel is the biggest importer of painted coil. Coil is available in a large range of colours and on varying metallic coated coils. Coil painting companies are the primary supplier of the material warranty for a roof. At this level, Fletcher Building’s company Pacific Coilcoaters has a 40% market share.
Roofing manufacturers or roll-formers form the coated metal coil into roofing profiles e.g. corrugated (end product used in residential development). At this level in the supply chain there are five key players and about 35 other small players. Dimond Roofing (Fletcher Building) has a 23% market share in the roll-forming market.
6.3. Factors influencing the price of steel roofing
Competitiveness of the wholesale supply of steel roofing
Figure 6.6 - Steel supply chain
Source: Deloitte Access Economics estimates based on market information
Steel Source
(2 sources)
Coil Painting Companies
(3 players dominate)
Roofing manufacturers
(4 players dominate, approx. 35 other small players)
Imported ProductNZ Steel
(manufactured in NZ)
Roofing storePacific Coilcoaters
(Fletcher)ColorSteel
Dimond
Roofing
(Fletcher)
Steel and
Tube
Roofing
IndustriesMetalcraft
~35 other
small
payers
Distribute to many
Freeman
Group
Distribute to many
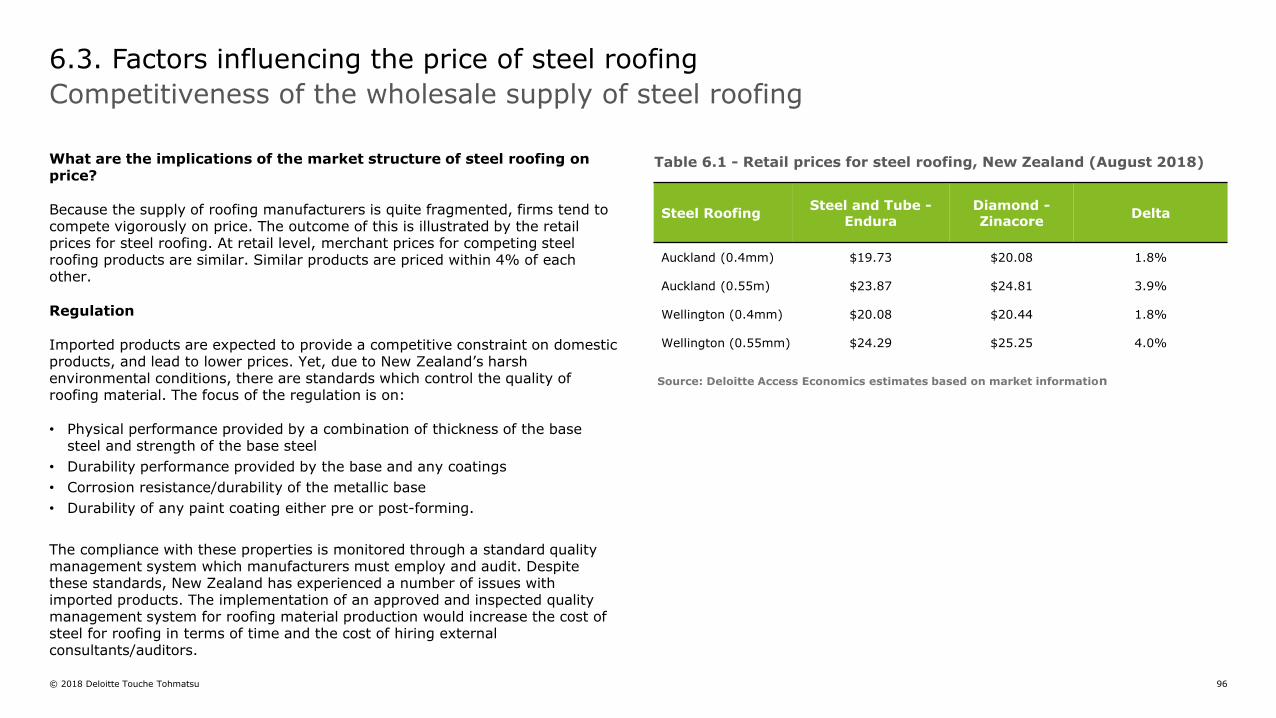
© 2018 Deloitte Touche Tohmatsu 96
What are the implications of the market structure of steel roofing on price?
Because the supply of roofing manufacturers is quite fragmented, firms tend to compete vigorously on price. The outcome of this is illustrated by the retail prices for steel roofing. At retail level, merchant prices for competing steel roofing products are similar. Similar products are priced within 4% of each other.
Regulation
Imported products are expected to provide a competitive constraint on domestic products, and lead to lower prices. Yet, due to New Zealand’s harsh environmental conditions, there are standards which control the quality of roofing material. The focus of the regulation is on:
• Physical performance provided by a combination of thickness of the base steel and strength of the base steel
• Durability performance provided by the base and any coatings
• Corrosion resistance/durability of the metallic base
• Durability of any paint coating either pre or post-forming.
The compliance with these properties is monitored through a standard quality management system which manufacturers must employ and audit. Despite these standards, New Zealand has experienced a number of issues with imported products. The implementation of an approved and inspected quality management system for roofing material production would increase the cost of steel for roofing in terms of time and the cost of hiring external consultants/auditors.
6.3. Factors influencing the price of steel roofing
Competitiveness of the wholesale supply of steel roofing
Steel RoofingSteel and Tube -
EnduraDiamond -Zinacore
Delta
Auckland (0.4mm) $19.73 $20.08 1.8%
Auckland (0.55m) $23.87 $24.81 3.9%
Wellington (0.4mm) $20.08 $20.44 1.8%
Wellington (0.55mm) $24.29 $25.25 4.0%
Table 6.1 - Retail prices for steel roofing, New Zealand (August 2018)
Source: Deloitte Access Economics estimates based on market information
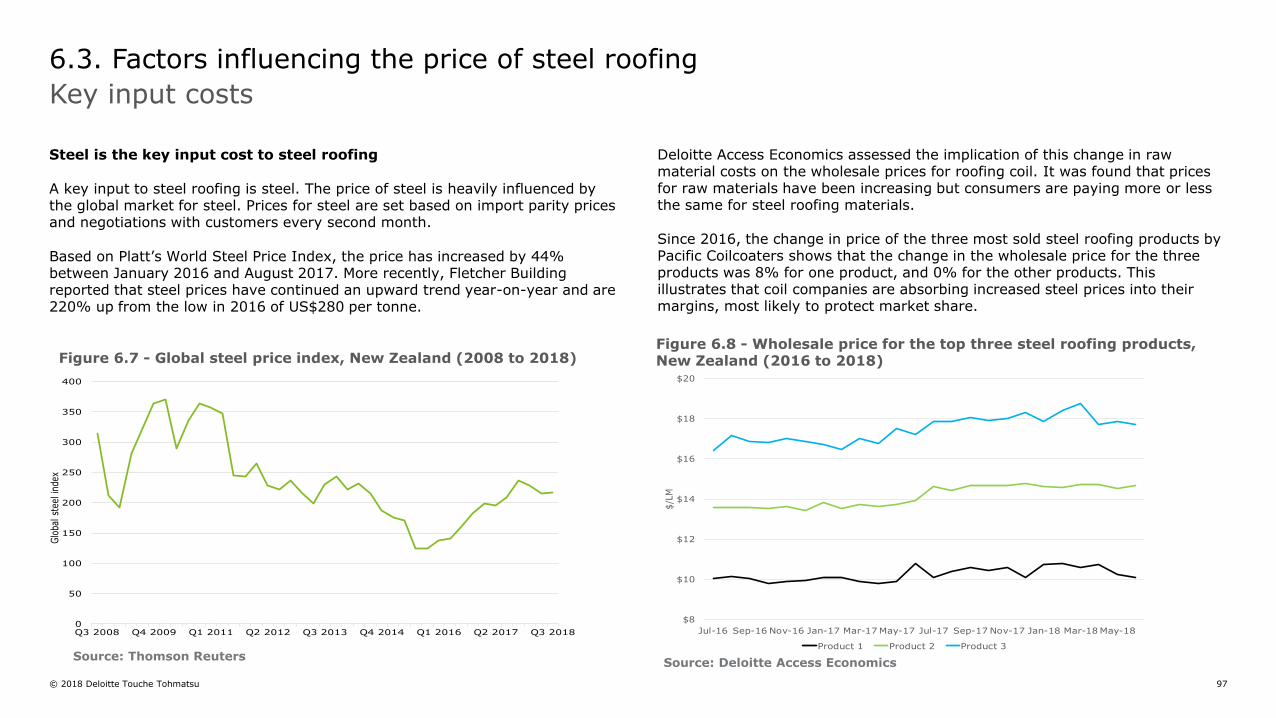
© 2018 Deloitte Touche Tohmatsu 97
Steel is the key input cost to steel roofing
A key input to steel roofing is steel. The price of steel is heavily influenced by the global market for steel. Prices for steel are set based on import parity prices and negotiations with customers every second month.
Based on Platt’s World Steel Price Index, the price has increased by 44% between January 2016 and August 2017. More recently, Fletcher Building reported that steel prices have continued an upward trend year-on-year and are 220% up from the low in 2016 of US$280 per tonne.
Deloitte Access Economics assessed the implication of this change in raw material costs on the wholesale prices for roofing coil. It was found that prices for raw materials have been increasing but consumers are paying more or less the same for steel roofing materials.
Since 2016, the change in price of the three most sold steel roofing products by Pacific Coilcoaters shows that the change in the wholesale price for the three products was 8% for one product, and 0% for the other products. This illustrates that coil companies are absorbing increased steel prices into their margins, most likely to protect market share.
$8
$10
$12
$14
$16
$18
$20
Jul-16 Sep-16 Nov-16 Jan-17 Mar-17 May-17 Jul-17 Sep-17 Nov-17 Jan-18 Mar-18 May-18
$/L
M
Product 1 Product 2 Product 3
6.3. Factors influencing the price of steel roofing
Key input costs
Figure 6.7 - Global steel price index, New Zealand (2008 to 2018)
Source: Deloitte Access EconomicsSource: Thomson Reuters
Figure 6.8 - Wholesale price for the top three steel roofing products, New Zealand (2016 to 2018)
0
50
100
150
200
250
300
350
400
Q3 2008 Q4 2009 Q1 2011 Q2 2012 Q3 2013 Q4 2014 Q1 2016 Q2 2017 Q3 2018
Glo
bal st
eel in
dex

98
Timber framing
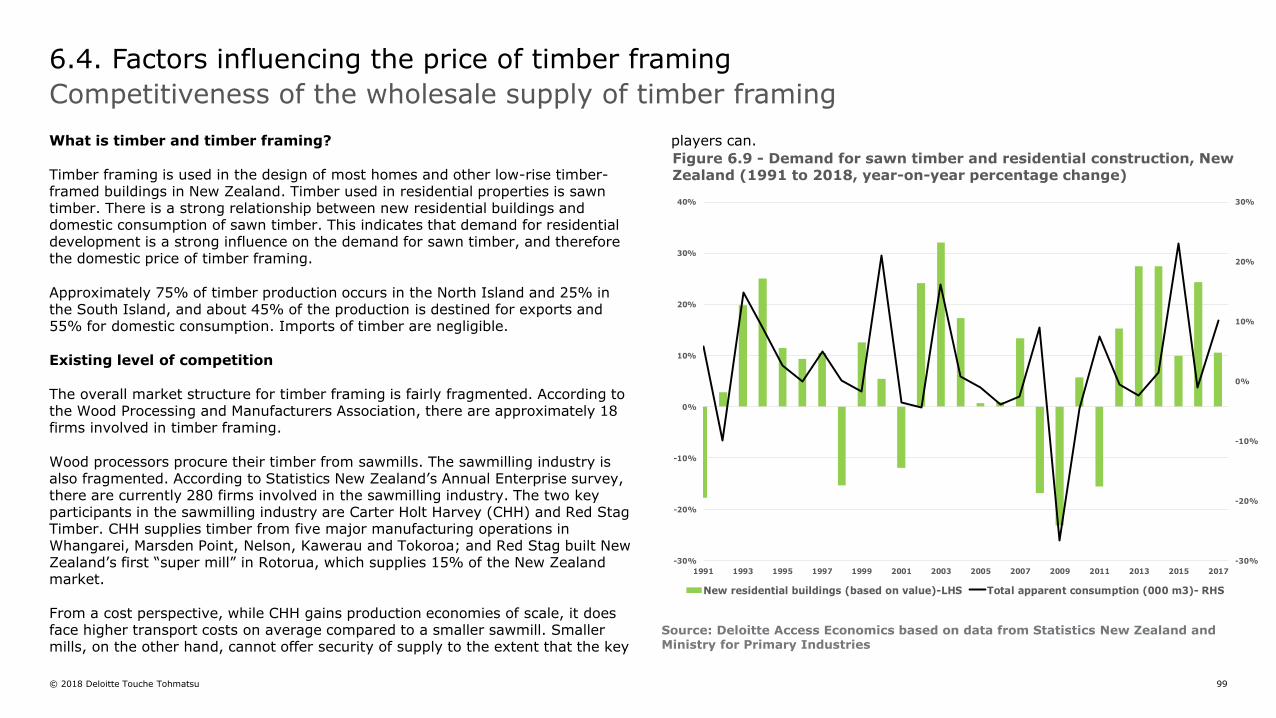
© 2018 Deloitte Touche Tohmatsu 99
What is timber and timber framing?
Timber framing is used in the design of most homes and other low-rise timber-framed buildings in New Zealand. Timber used in residential properties is sawn timber. There is a strong relationship between new residential buildings and domestic consumption of sawn timber. This indicates that demand for residential development is a strong influence on the demand for sawn timber, and therefore the domestic price of timber framing.
Approximately 75% of timber production occurs in the North Island and 25% in the South Island, and about 45% of the production is destined for exports and 55% for domestic consumption. Imports of timber are negligible.
Existing level of competition
The overall market structure for timber framing is fairly fragmented. According to the Wood Processing and Manufacturers Association, there are approximately 18 firms involved in timber framing.
Wood processors procure their timber from sawmills. The sawmilling industry is also fragmented. According to Statistics New Zealand’s Annual Enterprise survey, there are currently 280 firms involved in the sawmilling industry. The two key participants in the sawmilling industry are Carter Holt Harvey (CHH) and Red Stag Timber. CHH supplies timber from five major manufacturing operations in Whangarei, Marsden Point, Nelson, Kawerau and Tokoroa; and Red Stag built New Zealand’s first “super mill” in Rotorua, which supplies 15% of the New Zealand market.
From a cost perspective, while CHH gains production economies of scale, it does face higher transport costs on average compared to a smaller sawmill. Smaller mills, on the other hand, cannot offer security of supply to the extent that the key
players can.
6.4. Factors influencing the price of timber framing
Competitiveness of the wholesale supply of timber framing
Figure 6.9 - Demand for sawn timber and residential construction, New Zealand (1991 to 2018, year-on-year percentage change)
Source: Deloitte Access Economics based on data from Statistics New Zealand and Ministry for Primary Industries
-30%
-20%
-10%
0%
10%
20%
30%
-30%
-20%
-10%
0%
10%
20%
30%
40%
1991 1993 1995 1997 1999 2001 2003 2005 2007 2009 2011 2013 2015 2017
New residential buildings (based on value)-LHS Total apparent consumption (000 m3)- RHS
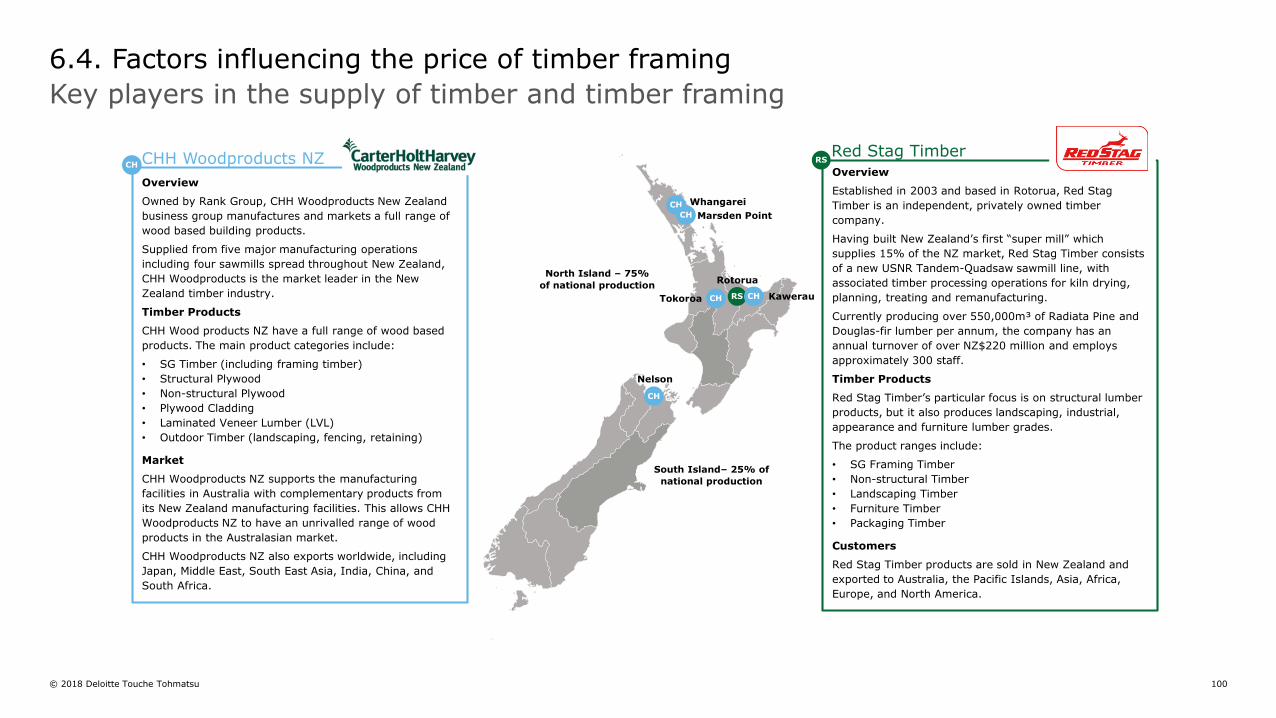
© 2018 Deloitte Touche Tohmatsu 100
Whangarei
Rotorua
Overview
Established in 2003 and based in Rotorua, Red Stag
Timber is an independent, privately owned timber
company.
Having built New Zealand’s first “super mill” which
supplies 15% of the NZ market, Red Stag Timber consists
of a new USNR Tandem-Quadsaw sawmill line, with
associated timber processing operations for kiln drying,
planning, treating and remanufacturing.
Currently producing over 550,000m³ of Radiata Pine and
Douglas-fir lumber per annum, the company has an
annual turnover of over NZ$220 million and employs
approximately 300 staff.
Timber Products
Red Stag Timber’s particular focus is on structural lumber
products, but it also produces landscaping, industrial,
appearance and furniture lumber grades.
The product ranges include:
• SG Framing Timber
• Non-structural Timber
• Landscaping Timber
• Furniture Timber
• Packaging Timber
Customers
Red Stag Timber products are sold in New Zealand and
exported to Australia, the Pacific Islands, Asia, Africa,
Europe, and North America.
CH
Kawerau
Nelson
RS
RS
Overview
Owned by Rank Group, CHH Woodproducts New Zealand
business group manufactures and markets a full range of
wood based building products.
Supplied from five major manufacturing operations
including four sawmills spread throughout New Zealand,
CHH Woodproducts is the market leader in the New
Zealand timber industry.
Timber Products
CHH Wood products NZ have a full range of wood based
products. The main product categories include:
• SG Timber (including framing timber)
• Structural Plywood
• Non-structural Plywood
• Plywood Cladding
• Laminated Veneer Lumber (LVL)
• Outdoor Timber (landscaping, fencing, retaining)
Market
CHH Woodproducts NZ supports the manufacturing
facilities in Australia with complementary products from
its New Zealand manufacturing facilities. This allows CHH
Woodproducts NZ to have an unrivalled range of wood
products in the Australasian market.
CHH Woodproducts NZ also exports worldwide, including
Japan, Middle East, South East Asia, India, China, and
South Africa.
CH CHH Woodproducts NZ Red Stag Timber
CH
CH
CHTokoroa CH
Marsden Point
North Island – 75%
of national production
South Island– 25% of
national production
Key players in the supply of timber and timber framing
6.4. Factors influencing the price of timber framing
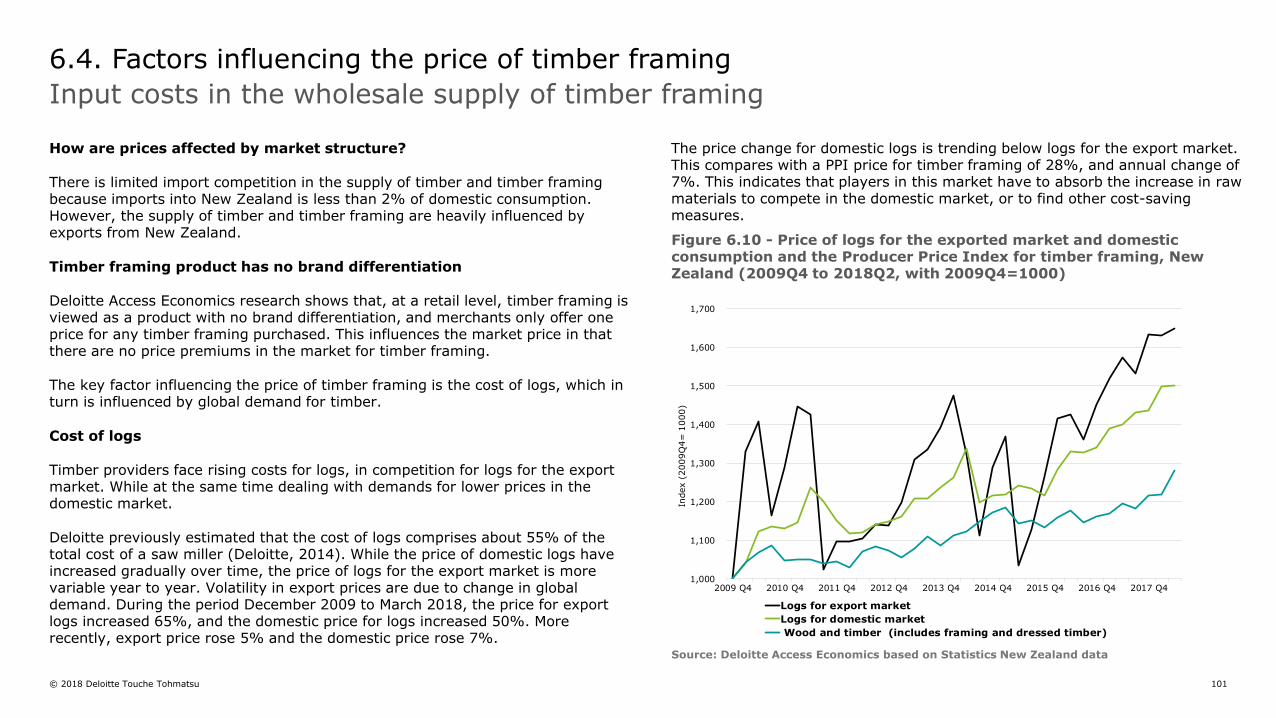
© 2018 Deloitte Touche Tohmatsu 101
How are prices affected by market structure?
There is limited import competition in the supply of timber and timber framing because imports into New Zealand is less than 2% of domestic consumption. However, the supply of timber and timber framing are heavily influenced by exports from New Zealand.
Timber framing product has no brand differentiation
Deloitte Access Economics research shows that, at a retail level, timber framing is viewed as a product with no brand differentiation, and merchants only offer one price for any timber framing purchased. This influences the market price in that there are no price premiums in the market for timber framing.
The key factor influencing the price of timber framing is the cost of logs, which in turn is influenced by global demand for timber.
Cost of logs
Timber providers face rising costs for logs, in competition for logs for the export market. While at the same time dealing with demands for lower prices in the domestic market.
Deloitte previously estimated that the cost of logs comprises about 55% of the total cost of a saw miller (Deloitte, 2014). While the price of domestic logs have increased gradually over time, the price of logs for the export market is more variable year to year. Volatility in export prices are due to change in global demand. During the period December 2009 to March 2018, the price for export logs increased 65%, and the domestic price for logs increased 50%. More recently, export price rose 5% and the domestic price rose 7%.
The price change for domestic logs is trending below logs for the export market. This compares with a PPI price for timber framing of 28%, and annual change of 7%. This indicates that players in this market have to absorb the increase in raw materials to compete in the domestic market, or to find other cost-saving measures.
6.4. Factors influencing the price of timber framing
Input costs in the wholesale supply of timber framing
Figure 6.10 - Price of logs for the exported market and domestic consumption and the Producer Price Index for timber framing, New Zealand (2009Q4 to 2018Q2, with 2009Q4=1000)
Source: Deloitte Access Economics based on Statistics New Zealand data
1,000
1,100
1,200
1,300
1,400
1,500
1,600
1,700
2009 Q4 2010 Q4 2011 Q4 2012 Q4 2013 Q4 2014 Q4 2015 Q4 2016 Q4 2017 Q4
Index (
2009Q
4=
1000)
Logs for export market
Logs for domestic market
Wood and timber (includes framing and dressed timber)
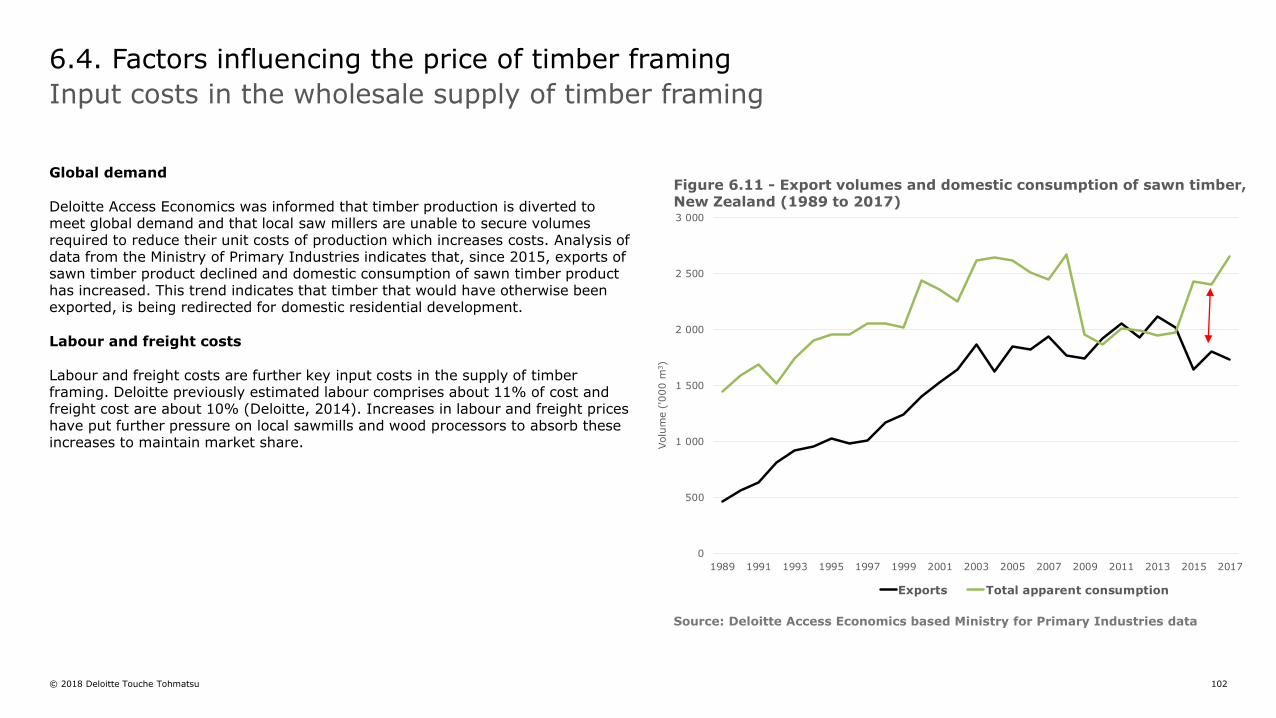
© 2018 Deloitte Touche Tohmatsu 102
Global demand
Deloitte Access Economics was informed that timber production is diverted to meet global demand and that local saw millers are unable to secure volumes required to reduce their unit costs of production which increases costs. Analysis of data from the Ministry of Primary Industries indicates that, since 2015, exports of sawn timber product declined and domestic consumption of sawn timber product has increased. This trend indicates that timber that would have otherwise been exported, is being redirected for domestic residential development.
Labour and freight costs
Labour and freight costs are further key input costs in the supply of timber framing. Deloitte previously estimated labour comprises about 11% of cost and freight cost are about 10% (Deloitte, 2014). Increases in labour and freight prices have put further pressure on local sawmills and wood processors to absorb these increases to maintain market share.
6.4. Factors influencing the price of timber framing
Input costs in the wholesale supply of timber framing
0
500
1 000
1 500
2 000
2 500
3 000
1989 1991 1993 1995 1997 1999 2001 2003 2005 2007 2009 2011 2013 2015 2017
Volu
me (
'000 m
3)
Exports Total apparent consumption
Figure 6.11 - Export volumes and domestic consumption of sawn timber, New Zealand (1989 to 2017)
Source: Deloitte Access Economics based Ministry for Primary Industries data
103
Glass wool insulation
© 2018 Deloitte Touche Tohmatsu 104
What is insulation?
Insulation materials have properties to insulate sound and heat, as well as providing fire resistance qualities. There are a number of insulation products in New Zealand, including glass wool insulation products, polyester insulation, and polystyrene. For purposes of this report, Deloitte Access Economics focused on glass wool insulation as the most common insulation material used in residential construction in New Zealand.
Existing level of competition
There are five firms operating in the wholesale supply of glass wool insulation in
New Zealand. Tasman Insulation (Fletcher Building) has a share of 54% and
manufactures the New Zealand brand Pink® Batts®.
There are two large and two small international manufacturers of glass wool
insulation.
• Knauf is one of the world’s leading manufacturers of insulation. Their New
Zealand insulation products are currently primarily imported from a
manufacturing facility in the UK (Wales). Knauf currently has a market share
of 25%.
• CSR is a major Australian industrial company producing building products.
Their insulation products, produced in Australia, are distributed through Mitre
10 and directly to installers. Currently, CSR has a market share of 10%.
• Taita Glass wool, based in Taiwan, distribute their glass wool products
through ‘Premier Insulation’ in New Zealand, where they have a market share
of 5%.
• Poly Glass Fibre Insulation is based in Malaysia, and is a manufacturer and
distributor of glass mineral wool insulation, and are the largest insulation
manufacturer in South East Asia. Currently, their domestic market share is
5%.
How are prices affected by market structure?
Deloitte Access Economics found that there is a strong competitive constraint of imported glass wool insulation in the domestic market.
Figure 6.12 (left on next page) shows that Tasman Insulation has been losing volume share, and imports of glass wool have been gaining volume share in the domestic market over the past ten years. This is indicative that imports provide a credible competition threat because consumers are readily able to switch between different suppliers of glass wool insulation.
Additionally, Figure 6.13 (right on the next page) shows that the average wholesale price for Tasman’s glass wool sales has decreased over the same timeframe, even in nominal terms, reflecting the effect of the competitive constraint of imports on domestic wholesale prices.
6.5. Factors influencing the price of glass wool insulation
Competitiveness of the wholesale supply of glass wool insulation
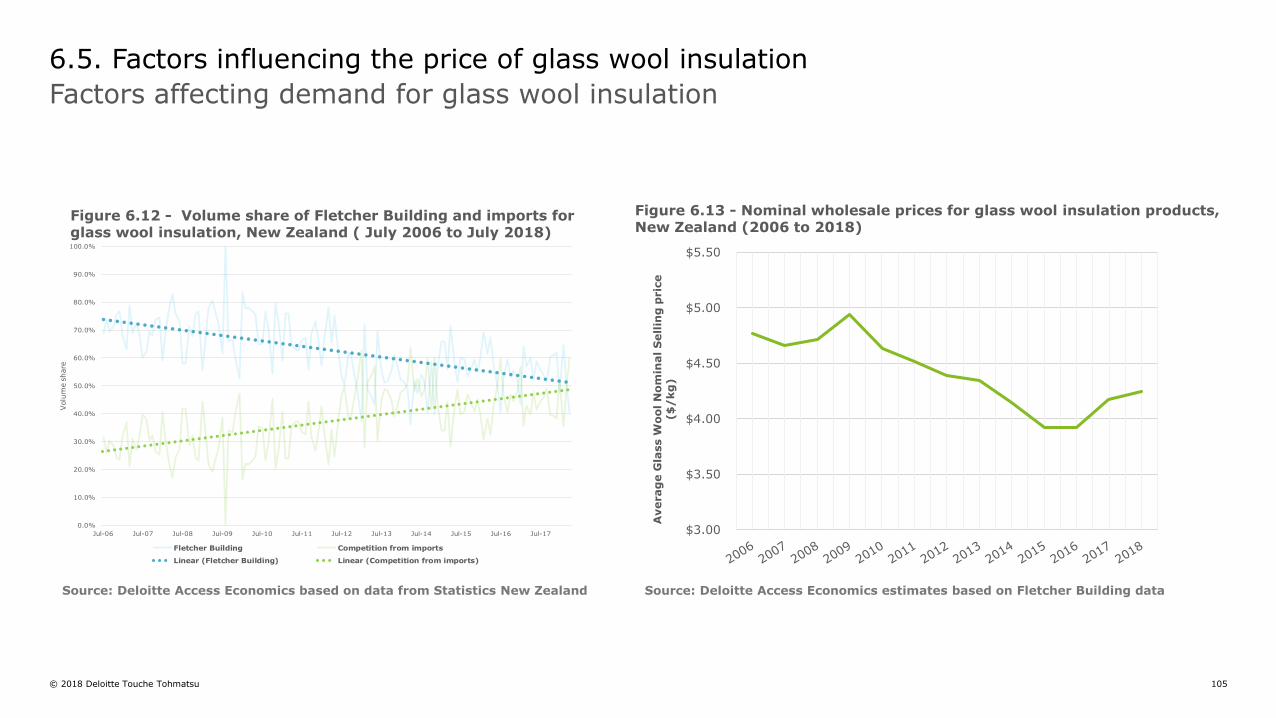
© 2018 Deloitte Touche Tohmatsu 105
6.5. Factors influencing the price of glass wool insulation
Factors affecting demand for glass wool insulation
Figure 6.13 - Nominal wholesale prices for glass wool insulation products, New Zealand (2006 to 2018)
Source: Deloitte Access Economics estimates based on Fletcher Building data
$3.00
$3.50
$4.00
$4.50
$5.00
$5.50
Averag
e G
lass W
oo
l N
om
inal S
ell
ing
pric
e
($
/kg
)
0.0%
10.0%
20.0%
30.0%
40.0%
50.0%
60.0%
70.0%
80.0%
90.0%
100.0%
Jul-06 Jul-07 Jul-08 Jul-09 Jul-10 Jul-11 Jul-12 Jul-13 Jul-14 Jul-15 Jul-16 Jul-17
Volu
me s
hare
Fletcher Building Competition from imports
Linear (Fletcher Building) Linear (Competition from imports)
Figure 6.12 - Volume share of Fletcher Building and imports for glass wool insulation, New Zealand ( July 2006 to July 2018)
Source: Deloitte Access Economics based on data from Statistics New Zealand
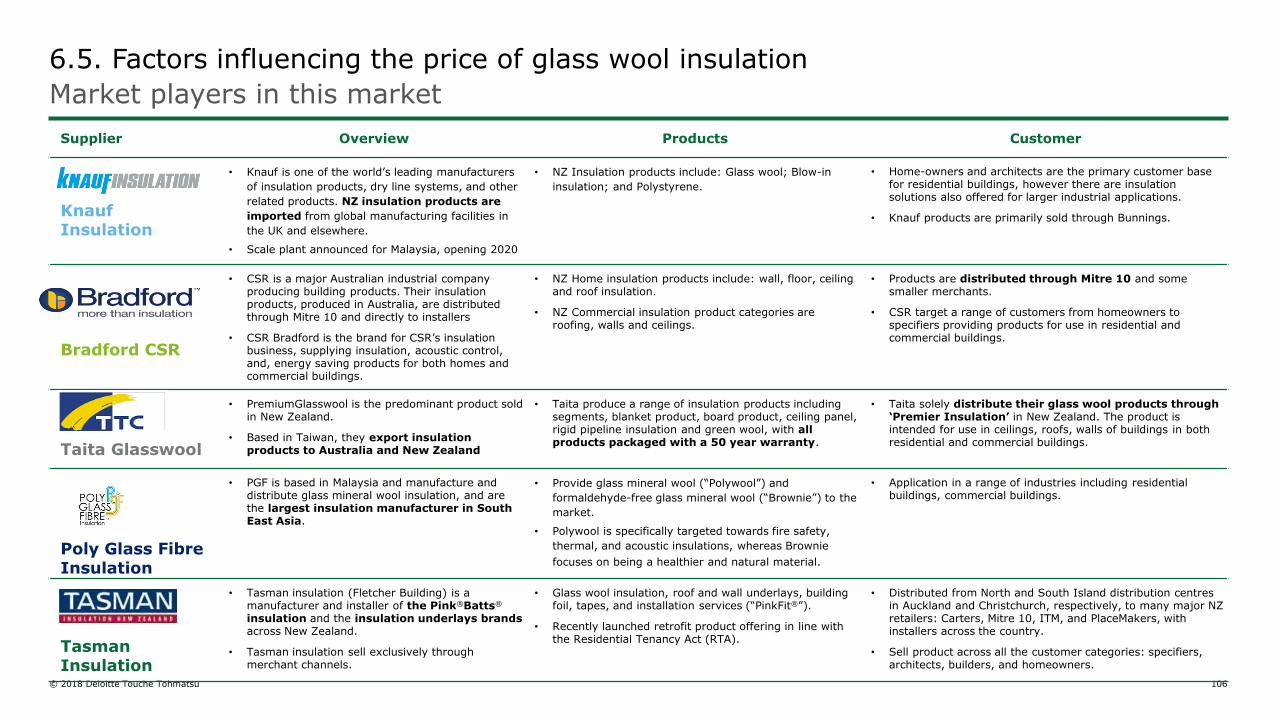
© 2018 Deloitte Touche Tohmatsu 106
Supplier Overview Products Customer
Knauf Insulation
• Knauf is one of the world’s leading manufacturers
of insulation products, dry line systems, and other
related products. NZ insulation products are
imported from global manufacturing facilities in
the UK and elsewhere.
• Scale plant announced for Malaysia, opening 2020
• NZ Insulation products include: Glass wool; Blow-in
insulation; and Polystyrene.
• Home-owners and architects are the primary customer basefor residential buildings, however there are insulation solutions also offered for larger industrial applications.
• Knauf products are primarily sold through Bunnings.
Bradford CSR
• CSR is a major Australian industrial company producing building products. Their insulation products, produced in Australia, are distributed through Mitre 10 and directly to installers
• CSR Bradford is the brand for CSR’s insulation business, supplying insulation, acoustic control, and, energy saving products for both homes and commercial buildings.
• NZ Home insulation products include: wall, floor, ceilingand roof insulation.
• NZ Commercial insulation product categories are roofing, walls and ceilings.
• Products are distributed through Mitre 10 and some smaller merchants.
• CSR target a range of customers from homeowners to specifiers providing products for use in residential and commercial buildings.
Taita Glasswool
• PremiumGlasswool is the predominant product sold in New Zealand.
• Based in Taiwan, they export insulation products to Australia and New Zealand
• Taita produce a range of insulation products including segments, blanket product, board product, ceiling panel, rigid pipeline insulation and green wool, with all products packaged with a 50 year warranty.
• Taita solely distribute their glass wool products through ‘Premier Insulation’ in New Zealand. The product is intended for use in ceilings, roofs, walls of buildings in both residential and commercial buildings.
Poly Glass FibreInsulation
• PGF is based in Malaysia and manufacture and distribute glass mineral wool insulation, and are the largest insulation manufacturer in South East Asia.
• Provide glass mineral wool (“Polywool”) and
formaldehyde-free glass mineral wool (“Brownie”) to the
market.
• Polywool is specifically targeted towards fire safety,
thermal, and acoustic insulations, whereas Brownie
focuses on being a healthier and natural material.
• Application in a range of industries including residential buildings, commercial buildings.
Tasman Insulation
• Tasman insulation (Fletcher Building) is a manufacturer and installer of the Pink®Batts®
insulation and the insulation underlays brands across New Zealand.
• Tasman insulation sell exclusively through merchant channels.
• Glass wool insulation, roof and wall underlays, building foil, tapes, and installation services (“PinkFit®”).
• Recently launched retrofit product offering in line with the Residential Tenancy Act (RTA).
• Distributed from North and South Island distribution centres in Auckland and Christchurch, respectively, to many major NZ retailers: Carters, Mitre 10, ITM, and PlaceMakers, with installers across the country.
• Sell product across all the customer categories: specifiers, architects, builders, and homeowners.
6.5. Factors influencing the price of glass wool insulation
Market players in this market
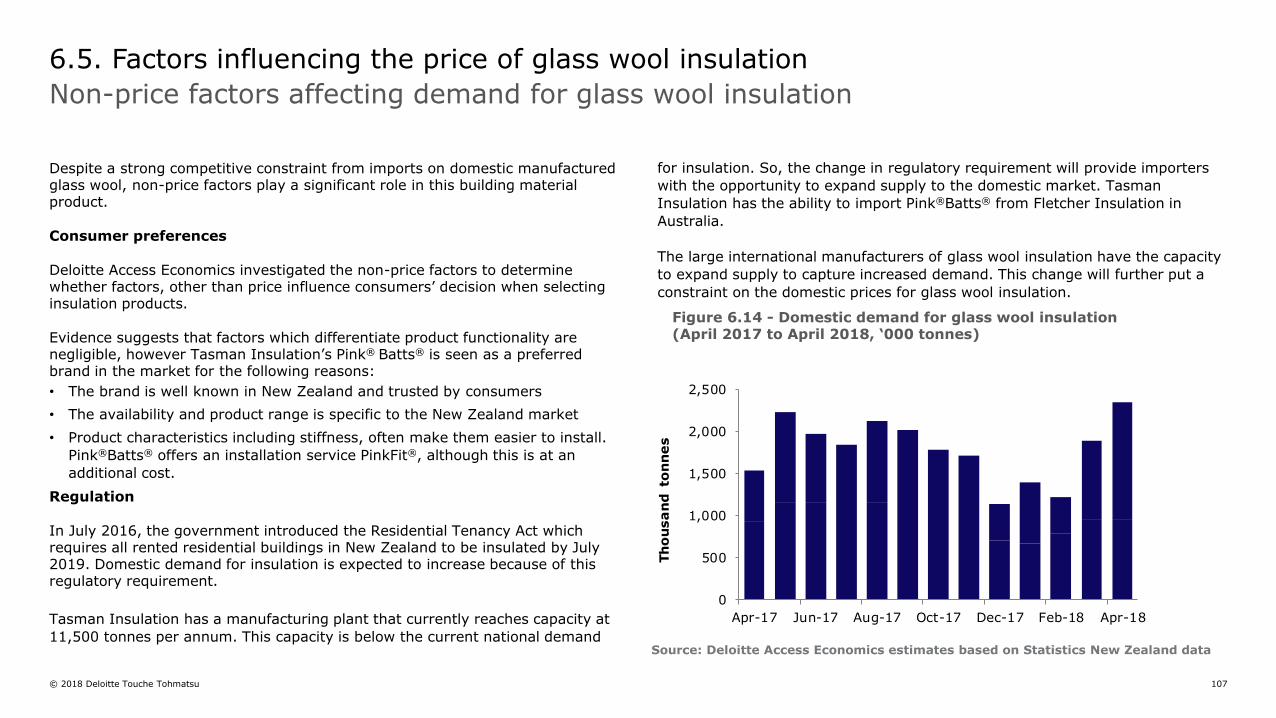
© 2018 Deloitte Touche Tohmatsu 107
Despite a strong competitive constraint from imports on domestic manufactured glass wool, non-price factors play a significant role in this building material product.
Consumer preferences
Deloitte Access Economics investigated the non-price factors to determine whether factors, other than price influence consumers’ decision when selecting insulation products.
Evidence suggests that factors which differentiate product functionality are negligible, however Tasman Insulation’s Pink® Batts® is seen as a preferred brand in the market for the following reasons:
• The brand is well known in New Zealand and trusted by consumers
• The availability and product range is specific to the New Zealand market
• Product characteristics including stiffness, often make them easier to install.
Pink®Batts® offers an installation service PinkFit®, although this is at an
additional cost.
Regulation
In July 2016, the government introduced the Residential Tenancy Act which requires all rented residential buildings in New Zealand to be insulated by July 2019. Domestic demand for insulation is expected to increase because of this regulatory requirement.
Tasman Insulation has a manufacturing plant that currently reaches capacity at
11,500 tonnes per annum. This capacity is below the current national demand
for insulation. So, the change in regulatory requirement will provide importers
with the opportunity to expand supply to the domestic market. Tasman
Insulation has the ability to import Pink®Batts® from Fletcher Insulation in
Australia.
The large international manufacturers of glass wool insulation have the capacity
to expand supply to capture increased demand. This change will further put a
constraint on the domestic prices for glass wool insulation.
6.5. Factors influencing the price of glass wool insulation
Non-price factors affecting demand for glass wool insulation
0
500
1,000
1,500
2,000
2,500
Apr-17 Jun-17 Aug-17 Oct-17 Dec-17 Feb-18 Apr-18
Th
ou
sa
nd
to
nn
es
Figure 6.14 - Domestic demand for glass wool insulation (April 2017 to April 2018, ‘000 tonnes)
Source: Deloitte Access Economics estimates based on Statistics New Zealand data

© 2018 Deloitte Touche Tohmatsu 108
7. Regulation
CONFIDENTIAL
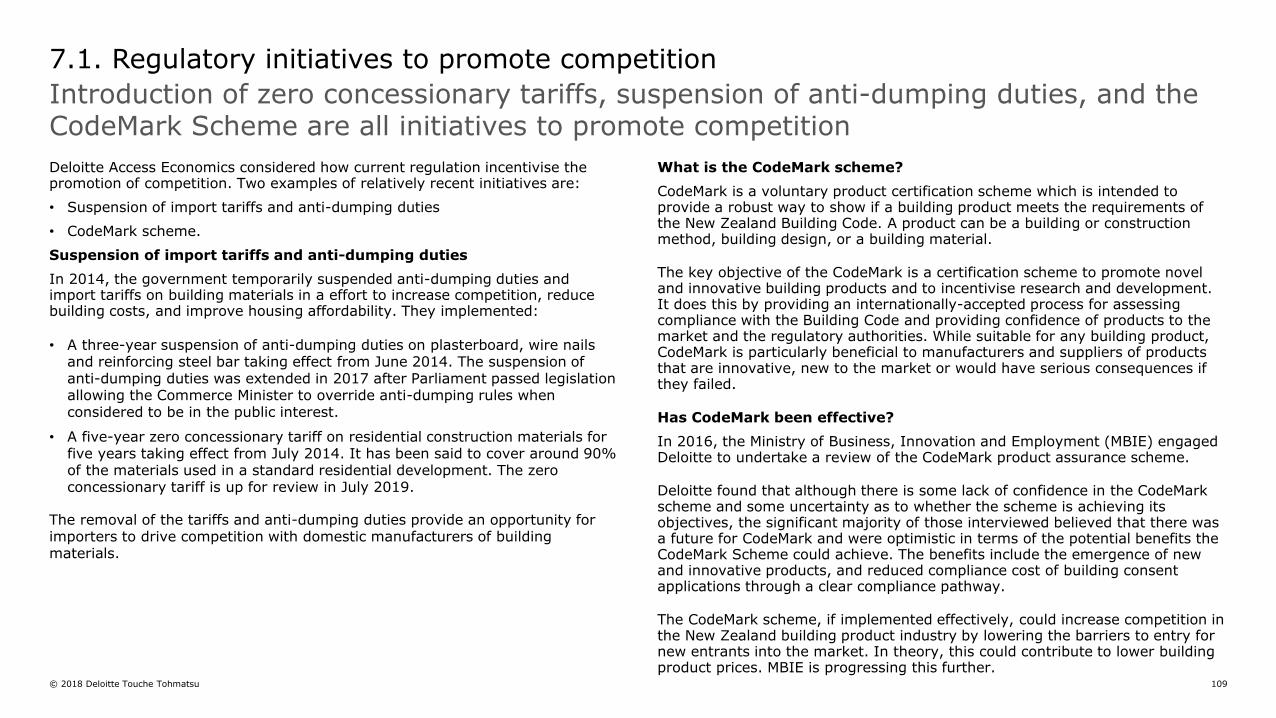
© 2018 Deloitte Touche Tohmatsu 109
Deloitte Access Economics considered how current regulation incentivise the promotion of competition. Two examples of relatively recent initiatives are:
• Suspension of import tariffs and anti-dumping duties
• CodeMark scheme.
Suspension of import tariffs and anti-dumping duties
In 2014, the government temporarily suspended anti-dumping duties and import tariffs on building materials in a effort to increase competition, reduce building costs, and improve housing affordability. They implemented:
• A three-year suspension of anti-dumping duties on plasterboard, wire nails and reinforcing steel bar taking effect from June 2014. The suspension of anti-dumping duties was extended in 2017 after Parliament passed legislation allowing the Commerce Minister to override anti-dumping rules when considered to be in the public interest.
• A five-year zero concessionary tariff on residential construction materials for five years taking effect from July 2014. It has been said to cover around 90% of the materials used in a standard residential development. The zero concessionary tariff is up for review in July 2019.
The removal of the tariffs and anti-dumping duties provide an opportunity for importers to drive competition with domestic manufacturers of building materials.
What is the CodeMark scheme?
CodeMark is a voluntary product certification scheme which is intended to provide a robust way to show if a building product meets the requirements of the New Zealand Building Code. A product can be a building or construction method, building design, or a building material.
The key objective of the CodeMark is a certification scheme to promote novel and innovative building products and to incentivise research and development. It does this by providing an internationally-accepted process for assessing compliance with the Building Code and providing confidence of products to the market and the regulatory authorities. While suitable for any building product, CodeMark is particularly beneficial to manufacturers and suppliers of products that are innovative, new to the market or would have serious consequences if they failed.
Has CodeMark been effective?
In 2016, the Ministry of Business, Innovation and Employment (MBIE) engaged Deloitte to undertake a review of the CodeMark product assurance scheme.
Deloitte found that although there is some lack of confidence in the CodeMark scheme and some uncertainty as to whether the scheme is achieving its objectives, the significant majority of those interviewed believed that there was a future for CodeMark and were optimistic in terms of the potential benefits the CodeMark Scheme could achieve. The benefits include the emergence of new and innovative products, and reduced compliance cost of building consent applications through a clear compliance pathway.
The CodeMark scheme, if implemented effectively, could increase competition in the New Zealand building product industry by lowering the barriers to entry for new entrants into the market. In theory, this could contribute to lower building product prices. MBIE is progressing this further.
7.1. Regulatory initiatives to promote competition
Introduction of zero concessionary tariffs, suspension of anti-dumping duties, and the CodeMark Scheme are all initiatives to promote competition
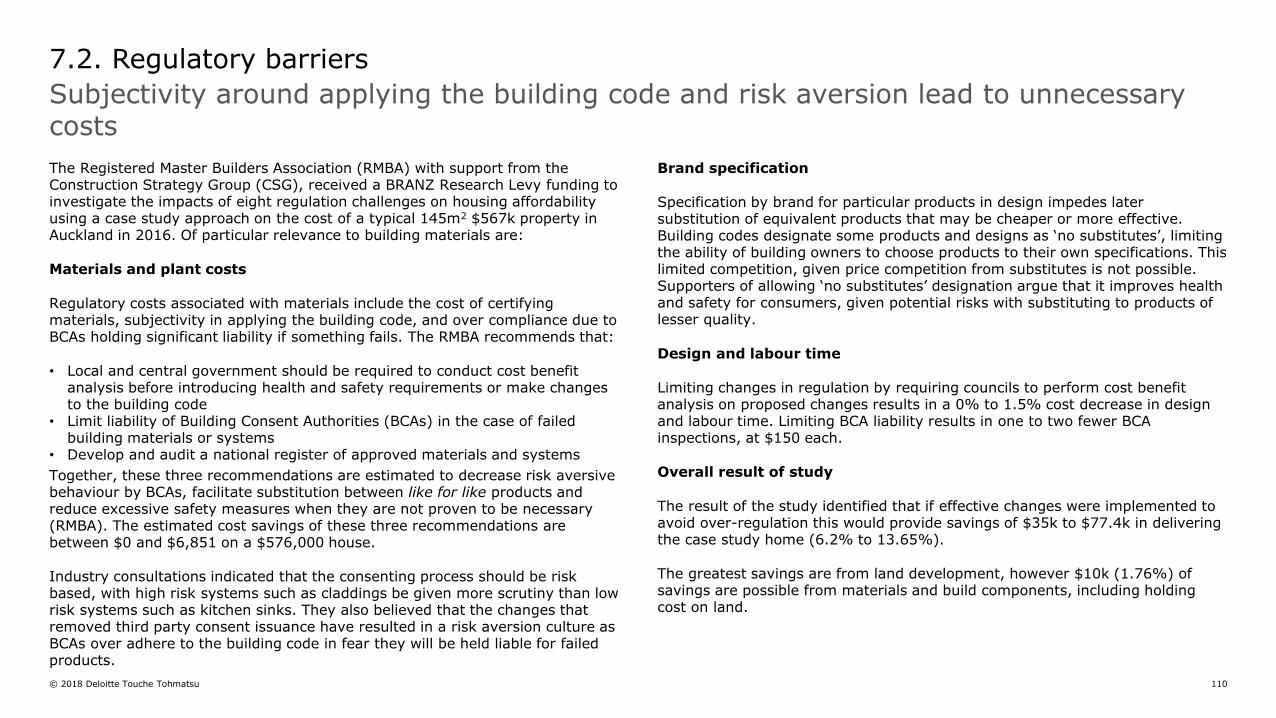
© 2018 Deloitte Touche Tohmatsu 110
The Registered Master Builders Association (RMBA) with support from the Construction Strategy Group (CSG), received a BRANZ Research Levy funding to investigate the impacts of eight regulation challenges on housing affordability using a case study approach on the cost of a typical 145m2 $567k property in Auckland in 2016. Of particular relevance to building materials are:
Materials and plant costs
Regulatory costs associated with materials include the cost of certifying materials, subjectivity in applying the building code, and over compliance due to BCAs holding significant liability if something fails. The RMBA recommends that:
• Local and central government should be required to conduct cost benefit analysis before introducing health and safety requirements or make changes to the building code
• Limit liability of Building Consent Authorities (BCAs) in the case of failed building materials or systems
• Develop and audit a national register of approved materials and systems
Together, these three recommendations are estimated to decrease risk aversive behaviour by BCAs, facilitate substitution between like for like products and reduce excessive safety measures when they are not proven to be necessary (RMBA). The estimated cost savings of these three recommendations are between $0 and $6,851 on a $576,000 house.
Industry consultations indicated that the consenting process should be risk based, with high risk systems such as claddings be given more scrutiny than low risk systems such as kitchen sinks. They also believed that the changes that removed third party consent issuance have resulted in a risk aversion culture as BCAs over adhere to the building code in fear they will be held liable for failed products.
Brand specification
Specification by brand for particular products in design impedes later substitution of equivalent products that may be cheaper or more effective. Building codes designate some products and designs as ‘no substitutes’, limiting the ability of building owners to choose products to their own specifications. This limited competition, given price competition from substitutes is not possible. Supporters of allowing ‘no substitutes’ designation argue that it improves health and safety for consumers, given potential risks with substituting to products of lesser quality.
Design and labour time
Limiting changes in regulation by requiring councils to perform cost benefit analysis on proposed changes results in a 0% to 1.5% cost decrease in design and labour time. Limiting BCA liability results in one to two fewer BCA inspections, at $150 each.
Overall result of study
The result of the study identified that if effective changes were implemented to avoid over-regulation this would provide savings of $35k to $77.4k in delivering the case study home (6.2% to 13.65%).
The greatest savings are from land development, however $10k (1.76%) of savings are possible from materials and build components, including holding cost on land.
7.2. Regulatory barriers
Subjectivity around applying the building code and risk aversion lead to unnecessary costs
© 2018 Deloitte Touche Tohmatsu 111
8. Fletcher Building’s potential impact on residential housing development costs
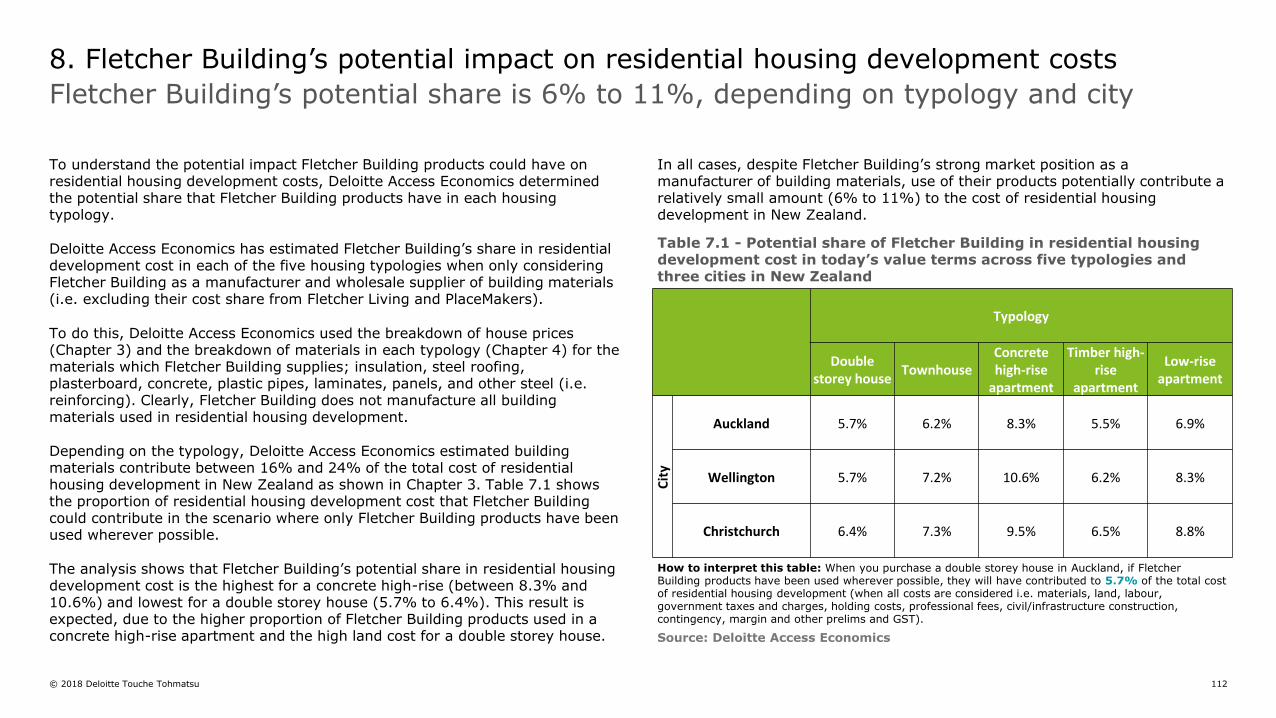
© 2018 Deloitte Touche Tohmatsu 112
To understand the potential impact Fletcher Building products could have on residential housing development costs, Deloitte Access Economics determined the potential share that Fletcher Building products have in each housing typology.
Deloitte Access Economics has estimated Fletcher Building’s share in residential development cost in each of the five housing typologies when only considering Fletcher Building as a manufacturer and wholesale supplier of building materials (i.e. excluding their cost share from Fletcher Living and PlaceMakers).
To do this, Deloitte Access Economics used the breakdown of house prices (Chapter 3) and the breakdown of materials in each typology (Chapter 4) for the materials which Fletcher Building supplies; insulation, steel roofing, plasterboard, concrete, plastic pipes, laminates, panels, and other steel (i.e. reinforcing). Clearly, Fletcher Building does not manufacture all building materials used in residential housing development.
Depending on the typology, Deloitte Access Economics estimated building materials contribute between 16% and 24% of the total cost of residential housing development in New Zealand as shown in Chapter 3. Table 7.1 shows the proportion of residential housing development cost that Fletcher Building could contribute in the scenario where only Fletcher Building products have been used wherever possible.
The analysis shows that Fletcher Building’s potential share in residential housing development cost is the highest for a concrete high-rise (between 8.3% and 10.6%) and lowest for a double storey house (5.7% to 6.4%). This result is expected, due to the higher proportion of Fletcher Building products used in a concrete high-rise apartment and the high land cost for a double storey house.
In all cases, despite Fletcher Building’s strong market position as a manufacturer of building materials, use of their products potentially contribute a relatively small amount (6% to 11%) to the cost of residential housing development in New Zealand.
8. Fletcher Building’s potential impact on residential housing development costs
Fletcher Building’s potential share is 6% to 11%, depending on typology and city
How to interpret this table: When you purchase a double storey house in Auckland, if Fletcher Building products have been used wherever possible, they will have contributed to 5.7% of the total cost of residential housing development (when all costs are considered i.e. materials, land, labour, government taxes and charges, holding costs, professional fees, civil/infrastructure construction, contingency, margin and other prelims and GST).
Typology
Double storey house
TownhouseConcrete high-rise
apartment
Timber high-rise
apartment
Low-rise apartment
Cit
y
Auckland 5.7% 6.2% 8.3% 5.5% 6.9%
Wellington 5.7% 7.2% 10.6% 6.2% 8.3%
Christchurch 6.4% 7.3% 9.5% 6.5% 8.8%
Table 7.1 - Potential share of Fletcher Building in residential housing development cost in today’s value terms across five typologies and three cities in New Zealand
Source: Deloitte Access Economics
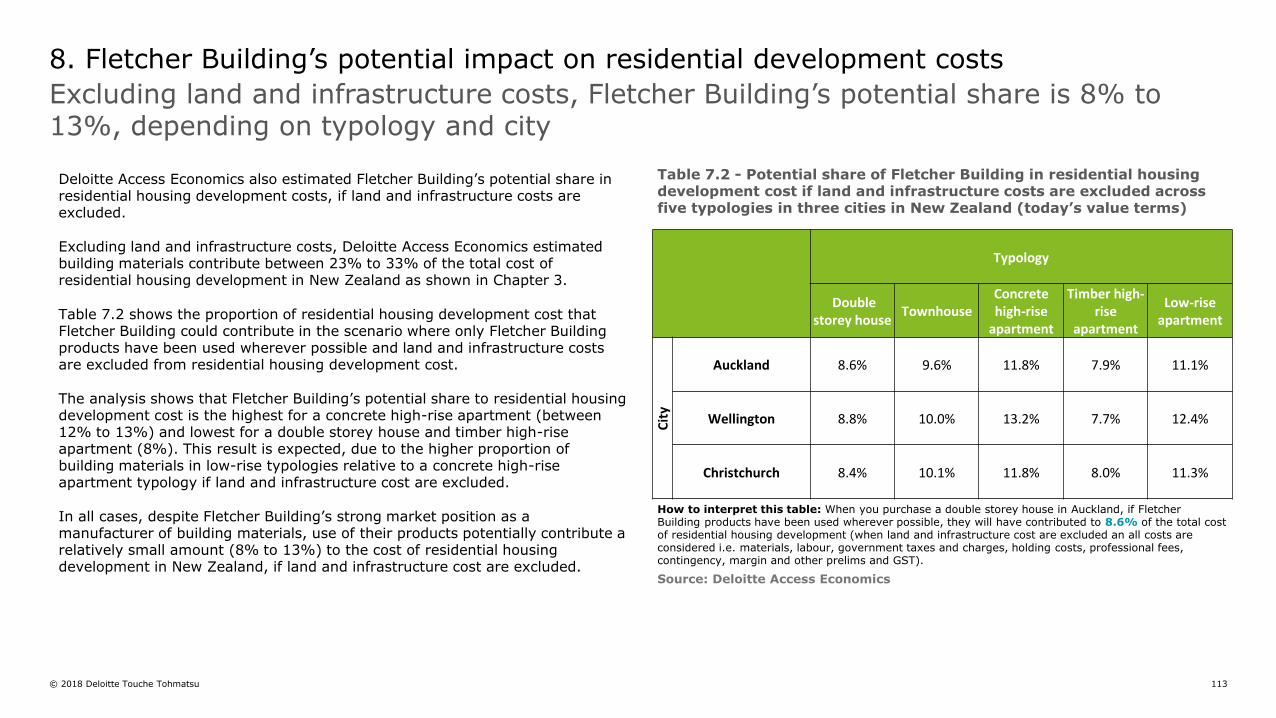
© 2018 Deloitte Touche Tohmatsu 113
Deloitte Access Economics also estimated Fletcher Building’s potential share in residential housing development costs, if land and infrastructure costs are excluded.
Excluding land and infrastructure costs, Deloitte Access Economics estimated building materials contribute between 23% to 33% of the total cost of residential housing development in New Zealand as shown in Chapter 3.
Table 7.2 shows the proportion of residential housing development cost that Fletcher Building could contribute in the scenario where only Fletcher Building products have been used wherever possible and land and infrastructure costs are excluded from residential housing development cost.
The analysis shows that Fletcher Building’s potential share to residential housing development cost is the highest for a concrete high-rise apartment (between 12% to 13%) and lowest for a double storey house and timber high-rise apartment (8%). This result is expected, due to the higher proportion of building materials in low-rise typologies relative to a concrete high-rise apartment typology if land and infrastructure cost are excluded.
In all cases, despite Fletcher Building’s strong market position as a manufacturer of building materials, use of their products potentially contribute a relatively small amount (8% to 13%) to the cost of residential housing development in New Zealand, if land and infrastructure cost are excluded.
8. Fletcher Building’s potential impact on residential development costs
Excluding land and infrastructure costs, Fletcher Building’s potential share is 8% to 13%, depending on typology and city
How to interpret this table: When you purchase a double storey house in Auckland, if Fletcher Building products have been used wherever possible, they will have contributed to 8.6% of the total cost of residential housing development (when land and infrastructure cost are excluded an all costs are considered i.e. materials, labour, government taxes and charges, holding costs, professional fees, contingency, margin and other prelims and GST).
Typology
Double storey house
TownhouseConcrete high-rise
apartment
Timber high-rise
apartment
Low-rise apartment
Cit
y
Auckland 8.6% 9.6% 11.8% 7.9% 11.1%
Wellington 8.8% 10.0% 13.2% 7.7% 12.4%
Christchurch 8.4% 10.1% 11.8% 8.0% 11.3%
Table 7.2 - Potential share of Fletcher Building in residential housing development cost if land and infrastructure costs are excluded across five typologies in three cities in New Zealand (today’s value terms)
Source: Deloitte Access Economics

© 2018 Deloitte Touche Tohmatsu 114
9. Appendix
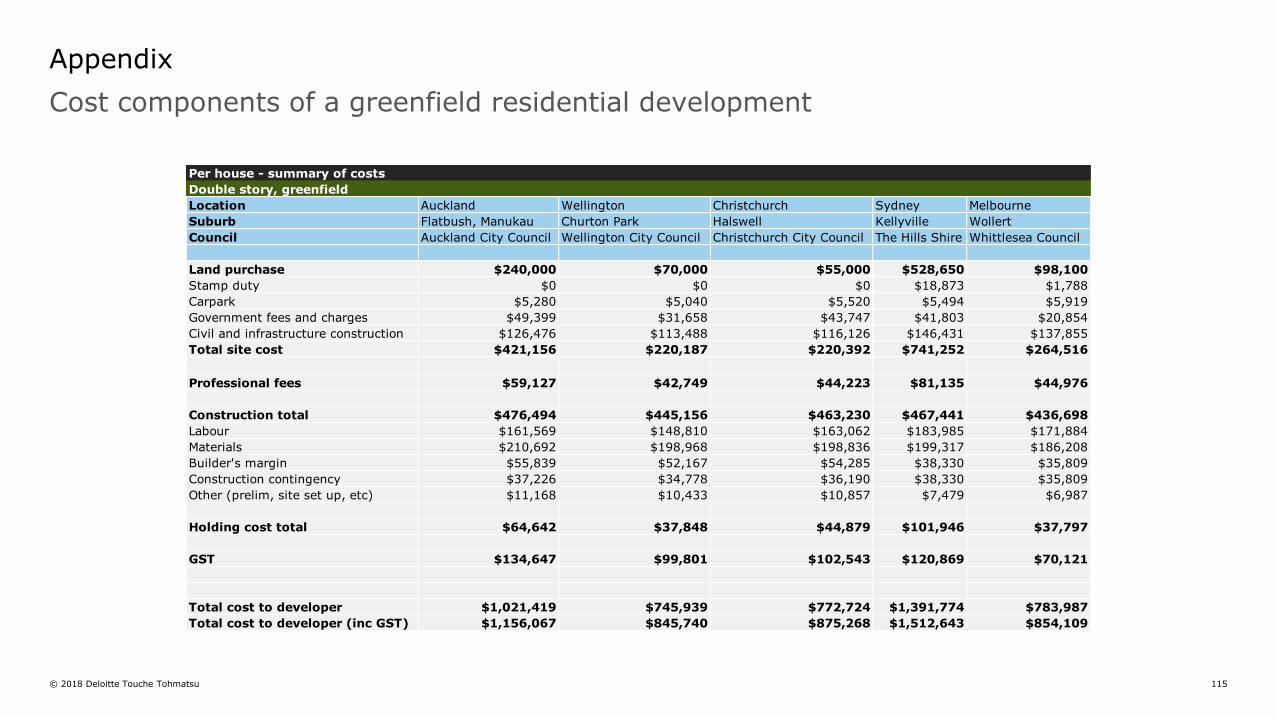
© 2018 Deloitte Touche Tohmatsu 115
Cost components of a greenfield residential development
Appendix
Per house - summary of costs
Double story, greenfield
Location Auckland Wellington Christchurch Sydney Melbourne
Suburb Flatbush, Manukau Churton Park Halswell Kellyville Wollert
Council Auckland City Council Wellington City Council Christchurch City Council The Hills Shire Whittlesea Council
Land purchase $240,000 $70,000 $55,000 $528,650 $98,100
Stamp duty $0 $0 $0 $18,873 $1,788
Carpark $5,280 $5,040 $5,520 $5,494 $5,919
Government fees and charges $49,399 $31,658 $43,747 $41,803 $20,854
Civil and infrastructure construction $126,476 $113,488 $116,126 $146,431 $137,855
Total site cost $421,156 $220,187 $220,392 $741,252 $264,516
Professional fees $59,127 $42,749 $44,223 $81,135 $44,976
Construction total $476,494 $445,156 $463,230 $467,441 $436,698
Labour $161,569 $148,810 $163,062 $183,985 $171,884
Materials $210,692 $198,968 $198,836 $199,317 $186,208
Builder's margin $55,839 $52,167 $54,285 $38,330 $35,809
Construction contingency $37,226 $34,778 $36,190 $38,330 $35,809
Other (prelim, site set up, etc) $11,168 $10,433 $10,857 $7,479 $6,987
Holding cost total $64,642 $37,848 $44,879 $101,946 $37,797
GST $134,647 $99,801 $102,543 $120,869 $70,121
Total cost to developer $1,021,419 $745,939 $772,724 $1,391,774 $783,987
Total cost to developer (inc GST) $1,156,067 $845,740 $875,268 $1,512,643 $854,109
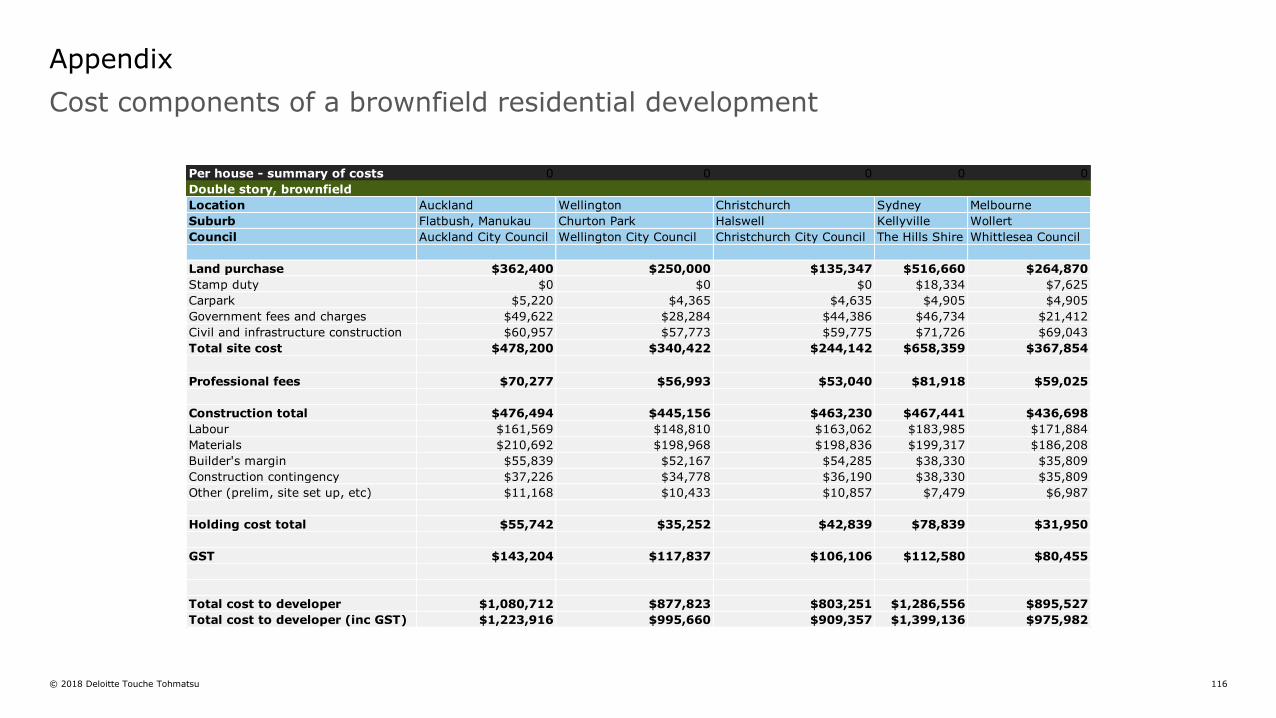
© 2018 Deloitte Touche Tohmatsu 116
Cost components of a brownfield residential development
Appendix
Per house - summary of costs 0 0 0 0 0
Double story, brownfield
Location Auckland Wellington Christchurch Sydney Melbourne
Suburb Flatbush, Manukau Churton Park Halswell Kellyville Wollert
Council Auckland City Council Wellington City Council Christchurch City Council The Hills Shire Whittlesea Council
Land purchase $362,400 $250,000 $135,347 $516,660 $264,870
Stamp duty $0 $0 $0 $18,334 $7,625
Carpark $5,220 $4,365 $4,635 $4,905 $4,905
Government fees and charges $49,622 $28,284 $44,386 $46,734 $21,412
Civil and infrastructure construction $60,957 $57,773 $59,775 $71,726 $69,043
Total site cost $478,200 $340,422 $244,142 $658,359 $367,854
Professional fees $70,277 $56,993 $53,040 $81,918 $59,025
Construction total $476,494 $445,156 $463,230 $467,441 $436,698
Labour $161,569 $148,810 $163,062 $183,985 $171,884
Materials $210,692 $198,968 $198,836 $199,317 $186,208
Builder's margin $55,839 $52,167 $54,285 $38,330 $35,809
Construction contingency $37,226 $34,778 $36,190 $38,330 $35,809
Other (prelim, site set up, etc) $11,168 $10,433 $10,857 $7,479 $6,987
Holding cost total $55,742 $35,252 $42,839 $78,839 $31,950
GST $143,204 $117,837 $106,106 $112,580 $80,455
Total cost to developer $1,080,712 $877,823 $803,251 $1,286,556 $895,527
Total cost to developer (inc GST) $1,223,916 $995,660 $909,357 $1,399,136 $975,982
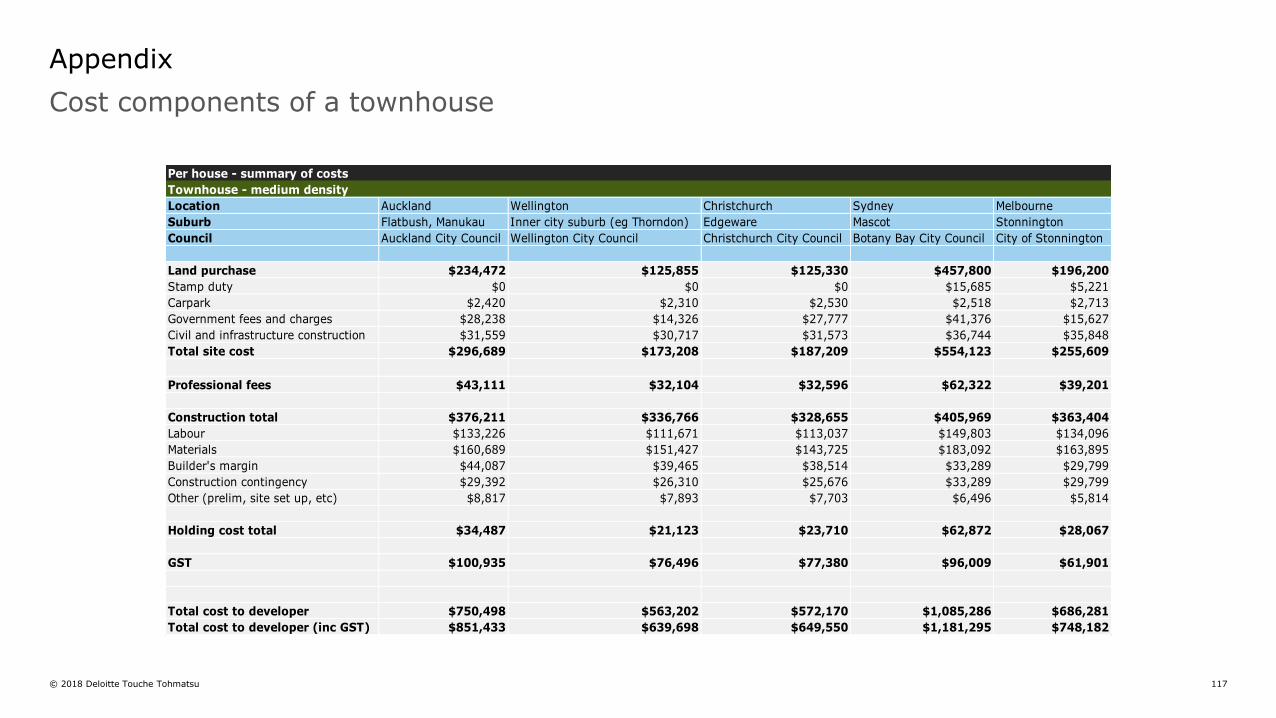
© 2018 Deloitte Touche Tohmatsu 117
Cost components of a townhouse
Appendix
Per house - summary of costs
Townhouse - medium density
Location Auckland Wellington Christchurch Sydney Melbourne
Suburb Flatbush, Manukau Inner city suburb (eg Thorndon) Edgeware Mascot Stonnington
Council Auckland City Council Wellington City Council Christchurch City Council Botany Bay City Council City of Stonnington
Land purchase $234,472 $125,855 $125,330 $457,800 $196,200
Stamp duty $0 $0 $0 $15,685 $5,221
Carpark $2,420 $2,310 $2,530 $2,518 $2,713
Government fees and charges $28,238 $14,326 $27,777 $41,376 $15,627
Civil and infrastructure construction $31,559 $30,717 $31,573 $36,744 $35,848
Total site cost $296,689 $173,208 $187,209 $554,123 $255,609
Professional fees $43,111 $32,104 $32,596 $62,322 $39,201
Construction total $376,211 $336,766 $328,655 $405,969 $363,404
Labour $133,226 $111,671 $113,037 $149,803 $134,096
Materials $160,689 $151,427 $143,725 $183,092 $163,895
Builder's margin $44,087 $39,465 $38,514 $33,289 $29,799
Construction contingency $29,392 $26,310 $25,676 $33,289 $29,799
Other (prelim, site set up, etc) $8,817 $7,893 $7,703 $6,496 $5,814
Holding cost total $34,487 $21,123 $23,710 $62,872 $28,067
GST $100,935 $76,496 $77,380 $96,009 $61,901
Total cost to developer $750,498 $563,202 $572,170 $1,085,286 $686,281
Total cost to developer (inc GST) $851,433 $639,698 $649,550 $1,181,295 $748,182
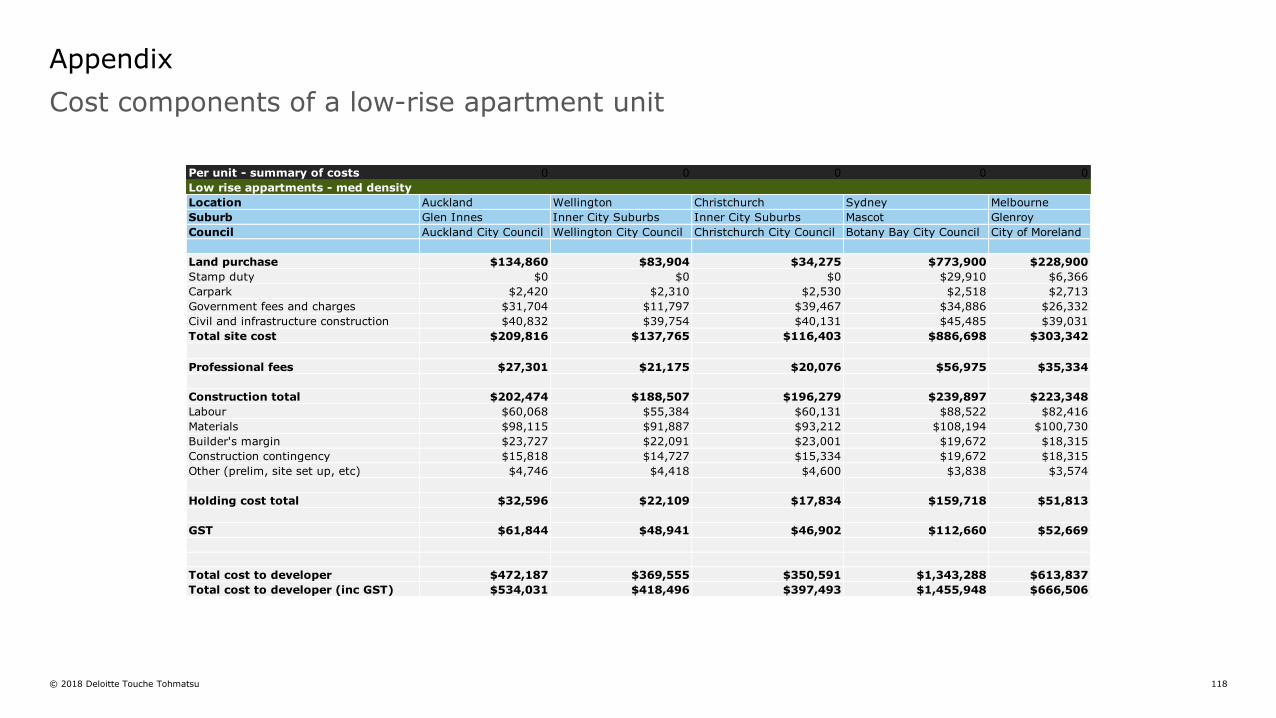
© 2018 Deloitte Touche Tohmatsu 118
Cost components of a low-rise apartment unit
Appendix
Per unit - summary of costs 0 0 0 0 0
Low rise appartments - med density
Location Auckland Wellington Christchurch Sydney Melbourne
Suburb Glen Innes Inner City Suburbs Inner City Suburbs Mascot Glenroy
Council Auckland City Council Wellington City Council Christchurch City Council Botany Bay City Council City of Moreland
Land purchase $134,860 $83,904 $34,275 $773,900 $228,900
Stamp duty $0 $0 $0 $29,910 $6,366
Carpark $2,420 $2,310 $2,530 $2,518 $2,713
Government fees and charges $31,704 $11,797 $39,467 $34,886 $26,332
Civil and infrastructure construction $40,832 $39,754 $40,131 $45,485 $39,031
Total site cost $209,816 $137,765 $116,403 $886,698 $303,342
Professional fees $27,301 $21,175 $20,076 $56,975 $35,334
Construction total $202,474 $188,507 $196,279 $239,897 $223,348
Labour $60,068 $55,384 $60,131 $88,522 $82,416
Materials $98,115 $91,887 $93,212 $108,194 $100,730
Builder's margin $23,727 $22,091 $23,001 $19,672 $18,315
Construction contingency $15,818 $14,727 $15,334 $19,672 $18,315
Other (prelim, site set up, etc) $4,746 $4,418 $4,600 $3,838 $3,574
Holding cost total $32,596 $22,109 $17,834 $159,718 $51,813
GST $61,844 $48,941 $46,902 $112,660 $52,669
Total cost to developer $472,187 $369,555 $350,591 $1,343,288 $613,837
Total cost to developer (inc GST) $534,031 $418,496 $397,493 $1,455,948 $666,506
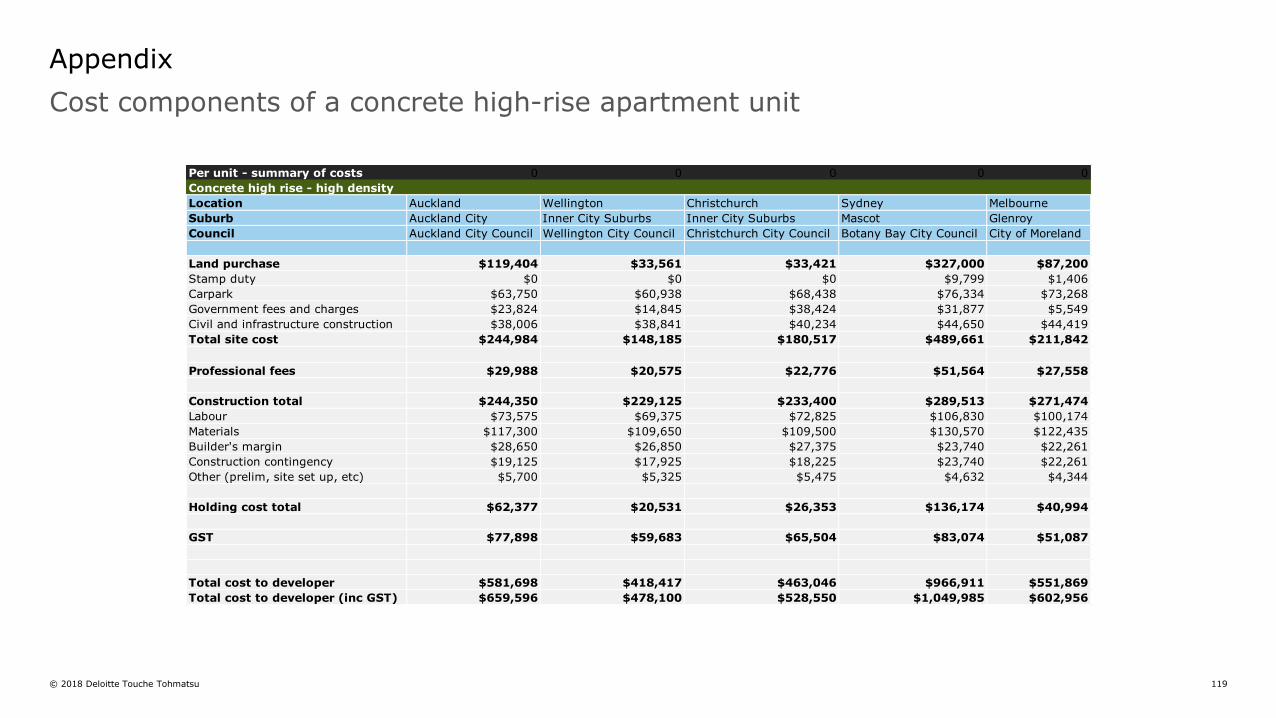
© 2018 Deloitte Touche Tohmatsu 119
Cost components of a concrete high-rise apartment unit
Appendix
Per unit - summary of costs 0 0 0 0 0
Concrete high rise - high density
Location Auckland Wellington Christchurch Sydney Melbourne
Suburb Auckland City Inner City Suburbs Inner City Suburbs Mascot Glenroy
Council Auckland City Council Wellington City Council Christchurch City Council Botany Bay City Council City of Moreland
Land purchase $119,404 $33,561 $33,421 $327,000 $87,200
Stamp duty $0 $0 $0 $9,799 $1,406
Carpark $63,750 $60,938 $68,438 $76,334 $73,268
Government fees and charges $23,824 $14,845 $38,424 $31,877 $5,549
Civil and infrastructure construction $38,006 $38,841 $40,234 $44,650 $44,419
Total site cost $244,984 $148,185 $180,517 $489,661 $211,842
Professional fees $29,988 $20,575 $22,776 $51,564 $27,558
Construction total $244,350 $229,125 $233,400 $289,513 $271,474
Labour $73,575 $69,375 $72,825 $106,830 $100,174
Materials $117,300 $109,650 $109,500 $130,570 $122,435
Builder's margin $28,650 $26,850 $27,375 $23,740 $22,261
Construction contingency $19,125 $17,925 $18,225 $23,740 $22,261
Other (prelim, site set up, etc) $5,700 $5,325 $5,475 $4,632 $4,344
Holding cost total $62,377 $20,531 $26,353 $136,174 $40,994
GST $77,898 $59,683 $65,504 $83,074 $51,087
Total cost to developer $581,698 $418,417 $463,046 $966,911 $551,869
Total cost to developer (inc GST) $659,596 $478,100 $528,550 $1,049,985 $602,956
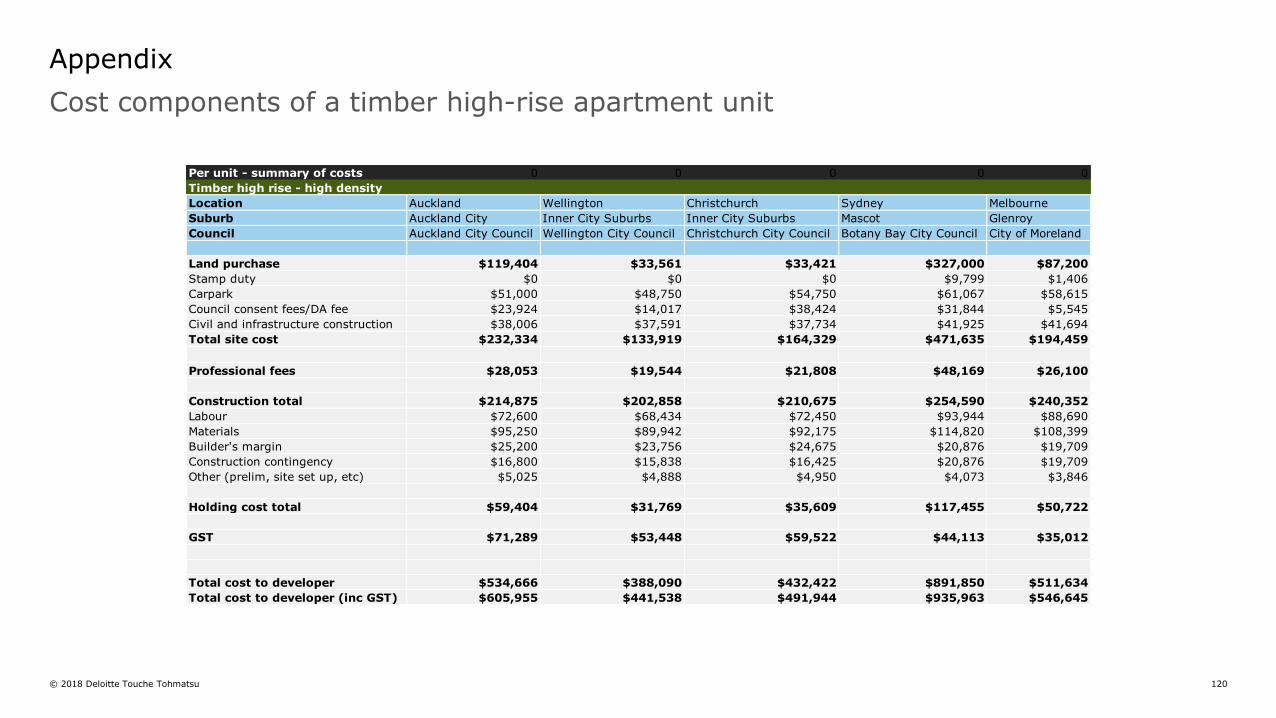
© 2018 Deloitte Touche Tohmatsu 120
Cost components of a timber high-rise apartment unit
Appendix
Per unit - summary of costs 0 0 0 0 0
Timber high rise - high density
Location Auckland Wellington Christchurch Sydney Melbourne
Suburb Auckland City Inner City Suburbs Inner City Suburbs Mascot Glenroy
Council Auckland City Council Wellington City Council Christchurch City Council Botany Bay City Council City of Moreland
Land purchase $119,404 $33,561 $33,421 $327,000 $87,200
Stamp duty $0 $0 $0 $9,799 $1,406
Carpark $51,000 $48,750 $54,750 $61,067 $58,615
Council consent fees/DA fee $23,924 $14,017 $38,424 $31,844 $5,545
Civil and infrastructure construction $38,006 $37,591 $37,734 $41,925 $41,694
Total site cost $232,334 $133,919 $164,329 $471,635 $194,459
Professional fees $28,053 $19,544 $21,808 $48,169 $26,100
Construction total $214,875 $202,858 $210,675 $254,590 $240,352
Labour $72,600 $68,434 $72,450 $93,944 $88,690
Materials $95,250 $89,942 $92,175 $114,820 $108,399
Builder's margin $25,200 $23,756 $24,675 $20,876 $19,709
Construction contingency $16,800 $15,838 $16,425 $20,876 $19,709
Other (prelim, site set up, etc) $5,025 $4,888 $4,950 $4,073 $3,846
Holding cost total $59,404 $31,769 $35,609 $117,455 $50,722
GST $71,289 $53,448 $59,522 $44,113 $35,012
Total cost to developer $534,666 $388,090 $432,422 $891,850 $511,634
Total cost to developer (inc GST) $605,955 $441,538 $491,944 $935,963 $546,645

© 2018 Deloitte Touche Tohmatsu 121
10. References
© 2018 Deloitte Touche Tohmatsu 122
References
Auckland Council (2018). Development contributions, available at: https://www.aucklandcouncil.govt.nz/building-and-consents/development-contributions/Pages/default.aspx
Auckland Council (2018b). The building and consents process, available at: https://www.aucklandcouncil.govt.nz/building-and-consents/understanding-building-consents-process/Pages/default.aspx
Auckland City Council (2018). Estimate your development contributions, available at: https://www.aucklandcouncil.govt.nz/building-and-consents/development-contributions/Pages/estimate-your-development-contributions.aspx
Auckland Council (2017). How should we fund our greenfield Infrastructure? Insights: Topical commentary on the Auckland economy. Available at: http://ourauckland.aucklandcouncil.govt.nz/media/14814/how-do-we-fund-our-greenfield-infrastructure-19-sep-2017-2.pdf
Auckland Council (2016). GeoMaps, Auckland Unitary Plan Operative in part (16 Nov 2016), available at: https://unitaryplanmaps.aucklandcouncil.govt.nz/upviewer/
Auckland City Council Chief Economist Unit (2018). Presentation and communications.
Australian Bureau of Statistics (2018a). Building Activity Statistics, available at: http://www.abs.gov.au/ausstats/[email protected]/mf/8752.0
Australian Bureau of Statistics (2018b). Business Indicators, available at: http://www.abs.gov.au/Business-Indicators
Australian Bureau of Statistics (2018c). Building and Construction, available at: http://www.abs.gov.au/Building-and-Construction
Bayside Council (2017). Bayside 2030: Fees and Charges 2018-2019, available at: https://www.bayside.nsw.gov.au/sites/default/files/2018-06/Fees%20and%20Charges_1.pdf
BDO (2018). 2018 BDO Construction Survey, available at: https://www.bdo.nz/en-nz/insights/featured-insights/2018-bdo-construction-survey
Bureau of Infrastructure, Transport and Regional Economics (2017). Freight Rates in Australia, available at: https://bitre.gov.au/publications/2017/is_090.aspx
Brunsdon, N. & Magan, C. (2018). Physical characteristics of new houses 2017. BRANZ Study Report SR396
Capital IQ (2018). Company Comparable Analysis.
Christchurch City Council (2018). Estimate of development contributions, available at: https://www.ccc.govt.nz/consents-and-licences/development-contributions/estimate-of-development-contributions/
City of Sydney (2018). Fees and charges, available at: http://www.cityofsydney.nsw.gov.au/council/our-responsibilities/fees-and-charges
Deloitte (2014). Confidential document on the timber industry in New Zealand.
Demographia (2018). Demographia World Urban Areas 14th Annual Edition: 2018:04, available at: http://www.demographia.com/db-worldua.pdf
Demographia (2016). Demographia World Urban Areas 12th Annual Edition: 2016:04, available at: http://cdn.plataformaurbana.cl/wp-content/uploads/2016/05/demographia-world-urban-areas.pdf
© 2018 Deloitte Touche Tohmatsu 123
Emmitt Consulting (2018). Consultation and communications.
Fletcher Building Limited (2018). Consultation and communications.
Fletcher Building Limited (2018b). Investor Centre, available at: https://fletcherbuilding.com/investor-centre/
Glaeser, E., & Gyourko, J. (2017). The Economic Implications of Housing Supply. Zell/Lurie Working Paper, 802
The Hills Shire Council (2018a). Development Contributions, available at: https://www.thehills.nsw.gov.au/Building/Planning-Guidelines/Development-Contributions
The Hills Shire Council (2018b). Fact Sheets, available at: https://www.thehills.nsw.gov.au/Building/Development-Approvals/Development-Application-Fact-Sheets
Infrastructure New Zealand (2017). Meeting Auckland’s Growth Challenge: The Innovation City. Discussion Document. Available at: https://www.infrastructure.org.nz/resources/Documents/Reports/Infrastructure%20New%20Zealand%20Meeting%20Aucklands%20Growth%20Challenge%20Report.pdf
Kenley R (2003). ‘Strewth Mate! It’s a Rip Off”, Architecture New Zealand July/August, p.g. 92-94.
Sapere and Sense Partners (2017). Quantifying the impact of land use regulation: Evidence from New Zealand: Report for Superu, Ministerial Social Sector Research Fund.
Mainfreight (2018). Consultation and communications.
Ministry of Business, Innovation and Employment (2017). National Construction Pipeline Report 2017: A forecast of Building and Construction Activity, 5th edition. Accessed from: https://www.mbie.govt.nz/publications-research/research/construction-sector-productivity/national-construction-pipeline-report-2017.pdf
Ministry of Housing and Urban Development (2018). Development feasibility tool, available at: https://www.hud.govt.nz/urban-development/national-policy-statement-on-urban-development-capacity-nps-udc/guidance-for-local-authorities-on-the-nps-udc/
Ministry of Housing and Urban Development (2018). Definitions on greenfield, brownfield and infill development land. https://www.hud.govt.nz/urban-development/; Also see https://www.productivity.govt.nz/sites/default/files/using-land-for-housing-issues-paper-dec.pdf
Ministry of Primary Industries (2018). Wood Products Markets, available at: https://www.teururakau.govt.nz/news-and-resources/open-data-and-forecasting/forestry/wood-product-markets/
Moreland City Council (2018). Moreland Development Contribution Plan, available at: https://www.moreland.vic.gov.au/planning-building/planning-permits/moreland-development-contributions-plan-dcp/
Moreland City Council (2018). Planning Fees, available at: https://www.moreland.vic.gov.au/planning-building/planning-permits/planning-fees/
New South Wales Department of Planning and Environment (2008). Planning & Environment, available at: https://www.planning.nsw.gov.au/
New South Wales Department of Planning and Environment (2008). ePlanning Data Reports , available at: https://www.planning.nsw.gov.au/
New Zealand Commerce Commission (2014). Investigation into Winstone Wallboards Limited, available at: https://comcom.govt.nz/__data/assets/pdf_file/0028/94393/Winstone-Wallboards-Limited-Investigation-closure-report-22-December-2014.pdf.
© 2018 Deloitte Touche Tohmatsu 124
New Zealand Productivity Commission (2012), Housing Affordability Inquiry. Accessed from https://www.productivity.govt.nz/inquiry-content/1509?stage=4
Office of the Mayor of Auckland (2017). Mayoral Housing Taskforce Report, available at: https://ourauckland.aucklandcouncil.govt.nz/media/13136/auckland-mayor-housing-taskforce-report.pdf
Organisation for Economic Cooperation and Development (2018). Inflation (CPI) data by country, available at: https://data.oecd.org/price/inflation-cpi.htm
Page, I.C. (2008) New House price modelling. BRANZ Study Report . No. 196
Quotable Value (2018). QV Costbuilder: Elemental Costs of Buildings.
Rawlinsons (2018). Australian Construction Handbook 2018, Edition 26.
Registered Master Builders (2016). The impact of regulation on housing affordability, available at: https://www.branz.co.nz/cms_show_download.php?id=cbae61bc5e71db0210d044b7795b14c79352465b
Reserve Bank of Australia (2018). Interest Rate Decisions 2018, available at: https://www.rba.gov.au/monetary-policy/int-rate-decisions/2018/
Reserve Bank of New Zealand (2018). Monetary Policy Statements, available at: https://www.rbnz.govt.nz/monetary-policy/monetary-policy-statement
Reserve Bank of New Zealand (2013). Reserve Bank of New Zealand Analytical Notes: A Closer look at some of the supply and demand factors influencing residential property markets, available at: https://www.rbnz.govt.nz/-/media/ReserveBank/Files/Publications/Analytical%20notes/2013/an2013-11.pdf
Statistics New Zealand (2018). Infoshare, available at: http://www.stats.govt.nz/infoshare/.
Stonnington City Council (2018a). Fees Guide, available at: https://www.stonnington.vic.gov.au/Development/Planning/Forms-and-Fees/Fees-Guide
Stonnington City Council (2018b). Planning Schedule of Permit Application Fees, available at:https://www.stonnington.vic.gov.au/files/assets/public/development/planning/forms-amp-fees/november-2018/_application-fees-as-at-1-november-2018.pdf
The Real Estate Institute of New Zealand (2018). REINZ Enhanced Statistics Portal.
Turner and Townsend (2016). International construction market survey 2016. Overstretched and over-reliant: a polarised market, available at: http://www.turnerandtownsend.com/media/1518/international-construction-market-survey-2016.pdf
Urban Economics (2016). Economic Significance of Property Industry to the New Zealand Economy, prepared for the Property Council New Zealand, available at: https://www.propertynz.co.nz/sites/default/files/uploaded-content/newsletter-content/economic_significance_web.pdf
United Nations (2018). Annual Percentage of Population at Mid-Year Residing in Urban Area, World urbanisation prospects, available at: https://esa.un.org/unpd/wup/dataquery/
Urban Economics (2016). Economic Significance of Property Industry to the New Zealand Economy, prepared for the Property Council New Zealand, available at: https://www.propertynz.co.nz/sites/default/files/uploaded-content/newsletter-content/economic_significance_web.pdf
© 2018 Deloitte Touche Tohmatsu 125
United Nations (2018). Annual Percentage of Population at Mid-Year Residing in Urban Area, World urbanisation prospects, available at: https://esa.un.org/unpd/wup/dataquery/
Watercare (2018). Fees and charges, available at: https://www.watercare.co.nz/Water-and-wastewater/Building-and-developing/Fees-and-charges
Wellington City Council (2009). Development Contribution Policy: Summary Guideline, available at: https://wellington.govt.nz/~/media/services/rates-and-property/property/files/development-guidelines.pdf
Wellington City Council (2018a). Resource consent fees, available at: https://wellington.govt.nz/services/consents-and-licences/resource-consents/fees
Wellington City Council (2018b). Building consent fees, available at: https://wellington.govt.nz/services/consents-and-licences/building-consents/fees
Wellington City Council (2018c). Development contributions, available at: https://wellington.govt.nz/services/rates-and-property/property/development-contributions
Westpac Banking Corporation (2017). Industry Insight: Residential Building, available at: https://www.westpac.co.nz/assets/Business/Economic-Updates/2017/Bulletins-2017/Industry-Insight-Residential-Building-September-2017.pdf
Whittlesea City Council (2018). Planning permit forms and fees, available at: https://www.whittlesea.vic.gov.au/building-planning-development/planning-permits/planning-permit-forms-and-fees/
World Bank (2018). World Bank Open Data, available from: https://data.worldbank.org/
Ying F. & Tookey J. (2017). Key Performance Indicator for Managing Construction Logistics Performance. In: Volume 2 – Proceedings of the 25th Annual Conference of the International Group for Lean Construction (IGLC) Walsh,. K, Sacks, R, Brilakis. (eds), Heraklion, Greece, pp. 869-876.
© 2018 Deloitte Touche Tohmatsu 126
Key contributors
Linda Meade
Partner, Deloitte Access Economics
Liza Van der Merwe
Associate Director, Deloitte Access Economics
Nicki Hutley
Partner, Deloitte Access Economics
Hilary Parker
Analyst, Deloitte Access Economics
Chantha Phai
Analyst, Deloitte Access Economics
Deloitte refers to one or more of Deloitte Touche Tohmatsu Limited, a UK private company limited by guarantee (“DTTL”), its network of member firms, and their related entities. DTTL and each of its member firms are legally separate and independent entities. DTTL (also referred to as “Deloitte Global”) does not provide services to clients. Please see www.deloitte.com/about for a more detailed description of DTTL and its member firms.
Deloitte provides audit, consulting, financial advisory, risk management, tax and related services to public and private clients spanning multiple industries. Deloitte serves four out of five Fortune Global 500® companies through a globally connected network of member firms in more than 150 countries bringing world-class capabilities, insights, and high-quality service to address clients’ most complex business challenges. To learn more about how Deloitte’s approximately 245,000 professionals make an impact that matters, please connect with us on Facebook, LinkedIn, or Twitter.
Deloitte New Zealand brings together more than 1200 specialist professionals providing audit, tax, technology and systems, strategy and performance improvement, risk management, corporate finance, business recovery, forensic and accounting services. Our people are based in Auckland, Hamilton, Rotorua, Wellington, Christchurch and Dunedin, serving clients that range from NZ’s largest companies and public sector organisations to smaller businesses with ambition to grow. For more information about Deloitte in NZ, look to our website www.deloitte.co.nz.
This communication contains general information only, and none of Deloitte Touche Tohmatsu Limited, its member firms, or their related entities (collectively, the “Deloitte network”) is, by means of this communication, rendering professional advice or services. No entity in the Deloitte network shall be responsible for any loss whatsoever sustained by any person who relies on this communication.
© 2018. For information, contact Deloitte Touche Tohmatsu Limited.