Embed Size (px)
Citation preview

1
Cost-of-Illness Studies—A Primer
January 2006
Joel E. Segel, B.A.
RTI International RTI-UNC Center of Excellence in
Health Promotion Economics
2
INTRODUCTION
Cost-of-illness studies measure the economic burden of a disease or diseases and estimate
the maximum amount that could potentially be saved or gained if a disease were to be eradicated.
Numerous cost-of-illness studies have been conducted over the past 30 years. Many of these
studies have been instrumental in public health policy debates because they highlight the
magnitude of the impact of an illness on society or a part of society.1,2 Knowledge of the costs of
an illness can help policy makers to decide which diseases need to be addressed first by health
care and prevention policy. Additionally, these studies can indicate for which diseases cures
would be valuable in reducing the burden of disease. For specific stakeholders, such as the
federal government, cost-of-illness studies can show the financial impact a disease has on public
programs, such as Medicare and Medicaid.3,4,5 For employers, they can show which diseases
have an especially large effect on their costs.6,7 Moreover, cost-of-illness studies provide
important information for cost-effectiveness and cost-benefit analyses. Although only one part of
cost analysis, cost-of-illness studies can provide a framework for the cost estimation in these
analyses.1,8 The value of cost-of-illness studies can be seen in their frequent use by policy makers.
For example, in response to a request from Congress, the National Institutes of Health (NIH)
released a 2000 report on the updated costs of illness for numerous diseases.9 State smoking cost-
of-illness estimates by Miller et al.10 were used in state lawsuits against the tobacco industry to
recover Medicaid losses.11 A study of the cost of injuries by Rice et al.12 was used to motivate
Centers for Disease Control and Prevention (CDC) requests for proposals for injury centers.1 A
recent pilot study by the Bureau of Labor Statistics (BLS) used a cost-of-illness method to
estimate the costs of fatal occupational injuries by state. The study “found such estimates would
3
benefit safety and health professionals and aid the overall education and prevention efforts aimed
at eliminating workplace fatalities.”13
In addition to their use by government organizations, cost-of-illness studies are often
cited in disease studies that attempt to highlight the importance of studying a particular disease,
as well as in cost-effectiveness and cost-benefit studies. For example, a study of how obesity
causes diabetes,14 a study about mitochondrial dysfunction and diabetes,15 and numerous other
studies cited a 2002 American Diabetes Association cost-of-illness study16 to illustrate the
magnitude of the burden associated with diabetes. On perhaps a more practical level, cost figures
from cost-of-illness studies are also used in cost-effectiveness and cost-benefit analyses. For
instance, a cost-effectiveness study17 of treating Alzheimer’s disease with Donepezil uses the
cost figures from an earlier Alzheimer’s disease cost-of-illness study by Rice et al.18 Similarly, a
cost-benefit analysis of physicians providing brief advice to problem drinkers19 used the cost
figures for health care utilization from a study by French and Martin20 and the highway crash
costs from a study by Miller et al.21
There are, however, limitations to the use of cost-of-illness studies. Cost-effectiveness
and cost-benefit analyses provide additional information not included in cost-of-illness studies
that can be used to determine the best course of action with respect to the disease
studied.22,23,24,25,26 Cost-of-illness studies can demonstrate which diseases may require increased
allocation of prevention or treatment resources, but they are limited in determining how
resources are to be allocated because they do not measure benefits. In addition, these studies
employ varying methods, which can limit the comparability of findings.23 Studies can vary by
perspective, sources of data, inclusion of indirect costs, and the time frame of costs.27 A clear
4
statement of the study methods can improve cost comparability.1 When performed with a clear
explanation, cost-of-illness studies represent an important analytic tool in public health policy.
COSTS
A comprehensive cost-of-illness study includes both direct and indirect costs, although
the specific focus of a study may make one or the other unnecessary. Direct costs measure the
opportunity cost of resources used for treating a particular illness, whereas indirect costs measure
the value of resources lost due to a particular illness.9 Opportunity cost, in this case, is defined by
Hodgson and Meiners as “the value of the forgone opportunity to use in a different way those
resources that are used or lost due to illness.”27 Although some studies also include intangible
costs of pain and suffering, usually in the form of quality of life measures, this category of costs
is often omitted because of the difficulty in accurately quantifying it in monetary terms. In such a
case, the study should note that intangible costs have been omitted.2,27,28
Direct Costs
When measuring direct costs, studies often measure total direct costs (i.e., the costs of
resources used) rather than net direct costs, which subtracts future medical costs avoided because
of the death of a patient, from total costs.27 Direct medical costs include hospital inpatient,
physician inpatient, physician outpatient, emergency department outpatient, nursing home care,
hospice care, rehabilitation care, specialists’ and other health professionals’ care, diagnostic
tests, prescription drugs and drug sundries, and medical supplies.2,9,27
One challenge with calculating direct medical costs, particularly hospital costs, is that
charges are often the only data available. Because of the nature of determining hospital charges,
they often do not accurately reflect the underlying costs. Charges are often higher than costs to
cover losses from patients who are unable to fully pay their expenses, such as procedures not
5
covered by insurance companies, and to cover the rising costs of replacing and updating medical
equipment.29 In addition, most insurers negotiate reimbursement rates and receive substantial
discounts off listed charges. This practice causes surveys that provide charge data—such as the
National Inpatient Sample, the American Hospital Association Annual Survey, and other surveys
specific to certain diseases—to overestimate the costs of an illness. To obtain more accurate
estimates, studies must use a cost-to-charge ratio, which can be obtained for specific hospitals
from Centers & Medicare and Medicaid Services (CMS) data30,31 or from the Agency for
Healthcare Research and Quality (AHRQ) for Healthcare Cost and Utilization Project (HCUP)
data.
Nonmedical direct costs include transportation costs to health care providers; relocation
expenses; and costs of making changes to one’s diet, house, car, or related items. However, some
nonmedical direct costs are generally not included in cost-of-illness studies, such as research,
training, and capital costs (e.g., construction). It can be difficult to attribute these costs to a
particular disease. Additionally, training health care providers for a particular illness or capital
costs, such as a new wing or equipment to treat an illness, are often reflected in the charges of
care. To include them separately would lead to the double-counting of costs.27 The specific
purpose of the study or the data available may preclude the calculation of nonmedical direct
costs. When calculated, the focus is often on direct financial costs because nonmonetary costs
can be difficult to capture.2,9,27
Indirect Costs
Indirect costs represent the other portion of estimated costs. These include mortality
costs; morbidity costs due to absenteeism and presenteeism; informal care costs (in terms of the
opportunity cost of hiring outside care); and, for the few relevant cases such as substance use or
6
violence, losses due to crime (e.g., incarceration, policing, legal, and costs to victims of
crime).9,32 Several issues exist with the estimation of indirect cost, which are discussed in the
Indirect Costs section.27,28
PERSPECTIVE
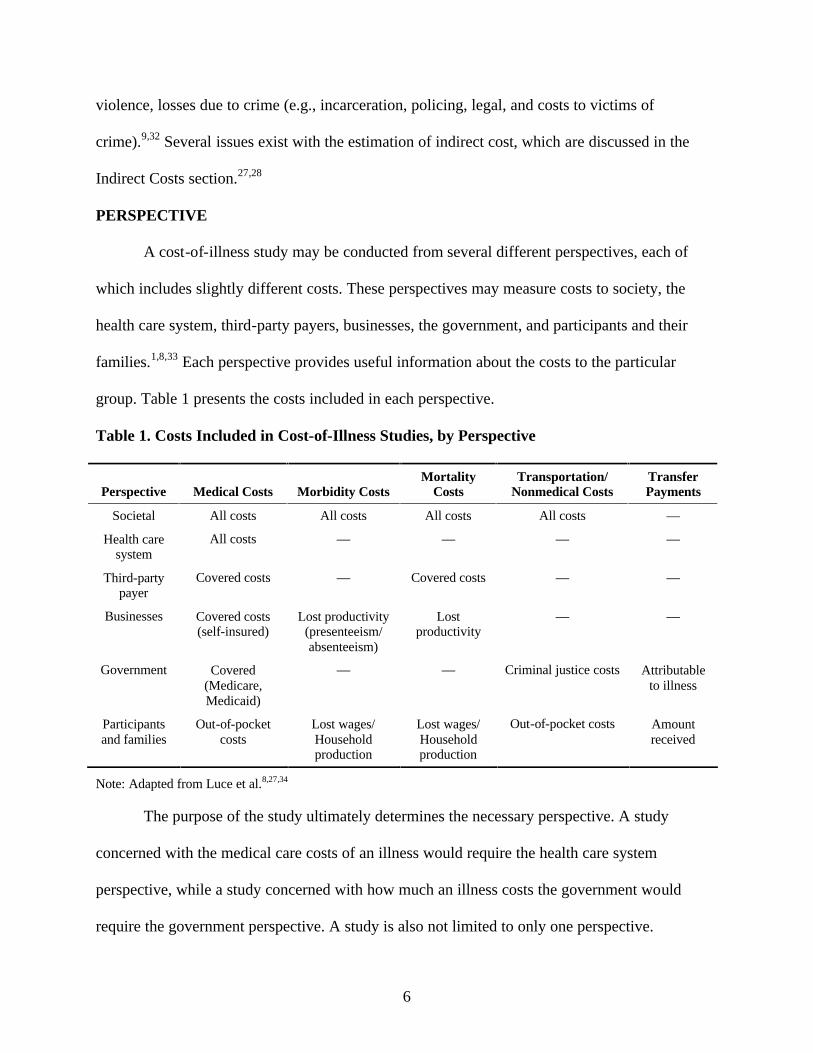
A cost-of-illness study may be conducted from several different perspectives, each of
which includes slightly different costs. These perspectives may measure costs to society, the
health care system, third-party payers, businesses, the government, and participants and their
families.1,8,33 Each perspective provides useful information about the costs to the particular
group. Table 1 presents the costs included in each perspective.
Table 1. Costs Included in Cost-of-Illness Studies, by Perspective
Perspective Medical Costs Morbidity Costs Mortality
Costs Transportation/
Nonmedical Costs Transfer Payments
Societal All costs All costs All costs All costs —
Health care system
All costs — — — —
Third-party payer
Covered costs — Covered costs — —
Businesses Covered costs (self-insured)
Lost productivity (presenteeism/ absenteeism)
Lost productivity
— —
Government Covered (Medicare, Medicaid)
— — Criminal justice costs Attributable to illness
Participants and families
Out-of-pocket costs
Lost wages/ Household production
Lost wages/ Household production
Out-of-pocket costs Amount received
Note: Adapted from Luce et al.8,27,34
The purpose of the study ultimately determines the necessary perspective. A study
concerned with the medical care costs of an illness would require the health care system
perspective, while a study concerned with how much an illness costs the government would
require the government perspective. A study is also not limited to only one perspective.
7
Researchers might estimate the more general societal costs but also include the more specific
costs to the government.
Although other purposes may require different perspectives, the societal perspective is
the most comprehensive because it includes all direct medical costs and indirect costs for all
members of the society. It does not include transfer payments, such as Medicare, Medicaid, or
Social Security benefits paid to individuals because they only represent a shift in resources, not a
use of them.8,27,34 The societal perspective is often favored because it allows a complete analysis
of all of the opportunity costs attributable to a disease and is recommended for cost-effectiveness
analysis by Gold et al.35 The societal approach, however, requires the most data, making it
difficult to use in certain cases. This is especially true with less common diseases, where data are
more limited. In these situations, data from a third-party payer may be the only reliable data
available, in which case the societal approach is clearly not feasible.
Because of the relatively larger range of costs included, the societal and health care
system perspectives inevitably tend to result in higher cost estimates than the other approaches.
A 2001 study by Szucs et al.36 illustrates the effect of choosing different perspectives. The study
estimates the costs of genital herpes using both a health care system and a health maintenance
organization (HMO), or third-party payer, perspective. The health care system perspective uses
an expert panel to estimate the direct medical costs to be $984 million, whereas the third-party
payer perspective uses an HMO claims database to estimate direct medical costs to be $283
million. The difference in approach explains most of the difference in costs, although the study
notes two additional possible explanations for some of the difference in costs. Because of the
stigma attached to sexually transmitted diseases, patients may not comply with physicians’
prescriptions or they may seek treatment anonymously at community health clinics, both of
8
which would lead to fewer claims being filed than estimated by the expert panel. Although the
explanation helps to clarify the reasons for the differences in cost estimates, the choice of
perspective can have a large effect on the actual cost estimates.
The perspective of the cost-of-illness study should be made clear because each includes
slightly different costs. While the societal perspective is the most comprehensive, the purpose of
the study drives which perspective should be chosen. More comprehensive studies may also
divide the costs by stakeholder to allow analysis from multiple perspectives, which may be
especially relevant for public policy.
DISCOUNTING
Discounting is an economic method that captures an individual’s preference for income
today rather than income in the future. This time preference is often explained by the opportunity
cost of interest. Income earned today can earn interest through investment. For example, given
an interest rate of 3 percent, a payment of $100 today is worth more than the same payment in
one year because $3 of interest can be earned if the payment is received today. Discounting
allows us to calculate the present value of payments (or costs) that occur in the future. The
present value of $100 received n years in the future when the discount rate (which is closely
related to the real interest rate) is r is given by the formula PV = payment/ (1+r)n.
Discounting is relevant for direct and indirect costs that accrue past the first year.
Numerous possible discount rates can be used to discount future costs, with each representing a
slightly different approach. The discount rates range from zero percent to 10 percent. Gold et
al.35 suggested a cost-effectiveness analysis discount rate of 3 percent. Given that cost-of-illness
studies can provide a basis for cost-effectiveness studies, the 3 percent discount rate represents a
9
good starting point. Other discount rates can be applied to determine their effect on the cost
estimates.27,37,38
INCIDENCE-BASED VERSUS PREVALENCE-BASED STUDIES
Incidence-based studies, which estimate lifetime costs, measure the costs of an illness
from onset to conclusion for cases beginning within the period of the study, usually a year.
Incidence costs include the discounted, lifetime medical, morbidity, and mortality costs for the
incident cohort. Prevalence-based studies, which estimate annual costs, measure the costs of an
illness in one period, usually a year, regardless of the date of onset. Prevalence-based studies
include all medical care costs and morbidity costs for a disease within the study year. However,
the mortality and permanent disability costs of prevalence-based studies are calculated
differently from the other costs. Discounted mortality and permanent disability costs are
calculated for all patients who die or become permanently disabled in the study year for that year
and each year until the expected age of death.37,39
Prevalence-based studies are far more common because they require less data and fewer
assumptions than incidence-based studies. Data only need to be collected from one year, and
nothing has to be known or assumed about the survival rate or course of the illness. Lifetime
costs can be calculated from annual costs, assuming a steady state of disease incidence,
progression, survival rate, and treatment; but the estimates may not be as accurate as using actual
longitudinal data on the full course of the illness because of potential future changes in medical
care technology and other assumptions.39 Despite this limitation, numerous methods provide
useful approximations of lifetime costs using annual data, all of which involve the assumption
that the structure of future costs is the same as the structure of current costs and then discounting
future costs.1,23,27,37,39
10
While the specific methods for calculating lifetime costs using annual cost data differ, the
basic approach of each method is to use annual data as a cross-section of how costs are
distributed by age. The assumption is that the cross-sectional view of the costs at different ages
represents the progression of the disease. One method is to estimate the difference in costs
incurred by those with the disease and those without the disease by age group. This provides an
“incremental” per person cost by age for those with the disease, which can be combined with
data on the number of people with the disease who are expected to survive to each age to obtain
lifetime cost estimates.40 Another method is to combine annual unit cost data with expert
opinions about the course of the disease to obtain lifetime cost estimates.41 A third method is to
use data on the percentage of costs incurred in the first year for a related condition to determine
the total lifetime costs.12 Additional related methods also exist, which are similar in the basic
approach of the aforementioned examples. Hodgson provided a description of the relationship
between annual and lifetime costs and how lifetime costs can be calculated using annual costs.39
Cost-of-illness studies are particularly useful for measuring the potential savings of
averting a case of an illness. To this end, they can aid in cost-effectiveness analysis, cost-benefit
analysis, or illness prevention analysis by providing the baseline costs of maintaining the status
quo. For an acute illness that only has costs within one year, a prevalence-based or incidence-
based study would be the same because future costs would not exist. For chronic illnesses with
costs that extend past the first year, incidence-based studies provide more information about the
costs of averting a case. A prevalence-based study can be performed with a chronic illness, but it
needs to be interpreted as a snapshot of the costs in one year, rather than the costs that could be
saved if all cases of the illness were averted.1,23,27,37,39
11
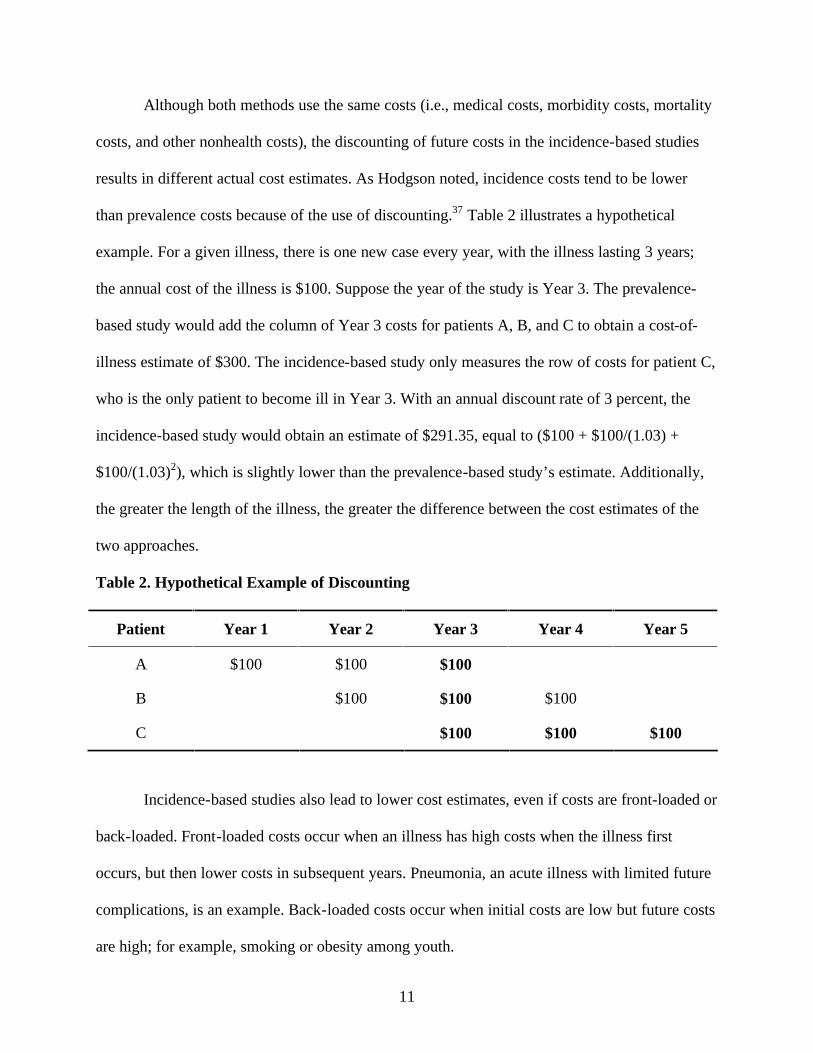
Although both methods use the same costs (i.e., medical costs, morbidity costs, mortality
costs, and other nonhealth costs), the discounting of future costs in the incidence-based studies
results in different actual cost estimates. As Hodgson noted, incidence costs tend to be lower
than prevalence costs because of the use of discounting.37 Table 2 illustrates a hypothetical
example. For a given illness, there is one new case every year, with the illness lasting 3 years;
the annual cost of the illness is $100. Suppose the year of the study is Year 3. The prevalence-
based study would add the column of Year 3 costs for patients A, B, and C to obtain a cost-of-
illness estimate of $300. The incidence-based study only measures the row of costs for patient C,
who is the only patient to become ill in Year 3. With an annual discount rate of 3 percent, the
incidence-based study would obtain an estimate of $291.35, equal to ($100 + $100/(1.03) +
$100/(1.03)2), which is slightly lower than the prevalence-based study’s estimate. Additionally,
the greater the length of the illness, the greater the difference between the cost estimates of the
two approaches.
Table 2. Hypothetical Example of Discounting
Patient Year 1 Year 2 Year 3 Year 4 Year 5
A $100 $100 $100
B $100 $100 $100
C $100 $100 $100
Incidence-based studies also lead to lower cost estimates, even if costs are front-loaded or
back-loaded. Front-loaded costs occur when an illness has high costs when the illness first
occurs, but then lower costs in subsequent years. Pneumonia, an acute illness with limited future
complications, is an example. Back-loaded costs occur when initial costs are low but future costs
are high; for example, smoking or obesity among youth.
12
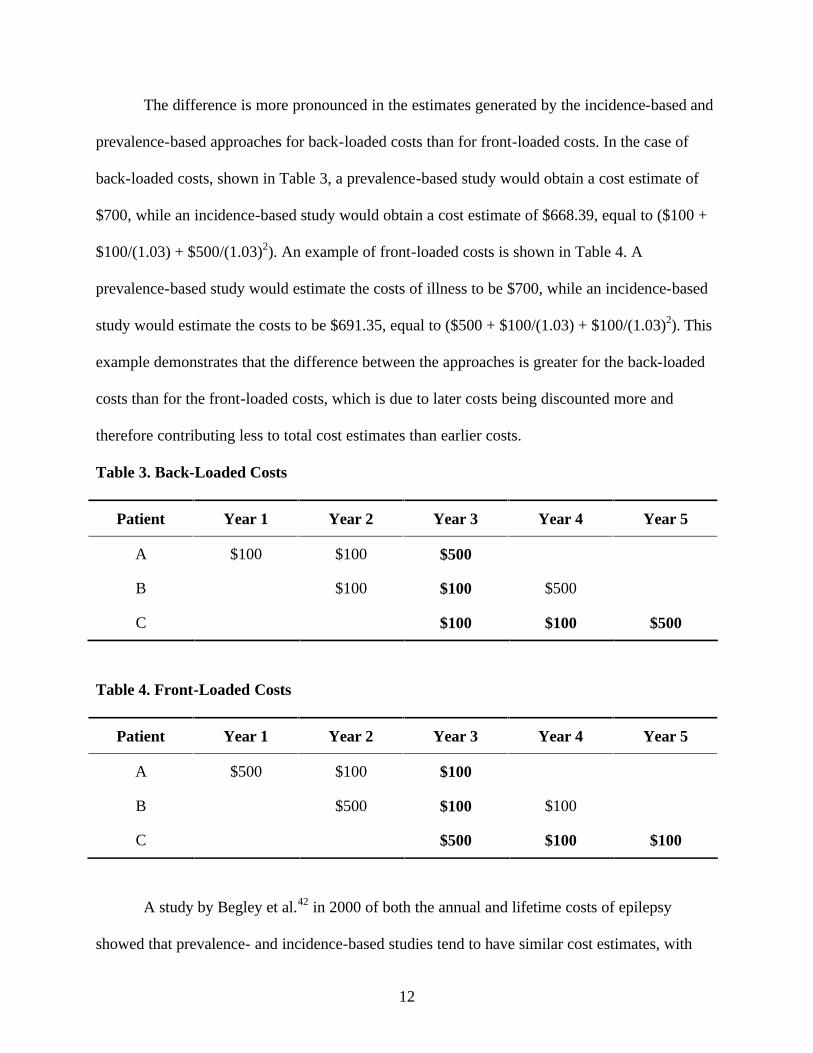
The difference is more pronounced in the estimates generated by the incidence-based and
prevalence-based approaches for back-loaded costs than for front-loaded costs. In the case of
back-loaded costs, shown in Table 3, a prevalence-based study would obtain a cost estimate of
$700, while an incidence-based study would obtain a cost estimate of $668.39, equal to ($100 +
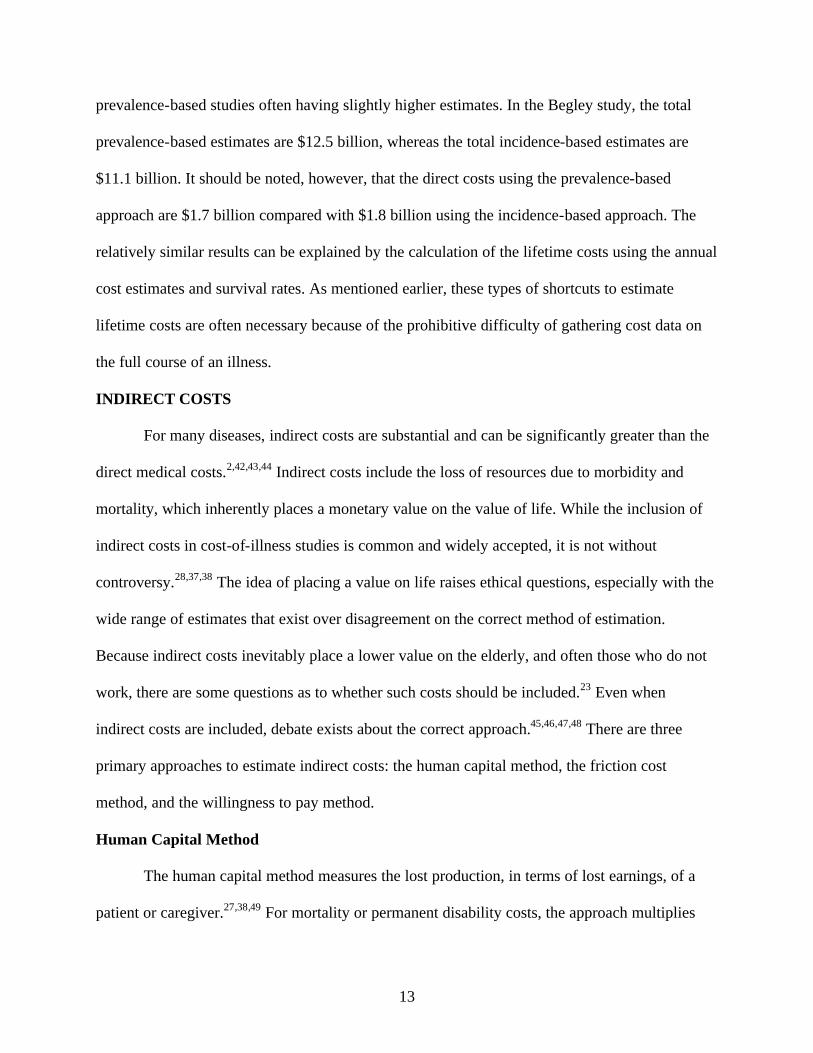
$100/(1.03) + $500/(1.03)2). An example of front-loaded costs is shown in Table 4. A
prevalence-based study would estimate the costs of illness to be $700, while an incidence-based
study would estimate the costs to be $691.35, equal to ($500 + $100/(1.03) + $100/(1.03)2). This
example demonstrates that the difference between the approaches is greater for the back-loaded
costs than for the front-loaded costs, which is due to later costs being discounted more and
therefore contributing less to total cost estimates than earlier costs.
Table 3. Back-Loaded Costs
Patient Year 1 Year 2 Year 3 Year 4 Year 5
A $100 $100 $500
B $100 $100 $500
C $100 $100 $500
Table 4. Front-Loaded Costs
Patient Year 1 Year 2 Year 3 Year 4 Year 5
A $500 $100 $100
B $500 $100 $100
C $500 $100 $100
A study by Begley et al.42 in 2000 of both the annual and lifetime costs of epilepsy
showed that prevalence- and incidence-based studies tend to have similar cost estimates, with
13
prevalence-based studies often having slightly higher estimates. In the Begley study, the total
prevalence-based estimates are $12.5 billion, whereas the total incidence-based estimates are
$11.1 billion. It should be noted, however, that the direct costs using the prevalence-based
approach are $1.7 billion compared with $1.8 billion using the incidence-based approach. The
relatively similar results can be explained by the calculation of the lifetime costs using the annual
cost estimates and survival rates. As mentioned earlier, these types of shortcuts to estimate
lifetime costs are often necessary because of the prohibitive difficulty of gathering cost data on
the full course of an illness.
INDIRECT COSTS
For many diseases, indirect costs are substantial and can be significantly greater than the
direct medical costs.2,42,43,44 Indirect costs include the loss of resources due to morbidity and
mortality, which inherently places a monetary value on the value of life. While the inclusion of
indirect costs in cost-of-illness studies is common and widely accepted, it is not without
controversy.28,37,38 The idea of placing a value on life raises ethical questions, especially with the
wide range of estimates that exist over disagreement on the correct method of estimation.
Because indirect costs inevitably place a lower value on the elderly, and often those who do not
work, there are some questions as to whether such costs should be included.23 Even when
indirect costs are included, debate exists about the correct approach.45,46,47,48 There are three
primary approaches to estimate indirect costs: the human capital method, the friction cost
method, and the willingness to pay method.
Human Capital Method
The human capital method measures the lost production, in terms of lost earnings, of a
patient or caregiver.27,38,49 For mortality or permanent disability costs, the approach multiplies
14
the earnings lost at each age by the probability of living to that age. The earnings in future years
are discounted and often a one percent real annual growth rate in earnings is assumed.2,12 The
human capital approach often includes the value of household work, usually valued as the
opportunity cost of hiring a replacement from the labor market.27,28,38
Friction Cost Method
A related method, the friction cost method, measures only the production losses during
the time it takes to replace a worker.50,51,52 This approach assumes that short-term work losses
can be made up by an employee and the loss of an employee only results in costs in the time it
takes a new employee to be hired and trained, known as the friction period.
Willingness to Pay Method
The willingness to pay approach measures the amount an individual would pay to reduce
the probability of illness or mortality.27,38 There are various methods of determining an
individual’s willingness to pay, including surveys, examining the additional wages for jobs with
high risks, examining the demand for products that lead to greater health or safety (e.g.,
seatbelts), and other related methods.12,53
Advantages and Limitations of the Three Methods
The human capital method is the most common approach used to calculate the indirect
costs of an illness. A criticism of this approach is that certain groups are assigned a higher value
than others. Because the human capital approach uses wage rates and employment rates (often by
age, sex, or race), certain groups that earn less are consequently assigned a lower value.2723,27,37
The willingness to pay approach, usually with higher estimates of the value of life than the
human capital approach,53 attempts to ameliorate these problems. However, this approach is
often difficult to implement in cost-of-illness studies. For specific diseases, extensive surveys of
15
people’s preferences are needed, although the results rely heavily on people’s responses to very
specific hypothetical questions about their willingness to avoid certain illnesses.27,38 For
communicable diseases, surveys may not fully capture the cost of the disease because of
externalities. People only take into account the cost to themselves, without taking into account
the societal benefit that having fewer people with a communicable disease benefits everybody
because the disease is less likely to spread. Thus, the willingness to pay method is often not
feasible for a cost-of-illness study.
Proponents of the friction cost method criticize the human capital method for overvaluing
the indirect costs, claiming that the productivity losses are often eliminated after a new employee
is trained and can replace the former employee. However, the friction cost method is rarely used
because it requires extensive data to attempt to estimate only the losses in the friction period.
Valuation of the productivity losses is complicated further by firms’ use of internal reserves of
labor during the friction period, which lowers the estimates of losses even more but can be
difficult to calculate.52,54,55
The choice of method, however, can have a dramatic effect on the estimates of indirect
costs. A review by Hirth et al.53 shows the wide range of estimated values of life that exist and
how the method of estimation can affect these values. The study reviews estimated values of a
quality adjusted life year (QALY), which measures both the quantity and quality of life. It takes
a value of 1 for each year of perfect health and 0 at death, with values in between for various
states of illness. Hirth et al. categorized the estimates by the method used and then provided the
median value of a QALY by method. Hirth et al. found that the median value using the human
capital method is $24,777. Three willingness to pay methods are examined, all with higher
median values than the human capital method. An approach that uses revealed preferences, such
16
as seat belt use, smoke detector use, and similar non-job-related safety measures, has a median
QALY value of $93,402. Studies using contingent valuation, a method involving answers to
direct questions about a person’s willingness to pay, have a median QALY value of $161,305.
The highest median QALY value, $428,286, is for a method using revealed preferences from
higher wages for higher risk occupations.53 A study by Goeree et al. of the productivity costs of
schizophrenia found the productivity costs using the human capital method to be nearly 70 times
those using the friction cost method.56 Because of the potential for such wide variation, it should
be clear which method is used to estimate indirect costs, especially with the impact indirect costs
can have on the total costs of illness.
TOP-DOWN, BOTTOM-UP, AND ECONOMETRIC APPROACHES
Direct costs can be estimated using one of three approaches: the top-down approach, the
bottom-up approach, or the econometric approach.
Top-Down Approach
The top-down approach, also known as the epidemiological or attributable risk approach,
measures the proportion of a disease that is due to exposure to the disease or risk factor.57,58 The
approach uses aggregated data along with a population-attributable fraction (PAF) to calculate
the attributable costs.
Studies often use an epidemiological measure known as the population-attributable
fraction,16,59,60 which was developed by Morganstern et al.61 In this approach, the proportion of
medical care for disease B attributable to disease A is measured as follows:
PAF = p(RR-1)/ [p(RR-1)+1],
where p is the prevalence rate of disease A and RR is the unadjusted relative risk of disease B for
people with disease A, compared with those without disease A.16,59,62 However, this equation
17
applies only in limited cases where other factors do not affect the association between diseases A
and B.63
Commonly, confounding variables (e.g., age, sex, and other similar variables) may be
related to both disease A and disease B. If not controlled for, the confounding variable causes a
bias (usually upward) in the relative risk and consequently the PAF. For example, there is an
association between diabetes and heart disease, yet those with diabetes and heart disease tend to
be older. Failing to account for age when calculating the PAF in this case would lead to a bias. A
couple of adjustment methods exist to account for confounding variables when calculating the
PAF, namely the Mantel-Haenszel approach and the weighted-sum approach. Both methods are
discussed in more detail by Benichou.62,63,64
A common error when using the top-down approach, which can significantly impact the
estimates, is to use a partially-adjusted method rather than one of the two methods suggested by
Benichou.64 The error consists of using the PAF equation (shown above), which can only be used
with unadjusted relative risks, with adjusted relative risks. The error occurs when the study
accounts for the confounding variables when calculating the relative risks and plugs these
adjusted relative risks into the PAF equation. This error is exacerbated if effect modification is
also present but not accounted for.
Similar to confounding, effect modification exists when a third factor affects the
association between disease A and B through interaction. For example, as mentioned earlier, age
is correlated with diabetes and heart disease, but as one gets older the effect of diabetes on heart
disease gets stronger. Not only are older people more likely to have diabetes and heart disease
(confounding), but as one gets older diabetes is more likely to lead to heart disease (effect
18
modification). As this example shows, it can sometimes be difficult to tease apart how the
additional variable affects the association between the two illnesses.63,64
Bottom-Up Approach
While the top-down approach is a valid approach to avoid the need to calculate PAFs and
the potentially more cumbersome methods needed to prevent a bias in the estimate, the bottom-
up or econometric approach can be used. The bottom-up approach estimates costs by calculating
the average cost of treatment of the illness and multiplying it by the prevalence of the illness.57,58
Because the average cost of treatment for an illness is seldom readily available, the bottom-up
approach often calculates the average cost of treatment by adding together the various pieces of
the treatment. The bottom-up approach often multiplies the unit cost of a particular treatment by
the average amount of utilization of the treatment to get an average cost estimate of the
treatment. For example, the average cost of an outpatient physician visit is multiplied by the
number of visits to get an average cost of outpatient physician care for the particular illness. The
method is repeated for each type of care to obtain a total average cost per case, which is then
multiplied by the prevalence of the illness to get an estimate of the total direct costs.2,43
Econometric Approach
The econometric or incremental approach estimates the difference in costs between a
cohort of the population with the disease and a cohort of the population without the disease. The
two cohorts are matched, usually via regression analysis, by various demographic characteristics
(e.g., sex, age, race, geographic location) and the presence of other chronic conditions. Within
the econometric approach, there are again two methods of estimating costs: a mean differences
approach and a multistage regression approach. The mean differences approach compares the
mean costs incurred by each of the two cohorts to determine the incremental difference
19
attributable to the disease of interest.65,66,67 Studies using the mean differences approach
sometimes only provide the cost per case of the disease of interest, rather than a total cost
estimate.66,67
A multiple-stage regression is typically run if there are a large number of cases with zero
costs and a few cases of very high costs. The incremental cost of the disease is measured by
comparing the regression estimate with the disease dummy variable turned on to the regression
estimate with the disease dummy variable turned off. The multiple-stage regression often uses a
two-stage regression in the cost estimation, although there are many other possible variants of
the multiple-stage regression.3,68,69,70 The approach involves estimating the likelihood of an
individual receiving any care and then the excess cost of care if care is received.
Because the econometric approach measures the incremental difference between persons
who have the disease and those who do not, it often only requires one dataset.65,69 The top-down
approach usually requires data on the costs as well as on the relative risks, which are needed to
calculate the PAFs. The bottom-up approach often requires data from multiple sources for the
unit cost and utilization rate of the different types of care. While each method is valid, the
econometric approach has the advantage of requiring less data.
DEFINITION OF ILLNESS
Diagnostic Definition
The costs attributable to an illness depend largely on how the illness is defined
diagnostically. Studies typically use the International Classification of Diseases, 9th/10th
Revision codes as a basis of defining the illness of interest.9,28,49 Yet the actual choice of which
codes to include can vary significantly for a disease. For example, heart disease can be defined in
different ways, by including or excluding conditions ranging from angina to ischemic heart
20
disease to hypertension. Which condition to include is an important issue and can have a
dramatic effect on the levels of costs estimated.
A study by Javitz et al.71 of the costs of angina demonstrates the extent of the issue. This
study defined angina specifically and then more generally as all coronary heart disease. The cost
estimates ranged dramatically from $1.9 billion to $74.8 billion, emphasizing the need for a
study to clearly state how the disease is defined.
Secondary Diagnoses
A second issue in defining a disease is whether to include secondary diagnoses. With
multiple diagnoses for a medical treatment, a study must decide how to attribute the costs among
the diagnoses. To accurately include the costs of secondary diagnoses, the causal pathway of the
various diagnoses must be understood. The secondary diagnosis may be listed because it is the
underlying cause, because it is a complication, or possibly just as a note to inform the health care
provider. For instance, diabetes may be listed as a secondary diagnosis for a foot amputation
because it is the underlying cause, for a heart-related procedure because diabetes is a
complicating factor, or for pneumonia just as a note to warn the provider that the patient has
diabetes. In this example, the costs attributable to diabetes should be highest when it is the cause,
slightly lower when it is a complicating factor, and minimal if not zero when it is unrelated to the
primary diagnosis.
In addition, knowledge of the causal pathway is needed to determine how the costs are to
be attributed to a secondary diagnosis. The simplest method is to include only primary diagnoses,
but this may ignore a large contribution of the secondary diagnoses to the attributable costs.
Another method is to include secondary diagnoses with relative weights. For instance, a disease
with a primary and a secondary diagnosis might have 80 percent of its costs attributed to the
21
primary diagnosis and 20 percent to the secondary diagnosis. The costs of a disease may also be
estimated as the incremental increase in cost attributable to the secondary diagnosis.72
A study by Ward et al.72 examined the effect that the different approaches can have on
the cost-of-illness estimates. This study used data from the National Hospital Discharge Survey
to estimate the costs of chronic obstructive pulmonary disease (COPD) with three different
approaches. The costs are estimated with COPD as the primary diagnosis, with a weighted
approach, and with an incremental approach. The weighted approach assigns various weights to
the secondary and tertiary COPD diagnoses depending on whether the diagnosis is related to the
primary diagnosis. The more related the diagnoses, the higher the weight. The study estimates
the costs of COPD, when listed only as the primary diagnosis, to be $710 million. Using the
weighted approach, the costs are estimated to be $2.2 billion. Using the incremental approach,
the costs are estimated to be $1.6 billion. There is a threefold difference in cost between the
approaches, highlighting the importance of choosing an appropriate approach.
Ward et al. also provided recommendations for when to use each approach. They
recommended only including primary diagnoses if there are not any particular comorbidities
associated with the disease. Illnesses with no appreciable secondary diagnoses on the causal
pathway are rare, although examples include rhinitis and some types of skin disease. If
significant comorbidities exist, the costs could be underestimated. The study suggests the
weighted approach is most appropriate for diseases where treatment is clearly attributable to the
condition, even with the presence of comorbidities, such as psychiatric disorders. The drawback
to the approach is the subjective nature of the weights assigned and the possibility of double-
counting. Because the weights are selected for each individual disease, the total costs of all
diseases if added together could exceed 100 percent of the total amount spent on health care. The
22
difficulty in selecting appropriate weights limits the use of this approach. Although it requires
illness prevalence data by age and gender, the authors recommended the incremental approach
for diseases that have significant comorbidities.
COMORBIDITY
The presence of comorbidities on the causal pathway, often defined via secondary
diagnoses, can lead to significant increases in the cost of an illness. Ignoring the comorbidities of
an illness can cause significant underestimation of the costs of an illness.38,73,74 However,
including all costs of multiple diagnoses can lead to the problem of double-counting,54,74 which
can occur because of the difficulty in accurately separating the costs of related diseases. When
the costs of illness are estimated for related diseases, such as diabetes and heart disease, the
overlap may be counted twice, once for each disease. The problem can potentially lead to the
sum of the cost estimates exceeding the total expenditures for health care.72
Attributable costs of comorbidities can be calculated using either attributable risk
analysis or econometric analysis. Attributable risk analysis, often known as the epidemiological
approach, uses the same method as the top-down approach described earlier. Econometric
analysis uses the same method as the econometric approach described earlier.
The use of one of the two methods of calculating comorbidity costs is especially
important for estimating the costs of risk factors, such as smoking and obesity. Risk factors have
few directly attributable costs because the majority of the costs reflect the costs of diseases for
which they are causes. For example, obesity itself has few costs; rather, its high costs are due to
the causal effect on heart disease, diabetes, musculoskeletal disorders, and other illnesses.
23
DATA
The appropriate data source to use for a cost-of-illness study varies by the illness,
perspective, and approach of the study. The following are some possible data sources as a
starting point for performing a cost-of-illness study using the societal or health care system
perspective. This is not an exhaustive list of data sources.
Common Illnesses
National datasets are appropriate for more common illnesses, such as diabetes,
cardiovascular disease, asthma, cancer, and others with relatively high prevalence rates. Table 5
presents possible data sources for calculating medical costs using a prevalence-based approach.
The data sources for utilization rates and costs vary by type. While data of annual costs can be
used for the calculation of lifetime cost estimates, as mentioned earlier, incidence-based studies
may also require illness-specific data on the course of the illness. One example of this is the
Surveillance, Epidemiology, and End Results Program of the National Cancer Institute, which
provides incidence and survival data for various types of cancer.
24
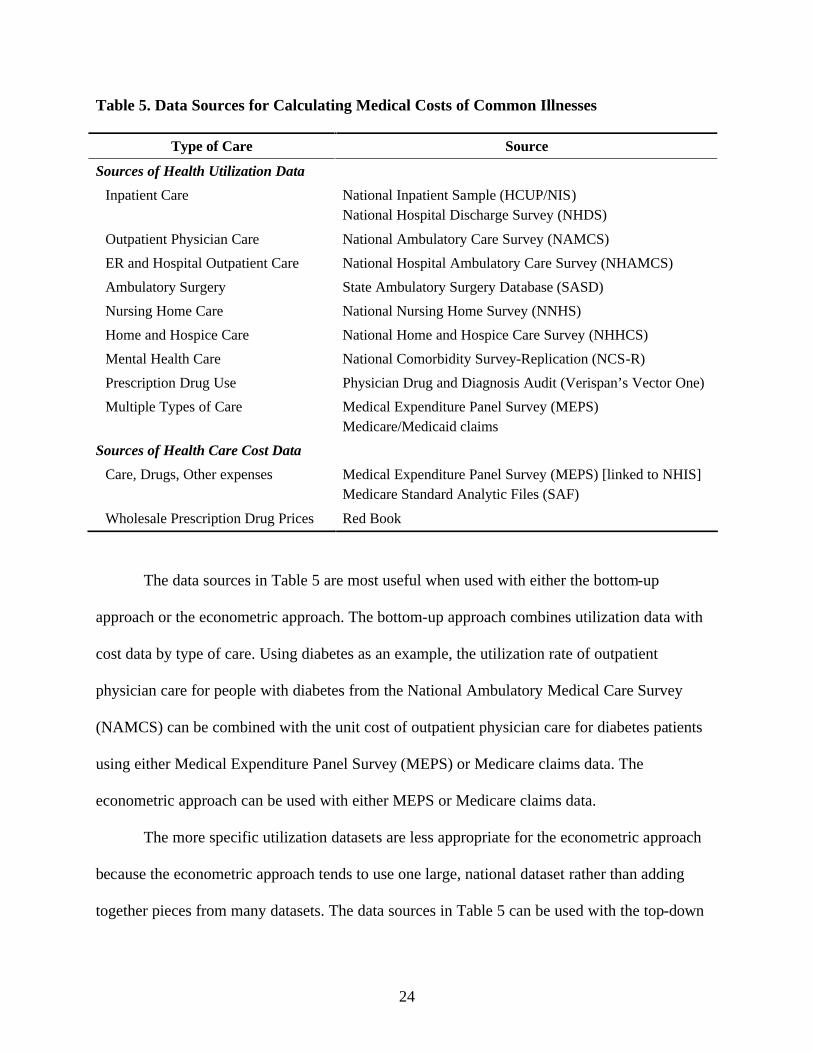
Table 5. Data Sources for Calculating Medical Costs of Common Illnesses
Type of Care Source
Sources of Health Utilization Data Inpatient Care National Inpatient Sample (HCUP/NIS)
National Hospital Discharge Survey (NHDS)
Outpatient Physician Care National Ambulatory Care Survey (NAMCS) ER and Hospital Outpatient Care National Hospital Ambulatory Care Survey (NHAMCS) Ambulatory Surgery State Ambulatory Surgery Database (SASD) Nursing Home Care National Nursing Home Survey (NNHS) Home and Hospice Care National Home and Hospice Care Survey (NHHCS) Mental Health Care National Comorbidity Survey-Replication (NCS-R) Prescription Drug Use Physician Drug and Diagnosis Audit (Verispan’s Vector One) Multiple Types of Care Medical Expenditure Panel Survey (MEPS)
Medicare/Medicaid claims Sources of Health Care Cost Data
Care, Drugs, Other expenses Medical Expenditure Panel Survey (MEPS) [linked to NHIS] Medicare Standard Analytic Files (SAF)
Wholesale Prescription Drug Prices Red Book
The data sources in Table 5 are most useful when used with either the bottom-up
approach or the econometric approach. The bottom-up approach combines utilization data with
cost data by type of care. Using diabetes as an example, the utilization rate of outpatient
physician care for people with diabetes from the National Ambulatory Medical Care Survey
(NAMCS) can be combined with the unit cost of outpatient physician care for diabetes patients
using either Medical Expenditure Panel Survey (MEPS) or Medicare claims data. The
econometric approach can be used with either MEPS or Medicare claims data.
The more specific utilization datasets are less appropriate for the econometric approach
because the econometric approach tends to use one large, national dataset rather than adding
together pieces from many datasets. The data sources in Table 5 can be used with the top-down
25
approach, although additional data would be needed to calculate the population-attributable
fractions.
Sources for calculating indirect costs are based on the use of the human capital method.
Mortality costs are calculated as the lost earnings due to premature mortality. Mortality data,
including age and cause of death, can be obtained from the National Center for Health Statistics’
Division of Vital Statistics, including the Mortality Data, Multiple Cause-of-Death Public-Use
Data Files or the Compressed Mortality File from CDC Wonder. The number of years of life
lost, using life expectancy data from the National Center for Health Statistics, can be combined
with wage data from the BLS—including its Current Population Survey, which includes
employment rates, mean annual earnings, and the mean annual value of housekeeping—to
estimate total mortality costs. Indirect costs often extend far into the future, so the wage data
should reflect expected increases for future years.
Social Security Administration (SSA) data on disability by condition and National Health
Interview Survey (NHIS) disability data can be combined with BLS earnings data to compute the
losses attributable to disability. It should be noted that SSA data would lead to an underestimate
of the number of disabled people because it provides data on the number of people who receive
disability benefits. The number of people who are actually disabled exceeds the number who
receive benefits. Productivity loss estimates due to absenteeism can be calculated by combining
MEPS and NHIS data on lost workdays with BLS wage data. However, productivity losses due
to presenteeism may require additional secondary data specific to the disease of interest.
Less Common Illnesses
For less common illnesses, MEPS and other national databases can suffer from small
sample size problems, especially for some demographic groups.16 A less common disease may
26
have too few occurrences in the national datasets to derive meaningful cost estimates. For these
diseases, other more specific datasets may be required to obtain reliable data. Medicare claims
data are very extensive and can provide useful data for some less common illnesses, especially
those affecting the elderly population. The drawback to Medicare data, however, is that they are
not readily accessible and they are expensive to obtain.
Other disease- or population-specific datasets can provide the necessary data on health
care utilization rates. For example, it is difficult to estimate accurately the costs of Alzheimer’s
disease or Parkinson’s disease from the previous national datasets. However, data from the
National Long Term Care Survey, which gathers data on the health status and health care use of
the elderly, can provide utilization rate data for Alzheimer’s disease, Parkinson’s disease, or
other diseases that primarily affect the elderly, and thus may not be well represented in a general
national survey.
For some less common illnesses (e.g., autism), the existing data on medical care
utilization may not be adequate. In these cases, a survey may be required to gather the necessary
data. Regardless of the method used to obtain data on the utilization of medical care for an
illness, the unit costs of care can be estimated using reimbursement rates from the Medicare
Standard Analytic Files. These costs are combined with utilization rates to obtain medical care
cost estimates, using a method similar to that for more common illnesses.
An additional issue with less common illnesses, especially those affecting the elderly, is
the relatively high rate of informal care use. Informal care is often not captured in the national
datasets, which may lead to a significant underestimation of the costs of illness for diseases with
high rates of informal care utilization. Disease-specific studies exist that estimate the costs of
informal care. However, it may be necessary to perform a survey to obtain data on the rates of
27
informal care. McDaid75 provided examples of studies and a discussion of some of the issues
involved in estimating informal care costs for Alzheimer’s disease.
The human capital method can still be used to estimate the indirect costs for less common
illnesses. These costs can be calculated using the same mortality and wage data that are used
with more common illnesses. However, rates of disability and lost work time may need to be
estimated with disease-specific surveys or by performing original surveys.
Risk Factors
The costs of risk factors, such as smoking and obesity, are estimated slightly differently
than costs of most illnesses. Risk factors have few costs themselves, but rather cause other
illnesses that may have high costs. Thus, the risk factor is rarely listed as a diagnosis, which
means many of the surveys of medical care utilization for more common illnesses are not
appropriate. On the other hand, certain risk factors are common, such as smoking and obesity,
meaning that national databases capture the appropriate data.
Some surveys, such as MEPS and NHIS, include responses to behavioral questions as
well as height and weight information that can be used to estimate the cost of smoking and
obesity, respectively. Because the cost of risk factors is measured largely by the illnesses they
cause, a method of attributing the medical costs to the risk factor is necessary. Either an
econometric or an epidemiological approach using a PAF is used. Thus, the top-down or
econometric approaches are more appropriate than the bottom-up approach for measuring the
costs of a risk factor.
Indirect costs can be calculated using the same human capital method that is used for
other diseases. NHIS and MEPS data on absenteeism and CDC mortality data can be used, but a
calculation must be made of the amount of missed work time and the number of premature
28
deaths that are attributable to the risk factor. These calculations are not trivial, and controversy
exists about the correct figures to use.76 BLS wage data can still be used in the indirect costs
estimation. Data on attributable disability and absenteeism may have to be estimated from risk-
factor-specific or original surveys for less common risk factors.
SENSITIVITY ANALYSIS
Sensitivity analysis is recommended anytime there is uncertainty.77 Cost-of-illness
studies rely on estimates with varying degrees of uncertainty and they should examine and vary
the assumptions made to determine the range of possible values the costs of illness can take. A
study should provide estimates with several different discount rates, illness prevalence rates, and
any other variables that may have potentially different values. While point estimates are more
useful for bringing attention to the costs of an illness, a range of possible costs has more
credibility for health policy analysis.27,37
29
COST-OF-ILLNESS GUIDELINES: WHAT YOU NEED TO KNOW
COSTS
• Direct medical costs include hospital inpatient, physician inpatient, physician
outpatient, emergency department outpatient, nursing home care, hospice care,
rehabilitation care, specialists’ and other health professionals’ care, diagnostic tests,
prescription drugs and drug sundries, and medical supplies.
• Direct nonmedical costs include transportation, relocation, and expenses to change
diet, house, car, etc.
• Research, training, and capital costs of care are not included.
• Indirect costs include mortality costs, morbidity costs, informal care costs, and losses
due to crime.
PERSPECTIVE
• The research question guides which perspective is appropriate.
• The societal and health care system perspectives are the most comprehensive and
most often used. However, additional perspectives may also be used to provide
information about the costs to a particular group.
INCIDENCE-BASED AND PREVALENCE-BASED STUDIES
• Incidence- and prevalence-based estimates will generally be equivalent if the costs all
occur in one year.
• If the costs extend past one year, incidence-based estimates provide information about
the cost of averting a case, whereas prevalence-based estimates provide a snapshot of
current costs.
30
INDIRECT COSTS
• For practicality, the human capital method is generally recommended.
TOP-DOWN, BOTTOM-UP, AND ECONOMETRIC APPROACHES
• The top-down approach requires additional data about the causal pathway to calculate
the population-attributable fraction.
• The bottom-up approach combines unit cost data with utilization data, which means it
can be useful for less common illnesses.
• The econometric approach is most appropriate with a large, national dataset and is
especially useful for risk factors.
DEFINITION OF ILLNESS AND COMORBIDITY
• For illnesses with significant comorbidities, an incremental approach is recommended
to ensure the inclusion of all appropriate costs.
DATA
• Large national datasets are always appropriate, although they may suffer from small
sample size for some less common illnesses.
• For less common illnesses, additional data are required, often in the form of
population- or disease-specific datasets and surveys.
DISCOUNT RATE
• A 3 percent discount rate is most common, although using multiple rates is
recommended to observe the effect of changing the discount rate.
SENSITIVITY ANALYSIS
• Applying different values for factors where uncertainty exists is recommended to
determine the possible range of costs.
31
REFERENCES
1. Rice DP, Cost of Illness Studies: What is Good About Them? Injury Prevention 2000, 6:
177-179.
2. Rice D, The Economic Burden of Musculoskeletal Conditions, US, 1995. In: Praemer A,
Furner S, and Rice DP editors, Musculoskeletal Conditions in the US. Rosemont, IL:
American Academy of Orthopedic Surgeons: 1999.
3. Finkelstein EA, Fiebelkorn IC, and Wang G, National Medical Spending Attributable to
Overweight and Obesity: How Much and Who’s Paying. Health Affairs 2003, 14 May:
W3-219- W3-226.
4. Taylor DH and Sloan FA, How Much Do Persons with Alzheimer’s Disease Cost
Medicare? Journal of the American Geriatrics Society 2000, 48: 639-646.
5. Bartlett JC, Miller LS, Rice DP, Max W, Medical Care Expenditures Attributable to
Cigarette Smoking- United States, 1993. Morbidity Mortality Weekly Report 1994, 43:
469-472.
6. Thompson D, Edelsberg J, Kinsey KL, and Oster G, Estimated Economic Costs of
Obesity to US Businesses. American Journal of Health Promotion 1998, 13 (2): 120-127.
7. Goetzel RZ, Long SR, Ozminkowski RJ, Hawkins K, Wang S, and Lynch W, Health,
Absence, Disability, and Presenteeism Cost Estimates of Certain Physical and Mental
Health Conditions Affecting US Employers. Journal of Occupational and Environmental
Medicine 2004, 46: 398-412.
8. Luce BR, Manning WG, Siegel JE, and Lipscomb J, Estimating Costs in Cost-
Effectiveness Analysis. In: Gold MR, Siegel JE, Russell LB, et al., eds., Cost-
effectiveness in Health and Medicine. New York: Oxford University Press, 1996.
32
9. Kirschstein R, Disease-Specific Estimates of Direct and Indirect Costs of Illness and NIH
Support: Fiscal Year 2000 Update. http://ospp.od.nih.gov/ecostudies/COIreportweb.htm
Accessed 8 December 2005.
10. Miller LS, Zhang X, Novotny T, Rice DP, and Max W, State Estimates of Medicaid
Expenditures Attributable to Cigarette Smoking, Fiscal Year 1993. Public Health Reports
1998, 113 (2): 140-151.
11. Warner KE, Hodgson TA, and Carroll CE, Medical Costs of Smoking in the United
States: Estimates, Their Validity, and Their Implication. Tobacco Control 1999, 8: 290-
300.
12. Rice DP, MacKenzie EJ, and Associates, Cost of Injury in the United States: A Report to
Congress. San Francisco, CA: Institute for Health and Aging, University of California
and Injury Prevention Center, Johns Hopkins University, 1989.
13. Biddle E, Hartley D, Starkey S, Fabrega V, and Richardson S, Deriving Occupational
Fatal Injury Costs: A State Pilot Study.
http://www.bls.gov/opub/cwc/sh20050216ar01p1.htm Accessed 12 August 2005.
14. Lazar MA, How Obesity Causes Diabetes: Not a Tall Tale. Science 2005, 307(5708):
373-375.
15. Lowell BB and Shulman GI, Mitochondrial Dysfunction and Type 2 Diabetes. Science
2005, 307(5708): 384-387.
16. American Diabetes Association, Economic Costs of Diabetes in the US in 2002. Diabetes
Care 2003, 26(3): 917- 932.
33
17. Neumann PJ, Hermann RC, Kuntz KM, Araki SS, Duff SB, Leon J, Berenbaum PA,
Goldman PA, Williams LW, and Weinstein MC, Cost-Effectiveness of Donepezil in the
Treatment of Mild or Moderate Alzheimer’s Disease. Neurology 1999, 52(6): 1138-1145.
18. Rice DP, Fox PJ, Max W, Webber PA, Lindeman DA, Hauck WW, and Segura E, The
Economic Burden of Alzheimer’s Disease Care. Health Affairs 1993, 12(2): 164-176.
19. Fleming MF, Mundt MP, French MT, Manwell LB, Stauffacher EA, and Barry KL,
Benefit-Cost Analysis of Brief Physician Advice with Problem Drinkers in Primary Care
Settings. Medical Care 2000, 38(1): 7-18.
20. French MT and Martin RF, The Costs of Drug Abuse Consequences: A Summary of
Research Findings. Journal of Substance Abuse Treatment 1996, 13(6): 453-466.
21. Miller TR, Lestina DC, Spicer RS. Highway Crash Costs in the US by Driver Age,
Victim Age, Blood Alcohol Level, and Restraint Use. Accident Analysis and Prevention
1998, 30:137-150.
22. Byford S, Torgerson DJ, Raftery J, Cost of Illness Studies. BMJ 2000, 320: 1335.
23. Drummond M, Cost-of-Illness Studies: A Major Headache? Pharmacoeconomics 1992, 2
(1): 1-4.
24. Currie G, Kerfoot KD, Donaldson C, and Macarthur C, Are Cost of Injury Studies
Useful? Injury Prevention 2000, 6: 175-176.
25. Roux L and Donaldson C, Economics and Obesity: Costing the Problem or Evaluating
Solutions? Obesity Research 2004, 12: 173-179.
26. Corso P, Grosse S, and Finkelstein E, The Skinny on COI Analysis. Obesity Research
2004, 12: 1189.

34
27. Hodgson TA and Meiners MR, Cost of Illness Methodology: A Guide to Current
Practices and Procedures. Milbank Memorial Fund Quarterly 1982, 60 (3): 429-462.
28. Cooper BS and Rice DP, The Economic Cost of Illness Revisited. Social Security
Bulletin 1976, 39 (2): 21-36.
29. Finkler SA, The Distinction Between Costs and Charges. Annals of Internal Medicine
1982, 96: 102-109.
30. Freedberg KA, Scharfstein JA, Seage GR III, Losina E, Weinstein MC, Craven DE, and
Paltiel AD, The Cost-Effectiveness of Preventing AIDS-related Opportunistic Infections.
JAMA 1998, 279 (2): 130-136.
31. Rogowski J, Measuring the Cost of Prenatal and Perinatal Care. Pediatrics 1999, 103
(suppl 1 E): 329-335.
32. Mark TL, Woody GE, Juday T, and Kleber HD, The Economic Costs of Heroin
Addiction in the United States. Drug and Alcohol Dependence 2001, 61: 195-206.
33. Hodgson TA, Costs of Illness in Cost-Effectiveness Analysis: A Review of the
Methodology. Pharmacoeconomics 1994, 6 (6): 536- 552.
34. Choi BCK, Robson L, and Single E, Estimating the Economic Costs of the Abuse of
Tobacco, Alcohol and Illicit Drugs: A Review of Methodologies and Canadian Data
Sources. Chronic Diseases in Canada 1997, 18 (4): 149-165.
35. Gold MR, Siegel JE, Russell LB, and Weinstein MC, Cost Effectiveness in Health and
Medicine. Oxford University Press: New York, 1996.
35
36. Szucs TD, Berger K, Fisman DN, and Harbarth S, The Estimated Economic Burden of
Genital Herpes in the United States. An Analysis Using Two Costing Approaches. BMC
Infectious Diseases 2001, 1:5. http://www.biomedcentral.com/content/pdf/1471-2334-1-
5.pdf Accessed 8 August 2005.
37. Hodgson TA, The State of the Art of Cost-of-Illness Studies. Advances in Health
Economics and Health Services Research 1983, 4: 129-164.
38. Rice DP, Kelman S, Miller LS, and Dunmeyer S, The Economic Costs of Alcohol and
Drug Abuse and Mental Illness, 1985. Rockville, MD: National Institute on Drug Abuse,
1990.
39. Hodgson TA, Annual Costs of Illness Versus Lifetime Costs of Illness and Implications
of Structural Change. Drug Information Journal 1988, 22: 323-341.
40. Honeycutt AA, Grosse SD, Dunlap LJ, et al., Economic Costs of Mental Retardation,
Cerebral Palsy, Hearing Loss, and Vision Impairment. In: Altman BM, Barnartt SN,
Hendershot G, Larson S, eds. Using Survey Data to Study Disability: Results from the
National Health Interview Survey on Disability. London, England: Elsevier Science Ltd.,
2003: 207-28.
41. Begley CE, Annegers JF, Swann AC, Lewis C, Coan S, Schnapp WB, and Bryant-
Comstock L, The Lifetime Cost of Bipolar Disorder in the US: An Estimate for New
Cases in 1998. Pharmacoeconomics 2001, 19 (5 pt.1): 483-495.
42. Begley CE, Famulari M, Annegers JF, Lairson DR, Reynolds TF, Coan S, Dubinsky S,
Newmark ME, Leibson C, So EL, and Rocca WA, The Cost of Epilepsy in the United
States: An Estimate from Population-based Clinical and Survey Data. Epilepsia 2000,
41(3): 342-351.
36
43. Rice DP and Miller LS, Health Economics and Cost Implications of Anxiety and Other
Mental Disorders in the United States. British Journal of Psychiatry 1998, 173 (suppl.
34): 4-9.
44. Honeycutt A et al, Economic Costs Associated with Mental Retardation, Cerebral Palsy,
Hearing Loss, and Vision Impairment—United States, 2003. Morbidity and Mortality
Weekly Report 2004, 53 (3): 57-59.
45. Mrozek JR and Taylor LO, What Determines the Value of Life? A Meta-Analysis.
Journal of Policy Analysis and Management 2002, 21(2): 253-270.
46. Rice DP and Hodgson TA, The Value of Human Life Revisited. American Journal of
Public Health 1982, 72(6): 536-538.
47. Landefeld JS and Seskin EP, The Economic Value of Life: Linking Theory to Practice.
American Journal of Public Health 1982, 72(6): 555-566.
48. Mishan EJ, Evaluation of Life and Limb: A Theoretical Approach. Journal of Political
Economy 1971, 79(4): 687-705.
49. Rice DP, Estimating the Cost of Illness. American Journal of Public Health 1967, 57 (3):
424-440.
50. Koopmanschap MA and van Ineveld BM, Towards a New Approach for Estimating
Indirect Costs of Disease. Social Science and Medicine 1992, 34 (9): 1005-1010.
51. Koopmanschap MA, Rutten FFH, van Ineveld BM, and van Roijen L, The Friction Cost
Method for Measuring Indirect Costs of Disease. Journal of Health Economics 1995, 14:
171-189.
52. Johannesson M and Karlsson G, Journal of Health Economics 1996, 16: 249-255.
37
53. Hirth RA, Chernew ME, Miller E, Fendrick AM, and Weissert WG, Willingness to Pay
for a Quality-Adjusted Life Year: in Search of a Standard. Medical Decision Making
2000, 20(3): 332-342.
54. Pagano E, Brunetti M, Tediosi F, and Garattini L, Costs of Diabetes: A Methodological
Analysis of the Literature. Pharmacoeconomics 1999, 15 (6): 583-595.
55. Rothermich EA and Pathak DS, Productivity-Cost Controversies in Cost-Effectiveness
Analysis: Review and Research Agenda. Clinical Therapeutics 1999, 21 (1): 255-267.
56. Goeree R, O’Brien BJ, Blackhouse G, Agro K, and Goering P, The Valuation of
Productivity Costs Due to Premature Mortality: A Comparison of the Human-Capital and
Friction-Cost Methods for Schizophrenia. Canadian Journal of Psychiatry 1999, 44 (5):
455-463.
57. Bloom BS, Bruno DJ, Maman DY, and Jayadevappa R, Usefulness of US Cost-of-Illness
Studies in Healthcare Decision Making. Pharmacoeconomics 2001, 19(2): 207-213.
58. Liu JL, Maniadakis N, Gray A, and Rayner M, The Economic Burden of Coronary Heart
Disease in the UK. Heart 2002, 88(6): 597-603.
59. Hodgson TA and Cohen AJ, Medical Care Expenditures for Diabetes, Its Chronic
Complications, and Its Comorbidities, Preventive Medicine 1999, 29: 173-186.
60. Reynaud M, Gaudin-Colombel AF, and Le Pen C, Two Methods of Estimating Health
Costs Linked to Alcoholism in France (With a Note on Social Costs). Alcohol and
Alcoholism 2001, 36 (1): 89-95.
61. Morganstern H, Kleinbaum DG, and Kupper LL, Measures of Disease Incidence Used in
Epidemiological Research, International Journal of Epidemiology 1980, 9: 97-104.
38
62. Rockhill B, Newman B, and Weinberg C, Use and Misuse of Population Attributable
Fractions. American Journal of Public Health 1998, 88(1): 15-19.
63. Benichou J, A Review of Adjusted Estimators of Attributable Risk. Statistical Methods in
Medical Research 2001, 10(3); 195-216.
64. Flegal KM, Graubard BI, and Williamson DF, Methods of Calculating Deaths
Attributable to Obesity. American Journal of Epidemiology 2004, 160(4): 331-338.
65. Birnbaum HG, Kessler RC, Lowe SW, Secnik K, Greenberg PE, Leong SA, and Swensen
AR, Costs of Attention Deficit Hyperactivity Disorder: Excess Costs of Persons with
ADHD and Their Family Members in 2000. Current Medical Research and Opinion
2005, 21 (2): 195-205.
66. Rubenstein LM, Chrischilles EA, and Voelker MD, The Impact of Parkinson’s Disease
on Health Status, Health Expenditures, and Productivity: Estimates from the National
Medical Expenditure Survey. Pharmacoeconomics 1997, 12 (4): 486-498.
67. Swensen A, Birnbaum HG, Secnik K, Marynchenko M, Greenberg P, and Claxton A,
Attention Deficit/Hyperactivity Disorder: Increased Costs for Patients and Their
Families. Journal of the American Academy of Child and Adolescent Psychiatry 2003, 42
(12): 1415-1423.
68. Yelin E, Trupin L, Cisternas M, Eisner M, Katz P, and Blanc P, A National Study of
Medical Care Expenditures for Respiratory Conditions. European Respiratory Journal
2002, 19: 414-421.
69. Yelin E, Herrndorf A, Trupin L, and Sonneborn D, A National Study of Medical Care
Expenditures for Musculoskeletal Conditions. Arthritis and Rheumatism 2001, 44 (5):
1160-1169.
39
70. Greenberg PE, Sisitsky T, Kessler RC, Finkelstein SN, Berndt ER, Davidson JRT,
Ballenger JC, and Fyer AJ, The Economic Burden of Anxiety Disorders in the 1990s.
Journal of Clinical Psychiatry 1999, 60 (7): 427-435.
71. Javitz HS, Ward MM, Watson JB, and Jaana M, Cost of Illness of Chronic Angina. The
American Journal of Managed Care 2004, 10 (11 suppl): S358-S369.
72. Ward MM, Javitz HS, Smith WF, and Bakst A, A Comparison of Three Approaches for
Attributing Hospitalizations to Specific Diseases in Cost Analyses. International Journal
of Technology Assessment in Health Care 2000, 16 (1): 125-136.
73. Norlund A, Apelqvist J, Bitzén PO, Nyberg P, and Scherstén B, Cost of Illness of Adult
Diabetes Mellitus Underestimated if Comorbidity Is Not Considered. Journal of Internal
Medicine 2001, 250: 57-65.
74. Hodgson TA and Cai L, Medical Care Expenditures for Hypertension, Its Complications,
and Its Comorbidities. Medical Care 2001, 39 (6): 599-615.
75. McDaid D, Estimating the Costs of Informal Care for People with Alzheimer’s Disease:
Methodological and Practical Challenges. International Journal of Geriatric Psychiatry
2001, 16: 400-405.
76. Flegal KM, Graubard BI, Williamson DF, and Gail MH, Excess Deaths Associated with
Underweight, Overweight, and Obesity. JAMA 2005, 293 (15): 1861-1867.
77. Briggs A, Handling Uncertainty in Economic Evaluation. BMJ 1999, 319 (7202): 120.