Embed Size (px)
Citation preview

Cost of Data Centers
Queenie Wong
CMPT 880: Large-scale Multimedia Systems and Cloud Computing

Queenie Wong
Introduction
“Facebook placed over 1 billion to a new datacenter in Iowa...”
“Google spent $400 million to expand its datacenter, bringing its total spent $1.5 billion in the area…”
GiGaom Tech News
Does a datacenter cost over billion dollars?? How to calculate and model the cost of building and
operating a datacenter? What is the total cost of ownership (TCO) of a datacenter? How to reduce the cost effectively?
2

Queenie Wong
Modeling Costs
Simplified model– Capital expense (Capex) of datacenter and server– Operational expense (Opex) of datacenter and server
Total Cost of Ownership (TCO) = datacenter depreciation & Opex + server depreciation & Opex
Cost of software and administrators are omitted in calculation– Focus on running the physical infrastructure– Costs vary greatly
3

Queenie Wong
Capital Costs
Datacenter construction costs Server costs Infrastructure costs
– Facilities dedicated to consistent power delivery Networking
– Switches, routers, and load balancers, etc
4

Queenie Wong
Datacenters
Datacenter construction costs– Design, size, location, reliability, and redundancy– Depreciate over 10-15 years– Interest rate
Most large DC cost $12-15/W to build, the very small or large ones cost more
Approximately 80% goes toward power and cooling, the remaining 20% toward the general building and site construction
5

Queenie Wong
Datacenter
Example– Cost $15/W
Amortized over 12 years – $1.25/W per year – $0.10/W per month
– Financing at 8%, adding $0.06/W– Total of $0.16/W per month
6
Queenie Wong
Servers
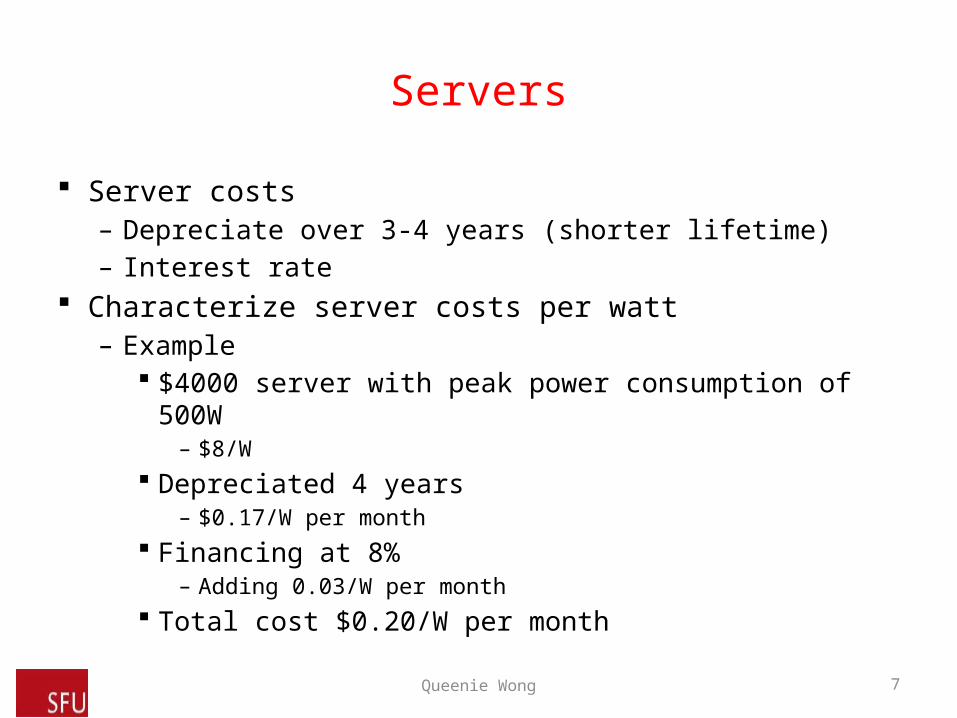
Server costs– Depreciate over 3-4 years (shorter lifetime)– Interest rate
Characterize server costs per watt– Example
$4000 server with peak power consumption of 500W– $8/W
Depreciated 4 years – $0.17/W per month
Financing at 8%– Adding 0.03/W per month
Total cost $0.20/W per month
7

Queenie Wong
Infrastructure Cost
Facilities dedicated to consistent power delivery and to evacuating heat– Generators, transformers, and UPS systems
8

Queenie Wong
Networking
Links & transits– Inter-data center links between geographically distributed
data centers– Traffic to Internet Service Providers– Regional facilities reach wide area network
interconnection sites Equipment
– Switches, routers, load balancers
9
Queenie Wong
Operational Costs
Datacenter– Geographic location factors (Climate, taxes, salary levels)– Design and age– Security
Server– Hardware maintenance
Power
10

Queenie Wong
Power
US Environmental Protection Agency (EPA) 2007 report predicted the power consumption of DC could increase to 3% in 2011
In 2010, datacenters in US consumed between 1.7% and 2.2% of total US electricity consumption that is much lower than EPA’s predication [Koomey, Analytics Press]
Google’s datacenters consumed less than 1% of electricity used by datacenters worldwide
Cost of electricity is still significant
11

Queenie Wong
Case Study A: High-end Servers
12
DC amortization16%
DC interest14%
DC opex6%
server amortization43%
server interest8%
server opex2%
server power5%
PUE overhead5%
DC amortizationDC interestDC opexserver amortizationserver interestserver opexserver powerPUE overhead
3yr TCO = $10,757

Queenie Wong
Case Study B: Low-end Servers
13
DC amortization22%
DC interest19%
DC opex8%
server amortization23%
server interest4%
server opex1%
server power11%
PUE overhead11%
DC amortizationDC interestDC opexserver amortizationserver interestserver opexserver powerPUE overhead
3yr TCO = $8,702

Queenie Wong
Real-World Datacenter
Costs are even higher than modeled in real-world– The model assume datacenter is 100% utilization with 50%
CPU utilization– Empty space for future development– Supply maximum power consumption to server instead of
the average value they consume to avoid overheat and trip a breaker (shut off)
Reserves 20–50% – For example
A DC with 10MW of critical power will often consume just 4-6 MW
14

Queenie Wong
Case Study C: Partially Filled Datacenter
15
DC amortization29%
DC interest26%
DC opex11%
server amortization15%
server interest3%
server opex1%
server power7%
PUE overhead7%
DC amortizationDC interestDC opexserver amortizationserver interestserver opexserver powerPUE overhead
3yr TCO = $12,968

Queenie Wong
Energy Efficiency
Datacenter facilities– 30% utilization
Servers– 30% utilization
Power Usage Effectiveness (PUE)– A state of the art DC facilities have PUE of 1.7 – Inefficient DC facilities have PUE of 2.0 to 3.0– Google have PUE of 1.12 recently
16

Queenie Wong
Resilience
Built at hardware level to mask failure– UPS– Generators
Proposed: build at system level– Eliminate expensive infrastructure (generators, UPS)– Failure unit becomes an entire datacenter
The workload of the failed DC can be distributed across sites
17

Queenie Wong
Agility
Any server can be dynamically assigned to any service anywhere in the datacenter
Dynamic growing and shrinking of server pools while maintaining high level of security and performance isolation between services
Rapid virtual machine migration Conventional datacenter design against agility
– Fragmentation of resources– Poor server to server connectivity
18

Queenie Wong
Design Objectives for agility
Location-independent Addressing– Decouple the server’s location from its address– Any server can become part of any server pool
Uniform Bandwidth and Latency– Service can be distributed arbitrarily in DC– No bandwidth choke point– Achieve high performance regardless of location
19

Queenie Wong
Design Objective for Agility
Security and Performance Isolation– Any server can be part of any service– Services are sufficiently isolated– Maintain high level of security– No impact on another service
E.g. Denial-of-Service attacks, configuration errors
20
Queenie Wong
Geo-Distribution
Goal: maximize performance – High speed and low latency
Google: 20% revenue loss – Caused by 500 msecs delay in display search result
Amazon: 1% sales decrease – Caused by additional 100 msecs delay
Strong motivation for building geographically distributed DCs to reduce delays
21

Queenie Wong
Placement
Optimal placement and size– Diverse locations
Reduce latency between DC and clients Helps with redundancy, not all areas lose power
– Size Determined by
– local demands– physical size– network cost– Maximum benefits
22

Queenie Wong
Geo-Distributing
Resilience at System Level– Allow entire DC to fail
Eliminate expensive infrastructure costs, such as UPS systems and generators
Turning geo-diversity into geo-redundancy– Requires applications distributed across sites and
frameworks to support– Balance between communication cost and service
performance
23
Queenie Wong
Cost saving approaches
Architectural redesigns Maximizing utilization of datacenter
– Energy-aware load balancing algorithm Minimizing electricity cost
– Energy cost-aware routing scheme DC power Virtualization New cooling technologies Multi-core servers
24

Queenie Wong
Internet-Scale Systems
Large distributed systems with request routing and replication incorporated
Able to manage millions of users concurrently Composed of tens or even hundreds of sites Tolerate faults Dynamic mapping clients to servers Replicate the data at multiple sites if necessary
25

Queenie Wong
Energy Elasticity
Assumption: Elastic clusters Energy consumed by a cluster depends on the load
placed on it– Ideal: consume no power in the absence of load– Reality: about 60% of peak in the absence of load
Savings can be achieved from routing power demand away from high priced areas, turning off under-utilized components
Key: System’s energy elasticity is turned into energy savings
26

Queenie Wong
Energy cost-aware routing
System requirements– Fully replicate – Clusters with energy elasticity
Electricity prices have temporal and geographic disparity Map client requests to clusters where the total electricity
cost of the system is minimized under certain constraints Applicable to both large and small systems
27

Queenie Wong
Price variation
Geographic – US electricity market differ regionally– Different generation sources (coal, natural gas, nuclear
power, etc)– Taxes
Temporal – Real-time markets: prices are calculated every 5 mins– volatile
28

Queenie Wong
Constraints
Latencies – High service performance with low client latencies– E.g. Map a client’s request to a cluster within the max
radical geographic distance Bandwidth
– Temporal and spatial variation– Additional cost when exceeding the limit
29

Queenie Wong
Simulation
Data– Hourly electricity prices (Jan 2006 – Mar 2009) – Akamai workload data set at public clusters in 18 US cities– No sufficient network distance info, only coarse
measurement Routing schemes
– Akamai’s original allocation– Price-conscious optimizer
30

Queenie Wong
Price-conscious Optimizer
Map a client to a cluster with lowest prices which within some predefined max radial distance– Consider another cluster if the selected cluster is nearing
its capacity Map a client to the closest cluster when no clusters fall
within max radial distance, and consider any other nearby clusters
Controlled by two parameters– Price differentials threshold (minimum price difference)– Distance threshold (maximum radical geographic distance)
31

Queenie Wong
Simulation Results
Reduced energy cost – by at least 2% without any increase in bandwidth costs or
significant reduction in performance– by 30% with relaxed bandwidth constraints– around 13% with strict bandwidth constraints
A dynamic solution (without distance constraint) beat a static solution (place all servers in cheapest market) without bandwidth constraints– 45% versus 35% savings
32

Queenie Wong
Cons
Only applicable to some locations with temporal and spatial electricity price variations
Increase in routing energy Delay
– reduction in client performance Bandwidth
– May increase bandwidth cost Complexity
33

Queenie Wong
VL2
Practical network architecture supports agility– Uniform high capacity between servers
Traffic flow should be limited only by the network-interface cards, not the architecture of the network
– Performance isolation between services Traffic of one service should not be affected by traffic of
any other service Virtual Layer 2 - Just as if each service was connected
by a separate physical switch
34

Queenie Wong
VL2
Ethernet layer-2 semantics– Flat addressing
allow services to be placed anywhere Load balancing to spread traffic uniformly across the DC
– Just as if servers were on a LAN - where any IP address can be connected to any port of an Ethernet switch
– Configure server with whatever IP address the service expects
35

Queenie Wong
VL2 Addressing Scheme
Separate server names from locations
Two separate address families– Topologically
significant Locator Addresses (LAs)
– Flat Application Addresses (Aas)
36
Queenie Wong
FORTE
FORTE: Flow Optimization based framework for request-Routing and Traffic Engineering
Carbon emissions of a DC are depended on it’s electricity fuel in the region
Dynamically controls the user traffic directed to DC by weighting each request’s effect on three metrics:– Access latency– Carbon footprint– Electricity cost
37

Queenie Wong
FORTE
Allow operators to balance performance with cost and carbon footprint by applying the linear programming approach to solve the user assignments problem
Then, determine if data replication or migration to the selected DC is needed
Results: – Reduce carbon emission by 10% without increasing the
mean latency nor the electricity bill
38

Queenie Wong
TIVC
TIVC: Time-Interleaved Virtual Clusters Problems:
– Current resource reservation model only provisions CPU and memory resources
– Cloud applications with time-varying bandwidth nature A new virtual network abstraction to specify the time-
varying network requirement of cloud applications– Increase utilization of both network resources and VM
39

Queenie Wong
TIVC
Compared to virtual cluster (VC), TIVC reduced the completion time significantly
40

Queenie Wong
Energy Storage Devices
Different types of Energy Storage Devices (ESD)– Lead-acid batteries (common used in DCs)– Ultra-capacitors (UC)– Compressed Air Energy Storage (CAES)– Flywheels (gaining acceptance in DC)
Different trade-offs between their power, energy costs, lifetime, energy efficiency
Hybrid combinations may be more effective Place different ESDs at different levels of power hierarchy
according to their advantages
41

Queenie Wong
Lyapunov Optimization
Online control algorithm to minimize the time average cost
Make use of UPS to store electricity Store the electricity when prices are low and draw it
when the prices are high No suffer from the “curse of dimensionality” as dynamic
programming Without requiring any knowledge of the system statistics Easy to implement
42

Queenie Wong
Summary
Maximize utilization of datacenters Minimize cost for electricity Architectural redesign of datacenter, network and server Geo-redundancy to mask failure of datacenter Optimization of resources Trends
– High demand of Low-end server in order to lower hardware cost due to low utilization of datacenter
– Electricity costs dominate TCO– Power & Energy Efficiency
43

Queenie Wong 44
Review

Queenie Wong
TCO Comparisons
A B C
DC amortization $0.104 $0.104 $0.208
DC interest $0.093 $0.093 $0.186
DC opex $0.040 $0.040 $0.080
server amortization $0.556 $0.111 $0.111
server interest $0.109 $0.022 $0.022
server opex $0.028 $0.006 $0.006
server power $0.033 $0.054 $0.054
PUE overhead $0.033 $0.054 $0.054
Total $0.996 $0.483 $0.720
3-yr TCO $10,757 $8,702 $12,968
45

Queenie Wong
TCO Breakdown
46
A B C
DC amortization 10.46% 24% 21.55% 49% 28.92% 66%
DC interest 9.32% 19.21% 25.77%
DC opex 4.02% 8.27% 11.10%
server amortization 55.78% 69% 22.98% 29% 15.42% 19%
server interest 10.92% 4.50% 3.02%
server opex 2.79% 1.15% 0.77%
server power 3.36% 7% 11.17% 22% 7.50% 15%
PUE overhead 3.36% 11.17% 7.50%
Total 100% 100% 100%
Queenie Wong
Geo-Redundancy
In the case of datacenter failure, requests can be directed to a different datacenter
Requirements– Data replication across sites– Special software and framework to support
Pros– Eliminate the cost of infrastructure redundancy
Cons– Expensive inter-data center communication costs
Reliability versus Communication costs
47

Queenie Wong
Energy Elasticity
Assumption: Elastic clusters Energy consumed by a cluster depends on the load
placed on it– Ideal: consume no power in the absence of load– Reality: about 60% of peak in the absence of load
Savings can be achieved from– routing power demand away from high priced areas– turning off under-utilized components
Key: System’s energy elasticity is turned into energy savings
48

Cost-aware Routing: Case 1
Map a client to a cluster with lowest prices which within some predefined max radial distance
Consider another cluster if the selected cluster is approaching its capacity
Queenie Wong 49
A
1500
C1:50 C3:35
C2:40
C4:43distance threshold = 1500 price threshold = 5
Cluster: Electricity Price

Queenie Wong
Cost-aware Routing: Case 2
Map a client to the closest cluster when no clusters fall within max radial distance
Consider any other nearby clusters < 50 km
50
1500
C3:35
C4:43
B
distance threshold = 1500price threshold = 5

Queenie Wong
Simulation Results
Reduced system energy cost – by at least 2% without any increase in bandwidth costs or
significant reduction in performance Fully elastic system
– 30% with relaxed bandwidth constraints– 13% with strict bandwidth constraints
Assume the data center can achieve 30% energy cost reduction– Case D (Case B with 30% energy cost reduction)
51

TCO Comparisons
A B C D
DC amortization $0.104 $0.104 $0.208 $0.104
DC interest $0.093 $0.093 $0.186 $0.093
DC opex $0.040 $0.040 $0.080 $0.040server amortization $0.556 $0.111 $0.111 $0.111
server interest $0.109 $0.022 $0.022 $0.022
server opex $0.028 $0.006 $0.006 $0.006
server power $0.033 $0.054 $0.054 $0.038
PUE overhead $0.033 $0.054 $0.054 $0.038
Total $0.996 $0.483 $0.720 $0.451
3-yr TCO $10,757 $8,702 $12,968 $8,118
Queenie Wong 52
A B C D$0
$2,000
$4,000
$6,000
$8,000
$10,000
$12,000
$14,000
$10,757
$8,702
$12,968
$8,118
3-year TCO

Queenie Wong
95th Percentile Metering
Billing method for bandwidth Sample the traffic every 5 minutes Sort and rank the samples collected over the billing cycle
53

Queenie Wong
95th Percentile Metering
54
Measure bandwidth based on 95th percentile of usage Allow occasional bursts beyond committed base rate (< top 5%
samples) Cost is determined by the sample size of the 95th percentile, not the
area under the curve

Queenie Wong
Smoothing Resource Consumption
Set prices varying with resource availability Differentiate demands by urgency Shift workload to change inefficient usage pattern
55

Queenie Wong
Cost Optimization
Hardware– Eliminate hardware redundancy– Mid-range servers
Resource management– Minimize electricity cost– Prioritize workloads– Shift workload to create efficient usage pattern
56

Queenie Wong
References
Barroso, Luiz André, and Urs Hölzle. "The datacenter as a computer: An introduction to the design of warehouse-scale machines." Synthesis Lectures on Computer Architecture 4.1 (2009): 1-108.
Barroso, Luiz André, and Urs Hölzle. “TCO calculations for case studies in Chapter 6.” <http://spreadsheets.google.com/ pub?key=phRJ4tNx2bFOHgYskgpoXAA&output=xls>
Greenberg, Albert, et al. "The cost of a cloud: research problems in data center networks." ACM SIGCOMM Computer Communication Review 39.1 (2008): 68-73.
Qureshi, Asfandyar, et al. "Cutting the electric bill for internet-scale systems." ACM SIGCOMM Computer Communication Review 39.4 (2009): 123-134.
57

Queenie Wong
References
Koomey, Jonathan. 2011. Growth in Data center electricity use 2005 to 2010. Oakland, CA: Analytics Press. August 1. <http://www.analyticspress.com/datacenters.html>
Greenberg, Albert, et al. "VL2: a scalable and flexible data center network." ACM SIGCOMM Computer Communication Review. Vol. 39. No. 4. ACM, 2009.
Gao, Peter Xiang, et al. "It's not easy being green." ACM SIGCOMM Computer Communication Review 42.4 (2012): 211-222.
Xie, Di, et al. "The only constant is change: incorporating time-varying network reservations in data centers." ACM SIGCOMM Computer Communication Review 42.4 (2012): 199-210.
58

Queenie Wong
Reference
Wang, Di, et al. "Energy storage in datacenters: what, where, and how much?." ACM SIGMETRICS Performance Evaluation Review. Vol. 40. No. 1. ACM, 2012.
Urgaonkar, Rahul, et al. "Optimal power cost management using stored energy in data centers." Proceedings of the ACM SIGMETRICS joint international conference on Measurement and modeling of computer systems. ACM, 2011.
Semaphore Corporation. 95th percentile bandwidth metering explained and analyzed. Web. April 2011.http://www.semaphore.com
Higginbotham, Stacey. Data center rivals Facebook and Google pump $700M in new construction into Iowa. 23 April. 2013. Web. 23 May. 2013 http://gigaom.com
59