Embed Size (px)
Citation preview

Ministry of Economic Development
Revised June 2012
Final Report October 2011
Cost Benefit Analysis of the Warm Up New Zealand: Heat Smart Programme
Arthur Grimes(1), Tim Denne(2), Philippa Howden-Chapman(3),
Richard Arnold(4), Lucy Telfar-Barnard(3), Nicholas Preval (3) and
Chris Young(1)
(1) Motu, Wellington; (2) Covec; (3) He Kainga Oranga/Housing and Health Research
Programme,University of Otago, Wellington; (4) Department of Mathematics, Victoria
University of Wellington
Prepared for
Contents
Executive Summary i
1 Introduction 1
1.1 Background 1
1.2 The Programme 2
1.3 Expected Effects – Lessons from Previous Research 3
1.4 Methodology 5
1.5 Discount Rate 6
1.6 Additionality 7
2 Cost Analysis 9
2.1 Government Administration Costs 9
2.2 Deadweight costs of taxation 9
2.3 Costs of Installations 10
3 Benefits 12
3.1 Benefits Included 12
3.2 Energy Savings 12
3.3 Health Savings 21
3.4 Producer Surplus 23
3.5 Scale of Activity and Employment Effects 24
4 Net Benefits and Conclusions 26
4.1 Net Benefits 26
4.2 Potential Programme Refinements 27
Annex 1 Heating Profiles 29
i
Executive Summary
Background
This report summarises the results of an analysis of the costs and benefits of the Warm
Up New Zealand: Heat Smart programme. Under the programme, subsidies are
provided towards the costs of retrofitting insulation and/or installing clean heating for
pre-2000 houses. The benefits that are included in this report are analysed in more detail
in three separate papers produced as part of this study that assess the impacts on energy
use,1 health outcomes2 and producer surpluses, with additional data on employment.3
The costs of the programme are also assessed in this report and include the costs of the
additional insulation and clean heating plus the administrative costs falling on the
government. Administrative costs for companies are assessed as part of the report on
impacts on industry.4
To analyse the effects we include the following key assumptions:
some houses that receive subsidised treatments (insulation or clean heating)
under the programme would have installed insulation or clean heating anyway.
We use the results of regression analysis to estimate that 74% of the treatments
are additional, within a range of 36% to 113%.5 The high figure is explainable by
the programme resulting in publicity that encourages others to install insulation
or clean heating outside the programme;
a (real) discount rate of 4%, with sensitivity analysis using 2.5% and 8%. We
discount the costs and benefits to the first year of the programme (2009/10); and
benefits are analysed over 30 years for insulation and ten years for clean heat.
Costs
The costs considered are those of government administration, the deadweight costs of
taxation and the resource costs of the insulation and clean heating.
Administration costs include EECA staff, marketing, audits and other costs, eg.
travel and legal advice. Some proportion of the labour costs would have a zero
opportunity cost as, in the absence of the programme, they would have been
expected to be unemployed;
The deadweight costs of taxation are included to take account of the
distortionary effects of tax that must be raised to pay for the subsidy (net of GST
paid on installation and products). We use a value recommended by the
1 Grimes A, Young C, Arnold R, Denne T, Howden-Chapman P, Preval N and Telfar-Barnard L (2011)
Warming Up New Zealand: Impacts of the New Zealand Insulation Fund on Household Energy Use. 2 Telfar Barnard L, Preval N, Howden-Chapman P, Arnold R, Young C, Grimes A, Denne T (2011) The
impact of retrofitted insulation and new heaters on health services utilisation and costs, and
pharmaceutical costs. Evaluation of the New Zealand Insulation Fund. 3 Covec (2011) Impacts of the NZ Insulation Fund on Industry and Employment. Report for Ministry of
Economic Development 4 Covec (op cit) 5 This analysis is described in Covec (op cit)

ii
Treasury that public expenditures should be multiplied by a factor of 1.2 to take
account of these deadweight costs;6
The cost of the installations is a resource cost and is equal to the opportunity
cost of allocating resources to the production and installation of insulation and
clean heating. In calculating opportunity costs we deduct producer surplus and
costs of labour that would otherwise be unemployed from gross costs.
The costs are summarised in Table ES1.
Table ES1 Annual Costs of the Programme ($ million)
Item 2009-10 2010-11 2011-12 2012-13
Administration 6.8 – 8.0 6.6 - 7.6 6.0 – 7.0 3.2 - 3.7
Deadweight costs of taxation 16.9 16.9 4.8 14.9
Costs of Insulation + installation 52.5 49.9 64.1 14.7
Costs of Clean heaters + installation 18.9 16.9 42.5 12.1
Total(1) 95.7 90.8 117.8 45.2
(1) Using the mid-point of the range of administration costs
Benefits
The benefits analysed in this study have been limited to those that can be assessed using
measured changes in metered energy consumption and in independently measured
health costs (prescriptions, hospitalisations and benefits of reduced mortality). In
addition, we have adopted some values of additional health benefits from prior studies.
For both energy and health impacts, the effects were analysed by obtaining addresses of
houses that have been treated under the programme. We used QVNZ data to identify
houses with similar characteristics7 to these to set up intervention and control datasets.
Data were then obtained from energy companies on changes in metered energy use for
before and after treatment, and health data were obtained relating to hospitalisations
(including mortality outcomes) and prescription charges for people at those addresses.
The energy savings were estimated by region and by month. We adopt the energy
report’s primary estimate of energy savings, which was more conservative than some
other estimates of savings in that report. These estimated savings were subsequently
spread over time of day using EECA assumptions on heating energy use profiles. Time
of day prices were then used to calculate the benefits. We used a wholesale electricity
price to value the savings in kWh. Reductions in winter peak electricity demand were
used to identify potential savings in generation and transmission capacity; this was
combined with values of new capacity. Gas does not have time of day prices and we
have used a simpler approach to measuring the value of savings in gas use, based on a
commercial gas price that includes savings in wholesale gas costs and transmission
6 New Zealand Treasury (2005) Cost Benefit Analysis Primer. In comparing our results with CBAs of
other projects, it is important to ensure that comparators have also included the deadweight costs of
taxation into their analysis. 7 This was location (Census area unit, similar to a suburb), dwelling and house type, number of levels,
age (decade of build), floor area and number of bedrooms, whether there is a garage under the main
roof and its size (number of vehicles), house construction material (walls and roof), whether or not the
house was modernised, and quality (building and roof condition) of the dwelling.

iii
costs. Because we have limited the assessment to metered energy use, reductions in
other energy (natural gas use) is limited to the North Island.
The present value of estimated savings at a 4% discount rate is shown in Table ES2.
Table ES2 Net Present Value ($ million) of Electricity and Other Energy Savings
Insulation Clean heat
Energy CO2 Total Energy CO2 Total Total
Electricity 24.4 0.2 24.6 -7.0 -0.1 -7.1 17.5
Other Energy -1.3 -0.2 -1.5 0.9 0.1 0.9 -0.5
Total 23.1 -0.0 23.1 -6.1 0.0 -6.1 16.9
Health benefits differ depending on the income level of houses, measured on the basis
of whether they were Community Service Card (CSC) holders or not; CSCs are available
to low and middle income earners. The present values of health benefits are estimated
using both a conservative approach and a more focussed approach, where the latter
resulted in a wider estimate of potential benefits. The results at a 4% discount rate are
shown in Table ES3.
Table ES3 Present value of health benefits at different discount rates ($ million)
Conservative Focussed
CSC Insulation 802 892
Other insulation 460 550
Total insulation 1,263 1,443
CSC Clean heat 1 1
Other clean heat 2 2
Total clean heat 4 4
Total 1,266 1,446
The net employment impacts of the programme, ie. additional jobs that would not exist
in the absence of the programme, are estimated to be approximately 71-424 full time
equivalents (FTEs) in the first year and to peak at 94-560 FTEs in 2001/12.
Net Benefits
The total costs and benefits (using the conservative estimates for both health benefits
and energy savings) are summarised in Table ES4 at different discount rates and with
different assumed levels of additionality (central = 74%, low = 36%, high = 113%).
Table ES4 Present Value of Total Costs and Benefits ($ million)
Additionality: Central
Low High
Discount rate: 4% 2.5% 8% 4% 4%
Costs
Admin costs 23 24 22 23 23
Deadweight costs of tax 51 52 49 58 44
Installations - insulation 173 176 165 83 263
Installations - clean heat 85 87 81 41 130
Sub-total 332 339 317 205 460
Benefits
Energy 17 21 10 8 25
Health 1,266 1,541 816 608 1,926
Sub-total 1,283 1,562 827 616 1,951
Net Benefits 951 1,224 510 411 1,492

iv
The results suggest that there are positive net benefits of the programme at all discount
rates examined, including with assumptions of low levels of additionality.
The results are dominated by the health benefits, which represent approximately 99% of
the total benefits. There are additional benefits that we have not been able to include in
our analysis, eg. comfort benefits associated with additional interior warmth, and
savings in other fuels that we have not measured (changes in consumption of coal,
wood and LPG). On the basis of the analysis in this study, we conclude that the
dominant benefits (gross and net) of the programme are attributable to the insulation
component of the scheme. We are unable to conclude whether there are net benefits or
net costs associated with the inclusion of clean heating in the programme, but it is
reasonable to conclude that the (positive or negative) net benefits of this component are
small by comparison to those for insulation.
The largest component of costs is the costs of the installations themselves, ie. the direct
costs of insulation materials, clean heaters, and the labour costs for installations.
The energy study found that energy benefits from insulation were greatest for houses in
cooler regions. In addition, clean heating resulted in greater total metered energy
savings for houses that had reticulated gas than for other houses. The health impacts
study shows clear differences between the effects on low to middle income earners and
other households, with significantly larger benefits for Community Service Card (CSC)
holders.
The overall results suggest that the programme as a whole has had sizeable net benefits,
with our central estimate of programme benefits being almost five times resource costs
attributable to the programme. The central estimate of gross benefits for the programme
is $1.28 billion compared with resource costs of $0.33 billion, a net benefit of $0.95
billion. Nevertheless, even greater benefits may be achievable through consideration of
four targeting strategies:
1. Prioritise the insulation component of the programme relative to the clean
heating component of the programme.
2. Target clean heating to houses that use reticulated gas rather than electricity for
heating prior to treatment.
3. Target insulation to houses in cooler rather than warmer areas.
4. Target insulation to low and middle income earners and other at-risk groups in
terms of illness.

1
1 Introduction
1.1 Background
This report summarises the results of an analysis of the costs and benefits of the Warm
Up New Zealand: Heat Smart programme. Under the programme, subsidies are
provided towards the costs of retrofitting insulation and/or installing clean heating for
pre-2000 houses. The benefits of the programme are expected to comprise:
improvements in comfort of houses because of increased temperatures and
reduced damp and draught;
improved health outcomes as a result of the changes in temperature and
damp/draught;
increased energy efficiency of houses (reduced energy requirement to meet
temperature outcomes) that may result in some overall reduction in energy
consumption;
an increase in employment and production, at a time of depressed economic
activity, as a result of increased activity in affected sectors.
The benefits are expected to be shared between households and the producers and
installers of insulation. The different benefits have been analysed in three separate
papers produced as part of this study. These analyse the impacts on:
energy use;8
health outcomes;9 and
producer surpluses, with additional data on employment.10 The producer
surplus and additional employment benefits are deducted from gross costs in
order to calculate the actual resource costs (ie. opportunity costs) of the
programme.
The costs of the programme are assessed in this report and include the resource costs of
the additional insulation and clean heating plus the administrative costs falling on the
government. Administrative costs for companies are assessed as part of the report on
impacts on industry.11 The costs of the programme are then compared with the benefits
to arrive at a calculation of net benefits attributable to the programme.
The different elements of the analysis are set out below.
8 Grimes A, Young C, Arnold R, Denne T, Howden-Chapman P, Preval N and Telfar-Barnard L (2011)
Warming Up New Zealand: Impacts of the New Zealand Insulation Fund on Household Energy Use. 9 Telfar Barnard L, Preval N, Howden-Chapman P, Arnold R, Young C, Grimes A, Denne T (2011) The
impact of retrofitted insulation and new heaters on health services utilisation and costs, and
pharmaceutical costs. Evaluation of the New Zealand Insulation Fund. 10 Covec (2011) Impacts of the NZ Insulation Fund on Industry and Employment. Report for Ministry
of Economic Development 11 Covec (op cit)

2
1.2 The Programme
The Warm Up New Zealand: Heat Smart programme started in July 2009 and provides
co-funding to encourage the retrofitting of insulation and clean heating to houses built
prior to 2000. It replaced or enhanced a number of existing government retrofit
programmes. The underlying objectives of the programme are: 12
Helping New Zealanders to have warm, dry, more comfortable homes;
Improving the health of New Zealanders;
Saving energy;
Improving New Zealand’s housing infrastructure through the uptake of cost
effective energy efficiency measures; and
Stimulating employment and developing capability in the insulation and
construction industries.
The programme provides partial funding for the purchase and installation of eligible
products by approved providers. Depending on their existing insulation and heating,
and the characteristics of the house, applications to the Fund may be for funding for
insulation and clean heat, insulation only, or clean heat only. The elements of the
programme are set out in Table 1.
Table 1 Eligible Recipients of Programme Funding
Recipients(1) Insulation Clean heating
Homeowners who hold Community
Services Cards
60% of the total cost, or more(2) $1200 (incl GST)
Landlords with tenants who hold
Community Services Cards
60% of the total cost $500 (incl GST)
All other houses 33% of the total cost up to $1300
(incl GST)
$500 (incl GST)
(1) All houses must be built prior to 2000; (2) May be higher, if installation qualifies for a special project
where third party funding from charities, lines companies or councils is provided
Source: www.energywise.govt.nz/funding-available/insulation-and-clean-heating
The number of houses treated under the programme to date, and the number that are in
current targets for future years, are set out in Table 2.
Table 2 Number of houses treated under the programme
Actual Installations Targeted Installations
Intervention 09/10 10/11 11/12 12/13 Total
Insulation retrofits
Low income 29,249 23,184 18,000 1,000 71,433
Other 22,414 25,912 45,000 13,500 106,826
Total 51,663 49,096 63,000 14,500 178,259
Clean heat
Low income 7,012 5,692 6,000 1,400 20,104
Other 5,646 5,635 22,500 6,750 40,531
Total 12,658 11,327 28,500 8,150 60,635
Source: EECA
12 EECA, personal communication

3
1.3 Expected Effects – Lessons from Previous Research
Prior research has shown that the thermal quality of housing affects the health of the
population and household energy use. Housing improvements, especially to those
exposed to substandard housing, can help improve the health of occupants and
potentially prevent ill health. Also, retrofitting houses with insulation and/or clean
heating can lead to energy savings through houses becoming more energy efficient,
although the savings are limited by the extent that households increase household
temperatures (comfort levels) following these retrofits.
1.3.1 Health Effects
Inadequately warmed homes can have health consequences for occupants, particularly
during winter periods.13,14 Colder houses place greater stress on older people, babies and
the sick,15 and are more likely to be damp and provide a more favourable growing
environment for mould that can cause respiratory symptoms.16,17 By improving housing
quality, especially warmth, these consequences can be minimised and health
improvements can be generated.18, 19
The potential for health improvements depends on the baseline housing conditions and
how well targeted intervention is. There is clear evidence showing that housing
interventions can improve house quality, and that these interventions to improve house
quality can yield important savings in medical care and improvements in quality of
life.20 Previous research by the University of Otago Housing and Health Research
Programme (H&HRP) found a suggestive reduction in respiratory hospitalisations after
insulation was retrofitted in dwellings (p=0.16 adjusted).21
1.3.2 Energy Savings
Retrofitting insulation and installing efficient clean heating improves the energy
efficiency of the dwelling, and can lead to energy savings.22, 23, 24, 25, 26, 27 Research in
13 Boardman B (1991) Fuel Poverty: from cold homes to affordable warmth, London: Belhaven Press; 14 Wilkinson P, Landon M, Armstrong B, Stevenson S, Pattenden S, McKee M and Fletcher T (2001)
Cold comfort: The social and environmental determinants of excess winter deaths in England, 1986-96,
London: The Policy Press 15 Curwen, M (1991) “Excess winter mortality: a British phenomenon?” Health Trends, 4, pp. 169 -175. 16 Tobin R, et al 1987. “The significance of fungi in indoor air,” Canadian Journal of Public Health.
Revue Canadienne de Sante Publique, S1-14; 17 Institute of Medicine of the National Academies (2004) Damp indoor spaces and health, Washington,
D.C.: National Academies Press 18 Thompson H et al (2009) The health impacts of housing improvement: a systematic review of
intervention studies from 1887 to 2007. American Journal of Public Health, 99 (Supplement 3): S681-
S692 19 Jacobs et al (2010) A Systematic Review of Housing Interventions and Health: Introduction, methods
and Summary Findings. Journal of Public Health Management & Practice, 16(5): S5-S10 20 Jacobs et al (op cit) 21 Howden-Chapman P, Matheson A, Crane J, Viggers H, Cunningham M, Blakely T, Cunningham C,
Woodward A, Saville-Smith K, O’Dea D, Kennedy M, Baker M, Waipara N, Chapman R and Davie G
(2007) Effect of insulating houses on health inequality: cluster randomised study in the community.
British Medical Journal, 334 22 Berkhout, PHG, Muskens JC and Velthuijsen JW (2000) “Defining the rebound effect,” Energy Policy,
28, pp. 425-432

4
Christchurch demonstrated that houses can decrease electricity consumption by around
5% after having insulation retrofitted,28 and have also been shown to decrease average
peak electricity consumption by 18% during winter months.29 Other New Zealand
research has found that houses subject to intervention save on average $25.53 per year
on total energy, but spend on average $10.51 more per year on electricity use.30
Magnitudes of electricity savings are also dependent on the type of heating source being
replaced and what it is being replaced with.31
Energy efficiency gains can be received by households wholly as energy savings, and
therefore reduced household energy costs, or they can substitute part of the cost savings
for improvements in comfort and warmth that help to improve health outcomes, a
phenomenon commonly known as the ‘take-back’ or ‘rebound’ effect.32,33 Evidence exists
that the majority of households ‘take-back’ energy efficiency improvements as increased
comfort levels34 and that low indoor temperatures induce ‘take-back’ effects, but the
magnitude of ‘take-back’ reduces as the baseline temperature increases.35
1.3.3 Impacts on Producers and Installers
Little research exists specifically looking at the impacts of policies aimed at improving
house quality on producers and installers of insulation and clean heating, or the impact
on employment levels. Historical data from Statistics New Zealand suggest that imports
of glass fibre insulation have noticeably increased in the last three years; however,
employment of insulation installers varies depending on the season. Maré discusses
impacts of active labour market policies, with respect to wage subsidies, and finds that
23 Orion Ltd (2004) “Effects of improved insulation on peak period demand.” 24 Chapman R, Howden-Chapman P, Viggers H, O’Dea D and Kennedy M (2009) Retrofitting houses
with insulation: a cost-benefit analysis of a randomised community trial. Journal of Epidemiology &
Community Health 63:271-277 25 Howden-Chapman P, Viggers H, Chapman R, O’Dea D, Free S and O’Sullivan K (2009) “Warm
homes: Drivers of the demand for heating in the residential sector in New Zealand,” Energy Policy, 37,
pp. 3387-3399 26 Phillips Y and Scarpa R (2010) “Waikato Warm Home Study,” Paper presented at the 2010 NZARES
Conference. Available online at http://purl.umn.edu/96494. Last accessed 11 Jul 2011 27 Preval N, Chapman R, Pierse N, Howden-Chapman P, The Housing Heating and Health Group.
(2010) “Evaluating energy, health and carbon co-benefits from improved domestic space heating: A
randomised community trial,” Energy Policy, 38, pp. 3955-3972 28 Chapman et al (op cit) 29 Orion Ltd (op cit) 30 Preval et al (op cit) 31 Orion Ltd (2009) “Impact of Environment Canterbury’s Clean Heat project on Christchurch
electricity usage.” 32 Berkhout et al (op cit) 33 Howden-Chapman P, Viggers H, Chapman R, O’Dea D, Free S and O’Sullivan K (2009) “Warm
homes: Drivers of the demand for heating in the residential sector in New Zealand,” Energy Policy, 37,
pp. 3387-3399 34 Howden-Chapman P, Crane J, Matheson A, Viggers H, Cunningham M, Blakely T, O’Dea D,
Cunningham C, Woodward A, Saville-Smith K, Baker M and Waipara N (2005) “Retrofitting houses
with insulation to reduce health inequalities: aims and methods of a clustered, randomised train in
community settings,” Social Science and Medicine, 61, pp. 2600-2610 35 Milne G and Boardman B (2000) “Making cold homes warmer: the effect of energy efficiency
improvements in low-income homes,” Energy Policy, 28, pp. 411-424.

5
policies aimed at improving employment levels have a net employment effect (total
additional employment over what would have happened otherwise) of around 5-10% of
gross employment outcomes (total employment as a result of policy).36
1.4 Methodology
Taking account of the results of previous studies, the cost benefit analysis (CBA)
incorporates the following costs and benefits:
Costs
The administrative costs of the programme for the government;
The costs of raising revenue for the subsidy – the deadweight costs of taxation;
The costs of the insulation and clean heaters.
Benefits
The reductions in energy costs;
The savings in CO2 emission costs not included in the fuel price;
Improvements in health outcomes;
Producer surpluses for suppliers of insulation and clean heaters, ie. the
difference between the price and the costs of supply.
The analysis applies to the insulation and clean heating that is estimated to have been
installed as a result of the programme, recognising that some proportion of the total
number of households that received a subsidy would have installed these products
anyway.
The benefits are estimated over the expected duration of those benefits. For insulation
this might be a long period, ie. the duration of the house. The duration of a clean heater
is expected to be shorter. However, it is likely that, for some houses at least, some
proportion of the benefit will not be additional as it is bringing the timing of the
installation forward in time, rather being an absolute saving, ie. some of the houses that
received insulation or heating under the programme would have purchased it in the
absence of a subsidy at some point in the future; this also means some of the costs are
also simply brought forward in time. The starting place is an assumption that insulation
benefits will last for 30 years37 and clean heating for 10 years.
Costs and benefits that fall in different time periods are discounted and we discuss the
discount rate used below.
1.4.1 Wider Economic Impacts
The terms of reference for the analysis include consideration of the wider economic
impacts of the programme, particularly on employment. These issues were addressed in
the separate report on producers and employment, and we extend the findings from
36 Maré D (2005) “Indirect Effects of Active Labour Market Policies,” Motu Working Paper 05-01, Motu
Economic and Public Policy Research, Wellington. 37 This is the same assumption used by Chapman R, Howden-Chapman P, Viggers H, O’Dea D and
Kennedy M (2009) Retrofitting houses with insulation: a cost-benefit analysis of a randomised
community trial. Journal of Epidemiology & Community Health 63:271-277

6
that report to the whole programme in this report. Employment benefits are not part of
the cost benefit analysis (the analysis does not attribute additional benefits to
employment per se). Rather, labour costs are included on the basis of their opportunity
costs (the assumption that the costs of labour in insulation and clean heat provision
reflect the value of the labour in some other alternative activity that is displaced).
However, labour is measured as having a zero cost if it would otherwise have been
unemployed. Thus, in this analysis, some proportion of the private costs of insulation is
not counted as an opportunity cost.
1.5 Discount Rate
Discount rates are used in cost benefit analysis to take account of the opportunity costs
relating to the timing of costs and benefits. There are two broad approaches:
Discount rates based on the opportunity cost of consumption assume that policy
changes the timing of consumption, eg. spending on insulation/clean heating
displaces the consumption of other goods and services, and the benefits of
reduced energy and medical costs allows additional consumption. Discount
rates based on the opportunity cost of consumption reflect the preference of
people to consume sooner rather than later, the expectation of rising incomes
(and thus an expectation of a declining marginal utility of income) and some risk
of disaster that will not enable future consumption.
Discount rates based on the opportunity cost of investment assume that policy
displaces investment that would have earned a return, eg. spending on
insulation/clean heating reduces savings and the availability of capital. Discount
rates based on the opportunity cost of investment measure expected market
returns on marginal investments.
NZ Treasury recommends an approach that is based largely on an estimate of the
opportunity cost of investment (or opportunity cost of capital), estimated as the pre-tax
rate of return on investment by the private sector.38 However, many other countries use
rates based on an opportunity cost of consumption (social rate of time preference). 39 The
approaches result in a wide range of values, from 2-3% in the US for environmental
projects, 3.5% (but falling to 1% for costs and benefits in the distant future) in the UK
and 10-15% in a number of developing countries.40
The New Zealand Treasury recommends a rate of 8% (real) for energy policy and other
policy issues where there is no specific rate. However, other analyses in New Zealand
have produced much lower numbers including an estimate by MED of a social rate of
time preference of 4.4% (real) undertaken in the context of choosing a discount rate for
analysing the government’s energy strategy,41 and a rate of 2.7% to 4.2% (real)
38 NZ Treasury (2008) Public Sector Discount Rates for Cost Benefit Analysis. 39 See range of values in Harrison M (2010) Valuing the Future: the social discount rate in cost-benefit
analysis. Australian Government Productivity Commission. 40 Harrison op cit 41 MED (2006) Choice of Discount Rate for the New Zealand Energy Strategy (NZES). POL/1/39/1/1

7
recommended by Castalia for use in the Grid Investment Test to analyse the costs and
benefits of upgrades to the electricity transmission system.42
For analytical robustness and to cover this range, we have used real discount rates of
2.5%, 4% and 8%.
1.6 Additionality
As noted above, some of the activity subsidised under the programme would have
occurred without it. Part of the analysis is thus the degree of additionality, ie. the
proportion of the total number of installations that are additional to that which would
have occurred without the programme.
The costs and benefits of the programme include fixed and variable elements. The fixed
elements are the costs of administering the programme, including the costs associated
with raising the revenue for the subsidy. These apply regardless of the extent to which
the programme encourages additional production and installation of insulation and
clean heating.
In contrast, the benefits of the programme and the costs of additional supply of
insulation/clean heating are proportional to the estimate of additionality. Where the
subsidies have been applied to insulation and clean heating that would have been
installed in the absence of the programme there are no benefits and no additional costs
of production and installation.
Additionality has been estimated on the basis of econometric analysis of sales of
insulation. Regression analysis was used to explain the quantity of insulation installed
on the basis of building consent activity and the number of houses subsidised.43 In the
central estimate, 74% of the houses that were insulated under the programme would not
have installed insulation in the absence of the subsidy (Table 3). It was not possible to
undertake a similar analysis for clean heating as no factors were identified to explain the
number installed historically. In estimating the producer surplus associated with clean
heating the same assumption was used as for insulation, ie. that 74% were additional.
Table 3 Projected Increases in Insulation Consumption as a Result of the Programme (2009-10)
Estimate Quantity installed
per house (m2)
Total quantity
installed
(million m2)
% of
Subsidised
Subsidised Sample 171.1 8.8 100
Low 61.1 3.2 35.7
Central 127.2 6.6 74.3
High 193.4 10.0 113.0
Source: Covec (2011) Impacts of the NZ Insulation Fund on Industry and Employment. Report for the
Ministry of Economic Development
The analysis of additionality was based on few data points: data were available for
seven years only and three in which a subsidy programme existed. Reflecting the small
42 Castalia (2006) Discount Rate for the Grid Investment Test. Report to Transpower 43 Covec (2011) Impacts of the NZ Insulation Fund on Industry and Employment. Report for the
Ministry of Economic Development

8
number of data points, there was a significant uncertainty range: 36% to 113% at the
95% confidence level. This wide range of additionality estimates is used in sensitivity
analysis.
However, this analysis represents only one aspect of additionality. One possibility is
that the benefits that flow from the subsidised installations only bring these
expenditures forward in time rather than representing fully additional expenditures.
These effects could be picked up if a longer dataset was available. However, we have no
data to test this hypothesis and instead we illustrate the effects of assuming a shorter
duration of benefits using a sensitivity analysis.

9
2 Cost Analysis
2.1 Government Administration Costs
To administer the programme, EECA employs 22.5 full time equivalents (FTEs) and 2.1
FTEs of contracted labour.44 The costs associated with this are estimated at $2.5 million
in the first year and to total $7.3 million over the 4 years of the programme. In the
analysis of employment effects, it was noted that the introduction of the programme
included a period of relatively high unemployment as a result of the global recession. 45
Some proportion of the labour costs would have a zero opportunity cost as, in the
absence of the programme, they would have been expected to be unemployed. The
number of employees estimated to be additional, and therefore with a zero opportunity
cost, ranges from 3 to 15;46 labour costs are adjusted to take account of the lower average
opportunity costs. In addition there are costs associated with marketing, audits, travel,
legal advice and so on (Table 4).
Table 4 Costs of government overheads ($ million)
Item 2009-10 2010-11 2011-12 2012-13
Financial Costs
Marketing 3.5 3.5 3.0 1.7
Audits 1.1 1.4 1.4 0.5
Staff 1.0 - 2.2 0.7 - 1.7 0.7 - 1.7 0.4 - 0.9
other (travel, legal etc) 1.2 1.0 0.9 0.6
Total 6.8 – 8.0 6.6 - 7.6 6.0 – 7.0 3.2 - 3.7
Source: EECA; staff costs – see text
2.2 Deadweight costs of taxation
The deadweight cost of taxation is the result of the distortionary effects of tax.47 When
taxes are raised via increasing the costs of consumption (GST) or reducing the rewards
of work (income tax), behaviour is changed. People spend and work less than they
would otherwise, and they spend and work differently. This distortion to consumption
behaviour involves a cost that is additional to the amount of tax paid. As a result, the
Treasury recommends that public expenditures should be multiplied by a factor of 1.2
to take account of these deadweight costs.48
Although the government has not raised tax specifically to pay for the subsidy
programme, the inter-temporal government budget constraint means that there has to
be a long run relationship between government expenditure and the taxation
requirement.
44 EECA, personal communication 45 Covec (2011) Impacts of the NZ Insulation Fund on Industry and Employment. Report for the
Ministry of Economic Development 46 Covec (op cit) 47 NZ Treasury (2009) Estimating the Distortionary Costs of Income Taxation in New Zealand.
Background Paper for Session 5 of the Victoria University of Wellington Tax Working Group; Creedy J
(2009) The Distortionary Costs of Taxation. Paper prepared for the New Zealand Treasury. 48 New Zealand Treasury (2005) Cost Benefit Analysis Primer. In comparing our results with CBAs of
other projects, it is important to ensure that comparators have also included the deadweight costs of
taxation into their analysis.

10
However, for analysis care must be taken to apply this multiplier equally to revenue
raised and to additional tax paid, eg. the GST paid on goods and services consumed as a
result of the subsidy reduces the need for government to raise revenue elsewhere. Thus
our concern is just with the distortionary effect of the net tax burden.
The net tax burden can be estimated from the amount paid as grants, the costs of
overheads, less the tax on additional expenditure. Expenditure is estimated from:
the grants paid;
an estimate of the proportion of costs on products and their installation that is
covered by grants; and
the percentage of installations that are additional.
EECA data on the initial set of grants suggests that grants are approximately 50% of
total costs, reflecting the mix of general and low income households included in the
programme. The estimated deadweight costs are shown in Table 5 for central (74%), low
(36%) and high (113%) levels of additionality. The deadweight costs are lower where
there is high additionality as it means that a greater portion of GST paid on expenditure
is additional and thus the net tax requirement is lower.
Table 5 Estimates of deadweight costs of net taxation ($ million)
2009-10 2010-11 2011-12 2012-13
Grants 87.8 101.2 101.5 27.5
Overheads 7.4 7.1 6.5 3.4
Total 95.2 108.3 108.0 30.9
GST on expenditure (central additionality)(1) 19.6 22.6 22.6 6.1
PAYE(2) 0.6 0.5 0.5 0.2
GST on overhead expenditure 0.7 0.8 0.7 0.4
Total 20.9 23.8 23.8 6.7
Net Government Expenditure 74.3 84.5 84.3 24.2
Deadweight loss – central additionality 14.9 16.9 16.9 4.8
Deadweight loss – low additionality 16.9 19.3 19.2 5.5
Deadweight loss – high additionality 12.8 14.6 14.5 4.2
(1) GST = 15%; estimated on 74% of expenditure, calculated as grants x 2; (2) Calculated using an average
tax rate of 24.1%, based on the average EECA staff cost ($2.5 million/24.6 FTEs)
Source: expenditure data from EECA adjusted to take account of reduced labour costs – midpoint of
range in Table 4
2.3 Costs of Installations
The cost of the installations is a resource cost and is equal to the opportunity cost of
allocating resources to the production and installation of insulation and clean heating.
We calculate this as the costs of the products and their installation to households, less
the estimated producer surplus that is discussed below. The producer surplus is the
difference between the costs of supply of insulation/clean heating and the retail costs
paid by households; it includes an assessment of the extent of the retail cost that
represents a pure profit to the producers and installers, and the proportion of labour
costs that are estimated to have a zero cost because of the level of unemployment in the
economy.

11
The average costs of insulation across all houses in the initial data provided by EECA is
$2,494.37/house and the average cost of clean heating is $2,977/house. This results in the
estimates of total costs shown in Table 6. The resource costs are these costs less the
producer surplus estimates that are discussed below (see Table 24) and less the costs of
labour that would otherwise have been unemployed. Total resource costs (opportunity
costs) once these deductions are made are summarised in Table 7, taking account of the
assumption that only 74% of total costs are additional.
Table 6 Total costs of installations ($ million) including GST
Product Installed 09/10 10/11 11/12 12/13
Insulation 128.9 122.5 157.1 36.2
Clean heat 37.7 33.7 84.8 24.3
Total 166.5 156.2 242.0 60.4
Table 7 Resource costs of installations ($ million)
Product installed 09/10 10/11 11/12 12/13
Insulation 52.5 49.9 64.1 14.7
Clean heat 18.9 16.9 42.5 12.1
Total 71.4 66.8 106.5 26.9

12
3 Benefits
3.1 Benefits Included
Benefits included in the analysis are those relating to energy savings and improved
health outcomes. There will be some additional benefits associated with consumer
comfort, but these have not been measured. The analysis here measures the benefits that
accrue to households that would not install insulation or clean heating in the absence of
the programme but that do so as a result of the programme. The difference may be
attributed to the net benefits to the household that arise from the subsidy (ie. the
household was not initially willing to install if they had to pay the full price, but are
willing to do so at the subsidised price.) It may also, in part, be attributed to the
educational/information benefits that arise as a result of the programme that makes
people understand better the benefits of insulation and/or clean heating.
We leave the comfort benefits as a one-sided uncertainty in the analysis; the total
benefits will therefore be higher than those measured.
3.2 Energy Savings
3.2.1 Volume Savings
The impacts on energy use of the additional insulation and clean heating have been
estimated from an analysis of the differences between energy use in treated versus
untreated houses. The addresses of the houses where the interventions occurred were
obtained and, using QVNZ data, these were matched with houses with similar
characteristics49 to identify a set of controls. Data were then obtained from energy
companies on metered energy consumption (electricity and gas) before and after the
date of treatment for treated houses and their controls. Regression analysis was used to
identify the impact of the separate interventions and the way that this differed by
location and by month. A regression model was developed that estimated the difference
in monthly electricity and total metered energy consumption between houses with and
without interventions as a function of the intervention type (insulation and/or clean
heating). The approach and results are described in detail in the separate energy study.50
The approach has limitations. Because we have used metered data only to estimate
changes in energy use, we have no data on the impacts on other fuels, eg. coal, wood or
LPG. Sensitivity analysis reported in the energy study found no significant difference in
metered energy savings according to whether a treated house already had a solid fuel or
other non-metered energy heating source prior to intervention. Thus there was no
evidence that additional fuel savings were made in houses with other forms of heating.
Nevertheless, to the extent that additional non-metered energy savings are made in
49 This was location (Census area unit, similar to a suburb), dwelling and house type, number of levels,
age (decade of build), floor area and number of bedrooms, whether there is a garage under the main
roof and its size (number of vehicles), house construction material (walls and roof), whether or not the
house was modernised, and quality (building and roof condition) of the dwelling. 50 Grimes A, Young C, Arnold R, Denne T, Howden-Chapman P, Preval N and Telfar-Barnard L (2011)
Warming Up New Zealand: Impacts of the New Zealand Insulation Fund on Household Energy Use.
13
treated houses, these savings are left as a one-sided uncertainty in the analysis, akin to
the treatment of additional comfort benefits. Both of these one-sided uncertainties mean
that actual benefits may be greater than those incorporated explicitly here.
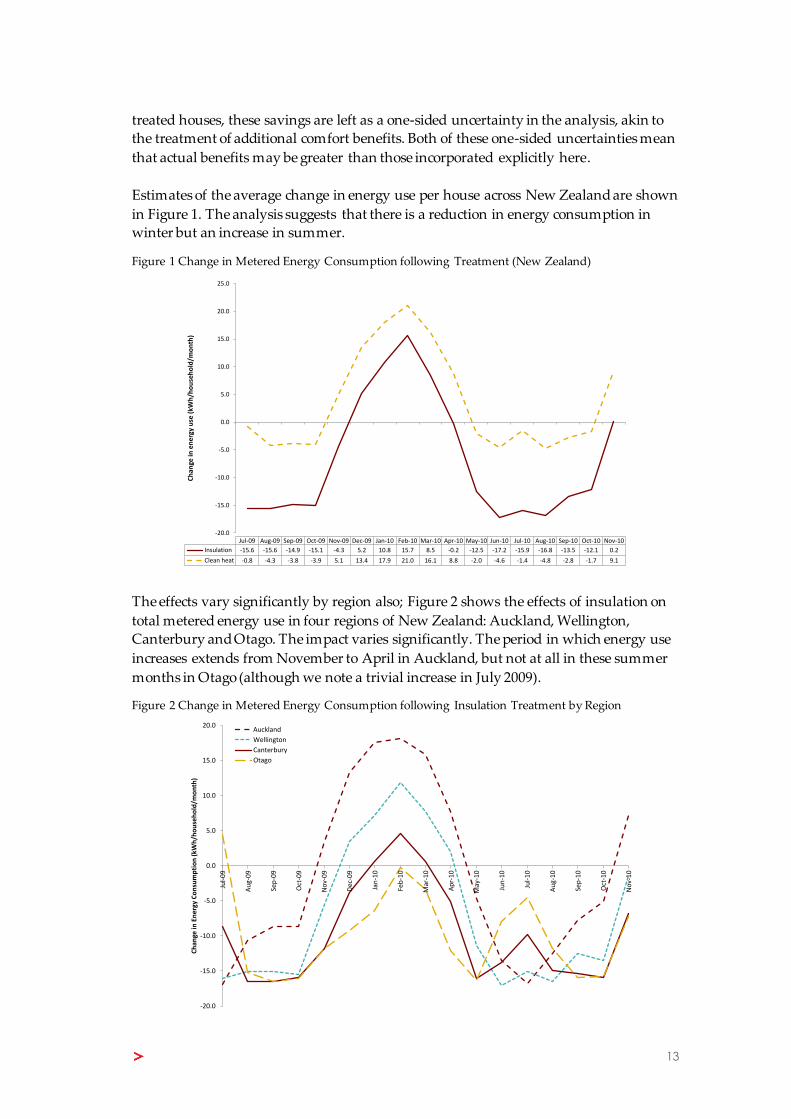
Estimates of the average change in energy use per house across New Zealand are shown
in Figure 1. The analysis suggests that there is a reduction in energy consumption in
winter but an increase in summer.
Figure 1 Change in Metered Energy Consumption following Treatment (New Zealand)
The effects vary significantly by region also; Figure 2 shows the effects of insulation on
total metered energy use in four regions of New Zealand: Auckland, Wellington,
Canterbury and Otago. The impact varies significantly. The period in which energy use
increases extends from November to April in Auckland, but not at all in these summer
months in Otago (although we note a trivial increase in July 2009).
Figure 2 Change in Metered Energy Consumption following Insulation Treatment by Region
-20.0
-15.0
-10.0
-5.0
0.0
5.0
10.0
15.0
20.0
25.0
Ch
ange
in e
ne
rgy
use
(kW
h/h
ou
seh
old
/mo
nth
)
Jul-09 Aug-09 Sep-09 Oct-09 Nov-09 Dec-09 Jan-10 Feb-10 Mar-10 Apr-10 May-10 Jun-10 Jul-10 Aug-10 Sep-10 Oct-10 Nov-10
Insulation -15.6 -15.6 -14.9 -15.1 -4.3 5.2 10.8 15.7 8.5 -0.2 -12.5 -17.2 -15.9 -16.8 -13.5 -12.1 0.2
Clean heat -0.8 -4.3 -3.8 -3.9 5.1 13.4 17.9 21.0 16.1 8.8 -2.0 -4.6 -1.4 -4.8 -2.8 -1.7 9.1
-20.0
-15.0
-10.0
-5.0
0.0
5.0
10.0
15.0
20.0
Jul-
09
Au
g-0
9
Sep
-09
Oct
-09
No
v-0
9
Dec
-09
Jan
-10
Feb
-10
Mar
-10
Ap
r-1
0
May
-10
Jun
-10
Jul-
10
Au
g-1
0
Sep
-10
Oct
-10
No
v-1
0
Ch
ange
in E
ner
gy C
on
sum
pti
on
(kW
h/h
ou
seh
old
/mo
nth
)
Auckland
Wellington
Canterbury
Otago

14
The aggregate impact across a year is shown for each region in Table 8; this includes the
impacts on electricity and all metered energy consumption as a result of treatment with
insulation and clean heating. The South Island data are the results calculated from the
regression analysis using data for houses with no reticulated gas. In practice there may
be savings of other fuels (coal, wood, LPG), but we have no data on these changes, as
noted above.
Table 8 Impact on Annual Energy Consumption of Treatment by Region (kWh/house) (1)
Insulation Clean heating
Electricity Other All metered Electricity Other All metered
NZ -70.2 18.7 -51.5 144.6 -78.8 65.9
Northland -2.3 30.5 28.2 119.0 3.7 122.6
Auckland -12.0 28.4 16.4 135.4 -25.5 109.9
Waikato -66.0 18.8 -47.3 152.1 -83.2 68.9
Bay of Plenty -85.7 14.3 -71.4 166.2 -108.6 57.6
Gisborne -42.7 23.2 -19.5 139.8 -52.4 87.5
Hawke's Bay -83.9 16.1 -67.8 151.1 -96.3 54.9
Taranaki -108.7 11.8 -96.8 161.7 -128.1 33.5
Manawatu-Wanganui -87.0 15.4 -71.6 155.5 -103.8 51.7
Wellington -77.2 17.9 -59.3 141.1 -80.9 60.2
Marlborough -64.9 -64.9 143.3 143.3
Nelson -58.1 -58.1 135.4 135.4
Tasman -81.1 -81.1 136.8 136.8
West Coast -120.4 -120.4 150.7 150.7
Canterbury -99.1 -99.1 140.9 140.9
Otago -111.0 -111.0 159.9 159.9
Southland -92.8 -92.8 188.0 188.0
(1) measured over period from July 2009 to November 2010 – months with 2 records are averaged, eg
(July 2009 + July 2010)/2 etc
Source: Grimes A, Young C, Arnold R, Denne T, Howden-Chapman P, Preval N and Telfar-Barnard L
(2011) Warming Up New Zealand: Impacts of the New Zealand Insulation Fund on Household Energy
Use
The results suggest that:
following insulation there is a net reduction in electricity consumption in all
regions and a net increase in other metered energy use in areas with reticulated
gas (North Island);
following installation of clean heating, there is a net increase in electricity use in
all regions and a reduction in other energy use in all regions (apart from a trivial
increase in Auckland).
To estimate the value of these savings, the electricity savings need to be estimated by
time of day because: (1) generation costs vary with total instantaneous consumption,
and (2) capacity costs vary with peak demand.
Orion Energy analysed the difference in peak demand for electricity of 116 Christchurch
households before and after the installation of insulation, compared with changes in
electricity demand in a control group of houses.51 They estimated the average net effect
of installing insulation was an 18% (0.39kW) reduction in peak winter demand; they
also noted a 1-2°C increase in internal temperature. However, the Orion data do not
51 Orion (2004) Effect of improved insulation on peak period demand.

15
include estimates of the change in energy use outside of the winter peak; nor do they
include estimates of the time of day of reductions.
EECA estimates the heating profiles for different locations and time periods using the
results of modelling by BRANZ. Different profiles are produced for different regions of
New Zealand; an example is given in Table 9, with the full set included in Annex 1. The
definitions used are listed in Table 10.
Table 9 Heating Profiles for Auckland (% of heating energy used in different periods)
Time period
Profile 1:
24hr (living), evening only
(bedrooms+kitchen)
Profile 2:
Evening only
(living)
Profile 3:
Evening only (living+
bedrooms+kitchen)
Summer day 1% 0% 0%
Summer night 4% 0% 0%
Summer peak 0% 0% 0%
Winter day 22% 77% 56%
Winter night 33% 0% 0%
Winter peak 18% 17% 33%
Shoulder day 5% 5% 8%
Shoulder night 14% 0% 0%
Shoulder peak 3% 0% 2%
Total 100% 100% 100%
Source: EECA
Table 10 Definitions used in heating profiles
Season Definition Time of day Definition
Winter May to September Day 09:00 to 17:00 &
20:00 to 23:00
Summer December to February Night 23:00 to 07:00
Shoulder March-April &
October-November Peak
07:00 to 09:00 &
17:00 to 20:00
Source: EECA
To make use of these profiles we need an estimate of the proportion of households that
are characterised by the different profiles. The only data we have identified are the
modelling assumptions used by BRANZ in its Household Energy End-use Project
(HEEP), and as recommended by EECA (Table 11). It shows the percentage of houses
that heat specified rooms at a specified time, eg. 1.5% of houses only heat their living
room on a weekday in the morning, but 45.5% heat the living room on a weekday in the
evening only.
We use these to estimate the proportion of households under each profile from Table 9.
The three profiles do not match the wide range of heating options, but we use the data
to make the assumed spread shown in Table 12.

16
Table 11 Percentage of houses on different heating schedules
Room: Living Bedroom Utility
Time period: Weekday Weekend Weekday Weekend Weekday Weekend
Morning 1.5% 1.8% 3.2% 2.6% 3.0% 2.5%
All day 0.7% 1.6% 0.3% 0.7% 0.7% 1.0%
Evening 45.5% 37.2% 21.8% 19.7% 11.4% 9.0%
Night 1.7% 1.8% 6.7% 6.5% 1.2% 1.3%
Morning/day 0.0% 0.0% 0.2% 0.0% 0.2% 0.3%
Morning/evening 13.9% 11.3% 6.0% 4.7% 4.0% 3.0%
Morning/night 1.0% 1.0% 0.2% 0.3% 0.0% 0.0%
Morning/day/evening 9.3% 12.3% 1.4% 2.3% 3.0% 4.2%
Morning/evening/night 0.3% 0.3% 0.0% 0.3% 0.7% 0.5%
Daytime/evening 5.0% 10.3% 1.0% 2.0% 2.5% 3.0%
Evening/night 3.2% 2.8% 4.0% 4.0% 1.0% 0.7%
Daytime/evening/night 0.5% 0.8% 0.0% 0.0% 0.3% 0.5%
24 hours 10.9% 10.8% 5.0% 4.7% 4.7% 4.8%
No heating 6.5% 8.0% 50.2% 52.2% 67.3% 69.2%
Total 100.0% 100.0% 100.0% 100.0% 100.0% 100.0%
Source: Burgess J (2007) Accurate modification for New Zealand. BRANZ EC1353
Table 12 Proportion of houses in different heating profiles
Profile Data used(1) % of total Adjusted %
1- 24hr (living),
evening only (bedrooms
+ kitchen)
All day (living) + morning/evening/night
(living) + daytime/evening/night (living) +
24 hours (living)
19% 36%
2 - Evening only
(living)
Evening (living) + evening/night (living) –
Evening (bedroom) - evening/night (bedroom)
22% 42%
3 - Evening only (living
+ bedrooms + kitchen)
Evening (utility) + evening/night (utility) 12% 22%
Total 52% 100%
(1) Weighted average of weekday and weekend used
These data enable us to combine the monthly changes in energy use in different regions
to times of day. The household level energy savings are spread across the different
regions on the basis of the initial data on the location of installations (Table 13). We
assume that this distribution continues.
Table 13 Proportion of Installations in Each Region (July 2009 – May 2010)
Region Insulation Clean Heating
Northland 5% 3%
Auckland 21% 14%
Bay of Plenty 7% 6%
Waikato 10% 5%
East Coast 8% 7%
Manawatu-Wanganui 4% 3%
Taranaki 3% 1%
Wellington 12% 12%
North Island 70% 50%
Nelson Marlborough Tasman 4% 6%
Canterbury 18% 37%
West Coast 0% 0%
Otago 5% 6%
Southland 3% 1%
South Island 30% 50%

17
Combining the household level energy savings (Table 8) with the heating profiles (Table
9 and Annex 1), the proportion of houses in each profile (Table 12) and the distribution
of interventions (Table 13), the weighted average energy savings from the insulation
and clean heat programmes are summarised in Table 14.
Table 14 Savings in Energy Use from Interventions (kWh/household per year) (1)
Summer
Day
Summer
Night
Summer
Peak
Winter
Day
Winter
Night
Winter
Peak
Shoulder
Day
Shoulder
Night
Shoulder
Peak
Electricity from Insulation
NZ -3.23 -16.41 -1.26 43.59 9.77 24.38 9.99 5.39 4.19
NI -4.13 -22.22 -1.64 44.76 9.99 21.76 5.51 3.50 2.17
SI -1.17 -3.03 -0.40 40.90 9.29 30.40 20.32 9.76 8.83
Other Energy from Insulation
NZ -1.42 -6.79 -0.56 -0.52 -0.12 -0.19 -3.32 -2.51 -1.14
NI -2.03 -9.74 -0.80 -0.75 -0.17 -0.28 -4.76 -3.60 -1.64
SI - - - - - - - - -
Electricity from Clean Heat Installations
NZ -6.67 -20.03 -2.63 -52.73 -11.88 -32.63 -22.15 -13.06 -8.88
NI -5.07 -25.12 -1.99 -51.69 -11.53 -25.14 -19.60 -14.34 -6.94
SI -8.53 -16.15 -3.36 -55.58 -12.65 -41.24 -25.25 -12.15 -11.02
Other Energy from Clean Heat Installations
NZ -2.44 -10.90 -0.95 29.22 6.52 14.61 0.98 0.44 0.46
NI -4.58 -21.38 -1.79 57.28 12.78 28.09 1.51 0.46 0.81
SI - - - - - - - - -
(1) Negative numbers are increases in energy use
We also consider changes in peak use separately so that we can estimate the impacts on
the long run requirement for electricity capacity (generation and transmission). We
estimate the peak use by taking the total savings for the winter peak periods and
assuming it is uniform over winter peak hours (Table 15).
Table 15 Savings in Peak Electricity Use (kW/household)(1)
Insulation Heat Pump
New Zealand 0.020 -0.027
North Island 0.018 -0.021
South Island 0.025 -0.034
(1) Negative numbers are increases in energy use
To take account of transmission losses, we use the following factors to scale up the
savings:
to value the savings in electricity we increase metered electricity savings by
6.39%. This represents the average (2006-2010) difference between the total
electricity entering the system and the total (observed) electricity demand.52
Total electricity entering the system is used because this is the point at which
prices are measured also;
52 MED (2011) Energy Data File. Table G.1
18
to value savings in CO2 emissions, we increase electricity savings by 12.01%.
This represents the average (2006-2010) difference between the total (gross)
electricity generation and the total (observed) electricity demand.53
These adjustments are made below when we calculate savings in costs.
3.2.2 Valuing Energy Savings
Changes in energy use have different benefits in the long and short run. In the short run
there is a saving from reduced fuel consumption either used directly (eg. as gas for
heating) or indirectly in electricity generation. In the long run there are savings from the
reduced capacity requirement for energy supply. To estimate the benefits we use
different approaches for electricity and gas.
For electricity we use the same broad approach as adopted by KEMA in estimating
avoided costs of electricity efficiency measures;54 this is to estimate the fuel savings
separately from the capacity savings. The fuel savings are based on estimates of
reduction in kWh of electricity consumption; we spread estimates of monthly savings
over different hours of the day to estimate the savings in generation costs using time-of-
day wholesale prices. The capacity savings, for generation and transmission, are based
on reductions in peak demand, using the change in winter peak and a capacity cost
based on the costs of new generation and transmission.
For gas we take a simpler approach, using a delivered price of gas as the basis for our
estimate of the savings in costs of supply. This is because gas supply does not have the
same variability in supply costs over time as does electricity.
Electricity
To estimate the impacts on electricity costs we use the following assumptions:
Marginal generation costs are estimated using time of day pricing at the
Haywards node, calculated as a percentage of the annual average price. This is
then combined with MED’s projections of future (annual average) electricity
prices to estimate future time of day prices;55
Generation capacity costs are based on the capital costs of a gas peaker, the same
assumption as used by KEMA. We use a value of $1,000/kW derived from
estimates by PB Consulting;56
Transmission capacity costs use the same assumption as used by KEMA, ie.
$300/kW.
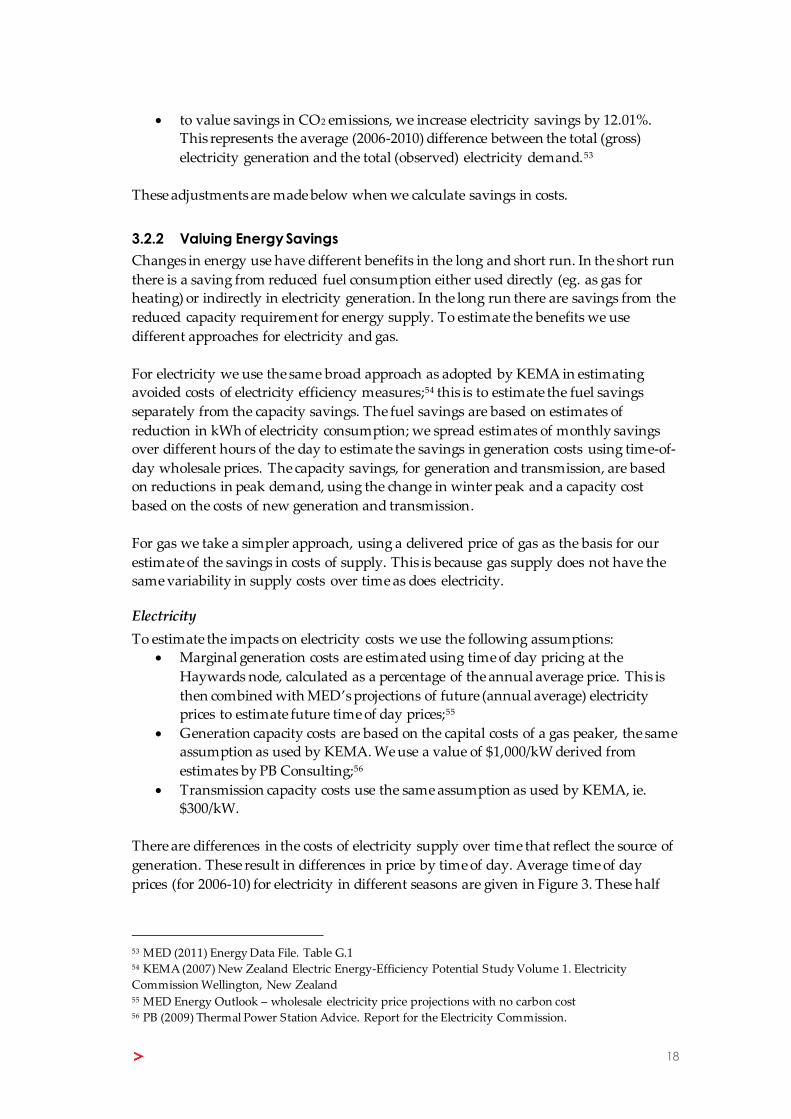
There are differences in the costs of electricity supply over time that reflect the source of
generation. These result in differences in price by time of day. Average time of day
prices (for 2006-10) for electricity in different seasons are given in Figure 3. These half
53 MED (2011) Energy Data File. Table G.1 54 KEMA (2007) New Zealand Electric Energy-Efficiency Potential Study Volume 1. Electricity
Commission Wellington, New Zealand 55 MED Energy Outlook – wholesale electricity price projections with no carbon cost 56 PB (2009) Thermal Power Station Advice. Report for the Electricity Commission.
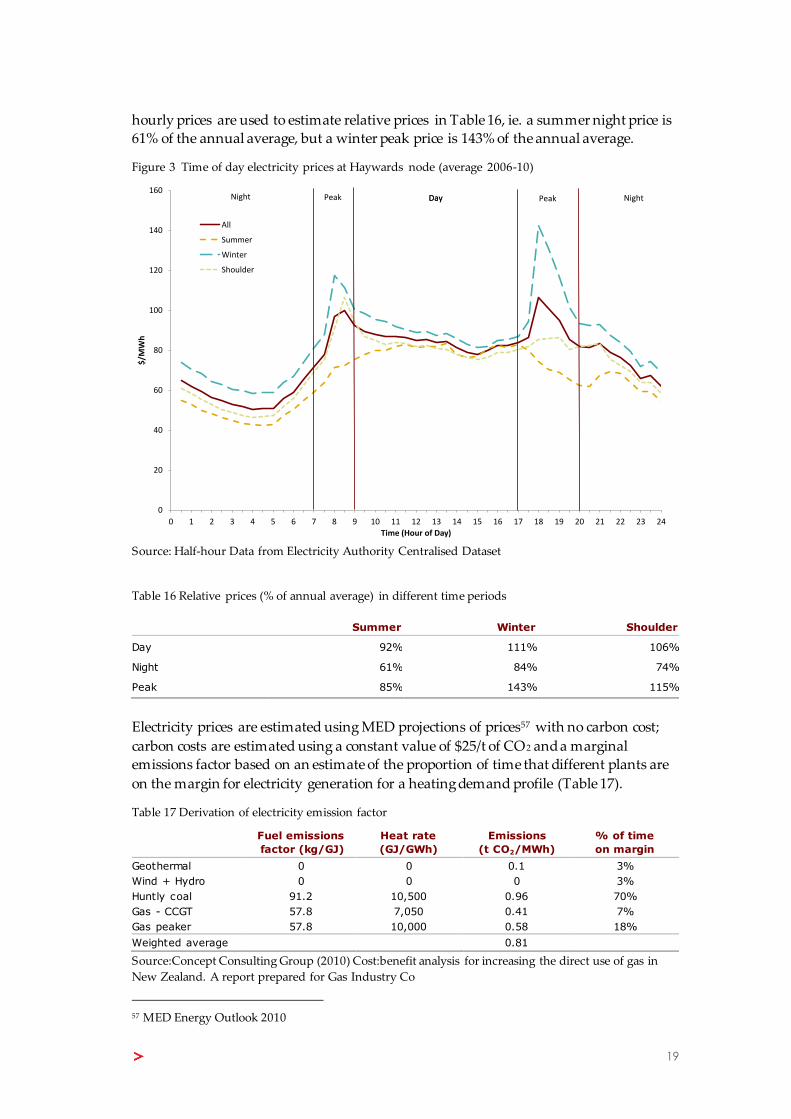
19
hourly prices are used to estimate relative prices in Table 16, ie. a summer night price is
61% of the annual average, but a winter peak price is 143% of the annual average.
Figure 3 Time of day electricity prices at Haywards node (average 2006-10)
Source: Half-hour Data from Electricity Authority Centralised Dataset
Table 16 Relative prices (% of annual average) in different time periods
Summer Winter Shoulder
Day 92% 111% 106%
Night 61% 84% 74%
Peak 85% 143% 115%
Electricity prices are estimated using MED projections of prices57 with no carbon cost;
carbon costs are estimated using a constant value of $25/t of CO2 and a marginal
emissions factor based on an estimate of the proportion of time that different plants are
on the margin for electricity generation for a heating demand profile (Table 17).
Table 17 Derivation of electricity emission factor
Fuel emissions
factor (kg/GJ)
Heat rate
(GJ/GWh)
Emissions
(t CO2/MWh)
% of time
on margin
Geothermal 0 0 0.1 3%
Wind + Hydro 0 0 0 3%
Huntly coal 91.2 10,500 0.96 70%
Gas - CCGT 57.8 7,050 0.41 7%
Gas peaker 57.8 10,000 0.58 18%
Weighted average
0.81
Source:Concept Consulting Group (2010) Cost:benefit analysis for increasing the direct use of gas in
New Zealand. A report prepared for Gas Industry Co
57 MED Energy Outlook 2010
0
20
40
60
80
100
120
140
160
0 1 2 3 4 5 6 7 8 9 10 11 12 13 14 15 16 17 18 19 20 21 22 23 24
$/M
Wh
Time (Hour of Day)
All
Summer
Winter
Shoulder
Peak DayNight PeakDay Night

20
Gas
To value savings in gas use we use an estimate of the retail charge for gas to commercial
customers, currently estimated as 5.7c/kWh.58 We use the commercial charge rather than
the residential charge recognising that the gas supply network has more surplus
capacity than does electricity, as noted by Concept Consulting, suggesting that small
marginal changes in demand may not result in measurable changes in distribution costs.
We note that in the short run benefits may be closer to the wholesale price of gas of
(2.7c/kWh). However, reductions may have long run benefits in terms of reduced
transmission costs and we use a commercial price to take account of some of these
benefits.
As for electricity, future price estimates are based on MED’s price projections. We use a
historical average ratio between commercial and wholesale prices (2.67:1) to scale up
MED wholesale price projections.59
For CO2 emissions from gas use we use a weighted average of New Zealand gas
production in 2010 at 53.16kg CO2/GJ.60
3.2.3 Present Value of Energy Savings
We assume that the benefits from insulation are achieved over 30 years and the benefits
of a heat pump are achieved over 10 years. We discount the energy and carbon savings
to present value terms using a discount rate of 4%; we also show the results at
alternative discount rates.
Taking account of the additionality of interventions, we use a central estimate of 74% of
the changes in energy use being a result of the programme. The results are presented in
Table 18. To calculate these benefits, the savings in electricity related costs per
household from Table 14 are combined with:
Estimates of number of houses treated in each year (Table 2);
The transmission losses to scale up the savings;61
The relative electricity prices in the different time periods in Table 16;
Projections of future electricity prices from MED’s Energy Outlook;
The assumed additionality of 74.3% (Table 3);
The assumed marginal electricity emission factor of 0.81t CO 2/MWh (Table 17)
and a constant real price of $25/tonne.
Consistent with the energy study, “other energy” is restricted to reticulated gas. We use
an emission factor of 53.16kgCO2/GJ.
58 MED (2010) Energy Data File. $33.46/GJ including GST 59 MED Energy Outlook 2010 60 MED (2010) New Zealand Energy Greenhouse Gas Emissions (2009 Calendar year Edition) 61 6.39% for losses between electricity entering the system and final consumption, and 12.01% for losses
between generation and consumption

21
Table 18 Net Present Value ($ million) of Electricity and Other Energy Savings
Insulation Clean heat
Energy CO2 Total Energy CO2 Total Total
@ 4%
Electricity 24.4 0.2 24.6 -7.0 -0.1 -7.1 17.5
Other Energy -1.3 -0.2 -1.5 0.9 0.1 0.9 -0.5
Total 23.1 -0.0 23.1 -6.1 0.0 -6.1 16.9
@ 2.5%
Electricity 29.7 0.2 29.9 -7.6 -0.1 -7.7 22.2
Other Energy -1.6 -0.2 -1.9 0.9 0.1 0.9 -0.9
Total 28.0 -0.0 28.0 -6.8 0.0 -6.8 21.2
@ 8%
Electricity 15.9 0.1 16.0 -5.7 -0.0 -5.8 10.3
Other Energy -0.8 -0.1 -0.9 0.9 0.0 0.9 0.1
Total 15.2 -0.0 15.2 -4.8 0.0 -4.8 10.3
We test the impacts of the duration of benefits in sensitivity analysis in Table 19. This is
to examine the implications if the programme merely brought installations forward in
time; we assume a duration of benefits of 10 years for insulation and 5 years for clean
heating. At a 4% discount rate this reduces the benefit by 57%.
Table 19 Sensitivity Analysis: NPV ($ million) of Energy Savings (Limited Duration)(1)
Insulation Clean heat
Energy CO2 Total Energy CO2 Total Total
@ 4%
Electricity 11.6 0.1 11.7 -4.2 -0.0 -4.2 7.5
Other Energy -0.6 -0.1 -0.7 0.5 0.0 0.5 -0.1
Total 11.0 -0.0 11.0 -3.7 0.0 -3.7 7.4
@ 2.5%
Electricity 12.5 0.1 12.6 -4.4 -0.0 -4.4 8.2
Other Energy -0.6 -0.1 -0.7 0.5 0.0 0.5 -0.2
Total 11.9 -0.0 11.9 -3.9 0.0 -3.9 8.0
@ 8%
Electricity 9.7 0.1 9.8 -3.7 -0.0 -3.7 6.1
Other Energy -0.5 -0.1 -0.5 0.5 0.0 0.5 0.0
Total 9.3 -0.0 9.3 -3.2 0.0 -3.2 6.1
(1) Insulation benefits assumed to last 10 years; clean heating for 5 years
3.3 Health Savings
The health savings are estimated in a similar way to the energy savings, and the
approach and detailed results are set out in the separate paper. 62 Addresses of houses
that had received treatment were matched with similar houses to provide a control
group of addresses. Data were then obtained on hospitalisation and pharmaceutical
costs of the treatment and control groups; benefits were estimated using the difference
between treated and untreated houses. Additional benefits were estimated from
previous studies under the Heating, Housing and Health Study; these included reduced
medical visits, reduced days off school or work and associated reductions in caregiver
62 Telfar Barnard L, Preval N, Howden-Chapman P, Arnold R, Young C, Grimes A, Denne T (2011) The
impact of retrofitted insulation and new heaters on health services utilisation and costs, and
pharmaceutical costs. Evaluation of the New Zealand Insulation Fund.

22
costs. The total benefits per household are summarised in Table 20. The authors note
that they prefer the conservative estimates of benefits that include the total benefits
calculated in the study plus the benefits imputed from previous studies; they include a
more focussed assessment of benefits that includes only respiratory and circulatory
benefits which produces a higher monthly saving.
Table 20 Summary of annual health related benefits (savings) per household treated ($/house)
Insulation Clean heating
All
CSC(1)
Holders Other All
CSC
Holders Other
Conservative Assessment
Hospitalisation and pharmaceutical use
related benefits 75.48 109.8 11.04 0 0 0
Benefits imputed from previous studies 95.49 95.49 95.49 9.27 9.27 9.27
Value of reduced mortality 465.36 649.11 229.11 0 0 0
Total health benefits 636.33 854.4 335.64 9.27 9.27 9.27
Focussed Assessment
Hospitalisation and pharmaceutical use
related benefits 168.24 206.04 76.56 0 0 0
Benefits imputed from previous Studies 95.49 95.49 95.49 9.27 9.27 9.27
Value of reduced mortality 465.36 649.11 229.11 0 0 0
Total health benefits 729.09 950.64 401.16 9.27 9.27 9.27
(1) CSC = Community Service Card, available to those on a low to middle income
Source: Telfar Barnard L, Preval N, Howden-Chapman P, Arnold R, Young C, Grimes A, Denne T
(2011) The impact of retrofitted insulation and new heaters on health services utilisation and costs, and
pharmaceutical costs. Evaluation of the New Zealand Insulation Fund
Table 21 shows the present value of the health benefits spread over the duration of those
benefits (30 years for insulation and 10 years for clean heat). These are spread over the
assumed number of houses treated under the programme (Table 2), adjusted to take
account of the assumed additionality of 74% of total installations (Table 3). The health
benefits are dominated by the insulation benefits ($1,263 million of a total of $1,266
million).
Table 21 Present value of health benefits at different discount rates ($ million)
Conservative Focussed
Discount rate: 4.0% 2.5% 8.0% 4.0% 2.5% 8.0%
CSC Insulation 802 974 521 892 1,083 580
Other insulation 460 564 293 550 674 350
Total insulation 1,263 1,537 813 1,443 1,757 929
CSC Clean heat 1 1 1 1 1 1
Other clean heat 2 3 2 2 3 2
Total clean heat 4 4 3 4 4 3
Total 1,266 1,541 816 1,446 1,761 932
As with the energy benefits, we examine the implications of reducing the duration of
benefits in Table 22. The shorter duration of benefits (10 years for insulation, rather than
30 and 5 years for clean heating, rather than 10) reduces the total benefits under the
conservative scenario (and a 4% discount rate) by approximately 50%.

23
Table 22 Sensitivity analysis: present value of health benefits at different discount rates ($ million)
(Limited Duration)(1)
Conservative Focussed
Discount rate: 4.0% 2.5% 8.0% 4.0% 2.5% 8.0%
CSC Insulation 399 433 328 444 482 365
Other insulation 229 251 184 274 300 220
Total insulation 629 684 512 719 781 584
CSC Clean heat 1 1 1 1 1 1
Other clean heat 1 2 1 1 2 1
Total clean heat 2 2 2 2 2 2
Total 631 686 514 721 784 586
(1) Insulation benefits assumed to last 10 years; clean heating for 5 years
3.4 Producer Surplus
Producer surplus is defined as the total sales revenue attributable to the programme,
minus all opportunity costs of production.
Producer surplus benefits were calculated from an estimate of the difference between
costs of supply of insulation and clean heating and the costs to households; the
methodology and results are reported separately.63 This calculation includes the surplus
to producers, any tax paid that is included in the costs to households plus a proportion
of the labour costs that we estimate would otherwise be unemployed (in the short run)
and therefore has a zero opportunity cost. We deduct producer surplus from gross costs
of the programme to arrive at opportunity costs, being the appropriate definition of
resource costs attributable to the programme. (To avoid double counting, producer
surplus is therefore not included as a separate benefit.)
The main inputs to the analysis are summarised in Table 23; this takes the results from
the separate paper and reports them as a surplus per house treated (insulated or clean
heating installed).
Table 23 Elements of Producer Surplus
Element of Surplus Insulation
($/m2)
$/house Clean heating
($/unit)
$/house
Production 0.54 - 1.19 92 - 203 538 538
Installation 4.74 - 6.70 811 – 1,146 433 433
Total 5.27 - 7.89 902 – 1,349 970 970
Source: Covec (op cit); insulation surplus per house estimated from 171.1m2 insulation/house
The resulting total producer surplus, taking account of the additionality factor of 74%
and the number of houses treated (Table 2), is shown in Table 24. It uses average values
for insulation and splits the surplus into those that are from benefits accruing to
producers and those relating to zero labour costs (these are 20% of the total surplus for
insulation and 12% for clean heating). The present value over the four years over the
programme is given at different discount rates in Table 25.
63 Covec (2011) Impacts of the NZ Insulation Fund on Industry and Employment. Report for Ministry
of Economic Development
24
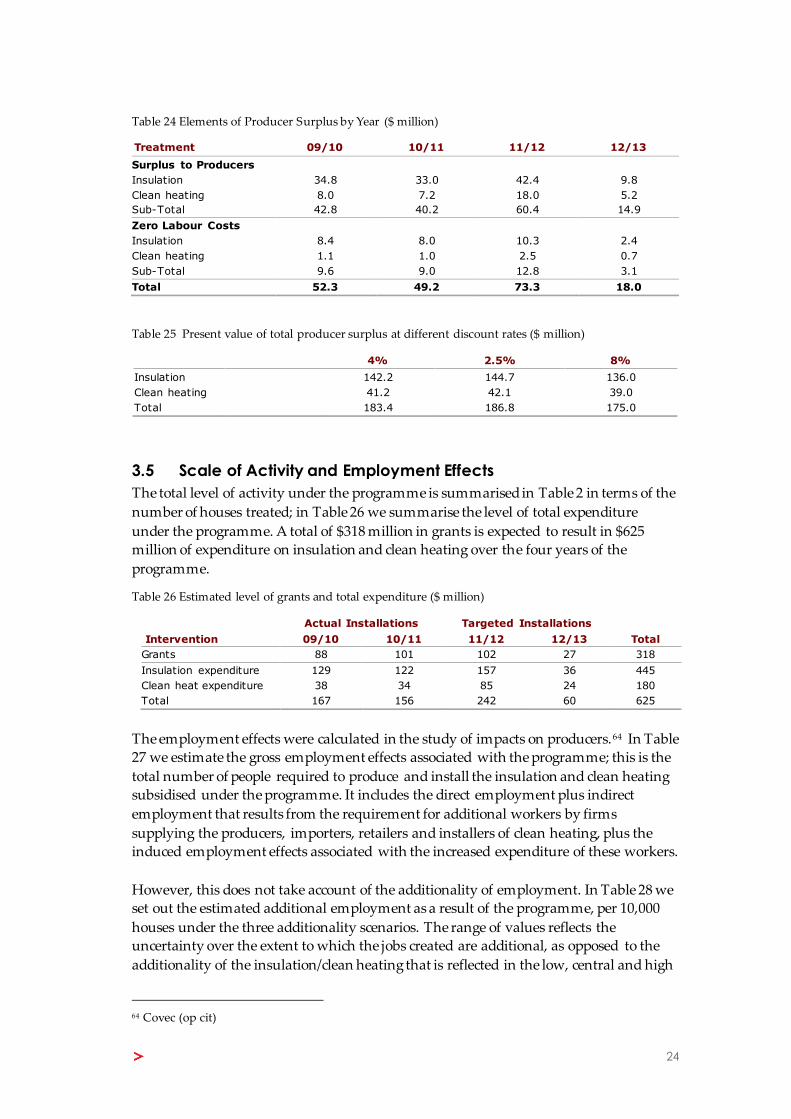
Table 24 Elements of Producer Surplus by Year ($ million)
Treatment 09/10 10/11 11/12 12/13
Surplus to Producers
Insulation 34.8 33.0 42.4 9.8
Clean heating 8.0 7.2 18.0 5.2
Sub-Total 42.8 40.2 60.4 14.9
Zero Labour Costs
Insulation 8.4 8.0 10.3 2.4
Clean heating 1.1 1.0 2.5 0.7
Sub-Total 9.6 9.0 12.8 3.1
Total 52.3 49.2 73.3 18.0
Table 25 Present value of total producer surplus at different discount rates ($ million)
4% 2.5% 8%
Insulation
142.2 144.7 136.0
Clean heating 41.2 42.1 39.0
Total
183.4 186.8 175.0
3.5 Scale of Activity and Employment Effects
The total level of activity under the programme is summarised in Table 2 in terms of the
number of houses treated; in Table 26 we summarise the level of total expenditure
under the programme. A total of $318 million in grants is expected to result in $625
million of expenditure on insulation and clean heating over the four years of the
programme.
Table 26 Estimated level of grants and total expenditure ($ million)
Actual Installations Targeted Installations
Intervention 09/10 10/11 11/12 12/13 Total
Grants 88 101 102 27 318
Insulation expenditure 129 122 157 36 445
Clean heat expenditure 38 34 85 24 180
Total 167 156 242 60 625
The employment effects were calculated in the study of impacts on producers.64 In Table
27 we estimate the gross employment effects associated with the programme; this is the
total number of people required to produce and install the insulation and clean heating
subsidised under the programme. It includes the direct employment plus indirect
employment that results from the requirement for additional workers by firms
supplying the producers, importers, retailers and installers of clean heating, plus the
induced employment effects associated with the increased expenditure of these workers.
However, this does not take account of the additionality of employment. In Table 28 we
set out the estimated additional employment as a result of the programme, per 10,000
houses under the three additionality scenarios. The range of values reflects the
uncertainty over the extent to which the jobs created are additional, as opposed to the
additionality of the insulation/clean heating that is reflected in the low, central and high
64 Covec (op cit)

25
columns– see Table 3 for definitions. Using these figures, the estimates of total
additional employment over the four years of the programme are given in Table 29.
Table 27 Estimated Gross Employment Effects of the Programme
09/10 10/11 11/12 12/13
Insulation - direct 484 460 590 136
Insulation - indirect 286 271 348 80
Insulation - total 769 731 938 216
Clean heat - direct 34 30 76 22
Clean heat - indirect 32 28 71 20
Clean heat - total 65 58 147 42
Government - direct 25 25 25 25
Government - indirect 30 30 30 30
Government - total 55 55 55 55
Total - direct 542 515 691 182
Total - indirect 347 329 449 130
Total 889 844 1,140 313
Table 28 Additional employment per 10,000 houses
Additionality:
Low Central High
EECA(1) Direct 3 - 15 3 - 15 3 - 15
Indirect 3 - 18 3 - 18 3 - 18
Total 6 - 33 6 - 33 6 - 33
Insulation Direct 3 - 20 7 - 42 11 - 64
Indirect 2 - 12 4 - 25 6 - 37
Total 5 - 32 11 - 66 17 - 101
Clean heat Direct 0.3 - 2 3 - 20 5 - 30
Indirect 0.3 - 2 3 - 19 5 - 28
Total 0.6 - 4 6 - 38 10 - 58
Total Direct 6 - 37 13 - 77 18 - 109
Indirect 5 - 32 10 - 61 14 - 84
Total 12 - 69 23 - 138 32 - 192
(1) EECA employment numbers assumed to be independent of number of houses
Table 29 Additional employment under the programme with low, central and high additionality
Source Additionality 09/10 10/11 11/12 12/13
EECA All 6 - 33 6 - 33 6 - 33 6 - 33
Insulation Low 28 - 165 26 - 157 34 - 201 8 - 46
Central 58 - 343 55 - 326 70 - 418 16 - 96
High 88 - 522 83 - 496 107 - 636 25 - 146
Clean heat Low 1 - 5 1 - 4 2 - 11 1 - 3
Central 8 - 48 7 - 43 18 - 109 5 - 31
High 12 - 74 11 - 66 28 - 166 8 - 47
Total Low 34 - 203 33 - 194 41 - 245 14 - 82
Central 71 - 424 68 - 402 94 - 560 27 - 160
High 106 - 628 100 - 595 140 - 835 38 - 227
The monetary value of the additional direct employment is estimated by multiplying
the direct additional employment by estimated wage rates, as discussed in the separate
report. The resulting values are an estimate of the financial costs of labour for which
there is a zero social opportunity cost. These values are included in the Producer
Surplus calculation above, and summarised in Table 24.

26
4 Net Benefits and Conclusions
4.1 Net Benefits
4.1.1 Total Net Benefits
The total resource costs and benefits are summarised in Table 30. The benefits for health
and energy are, in each case, conservative estimates obtained from the two related
studies.
Table 30 Present Value of Total Costs and Benefits ($ million)
Additionality: Central
Low High
Discount rate: 4% 2.5% 8% 4% 4%
Costs
Admin costs 23 24 22 23 23
Deadweight costs of tax 51 52 49 58 44
Installations - insulation 173 176 165 83 263
Installations - clean heat 85 87 81 41 130
Sub-total 332 339 317 205 460
Benefits
Energy 17 21 10 8 26
Health 1,266 1,541 816 608 1,926
Sub-total 1,283 1,562 827 616 1,951
Net Benefits 951 1,224 510 411 1,492
Given our baseline assumptions for the horizon of benefits from each of insulation and
clean heating, the results suggest that there are positive net benefits of the programme at
all discount rates examined, even with assumptions of low levels of additionality, or
with a high discount rate.
Thus even our conservative estimates of benefits indicate that the programme, overall,
has had considerable net benefits. While care must be exercised in formulating benefit-
cost ratios (owing to alternative ways of attributing certain categories either as benefits
or as offsets to costs), the ratio of benefits to costs in Table 30 ranges between 2.6 and 4.6,
with a central (4% discount rate) benefit-cost ratio of 3.9. These results indicate that,
overall, the Warm Up New Zealand: HeatSmart programme has been well justified in
terms of positive net benefits.
4.1.2 Distribution of Benefits
The results are dominated by the health benefits; they represent approximately 99% of
the total benefits. The benefits from reduced mortality are the most significant health
benefits, comprising approximately 74% of the total health benefits ($1,130 million for
the central, 4% scenario). However, the programme would still have positive net
benefits even in the absence of mortality benefits.
The benefits are also dominated by insulation (Table 31); the measured results suggest
approximately zero (or even slight net costs) associated with clean heat. This may be
because, unlike retrofitted insulation which does not involve on-going household
expenditure, installation of clean heat heaters will only affect health outcomes if the

27
household is able and willing to afford the metered energy costs.65 However, there are
significant missing benefits that we are unable to quantify, including those of household
comfort and possible reductions in non-metered energy use.
Table 31 Benefits by Category($ million) (Central additionality; 4% discount rate)
Insulation Clean heat Total
Energy 23 -6 17
Health 1,263 4 1,266
Total 1,286 -3 1,283
4.1.3 Cost Components
The largest component of costs is the costs of the installations themselves, ie. the
insulation, clean heaters and the labour costs for installations. The deadweight cost of
taxation is a significant component, and one that is frequently ignored in cost benefit
analyses. Here it is estimated at approximately 15% of the total costs.
4.2 Potential Programme Refinements
The energy study found that energy benefits from insulation were greatest for houses in
cooler regions. This result most likely reflects the fact that energy use for heating
purposes prior to treatment is greater for houses in cooler areas than for those in
warmer regions. There is therefore greater scope for energy savings following treatment
for houses in cooler areas.
Table 8 shows the differences between regions in the impacts of insulation and clean
heating on metered energy use. The results for Northland and Auckland suggest small
reductions in electricity consumption but an overall increase in total metered energy
use; elsewhere there are overall reductions in total metered energy use.
Clean heating results in increases in energy use in all regions. The energy study showed,
however, that there were positive energy savings for treated houses that already had
reticulated gas, in contrast to the result for other houses. Thus energy savings from
installation of clean heating may be increased if clean heating is targeted at houses that
initially use reticulated gas rather than electricity for heating.
The health impacts study shows clear differences between the effects on low to middle
income earners and other households, with significantly larger benefits for Community
Service Card (CSC) holders (Table 20). This result is consistent with prior research (see
section 1.3.1) that the sick and other at-risk groups are most adversely affected by cold
house temperatures. These groups therefore have the most to gain from installation of
retrofitted insulation.
The overall results suggest that the programme as a whole has had sizeable net benefits,
with our central estimate of programme benefits being 4.8 times resource costs
65 Howden-Chapman P, Viggers H, Chapman H, O’Sullivan K, Telfar-Barnard K, Lloyd B (in press)
Tackling cold housing and fuel poverty in New Zealand: a review of policies, research and health
impacts. Energy Policy, Fuel Poverty comes of age: 21 years of research into fuel poverty

28
attributable to the programme. Nevertheless, even greater benefits may be achievable
through consideration of four targeting strategies:
1. Prioritise the insulation component of the programme relative to the clean
heating component of the programme.
2. Target clean heating to houses that use reticulated gas rather than electricity for
heating prior to treatment.
3. Target insulation to houses in cooler rather than warmer areas.
4. Target insulation to low and middle income earners and other at-risk groups in
terms of illness.

29
Annex 1 Heating Profiles
Profiles: % of heating energy consumed in different time periods.
Region Profile(1)
Sum
mer
day
Sum
mer
nig
ht
Sum
mer
peak
Win
ter
day
Win
ter
nig
ht
Win
ter
peak
Should
er
day
Should
er
nig
ht
Should
er
peak
Northland 1 1% 4% 0% 22% 33% 18% 5% 14% 3%
2 0% 0% 0% 77% 0% 17% 5% 0% 0%
3 0% 0% 0% 56% 0% 33% 8% 0% 2%
Auckland 1 1% 4% 0% 22% 33% 18% 5% 14% 3%
2 0% 0% 0% 77% 0% 17% 5% 0% 0%
3 0% 0% 0% 56% 0% 33% 8% 0% 2%
Hamilton 1 1% 4% 0% 22% 33% 18% 5% 14% 3%
2 0% 0% 0% 77% 0% 17% 5% 0% 0%
3 0% 0% 0% 56% 0% 33% 8% 0% 2%
Bay of Plenty 1 0% 0% 0% 77% 0% 17% 5% 0% 0%
2 0% 0% 0% 77% 0% 17% 5% 0% 0%
3 0% 0% 0% 56% 0% 33% 8% 0% 2%
Rotorua 1 1% 4% 0% 22% 33% 18% 5% 14% 3%
2 0% 0% 0% 77% 0% 17% 5% 0% 0%
3 0% 0% 0% 56% 0% 33% 8% 0% 2%
Taupo 1 2% 6% 1% 23% 25% 17% 7% 13% 5%
2 0% 0% 0% 53% 0% 35% 10% 0% 2%
3 2% 0% 0% 41% 0% 37% 13% 0% 6%
East Cape 1 1% 4% 0% 22% 33% 18% 5% 14% 3%
2 0% 0% 0% 77% 0% 17% 5% 0% 0%
3 0% 0% 0% 56% 0% 33% 8% 0% 2%
New Plymouth 1 2% 5% 1% 23% 24% 18% 8% 13% 6%
2 0% 0% 0% 52% 0% 36% 9% 0% 3%
3 1% 0% 0% 40% 0% 38% 14% 0% 6%
Manawatu 1 2% 5% 1% 23% 24% 18% 8% 13% 6%
2 0% 0% 0% 52% 0% 36% 9% 0% 3%
3 1% 0% 0% 40% 0% 38% 14% 0% 6%
Wairarapa 1 2% 5% 1% 23% 24% 18% 8% 13% 6%
2 0% 0% 0% 52% 0% 36% 9% 0% 3%
3 1% 0% 0% 40% 0% 38% 14% 0% 6%
Wellington 1 2% 5% 1% 23% 24% 18% 8% 13% 6%
2 0% 0% 0% 52% 0% 36% 9% 0% 3%
3 1% 0% 0% 40% 0% 38% 14% 0% 6%
Nelson/
Marlborough 1 1% 4% 0% 22% 33% 18% 5% 14% 3%
2 0% 0% 0% 77% 0% 17% 5% 0% 0%
3 0% 0% 0% 56% 0% 33% 8% 0% 2%
West Coast 1 2% 6% 1% 23% 25% 17% 7% 13% 5%
2 0% 0% 0% 53% 0% 35% 10% 0% 2%
3 2% 0% 0% 41% 0% 37% 13% 0% 6%
Christchurch 1 2% 6% 1% 23% 25% 17% 7% 13% 5%
2 0% 0% 0% 53% 0% 35% 10% 0% 2%
3 2% 0% 0% 41% 0% 37% 13% 0% 6%
Queenstown
Lakes 1 2% 6% 1% 23% 25% 17% 7% 13% 5%
2 0% 0% 0% 53% 0% 35% 10% 0% 2%
3 2% 0% 0% 41% 0% 37% 13% 0% 6%
Otago Central 1 2% 6% 1% 23% 25% 17% 7% 13% 5%
2 0% 0% 0% 53% 0% 35% 10% 0% 2%
3 2% 0% 0% 41% 0% 37% 13% 0% 6%

30
Dunedin 1 2% 6% 1% 23% 25% 17% 7% 13% 5%
2 0% 0% 0% 53% 0% 35% 10% 0% 2%
3 2% 0% 0% 41% 0% 37% 13% 0% 6%
Invercargill 1 2% 6% 1% 23% 25% 17% 7% 13% 5%
2 0% 0% 0% 53% 0% 35% 10% 0% 2%
3 2% 0% 0% 41% 0% 37% 13% 0% 6%
(1) See Table 9 for definitions
Source: EECA