Embed Size (px)
Citation preview
Cost-Benefit Analysis of Stream-Simulation Culverts
December 19, 2014
Prepared by: Carl Christiansen Angela Filer Matthew Landi Eric O’Shaughnessy Mallory Palmer Travis Schwartz
On Behalf of the Wisconsin Department of Natural Resources

Cost-Benefit Analysis of Stream-Simulation Culverts i
EXECUTIVE SUMMARY On behalf of the Wisconsin Department of Natural Resources, our project team performed a cost-benefit analysis of culvert replacement in Wisconsin. Our report quantifies the social and fiscal costs and benefits of replacing conventional culverts with stream-simulation design culverts. We conclude that replacing conventional culverts with stream-simulation design culverts yields average net fiscal benefits of -$4,500 and average net social benefits of $7,800 per culvert replacement. While the net fiscal benefit is negative, we find that approximately 44 percent of culvert replacements yields net fiscal benefits and, further, 77 percent yields net social benefits. We recommend that responsible stakeholders (i.e. local municipalities and county governments) should strongly consider replacing traditional culverts with stream-simulation design culverts. We find that culverts located on streams with smaller bankfull widths yield larger net benefits, and further, culverts that currently exhibit environmental damages such as fish passage barriers, downstream degradation, or wetland impacts yield the largest net benefits from culvert replacement. Lastly, we conclude that the primary benefit of a stream-simulation design culverts are their longer expected lifetimes. Stream-simulation culverts provide more benefits and have longer project lifetimes because they reflect the natural stream characteristics and maintain the aquatic connectivity of the stream. We monetized nine separate benefits, which we have grouped into two main categories: fiscal benefits and ecological/social benefits. The single cost of stream-simulation design is the higher initial installation cost. We then developed a cost-benefit model after reviewing culvert data collected by the DNR from the Green Bay, WI area, and a thorough literature review of culvert design and case studies. Generally, we recommend that responsible stakeholders collect site-specific data and contact the DNR for assistance in ascertaining whether replacing the existing culvert with a stream-simulation design culvert is appropriate. The DNR can use our model as a financial tool to advise responsible stakeholders on their decision whether to replace a culvert. Further, we recommend that the DNR and local municipalities increase their data collection efforts in order to more accurately account for the true costs of culverts in Wisconsin, which will help estimate the net benefits of stream-simulation design culverts.

Cost-Benefit Analysis of Stream-Simulation Culverts ii
ACKNOWLEDGEMENTS Many people assisted us in the completion of this project. First, we would like to thank our clients at the Wisconsin Department of Natural Resources Matt Diebel, Jon Simonsen, Bobbi Fischer, and Mike Miller. Also, thank you to Tammie Paoli of the DNR for providing us with data on fish density.
The following county workers provided responses to our operations and maintenance survey: Freeman Bennett of Oneida County, Gerry Abbe of Walworth County, Allison Bussler of Waukesha County, Ronald Chamberlain of LaCrosse County, Nathan Check of Portage County, James Chitwood of Richland County, Brian Field of Dodge County, Alvin Guerts of Outagamie County, Don Grande of Price County, Jim Griesbach of Marathon County, Jane Severson of Vernon County, Craig Hardy of Iowa County, Tom Janke of Fond du Lac County, Tim Ramberg of St. Croix County, Timothy Rusch of Langlade County, Greg Schnell of Sheboygan County, Emmer Shields of Ashland County, Dean Steingraber of Waupaca County, Tom Toepfer of Bayfield County, Pete Koch of Green County, Paul Woodward of the City of Janesville, David Patek of the City of Oshkosh.
Several individuals consulted with us on individual portions of the paper, engineering assistance was provided by Todd Riebau and Bob Moore of Contech as well as Dr. Eric Booth of the University of Wisconsin-Madison. Dr. Stephanie Januchowski-Hartley, and Drs. Thomas Neeson and Allison Moody of the Wisconsin Center for Limnology provided a review of our methodology. Finally, we would like to thank Dr. David Weimer for his guidance on this project.
iii
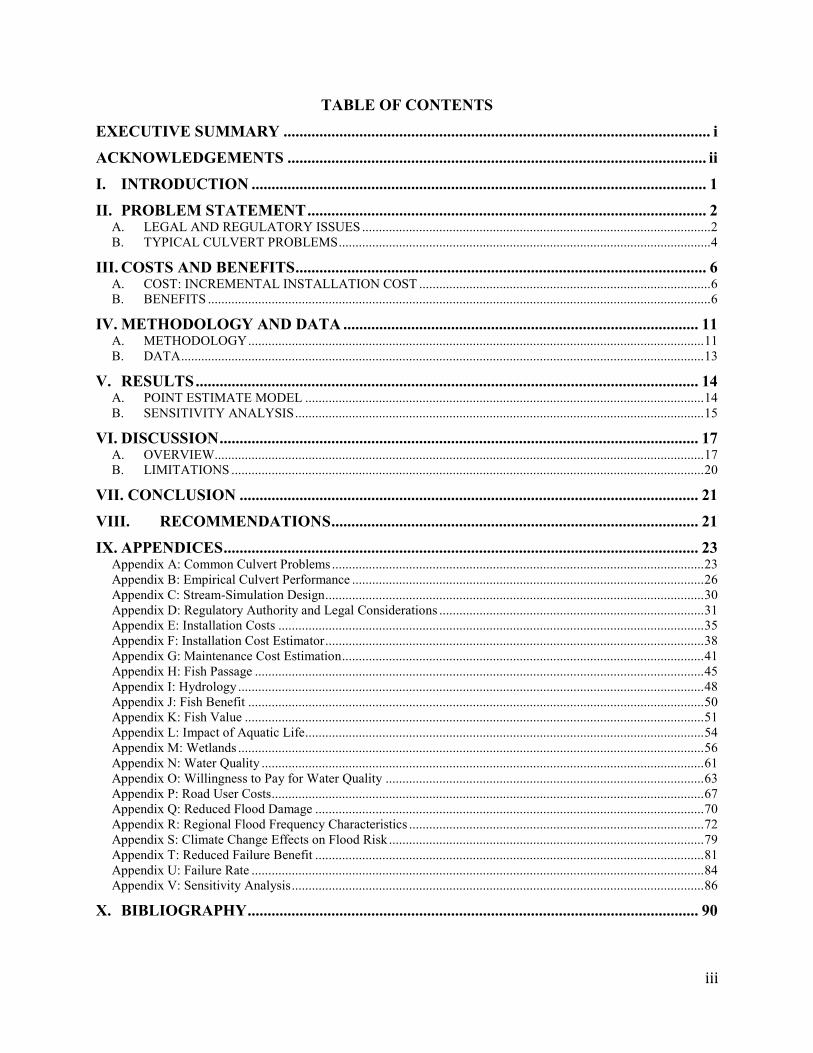
TABLE OF CONTENTS EXECUTIVE SUMMARY ........................................................................................................... i ACKNOWLEDGEMENTS ......................................................................................................... ii I. INTRODUCTION .................................................................................................................. 1
II. PROBLEM STATEMENT .................................................................................................... 2 A. LEGAL AND REGULATORY ISSUES ........................................................................................................ 2 B. TYPICAL CULVERT PROBLEMS ............................................................................................................... 4
III. COSTS AND BENEFITS ....................................................................................................... 6 A. COST: INCREMENTAL INSTALLATION COST ....................................................................................... 6 B. BENEFITS ...................................................................................................................................................... 6
IV. METHODOLOGY AND DATA ......................................................................................... 11 A. METHODOLOGY ........................................................................................................................................ 11 B. DATA ............................................................................................................................................................ 13
V. RESULTS .............................................................................................................................. 14 A. POINT ESTIMATE MODEL ....................................................................................................................... 14 B. SENSITIVITY ANALYSIS .......................................................................................................................... 15
VI. DISCUSSION ........................................................................................................................ 17 A. OVERVIEW.................................................................................................................................................. 17 B. LIMITATIONS ............................................................................................................................................. 20
VII. CONCLUSION ................................................................................................................... 21
VIII. RECOMMENDATIONS ............................................................................................ 21
IX. APPENDICES ....................................................................................................................... 23 Appendix A: Common Culvert Problems ............................................................................................................... 23 Appendix B: Empirical Culvert Performance ......................................................................................................... 26 Appendix C: Stream-Simulation Design ................................................................................................................. 30 Appendix D: Regulatory Authority and Legal Considerations ............................................................................... 31 Appendix E: Installation Costs ............................................................................................................................... 35 Appendix F: Installation Cost Estimator ................................................................................................................. 38 Appendix G: Maintenance Cost Estimation ............................................................................................................ 41 Appendix H: Fish Passage ...................................................................................................................................... 45 Appendix I: Hydrology ........................................................................................................................................... 48 Appendix J: Fish Benefit ........................................................................................................................................ 50 Appendix K: Fish Value ......................................................................................................................................... 51 Appendix L: Impact of Aquatic Life....................................................................................................................... 54 Appendix M: Wetlands ........................................................................................................................................... 56 Appendix N: Water Quality .................................................................................................................................... 61 Appendix O: Willingness to Pay for Water Quality ............................................................................................... 63 Appendix P: Road User Costs ................................................................................................................................. 67 Appendix Q: Reduced Flood Damage .................................................................................................................... 70 Appendix R: Regional Flood Frequency Characteristics ........................................................................................ 72 Appendix S: Climate Change Effects on Flood Risk .............................................................................................. 79 Appendix T: Reduced Failure Benefit .................................................................................................................... 81 Appendix U: Failure Rate ....................................................................................................................................... 84 Appendix V: Sensitivity Analysis ........................................................................................................................... 86
X. BIBLIOGRAPHY ................................................................................................................. 90

Cost-Benefit Analysis of Stream-Simulation Culverts 1
I. INTRODUCTION
Local municipalities often have the responsibility for small-scale infrastructure
construction, maintenance, repair, and replacement in the state of Wisconsin. A common
infrastructure enactment is the culvert, which enables our transportation infrastructure to cross
over streams. Maintaining the stream’s aquatic connectivity and mimicking the stream’s natural
conditions is an important goal. Maintaining the stream’s natural conditions at road-crossings is
increasingly becoming a priority for the Wisconsin Department of Natural Resources (DNR),
which has a broad legal responsibility for maintaining the health of the state’s waterways, as a
means to mitigate the impact of our transportation infrastructure on the health of streams and
riparian habitat in our state.
Healthy streams and riparian habitats provide significant economic, recreational,
environmental, and wildlife benefits. Culverts play a central role in realizing these benefits.
While the WDNR would prefer that municipalities choose to invest in alternative culvert designs
that maintain a stream’s natural conditions, the benefits of these alternatives do not easily or
immediately accrue to the local municipality responsible for any particular culvert. Local
municipalities across Wisconsin, therefore, regularly face difficult decisions involving culverts,
having to decide how to allocate limited, short-term resources for a long-term project. The short-
term costs are certain while the long-term benefits are generally uncertain and not fully
understood or quantified.
The prevailing practice of many municipalities has been to pursue the least-cost option
for culvert installation and replacement. With limited resources and external benefits, it is no
surprise that this short-term perspective often trumps longer-term considerations of alternative
options.

Cost-Benefit Analysis of Stream-Simulation Culverts 2
The alternative option at issue in this report is a culvert design known as “stream-
simulation,” which advances the DNR’s goal of maintaining aquatic connectivity and mimicking
a stream’s natural conditions. This type of culvert requires a higher initial outlay of limited
resources, but it is the preferable design for maintaining aquatic connectivity. Despite the larger
initial upfront costs of installing a stream-simulation-design culvert relative to conventional
culvert designs, there are several benefits associated with replacing problematic conventional
culverts with stream-simulation culverts. These benefits include: reduced maintenance costs,
healthier fish populations, improved water quality, decreased probability of flood-related
damage, reduced wetland impact, increased project lifetime, and reduced road user costs. This
report is intended to help the DNR model and quantify these benefits, so that local municipalities
and other relevant actors are able to more effectively evaluate their options when making a
decision to install or replace a culvert.
We have worked closely with the DNR in developing the methodology and obtaining
data for our analysis. In short, our analysis shows that stream-simulation culverts yield positive
net benefits in the majority of cases, especially for culverts that are located on smaller bankfull
widths and those that are currently exhibiting environmental damages. In addition, we estimate
that the financial benefits of stream-simulation culverts fully offset the higher up-front
installation costs in the majority of cases, resulting in net fiscal benefits for local municipalities.
II. PROBLEM STATEMENT A. LEGAL AND REGULATORY ISSUES
The DNR is the legal authority in Wisconsin responsible for the regulation of culverts in
all “waters of the State.”1 This authority is derived from the legal principle known as the Public
1 Wis. Stat. §281.01(18)
Cost-Benefit Analysis of Stream-Simulation Culverts 3
Trust Doctrine, which asserts state authority over all of Wisconsin’s navigable waters, declaring
them to be “public highways and forever free” in Wisconsin’s constitution.2 This legal obligation
requires that the state legislature empower the DNR with the authority to effectively use limited
resources to carry out this mandate. In addition to this obligation, the DNR must also comply
with relevant federal laws and regulations, most notably the Clean Water Act (CWA).3 These
state and federal laws give the DNR imbued the authority for and responsibility of maintaining
Wisconsin’s navigable waterways. Culvert regulation falls under this responsibility. The DNR’s
legal and regulatory authority and obligations related to culverts and navigable water are
delineated more clearly in Appendix D. This Appendix also discusses the current legal status of
federal regulation of navigable water under the CWA, which has some implications for the
regulation of navigable waters in Wisconsin.
The DNR, however, currently lacks the legal authority to proscribe or prescribe a specific
type of culvert design. Essentially, it cannot require that any entity attempting to obtain a permit
for the construction or replacement of a culvert use a stream-simulation culvert. Individual
permits require only three general statutory conditions that obligate the DNR to approve the
permit application: (1) it must not materially obstruct navigation; (2) it must not materially
reduce the effective flood flow capacity of a stream; and (3) it will not be detrimental to the
public interest.4
Therein lies the problem for the DNR. If the DNR takes the position that stream-
simulation culverts are the preferred design for efficaciously fulfilling its Constitutional and
legislative mandates to maintain the public interest in the waters of the state, it may only do so in
2 Wisconsin State Constitution, Article IX, Section 1. 3 33 U.S.C. §1251 et seq. 4 Wis. Stat. §30.123(8)(c)
Cost-Benefit Analysis of Stream-Simulation Culverts 4
an advisory role. Therefore, this project aims to support DNR in its advisory role with a clear
analysis of the fiscal, ecological, and social net benefits of stream-simulation design relative to
conventional culverts. Wisconsin DNR can use the results of this analysis to convey more clearly
the implications of different culvert designs to county and municipal planners.
B. TYPICAL CULVERT PROBLEMS
There are approximately 62,000 road-stream crossings in Wisconsin, which are locations
where a road crosses over a culvert.5 The stability and failure of culverts can have significant
implications for local communities and the environment. Improperly designed culverts can cause
high maintenance costs, reduced culvert lifespan, road washouts, stream habitat destruction from
sediment deposition, and disruption of fish migration. In the Great Lakes Basin, approximately
19 percent of road-stream crossings pose fish passage barriers.6 In some areas of the state, the
problem is more severe. For example, approximately 77 percent of culverts in the Manitowish
River Headwaters block aquatic passage.7
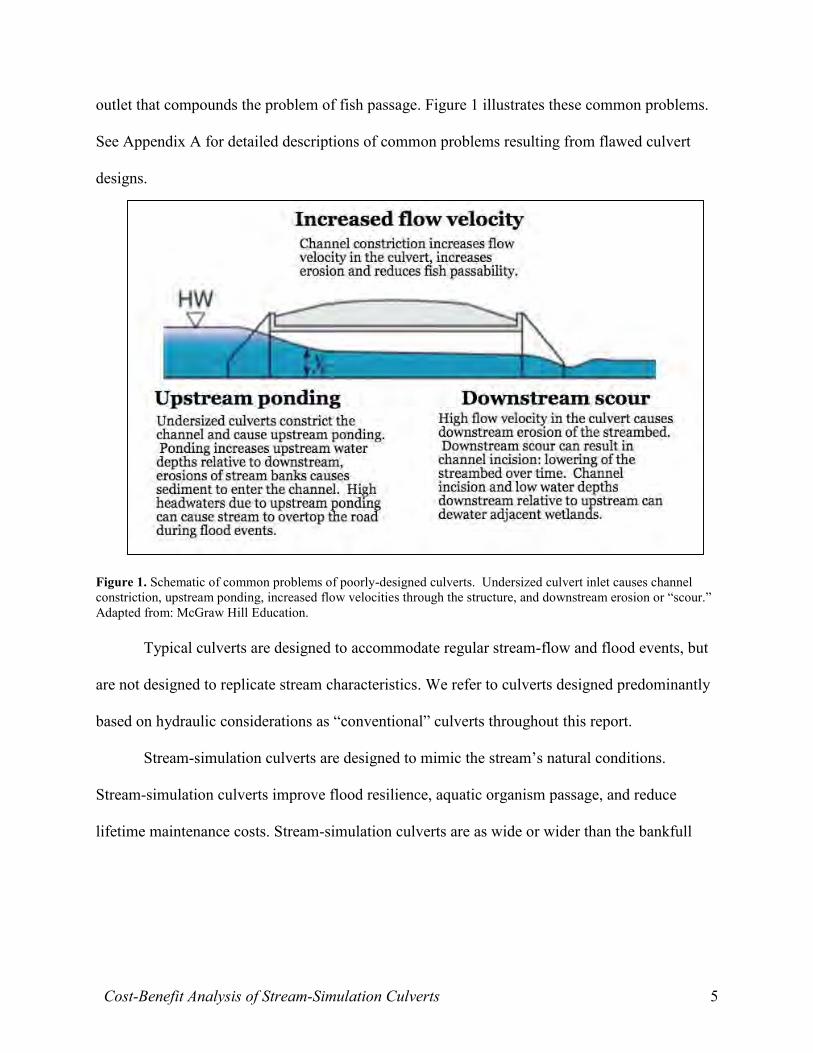
Culverts can cause several problems when the structure does not mimic the
characteristics of the stream, including bankfull width, slope, and depth. Undersized culverts
cause channel constriction at the culvert inlet. Channel constriction can cause water to pond
upstream from the culvert, mobilizing upstream sediment and reducing water quality. Channel
constriction increases flow velocity within the structure, which can pose a barrier to fish passage.
High flow velocities result in high energy at the culvert outlet that can erode or “scour” the
streambed downstream. Downstream scour further contributes to water quality degradation, as
well as dewatering of wetlands and, in some cases, result in an elevation drop at the culvert
5 "DNR Consultation." Personal interview. 16 Sept. 2014. 6 Janichowski Hartley et al., 2013 7 "DNR Consultation." Personal interview. 16 Sept. 2014.
Cost-Benefit Analysis of Stream-Simulation Culverts 5
outlet that compounds the problem of fish passage. Figure 1 illustrates these common problems.
See Appendix A for detailed descriptions of common problems resulting from flawed culvert
designs.
Figure 1. Schematic of common problems of poorly-designed culverts. Undersized culvert inlet causes channel constriction, upstream ponding, increased flow velocities through the structure, and downstream erosion or “scour.” Adapted from: McGraw Hill Education. Typical culverts are designed to accommodate regular stream-flow and flood events, but
are not designed to replicate stream characteristics. We refer to culverts designed predominantly
based on hydraulic considerations as “conventional” culverts throughout this report.
Stream-simulation culverts are designed to mimic the stream’s natural conditions.
Stream-simulation culverts improve flood resilience, aquatic organism passage, and reduce
lifetime maintenance costs. Stream-simulation culverts are as wide or wider than the bankfull
Cost-Benefit Analysis of Stream-Simulation Culverts 6
width of the stream, embedded in the streambed to mimic streambed characteristics in the
structure, and installed at the natural slope gradient of the stream.8
While stream-simulations culverts reduce culvert problems, municipalities typically
install conventional culverts to minimize short-term costs.9 However, the long-term maintenance
and social costs of conventional culverts may make them more costly than stream-simulation
design over their lifetime.10
III. COSTS AND BENEFITS A. COST: INCREMENTAL INSTALLATION COST
Culvert installation costs can range from $2,000 to over $100,000. Installation costs vary
with culvert shape, materials, sizes, hydrological features, and any regulatory directives specified
by the permitting authority (the DNR). Stream-simulation culverts entail higher installation costs
associated with their larger size (FHWA, 2012). We estimate installation costs as a function of
culvert width, bankfull width, road fill depth, culvert length, road width, and road surface with a
DNR cost estimation tool. The incremental installation cost of a stream-simulation culvert is the
difference in estimated installation costs result from increased culvert width. Appendix F
explains the DNR cost estimator in detail. Appendix E explores the validity of the DNR cost
estimator.
B. BENEFITS 1. Fiscal Benefits
a. Improved Lifetime The service life of a culvert varies with material, structural design, and hydrological
conditions at the road-stream crossing. The two primary hydrological determinants of service life
8 "Stream-simulation: An Ecological Approach to Providing Passage for Aquatic Organisms at Road-Stream
Crossings." National Technology and Development Program. United States Department of Agriculture: US Forest Service, May 2008: p. xvii.
9 USFS. Cost Estimating Guide for Road Construction: p. 108. 10 Gilespie et al., 2014.

Cost-Benefit Analysis of Stream-Simulation Culverts 7
are abrasion and corrosion. Abrasion is defined as the erosion of the culvert due to the movement
of sediment through the structure. Corrosion results, in part, from low pH levels in streams
(FHWA, 2012). In turn, abrasion and corrosion are functions of the size, shape, and slope of a
culvert, the pH level of the stream, and the size of sediments that pass through the structure
(FHWA, 2000). Stream-simulation culverts improve the passage of sediment through the
structure and reduce abrasion.
Typical service lifetimes for conventional metallic culverts range from 25 to 50 years,
while stream-simulation designs can achieve lifetimes of 50 to 75 years (Gillespie et al., 2014).
We assume a lifetime of 35 years for conventional culverts and 70 years for stream-simulation
culverts. As a result, we compare lifetime costs between conventional and stream-simulation
culverts over a 70-year timeframe, with conventional culverts incurring a second replacement
cost in year 35.
b. Benefit: Reduced Maintenance Costs
Undersized culverts can require frequent maintenance because of the accumulation of
debris and erosion of the structure. Stream-simulation culverts reduce maintenance requirements
by improving the passage of sediments through the structure and reducing abrasion.
We use data from a case study of Green Bay watershed culverts to estimate a relationship
between culvert size and maintenance requirements. We use maintenance cost estimates to
calculate annual expected values of maintenance throughout the culvert lifetime. The benefit
from reduced maintenance cost is the difference in lifetime maintenance costs between a stream-
simulation and a conventional culvert. Appendix G explains our maintenance cost methodology.
Cost-Benefit Analysis of Stream-Simulation Culverts 8
c. Reduced Catastrophic Failure Costs
Catastrophic culvert failure resulting from abrasion and corrosion can shorten the service
life of a culvert. The economic costs of catastrophic culvert failure include the replacement of the
structure at emergency hourly rates of both human resources and equipment use, road damages,
and road user delays (Gillespie et al., 2014; Perrin & Jhaveri, 2004). Stream-simulation design
reduces the probability of culvert failure through decreased exposure to abrasion and corrosion
and improved flood resilience.
We use a Weibull distribution failure rate to estimate the probability of catastrophic
culvert failure during a flood event. We estimate catastrophic culvert failure costs as the sum of
culvert replacement at emergency rates, road damages, and road user delays. The benefit of
reduced culvert failure is the difference in lifetime expected values of culvert failure between
conventional culverts and stream-simulation culverts. Appendix T explains our catastrophic
culvert failure benefit methodology.
d. Decreased Flood-Related Physical Costs
Stream-simulation culverts allow water to flow properly within the streambed during
intense storms. This reduces the probability of flood-related damages such as a road washout.
We estimate the probability of a 24-hour precipitation exceeding the benchmark capacity of the
stream using regression analysis of data from five geological regions in Wisconsin. We also
estimate dollars per cleanup and reconstruction to estimate the physical costs of a road washout.
To estimate expected values, we multiply the probability of a washout occurring by the cost of
fixing a road for both conventional and stream-simulation culverts. The difference between these
two estimates is the annual expected benefit of decreasing flood-related physical costs. For a
more detailed description of methodology, see Appendix Q.

Cost-Benefit Analysis of Stream-Simulation Culverts 9
2. Ecological and Social Benefits
a. Wetland Restoration Benefits
Culverts impact riparian habitats such as wetlands through channel constriction and
downstream degradation (Mensing et al., 1998). Downstream scour, which alters the stream
depth and width, from an undersized culvert can cause channel incision and dewater adjacent
wetlands. Channels with wetlands are particularly vulnerable to the habitat impacts of channel
degradation (Bates et al., 2003).
Public expenditures to restore degraded wetlands represent a valuation of wetland
resources. We employ a wetland restoration cost estimate of $128,000 per acre for forested
wetlands and make downward adjustments based on forest cover and wetland acreage in specific
watersheds.
Stream-simulation culverts reduce or eliminate channel constriction and degradation. The
replacement of an undersized culvert with a properly sized structure can result in the restoration
of stream connectivity and improve the environmental quality of riparian habitats (O’Hanley,
2011). We assume that stream-simulation culverts result in the restoration of degraded wetlands
and an accrual of benefits equal to the avoided restoration cost of the degraded wetlands.
Appendix M explains our wetland restoration benefit methodology.
b. Increased Fish Passage
Stream-simulation culverts mimic the natural stream characteristics, including velocity,
and thus avoid the barrier effect seen in many conventional culverts. More fish are able to pass
through stream-simulation culverts allowing for effective migration. This avoids habitat
fragmentation, which typically results in drastic decreases in fish population and genetic
diversity. Maintaining aquatic connectivity also has a variety of benefits for the stream
Cost-Benefit Analysis of Stream-Simulation Culverts 10
ecosystem. To quantify the benefits of maintaining aquatic connectivity and mimic the stream’s
natural conditions, we analyzed the impact of stream-simulation culverts on eleven different fish.
The true population of these species is currently unknown and would require significant
time and effort to determine. Thankfully, the DNR has provided us with data on fish prevalence
in every stream in Oconto and Brown County using a fish/mile catch methodology. From this
data, trout appeared to be an outlier that would skew our benefit estimates. Trout are not found in
every stream, thus we modified our methodology for trout. For the trout species, we took the
average of the bottom quartile to get a conservative estimate of trout. If a culvert is in a trout
habitat, then there will be significantly higher benefits if a stream-simulation culvert is installed.
To move from our sample to a population estimate, we doubled our catch/mile rate. To monetize
these benefits we determined the value of fish by consulting private fish hatcheries for the
purchase cost of various fish species (see Appendix K for a full list of prices and hatcheries). We
then applied the fish passability methodology employed in Januchowski et al. (2013) to
determine what fish could pass through each culvert. Finally, we used data from the DNR on the
density of specific fish in Northeastern Wisconsin streams. Benefits for each fish species was
summed to get total benefits from fish passage.
c. Improved Water Quality
Culverts that are narrower than the natural bankfull width result in channel constriction.
Channel constriction can cause water to pool upstream from the culvert as well as cause erosion
downstream by increasing the flow velocity coming from the outlet. Both problems caused by
channel constriction degrade water quality. Stream-simulation culverts reduce or eliminate
channel constriction and therefore improve water quality. The benefits of water quality include
recreation, withdrawal, future use, as well as intrinsic and aesthetic value. To estimate this
Cost-Benefit Analysis of Stream-Simulation Culverts 11
benefit, we used the average WTP for improvements in water quality inland from the Green Bay
(Moore et. al., 2011). We then apply this value to an individual culvert replacement scenario
using county population data. For a more detailed description of this benefit and its
methodology, see Appendix O.
d. Reduced Road User Costs
Steam simulation culverts not only provide direct benefits by reducing the frequency of
culvert damage and flooding, but the secondary benefit of the reduction of costs borne by the
road user. Every time a road is closed from flooding or road repairs caused by a failed culvert,
the drivers who use the road bare a cost of increased travel time. The difference in cost between
the two culvert designs for a single culvert outage was estimated using an estimation of value of
driver time per vehicle - hour, the average delay they face from road construction, the number of
vehicles that will be effected per delay, and the number of days the repairs will take, which
averaged out over personal and business travel is about $400 per culvert. For a more detailed
description of the methodology and discussion of assumption, see Appendix P.
IV. METHODOLOGY AND DATA A. METHODOLOGY
We estimate the net benefits of replacing an undersized conventional culvert with a
stream-simulation design. For the purposes of our analysis, a stream-simulation culvert has the
following dimensions based on the slope gradient of a stream:
Slope gradient less than one percent: Culvert width equals bankfull width
Slope gradient greater than one percent: Culvert width equals 1.2 times bankfull width
Cost-Benefit Analysis of Stream-Simulation Culverts 12
The required dimensions are based on Wisconsin DNR guidance under the General Permit.11
See Appendix C for more information of stream-simulation design.
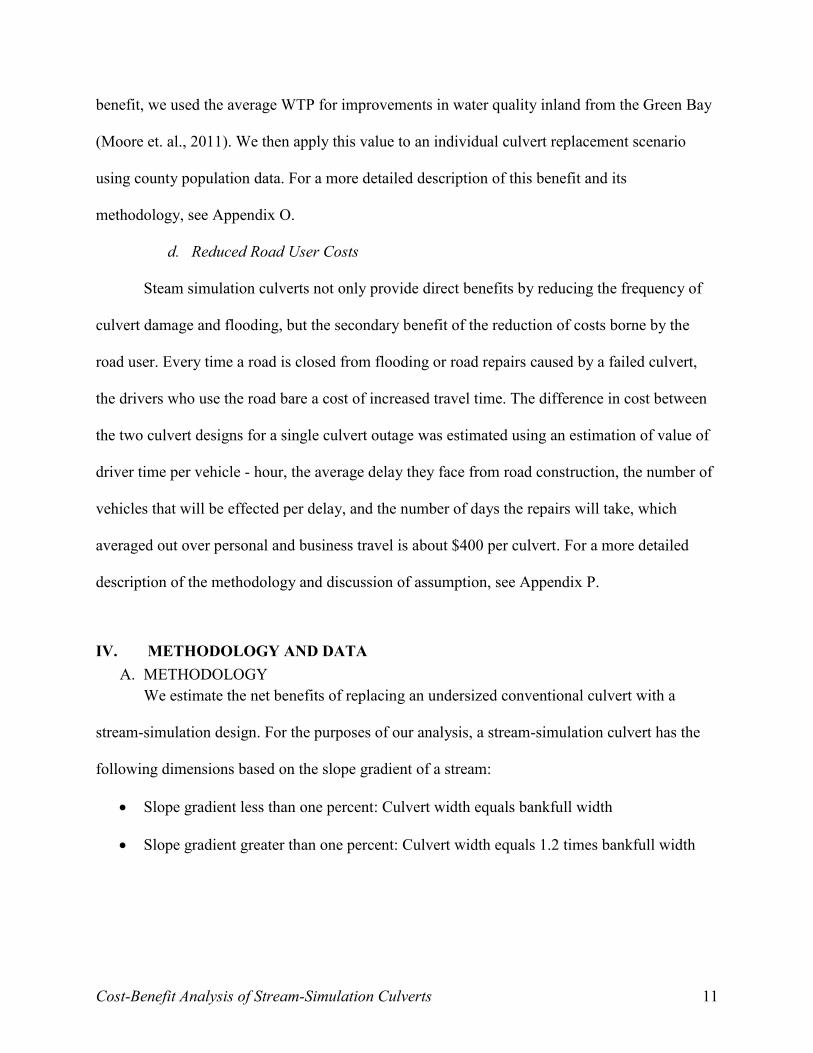
We estimate the net benefits of stream-simulation culverts as the difference in lifetime fiscal, social, and ecological costs between a stream-simulation culvert and a conventional culvert. Lifetime costs are the sum of one-time and annual costs:
Summary of Costs One-time costs Annual costs
Replacement cost
Wetland impacts
Water quality impacts
Maintenance
Fish passage impacts
Flood damages
Catastrophic failure
Road user costs
Figure 2. Summary of costs included in our analysis.
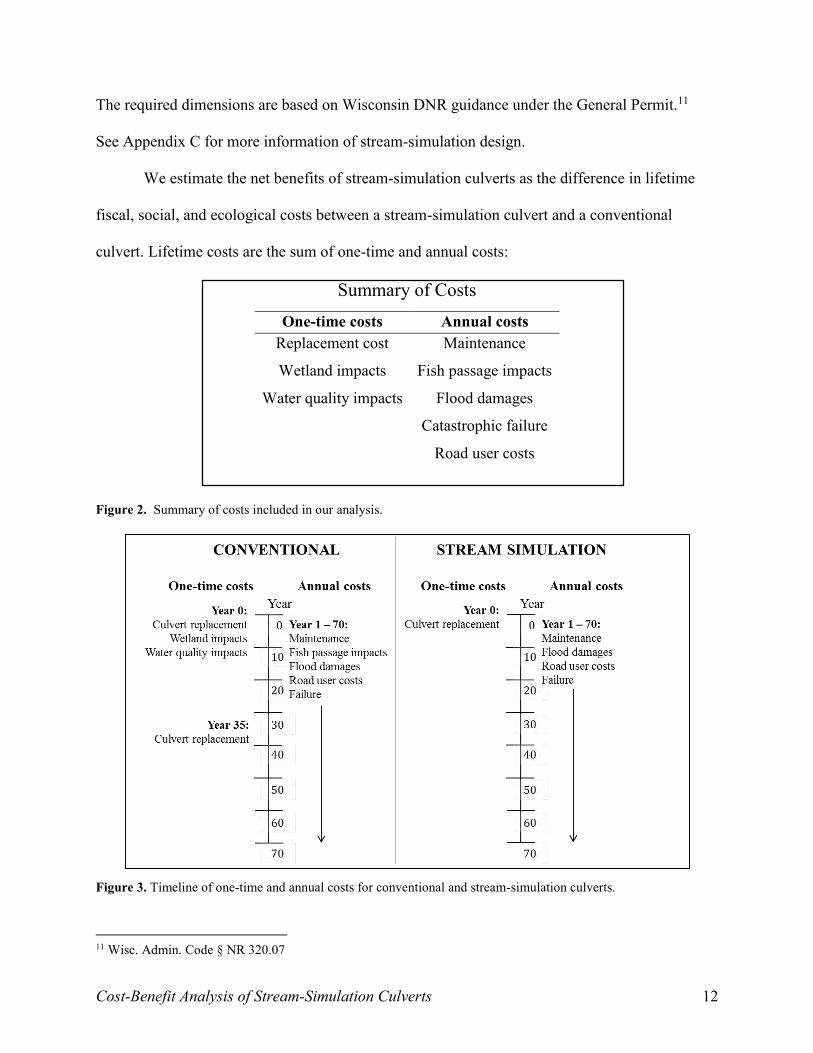
Figure 3. Timeline of one-time and annual costs for conventional and stream-simulation culverts.
11 Wisc. Admin. Code § NR 320.07

Cost-Benefit Analysis of Stream-Simulation Culverts 13
Total lifetime costs are the sum of one-time and annual costs. We use a discount rate of
3.5 percent to discount future costs. We discount annual costs at mid-year to reflect the accrual
of costs throughout the year:
𝑡𝑜𝑡𝑎𝑙 𝑙𝑖𝑓𝑒𝑡𝑖𝑚𝑒 𝑐𝑜𝑠𝑡𝑠 = 𝑜𝑛𝑒 − 𝑡𝑖𝑚𝑒 𝑐𝑜𝑠𝑡𝑠 + ∑𝑎𝑛𝑛𝑢𝑎𝑙 𝑐𝑜𝑠𝑡𝑠
1.035𝑡−0.5
70
𝑡=1
The net benefit of a replacement with a stream-simulation culvert rather than a
conventional culvert is the difference in total lifetime costs (LC) between a stream-simulation
culvert and a conventional culvert:
𝑛𝑒𝑡 𝑏𝑒𝑛𝑒𝑓𝑖𝑡(𝑠𝑡𝑟𝑒𝑎𝑚 𝑠𝑖𝑚𝑢𝑙𝑎𝑡𝑖𝑜𝑛) = 𝐿𝐶𝑐𝑜𝑛𝑣𝑒𝑛𝑡𝑖𝑜𝑛𝑎𝑙 − 𝐿𝐶𝑠𝑡𝑟𝑒𝑎𝑚 𝑠𝑖𝑚
B. DATA
We apply our methodology to a dataset of road-stream crossings over Green Bay
tributaries. The dataset includes information on 1,615 culverts in seven counties in Wisconsin
and three counties in Michigan.
We exclude culverts that currently meet the stream-simulation dimensional criteria from
our analysis (516 of 1,615 culvert in the Green Bay dataset). Based on Wisconsin DNR
guidance, we exclude culverts on streams wider than 20 feet from our analysis because wide
road-stream crossings typically qualify for federal bridge aid and are therefore treated differently
than locally funded culverts (30 of 1,615 culverts). Lastly, we exclude culverts with insufficient
data to apply the Wisconsin DNR cost estimator. Therefore, we estimate net benefits for the
remaining 495 culverts from the Green Bay dataset.
Cost-Benefit Analysis of Stream-Simulation Culverts 14
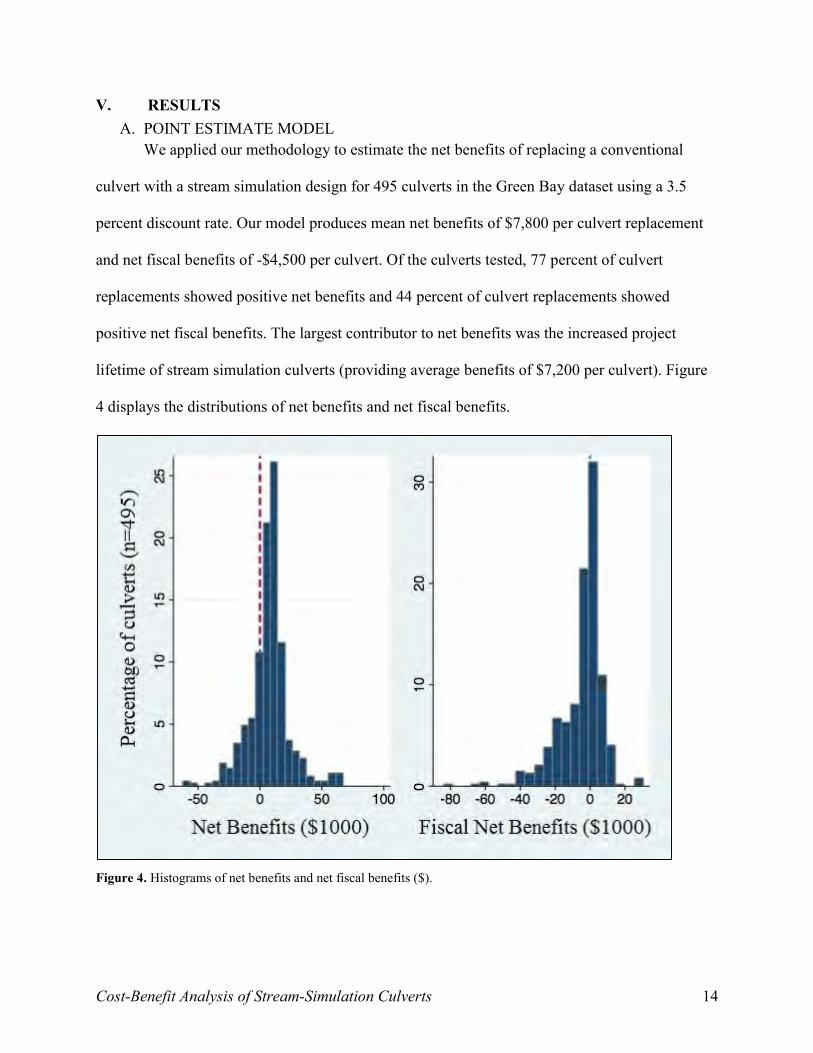
V. RESULTS A. POINT ESTIMATE MODEL
We applied our methodology to estimate the net benefits of replacing a conventional
culvert with a stream simulation design for 495 culverts in the Green Bay dataset using a 3.5
percent discount rate. Our model produces mean net benefits of $7,800 per culvert replacement
and net fiscal benefits of -$4,500 per culvert. Of the culverts tested, 77 percent of culvert
replacements showed positive net benefits and 44 percent of culvert replacements showed
positive net fiscal benefits. The largest contributor to net benefits was the increased project
lifetime of stream simulation culverts (providing average benefits of $7,200 per culvert). Figure
4 displays the distributions of net benefits and net fiscal benefits.
Figure 4. Histograms of net benefits and net fiscal benefits ($).

Cost-Benefit Analysis of Stream-Simulation Culverts 15
For more information on net benefits from individual benefit categories see Table 1.
Table 1. Net Benefits by Category (3.5% Discount Rate)
Category
Point Estimate of Benefit
($)
Standard Deviation ($)
Increased Project Lifetime 7,200 4,900 Reduced Wetland Impact 5,600 3,600 Increased Fish Passage 3,200 10,000 Reduced Road User Cost 2,000 1,300 Reduced Maintenance Cost 1,900 700 Reduced Flood Damages 1,700 1,100 Reduced failure rate 1,500 900 Improved Water Quality 1,300 2,900 Incremental Installation Cost -16,600 14,600 Net Benefits 7,800 16,500
To analyze the robustness of our results, we repeated our analysis using a seven percent
discount rate. The larger discount rate reduces the impacts of future benefits and reduces net
benefits to -$1,800 per culvert, and net fiscal benefits to -$11,900. Under a seven percent
discount rate, 55 percent of culvert replacements yield positive net benefits.
B. SENSITIVITY ANALYSIS
In addition to the point estimate, we performed a Monte Carlo analysis to address
parameter uncertainty. We performed 500 iterations per culvert allowing uncertain parameters to
vary according to specified distributions. We then took average values for each culvert, so that
our analysis consists of 495 data points each representing 500 iterations. See Appendix V for a
complete description of the Monte Carlo analysis.
Cost-Benefit Analysis of Stream-Simulation Culverts 16
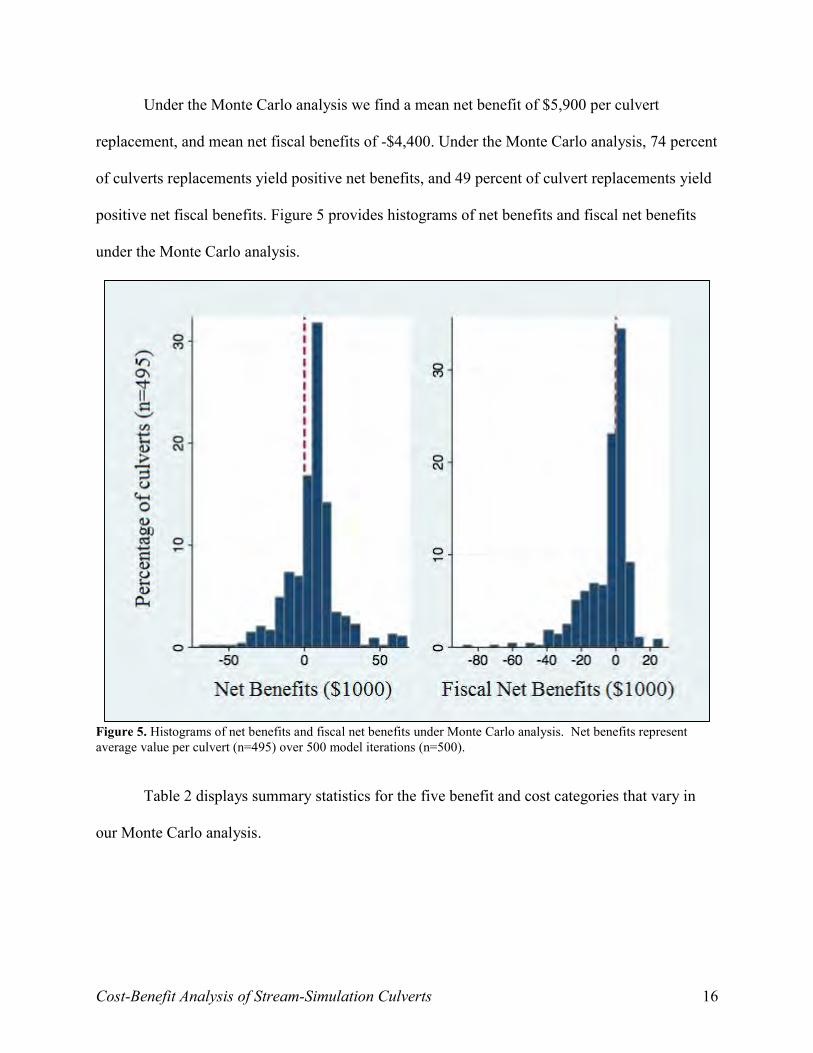
Under the Monte Carlo analysis we find a mean net benefit of $5,900 per culvert
replacement, and mean net fiscal benefits of -$4,400. Under the Monte Carlo analysis, 74 percent
of culverts replacements yield positive net benefits, and 49 percent of culvert replacements yield
positive net fiscal benefits. Figure 5 provides histograms of net benefits and fiscal net benefits
under the Monte Carlo analysis.
Figure 5. Histograms of net benefits and fiscal net benefits under Monte Carlo analysis. Net benefits represent average value per culvert (n=495) over 500 model iterations (n=500).
Table 2 displays summary statistics for the five benefit and cost categories that vary in
our Monte Carlo analysis.

Cost-Benefit Analysis of Stream-Simulation Culverts 17
Table 2. Net Benefits under Monte Carlo Analysis 495 culverts, 500 iterations
(Dollars)
Variable Average Monte Carlo Estimate ($) Standard Deviation ($)
Increased project lifetime 6,800 4,700 Fish passage benefit 3,400 10,500 Reduced flood damages 2,600 80 Reduced maintenance costs 1,900 700 Incremental replacement cost -17,100 15,000
Table 2 shows that the increased project lifetime benefit remains the most significant
benefit in our analysis. The other categories are roughly similar to the results of the point
estimate model. Table 2 also shows that the incremental replacement cost under the Monte Carlo
analysis is slightly higher than our point estimate. As a result, fewer culvert replacements
achieve positive net benefits under the Monte Carlo analysis.
The Monte Carlo analysis generally suggests our results for benefits are robust under a
range of reasonable assumptions. The Monte Carlo analysis illustrates that assumptions about the
incremental replacement cost significantly determine the proportion of net benefits in our
analysis.
VI. DISCUSSION
A. OVERVIEW
We believe that the results of our cost-benefit analysis (CBA) will be useful to DNR and
informative to the municipalities that they advise. Our results lend support to the empirical claim
that stream-simulation culverts recoup the higher initial investment over the culvert’s lifetime.
Using a CBA method instead of a more typical financial analysis shows the ecological and
social, along with financial, benefits that municipalities can use to inform decisions about culvert
design.
Cost-Benefit Analysis of Stream-Simulation Culverts 18
In general, we find that the single largest determinant of net benefits is the bankfull width
of the stream. In our dataset of 495 culverts, larger bankfull width streams are associated with
lower constriction ratios. As a result, culverts on large bankfull width streams incur high
incremental installation costs in order to upgrade from an undersized culvert to a much larger
stream-simulation culvert. The model shows larger positive net social and fiscal benefits for
culvert replacements on smaller streams. Figure 4 illustrates the negative relationship between
bankfull width and net benefits.
Other significant determinants of net benefits include the presence of a scour pool at the
existing culvert, the presence of wetlands in the watershed of the culvert, and whether the
existing culvert poses a fish passage barrier. We performed an ordinary least squares (OLS)
linear regression to quantify the relationship between these determinants and net benefits in our
model. Table 3 summarizes the results of the regression.
Table 3. Relationship of Stream and Culvert
Characteristics to Net Benefits
Variable Coefficient Standard error Bankfull width -2,670 197 Scour pool 4,702 1,321 Fish passage barrier 12,164 5,599 Wetland acreage 153 25 Constant 18,100 1,620 R2 = 0.25 N = 495
Table 3 suggests that an increase of one foot of bankfull width is associated with a $2,670
reduction in net benefits. The elimination of a scour pool through culvert replacement is
associated with a $4,702 increase in net benefits. The elimination of a fish passage barrier is
associated with a $12,164 increase in net benefits. Last, the statistically significant coefficient on
Cost-Benefit Analysis of Stream-Simulation Culverts 19
wetland acreage indicates that culvert replacements in wetland areas are associated with larger
net benefits.
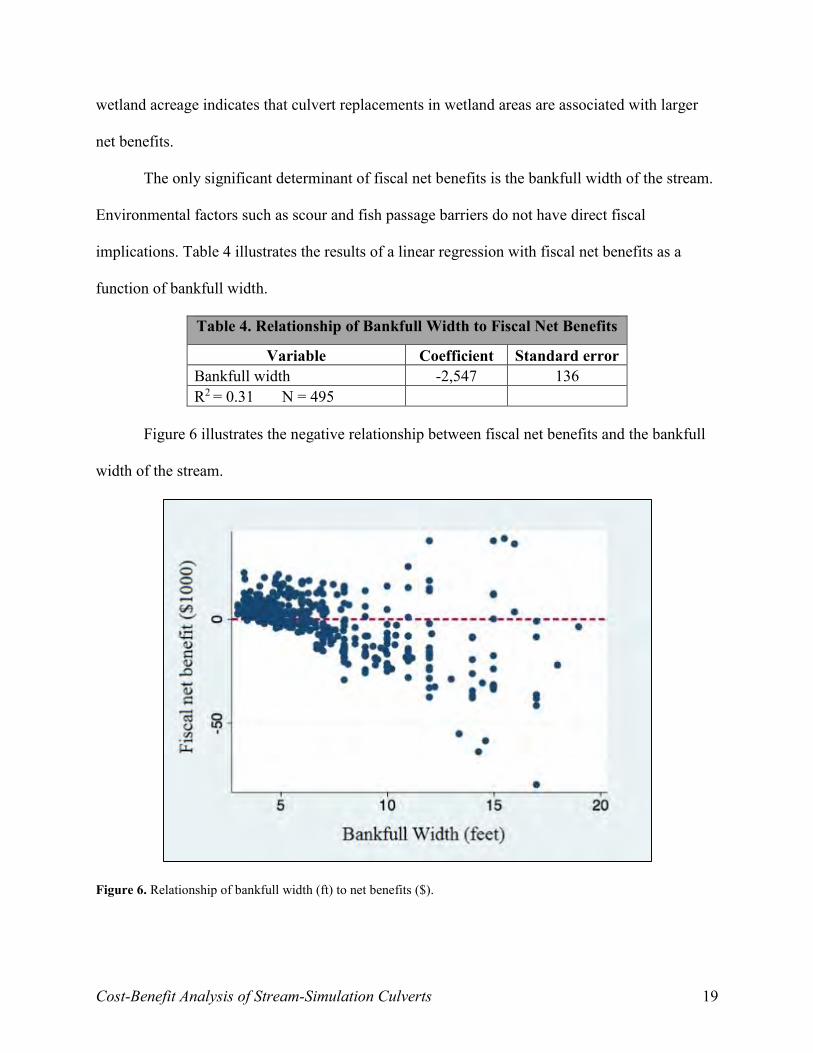
The only significant determinant of fiscal net benefits is the bankfull width of the stream.
Environmental factors such as scour and fish passage barriers do not have direct fiscal
implications. Table 4 illustrates the results of a linear regression with fiscal net benefits as a
function of bankfull width.
Table 4. Relationship of Bankfull Width to Fiscal Net Benefits
Variable Coefficient Standard error Bankfull width -2,547 136 R2 = 0.31 N = 495
Figure 6 illustrates the negative relationship between fiscal net benefits and the bankfull
width of the stream.
Figure 6. Relationship of bankfull width (ft) to net benefits ($).
Cost-Benefit Analysis of Stream-Simulation Culverts 20
B. LIMITATIONS
The applicability of our results are limited by the underlying assumptions of our model.
We make broad assumptions about culvert performance over 35 and 70 year lifetimes based on
culvert size and stream characteristics. Throughout the analysis we remained cognizant of the
site-specific nature of culvert performance and attempted to develop a model capable of
replicating the nuances of actual culverts.
The validity of our analysis is limited by data availability. In particular, we had to make
uncertain assumptions about maintenance costs in response to debris accumulation and flood
damages. We surveyed 72 Wisconsin counties and utilized the data collection to make informed
assumptions about lifetime culvert maintenance.
Finally, we developed our model based on a case study of culverts in Green Bay
watersheds. We believe that the size of the Green Bay dataset and the physical similarity
between Green Bay watersheds and the majority of streams throughout Wisconsin make our
results broadly applicable to culvert replacements in the state of Wisconsin. Further, due to
limited data, we made a conservative assumption that most culverts are located at road-stream
crossings with a stream gradient greater than one percent, and therefore require a larger-width
replacement. This assumption under-estimates fiscal net benefits in the Green Bay dataset due to
the larger estimated incremental replacement cost associated with the larger culvert size,
however the assumptions makes the estimate more representative of culverts throughout
Wisconsin (where slope gradients are typically greater). Nonetheless, the external validity of our
model’s results may be weaker in geologically dissimilar areas of Wisconsin such as the driftless
area.
Cost-Benefit Analysis of Stream-Simulation Culverts 21
VII. CONCLUSION
We performed a cost-benefit analysis of culvert replacement with stream-simulation
designs on behalf of the Wisconsin DNR. We developed a methodology that models lifetime
culvert costs based on culvert and stream characteristics. We applied our methodology to a case
study of 495 culverts in the Green Bay area. We find that culvert replacement with stream-
simulation design yields positive net benefits in the majority of circumstances. We find that
culvert replacement with stream-simulation design yields larger net benefits where the existing
culvert results in measurable environmental damages such as downstream scour, fish passage
barriers, and wetland impacts.
VIII. RECOMMENDATIONS
RECOMMENDATION #1: Implement Stream-simulation to Mitigate Environmental Impacts
We recommend that the Wisconsin DNR prioritize the implementation of stream-
simulation culverts based on the measurable environmental impacts of existing culverts. Our
model demonstrates that the replacement of culverts that currently pose fish passage barriers,
exhibit downstream scour, or impact wetlands yields benefits that fully offset the high up-front
incremental installation costs of stream-simulation culverts.
RECOMMENDATION #2: Emphasize Long-term Benefits of Stream-simulation design
We recommend that the Wisconsin DNR use our results to demonstrate the relative long-
term net benefits of stream-simulation culverts to county and local transportation planners. Our
model indicates that the benefits of stream-simulation culverts reduce lifetime maintenance costs
of an average culvert by $1,900, reduce expected lifetime flood repair costs of an average culvert
by $1,700, and reduce the expected value of culvert failure costs by $1,500. Our model estimates

Cost-Benefit Analysis of Stream-Simulation Culverts 22
that the lifetime fiscal savings of a stream-simulation culvert completely offset the higher up-
front incremental installation cost in 44 percent of cases. Positive fiscal net benefits are more
likely on narrower streams. Our results provide DNR with justification to advise local
municipalities to consider stream-simulation as a financially viable alternative to conventional
culvert designs.
RECOMMENDATION #3: Collect More Culvert Maintenance Data
We highly recommend that the Wisconsin DNR collect data on culvert maintenance
costs. Although the replacement of small culverts theoretically results in large net benefits due to
reduced maintenance, improved flood resilience, and improved stream connectivity, there is little
available evidence to support the claim that the replacement of undersized culverts with large
stream-simulation culverts fully offsets the considerable incremental installation costs of stream-
simulation design.
Cost-Benefit Analysis of Stream-Simulation Culverts 23
IX. APPENDICES Appendix A: Common Culvert Problems
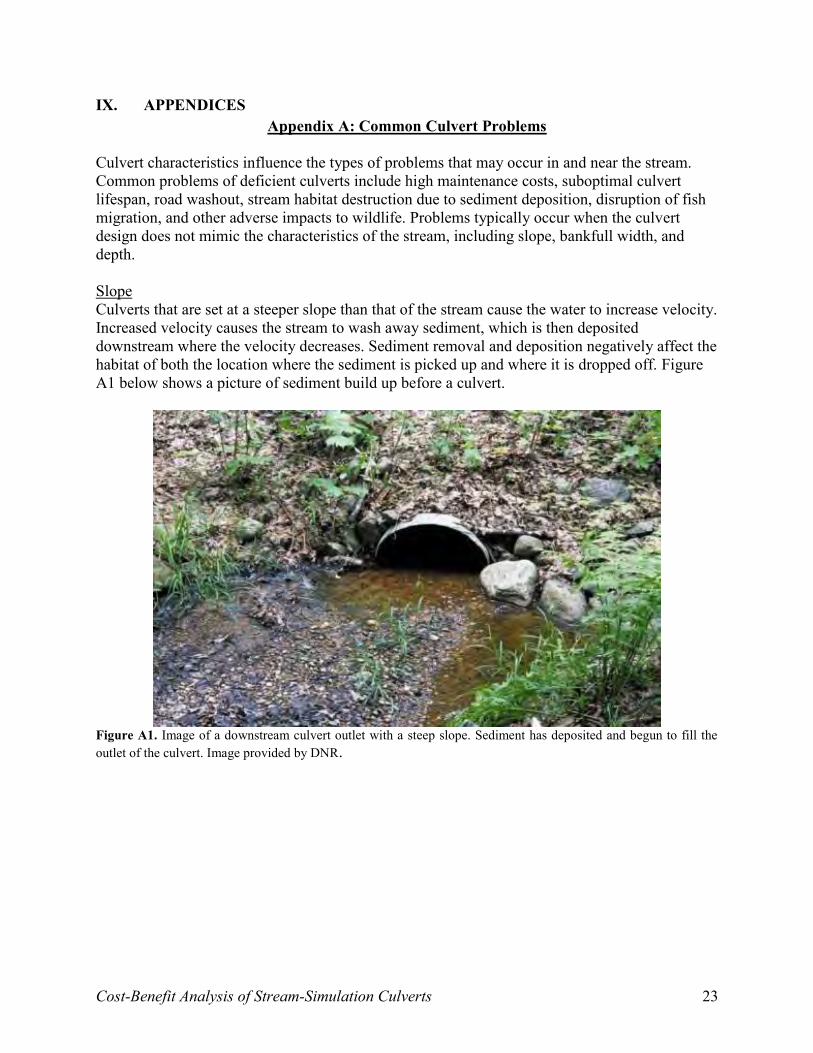
Culvert characteristics influence the types of problems that may occur in and near the stream. Common problems of deficient culverts include high maintenance costs, suboptimal culvert lifespan, road washout, stream habitat destruction due to sediment deposition, disruption of fish migration, and other adverse impacts to wildlife. Problems typically occur when the culvert design does not mimic the characteristics of the stream, including slope, bankfull width, and depth. Slope Culverts that are set at a steeper slope than that of the stream cause the water to increase velocity. Increased velocity causes the stream to wash away sediment, which is then deposited downstream where the velocity decreases. Sediment removal and deposition negatively affect the habitat of both the location where the sediment is picked up and where it is dropped off. Figure A1 below shows a picture of sediment build up before a culvert.
Figure A1. Image of a downstream culvert outlet with a steep slope. Sediment has deposited and begun to fill the outlet of the culvert. Image provided by DNR.
Cost-Benefit Analysis of Stream-Simulation Culverts 24
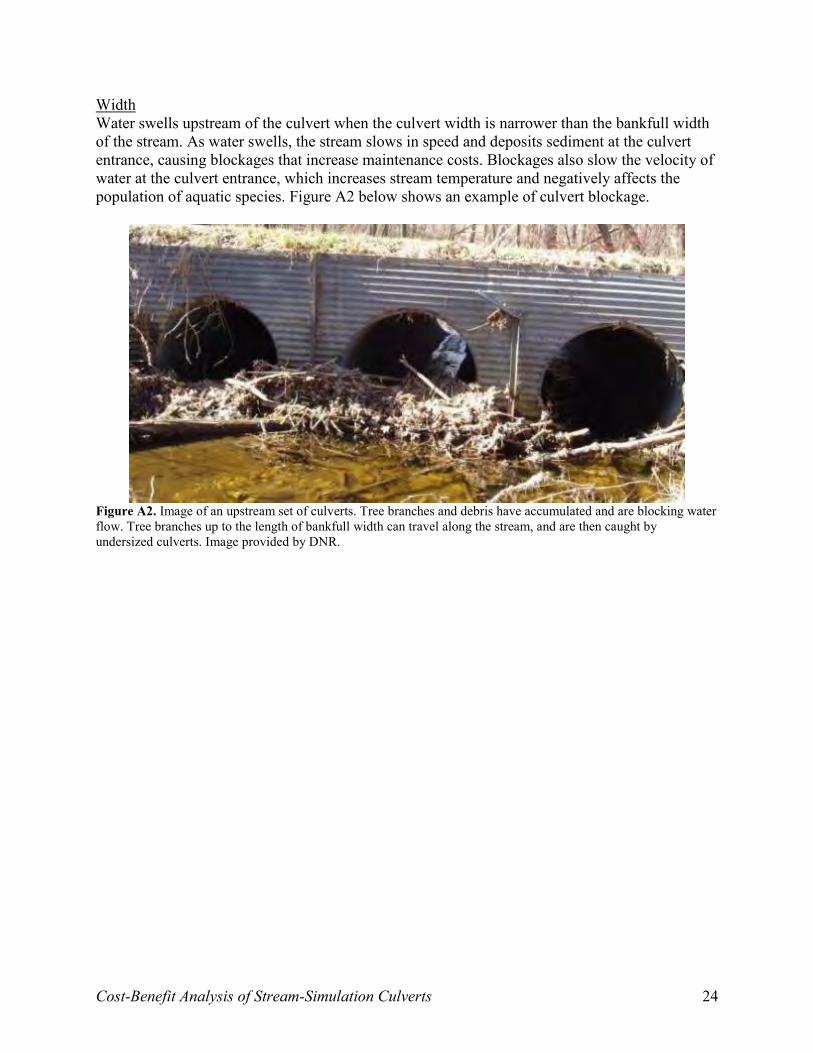
Width Water swells upstream of the culvert when the culvert width is narrower than the bankfull width of the stream. As water swells, the stream slows in speed and deposits sediment at the culvert entrance, causing blockages that increase maintenance costs. Blockages also slow the velocity of water at the culvert entrance, which increases stream temperature and negatively affects the population of aquatic species. Figure A2 below shows an example of culvert blockage.
Figure A2. Image of an upstream set of culverts. Tree branches and debris have accumulated and are blocking water flow. Tree branches up to the length of bankfull width can travel along the stream, and are then caught by undersized culverts. Image provided by DNR.
Cost-Benefit Analysis of Stream-Simulation Culverts 25
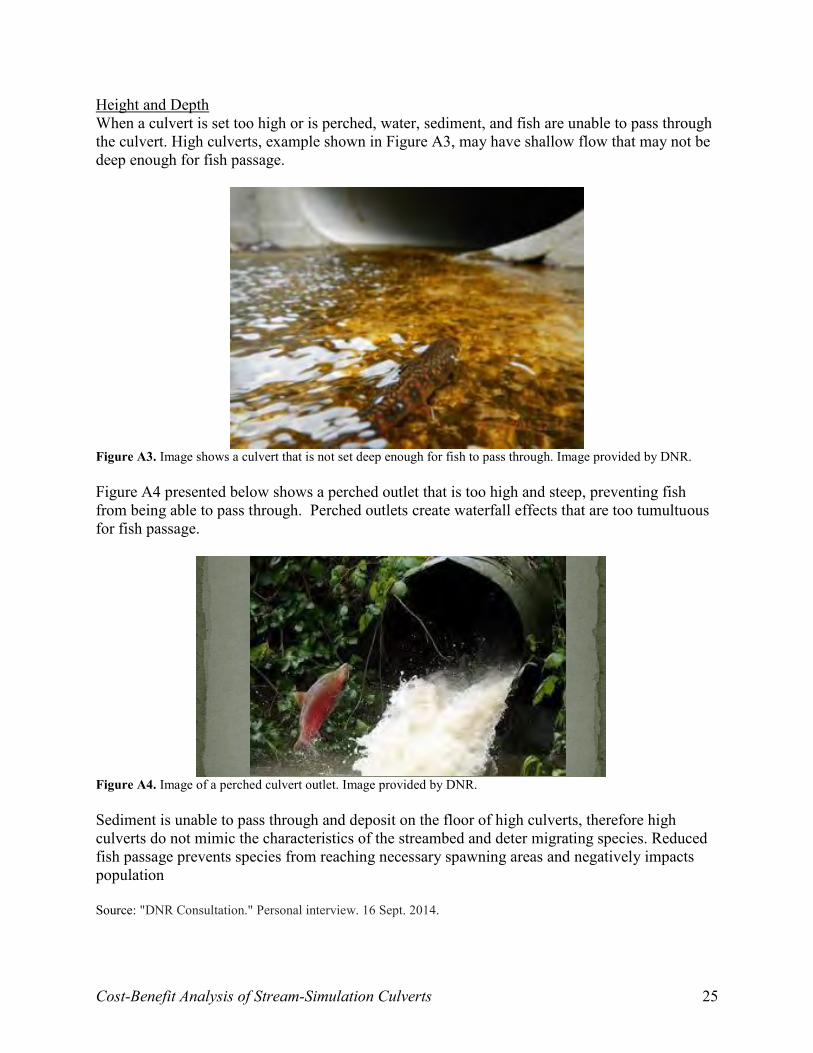
Height and Depth When a culvert is set too high or is perched, water, sediment, and fish are unable to pass through the culvert. High culverts, example shown in Figure A3, may have shallow flow that may not be deep enough for fish passage.
Figure A3. Image shows a culvert that is not set deep enough for fish to pass through. Image provided by DNR.
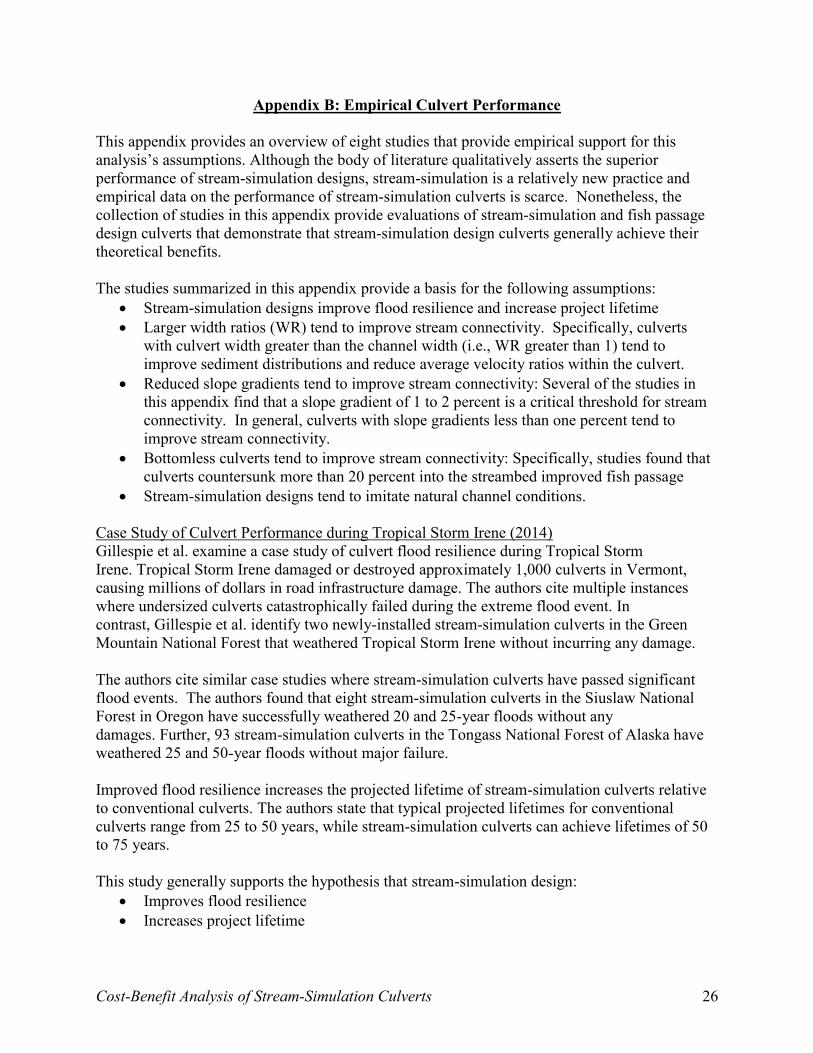
Figure A4 presented below shows a perched outlet that is too high and steep, preventing fish from being able to pass through. Perched outlets create waterfall effects that are too tumultuous for fish passage.
Figure A4. Image of a perched culvert outlet. Image provided by DNR.
Sediment is unable to pass through and deposit on the floor of high culverts, therefore high culverts do not mimic the characteristics of the streambed and deter migrating species. Reduced fish passage prevents species from reaching necessary spawning areas and negatively impacts population Source: "DNR Consultation." Personal interview. 16 Sept. 2014.
11
Perched Outlets
One – way biological check valves
Cost-Benefit Analysis of Stream-Simulation Culverts 26
Appendix B: Empirical Culvert Performance This appendix provides an overview of eight studies that provide empirical support for this analysis’s assumptions. Although the body of literature qualitatively asserts the superior performance of stream-simulation designs, stream-simulation is a relatively new practice and empirical data on the performance of stream-simulation culverts is scarce. Nonetheless, the collection of studies in this appendix provide evaluations of stream-simulation and fish passage design culverts that demonstrate that stream-simulation design culverts generally achieve their theoretical benefits. The studies summarized in this appendix provide a basis for the following assumptions:
Stream-simulation designs improve flood resilience and increase project lifetime Larger width ratios (WR) tend to improve stream connectivity. Specifically, culverts
with culvert width greater than the channel width (i.e., WR greater than 1) tend to improve sediment distributions and reduce average velocity ratios within the culvert.
Reduced slope gradients tend to improve stream connectivity: Several of the studies in this appendix find that a slope gradient of 1 to 2 percent is a critical threshold for stream connectivity. In general, culverts with slope gradients less than one percent tend to improve stream connectivity.
Bottomless culverts tend to improve stream connectivity: Specifically, studies found that culverts countersunk more than 20 percent into the streambed improved fish passage
Stream-simulation designs tend to imitate natural channel conditions. Case Study of Culvert Performance during Tropical Storm Irene (2014) Gillespie et al. examine a case study of culvert flood resilience during Tropical Storm Irene. Tropical Storm Irene damaged or destroyed approximately 1,000 culverts in Vermont, causing millions of dollars in road infrastructure damage. The authors cite multiple instances where undersized culverts catastrophically failed during the extreme flood event. In contrast, Gillespie et al. identify two newly-installed stream-simulation culverts in the Green Mountain National Forest that weathered Tropical Storm Irene without incurring any damage. The authors cite similar case studies where stream-simulation culverts have passed significant flood events. The authors found that eight stream-simulation culverts in the Siuslaw National Forest in Oregon have successfully weathered 20 and 25-year floods without any damages. Further, 93 stream-simulation culverts in the Tongass National Forest of Alaska have weathered 25 and 50-year floods without major failure. Improved flood resilience increases the projected lifetime of stream-simulation culverts relative to conventional culverts. The authors state that typical projected lifetimes for conventional culverts range from 25 to 50 years, while stream-simulation culverts can achieve lifetimes of 50 to 75 years. This study generally supports the hypothesis that stream-simulation design:
Improves flood resilience Increases project lifetime

Cost-Benefit Analysis of Stream-Simulation Culverts 27
Washington State Evaluation of Stream-simulation Culvert Design (2003-2014) The Washington Department of Fish and Wildlife (WADFW) and the Washington Department of Natural Resources (WADNR) conducted an evaluation of 53 stream-simulation culverts in Washington state from 2003 to 2014. The study shows that stream-simulation culverts tend to imitate natural conditions for sediment particle size, flood-event flow velocities, and flood-event flow widths. Nonetheless, the study finds that stream-simulation culverts are not “uniformly similar to their reference reach.” Table 1 illustrates a selection of results from the WADFW/DNR study. The table shows that response ratios (measurements of parameter in culvert divided by measurements of parameter in reference reach) are close to 1 for median measurements, supporting the claim that stream-simulation culverts imitate the natural conditions of the stream. Nonetheless, Table B1 provides sufficient reason for caution: response ratios differ from one at the extreme measurements, indicating that stream-simulation culverts do not completely eliminate road-stream crossing impacts.
Table B1. Response Ratios for Stream-simulation
Source: Barnard et al., 2014. Parameter Minimum Median Maximum Characteristic particle size 0.4 1.0 6.0 2-year event width 0.6 1.1 1.8 2-year event velocity 0.6 0.9 1.3 100-year event width 0.4 0.9 1.6 100-year event velocity 0.6 1.0 1.4
The WADFW/DNR study generally supports the hypothesis:
Stream-simulation design tends to imitate natural channel conditions Minnesota Department of Transportation Evaluation of Fish Passage Culverts (2011) The Minnesota Department of Transportation (MNDOT) surveyed 19 recessed culverts (i.e., culvert invert buried beneath streambed) to assess fish passage. The study measured culvert fish passage performance by the presence of sediment in the recessed barrels, where the presence of sediment indicated a functioning fish passage culvert. The study found that 11 of the 19 surveyed culverts contained sediment. Of the 19 culverts, 12 culverts had a width ratio (WR) of greater than one (typical of stream-simulation design). The study found a positive correlation between larger width ratios and presence of barrel sediment. Nine of the 12 barrels with WR greater than one had sediment, while only two of the seven culverts with WR less than one had sediment. These results support the claim that larger WR improves the stream connectivity function of culverts. Further, WR and average velocity ratio (ratio of culvert velocity to natural channel velocity) are negatively correlated in the MNDOT study. This generally supports the claim that larger width ratios reduce flow velocities toward the natural channel velocity. The MNDOT study generally supports the following hypotheses:
Cost-Benefit Analysis of Stream-Simulation Culverts 28
Large WR (greater than one) results in improved stream connectivity Large WR (greater than one) reduces average velocity ratio
WADFW Puget Sound Fish Passage Effectiveness Study (2011) WADFW evaluated fish passage at 77 randomly selected fish passage culverts in the Puget Sound area. The study found that 23 of the 77 culverts (30 percent) continued to pose fish passage barriers. The study found two conclusions relevant to this analysis:
All bottomless culverts, or culverts countersunk at least 20 percent into the streambed, were fish passable. In contrast, 23 of 27 culverts countersunk less than 20 percent into the streambed were passage barriers.
Slope gradients of greater than one percent tended to pose passage barriers. The WADFW Puget Sound study generally supports the following hypotheses:
Bottomless culverts (less than 20 percent in streambed) improve stream connectivity Low slope gradients (less than one percent) improve stream connectivity
Ohio Department of Transportation Culvert Design Effectiveness (2011) The Ohio Department of Transportation (ODOT) conducted a survey of 59 culverts installed as either embedded or bankfull width designs. The study found that 24 of the 59 culverts actually operated as embedded (i.e., contained sediment in the full length of the barrel). The study measures culvert impact by change in stream sedimentation patterns as either minimal/minor or potentially significant. The study finds no significant difference for sedimentation impacts between embedded and non-embedded culverts. Slope gradient correlates weakly with sedimentation impacts for embedded and partially-embedded culverts: culverts with minimal/minor impact had an average slope gradient of 1.47 percent, while culverts with potentially significant impact had an average slope gradient of 2.22 percent. The study found no statistically significant impacts of width or culvert design on impact. The author finds that slope gradient and culvert diameter largely determine culvert impact. The author concludes that the data indicate that embedded culverts have minimal impact in streams with slopes of less than one percent. The ODOT study generally supports the hypothesis:
Low slope gradients (less than one percent) improve stream connectivity USFS Lake Tahoe Basin Management Unit Fish Passage Assessment (2010) The U.S. Forest Service Lake Tahoe Basin Management Unit (LTMBU) conducted a survey of 61 culverts. The study evaluates fish passage with the USFS FishXing tool. The LTBMU study classifies culvert passability as red (impassable), gray (indeterminate), or green (passable) for salmonid and trout species. The study classifies culverts with WR less than
Cost-Benefit Analysis of Stream-Simulation Culverts 29
0.7 as impassable for most fish species. The study classifies culverts with WR less than 0.5 as impassable for all life stages of the cutthroat trout. The study classifies embedded culverts with slope gradient less than 1 percent as impassable, and non-embedded culverts with slope gradient less than 0.5 percent as impassable for most fish species. These thresholds are 2 percent and 1 percent for cutthroat trout, respectively. The study classifies 30 of 30 circular culverts as red (impassable), and finds that 3 of 5 open-bottom arch culverts are green (passable). The study finds that outlet drops explain impassability (trout) at 28 of the 61 culverts, slope gradient explains impassability (trout) at 17 culverts, and low width ratio explains impassability (salmonid) for 5 culverts. The LTBMU concluded that open-bottom arch culverts allow for continuous bottom substrate resulting in passability. The LTBMU study generally supports the hypotheses:
Large WR (greater than 0.7) improves stream connectivity Low slope gradient (less than one to two percent) improves stream connectivity
Appalachian Watershed Assessment of Brook Trout Passage (2009) Researchers from West Virginia University conducted a survey of 120 state-owned culverts for brook trout passage in an Appalachian watershed. The culvert design distribution of the survey included 55 percent circular, 30 percent pipe arch, 11 percent box, 4 percent combination box/circular. The study found that only three culverts were completely passable while 83 culverts were completely impassable. The study found that culvert slope gradient partially explained impassability: impassable culverts had an average slope gradient of seven percent, compared to the survey mean of 5.1 percent. Assessment of Trout Passage in Montana (2009) A study of trout passage in Montana (Burford et al., 2009) found that 41 of 45 culverts posed upstream barriers to fish passage, mostly due to depth. The study included one open-bottom arch culvert that was classified as one of the four passable culverts. USFS Northern Region Assessment of Fish Passage (2008) A USFS Northern Region study (Hendrickson et al., 2008) conducted a survey of 2,865 culverts. The study found that 77.5 percent of culverts posed barriers to fish passage according to the FishXing tool. The study found that 93 percent of surveyed culverts constrict stream channels, and classified culverts with constriction ratios of less than 0.5 as “high or extreme risk of failure.”

Cost-Benefit Analysis of Stream-Simulation Culverts 30
Appendix C: Stream-Simulation Design The use of the term “stream-simulation” throughout this document is consistent with the term as defined by the U.S. Forest Service (USFS) Stream-Simulation Working Group. This appendix summarizes the key characteristics that distinguish stream-simulation design. According to the USFS Stream-Simulation Working Group:
“Stream-simulation is an approach to designing crossing structures (usually culverts), that creates a structure that is as similar as possible to the natural channel. When channel dimensions, slope, and streambed structure are similar, water velocities and depths also will be similar. Thus, the simulated channel should present no more of an obstacle to aquatic animals than the natural channel.”
Stream-simulation design can be distinguished by three features:
Reference reach: The channel inside the structure must reflect the same stream characteristics (channel width, gradient, flow velocity) as a natural stable channel reach or “reference reach.” The reference reach should ensure that the culvert achieves conditions that are as good as a natural channel.
Streambed simulation: Stream-simulation design culverts emulate the roughness of natural streambeds through features such as immobile rock placement and embedded debris in the culvert bottom.
Channel restoration: Stream-simulation projects restore natural channel conditions by offsetting upstream sedimentation and downstream scour during culvert replacement.
Stream-simulation Specifications in this Analysis Per Wisconsin DNR guidance, we apply two standards to determine an appropriate stream-simulation design width depending on the slope of the existing structure:
Existing slope less than 1 percent: Stream-simulation design width = bankfull width Existing slope less than or equal to one percent: Stream-simulation design width =
1.2*bankfull width We apply these standards to calculate culvert widths of stream-simulation culverts in our analysis of the Green Bay dataset. Of 1,615 culverts in the Green Bay dataset, 493 already meet the WI DNR stream-simulation design width standard. Although these culverts may not truly be stream-simulation, we exclude them from our analysis in order to avoid over-estimating benefits for properly sized culverts.

Cost-Benefit Analysis of Stream-Simulation Culverts 31
Appendix D: Regulatory Authority and Legal Considerations Federal Laws, Regulations, and Authorities The U.S. Environmental Protection Agency (EPA) and the U.S. Army Corps of Engineers (Corps) are responsible for implementing the Clean Water Act (CWA)12 and have legal jurisdiction over all “navigable waters”13 as defined by the regulatory definition of “waters of the U.S.”14 The EPA and Corps are responsible for issuing permits for “the discharge of dredged or fill material into…navigable waters.”15 Culvert construction and replacement would fall generally under CWA jurisdiction. The CWA, however, is a manifestation of ‘cooperative federalism,’ which is the concept that state sovereignty plays an important part in implementing federal law and regulations. The CWA explicitly recognizes state authority and responsibility to carry out its general purpose, granting states the authority to “implement the permit programs under sections 134216 [the National Pollutant Discharge Elimination System] and 134417 [Permits for dredged or fill material].18 The CWA jurisdiction of the EPA and the Corps has been called into question by two Supreme Court cases: Solid Waste Agency of Northern Cook County v. U.S. Army Corps of Engineers (SWANCC), 531 U.S. 159 (2001), and Rapanos v. United States (Rapanos), 547 U.S. 715 (2006). The Court in SWANCC held that the term “navigable waters” within regulations promulgated by the Corps was too broadly defined.19 The Court in Rapanos further limited jurisdiction, holding that the term “waters of the U.S.”20, as defined by the CWA, are limited only to waters that have a “significant nexus” to “navigable waters.”21 In response to this Supreme Court rulings, the EPA and the Corps have promulgated a new rule that re-defines “waters of the U.S.” that clarifies the jurisdictional reach of the CWA.22 This new rule is expected to restore some of the EPA’s and Corps’ original CWA jurisdiction. The U.S. Federal Highway Administration (FHWA) has authority over the National Highway System (NHS) and authority over federal-aid projects outside of the NHS. The FHWA specifies design standards for NHS structures under 23 C.F.R §625 “Design Standards for Highways.”23 The regulations specify that proposed NHS projects shall provide a facility (including culverts) that will “adequately serve the existing and planned future traffic of the highway in a manner that
12 33 U.S.C. §1251 et seq. 13 Id., at §1362(7) 14 33 C.F.R. §328.3 15 Supra note 1, at §1344(a) 16 Id., at §1342 17 Id., at §1344 18 Id., at §1251(b) 19 Solid Waste Agency of Northern Cook County v. U.S. Army Corps of Engineer, 531 U.S. 159 (2001) 20 33 U.S.C. §1362(7), 21 Rapanos v. United States, 547 U.S. 715 (2006) 22United States Environmental Protection Agency and the Army Corps of Engineers, Definition of “Waters of the United States” Under the Clean Water Act, 79 Fed. Reg. 22187, 22198 (proposed April 21, 2014) (to be codified at 33 C.F.R. pt. 328.3) 23 23 C.F.R. §625 et seq.

Cost-Benefit Analysis of Stream-Simulation Culverts 32
is conducive to safety, durability, and economy of maintenance.”24 The regulations provide the FHWA with authority to consider the environmental implications of proposed NHS projects during the approval process.25 FHWA references standards and specifications for highway projects developed by the American Association of State Highway and Transportation Officials. State Laws, Regulations, and Authorities Since its inception, Wisconsin’s state Constitution has maintained that navigable waters “shall be common highways and forever free,”26 to be held in trust by the state of Wisconsin for the public benefit. The Public Trust Doctrine imbues the Wisconsin state government with the responsibility to protect, preserve, and maintain Wisconsin’s navigable waters for public use in a general, legal sense. Subsequent state laws, regulations, and common law findings have delineated specific legal obligations, all shaped by the contours of the Public Trust Doctrine. Consequently, the enforcement of this Constitutional mandate falls generally to the Wisconsin Department of Natural Resources (DNR). Wisconsin DNR Wis. Stat. §30.10 defines the scope of jurisdiction of the state’s authority to regulate navigable waters.27 Wis. Stat. §30.12 states that a permit is required for any structures placed in navigable waters, including culverts, unless granted an exemption or is specifically approved by the Wisconsin State Legislature.28 Wisconsin State Statute 30.123 specifically delineates the permit requirements and exemptions for culverts, other legal requirements related to navigable water, and also provides a framework for the regulations that Wisconsin DNR has promulgated regarding culvert placement, design, and construction.29 These regulations address very specific legal questions and requirements regarding culverts and implement the legal requirements of the Public Trust Doctrine, state and federal law, and common law findings. Wisconsin Administrative Code Chapter NR 320 is the source of the DNR’s regulation of culverts. The general purpose of the chapter is to establish the procedures for obtaining permits and constructing culverts bridges, while also establishing limits to culvert design, construction, and maintenance in order to protect the public interest in the state’s navigable waters.30 These regulations specifically delineate the types of activities regulated by the state, the size and placement of culverts, and the permits required in order to construct, maintain, or replace culverts. As aforementioned, the EPA and Corps have promulgated a new rule that clarifies the uncertainty of how the CWA defines “waters of the U.S.”31 Given the broad reach of the Public Trust Doctrine, this is not expected to add any legal protection to bodies of water or wetlands in 24 Id., at §625.2(a)(1) 25 Id., at §625.3(a)(1)(i)-(ii) 26 Wisconsin State Constitution, Article IX, Section 1. 27 Wis. Stat. §30.10 28 Wis. Stat. §30.12 29 Wis. Stat. §30.123 30 Wisc. Admin. Code § NR 320.01 31 Supra note 11

Cost-Benefit Analysis of Stream-Simulation Culverts 33
the state of Wisconsin that does not already exist at the state level.32 Instead, the new rule will add an additional layer of regulatory approval to decisions that the DNR makes regarding projects in areas of the state that do not currently fall under the EPA’s or Corps’ jurisdiction, especially projects related to isolated wetlands.33 This will have the effect of preventing the state legislature from passing a law that exempts a specific project from DNR regulations due to the Supremacy Clause of the United States Constitution, which “preempts” and invalidates any state laws that conflict with federal law.34 Wis. Stat §87.02 grants authority to Wisconsin DNR to “order the straightening, widening, altering, deepening, changing or the removing of obstructions from the course of any river, watercourse, pond, lake, creek or natural stream, ditch, drain or sewer, and the concentration, diversion or division of the flow of water therein; provided, that in the case of navigable waters no such work shall substantially impair the navigability thereof.”35 Wis. Stat §281.36 provides DNR with permitting authority over the discharge of “dredged material or fill material into a wetland.”36 The “wetland general permit” encompasses any “discharge that is necessary for the construction, reconstruction, or maintenance of a bridge or culvert that is part of a transportation project that is being carried out under the direction and supervision of a city, village, town, or county.”37 Wis. Stat §87.11 directs DNR to proceed with projects with net benefits, where benefits are measured by benefits to parcels of land impacted by the project.38 Wisconsin Department of Transportation The Wisconsin Department of Transportation (DOT) has authority to specify culvert standards under Wis. Stat §84.39 Wis. Stat §83.01 requires County Highway Commissioners to inspect condition of culverts and make cost estimates of required improvements.40 Towns can petition for county aid for culvert projects with 36 inch or greater span under Wis. Stat. §82.08.41 When DOT projects affect navigable waters, they must work with the Wisconsin Department of Natural Resources (DNR) in order to ensure that the project does not unduly affect the “waters of the state” as defined by Wis. Stat. §28142, or violate the federal CWA. Through a cooperative agreement between the DOT and DNR, as specified by Wis. Stat. §30.2022,43 allows the DOT and DNR to collaborate on projects, “exchange information, and cooperate in the planning and carrying out of such activities in order to alleviate, to the extent practical under the
32 Personal interview with DNR official, Jonathan Simonsen, 11/21/2014. 33 Id. 34 U.S. Const. art. VI, cl. 2 35 Wis. Stat §87.02(1) 36 Wis. Stat §281.36(3b)(b) 37 Wis. Stat §281.36(3g)(a)10 38 Wis. Stat §87.11(1) 39 Wis. Stat §84.01(23) 40 Wis. Stat §83.01(7)(b) 41 Wis. Stat §82.08 42 Wis. Stat. §281.01(18) 43 Wis. Stat. §30.2022(4)

Cost-Benefit Analysis of Stream-Simulation Culverts 34
circumstances, any potential detrimental encroachment on the waters of the state.”44 The DNR, however, retains final approval and authority over any DOT projects that impact the waters of the state.45 Once the project is approved by the DNR, the DNR issues a “Final Concurrence” with the DNR often attaching specific conditions that ensure that the DOT project is in compliance with all applicable state and federal laws and regulations.46
44 Id. 45 Id., at §30.2022(3) 46 Supra note 21

Cost-Benefit Analysis of Stream-Simulation Culverts 35
Appendix E: Installation Costs We use a DNR culvert installation cost estimator to estimate installation costs in this cost-benefit analysis. Appendix F summarizes the DNR cost estimator in detail. In this appendix we compare the DNR estimates for incremental costs of larger culvert widths with empirical observations from studies in Minnesota and New England. We find that the Wisconsin DNR cost estimator produces reasonable estimates of the incremental cost difference for stream-simulation design culverts. Minnesota DOT Cost Estimation A Minnesota DOT study estimated the incremental culvert structure costs of replacing a conventional in-place structure with a MESBOAC (Match, Extend, Set, Bury, Offset, Align, Consider) stream-simulation design. The average culvert structure cost percentage increase for a MESBOAC design was 10 percent, ranging from one to 33 percent. Table E1 summarizes culvert structure cost estimates from the study. Importantly, the MNDOT estimates do not reflect the full installation cost (e.g., the estimates explicitly exclude fill material), but provide some basis for assessing the incremental cost of alternative designs.
Table E1. Comparison of Culvert Structure Costs for 11 Culverts in
MNDOT Study (2009 dollars) Culvert type Average Minimum Maximum
Conventional in-place structure 71,151 20,178 167,096 MESBOAC 77,143 22,370 188,604
The estimates of the Minnesota DOT study are much lower than the estimated incremental costs of the DNR approach. On average, the DNR approach estimates that the larger culvert width design entails an 85 percent installation cost increase when applied to the Green Bay dataset.47 Source: Hansen, Brad; Nieber, John; Lenhar, Chris. “Cost Analysis of Alternative Culvert Installation Practices in Minnesota.” Department of Bioproducts and Biosystems Engineering, University of Minnesota & Minnesota Department of Transportation. MN/RC 2009-20. Maine Natural Resources Conservation Service Installation Cost Data The Maine Natural Resources Conservation Service (NRCS) collected installation cost data at four culvert replacement sites. The NRCS data includes project installation costs for conventional round culverts and arch culverts (more representative of stream-simulation). Table E2 summarizes the NRCS data.
47 Based on comparison of estimated installation costs for 495 culverts in the Green Bay dataset using the revised cost estimate method outlined in Appendix F.

Cost-Benefit Analysis of Stream-Simulation Culverts 36
Table E2. Maine NRCS Project Installation Cost Data
Site Round Culvert Arch culvert
Cost ($2007)
Width (feet)
Length (feet)
Cost ($2007)
Width (feet)
Length (feet)
1 3,780 2x2.5 30 28,189 10 46 2 4,752 3.5 44 32,088 12 48 3 2,460 3 30 47,031 12 48 4 5,360 4 40 50,910 12 48
Table E2 shows that the larger arch culverts, ranging from two to four times the initial diameter, entailed consistently higher installation costs than the conventional round culverts. The incremental installation costs of the arch culverts ranged from 6.8 to 19.1 times the cost of the round culverts. The Maine NRCS project installation data is largely inconsistent with the DNR cost estimator: incremental installation costs for stream-simulation culverts range from 1.08 to 4.66 times the costs of conventional culverts under the Wisconsin DNR cost estimator. Source: Long, John. “The Economics of Culvert Replacement: Fish Passage in Eastern Maine.” Maine NRCS. Revised March 2010. Green Mountain National Forest Cost Estimates A review of cost estimates for stream-simulation replacements in the Green Mountain National Forest in Vermont produced estimates reasonably consistent with the Wisconsin DNR cost estimator. Table E3 displays the estimates:
E3. Cost Estimates ($) for Traditional and Stream-simulation Replacements in the Green Table Mountain National Forest,
2008 Traditional
culvert Stream-simulation
replacement Percentage Cost
Increase 92,950 142,050 53 percent 112,175 156,775 40 percent 93,800 140,700 50 percent 106,635 172,200 61 percent 104,700 130,250 24 percent
All of the percentage cost increases in Table E3 are lower than the average and median values of the percentage cost increase that we estimate using the Wisconsin DNR cost estimator. The difference could be due to methodological differences or due to differences in the existing culverts in the comparison in the Green Mountain case study. Summary The MNDOT and Green Mountain National Forest studies suggest that the DNR approach provides a conservative estimate of incremental installation costs for stream-simulation culverts.

Cost-Benefit Analysis of Stream-Simulation Culverts 37
In contrast, the Maine NRCS data suggest that the DNR cost estimator may not fully reflect the incremental installation costs associated with stream-simulation design. We believe that the Wisconsin DNR cost estimator is sufficiently conservative for our point estimates. We apply a range of adjustments to the DNR cost estimate in our sensitivity analysis from 0.05 to 1.5 to reflect the possibility that the DNR cost estimator under or over estimates the actual replacement cost difference. Source: Gillespie, N.; Unthank, A.; Campbell, L.; Anderson, P.; Gubernick, R.; Weinhold, M.; Cenderelli, D.; Austin, B.;
McKinley, D.; Wells, S.; Rowan, J.; Orvis, C.; Hudy, M.; Bowden, A.; Singler, A.; Fretz, E.; Levine, J.; Kirn, R. “Flood Effects on Road-Stream Crossing Infrastructure: Economic and Ecological Benefits of Stream-simulation Designs.” Fisheries. Vol 39 No 2, Feb 2014

Cost-Benefit Analysis of Stream-Simulation Culverts 38
Appendix F: Installation Cost Estimator This analysis uses installation cost estimates based on culvert replacement cost equations developed by the Wisconsin DNR. The basic structure of the cost estimator is given:
DNR replacement cost = 1.2*∑derived input costs Where derived input costs are a function of field data and derived inputs. We make five adjustments to the original DNR model. Adjustment 1: Culvert Width Input The original model estimates the cost of replacing an existing culvert with a bankfull width culvert (i.e., culvert width = bankfull width). This assumption served the purposes of a study of culverts in Green Bay tributaries. We modify the model’s assumptions for the purposes of our analysis. We estimate installation costs for the conventional culvert by assuming that the replacement culvert width (CWR) equals the existing culvert width (CWE):
conventional culvert width: CWR = CWE
We estimate installation costs for stream simulation culverts by assuming that the replacement culvert width conforms to the culvert width standards outlined by the Wisconsin DNR general permit. For all culverts located on a slope gradient of less than 1 percent, we assume that stream simulation culvert width matches the bankfull width of the stream. For all culverts located on a slope gradient of greater than 1 percent, we assume that stream simulation width equals 1.2 times the bankfull width of the stream. Due to limited slope data in the Green Bay dataset, we conservatively assume that most culverts in our analysis are located on slope gradients greater than 1 percent. This conservative assumption results in an underestimation of net benefits in the Green Bay dataset, however the assumption makes our results more broadly applicable to road-stream crossings throughout the state of Wisconsin. Adjustment 2: Large Culvert Assumptions The DNR cost estimator assumes a replacement cost $100,000 for all culverts wider than 11.1 feet, and $150,000 for all culverts wider than 24 feet. This method does not allow for a proper comparison between alternative culvert width structures, which is the goal of our analysis. We modify the cost estimator so that all large culverts are estimated according to the same cost per foot material costs as culverts with widths greater than 10 feet but less than 11.1. Adjustment 3: Excavation Depth The DNR cost estimator assumes an additional two feet of excavation depth to ensure a properly embedded culvert. The additional excavation depth is a feature of stream-simulation culverts, we therefore apply the extra two feet to stream-simulation culverts in the comparison. Adjustment 4: Road Surface Elevation Costs
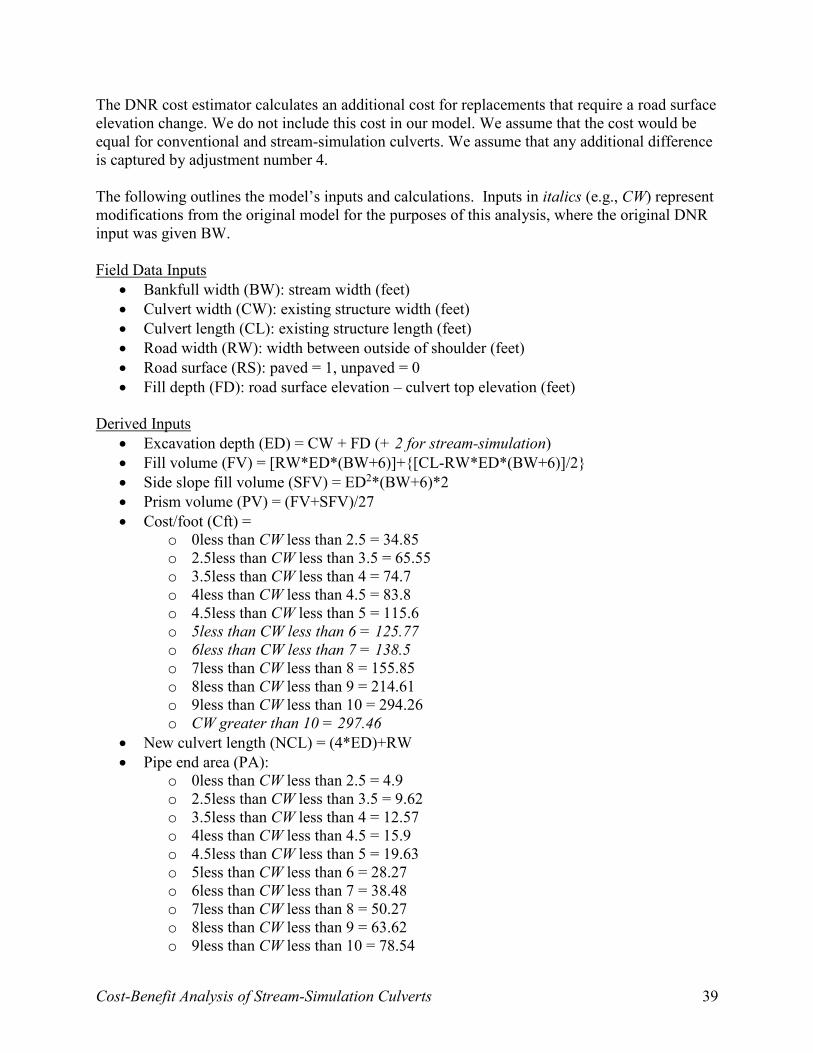
Cost-Benefit Analysis of Stream-Simulation Culverts 39
The DNR cost estimator calculates an additional cost for replacements that require a road surface elevation change. We do not include this cost in our model. We assume that the cost would be equal for conventional and stream-simulation culverts. We assume that any additional difference is captured by adjustment number 4. The following outlines the model’s inputs and calculations. Inputs in italics (e.g., CW) represent modifications from the original model for the purposes of this analysis, where the original DNR input was given BW. Field Data Inputs
Bankfull width (BW): stream width (feet) Culvert width (CW): existing structure width (feet) Culvert length (CL): existing structure length (feet) Road width (RW): width between outside of shoulder (feet) Road surface (RS): paved = 1, unpaved = 0 Fill depth (FD): road surface elevation – culvert top elevation (feet)
Derived Inputs
Excavation depth (ED) = CW + FD (+ 2 for stream-simulation) Fill volume (FV) = [RW*ED*(BW+6)]+{[CL-RW*ED*(BW+6)]/2} Side slope fill volume (SFV) = ED2*(BW+6)*2 Prism volume (PV) = (FV+SFV)/27 Cost/foot (Cft) =
o 0less than CW less than 2.5 = 34.85 o 2.5less than CW less than 3.5 = 65.55 o 3.5less than CW less than 4 = 74.7 o 4less than CW less than 4.5 = 83.8 o 4.5less than CW less than 5 = 115.6 o 5less than CW less than 6 = 125.77 o 6less than CW less than 7 = 138.5 o 7less than CW less than 8 = 155.85 o 8less than CW less than 9 = 214.61 o 9less than CW less than 10 = 294.26 o CW greater than 10 = 297.46
New culvert length (NCL) = (4*ED)+RW Pipe end area (PA):
o 0less than CW less than 2.5 = 4.9 o 2.5less than CW less than 3.5 = 9.62 o 3.5less than CW less than 4 = 12.57 o 4less than CW less than 4.5 = 15.9 o 4.5less than CW less than 5 = 19.63 o 5less than CW less than 6 = 28.27 o 6less than CW less than 7 = 38.48 o 7less than CW less than 8 = 50.27 o 8less than CW less than 9 = 63.62 o 9less than CW less than 10 = 78.54
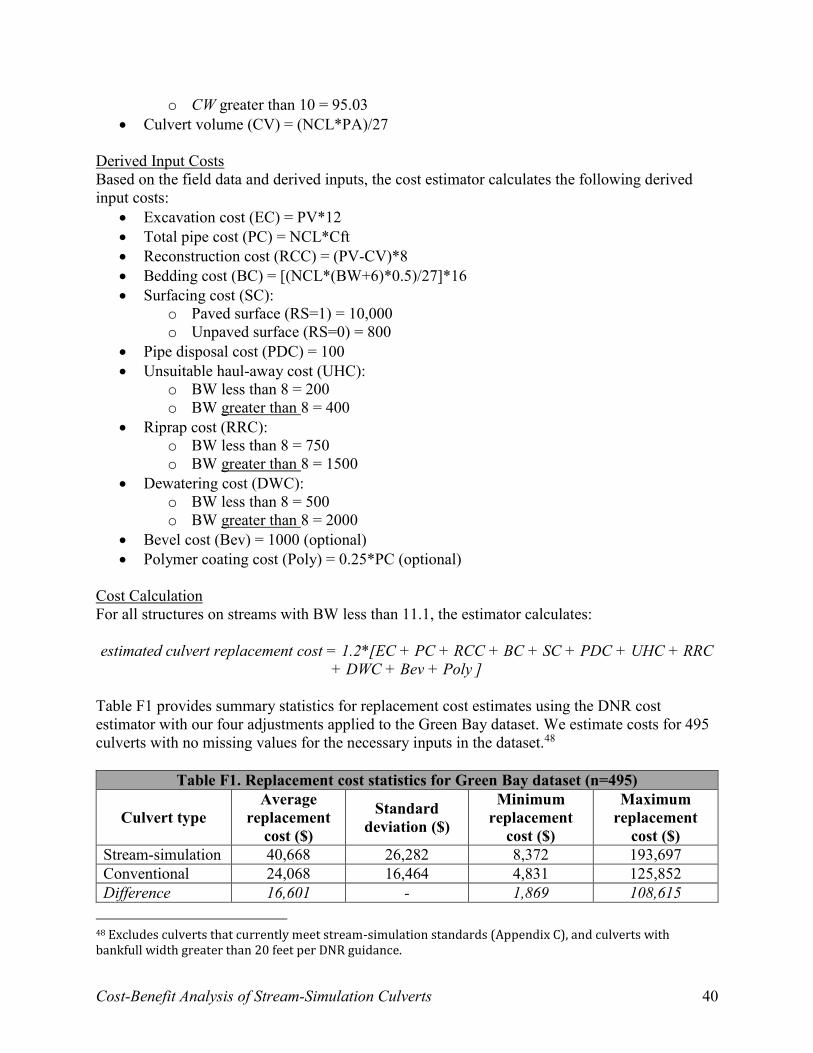
Cost-Benefit Analysis of Stream-Simulation Culverts 40
o CW greater than 10 = 95.03 Culvert volume (CV) = (NCL*PA)/27
Derived Input Costs Based on the field data and derived inputs, the cost estimator calculates the following derived input costs:
Excavation cost (EC) = PV*12 Total pipe cost (PC) = NCL*Cft Reconstruction cost (RCC) = (PV-CV)*8 Bedding cost (BC) = [(NCL*(BW+6)*0.5)/27]*16 Surfacing cost (SC):
o Paved surface (RS=1) = 10,000 o Unpaved surface (RS=0) = 800
Pipe disposal cost (PDC) = 100 Unsuitable haul-away cost (UHC):
o BW less than 8 = 200 o BW greater than 8 = 400
Riprap cost (RRC): o BW less than 8 = 750 o BW greater than 8 = 1500
Dewatering cost (DWC): o BW less than 8 = 500 o BW greater than 8 = 2000
Bevel cost (Bev) = 1000 (optional) Polymer coating cost (Poly) = 0.25*PC (optional)
Cost Calculation For all structures on streams with BW less than 11.1, the estimator calculates:
estimated culvert replacement cost = 1.2*[EC + PC + RCC + BC + SC + PDC + UHC + RRC
+ DWC + Bev + Poly ]
Table F1 provides summary statistics for replacement cost estimates using the DNR cost estimator with our four adjustments applied to the Green Bay dataset. We estimate costs for 495 culverts with no missing values for the necessary inputs in the dataset.48
Table F1. Replacement cost statistics for Green Bay dataset (n=495)
Culvert type Average
replacement cost ($)
Standard deviation ($)
Minimum replacement
cost ($)
Maximum replacement
cost ($) Stream-simulation 40,668 26,282 8,372 193,697 Conventional 24,068 16,464 4,831 125,852 Difference 16,601 - 1,869 108,615
48 Excludes culverts that currently meet stream-simulation standards (Appendix C), and culverts with bankfull width greater than 20 feet per DNR guidance.

Cost-Benefit Analysis of Stream-Simulation Culverts 41
Appendix G: Maintenance Cost Estimation Undersized culverts can require frequent maintenance for debris removal. Accumulation of debris typically occurs at the culvert inlet. A significant accumulation of debris can result in catastrophic culvert failure during a flood event. In contrast to hydraulic design, stream-simulation culverts have demonstrated minimal maintenance requirements. Stream-simulation culverts tend to pass most woody debris, which is typically shorter in length than the bankfull width of the stream. Preliminary studies suggest that properly designed stream-simulation culverts may completely eliminate maintenance costs (Gillespie et al., 2014). We remain conservative and assume an incremental improvement based on the change in culvert width. Costs A comprehensive dataset of culvert maintenance costs is unavailable. We solicited culvert maintenance cost data from 72 counties in Wisconsin and received data on approximate maintenance costs from Green County. Green County reported that the most typical maintenance requirement is cleaning of the inlet or outlet with an excavator. The hourly rate for an excavator and a haul truck is $118.91, and the average rate for two operators of the equipment with fringe benefits is $68.20. We assume average use of 4 hours per maintenance (Long, 2010). Therefore our estimated maintenance cost per cleaning is given: ($118.91+$68.20)*4 hours=$748. Maintenance Frequency Debris accumulation is more common in undersized culverts; we therefore developed a methodology to estimate the increased maintenance requirements of smaller culvert widths. The Green Bay dataset provides a case study of 1,615 culverts. The data include a variable for obstruction that indicates whether the structure is plugged by debris, plants, or sediment, or whether the structure has been crushed. About 10 percent of the culverts in the Green Bay dataset report some type of obstruction. We assume that an obstruction is indicative of a maintenance requirement. In order to establish a relationship between culvert width and the maintenance requirement we first perform a difference of means tests comparing maintenance requirements observed in bankfull width culverts in the data versus undersized culverts. Table G1 lists the results of the difference of means test.
Table G1. Comparison of Mean Values for Obstruction in Undersized and Bankfull
Width Culverts in Green Bay Dataset (t = 5.33) Group n Mean SE Undersized 1,077 0.13 0.01 Bankfull width 508 0.04 0.01
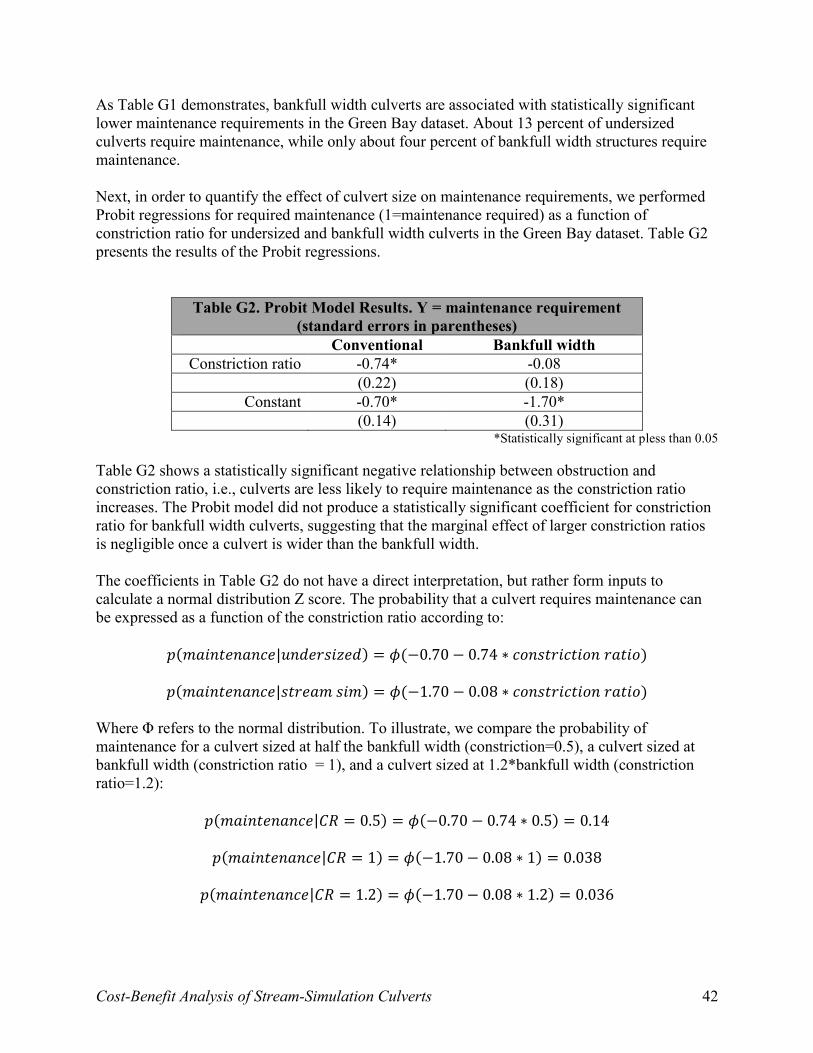
Cost-Benefit Analysis of Stream-Simulation Culverts 42
As Table G1 demonstrates, bankfull width culverts are associated with statistically significant lower maintenance requirements in the Green Bay dataset. About 13 percent of undersized culverts require maintenance, while only about four percent of bankfull width structures require maintenance. Next, in order to quantify the effect of culvert size on maintenance requirements, we performed Probit regressions for required maintenance (1=maintenance required) as a function of constriction ratio for undersized and bankfull width culverts in the Green Bay dataset. Table G2 presents the results of the Probit regressions.
Table G2. Probit Model Results. Y = maintenance requirement
(standard errors in parentheses) Conventional Bankfull width
Constriction ratio -0.74* -0.08 (0.22) (0.18)
Constant -0.70* -1.70* (0.14) (0.31)
*Statistically significant at pless than 0.05
Table G2 shows a statistically significant negative relationship between obstruction and constriction ratio, i.e., culverts are less likely to require maintenance as the constriction ratio increases. The Probit model did not produce a statistically significant coefficient for constriction ratio for bankfull width culverts, suggesting that the marginal effect of larger constriction ratios is negligible once a culvert is wider than the bankfull width. The coefficients in Table G2 do not have a direct interpretation, but rather form inputs to calculate a normal distribution Z score. The probability that a culvert requires maintenance can be expressed as a function of the constriction ratio according to:
𝑝(𝑚𝑎𝑖𝑛𝑡𝑒𝑛𝑎𝑛𝑐𝑒|𝑢𝑛𝑑𝑒𝑟𝑠𝑖𝑧𝑒𝑑) = 𝜙(−0.70 − 0.74 ∗ 𝑐𝑜𝑛𝑠𝑡𝑟𝑖𝑐𝑡𝑖𝑜𝑛 𝑟𝑎𝑡𝑖𝑜)
𝑝(𝑚𝑎𝑖𝑛𝑡𝑒𝑛𝑎𝑛𝑐𝑒|𝑠𝑡𝑟𝑒𝑎𝑚 𝑠𝑖𝑚) = 𝜙(−1.70 − 0.08 ∗ 𝑐𝑜𝑛𝑠𝑡𝑟𝑖𝑐𝑡𝑖𝑜𝑛 𝑟𝑎𝑡𝑖𝑜) Where Φ refers to the normal distribution. To illustrate, we compare the probability of maintenance for a culvert sized at half the bankfull width (constriction=0.5), a culvert sized at bankfull width (constriction ratio = 1), and a culvert sized at 1.2*bankfull width (constriction ratio=1.2):
𝑝(𝑚𝑎𝑖𝑛𝑡𝑒𝑛𝑎𝑛𝑐𝑒|𝐶𝑅 = 0.5) = 𝜙(−0.70 − 0.74 ∗ 0.5) = 0.14
𝑝(𝑚𝑎𝑖𝑛𝑡𝑒𝑛𝑎𝑛𝑐𝑒|𝐶𝑅 = 1) = 𝜙(−1.70 − 0.08 ∗ 1) = 0.038
𝑝(𝑚𝑎𝑖𝑛𝑡𝑒𝑛𝑎𝑛𝑐𝑒|𝐶𝑅 = 1.2) = 𝜙(−1.70 − 0.08 ∗ 1.2) = 0.036
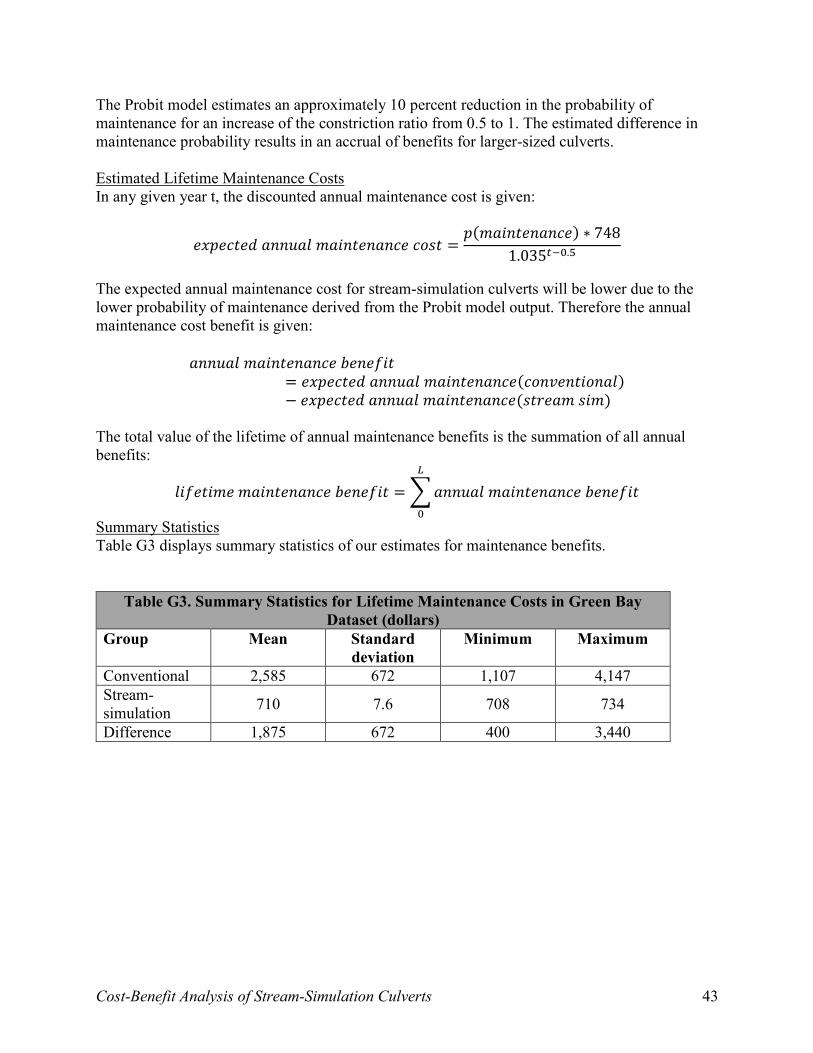
Cost-Benefit Analysis of Stream-Simulation Culverts 43
The Probit model estimates an approximately 10 percent reduction in the probability of maintenance for an increase of the constriction ratio from 0.5 to 1. The estimated difference in maintenance probability results in an accrual of benefits for larger-sized culverts. Estimated Lifetime Maintenance Costs In any given year t, the discounted annual maintenance cost is given:
𝑒𝑥𝑝𝑒𝑐𝑡𝑒𝑑 𝑎𝑛𝑛𝑢𝑎𝑙 𝑚𝑎𝑖𝑛𝑡𝑒𝑛𝑎𝑛𝑐𝑒 𝑐𝑜𝑠𝑡 =𝑝(𝑚𝑎𝑖𝑛𝑡𝑒𝑛𝑎𝑛𝑐𝑒) ∗ 748
1.035𝑡−0.5
The expected annual maintenance cost for stream-simulation culverts will be lower due to the lower probability of maintenance derived from the Probit model output. Therefore the annual maintenance cost benefit is given:
𝑎𝑛𝑛𝑢𝑎𝑙 𝑚𝑎𝑖𝑛𝑡𝑒𝑛𝑎𝑛𝑐𝑒 𝑏𝑒𝑛𝑒𝑓𝑖𝑡= 𝑒𝑥𝑝𝑒𝑐𝑡𝑒𝑑 𝑎𝑛𝑛𝑢𝑎𝑙 𝑚𝑎𝑖𝑛𝑡𝑒𝑛𝑎𝑛𝑐𝑒(𝑐𝑜𝑛𝑣𝑒𝑛𝑡𝑖𝑜𝑛𝑎𝑙)− 𝑒𝑥𝑝𝑒𝑐𝑡𝑒𝑑 𝑎𝑛𝑛𝑢𝑎𝑙 𝑚𝑎𝑖𝑛𝑡𝑒𝑛𝑎𝑛𝑐𝑒(𝑠𝑡𝑟𝑒𝑎𝑚 𝑠𝑖𝑚)
The total value of the lifetime of annual maintenance benefits is the summation of all annual benefits:
𝑙𝑖𝑓𝑒𝑡𝑖𝑚𝑒 𝑚𝑎𝑖𝑛𝑡𝑒𝑛𝑎𝑛𝑐𝑒 𝑏𝑒𝑛𝑒𝑓𝑖𝑡 = ∑ 𝑎𝑛𝑛𝑢𝑎𝑙 𝑚𝑎𝑖𝑛𝑡𝑒𝑛𝑎𝑛𝑐𝑒 𝑏𝑒𝑛𝑒𝑓𝑖𝑡
𝐿
0
Summary Statistics Table G3 displays summary statistics of our estimates for maintenance benefits.
Table G3. Summary Statistics for Lifetime Maintenance Costs in Green Bay
Dataset (dollars) Group Mean Standard
deviation Minimum Maximum
Conventional 2,585 672 1,107 4,147 Stream-simulation 710 7.6 708 734
Difference 1,875 672 400 3,440
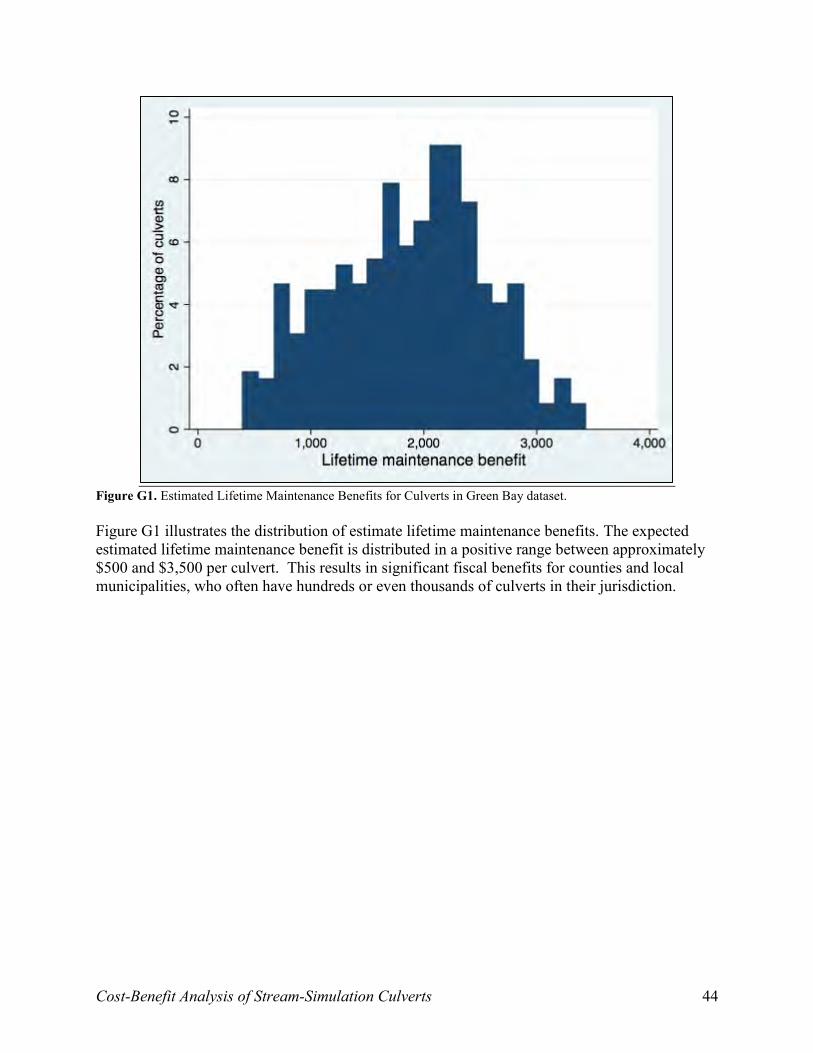
Cost-Benefit Analysis of Stream-Simulation Culverts 44
Figure G1. Estimated Lifetime Maintenance Benefits for Culverts in Green Bay dataset. Figure G1 illustrates the distribution of estimate lifetime maintenance benefits. The expected estimated lifetime maintenance benefit is distributed in a positive range between approximately $500 and $3,500 per culvert. This results in significant fiscal benefits for counties and local municipalities, who often have hundreds or even thousands of culverts in their jurisdiction.

Cost-Benefit Analysis of Stream-Simulation Culverts 45
Appendix H: Fish Passage Undersized culverts pose fish passage barriers for several reasons, including increased flow velocity within the structure and vertical discontinuities. Flow velocities in poorly designed culverts exceed the swimming ability of some fish species. Excessive vertical discontinuities can result in outlet drops that pose barriers to migratory fish with limited leaping ability. Impassable culverts negatively impact fish by preventing migration, reducing the overall population and genetic diversity of the remaining population, and preventing fish from adapting to climate change. Further, food chain disruptions resulting from barriers to fish passage can have cascading effects on other aquatic organisms, terrestrial animals, and, generally, the complex interrelations within the stream ecosystem. Properly designed, constructed, and maintained culverts can mitigate these issues, maintaining the stream’s aquatic connectivity and promoting a homeostatic, natural stream ecosystem. Passability We use on-ground data collated by Januchowski-Hartley et al. (in press) to inform a ‘Road Culvert Passability Model’. Januchowski-Hartley et al. (in press) determined passability as the modelled probability of fish passage through a road culvert. The modelled probability of fish passage through a culvert was based on the presence or absence of an outlet drop and three different culvert outlet velocities for culverts occurring on low-order streams (Strahler order 1-4). Januchowski-Hartley et al. use criteria for fish passage based on three orders of flow velocity through the culvert:
V greater than 0.4 m/s: Impassable for young or weak migratory fish species (e.g., darters)
V greater than 0.7 m/s: Impassable for fish species with moderate swimming ability (e.g., northern pike, walleye
V greater than 1.0 m/s: Impassable for all fish species. We apply the same criteria in our model to value benefits of improved fish passage for 11 species of fish native to Wisconsin. Further, consistent with Januchowski-Hartley et al., we assume that any culvert with an outlet drop is impassable to most fish species. We conservatively assume a leaping ability of 12 inches for trout species. Application of Passability Model to Stream-simulation For the purposes of our analysis, we assume that stream-simulation culverts have no outlet drop and that stream-simulation culverts reduce flow velocity to the natural channel velocity. These assumptions indicate that appropriately-designed, constructed, and maintained stream-simulation culverts completely eliminate artificial barriers to fish passage at road-stream crossings. This assumption is supported by observations of fish passability through alternative culvert designs in empirical studies (see Appendix B).

Cost-Benefit Analysis of Stream-Simulation Culverts 46
Incremental Passability Impact We estimate a change in passability (∆P) for every existing culvert in our Green Bay dataset. ∆P takes on a value of 1 if the replacement of the existing culvert would result in the removal of a fish passage barrier for Wisconsin fish species according to Table H1.
Table H1. Estimated Passability Improvements
Current Fish Passage Barrier ∆ Passability
Flow velocity >0.7 m/s ∆P = 1 for bass, black crappie, bluegill, muskellunge, pike, walleye, yellow perch
Flow velocity > 1.0 m/s ∆P = 1 for all species
Outlet drop ∆P = 1 for bass, black crappie, bluegill, muskellunge, pike, walleye, yellow perch
Outlet drop > 12 inches ∆P = 1 for all species
We represent that there is no change in passability for all existing culverts that do not currently pose fish passage barriers, represented mathematically by ∆P=0. We estimate flow velocities in exiting culverts through a methodology based on the Manning’s equation (see Appendix I). Estimation of Affected Fish Population To determine the impact of stream-simulation culverts on fish, we collected fish population density in Wisconsin watersheds (number of fish/mile of stream). We obtained this information from the DNR’s fishing forecast as well through correspondence with the Green Bay DNR. See Appendix J for a complete explanation of the data and our adjustments. Estimated Fish Value We use data from private fish hatcheries to approximate the market value of Wisconsin fish species. We aggregate fish values from a wide variety of private hatcheries whose prices are publicly available online (see Appendix K). Our sample of 11 fish species is not representative of all fish species, therefore our approach represents a conservative estimate of benefits from increased fish passage. Estimated Benefits The estimated benefit of fish passage for a given species f is the product of the change in passability for the species (∆Pf), fish density of species f (number of fish f/mile of stream), distance from the next road-stream crossing D, and the value of each fish ($/fish):
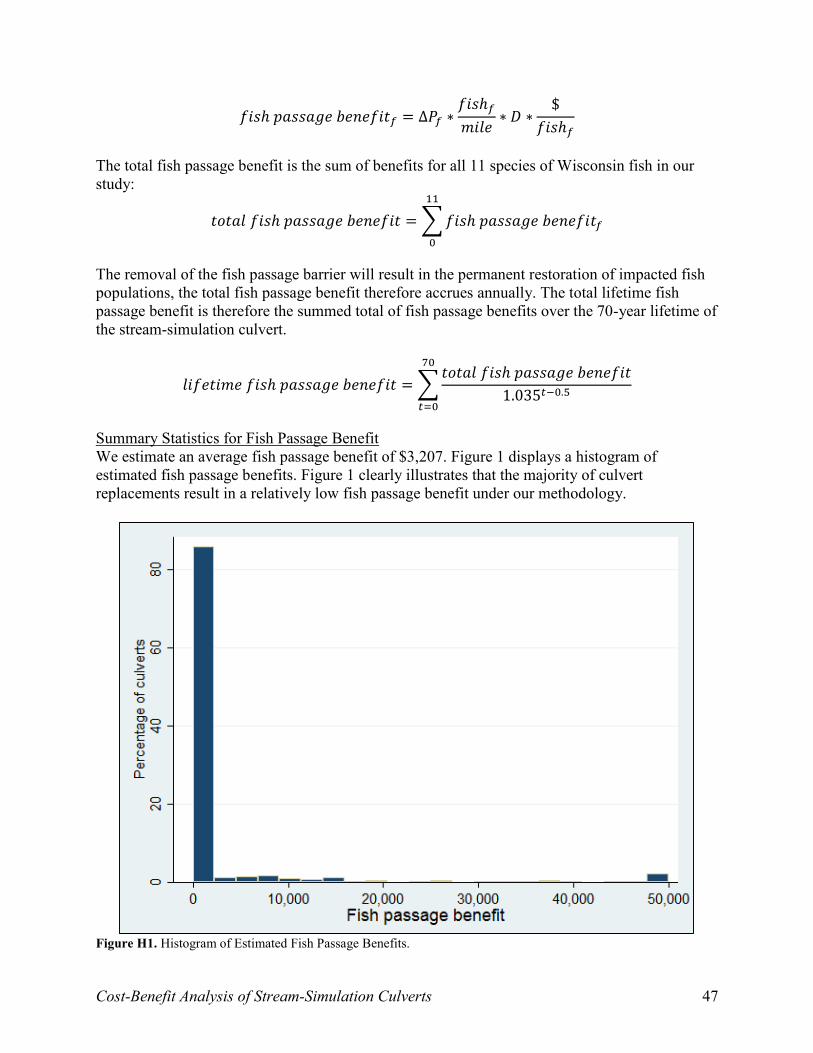
Cost-Benefit Analysis of Stream-Simulation Culverts 47
𝑓𝑖𝑠ℎ 𝑝𝑎𝑠𝑠𝑎𝑔𝑒 𝑏𝑒𝑛𝑒𝑓𝑖𝑡𝑓 = ∆𝑃𝑓 ∗𝑓𝑖𝑠ℎ𝑓
𝑚𝑖𝑙𝑒∗ 𝐷 ∗
$
𝑓𝑖𝑠ℎ𝑓
The total fish passage benefit is the sum of benefits for all 11 species of Wisconsin fish in our study:
𝑡𝑜𝑡𝑎𝑙 𝑓𝑖𝑠ℎ 𝑝𝑎𝑠𝑠𝑎𝑔𝑒 𝑏𝑒𝑛𝑒𝑓𝑖𝑡 = ∑ 𝑓𝑖𝑠ℎ 𝑝𝑎𝑠𝑠𝑎𝑔𝑒 𝑏𝑒𝑛𝑒𝑓𝑖𝑡𝑓
11
0
The removal of the fish passage barrier will result in the permanent restoration of impacted fish populations, the total fish passage benefit therefore accrues annually. The total lifetime fish passage benefit is therefore the summed total of fish passage benefits over the 70-year lifetime of the stream-simulation culvert.
𝑙𝑖𝑓𝑒𝑡𝑖𝑚𝑒 𝑓𝑖𝑠ℎ 𝑝𝑎𝑠𝑠𝑎𝑔𝑒 𝑏𝑒𝑛𝑒𝑓𝑖𝑡 = ∑𝑡𝑜𝑡𝑎𝑙 𝑓𝑖𝑠ℎ 𝑝𝑎𝑠𝑠𝑎𝑔𝑒 𝑏𝑒𝑛𝑒𝑓𝑖𝑡
1.035𝑡−0.5
70
𝑡=0
Summary Statistics for Fish Passage Benefit We estimate an average fish passage benefit of $3,207. Figure 1 displays a histogram of estimated fish passage benefits. Figure 1 clearly illustrates that the majority of culvert replacements result in a relatively low fish passage benefit under our methodology.
Figure H1. Histogram of Estimated Fish Passage Benefits.

Cost-Benefit Analysis of Stream-Simulation Culverts 48
Appendix I: Hydrology We will give a brief background on the hydrology needed to understand our velocity change estimations. Water moving through a stream can be modeled as a fluid. A fluid is defined as anything that can flow, meaning it can move over and around a similar substance and take the shape of its pathway. Both gasses and liquids are fluids. A stream is an example of an open-channel flow, which describes the condition of a fluid not entirely filling its pathway. Another condition of open-channel flow is a free surface existing between the fluid and anther fluid. In the case of a stream, the free surface is the water touching the air above. In open channel flow, the force of gravity moves the fluid down a height gradient or slope.49 There are differences in open-channel flow types. The flow can be steady, meaning the depth of the fluid stays constant over time, and unsteady flow, where the depth changes over time. A channel can also be uniform or non-uniform. Uniform channel depths do not change as the fluid moves down the channel. Non-uniform fluid depth will change along a channel. For our purposes, we are assuming our streams are steady and uniform, that is to say, their depth is constant at all times and locations. We only have average depth readings from one location, so we do not have the data to consider unsteady or non-uniform streams regardless. Also our talks with our clients lead us to believe that after a modification to a stream occurs, the stream will return to steady flow.50 The velocity of an open-channel flow can be determined with the Manning equation.51 This equation is empirically derived is expressed as:
𝑉 =𝑘
𝑛𝑅ℎ
23𝑆
12
Where, V is velocity of the open-channel flow. k is a unit constant, for English units, 1.486 ft/s. Rh is the hydraulic radius, which is defined as cross-sectional area divided by wetted perimeter. S is the slope of the channel defined as ft/ft. n is a roughness factor that is determined by the materials of the channel. Wetter perimeter is the surface that is being touched by water, this is detailed in a Figure I1 below.
Figure I1. Diagram of Wetted Perimeter. 52
49 Fundamentals of Fluid Mechanics 50 Personal interview with DNR. 51 Interview with Dr. Eric Booth 52 https://ecourses.ou.edu/ebook/fluids/ch10/sec101/media/d10144.gif
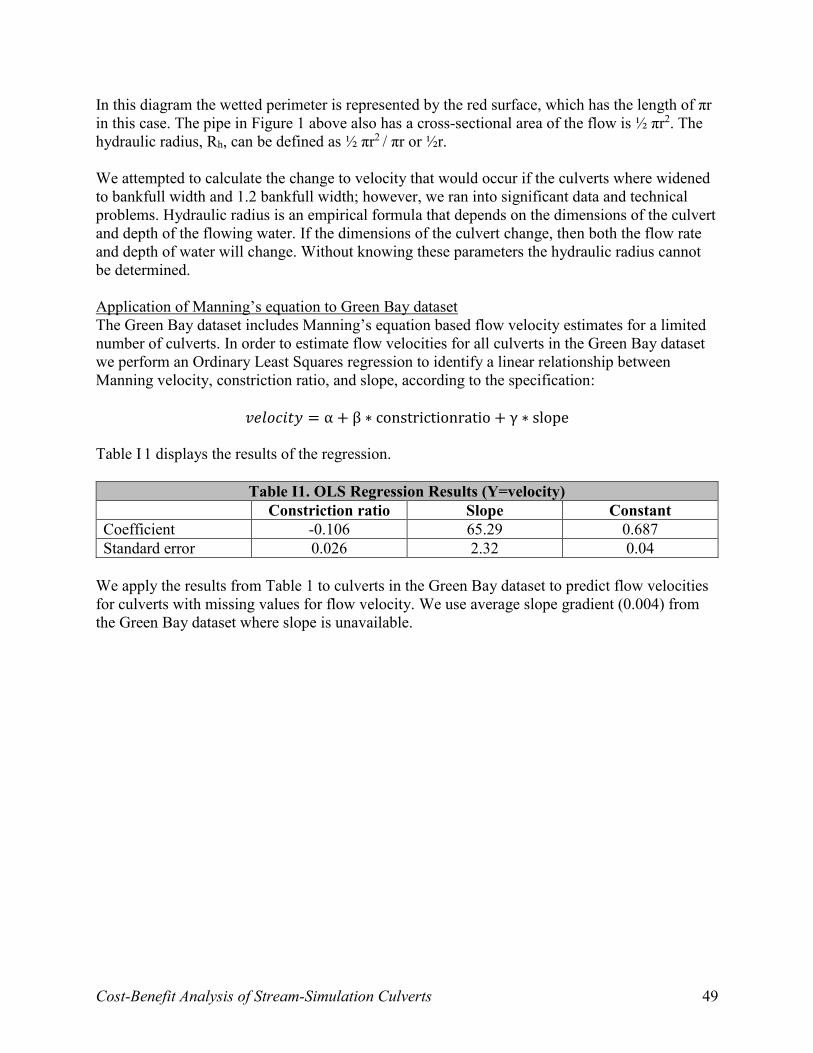
Cost-Benefit Analysis of Stream-Simulation Culverts 49
In this diagram the wetted perimeter is represented by the red surface, which has the length of πr in this case. The pipe in Figure 1 above also has a cross-sectional area of the flow is ½ πr2. The hydraulic radius, Rh, can be defined as ½ πr2 / πr or ½r.
We attempted to calculate the change to velocity that would occur if the culverts where widened to bankfull width and 1.2 bankfull width; however, we ran into significant data and technical problems. Hydraulic radius is an empirical formula that depends on the dimensions of the culvert and depth of the flowing water. If the dimensions of the culvert change, then both the flow rate and depth of water will change. Without knowing these parameters the hydraulic radius cannot be determined. Application of Manning’s equation to Green Bay dataset The Green Bay dataset includes Manning’s equation based flow velocity estimates for a limited number of culverts. In order to estimate flow velocities for all culverts in the Green Bay dataset we perform an Ordinary Least Squares regression to identify a linear relationship between Manning velocity, constriction ratio, and slope, according to the specification:
𝑣𝑒𝑙𝑜𝑐𝑖𝑡𝑦 = α + β ∗ constrictionratio + γ ∗ slope Table I 1 displays the results of the regression.
Table I1. OLS Regression Results (Y=velocity) Constriction ratio Slope Constant Coefficient -0.106 65.29 0.687 Standard error 0.026 2.32 0.04
We apply the results from Table 1 to culverts in the Green Bay dataset to predict flow velocities for culverts with missing values for flow velocity. We use average slope gradient (0.004) from the Green Bay dataset where slope is unavailable.

Cost-Benefit Analysis of Stream-Simulation Culverts 50
Appendix J: Fish Benefit This appendix is one of four appendices related to fish passage through culverts. This appendix details our methodology for calculating benefits as a result of increased fish passage. For the impact of culverts and other barriers on fish populations see Appendix L, for more information on what passability is see Appendix H, for information on fish values and density estimates see Appendix K. Theory From the literature it is clear that there are significant barriers to fish movement that result from culverts. These barriers have many negative impacts including reduced fish population, and genetic diversity that threatens the existence of certain fish populations. The literature indicates that stream-simulation culvert design provides perfect passage for fish, so we should see incremental benefits to fish as a result of moving from a partially blocked situation to a situation of free flow of fish. For more information on the impact of barriers on fish see Appendix L. Methodology To determine the impact of stream-simulation culverts on fish we need three pieces of information. First, we need the current passability of culverts to different fish types. Our passability estimates are based off of culvert velocity, perch, and slope. For more information on our passability methodology see Appendix H. Second, we need the current population density of fish in the area. We have obtained this through correspondence with the Green Bay DNR. Finally, we need a value for an individual fish. Thankfully, game fish seen in Wisconsin rivers are also sold from hatcheries so we have an approximation of a market value for these fish that we can apply to fish in the wild. Our values of an individual fish are aggregated from a variety of private hatcheries whose prices were publicly available online. A full list of fish value sources is provided in our appendix K. We have selected eleven different types of fish to value for this analysis: Northern Pike, Muskie, Black Crappie, Bigmouth Bass, Smallmouth Bass, Bluegill, Walleye, and Brook Trout, Rainbow Trout, and Brown Trout. These fish represent a variety of fish sizes and swimming ability and should provide us with a range of estimates. Our analysis will understate the total value of fish benefits, and as such provides a conservative estimate of benefits from increased fish passage.
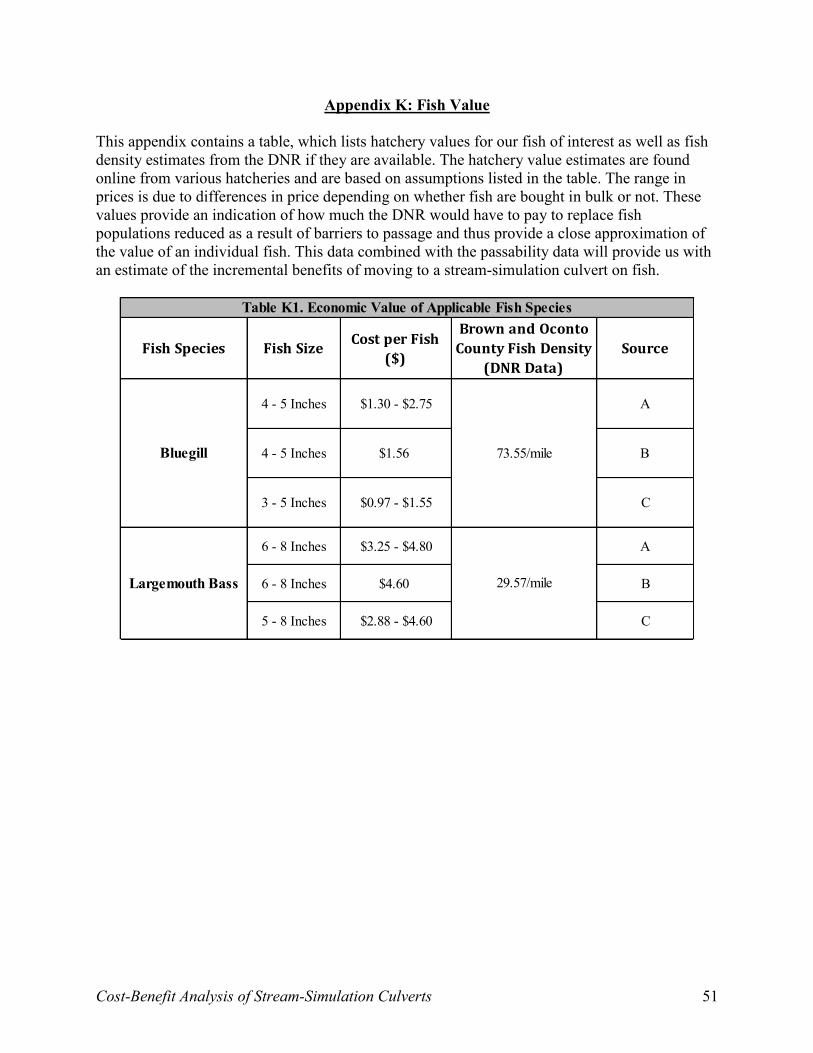
Cost-Benefit Analysis of Stream-Simulation Culverts 51
Appendix K: Fish Value This appendix contains a table, which lists hatchery values for our fish of interest as well as fish density estimates from the DNR if they are available. The hatchery value estimates are found online from various hatcheries and are based on assumptions listed in the table. The range in prices is due to differences in price depending on whether fish are bought in bulk or not. These values provide an indication of how much the DNR would have to pay to replace fish populations reduced as a result of barriers to passage and thus provide a close approximation of the value of an individual fish. This data combined with the passability data will provide us with an estimate of the incremental benefits of moving to a stream-simulation culvert on fish.
Fish Species Fish SizeCost per Fish
($)
Brown and Oconto
County Fish Density
(DNR Data)
Source
4 - 5 Inches $1.30 - $2.75 A
4 - 5 Inches $1.56 B
3 - 5 Inches $0.97 - $1.55 C
6 - 8 Inches $3.25 - $4.80 A
6 - 8 Inches $4.60 B
5 - 8 Inches $2.88 - $4.60 C
Table K1. Economic Value of Applicable Fish Species
Bluegill 73.55/mile
Largemouth Bass 29.57/mile
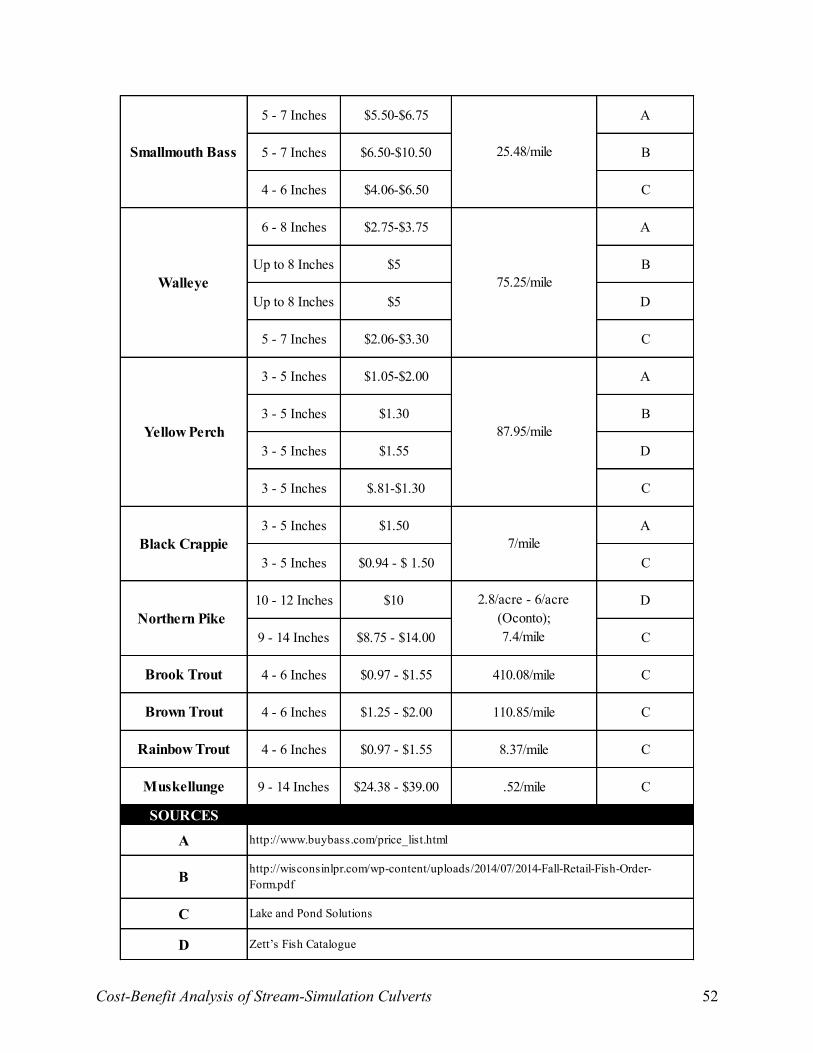
Cost-Benefit Analysis of Stream-Simulation Culverts 52
5 - 7 Inches $5.50-$6.75 A
5 - 7 Inches $6.50-$10.50 B
4 - 6 Inches $4.06-$6.50 C
6 - 8 Inches $2.75-$3.75 A
Up to 8 Inches $5 B
Up to 8 Inches $5 D
5 - 7 Inches $2.06-$3.30 C
3 - 5 Inches $1.05-$2.00 A
3 - 5 Inches $1.30 B
3 - 5 Inches $1.55 D
3 - 5 Inches $.81-$1.30 C
3 - 5 Inches $1.50 A
3 - 5 Inches $0.94 - $ 1.50 C
10 - 12 Inches $10 D
9 - 14 Inches $8.75 - $14.00 C
Brook Trout 4 - 6 Inches $0.97 - $1.55 410.08/mile C
Brown Trout 4 - 6 Inches $1.25 - $2.00 110.85/mile C
Rainbow Trout 4 - 6 Inches $0.97 - $1.55 8.37/mile C
Muskellunge 9 - 14 Inches $24.38 - $39.00 .52/mile C
SOURCES
A
B
C
D
Walleye 75.25/mile
Smallmouth Bass 25.48/mile
Yellow Perch 87.95/mile
7/mile
2.8/acre - 6/acre (Oconto); 7.4/mile
Black Crappie
Northern Pike
http://wisconsinlpr.com/wp-content/uploads/2014/07/2014-Fall-Retail-Fish-Order-Form.pdf
http://www.buybass.com/price_list.html
Lake and Pond Solutions
Zett’s Fish Catalogue

Cost-Benefit Analysis of Stream-Simulation Culverts 53
Fish Size Fish Species
Muskie
Northern Pike
Walleye
Brown Trout
Brook Trout
Largemouth Bass
Smallmouth Bass
Black Crappie
Bluegill
Yellow Perch
Table K2. Size of the Applicable Fish Species
Medium
Small
Large

Cost-Benefit Analysis of Stream-Simulation Culverts 54
Appendix L: Impact of Aquatic Life
The design of a culvert has a major impact on aquatic life, especially fish. An improperly designed culvert is impassable for fish, preventing migration and jeopardizing the fish population. The ability to migrate is key if species are to adapt to climate change (Lee et., al 2012, 13). In this appendix, we will address the negative impacts that impassable culverts have on fish including decreased genetic diversity, habitat loss, and water quality degradation. The Washington Department of Fish and Wildlife have identified five different ways that culverts can impede fish passage (Hansen et al., 2009, 3). First, there can be an excess drop at the culvert exit. Second, the velocity within the culvert can be too high. Third, the culvert is too shallow to allow proper flow of water. Fourth, the presence of turbulence within the culvert can prevent passage. Finally, debris can build up as a result of improper design. In Northeastern Wisconsin, one survey found that 67 percent of culverts were partially or totally impassible for fish (Hansen et al., 2009, 13). The impact of these impediments on fish population can be significant. Much of the work done related to fish impediments concerns the effects of dams on the west coast. Once an impediment is constructed it will change the composition of the river endangering the existing ecosystem (Ligon et al., 1995, 183). A study of damming of a river in Oregon found that the installation of a dam changed the composition of the river causing scarce spawning sites to be “overbuilt” and the population to decline by 50 percent (Ligon et al., 1995, 186). The impact of impassable culverts may be more severe for freshwater fish than coastal fish, as cross-lake migration is essential for freshwater fish (Hansen et al 2009, 10). A study of rivers in Illinois found that rivers, which feature impoundments, contain lower populations of game fish then free flowing rivers (Santucci et al., 2011, 981). In addition to blocking fish from moving to new rivers and streams, culverts can also degrade the water that fish currently live in (Hansen et al., 2009, 2). The Illinois study found that impounded rivers were characterized by having “severely degraded” water quality (Santucci et al., 2011, 982). The blockage that occurs from dams threatens fish in two ways. First, it prevents fish from migrating, which can be extremely harmful as climate change makes their current habitats increasingly inhospitable. In a review of the literature, Lee et al. found that the most common suggestion to ensure biodiversity in the face of climate change was to ensure habitat connectivity (Lee et al., 2012). This is especially true for fish as their options for migration are more constrained then land-based wildlife. The second way that blockage harms fish is through decreasing the biodiversity of the individual species. In a study of trout in Oregon, researchers found that rivers impeded by dams contained fish that were less genetically diverse and more isolated possibly jeopardizing the species (Wofford et al., 2005). The Washington Department of Fish and Wildlife state that aquatic barriers act as a filter holding weaker fish back and decreases genetic diversity of the weaker fish (Washington Department of Fish and Wildlife 2013). To summarize, poorly designed culverts hurt fish in several ways. First, they act as a barrier to migration. As climate change alters the nature of fish habitats, migration will be key to survival.

Cost-Benefit Analysis of Stream-Simulation Culverts 55
Second, they change the nature of the stream, which can threaten the reproduction practices of the fish. Third, they decrease genetic diversity by isolating populations of fish.
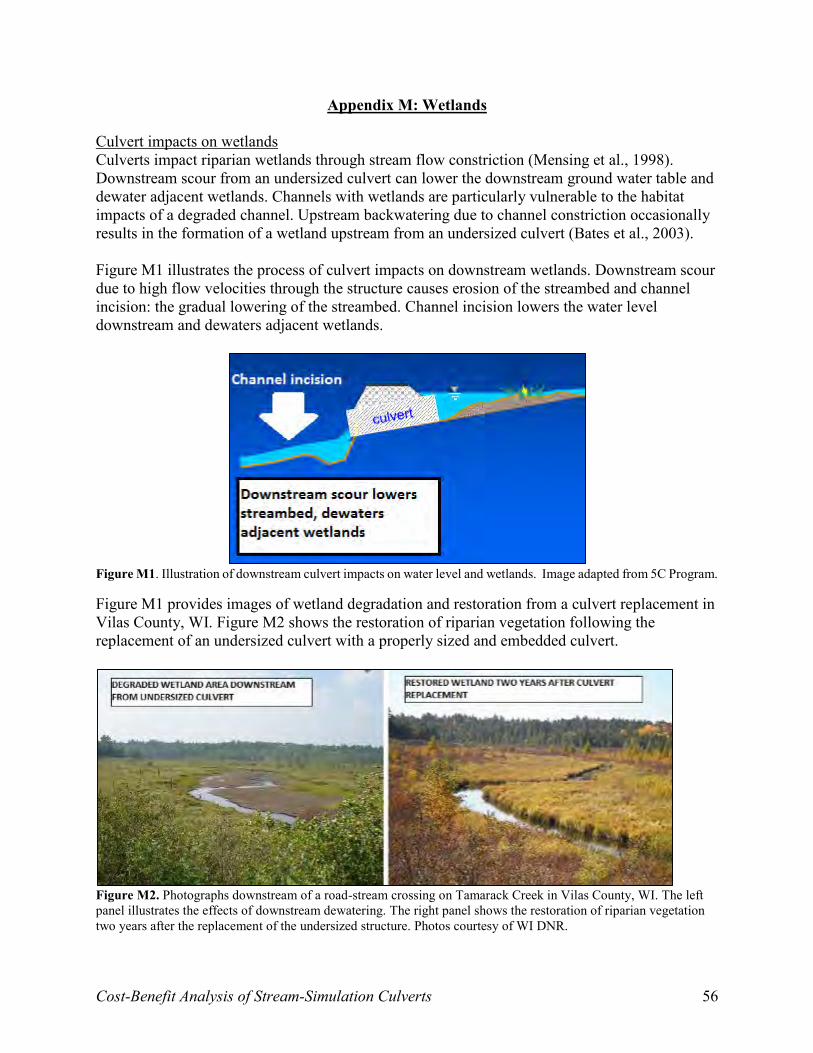
Cost-Benefit Analysis of Stream-Simulation Culverts 56
Appendix M: Wetlands Culvert impacts on wetlands Culverts impact riparian wetlands through stream flow constriction (Mensing et al., 1998). Downstream scour from an undersized culvert can lower the downstream ground water table and dewater adjacent wetlands. Channels with wetlands are particularly vulnerable to the habitat impacts of a degraded channel. Upstream backwatering due to channel constriction occasionally results in the formation of a wetland upstream from an undersized culvert (Bates et al., 2003). Figure M1 illustrates the process of culvert impacts on downstream wetlands. Downstream scour due to high flow velocities through the structure causes erosion of the streambed and channel incision: the gradual lowering of the streambed. Channel incision lowers the water level downstream and dewaters adjacent wetlands.
Figure M1. Illustration of downstream culvert impacts on water level and wetlands. Image adapted from 5C Program.
Figure M1 provides images of wetland degradation and restoration from a culvert replacement in Vilas County, WI. Figure M2 shows the restoration of riparian vegetation following the replacement of an undersized culvert with a properly sized and embedded culvert.
Figure M2. Photographs downstream of a road-stream crossing on Tamarack Creek in Vilas County, WI. The left panel illustrates the effects of downstream dewatering. The right panel shows the restoration of riparian vegetation two years after the replacement of the undersized structure. Photos courtesy of WI DNR.

Cost-Benefit Analysis of Stream-Simulation Culverts 57
Wetland legal requirements Both state and federal law protect wetlands. Wisc. Stat. §30.2022 requires the WI Department of Transportation to mitigate wetland impacts of projects that affect wetlands, including culverts. Culverts that impact wetlands may also be subject to federal permitting requirements under the Clean Water Act §404. Wetland restoration cost Wetlands perform a large variety of ecological functions that result in both environmental and social benefits. We use estimates of wetland restoration costs as a proxy of these benefits. King and Bohlen (1994) provide a synthesis of wetland restoration cost data for 1,000 projects in 1993. Average wetland restoration costs in the study vary depending on the type of wetland and range from $18,100/acre for salt marshes to $77,900/acre for forested wetland (1993$). For the purposes of this analysis, we estimate wetland restoration cost as a function of the average restoration cost for forested wetland ($128,000 in 2014$) and the percent of forest cover in the watershed:
Equation M.1 𝑤𝑒𝑡𝑙𝑎𝑛𝑑 𝑟𝑒𝑠𝑡𝑜𝑟𝑎𝑡𝑖𝑜𝑛 𝑐𝑜𝑠𝑡/𝑎𝑐𝑟𝑒 = $128,000 ∗
𝑓𝑜𝑟𝑒𝑠𝑡 𝑎𝑐𝑟𝑒𝑎𝑔𝑒
𝑤𝑎𝑡𝑒𝑟𝑠ℎ𝑒𝑑 𝑎𝑐𝑟𝑒𝑎𝑔𝑒
Equation M.1 results in negligible restoration estimates for non-forested wetlands that nonetheless serve a variety of ecosystem functions. We therefore set a lower bound for wetland restoration cost based on King and Bohlen (1994) estimated restoration cost of $25,300 for freshwater mixed wetland habitat, or $41,571/acre in 2014$. Estimation of wetland impacts Stream simulation design reduces or eliminates wetland impacts by reducing channel constriction, downstream scour, and channel incision. Therefore stream simulation design results in a net gain of wetland acreage. The quantification of the gain of wetland acreage that results from the replacement of an undersized culvert with a stream simulation design is an uncertain task. Our literature search produced few useful estimates of the incremental impact and little research is available on the impact of road crossings on wetlands (Miller and Finley, 1997). A 1997 study of the downstream impacts of two culverts on wetlands in North Carolina provides a limited means of quantifying culvert impacts on wetlands. The study contains four findings pertinent to our analysis:
Upstream backwatering resulted in a relative increase of about 0.30 acres of the upstream area relative to the downstream area within 60 meters at one of the study sites.
Downstream wetlands at the two study sites had 37 and 38 percent less basal area (sum of tree diameters) than a reference area, and about 42-48 percent less biomass than the upstream areas.
Upstream backwatering at one site lowered the downstream water depth about 20 cm relative to the upstream water level. Changes in water depth can alter plant communities in wetlands.
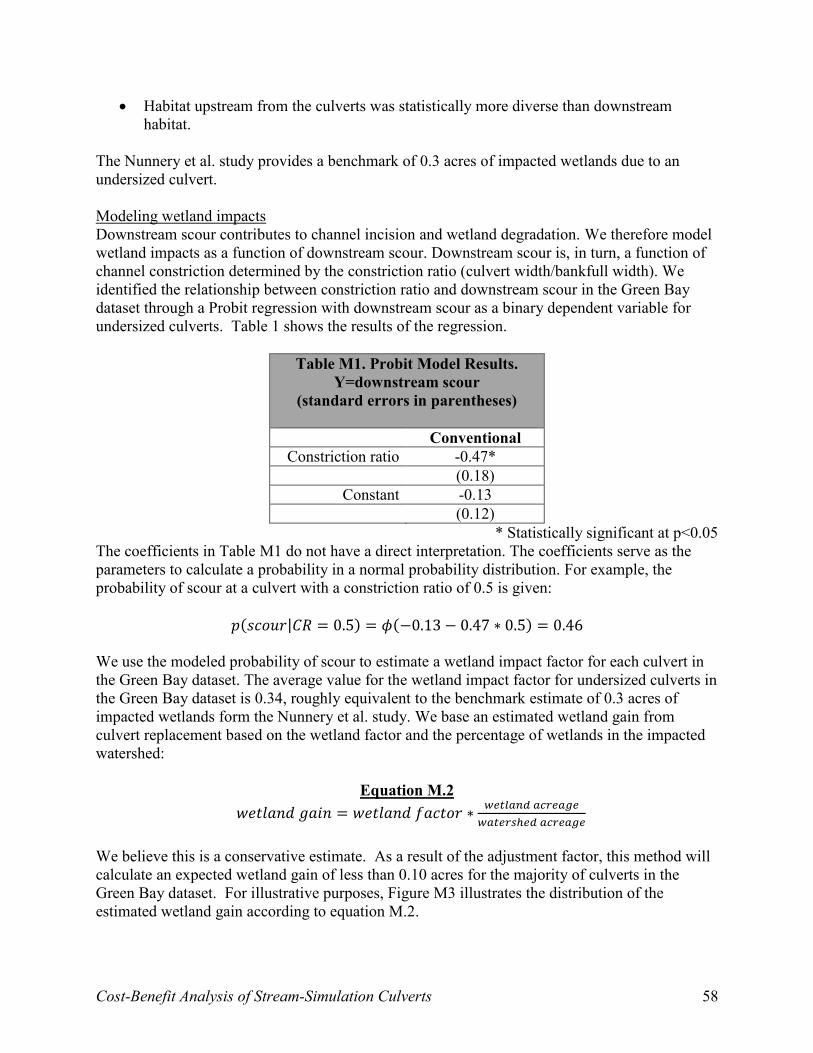
Cost-Benefit Analysis of Stream-Simulation Culverts 58
Habitat upstream from the culverts was statistically more diverse than downstream habitat.
The Nunnery et al. study provides a benchmark of 0.3 acres of impacted wetlands due to an undersized culvert. Modeling wetland impacts Downstream scour contributes to channel incision and wetland degradation. We therefore model wetland impacts as a function of downstream scour. Downstream scour is, in turn, a function of channel constriction determined by the constriction ratio (culvert width/bankfull width). We identified the relationship between constriction ratio and downstream scour in the Green Bay dataset through a Probit regression with downstream scour as a binary dependent variable for undersized culverts. Table 1 shows the results of the regression.
Table M1. Probit Model Results. Y=downstream scour
(standard errors in parentheses)
Conventional Constriction ratio -0.47*
(0.18) Constant -0.13
(0.12) * Statistically significant at p<0.05
The coefficients in Table M1 do not have a direct interpretation. The coefficients serve as the parameters to calculate a probability in a normal probability distribution. For example, the probability of scour at a culvert with a constriction ratio of 0.5 is given:
𝑝(𝑠𝑐𝑜𝑢𝑟|𝐶𝑅 = 0.5) = 𝜙(−0.13 − 0.47 ∗ 0.5) = 0.46 We use the modeled probability of scour to estimate a wetland impact factor for each culvert in the Green Bay dataset. The average value for the wetland impact factor for undersized culverts in the Green Bay dataset is 0.34, roughly equivalent to the benchmark estimate of 0.3 acres of impacted wetlands form the Nunnery et al. study. We base an estimated wetland gain from culvert replacement based on the wetland factor and the percentage of wetlands in the impacted watershed:
Equation M.2 𝑤𝑒𝑡𝑙𝑎𝑛𝑑 𝑔𝑎𝑖𝑛 = 𝑤𝑒𝑡𝑙𝑎𝑛𝑑 𝑓𝑎𝑐𝑡𝑜𝑟 ∗
𝑤𝑒𝑡𝑙𝑎𝑛𝑑 𝑎𝑐𝑟𝑒𝑎𝑔𝑒
𝑤𝑎𝑡𝑒𝑟𝑠ℎ𝑒𝑑 𝑎𝑐𝑟𝑒𝑎𝑔𝑒
We believe this is a conservative estimate. As a result of the adjustment factor, this method will calculate an expected wetland gain of less than 0.10 acres for the majority of culverts in the Green Bay dataset. For illustrative purposes, Figure M3 illustrates the distribution of the estimated wetland gain according to equation M.2.
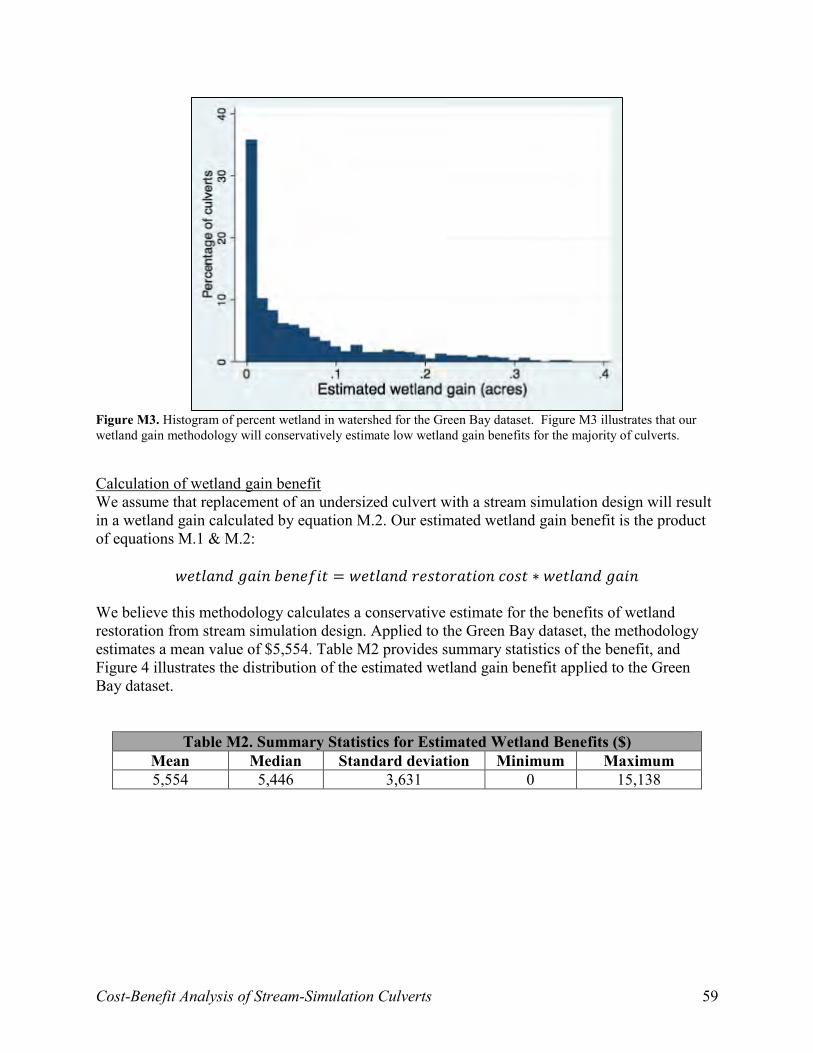
Cost-Benefit Analysis of Stream-Simulation Culverts 59
Figure M3. Histogram of percent wetland in watershed for the Green Bay dataset. Figure M3 illustrates that our wetland gain methodology will conservatively estimate low wetland gain benefits for the majority of culverts.
Calculation of wetland gain benefit We assume that replacement of an undersized culvert with a stream simulation design will result in a wetland gain calculated by equation M.2. Our estimated wetland gain benefit is the product of equations M.1 & M.2:
𝑤𝑒𝑡𝑙𝑎𝑛𝑑 𝑔𝑎𝑖𝑛 𝑏𝑒𝑛𝑒𝑓𝑖𝑡 = 𝑤𝑒𝑡𝑙𝑎𝑛𝑑 𝑟𝑒𝑠𝑡𝑜𝑟𝑎𝑡𝑖𝑜𝑛 𝑐𝑜𝑠𝑡 ∗ 𝑤𝑒𝑡𝑙𝑎𝑛𝑑 𝑔𝑎𝑖𝑛 We believe this methodology calculates a conservative estimate for the benefits of wetland restoration from stream simulation design. Applied to the Green Bay dataset, the methodology estimates a mean value of $5,554. Table M2 provides summary statistics of the benefit, and Figure 4 illustrates the distribution of the estimated wetland gain benefit applied to the Green Bay dataset.
Table M2. Summary Statistics for Estimated Wetland Benefits ($)
Mean Median Standard deviation Minimum Maximum 5,554 5,446 3,631 0 15,138
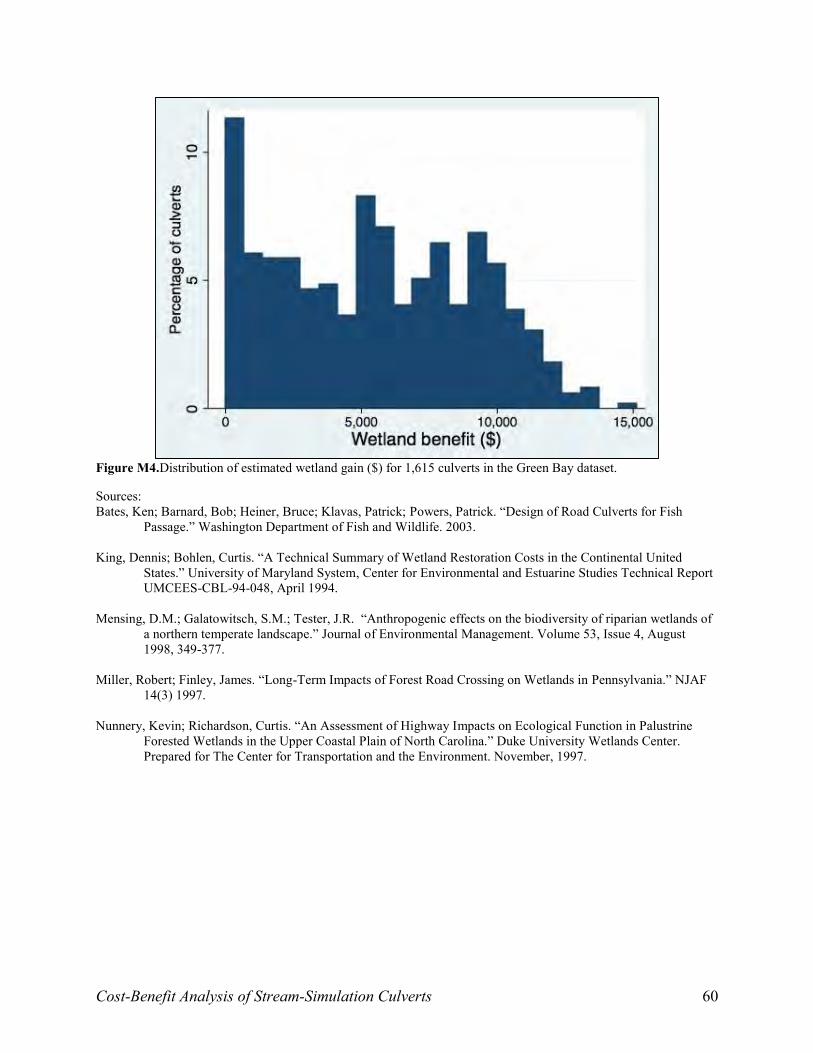
Cost-Benefit Analysis of Stream-Simulation Culverts 60
Figure M4.Distribution of estimated wetland gain ($) for 1,615 culverts in the Green Bay dataset.
Sources: Bates, Ken; Barnard, Bob; Heiner, Bruce; Klavas, Patrick; Powers, Patrick. “Design of Road Culverts for Fish
Passage.” Washington Department of Fish and Wildlife. 2003.
King, Dennis; Bohlen, Curtis. “A Technical Summary of Wetland Restoration Costs in the Continental United States.” University of Maryland System, Center for Environmental and Estuarine Studies Technical Report UMCEES-CBL-94-048, April 1994.
Mensing, D.M.; Galatowitsch, S.M.; Tester, J.R. “Anthropogenic effects on the biodiversity of riparian wetlands of
a northern temperate landscape.” Journal of Environmental Management. Volume 53, Issue 4, August 1998, 349-377.
Miller, Robert; Finley, James. “Long-Term Impacts of Forest Road Crossing on Wetlands in Pennsylvania.” NJAF 14(3) 1997.
Nunnery, Kevin; Richardson, Curtis. “An Assessment of Highway Impacts on Ecological Function in Palustrine Forested Wetlands in the Upper Coastal Plain of North Carolina.” Duke University Wetlands Center. Prepared for The Center for Transportation and the Environment. November, 1997.
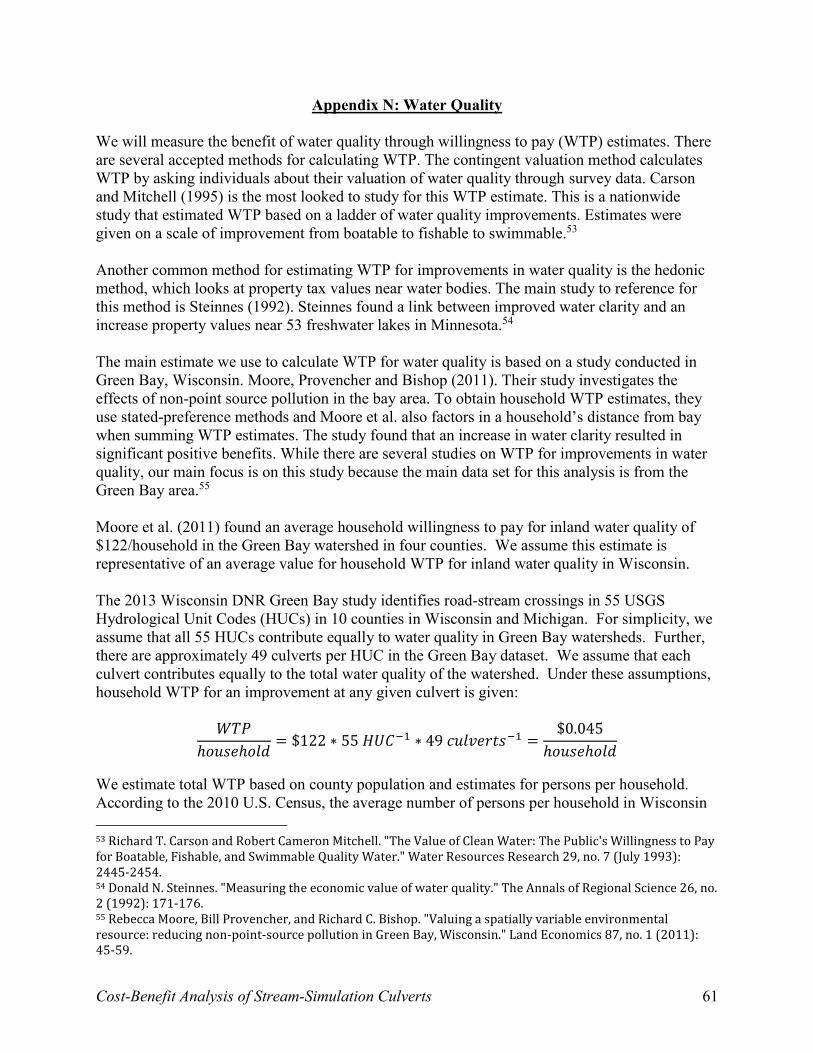
Cost-Benefit Analysis of Stream-Simulation Culverts 61
Appendix N: Water Quality We will measure the benefit of water quality through willingness to pay (WTP) estimates. There are several accepted methods for calculating WTP. The contingent valuation method calculates WTP by asking individuals about their valuation of water quality through survey data. Carson and Mitchell (1995) is the most looked to study for this WTP estimate. This is a nationwide study that estimated WTP based on a ladder of water quality improvements. Estimates were given on a scale of improvement from boatable to fishable to swimmable.53 Another common method for estimating WTP for improvements in water quality is the hedonic method, which looks at property tax values near water bodies. The main study to reference for this method is Steinnes (1992). Steinnes found a link between improved water clarity and an increase property values near 53 freshwater lakes in Minnesota.54 The main estimate we use to calculate WTP for water quality is based on a study conducted in Green Bay, Wisconsin. Moore, Provencher and Bishop (2011). Their study investigates the effects of non-point source pollution in the bay area. To obtain household WTP estimates, they use stated-preference methods and Moore et al. also factors in a household’s distance from bay when summing WTP estimates. The study found that an increase in water clarity resulted in significant positive benefits. While there are several studies on WTP for improvements in water quality, our main focus is on this study because the main data set for this analysis is from the Green Bay area.55 Moore et al. (2011) found an average household willingness to pay for inland water quality of $122/household in the Green Bay watershed in four counties. We assume this estimate is representative of an average value for household WTP for inland water quality in Wisconsin. The 2013 Wisconsin DNR Green Bay study identifies road-stream crossings in 55 USGS Hydrological Unit Codes (HUCs) in 10 counties in Wisconsin and Michigan. For simplicity, we assume that all 55 HUCs contribute equally to water quality in Green Bay watersheds. Further, there are approximately 49 culverts per HUC in the Green Bay dataset. We assume that each culvert contributes equally to the total water quality of the watershed. Under these assumptions, household WTP for an improvement at any given culvert is given:
𝑊𝑇𝑃
ℎ𝑜𝑢𝑠𝑒ℎ𝑜𝑙𝑑= $122 ∗ 55 𝐻𝑈𝐶−1 ∗ 49 𝑐𝑢𝑙𝑣𝑒𝑟𝑡𝑠−1 =
$0.045
ℎ𝑜𝑢𝑠𝑒ℎ𝑜𝑙𝑑
We estimate total WTP based on county population and estimates for persons per household. According to the 2010 U.S. Census, the average number of persons per household in Wisconsin 53 Richard T. Carson and Robert Cameron Mitchell. "The Value of Clean Water: The Public's Willingness to Pay for Boatable, Fishable, and Swimmable Quality Water." Water Resources Research 29, no. 7 (July 1993): 2445-2454. 54 Donald N. Steinnes. "Measuring the economic value of water quality." The Annals of Regional Science 26, no. 2 (1992): 171-176. 55 Rebecca Moore, Bill Provencher, and Richard C. Bishop. "Valuing a spatially variable environmental resource: reducing non-point-source pollution in Green Bay, Wisconsin." Land Economics 87, no. 1 (2011): 45-59.

Cost-Benefit Analysis of Stream-Simulation Culverts 62
was 2.43 persons/household, and the average number of persons per household in Michigan was 2.53 persons/household. We applied these figures to 2010 U.S. Census population estimates for each county to estimate total WTP per county. We assume that a water quality improvement will occur from the replacement of any existing culvert that currently results in sediment mobilization through downstream scour or upstream ponding. Approximately 39 percent of culverts (622 of 1,615) in the Green Bay dataset exhibit downstream scour (474 culverts) or upstream ponding (250 culverts). Under this methodology, total benefits from water quality improvement are given:
𝑊𝑇𝑃
𝑐𝑜𝑢𝑛𝑡𝑦=
$0.045
ℎ𝑜𝑢𝑠𝑒ℎ𝑜𝑙𝑑∗
ℎ𝑜𝑢𝑠𝑒ℎ𝑜𝑙𝑑
𝑐𝑜𝑢𝑛𝑡𝑦∗ 𝑆|𝑈𝑃
Where S|UP takes on a value of 1 if scour or upstream ponding is present at the existing culvert.

Cost-Benefit Analysis of Stream-Simulation Culverts 63
Appendix O: Willingness to Pay for Water Quality
Summary figures below are estimates from the literature on willingness to pay for improved water quality. We used these to inform our model estimate of willingness to pay. Methods: CV = Contingent Valuation TCM =Travel Cost Method Hedonic See next few pages for table.
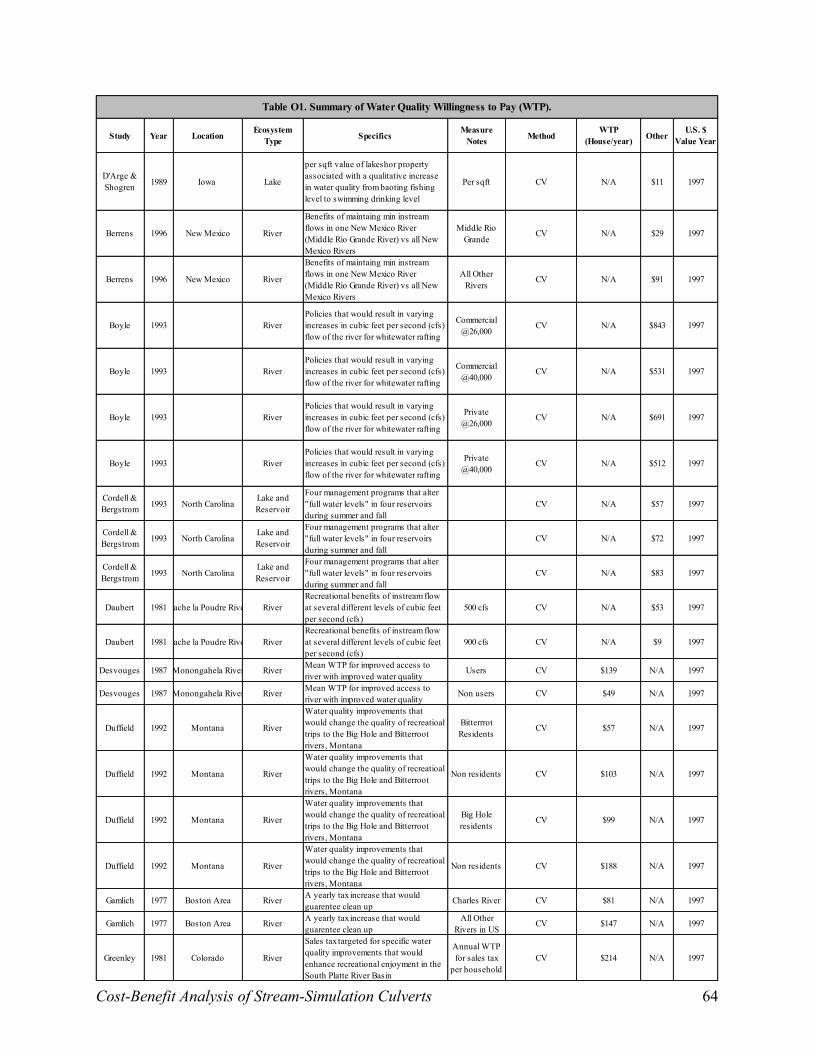
Cost-Benefit Analysis of Stream-Simulation Culverts 64
Study Year LocationEcosystem
Type SpecificsMeasure
Notes MethodWTP
(House/year) OtherU.S. $
Value Year
D'Arge & Shogren 1989 Iowa Lake
per sqft value of lakeshor property associated with a qualitative increase in water quality from baoting fishing level to swimming drinking level
Per sqft CV N/A $11 1997
Berrens 1996 New Mexico River
Benefits of maintaing min instream flows in one New Mexico River (Middle Rio Grande River) vs all New Mexico Rivers
Middle Rio Grande
CV N/A $29 1997
Berrens 1996 New Mexico River
Benefits of maintaing min instream flows in one New Mexico River (Middle Rio Grande River) vs all New Mexico Rivers
All Other Rivers
CV N/A $91 1997
Boyle 1993 RiverPolicies that would result in varying increases in cubic feet per second (cfs) flow of the river for whitewater rafting
Commercial @26,000
CV N/A $843 1997
Boyle 1993 RiverPolicies that would result in varying increases in cubic feet per second (cfs) flow of the river for whitewater rafting
Commercial @40,000
CV N/A $531 1997
Boyle 1993 RiverPolicies that would result in varying increases in cubic feet per second (cfs) flow of the river for whitewater rafting
Private @26,000
CV N/A $691 1997
Boyle 1993 RiverPolicies that would result in varying increases in cubic feet per second (cfs) flow of the river for whitewater rafting
Private @40,000
CV N/A $512 1997
Cordell & Bergstrom 1993 North Carolina
Lake and Reservoir
Four management programs that alter "full water levels" in four reservoirs during summer and fall
CV N/A $57 1997
Cordell & Bergstrom 1993 North Carolina
Lake and Reservoir
Four management programs that alter "full water levels" in four reservoirs during summer and fall
CV N/A $72 1997
Cordell & Bergstrom 1993 North Carolina
Lake and Reservoir
Four management programs that alter "full water levels" in four reservoirs during summer and fall
CV N/A $83 1997
Daubert 1981Cache la Poudre River RiverRecreational benefits of instream flow at several different levels of cubic feet per second (cfs)
500 cfs CV N/A $53 1997
Daubert 1981Cache la Poudre River RiverRecreational benefits of instream flow at several different levels of cubic feet per second (cfs)
900 cfs CV N/A $9 1997
Desvouges 1987 Monongahela River River Mean WTP for improved access to river with improved water quality
Users CV $139 N/A 1997
Desvouges 1987 Monongahela River River Mean WTP for improved access to river with improved water quality
Non users CV $49 N/A 1997
Duffield 1992 Montana River
Water quality improvements that would change the quality of recreatioal trips to the Big Hole and Bitterroot rivers, Montana
Bitterrrot Residents
CV $57 N/A 1997
Duffield 1992 Montana River
Water quality improvements that would change the quality of recreatioal trips to the Big Hole and Bitterroot rivers, Montana
Non residents CV $103 N/A 1997
Duffield 1992 Montana River
Water quality improvements that would change the quality of recreatioal trips to the Big Hole and Bitterroot rivers, Montana
Big Hole residents
CV $99 N/A 1997
Duffield 1992 Montana River
Water quality improvements that would change the quality of recreatioal trips to the Big Hole and Bitterroot rivers, Montana
Non residents CV $188 N/A 1997
Gamlich 1977 Boston Area River A yearly tax increase that would guarentee clean up
Charles River CV $81 N/A 1997
Gamlich 1977 Boston Area River A yearly tax increase that would guarentee clean up
All Other Rivers in US
CV $147 N/A 1997
Greenley 1981 Colorado River
Sales tax targeted for specific water quality improvements that would enhance recreational enjoyment in the South Platte River Basin
Annual WTP for sales tax
per householdCV $214 N/A 1997
Table O1. Summary of Water Quality Willingness to Pay (WTP).
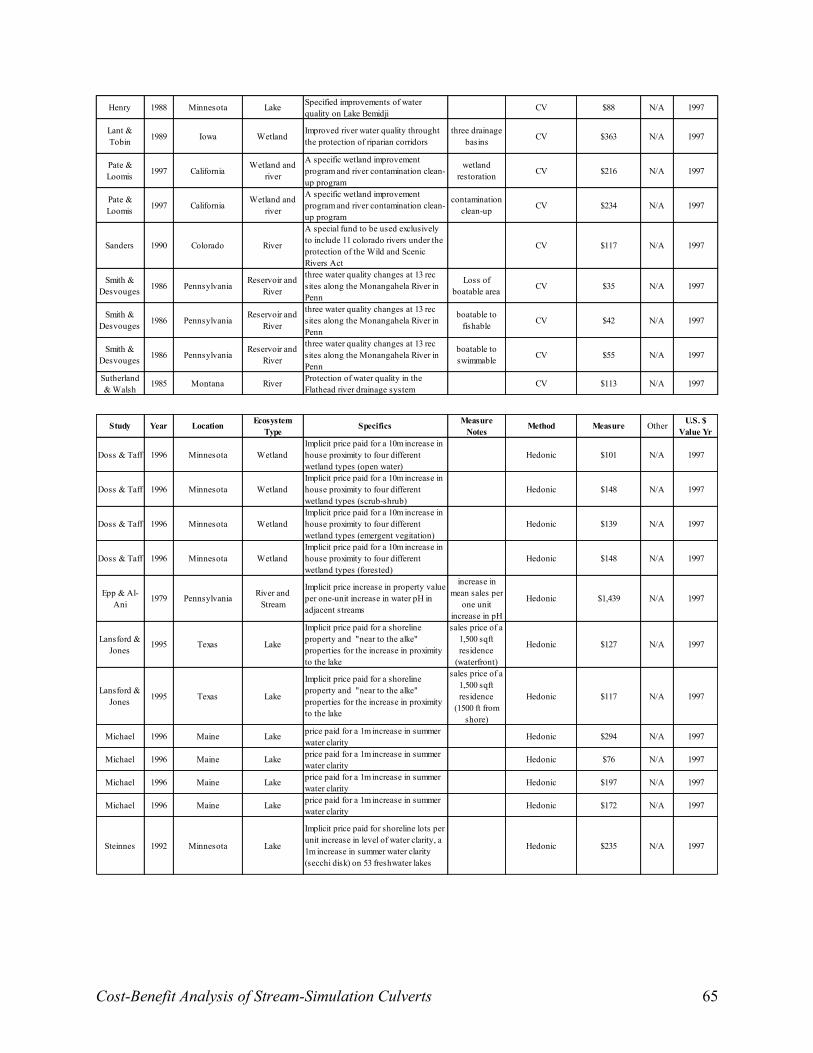
Cost-Benefit Analysis of Stream-Simulation Culverts 65
Henry 1988 Minnesota Lake Specified improvements of water quality on Lake Bemidji
CV $88 N/A 1997
Lant & Tobin 1989 Iowa Wetland
Improved river water quality throught the protection of riparian corridors
three drainage basins CV $363 N/A 1997
Pate & Loomis 1997 California
Wetland and river
A specific wetland improvement program and river contamination clean-up program
wetland restoration CV $216 N/A 1997
Pate & Loomis 1997 California
Wetland and river
A specific wetland improvement program and river contamination clean-up program
contamination clean-up CV $234 N/A 1997
Sanders 1990 Colorado River
A special fund to be used exclusively to include 11 colorado rivers under the protection of the Wild and Scenic Rivers Act
CV $117 N/A 1997
Smith & Desvouges 1986 Pennsylvania
Reservoir and River
three water quality changes at 13 rec sites along the Monangahela River in Penn
Loss of boatable area CV $35 N/A 1997
Smith & Desvouges 1986 Pennsylvania
Reservoir and River
three water quality changes at 13 rec sites along the Monangahela River in Penn
boatable to fishable CV $42 N/A 1997
Smith & Desvouges 1986 Pennsylvania
Reservoir and River
three water quality changes at 13 rec sites along the Monangahela River in Penn
boatable to swimmable CV $55 N/A 1997
Sutherland & Walsh
1985 Montana River Protection of water quality in the Flathead river drainage system
CV $113 N/A 1997
Study Year Location Ecosystem Type
Specifics Measure Notes
Method Measure Other U.S. $ Value Yr
Doss & Taff 1996 Minnesota WetlandImplicit price paid for a 10m increase in house proximity to four different wetland types (open water)
Hedonic $101 N/A 1997
Doss & Taff 1996 Minnesota WetlandImplicit price paid for a 10m increase in house proximity to four different wetland types (scrub-shrub)
Hedonic $148 N/A 1997
Doss & Taff 1996 Minnesota WetlandImplicit price paid for a 10m increase in house proximity to four different wetland types (emergent vegitation)
Hedonic $139 N/A 1997
Doss & Taff 1996 Minnesota WetlandImplicit price paid for a 10m increase in house proximity to four different wetland types (forested)
Hedonic $148 N/A 1997
Epp & Al-Ani
1979 Pennsylvania River and Stream
Implicit price increase in property value per one-unit increase in water pH in adjacent streams
increase in mean sales per
one unit increase in pH
Hedonic $1,439 N/A 1997
Lansford & Jones
1995 Texas Lake
Implicit price paid for a shoreline property and "near to the alke" properties for the increase in proximity to the lake
sales price of a 1,500 sqft residence
(waterfront)
Hedonic $127 N/A 1997
Lansford & Jones 1995 Texas Lake
Implicit price paid for a shoreline property and "near to the alke" properties for the increase in proximity to the lake
sales price of a 1,500 sqft residence
(1500 ft from shore)
Hedonic $117 N/A 1997
Michael 1996 Maine Lake price paid for a 1m increase in summer water clarity
Hedonic $294 N/A 1997
Michael 1996 Maine Lake price paid for a 1m increase in summer water clarity
Hedonic $76 N/A 1997
Michael 1996 Maine Lake price paid for a 1m increase in summer water clarity
Hedonic $197 N/A 1997
Michael 1996 Maine Lake price paid for a 1m increase in summer water clarity
Hedonic $172 N/A 1997
Steinnes 1992 Minnesota Lake
Implicit price paid for shoreline lots per unit increase in level of water clarity, a 1m increase in summer water clarity (secchi disk) on 53 freshwater lakes
Hedonic $235 N/A 1997
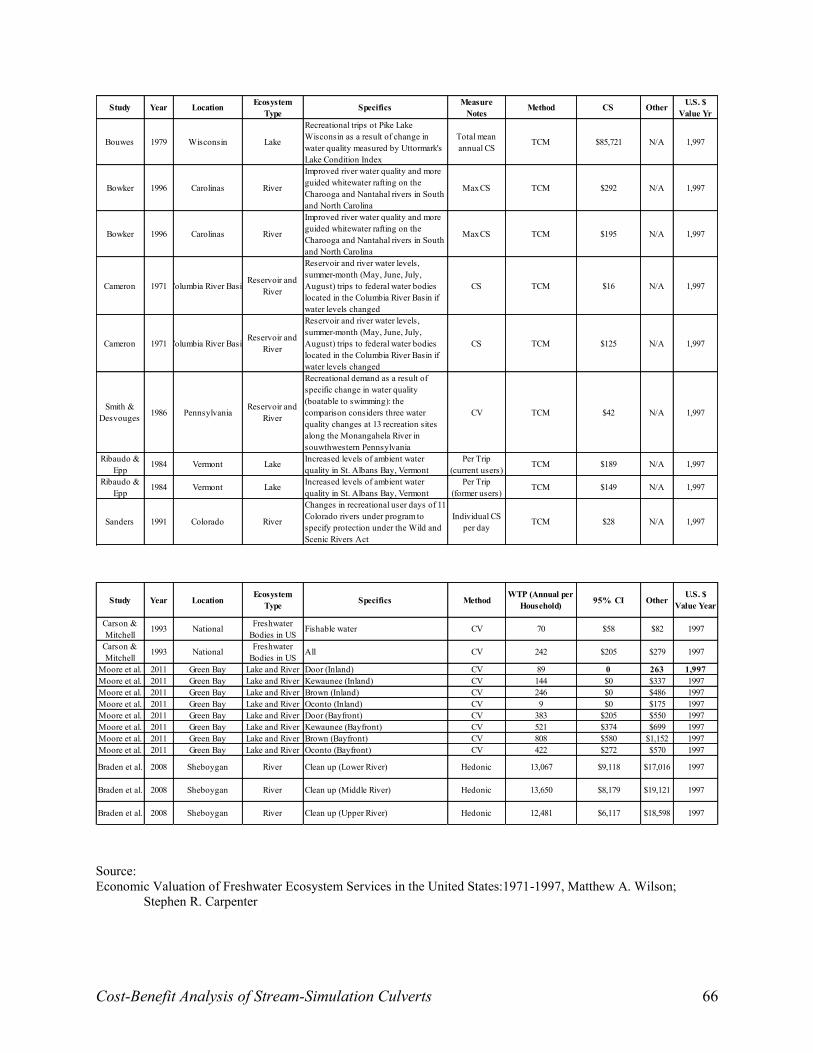
Cost-Benefit Analysis of Stream-Simulation Culverts 66
Source: Economic Valuation of Freshwater Ecosystem Services in the United States:1971-1997, Matthew A. Wilson;
Stephen R. Carpenter
Study Year Location Ecosystem Type
Specifics Measure Notes
Method CS Other U.S. $ Value Yr
Bouwes 1979 Wisconsin Lake
Recreational trips ot Pike Lake Wisconsin as a result of change in water quality measured by Uttormark's Lake Condition Index
Total mean annual CS
TCM $85,721 N/A 1,997
Bowker 1996 Carolinas River
Improved river water quality and more guided whitewater rafting on the Charooga and Nantahal rivers in South and North Carolina
Max CS TCM $292 N/A 1,997
Bowker 1996 Carolinas River
Improved river water quality and more guided whitewater rafting on the Charooga and Nantahal rivers in South and North Carolina
Max CS TCM $195 N/A 1,997
Cameron 1971 Columbia River BasinReservoir and
River
Reservoir and river water levels, summer-month (May, June, July, August) trips to federal water bodies located in the Columbia River Basin if water levels changed
CS TCM $16 N/A 1,997
Cameron 1971 Columbia River BasinReservoir and
River
Reservoir and river water levels, summer-month (May, June, July, August) trips to federal water bodies located in the Columbia River Basin if water levels changed
CS TCM $125 N/A 1,997
Smith & Desvouges 1986 Pennsylvania
Reservoir and River
Recreational demand as a result of specific change in water quality (boatable to swimming): the comparison considers three water quality changes at 13 recreation sites along the Monangahela River in souwthwestern Pennsylvania
CV TCM $42 N/A 1,997
Ribaudo & Epp
1984 Vermont Lake Increased levels of ambient water quality in St. Albans Bay, Vermont
Per Trip (current users)
TCM $189 N/A 1,997
Ribaudo & Epp
1984 Vermont Lake Increased levels of ambient water quality in St. Albans Bay, Vermont
Per Trip (former users)
TCM $149 N/A 1,997
Sanders 1991 Colorado River
Changes in recreational user days of 11 Colorado rivers under program to specify protection under the Wild and Scenic Rivers Act
Individual CS per day
TCM $28 N/A 1,997
Study Year LocationEcosystem
Type Specifics MethodWTP (Annual per
Household) 95% CI OtherU.S. $
Value Year
Carson & Mitchell
1993 National Freshwater Bodies in US
Fishable water CV 70 $58 $82 1997
Carson & Mitchell
1993 National Freshwater Bodies in US
All CV 242 $205 $279 1997
Moore et al. 2011 Green Bay Lake and River Door (Inland) CV 89 0 263 1,997Moore et al. 2011 Green Bay Lake and River Kewaunee (Inland) CV 144 $0 $337 1997Moore et al. 2011 Green Bay Lake and River Brown (Inland) CV 246 $0 $486 1997Moore et al. 2011 Green Bay Lake and River Oconto (Inland) CV 9 $0 $175 1997Moore et al. 2011 Green Bay Lake and River Door (Bayfront) CV 383 $205 $550 1997Moore et al. 2011 Green Bay Lake and River Kewaunee (Bayfront) CV 521 $374 $699 1997Moore et al. 2011 Green Bay Lake and River Brown (Bayfront) CV 808 $580 $1,152 1997Moore et al. 2011 Green Bay Lake and River Oconto (Bayfront) CV 422 $272 $570 1997
Braden et al. 2008 Sheboygan River Clean up (Lower River) Hedonic 13,067 $9,118 $17,016 1997
Braden et al. 2008 Sheboygan River Clean up (Middle River) Hedonic 13,650 $8,179 $19,121 1997
Braden et al. 2008 Sheboygan River Clean up (Upper River) Hedonic 12,481 $6,117 $18,598 1997
Cost-Benefit Analysis of Stream-Simulation Culverts 67
Appendix P: Road User Costs Large flows during flooding events can exceed the hydraulic capacity of culverts and cause the stream to overtop the roadway. Roadway overtopping temporarily obstructs roads and causes road user delays. We use a Federal Highway Administration (FHWA) online tool to estimate the costs of road downtime on Wisconsin drivers.56 Our methodology of road user costs due to roadway overtopping is given:
𝑟𝑜𝑎𝑑 𝑢𝑠𝑒𝑟 𝑐𝑜𝑠𝑡 = 𝑣𝑒ℎ𝑖𝑐𝑙𝑒𝑠 ∗$
𝑣𝑒ℎ𝑖𝑐𝑙𝑒 ∗ ℎ𝑟
Average Delay The delay caused by each overtopping or road construction event varies depending on the characteristics of the road and extent of repairs. If only one lane is blocked, the delay could be as short as slowing down to 30 miles per hour to travel through a work zone. If both lanes are blocked, then a detour the road could be detoured for a mile or many miles. Without having more information about the specific characteristics of the road and surrounding areas, we make a conservative assumption of an average delay of 10 minutes. Value of Time The value of a road user’s time depends on if they are traveling for business or personal reasons. The FHWA’s model considers both intercity and local travel. Our contact with Wisconsin Cities revealed that very few cities use culverts within city limits, therefore we do not consider local travel costs.57 The value of an hour of personal travel is derived from 50 percent of the area’s median annual household income divided by 2080 work hours in a year. According to the US Census bureau, Wisconsin’s mean household income for 2008-12 is $52,627.58 Under this figure, the value of personal travel is (0.5*52,627)/2080=$12.65/person. The FHWA assumes a value of 1.67 persons per vehicle, therefore the value of personal travel is 1.67*$12.65=$21.13/vehicle/hour, or $3.52/vehicle for a 10-minute delay. Business travel time cost uses 100 percent of median hourly wages plus benefits. FHWA uses the Bureau of Labor Statistics reported cost per employee, which as of June 2014 is $30.11 per hour.59 The FHWA assumes 1.24 persons per vehicle for business travel, so that travel value per vehicle is 1.24*$30.11=$37.34/vehicle/hour, or $6.22/vehicle for a 10-minute delay. The FHWA tool also estimates values for trucking delays. The estimate of travel time value for trucking $18.42/hr ($16.89 in 2009$), or $3.07 for a 10-minute delay. We therefore assume an average business travel time value (business and trucking) of ($6.22+$3.07)/2=$4.65 for a 10-minute delay.
56 Federal Highway Administration Work Zone Road User Costs- Concepts and Applications http://www.ops.fhwa.dot.gov/wz/resources/publications/fhwahop12005/index.htm 57 County Contact data 58 US Census Bureau http://quickfacts.census.gov/qfd/states/55000.html 59 Bureau of Labor Statistics http://www.bls.gov/news.release/ecec.htm
Cost-Benefit Analysis of Stream-Simulation Culverts 68
We assume that 94 percent of travel is personal and 6 percent of travel is business, based on a FHWA literature review. Overtopping frequency We assume that conventional culverts overtop during 25 and 50-year flood events. We assume that overtopping during the 25-year flood event causes one day of road downtime, while overtopping during a 50-year flood event causes two days of road downtime.60 Therefore the probability of road overtopping for conventional culverts in any given year simplifies to (1/25)*(1/50)=2/25. We conservatively assume that stream-simulation culverts will overtop during a 50-year flood event and result in one day of road downtime. We interviewed engineers Bob Moore and Todd Riebau P.E. from the construction contract firm CONTECH Engineering Solutions LLC to learn about realistic culvert repair times.61 Culvert repairs can take from 1 day to 1 month, or 1 to 2 weeks on average. We therefore assume road downtime of one week following a catastrophic culvert failure (see Appendix T). We assume that culverts with adequate road fill above the structure will not cause roadway overtopping. We assume that all culverts with road fill depth greater than or equal to the stream bankfull width do not cause roadway overtopping during flood events. Vehicles per Day We use DOT 2009 Historical Traffic county maps to determine the number of vehicles on a given road.62 There is a large variance in the number of drivers on different road types. We assume daily traffic of 10 vehicles on private roads, 500 vehicles on non-highway public roads, and 1,000 vehicles on highways. Calculations Our complete road user cost methodology is:
𝑟𝑜𝑎𝑑 𝑢𝑠𝑒𝑟 𝑐𝑜𝑠𝑡 = (𝑉𝑝,𝑟 ∗ 3.52) + (𝑉𝑏,𝑟 ∗ 4.65) Where Vp,r is the number of vehicles of personal travel on road type r, and Vb,r is number of vehicles of business travel on road type r. We assume that 94 percent of vehicles are on personal travel, and 6 percent of vehicles are on business travel. Therefore for personal travel we assume 9.4, 470, and 940 vehicles on private, non-highway public, and highways respectively, and for business travel we assume 0.6, 30, and 60 vehicles on private, non-highway public, and highways respectively.
60 State of Florida DOT, Drainage Handbook Culvert Design http://www.dot.state.fl.us/rddesign/Drainage/files/CulvertHB.pdf 61 Engineering Interview, Nitty Gritty, 11/10/14 62 Historical Traffic count maps by county, http://www.dot.wisconsin.gov/travel/counts/maps.htm
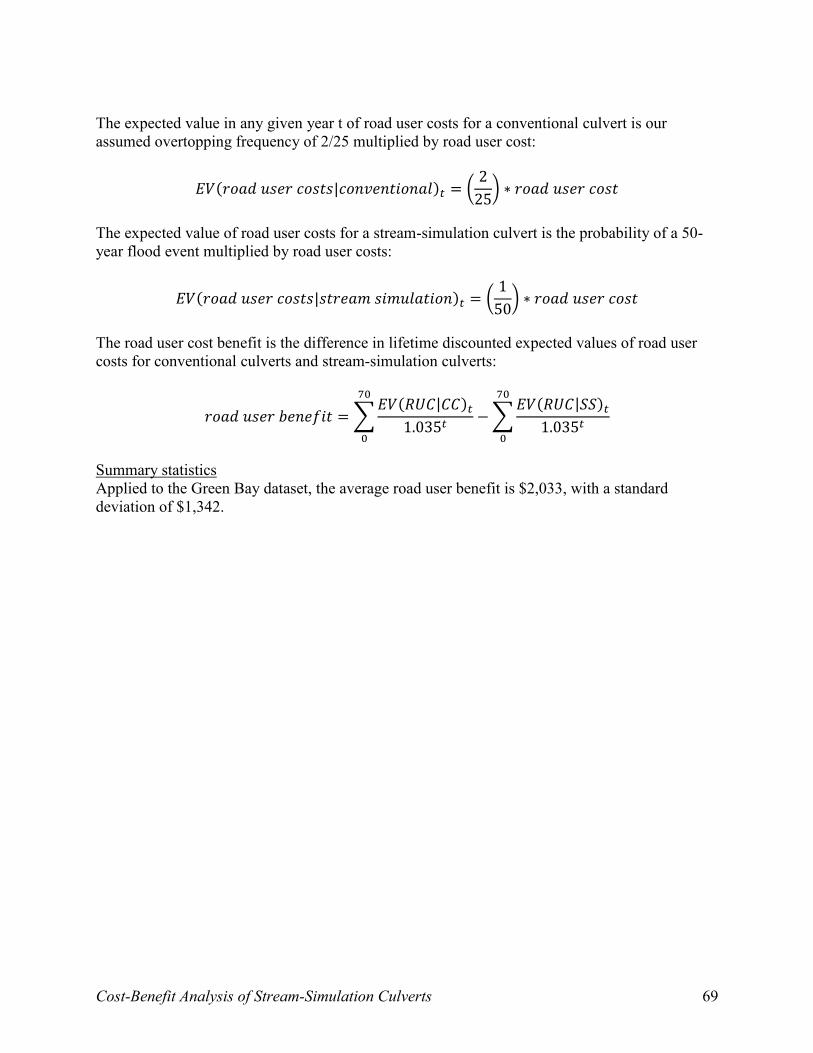
Cost-Benefit Analysis of Stream-Simulation Culverts 69
The expected value in any given year t of road user costs for a conventional culvert is our assumed overtopping frequency of 2/25 multiplied by road user cost:
𝐸𝑉(𝑟𝑜𝑎𝑑 𝑢𝑠𝑒𝑟 𝑐𝑜𝑠𝑡𝑠|𝑐𝑜𝑛𝑣𝑒𝑛𝑡𝑖𝑜𝑛𝑎𝑙)𝑡 = (2
25) ∗ 𝑟𝑜𝑎𝑑 𝑢𝑠𝑒𝑟 𝑐𝑜𝑠𝑡
The expected value of road user costs for a stream-simulation culvert is the probability of a 50-year flood event multiplied by road user costs:
𝐸𝑉(𝑟𝑜𝑎𝑑 𝑢𝑠𝑒𝑟 𝑐𝑜𝑠𝑡𝑠|𝑠𝑡𝑟𝑒𝑎𝑚 𝑠𝑖𝑚𝑢𝑙𝑎𝑡𝑖𝑜𝑛)𝑡 = (1
50) ∗ 𝑟𝑜𝑎𝑑 𝑢𝑠𝑒𝑟 𝑐𝑜𝑠𝑡
The road user cost benefit is the difference in lifetime discounted expected values of road user costs for conventional culverts and stream-simulation culverts:
𝑟𝑜𝑎𝑑 𝑢𝑠𝑒𝑟 𝑏𝑒𝑛𝑒𝑓𝑖𝑡 = ∑𝐸𝑉(𝑅𝑈𝐶|𝐶𝐶)𝑡
1.035𝑡− ∑
𝐸𝑉(𝑅𝑈𝐶|𝑆𝑆)𝑡
1.035𝑡
70
0
70
0
Summary statistics Applied to the Green Bay dataset, the average road user benefit is $2,033, with a standard deviation of $1,342.

Cost-Benefit Analysis of Stream-Simulation Culverts 70
Appendix Q: Reduced Flood Damage Stream simulation design culverts allow water to properly flow within the streambed during intense storms. This reduces the probability of flood-related damages, such as road washout and catastrophic culvert failure. Units We use the estimated magnitude of 25-year flood events using inches of precipitation in a 24-hour period. We use dollars per cleanup and construction to estimate the costs of a culvert failure and road washout. Methodology We use regression analysis outputs primarily from two studies to estimate the magnitude of 25-year flood events in Wisconsin. Both analyses were conducted by, or in cooperation with, Wisconsin state agencies. The first looks at regional flood-frequency characteristics of Wisconsin streams, and was produced by the United States Geological Survey and the Wisconsin Department of Transportation. The second analyzes downscaled projections of the impact of climate change on flood-frequency of Wisconsin streams, and was produced by the UW-Madison Department of Civil and Environmental Engineering with data from the Wisconsin Initiative on Climate Change Impacts (WICCI), which is comprised of the Wisconsin DNR and the University of Wisconsin. Using primarily these studies, we will estimate the probability of a 24-hour precipitation exceeding the benchmark capacity for a stream in a given region. Each region will use a different equation to estimate flood-peak characteristics, the dependent variable. Independent variables include:
Drainage area (square miles) Main-channel slope (feet/mile) Storage (percentage of the drainage area) Forest cover (percentage of the drainage area) 25-year precipitation index (inches) Mean annual snowfall (inches) Soil Permeability (inches/hour)
See Appendices R and S for more information on regression methodology. We use the results from these two studies as benchmarks to ground estimates from a study comparing the rates of failure of conventional and stream simulation culverts during Hurricane Irene. Culverts in the Irene study experienced 24-hour rainfall of 6.7 inches. We then estimate the probability of a catastrophic culvert failure given a category of flood event. Using evidence from Hurricane Irene, we assume that conventional culverts will fail a 25 year flood, and stream simulation culverts will pass a 25 year flood. We then estimate the cost of culvert repair due to flooding. We collected O&M cost data from county highway departments. This data includes hourly wages for maintenance workers (see Appendix G). We filled gaps in the Wisconsin-based data from studies detailing costs of maintenance in Maine, which includes the cost of mobilizing a truck ($200). From this data, we estimate the average cost of cleanup costs to be $748 for emergency culvert cleanup ($200 mobilization costs and $548 variable cleanup costs). For flood damage cleanup, we multiply the cleanup rates by four to account for the emergency costs of the cleanup based on empirically
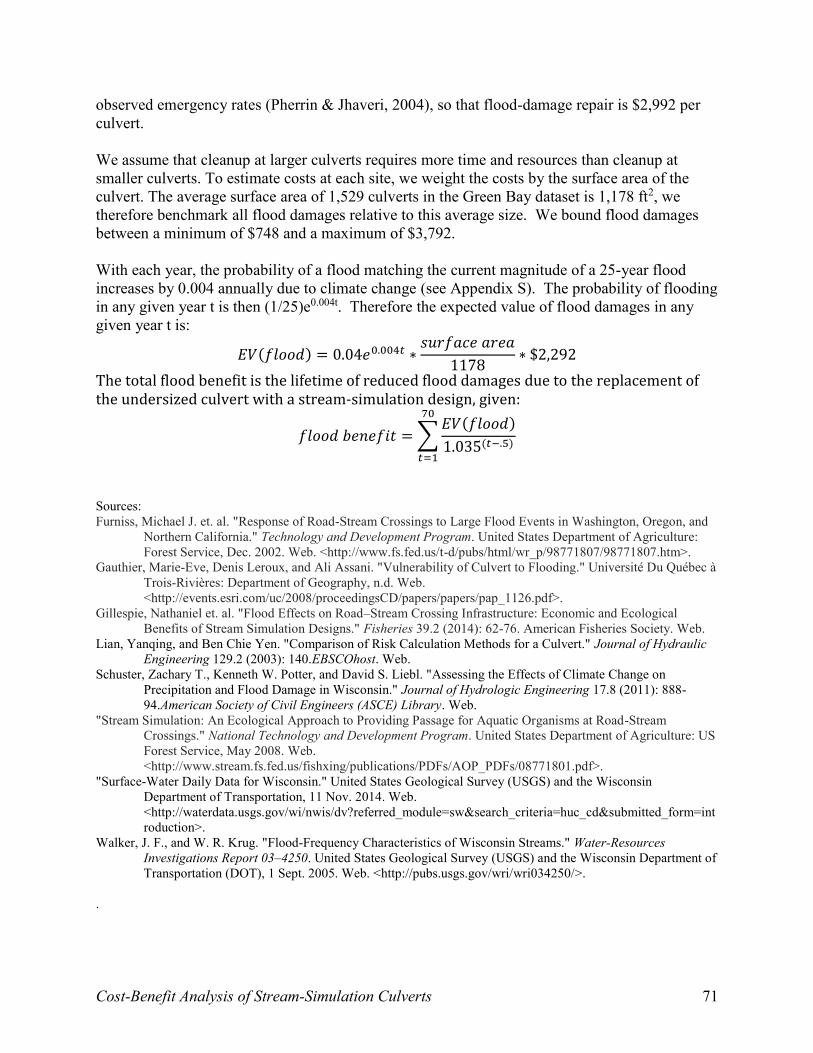
Cost-Benefit Analysis of Stream-Simulation Culverts 71
observed emergency rates (Pherrin & Jhaveri, 2004), so that flood-damage repair is $2,992 per culvert. We assume that cleanup at larger culverts requires more time and resources than cleanup at smaller culverts. To estimate costs at each site, we weight the costs by the surface area of the culvert. The average surface area of 1,529 culverts in the Green Bay dataset is 1,178 ft2, we therefore benchmark all flood damages relative to this average size. We bound flood damages between a minimum of $748 and a maximum of $3,792. With each year, the probability of a flood matching the current magnitude of a 25-year flood increases by 0.004 annually due to climate change (see Appendix S). The probability of flooding in any given year t is then (1/25)e0.004t. Therefore the expected value of flood damages in any given year t is:
𝐸𝑉(𝑓𝑙𝑜𝑜𝑑) = 0.04𝑒0.004𝑡 ∗𝑠𝑢𝑟𝑓𝑎𝑐𝑒 𝑎𝑟𝑒𝑎
1178∗ $2,292
The total flood benefit is the lifetime of reduced flood damages due to the replacement of the undersized culvert with a stream-simulation design, given:
𝑓𝑙𝑜𝑜𝑑 𝑏𝑒𝑛𝑒𝑓𝑖𝑡 = ∑𝐸𝑉(𝑓𝑙𝑜𝑜𝑑)
1.035(𝑡−.5)
70
𝑡=1
Sources: Furniss, Michael J. et. al. "Response of Road-Stream Crossings to Large Flood Events in Washington, Oregon, and
Northern California." Technology and Development Program. United States Department of Agriculture: Forest Service, Dec. 2002. Web. <http://www.fs.fed.us/t-d/pubs/html/wr_p/98771807/98771807.htm>.
Gauthier, Marie-Eve, Denis Leroux, and Ali Assani. "Vulnerability of Culvert to Flooding." Université Du Québec à Trois-Rivières: Department of Geography, n.d. Web. <http://events.esri.com/uc/2008/proceedingsCD/papers/papers/pap_1126.pdf>.
Gillespie, Nathaniel et. al. "Flood Effects on Road–Stream Crossing Infrastructure: Economic and Ecological Benefits of Stream Simulation Designs." Fisheries 39.2 (2014): 62-76. American Fisheries Society. Web.
Lian, Yanqing, and Ben Chie Yen. "Comparison of Risk Calculation Methods for a Culvert." Journal of Hydraulic Engineering 129.2 (2003): 140.EBSCOhost. Web.
Schuster, Zachary T., Kenneth W. Potter, and David S. Liebl. "Assessing the Effects of Climate Change on Precipitation and Flood Damage in Wisconsin." Journal of Hydrologic Engineering 17.8 (2011): 888-94.American Society of Civil Engineers (ASCE) Library. Web.
"Stream Simulation: An Ecological Approach to Providing Passage for Aquatic Organisms at Road-Stream Crossings." National Technology and Development Program. United States Department of Agriculture: US Forest Service, May 2008. Web. <http://www.stream.fs.fed.us/fishxing/publications/PDFs/AOP_PDFs/08771801.pdf>.
"Surface-Water Daily Data for Wisconsin." United States Geological Survey (USGS) and the Wisconsin Department of Transportation, 11 Nov. 2014. Web. <http://waterdata.usgs.gov/wi/nwis/dv?referred_module=sw&search_criteria=huc_cd&submitted_form=introduction>.
Walker, J. F., and W. R. Krug. "Flood-Frequency Characteristics of Wisconsin Streams." Water-Resources Investigations Report 03–4250. United States Geological Survey (USGS) and the Wisconsin Department of Transportation (DOT), 1 Sept. 2005. Web. <http://pubs.usgs.gov/wri/wri034250/>.
.
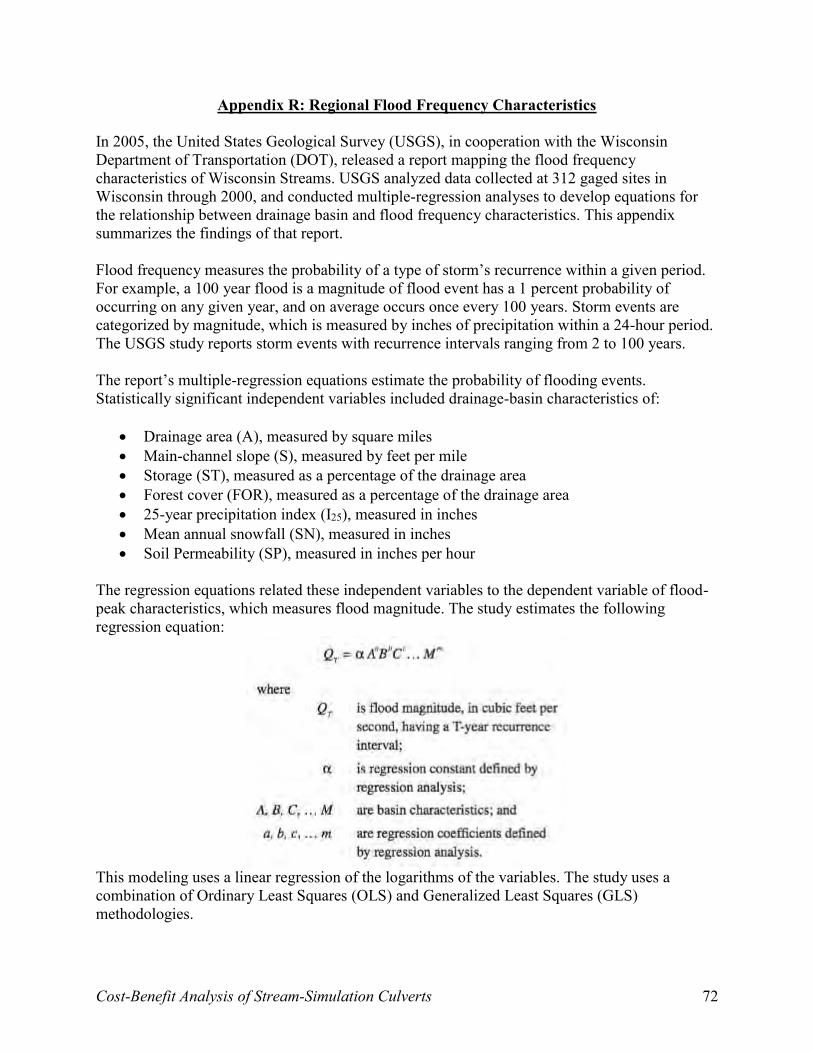
Cost-Benefit Analysis of Stream-Simulation Culverts 72
Appendix R: Regional Flood Frequency Characteristics In 2005, the United States Geological Survey (USGS), in cooperation with the Wisconsin Department of Transportation (DOT), released a report mapping the flood frequency characteristics of Wisconsin Streams. USGS analyzed data collected at 312 gaged sites in Wisconsin through 2000, and conducted multiple-regression analyses to develop equations for the relationship between drainage basin and flood frequency characteristics. This appendix summarizes the findings of that report. Flood frequency measures the probability of a type of storm’s recurrence within a given period. For example, a 100 year flood is a magnitude of flood event has a 1 percent probability of occurring on any given year, and on average occurs once every 100 years. Storm events are categorized by magnitude, which is measured by inches of precipitation within a 24-hour period. The USGS study reports storm events with recurrence intervals ranging from 2 to 100 years. The report’s multiple-regression equations estimate the probability of flooding events. Statistically significant independent variables included drainage-basin characteristics of:
Drainage area (A), measured by square miles Main-channel slope (S), measured by feet per mile Storage (ST), measured as a percentage of the drainage area Forest cover (FOR), measured as a percentage of the drainage area 25-year precipitation index (I25), measured in inches Mean annual snowfall (SN), measured in inches Soil Permeability (SP), measured in inches per hour
The regression equations related these independent variables to the dependent variable of flood-peak characteristics, which measures flood magnitude. The study estimates the following regression equation:
This modeling uses a linear regression of the logarithms of the variables. The study uses a combination of Ordinary Least Squares (OLS) and Generalized Least Squares (GLS) methodologies.

Cost-Benefit Analysis of Stream-Simulation Culverts 73
The following tables and geological maps demonstrate the regional variation of flood-frequency characteristics in Wisconsin. Figure R1 maps five geological regions used in the multiple-regression analyses. Figure R2 shows the range of basin characteristics of the five regions. Figure R3 shows the best-fit regression equations for estimating flood-frequency in these five regions. Figure R4 maps climatic sections for 25-year 24-hour precipitation. Figure R5 maps soil permeability, which impacts the probability of flooding given a particular amount of precipitation.
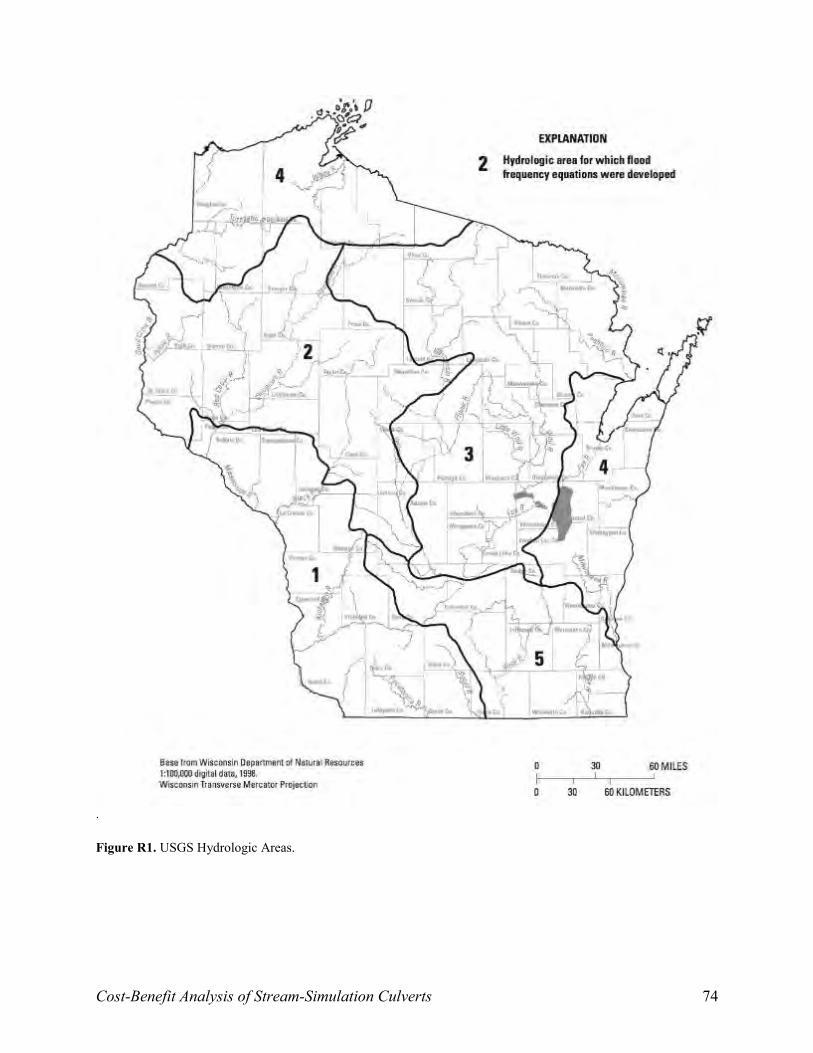
Cost-Benefit Analysis of Stream-Simulation Culverts 74
. Figure R1. USGS Hydrologic Areas.
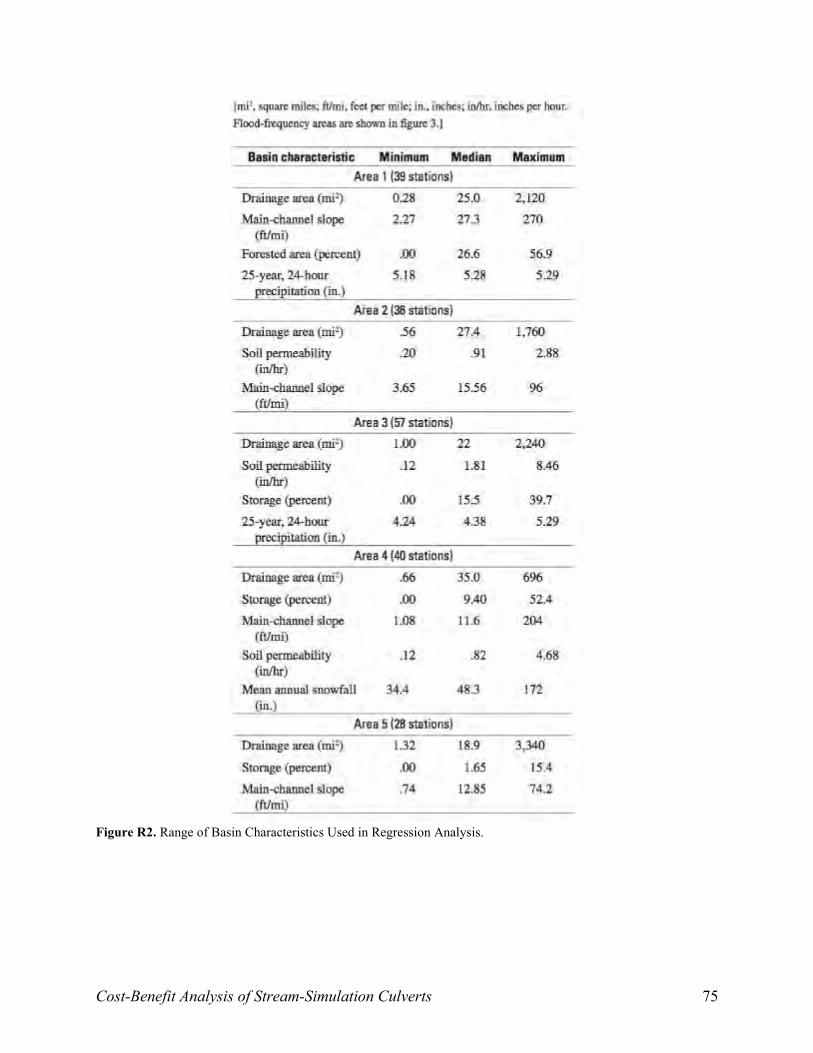
Cost-Benefit Analysis of Stream-Simulation Culverts 75
Figure R2. Range of Basin Characteristics Used in Regression Analysis.
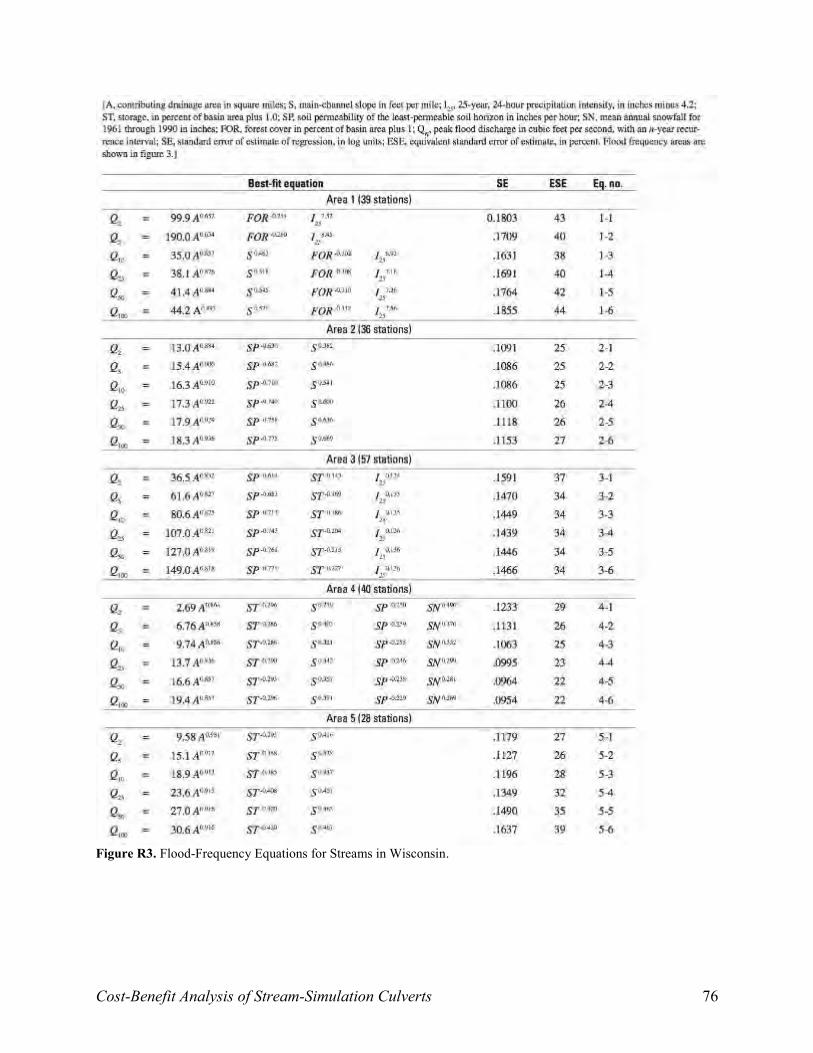
Cost-Benefit Analysis of Stream-Simulation Culverts 76
Figure R3. Flood-Frequency Equations for Streams in Wisconsin.
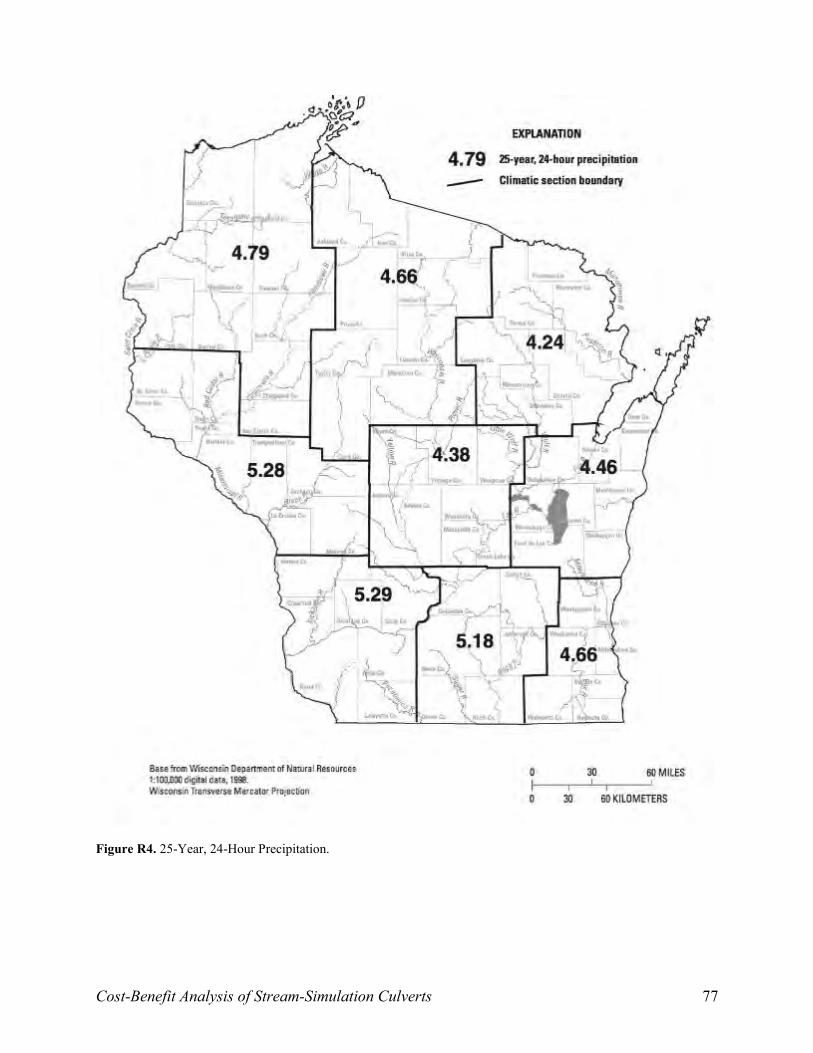
Cost-Benefit Analysis of Stream-Simulation Culverts 77
Figure R4. 25-Year, 24-Hour Precipitation.
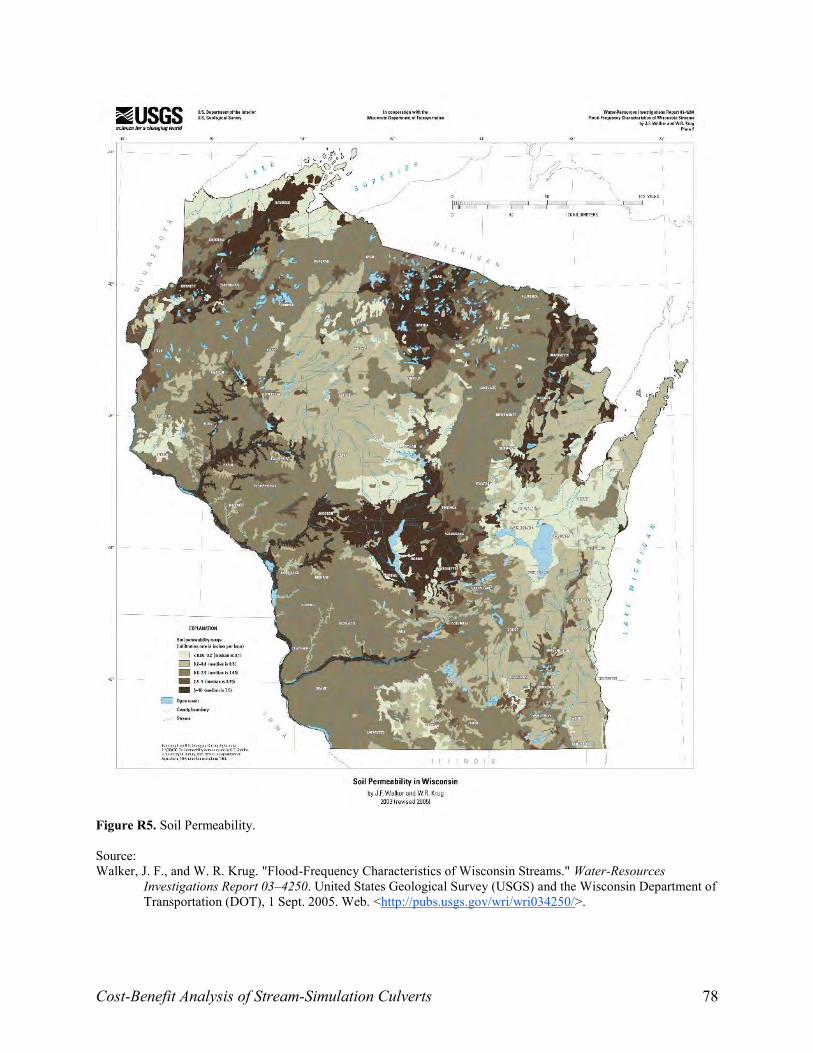
Cost-Benefit Analysis of Stream-Simulation Culverts 78
Figure R5. Soil Permeability. Source: Walker, J. F., and W. R. Krug. "Flood-Frequency Characteristics of Wisconsin Streams." Water-Resources
Investigations Report 03–4250. United States Geological Survey (USGS) and the Wisconsin Department of Transportation (DOT), 1 Sept. 2005. Web. <http://pubs.usgs.gov/wri/wri034250/>.
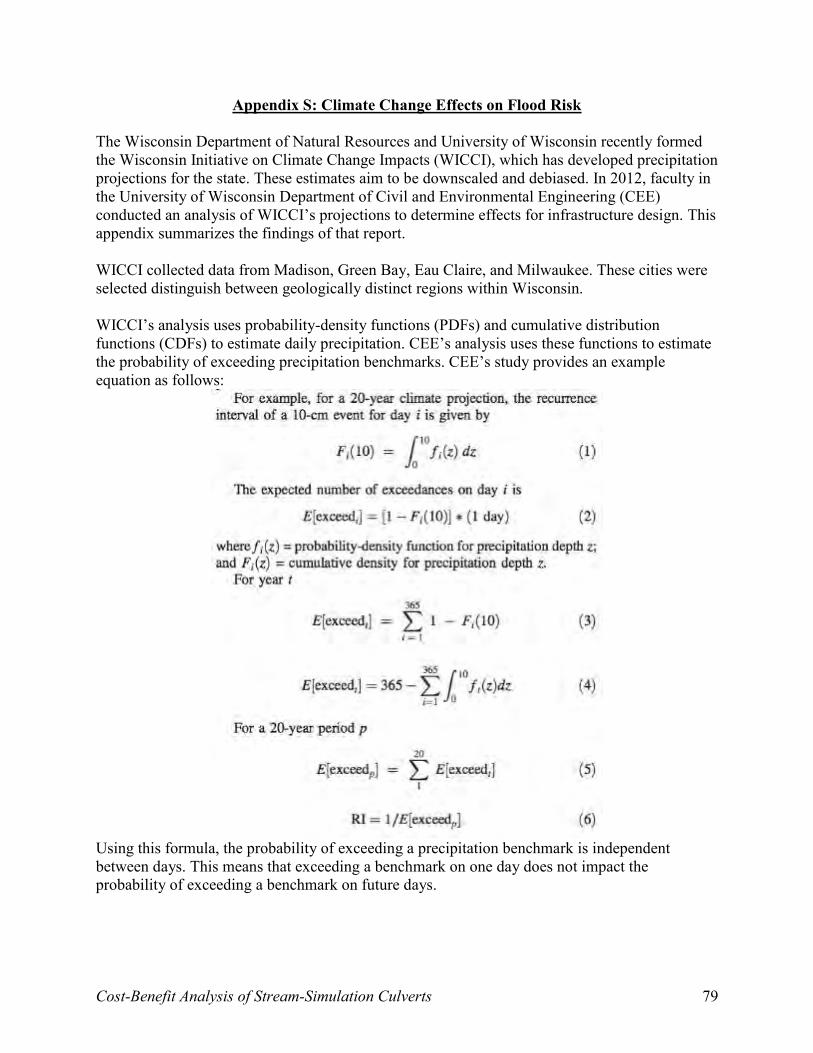
Cost-Benefit Analysis of Stream-Simulation Culverts 79
Appendix S: Climate Change Effects on Flood Risk The Wisconsin Department of Natural Resources and University of Wisconsin recently formed the Wisconsin Initiative on Climate Change Impacts (WICCI), which has developed precipitation projections for the state. These estimates aim to be downscaled and debiased. In 2012, faculty in the University of Wisconsin Department of Civil and Environmental Engineering (CEE) conducted an analysis of WICCI’s projections to determine effects for infrastructure design. This appendix summarizes the findings of that report. WICCI collected data from Madison, Green Bay, Eau Claire, and Milwaukee. These cities were selected distinguish between geologically distinct regions within Wisconsin. WICCI’s analysis uses probability-density functions (PDFs) and cumulative distribution functions (CDFs) to estimate daily precipitation. CEE’s analysis uses these functions to estimate the probability of exceeding precipitation benchmarks. CEE’s study provides an example equation as follows:
Using this formula, the probability of exceeding a precipitation benchmark is independent between days. This means that exceeding a benchmark on one day does not impact the probability of exceeding a benchmark on future days.
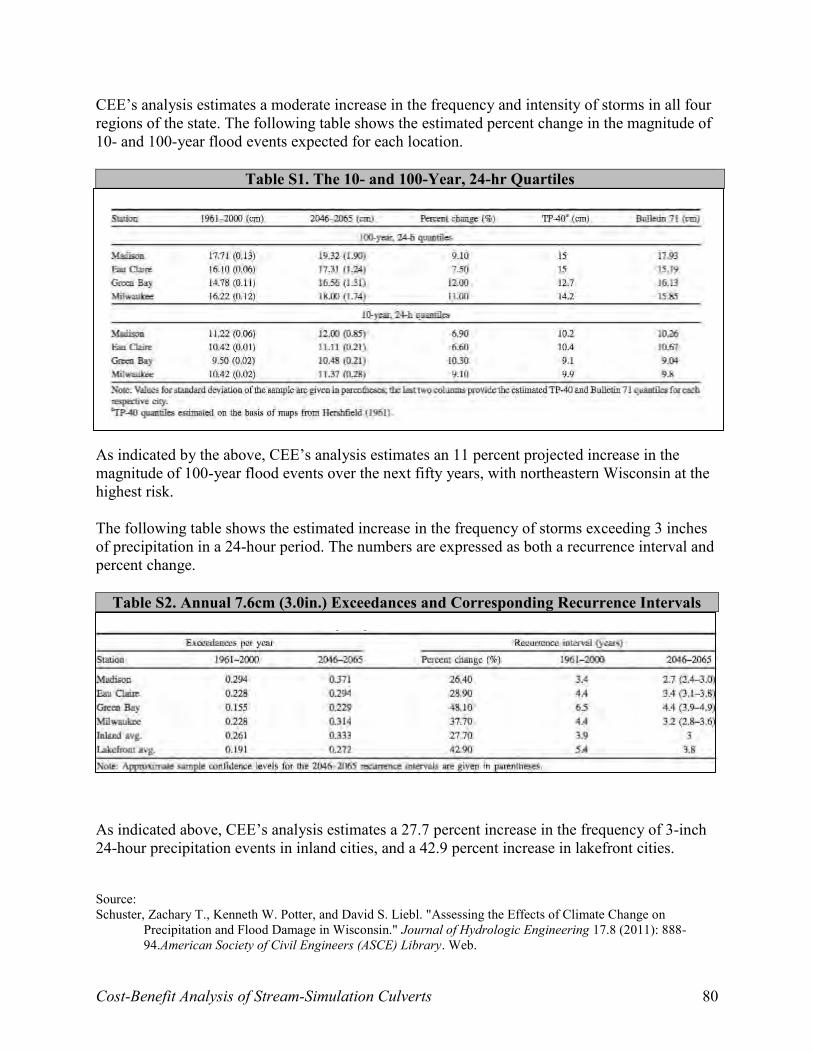
Cost-Benefit Analysis of Stream-Simulation Culverts 80
CEE’s analysis estimates a moderate increase in the frequency and intensity of storms in all four regions of the state. The following table shows the estimated percent change in the magnitude of 10- and 100-year flood events expected for each location.
Table S1. The 10- and 100-Year, 24-hr Quartiles
As indicated by the above, CEE’s analysis estimates an 11 percent projected increase in the magnitude of 100-year flood events over the next fifty years, with northeastern Wisconsin at the highest risk. The following table shows the estimated increase in the frequency of storms exceeding 3 inches of precipitation in a 24-hour period. The numbers are expressed as both a recurrence interval and percent change.
Table S2. Annual 7.6cm (3.0in.) Exceedances and Corresponding Recurrence Intervals
As indicated above, CEE’s analysis estimates a 27.7 percent increase in the frequency of 3-inch 24-hour precipitation events in inland cities, and a 42.9 percent increase in lakefront cities.
Source: Schuster, Zachary T., Kenneth W. Potter, and David S. Liebl. "Assessing the Effects of Climate Change on
Precipitation and Flood Damage in Wisconsin." Journal of Hydrologic Engineering 17.8 (2011): 888-94.American Society of Civil Engineers (ASCE) Library. Web.
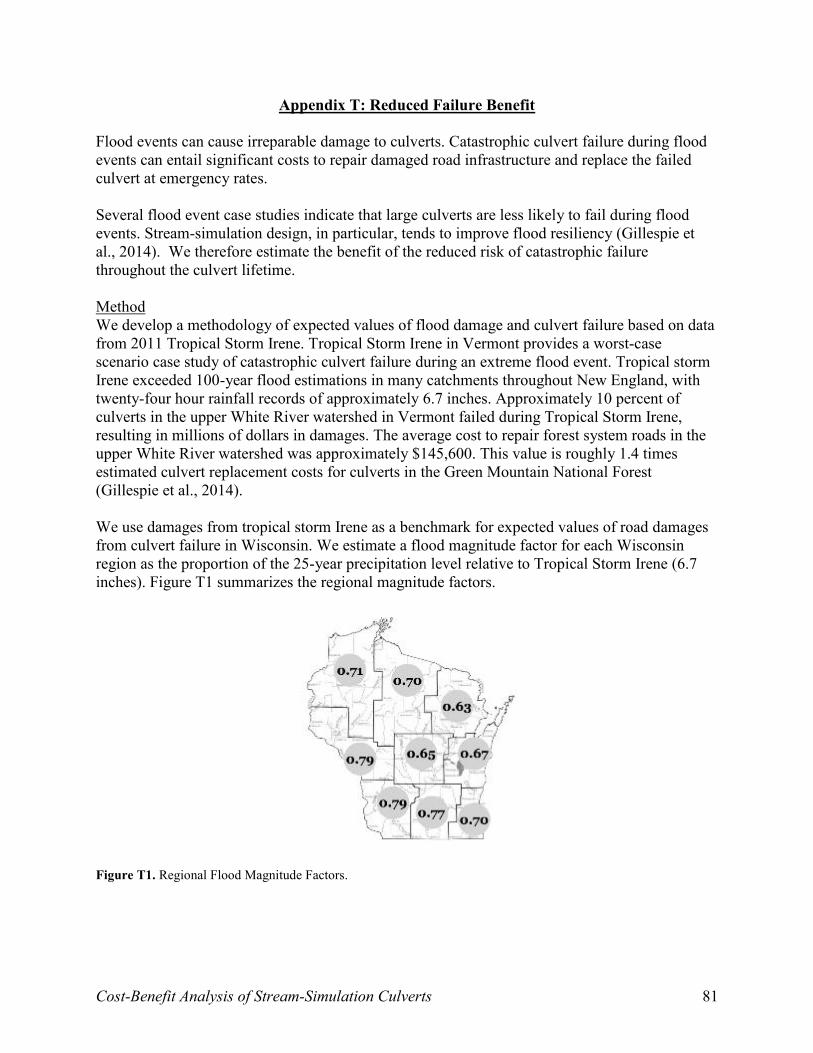
Cost-Benefit Analysis of Stream-Simulation Culverts 81
Appendix T: Reduced Failure Benefit Flood events can cause irreparable damage to culverts. Catastrophic culvert failure during flood events can entail significant costs to repair damaged road infrastructure and replace the failed culvert at emergency rates. Several flood event case studies indicate that large culverts are less likely to fail during flood events. Stream-simulation design, in particular, tends to improve flood resiliency (Gillespie et al., 2014). We therefore estimate the benefit of the reduced risk of catastrophic failure throughout the culvert lifetime. Method We develop a methodology of expected values of flood damage and culvert failure based on data from 2011 Tropical Storm Irene. Tropical Storm Irene in Vermont provides a worst-case scenario case study of catastrophic culvert failure during an extreme flood event. Tropical storm Irene exceeded 100-year flood estimations in many catchments throughout New England, with twenty-four hour rainfall records of approximately 6.7 inches. Approximately 10 percent of culverts in the upper White River watershed in Vermont failed during Tropical Storm Irene, resulting in millions of dollars in damages. The average cost to repair forest system roads in the upper White River watershed was approximately $145,600. This value is roughly 1.4 times estimated culvert replacement costs for culverts in the Green Mountain National Forest (Gillespie et al., 2014). We use damages from tropical storm Irene as a benchmark for expected values of road damages from culvert failure in Wisconsin. We estimate a flood magnitude factor for each Wisconsin region as the proportion of the 25-year precipitation level relative to Tropical Storm Irene (6.7 inches). Figure T1 summarizes the regional magnitude factors.
Figure T1. Regional Flood Magnitude Factors.
Cost-Benefit Analysis of Stream-Simulation Culverts 82
Probability of Catastrophic Failure We conservatively assume a significantly lower failure rate in our estimate than the failure rate observed during tropical storm Irene, which represents a worst-case scenario. We estimate a flood-event failure rate based on the culvert failure rate approach developed by the New Jersey Department of Transportation (NJDOT). The failure rate approach assumes increasing probability of failure with culvert age. See Appendix U for further information on the NJDOT failure rate. In 2011, the University of Wisconsin Department of Civil and Environmental Engineering estimated that the recurrence interval of heavy rain events would decrease from approximately 3.9 years in 2000 to approximately 3 years in 2065, or an estimated annual reduction of 0.4 percent. We assume that the probability of a 25-year flood will increase over time at a rate of 0.4 percent annually. The probability of culvert failure due to the 25-year flood in any given year t is then:
𝑝(𝑓𝑡) =𝑓(𝑡)
25∗ 𝑒0.004𝑡
Where p(Ft) is the probability of failure in year t, and f(t) is the failure rate in year t. We assume that stream-simulation culverts reduce failure rates by 75 percent. We believe this is a conservative approach. Data from Tropical Storm Irene suggest that stream-simulation culverts are capable of passing flood events exceeding 100-year flood expectations (Gillespie et al., 2014). Catastrophic Failure Costs Culvert replacement due to catastrophic culvert failure entails emergency rates. Emergency culvert replacement costs range from 4 to more than 10 times standard replacement costs (Perrin and Jhaveri, 2004). We conservatively assume an emergency rate of 4 times standard replacement cost. In addition to emergency culvert replacement, catastrophic culvert failure damages road infrastructure (fiscal costs) and results in road user delays (social costs). We apply regional magnitude factors (Figure T1) to estimate expected values for road damages. We assume that road damages equal 1.4*replacement cost, based on Tropical Storm Irene data, adjusted by the appropriate regional magnitude factor. Our methodology is given:
𝐸𝑉(𝐶𝐹) = 𝑝(𝑓𝑡) ∗ [(4 ∗ 𝑟𝑒𝑝𝑙𝑎𝑐𝑒𝑚𝑒𝑛𝑡 𝑐𝑜𝑠𝑡) + (1.4 ∗ 𝑅 ∗ 𝑟𝑒𝑝𝑙𝑎𝑐𝑒𝑚𝑒𝑛𝑡 𝑐𝑜𝑠𝑡)] Where:
EV(CF) : expected value of catastrophic failure p(Ft) : probability of failure in year t R : regional flood magnitude factor (Figure T1)
Cost-Benefit Analysis of Stream-Simulation Culverts 83
The total benefit of the reduced expected value of catastrophic failure costs is the difference between lifetime expected costs for conventional and stream-simulation culverts:
𝑐𝑎𝑡𝑎𝑠𝑡𝑟𝑜𝑝ℎ𝑖𝑐 𝑓𝑎𝑖𝑙𝑢𝑟𝑒 𝑏𝑒𝑛𝑒𝑓𝑖𝑡 = ∑𝐸𝑉(𝐶𝐹|𝑐𝑜𝑛𝑣𝑒𝑛𝑡𝑖𝑜𝑛𝑎𝑙)
1.035𝑡−0.5− ∑
𝐸𝑉(𝐶𝐹|𝑠𝑡𝑟𝑒𝑎𝑚 𝑠𝑖𝑚)
1.035𝑡−0.5
𝐿
0
𝐿
0
Road User Delays Catastrophic culvert failure also results in road user delays. Required downtime for road repairs due to culvert failure range from several days to several weeks (Perrin and Jhaveri, 2004). We develop our road user cost methodology in Appendix P.

Cost-Benefit Analysis of Stream-Simulation Culverts 84
Appendix U: Failure Rate The service lifetime of a culvert is a function of corrosion and abrasion (USFS, 2008). In turn, abrasion is a function of the size, shape, and slope of a culvert, and the flow velocity and size of sediments that pass through the structure (FHWA, 2000). Projected culvert lifetimes vary based on a variety of factors. Projected lifetimes for different materials range from 30 years (corrugated steel) to 150 years (brick/clay). Culvert design also influences service lifetime: projected lifetimes for conventional culverts are typically between 25 and 50 years, while projected lifetimes for stream simulation culverts range from 50 to 75 years (Gillespie et al., 2014). For the purposes of this analysis, we assume a projected culvert lifetime of 70 years for stream simulation designs and 35 years for conventional culverts. Actual culvert lifetimes do not necessarily equal projected lifetimes due to premature culvert failure. For the purposes of this appendix culvert failure refers to a catastrophic event that requires the immediate replacement of the culvert. The probability of culvert failure increases with the age of a culvert. We use the New Jersey Department of Transportation (NJDOT) condition classification system to calculate a failure rate (Meegoda et al., 2009). The NJDOT system estimates a failure rate as a function of time according to the Weibull distribution:
𝑓(𝑡) = (γ/θ) tγ−1 Where f(t) is the failure rate, t is in years, and γ and θ are characteristic shape and life parameters that determine project lifetime. The life parameter is itself a function of the design life for a material (L), given:
θ =Lγ
ln(2)
Given the assumptions about the life parameter, NJDOT calculates a constant value for the shape parameter of ϒ=3.6. Under these assumptions we calculate failure rates for conventional and stream simulation culverts: Conventional failure rate θ = (35)3.6/ln(2) = 5.2*105 f(t) = (3.6/5.2*105)t3.6-1 = 6.9*10-6t2.6
Stream simulation failure rate θ = (70)3.6/ln(2) = 6.3*106 f(t) = (3.6/6.3*106)t3.6-1 = 5.7*10-7t2.6
We apply f(t) in our estimate of benefits from the reduced probability of catastrophic culvert failure (see Appendix T). Figure U1 provides a graphical depiction of our estimated failure rates.
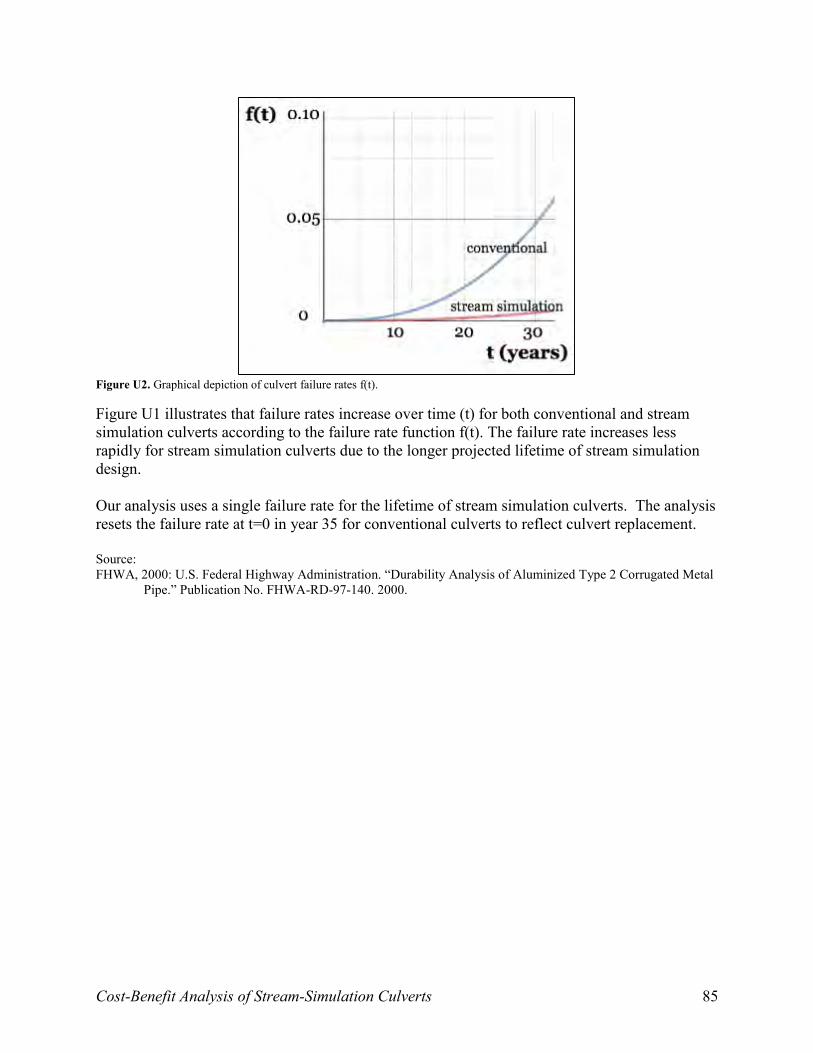
Cost-Benefit Analysis of Stream-Simulation Culverts 85
Figure U2. Graphical depiction of culvert failure rates f(t).
Figure U1 illustrates that failure rates increase over time (t) for both conventional and stream simulation culverts according to the failure rate function f(t). The failure rate increases less rapidly for stream simulation culverts due to the longer projected lifetime of stream simulation design. Our analysis uses a single failure rate for the lifetime of stream simulation culverts. The analysis resets the failure rate at t=0 in year 35 for conventional culverts to reflect culvert replacement. Source: FHWA, 2000: U.S. Federal Highway Administration. “Durability Analysis of Aluminized Type 2 Corrugated Metal
Pipe.” Publication No. FHWA-RD-97-140. 2000.
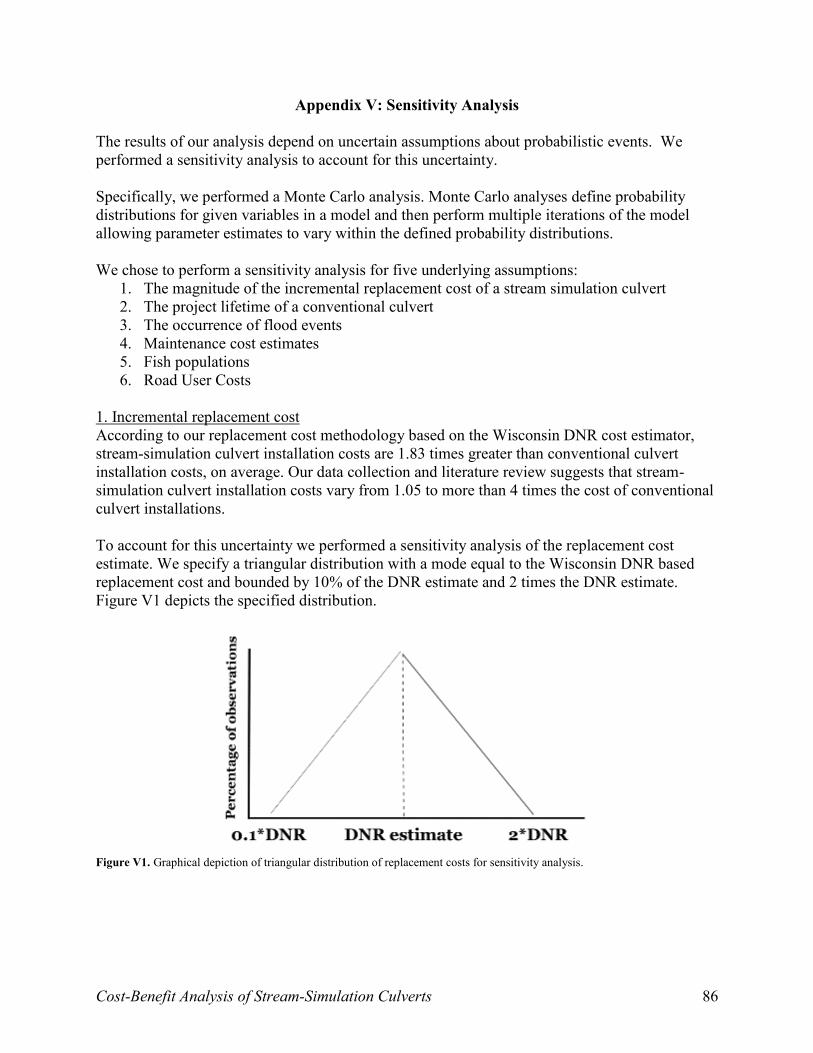
Cost-Benefit Analysis of Stream-Simulation Culverts 86
Appendix V: Sensitivity Analysis The results of our analysis depend on uncertain assumptions about probabilistic events. We performed a sensitivity analysis to account for this uncertainty. Specifically, we performed a Monte Carlo analysis. Monte Carlo analyses define probability distributions for given variables in a model and then perform multiple iterations of the model allowing parameter estimates to vary within the defined probability distributions. We chose to perform a sensitivity analysis for five underlying assumptions:
1. The magnitude of the incremental replacement cost of a stream simulation culvert 2. The project lifetime of a conventional culvert 3. The occurrence of flood events 4. Maintenance cost estimates 5. Fish populations 6. Road User Costs
1. Incremental replacement cost According to our replacement cost methodology based on the Wisconsin DNR cost estimator, stream-simulation culvert installation costs are 1.83 times greater than conventional culvert installation costs, on average. Our data collection and literature review suggests that stream-simulation culvert installation costs vary from 1.05 to more than 4 times the cost of conventional culvert installations. To account for this uncertainty we performed a sensitivity analysis of the replacement cost estimate. We specify a triangular distribution with a mode equal to the Wisconsin DNR based replacement cost and bounded by 10% of the DNR estimate and 2 times the DNR estimate. Figure V1 depicts the specified distribution.
Figure V1. Graphical depiction of triangular distribution of replacement costs for sensitivity analysis.
Cost-Benefit Analysis of Stream-Simulation Culverts 87
2. Project lifetime of conventional culverts Culvert lifetimes depend on a large number of uncertain factors. Estimates for project lifetime of conventional culverts range from 25 to 50 years (Gillespie et al., 2014). We therefore allow our assumption for the project lifetime of a conventional culvert (the counterfactual in our cost-benefit analysis) to vary within a uniform distribution between 25 and 50 years. The timing of the culvert replacement affects net benefits due to the time value of money. Early culvert replacements (e.g., 25 years) entail relatively higher costs due to the lower discount rate factor applied to the replacement cost, while later culvert replacements (e.g., 50 years) entail relatively lower costs due to the higher discount rate factor applied to the replacement cost:
𝑀𝑜𝑛𝑡𝑒 𝐶𝑎𝑟𝑙𝑜 𝑟𝑒𝑝𝑙𝑎𝑐𝑒𝑚𝑒𝑛𝑡 𝑒𝑠𝑡𝑖𝑚𝑎𝑡𝑒 =𝑟𝑒𝑝𝑙𝑎𝑐𝑒𝑚𝑒𝑛𝑡 𝑐𝑜𝑠𝑡
1.035𝑢(25,50)
3. Occurrence of flood events We estimate damages related to 25-year floods in our analysis. In any given year the probability of a 25-year flood event is 0.04. Due to the effects of future year discounting, the timing of flood events changes the net present value (NPV) of the reduced flood damages benefit. Flood events occurring in the first few years of a culvert’s lifetime have a much larger effect on the NPV than flood events occurring late in the culvert’s lifetime. Our Monte Carlo analysis randomly generates a value between 0 and 1 based on a uniform distribution for each of 70 years in the analysis. Where the Monte Carlo analysis generates a value of less than 0.04 we calculate flood damages in that year.
𝑀𝑜𝑛𝑡𝑒 𝐶𝑎𝑟𝑙𝑜 𝑓𝑙𝑜𝑜𝑑 𝑑𝑎𝑚𝑎𝑔𝑒 = ∑𝑓𝑙𝑜𝑜𝑑 𝑑𝑎𝑚𝑎𝑔𝑒
1.035𝑡
70
𝑡=0
| 𝑢(0,1) < 0.04
The methodology for flood damages is described in Appendix Q. Flood events also result in road user delays. Road user costs are dependent on the amount of time lost due to a flood effected road. The length of a delay to travel though a construction site or length of an alternate route is site and case-specific. Because we cannot know the specifics of all the possible cases, we need to vary this parameter in the Monte Carlo. We capture this uncertainty by varying the number of vehicles affected by a road delay within a uniform distribution bounded by 10 and 1,000 drivers. Appendix P describes the road user costs methodology in further detail. For each year of the analysis where the model generates a flood event the model estimates road user costs according to:
𝑀𝑜𝑛𝑡𝑒 𝐶𝑎𝑟𝑙𝑜 𝑟𝑜𝑎𝑑 𝑢𝑠𝑒𝑟 𝑐𝑜𝑠𝑡𝑠 = 𝑢(10, 1,000) ∗ 𝑣𝑎𝑙𝑢𝑒 𝑝𝑒𝑟 ℎ𝑜𝑢𝑟 ∗10
60| 𝑢(0,1) < 0.04
Where 10/60 models a 10-minute delay. Total flood damages in the model are the sum of flood damages and road user costs.

Cost-Benefit Analysis of Stream-Simulation Culverts 88
4. Maintenance of cost estimates Reliable data on culvert maintenance frequency and costs is currently unavailable. We based our model on a point estimate of $748 per maintenance based on cost data from Green County, WI, and an estimated maintenance time of four hours based on a study of culvert costs by the Maine Natural Resources Conservation Service (NRCS) (Long, 2010). The Maine NRCS assumed value for annual maintenance is $600, including a $200 mobilization fee for equipment. In our sensitivity analysis, we allow our estimated maintenance costs to vary between a lower bound of $600 based on the Maine NRCS assumption and an upper bound of $948 based on the Green County point estimate plus a mobilization fee of $200:
𝑀𝑜𝑛𝑡𝑒 𝐶𝑎𝑟𝑙𝑜 𝑚𝑎𝑖𝑛𝑡𝑒𝑛𝑎𝑛𝑐𝑒 𝑒𝑠𝑡𝑖𝑚𝑎𝑡𝑒 = ∑ 𝑢
70
𝑡=0
(600, 948) ∗ 𝑝(𝑚𝑎𝑖𝑛𝑡𝑒𝑛𝑎𝑛𝑐𝑒)
See Appendix G for the methodology the probability of maintenance. 5. Fish populations We base our estimates of improved fish passage benefits on uncertain assumptions of fish density. Our estimates of fish density are based on the number of fish caught and do not capture the entire population of fish within the stream. Furthermore, because we use the average density from captured fish in Brown and Oconto counties we are unsure whether this average overstates or understates the total number of fish in any given stream. Because of this we have chosen to vary the fish density from 0.1 to 2 times the value of the fish density estimate.
𝑀𝑜𝑛𝑡𝑒 𝐶𝑎𝑟𝑙𝑜 𝑓𝑖𝑠ℎ 𝑝𝑎𝑠𝑠𝑎𝑔𝑒 = 𝑢(0.1, 2) ∗ 𝑓𝑖𝑠ℎ 𝑝𝑎𝑠𝑠𝑎𝑔𝑒 𝑏𝑒𝑛𝑒𝑓𝑖𝑡 Results We performed 500 iterations of our model allowing values for replacement costs, project lifetime, occurrence of flood events, maintenance costs, and fish populations to vary within the distributions specified above. The results of the analysis represent average values per culverts of the 500 iterations. Table V1 compares the outcomes of the Monte Carlo analysis and compares the results with values from our point estimate model.
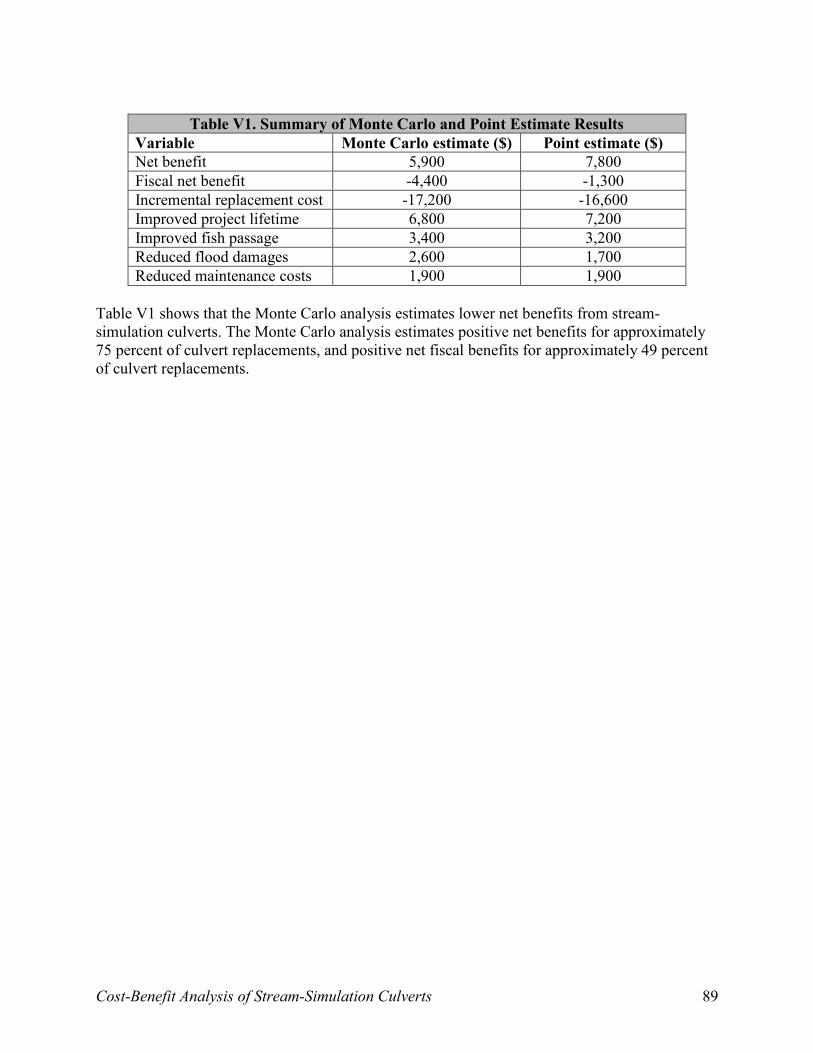
Cost-Benefit Analysis of Stream-Simulation Culverts 89
Table V1. Summary of Monte Carlo and Point Estimate Results
Variable Monte Carlo estimate ($) Point estimate ($) Net benefit 5,900 7,800 Fiscal net benefit -4,400 -1,300 Incremental replacement cost -17,200 -16,600 Improved project lifetime 6,800 7,200 Improved fish passage 3,400 3,200 Reduced flood damages 2,600 1,700 Reduced maintenance costs 1,900 1,900
Table V1 shows that the Monte Carlo analysis estimates lower net benefits from stream-simulation culverts. The Monte Carlo analysis estimates positive net benefits for approximately 75 percent of culvert replacements, and positive net fiscal benefits for approximately 49 percent of culvert replacements.
Cost-Benefit Analysis of Stream-Simulation Culverts 90
X. BIBLIOGRAPHY
"2011 Fish Catalogue." Zett's Fish Farm and Hatcheries. Web. 2 Nov. 2014.
"2014 LPS Fish Price List." Lake and Pond Solutions. Web. 2 Nov. 2014.
Albuquerque, Francisco Daniel B., Dean L. Sicking, Ronald K. Faller, and Karla A. Lechtenberg. (2011). "Evaluating the cost-effectiveness of roadside culvert treatments." Journal of Transportation Engineering 137,12: 918-925.
Barnard, R. J., Yokers, S., Nagygyor, A., & Quinn, T. (2014). An Evaluation of the Stream Simulation Culvert Design Method in Washington State. River Research and Applications. doi:10.1002/rra.2837
Bates, K., Barnard, B., Heiner, B., Klavas, P., & Powers, P. (2003). Design of Road Culverts for Fish Passage. Washington Department of Fish and Wildlife.
Berrens, R. P., Ganderton, P., & Silva, C. L. (1996). Valuing the protection of minimum instream flows in New Mexico. Journal of Agricultural and Resource Economics, 294-308.
Booth, Eric. (10/22/14). Interview with Dr. Eric Booth, Assistant Research Scientist, University
of Wisconsin Madison.
Bouwes, N. W., & Schneider, R. (1979). Procedures in estimating benefits of water quality change. American Journal of Agricultural Economics, 61(3), 535-539.
Bowker, J. M., English, D. B., & Donovan, J. A. (1996). Toward a value for guided rafting on southern rivers. Journal of Agricultural and Applied Economics, 28, 423-432.
Boyle, K. J. (1993). Measuring natural resource damages with contingent valuation: tests of validity and reliability. Contributions to Economic Analysis, 220, 91-164.
Braden, John B., Doohwan Won, Laura O. Taylor, Nicole Mays, Allegra Cangelosi, and Arianto A. Patunru. (2008). "Economic Benefits of Remediating the Sheboygan River, Wisconsin Area of Concern." Journal of Great Lakes Research 34.4: 649-60.
Bureau of Labor Statistics. (12/10/14) “Employer Costs for Employee Compensation News Release” http://www.bls.gov/news.release/ecec.htm
Burford, D. D., McMahon, T. E., Cahoon, J. E., & Blank, M. (2011). Assessment of Trout Passage through Culverts in a Large Montana Drainage during Summer Low Flow. North American Journal of Fisheries Management, 29(3), 739–752. doi:10.1577/M07-175.1
Carson, Richard T., and Robert Cameron Mitchell. (1993). "The value of clean water: the public's willingness to pay for boatable, fishable, and swimmable quality water." Water resources research 29.7: 2445-2454.
Cost-Benefit Analysis of Stream-Simulation Culverts 91
Cenderelli, DA., Clarkin, K., Gubernick, RA. (2011). “Stream Simulation for Aquatic Organism Passage at Road-Stream Crossings.” Transportation Research Record.
Cordell, H. K., & Bergstrom, J. C. (1993). Comparison of recreation use values among alternative reservoir water level management scenarios. Water Resources Research, 29(2), 247-258.
d'Arge, R. C., & Shogren, J. F. (1989). Okoboji experiment: Comparing non-market valuation techniques in an unusually well-defined market for water quality. Ecological economics, 1(3), 251-259.
Daubert, J. T., & Young, R. A. (1981). Recreational demands for maintaining instream flows: a contingent valuation approach. American Journal of Agricultural Economics, 63(4), 666-676.
Desvousges, W. H., Smith, V. K., & Fisher, A. (1987). Option price estimates for water quality improvements: a contingent valuation study for the Monongahela River. Journal of Environmental Economics and Management, 14(3), 248-267.
"DNR Consultation." 16 Sept. 2014. Personal interview.
Doss, C. R., & Taff, S. J. (1996). The influence of wetland type and wetland proximity on residential property values. Journal of agricultural and resource economics, 120-129.
Duffield, J. W., Neher, C. J., & Brown, T. C. (1992). Recreation benefits of instream flow: Application to Montana's Big Hole and Bitterroot Rivers. Water Resources Research, 28(9), 2169-2181.
Engle, Carole, and Brent Southworth. Cost of Raising Large Mouth Bass Fingerlings. Rep. University of Arkansas-Pine Bluff Extension, n.d.
“Engineering Interview” 10 Nov. 2014. Interview with Todd Riebau and Bob Moore Epp, D. J., & Al-Ani, K. S. (1979). The effect of water quality on rural nonfarm residential
property values. American Journal of Agricultural Economics, 61(3), 529-534. Fall 2014 Preferred Customer Retail Fish Order Form. Wisconsin Lake and Pond Resource
LLC. Web. 2 Nov. 2014. Federal Highway Administration. (2011) “Work Zone Road User Costs- Concepts and
Applications” http://www.ops.fhwa.dot.gov/wz/resources/publications/fhwahop12005/index.htm
Feurich, Robert, Jacques Boubee, and Nils Reidar Olsen. (2012). "Improvements of Fish Passage in Culverts Using CFD." Ecological Engineering: 1-8. ScienceDirect.
Francfort et al. (1994). “Environmental Mitigation at Hydroelectric Projects: Benefits and Costs of Fish Passage and Protection.” Idaho National Engineering Laboratory.
Cost-Benefit Analysis of Stream-Simulation Culverts 92
Frederick, Kenneth D., Jean Hanson, and Tim VandenBerg. (1996). Economic values of freshwater in the United States. Resources for the Future.
Furniss, Michael J. et. al. (2002). "Response of Road-Stream Crossings to Large Flood Events in Washington, Oregon, and Northern California." Technology and Development Program. United States Department of Agriculture: Forest Service. <http://www.fs.fed.us/t-d/pubs/html/wr_p/98771807/98771807.htm>.
Gauthier, Marie-Eve, Denis Leroux, and Ali Assani. "Vulnerability of Culvert to Flooding." Université Du Québec à Trois-Rivières: Department of Geography. <http://events.esri.com/uc/2008/proceedingsCD/papers/papers/pap_1126.pdf>.
Gillespie, N., Unthank, A., Campbell, L., Anderson, P., Gubernick, R., Weinhold, M., … Kirn, R. (2014). Flood Effects on Road-Stream Crossing Infrastructure: Economic and Ecological Benefits of Stream Simulation Designs. Fisheries,39(2), 62–76.
Gilmore, Nathaniel. (2009). “A Cost Benefit Analysis of the Nimbus Fish Passage Project.” California State University.
Greenley, D. A., Walsh, R. G., & Young, R. A. (1981). Option value: empirical evidence from a case study of recreation and water quality. The Quarterly Journal of Economics, 657-673.
Hansen, B., Nieber, J., & Lenhart, C. (2009). Cost Analysis of Alternative Culvert Installation Practices in Minnesota. Minnesota Department of Transportation.
Hendrickson, S., Jacobson, S., & Bower, F. (2008). Assessment of Aquatic Organism Passage at Road / Stream Crossings for the Northern Region of the USDA Forest Service. U.S. Forest Service.
Huijser, Marcel P., et al. (2009). "Cost–benefit analyses of mitigation measures aimed at reducing collisions with large ungulates in the United States and Canada; a decision support tool." Ecology and Society 14.2: 15.
Iovanna, R., & Griffiths, C. (2006). Clean water, ecological benefits, and benefits transfer: a work in progress at the US EPA. Ecological Economics, 60(2), 473-482.
Januchowski-Hartley, S. R., Diebel, M., Doran, P. J., & McIntyre, P. B. (2014). Predicting road culvert passability for migratory fishes. Diversity and Distributions, 20(12), 1414–1424. doi:10.1111/ddi.12248
Kilgore, Roger T., Bart S. Bergendahl, and Rollin H. Hotchkiss. (2010). Culvert Design for Aquatic Organism Passage. No. HWA-HIF-11-008.
King, D., & Bohlen, C. (1994). A Technical Summary of Wetland Restoration Costs in the Continental United States. University of Maryland system, Center for Environmental and Estuarine Studies.
Cost-Benefit Analysis of Stream-Simulation Culverts 93
Lansford Jr, N. H., & Jones, L. L. (1995). Recreational and aesthetic value of water using hedonic price analysis. Journal of Agricultural and Resource Economics, 341-355.
Lant, C. L., & Tobin, G. A. (1989). THE ECONOMIC VALUE OF RIPARIAN CORRIDORS IN CORNBELT FLOODPLAINS: A RESEARCH FRAMEWORK*. The Professional Geographer, 41(3), 337-349.
Larsson-Kraik, Per-Olof. (2012). “Managing avalanches using cost-benefit-risk analysis.” Journal of Rail and Rapid Transit.
Lee, T. Clevenger, A., Ament, R. (2012). “Highway Wildlife Mitigation Opportunities for the Trans-Canada Highway in the Bow River Valley” Miistakis Institute, Calgary, AB.
Kousky, Carolyn, Sheila M. Olmstead, Margaret A. Walls, and Molly Macauley. (2013). "Strategically Placing Green Infrastructure: Cost-Effective Land Conservation in the Floodplain." Environmental Science & Technology 47.8: 3563-570.
Levine, Jessica. (2013). “An Economic Analysis of Improved Road-Stream Crossings.” Rep. The Nature Conservancy.
Lian, Yanqing, and Ben Chie Yen. (2003). "Comparison of Risk Calculation Methods for a Culvert." Journal of Hydraulic Engineering 129.2: 140.
Ligon, Franklin K., William E. Dietrich, and William J. Trush. (1995). "Downstream ecological effects of dams." BioScience: 183-192.
Long, John. (2010). “The Economics of Culvert Replacement: Fish Passage in Eastern Maine.” Maine Natural Resources Conservation Service.
Long, J. (2010). The Economics of Culvert Replacement : Fish Passage in Eastern Maine (pp. 1–5). Maine Natural Resources Conservation Service.
Matthews, John C., Jadranka Simicevic, Maureen A. Kestler, Rob Riehl. (2012). “Decision Analysis Guide for Corrugated Metal Culvert Rehabilitation and Replacement Using Trenchless Technology.” United States Department of Agriculture Forest Service. <http://www.fs.fed.us/t-d/pubs/pdfpubs/pdf11771810/pdf11771810Pdpi72.pdf>
McGrath et al. (2002). “Recommended Specifications for Large-Span Culverts.” Transportation Research Board.
Meegoda, J. N., Juliano, T. M., & Tang, C. (2009). Culvert Information Management System. New Jersey Department of Transportation.
Melstrom, Richard T., and Frank Lupi. (2013). "Valuing Recreational Fishing in the Great Lakes." North American Journal of Fisheries Management 33.6: 1184-193.
Cost-Benefit Analysis of Stream-Simulation Culverts 94
Mensing, D. M., Galatowitsch, S. M., & Tester, J. R. (1998). Anthropogenic effects on the biodiversity of riparian wetlands of a northern temperate landscape. Journal of Environmental Management, 53(4), 349–377.
Meyer, Andrew. (2013). "Intertemporal Valuation of River Restoration."Environmental and Resource Economics 54.1: 41-61.
Michael, H. J., Boyle, K. J., & Bouchard, R. (1996). Water quality affects property prices: A case study of selected Maine lakes.
Miller, R., & Finley, J. (1997). Long-term impacts of forest road crossings on wetlands in Pennsylvania. NJAF, 14(3).
Moore, Rebecca, Bill Provencher, and Richard C. Bishop. (2011). "Valuing a Spatially Variable Environmental Resource: Reducing Non-Point-Source Pollution in Green Bay, Wisconsin." Land Economics 87.1: 45-59. Web.
Munson, Bruce R., Young, Donald F., Okiishi, Ted H., Huebsch, Wade W. (2009). Fundamentals of Fluid Mechanics. 6th Edition. Wiley
Oklahoma Forestry Services. (2009). “Introduction to Road-Stream Crossings.”
Neary, V. S. (2012). Binary Fish Passage Models for Uniform and Non-Uniform Flows. 428, 418–428. doi:10.1002/rra
Nieber, J. (2011). Performance Assessment of Oversized Culverts to Accommodate Fish Passage. Minnesota Department of Transportation.
Nunnery, K., & Richardson, C. (1997). An Assessment of Highway Impacts on Ecological Function in Palustrine Forested Wetlands in the Upper Coastal Plain of North Carolina. Duke University Wetlands Center.
Pate, J., & Loomis, J. (1997). The effect of distance on willingness to pay values: a case study of wetlands and salmon in California. Ecological Economics, 20(3), 199-207.
Perrin, J., & Jhaveri, C. S. (2004). The Economic Costs of Culvert Failures. Transportation Research Board.
Reclemation, B. O. (2001). Economic Nonmarket Valuation of Instream Flows.
Poplar-Jeffers, I. O., Petty, J. T., Anderson, J. T., Kite, S. J., Strager, M. P., & Fortney, R. H. (2009). Culvert Replacement and Stream Habitat Restoration: Implications from Brook Trout Management in an Appalachian Watershed, U.S.A. Restoration Ecology, 17(3), 404–413. doi:10.1111/j.1526-100X.2008.00396.x
Price, D. M., Quinn, T., & Barnard, R. J. (2010). Fish Passage Effectiveness of Recently Constructed Road Crossing Culverts in the Puget Sound Region of Washington State.
Cost-Benefit Analysis of Stream-Simulation Culverts 95
North American Journal of Fisheries Management, 30(5), 1110–1125. doi:10.1577/M10-004.1
"Price List." Schultz's Fish Hatchery. Web. 2 Nov. 2014. Ribaudo, M. O., & Epp, D. J. (1984). The importance of sample discrimination in using the
travel cost method to estimate the benefits of improved water quality. Land Economics, 397-403.
Salem, Sam, et al. (2008). “Use of Trenchless Technologies for a Comprehensive Asset Management of Culverts and Drainage Structures.” No. MRUTC 07-15. Midwest Regional University Transportation Center, College of Engineering, Department of Civil and Environmental Engineering, University of Wisconsin, Madison.
Santucci Jr, Victor J., Stephen R. Gephard, and Stephen M. Pescitelli. (2005). "Effects of multiple low-head dams on fish, macroinvertebrates, habitat, and water quality in the Fox River, Illinois." North American Journal of Fisheries Management 25, 3: 975-992.
Schall, J. D., Thompson, P. L., Zerges, S. M., Kilgore, R. T., & Morris, J. L. (2012). Hydraulic Design of Highway Culverts. U.S. Federal Highway Administration.
Scheidegger, Karl. (2002). "Fish Gotta Swim." Wisconsin Natural Resources Magazine. Wisconsin Department of Natural Resources, <http://dnr.wi.gov/wnrmag/html/stories/2002/apr02/fishlad.htm>.
Schuster, Zachary T., Kenneth W. Potter, and David S. Liebl. (2011). "Assessing the Effects of Climate Change on Precipitation and Flood Damage in Wisconsin." Journal of Hydrologic Engineering 17.8: 888-94.American Society of Civil Engineers (ASCE) Library.
Shrestha, R. K., & Loomis, J. B. (2001). Testing a meta-analysis model for benefit transfer in international outdoor recreation. Ecological Economics, 39(1), 67-83.
State of Florida DOT. “Drainage Handbook Culvert Design” (2004)
http://www.dot.state.fl.us/rddesign/Drainage/files/CulvertHB.pdf
Steinnes, Donald N. (1992). "Measuring the economic value of water quality." The Annals of Regional Science 26, 2: 171-176.
Sutherland, R. J., & Walsh, R. G. (1985). Effect of distance on the preservation value of water quality. Land Economics, 281-291.
Tumeo, M. A., & Pavlick, J. (2011). A Study of Bankfull Culvert Design Effectiveness. Ohio Department of Transportation.
United States Department of Agriculture: US Forest Service. (2008). "Stream Simulation: An Ecological Approach to Providing Passage for Aquatic Organisms at Road-Stream
Cost-Benefit Analysis of Stream-Simulation Culverts 96
Crossings." National Technology and Development Program. <http://www.stream.fs.fed.us/fishxing/publications/PDFs/AOP_PDFs/08771801.pdf>.
United States Geological Survey (USGS) and the Wisconsin Department of Transportation. (2014). "Surface-Water Daily Data for Wisconsin." <http://waterdata.usgs.gov/wi/nwis/dv?referred_module=sw&search_criteria=huc_cd&submitted_form=introduction>.
U.S. Department of Transportation Federal Highway Administration. “Debris Control Structures Evaluation and Countermeasures.” <http://www.fhwa.dot.gov/engineering/hydraulics/pubs/04016/hec0906.cfm>
U.S. Department of Transportation Federal Highway Administration. “Work Zone Road User Costs.” <http://ops.fhwa.dot.gov/wz/resources/publications/fhwahop12005/sec2.htm>
U.S. Federal Highway Administration. (2002). “Durability Analysis of Aluminized Type 2 Corrugated Metal Pipe.” Publication No. FHWA-RD-97-140. 2000.
U.S. Census Bureau. “State & County QuickFacts, Wisconsin” http://quickfacts.census.gov/qfd/states/55000.htm
USFS Stream-Simulation Working Group. (2008). Stream Simulation: An Ecological Approach
to Providing Passage for Aquatic Organisms at Road-Stream Crossings. U.S. Forest Service.
Vacirca, B. R., Enders, B., & Bond, R. (2010). Aquatic Organism Passage ( AOP ) Assessment Lake Tahoe Basin Management Unit FY 2010.
Van Houtven, G., Powers, J., & Pattanayak, S. K. (2007). Valuing water quality improvements in the United States using meta-analysis: Is the glass half-full or half-empty for national policy analysis?. Resource and Energy Economics, 29(3), 206-228.
Walker, J. F., and W. R. Krug. (2005). "Flood-Frequency Characteristics of Wisconsin Streams." Water-Resources Investigations Report 03–4250. United States Geological Survey (USGS) and the Wisconsin Department of Transportation (DOT). <http://pubs.usgs.gov/wri/wri034250/>.
Walsh, R. G., Sanders, L. D., & McKean, J. R. (1990). The consumptive value of travel time on recreation trips. Journal of Travel Research, 29(1), 17-24.
Wilson, Matthew A. and Stephan R. Carpenter. “Economic Valuation of Freshwater Ecosystem Services in the United States:1971-1997.”
Wilson, M. A., & Hoehn, J. P. (2006). Valuing environmental goods and services using benefit transfer: the state-of-the art and science. Ecological economics, 60(2), 335-342.
Cost-Benefit Analysis of Stream-Simulation Culverts 97
Wisconsin Department of Natural Resources. (2013). "Culvert Decision Matrix." Waterway Protection. <http://dnr.wi.gov/topic/Waterways/water_levels_crossings/culverts-text.html>.
Wisconsin Department of Transportation. (2014). “Historical Traffic count maps by county”. http://www.dot.wisconsin.gov/travel/counts/maps.htm
Wissink, Katherine, Meghan McKee, Robert Houghtalen, and Kevin Sutterer. (2005). "Simple
Rating System for Identification of Failure-Critical Culverts and Small Structures." Journal of the Transportation Research Board 1928.2005 Design of Structures: 226-29. Transportation Research Board of the National Academies.
Wofford, John EB, Robert E. Gresswell, and Michael A. Banks. (2005). "Influence of barriers to movement on within-watershed genetic variation of coastal cutthroat trout." Ecological Applications 15, 2: 628-637.