Embed Size (px)
Citation preview
COST BENEFIT ANALYSIS OF STEP, AS FIRST PHASE OF MIDCAT - FINAL REPORT
17 November 2017
CO
ST
BE
NE
FIT
AN
ALY
SIS
OF
ST
EP
, AS
FIR
ST
PH
AS
E O
F M
IDC
AT
- F
INA
L
RE
PO
RT

COST BENEFIT ANALYSIS OF STEP, AS FIRST PHASE OF MIDCAT - FINAL REPORT
17 November 2017
EC_Step CBA_Final Report_Master_601_Public.docx
2
PÖYRY MANAGEMENT CONSULTING
COST BENEFIT ANALYSIS OF STEP, AS FIRST PHASE OF MIDCAT - FINAL REPORT
17 November 2017
EC_Step CBA_Final Report_Master_601_Public.docx
3
PÖYRY MANAGEMENT CONSULTING
Contact details
Name Email Telephone
Mr. Antonio Michelon [email protected] +39 348 019 4112
Mr. Angus Paxton [email protected] +44 776 682 4716
Dr. Fotis Thomaidis [email protected] +30 693 827 8576
Dr. Gareth Davies [email protected] +44 797 057 2454
Pöyry is an international consulting and engineering company. We serve clients globally across the energy and industrial sectors and provide local services in our core markets. We deliver management consulting and engineering services, underpinned by strong project implementation capability and expertise. Our focus sectors are power generation, transmission & distribution, forest industry, chemicals & biorefining, mining & metals, transportation and water. Pöyry employs over 5,000 experts across extensive local office networks. Pöyry’s net sales in 2016 were EUR 530 million and the company’s shares are quoted on Nasdaq Helsinki (Pöyry PLC: POY1V).
Pöyry Management Consulting provides leading-edge consulting and advisory services covering the whole value chain in energy, forest and bio-based industries. Our energy practice is the leading provider of strategic, commercial, regulatory and policy advice to energy markets in Europe, the Middle East and the Americas. Our energy team of 200 specialists offers unparalleled expertise in the rapidly changing energy sector.
© European Union, 2018
© Pöyry Management Consulting (Italia) Srl, 2018
All rights reserved
No part of this publication may be reproduced, stored in a retrieval system or transmitted in any form or by any means electronic, mechanical, photocopying, recording or otherwise without the prior written permission of Pöyry Management Consulting (UK) Ltd (“Pöyry”). This report is provided to the legal entity identified on the front cover for its internal use only. This report may not be provided, in whole or in part, to any other party without the prior written permission of an authorised representative of Pöyry. In such circumstances additional fees may be applicable and the other party may be required to enter into either a Release and Non-Reliance Agreement or a Reliance Agreement with Pöyry.
Disclaimer
While Pöyry considers that the information and opinions given in this work are sound, all parties must rely upon their own skill and judgement when making use of it. Pöyry does not make any representation or warranty, expressed or implied, as to the accuracy or completeness of the information contained in this report and assumes no responsibility for the accuracy or completeness of such information. Pöyry will not assume any liability to anyone for any loss or damage arising out of the provision of this report.
The report contains projections that are based on assumptions that are subject to uncertainties and contingencies. Because of the subjective judgements and inherent uncertainties of projections, and because events frequently do not occur as expected, there can be no assurance that the projections contained herein will be realised and actual results may be different from projected results. Hence the projections supplied are not to be regarded as firm predictions of the future, but rather as illustrations of what might happen. Parties are advised to base their actions on an awareness of the range of such projections, and to note that the range necessarily broadens in the latter years of the projections.
Version linguistique Support/Volume Numéro de catalogue ISBN DOI
EN PDF PDF/Volume_01 MJ-01-18-352-EN-N 978-92-79-81001-5 10.2833/65894
COST BENEFIT ANALYSIS OF STEP, AS FIRST PHASE OF MIDCAT - FINAL REPORT
17 November 2017
EC_Step CBA_Final Report_Master_601_Public.docx
4
PÖYRY MANAGEMENT CONSULTING
ABSTRACT
This paper presents a cost benefit assessment (CBA) of a proposed pipeline project in the Eastern Pyrenees – the South Transit Eastern Pyrenees (STEP), as the first phase of Midcat. Pöyry Management Consulting (Pöyry), with the support of VIS Economic and Energy Consultants (VIS), has been mandated by the European Commission to produce a ‘project specific’ CBA (PS-CBA) for STEP consistent with the CBA Methodology set out by the European Network of Transmission System Operators for Gas (ENTSOG).
The paper analyses several scenarios to explore the potential for STEP to provide economic benefits. In addition to these five scenarios, it also presents a series of stress-test cases, and discusses sensitivities investigated during the course of the project. Both economic and financial net-present values and rates of return are presented for each of the five scenarios, alongside the variety of other indicators required by the ENTSOG methodology.

COST BENEFIT ANALYSIS OF STEP, AS FIRST PHASE OF MIDCAT - FINAL REPORT
17 November 2017
EC_Step CBA_Final Report_Master_601_Public.docx
5
PÖYRY MANAGEMENT CONSULTING
[This page is intentionally blank]
COST BENEFIT ANALYSIS OF STEP, AS FIRST PHASE OF MIDCAT - FINAL REPORT
17 November 2017
EC_Step CBA_Final Report_Master_601_Public.docx
6
PÖYRY MANAGEMENT CONSULTING
TABLE OF CONTENTS
ABSTRACT 4
EXECUTIVE SUMMARY 8
1. INTRODUCTION 14
2. SUMMARY OF FINDINGS FROM REVIEWED LITERATURE 16
2.1 Study on the benefits of additional gas interconnections between the Iberian Peninsula and the rest of Europe 16
2.2 Project MidCat: Cost Benefit Analysis 17
2.3 Commission de régulation de l'énergie (CRE) report on the “Electricity and gas interconnections in France” 17
2.4 TSO joint technical study 18
3. BACKGROUND AND CONTEXT 20
3.1 Gas market overview in France, Spain and Portugal 20
3.2 Focus on LNG to Europe 24
3.3 Focus on PEG merger in France 26
3.4 Flows and prices between Spain and France 27
4. OVERVIEW OF STEP 30
4.1 From Midcat to STEP 30
4.2 3rd Interconnector Portugal – Spain 32
4.3 STEP 33
5. CBA METHODOLOGY AND ASSUMPTIONS 38
5.1 Introduction 38
5.2 Calculation of Benefits and Costs according to ENTSOG ESW-CBA Methodology 38
5.3 Gas scenarios modelling 44
5.4 Scope of ENTSOG CBA methodology 64
6. RESULTS OF MODELLING 67
6.1 European supply mix 68
6.2 French and Iberian supplies 72
6.3 Flows across the Spanish/French border 76
6.4 Impacts on supply bill (welfare gains) 78
6.5 Impacts on marginal prices 79
6.6 Stress tests 80
7. COSTS AND BENEFITS AND COST ALLOCATION 87
7.1 Financial analysis 87
7.2 Economic analysis 91
COST BENEFIT ANALYSIS OF STEP, AS FIRST PHASE OF MIDCAT - FINAL REPORT
17 November 2017
EC_Step CBA_Final Report_Master_601_Public.docx
7
PÖYRY MANAGEMENT CONSULTING
7.3 Break even analysis with disruption costs 94
7.4 Comparison with Frontier Economics’ results 96
7.5 Modelling-based indicators 97
7.6 Capacity-based indicators 102
7.7 Optionality of STEP 103
ANNEX A – DETAILED MODELLING RESULTS 105
A.1 Spanish flows in the Blue Transition scenario 106
A.2 Spanish and European flows in the Green Revolution / LNG+10 / OIES Algeria scenario 107
A.3 European LNG utilisation in different scenarios and different stress tests 109
A.4 Storage utilisation with different weather patterns 111
ANNEX B – FINANCIAL ANALYSIS RESULTS 112
ANNEX C – ECONOMIC ANALYSIS RESULTS 125
ANNEX D – COMPARISON WITH FRONTIER ECONOMICS’ STUDY 134
ANNEX E – CBA INDICATORS 137
E.1 Modelling-based indicators 137
E.2 Capacity-based indicators 142
ANNEX F – MODELLING GAS MARKET FUNDAMENTALS 147
F.1 Pegasus3 147
F.2 Pegasus3 in Rolling Tree optimisation mode 152
ANNEX G – BID3 POWER MARKET MODEL 157
G.1 Modelling methodology 158
G.2 Key input data 159
G.3 Model results 160
ANNEX H – MARKET REPORTS 163
]
COST BENEFIT ANALYSIS OF STEP, AS FIRST PHASE OF MIDCAT - FINAL REPORT
17 November 2017
EC_Step CBA_Final Report_Master_601_Public.docx
8
PÖYRY MANAGEMENT CONSULTING
EXECUTIVE SUMMARY
Introduction
This paper presents a cost benefit analysis (CBA) of a proposed pipeline project in the Eastern Pyrenees – the South Transit Eastern Pyrenees project (known as STEP). Pöyry Management Consulting (Pöyry), with the support of VIS Economic and Energy Consultants (VIS), has been mandated by the European Commission to produce a ‘project specific’ CBA (PS-CBA) for STEP in line with the ENTSOG methodology.
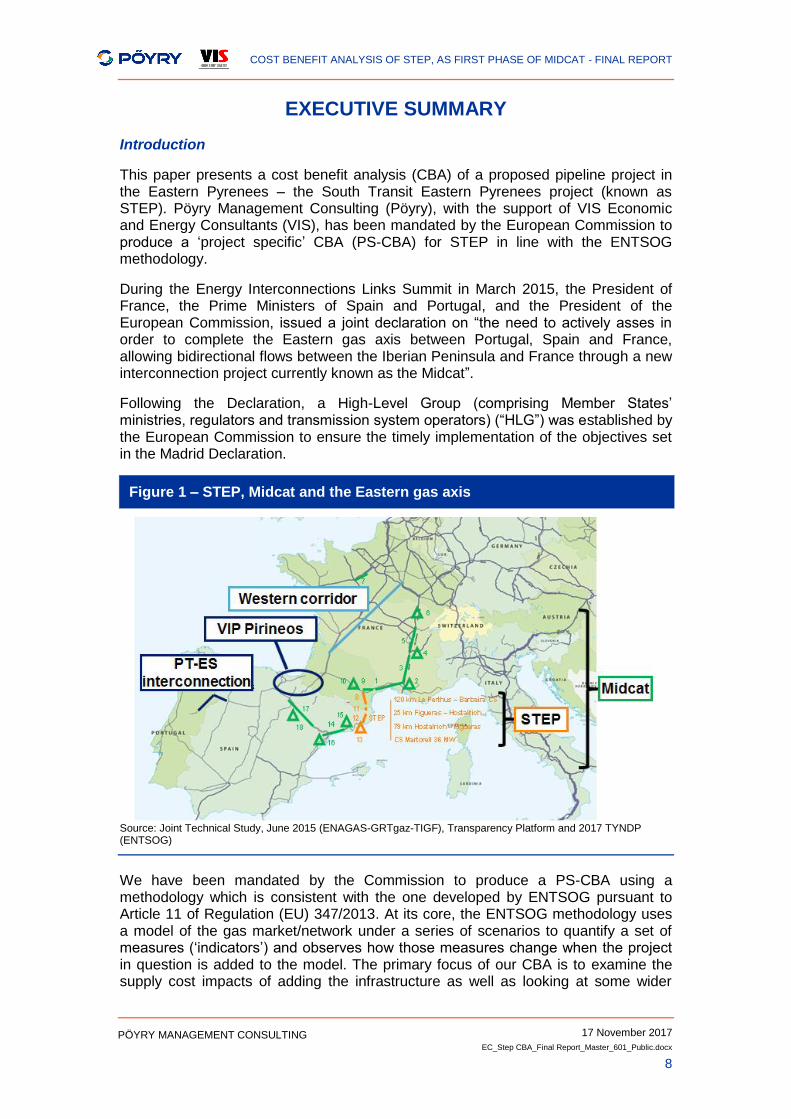
During the Energy Interconnections Links Summit in March 2015, the President of France, the Prime Ministers of Spain and Portugal, and the President of the European Commission, issued a joint declaration on “the need to actively asses in order to complete the Eastern gas axis between Portugal, Spain and France, allowing bidirectional flows between the Iberian Peninsula and France through a new interconnection project currently known as the Midcat”.
Following the Declaration, a High-Level Group (comprising Member States’ ministries, regulators and transmission system operators) (“HLG”) was established by the European Commission to ensure the timely implementation of the objectives set in the Madrid Declaration.
Figure 1 – STEP, Midcat and the Eastern gas axis
Source: Joint Technical Study, June 2015 (ENAGAS-GRTgaz-TIGF), Transparency Platform and 2017 TYNDP (ENTSOG)
We have been mandated by the Commission to produce a PS-CBA using a methodology which is consistent with the one developed by ENTSOG pursuant to Article 11 of Regulation (EU) 347/2013. At its core, the ENTSOG methodology uses a model of the gas market/network under a series of scenarios to quantify a set of measures (‘indicators’) and observes how those measures change when the project in question is added to the model. The primary focus of our CBA is to examine the supply cost impacts of adding the infrastructure as well as looking at some wider
COST BENEFIT ANALYSIS OF STEP, AS FIRST PHASE OF MIDCAT - FINAL REPORT
17 November 2017
EC_Step CBA_Final Report_Master_601_Public.docx
9
PÖYRY MANAGEMENT CONSULTING
quantitative/qualitative indicators. We do this by examining future possible market developments in our proprietary gas market fundamentals model. We study the asset under several scenarios to assess the robustness of results.
Scenarios
Pöyry has created a series of scenarios and stress tests that explore the potential economic benefits of STEP. Our analysis has examined the gas years 2022, 2025, 2030, 2035 and 2040, commensurate with the ENTSOG CBA methodology. These scenarios have been constructed to largely follow the scenarios specified in the ENTSOG 2017 Ten Year Network Development Plan (although Pöyry uses a different approach to modelling supply costs which is explained in section 5.3.3.2).
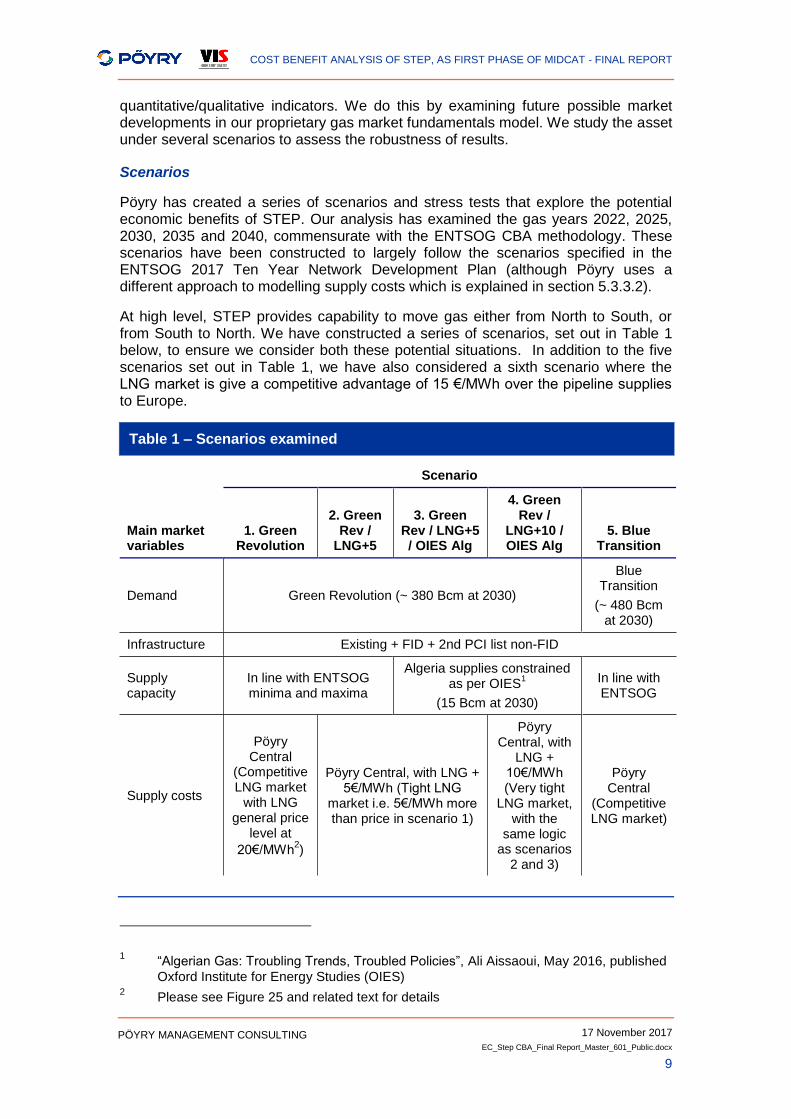
At high level, STEP provides capability to move gas either from North to South, or from South to North. We have constructed a series of scenarios, set out in Table 1 below, to ensure we consider both these potential situations. In addition to the five scenarios set out in Table 1, we have also considered a sixth scenario where the LNG market is give a competitive advantage of 15 €/MWh over the pipeline supplies to Europe.
Table 1 – Scenarios examined
Scenario
Main market variables
1. Green Revolution
2. Green Rev /
LNG+5
3. Green Rev / LNG+5 / OIES Alg
4. Green Rev /
LNG+10 / OIES Alg
5. Blue Transition
Demand Green Revolution (~ 380 Bcm at 2030)
Blue Transition
(~ 480 Bcm at 2030)
Infrastructure Existing + FID + 2nd PCI list non-FID
Supply capacity
In line with ENTSOG minima and maxima
Algeria supplies constrained as per OIES
1
(15 Bcm at 2030)
In line with ENTSOG
Supply costs
Pöyry Central
(Competitive LNG market
with LNG general price
level at
20€/MWh2)
Pöyry Central, with LNG + 5€/MWh (Tight LNG
market i.e. 5€/MWh more than price in scenario 1)
Pöyry Central, with
LNG + 10€/MWh (Very tight
LNG market, with the
same logic as scenarios
2 and 3)
Pöyry Central
(Competitive LNG market)
1 “Algerian Gas: Troubling Trends, Troubled Policies”, Ali Aissaoui, May 2016, published
Oxford Institute for Energy Studies (OIES) 2 Please see Figure 25 and related text for details
COST BENEFIT ANALYSIS OF STEP, AS FIRST PHASE OF MIDCAT - FINAL REPORT
17 November 2017
EC_Step CBA_Final Report_Master_601_Public.docx
10
PÖYRY MANAGEMENT CONSULTING
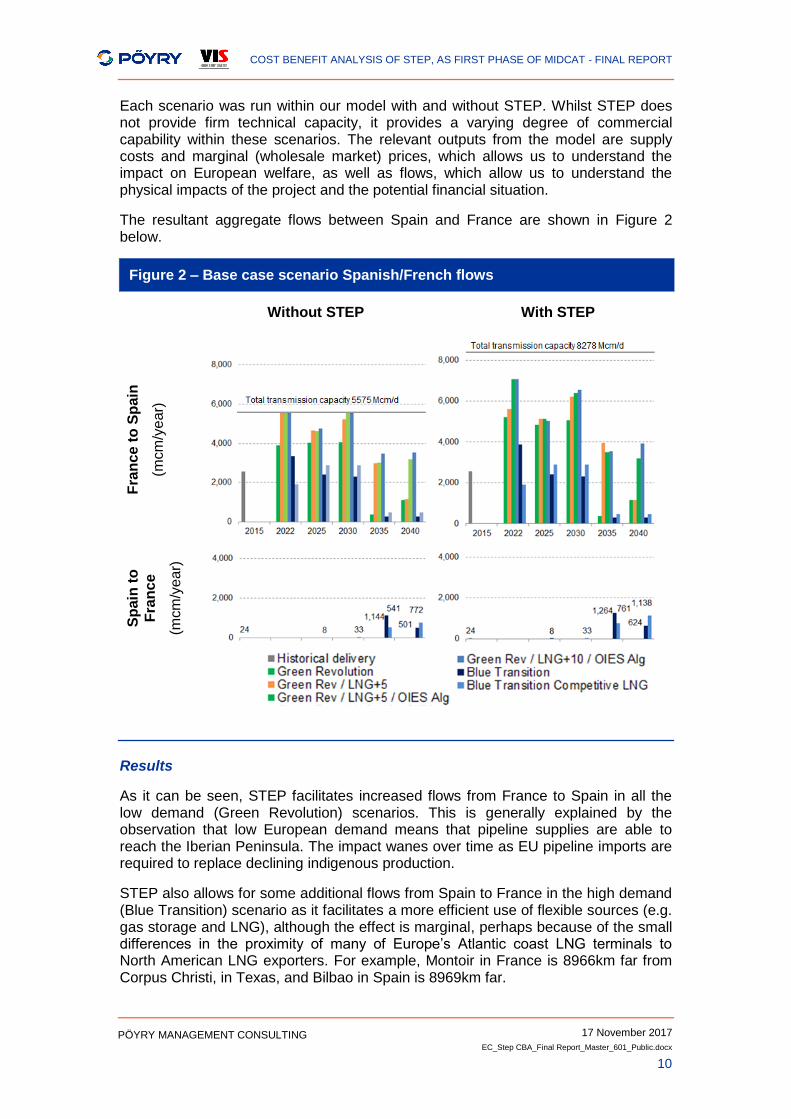
Each scenario was run within our model with and without STEP. Whilst STEP does not provide firm technical capacity, it provides a varying degree of commercial capability within these scenarios. The relevant outputs from the model are supply costs and marginal (wholesale market) prices, which allows us to understand the impact on European welfare, as well as flows, which allow us to understand the physical impacts of the project and the potential financial situation.
The resultant aggregate flows between Spain and France are shown in Figure 2 below.
Figure 2 – Base case scenario Spanish/French flows
Without STEP With STEP
Fra
nc
e t
o S
pain
(mcm
/ye
ar)
Sp
ain
to
Fra
nc
e
(mcm
/ye
ar)
Results
As it can be seen, STEP facilitates increased flows from France to Spain in all the low demand (Green Revolution) scenarios. This is generally explained by the observation that low European demand means that pipeline supplies are able to reach the Iberian Peninsula. The impact wanes over time as EU pipeline imports are required to replace declining indigenous production.
STEP also allows for some additional flows from Spain to France in the high demand (Blue Transition) scenario as it facilitates a more efficient use of flexible sources (e.g. gas storage and LNG), although the effect is marginal, perhaps because of the small differences in the proximity of many of Europe’s Atlantic coast LNG terminals to North American LNG exporters. For example, Montoir in France is 8966km far from Corpus Christi, in Texas, and Bilbao in Spain is 8969km far.
COST BENEFIT ANALYSIS OF STEP, AS FIRST PHASE OF MIDCAT - FINAL REPORT
17 November 2017
EC_Step CBA_Final Report_Master_601_Public.docx
11
PÖYRY MANAGEMENT CONSULTING
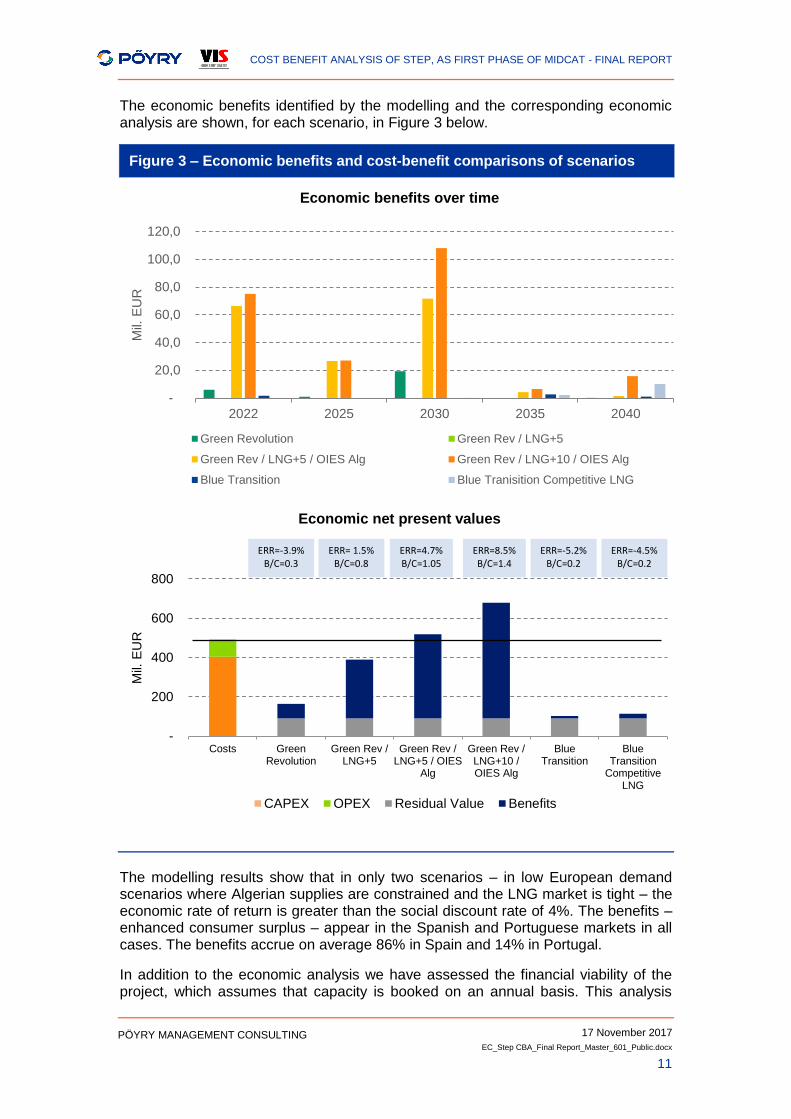
The economic benefits identified by the modelling and the corresponding economic analysis are shown, for each scenario, in Figure 3 below.
Figure 3 – Economic benefits and cost-benefit comparisons of scenarios
Economic benefits over time
Economic net present values
The modelling results show that in only two scenarios – in low European demand scenarios where Algerian supplies are constrained and the LNG market is tight – the economic rate of return is greater than the social discount rate of 4%. The benefits – enhanced consumer surplus – appear in the Spanish and Portuguese markets in all cases. The benefits accrue on average 86% in Spain and 14% in Portugal.
In addition to the economic analysis we have assessed the financial viability of the project, which assumes that capacity is booked on an annual basis. This analysis
-
20,0
40,0
60,0
80,0
100,0
120,0
2022 2025 2030 2035 2040
Mil.
EU
R
Green Revolution Green Rev / LNG+5
Green Rev / LNG+5 / OIES Alg Green Rev / LNG+10 / OIES Alg
Blue Transition Blue Tranisition Competitive LNG
-
200
400
600
800
Costs GreenRevolution
Green Rev /LNG+5
Green Rev /LNG+5 / OIES
Alg
Green Rev /LNG+10 /OIES Alg
BlueTransition
BlueTransition
CompetitiveLNG
Mil.
EU
R
CAPEX OPEX Residual Value Benefits
ERR=-3.9% B/C=0.3
ERR= 1.5% B/C=0.8
ERR=4.7% B/C=1.05
ERR=8.5% B/C=1.4
ERR=-5.2% B/C=0.2
ERR=-4.5% B/C=0.2
COST BENEFIT ANALYSIS OF STEP, AS FIRST PHASE OF MIDCAT - FINAL REPORT
17 November 2017
EC_Step CBA_Final Report_Master_601_Public.docx
12
PÖYRY MANAGEMENT CONSULTING
demonstrates that the project achieves an Internal Rate of Return (IRR) in excess of 4.4% (the average of French and Spanish TSO’s costs of capital allowed by the NRAs) in the three scenarios with a tight LNG market. The difference to the economic analysis does not represent social welfare change, however, but is a transfer of value from shippers to TSOs.
The ENTSOG methodology also provides for a series of indicators to be observed, pertaining to price convergence; supply source price diversification; remaining flexibility & demand disruption; security of supply (N-1); import route diversification and bi-directionality. None of these indicators are significantly impacted by STEP, except for the supply source price diversification. We observe that both France and Spain already enjoy healthy levels of security of supply according to the N-1 measure.
Stress tests and sensitivities
To ensure we have a clear picture of the impact that STEP might have on security of supply, these scenarios were also used as the basis of a series of ‘stress tests’. These stress tests are exogenously specified significant disruptions in underlying fundamentals. The stress tests we have examined are:
Maghreb Europe Gas pipe outage for 1 winter month – this is to test whether STEP lessens the impact of loss of major pipeline importation infrastructure into Iberia; please note that two scenarios, the 3 and 4, already apply a declining trend to the export capability of Algeria, from the current 45 Bcm to 15 Bcm in 2030; the stress test case is additional to the reduction of the scenarios;
Franpipe outage for 1 winter month – this is to test whether STEP lessens the impact of loss of major importation pipeline infrastructure into France from Norway;
Fos LNG terminal outage for 6 winter months – this is to test whether STEP lessens the impact of loss of major LNG importation infrastructure into France;
Complete cessation of Russian supplies to Europe for 6 winter months – this is to test whether STEP lessens the impact of loss of major supply into Europe;
Complete cessation of Algerian supplies to Europe for 6 winter months – this is to test whether STEP lessens the impact of loss of major supply into Iberia; please see note above on Algeria export capability scenarios and their correlation with this stress test case; and
Complete cessation of Qatari LNG supplies to the global gas market for 6 winter months – this is to test whether STEP lessens the impact of loss of a major supply into the global LNG market.
In addition to these stress tests we have undertaken additional sensitivities examining peak-day demands, peak 14-day demand and historical weather to test whether our detailed demand modelling assumptions might give rise to bias within the results. We have also applied different forms of modelling to test the resilience of our primary modelling to factors such as imperfect foresight and LNG scheduling.
The inclusion of STEP in the stress tested situations did not materially change the impact of the situations – i.e. STEP did not provide any additional benefits in these situations. Also, the sensitivities and tests of modelling form did not indicate that they would impact the results.
COST BENEFIT ANALYSIS OF STEP, AS FIRST PHASE OF MIDCAT - FINAL REPORT
17 November 2017
EC_Step CBA_Final Report_Master_601_Public.docx
13
PÖYRY MANAGEMENT CONSULTING
The results of this analysis shows that whilst the stress tests impact the European market, STEP does not change either the level of unserved energy or the resulting system costs.
Conclusions
From the analysis undertaken and the five scenarios we have examined, we conclude that STEP may have economic value but in presence of a specific combination of:
low levels of European gas demand (380 bcm/year in 2030, which is within the assumption used by the European Commission as a baseline for its Clean Energy Package of 350 bcm/year by 2030);
restricted availability of volumes of gas from Algeria (15bcm compared to the current 40bcm); and
global LNG market and therefore highly priced commodity (with LNG prices rising to approximately 150% of baseline levels, i.e. 30€/MWh).
Our analysis has been done in line with ENTSOG methodology, so it excludes potential local benefits.
COST BENEFIT ANALYSIS OF STEP, AS FIRST PHASE OF MIDCAT - FINAL REPORT
17 November 2017
EC_Step CBA_Final Report_Master_601_Public.docx
14
PÖYRY MANAGEMENT CONSULTING
1. INTRODUCTION
The Spanish and the French gas transmission systems are connected at the Larrau and Biriatu/Irun interconnection points. The interconnection points (IPs) are bundled commercially together to form the virtual IP (VIP) known as Pirineos, which provides 225 GWh/day of capacity from Spain to France and 165 GWh/day of capacity from France to Spain.
Additional interconnection capacity, in the form of the PCI project known as Midcat, has been under discussion for several years. In 2009 and 2010, Open Season procedures were held to test the market’s appetite for an extension of the transmission capacity between France and Spain. The results supported additional capacity increments at the existing physical IPs, which were implemented in 2015, but did not support the Midcat project.
Subsequently, Midcat received attention during the Energy Interconnections Links Summit in March 2015, from Spain, France, Portugal, the European Commission and the European Investment Bank. The President of France, the Prime Ministers of Spain and Portugal, and the President of the European Commission, in a joint declaration, agreed on “the need to actively asses in order to complete the Eastern gas axis between Portugal, Spain and France, allowing bidirectional flows between the Iberian Peninsula and France through a new interconnection project currently known as the MIDCAT”.
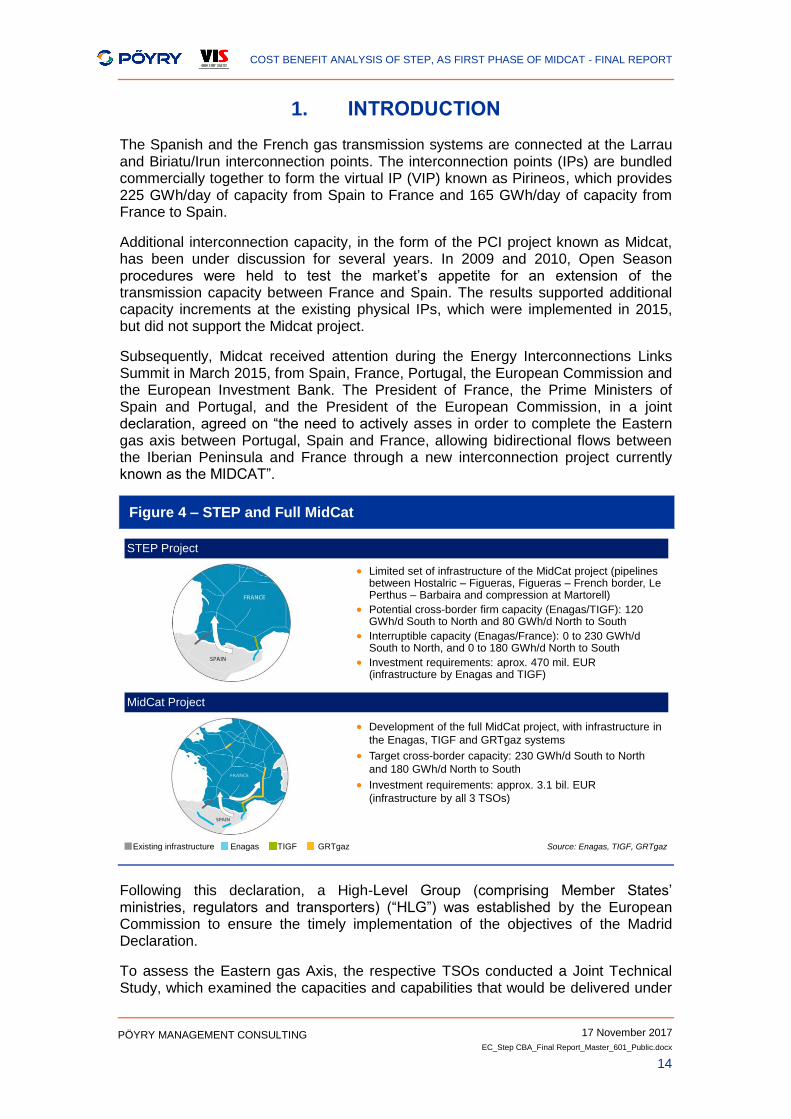
Figure 4 – STEP and Full MidCat
Following this declaration, a High-Level Group (comprising Member States’ ministries, regulators and transporters) (“HLG”) was established by the European Commission to ensure the timely implementation of the objectives of the Madrid Declaration.
To assess the Eastern gas Axis, the respective TSOs conducted a Joint Technical Study, which examined the capacities and capabilities that would be delivered under
Limited set of infrastructure of the MidCat project (pipelines between Hostalric – Figueras, Figueras – French border, Le Perthus – Barbaira and compression at Martorell)
Potential cross-border firm capacity (Enagas/TIGF): 120 GWh/d South to North and 80 GWh/d North to South
Interruptible capacity (Enagas/France): 0 to 230 GWh/d South to North, and 0 to 180 GWh/d North to South
Investment requirements: aprox. 470 mil. EUR (infrastructure by Enagas and TIGF)
Development of the full MidCat project, with infrastructure in
the Enagas, TIGF and GRTgaz systems
Target cross-border capacity: 230 GWh/d South to North
and 180 GWh/d North to South
Investment requirements: approx. 3.1 bil. EUR
(infrastructure by all 3 TSOs)
STEP Project
MidCat Project
Source: Enagas, TIGF, GRTgazExisting infrastructure Enagas TIGF GRTgaz
COST BENEFIT ANALYSIS OF STEP, AS FIRST PHASE OF MIDCAT - FINAL REPORT
17 November 2017
EC_Step CBA_Final Report_Master_601_Public.docx
15
PÖYRY MANAGEMENT CONSULTING
a range of situations and configurations of Midcat infrastructure projects. This study considered the capability that would be delivered by a reduced set of infrastructure, and the amount of infrastructure that would be required to deliver firm capacities (the full MidCat project). The reduced set of infrastructure is referred to as STEP (South Transit East Pyrenees) (see Figure 4). STEP includes:
a 79 km pipeline from Hostalric to Figueras and a 25 km pipeline to Figueras to the French border;
a compressor station of 36 MW at Martorell; and
a 120 km pipeline from Le Perthus to the compressor station of Barbaira.
STEP was not assessed by ENTSOG in the 2015 Ten Year Network Development Plan (TYNDP). ENTSOG, however, have included it in the 2017 TYNDP.
Pöyry was mandated by the European Commission to conduct a cost-benefit analysis (CBA) according to the CBA methodology developed by ENTSOG, pursuant to Article 11 of Regulation (EU) 347/2013 (Regulation).
The results of the CBA are set out as follows.
Executive summary
This introduction
Background & context
Description of the project
Description of the CBA methodology & stakeholder engagement
Definition of scenarios
Modelling results
Economic assessment
Conclusions
The annex with the CBA indicators
The annexes with a description of Pegasus3 and BID3 econometric models
All figures and charts are referenced to Pöyry and/or VIS unless otherwise stated.
COST BENEFIT ANALYSIS OF STEP, AS FIRST PHASE OF MIDCAT - FINAL REPORT
17 November 2017
EC_Step CBA_Final Report_Master_601_Public.docx
16
PÖYRY MANAGEMENT CONSULTING
2. SUMMARY OF FINDINGS FROM REVIEWED LITERATURE
In this Chapter we provide a summary of the main findings from the literature review by describing the most important outcomes of previous studies conducted by:
DNV GL, Ecorys, ECN and Ramboll – “Study on the benefits of additional gas interconnections between the Iberian Peninsula and the rest of Europe”
Frontier economics – “Project MidCat: Cost Benefit Analysis”
CRE (Commission de régulation de l'énergie) – “Les interconnexions électriques et gazières en France” (or “Electrical and gas interconnections in France”)
Joint Technical Study Between ENAGAS, GRTgaz and TIGF.
2.1 Study on the benefits of additional gas interconnections between the Iberian Peninsula and the rest of Europe
The consortium of DNV GL, Ecorys, ECN and Ramboll carried the “Study on the benefits of additional gas interconnections between the Iberian Peninsula and the rest of Europe” reaching the following main conclusions:
There is sufficient evidence for establishing additional interconnections between the two areas in scope;
In low demand scenarios the increased interconnection capacity would allow for better integration of the Iberian gas market with the rest of the EU;
In high demand scenario LNG terminals in the Iberian peninsula would be made available for security of supply situations;
Security of supply can - to a certain degree - be created by establishing only the first step of MidCat.
It was additionally suggested that detailed feasibility and conceptual analyses are necessary to create a firm basis for decision making and final investment decision.
In more detail, the study concluded that increased interconnection capacity from the MidCat interconnector is justified as it allows the integration of the Iberian gas market with the rest of EU in low demand scenarios, where the need for LNG import towards the EU is limited. In high demand scenarios, the interconnector makes LNG terminals on Iberian Peninsula available for security of supply situations (Russia or Norway disruption) where LNG terminals in the rest of EU will not have sufficient capacity.
In the case of limited LNG import to EU, the dominating LNG exporters could choose to use Northern European LNG terminals (if new LNG receiving terminals were to be established in North and Eastern Europe for security of supply reasons) and hereby creating congestion on the interconnector and isolate the Iberian markets.
In more demand cases there will be a case for the interconnector, with prevailing flow direction depending on EU demand and LNG versus gas hub prices. Based on the study analysis, security of supply can to a certain degree be created by only establishing the first step of MidCat, which should preferably be established with the same capacity as the Eridan project, which may increase the ultimate capacity from 8 to 20 bcm/year.
COST BENEFIT ANALYSIS OF STEP, AS FIRST PHASE OF MIDCAT - FINAL REPORT
17 November 2017
EC_Step CBA_Final Report_Master_601_Public.docx
17
PÖYRY MANAGEMENT CONSULTING
The first step of the MidCat project would allow for an initial market integration of the Iberian peninsula, while full market integration will require large capacity and removing internal bottlenecks in France in particular for North to South flow.
The expected increase in the already high border tariffs between France and Spain, when France establishes one market zone from 2018, contributes to further splitting the Iberian Peninsula from the rest of the EU gas market, in particular for short term trade. A stepwise implementation of the interconnector is possible when accepting that mostly interruptible capacity will be available after the first step MidCat.
This study has been appreciated by the stakeholders in that it provides a distribution of the benefits on the impacted Member States.
2.2 Project MidCat: Cost Benefit Analysis
Frontier Economics was mandated in 2015 by ENAGAS S.A. to develop a Cost Benefit Analysis, CBA, of “The MidCat project”. The study reached the following main conclusions:
Frontier Economics concluded that averaged over all scenarios considered, MidCat represents a socially profitable investment under most cost options considered
Comparing the composition of the infrastructure in place in Spain to those of the rest of Europe and based on the modelling approach adopted and consistent with ENTSO-G methodology, a key driver of the benefits of MidCat is the price differential between LNG and natural gas imports
MidCat would allow for an increase in the available capacity for Spain to be supplied by natural gas via pipeline, while at the same time providing the rest of Europe with additional import potential for LNG supplies
In scenarios where LNG is priced at lower prices to natural gas imports, the study finds that MidCat tends to be used in the direction Spain-France
In scenarios where LNG is more expensive than natural gas, the direction of gas flows is reversed
It was additionally suggested that detailed feasibility and conceptual analyses are necessary to create a firm basis for decision making and final investment decision.
The study does not include the most recent value for the existing interconnection capacity between France and Spain. The study was finalised in May 2015 when the capacity was lower, i.e. 170GWh/d in 2015 vs. 225GWh/d in 2017, Spain to France direction.
A comparison of the results of the Frontier Economics study and this study is given in paragraph 7.3.
2.3 Commission de régulation de l'énergie (CRE) report on the “Electricity and gas interconnections in France”
The CRE (“Commission de régulation de l'énergie) considers the MidCat as not crucial for the security of the French supply system.
COST BENEFIT ANALYSIS OF STEP, AS FIRST PHASE OF MIDCAT - FINAL REPORT
17 November 2017
EC_Step CBA_Final Report_Master_601_Public.docx
18
PÖYRY MANAGEMENT CONSULTING
In its June 2016 report on the “Electricity and gas interconnections in France”, the CRE states that the existing infrastructure already provides for a good and sufficient level of interconnection between the French and the Spanish market.
It also reports that unallocated capacity is currently available and will further increase when long term allocations expire. According to the CRE, the project would also imply high costs, ca. 2B€, for additional developments on the French national grid.
The CRE report suggested that TSOs run market tests, as demanded in European network codes, in order to verify that the market actually needs such infrastructure.
If market test results are negative (which according to the CRE it is likely, given the current market context), the CRE concludes that the decision can be taken only in light of the completion of a comprehensive CBA.
2.4 TSO joint technical study
The study has been conducted by the three involved TSOs, i.e. ENAGAS, GRTgaz and TIGF, with the aim of defining the levels of transmission capacity delivered by STEP in various scenarios of demand and relevant gas infrastructure utilization.
Under this study, the STEP project consists of:
For TIGF: a pipeline between the compressor station of Barbaira and Le Perthus
For ENAGAS: a pipeline between Hostalric and Figueras, a pipeline between Figueras and Le Perthus and a compressor station in Martorell
With such a configuration, the STEP interconnector can provide firm capacity for 120 GWh/d from South to North and 80 GWh/d from North to South, on the Spanish side. The firm capacity provided on the French side, on a firm basis, is zero in both directions. This is because firm capacity is defined as available in the worst case scenario.
Capacity for 120 GWh/d from Spain to France, in Spain, can be delivered in the following conditions:
Shippers have made commercial arrangements to have Barcelona LNG Terminal working at least at 30% of nominal send-out capacity ~165 GWh/d, to serve national demand and/or exports to Portugal or France
The Spanish Gas system adopts operative or commercial measures to guarantee the 30% utilization at Barcelona.
The capacity delivered in the South to North direction might increase congestion at the French system. In winter time, it might compete with deliverability at Fos LNG terminal and Lussagnet and Manosque gas storages. In summer time instead, storage injection provide an outlet for the STEP Spain to France capacity.
The firm capacity North to South, at 80 GWh/d, can be delivered if Barcelona LNG terminal utilization is not higher than 95%. During the winter season this condition is usually met and so is during summer time.
Even in the North to South direction, STEP capacity competes with the one at the French gas transmission system. In summer time, in particular, the STEP capacity might reduce fuel injection at the southern gas storages. In winter time, deliverability in the area of influence might be reduced to allow for the 80 GWh/d capacity North to South.

COST BENEFIT ANALYSIS OF STEP, AS FIRST PHASE OF MIDCAT - FINAL REPORT
17 November 2017
EC_Step CBA_Final Report_Master_601_Public.docx
19
PÖYRY MANAGEMENT CONSULTING
The study proposes other scenarios resulting in different STEP capacities.
The results of this study are important to accurately include in the gas model the STEP capacity.
The outcome of this study, in particular the flow equations, has been included in this study to assess the transport capability of STEP, as described in section 4.3.3.1.
COST BENEFIT ANALYSIS OF STEP, AS FIRST PHASE OF MIDCAT - FINAL REPORT
17 November 2017
EC_Step CBA_Final Report_Master_601_Public.docx
20
PÖYRY MANAGEMENT CONSULTING
3. BACKGROUND AND CONTEXT
3.1 Gas market overview in France, Spain and Portugal
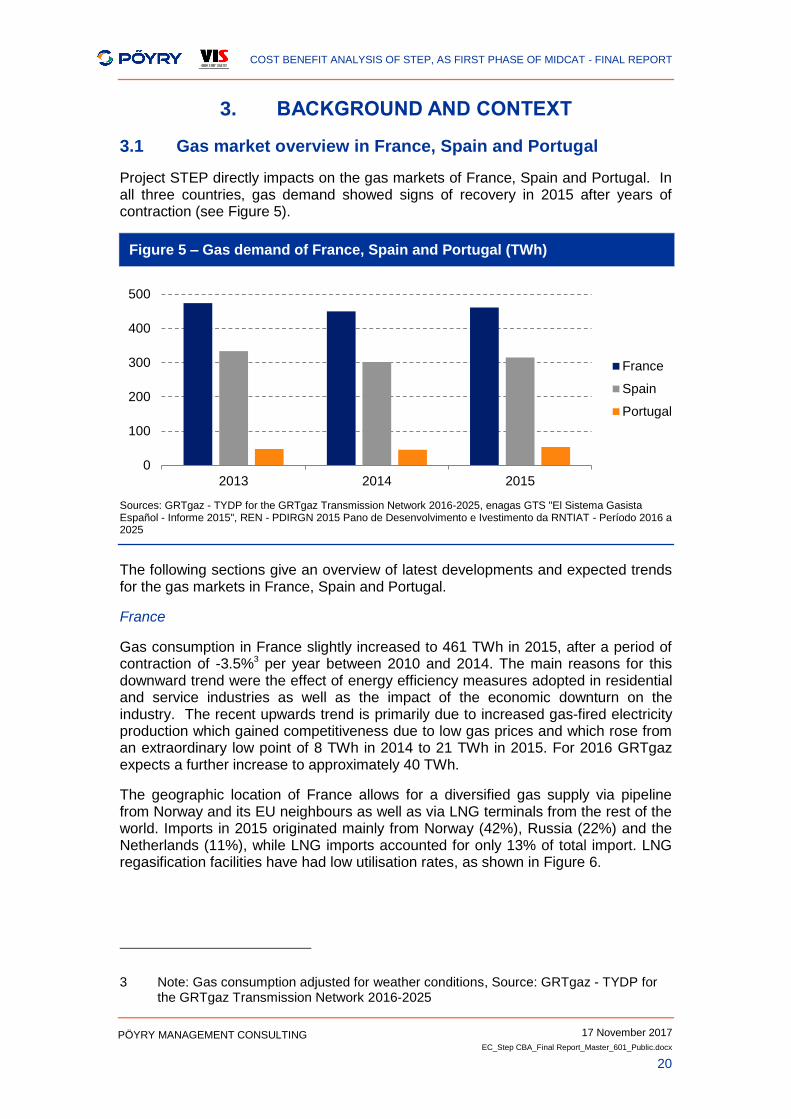
Project STEP directly impacts on the gas markets of France, Spain and Portugal. In all three countries, gas demand showed signs of recovery in 2015 after years of contraction (see Figure 5).
Figure 5 – Gas demand of France, Spain and Portugal (TWh)
Sources: GRTgaz - TYDP for the GRTgaz Transmission Network 2016-2025, enagas GTS "El Sistema Gasista Español - Informe 2015", REN - PDIRGN 2015 Pano de Desenvolvimento e Ivestimento da RNTIAT - Período 2016 a 2025
The following sections give an overview of latest developments and expected trends for the gas markets in France, Spain and Portugal.
France
Gas consumption in France slightly increased to 461 TWh in 2015, after a period of contraction of -3.5%3 per year between 2010 and 2014. The main reasons for this downward trend were the effect of energy efficiency measures adopted in residential and service industries as well as the impact of the economic downturn on the industry. The recent upwards trend is primarily due to increased gas-fired electricity production which gained competitiveness due to low gas prices and which rose from an extraordinary low point of 8 TWh in 2014 to 21 TWh in 2015. For 2016 GRTgaz expects a further increase to approximately 40 TWh.
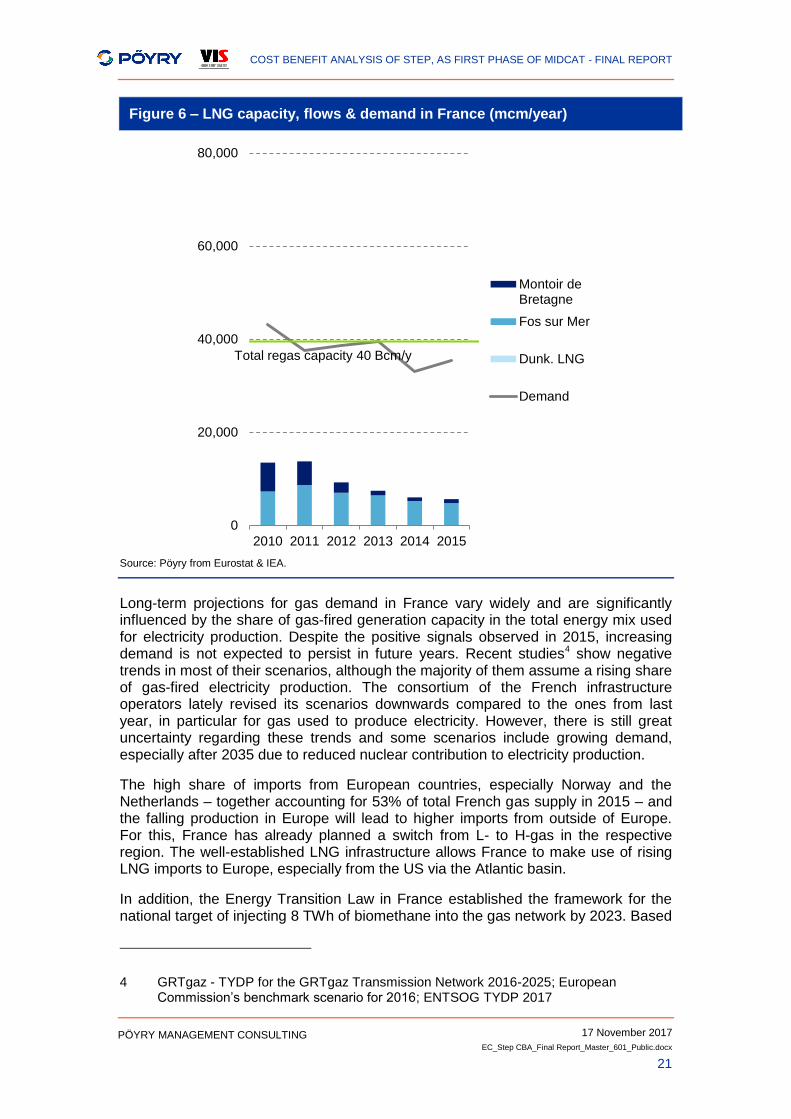
The geographic location of France allows for a diversified gas supply via pipeline from Norway and its EU neighbours as well as via LNG terminals from the rest of the world. Imports in 2015 originated mainly from Norway (42%), Russia (22%) and the Netherlands (11%), while LNG imports accounted for only 13% of total import. LNG regasification facilities have had low utilisation rates, as shown in Figure 6.
3 Note: Gas consumption adjusted for weather conditions, Source: GRTgaz - TYDP for the GRTgaz Transmission Network 2016-2025
0
100
200
300
400
500
2013 2014 2015
France
Spain
Portugal
COST BENEFIT ANALYSIS OF STEP, AS FIRST PHASE OF MIDCAT - FINAL REPORT
17 November 2017
EC_Step CBA_Final Report_Master_601_Public.docx
21
PÖYRY MANAGEMENT CONSULTING
Figure 6 – LNG capacity, flows & demand in France (mcm/year)
Source: Pöyry from Eurostat & IEA.
Long-term projections for gas demand in France vary widely and are significantly influenced by the share of gas-fired generation capacity in the total energy mix used for electricity production. Despite the positive signals observed in 2015, increasing demand is not expected to persist in future years. Recent studies4 show negative trends in most of their scenarios, although the majority of them assume a rising share of gas-fired electricity production. The consortium of the French infrastructure operators lately revised its scenarios downwards compared to the ones from last year, in particular for gas used to produce electricity. However, there is still great uncertainty regarding these trends and some scenarios include growing demand, especially after 2035 due to reduced nuclear contribution to electricity production.
The high share of imports from European countries, especially Norway and the Netherlands – together accounting for 53% of total French gas supply in 2015 – and the falling production in Europe will lead to higher imports from outside of Europe. For this, France has already planned a switch from L- to H-gas in the respective region. The well-established LNG infrastructure allows France to make use of rising LNG imports to Europe, especially from the US via the Atlantic basin.
In addition, the Energy Transition Law in France established the framework for the national target of injecting 8 TWh of biomethane into the gas network by 2023. Based
4 GRTgaz - TYDP for the GRTgaz Transmission Network 2016-2025; European Commission’s benchmark scenario for 2016; ENTSOG TYDP 2017
0
20,000
40,000
60,000
80,000
2010 2011 2012 2013 2014 2015
Montoir deBretagne
Fos sur Mer
Dunk. LNG
Demand
Total regas capacity 40 Bcm/y
COST BENEFIT ANALYSIS OF STEP, AS FIRST PHASE OF MIDCAT - FINAL REPORT
17 November 2017
EC_Step CBA_Final Report_Master_601_Public.docx
22
PÖYRY MANAGEMENT CONSULTING
on this, the TYDP for GRTgaz projects a ramping up of national biomethane production from less than 1 TWh in 2015 to approximately 18-54 TWh in 2035.
Major infrastructure developments of the French gas network are described in section 3.3.
The year 2016 saw a significant reduction in the electricity generated by the French nuclear fleet. This led to an increase in CCGT generation which has supported French gas demand levels during 2016, as well as reduced exports and increased imports from the UK, German and Belgian and other electricity markets, ultimately being provided by thermal generation (gas and coal).
ENTSOG has assumed demand of between 36 and 48 bcm/year for France by 2030.
Spain
Between 2010 and 2014 the domestic gas demand in Spain dropped from 401 TWh to 302 TWh, a reduction of 25%5. This downward trend was followed by a slight recovery to 315 TWh in 2015. During the period of contraction increased exports partially compensated the decline in demand reaching a share of around 22% in 2014. Between 2000 and 2009 the commissioning of several CCGTs led to a strong increase in the share of gas used for electricity production which was the main reason for overall growth in gas demand.
The increase in 2015 is mainly based on two drivers. First, gas-fired electricity production surged resulting from lower hydro and wind generation than in 2014. Second, temperatures in first quarter in 2015 were comparatively low.
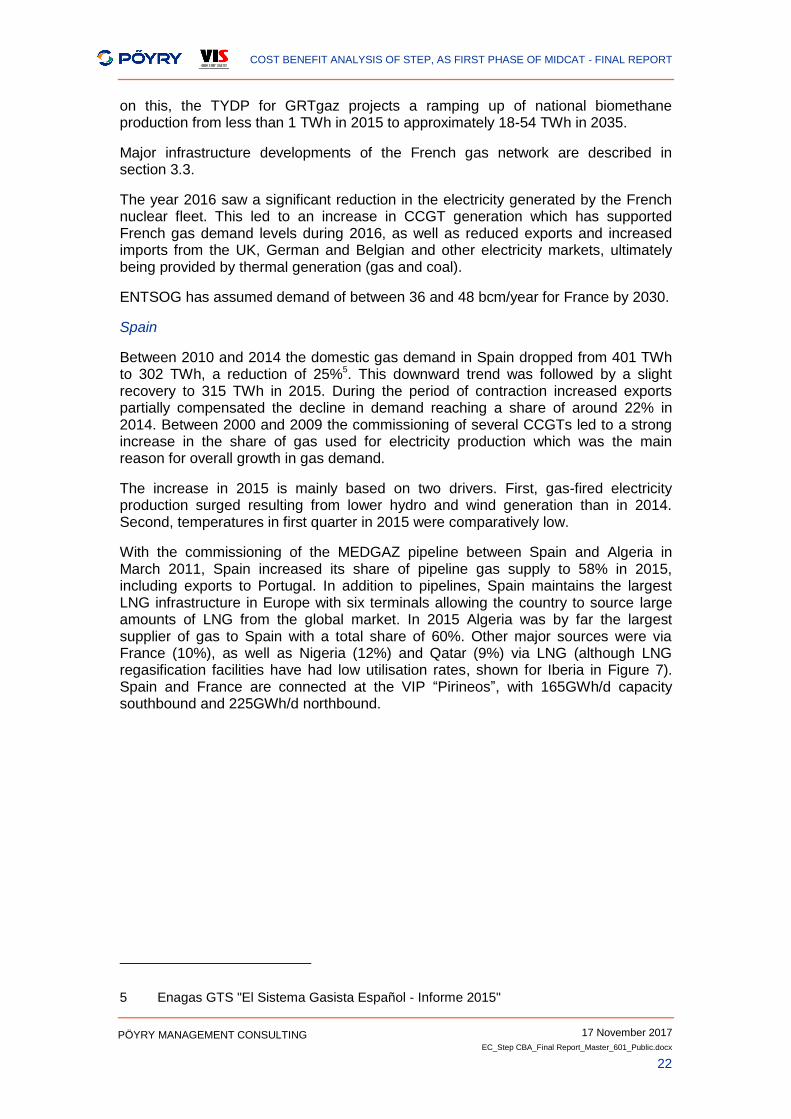
With the commissioning of the MEDGAZ pipeline between Spain and Algeria in March 2011, Spain increased its share of pipeline gas supply to 58% in 2015, including exports to Portugal. In addition to pipelines, Spain maintains the largest LNG infrastructure in Europe with six terminals allowing the country to source large amounts of LNG from the global market. In 2015 Algeria was by far the largest supplier of gas to Spain with a total share of 60%. Other major sources were via France (10%), as well as Nigeria (12%) and Qatar (9%) via LNG (although LNG regasification facilities have had low utilisation rates, shown for Iberia in Figure 7). Spain and France are connected at the VIP “Pirineos”, with 165GWh/d capacity southbound and 225GWh/d northbound.
5 Enagas GTS "El Sistema Gasista Español - Informe 2015"
COST BENEFIT ANALYSIS OF STEP, AS FIRST PHASE OF MIDCAT - FINAL REPORT
17 November 2017
EC_Step CBA_Final Report_Master_601_Public.docx
23
PÖYRY MANAGEMENT CONSULTING
Figure 7 – LNG capacity, flows & demand in Iberia (mcm/year)
Source: Poyry from Eurostat & IEA. * excludes EU interconnection capacity
Besides STEP, the LNG terminal at the El Musel commercial Port is the second major infrastructure project within the Spanish gas network. Construction work on the LNG terminal, which has an annual regasification capacity of 7 bcm, has already been completed. However, authorization granted by the Ministry of Industry has been rejected by the Spanish Supreme Court and so start of operation is still subject to authorization by the Government.
The year 2016 saw the introduction of the 'PVB' the new name for the entry-paid virtual trading point in Spain (previously called 'AOB'). Liquidity (i.e. the ability to, and cost of, trade) and transparency in the Spanish market have continued to improve, and reported prices for AOC/PVB became reliable (i.e. reflect the price at which gas has actually been traded) in approximately mid-2016.
ENTSOG has assumed demand of between 39 and 46 bcm/year for Spain by 2030.
Portugal
Gas demand in Portugal fell from 58 TWh in 2010 to 45 TWh in 20146. This is the result of a -86% slump in gas-fired electricity production which more than offset the 19% growth in the conventional market within this period. The negative trend seen in power sector gas demand is based on an increased installed wind capacity, the
6 REN - PDIRGN 2015 Pano de Desenvolvimento e Ivestimento da RNTIAT - Período 2016 a 2025
0
20,000
40,000
60,000
80,000
2010 2011 2012 2013 2014 2015
Sines
Sagunto
Murgardos
Huelva
Cartagena
Bilbao
Barcelona
Demand
Total regas capacity 67 Bcm/y
COST BENEFIT ANALYSIS OF STEP, AS FIRST PHASE OF MIDCAT - FINAL REPORT
17 November 2017
EC_Step CBA_Final Report_Master_601_Public.docx
24
PÖYRY MANAGEMENT CONSULTING
reduced price of CO2 allowances leading to a competitive advantage of coal-based electricity production, and a slightly reduced electricity demand in Portugal.
In general, Portugal’s energy mix for electricity production is strongly influenced by the hydrological conditions of the respective year. The conventional sector showed the characteristics of an emerging market with growth even during the period of economic recession 2011-2013. REN’s scenarios for long-term gas demand vary but foresee a positive development with a surge of 12-85% in 2030 compared to 2015.
Despite the increased diversification of supply sources achieved via Portugal’s only LNG terminal in Sines, Portugal is highly dependent on pipeline gas from Algeria which is imported via the interconnection at Campo Maior and accounts for 68% of total gas supply. Qatar is the second largest supplier to Portugal with a share of 15%. Over the last decade almost the entire gas supply has been imported via the LNG terminal in Sines and the Campo Maior interconnection.
In the mid-term, the PCI “3rd Interconnection between Portugal and Spain” will further diversify Portugal’s supply sources. As part of the “Priority corridor North-South gas interconnections in Western Europe” it promotes bidirectional flows between Portuguese and Spanish gas systems. The project plays a major role in the market integration of the Iberian Peninsula, increasing the systems flexibility and helping to achieve the National and European energy policy goals, primarily security of supply.
It consists of a DN700 (28”) pipeline connecting Celorico da Beira in Portugal with Zamora in Spain (pipeline Celorico/Vale de Frades). The project is presented in the ENTSOG TYNDP 2017 with two phases on the Spanish side, with commissioning dates in 2021 and 2025 respectively, and one phase on the Portuguese side, with commissioning date in 2021.
ENTSOG has assumed demand of between 5.8 and 6.8 bcm/year for Portugal by 2030.
3.2 Focus on LNG to Europe
LNG represents the main alternative to pipeline supplies of gas and accounts for a growing share of world natural gas trade, with around 10% of natural gas consumption and 31% of global natural gas trade7. The rise of LNG has connected remote geographies with great impact on the mix and cost of gas supply.
For Europe, LNG is a major opportunity to diversify supply sources and thus reduce dependence on the few non-EU countries connected through pipelines, notably Russia, Norway and Algeria. Consequently, the development of a competitive LNG market framework is important for the EU. In order to achieve this, the development of a suitable infrastructure facilitating access to LNG for all Member Countries is of high importance.
Similar to total gas demand in Europe but to a larger extent, European LNG imports dropped from 82 bcm in 2010 to 41 bcm in 2014. In 2015, a weaker Asian demand coupled with narrowed Asia - European hub price differentials and general recovery of EU gas consumption, supported diversion of flows towards Europe, which passed from 41 to 48 bcm, corresponding to a 16% increase.
7 EIA 2015, https://www.eia.gov/forecasts/ieo/nat_gas.cfm
COST BENEFIT ANALYSIS OF STEP, AS FIRST PHASE OF MIDCAT - FINAL REPORT
17 November 2017
EC_Step CBA_Final Report_Master_601_Public.docx
25
PÖYRY MANAGEMENT CONSULTING
In general, European LNG consumption has been highly dependent on LNG availability for the European market, resulting from price arbitrage between the Atlantic and Pacific basins. These were mainly influenced by gas market dynamics in the Asian regions, in the post financial crisis and Fukushima event phase.
On the global supply side Middle East has become by far the largest LNG producer (mainly as a result of the huge increase in output from Qatar), followed by South East Asia and Africa with, respectively, 38%, 20% and 15% market share in 20158. So far North America has not been a relevant supplier on the global or on the European LNG market. However, the first European shipment of US LNG took place in April 2016 at the Portuguese Sines terminal and the United States is well positioned to become one of the largest LNG exporters in the world.
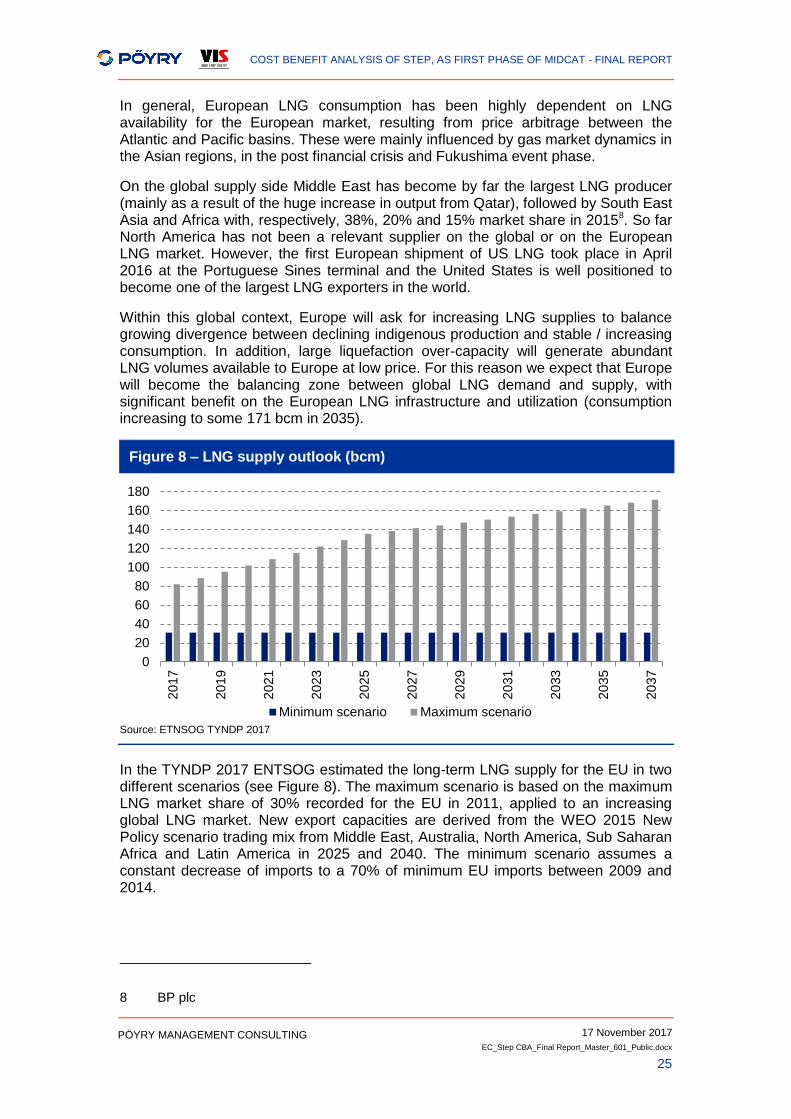
Within this global context, Europe will ask for increasing LNG supplies to balance growing divergence between declining indigenous production and stable / increasing consumption. In addition, large liquefaction over-capacity will generate abundant LNG volumes available to Europe at low price. For this reason we expect that Europe will become the balancing zone between global LNG demand and supply, with significant benefit on the European LNG infrastructure and utilization (consumption increasing to some 171 bcm in 2035).
Figure 8 – LNG supply outlook (bcm)
Source: ETNSOG TYNDP 2017
In the TYNDP 2017 ENTSOG estimated the long-term LNG supply for the EU in two different scenarios (see Figure 8). The maximum scenario is based on the maximum LNG market share of 30% recorded for the EU in 2011, applied to an increasing global LNG market. New export capacities are derived from the WEO 2015 New Policy scenario trading mix from Middle East, Australia, North America, Sub Saharan Africa and Latin America in 2025 and 2040. The minimum scenario assumes a constant decrease of imports to a 70% of minimum EU imports between 2009 and 2014.
8 BP plc
0
20
40
60
80
100
120
140
160
180
20
17
20
19
20
21
20
23
20
25
20
27
20
29
20
31
20
33
20
35
20
37
Minimum scenario Maximum scenario
COST BENEFIT ANALYSIS OF STEP, AS FIRST PHASE OF MIDCAT - FINAL REPORT
17 November 2017
EC_Step CBA_Final Report_Master_601_Public.docx
26
PÖYRY MANAGEMENT CONSULTING
3.3 Focus on PEG merger in France
At present, there are two balancing zones in France – the Trading Region South (TRS), formed in 2015 from the merger of TIGF’s market area with the area of GRTgaz Sud, and GRTgaz North (PEG North).
The price spread between TRS and PEG North, as well as the auction results on the North-South link in spring 2014, illustrate the physical congestion between the two market areas. In order to create a single wholesale market in France and facilitate the integration of the French network into the European system, the French energy regulation commission (CRE) and the market operators have made plans to merge the TRS and PEG North in 2018 (PEG merger).
In its TYDP for the Transmission Network 2016-2025 GRTgaz states that for this PEG merger several analyses have been conducted to determine the optimal target model. A combination of infrastructure investments and contractual mechanisms was identified as the most efficient solution. The infrastructure investments consist of the Arc de Dierrey and Eridan projects as well as the Val de Saône looping of the Burgundy pipeline.
A comparative CBA on different investment alternatives conducted by Pöyry in the second half of 2013 confirmed Val de Saône and identified Gascogne Midi as a more economical alternative for the Eridan project9. This alternative combines the consolidation works on the GRTgaz and the TIGF networks facilitating the transfer of large quantities from the market area North to the one in the South. It consists of the following two infrastructure projects which were both declared as Projects of Common Interest by the EU Commission10:
Val de Saône project: The looping of the Burgundy pipeline between the stations in Voisines and Étrez allowing for North-South traffic via the shortest route in the East of France.
Apart from the looping the Burgundy pipeline (189 km, DN 1,200) the project includes the capacity consolidation of the compressor station in Étrez by installing a third 9 MW compressor, and adjusting the interconnections in Étrez, Palleau and Voisines accordingly. Commissioning is planned for November 2018.
Given its importance for the completion of the Eastern Gas Axis, the EU has granted financial aid of max. EUR 74 million covering up to 10% of the overall costs of approximately EUR 740 million.
Gascogne Midi project: The consolidation of the southern section of the West-East link opens up the South-East of France and allows for supplementary supply of this region via the Western part of the country. For this, the midi pipeline creates a backhaul flow from TIGF to GRTgaz.
Within the TIGF network the project contains the partial looping of the Gascogne pipeline over 60 km between Lussagnet and Barran as well as the consolidation work on the Barbaira station. Within the GRTgaz network
9 See, “Deliberation of the French Energy Regulatory Commission dated 7 May 2014
setting out guidelines for the creation of a single marketplace in France by 2018”, CRE, 7 May 2014
10 GRTgaz - TYDP for the GRTgaz Transmission Network 2016-2025
COST BENEFIT ANALYSIS OF STEP, AS FIRST PHASE OF MIDCAT - FINAL REPORT
17 November 2017
EC_Step CBA_Final Report_Master_601_Public.docx
27
PÖYRY MANAGEMENT CONSULTING
the Cruzy (Hérault) and St-Martin-de-Crau (Bouches-du-Rhône) stations will be redesigned to operate the Midi pipeline in a backhaul direction.
Commissioning is expected in late 2017 (GRTgaz part) and late 2018 (TIGF part). The provisional budget for TIGF amounts to EUR 152 million while the final investment decision of GRTgaz is EUR 22 million.
The two projects allow the merger of the PEG North and TRS market areas, while still maintaining the GRTgaz and TIGF balancing areas. The gas offer on the future single PEG will be capable of facilitating the usual requirements of shippers. In addition, certain rare flow patterns must be met by contractual mechanisms that are currently analysed as part of the “Concertation Gaz” consultation procedure. In 2014 the CRE adopted the investment scheme for the combination of these two projects and asked the TSOs to start the implementation.
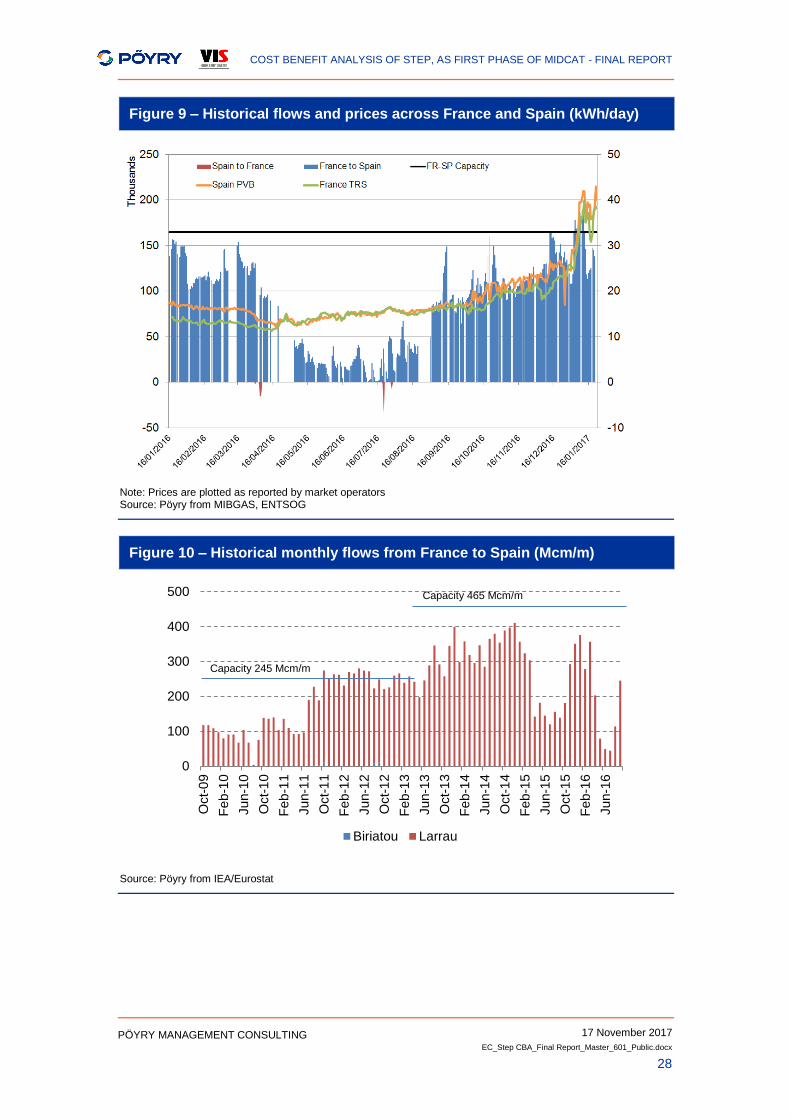
3.4 Flows and prices between Spain and France
The chart in Figure 9 below plots flows across the Spanish-French border over the period from January 2016 to January 2017, using data available in February 2017 (there is insufficient reliable data to extend this analysis to cover earlier periods). This clearly demonstrates that there are significant price differences even when capacity does not appear to be fully utilised.
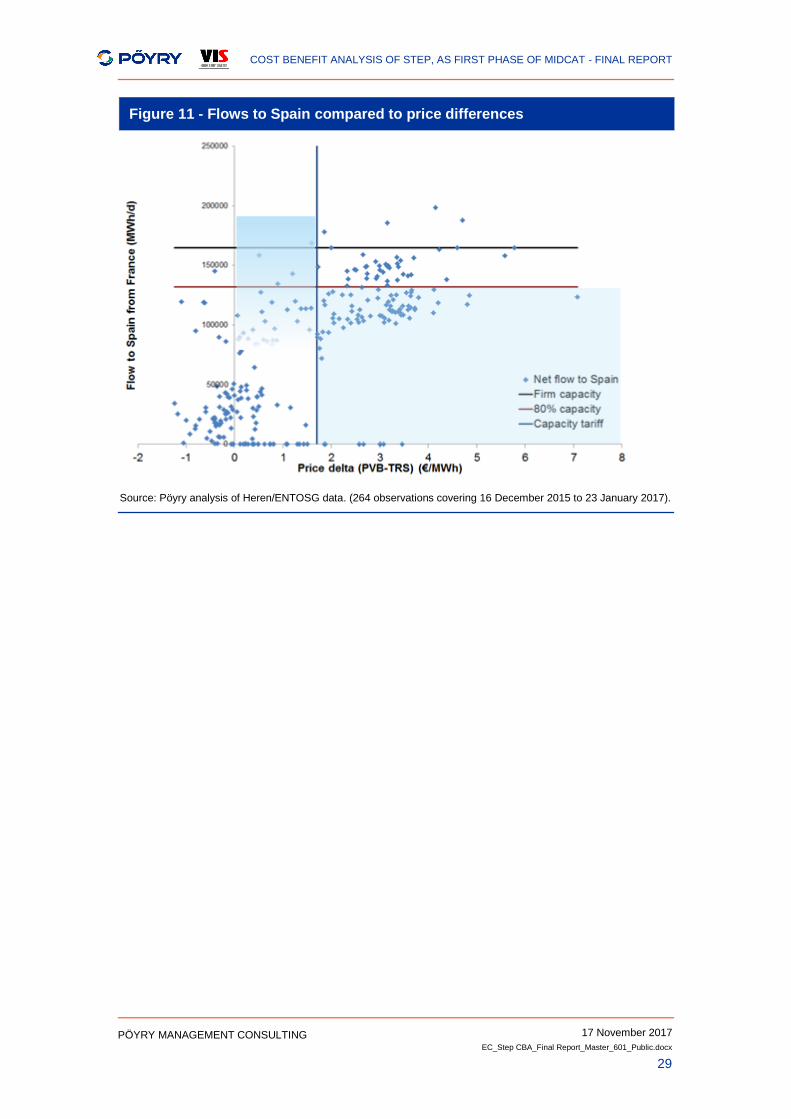
Figure 10 demonstrates that there has been relatively low utilisation recently.
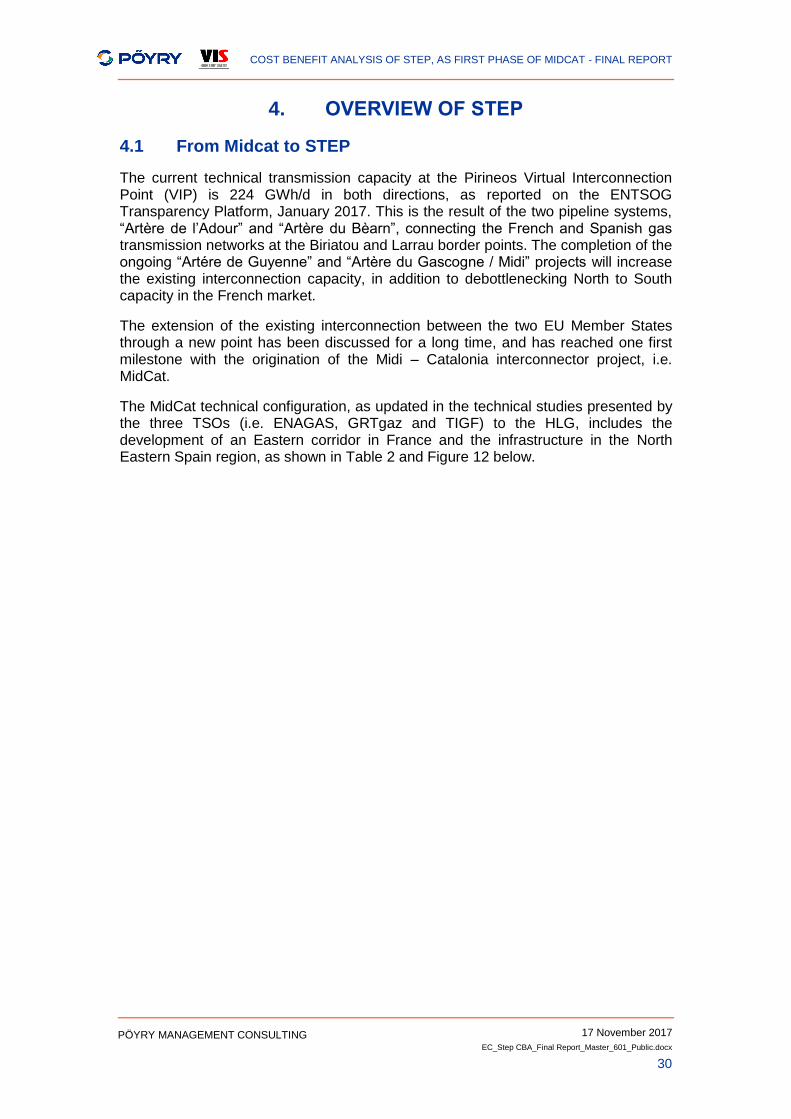
We would expect to see very low utilisation of the existing interconnector capacity where price differentials are lower than the applicable transportation tariff, and very high utilisation (e.g. above 80%) where price differentials are above the transportation tariff. However Figure 11 suggests that there are significant deviations from this pattern (the shaded areas). Among the reasons for this observed lack of correlation between price spreads and flows, there might be regulatory and / or commercial restrictions on use of capacity or trading market access. Any underlying restrictions may prevent the full benefits of any capacity expansion (e.g. STEP) from being realised.
In addition, more recently there have been flows above the technical capacity of the existing interconnection, which suggests that physical capability is greater than the technical capacity. The very high utilisation in early January also indicates that there may be some value in additional capacity. However it is difficult to know whether previous inefficiencies have been removed, so it is not clear that additional capacity would reduce price spreads today.
COST BENEFIT ANALYSIS OF STEP, AS FIRST PHASE OF MIDCAT - FINAL REPORT
17 November 2017
EC_Step CBA_Final Report_Master_601_Public.docx
28
PÖYRY MANAGEMENT CONSULTING
Figure 9 – Historical flows and prices across France and Spain (kWh/day)
Note: Prices are plotted as reported by market operators Source: Pöyry from MIBGAS, ENTSOG
Figure 10 – Historical monthly flows from France to Spain (Mcm/m)
Source: Pöyry from IEA/Eurostat
0
100
200
300
400
500
Oct-
09
Fe
b-1
0
Ju
n-1
0
Oct-
10
Fe
b-1
1
Ju
n-1
1
Oct-
11
Fe
b-1
2
Ju
n-1
2
Oct-
12
Fe
b-1
3
Jun-1
3
Oct-
13
Fe
b-1
4
Ju
n-1
4
Oct-
14
Fe
b-1
5
Ju
n-1
5
Oct-
15
Fe
b-1
6
Ju
n-1
6
Biriatou Larrau
Capacity 245 Mcm/m
Capacity 465 Mcm/m
COST BENEFIT ANALYSIS OF STEP, AS FIRST PHASE OF MIDCAT - FINAL REPORT
17 November 2017
EC_Step CBA_Final Report_Master_601_Public.docx
29
PÖYRY MANAGEMENT CONSULTING
Figure 11 - Flows to Spain compared to price differences
Source: Pöyry analysis of Heren/ENTOSG data. (264 observations covering 16 December 2015 to 23 January 2017).
COST BENEFIT ANALYSIS OF STEP, AS FIRST PHASE OF MIDCAT - FINAL REPORT
17 November 2017
EC_Step CBA_Final Report_Master_601_Public.docx
30
PÖYRY MANAGEMENT CONSULTING
4. OVERVIEW OF STEP
4.1 From Midcat to STEP
The current technical transmission capacity at the Pirineos Virtual Interconnection Point (VIP) is 224 GWh/d in both directions, as reported on the ENTSOG Transparency Platform, January 2017. This is the result of the two pipeline systems, “Artère de l’Adour” and “Artère du Bèarn”, connecting the French and Spanish gas transmission networks at the Biriatou and Larrau border points. The completion of the ongoing “Artére de Guyenne” and “Artère du Gascogne / Midi” projects will increase the existing interconnection capacity, in addition to debottlenecking North to South capacity in the French market.
The extension of the existing interconnection between the two EU Member States through a new point has been discussed for a long time, and has reached one first milestone with the origination of the Midi – Catalonia interconnector project, i.e. MidCat.
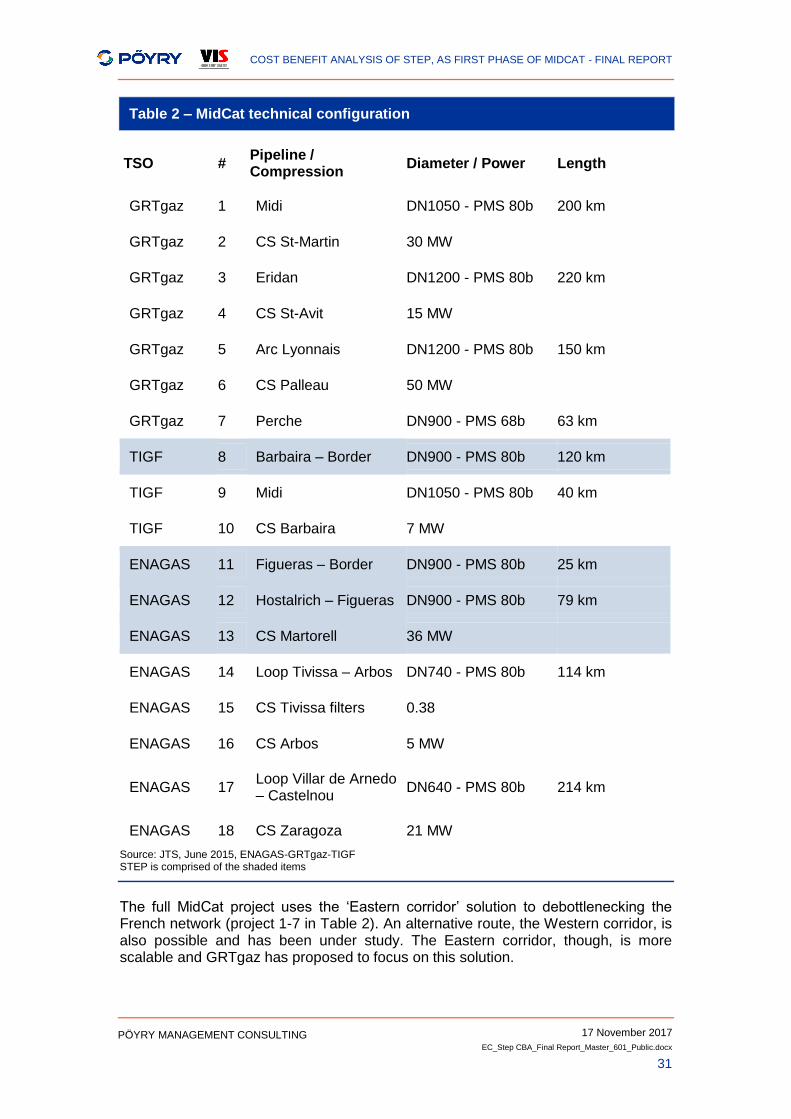
The MidCat technical configuration, as updated in the technical studies presented by the three TSOs (i.e. ENAGAS, GRTgaz and TIGF) to the HLG, includes the development of an Eastern corridor in France and the infrastructure in the North Eastern Spain region, as shown in Table 2 and Figure 12 below.
COST BENEFIT ANALYSIS OF STEP, AS FIRST PHASE OF MIDCAT - FINAL REPORT
17 November 2017
EC_Step CBA_Final Report_Master_601_Public.docx
31
PÖYRY MANAGEMENT CONSULTING
Table 2 – MidCat technical configuration
TSO # Pipeline / Compression
Diameter / Power Length
GRTgaz 1 Midi DN1050 - PMS 80b 200 km
GRTgaz 2 CS St-Martin 30 MW
GRTgaz 3 Eridan DN1200 - PMS 80b 220 km
GRTgaz 4 CS St-Avit 15 MW
GRTgaz 5 Arc Lyonnais DN1200 - PMS 80b 150 km
GRTgaz 6 CS Palleau 50 MW
GRTgaz 7 Perche DN900 - PMS 68b 63 km
TIGF 8 Barbaira – Border DN900 - PMS 80b 120 km
TIGF 9 Midi DN1050 - PMS 80b 40 km
TIGF 10 CS Barbaira 7 MW
ENAGAS 11 Figueras – Border DN900 - PMS 80b 25 km
ENAGAS 12 Hostalrich – Figueras DN900 - PMS 80b 79 km
ENAGAS 13 CS Martorell 36 MW
ENAGAS 14 Loop Tivissa – Arbos DN740 - PMS 80b 114 km
ENAGAS 15 CS Tivissa filters 0.38
ENAGAS 16 CS Arbos 5 MW
ENAGAS 17 Loop Villar de Arnedo – Castelnou
DN640 - PMS 80b 214 km
ENAGAS 18 CS Zaragoza 21 MW
Source: JTS, June 2015, ENAGAS-GRTgaz-TIGF STEP is comprised of the shaded items
The full MidCat project uses the ‘Eastern corridor’ solution to debottlenecking the French network (project 1-7 in Table 2). An alternative route, the Western corridor, is also possible and has been under study. The Eastern corridor, though, is more scalable and GRTgaz has proposed to focus on this solution.
COST BENEFIT ANALYSIS OF STEP, AS FIRST PHASE OF MIDCAT - FINAL REPORT
17 November 2017
EC_Step CBA_Final Report_Master_601_Public.docx
32
PÖYRY MANAGEMENT CONSULTING
The TSOs have identified the works as outlined in the table above as necessary for MidCat to provide a target capacity of:
230 GWh/d South to North
180 GWh/d North to South
The total investment cost is estimated at EUR 3.1 billion.
In consideration of the significant size of these investments, the TSOs have considered a solution that includes only a minimal set of infrastructure between Spain and the TIGF area. The solution is the proposed South Transit Eastern Pyrenees (STEP) project – the subject of this study.
4.2 3rd Interconnector Portugal – Spain
STEP is a component of the overall plan to create a regional gas market in South-Western Europe. Although not part of STEP (and hence not assessed directly in this analysis) the 3rd Interconnector between Portugal and Spain is also an important part of the Regional plan. The project, which has PCI status, is planned to be developed in three phases in Portugal and two in Spain. The first phase includes a 162 km long pipeline, from the junction station of Celorico da Beira to the Spanish border, and 80/85 km long from there to Zamora compression station in Spain. The interconnection, expected to be commissioned in 2021, will provide a cross border capacity of 70 GWh/d.
As it has not been included in our scope of work, the costs and benefits of the 3rd Interconnector between Portugal and Spain have not been assessed as part of our analysis, however its transmission capacity has been included in the market modelling supporting our analysis.
COST BENEFIT ANALYSIS OF STEP, AS FIRST PHASE OF MIDCAT - FINAL REPORT
17 November 2017
EC_Step CBA_Final Report_Master_601_Public.docx
33
PÖYRY MANAGEMENT CONSULTING
4.3 STEP
4.3.1 Technical configuration
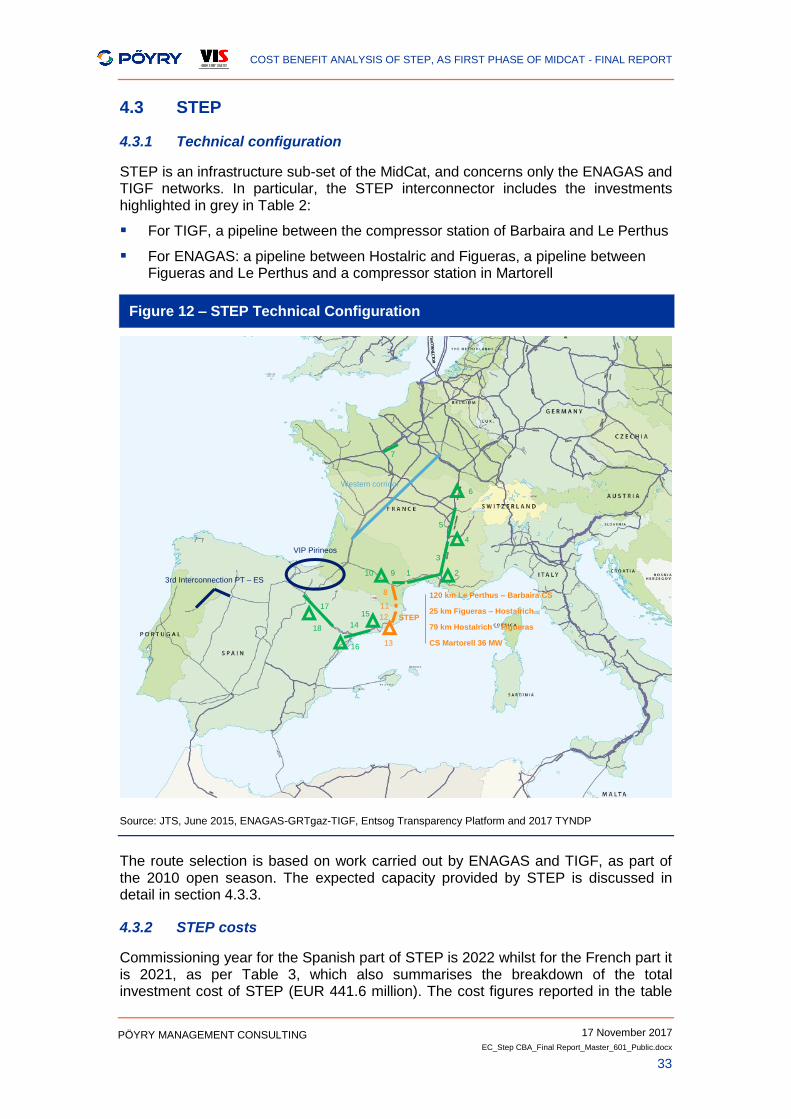
STEP is an infrastructure sub-set of the MidCat, and concerns only the ENAGAS and TIGF networks. In particular, the STEP interconnector includes the investments highlighted in grey in Table 2:
For TIGF, a pipeline between the compressor station of Barbaira and Le Perthus
For ENAGAS: a pipeline between Hostalric and Figueras, a pipeline between Figueras and Le Perthus and a compressor station in Martorell
Figure 12 – STEP Technical Configuration
Source: JTS, June 2015, ENAGAS-GRTgaz-TIGF, Entsog Transparency Platform and 2017 TYNDP
The route selection is based on work carried out by ENAGAS and TIGF, as part of the 2010 open season. The expected capacity provided by STEP is discussed in detail in section 4.3.3.
4.3.2 STEP costs
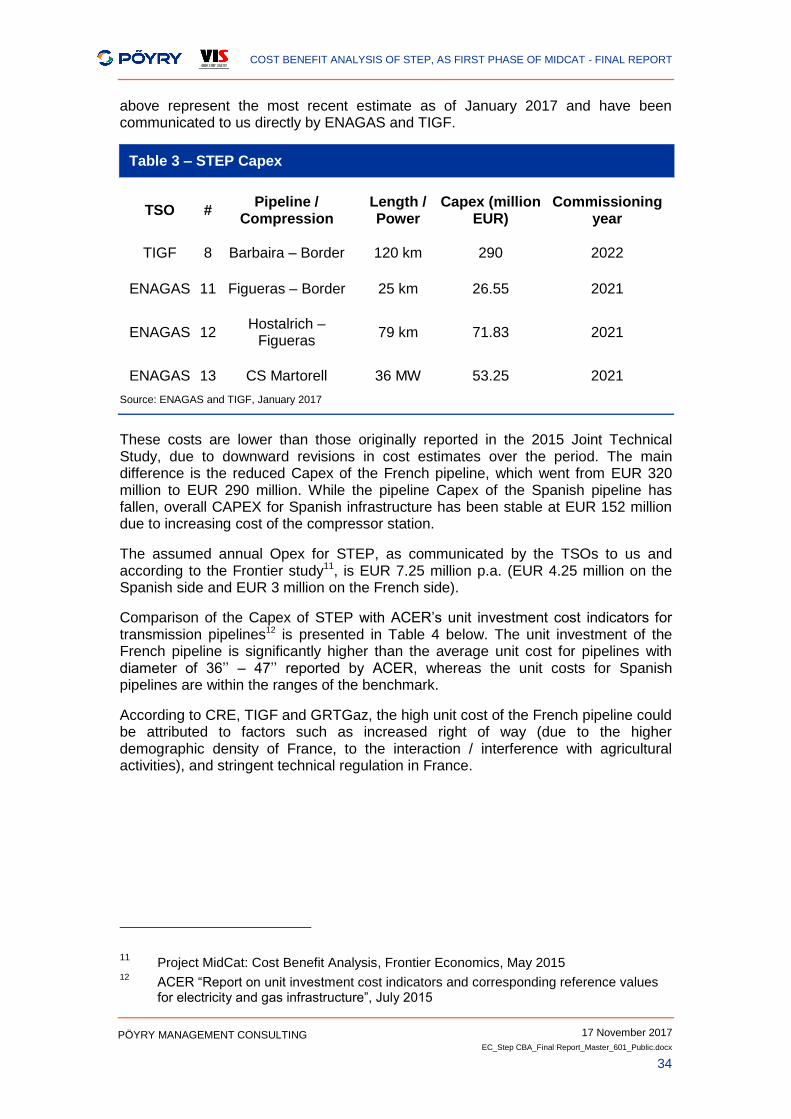
Commissioning year for the Spanish part of STEP is 2022 whilst for the French part it is 2021, as per Table 3, which also summarises the breakdown of the total investment cost of STEP (EUR 441.6 million). The cost figures reported in the table
VIP Pirineos
CS Martorell 36 MW
79 km Hostalrich – Figueras
25 km Figueras – Hostalrich
120 km Le Perthus – Barbaira CS
3rd Interconnection PT – ES
STEP
1 2
3
4
5
6
7
8
11
12
13
14
17
18
910
16
15
Western corridor
COST BENEFIT ANALYSIS OF STEP, AS FIRST PHASE OF MIDCAT - FINAL REPORT
17 November 2017
EC_Step CBA_Final Report_Master_601_Public.docx
34
PÖYRY MANAGEMENT CONSULTING
above represent the most recent estimate as of January 2017 and have been communicated to us directly by ENAGAS and TIGF.
Table 3 – STEP Capex
TSO # Pipeline /
Compression Length / Power
Capex (million EUR)
Commissioning year
TIGF 8 Barbaira – Border 120 km 290 2022
ENAGAS 11 Figueras – Border 25 km 26.55 2021
ENAGAS 12 Hostalrich –
Figueras 79 km 71.83 2021
ENAGAS 13 CS Martorell 36 MW 53.25 2021
Source: ENAGAS and TIGF, January 2017
These costs are lower than those originally reported in the 2015 Joint Technical Study, due to downward revisions in cost estimates over the period. The main difference is the reduced Capex of the French pipeline, which went from EUR 320 million to EUR 290 million. While the pipeline Capex of the Spanish pipeline has fallen, overall CAPEX for Spanish infrastructure has been stable at EUR 152 million due to increasing cost of the compressor station.
The assumed annual Opex for STEP, as communicated by the TSOs to us and according to the Frontier study11, is EUR 7.25 million p.a. (EUR 4.25 million on the Spanish side and EUR 3 million on the French side).
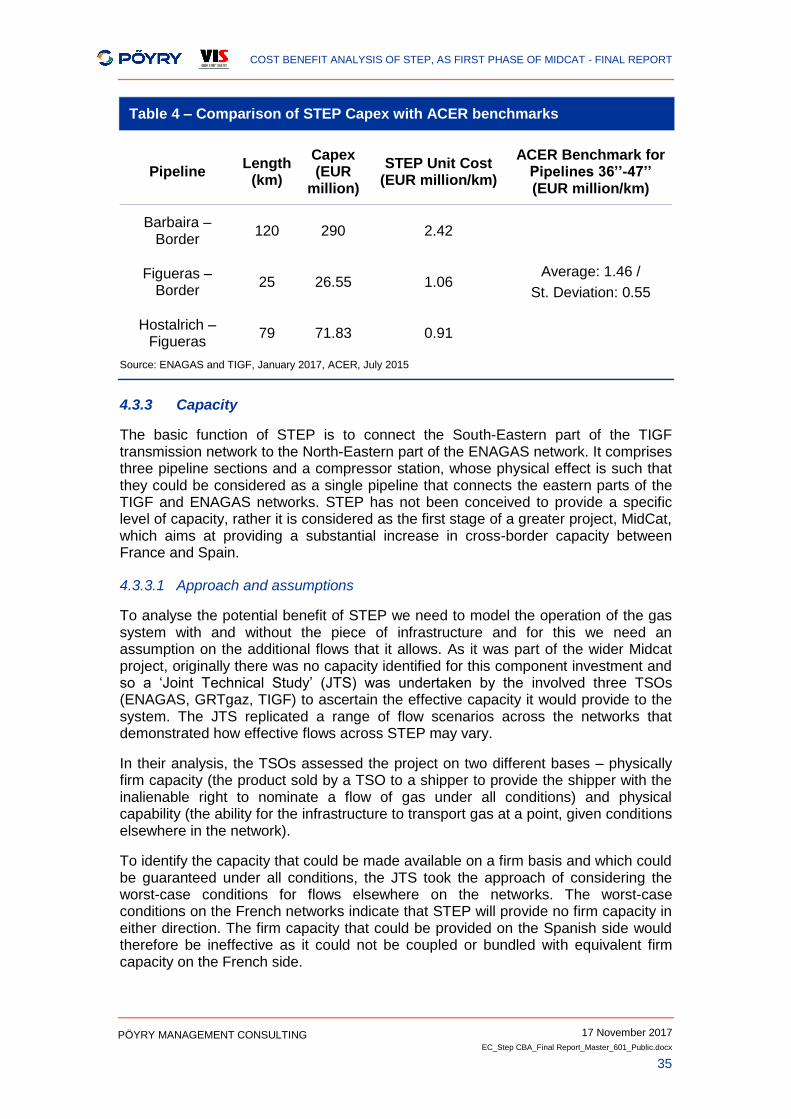
Comparison of the Capex of STEP with ACER’s unit investment cost indicators for transmission pipelines12 is presented in Table 4 below. The unit investment of the French pipeline is significantly higher than the average unit cost for pipelines with diameter of 36’’ – 47’’ reported by ACER, whereas the unit costs for Spanish pipelines are within the ranges of the benchmark.
According to CRE, TIGF and GRTGaz, the high unit cost of the French pipeline could be attributed to factors such as increased right of way (due to the higher demographic density of France, to the interaction / interference with agricultural activities), and stringent technical regulation in France.
11
Project MidCat: Cost Benefit Analysis, Frontier Economics, May 2015 12
ACER “Report on unit investment cost indicators and corresponding reference values for electricity and gas infrastructure”, July 2015
COST BENEFIT ANALYSIS OF STEP, AS FIRST PHASE OF MIDCAT - FINAL REPORT
17 November 2017
EC_Step CBA_Final Report_Master_601_Public.docx
35
PÖYRY MANAGEMENT CONSULTING
Table 4 – Comparison of STEP Capex with ACER benchmarks
Pipeline Length
(km)
Capex (EUR
million)
STEP Unit Cost (EUR million/km)
ACER Benchmark for Pipelines 36’’-47’’ (EUR million/km)
Barbaira – Border
120 290 2.42
Average: 1.46 /
St. Deviation: 0.55
Figueras – Border
25 26.55 1.06
Hostalrich – Figueras
79 71.83 0.91
Source: ENAGAS and TIGF, January 2017, ACER, July 2015
4.3.3 Capacity
The basic function of STEP is to connect the South-Eastern part of the TIGF transmission network to the North-Eastern part of the ENAGAS network. It comprises three pipeline sections and a compressor station, whose physical effect is such that they could be considered as a single pipeline that connects the eastern parts of the TIGF and ENAGAS networks. STEP has not been conceived to provide a specific level of capacity, rather it is considered as the first stage of a greater project, MidCat, which aims at providing a substantial increase in cross-border capacity between France and Spain.
4.3.3.1 Approach and assumptions
To analyse the potential benefit of STEP we need to model the operation of the gas system with and without the piece of infrastructure and for this we need an assumption on the additional flows that it allows. As it was part of the wider Midcat project, originally there was no capacity identified for this component investment and so a ‘Joint Technical Study’ (JTS) was undertaken by the involved three TSOs (ENAGAS, GRTgaz, TIGF) to ascertain the effective capacity it would provide to the system. The JTS replicated a range of flow scenarios across the networks that demonstrated how effective flows across STEP may vary.
In their analysis, the TSOs assessed the project on two different bases – physically firm capacity (the product sold by a TSO to a shipper to provide the shipper with the inalienable right to nominate a flow of gas under all conditions) and physical capability (the ability for the infrastructure to transport gas at a point, given conditions elsewhere in the network).
To identify the capacity that could be made available on a firm basis and which could be guaranteed under all conditions, the JTS took the approach of considering the worst-case conditions for flows elsewhere on the networks. The worst-case conditions on the French networks indicate that STEP will provide no firm capacity in either direction. The firm capacity that could be provided on the Spanish side would therefore be ineffective as it could not be coupled or bundled with equivalent firm capacity on the French side.
COST BENEFIT ANALYSIS OF STEP, AS FIRST PHASE OF MIDCAT - FINAL REPORT
17 November 2017
EC_Step CBA_Final Report_Master_601_Public.docx
36
PÖYRY MANAGEMENT CONSULTING
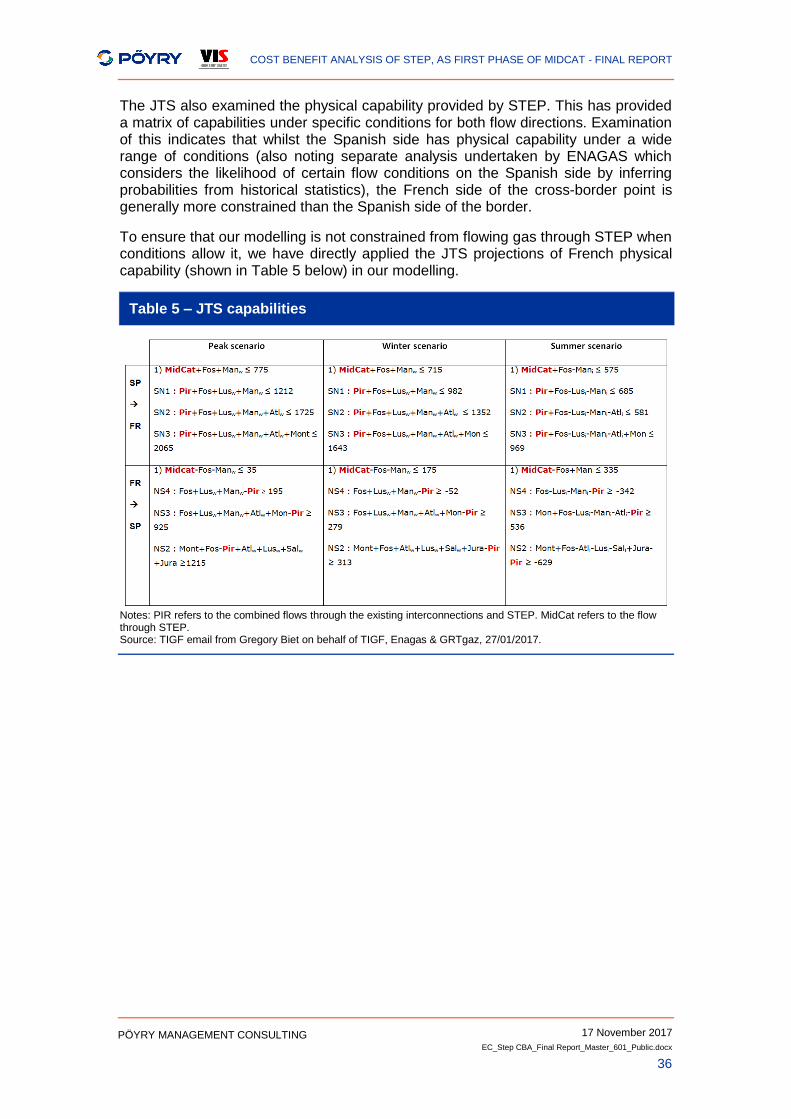
The JTS also examined the physical capability provided by STEP. This has provided a matrix of capabilities under specific conditions for both flow directions. Examination of this indicates that whilst the Spanish side has physical capability under a wide range of conditions (also noting separate analysis undertaken by ENAGAS which considers the likelihood of certain flow conditions on the Spanish side by inferring probabilities from historical statistics), the French side of the cross-border point is generally more constrained than the Spanish side of the border.
To ensure that our modelling is not constrained from flowing gas through STEP when conditions allow it, we have directly applied the JTS projections of French physical capability (shown in Table 5 below) in our modelling.
Table 5 – JTS capabilities
Notes: PIR refers to the combined flows through the existing interconnections and STEP. MidCat refers to the flow through STEP. Source: TIGF email from Gregory Biet on behalf of TIGF, Enagas & GRTgaz, 27/01/2017.

COST BENEFIT ANALYSIS OF STEP, AS FIRST PHASE OF MIDCAT - FINAL REPORT
17 November 2017
EC_Step CBA_Final Report_Master_601_Public.docx
37
PÖYRY MANAGEMENT CONSULTING
[This page is intentionally blank]
COST BENEFIT ANALYSIS OF STEP, AS FIRST PHASE OF MIDCAT - FINAL REPORT
17 November 2017
EC_Step CBA_Final Report_Master_601_Public.docx
38
PÖYRY MANAGEMENT CONSULTING
5. CBA METHODOLOGY AND ASSUMPTIONS
5.1 Introduction
ENTSOG published the finalised energy system-wide cost-benefit-analysis (ESW-CBA), pursuant to Article 11 of the Regulation (EU) No 347/2013 (Regulation), in February 2015 following a consultation process with stakeholders and with the guidance of the EC's and ACER's opinions. The ESW-CBA methodology supports the selection process of PCIs, by facilitating assessment of the projects’ expected impact.
We have followed the same approach as ENTSOG to ensure consistency with other CBA studies undertaken on gas infrastructure assets. The approach includes:
a monetized assessment of the impact of the asset;
a review of a set of supporting indicators; and
a financial analysis of the specific project.
In this section we describe the methodology we have used to complete the analysis, covering:
the calculation of benefits and costs according to ENTSOG ESW-CBA methodology; and
gas scenarios modelling.
5.2 Calculation of Benefits and Costs according to ENTSOG ESW-CBA Methodology
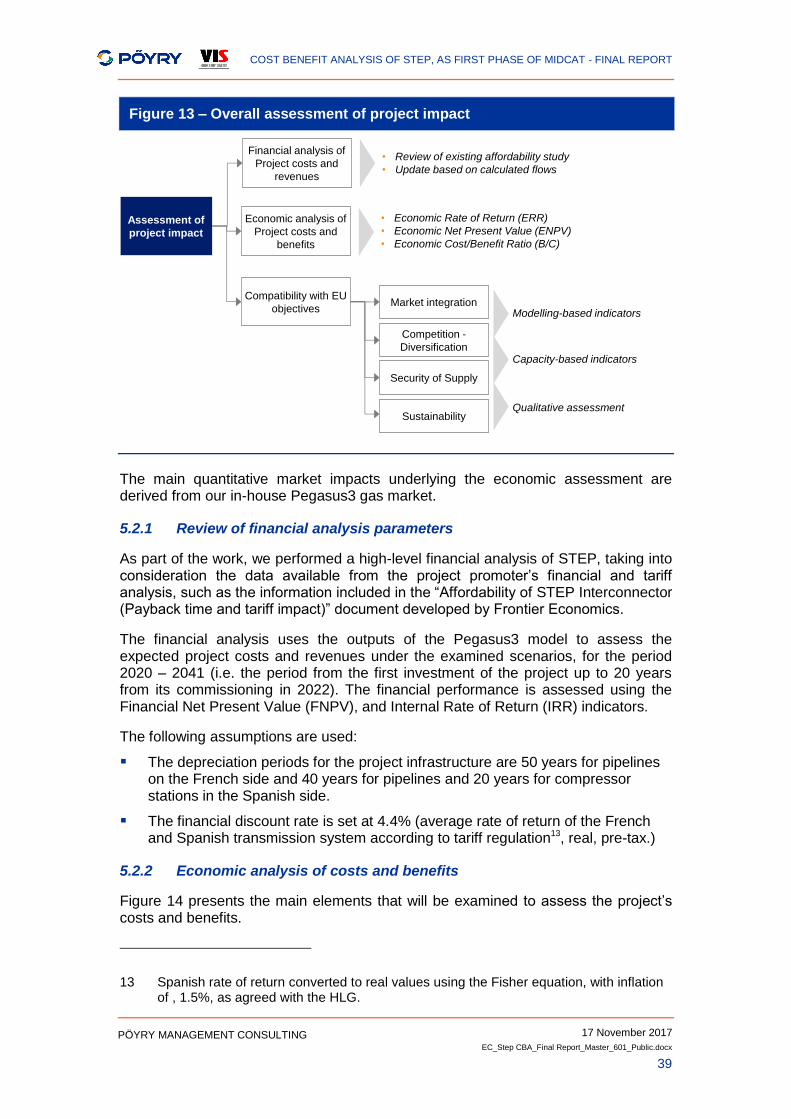
The approach that we follow, shown in Figure 13 below, is in line with the TEN-E Regulation, the CBA methodology developed by ENTSOG, and compliant with ACER’s Opinion No 04/2014 and Recommendation No 05/2015. This facilitates comparability with the results of the Project Specific CBAs carried out for the 2nd Union-wide list of PCIs. The assessment covers economic analysis of the project’s costs and monetized benefits, financial analysis building on the work that has been carried out so far for STEP and analysis of the project’s impact on the Specific Criteria defined in the TEN-E Regulation.
COST BENEFIT ANALYSIS OF STEP, AS FIRST PHASE OF MIDCAT - FINAL REPORT
17 November 2017
EC_Step CBA_Final Report_Master_601_Public.docx
39
PÖYRY MANAGEMENT CONSULTING
Figure 13 – Overall assessment of project impact
The main quantitative market impacts underlying the economic assessment are derived from our in-house Pegasus3 gas market.
5.2.1 Review of financial analysis parameters
As part of the work, we performed a high-level financial analysis of STEP, taking into consideration the data available from the project promoter’s financial and tariff analysis, such as the information included in the “Affordability of STEP Interconnector (Payback time and tariff impact)” document developed by Frontier Economics.
The financial analysis uses the outputs of the Pegasus3 model to assess the expected project costs and revenues under the examined scenarios, for the period 2020 – 2041 (i.e. the period from the first investment of the project up to 20 years from its commissioning in 2022). The financial performance is assessed using the Financial Net Present Value (FNPV), and Internal Rate of Return (IRR) indicators.
The following assumptions are used:
The depreciation periods for the project infrastructure are 50 years for pipelines on the French side and 40 years for pipelines and 20 years for compressor stations in the Spanish side.
The financial discount rate is set at 4.4% (average rate of return of the French and Spanish transmission system according to tariff regulation13, real, pre-tax.)
5.2.2 Economic analysis of costs and benefits
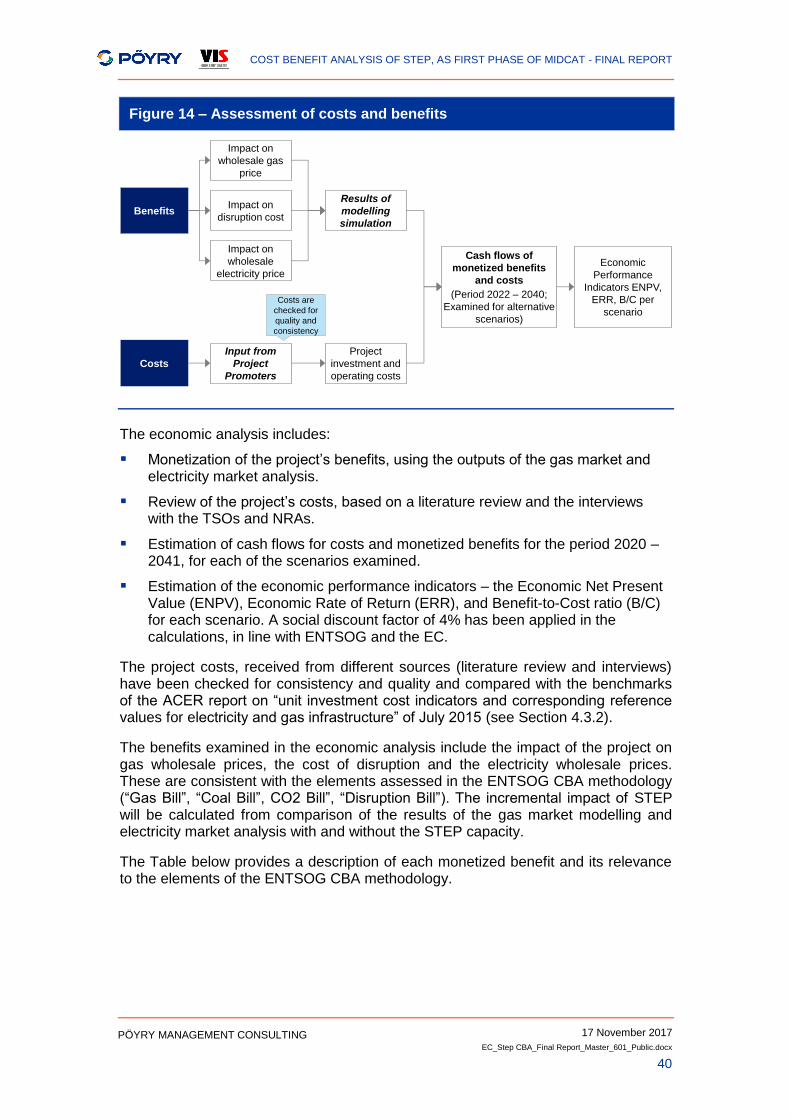
Figure 14 presents the main elements that will be examined to assess the project’s costs and benefits.
13 Spanish rate of return converted to real values using the Fisher equation, with inflation of , 1.5%, as agreed with the HLG.
Assessment of
project impact
Economic analysis of
Project costs and
benefits
Compatibility with EU
objectives
• Economic Rate of Return (ERR)
• Economic Net Present Value (ENPV)
• Economic Cost/Benefit Ratio (B/C)
Competition -
Diversification
Security of Supply
Sustainability
Market integrationModelling-based indicators
Capacity-based indicators
Qualitative assessment
Financial analysis of
Project costs and
revenues
• Review of existing affordability study
• Update based on calculated flows
COST BENEFIT ANALYSIS OF STEP, AS FIRST PHASE OF MIDCAT - FINAL REPORT
17 November 2017
EC_Step CBA_Final Report_Master_601_Public.docx
40
PÖYRY MANAGEMENT CONSULTING
Figure 14 – Assessment of costs and benefits
The economic analysis includes:
Monetization of the project’s benefits, using the outputs of the gas market and electricity market analysis.
Review of the project’s costs, based on a literature review and the interviews with the TSOs and NRAs.
Estimation of cash flows for costs and monetized benefits for the period 2020 – 2041, for each of the scenarios examined.
Estimation of the economic performance indicators – the Economic Net Present Value (ENPV), Economic Rate of Return (ERR), and Benefit-to-Cost ratio (B/C) for each scenario. A social discount factor of 4% has been applied in the calculations, in line with ENTSOG and the EC.
The project costs, received from different sources (literature review and interviews) have been checked for consistency and quality and compared with the benchmarks of the ACER report on “unit investment cost indicators and corresponding reference values for electricity and gas infrastructure” of July 2015 (see Section 4.3.2).
The benefits examined in the economic analysis include the impact of the project on gas wholesale prices, the cost of disruption and the electricity wholesale prices. These are consistent with the elements assessed in the ENTSOG CBA methodology (“Gas Bill”, “Coal Bill”, CO2 Bill”, “Disruption Bill”). The incremental impact of STEP will be calculated from comparison of the results of the gas market modelling and electricity market analysis with and without the STEP capacity.
The Table below provides a description of each monetized benefit and its relevance to the elements of the ENTSOG CBA methodology.
Cash flows of
monetized benefits
and costs
(Period 2022 – 2040;
Examined for alternative
scenarios)
Benefits
Impact on
wholesale gas
price
Impact on
disruption cost
Impact on
wholesale
electricity price
Results of
modelling
simulation
Costs
Project
investment and
operating costs
Input from
Project
Promoters
Economic
Performance
Indicators ENPV,
ERR, B/C per
scenario
Costs are
checked for
quality and
consistency
COST BENEFIT ANALYSIS OF STEP, AS FIRST PHASE OF MIDCAT - FINAL REPORT
17 November 2017
EC_Step CBA_Final Report_Master_601_Public.docx
41
PÖYRY MANAGEMENT CONSULTING
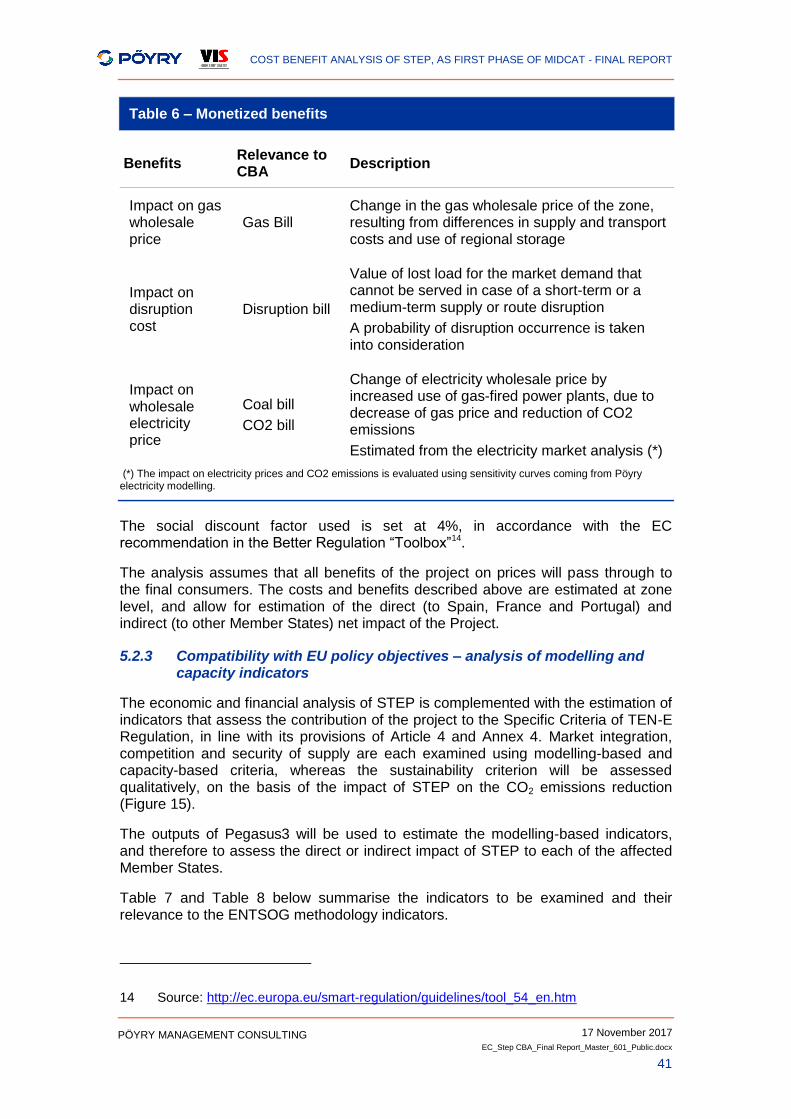
Table 6 – Monetized benefits
Benefits Relevance to CBA
Description
Impact on gas wholesale price
Gas Bill Change in the gas wholesale price of the zone, resulting from differences in supply and transport costs and use of regional storage
Impact on disruption cost
Disruption bill
Value of lost load for the market demand that cannot be served in case of a short-term or a medium-term supply or route disruption
A probability of disruption occurrence is taken into consideration
Impact on wholesale electricity price
Coal bill
CO2 bill
Change of electricity wholesale price by increased use of gas-fired power plants, due to decrease of gas price and reduction of CO2 emissions
Estimated from the electricity market analysis (*)
(*) The impact on electricity prices and CO2 emissions is evaluated using sensitivity curves coming from Pöyry electricity modelling.
The social discount factor used is set at 4%, in accordance with the EC recommendation in the Better Regulation “Toolbox”14.
The analysis assumes that all benefits of the project on prices will pass through to the final consumers. The costs and benefits described above are estimated at zone level, and allow for estimation of the direct (to Spain, France and Portugal) and indirect (to other Member States) net impact of the Project.
5.2.3 Compatibility with EU policy objectives – analysis of modelling and capacity indicators
The economic and financial analysis of STEP is complemented with the estimation of indicators that assess the contribution of the project to the Specific Criteria of TEN-E Regulation, in line with its provisions of Article 4 and Annex 4. Market integration, competition and security of supply are each examined using modelling-based and capacity-based criteria, whereas the sustainability criterion will be assessed qualitatively, on the basis of the impact of STEP on the CO2 emissions reduction (Figure 15).
The outputs of Pegasus3 will be used to estimate the modelling-based indicators, and therefore to assess the direct or indirect impact of STEP to each of the affected Member States.
Table 7 and Table 8 below summarise the indicators to be examined and their relevance to the ENTSOG methodology indicators.
14 Source: http://ec.europa.eu/smart-regulation/guidelines/tool_54_en.htm
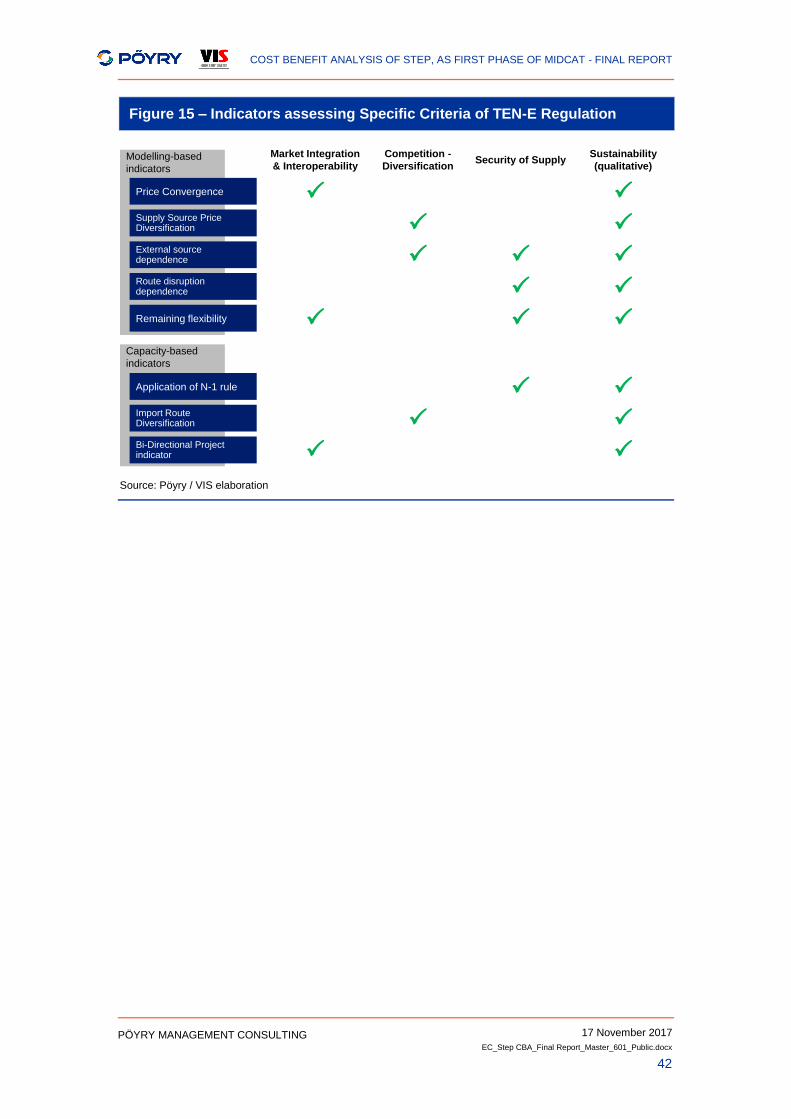
COST BENEFIT ANALYSIS OF STEP, AS FIRST PHASE OF MIDCAT - FINAL REPORT
17 November 2017
EC_Step CBA_Final Report_Master_601_Public.docx
42
PÖYRY MANAGEMENT CONSULTING
Figure 15 – Indicators assessing Specific Criteria of TEN-E Regulation
Source: Pöyry / VIS elaboration
Modelling-based
indicators
Supply Source Price Diversification
External source dependence
Remaining flexibility
Route disruption dependence
Price Convergence
Market Integration
& Interoperability
Competition -
Diversification
Security of Supply
Sustainability
(qualitative)
Capacity-based
indicators
Import Route Diversification
Bi-Directional Project indicator
Application of N-1 rule
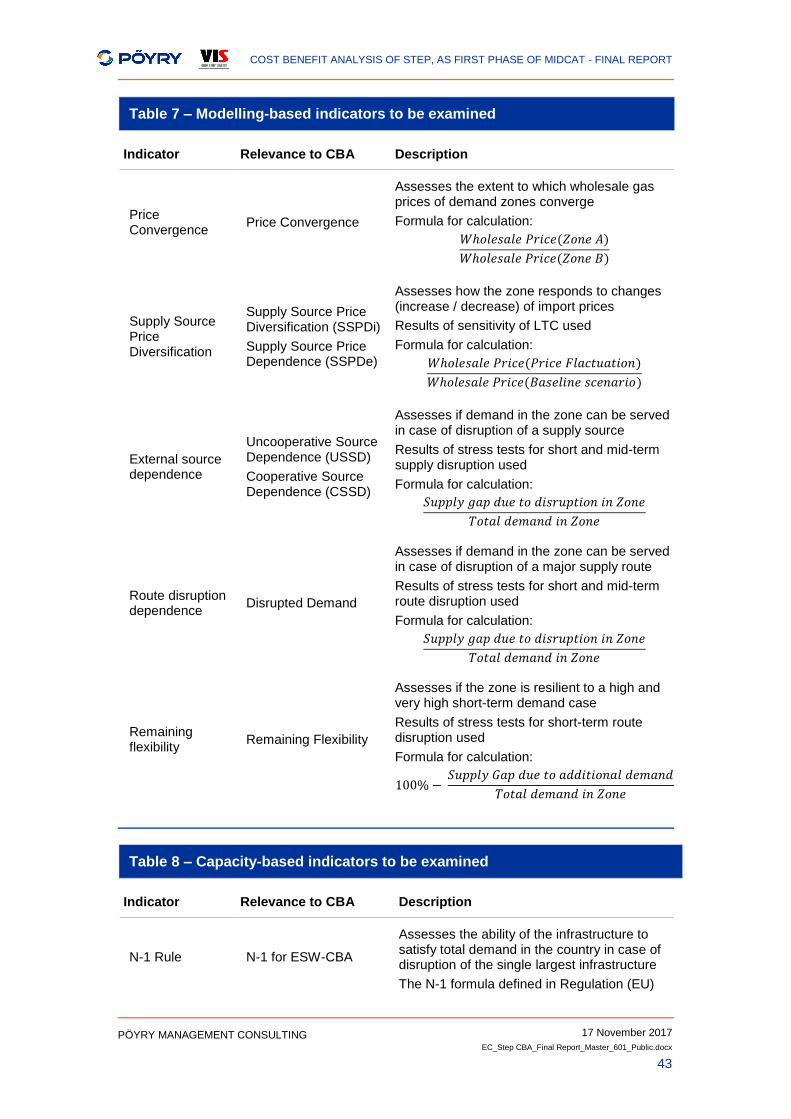
COST BENEFIT ANALYSIS OF STEP, AS FIRST PHASE OF MIDCAT - FINAL REPORT
17 November 2017
EC_Step CBA_Final Report_Master_601_Public.docx
43
PÖYRY MANAGEMENT CONSULTING
Table 7 – Modelling-based indicators to be examined
Table 8 – Capacity-based indicators to be examined
Indicator Relevance to CBA Description
Price Convergence
Price Convergence
𝑊ℎ𝑜𝑙𝑒𝑠𝑎𝑙𝑒 𝑃𝑟𝑖𝑐𝑒(𝑍𝑜𝑛𝑒 𝐴)
𝑊ℎ𝑜𝑙𝑒𝑠𝑎𝑙𝑒 𝑃𝑟𝑖𝑐𝑒(𝑍𝑜𝑛𝑒 𝐵)
Assesses the extent to which wholesale gas prices of demand zones converge
Formula for calculation:
Supply Source Price Diversification
Supply Source Price Diversification (SSPDi)
Supply Source Price Dependence (SSPDe) 𝑊ℎ𝑜𝑙𝑒𝑠𝑎𝑙𝑒 𝑃𝑟𝑖𝑐𝑒(𝑃𝑟𝑖𝑐𝑒 𝐹𝑙𝑎𝑐𝑡𝑢𝑎𝑡𝑖𝑜𝑛)
𝑊ℎ𝑜𝑙𝑒𝑠𝑎𝑙𝑒 𝑃𝑟𝑖𝑐𝑒(𝐵𝑎𝑠𝑒𝑙𝑖𝑛𝑒 𝑠𝑐𝑒𝑛𝑎𝑟𝑖𝑜)
Assesses how the zone responds to changes (increase / decrease) of import prices
Results of sensitivity of LTC used
Formula for calculation:
External source dependence
Uncooperative Source Dependence (USSD)
Cooperative Source Dependence (CSSD)
𝑆𝑢𝑝𝑝𝑙𝑦 𝑔𝑎𝑝 𝑑𝑢𝑒 𝑡𝑜 𝑑𝑖𝑠𝑟𝑢𝑝𝑡𝑖𝑜𝑛 𝑖𝑛 𝑍𝑜𝑛𝑒
𝑇𝑜𝑡𝑎𝑙 𝑑𝑒𝑚𝑎𝑛𝑑 𝑖𝑛 𝑍𝑜𝑛𝑒
Assesses if demand in the zone can be served in case of disruption of a supply source
Results of stress tests for short and mid-term supply disruption used
Formula for calculation:
Route disruption dependence
Disrupted Demand
𝑆𝑢𝑝𝑝𝑙𝑦 𝑔𝑎𝑝 𝑑𝑢𝑒 𝑡𝑜 𝑑𝑖𝑠𝑟𝑢𝑝𝑡𝑖𝑜𝑛 𝑖𝑛 𝑍𝑜𝑛𝑒
𝑇𝑜𝑡𝑎𝑙 𝑑𝑒𝑚𝑎𝑛𝑑 𝑖𝑛 𝑍𝑜𝑛𝑒
Assesses if demand in the zone can be served in case of disruption of a major supply route
Results of stress tests for short and mid-term route disruption used
Formula for calculation:
Remaining flexibility
Remaining Flexibility
100% − 𝑆𝑢𝑝𝑝𝑙𝑦 𝐺𝑎𝑝 𝑑𝑢𝑒 𝑡𝑜 𝑎𝑑𝑑𝑖𝑡𝑖𝑜𝑛𝑎𝑙 𝑑𝑒𝑚𝑎𝑛𝑑
𝑇𝑜𝑡𝑎𝑙 𝑑𝑒𝑚𝑎𝑛𝑑 𝑖𝑛 𝑍𝑜𝑛𝑒
Assesses if the zone is resilient to a high and very high short-term demand case
Results of stress tests for short-term route disruption used
Formula for calculation:
Indicator Relevance to CBA Description
N-1 Rule N-1 for ESW-CBA
Assesses the ability of the infrastructure to satisfy total demand in the country in case of disruption of the single largest infrastructure
The N-1 formula defined in Regulation (EU)
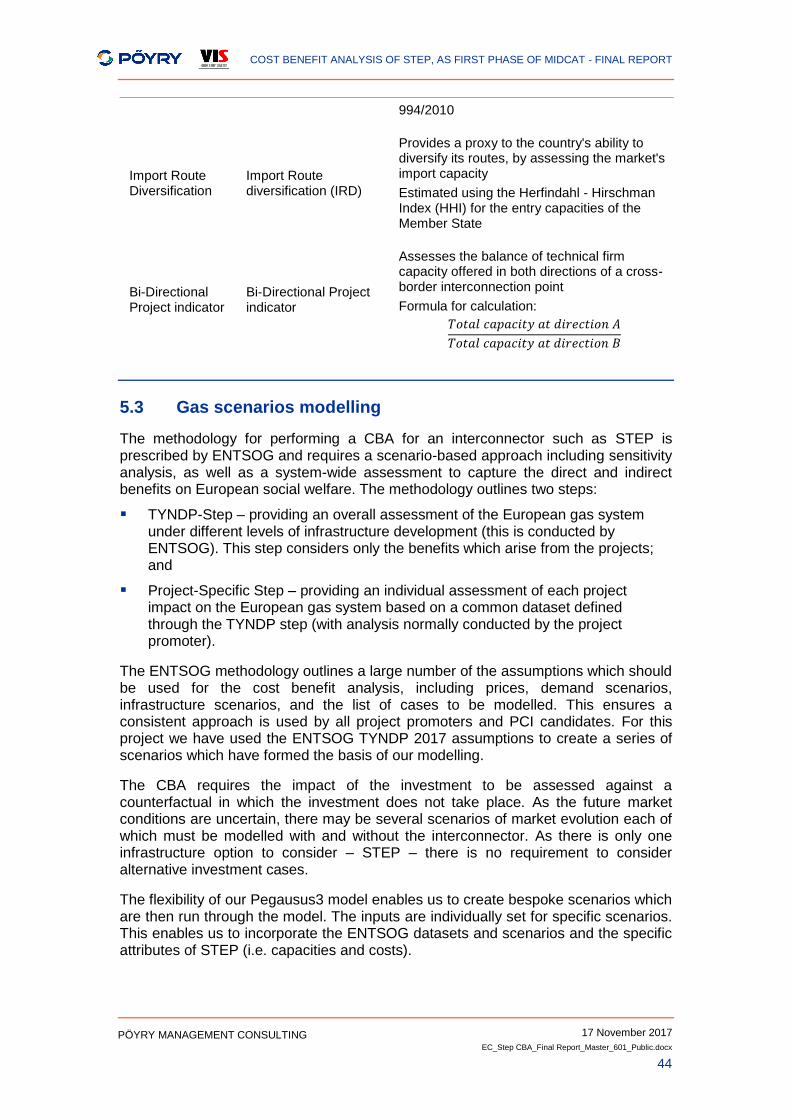
COST BENEFIT ANALYSIS OF STEP, AS FIRST PHASE OF MIDCAT - FINAL REPORT
17 November 2017
EC_Step CBA_Final Report_Master_601_Public.docx
44
PÖYRY MANAGEMENT CONSULTING
5.3 Gas scenarios modelling
The methodology for performing a CBA for an interconnector such as STEP is prescribed by ENTSOG and requires a scenario-based approach including sensitivity analysis, as well as a system-wide assessment to capture the direct and indirect benefits on European social welfare. The methodology outlines two steps:
TYNDP-Step – providing an overall assessment of the European gas system under different levels of infrastructure development (this is conducted by ENTSOG). This step considers only the benefits which arise from the projects; and
Project-Specific Step – providing an individual assessment of each project impact on the European gas system based on a common dataset defined through the TYNDP step (with analysis normally conducted by the project promoter).
The ENTSOG methodology outlines a large number of the assumptions which should be used for the cost benefit analysis, including prices, demand scenarios, infrastructure scenarios, and the list of cases to be modelled. This ensures a consistent approach is used by all project promoters and PCI candidates. For this project we have used the ENTSOG TYNDP 2017 assumptions to create a series of scenarios which have formed the basis of our modelling.
The CBA requires the impact of the investment to be assessed against a counterfactual in which the investment does not take place. As the future market conditions are uncertain, there may be several scenarios of market evolution each of which must be modelled with and without the interconnector. As there is only one infrastructure option to consider – STEP – there is no requirement to consider alternative investment cases.
The flexibility of our Pegausus3 model enables us to create bespoke scenarios which are then run through the model. The inputs are individually set for specific scenarios. This enables us to incorporate the ENTSOG datasets and scenarios and the specific attributes of STEP (i.e. capacities and costs).
994/2010
Import Route Diversification
Import Route diversification (IRD)
Provides a proxy to the country's ability to diversify its routes, by assessing the market's import capacity
Estimated using the Herfindahl - Hirschman Index (HHI) for the entry capacities of the Member State
Bi-Directional Project indicator
Bi-Directional Project indicator
𝑇𝑜𝑡𝑎𝑙 𝑐𝑎𝑝𝑎𝑐𝑖𝑡𝑦 𝑎𝑡 𝑑𝑖𝑟𝑒𝑐𝑡𝑖𝑜𝑛 𝐴
𝑇𝑜𝑡𝑎𝑙 𝑐𝑎𝑝𝑎𝑐𝑖𝑡𝑦 𝑎𝑡 𝑑𝑖𝑟𝑒𝑐𝑡𝑖𝑜𝑛 𝐵
Assesses the balance of technical firm capacity offered in both directions of a cross-border interconnection point
Formula for calculation:
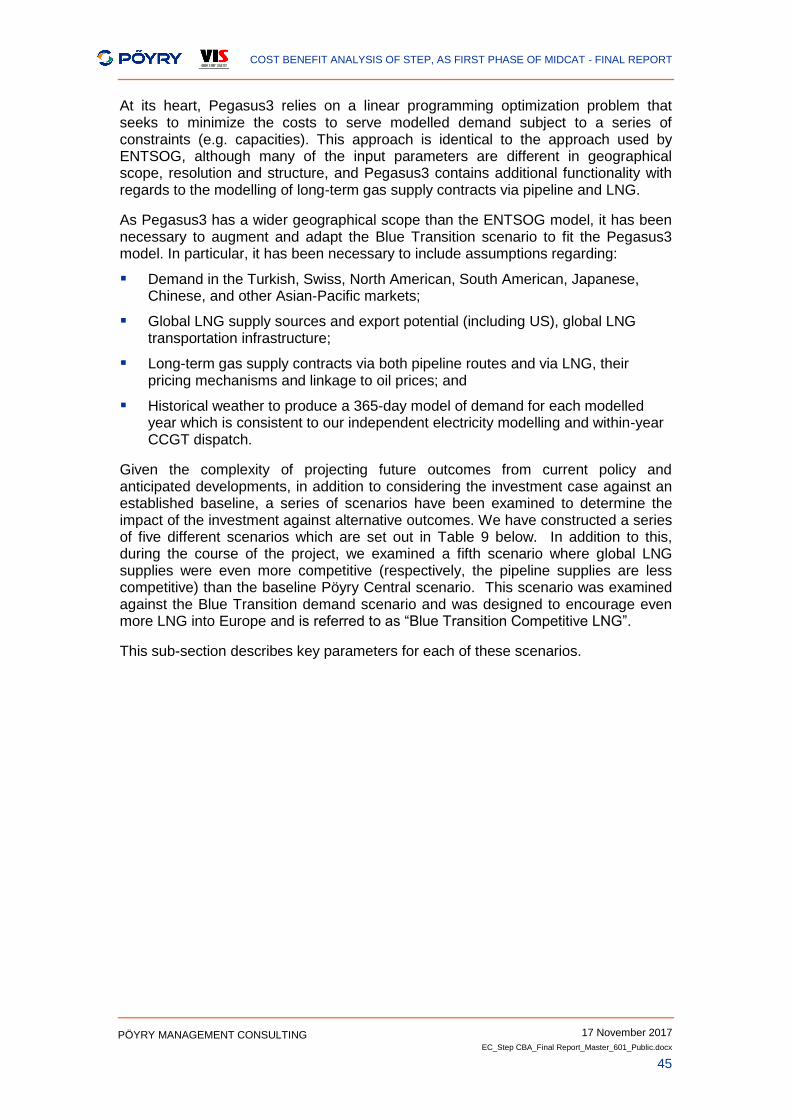
COST BENEFIT ANALYSIS OF STEP, AS FIRST PHASE OF MIDCAT - FINAL REPORT
17 November 2017
EC_Step CBA_Final Report_Master_601_Public.docx
45
PÖYRY MANAGEMENT CONSULTING
At its heart, Pegasus3 relies on a linear programming optimization problem that seeks to minimize the costs to serve modelled demand subject to a series of constraints (e.g. capacities). This approach is identical to the approach used by ENTSOG, although many of the input parameters are different in geographical scope, resolution and structure, and Pegasus3 contains additional functionality with regards to the modelling of long-term gas supply contracts via pipeline and LNG.
As Pegasus3 has a wider geographical scope than the ENTSOG model, it has been necessary to augment and adapt the Blue Transition scenario to fit the Pegasus3 model. In particular, it has been necessary to include assumptions regarding:
Demand in the Turkish, Swiss, North American, South American, Japanese, Chinese, and other Asian-Pacific markets;
Global LNG supply sources and export potential (including US), global LNG transportation infrastructure;
Long-term gas supply contracts via both pipeline routes and via LNG, their pricing mechanisms and linkage to oil prices; and
Historical weather to produce a 365-day model of demand for each modelled year which is consistent to our independent electricity modelling and within-year CCGT dispatch.
Given the complexity of projecting future outcomes from current policy and anticipated developments, in addition to considering the investment case against an established baseline, a series of scenarios have been examined to determine the impact of the investment against alternative outcomes. We have constructed a series of five different scenarios which are set out in Table 9 below. In addition to this, during the course of the project, we examined a fifth scenario where global LNG supplies were even more competitive (respectively, the pipeline supplies are less competitive) than the baseline Pöyry Central scenario. This scenario was examined against the Blue Transition demand scenario and was designed to encourage even more LNG into Europe and is referred to as “Blue Transition Competitive LNG”.
This sub-section describes key parameters for each of these scenarios.
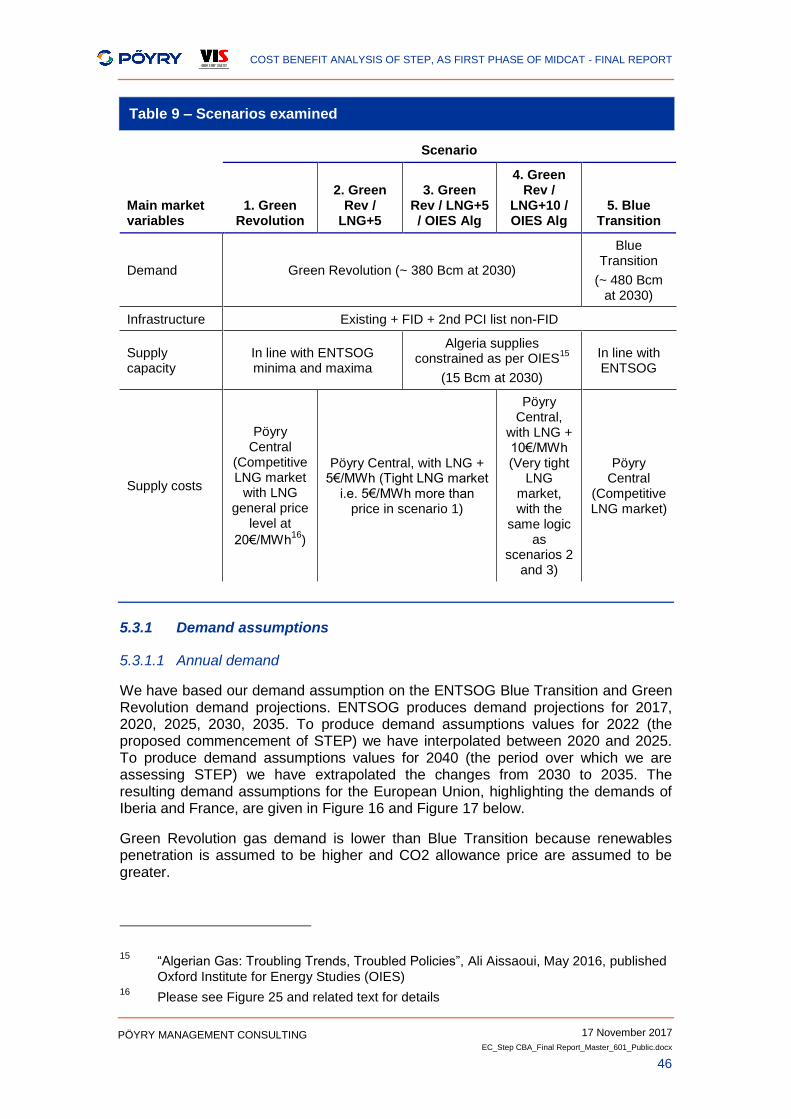
COST BENEFIT ANALYSIS OF STEP, AS FIRST PHASE OF MIDCAT - FINAL REPORT
17 November 2017
EC_Step CBA_Final Report_Master_601_Public.docx
46
PÖYRY MANAGEMENT CONSULTING
Table 9 – Scenarios examined
Scenario
Main market variables
1. Green Revolution
2. Green Rev /
LNG+5
3. Green Rev / LNG+5 / OIES Alg
4. Green Rev /
LNG+10 / OIES Alg
5. Blue Transition
Demand Green Revolution (~ 380 Bcm at 2030)
Blue Transition
(~ 480 Bcm at 2030)
Infrastructure Existing + FID + 2nd PCI list non-FID
Supply capacity
In line with ENTSOG minima and maxima
Algeria supplies constrained as per OIES
15
(15 Bcm at 2030)
In line with ENTSOG
Supply costs
Pöyry Central
(Competitive LNG market
with LNG general price
level at
20€/MWh16
)
Pöyry Central, with LNG + 5€/MWh (Tight LNG market
i.e. 5€/MWh more than price in scenario 1)
Pöyry Central,
with LNG + 10€/MWh (Very tight
LNG market, with the
same logic as
scenarios 2 and 3)
Pöyry Central
(Competitive LNG market)
5.3.1 Demand assumptions
5.3.1.1 Annual demand
We have based our demand assumption on the ENTSOG Blue Transition and Green Revolution demand projections. ENTSOG produces demand projections for 2017, 2020, 2025, 2030, 2035. To produce demand assumptions values for 2022 (the proposed commencement of STEP) we have interpolated between 2020 and 2025. To produce demand assumptions values for 2040 (the period over which we are assessing STEP) we have extrapolated the changes from 2030 to 2035. The resulting demand assumptions for the European Union, highlighting the demands of Iberia and France, are given in Figure 16 and Figure 17 below.
Green Revolution gas demand is lower than Blue Transition because renewables penetration is assumed to be higher and CO2 allowance price are assumed to be greater.
15
“Algerian Gas: Troubling Trends, Troubled Policies”, Ali Aissaoui, May 2016, published
Oxford Institute for Energy Studies (OIES) 16
Please see Figure 25 and related text for details
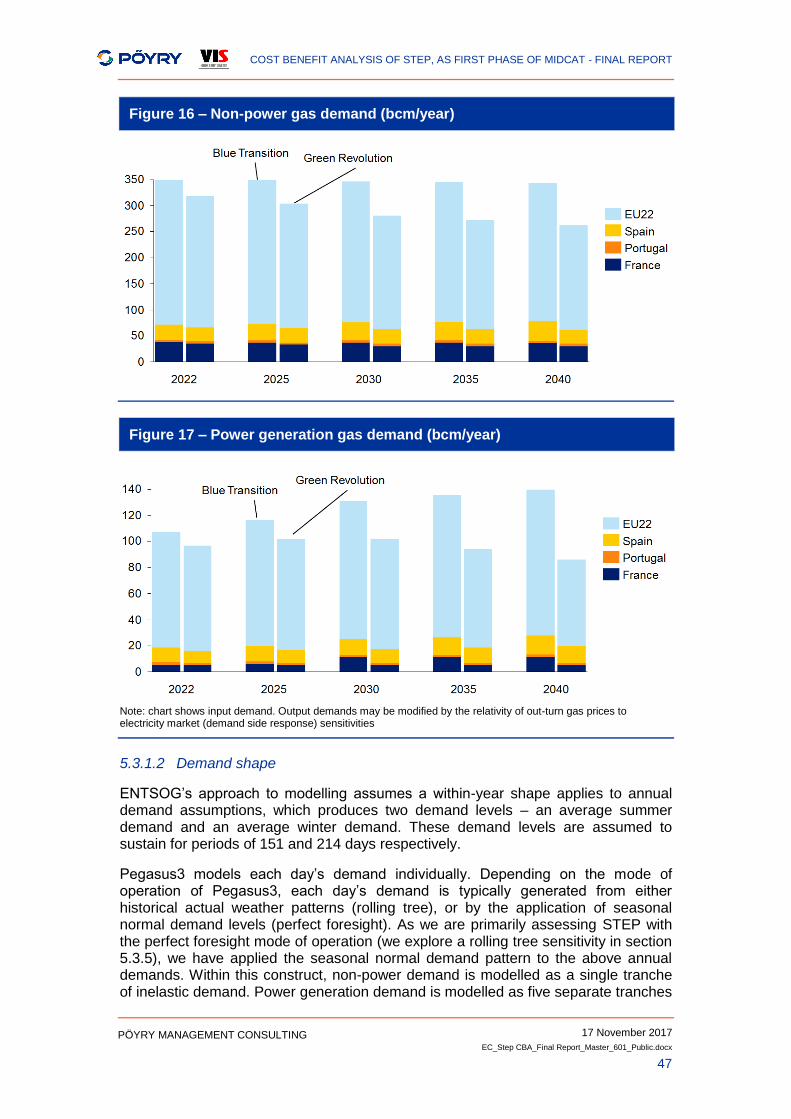
COST BENEFIT ANALYSIS OF STEP, AS FIRST PHASE OF MIDCAT - FINAL REPORT
17 November 2017
EC_Step CBA_Final Report_Master_601_Public.docx
47
PÖYRY MANAGEMENT CONSULTING
Figure 16 – Non-power gas demand (bcm/year)
Figure 17 – Power generation gas demand (bcm/year)
Note: chart shows input demand. Output demands may be modified by the relativity of out-turn gas prices to electricity market (demand side response) sensitivities
5.3.1.2 Demand shape
ENTSOG’s approach to modelling assumes a within-year shape applies to annual demand assumptions, which produces two demand levels – an average summer demand and an average winter demand. These demand levels are assumed to sustain for periods of 151 and 214 days respectively.
Pegasus3 models each day’s demand individually. Depending on the mode of operation of Pegasus3, each day’s demand is typically generated from either historical actual weather patterns (rolling tree), or by the application of seasonal normal demand levels (perfect foresight). As we are primarily assessing STEP with the perfect foresight mode of operation (we explore a rolling tree sensitivity in section 5.3.5), we have applied the seasonal normal demand pattern to the above annual demands. Within this construct, non-power demand is modelled as a single tranche of inelastic demand. Power generation demand is modelled as five separate tranches
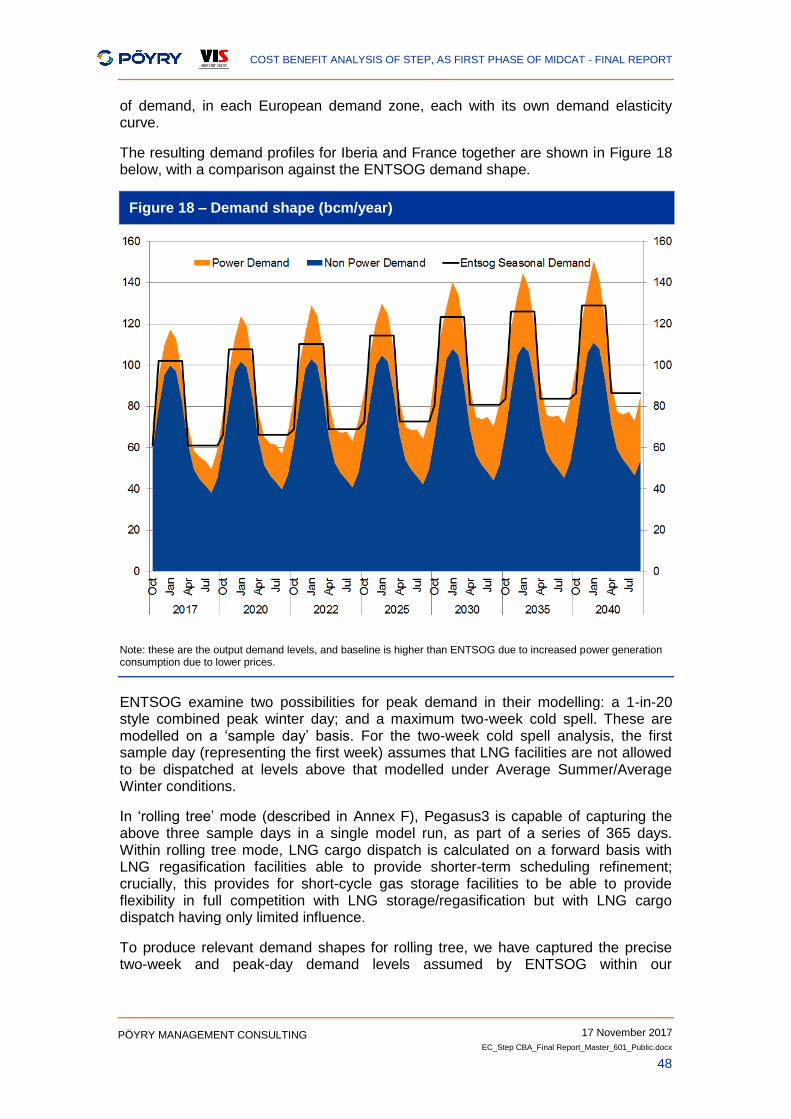
COST BENEFIT ANALYSIS OF STEP, AS FIRST PHASE OF MIDCAT - FINAL REPORT
17 November 2017
EC_Step CBA_Final Report_Master_601_Public.docx
48
PÖYRY MANAGEMENT CONSULTING
of demand, in each European demand zone, each with its own demand elasticity curve.
The resulting demand profiles for Iberia and France together are shown in Figure 18 below, with a comparison against the ENTSOG demand shape.
Figure 18 – Demand shape (bcm/year)
Note: these are the output demand levels, and baseline is higher than ENTSOG due to increased power generation consumption due to lower prices.
ENTSOG examine two possibilities for peak demand in their modelling: a 1-in-20 style combined peak winter day; and a maximum two-week cold spell. These are modelled on a ‘sample day’ basis. For the two-week cold spell analysis, the first sample day (representing the first week) assumes that LNG facilities are not allowed to be dispatched at levels above that modelled under Average Summer/Average Winter conditions.
In ‘rolling tree’ mode (described in Annex F), Pegasus3 is capable of capturing the above three sample days in a single model run, as part of a series of 365 days. Within rolling tree mode, LNG cargo dispatch is calculated on a forward basis with LNG regasification facilities able to provide shorter-term scheduling refinement; crucially, this provides for short-cycle gas storage facilities to be able to provide flexibility in full competition with LNG storage/regasification but with LNG cargo dispatch having only limited influence.
To produce relevant demand shapes for rolling tree, we have captured the precise two-week and peak-day demand levels assumed by ENTSOG within our
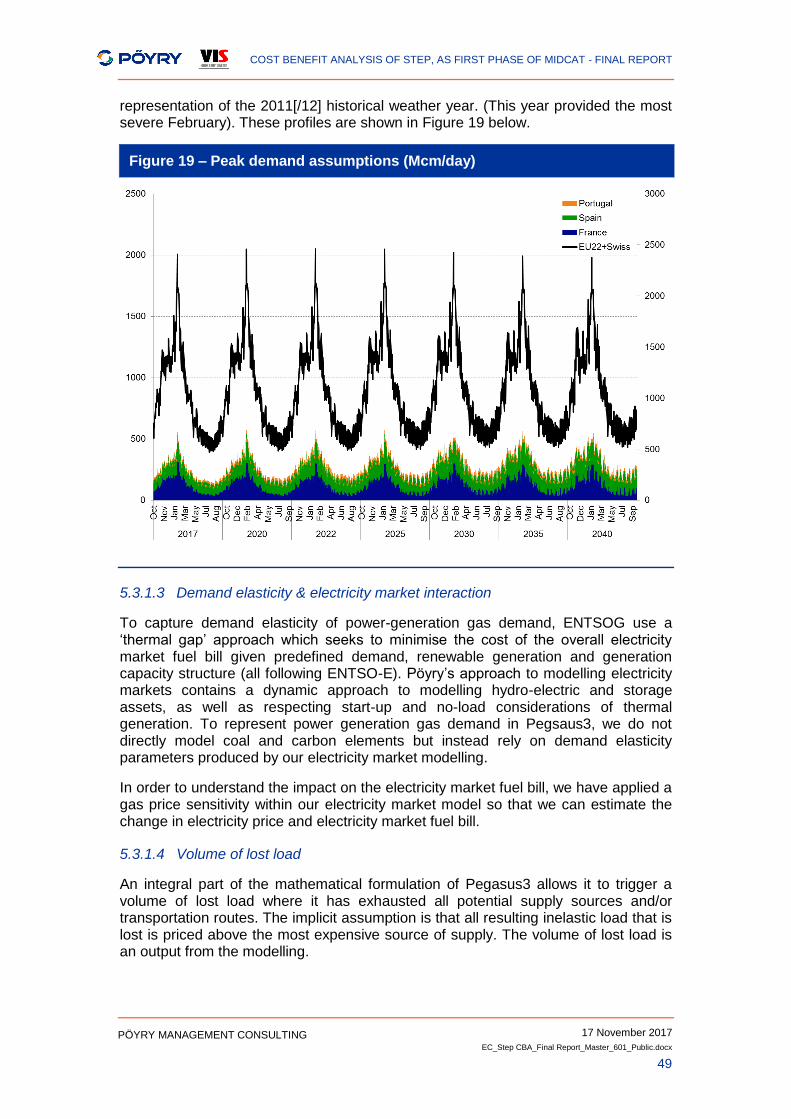
COST BENEFIT ANALYSIS OF STEP, AS FIRST PHASE OF MIDCAT - FINAL REPORT
17 November 2017
EC_Step CBA_Final Report_Master_601_Public.docx
49
PÖYRY MANAGEMENT CONSULTING
representation of the 2011[/12] historical weather year. (This year provided the most severe February). These profiles are shown in Figure 19 below.
Figure 19 – Peak demand assumptions (Mcm/day)
5.3.1.3 Demand elasticity & electricity market interaction
To capture demand elasticity of power-generation gas demand, ENTSOG use a ‘thermal gap’ approach which seeks to minimise the cost of the overall electricity market fuel bill given predefined demand, renewable generation and generation capacity structure (all following ENTSO-E). Pöyry’s approach to modelling electricity markets contains a dynamic approach to modelling hydro-electric and storage assets, as well as respecting start-up and no-load considerations of thermal generation. To represent power generation gas demand in Pegsaus3, we do not directly model coal and carbon elements but instead rely on demand elasticity parameters produced by our electricity market modelling.
In order to understand the impact on the electricity market fuel bill, we have applied a gas price sensitivity within our electricity market model so that we can estimate the change in electricity price and electricity market fuel bill.
5.3.1.4 Volume of lost load
An integral part of the mathematical formulation of Pegasus3 allows it to trigger a volume of lost load where it has exhausted all potential supply sources and/or transportation routes. The implicit assumption is that all resulting inelastic load that is lost is priced above the most expensive source of supply. The volume of lost load is an output from the modelling.
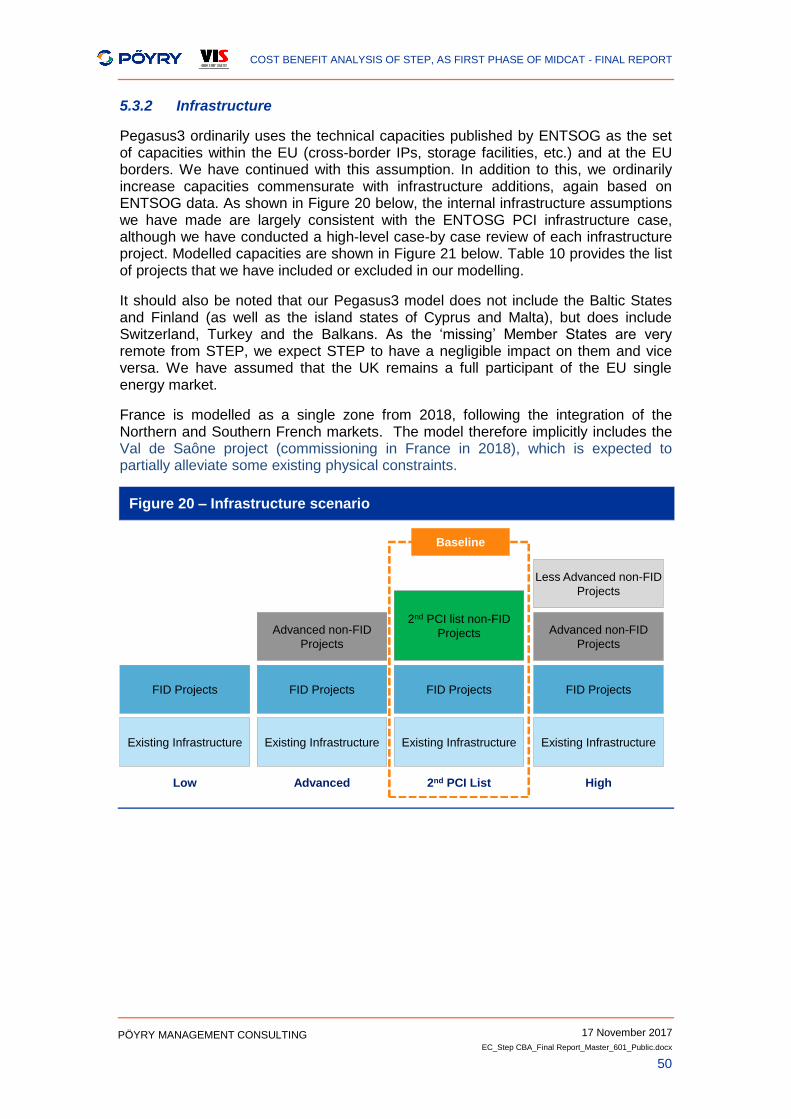
COST BENEFIT ANALYSIS OF STEP, AS FIRST PHASE OF MIDCAT - FINAL REPORT
17 November 2017
EC_Step CBA_Final Report_Master_601_Public.docx
50
PÖYRY MANAGEMENT CONSULTING
5.3.2 Infrastructure
Pegasus3 ordinarily uses the technical capacities published by ENTSOG as the set of capacities within the EU (cross-border IPs, storage facilities, etc.) and at the EU borders. We have continued with this assumption. In addition to this, we ordinarily increase capacities commensurate with infrastructure additions, again based on ENTSOG data. As shown in Figure 20 below, the internal infrastructure assumptions we have made are largely consistent with the ENTOSG PCI infrastructure case, although we have conducted a high-level case-by case review of each infrastructure project. Modelled capacities are shown in Figure 21 below. Table 10 provides the list of projects that we have included or excluded in our modelling.
It should also be noted that our Pegasus3 model does not include the Baltic States and Finland (as well as the island states of Cyprus and Malta), but does include Switzerland, Turkey and the Balkans. As the ‘missing’ Member States are very remote from STEP, we expect STEP to have a negligible impact on them and vice versa. We have assumed that the UK remains a full participant of the EU single energy market.
France is modelled as a single zone from 2018, following the integration of the Northern and Southern French markets. The model therefore implicitly includes the Val de Saône project (commissioning in France in 2018), which is expected to partially alleviate some existing physical constraints.
Figure 20 – Infrastructure scenario
Low Advanced High2nd PCI List
Baseline
Existing Infrastructure Existing Infrastructure Existing Infrastructure Existing Infrastructure
FID Projects FID Projects FID Projects FID Projects
Advanced non-FID
Projects
Advanced non-FID
Projects
2nd PCI list non-FID
Projects
Less Advanced non-FID
Projects
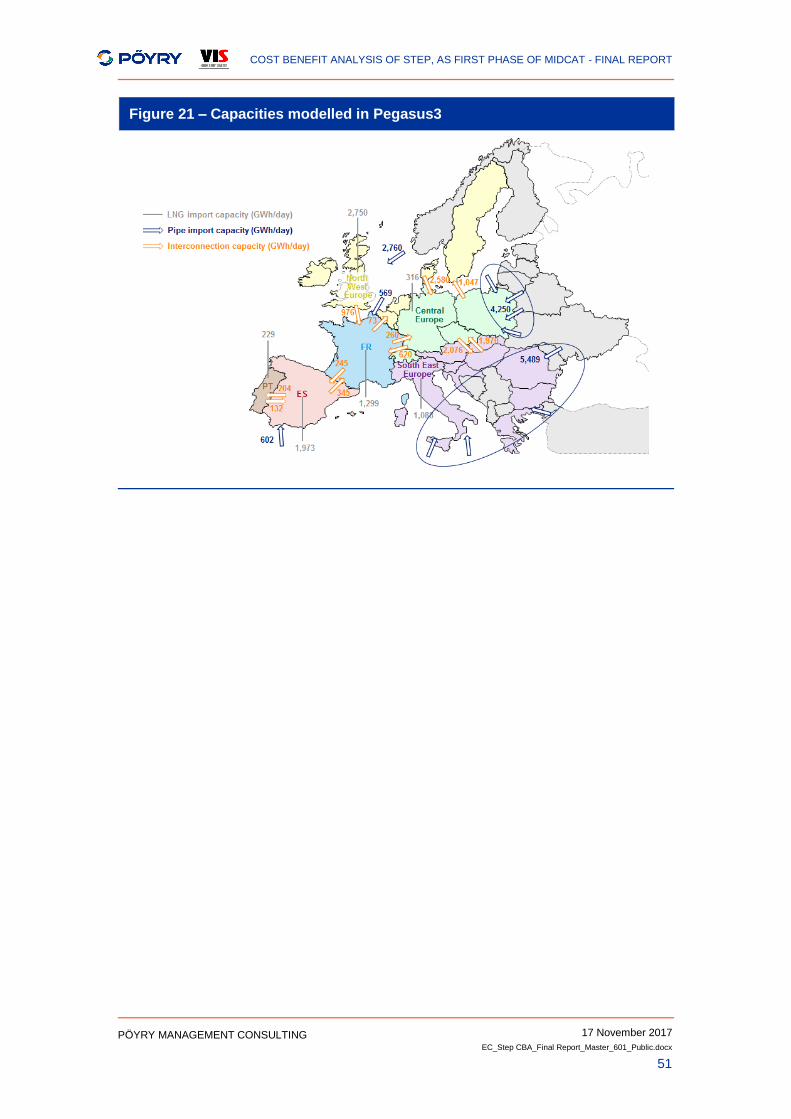
COST BENEFIT ANALYSIS OF STEP, AS FIRST PHASE OF MIDCAT - FINAL REPORT
17 November 2017
EC_Step CBA_Final Report_Master_601_Public.docx
51
PÖYRY MANAGEMENT CONSULTING
Figure 21 – Capacities modelled in Pegasus3
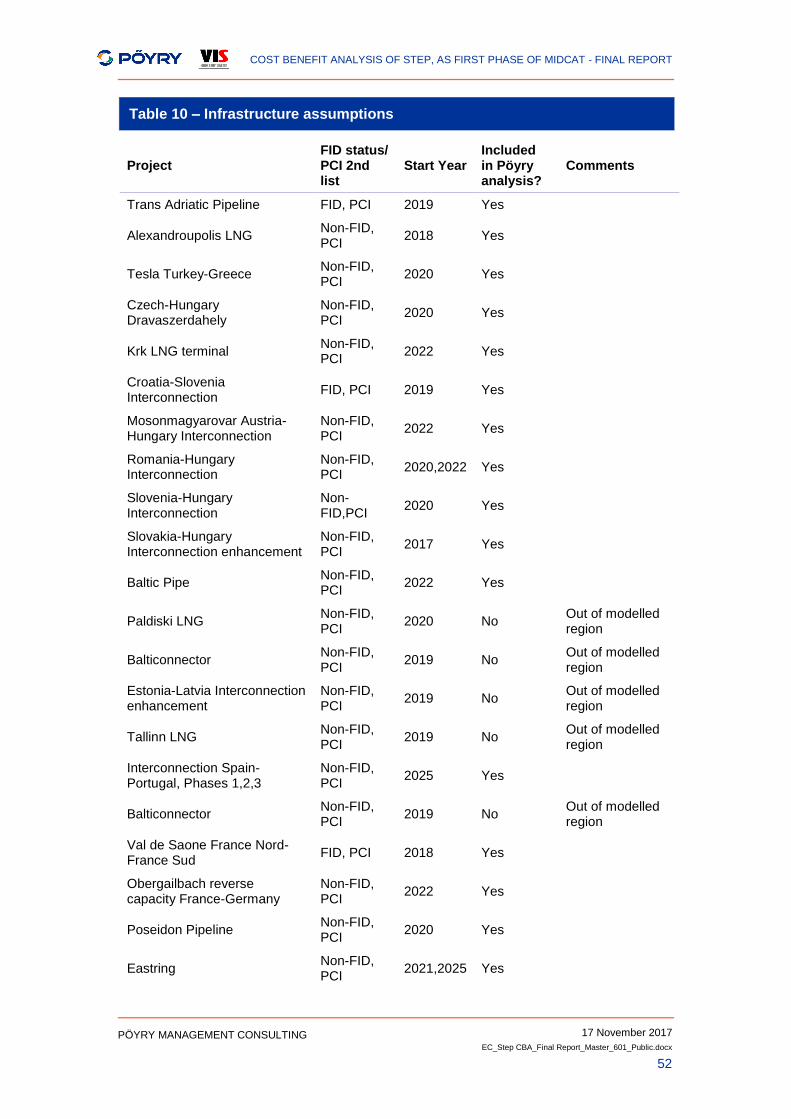
COST BENEFIT ANALYSIS OF STEP, AS FIRST PHASE OF MIDCAT - FINAL REPORT
17 November 2017
EC_Step CBA_Final Report_Master_601_Public.docx
52
PÖYRY MANAGEMENT CONSULTING
Table 10 – Infrastructure assumptions
Project FID status/ PCI 2nd
list Start Year
Included in Pöyry analysis?
Comments
Trans Adriatic Pipeline FID, PCI 2019 Yes
Alexandroupolis LNG Non-FID, PCI
2018 Yes
Tesla Turkey-Greece Non-FID, PCI
2020 Yes
Czech-Hungary Dravaszerdahely
Non-FID, PCI
2020 Yes
Krk LNG terminal Non-FID, PCI
2022 Yes
Croatia-Slovenia Interconnection
FID, PCI 2019 Yes
Mosonmagyarovar Austria-Hungary Interconnection
Non-FID, PCI
2022 Yes
Romania-Hungary Interconnection
Non-FID, PCI
2020,2022 Yes
Slovenia-Hungary Interconnection
Non-FID,PCI
2020 Yes
Slovakia-Hungary Interconnection enhancement
Non-FID, PCI
2017 Yes
Baltic Pipe Non-FID, PCI
2022 Yes
Paldiski LNG Non-FID, PCI
2020 No Out of modelled region
Balticonnector Non-FID, PCI
2019 No Out of modelled region
Estonia-Latvia Interconnection enhancement
Non-FID, PCI
2019 No Out of modelled region
Tallinn LNG Non-FID, PCI
2019 No Out of modelled region
Interconnection Spain-Portugal, Phases 1,2,3
Non-FID, PCI
2025 Yes
Balticonnector Non-FID, PCI
2019 No Out of modelled region
Val de Saone France Nord-France Sud
FID, PCI 2018 Yes
Obergailbach reverse capacity France-Germany
Non-FID, PCI
2022 Yes
Poseidon Pipeline Non-FID, PCI
2020 Yes
Eastring Non-FID, PCI
2021,2025 Yes
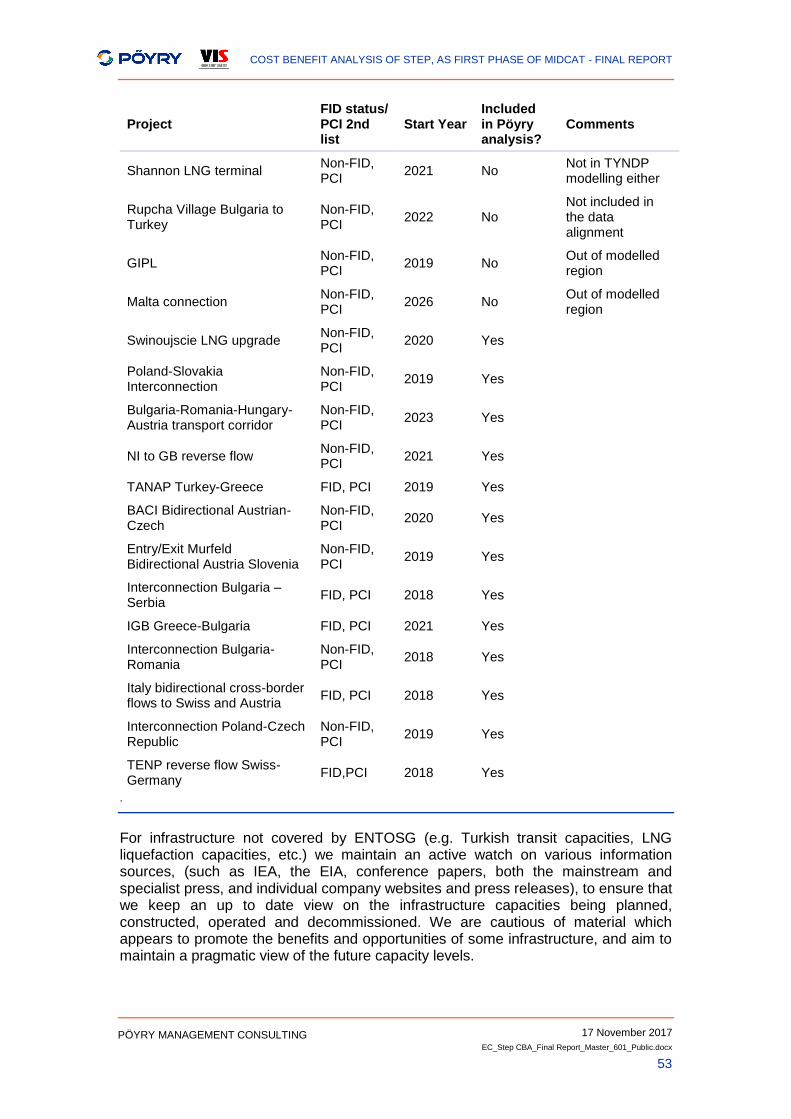
COST BENEFIT ANALYSIS OF STEP, AS FIRST PHASE OF MIDCAT - FINAL REPORT
17 November 2017
EC_Step CBA_Final Report_Master_601_Public.docx
53
PÖYRY MANAGEMENT CONSULTING
Project FID status/ PCI 2nd
list Start Year
Included in Pöyry analysis?
Comments
Shannon LNG terminal Non-FID, PCI
2021 No Not in TYNDP modelling either
Rupcha Village Bulgaria to Turkey
Non-FID, PCI
2022 No Not included in the data alignment
GIPL Non-FID, PCI
2019 No Out of modelled region
Malta connection Non-FID, PCI
2026 No Out of modelled region
Swinoujscie LNG upgrade Non-FID, PCI
2020 Yes
Poland-Slovakia Interconnection
Non-FID, PCI
2019 Yes
Bulgaria-Romania-Hungary-Austria transport corridor
Non-FID, PCI
2023 Yes
NI to GB reverse flow Non-FID, PCI
2021 Yes
TANAP Turkey-Greece FID, PCI 2019 Yes
BACI Bidirectional Austrian-Czech
Non-FID, PCI
2020 Yes
Entry/Exit Murfeld Bidirectional Austria Slovenia
Non-FID, PCI
2019 Yes
Interconnection Bulgaria – Serbia
FID, PCI 2018 Yes
IGB Greece-Bulgaria FID, PCI 2021 Yes
Interconnection Bulgaria-Romania
Non-FID, PCI
2018 Yes
Italy bidirectional cross-border flows to Swiss and Austria
FID, PCI 2018 Yes
Interconnection Poland-Czech Republic
Non-FID, PCI
2019 Yes
TENP reverse flow Swiss-Germany
FID,PCI 2018 Yes
.
For infrastructure not covered by ENTOSG (e.g. Turkish transit capacities, LNG liquefaction capacities, etc.) we maintain an active watch on various information sources, (such as IEA, the EIA, conference papers, both the mainstream and specialist press, and individual company websites and press releases), to ensure that we keep an up to date view on the infrastructure capacities being planned, constructed, operated and decommissioned. We are cautious of material which appears to promote the benefits and opportunities of some infrastructure, and aim to maintain a pragmatic view of the future capacity levels.
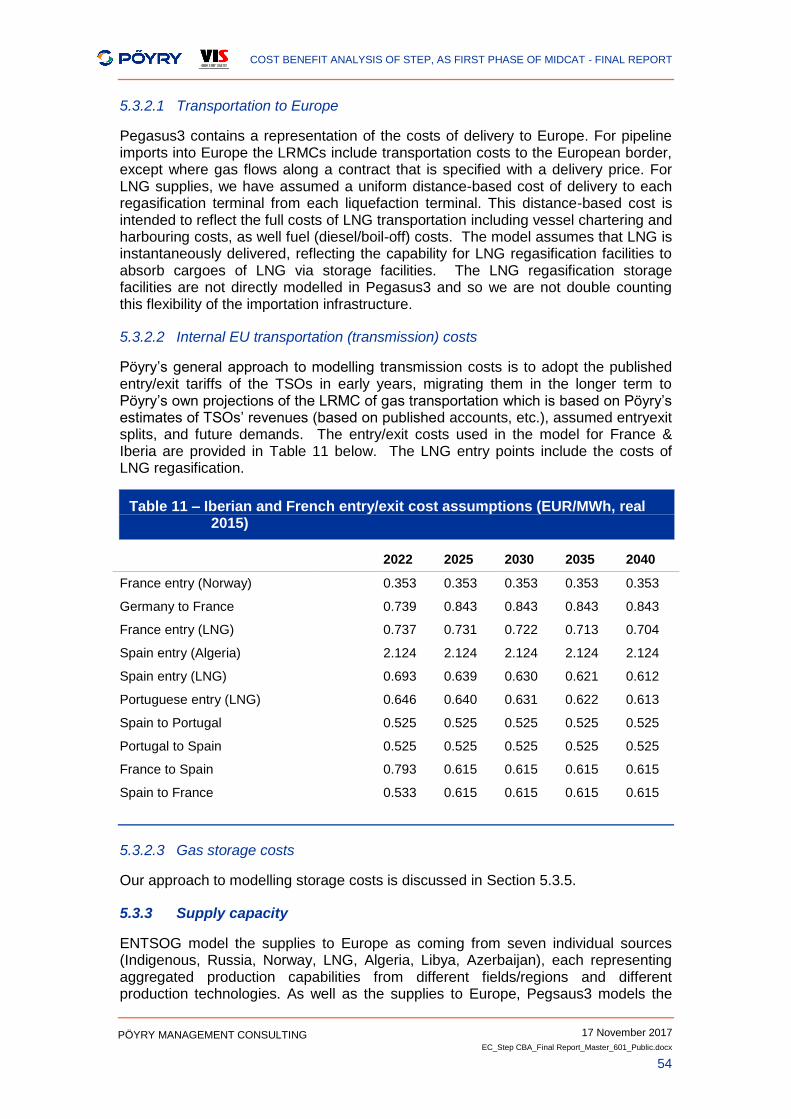
COST BENEFIT ANALYSIS OF STEP, AS FIRST PHASE OF MIDCAT - FINAL REPORT
17 November 2017
EC_Step CBA_Final Report_Master_601_Public.docx
54
PÖYRY MANAGEMENT CONSULTING
5.3.2.1 Transportation to Europe
Pegasus3 contains a representation of the costs of delivery to Europe. For pipeline imports into Europe the LRMCs include transportation costs to the European border, except where gas flows along a contract that is specified with a delivery price. For LNG supplies, we have assumed a uniform distance-based cost of delivery to each regasification terminal from each liquefaction terminal. This distance-based cost is intended to reflect the full costs of LNG transportation including vessel chartering and harbouring costs, as well fuel (diesel/boil-off) costs. The model assumes that LNG is instantaneously delivered, reflecting the capability for LNG regasification facilities to absorb cargoes of LNG via storage facilities. The LNG regasification storage facilities are not directly modelled in Pegasus3 and so we are not double counting this flexibility of the importation infrastructure.
5.3.2.2 Internal EU transportation (transmission) costs
Pöyry’s general approach to modelling transmission costs is to adopt the published entry/exit tariffs of the TSOs in early years, migrating them in the longer term to Pöyry’s own projections of the LRMC of gas transportation which is based on Pöyry’s estimates of TSOs’ revenues (based on published accounts, etc.), assumed entryexit splits, and future demands. The entry/exit costs used in the model for France & Iberia are provided in Table 11 below. The LNG entry points include the costs of LNG regasification.
Table 11 – Iberian and French entry/exit cost assumptions (EUR/MWh, real 2015)
2022 2025 2030 2035 2040
France entry (Norway) 0.353 0.353 0.353 0.353 0.353
Germany to France 0.739 0.843 0.843 0.843 0.843
France entry (LNG) 0.737 0.731 0.722 0.713 0.704
Spain entry (Algeria) 2.124 2.124 2.124 2.124 2.124
Spain entry (LNG) 0.693 0.639 0.630 0.621 0.612
Portuguese entry (LNG) 0.646 0.640 0.631 0.622 0.613
Spain to Portugal 0.525 0.525 0.525 0.525 0.525
Portugal to Spain 0.525 0.525 0.525 0.525 0.525
France to Spain 0.793 0.615 0.615 0.615 0.615
Spain to France 0.533 0.615 0.615 0.615 0.615
5.3.2.3 Gas storage costs
Our approach to modelling storage costs is discussed in Section 5.3.5.
5.3.3 Supply capacity
ENTSOG model the supplies to Europe as coming from seven individual sources (Indigenous, Russia, Norway, LNG, Algeria, Libya, Azerbaijan), each representing aggregated production capabilities from different fields/regions and different production technologies. As well as the supplies to Europe, Pegsaus3 models the
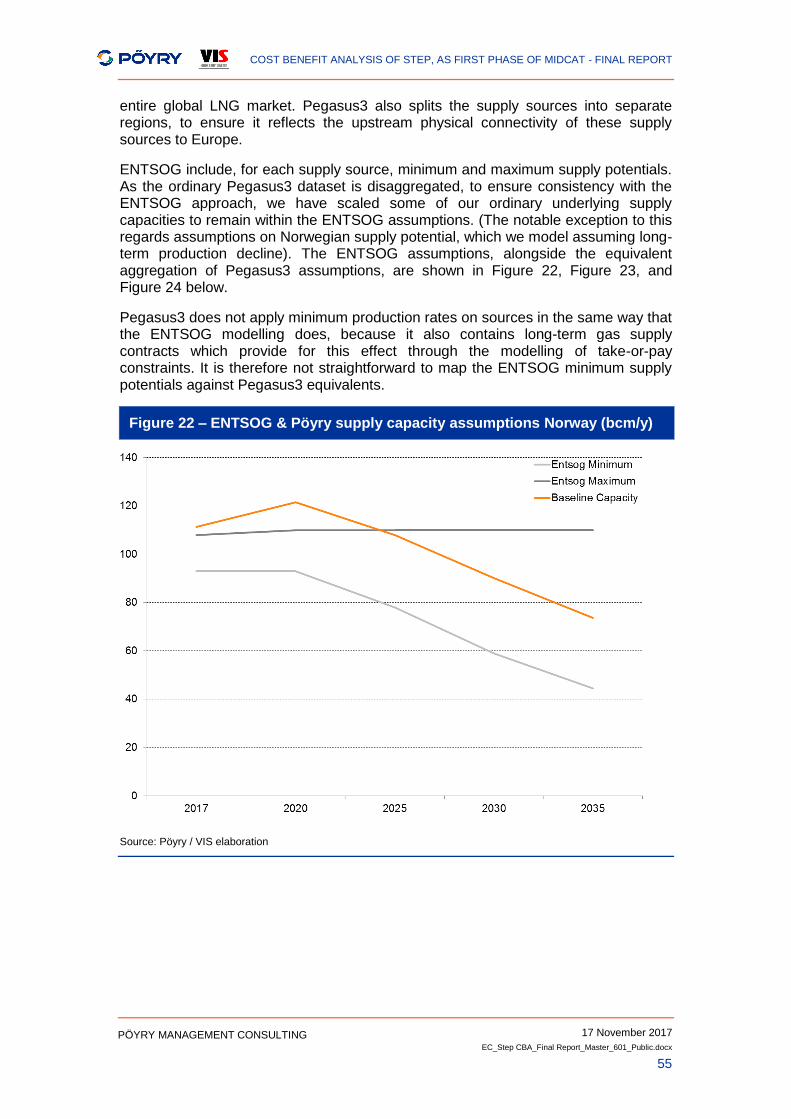
COST BENEFIT ANALYSIS OF STEP, AS FIRST PHASE OF MIDCAT - FINAL REPORT
17 November 2017
EC_Step CBA_Final Report_Master_601_Public.docx
55
PÖYRY MANAGEMENT CONSULTING
entire global LNG market. Pegasus3 also splits the supply sources into separate regions, to ensure it reflects the upstream physical connectivity of these supply sources to Europe.
ENTSOG include, for each supply source, minimum and maximum supply potentials. As the ordinary Pegasus3 dataset is disaggregated, to ensure consistency with the ENTSOG approach, we have scaled some of our ordinary underlying supply capacities to remain within the ENTSOG assumptions. (The notable exception to this regards assumptions on Norwegian supply potential, which we model assuming long-term production decline). The ENTSOG assumptions, alongside the equivalent aggregation of Pegasus3 assumptions, are shown in Figure 22, Figure 23, and Figure 24 below.
Pegasus3 does not apply minimum production rates on sources in the same way that the ENTSOG modelling does, because it also contains long-term gas supply contracts which provide for this effect through the modelling of take-or-pay constraints. It is therefore not straightforward to map the ENTSOG minimum supply potentials against Pegasus3 equivalents.
Figure 22 – ENTSOG & Pöyry supply capacity assumptions Norway (bcm/y)
Source: Pöyry / VIS elaboration
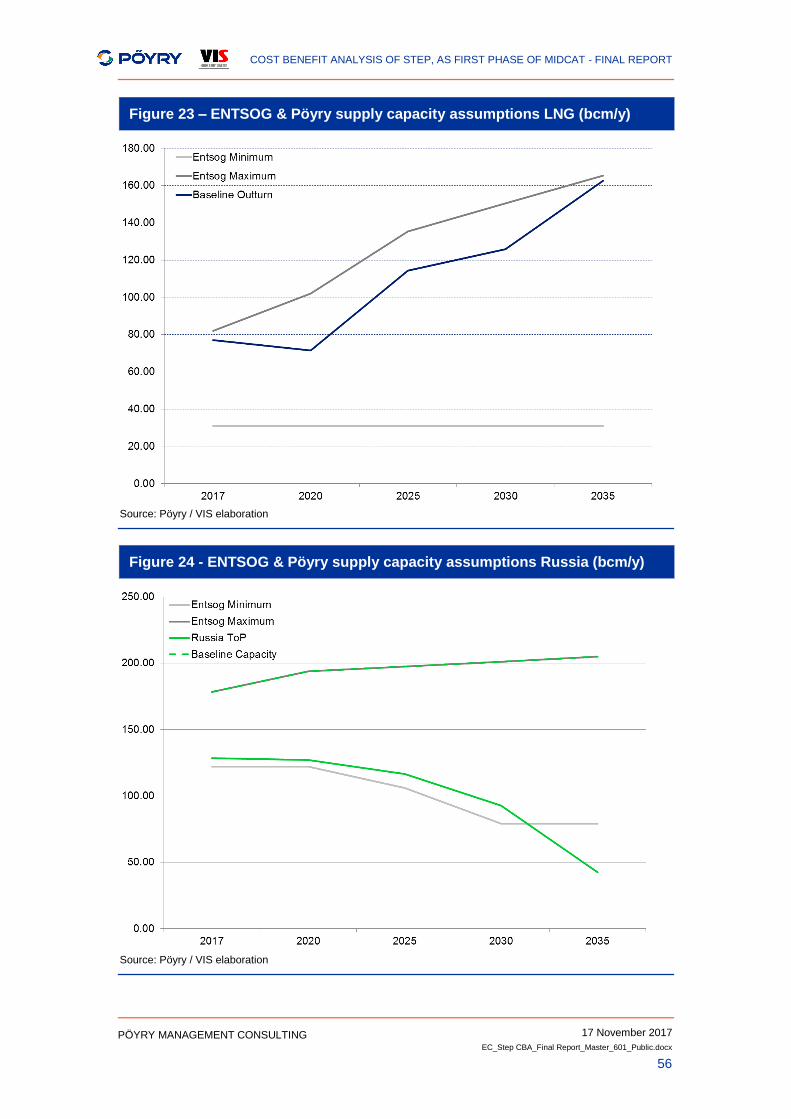
COST BENEFIT ANALYSIS OF STEP, AS FIRST PHASE OF MIDCAT - FINAL REPORT
17 November 2017
EC_Step CBA_Final Report_Master_601_Public.docx
56
PÖYRY MANAGEMENT CONSULTING
Figure 23 – ENTSOG & Pöyry supply capacity assumptions LNG (bcm/y)
Source: Pöyry / VIS elaboration
Figure 24 - ENTSOG & Pöyry supply capacity assumptions Russia (bcm/y)
Source: Pöyry / VIS elaboration
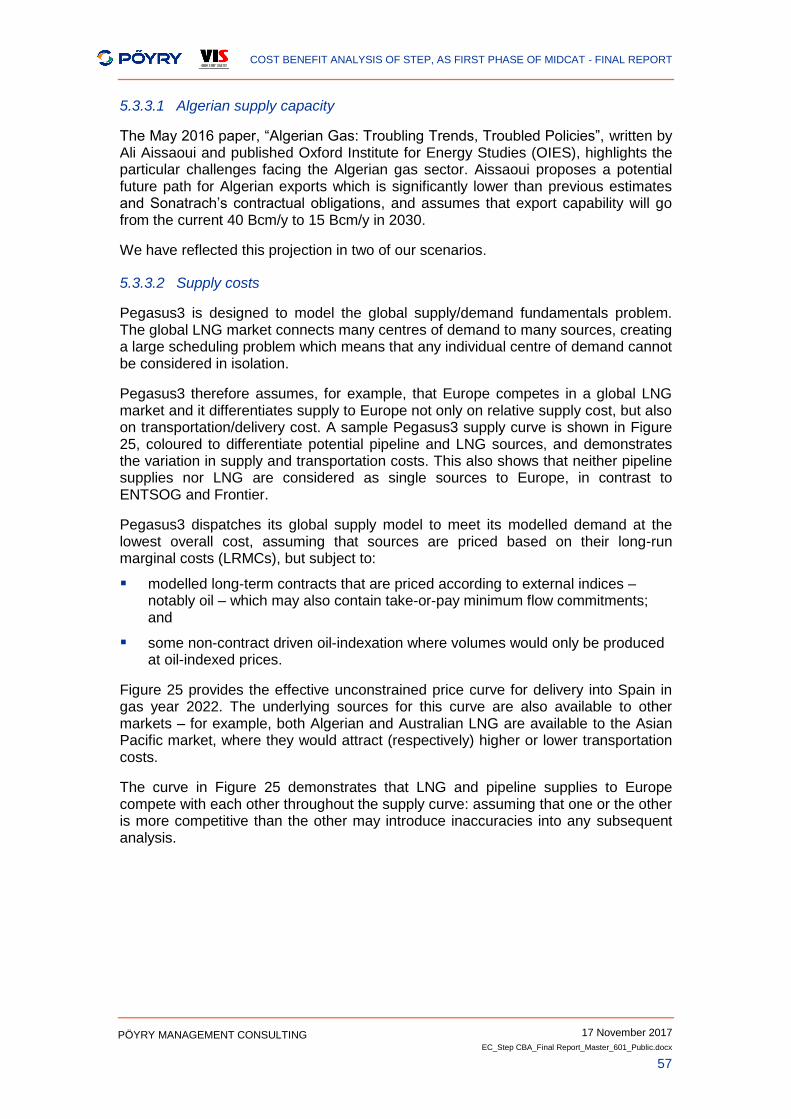
COST BENEFIT ANALYSIS OF STEP, AS FIRST PHASE OF MIDCAT - FINAL REPORT
17 November 2017
EC_Step CBA_Final Report_Master_601_Public.docx
57
PÖYRY MANAGEMENT CONSULTING
5.3.3.1 Algerian supply capacity
The May 2016 paper, “Algerian Gas: Troubling Trends, Troubled Policies”, written by Ali Aissaoui and published Oxford Institute for Energy Studies (OIES), highlights the particular challenges facing the Algerian gas sector. Aissaoui proposes a potential future path for Algerian exports which is significantly lower than previous estimates and Sonatrach’s contractual obligations, and assumes that export capability will go from the current 40 Bcm/y to 15 Bcm/y in 2030.
We have reflected this projection in two of our scenarios.
5.3.3.2 Supply costs
Pegasus3 is designed to model the global supply/demand fundamentals problem. The global LNG market connects many centres of demand to many sources, creating a large scheduling problem which means that any individual centre of demand cannot be considered in isolation.
Pegasus3 therefore assumes, for example, that Europe competes in a global LNG market and it differentiates supply to Europe not only on relative supply cost, but also on transportation/delivery cost. A sample Pegasus3 supply curve is shown in Figure 25, coloured to differentiate potential pipeline and LNG sources, and demonstrates the variation in supply and transportation costs. This also shows that neither pipeline supplies nor LNG are considered as single sources to Europe, in contrast to ENTSOG and Frontier.
Pegasus3 dispatches its global supply model to meet its modelled demand at the lowest overall cost, assuming that sources are priced based on their long-run marginal costs (LRMCs), but subject to:
modelled long-term contracts that are priced according to external indices – notably oil – which may also contain take-or-pay minimum flow commitments; and
some non-contract driven oil-indexation where volumes would only be produced at oil-indexed prices.
Figure 25 provides the effective unconstrained price curve for delivery into Spain in gas year 2022. The underlying sources for this curve are also available to other markets – for example, both Algerian and Australian LNG are available to the Asian Pacific market, where they would attract (respectively) higher or lower transportation costs.
The curve in Figure 25 demonstrates that LNG and pipeline supplies to Europe compete with each other throughout the supply curve: assuming that one or the other is more competitive than the other may introduce inaccuracies into any subsequent analysis.
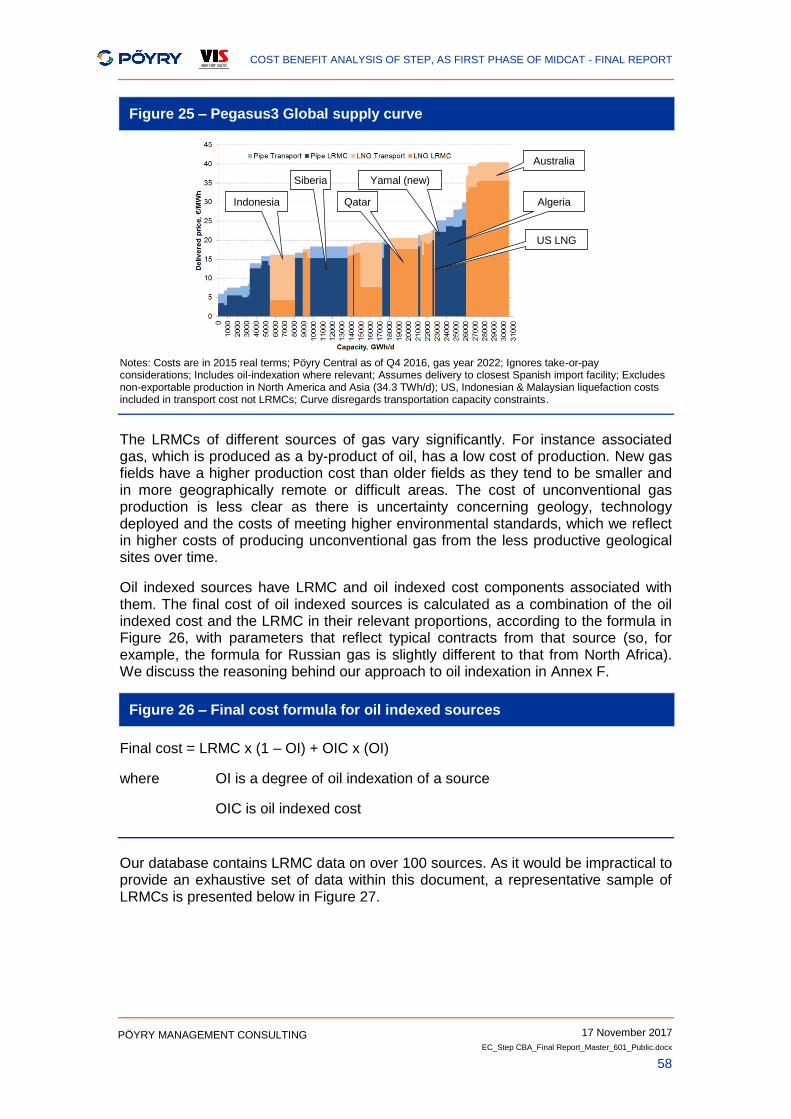
COST BENEFIT ANALYSIS OF STEP, AS FIRST PHASE OF MIDCAT - FINAL REPORT
17 November 2017
EC_Step CBA_Final Report_Master_601_Public.docx
58
PÖYRY MANAGEMENT CONSULTING
Figure 25 – Pegasus3 Global supply curve
Notes: Costs are in 2015 real terms; Pöyry Central as of Q4 2016, gas year 2022; Ignores take-or-pay considerations; Includes oil-indexation where relevant; Assumes delivery to closest Spanish import facility; Excludes non-exportable production in North America and Asia (34.3 TWh/d); US, Indonesian & Malaysian liquefaction costs included in transport cost not LRMCs; Curve disregards transportation capacity constraints.
The LRMCs of different sources of gas vary significantly. For instance associated gas, which is produced as a by-product of oil, has a low cost of production. New gas fields have a higher production cost than older fields as they tend to be smaller and in more geographically remote or difficult areas. The cost of unconventional gas production is less clear as there is uncertainty concerning geology, technology deployed and the costs of meeting higher environmental standards, which we reflect in higher costs of producing unconventional gas from the less productive geological sites over time.
Oil indexed sources have LRMC and oil indexed cost components associated with them. The final cost of oil indexed sources is calculated as a combination of the oil indexed cost and the LRMC in their relevant proportions, according to the formula in Figure 26, with parameters that reflect typical contracts from that source (so, for example, the formula for Russian gas is slightly different to that from North Africa). We discuss the reasoning behind our approach to oil indexation in Annex F.
Figure 26 – Final cost formula for oil indexed sources
Final cost = LRMC x (1 – OI) + OIC x (OI)
where OI is a degree of oil indexation of a source
OIC is oil indexed cost
Our database contains LRMC data on over 100 sources. As it would be impractical to provide an exhaustive set of data within this document, a representative sample of LRMCs is presented below in Figure 27.
Siberia
Indonesia Qatar
Yamal (new)
Algeria
Australia
US LNG
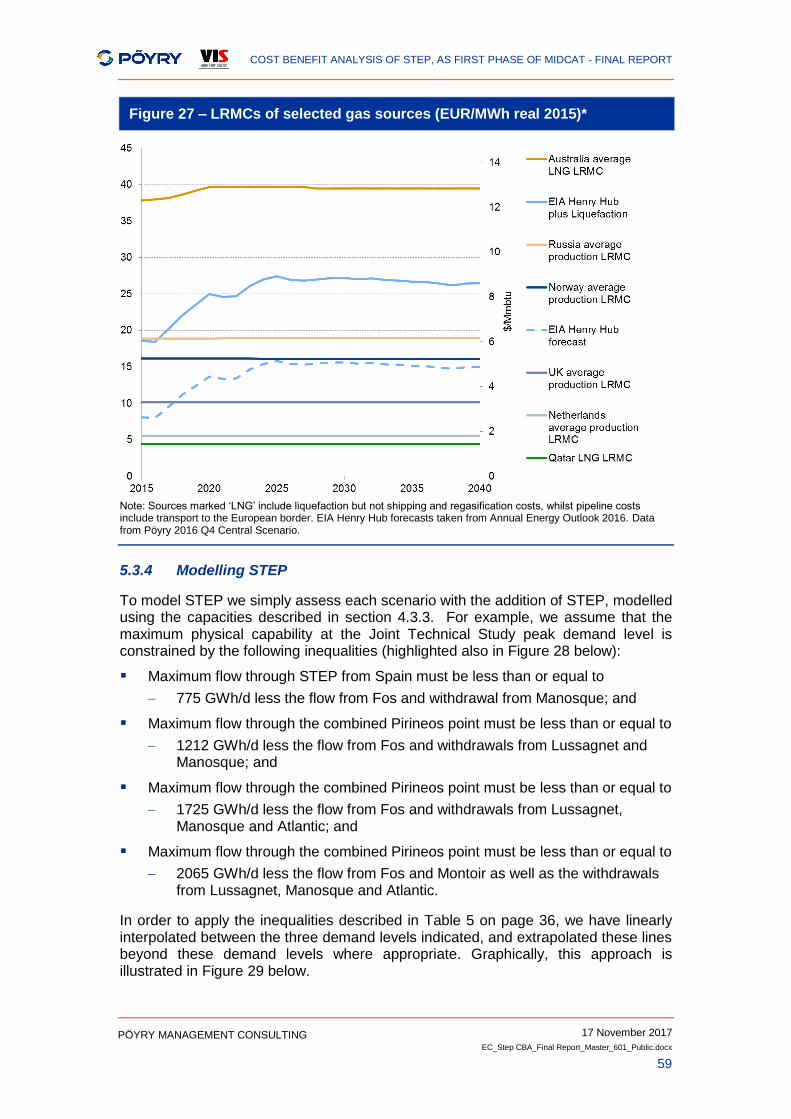
COST BENEFIT ANALYSIS OF STEP, AS FIRST PHASE OF MIDCAT - FINAL REPORT
17 November 2017
EC_Step CBA_Final Report_Master_601_Public.docx
59
PÖYRY MANAGEMENT CONSULTING
Figure 27 – LRMCs of selected gas sources (EUR/MWh real 2015)*
Note: Sources marked ‘LNG’ include liquefaction but not shipping and regasification costs, whilst pipeline costs include transport to the European border. EIA Henry Hub forecasts taken from Annual Energy Outlook 2016. Data from Pöyry 2016 Q4 Central Scenario.
5.3.4 Modelling STEP
To model STEP we simply assess each scenario with the addition of STEP, modelled using the capacities described in section 4.3.3. For example, we assume that the maximum physical capability at the Joint Technical Study peak demand level is constrained by the following inequalities (highlighted also in Figure 28 below):
Maximum flow through STEP from Spain must be less than or equal to
775 GWh/d less the flow from Fos and withdrawal from Manosque; and
Maximum flow through the combined Pirineos point must be less than or equal to
1212 GWh/d less the flow from Fos and withdrawals from Lussagnet and Manosque; and
Maximum flow through the combined Pirineos point must be less than or equal to
1725 GWh/d less the flow from Fos and withdrawals from Lussagnet, Manosque and Atlantic; and
Maximum flow through the combined Pirineos point must be less than or equal to
2065 GWh/d less the flow from Fos and Montoir as well as the withdrawals from Lussagnet, Manosque and Atlantic.
In order to apply the inequalities described in Table 5 on page 36, we have linearly interpolated between the three demand levels indicated, and extrapolated these lines beyond these demand levels where appropriate. Graphically, this approach is illustrated in Figure 29 below.
COST BENEFIT ANALYSIS OF STEP, AS FIRST PHASE OF MIDCAT - FINAL REPORT
17 November 2017
EC_Step CBA_Final Report_Master_601_Public.docx
60
PÖYRY MANAGEMENT CONSULTING
The constraints at the different Joint Technical Study demand levels (winter scenario and summer scenario) are likewise included in the model. As the form of each individual inequality (which are labelled as “SN1”, “SN2”, “NS4”, etc. in the Joint Technical Study and in Figure 28 below.) is the same at each of the three demand levels, we have been able to assume a simple linear interpolation of the right hand side of the inequalities. Interpolation has been applied between peak and winter demand levels and between winter and summer demand level. Extrapolation has been applied to cover for any demands encountered in the modelling above peak demand or below summer demand.
All inequalities are applied at the same time (they are all simultaneously respected by the model). This means that the full physical capability of the infrastructure, as defined by the JTS, is available for use within the model.
Figure 28 – Peak demand south to north JTS constraints applied
To isolate the welfare impacts to Europe and prevent any transfer of welfare outside of Europe, non-European supply sourcing and transportation scheduling decisions were constrained to be identical with and without STEP. All other aspects of the model are kept constant so that we are able to determine the changes in the outputs that are due to STEP. This produces a set of outputs consistent with the baseline scenario outputs that can then be compared. The difference of total costs within the modelling represents the economic benefit of STEP to Europe.
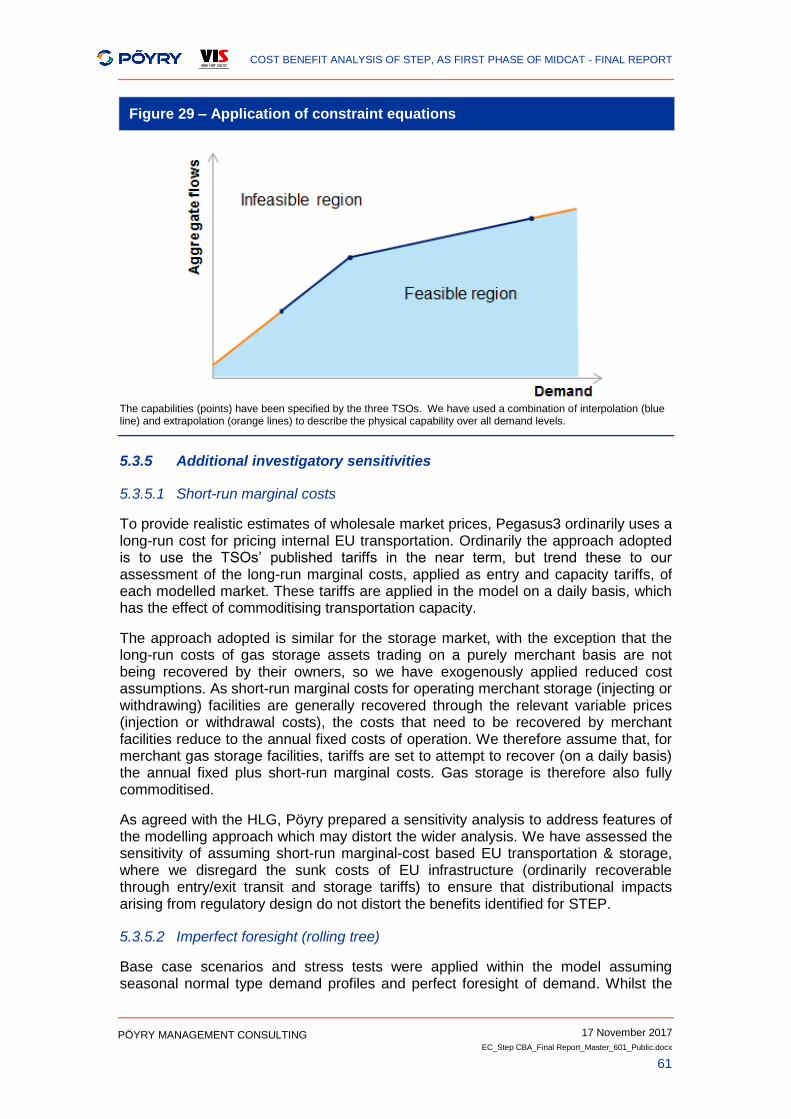
COST BENEFIT ANALYSIS OF STEP, AS FIRST PHASE OF MIDCAT - FINAL REPORT
17 November 2017
EC_Step CBA_Final Report_Master_601_Public.docx
61
PÖYRY MANAGEMENT CONSULTING
Figure 29 – Application of constraint equations
The capabilities (points) have been specified by the three TSOs. We have used a combination of interpolation (blue line) and extrapolation (orange lines) to describe the physical capability over all demand levels.
5.3.5 Additional investigatory sensitivities
5.3.5.1 Short-run marginal costs
To provide realistic estimates of wholesale market prices, Pegasus3 ordinarily uses a long-run cost for pricing internal EU transportation. Ordinarily the approach adopted is to use the TSOs’ published tariffs in the near term, but trend these to our assessment of the long-run marginal costs, applied as entry and capacity tariffs, of each modelled market. These tariffs are applied in the model on a daily basis, which has the effect of commoditising transportation capacity.
The approach adopted is similar for the storage market, with the exception that the long-run costs of gas storage assets trading on a purely merchant basis are not being recovered by their owners, so we have exogenously applied reduced cost assumptions. As short-run marginal costs for operating merchant storage (injecting or withdrawing) facilities are generally recovered through the relevant variable prices (injection or withdrawal costs), the costs that need to be recovered by merchant facilities reduce to the annual fixed costs of operation. We therefore assume that, for merchant gas storage facilities, tariffs are set to attempt to recover (on a daily basis) the annual fixed plus short-run marginal costs. Gas storage is therefore also fully commoditised.
As agreed with the HLG, Pöyry prepared a sensitivity analysis to address features of the modelling approach which may distort the wider analysis. We have assessed the sensitivity of assuming short-run marginal-cost based EU transportation & storage, where we disregard the sunk costs of EU infrastructure (ordinarily recoverable through entry/exit transit and storage tariffs) to ensure that distributional impacts arising from regulatory design do not distort the benefits identified for STEP.
5.3.5.2 Imperfect foresight (rolling tree)
Base case scenarios and stress tests were applied within the model assuming seasonal normal type demand profiles and perfect foresight of demand. Whilst the
COST BENEFIT ANALYSIS OF STEP, AS FIRST PHASE OF MIDCAT - FINAL REPORT
17 November 2017
EC_Step CBA_Final Report_Master_601_Public.docx
62
PÖYRY MANAGEMENT CONSULTING
perfect foresight of operation of Pegasus3 respects any exogenously applied storage constraints (such as the minima and maxima shapes that apply within the French market), this mode produces a potentially unrealistic scheduling of gas storage facilities’ injection and withdrawal, and a potentially unrealistic schedule for delivering LNG cargoes. We have investigated these potential issues using our ‘rolling-tree’ mode of operation, which did not yield any significant concerns that perfect foresight analysis would be deficient.
5.3.5.3 Within-year demand profile
To produce relevant demand shapes for our rolling tree analysis, we have captured the precise two-week and peak-day demand levels assumed by ENTSOG within our representation of the 2011/12 historical weather year. (2011/12 was selected as it provides the most severe February). These profiles are shown in Figure 19.
To ensure that we captured peak-day effects, we have also run the model with these demand patters in perfect foresight mode, and confirmed that there are no material differences results produced with seasonal normal demand. (For the avoidance of doubt, the ENTOSG European peak day has not been assessed against the stress tests presented in 5.3.7.)
5.3.6 Electricity modelling
Possible and significant changes in the gas prices may impact the generation mix, especially in countries that rely on coal fired production, like Spain. The impact may be, for example, that gas replaces coal in the generation mix where gas prices are reduced. The resulting reduction in power sector CO2 emissions and in electricity prices may then be considered as an additional benefit.
Pegasus3 automatically reduces gas-fired power generation consumption in response to high gas price signals within the model. The relationship between volumes reduced at different gas price levels is defined separately for each gas market, and is produced as an output of our power market model, BID3. Whilst this ‘automatic’ gas demand flexibility (which would ultimately rely on alternative power generation such as coal) is taken into account in Pegasus3, it does not capture the resultant change in electricity prices (whose associated increase may be tempered by alternative generation fuels such as coal) and CO2 emissions (which might be expected to increase reflecting increased use of coal).
To ensure we capture all the impacts we have therefore assessed the sensitivity of an increase in gas prices within our electricity model, BID3, and assume this applies as a standard factor in estimating increased coal consumption and increased CO2 emissions. We use the results of the sensitivity analysis to assess the benefits in terms of CO2 emissions reduction and electricity prices reduction, as a consequence of coal displacement. The electricity/gas price elasticities are shown in Table 12 below. This shows that both Iberia and France are more sensitive to gas price movements that the EU as a whole.
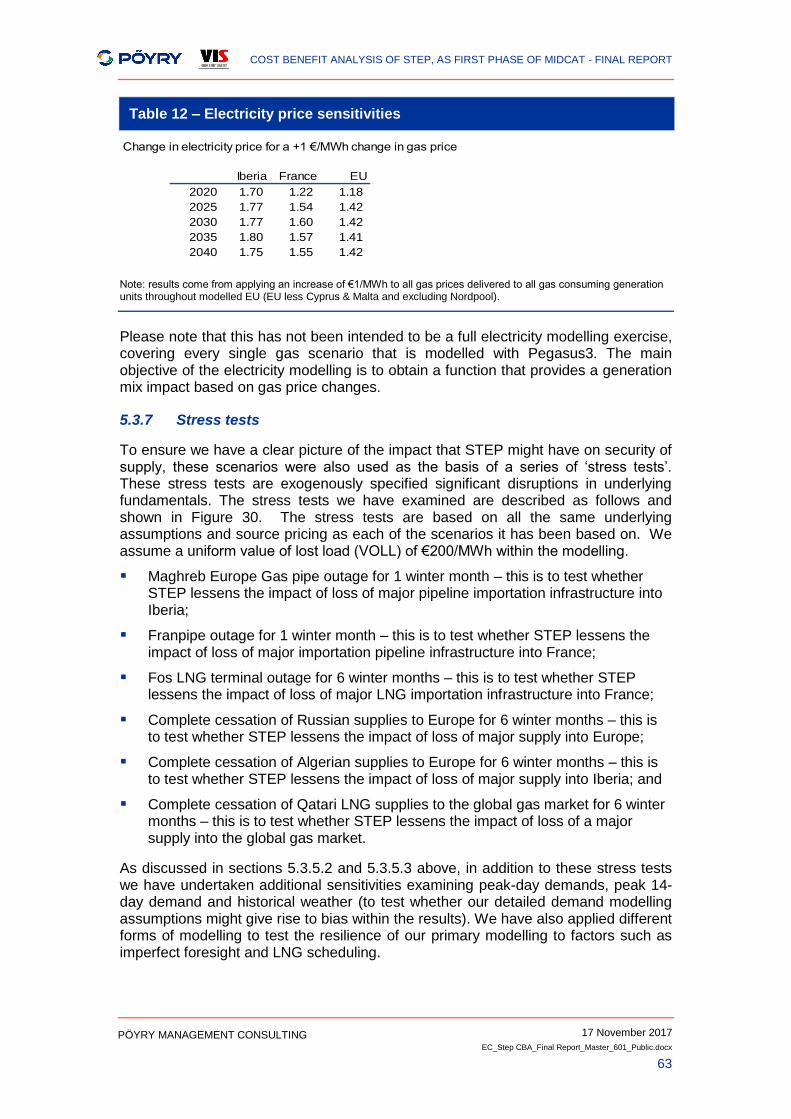
COST BENEFIT ANALYSIS OF STEP, AS FIRST PHASE OF MIDCAT - FINAL REPORT
17 November 2017
EC_Step CBA_Final Report_Master_601_Public.docx
63
PÖYRY MANAGEMENT CONSULTING
Table 12 – Electricity price sensitivities
Change in electricity price for a +1 €/MWh change in gas price
Iberia France EU
2020 1.70 1.22 1.18
2025 1.77 1.54 1.42
2030 1.77 1.60 1.42
2035 1.80 1.57 1.41
2040 1.75 1.55 1.42
Note: results come from applying an increase of €1/MWh to all gas prices delivered to all gas consuming generation units throughout modelled EU (EU less Cyprus & Malta and excluding Nordpool).
Please note that this has not been intended to be a full electricity modelling exercise, covering every single gas scenario that is modelled with Pegasus3. The main objective of the electricity modelling is to obtain a function that provides a generation mix impact based on gas price changes.
5.3.7 Stress tests
To ensure we have a clear picture of the impact that STEP might have on security of supply, these scenarios were also used as the basis of a series of ‘stress tests’. These stress tests are exogenously specified significant disruptions in underlying fundamentals. The stress tests we have examined are described as follows and shown in Figure 30. The stress tests are based on all the same underlying assumptions and source pricing as each of the scenarios it has been based on. We assume a uniform value of lost load (VOLL) of €200/MWh within the modelling.
Maghreb Europe Gas pipe outage for 1 winter month – this is to test whether STEP lessens the impact of loss of major pipeline importation infrastructure into Iberia;
Franpipe outage for 1 winter month – this is to test whether STEP lessens the impact of loss of major importation pipeline infrastructure into France;
Fos LNG terminal outage for 6 winter months – this is to test whether STEP lessens the impact of loss of major LNG importation infrastructure into France;
Complete cessation of Russian supplies to Europe for 6 winter months – this is to test whether STEP lessens the impact of loss of major supply into Europe;
Complete cessation of Algerian supplies to Europe for 6 winter months – this is to test whether STEP lessens the impact of loss of major supply into Iberia; and
Complete cessation of Qatari LNG supplies to the global gas market for 6 winter months – this is to test whether STEP lessens the impact of loss of a major supply into the global gas market.
As discussed in sections 5.3.5.2 and 5.3.5.3 above, in addition to these stress tests we have undertaken additional sensitivities examining peak-day demands, peak 14-day demand and historical weather (to test whether our detailed demand modelling assumptions might give rise to bias within the results). We have also applied different forms of modelling to test the resilience of our primary modelling to factors such as imperfect foresight and LNG scheduling.
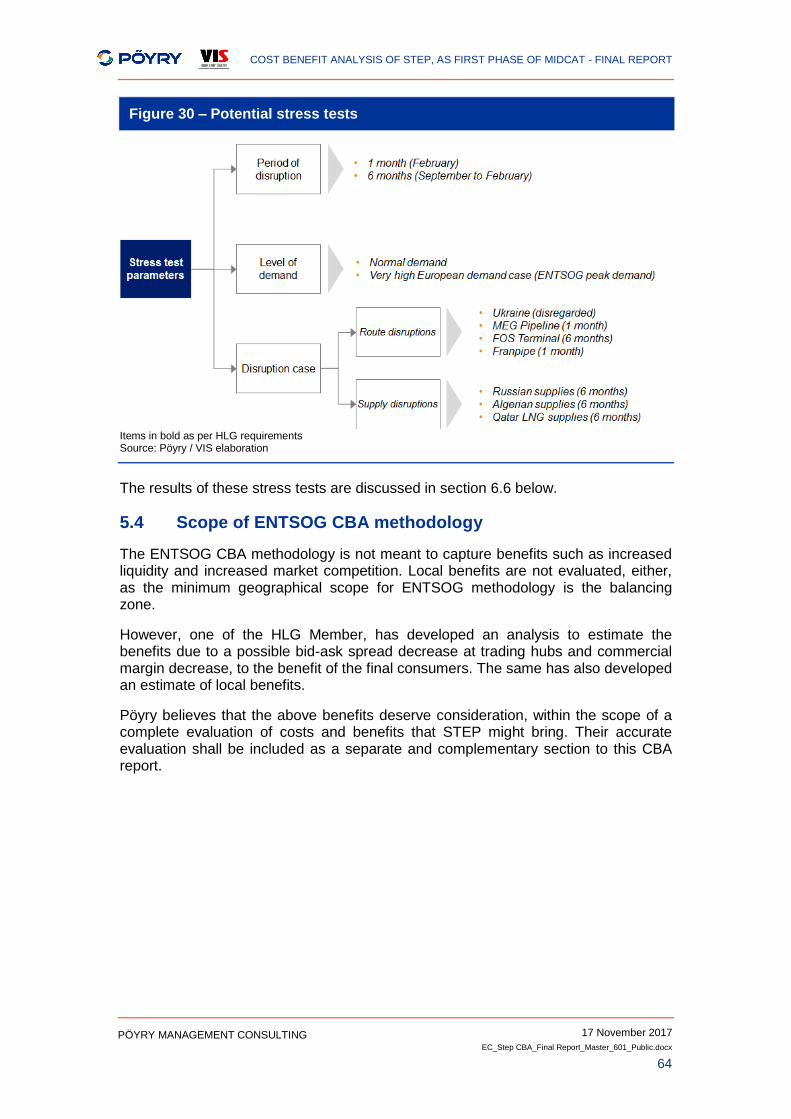
COST BENEFIT ANALYSIS OF STEP, AS FIRST PHASE OF MIDCAT - FINAL REPORT
17 November 2017
EC_Step CBA_Final Report_Master_601_Public.docx
64
PÖYRY MANAGEMENT CONSULTING
Figure 30 – Potential stress tests
Items in bold as per HLG requirements Source: Pöyry / VIS elaboration
The results of these stress tests are discussed in section 6.6 below.
5.4 Scope of ENTSOG CBA methodology
The ENTSOG CBA methodology is not meant to capture benefits such as increased liquidity and increased market competition. Local benefits are not evaluated, either, as the minimum geographical scope for ENTSOG methodology is the balancing zone.
However, one of the HLG Member, has developed an analysis to estimate the benefits due to a possible bid-ask spread decrease at trading hubs and commercial margin decrease, to the benefit of the final consumers. The same has also developed an estimate of local benefits.
Pöyry believes that the above benefits deserve consideration, within the scope of a complete evaluation of costs and benefits that STEP might bring. Their accurate evaluation shall be included as a separate and complementary section to this CBA report.

COST BENEFIT ANALYSIS OF STEP, AS FIRST PHASE OF MIDCAT - FINAL REPORT
17 November 2017
EC_Step CBA_Final Report_Master_601_Public.docx
65
PÖYRY MANAGEMENT CONSULTING

COST BENEFIT ANALYSIS OF STEP, AS FIRST PHASE OF MIDCAT - FINAL REPORT
17 November 2017
EC_Step CBA_Final Report_Master_601_Public.docx
66
PÖYRY MANAGEMENT CONSULTING
[This page is intentionally blank]
COST BENEFIT ANALYSIS OF STEP, AS FIRST PHASE OF MIDCAT - FINAL REPORT
17 November 2017
EC_Step CBA_Final Report_Master_601_Public.docx
67
PÖYRY MANAGEMENT CONSULTING
6. RESULTS OF MODELLING
This chapter presents the key outputs from the modelling. There are a number of important indicators:
the flows through STEP (i.e. the changes in flows across the Spanish/French border);
the impact on welfare (i.e. the change in the global supply bill, given that we have frozen non-European welfare); and
the impact on marginal (i.e. wholesale market) prices in each zone.
In addition to this, within the stress tests, we examine whether STEP has any impact on volumes of unserved energy.
Prior to presenting these indicators, it is useful to provide an overview of the patterns of supply observed in the scenarios (specified in Table 9 and outlined in Table 13 below). To this end, we present flow data at annual resolution for the modelled years, aggregated by supply categorisation, in sections 6.1, 6.2, and 6.3. Marginal prices are presented at monthly resolution. Some more detailed results and summary discussion are provided in Annex A.
Table 13 – Scenarios summary
Scenario Description
Blue Transition ENTSOG Blue Transition (high) demand; Pöyry Central supply assumptions
Blue Transition Competitive LNG ENTSOG Green Revolution (low) demand; Pöyry Central supply assumptions, etc. although with LNG supplies competing with pipelines supplies at a 15 €/MWh advantage
Green Revolution ENTSOG Green Revolution (low) demand; Pöyry Central supply assumptions, etc.
Green Rev / LNG+5 As per Green revolution, but with LNG supplies’ costs increased by 5 €/MWh
Green Rev / LNG+5 / OIES Alg As per Green revolution, but with LNG supplies’ costs increased by 5 €/MWh, and low Algerian export capability
Green Rev / LNG+10 / OIES Alg As per Green revolution, but with LNG supplies’ costs increased by 10 €/MWh, and low Algerian export capability
An additional scenario, where LNG is priced very competitively against pipeline supplies to Europe (where an additional €15/MWh differential between LNG and pipeline is introduced) has also been assessed.
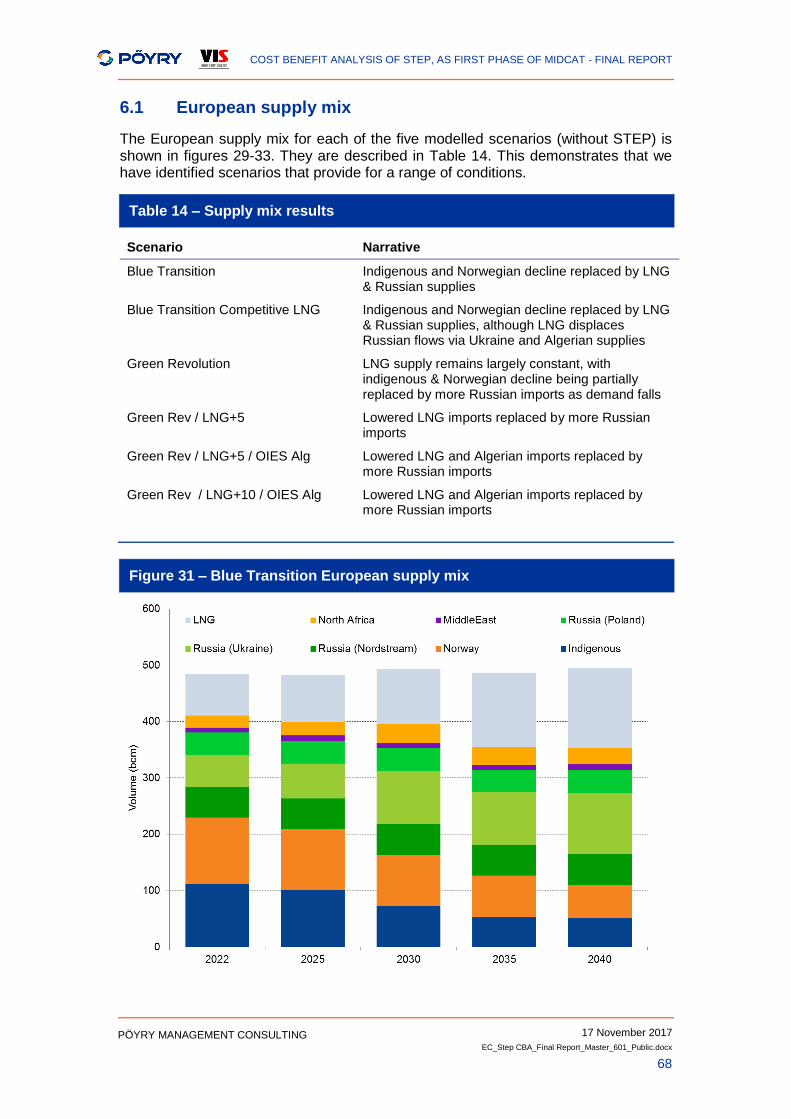
COST BENEFIT ANALYSIS OF STEP, AS FIRST PHASE OF MIDCAT - FINAL REPORT
17 November 2017
EC_Step CBA_Final Report_Master_601_Public.docx
68
PÖYRY MANAGEMENT CONSULTING
6.1 European supply mix
The European supply mix for each of the five modelled scenarios (without STEP) is shown in figures 29-33. They are described in Table 14. This demonstrates that we have identified scenarios that provide for a range of conditions.
Table 14 – Supply mix results
Scenario Narrative
Blue Transition Indigenous and Norwegian decline replaced by LNG & Russian supplies
Blue Transition Competitive LNG Indigenous and Norwegian decline replaced by LNG & Russian supplies, although LNG displaces Russian flows via Ukraine and Algerian supplies
Green Revolution LNG supply remains largely constant, with indigenous & Norwegian decline being partially replaced by more Russian imports as demand falls
Green Rev / LNG+5 Lowered LNG imports replaced by more Russian imports
Green Rev / LNG+5 / OIES Alg Lowered LNG and Algerian imports replaced by more Russian imports
Green Rev / LNG+10 / OIES Alg Lowered LNG and Algerian imports replaced by more Russian imports
Figure 31 – Blue Transition European supply mix
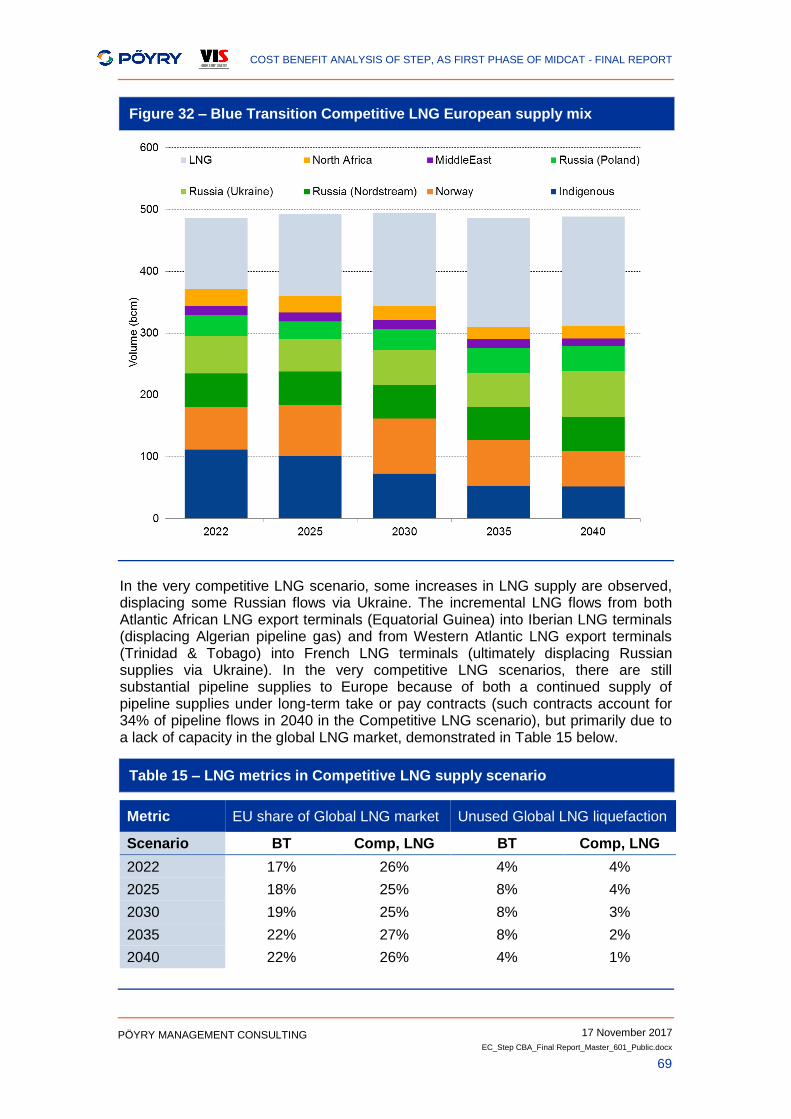
COST BENEFIT ANALYSIS OF STEP, AS FIRST PHASE OF MIDCAT - FINAL REPORT
17 November 2017
EC_Step CBA_Final Report_Master_601_Public.docx
69
PÖYRY MANAGEMENT CONSULTING
Figure 32 – Blue Transition Competitive LNG European supply mix
In the very competitive LNG scenario, some increases in LNG supply are observed, displacing some Russian flows via Ukraine. The incremental LNG flows from both Atlantic African LNG export terminals (Equatorial Guinea) into Iberian LNG terminals (displacing Algerian pipeline gas) and from Western Atlantic LNG export terminals (Trinidad & Tobago) into French LNG terminals (ultimately displacing Russian supplies via Ukraine). In the very competitive LNG scenarios, there are still substantial pipeline supplies to Europe because of both a continued supply of pipeline supplies under long-term take or pay contracts (such contracts account for 34% of pipeline flows in 2040 in the Competitive LNG scenario), but primarily due to a lack of capacity in the global LNG market, demonstrated in Table 15 below.
Table 15 – LNG metrics in Competitive LNG supply scenario
Metric EU share of Global LNG market Unused Global LNG liquefaction
Scenario BT Comp, LNG BT Comp, LNG
2022 17% 26% 4% 4%
2025 18% 25% 8% 4%
2030 19% 25% 8% 3%
2035 22% 27% 8% 2%
2040 22% 26% 4% 1%
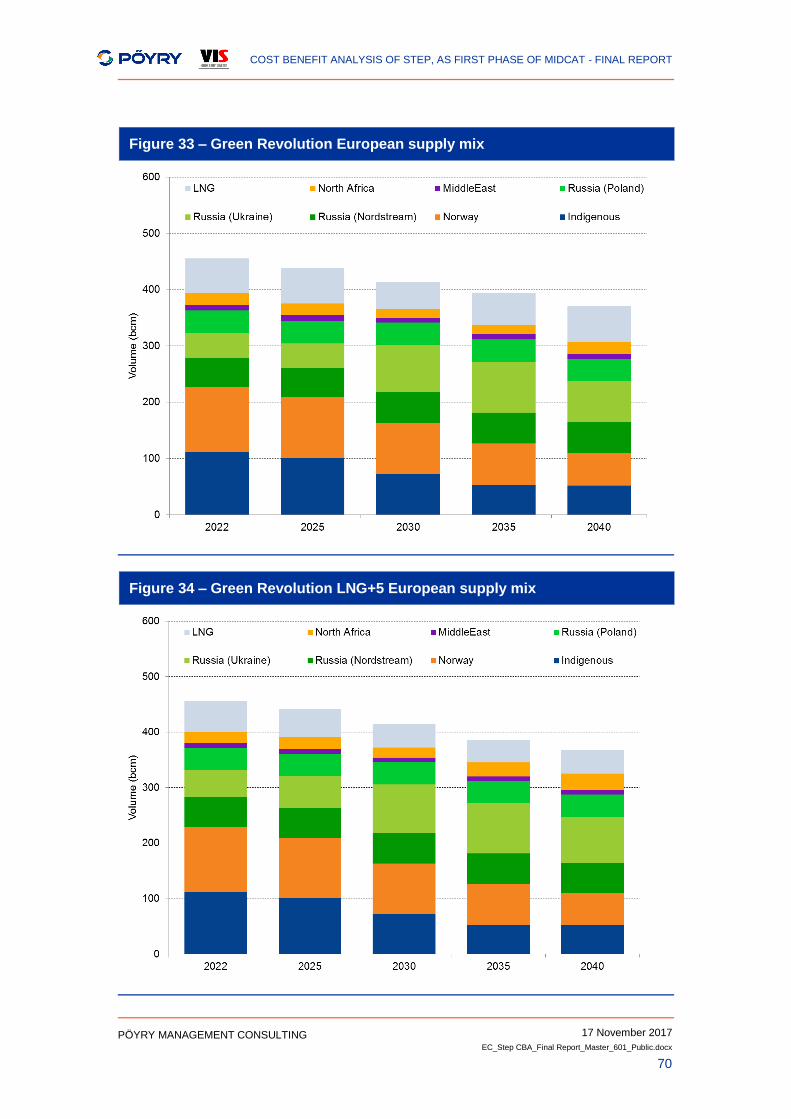
COST BENEFIT ANALYSIS OF STEP, AS FIRST PHASE OF MIDCAT - FINAL REPORT
17 November 2017
EC_Step CBA_Final Report_Master_601_Public.docx
70
PÖYRY MANAGEMENT CONSULTING
Figure 33 – Green Revolution European supply mix
Figure 34 – Green Revolution LNG+5 European supply mix
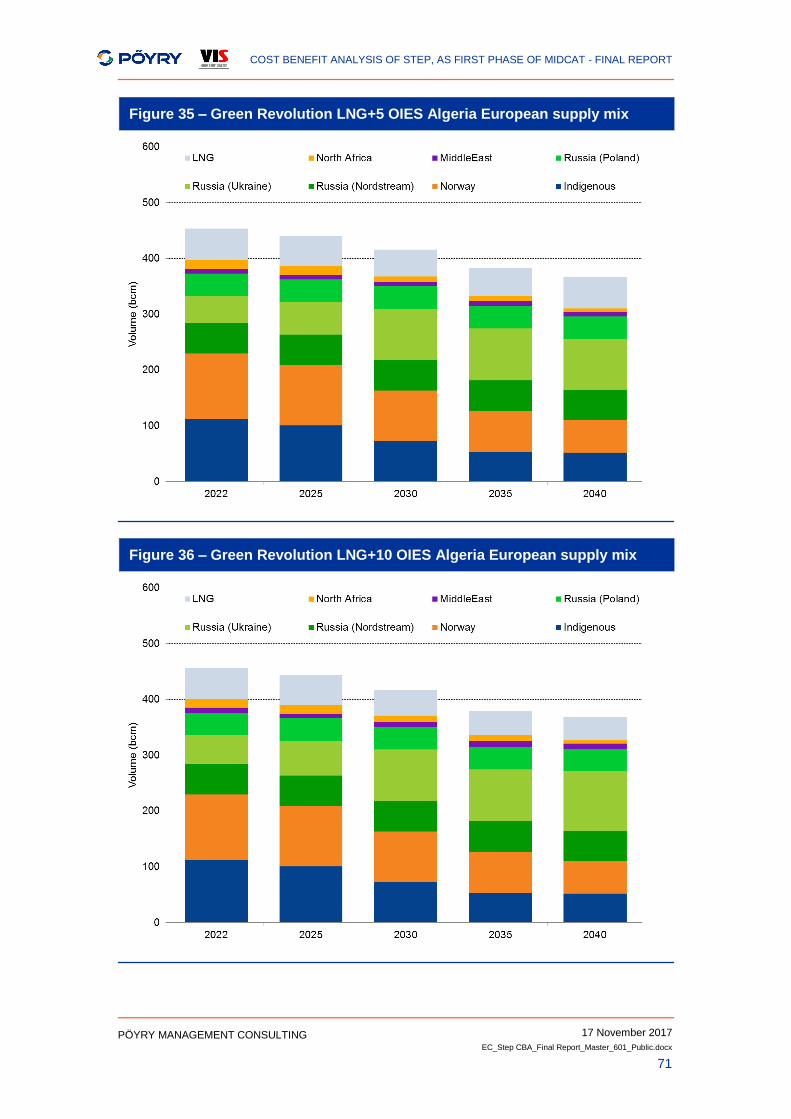
COST BENEFIT ANALYSIS OF STEP, AS FIRST PHASE OF MIDCAT - FINAL REPORT
17 November 2017
EC_Step CBA_Final Report_Master_601_Public.docx
71
PÖYRY MANAGEMENT CONSULTING
Figure 35 – Green Revolution LNG+5 OIES Algeria European supply mix
Figure 36 – Green Revolution LNG+10 OIES Algeria European supply mix
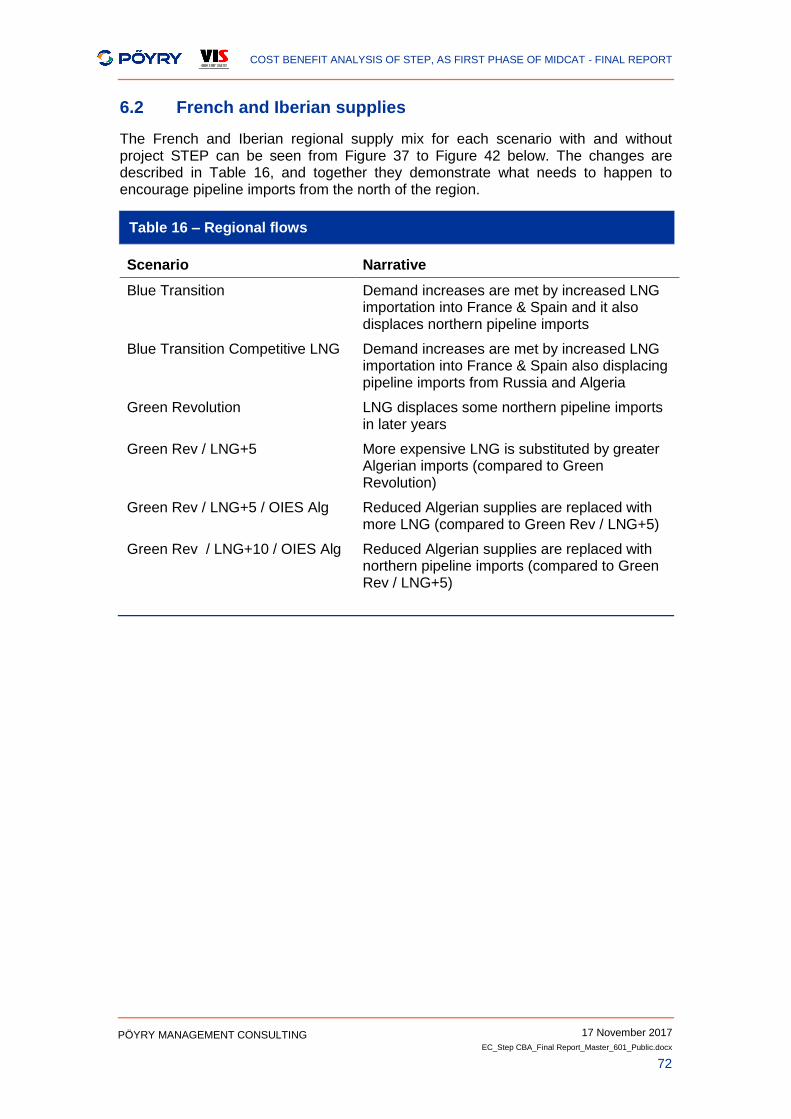
COST BENEFIT ANALYSIS OF STEP, AS FIRST PHASE OF MIDCAT - FINAL REPORT
17 November 2017
EC_Step CBA_Final Report_Master_601_Public.docx
72
PÖYRY MANAGEMENT CONSULTING
6.2 French and Iberian supplies
The French and Iberian regional supply mix for each scenario with and without project STEP can be seen from Figure 37 to Figure 42 below. The changes are described in Table 16, and together they demonstrate what needs to happen to encourage pipeline imports from the north of the region.
Table 16 – Regional flows
Scenario Narrative
Blue Transition Demand increases are met by increased LNG importation into France & Spain and it also displaces northern pipeline imports
Blue Transition Competitive LNG Demand increases are met by increased LNG importation into France & Spain also displacing pipeline imports from Russia and Algeria
Green Revolution LNG displaces some northern pipeline imports in later years
Green Rev / LNG+5 More expensive LNG is substituted by greater Algerian imports (compared to Green Revolution)
Green Rev / LNG+5 / OIES Alg Reduced Algerian supplies are replaced with more LNG (compared to Green Rev / LNG+5)
Green Rev / LNG+10 / OIES Alg Reduced Algerian supplies are replaced with northern pipeline imports (compared to Green Rev / LNG+5)
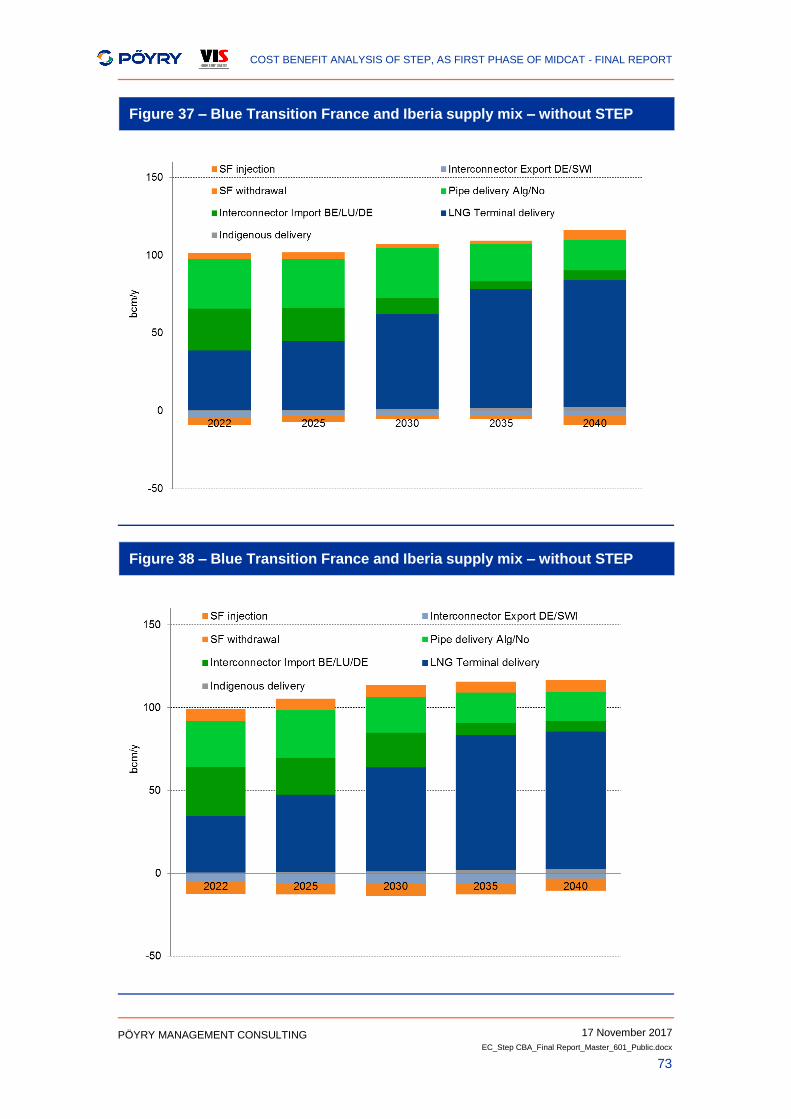
COST BENEFIT ANALYSIS OF STEP, AS FIRST PHASE OF MIDCAT - FINAL REPORT
17 November 2017
EC_Step CBA_Final Report_Master_601_Public.docx
73
PÖYRY MANAGEMENT CONSULTING
Figure 37 – Blue Transition France and Iberia supply mix – without STEP
Figure 38 – Blue Transition France and Iberia supply mix – without STEP
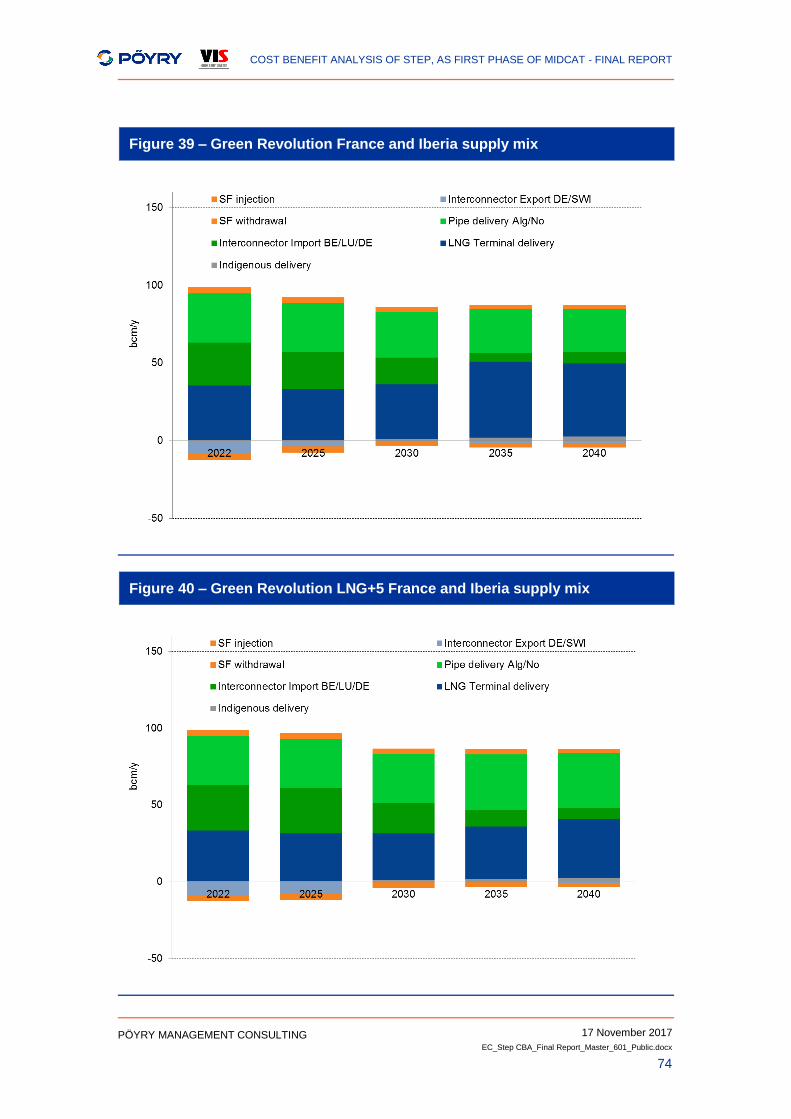
COST BENEFIT ANALYSIS OF STEP, AS FIRST PHASE OF MIDCAT - FINAL REPORT
17 November 2017
EC_Step CBA_Final Report_Master_601_Public.docx
74
PÖYRY MANAGEMENT CONSULTING
Figure 39 – Green Revolution France and Iberia supply mix
Figure 40 – Green Revolution LNG+5 France and Iberia supply mix
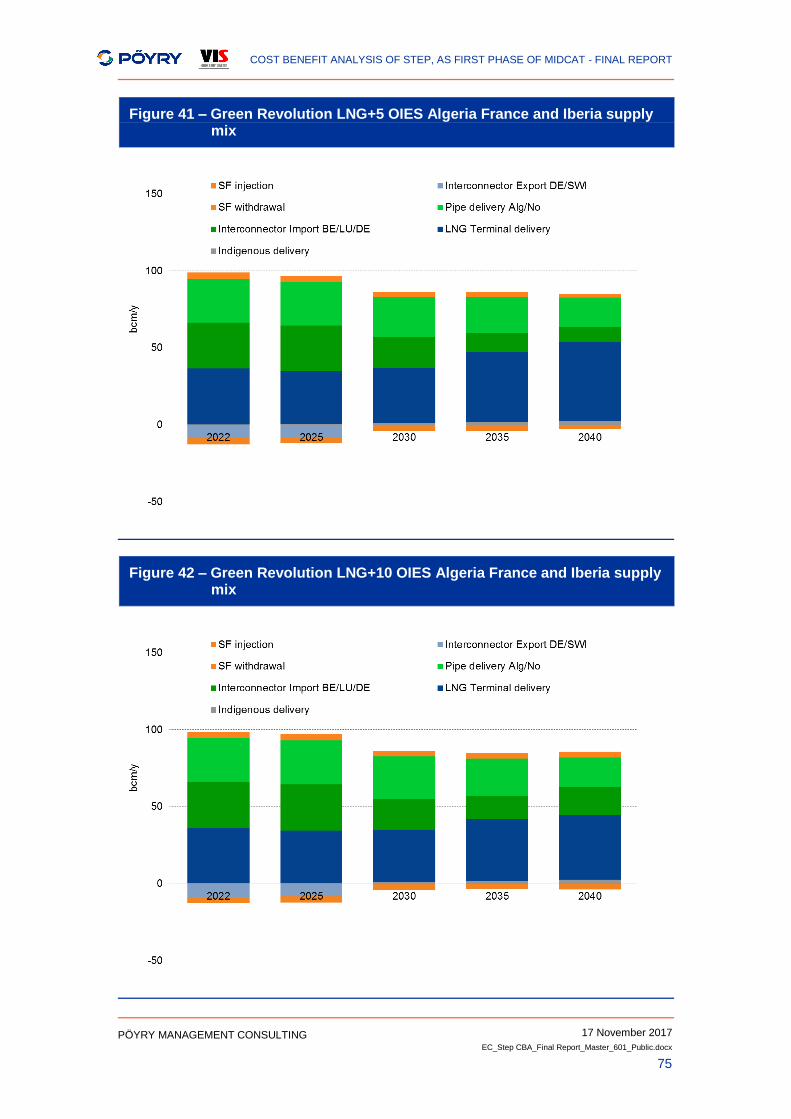
COST BENEFIT ANALYSIS OF STEP, AS FIRST PHASE OF MIDCAT - FINAL REPORT
17 November 2017
EC_Step CBA_Final Report_Master_601_Public.docx
75
PÖYRY MANAGEMENT CONSULTING
Figure 41 – Green Revolution LNG+5 OIES Algeria France and Iberia supply mix
Figure 42 – Green Revolution LNG+10 OIES Algeria France and Iberia supply mix
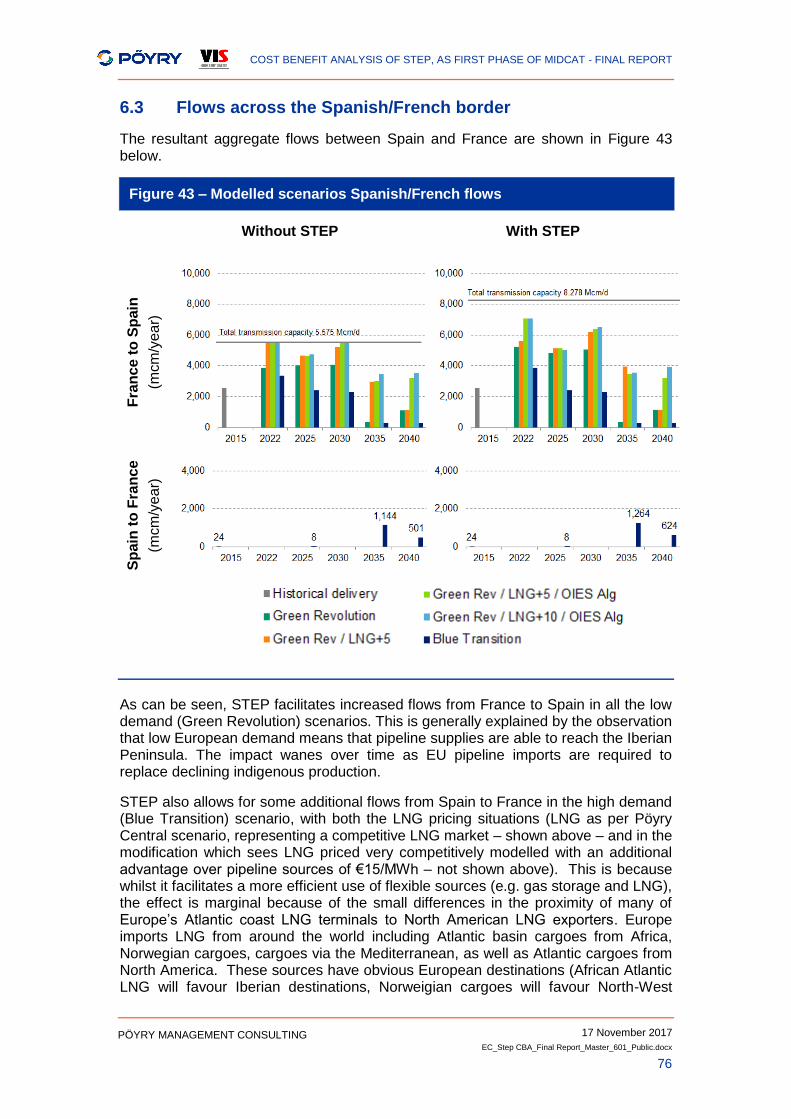
COST BENEFIT ANALYSIS OF STEP, AS FIRST PHASE OF MIDCAT - FINAL REPORT
17 November 2017
EC_Step CBA_Final Report_Master_601_Public.docx
76
PÖYRY MANAGEMENT CONSULTING
6.3 Flows across the Spanish/French border
The resultant aggregate flows between Spain and France are shown in Figure 43 below.
Figure 43 – Modelled scenarios Spanish/French flows
Without STEP With STEP
Fra
nc
e t
o S
pain
(mcm
/ye
ar)
Sp
ain
to
Fra
nc
e
(mcm
/ye
ar)
As can be seen, STEP facilitates increased flows from France to Spain in all the low demand (Green Revolution) scenarios. This is generally explained by the observation that low European demand means that pipeline supplies are able to reach the Iberian Peninsula. The impact wanes over time as EU pipeline imports are required to replace declining indigenous production.
STEP also allows for some additional flows from Spain to France in the high demand (Blue Transition) scenario, with both the LNG pricing situations (LNG as per Pöyry Central scenario, representing a competitive LNG market – shown above – and in the modification which sees LNG priced very competitively modelled with an additional advantage over pipeline sources of €15/MWh – not shown above). This is because whilst it facilitates a more efficient use of flexible sources (e.g. gas storage and LNG), the effect is marginal because of the small differences in the proximity of many of Europe’s Atlantic coast LNG terminals to North American LNG exporters. Europe imports LNG from around the world including Atlantic basin cargoes from Africa, Norwegian cargoes, cargoes via the Mediterranean, as well as Atlantic cargoes from North America. These sources have obvious European destinations (African Atlantic LNG will favour Iberian destinations, Norweigian cargoes will favour North-West
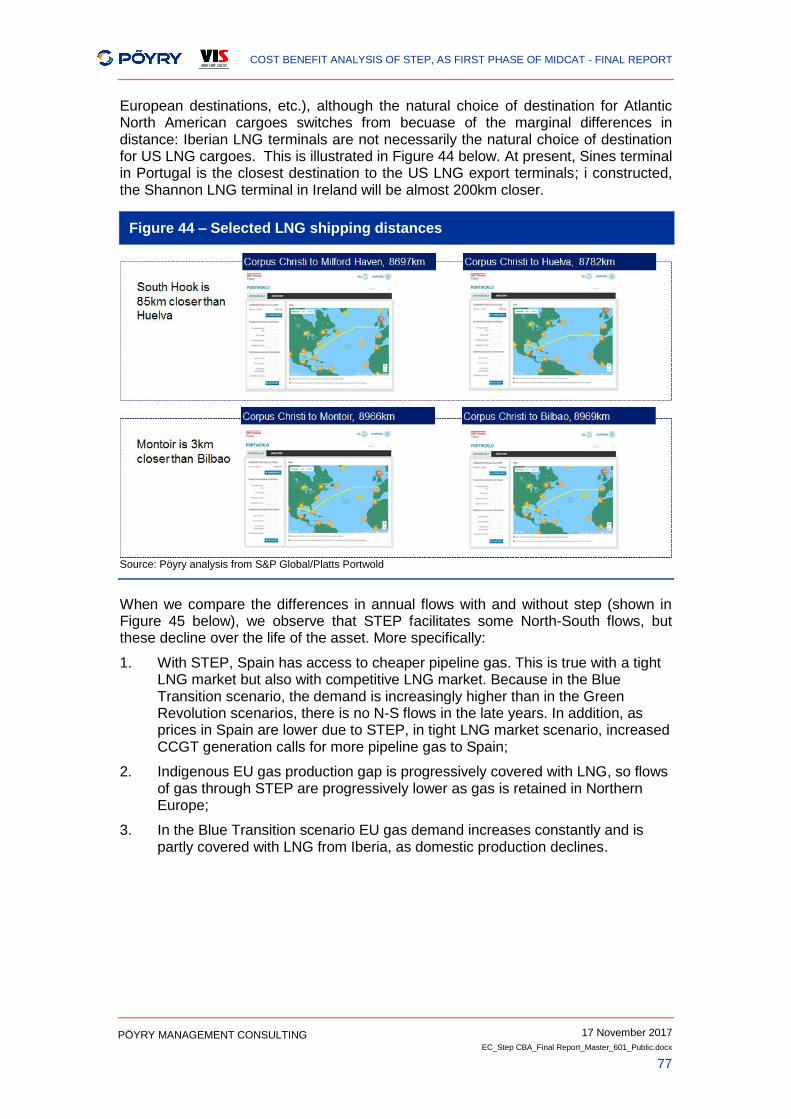
COST BENEFIT ANALYSIS OF STEP, AS FIRST PHASE OF MIDCAT - FINAL REPORT
17 November 2017
EC_Step CBA_Final Report_Master_601_Public.docx
77
PÖYRY MANAGEMENT CONSULTING
European destinations, etc.), although the natural choice of destination for Atlantic North American cargoes switches from becuase of the marginal differences in distance: Iberian LNG terminals are not necessarily the natural choice of destination for US LNG cargoes. This is illustrated in Figure 44 below. At present, Sines terminal in Portugal is the closest destination to the US LNG export terminals; i constructed, the Shannon LNG terminal in Ireland will be almost 200km closer.
Figure 44 – Selected LNG shipping distances
Source: Pöyry analysis from S&P Global/Platts Portwold
When we compare the differences in annual flows with and without step (shown in Figure 45 below), we observe that STEP facilitates some North-South flows, but these decline over the life of the asset. More specifically:
1. With STEP, Spain has access to cheaper pipeline gas. This is true with a tight LNG market but also with competitive LNG market. Because in the Blue Transition scenario, the demand is increasingly higher than in the Green Revolution scenarios, there is no N-S flows in the late years. In addition, as prices in Spain are lower due to STEP, in tight LNG market scenario, increased CCGT generation calls for more pipeline gas to Spain;
2. Indigenous EU gas production gap is progressively covered with LNG, so flows of gas through STEP are progressively lower as gas is retained in Northern Europe;
3. In the Blue Transition scenario EU gas demand increases constantly and is partly covered with LNG from Iberia, as domestic production declines.
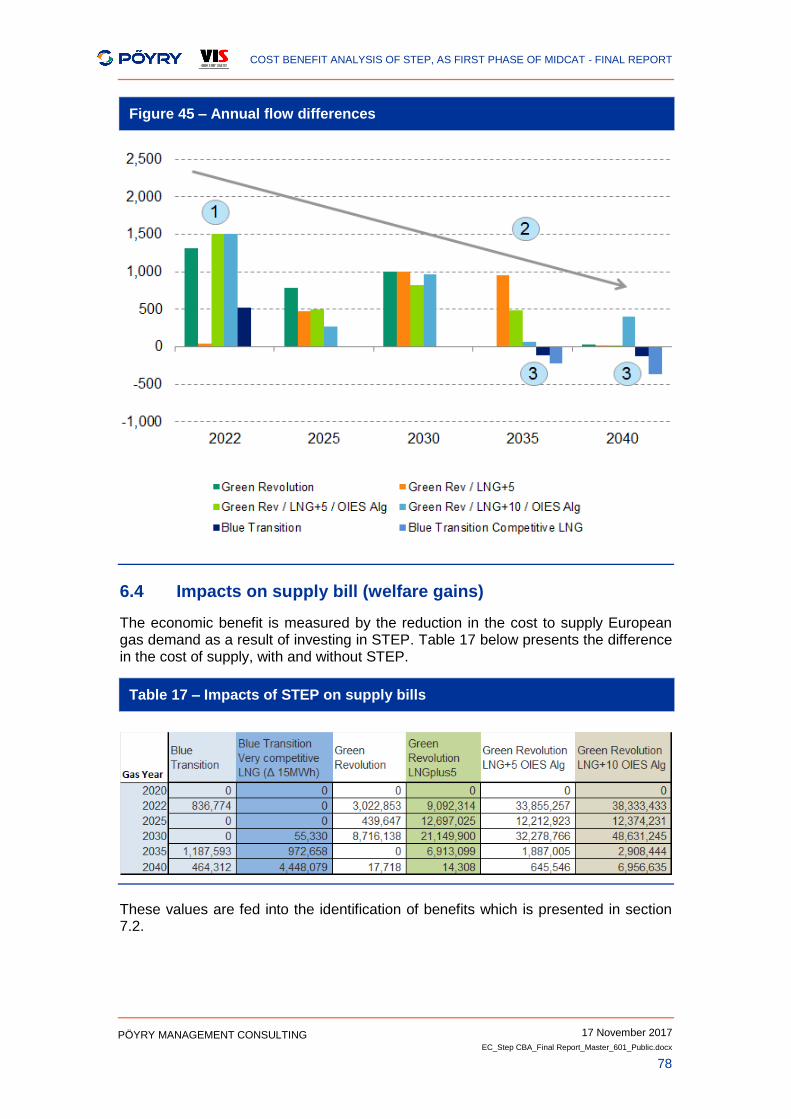
COST BENEFIT ANALYSIS OF STEP, AS FIRST PHASE OF MIDCAT - FINAL REPORT
17 November 2017
EC_Step CBA_Final Report_Master_601_Public.docx
78
PÖYRY MANAGEMENT CONSULTING
Figure 45 – Annual flow differences
6.4 Impacts on supply bill (welfare gains)
The economic benefit is measured by the reduction in the cost to supply European gas demand as a result of investing in STEP. Table 17 below presents the difference in the cost of supply, with and without STEP.
Table 17 – Impacts of STEP on supply bills
These values are fed into the identification of benefits which is presented in section 7.2.
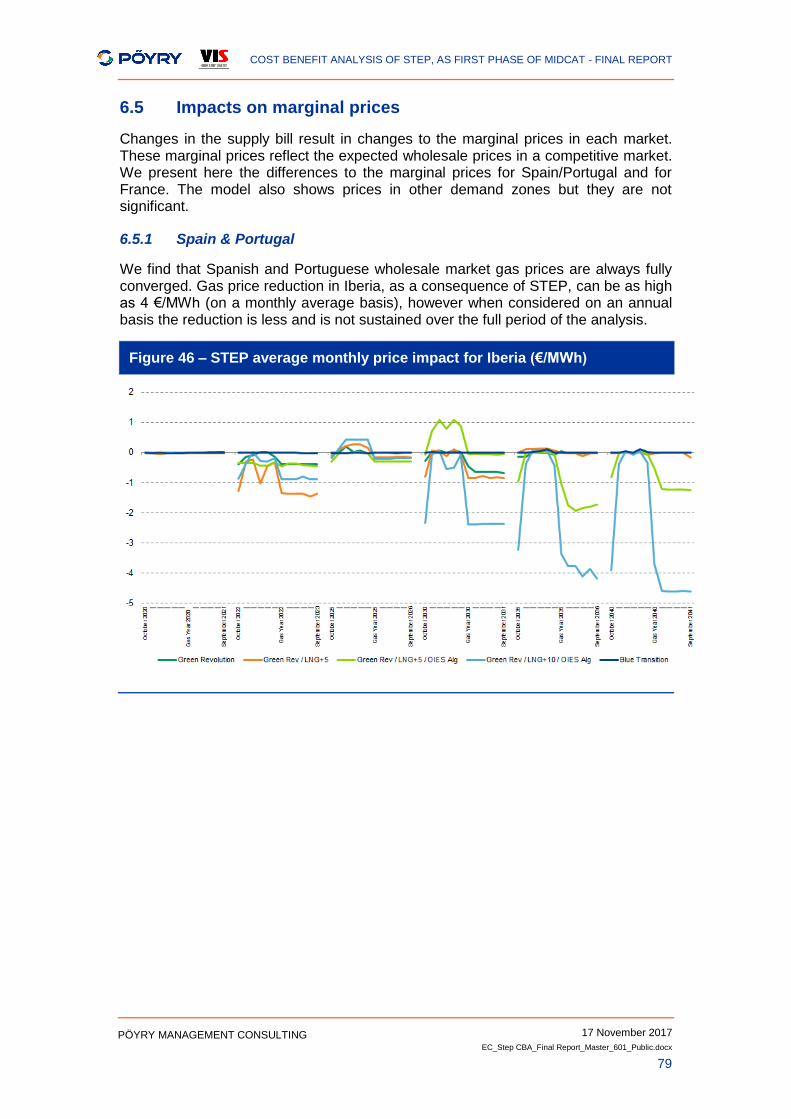
COST BENEFIT ANALYSIS OF STEP, AS FIRST PHASE OF MIDCAT - FINAL REPORT
17 November 2017
EC_Step CBA_Final Report_Master_601_Public.docx
79
PÖYRY MANAGEMENT CONSULTING
6.5 Impacts on marginal prices
Changes in the supply bill result in changes to the marginal prices in each market. These marginal prices reflect the expected wholesale prices in a competitive market. We present here the differences to the marginal prices for Spain/Portugal and for France. The model also shows prices in other demand zones but they are not significant.
6.5.1 Spain & Portugal
We find that Spanish and Portuguese wholesale market gas prices are always fully converged. Gas price reduction in Iberia, as a consequence of STEP, can be as high as 4 €/MWh (on a monthly average basis), however when considered on an annual basis the reduction is less and is not sustained over the full period of the analysis.
Figure 46 – STEP average monthly price impact for Iberia (€/MWh)
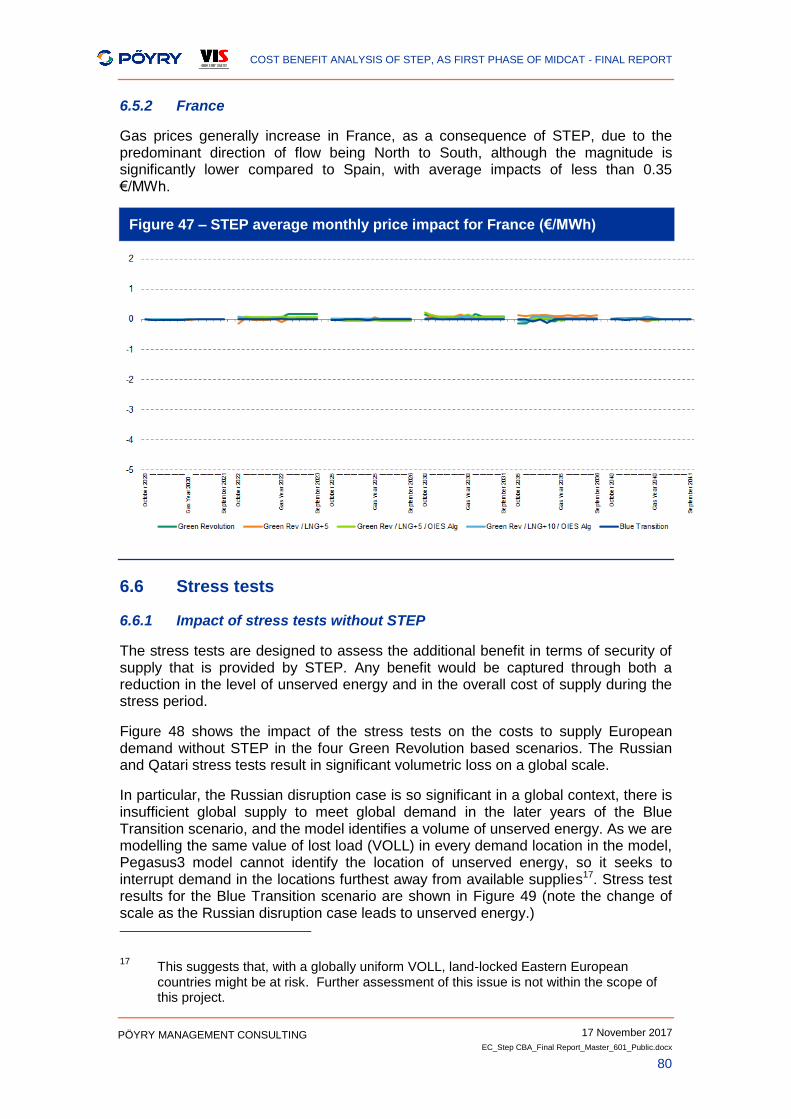
COST BENEFIT ANALYSIS OF STEP, AS FIRST PHASE OF MIDCAT - FINAL REPORT
17 November 2017
EC_Step CBA_Final Report_Master_601_Public.docx
80
PÖYRY MANAGEMENT CONSULTING
6.5.2 France
Gas prices generally increase in France, as a consequence of STEP, due to the predominant direction of flow being North to South, although the magnitude is significantly lower compared to Spain, with average impacts of less than 0.35 €/MWh.
Figure 47 – STEP average monthly price impact for France (€/MWh)
6.6 Stress tests
6.6.1 Impact of stress tests without STEP
The stress tests are designed to assess the additional benefit in terms of security of supply that is provided by STEP. Any benefit would be captured through both a reduction in the level of unserved energy and in the overall cost of supply during the stress period.
Figure 48 shows the impact of the stress tests on the costs to supply European demand without STEP in the four Green Revolution based scenarios. The Russian and Qatari stress tests result in significant volumetric loss on a global scale.
In particular, the Russian disruption case is so significant in a global context, there is insufficient global supply to meet global demand in the later years of the Blue Transition scenario, and the model identifies a volume of unserved energy. As we are modelling the same value of lost load (VOLL) in every demand location in the model, Pegasus3 model cannot identify the location of unserved energy, so it seeks to interrupt demand in the locations furthest away from available supplies17. Stress test results for the Blue Transition scenario are shown in Figure 49 (note the change of scale as the Russian disruption case leads to unserved energy.) 17
This suggests that, with a globally uniform VOLL, land-locked Eastern European countries might be at risk. Further assessment of this issue is not within the scope of this project.
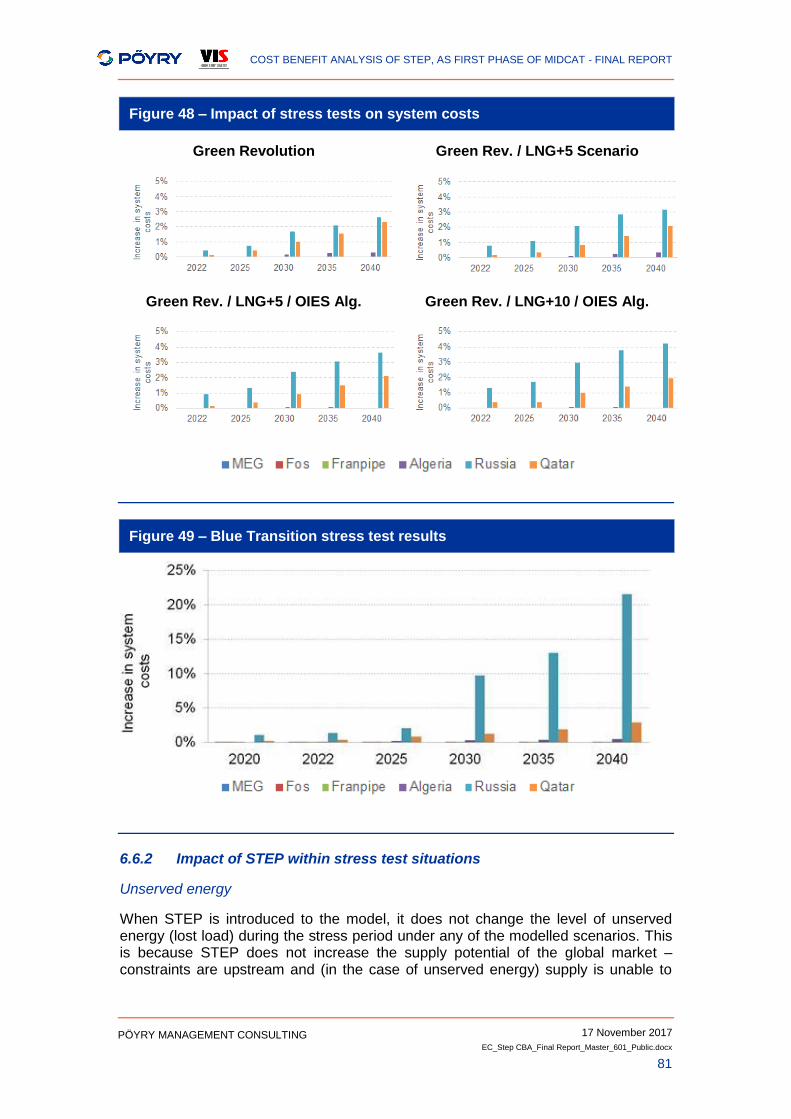
COST BENEFIT ANALYSIS OF STEP, AS FIRST PHASE OF MIDCAT - FINAL REPORT
17 November 2017
EC_Step CBA_Final Report_Master_601_Public.docx
81
PÖYRY MANAGEMENT CONSULTING
Figure 48 – Impact of stress tests on system costs
Green Revolution Green Rev. / LNG+5 Scenario
Green Rev. / LNG+5 / OIES Alg. Green Rev. / LNG+10 / OIES Alg.
Figure 49 – Blue Transition stress test results
6.6.2 Impact of STEP within stress test situations
Unserved energy
When STEP is introduced to the model, it does not change the level of unserved energy (lost load) during the stress period under any of the modelled scenarios. This is because STEP does not increase the supply potential of the global market – constraints are upstream and (in the case of unserved energy) supply is unable to
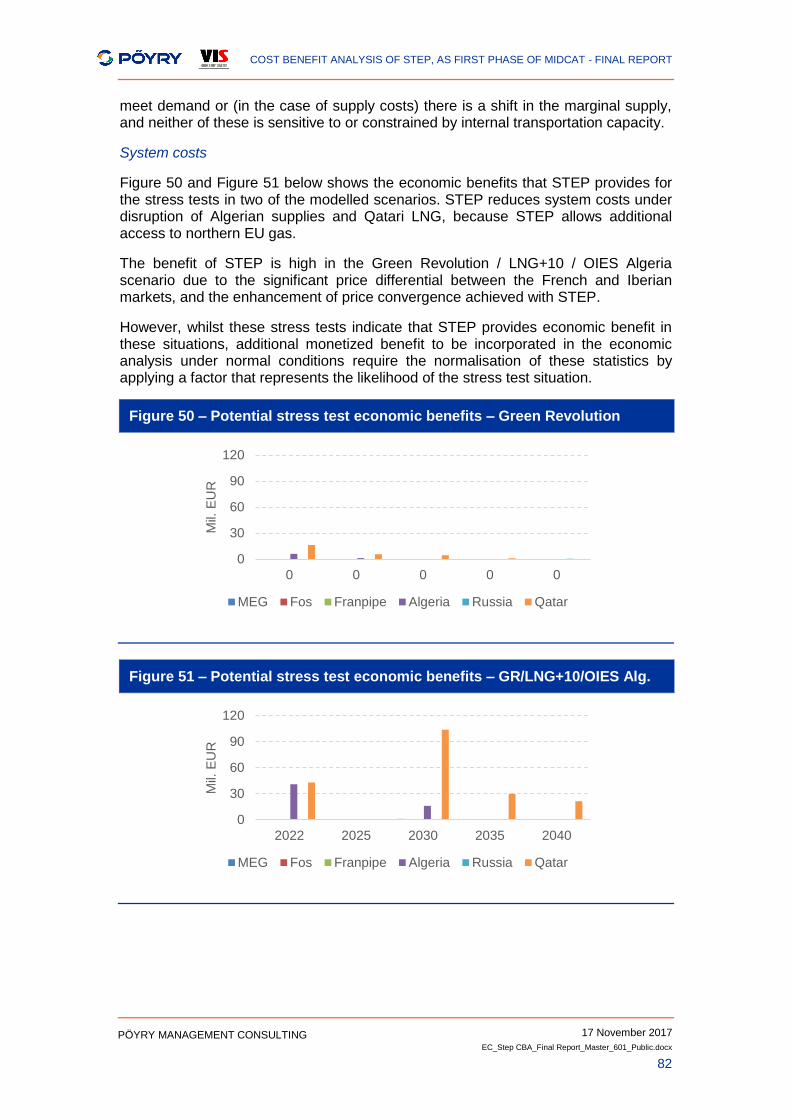
COST BENEFIT ANALYSIS OF STEP, AS FIRST PHASE OF MIDCAT - FINAL REPORT
17 November 2017
EC_Step CBA_Final Report_Master_601_Public.docx
82
PÖYRY MANAGEMENT CONSULTING
meet demand or (in the case of supply costs) there is a shift in the marginal supply, and neither of these is sensitive to or constrained by internal transportation capacity.
System costs
Figure 50 and Figure 51 below shows the economic benefits that STEP provides for the stress tests in two of the modelled scenarios. STEP reduces system costs under disruption of Algerian supplies and Qatari LNG, because STEP allows additional access to northern EU gas.
The benefit of STEP is high in the Green Revolution / LNG+10 / OIES Algeria scenario due to the significant price differential between the French and Iberian markets, and the enhancement of price convergence achieved with STEP.
However, whilst these stress tests indicate that STEP provides economic benefit in these situations, additional monetized benefit to be incorporated in the economic analysis under normal conditions require the normalisation of these statistics by applying a factor that represents the likelihood of the stress test situation.
Figure 50 – Potential stress test economic benefits – Green Revolution
Figure 51 – Potential stress test economic benefits – GR/LNG+10/OIES Alg.
0
30
60
90
120
0 0 0 0 0
Mil.
EU
R
MEG Fos Franpipe Algeria Russia Qatar
0
30
60
90
120
2022 2025 2030 2035 2040
Mil.
EU
R
MEG Fos Franpipe Algeria Russia Qatar
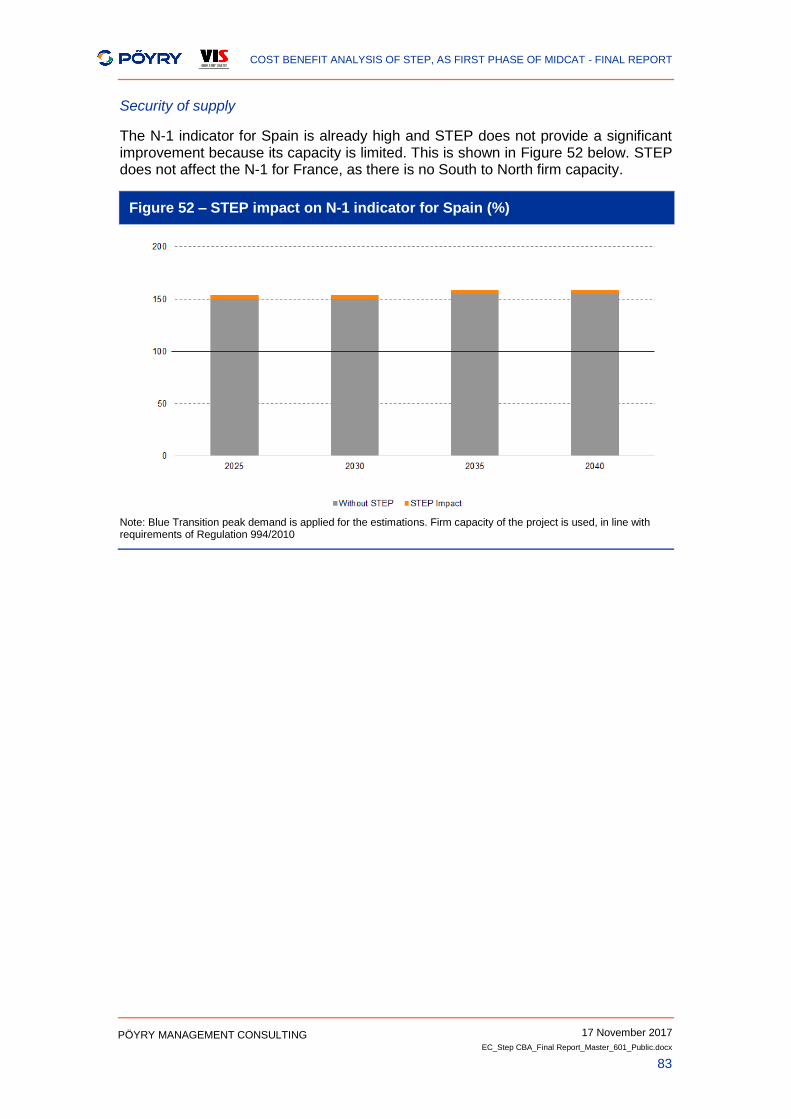
COST BENEFIT ANALYSIS OF STEP, AS FIRST PHASE OF MIDCAT - FINAL REPORT
17 November 2017
EC_Step CBA_Final Report_Master_601_Public.docx
83
PÖYRY MANAGEMENT CONSULTING
Security of supply
The N-1 indicator for Spain is already high and STEP does not provide a significant improvement because its capacity is limited. This is shown in Figure 52 below. STEP does not affect the N-1 for France, as there is no South to North firm capacity.
Figure 52 – STEP impact on N-1 indicator for Spain (%)
Note: Blue Transition peak demand is applied for the estimations. Firm capacity of the project is used, in line with requirements of Regulation 994/2010
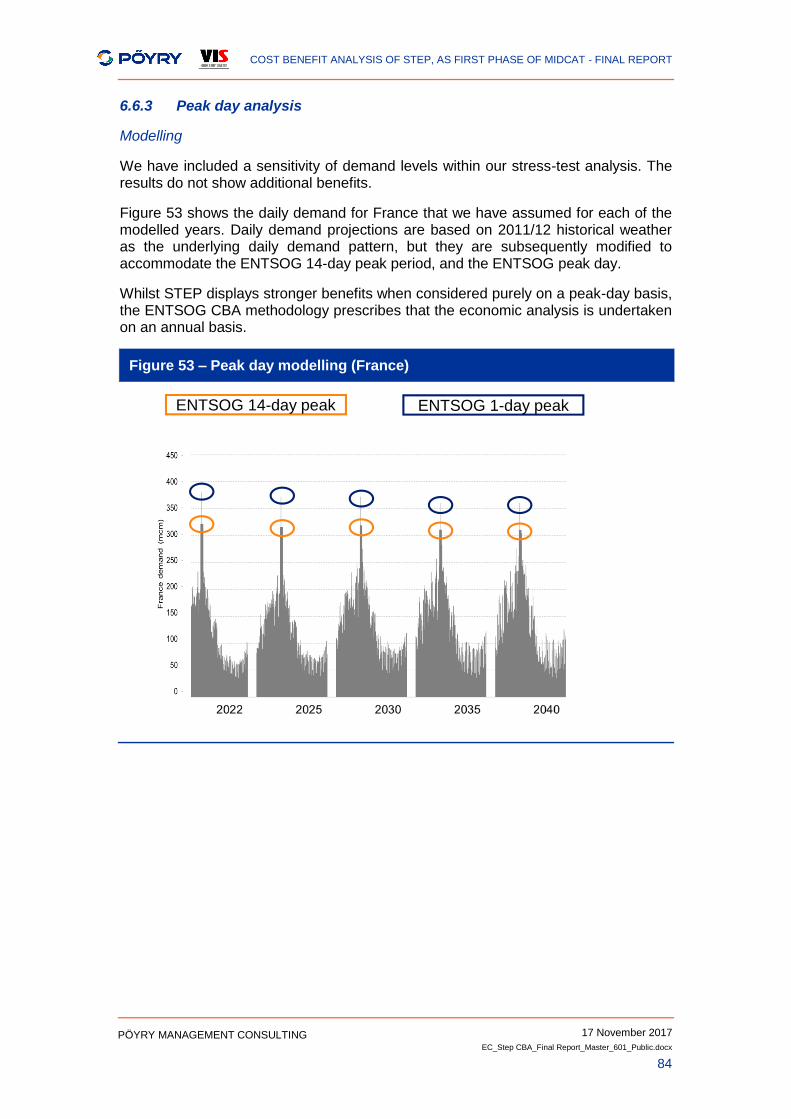
COST BENEFIT ANALYSIS OF STEP, AS FIRST PHASE OF MIDCAT - FINAL REPORT
17 November 2017
EC_Step CBA_Final Report_Master_601_Public.docx
84
PÖYRY MANAGEMENT CONSULTING
6.6.3 Peak day analysis
Modelling
We have included a sensitivity of demand levels within our stress-test analysis. The results do not show additional benefits.
Figure 53 shows the daily demand for France that we have assumed for each of the modelled years. Daily demand projections are based on 2011/12 historical weather as the underlying daily demand pattern, but they are subsequently modified to accommodate the ENTSOG 14-day peak period, and the ENTSOG peak day.
Whilst STEP displays stronger benefits when considered purely on a peak-day basis, the ENTSOG CBA methodology prescribes that the economic analysis is undertaken on an annual basis.
Figure 53 – Peak day modelling (France)
ENTSOG 14-day peak ENTSOG 1-day peak
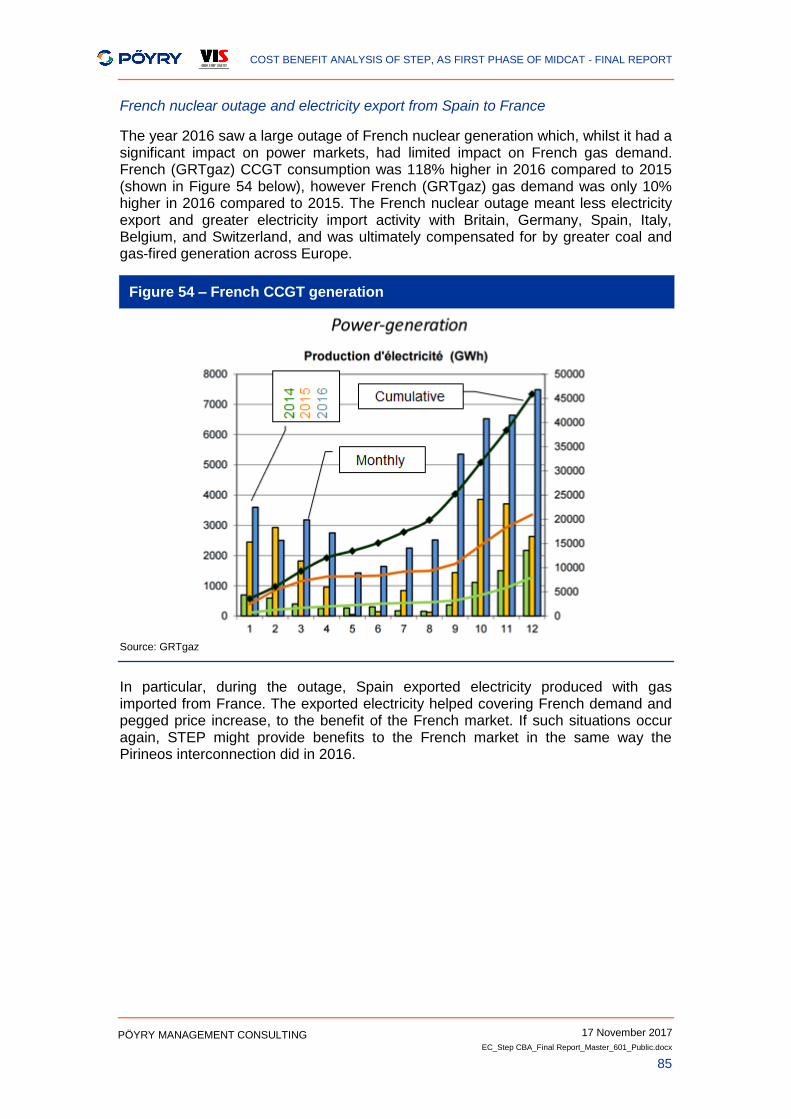
COST BENEFIT ANALYSIS OF STEP, AS FIRST PHASE OF MIDCAT - FINAL REPORT
17 November 2017
EC_Step CBA_Final Report_Master_601_Public.docx
85
PÖYRY MANAGEMENT CONSULTING
French nuclear outage and electricity export from Spain to France
The year 2016 saw a large outage of French nuclear generation which, whilst it had a significant impact on power markets, had limited impact on French gas demand. French (GRTgaz) CCGT consumption was 118% higher in 2016 compared to 2015 (shown in Figure 54 below), however French (GRTgaz) gas demand was only 10% higher in 2016 compared to 2015. The French nuclear outage meant less electricity export and greater electricity import activity with Britain, Germany, Spain, Italy, Belgium, and Switzerland, and was ultimately compensated for by greater coal and gas-fired generation across Europe.
Figure 54 – French CCGT generation
Source: GRTgaz
In particular, during the outage, Spain exported electricity produced with gas imported from France. The exported electricity helped covering French demand and pegged price increase, to the benefit of the French market. If such situations occur again, STEP might provide benefits to the French market in the same way the Pirineos interconnection did in 2016.

COST BENEFIT ANALYSIS OF STEP, AS FIRST PHASE OF MIDCAT - FINAL REPORT
17 November 2017
EC_Step CBA_Final Report_Master_601_Public.docx
86
PÖYRY MANAGEMENT CONSULTING
[This page is intentionally blank]
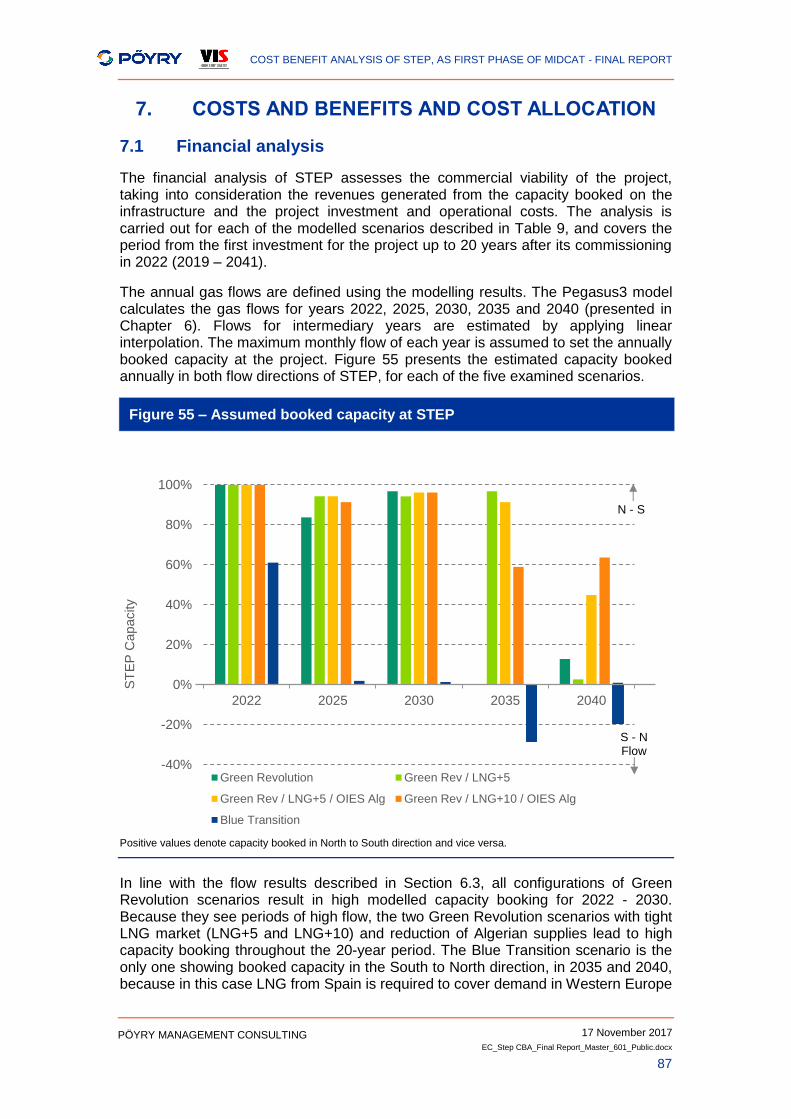
COST BENEFIT ANALYSIS OF STEP, AS FIRST PHASE OF MIDCAT - FINAL REPORT
17 November 2017
EC_Step CBA_Final Report_Master_601_Public.docx
87
PÖYRY MANAGEMENT CONSULTING
7. COSTS AND BENEFITS AND COST ALLOCATION
7.1 Financial analysis
The financial analysis of STEP assesses the commercial viability of the project, taking into consideration the revenues generated from the capacity booked on the infrastructure and the project investment and operational costs. The analysis is carried out for each of the modelled scenarios described in Table 9, and covers the period from the first investment for the project up to 20 years after its commissioning in 2022 (2019 – 2041).
The annual gas flows are defined using the modelling results. The Pegasus3 model calculates the gas flows for years 2022, 2025, 2030, 2035 and 2040 (presented in Chapter 6). Flows for intermediary years are estimated by applying linear interpolation. The maximum monthly flow of each year is assumed to set the annually booked capacity at the project. Figure 55 presents the estimated capacity booked annually in both flow directions of STEP, for each of the five examined scenarios.
Figure 55 – Assumed booked capacity at STEP
Positive values denote capacity booked in North to South direction and vice versa.
In line with the flow results described in Section 6.3, all configurations of Green Revolution scenarios result in high modelled capacity booking for 2022 - 2030. Because they see periods of high flow, the two Green Revolution scenarios with tight LNG market (LNG+5 and LNG+10) and reduction of Algerian supplies lead to high capacity booking throughout the 20-year period. The Blue Transition scenario is the only one showing booked capacity in the South to North direction, in 2035 and 2040, because in this case LNG from Spain is required to cover demand in Western Europe
-40%
-20%
0%
20%
40%
60%
80%
100%
2022 2025 2030 2035 2040
ST
EP
Capacity
Green Revolution Green Rev / LNG+5
Green Rev / LNG+5 / OIES Alg Green Rev / LNG+10 / OIES Alg
Blue Transition
N - S
S - N Flow
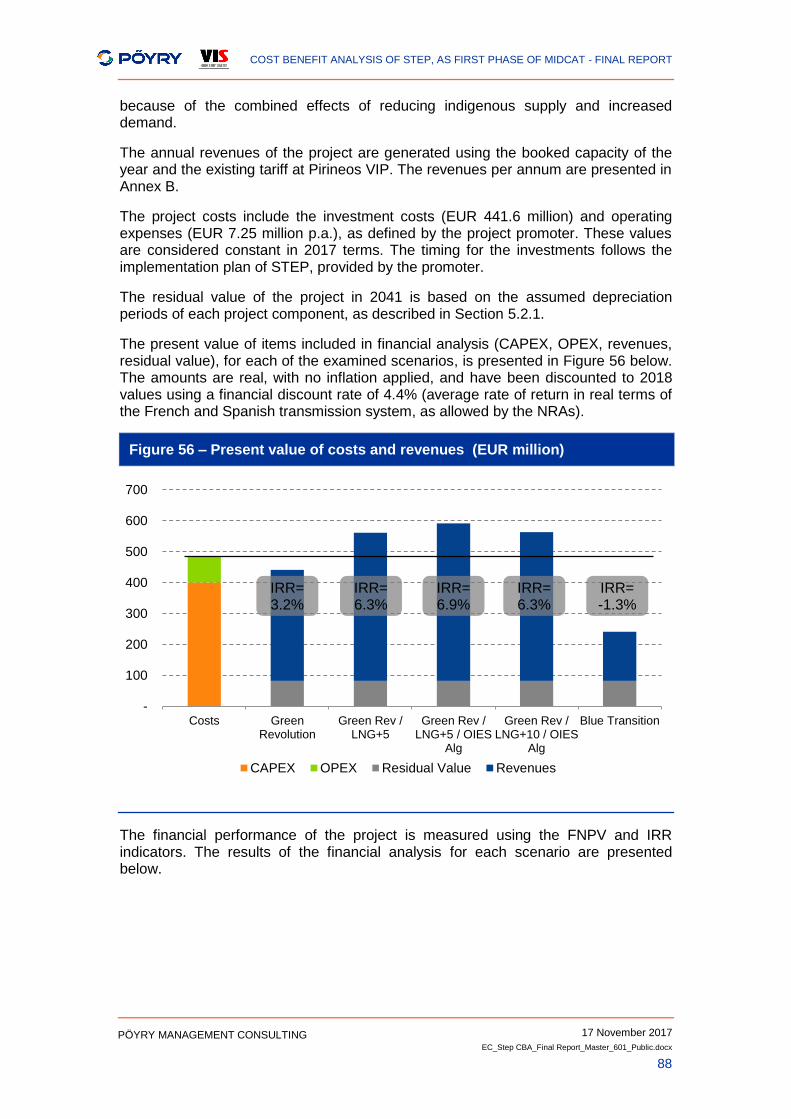
COST BENEFIT ANALYSIS OF STEP, AS FIRST PHASE OF MIDCAT - FINAL REPORT
17 November 2017
EC_Step CBA_Final Report_Master_601_Public.docx
88
PÖYRY MANAGEMENT CONSULTING
because of the combined effects of reducing indigenous supply and increased demand.
The annual revenues of the project are generated using the booked capacity of the year and the existing tariff at Pirineos VIP. The revenues per annum are presented in Annex B.
The project costs include the investment costs (EUR 441.6 million) and operating expenses (EUR 7.25 million p.a.), as defined by the project promoter. These values are considered constant in 2017 terms. The timing for the investments follows the implementation plan of STEP, provided by the promoter.
The residual value of the project in 2041 is based on the assumed depreciation periods of each project component, as described in Section 5.2.1.
The present value of items included in financial analysis (CAPEX, OPEX, revenues, residual value), for each of the examined scenarios, is presented in Figure 56 below. The amounts are real, with no inflation applied, and have been discounted to 2018 values using a financial discount rate of 4.4% (average rate of return in real terms of the French and Spanish transmission system, as allowed by the NRAs).
Figure 56 – Present value of costs and revenues (EUR million)
The financial performance of the project is measured using the FNPV and IRR indicators. The results of the financial analysis for each scenario are presented below.
-
100
200
300
400
500
600
700
Costs GreenRevolution
Green Rev /LNG+5
Green Rev /LNG+5 / OIES
Alg
Green Rev /LNG+10 / OIES
Alg
Blue Transition
CAPEX OPEX Residual Value Revenues
IRR= 6.3%
IRR= 6.9%
IRR= 3.2%
IRR= -1.3%
IRR= 6.3%
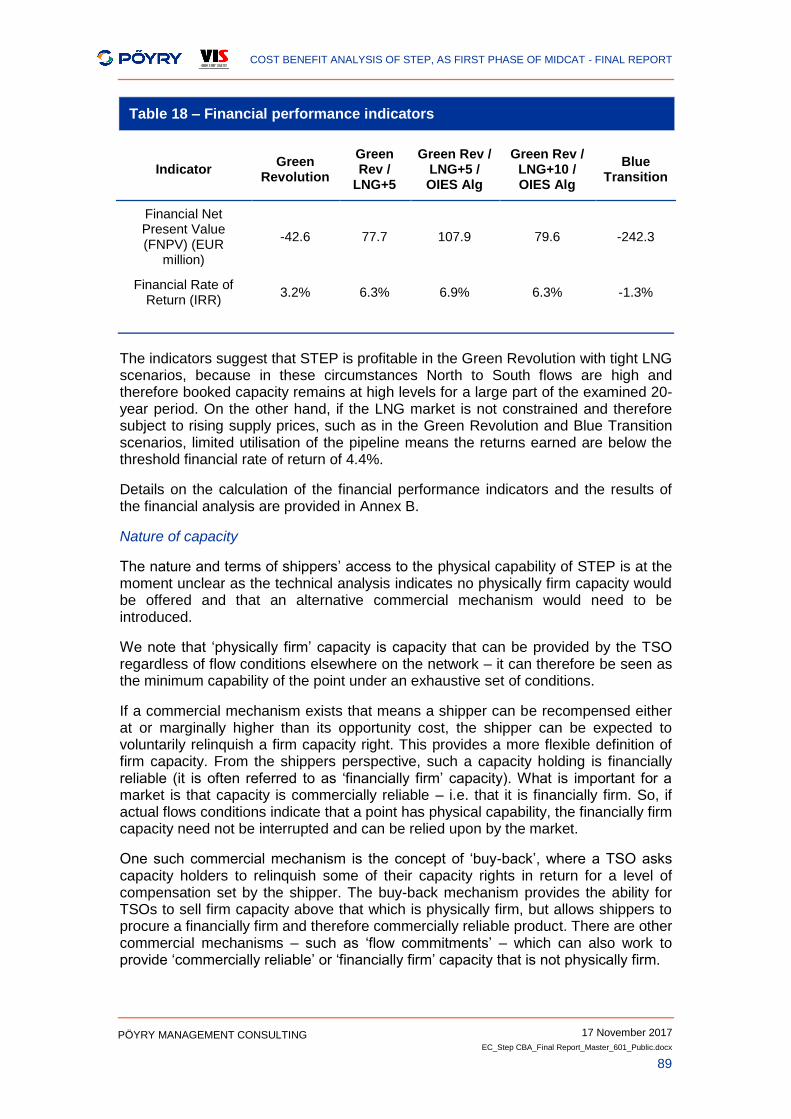
COST BENEFIT ANALYSIS OF STEP, AS FIRST PHASE OF MIDCAT - FINAL REPORT
17 November 2017
EC_Step CBA_Final Report_Master_601_Public.docx
89
PÖYRY MANAGEMENT CONSULTING
Table 18 – Financial performance indicators
Indicator Green
Revolution
Green Rev /
LNG+5
Green Rev / LNG+5 / OIES Alg
Green Rev / LNG+10 / OIES Alg
Blue Transition
Financial Net Present Value (FNPV) (EUR
million)
-42.6 77.7 107.9 79.6 -242.3
Financial Rate of Return (IRR)
3.2% 6.3% 6.9% 6.3% -1.3%
The indicators suggest that STEP is profitable in the Green Revolution with tight LNG scenarios, because in these circumstances North to South flows are high and therefore booked capacity remains at high levels for a large part of the examined 20-year period. On the other hand, if the LNG market is not constrained and therefore subject to rising supply prices, such as in the Green Revolution and Blue Transition scenarios, limited utilisation of the pipeline means the returns earned are below the threshold financial rate of return of 4.4%.
Details on the calculation of the financial performance indicators and the results of the financial analysis are provided in Annex B.
Nature of capacity
The nature and terms of shippers’ access to the physical capability of STEP is at the moment unclear as the technical analysis indicates no physically firm capacity would be offered and that an alternative commercial mechanism would need to be introduced.
We note that ‘physically firm’ capacity is capacity that can be provided by the TSO regardless of flow conditions elsewhere on the network – it can therefore be seen as the minimum capability of the point under an exhaustive set of conditions.
If a commercial mechanism exists that means a shipper can be recompensed either at or marginally higher than its opportunity cost, the shipper can be expected to voluntarily relinquish a firm capacity right. This provides a more flexible definition of firm capacity. From the shippers perspective, such a capacity holding is financially reliable (it is often referred to as ‘financially firm’ capacity). What is important for a market is that capacity is commercially reliable – i.e. that it is financially firm. So, if actual flows conditions indicate that a point has physical capability, the financially firm capacity need not be interrupted and can be relied upon by the market.
One such commercial mechanism is the concept of ‘buy-back’, where a TSO asks capacity holders to relinquish some of their capacity rights in return for a level of compensation set by the shipper. The buy-back mechanism provides the ability for TSOs to sell firm capacity above that which is physically firm, but allows shippers to procure a financially firm and therefore commercially reliable product. There are other commercial mechanisms – such as ‘flow commitments’ – which can also work to provide ‘commercially reliable’ or ‘financially firm’ capacity that is not physically firm.
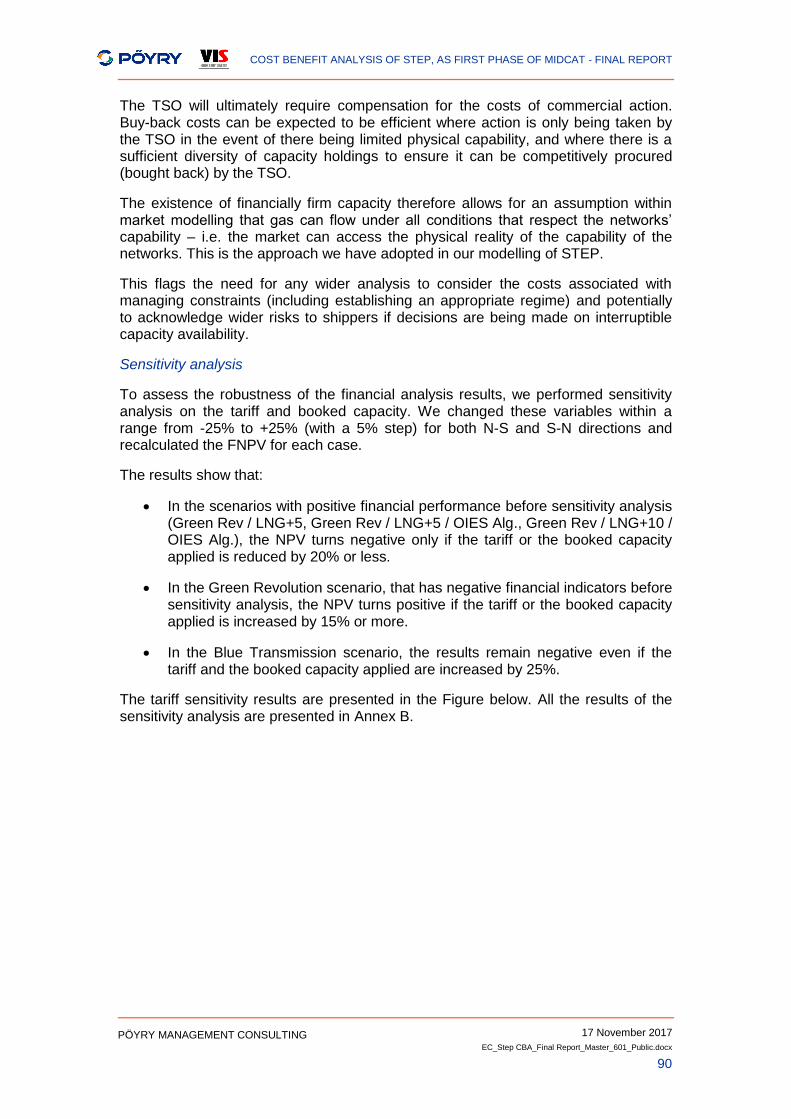
COST BENEFIT ANALYSIS OF STEP, AS FIRST PHASE OF MIDCAT - FINAL REPORT
17 November 2017
EC_Step CBA_Final Report_Master_601_Public.docx
90
PÖYRY MANAGEMENT CONSULTING
The TSO will ultimately require compensation for the costs of commercial action. Buy-back costs can be expected to be efficient where action is only being taken by the TSO in the event of there being limited physical capability, and where there is a sufficient diversity of capacity holdings to ensure it can be competitively procured (bought back) by the TSO.
The existence of financially firm capacity therefore allows for an assumption within market modelling that gas can flow under all conditions that respect the networks’ capability – i.e. the market can access the physical reality of the capability of the networks. This is the approach we have adopted in our modelling of STEP.
This flags the need for any wider analysis to consider the costs associated with managing constraints (including establishing an appropriate regime) and potentially to acknowledge wider risks to shippers if decisions are being made on interruptible capacity availability.
Sensitivity analysis
To assess the robustness of the financial analysis results, we performed sensitivity analysis on the tariff and booked capacity. We changed these variables within a range from -25% to +25% (with a 5% step) for both N-S and S-N directions and recalculated the FNPV for each case.
The results show that:
In the scenarios with positive financial performance before sensitivity analysis (Green Rev / LNG+5, Green Rev / LNG+5 / OIES Alg., Green Rev / LNG+10 / OIES Alg.), the NPV turns negative only if the tariff or the booked capacity applied is reduced by 20% or less.
In the Green Revolution scenario, that has negative financial indicators before sensitivity analysis, the NPV turns positive if the tariff or the booked capacity applied is increased by 15% or more.
In the Blue Transmission scenario, the results remain negative even if the tariff and the booked capacity applied are increased by 25%.
The tariff sensitivity results are presented in the Figure below. All the results of the sensitivity analysis are presented in Annex B.
COST BENEFIT ANALYSIS OF STEP, AS FIRST PHASE OF MIDCAT - FINAL REPORT
17 November 2017
EC_Step CBA_Final Report_Master_601_Public.docx
91
PÖYRY MANAGEMENT CONSULTING
Figure 57 – Sensitivity analysis on tariffs
7.2 Economic analysis
The economic analysis assesses if, and to what extent, the economic benefits resulting from implementation of STEP outweigh its investment and operational costs. The benefits examined in this analysis include the impact of the project on wholesale gas and electricity prices and the impact on the cost of gas disruption.
The economic analysis of STEP is carried out for the scenarios described in Table 9, and covers the period from the first investment for the project up to 20 years after its commissioning in 2022 (2019 – 2041).
The impact of STEP on the gas prices (EU gas bill) is calculated using the Pegasus3 outputs for global system costs with and without STEP, for years 2022, 2025, 2030, 2035 and 2040, shown in section 6.4. The impact of STEP on the EU electricity bills is estimated using a multiplier of gas benefits obtained with an electricity/gas price sensitivity and an electricity/gas consumption ratio18. As we are examining the impact on the EU, we have used the EU average change to estimate electricity market impacts (rather than the results for France or Iberia).
The modelling results for the stress tests indicate that there is no loss of load in any of the Green Revolution scenarios, while in the Blue Transition scenario, where loss of load is observed, STEP does not contribute to its reduction (see section 6.6). Consequently, disruption costs are not incorporated in the estimation of monetized benefits for STEP.
18
For a given decrease of gas price we calculate with the BID3 electricity model the
decrease of electricity price, at EU-wide level, and multiply it by the ratio of electricity to gas consumption. We obtain hence a multiplier that when applied to gas benefits produces a reasonable estimate of the electricity benefit. Our BID3 modelling incorporates projected carbon costs from the European emission trading scheme.
-400
-300
-200
-100
0
100
200
300
-25% -20% -15% -10% -5% 0% 5% 10% 15% 20% 25%
NP
V (
EU
R m
illio
n)
Change in tariff (%)
Green Revolution Green Rev / LNG+5
Green Rev / LNG+5 / OIES Alg Green Rev / LNG+10 / OIES Alg
Blue Transition
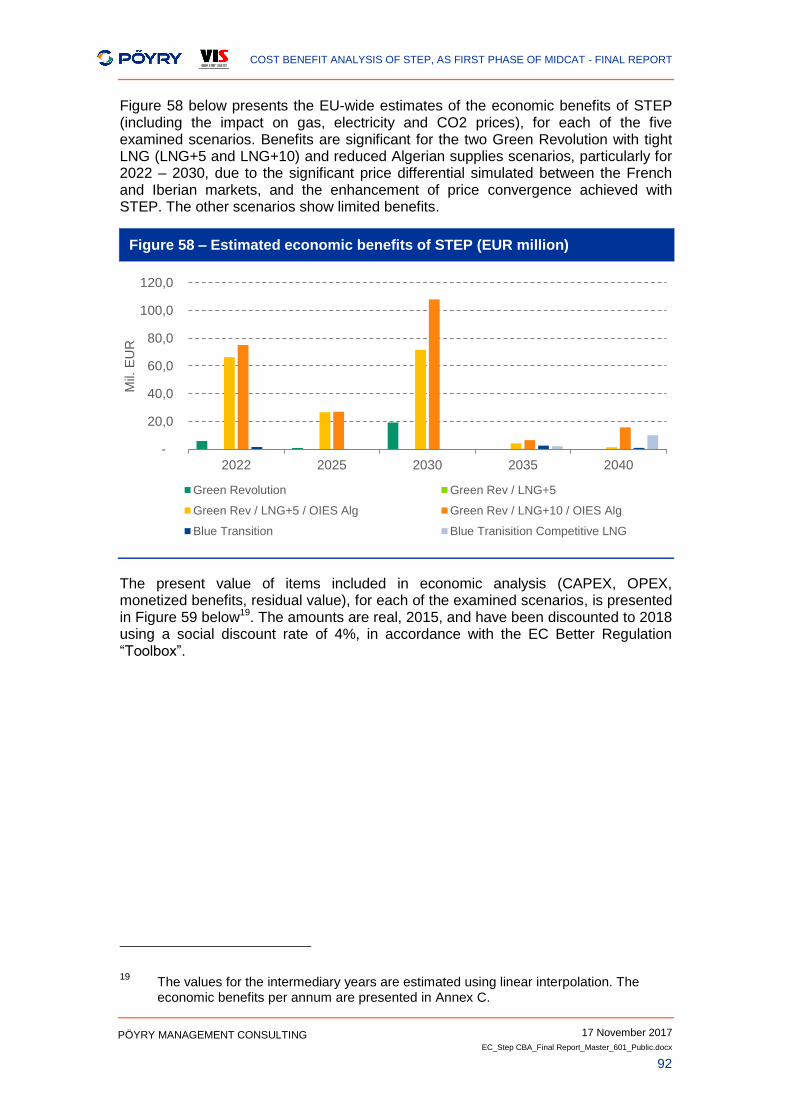
COST BENEFIT ANALYSIS OF STEP, AS FIRST PHASE OF MIDCAT - FINAL REPORT
17 November 2017
EC_Step CBA_Final Report_Master_601_Public.docx
92
PÖYRY MANAGEMENT CONSULTING
Figure 58 below presents the EU-wide estimates of the economic benefits of STEP (including the impact on gas, electricity and CO2 prices), for each of the five examined scenarios. Benefits are significant for the two Green Revolution with tight LNG (LNG+5 and LNG+10) and reduced Algerian supplies scenarios, particularly for 2022 – 2030, due to the significant price differential simulated between the French and Iberian markets, and the enhancement of price convergence achieved with STEP. The other scenarios show limited benefits.
Figure 58 – Estimated economic benefits of STEP (EUR million)
The present value of items included in economic analysis (CAPEX, OPEX, monetized benefits, residual value), for each of the examined scenarios, is presented in Figure 59 below19. The amounts are real, 2015, and have been discounted to 2018 using a social discount rate of 4%, in accordance with the EC Better Regulation “Toolbox”.
19
The values for the intermediary years are estimated using linear interpolation. The economic benefits per annum are presented in Annex C.
-
20,0
40,0
60,0
80,0
100,0
120,0
2022 2025 2030 2035 2040
Mil.
EU
R
Green Revolution Green Rev / LNG+5
Green Rev / LNG+5 / OIES Alg Green Rev / LNG+10 / OIES Alg
Blue Transition Blue Tranisition Competitive LNG
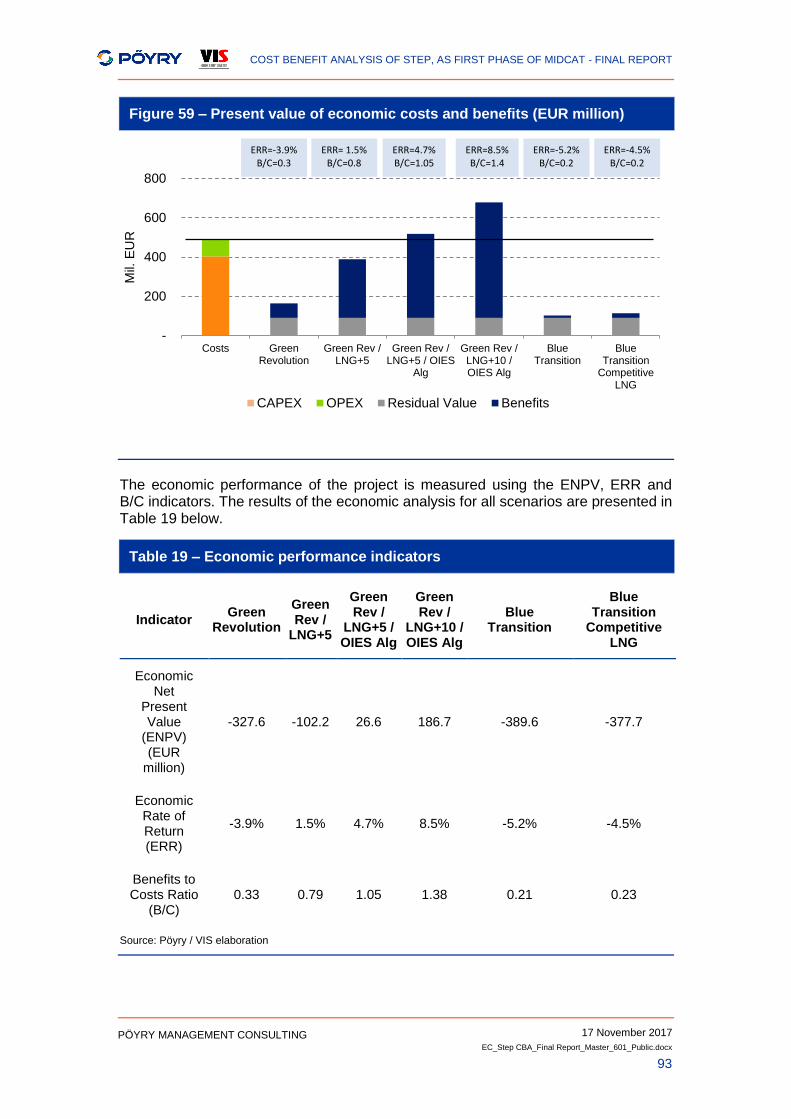
COST BENEFIT ANALYSIS OF STEP, AS FIRST PHASE OF MIDCAT - FINAL REPORT
17 November 2017
EC_Step CBA_Final Report_Master_601_Public.docx
93
PÖYRY MANAGEMENT CONSULTING
Figure 59 – Present value of economic costs and benefits (EUR million)
The economic performance of the project is measured using the ENPV, ERR and B/C indicators. The results of the economic analysis for all scenarios are presented in Table 19 below.
Table 19 – Economic performance indicators
Indicator Green
Revolution
Green Rev /
LNG+5
Green Rev /
LNG+5 / OIES Alg
Green Rev /
LNG+10 / OIES Alg
Blue Transition
Blue Transition
Competitive LNG
Economic Net
Present Value
(ENPV) (EUR
million)
-327.6 -102.2 26.6 186.7 -389.6 -377.7
Economic Rate of Return (ERR)
-3.9% 1.5% 4.7% 8.5% -5.2% -4.5%
Benefits to Costs Ratio
(B/C) 0.33 0.79 1.05 1.38 0.21 0.23
Source: Pöyry / VIS elaboration
-
200
400
600
800
Costs GreenRevolution
Green Rev /LNG+5
Green Rev /LNG+5 / OIES
Alg
Green Rev /LNG+10 /OIES Alg
BlueTransition
BlueTransition
CompetitiveLNG
Mil.
EU
R
CAPEX OPEX Residual Value Benefits
ERR=-3.9% B/C=0.3
ERR= 1.5% B/C=0.8
ERR=4.7% B/C=1.05
ERR=8.5% B/C=1.4
ERR=-5.2% B/C=0.2
ERR=-4.5% B/C=0.2
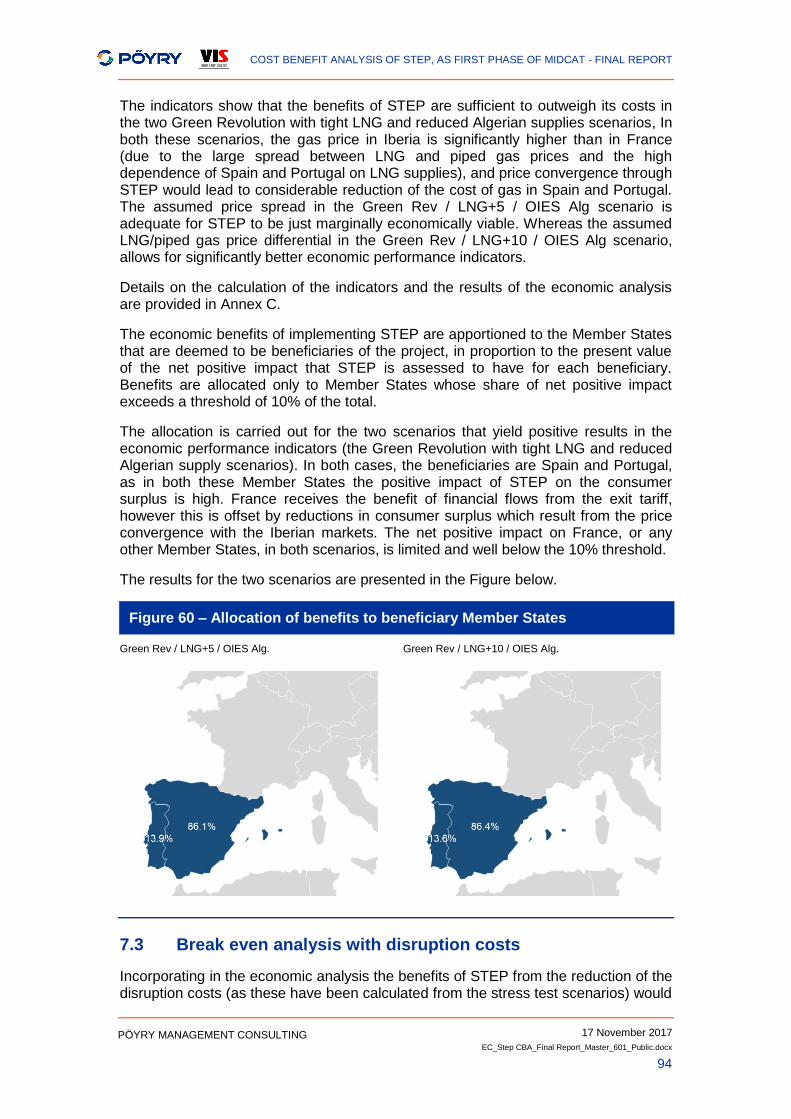
COST BENEFIT ANALYSIS OF STEP, AS FIRST PHASE OF MIDCAT - FINAL REPORT
17 November 2017
EC_Step CBA_Final Report_Master_601_Public.docx
94
PÖYRY MANAGEMENT CONSULTING
The indicators show that the benefits of STEP are sufficient to outweigh its costs in the two Green Revolution with tight LNG and reduced Algerian supplies scenarios, In both these scenarios, the gas price in Iberia is significantly higher than in France (due to the large spread between LNG and piped gas prices and the high dependence of Spain and Portugal on LNG supplies), and price convergence through STEP would lead to considerable reduction of the cost of gas in Spain and Portugal. The assumed price spread in the Green Rev / LNG+5 / OIES Alg scenario is adequate for STEP to be just marginally economically viable. Whereas the assumed LNG/piped gas price differential in the Green Rev / LNG+10 / OIES Alg scenario, allows for significantly better economic performance indicators.
Details on the calculation of the indicators and the results of the economic analysis are provided in Annex C.
The economic benefits of implementing STEP are apportioned to the Member States that are deemed to be beneficiaries of the project, in proportion to the present value of the net positive impact that STEP is assessed to have for each beneficiary. Benefits are allocated only to Member States whose share of net positive impact exceeds a threshold of 10% of the total.
The allocation is carried out for the two scenarios that yield positive results in the economic performance indicators (the Green Revolution with tight LNG and reduced Algerian supply scenarios). In both cases, the beneficiaries are Spain and Portugal, as in both these Member States the positive impact of STEP on the consumer surplus is high. France receives the benefit of financial flows from the exit tariff, however this is offset by reductions in consumer surplus which result from the price convergence with the Iberian markets. The net positive impact on France, or any other Member States, in both scenarios, is limited and well below the 10% threshold.
The results for the two scenarios are presented in the Figure below.
Figure 60 – Allocation of benefits to beneficiary Member States
Green Rev / LNG+5 / OIES Alg.
Green Rev / LNG+10 / OIES Alg.
7.3 Break even analysis with disruption costs
Incorporating in the economic analysis the benefits of STEP from the reduction of the disruption costs (as these have been calculated from the stress test scenarios) would
COST BENEFIT ANALYSIS OF STEP, AS FIRST PHASE OF MIDCAT - FINAL REPORT
17 November 2017
EC_Step CBA_Final Report_Master_601_Public.docx
95
PÖYRY MANAGEMENT CONSULTING
require hypothesis on the likelihood of the disruptions and on the risk aversion. Due to the uncertainty linked to such events, these parameters are usually estimated on a qualitative, and not quantitative, basis.
We performed a break-even analysis, to assess what the probability of a disruption event should be, for STEP to be economically viable in the three scenarios that currently show negative results (namely Green Revolution, Green Rev / LNG+5, Blue Transition). In particular, for each scenario, we:
1. Estimated the monetized benefits that should come from STEP’s reduction of disruption costs, for the project to reach a break-even position (ENPV=0); and
2. Estimated the impact of STEP in the stress tests’ situations (reduction of system costs under disruption, presented in Section 6.6.2), on both gas and electricity prices, following the same approach as discussed in Section 7.2.
3. Sought the appropriate probability of disruption that should be applied to the impact of STEP in the stress tests’ situations, so as to reach the required level of monetized benefits.
For each scenario we examined the stress test in which STEP had the largest impact on cost reduction. For the Green Revolution and Green Rev / LNG+5 scenarios we used the Qatari LNG stress test, and for the Blue Transition scenario the Russian gas stress test.
The results of the analysis show that for the Green Revolution and Blue Transition scenarios, the impact of STEP on disruption costs is not sufficient to reach the required level of monetized benefits, regardless of the probability of disruption assumed. In the case of the Green Rev / LNG+5 scenario, to break even the probability of having a Qatari supply disruption would have to be set at a very high level (77% per annum).
The Table below summarizes the results for the three scenarios (amounts are real, 2015, and have been discounted to 2018 using a social discount rate of 4%).
Table 20 – Results of break-even analysis
Green Revolution Green Rev / LNG+5 Blue Transition
PV of required level of monetized benefits (EUR
million) 327.6 102.2 389.6
PV of STEP impact on cost of disruption (EUR
million) 126.0 133.5 150.0
Break even annual probability of disruption
(%) N/A 77% N/A
Source: Pöyry / VIS elaboration
COST BENEFIT ANALYSIS OF STEP, AS FIRST PHASE OF MIDCAT - FINAL REPORT
17 November 2017
EC_Step CBA_Final Report_Master_601_Public.docx
96
PÖYRY MANAGEMENT CONSULTING
7.4 Comparison with Frontier Economics’ results
The Frontier Economics’ study, presented in paragraph 2.2, gives results that are:
In line with those of this analysis, in the case of a tight LNG market; the positive return is higher in the Frontier Economics’ study because the assumed difference between LNG and pipe gas price is larger and drives up the flows through STEP, along the North to South direction;
In line with those of this analysis, in the case of a competitive LNG market with declining gas demand in Europe, although with different flow patterns; the return is negative in the Frontier Economics’ study because the difference between LNG and pipe gas price is negative, i.e. LNG is cheaper, but is too small to drive substantial flows, along the direction South to North; our study predicts North to South flows, with limited utilization for STEP and hence with a negative economic return; the main difference between the two studies is the pricing assumption: for Frontier Economics LNG has a single price for all countries and is consistently cheaper than pipe gas; we do not assume a single LNG price, instead, and some LNG sources are cheaper than pipe gas, some are not;
Not in line with those of this analysis, in the case of a competitive LNG market with flat gas demand; the main difference is again the pricing logic, as above;
Annex D provides details about the comparison between Frontier Economics’ and this study.
COST BENEFIT ANALYSIS OF STEP, AS FIRST PHASE OF MIDCAT - FINAL REPORT
17 November 2017
EC_Step CBA_Final Report_Master_601_Public.docx
97
PÖYRY MANAGEMENT CONSULTING
7.5 Modelling-based indicators
The modelling-based indicators are used to assess the impact of STEP, based on the pipeline’s expected operation under different market conditions and disruptions. The outputs of the Pegausus3 model for the scenarios and stress tests were applied to estimate these indicators.
7.5.1 Price convergence
The price convergence indicator is applied to examine if the project contributes to the convergence of gas wholesale prices between two markets.
The outputs of Pegasus3 show that STEP increases price convergence between France and Spain in all scenarios. However, the magnitude of the impact depends on the scenario, and particularly the relevant price differential of the two markets.
Figure 61 presents the impact of STEP on the price convergence indicator for each scenario. In all cases STEP increases the indicator; the largest impact is observed in the Green Rev / LNG+10 / OIES Alg. scenario, where the price difference between France and Spain without STEP is the highest.
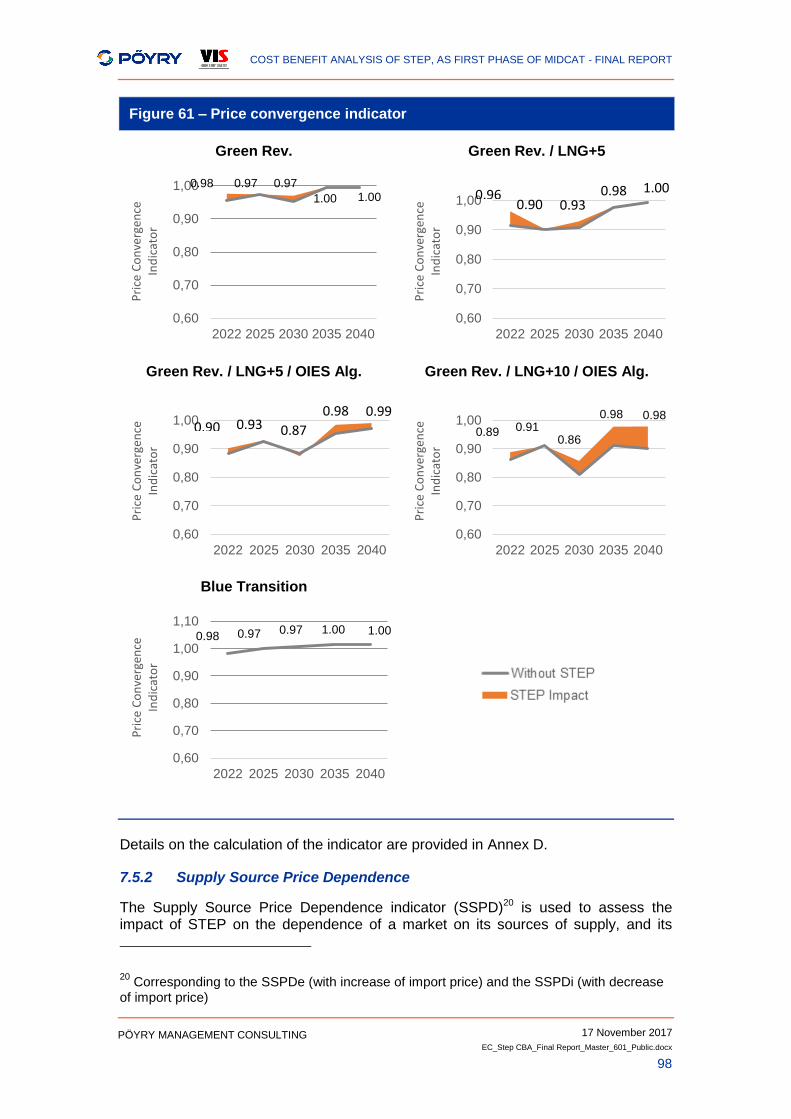
COST BENEFIT ANALYSIS OF STEP, AS FIRST PHASE OF MIDCAT - FINAL REPORT
17 November 2017
EC_Step CBA_Final Report_Master_601_Public.docx
98
PÖYRY MANAGEMENT CONSULTING
Figure 61 – Price convergence indicator
Green Rev. Green Rev. / LNG+5
Green Rev. / LNG+5 / OIES Alg. Green Rev. / LNG+10 / OIES Alg.
Blue Transition
Details on the calculation of the indicator are provided in Annex D.
7.5.2 Supply Source Price Dependence
The Supply Source Price Dependence indicator (SSPD)20 is used to assess the impact of STEP on the dependence of a market on its sources of supply, and its
20
Corresponding to the SSPDe (with increase of import price) and the SSPDi (with decrease of import price)
0,60
0,70
0,80
0,90
1,00
2022 2025 2030 2035 2040
Pri
ce C
on
verg
ence
In
dic
ato
r
0.98 0.97 0.97
1.00 1.00
0,60
0,70
0,80
0,90
1,00
2022 2025 2030 2035 2040
Pri
ce C
on
verg
ence
In
dic
ato
r
0.96 0.90 0.93
0.98 1.00
0,60
0,70
0,80
0,90
1,00
2022 2025 2030 2035 2040
Pri
ce C
on
verg
ence
In
dic
ato
r
0.90 0.93 0.87
0.98 0.99
0,60
0,70
0,80
0,90
1,00
2022 2025 2030 2035 2040
Pri
ce C
on
verg
ence
In
dic
ato
r 0.89 0.91
0.86
0.98 0.98
0,60
0,70
0,80
0,90
1,00
1,10
2022 2025 2030 2035 2040
Pri
ce C
on
verg
ence
In
dic
ato
r
0.98 0.97 0.97 1.00 1.00
COST BENEFIT ANALYSIS OF STEP, AS FIRST PHASE OF MIDCAT - FINAL REPORT
17 November 2017
EC_Step CBA_Final Report_Master_601_Public.docx
99
PÖYRY MANAGEMENT CONSULTING
diversification of sources, based on how a change in import prices affects prices in the market.
To evaluate the impact of STEP on the dependence of France and Spain on LNG imports, the indicator has been applied in the Green Revolution with limited Algerian price scenarios, with and without STEP (corresponding to SSPDe indicator of ENTSOG). Scenario Green Rev. / LNG+5 / OIES Alg. examines a 5 EUR/MWh increase of weighted LNG price (approx. 20% price increase), and scenario Green Rev. / LNG+10 / OIES Alg. examines a 10 EUR/MWh increase of weighted LNG price (approx. 40% price increase). Furthermore, to evaluate how STEP may affect the markets in case of a decrease in LNG prices (corresponding to SSPDi indicator of ENTSOG), we applied the indicator on a Green Rev. / LNG-5 / OIES Alg. scenario, which examines a 5 EUR/MWh decrease of weighted LNG price (approx. 20% price decrease).
The results of the Supply Source Price Dependence indicator for Spain are presented below.
The analysis shows that STEP benefits Spain by enhancing the availability of diversified supply sources.
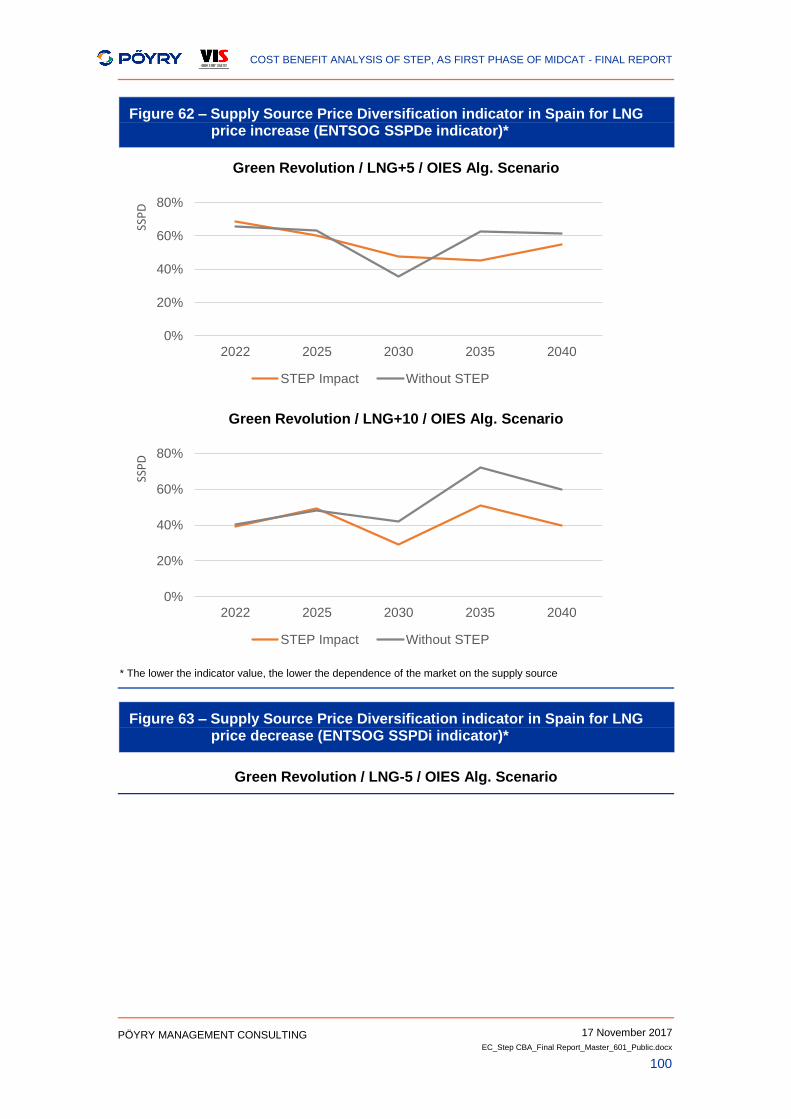
COST BENEFIT ANALYSIS OF STEP, AS FIRST PHASE OF MIDCAT - FINAL REPORT
17 November 2017
EC_Step CBA_Final Report_Master_601_Public.docx
100
PÖYRY MANAGEMENT CONSULTING
Figure 62 – Supply Source Price Diversification indicator in Spain for LNG price increase (ENTSOG SSPDe indicator)*
Green Revolution / LNG+5 / OIES Alg. Scenario
Green Revolution / LNG+10 / OIES Alg. Scenario
* The lower the indicator value, the lower the dependence of the market on the supply source
Figure 63 – Supply Source Price Diversification indicator in Spain for LNG price decrease (ENTSOG SSPDi indicator)*
Green Revolution / LNG-5 / OIES Alg. Scenario
0%
20%
40%
60%
80%
2022 2025 2030 2035 2040
SSP
D
STEP Impact Without STEP
0%
20%
40%
60%
80%
2022 2025 2030 2035 2040
SSP
D
STEP Impact Without STEP
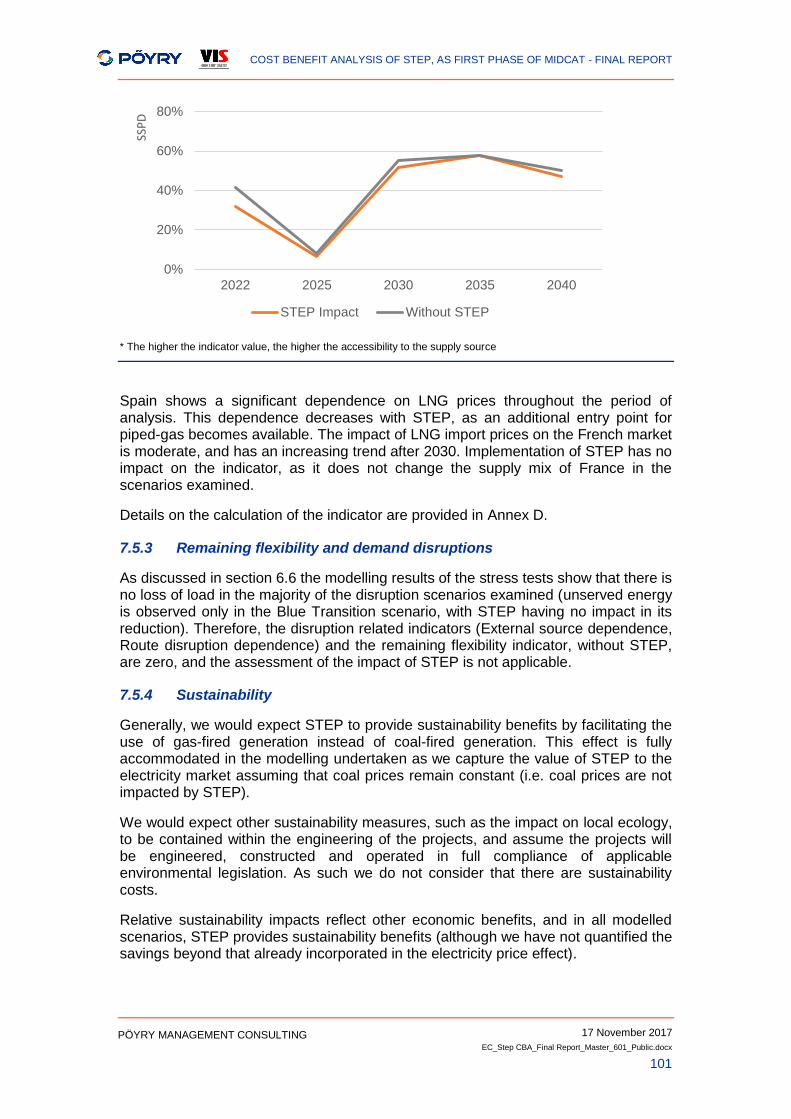
COST BENEFIT ANALYSIS OF STEP, AS FIRST PHASE OF MIDCAT - FINAL REPORT
17 November 2017
EC_Step CBA_Final Report_Master_601_Public.docx
101
PÖYRY MANAGEMENT CONSULTING
* The higher the indicator value, the higher the accessibility to the supply source
Spain shows a significant dependence on LNG prices throughout the period of analysis. This dependence decreases with STEP, as an additional entry point for piped-gas becomes available. The impact of LNG import prices on the French market is moderate, and has an increasing trend after 2030. Implementation of STEP has no impact on the indicator, as it does not change the supply mix of France in the scenarios examined.
Details on the calculation of the indicator are provided in Annex D.
7.5.3 Remaining flexibility and demand disruptions
As discussed in section 6.6 the modelling results of the stress tests show that there is no loss of load in the majority of the disruption scenarios examined (unserved energy is observed only in the Blue Transition scenario, with STEP having no impact in its reduction). Therefore, the disruption related indicators (External source dependence, Route disruption dependence) and the remaining flexibility indicator, without STEP, are zero, and the assessment of the impact of STEP is not applicable.
7.5.4 Sustainability
Generally, we would expect STEP to provide sustainability benefits by facilitating the use of gas-fired generation instead of coal-fired generation. This effect is fully accommodated in the modelling undertaken as we capture the value of STEP to the electricity market assuming that coal prices remain constant (i.e. coal prices are not impacted by STEP).
We would expect other sustainability measures, such as the impact on local ecology, to be contained within the engineering of the projects, and assume the projects will be engineered, constructed and operated in full compliance of applicable environmental legislation. As such we do not consider that there are sustainability costs.
Relative sustainability impacts reflect other economic benefits, and in all modelled scenarios, STEP provides sustainability benefits (although we have not quantified the savings beyond that already incorporated in the electricity price effect).
0%
20%
40%
60%
80%
2022 2025 2030 2035 2040
SSP
D
STEP Impact Without STEP
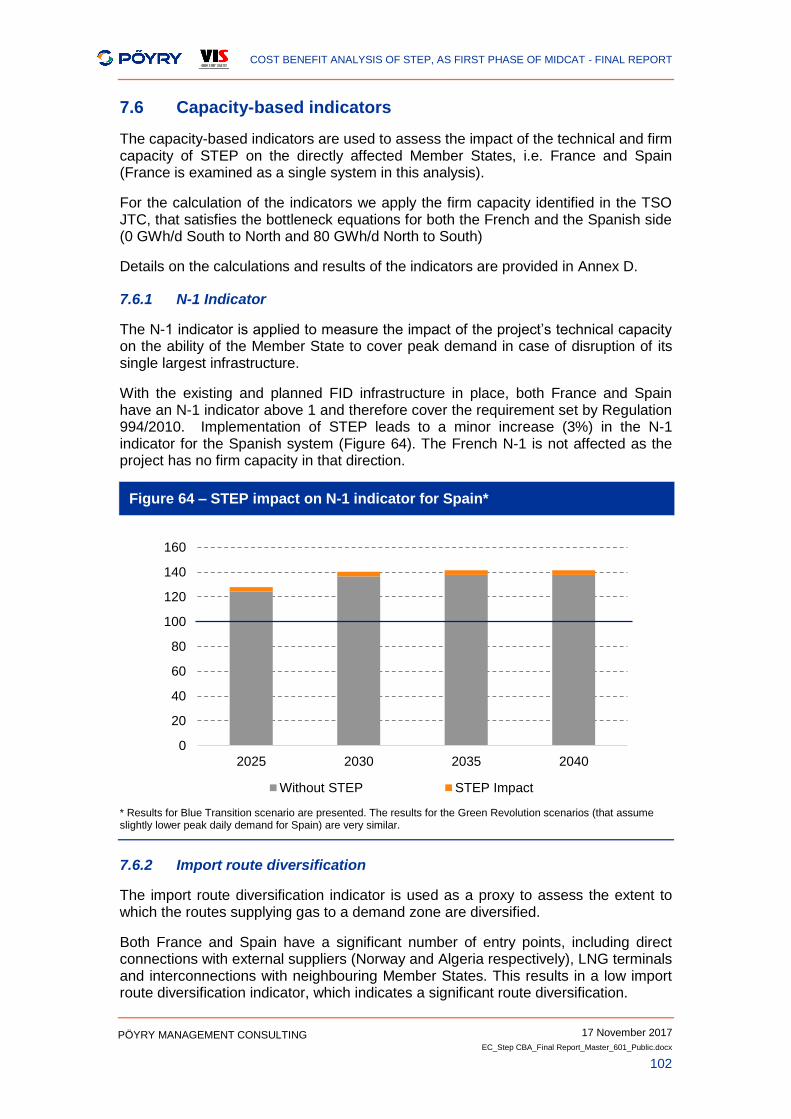
COST BENEFIT ANALYSIS OF STEP, AS FIRST PHASE OF MIDCAT - FINAL REPORT
17 November 2017
EC_Step CBA_Final Report_Master_601_Public.docx
102
PÖYRY MANAGEMENT CONSULTING
7.6 Capacity-based indicators
The capacity-based indicators are used to assess the impact of the technical and firm capacity of STEP on the directly affected Member States, i.e. France and Spain (France is examined as a single system in this analysis).
For the calculation of the indicators we apply the firm capacity identified in the TSO JTC, that satisfies the bottleneck equations for both the French and the Spanish side (0 GWh/d South to North and 80 GWh/d North to South)
Details on the calculations and results of the indicators are provided in Annex D.
7.6.1 N-1 Indicator
The N-1 indicator is applied to measure the impact of the project’s technical capacity on the ability of the Member State to cover peak demand in case of disruption of its single largest infrastructure.
With the existing and planned FID infrastructure in place, both France and Spain have an N-1 indicator above 1 and therefore cover the requirement set by Regulation 994/2010. Implementation of STEP leads to a minor increase (3%) in the N-1 indicator for the Spanish system (Figure 64). The French N-1 is not affected as the project has no firm capacity in that direction.
Figure 64 – STEP impact on N-1 indicator for Spain*
* Results for Blue Transition scenario are presented. The results for the Green Revolution scenarios (that assume slightly lower peak daily demand for Spain) are very similar.
7.6.2 Import route diversification
The import route diversification indicator is used as a proxy to assess the extent to which the routes supplying gas to a demand zone are diversified.
Both France and Spain have a significant number of entry points, including direct connections with external suppliers (Norway and Algeria respectively), LNG terminals and interconnections with neighbouring Member States. This results in a low import route diversification indicator, which indicates a significant route diversification.
0
20
40
60
80
100
120
140
160
2025 2030 2035 2040
Without STEP STEP Impact
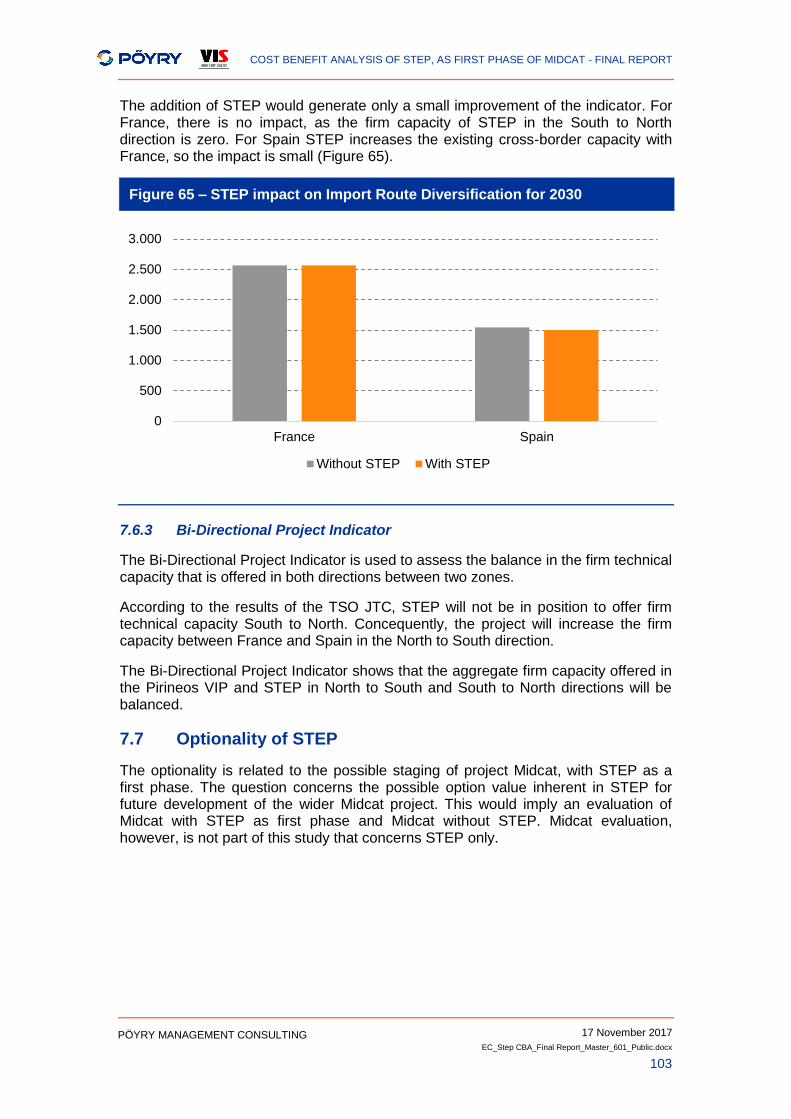
COST BENEFIT ANALYSIS OF STEP, AS FIRST PHASE OF MIDCAT - FINAL REPORT
17 November 2017
EC_Step CBA_Final Report_Master_601_Public.docx
103
PÖYRY MANAGEMENT CONSULTING
The addition of STEP would generate only a small improvement of the indicator. For France, there is no impact, as the firm capacity of STEP in the South to North direction is zero. For Spain STEP increases the existing cross-border capacity with France, so the impact is small (Figure 65).
Figure 65 – STEP impact on Import Route Diversification for 2030
7.6.3 Bi-Directional Project Indicator
The Bi-Directional Project Indicator is used to assess the balance in the firm technical capacity that is offered in both directions between two zones.
According to the results of the TSO JTC, STEP will not be in position to offer firm technical capacity South to North. Concequently, the project will increase the firm capacity between France and Spain in the North to South direction.
The Bi-Directional Project Indicator shows that the aggregate firm capacity offered in the Pirineos VIP and STEP in North to South and South to North directions will be balanced.
7.7 Optionality of STEP
The optionality is related to the possible staging of project Midcat, with STEP as a first phase. The question concerns the possible option value inherent in STEP for future development of the wider Midcat project. This would imply an evaluation of Midcat with STEP as first phase and Midcat without STEP. Midcat evaluation, however, is not part of this study that concerns STEP only.
0
500
1.000
1.500
2.000
2.500
3.000
France Spain
Without STEP With STEP

COST BENEFIT ANALYSIS OF STEP, AS FIRST PHASE OF MIDCAT - FINAL REPORT
17 November 2017
EC_Step CBA_Final Report_Master_601_Public.docx
104
PÖYRY MANAGEMENT CONSULTING
[This page is intentionally blank]
COST BENEFIT ANALYSIS OF STEP, AS FIRST PHASE OF MIDCAT - FINAL REPORT
17 November 2017
EC_Step CBA_Final Report_Master_601_Public.docx
105
PÖYRY MANAGEMENT CONSULTING
ANNEX A – DETAILED MODELLING RESULTS
This annex takes a sample of different detailed modelling results which were examined during the analysis of the project, to illustrate the granularity of the modelling, the issues that were investigated and some of the additional analysis that was undertaken. In this section we detail:
Spanish flows in the Blue Transition scenario
Spanish and European flows in the Green Revolution / LNG+10 / OIES Algeria scenario
European LNG utilisation in different scenarios and different stress tests
Storage utilisation with different weather patterns
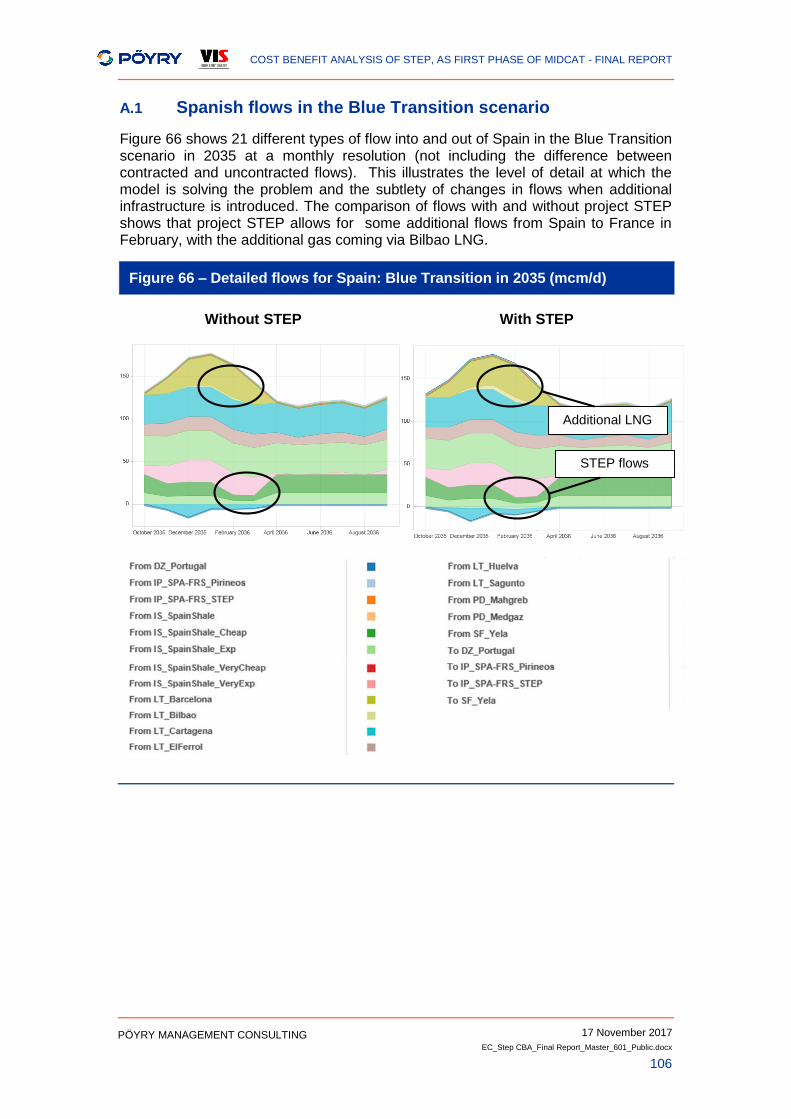
COST BENEFIT ANALYSIS OF STEP, AS FIRST PHASE OF MIDCAT - FINAL REPORT
17 November 2017
EC_Step CBA_Final Report_Master_601_Public.docx
106
PÖYRY MANAGEMENT CONSULTING
A.1 Spanish flows in the Blue Transition scenario
Figure 66 shows 21 different types of flow into and out of Spain in the Blue Transition scenario in 2035 at a monthly resolution (not including the difference between contracted and uncontracted flows). This illustrates the level of detail at which the model is solving the problem and the subtlety of changes in flows when additional infrastructure is introduced. The comparison of flows with and without project STEP shows that project STEP allows for some additional flows from Spain to France in February, with the additional gas coming via Bilbao LNG.
Figure 66 – Detailed flows for Spain: Blue Transition in 2035 (mcm/d)
Without STEP With STEP
Additional LNG
STEP flows
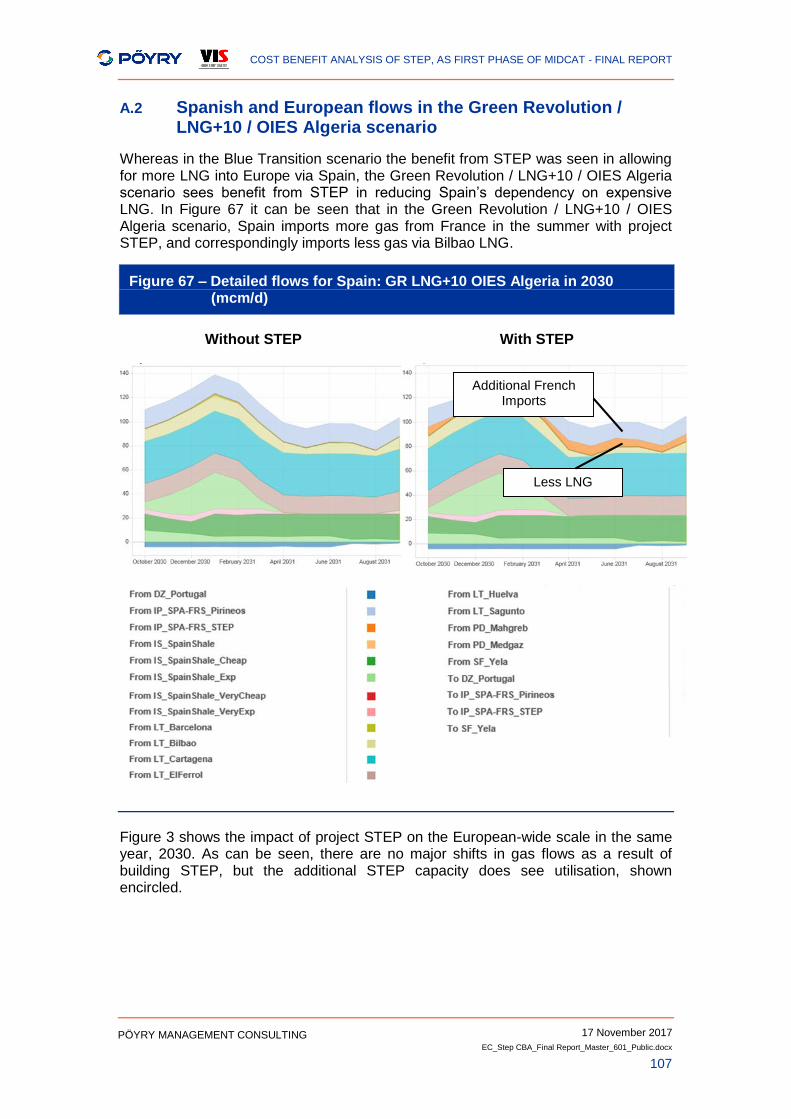
COST BENEFIT ANALYSIS OF STEP, AS FIRST PHASE OF MIDCAT - FINAL REPORT
17 November 2017
EC_Step CBA_Final Report_Master_601_Public.docx
107
PÖYRY MANAGEMENT CONSULTING
A.2 Spanish and European flows in the Green Revolution / LNG+10 / OIES Algeria scenario
Whereas in the Blue Transition scenario the benefit from STEP was seen in allowing for more LNG into Europe via Spain, the Green Revolution / LNG+10 / OIES Algeria scenario sees benefit from STEP in reducing Spain’s dependency on expensive LNG. In Figure 67 it can be seen that in the Green Revolution / LNG+10 / OIES Algeria scenario, Spain imports more gas from France in the summer with project STEP, and correspondingly imports less gas via Bilbao LNG.
Figure 67 – Detailed flows for Spain: GR LNG+10 OIES Algeria in 2030 (mcm/d)
Without STEP With STEP
Figure 3 shows the impact of project STEP on the European-wide scale in the same year, 2030. As can be seen, there are no major shifts in gas flows as a result of building STEP, but the additional STEP capacity does see utilisation, shown encircled.
Additional French Imports
Less LNG
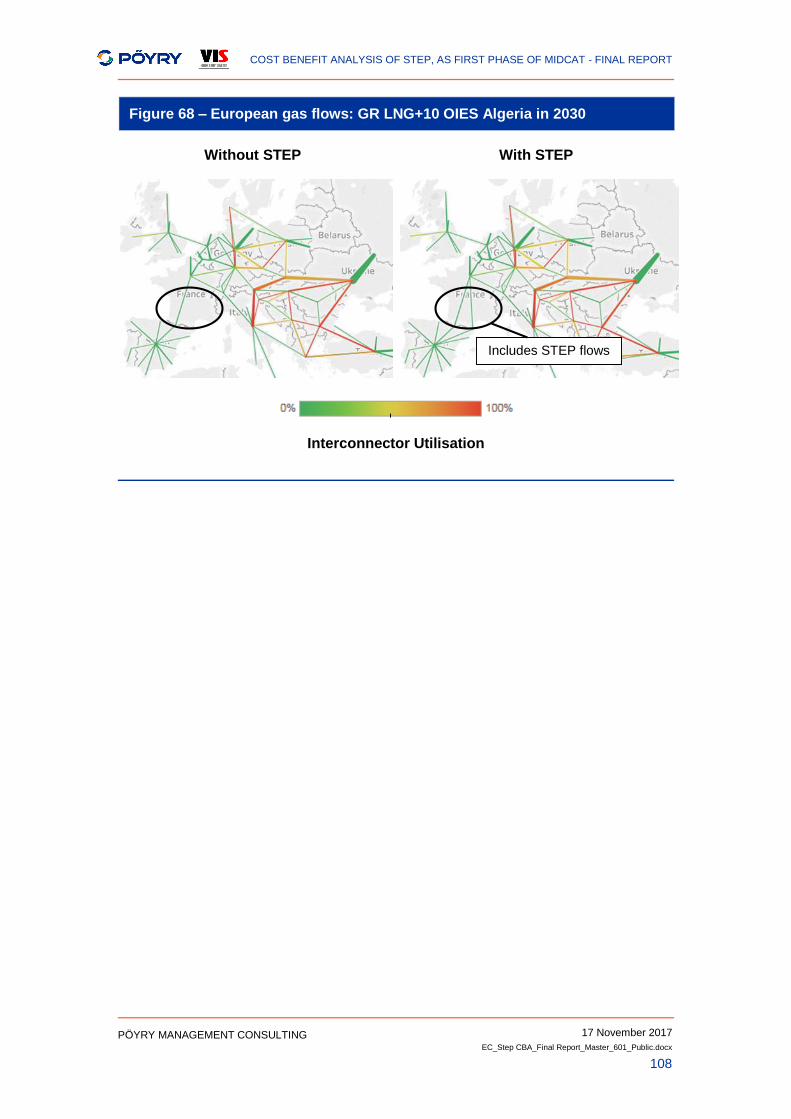
COST BENEFIT ANALYSIS OF STEP, AS FIRST PHASE OF MIDCAT - FINAL REPORT
17 November 2017
EC_Step CBA_Final Report_Master_601_Public.docx
108
PÖYRY MANAGEMENT CONSULTING
Figure 68 – European gas flows: GR LNG+10 OIES Algeria in 2030
Without STEP With STEP
Interconnector Utilisation
Includes STEP flows
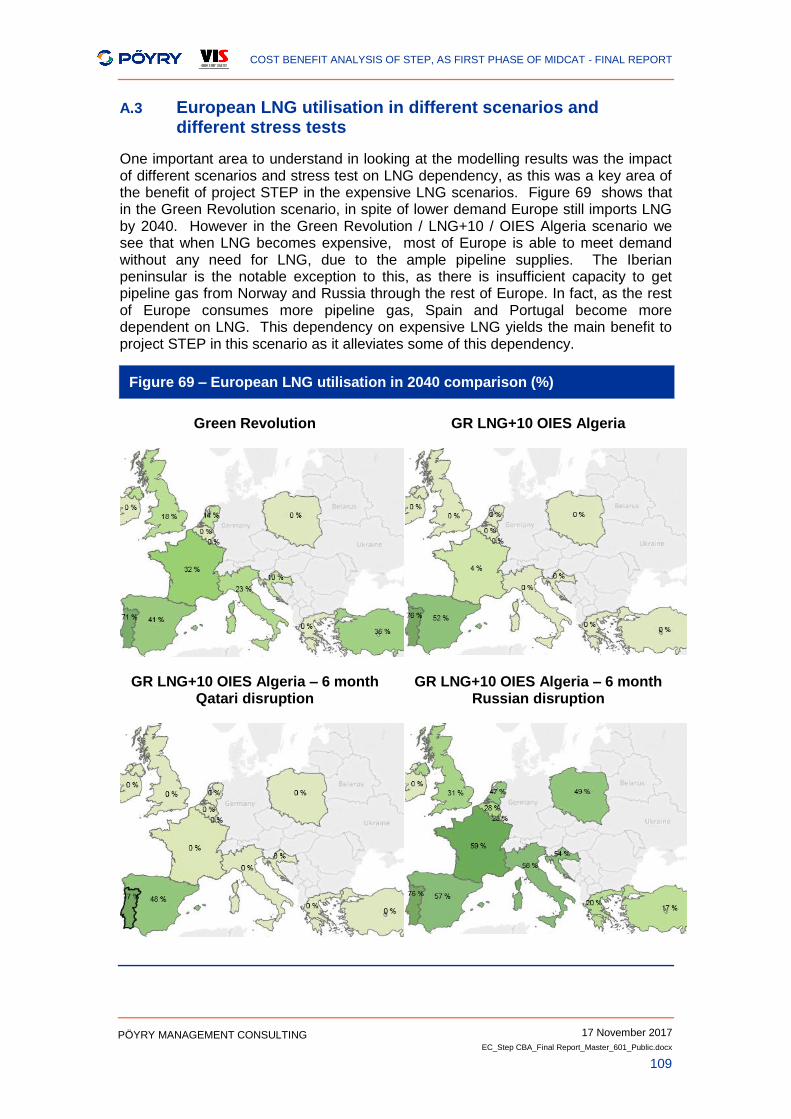
COST BENEFIT ANALYSIS OF STEP, AS FIRST PHASE OF MIDCAT - FINAL REPORT
17 November 2017
EC_Step CBA_Final Report_Master_601_Public.docx
109
PÖYRY MANAGEMENT CONSULTING
A.3 European LNG utilisation in different scenarios and different stress tests
One important area to understand in looking at the modelling results was the impact of different scenarios and stress test on LNG dependency, as this was a key area of the benefit of project STEP in the expensive LNG scenarios. Figure 69 shows that in the Green Revolution scenario, in spite of lower demand Europe still imports LNG by 2040. However in the Green Revolution / LNG+10 / OIES Algeria scenario we see that when LNG becomes expensive, most of Europe is able to meet demand without any need for LNG, due to the ample pipeline supplies. The Iberian peninsular is the notable exception to this, as there is insufficient capacity to get pipeline gas from Norway and Russia through the rest of Europe. In fact, as the rest of Europe consumes more pipeline gas, Spain and Portugal become more dependent on LNG. This dependency on expensive LNG yields the main benefit to project STEP in this scenario as it alleviates some of this dependency.
Figure 69 – European LNG utilisation in 2040 comparison (%)
Green Revolution GR LNG+10 OIES Algeria
GR LNG+10 OIES Algeria – 6 month Qatari disruption
GR LNG+10 OIES Algeria – 6 month Russian disruption

COST BENEFIT ANALYSIS OF STEP, AS FIRST PHASE OF MIDCAT - FINAL REPORT
17 November 2017
EC_Step CBA_Final Report_Master_601_Public.docx
110
PÖYRY MANAGEMENT CONSULTING
Also shown are the LNG utilisations rates in the two most extreme stress tests (6 month disruption to Qatari supplies and 6 month disruption to Russian supplies).
In the 6 month Qatari stress test, less global LNG means Spain is forced to take more pipeline gas from the North, some of which comes via STEP, giving STEP additional economic value versus the GR LNG+10 OIES Algeria scenario.
When Russian supplies are disrupted for 6 months, Europe becomes much more dependent on LNG and has less pipeline gas available for export to Iberia, meaning STEP has less economic value versus the GR LNG+10 OIES Algeria scenario.
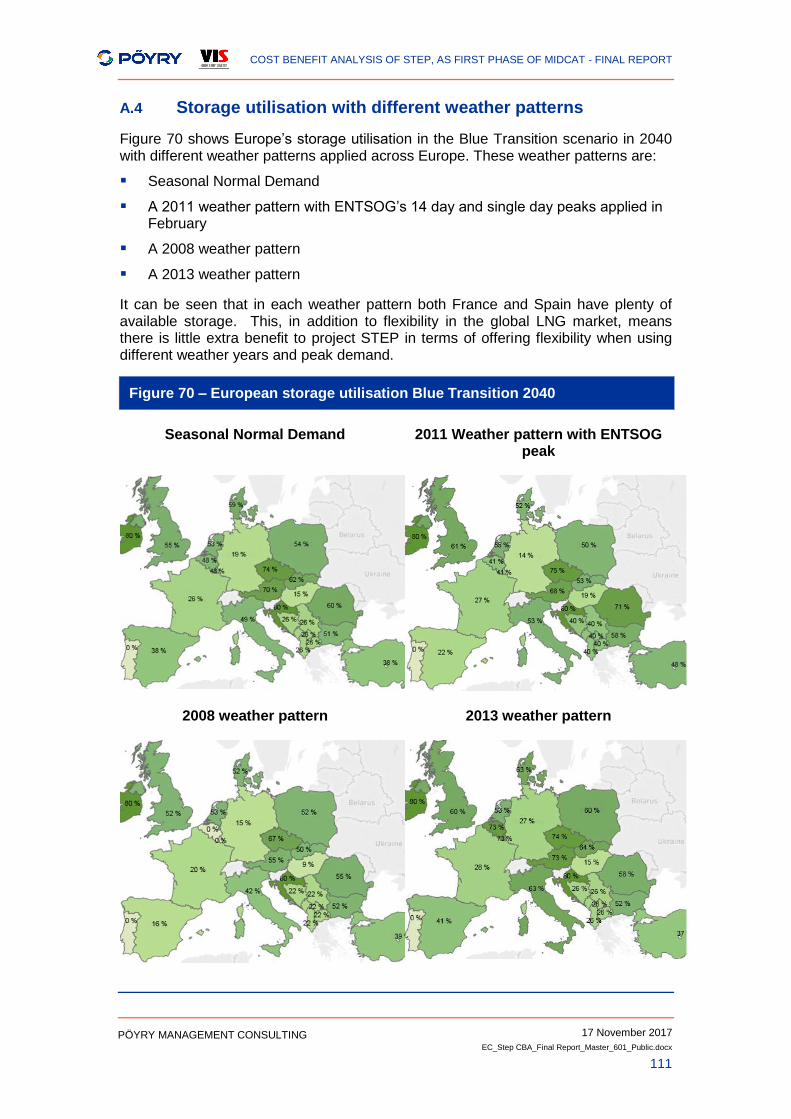
COST BENEFIT ANALYSIS OF STEP, AS FIRST PHASE OF MIDCAT - FINAL REPORT
17 November 2017
EC_Step CBA_Final Report_Master_601_Public.docx
111
PÖYRY MANAGEMENT CONSULTING
A.4 Storage utilisation with different weather patterns
Figure 70 shows Europe’s storage utilisation in the Blue Transition scenario in 2040 with different weather patterns applied across Europe. These weather patterns are:
Seasonal Normal Demand
A 2011 weather pattern with ENTSOG’s 14 day and single day peaks applied in February
A 2008 weather pattern
A 2013 weather pattern
It can be seen that in each weather pattern both France and Spain have plenty of available storage. This, in addition to flexibility in the global LNG market, means there is little extra benefit to project STEP in terms of offering flexibility when using different weather years and peak demand.
Figure 70 – European storage utilisation Blue Transition 2040
Seasonal Normal Demand 2011 Weather pattern with ENTSOG peak
2008 weather pattern 2013 weather pattern
COST BENEFIT ANALYSIS OF STEP, AS FIRST PHASE OF MIDCAT - FINAL REPORT
17 November 2017
EC_Step CBA_Final Report_Master_601_Public.docx
112
PÖYRY MANAGEMENT CONSULTING
ANNEX B – FINANCIAL ANALYSIS RESULTS
In this Annex, we describe the financial indicators examined and present the detailed of the financial analysis calculations.
The financial performance indicators examined include:
Financial Net Present Value (FNPV), which is calculated with the following formula:
𝐹𝑁𝑃𝑉 = ∑𝑃𝑖−𝑁𝑖
(1+𝐹𝐷𝑅)𝑖𝑛−1𝑖=0
where:
Pi: Positive financial cash flows in year i (including annual revenues and resisual value in the final year of analysis n)
Ci: Negative financial cash flows in year i (including investment costs and operating costs of the project)
n: Total number of years from first year of investment to final year of analysis (2020 – 2041 for STEP)
Financial Internal Rate of Return (IRR), which is the discount rate that produces a zero FNPV.
The annual revenues generated by STEP for each examined scenario are presented in Figure 71.
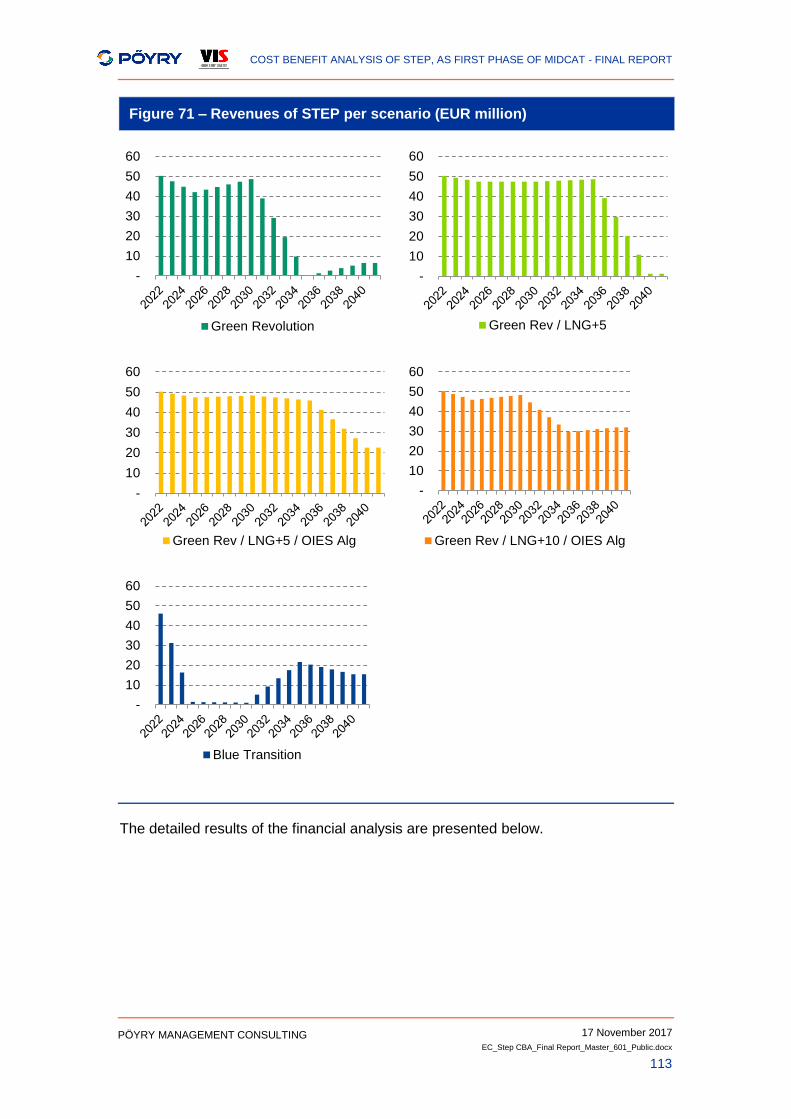
COST BENEFIT ANALYSIS OF STEP, AS FIRST PHASE OF MIDCAT - FINAL REPORT
17 November 2017
EC_Step CBA_Final Report_Master_601_Public.docx
113
PÖYRY MANAGEMENT CONSULTING
Figure 71 – Revenues of STEP per scenario (EUR million)
The detailed results of the financial analysis are presented below.
-
10
20
30
40
50
60
Green Revolution
-
10
20
30
40
50
60
Green Rev / LNG+5
-
10
20
30
40
50
60
Green Rev / LNG+5 / OIES Alg
-
10
20
30
40
50
60
Green Rev / LNG+10 / OIES Alg
-
10
20
30
40
50
60
Blue Transition
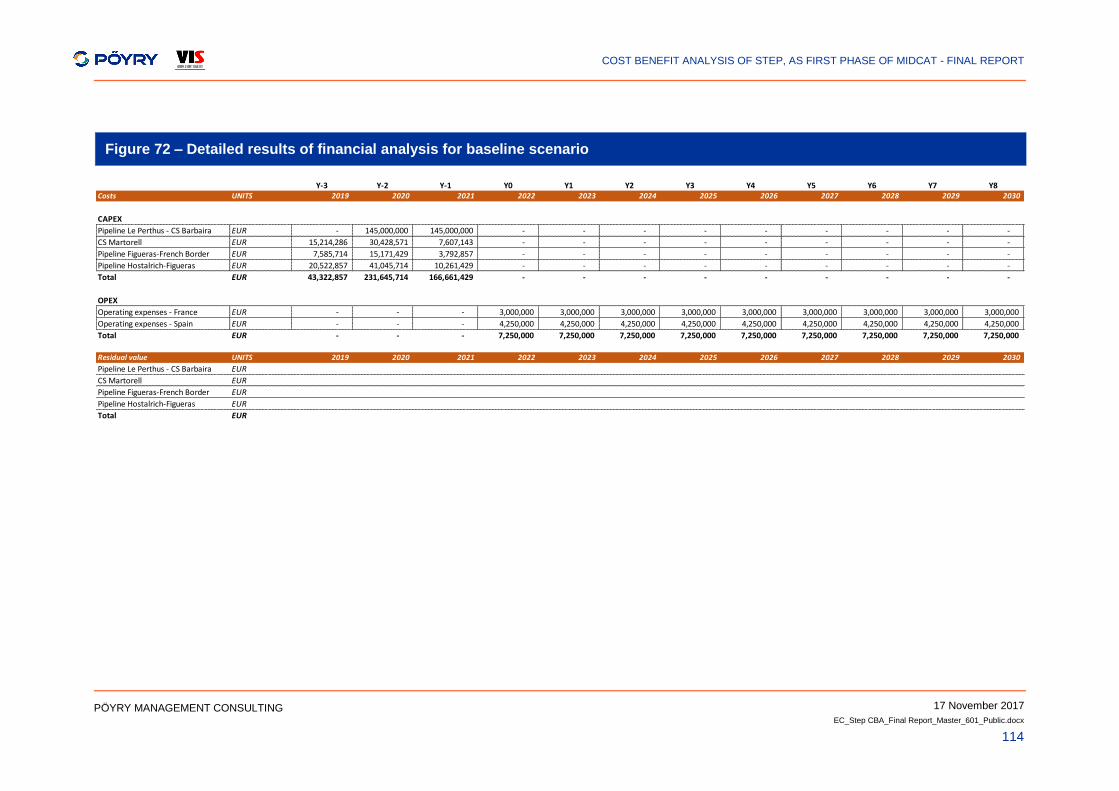
COST BENEFIT ANALYSIS OF STEP, AS FIRST PHASE OF MIDCAT - FINAL REPORT
17 November 2017
EC_Step CBA_Final Report_Master_601_Public.docx
114
PÖYRY MANAGEMENT CONSULTING
Figure 72 – Detailed results of financial analysis for baseline scenario
Y-3 Y-2 Y-1 Y0 Y1 Y2 Y3 Y4 Y5 Y6 Y7 Y8Costs UNITS 2019 2020 2021 2022 2023 2024 2025 2026 2027 2028 2029 2030
CAPEX
Pipeline Le Perthus - CS Barbaira EUR - 145,000,000 145,000,000 - - - - - - - - -
CS Martorell EUR 15,214,286 30,428,571 7,607,143 - - - - - - - - -
Pipeline Figueras-French Border EUR 7,585,714 15,171,429 3,792,857 - - - - - - - - -
Pipeline Hostalrich-Figueras EUR 20,522,857 41,045,714 10,261,429 - - - - - - - - -
Total EUR 43,322,857 231,645,714 166,661,429 - - - - - - - - -
OPEX
Operating expenses - France EUR - - - 3,000,000 3,000,000 3,000,000 3,000,000 3,000,000 3,000,000 3,000,000 3,000,000 3,000,000
Operating expenses - Spain EUR - - - 4,250,000 4,250,000 4,250,000 4,250,000 4,250,000 4,250,000 4,250,000 4,250,000 4,250,000
Total EUR - - - 7,250,000 7,250,000 7,250,000 7,250,000 7,250,000 7,250,000 7,250,000 7,250,000 7,250,000
Residual value UNITS 2019 2020 2021 2022 2023 2024 2025 2026 2027 2028 2029 2030
Pipeline Le Perthus - CS Barbaira EUR
CS Martorell EUR
Pipeline Figueras-French Border EUR
Pipeline Hostalrich-Figueras EUR
Total EUR
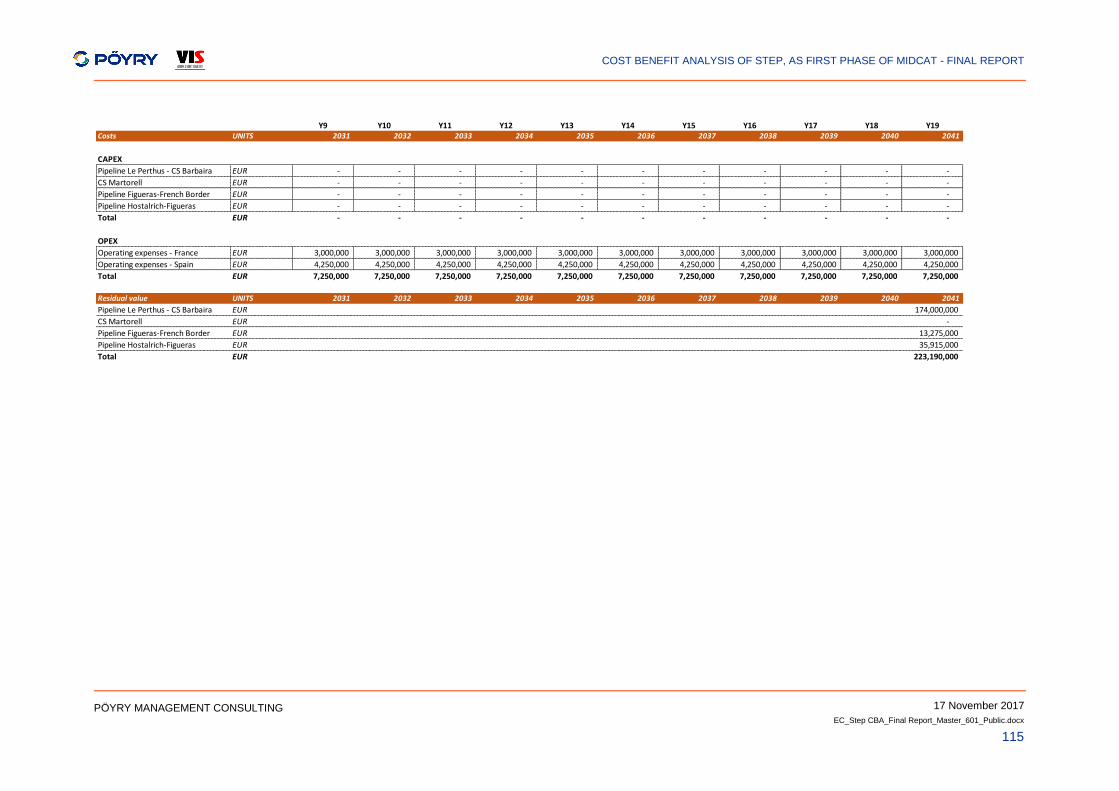
COST BENEFIT ANALYSIS OF STEP, AS FIRST PHASE OF MIDCAT - FINAL REPORT
17 November 2017
EC_Step CBA_Final Report_Master_601_Public.docx
115
PÖYRY MANAGEMENT CONSULTING
Y9 Y10 Y11 Y12 Y13 Y14 Y15 Y16 Y17 Y18 Y19Costs UNITS 2031 2032 2033 2034 2035 2036 2037 2038 2039 2040 2041
CAPEX
Pipeline Le Perthus - CS Barbaira EUR - - - - - - - - - - -
CS Martorell EUR - - - - - - - - - - -
Pipeline Figueras-French Border EUR - - - - - - - - - - -
Pipeline Hostalrich-Figueras EUR - - - - - - - - - - -
Total EUR - - - - - - - - - - -
OPEX
Operating expenses - France EUR 3,000,000 3,000,000 3,000,000 3,000,000 3,000,000 3,000,000 3,000,000 3,000,000 3,000,000 3,000,000 3,000,000
Operating expenses - Spain EUR 4,250,000 4,250,000 4,250,000 4,250,000 4,250,000 4,250,000 4,250,000 4,250,000 4,250,000 4,250,000 4,250,000
Total EUR 7,250,000 7,250,000 7,250,000 7,250,000 7,250,000 7,250,000 7,250,000 7,250,000 7,250,000 7,250,000 7,250,000
Residual value UNITS 2031 2032 2033 2034 2035 2036 2037 2038 2039 2040 2041
Pipeline Le Perthus - CS Barbaira EUR 174,000,000
CS Martorell EUR -
Pipeline Figueras-French Border EUR 13,275,000
Pipeline Hostalrich-Figueras EUR 35,915,000
Total EUR 223,190,000
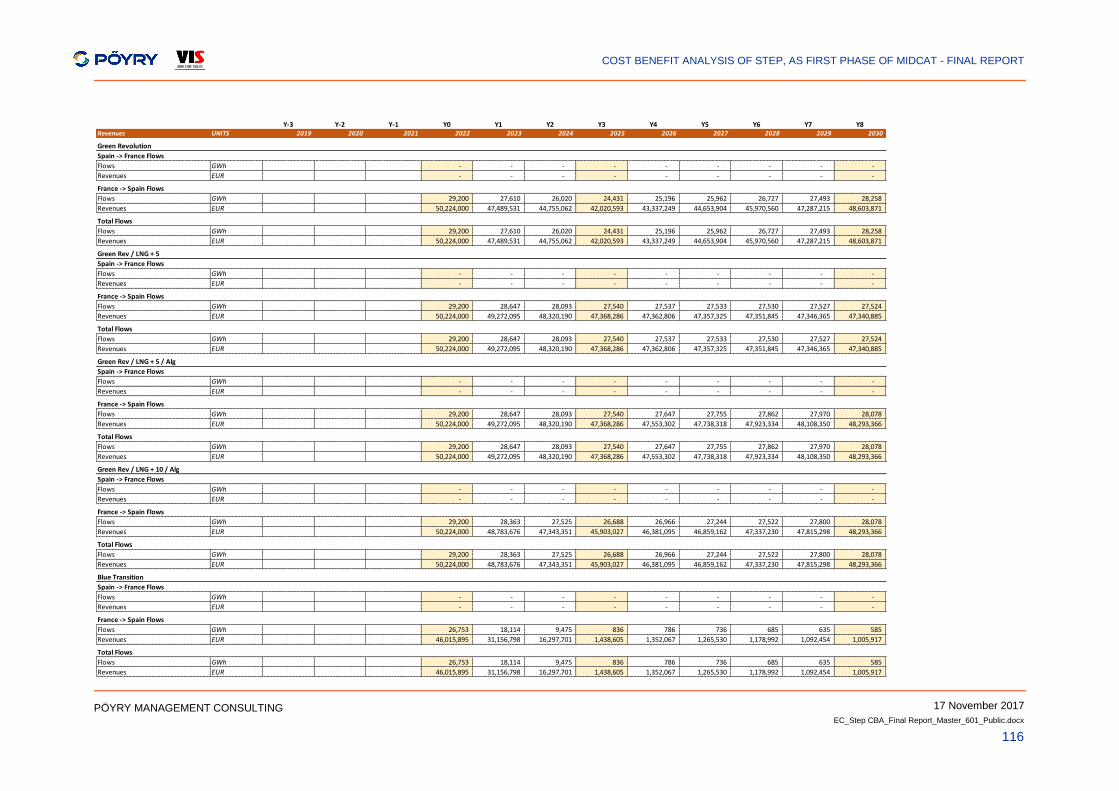
COST BENEFIT ANALYSIS OF STEP, AS FIRST PHASE OF MIDCAT - FINAL REPORT
17 November 2017
EC_Step CBA_Final Report_Master_601_Public.docx
116
PÖYRY MANAGEMENT CONSULTING
Y-3 Y-2 Y-1 Y0 Y1 Y2 Y3 Y4 Y5 Y6 Y7 Y8Revenues UNITS 2019 2020 2021 2022 2023 2024 2025 2026 2027 2028 2029 2030
Green Revolution
Spain -> France Flows
Flows GWh - - - - - - - - -
Revenues EUR - - - - - - - - -
France -> Spain Flows
Flows GWh 29,200 27,610 26,020 24,431 25,196 25,962 26,727 27,493 28,258
Revenues EUR 50,224,000 47,489,531 44,755,062 42,020,593 43,337,249 44,653,904 45,970,560 47,287,215 48,603,871
Total Flows
Flows GWh 29,200 27,610 26,020 24,431 25,196 25,962 26,727 27,493 28,258
Revenues EUR 50,224,000 47,489,531 44,755,062 42,020,593 43,337,249 44,653,904 45,970,560 47,287,215 48,603,871
Green Rev / LNG + 5
Spain -> France Flows
Flows GWh - - - - - - - - -
Revenues EUR - - - - - - - - -
France -> Spain Flows
Flows GWh 29,200 28,647 28,093 27,540 27,537 27,533 27,530 27,527 27,524
Revenues EUR 50,224,000 49,272,095 48,320,190 47,368,286 47,362,806 47,357,325 47,351,845 47,346,365 47,340,885
Total Flows
Flows GWh 29,200 28,647 28,093 27,540 27,537 27,533 27,530 27,527 27,524
Revenues EUR 50,224,000 49,272,095 48,320,190 47,368,286 47,362,806 47,357,325 47,351,845 47,346,365 47,340,885
Green Rev / LNG + 5 / Alg
Spain -> France Flows
Flows GWh - - - - - - - - -
Revenues EUR - - - - - - - - -
France -> Spain Flows
Flows GWh 29,200 28,647 28,093 27,540 27,647 27,755 27,862 27,970 28,078
Revenues EUR 50,224,000 49,272,095 48,320,190 47,368,286 47,553,302 47,738,318 47,923,334 48,108,350 48,293,366
Total Flows
Flows GWh 29,200 28,647 28,093 27,540 27,647 27,755 27,862 27,970 28,078
Revenues EUR 50,224,000 49,272,095 48,320,190 47,368,286 47,553,302 47,738,318 47,923,334 48,108,350 48,293,366
Green Rev / LNG + 10 / Alg
Spain -> France Flows
Flows GWh - - - - - - - - -
Revenues EUR - - - - - - - - -
France -> Spain Flows
Flows GWh 29,200 28,363 27,525 26,688 26,966 27,244 27,522 27,800 28,078
Revenues EUR 50,224,000 48,783,676 47,343,351 45,903,027 46,381,095 46,859,162 47,337,230 47,815,298 48,293,366
Total Flows
Flows GWh 29,200 28,363 27,525 26,688 26,966 27,244 27,522 27,800 28,078
Revenues EUR 50,224,000 48,783,676 47,343,351 45,903,027 46,381,095 46,859,162 47,337,230 47,815,298 48,293,366
Blue Transition
Spain -> France Flows
Flows GWh - - - - - - - - -
Revenues EUR - - - - - - - - -
France -> Spain Flows
Flows GWh 26,753 18,114 9,475 836 786 736 685 635 585
Revenues EUR 46,015,895 31,156,798 16,297,701 1,438,605 1,352,067 1,265,530 1,178,992 1,092,454 1,005,917
Total Flows
Flows GWh 26,753 18,114 9,475 836 786 736 685 635 585
Revenues EUR 46,015,895 31,156,798 16,297,701 1,438,605 1,352,067 1,265,530 1,178,992 1,092,454 1,005,917
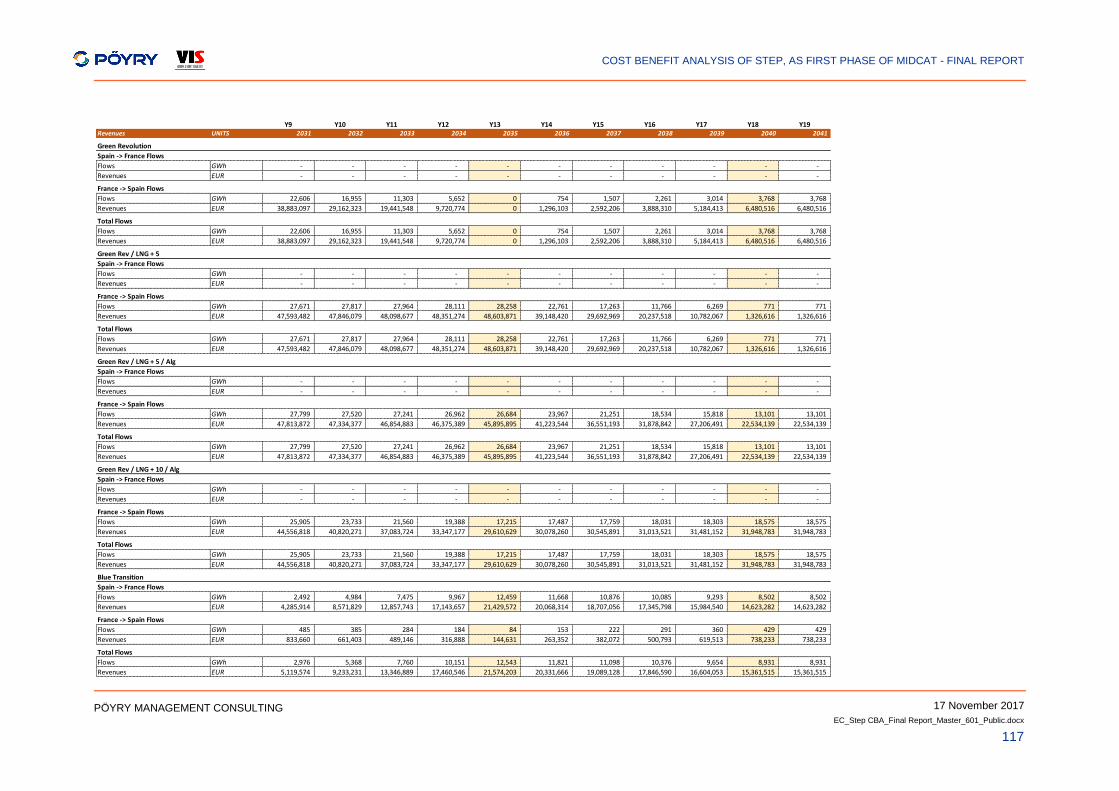
COST BENEFIT ANALYSIS OF STEP, AS FIRST PHASE OF MIDCAT - FINAL REPORT
17 November 2017
EC_Step CBA_Final Report_Master_601_Public.docx
117
PÖYRY MANAGEMENT CONSULTING
Y9 Y10 Y11 Y12 Y13 Y14 Y15 Y16 Y17 Y18 Y19Revenues UNITS 2031 2032 2033 2034 2035 2036 2037 2038 2039 2040 2041
Green Revolution
Spain -> France Flows
Flows GWh - - - - - - - - - - -
Revenues EUR - - - - - - - - - - -
France -> Spain Flows
Flows GWh 22,606 16,955 11,303 5,652 0 754 1,507 2,261 3,014 3,768 3,768
Revenues EUR 38,883,097 29,162,323 19,441,548 9,720,774 0 1,296,103 2,592,206 3,888,310 5,184,413 6,480,516 6,480,516
Total Flows
Flows GWh 22,606 16,955 11,303 5,652 0 754 1,507 2,261 3,014 3,768 3,768
Revenues EUR 38,883,097 29,162,323 19,441,548 9,720,774 0 1,296,103 2,592,206 3,888,310 5,184,413 6,480,516 6,480,516
Green Rev / LNG + 5
Spain -> France Flows
Flows GWh - - - - - - - - - - -
Revenues EUR - - - - - - - - - - -
France -> Spain Flows
Flows GWh 27,671 27,817 27,964 28,111 28,258 22,761 17,263 11,766 6,269 771 771
Revenues EUR 47,593,482 47,846,079 48,098,677 48,351,274 48,603,871 39,148,420 29,692,969 20,237,518 10,782,067 1,326,616 1,326,616
Total Flows
Flows GWh 27,671 27,817 27,964 28,111 28,258 22,761 17,263 11,766 6,269 771 771
Revenues EUR 47,593,482 47,846,079 48,098,677 48,351,274 48,603,871 39,148,420 29,692,969 20,237,518 10,782,067 1,326,616 1,326,616
Green Rev / LNG + 5 / Alg
Spain -> France Flows
Flows GWh - - - - - - - - - - -
Revenues EUR - - - - - - - - - - -
France -> Spain Flows
Flows GWh 27,799 27,520 27,241 26,962 26,684 23,967 21,251 18,534 15,818 13,101 13,101
Revenues EUR 47,813,872 47,334,377 46,854,883 46,375,389 45,895,895 41,223,544 36,551,193 31,878,842 27,206,491 22,534,139 22,534,139
Total Flows
Flows GWh 27,799 27,520 27,241 26,962 26,684 23,967 21,251 18,534 15,818 13,101 13,101
Revenues EUR 47,813,872 47,334,377 46,854,883 46,375,389 45,895,895 41,223,544 36,551,193 31,878,842 27,206,491 22,534,139 22,534,139
Green Rev / LNG + 10 / Alg
Spain -> France Flows
Flows GWh - - - - - - - - - - -
Revenues EUR - - - - - - - - - - -
France -> Spain Flows
Flows GWh 25,905 23,733 21,560 19,388 17,215 17,487 17,759 18,031 18,303 18,575 18,575
Revenues EUR 44,556,818 40,820,271 37,083,724 33,347,177 29,610,629 30,078,260 30,545,891 31,013,521 31,481,152 31,948,783 31,948,783
Total Flows
Flows GWh 25,905 23,733 21,560 19,388 17,215 17,487 17,759 18,031 18,303 18,575 18,575
Revenues EUR 44,556,818 40,820,271 37,083,724 33,347,177 29,610,629 30,078,260 30,545,891 31,013,521 31,481,152 31,948,783 31,948,783
Blue Transition
Spain -> France Flows
Flows GWh 2,492 4,984 7,475 9,967 12,459 11,668 10,876 10,085 9,293 8,502 8,502
Revenues EUR 4,285,914 8,571,829 12,857,743 17,143,657 21,429,572 20,068,314 18,707,056 17,345,798 15,984,540 14,623,282 14,623,282
France -> Spain Flows
Flows GWh 485 385 284 184 84 153 222 291 360 429 429
Revenues EUR 833,660 661,403 489,146 316,888 144,631 263,352 382,072 500,793 619,513 738,233 738,233
Total Flows
Flows GWh 2,976 5,368 7,760 10,151 12,543 11,821 11,098 10,376 9,654 8,931 8,931
Revenues EUR 5,119,574 9,233,231 13,346,889 17,460,546 21,574,203 20,331,666 19,089,128 17,846,590 16,604,053 15,361,515 15,361,515
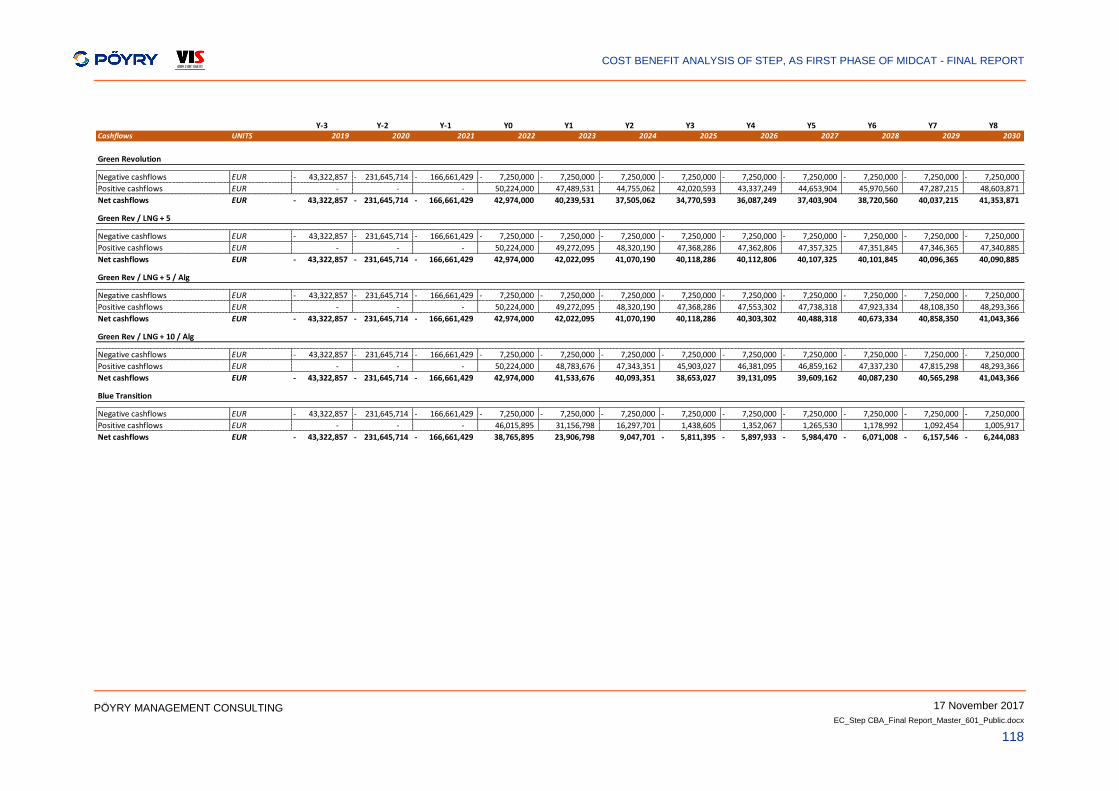
COST BENEFIT ANALYSIS OF STEP, AS FIRST PHASE OF MIDCAT - FINAL REPORT
17 November 2017
EC_Step CBA_Final Report_Master_601_Public.docx
118
PÖYRY MANAGEMENT CONSULTING
Y-3 Y-2 Y-1 Y0 Y1 Y2 Y3 Y4 Y5 Y6 Y7 Y8Cashflows UNITS 2019 2020 2021 2022 2023 2024 2025 2026 2027 2028 2029 2030
Green Revolution
Negative cashflows EUR 43,322,857- 231,645,714- 166,661,429- 7,250,000- 7,250,000- 7,250,000- 7,250,000- 7,250,000- 7,250,000- 7,250,000- 7,250,000- 7,250,000-
Positive cashflows EUR - - - 50,224,000 47,489,531 44,755,062 42,020,593 43,337,249 44,653,904 45,970,560 47,287,215 48,603,871
Net cashflows EUR 43,322,857- 231,645,714- 166,661,429- 42,974,000 40,239,531 37,505,062 34,770,593 36,087,249 37,403,904 38,720,560 40,037,215 41,353,871
Green Rev / LNG + 5
Negative cashflows EUR 43,322,857- 231,645,714- 166,661,429- 7,250,000- 7,250,000- 7,250,000- 7,250,000- 7,250,000- 7,250,000- 7,250,000- 7,250,000- 7,250,000-
Positive cashflows EUR - - - 50,224,000 49,272,095 48,320,190 47,368,286 47,362,806 47,357,325 47,351,845 47,346,365 47,340,885
Net cashflows EUR 43,322,857- 231,645,714- 166,661,429- 42,974,000 42,022,095 41,070,190 40,118,286 40,112,806 40,107,325 40,101,845 40,096,365 40,090,885
Green Rev / LNG + 5 / Alg
Negative cashflows EUR 43,322,857- 231,645,714- 166,661,429- 7,250,000- 7,250,000- 7,250,000- 7,250,000- 7,250,000- 7,250,000- 7,250,000- 7,250,000- 7,250,000-
Positive cashflows EUR - - - 50,224,000 49,272,095 48,320,190 47,368,286 47,553,302 47,738,318 47,923,334 48,108,350 48,293,366
Net cashflows EUR 43,322,857- 231,645,714- 166,661,429- 42,974,000 42,022,095 41,070,190 40,118,286 40,303,302 40,488,318 40,673,334 40,858,350 41,043,366
Green Rev / LNG + 10 / Alg
Negative cashflows EUR 43,322,857- 231,645,714- 166,661,429- 7,250,000- 7,250,000- 7,250,000- 7,250,000- 7,250,000- 7,250,000- 7,250,000- 7,250,000- 7,250,000-
Positive cashflows EUR - - - 50,224,000 48,783,676 47,343,351 45,903,027 46,381,095 46,859,162 47,337,230 47,815,298 48,293,366
Net cashflows EUR 43,322,857- 231,645,714- 166,661,429- 42,974,000 41,533,676 40,093,351 38,653,027 39,131,095 39,609,162 40,087,230 40,565,298 41,043,366
Blue Transition
Negative cashflows EUR 43,322,857- 231,645,714- 166,661,429- 7,250,000- 7,250,000- 7,250,000- 7,250,000- 7,250,000- 7,250,000- 7,250,000- 7,250,000- 7,250,000-
Positive cashflows EUR - - - 46,015,895 31,156,798 16,297,701 1,438,605 1,352,067 1,265,530 1,178,992 1,092,454 1,005,917
Net cashflows EUR 43,322,857- 231,645,714- 166,661,429- 38,765,895 23,906,798 9,047,701 5,811,395- 5,897,933- 5,984,470- 6,071,008- 6,157,546- 6,244,083-
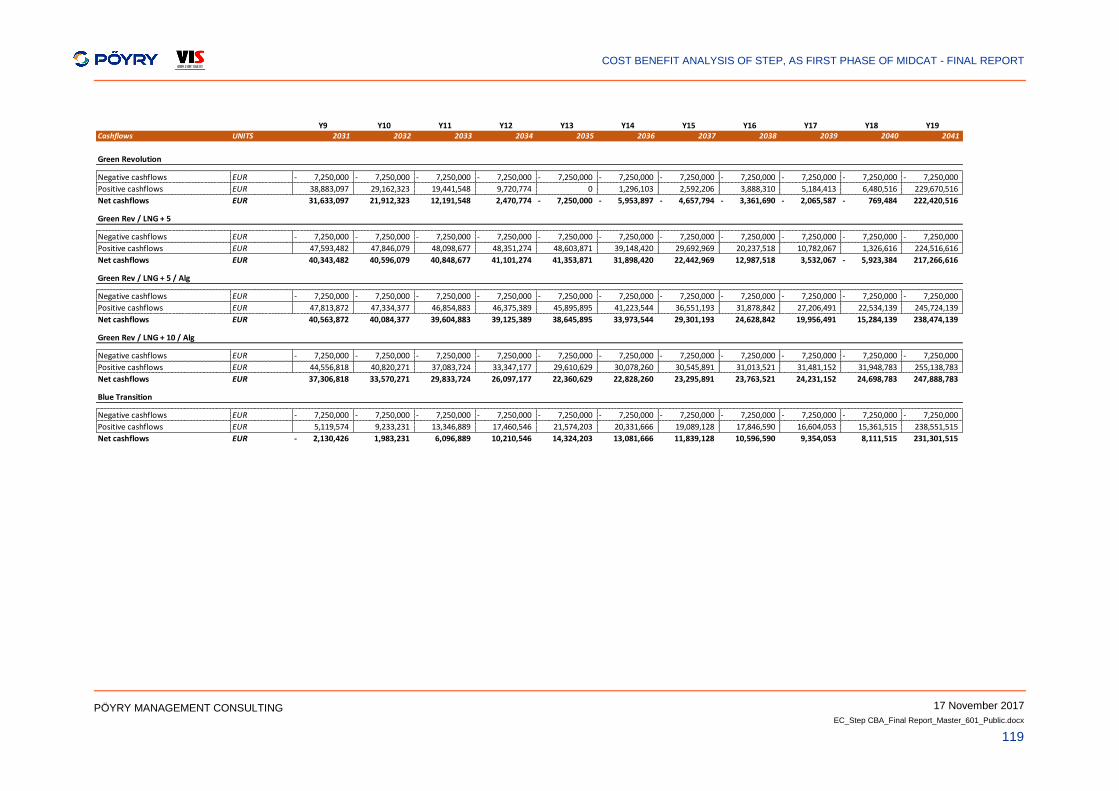
COST BENEFIT ANALYSIS OF STEP, AS FIRST PHASE OF MIDCAT - FINAL REPORT
17 November 2017
EC_Step CBA_Final Report_Master_601_Public.docx
119
PÖYRY MANAGEMENT CONSULTING
Y9 Y10 Y11 Y12 Y13 Y14 Y15 Y16 Y17 Y18 Y19Cashflows UNITS 2031 2032 2033 2034 2035 2036 2037 2038 2039 2040 2041
Green Revolution
Negative cashflows EUR 7,250,000- 7,250,000- 7,250,000- 7,250,000- 7,250,000- 7,250,000- 7,250,000- 7,250,000- 7,250,000- 7,250,000- 7,250,000-
Positive cashflows EUR 38,883,097 29,162,323 19,441,548 9,720,774 0 1,296,103 2,592,206 3,888,310 5,184,413 6,480,516 229,670,516
Net cashflows EUR 31,633,097 21,912,323 12,191,548 2,470,774 7,250,000- 5,953,897- 4,657,794- 3,361,690- 2,065,587- 769,484- 222,420,516
Green Rev / LNG + 5
Negative cashflows EUR 7,250,000- 7,250,000- 7,250,000- 7,250,000- 7,250,000- 7,250,000- 7,250,000- 7,250,000- 7,250,000- 7,250,000- 7,250,000-
Positive cashflows EUR 47,593,482 47,846,079 48,098,677 48,351,274 48,603,871 39,148,420 29,692,969 20,237,518 10,782,067 1,326,616 224,516,616
Net cashflows EUR 40,343,482 40,596,079 40,848,677 41,101,274 41,353,871 31,898,420 22,442,969 12,987,518 3,532,067 5,923,384- 217,266,616
Green Rev / LNG + 5 / Alg
Negative cashflows EUR 7,250,000- 7,250,000- 7,250,000- 7,250,000- 7,250,000- 7,250,000- 7,250,000- 7,250,000- 7,250,000- 7,250,000- 7,250,000-
Positive cashflows EUR 47,813,872 47,334,377 46,854,883 46,375,389 45,895,895 41,223,544 36,551,193 31,878,842 27,206,491 22,534,139 245,724,139
Net cashflows EUR 40,563,872 40,084,377 39,604,883 39,125,389 38,645,895 33,973,544 29,301,193 24,628,842 19,956,491 15,284,139 238,474,139
Green Rev / LNG + 10 / Alg
Negative cashflows EUR 7,250,000- 7,250,000- 7,250,000- 7,250,000- 7,250,000- 7,250,000- 7,250,000- 7,250,000- 7,250,000- 7,250,000- 7,250,000-
Positive cashflows EUR 44,556,818 40,820,271 37,083,724 33,347,177 29,610,629 30,078,260 30,545,891 31,013,521 31,481,152 31,948,783 255,138,783
Net cashflows EUR 37,306,818 33,570,271 29,833,724 26,097,177 22,360,629 22,828,260 23,295,891 23,763,521 24,231,152 24,698,783 247,888,783
Blue Transition
Negative cashflows EUR 7,250,000- 7,250,000- 7,250,000- 7,250,000- 7,250,000- 7,250,000- 7,250,000- 7,250,000- 7,250,000- 7,250,000- 7,250,000-
Positive cashflows EUR 5,119,574 9,233,231 13,346,889 17,460,546 21,574,203 20,331,666 19,089,128 17,846,590 16,604,053 15,361,515 238,551,515
Net cashflows EUR 2,130,426- 1,983,231 6,096,889 10,210,546 14,324,203 13,081,666 11,839,128 10,596,590 9,354,053 8,111,515 231,301,515
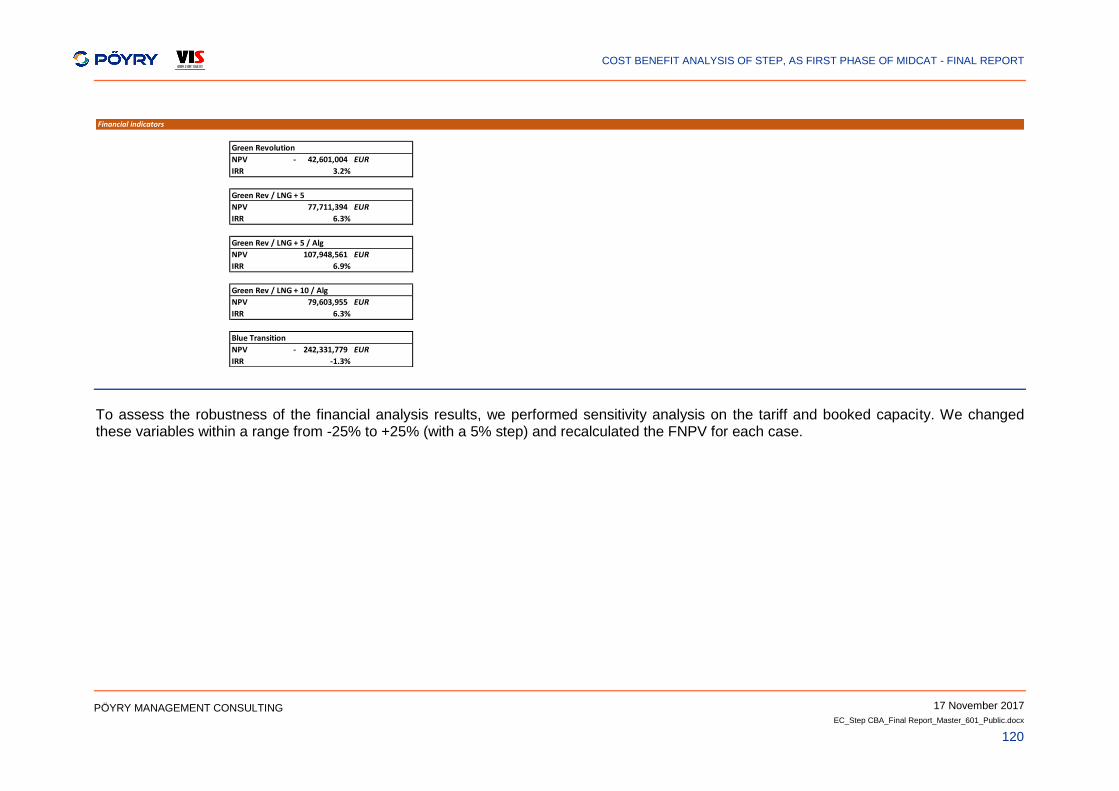
COST BENEFIT ANALYSIS OF STEP, AS FIRST PHASE OF MIDCAT - FINAL REPORT
17 November 2017
EC_Step CBA_Final Report_Master_601_Public.docx
120
PÖYRY MANAGEMENT CONSULTING
To assess the robustness of the financial analysis results, we performed sensitivity analysis on the tariff and booked capacity. We changed these variables within a range from -25% to +25% (with a 5% step) and recalculated the FNPV for each case.
Financial indicators
Green Revolution
NPV 42,601,004- EUR
IRR 3.2%
Green Rev / LNG + 5
NPV 77,711,394 EUR
IRR 6.3%
Green Rev / LNG + 5 / Alg
NPV 107,948,561 EUR
IRR 6.9%
Green Rev / LNG + 10 / Alg
NPV 79,603,955 EUR
IRR 6.3%
Blue Transition
NPV 242,331,779- EUR
IRR -1.3%
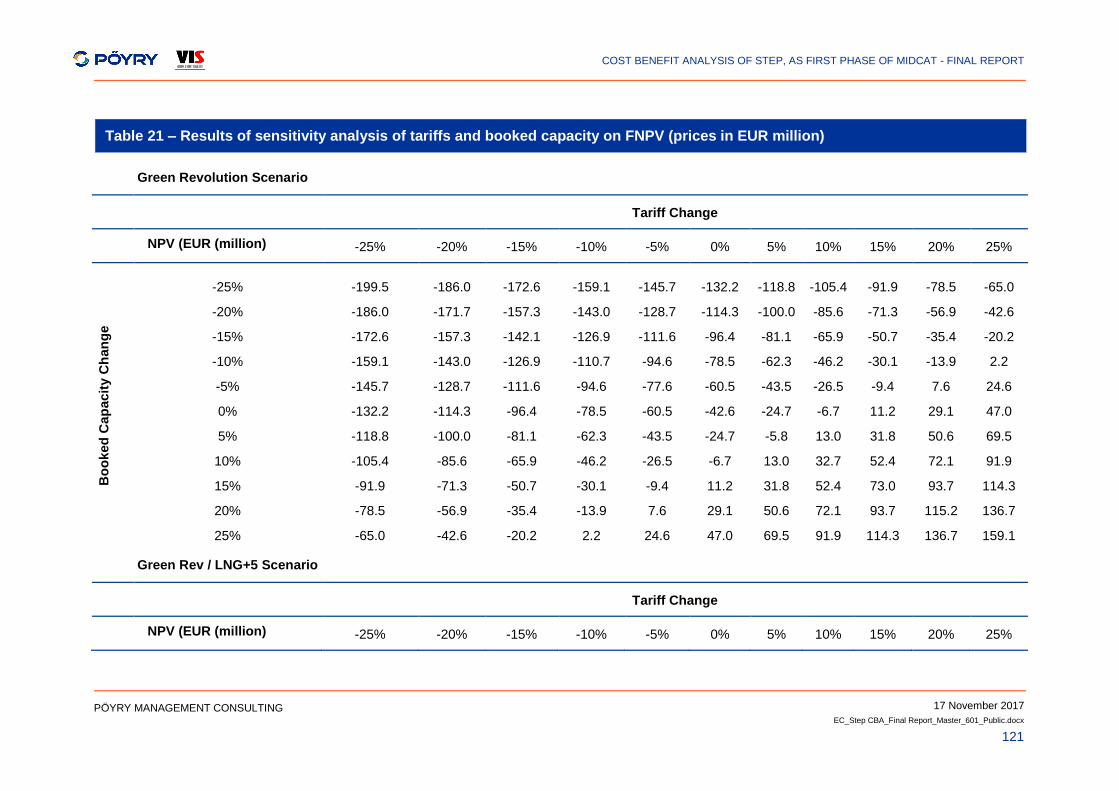
COST BENEFIT ANALYSIS OF STEP, AS FIRST PHASE OF MIDCAT - FINAL REPORT
17 November 2017
EC_Step CBA_Final Report_Master_601_Public.docx
121
PÖYRY MANAGEMENT CONSULTING
Table 21 – Results of sensitivity analysis of tariffs and booked capacity on FNPV (prices in EUR million)
Green Revolution Scenario
Tariff Change
NPV (EUR (million) -25% -20% -15% -10% -5% 0% 5% 10% 15% 20% 25%
Bo
oked
Cap
acit
y C
han
ge
-25% -199.5 -186.0 -172.6 -159.1 -145.7 -132.2 -118.8 -105.4 -91.9 -78.5 -65.0
-20% -186.0 -171.7 -157.3 -143.0 -128.7 -114.3 -100.0 -85.6 -71.3 -56.9 -42.6
-15% -172.6 -157.3 -142.1 -126.9 -111.6 -96.4 -81.1 -65.9 -50.7 -35.4 -20.2
-10% -159.1 -143.0 -126.9 -110.7 -94.6 -78.5 -62.3 -46.2 -30.1 -13.9 2.2
-5% -145.7 -128.7 -111.6 -94.6 -77.6 -60.5 -43.5 -26.5 -9.4 7.6 24.6
0% -132.2 -114.3 -96.4 -78.5 -60.5 -42.6 -24.7 -6.7 11.2 29.1 47.0
5% -118.8 -100.0 -81.1 -62.3 -43.5 -24.7 -5.8 13.0 31.8 50.6 69.5
10% -105.4 -85.6 -65.9 -46.2 -26.5 -6.7 13.0 32.7 52.4 72.1 91.9
15% -91.9 -71.3 -50.7 -30.1 -9.4 11.2 31.8 52.4 73.0 93.7 114.3
20% -78.5 -56.9 -35.4 -13.9 7.6 29.1 50.6 72.1 93.7 115.2 136.7
25% -65.0 -42.6 -20.2 2.2 24.6 47.0 69.5 91.9 114.3 136.7 159.1
Green Rev / LNG+5 Scenario
Tariff Change
NPV (EUR (million) -25% -20% -15% -10% -5% 0% 5% 10% 15% 20% 25%
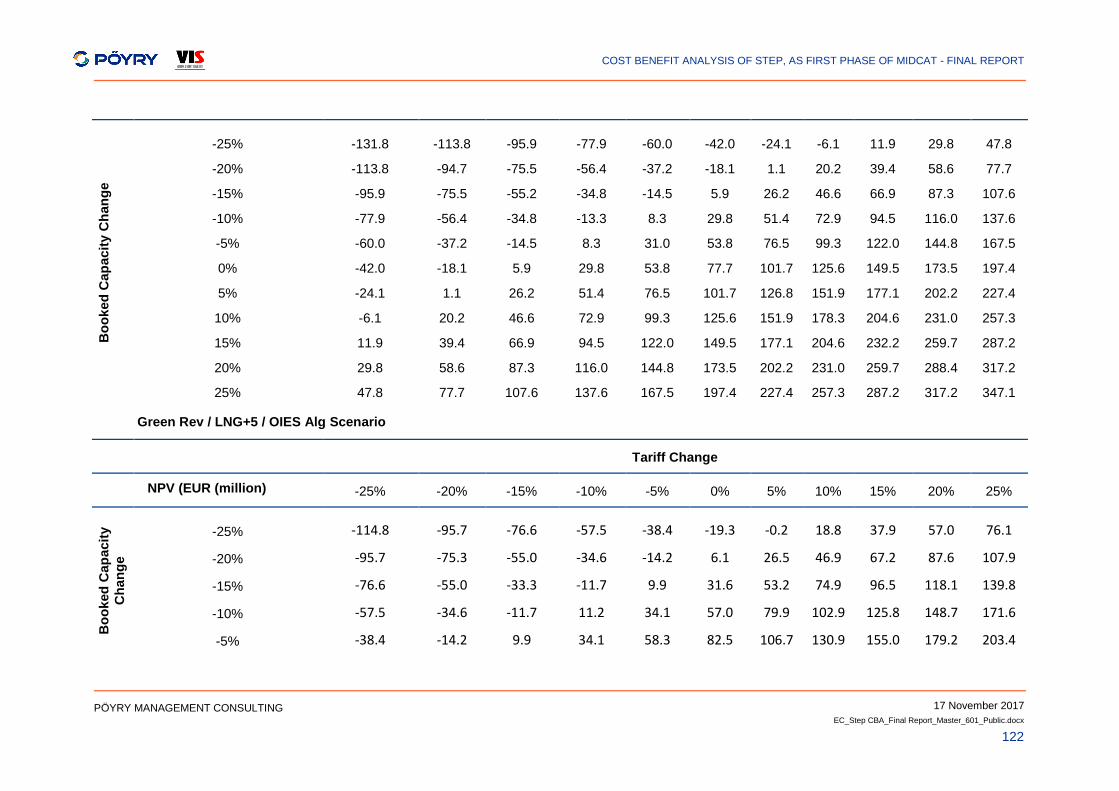
COST BENEFIT ANALYSIS OF STEP, AS FIRST PHASE OF MIDCAT - FINAL REPORT
17 November 2017
EC_Step CBA_Final Report_Master_601_Public.docx
122
PÖYRY MANAGEMENT CONSULTING
Bo
ok
ed
Cap
acit
y C
han
ge
-25% -131.8 -113.8 -95.9 -77.9 -60.0 -42.0 -24.1 -6.1 11.9 29.8 47.8
-20% -113.8 -94.7 -75.5 -56.4 -37.2 -18.1 1.1 20.2 39.4 58.6 77.7
-15% -95.9 -75.5 -55.2 -34.8 -14.5 5.9 26.2 46.6 66.9 87.3 107.6
-10% -77.9 -56.4 -34.8 -13.3 8.3 29.8 51.4 72.9 94.5 116.0 137.6
-5% -60.0 -37.2 -14.5 8.3 31.0 53.8 76.5 99.3 122.0 144.8 167.5
0% -42.0 -18.1 5.9 29.8 53.8 77.7 101.7 125.6 149.5 173.5 197.4
5% -24.1 1.1 26.2 51.4 76.5 101.7 126.8 151.9 177.1 202.2 227.4
10% -6.1 20.2 46.6 72.9 99.3 125.6 151.9 178.3 204.6 231.0 257.3
15% 11.9 39.4 66.9 94.5 122.0 149.5 177.1 204.6 232.2 259.7 287.2
20% 29.8 58.6 87.3 116.0 144.8 173.5 202.2 231.0 259.7 288.4 317.2
25% 47.8 77.7 107.6 137.6 167.5 197.4 227.4 257.3 287.2 317.2 347.1
Green Rev / LNG+5 / OIES Alg Scenario
Tariff Change
NPV (EUR (million) -25% -20% -15% -10% -5% 0% 5% 10% 15% 20% 25%
Bo
oked
Cap
acit
y
Ch
an
ge
-25% -114.8 -95.7 -76.6 -57.5 -38.4 -19.3 -0.2 18.8 37.9 57.0 76.1
-20% -95.7 -75.3 -55.0 -34.6 -14.2 6.1 26.5 46.9 67.2 87.6 107.9
-15% -76.6 -55.0 -33.3 -11.7 9.9 31.6 53.2 74.9 96.5 118.1 139.8
-10% -57.5 -34.6 -11.7 11.2 34.1 57.0 79.9 102.9 125.8 148.7 171.6
-5% -38.4 -14.2 9.9 34.1 58.3 82.5 106.7 130.9 155.0 179.2 203.4
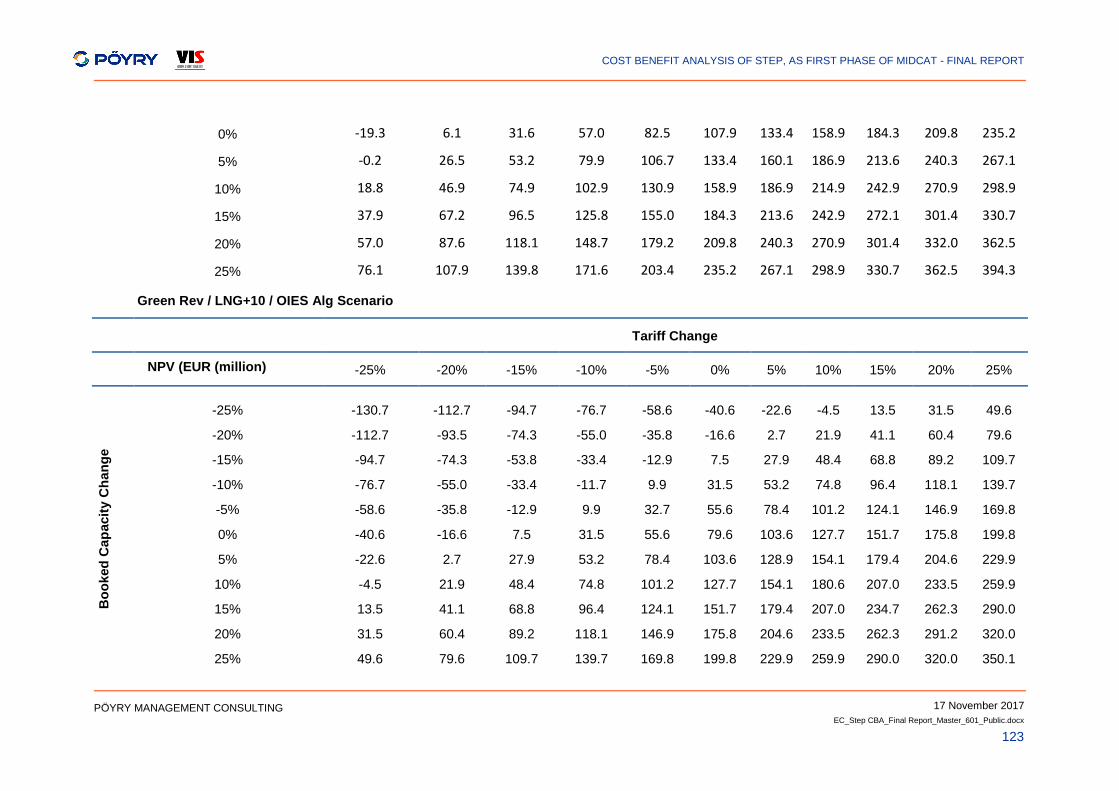
COST BENEFIT ANALYSIS OF STEP, AS FIRST PHASE OF MIDCAT - FINAL REPORT
17 November 2017
EC_Step CBA_Final Report_Master_601_Public.docx
123
PÖYRY MANAGEMENT CONSULTING
0% -19.3 6.1 31.6 57.0 82.5 107.9 133.4 158.9 184.3 209.8 235.2
5% -0.2 26.5 53.2 79.9 106.7 133.4 160.1 186.9 213.6 240.3 267.1
10% 18.8 46.9 74.9 102.9 130.9 158.9 186.9 214.9 242.9 270.9 298.9
15% 37.9 67.2 96.5 125.8 155.0 184.3 213.6 242.9 272.1 301.4 330.7
20% 57.0 87.6 118.1 148.7 179.2 209.8 240.3 270.9 301.4 332.0 362.5
25% 76.1 107.9 139.8 171.6 203.4 235.2 267.1 298.9 330.7 362.5 394.3
Green Rev / LNG+10 / OIES Alg Scenario
Tariff Change
NPV (EUR (million) -25% -20% -15% -10% -5% 0% 5% 10% 15% 20% 25%
Bo
oked
Ca
pacit
y C
han
ge
-25% -130.7 -112.7 -94.7 -76.7 -58.6 -40.6 -22.6 -4.5 13.5 31.5 49.6
-20% -112.7 -93.5 -74.3 -55.0 -35.8 -16.6 2.7 21.9 41.1 60.4 79.6
-15% -94.7 -74.3 -53.8 -33.4 -12.9 7.5 27.9 48.4 68.8 89.2 109.7
-10% -76.7 -55.0 -33.4 -11.7 9.9 31.5 53.2 74.8 96.4 118.1 139.7
-5% -58.6 -35.8 -12.9 9.9 32.7 55.6 78.4 101.2 124.1 146.9 169.8
0% -40.6 -16.6 7.5 31.5 55.6 79.6 103.6 127.7 151.7 175.8 199.8
5% -22.6 2.7 27.9 53.2 78.4 103.6 128.9 154.1 179.4 204.6 229.9
10% -4.5 21.9 48.4 74.8 101.2 127.7 154.1 180.6 207.0 233.5 259.9
15% 13.5 41.1 68.8 96.4 124.1 151.7 179.4 207.0 234.7 262.3 290.0
20% 31.5 60.4 89.2 118.1 146.9 175.8 204.6 233.5 262.3 291.2 320.0
25% 49.6 79.6 109.7 139.7 169.8 199.8 229.9 259.9 290.0 320.0 350.1
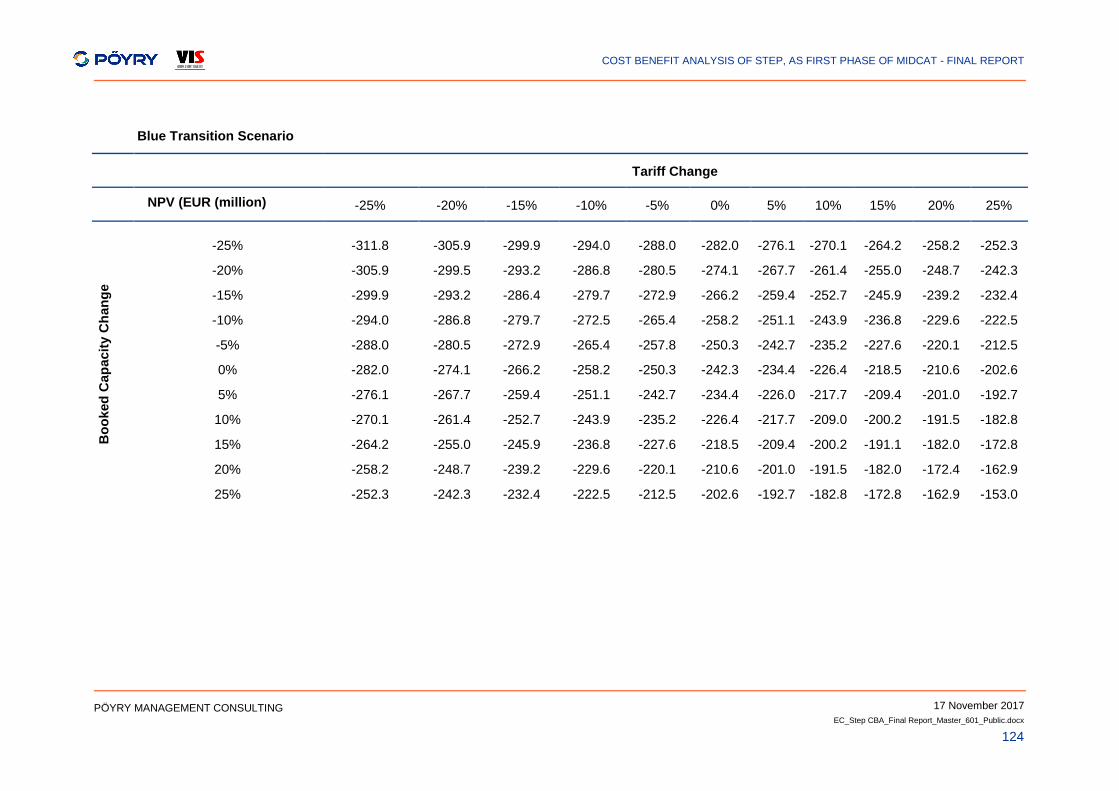
COST BENEFIT ANALYSIS OF STEP, AS FIRST PHASE OF MIDCAT - FINAL REPORT
17 November 2017
EC_Step CBA_Final Report_Master_601_Public.docx
124
PÖYRY MANAGEMENT CONSULTING
Blue Transition Scenario
Tariff Change
NPV (EUR (million) -25% -20% -15% -10% -5% 0% 5% 10% 15% 20% 25%
Bo
oked
Cap
acit
y C
han
ge
-25% -311.8 -305.9 -299.9 -294.0 -288.0 -282.0 -276.1 -270.1 -264.2 -258.2 -252.3
-20% -305.9 -299.5 -293.2 -286.8 -280.5 -274.1 -267.7 -261.4 -255.0 -248.7 -242.3
-15% -299.9 -293.2 -286.4 -279.7 -272.9 -266.2 -259.4 -252.7 -245.9 -239.2 -232.4
-10% -294.0 -286.8 -279.7 -272.5 -265.4 -258.2 -251.1 -243.9 -236.8 -229.6 -222.5
-5% -288.0 -280.5 -272.9 -265.4 -257.8 -250.3 -242.7 -235.2 -227.6 -220.1 -212.5
0% -282.0 -274.1 -266.2 -258.2 -250.3 -242.3 -234.4 -226.4 -218.5 -210.6 -202.6
5% -276.1 -267.7 -259.4 -251.1 -242.7 -234.4 -226.0 -217.7 -209.4 -201.0 -192.7
10% -270.1 -261.4 -252.7 -243.9 -235.2 -226.4 -217.7 -209.0 -200.2 -191.5 -182.8
15% -264.2 -255.0 -245.9 -236.8 -227.6 -218.5 -209.4 -200.2 -191.1 -182.0 -172.8
20% -258.2 -248.7 -239.2 -229.6 -220.1 -210.6 -201.0 -191.5 -182.0 -172.4 -162.9
25% -252.3 -242.3 -232.4 -222.5 -212.5 -202.6 -192.7 -182.8 -172.8 -162.9 -153.0
COST BENEFIT ANALYSIS OF STEP, AS FIRST PHASE OF MIDCAT - FINAL REPORT
17 November 2017
EC_Step CBA_Final Report_Master_601_Public.docx
125
PÖYRY MANAGEMENT CONSULTING
ANNEX C – ECONOMIC ANALYSIS RESULTS
In this Annex, we describe the economic indicators examined and present the detailed of the economic analysis calculations.
The economic performance indicators examined include:
Economic Net Present Value (ENPV): the difference between the discounted total social benefits and costs, calculated with the following formula:
𝐸𝑁𝑃𝑉 = ∑𝑃𝐸𝑖−𝑁𝑖
(1+𝑆𝐷𝑅)𝑖𝑛−1𝑖=0
where:
PEi: Positive economic cash flows in year i (including annual monetized benefits and resisual value in the final year of analysis n)
Ci: Negative cash flows in year i (including investment costs and operating costs of the project)
n: Total number of years from first year of investment to final year of analysis (2020 – 2041 for STEP)
Economic Internal Rate of Return (ERR), which is the discount rate that produces a zero ENPV.
Benefit to Cost Ratio (B/C): the ratio between discounted economic benefits and costs, calculated with the following formula:
𝐵/𝐶 =
∑𝑃𝐸𝑖
(1 + 𝑆𝐷𝑅)𝑖𝑛−1𝑖=0
∑𝑁𝑖
(1 + 𝑆𝐷𝑅)𝑖𝑛−1𝑖=0
The annual monetized benefits of STEP for each examined scenario are presented in Figure 73.
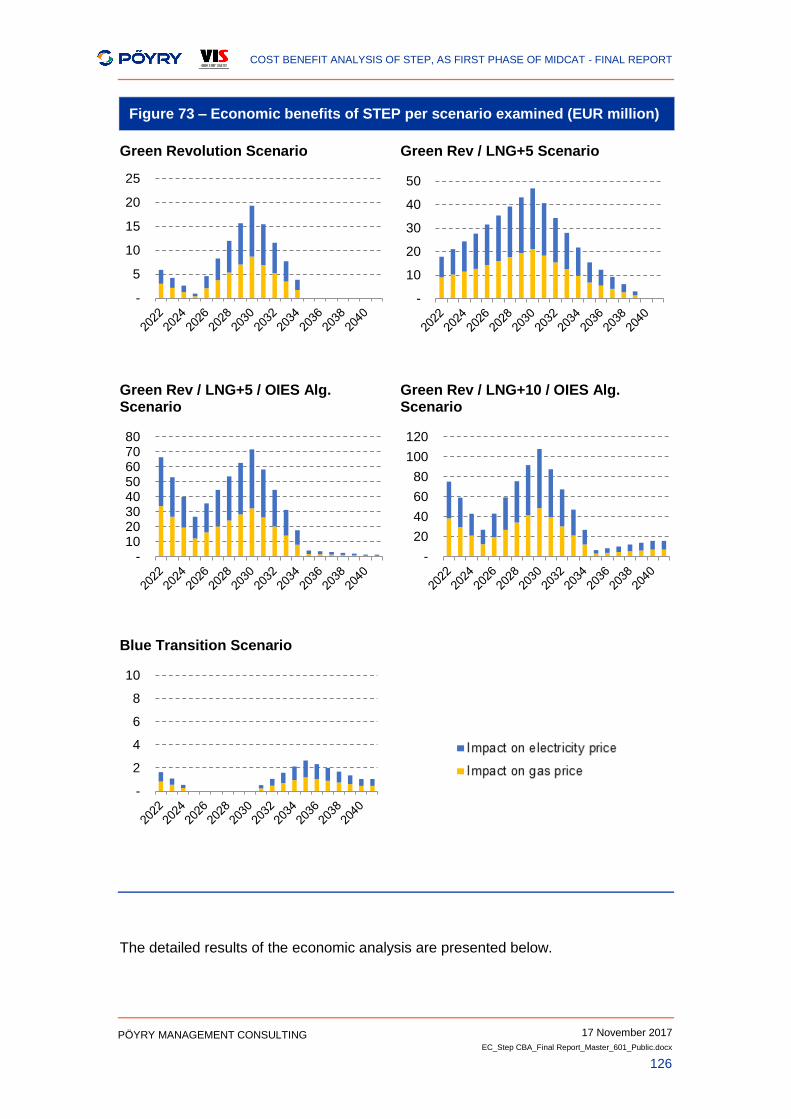
COST BENEFIT ANALYSIS OF STEP, AS FIRST PHASE OF MIDCAT - FINAL REPORT
17 November 2017
EC_Step CBA_Final Report_Master_601_Public.docx
126
PÖYRY MANAGEMENT CONSULTING
Figure 73 – Economic benefits of STEP per scenario examined (EUR million)
Green Revolution Scenario Green Rev / LNG+5 Scenario
Green Rev / LNG+5 / OIES Alg. Scenario
Green Rev / LNG+10 / OIES Alg. Scenario
Blue Transition Scenario
The detailed results of the economic analysis are presented below.
-
5
10
15
20
25
-
10
20
30
40
50
- 10 20 30 40 50 60 70 80
-
20
40
60
80
100
120
-
2
4
6
8
10
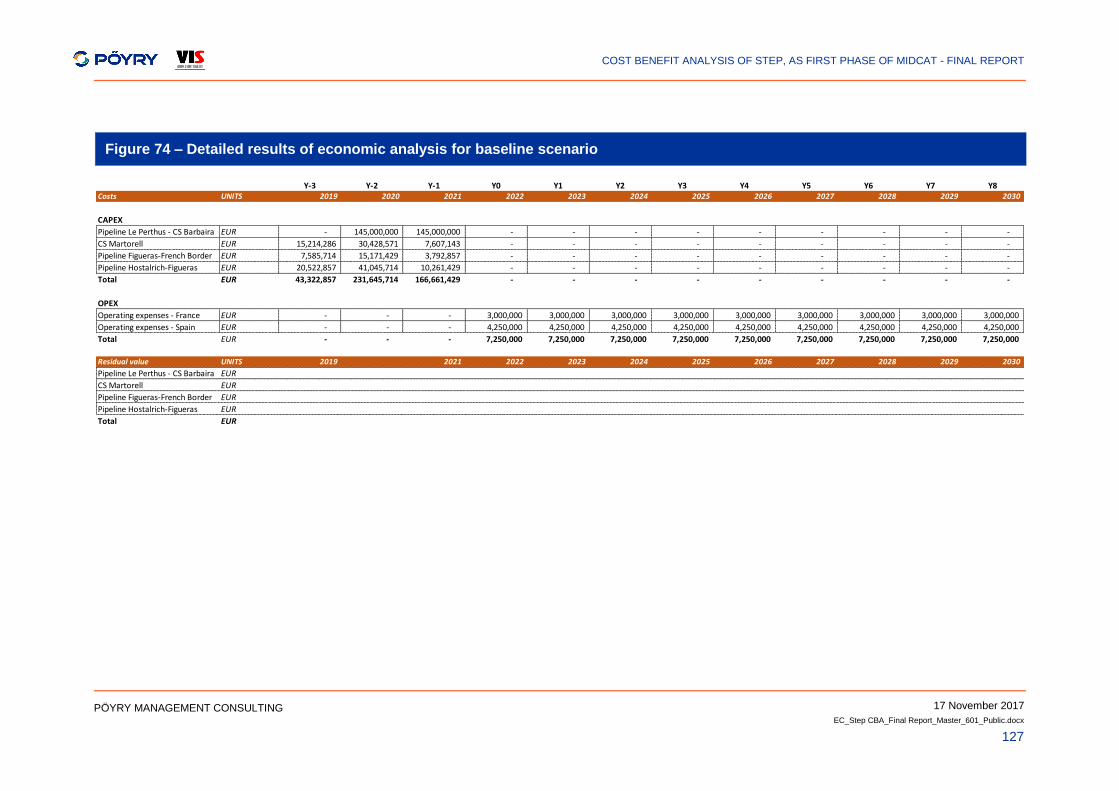
COST BENEFIT ANALYSIS OF STEP, AS FIRST PHASE OF MIDCAT - FINAL REPORT
17 November 2017
EC_Step CBA_Final Report_Master_601_Public.docx
127
PÖYRY MANAGEMENT CONSULTING
Figure 74 – Detailed results of economic analysis for baseline scenario
Y-3 Y-2 Y-1 Y0 Y1 Y2 Y3 Y4 Y5 Y6 Y7 Y8Costs UNITS 2019 2020 2021 2022 2023 2024 2025 2026 2027 2028 2029 2030
CAPEX
Pipeline Le Perthus - CS Barbaira EUR - 145,000,000 145,000,000 - - - - - - - - -
CS Martorell EUR 15,214,286 30,428,571 7,607,143 - - - - - - - - -
Pipeline Figueras-French Border EUR 7,585,714 15,171,429 3,792,857 - - - - - - - - -
Pipeline Hostalrich-Figueras EUR 20,522,857 41,045,714 10,261,429 - - - - - - - - -
Total EUR 43,322,857 231,645,714 166,661,429 - - - - - - - - -
OPEX
Operating expenses - France EUR - - - 3,000,000 3,000,000 3,000,000 3,000,000 3,000,000 3,000,000 3,000,000 3,000,000 3,000,000
Operating expenses - Spain EUR - - - 4,250,000 4,250,000 4,250,000 4,250,000 4,250,000 4,250,000 4,250,000 4,250,000 4,250,000
Total EUR - - - 7,250,000 7,250,000 7,250,000 7,250,000 7,250,000 7,250,000 7,250,000 7,250,000 7,250,000
Residual value UNITS 2019 2021 2022 2023 2024 2025 2026 2027 2028 2029 2030
Pipeline Le Perthus - CS Barbaira EUR
CS Martorell EUR
Pipeline Figueras-French Border EUR
Pipeline Hostalrich-Figueras EUR
Total EUR
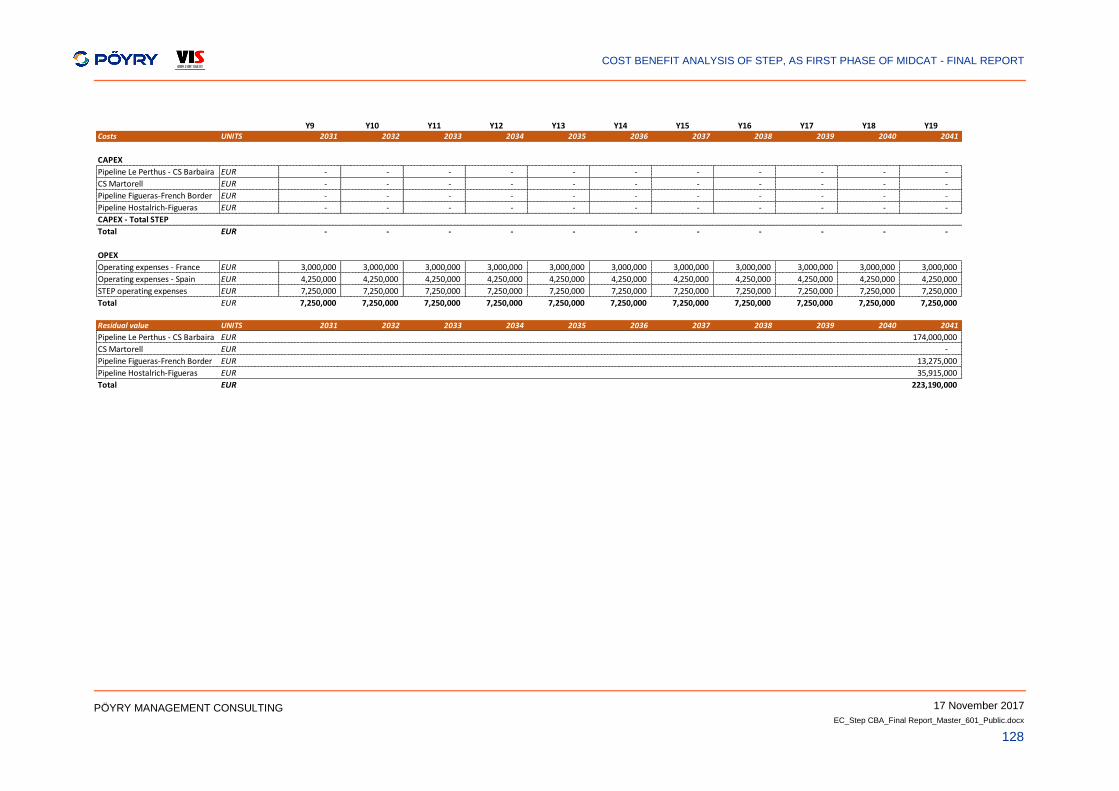
COST BENEFIT ANALYSIS OF STEP, AS FIRST PHASE OF MIDCAT - FINAL REPORT
17 November 2017
EC_Step CBA_Final Report_Master_601_Public.docx
128
PÖYRY MANAGEMENT CONSULTING
Y9 Y10 Y11 Y12 Y13 Y14 Y15 Y16 Y17 Y18 Y19Costs UNITS 2031 2032 2033 2034 2035 2036 2037 2038 2039 2040 2041
CAPEX
Pipeline Le Perthus - CS Barbaira EUR - - - - - - - - - - -
CS Martorell EUR - - - - - - - - - - -
Pipeline Figueras-French Border EUR - - - - - - - - - - -
Pipeline Hostalrich-Figueras EUR - - - - - - - - - - -
CAPEX - Total STEP
Total EUR - - - - - - - - - - -
OPEX
Operating expenses - France EUR 3,000,000 3,000,000 3,000,000 3,000,000 3,000,000 3,000,000 3,000,000 3,000,000 3,000,000 3,000,000 3,000,000
Operating expenses - Spain EUR 4,250,000 4,250,000 4,250,000 4,250,000 4,250,000 4,250,000 4,250,000 4,250,000 4,250,000 4,250,000 4,250,000
STEP operating expenses EUR 7,250,000 7,250,000 7,250,000 7,250,000 7,250,000 7,250,000 7,250,000 7,250,000 7,250,000 7,250,000 7,250,000
Total EUR 7,250,000 7,250,000 7,250,000 7,250,000 7,250,000 7,250,000 7,250,000 7,250,000 7,250,000 7,250,000 7,250,000
Residual value UNITS 2031 2032 2033 2034 2035 2036 2037 2038 2039 2040 2041
Pipeline Le Perthus - CS Barbaira EUR 174,000,000
CS Martorell EUR -
Pipeline Figueras-French Border EUR 13,275,000
Pipeline Hostalrich-Figueras EUR 35,915,000
Total EUR 223,190,000
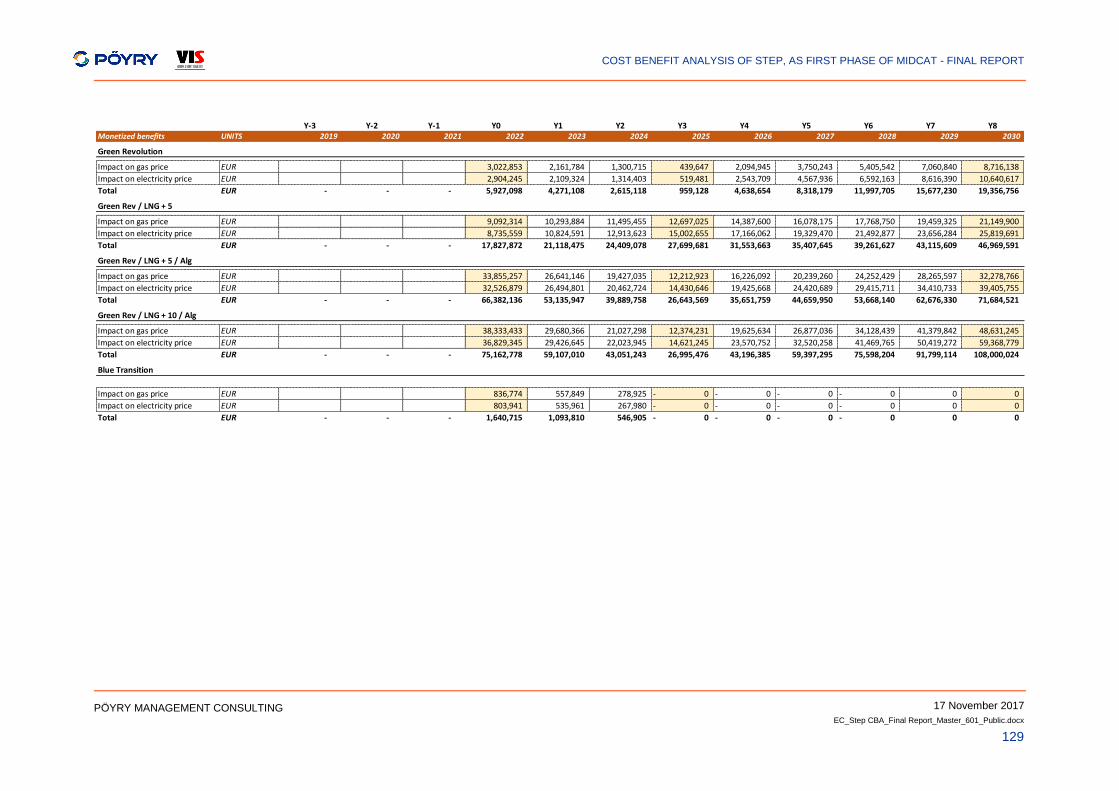
COST BENEFIT ANALYSIS OF STEP, AS FIRST PHASE OF MIDCAT - FINAL REPORT
17 November 2017
EC_Step CBA_Final Report_Master_601_Public.docx
129
PÖYRY MANAGEMENT CONSULTING
Y-3 Y-2 Y-1 Y0 Y1 Y2 Y3 Y4 Y5 Y6 Y7 Y8Monetized benefits UNITS 2019 2020 2021 2022 2023 2024 2025 2026 2027 2028 2029 2030
Green Revolution
Impact on gas price EUR 3,022,853 2,161,784 1,300,715 439,647 2,094,945 3,750,243 5,405,542 7,060,840 8,716,138
Impact on electricity price EUR 2,904,245 2,109,324 1,314,403 519,481 2,543,709 4,567,936 6,592,163 8,616,390 10,640,617
Total EUR - - - 5,927,098 4,271,108 2,615,118 959,128 4,638,654 8,318,179 11,997,705 15,677,230 19,356,756
Green Rev / LNG + 5
Impact on gas price EUR 9,092,314 10,293,884 11,495,455 12,697,025 14,387,600 16,078,175 17,768,750 19,459,325 21,149,900
Impact on electricity price EUR 8,735,559 10,824,591 12,913,623 15,002,655 17,166,062 19,329,470 21,492,877 23,656,284 25,819,691
Total EUR - - - 17,827,872 21,118,475 24,409,078 27,699,681 31,553,663 35,407,645 39,261,627 43,115,609 46,969,591
Green Rev / LNG + 5 / Alg
Impact on gas price EUR 33,855,257 26,641,146 19,427,035 12,212,923 16,226,092 20,239,260 24,252,429 28,265,597 32,278,766
Impact on electricity price EUR 32,526,879 26,494,801 20,462,724 14,430,646 19,425,668 24,420,689 29,415,711 34,410,733 39,405,755
Total EUR - - - 66,382,136 53,135,947 39,889,758 26,643,569 35,651,759 44,659,950 53,668,140 62,676,330 71,684,521
Green Rev / LNG + 10 / Alg
Impact on gas price EUR 38,333,433 29,680,366 21,027,298 12,374,231 19,625,634 26,877,036 34,128,439 41,379,842 48,631,245
Impact on electricity price EUR 36,829,345 29,426,645 22,023,945 14,621,245 23,570,752 32,520,258 41,469,765 50,419,272 59,368,779
Total EUR - - - 75,162,778 59,107,010 43,051,243 26,995,476 43,196,385 59,397,295 75,598,204 91,799,114 108,000,024
Blue Transition
Impact on gas price EUR 836,774 557,849 278,925 0- 0- 0- 0- 0 0
Impact on electricity price EUR 803,941 535,961 267,980 0- 0- 0- 0- 0 0
Total EUR - - - 1,640,715 1,093,810 546,905 0- 0- 0- 0- 0 0
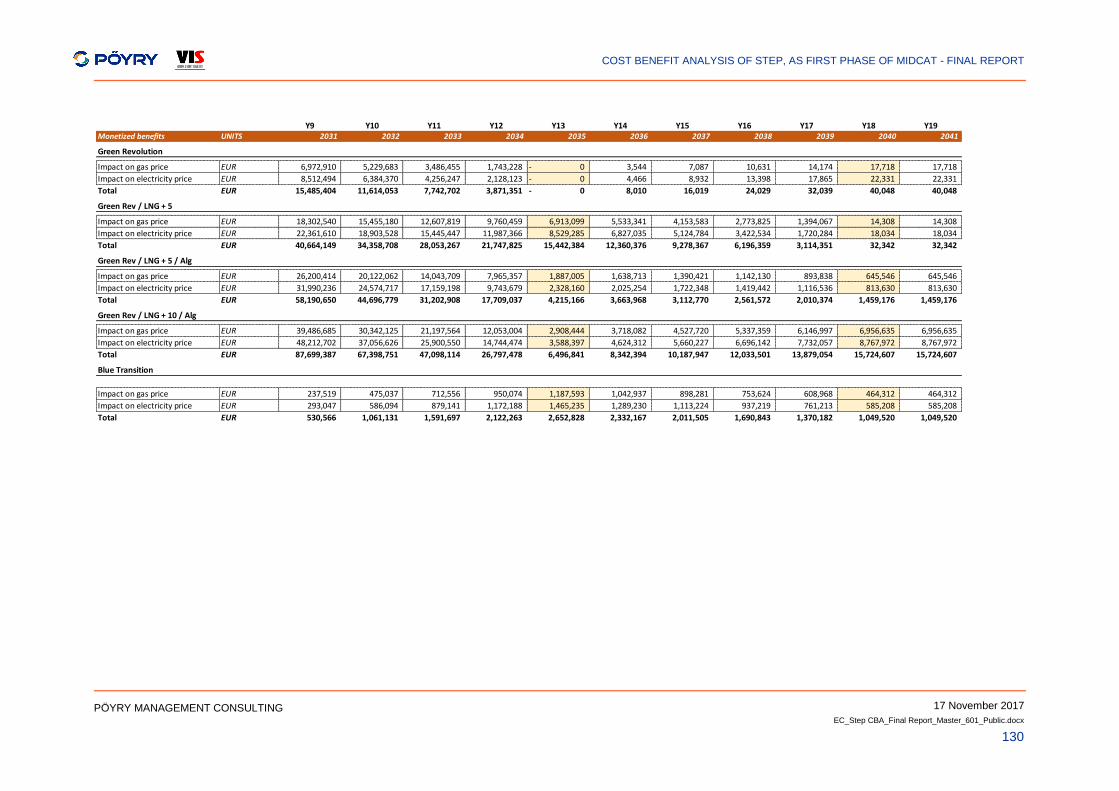
COST BENEFIT ANALYSIS OF STEP, AS FIRST PHASE OF MIDCAT - FINAL REPORT
17 November 2017
EC_Step CBA_Final Report_Master_601_Public.docx
130
PÖYRY MANAGEMENT CONSULTING
Y9 Y10 Y11 Y12 Y13 Y14 Y15 Y16 Y17 Y18 Y19Monetized benefits UNITS 2031 2032 2033 2034 2035 2036 2037 2038 2039 2040 2041
Green Revolution
Impact on gas price EUR 6,972,910 5,229,683 3,486,455 1,743,228 0- 3,544 7,087 10,631 14,174 17,718 17,718
Impact on electricity price EUR 8,512,494 6,384,370 4,256,247 2,128,123 0- 4,466 8,932 13,398 17,865 22,331 22,331
Total EUR 15,485,404 11,614,053 7,742,702 3,871,351 0- 8,010 16,019 24,029 32,039 40,048 40,048
Green Rev / LNG + 5
Impact on gas price EUR 18,302,540 15,455,180 12,607,819 9,760,459 6,913,099 5,533,341 4,153,583 2,773,825 1,394,067 14,308 14,308
Impact on electricity price EUR 22,361,610 18,903,528 15,445,447 11,987,366 8,529,285 6,827,035 5,124,784 3,422,534 1,720,284 18,034 18,034
Total EUR 40,664,149 34,358,708 28,053,267 21,747,825 15,442,384 12,360,376 9,278,367 6,196,359 3,114,351 32,342 32,342
Green Rev / LNG + 5 / Alg
Impact on gas price EUR 26,200,414 20,122,062 14,043,709 7,965,357 1,887,005 1,638,713 1,390,421 1,142,130 893,838 645,546 645,546
Impact on electricity price EUR 31,990,236 24,574,717 17,159,198 9,743,679 2,328,160 2,025,254 1,722,348 1,419,442 1,116,536 813,630 813,630
Total EUR 58,190,650 44,696,779 31,202,908 17,709,037 4,215,166 3,663,968 3,112,770 2,561,572 2,010,374 1,459,176 1,459,176
Green Rev / LNG + 10 / Alg
Impact on gas price EUR 39,486,685 30,342,125 21,197,564 12,053,004 2,908,444 3,718,082 4,527,720 5,337,359 6,146,997 6,956,635 6,956,635
Impact on electricity price EUR 48,212,702 37,056,626 25,900,550 14,744,474 3,588,397 4,624,312 5,660,227 6,696,142 7,732,057 8,767,972 8,767,972
Total EUR 87,699,387 67,398,751 47,098,114 26,797,478 6,496,841 8,342,394 10,187,947 12,033,501 13,879,054 15,724,607 15,724,607
Blue Transition
Impact on gas price EUR 237,519 475,037 712,556 950,074 1,187,593 1,042,937 898,281 753,624 608,968 464,312 464,312
Impact on electricity price EUR 293,047 586,094 879,141 1,172,188 1,465,235 1,289,230 1,113,224 937,219 761,213 585,208 585,208
Total EUR 530,566 1,061,131 1,591,697 2,122,263 2,652,828 2,332,167 2,011,505 1,690,843 1,370,182 1,049,520 1,049,520
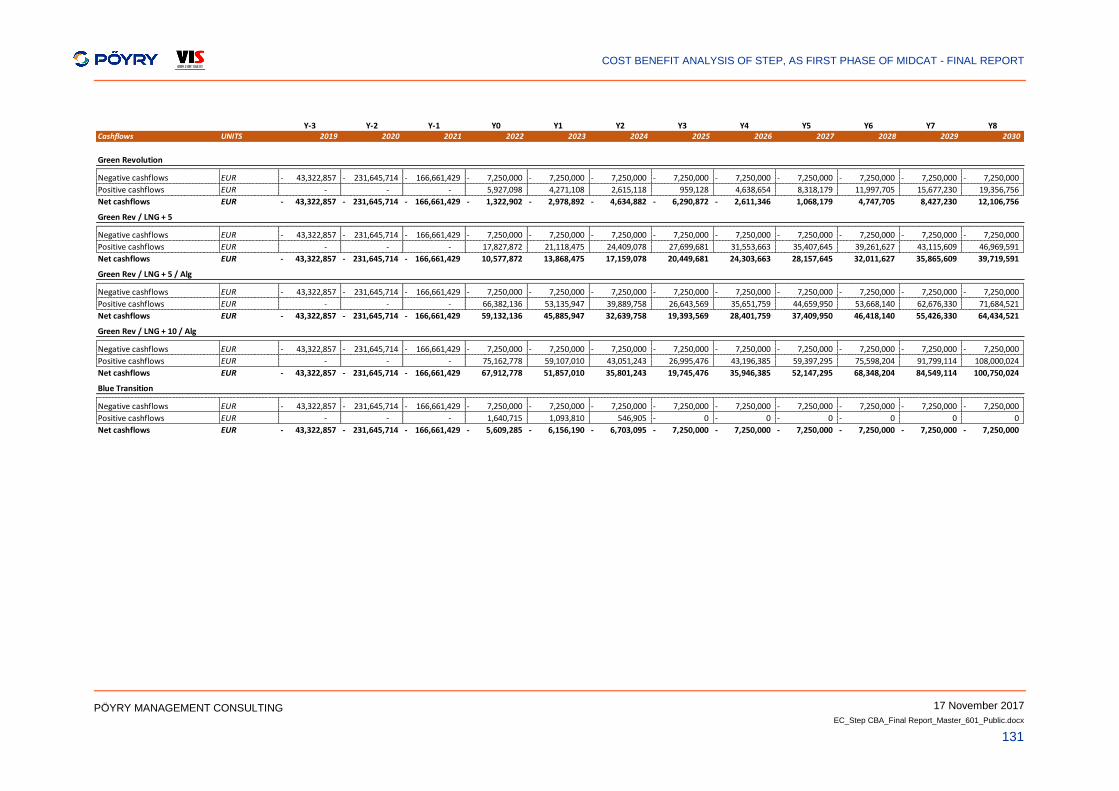
COST BENEFIT ANALYSIS OF STEP, AS FIRST PHASE OF MIDCAT - FINAL REPORT
17 November 2017
EC_Step CBA_Final Report_Master_601_Public.docx
131
PÖYRY MANAGEMENT CONSULTING
Y-3 Y-2 Y-1 Y0 Y1 Y2 Y3 Y4 Y5 Y6 Y7 Y8Cashflows UNITS 2019 2020 2021 2022 2023 2024 2025 2026 2027 2028 2029 2030
Green Revolution
Negative cashflows EUR 43,322,857- 231,645,714- 166,661,429- 7,250,000- 7,250,000- 7,250,000- 7,250,000- 7,250,000- 7,250,000- 7,250,000- 7,250,000- 7,250,000-
Positive cashflows EUR - - - 5,927,098 4,271,108 2,615,118 959,128 4,638,654 8,318,179 11,997,705 15,677,230 19,356,756
Net cashflows EUR 43,322,857- 231,645,714- 166,661,429- 1,322,902- 2,978,892- 4,634,882- 6,290,872- 2,611,346- 1,068,179 4,747,705 8,427,230 12,106,756
Green Rev / LNG + 5
Negative cashflows EUR 43,322,857- 231,645,714- 166,661,429- 7,250,000- 7,250,000- 7,250,000- 7,250,000- 7,250,000- 7,250,000- 7,250,000- 7,250,000- 7,250,000-
Positive cashflows EUR - - - 17,827,872 21,118,475 24,409,078 27,699,681 31,553,663 35,407,645 39,261,627 43,115,609 46,969,591
Net cashflows EUR 43,322,857- 231,645,714- 166,661,429- 10,577,872 13,868,475 17,159,078 20,449,681 24,303,663 28,157,645 32,011,627 35,865,609 39,719,591
Green Rev / LNG + 5 / Alg
Negative cashflows EUR 43,322,857- 231,645,714- 166,661,429- 7,250,000- 7,250,000- 7,250,000- 7,250,000- 7,250,000- 7,250,000- 7,250,000- 7,250,000- 7,250,000-
Positive cashflows EUR - - - 66,382,136 53,135,947 39,889,758 26,643,569 35,651,759 44,659,950 53,668,140 62,676,330 71,684,521
Net cashflows EUR 43,322,857- 231,645,714- 166,661,429- 59,132,136 45,885,947 32,639,758 19,393,569 28,401,759 37,409,950 46,418,140 55,426,330 64,434,521
Green Rev / LNG + 10 / Alg
Negative cashflows EUR 43,322,857- 231,645,714- 166,661,429- 7,250,000- 7,250,000- 7,250,000- 7,250,000- 7,250,000- 7,250,000- 7,250,000- 7,250,000- 7,250,000-
Positive cashflows EUR - - - 75,162,778 59,107,010 43,051,243 26,995,476 43,196,385 59,397,295 75,598,204 91,799,114 108,000,024
Net cashflows EUR 43,322,857- 231,645,714- 166,661,429- 67,912,778 51,857,010 35,801,243 19,745,476 35,946,385 52,147,295 68,348,204 84,549,114 100,750,024
Blue Transition
Negative cashflows EUR 43,322,857- 231,645,714- 166,661,429- 7,250,000- 7,250,000- 7,250,000- 7,250,000- 7,250,000- 7,250,000- 7,250,000- 7,250,000- 7,250,000-
Positive cashflows EUR - - - 1,640,715 1,093,810 546,905 0- 0- 0- 0- 0 0
Net cashflows EUR 43,322,857- 231,645,714- 166,661,429- 5,609,285- 6,156,190- 6,703,095- 7,250,000- 7,250,000- 7,250,000- 7,250,000- 7,250,000- 7,250,000-
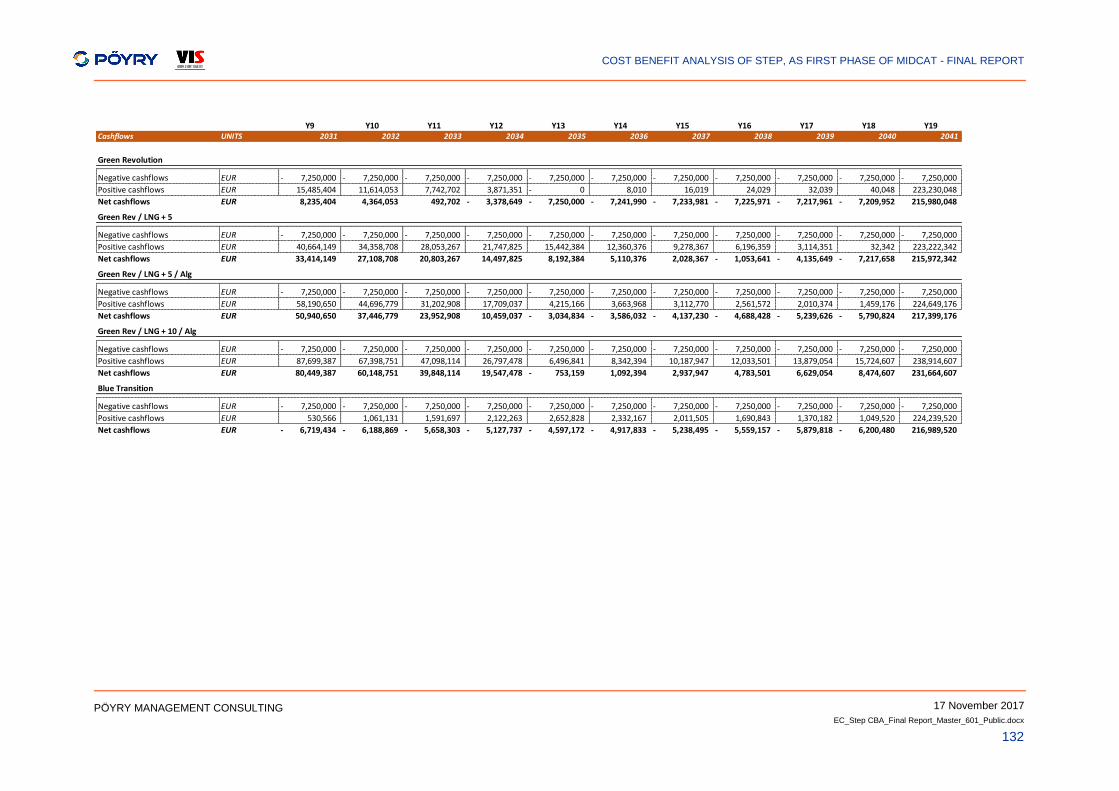
COST BENEFIT ANALYSIS OF STEP, AS FIRST PHASE OF MIDCAT - FINAL REPORT
17 November 2017
EC_Step CBA_Final Report_Master_601_Public.docx
132
PÖYRY MANAGEMENT CONSULTING
Y9 Y10 Y11 Y12 Y13 Y14 Y15 Y16 Y17 Y18 Y19Cashflows UNITS 2031 2032 2033 2034 2035 2036 2037 2038 2039 2040 2041
Green Revolution
Negative cashflows EUR 7,250,000- 7,250,000- 7,250,000- 7,250,000- 7,250,000- 7,250,000- 7,250,000- 7,250,000- 7,250,000- 7,250,000- 7,250,000-
Positive cashflows EUR 15,485,404 11,614,053 7,742,702 3,871,351 0- 8,010 16,019 24,029 32,039 40,048 223,230,048
Net cashflows EUR 8,235,404 4,364,053 492,702 3,378,649- 7,250,000- 7,241,990- 7,233,981- 7,225,971- 7,217,961- 7,209,952- 215,980,048
Green Rev / LNG + 5
Negative cashflows EUR 7,250,000- 7,250,000- 7,250,000- 7,250,000- 7,250,000- 7,250,000- 7,250,000- 7,250,000- 7,250,000- 7,250,000- 7,250,000-
Positive cashflows EUR 40,664,149 34,358,708 28,053,267 21,747,825 15,442,384 12,360,376 9,278,367 6,196,359 3,114,351 32,342 223,222,342
Net cashflows EUR 33,414,149 27,108,708 20,803,267 14,497,825 8,192,384 5,110,376 2,028,367 1,053,641- 4,135,649- 7,217,658- 215,972,342
Green Rev / LNG + 5 / Alg
Negative cashflows EUR 7,250,000- 7,250,000- 7,250,000- 7,250,000- 7,250,000- 7,250,000- 7,250,000- 7,250,000- 7,250,000- 7,250,000- 7,250,000-
Positive cashflows EUR 58,190,650 44,696,779 31,202,908 17,709,037 4,215,166 3,663,968 3,112,770 2,561,572 2,010,374 1,459,176 224,649,176
Net cashflows EUR 50,940,650 37,446,779 23,952,908 10,459,037 3,034,834- 3,586,032- 4,137,230- 4,688,428- 5,239,626- 5,790,824- 217,399,176
Green Rev / LNG + 10 / Alg
Negative cashflows EUR 7,250,000- 7,250,000- 7,250,000- 7,250,000- 7,250,000- 7,250,000- 7,250,000- 7,250,000- 7,250,000- 7,250,000- 7,250,000-
Positive cashflows EUR 87,699,387 67,398,751 47,098,114 26,797,478 6,496,841 8,342,394 10,187,947 12,033,501 13,879,054 15,724,607 238,914,607
Net cashflows EUR 80,449,387 60,148,751 39,848,114 19,547,478 753,159- 1,092,394 2,937,947 4,783,501 6,629,054 8,474,607 231,664,607
Blue Transition
Negative cashflows EUR 7,250,000- 7,250,000- 7,250,000- 7,250,000- 7,250,000- 7,250,000- 7,250,000- 7,250,000- 7,250,000- 7,250,000- 7,250,000-
Positive cashflows EUR 530,566 1,061,131 1,591,697 2,122,263 2,652,828 2,332,167 2,011,505 1,690,843 1,370,182 1,049,520 224,239,520
Net cashflows EUR 6,719,434- 6,188,869- 5,658,303- 5,127,737- 4,597,172- 4,917,833- 5,238,495- 5,559,157- 5,879,818- 6,200,480- 216,989,520
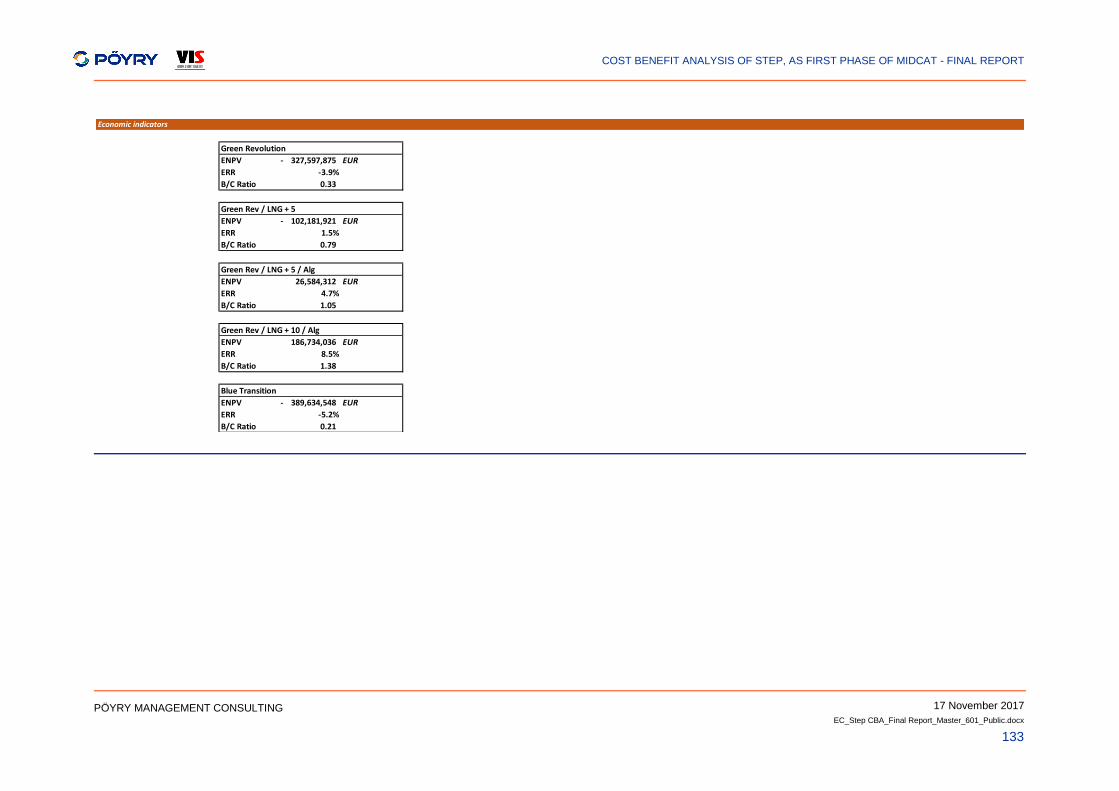
COST BENEFIT ANALYSIS OF STEP, AS FIRST PHASE OF MIDCAT - FINAL REPORT
17 November 2017
EC_Step CBA_Final Report_Master_601_Public.docx
133
PÖYRY MANAGEMENT CONSULTING
Economic indicators
Green Revolution
ENPV 327,597,875- EUR
ERR -3.9%
B/C Ratio 0.33
Green Rev / LNG + 5
ENPV 102,181,921- EUR
ERR 1.5%
B/C Ratio 0.79
Green Rev / LNG + 5 / Alg
ENPV 26,584,312 EUR
ERR 4.7%
B/C Ratio 1.05
Green Rev / LNG + 10 / Alg
ENPV 186,734,036 EUR
ERR 8.5%
B/C Ratio 1.38
Blue Transition
ENPV 389,634,548- EUR
ERR -5.2%
B/C Ratio 0.21
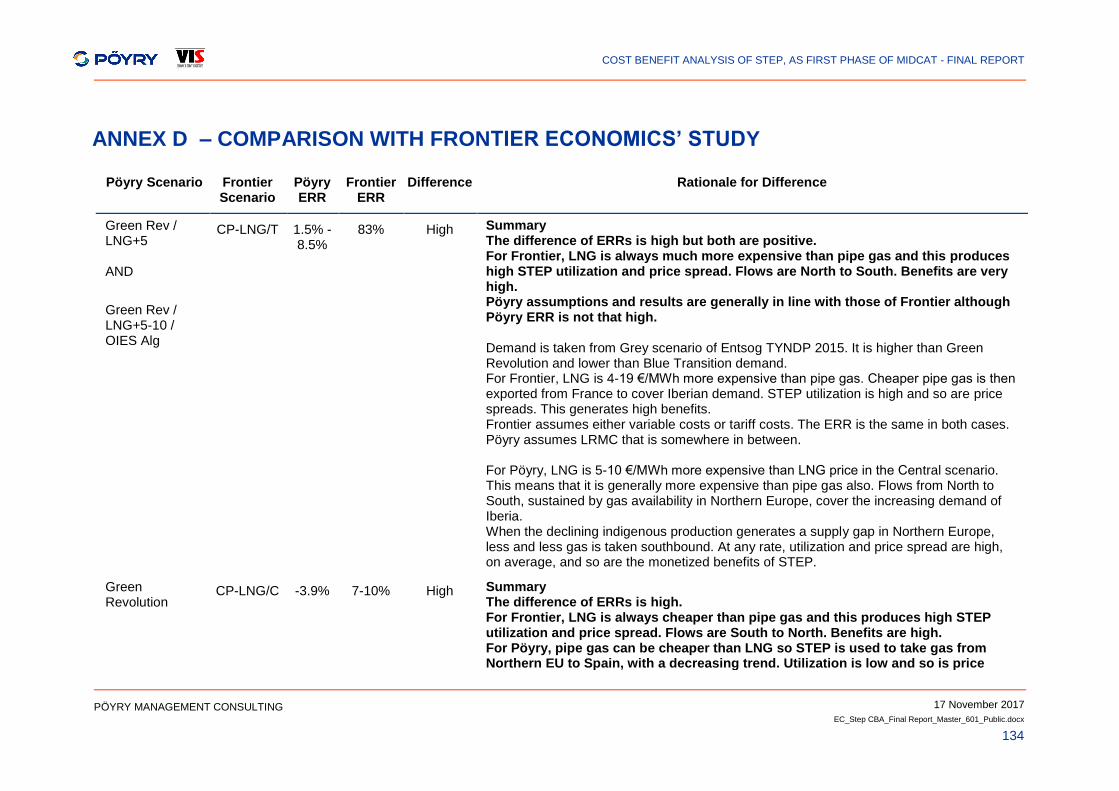
COST BENEFIT ANALYSIS OF STEP, AS FIRST PHASE OF MIDCAT - FINAL REPORT
17 November 2017
EC_Step CBA_Final Report_Master_601_Public.docx
134
PÖYRY MANAGEMENT CONSULTING
ANNEX D – COMPARISON WITH FRONTIER ECONOMICS’ STUDY
Pöyry Scenario Frontier Scenario
Pöyry ERR
Frontier ERR
Difference Rationale for Difference
Green Rev / LNG+5 AND
Green Rev / LNG+5-10 / OIES Alg
CP-LNG/T 1.5% - 8.5%
83% High Summary The difference of ERRs is high but both are positive. For Frontier, LNG is always much more expensive than pipe gas and this produces high STEP utilization and price spread. Flows are North to South. Benefits are very high. Pöyry assumptions and results are generally in line with those of Frontier although Pöyry ERR is not that high. Demand is taken from Grey scenario of Entsog TYNDP 2015. It is higher than Green Revolution and lower than Blue Transition demand. For Frontier, LNG is 4-19 €/MWh more expensive than pipe gas. Cheaper pipe gas is then exported from France to cover Iberian demand. STEP utilization is high and so are price spreads. This generates high benefits. Frontier assumes either variable costs or tariff costs. The ERR is the same in both cases. Pöyry assumes LRMC that is somewhere in between. For Pöyry, LNG is 5-10 €/MWh more expensive than LNG price in the Central scenario. This means that it is generally more expensive than pipe gas also. Flows from North to South, sustained by gas availability in Northern Europe, cover the increasing demand of Iberia. When the declining indigenous production generates a supply gap in Northern Europe, less and less gas is taken southbound. At any rate, utilization and price spread are high, on average, and so are the monetized benefits of STEP.
Green Revolution
CP-LNG/C -3.9% 7-10% High Summary The difference of ERRs is high. For Frontier, LNG is always cheaper than pipe gas and this produces high STEP utilization and price spread. Flows are South to North. Benefits are high. For Pöyry, pipe gas can be cheaper than LNG so STEP is used to take gas from Northern EU to Spain, with a decreasing trend. Utilization is low and so is price
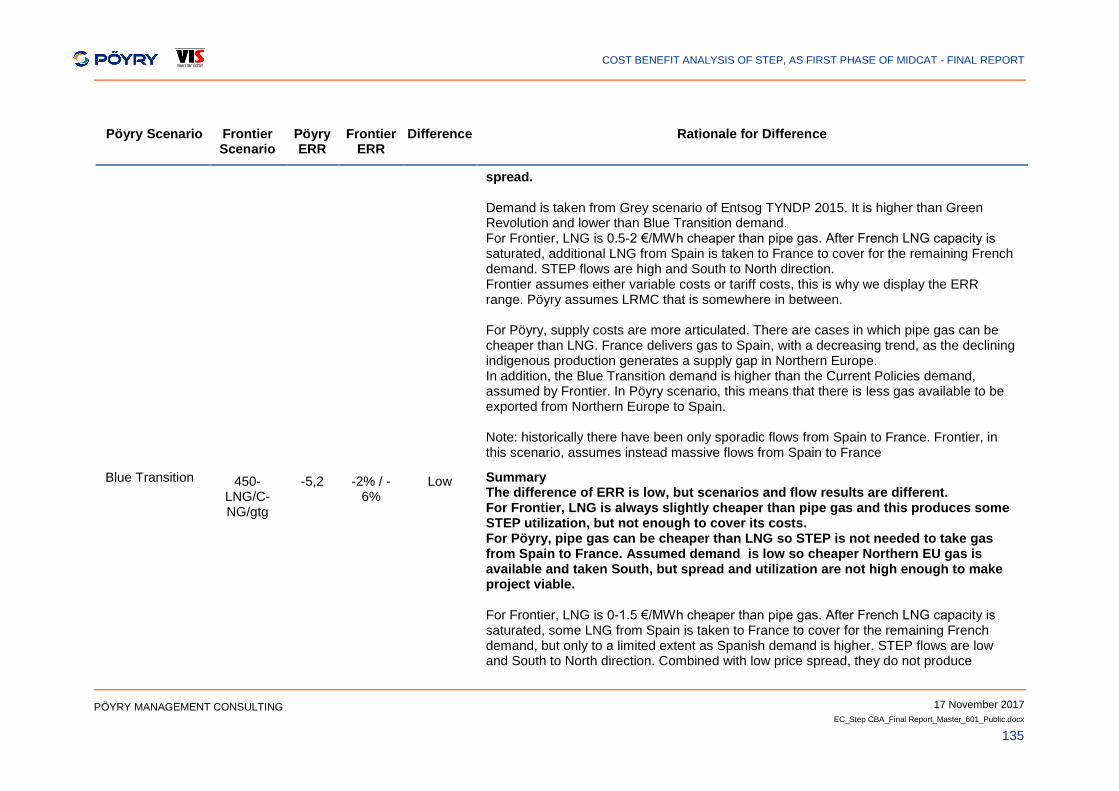
COST BENEFIT ANALYSIS OF STEP, AS FIRST PHASE OF MIDCAT - FINAL REPORT
17 November 2017
EC_Step CBA_Final Report_Master_601_Public.docx
135
PÖYRY MANAGEMENT CONSULTING
Pöyry Scenario Frontier Scenario
Pöyry ERR
Frontier ERR
Difference Rationale for Difference
spread. Demand is taken from Grey scenario of Entsog TYNDP 2015. It is higher than Green Revolution and lower than Blue Transition demand. For Frontier, LNG is 0.5-2 €/MWh cheaper than pipe gas. After French LNG capacity is saturated, additional LNG from Spain is taken to France to cover for the remaining French demand. STEP flows are high and South to North direction. Frontier assumes either variable costs or tariff costs, this is why we display the ERR range. Pöyry assumes LRMC that is somewhere in between. For Pöyry, supply costs are more articulated. There are cases in which pipe gas can be cheaper than LNG. France delivers gas to Spain, with a decreasing trend, as the declining indigenous production generates a supply gap in Northern Europe. In addition, the Blue Transition demand is higher than the Current Policies demand, assumed by Frontier. In Pöyry scenario, this means that there is less gas available to be exported from Northern Europe to Spain. Note: historically there have been only sporadic flows from Spain to France. Frontier, in this scenario, assumes instead massive flows from Spain to France
Blue Transition 450-LNG/C-NG/gtg
-5,2 -2% / -6%
Low Summary The difference of ERR is low, but scenarios and flow results are different. For Frontier, LNG is always slightly cheaper than pipe gas and this produces some STEP utilization, but not enough to cover its costs. For Pöyry, pipe gas can be cheaper than LNG so STEP is not needed to take gas from Spain to France. Assumed demand is low so cheaper Northern EU gas is available and taken South, but spread and utilization are not high enough to make project viable. For Frontier, LNG is 0-1.5 €/MWh cheaper than pipe gas. After French LNG capacity is saturated, some LNG from Spain is taken to France to cover for the remaining French demand, but only to a limited extent as Spanish demand is higher. STEP flows are low and South to North direction. Combined with low price spread, they do not produce
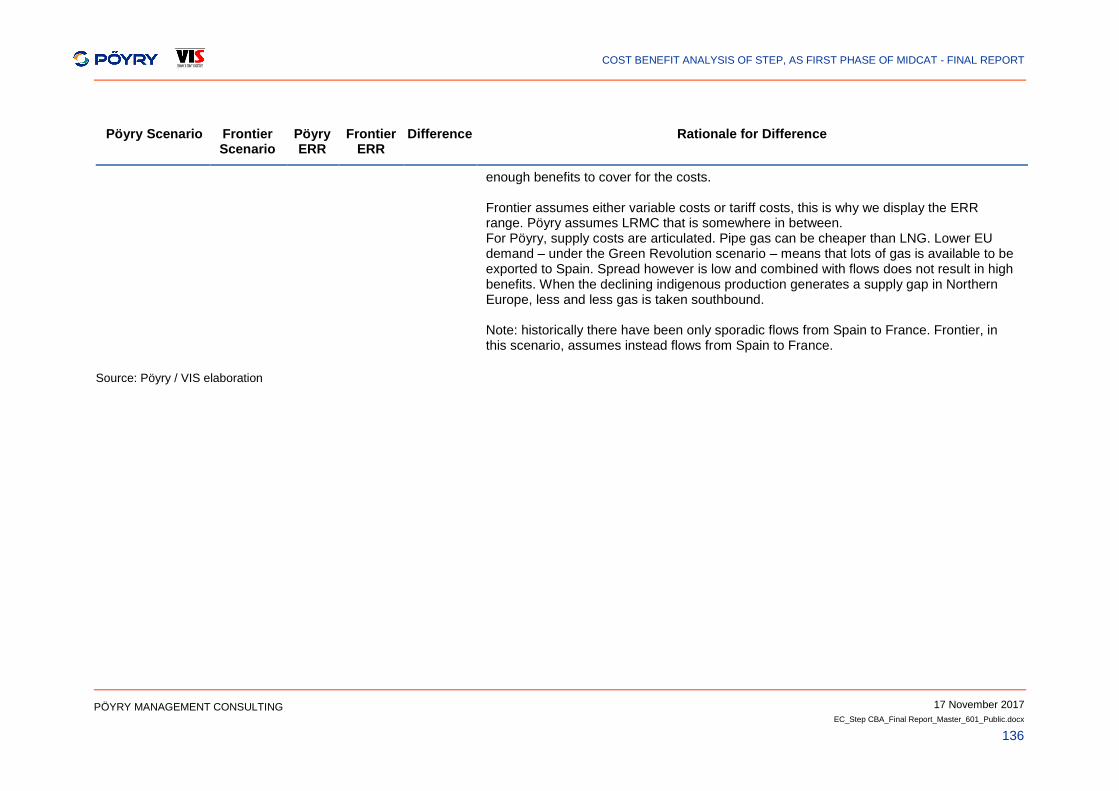
COST BENEFIT ANALYSIS OF STEP, AS FIRST PHASE OF MIDCAT - FINAL REPORT
17 November 2017
EC_Step CBA_Final Report_Master_601_Public.docx
136
PÖYRY MANAGEMENT CONSULTING
Pöyry Scenario Frontier Scenario
Pöyry ERR
Frontier ERR
Difference Rationale for Difference
enough benefits to cover for the costs. Frontier assumes either variable costs or tariff costs, this is why we display the ERR range. Pöyry assumes LRMC that is somewhere in between. For Pöyry, supply costs are articulated. Pipe gas can be cheaper than LNG. Lower EU demand – under the Green Revolution scenario – means that lots of gas is available to be exported to Spain. Spread however is low and combined with flows does not result in high benefits. When the declining indigenous production generates a supply gap in Northern Europe, less and less gas is taken southbound. Note: historically there have been only sporadic flows from Spain to France. Frontier, in this scenario, assumes instead flows from Spain to France.
Source: Pöyry / VIS elaboration
COST BENEFIT ANALYSIS OF STEP, AS FIRST PHASE OF MIDCAT - FINAL REPORT
17 November 2017
EC_Step CBA_Final Report_Master_601_Public.docx
137
PÖYRY MANAGEMENT CONSULTING
ANNEX E – CBA INDICATORS
In this Annex, we present the approach used to estimate the modelling-based and the capacity-based indicators and the results of the calculations.
E.1 Modelling-based indicators
E.1.1 Price convergence
The Price Convergence Indicator (PC) is used to assess the extent to which the gas wholesale prices of two markets converge is carried out by comparing the gas prices of the markets. The formula used is the following:
𝑃𝐶 =𝑀𝑎𝑟𝑔𝑖𝑛𝑎𝑙 𝑝𝑟𝑖𝑐𝑒 𝑎𝑡 𝑚𝑎𝑟𝑘𝑒𝑡 𝐴
𝑀𝑎𝑟𝑔𝑖𝑛𝑎𝑙 𝑝𝑟𝑖𝑐𝑒 𝑎𝑡 𝑚𝑎𝑟𝑘𝑒𝑡 𝐵
The marginal gas prices of markets A and B (EUR/MWh) are calculated using the Pegasus3 Model. The closer the indicator is to 1, the more converged are the prices of the two examined markets.
STEP increases price convergence for all examined scenarios. The extent of the project's impact depends on the scenario and particularly the assumed relevant price differential of the two markets. The marginal prices of France and Spain, for each of the scenarios are presented in Table 22 below.
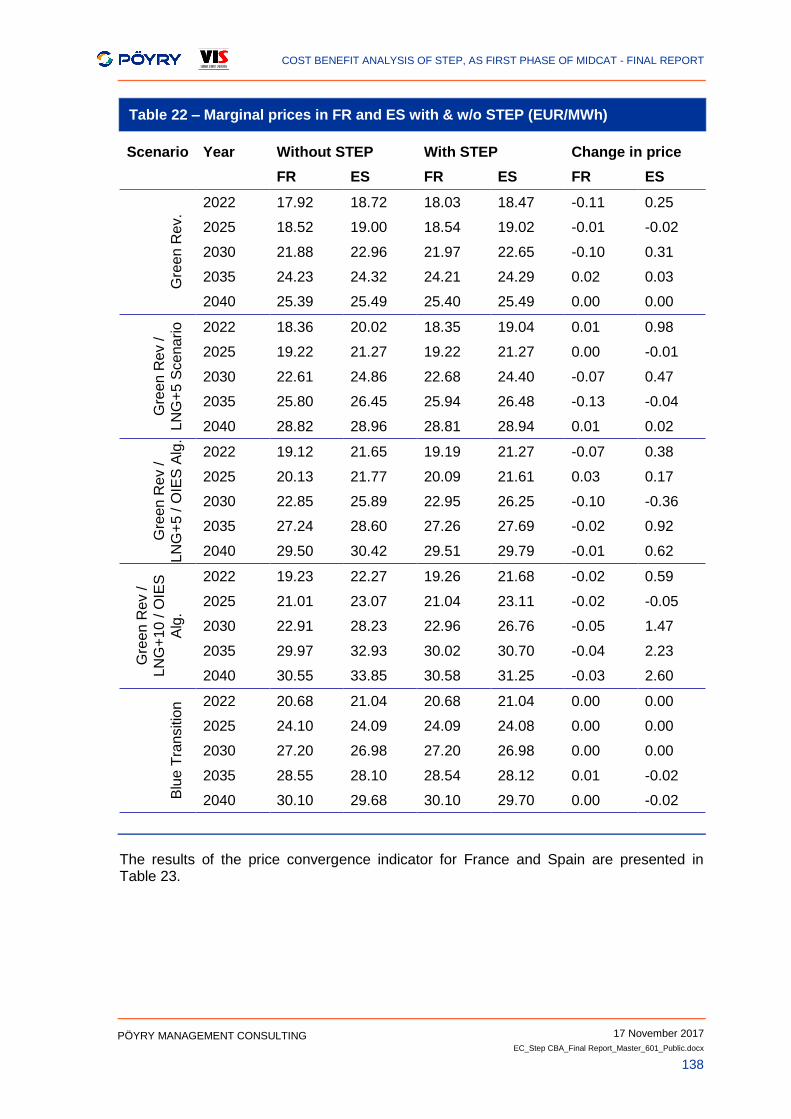
COST BENEFIT ANALYSIS OF STEP, AS FIRST PHASE OF MIDCAT - FINAL REPORT
17 November 2017
EC_Step CBA_Final Report_Master_601_Public.docx
138
PÖYRY MANAGEMENT CONSULTING
Table 22 – Marginal prices in FR and ES with & w/o STEP (EUR/MWh)
Scenario Year Without STEP With STEP Change in price
FR ES FR ES FR ES G
reen R
ev.
2022 17.92 18.72 18.03 18.47 -0.11 0.25
2025 18.52 19.00 18.54 19.02 -0.01 -0.02
2030 21.88 22.96 21.97 22.65 -0.10 0.31
2035 24.23 24.32 24.21 24.29 0.02 0.03
2040 25.39 25.49 25.40 25.49 0.00 0.00
Gre
en R
ev /
LN
G+
5 S
ce
na
rio
2022 18.36 20.02 18.35 19.04 0.01 0.98
2025 19.22 21.27 19.22 21.27 0.00 -0.01
2030 22.61 24.86 22.68 24.40 -0.07 0.47
2035 25.80 26.45 25.94 26.48 -0.13 -0.04
2040 28.82 28.96 28.81 28.94 0.01 0.02
Gre
en R
ev /
LN
G+
5 / O
IES
Alg
.
2022 19.12 21.65 19.19 21.27 -0.07 0.38
2025 20.13 21.77 20.09 21.61 0.03 0.17
2030 22.85 25.89 22.95 26.25 -0.10 -0.36
2035 27.24 28.60 27.26 27.69 -0.02 0.92
2040 29.50 30.42 29.51 29.79 -0.01 0.62
Gre
en R
ev /
LN
G+
10 / O
IES
Alg
.
2022 19.23 22.27 19.26 21.68 -0.02 0.59
2025 21.01 23.07 21.04 23.11 -0.02 -0.05
2030 22.91 28.23 22.96 26.76 -0.05 1.47
2035 29.97 32.93 30.02 30.70 -0.04 2.23
2040 30.55 33.85 30.58 31.25 -0.03 2.60
Blu
e T
ran
sitio
n 2022 20.68 21.04 20.68 21.04 0.00 0.00
2025 24.10 24.09 24.09 24.08 0.00 0.00
2030 27.20 26.98 27.20 26.98 0.00 0.00
2035 28.55 28.10 28.54 28.12 0.01 -0.02
2040 30.10 29.68 30.10 29.70 0.00 -0.02
The results of the price convergence indicator for France and Spain are presented in Table 23.
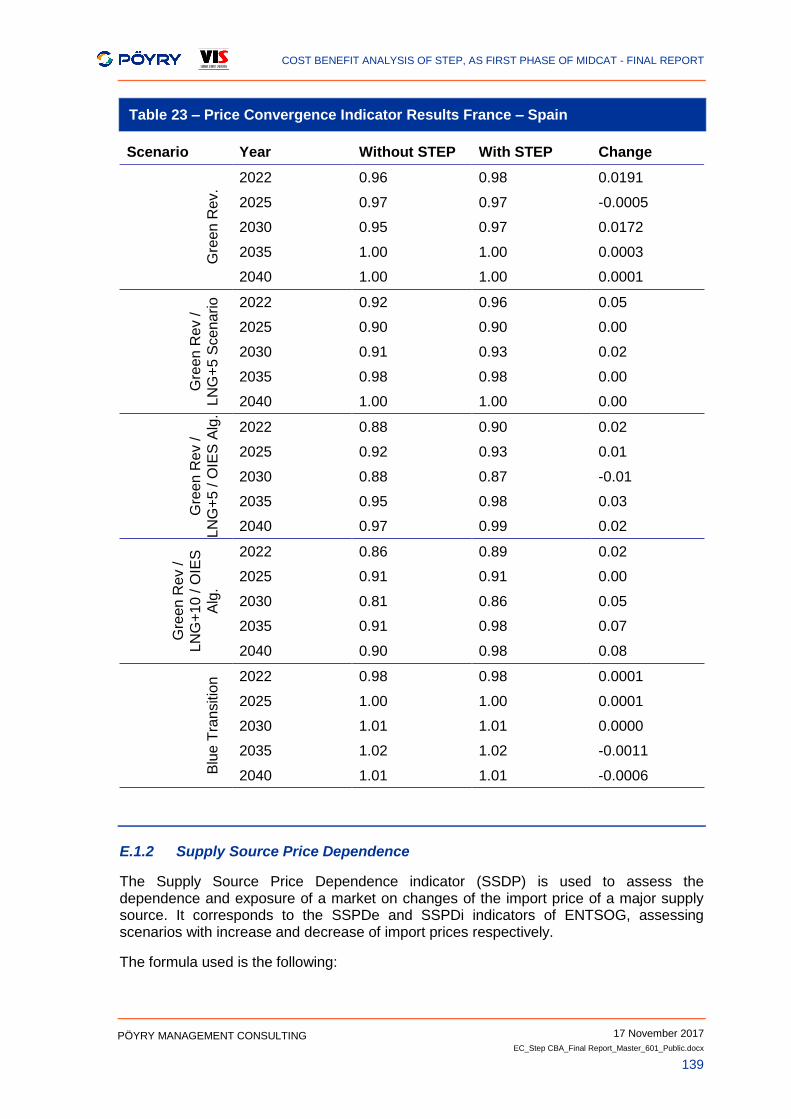
COST BENEFIT ANALYSIS OF STEP, AS FIRST PHASE OF MIDCAT - FINAL REPORT
17 November 2017
EC_Step CBA_Final Report_Master_601_Public.docx
139
PÖYRY MANAGEMENT CONSULTING
Table 23 – Price Convergence Indicator Results France – Spain
Scenario Year Without STEP With STEP Change
Gre
en R
ev.
2022 0.96 0.98 0.0191
2025 0.97 0.97 -0.0005
2030 0.95 0.97 0.0172
2035 1.00 1.00 0.0003
2040 1.00 1.00 0.0001
Gre
en R
ev /
LN
G+
5 S
ce
na
rio
2022 0.92 0.96 0.05
2025 0.90 0.90 0.00
2030 0.91 0.93 0.02
2035 0.98 0.98 0.00
2040 1.00 1.00 0.00
Gre
en R
ev /
LN
G+
5 / O
IES
Alg
.
2022 0.88 0.90 0.02
2025 0.92 0.93 0.01
2030 0.88 0.87 -0.01
2035 0.95 0.98 0.03
2040 0.97 0.99 0.02
Gre
en R
ev /
LN
G+
10 / O
IES
Alg
.
2022 0.86 0.89 0.02
2025 0.91 0.91 0.00
2030 0.81 0.86 0.05
2035 0.91 0.98 0.07
2040 0.90 0.98 0.08
Blu
e T
ran
sitio
n 2022 0.98 0.98 0.0001
2025 1.00 1.00 0.0001
2030 1.01 1.01 0.0000
2035 1.02 1.02 -0.0011
2040 1.01 1.01 -0.0006
E.1.2 Supply Source Price Dependence
The Supply Source Price Dependence indicator (SSDP) is used to assess the dependence and exposure of a market on changes of the import price of a major supply source. It corresponds to the SSPDe and SSPDi indicators of ENTSOG, assessing scenarios with increase and decrease of import prices respectively.
The formula used is the following:
COST BENEFIT ANALYSIS OF STEP, AS FIRST PHASE OF MIDCAT - FINAL REPORT
17 November 2017
EC_Step CBA_Final Report_Master_601_Public.docx
140
PÖYRY MANAGEMENT CONSULTING
𝑆𝑆𝑃𝐷 = (1
% 𝑖𝑛𝑐𝑟𝑒𝑎𝑠𝑒 𝑜𝑓 𝑖𝑚𝑝𝑜𝑟𝑡 𝑝𝑟𝑖𝑐𝑒 ) ∗ (
𝑀𝑎𝑟𝑔𝑖𝑛𝑎𝑙 𝑃𝑟𝑖𝑐𝑒𝑃𝑟𝑖𝑐𝑒 𝑠𝑒𝑛𝑠𝑖𝑡𝑖𝑣𝑖𝑡𝑦 − 𝑀𝑎𝑟𝑔𝑖𝑛𝑎𝑙 𝑃𝑟𝑖𝑐𝑒𝐵𝑎𝑠𝑒 𝑝𝑟𝑖𝑐𝑒
𝑀𝑎𝑟𝑔𝑖𝑛𝑎𝑙 𝑃𝑟𝑖𝑐𝑒𝐵𝑎𝑠𝑒 𝑝𝑟𝑖𝑐𝑒 )
The marginal gas prices (EUR/MWh) are calculated using the Pegasus3 Model. The lower the indicator, then the less dependent is the market to the price fluctuations of the specific gas supply source.
The indicator is applied for LNG supplies, with a focus on the two countries directly affected by STEP, Spain and France. The following price sensitivities are examined:
Green Revolution / LNG+5 / OIES Algeria Scenario: Weighed LNG supply price increase of 5 EUR/MWh (approx. 20% price increase)
Green Revolution / LNG+10 / OIES Algeria Scenario: Weighed LNG supply price increase of 10 EUR/MWh (approx. 40% price increase)
Green Revolution / LNG-5 / OIES Algeria Scenario: Weighed LNG supply price decrease of 5 EUR/MWh (approx. 20% price decrease)
The indicator results show that STEP enhances the resilience of the Spanish market to LNG price fluctuations. The detailed results of France and Spain for the three examined scenarios are presented in Table 24.
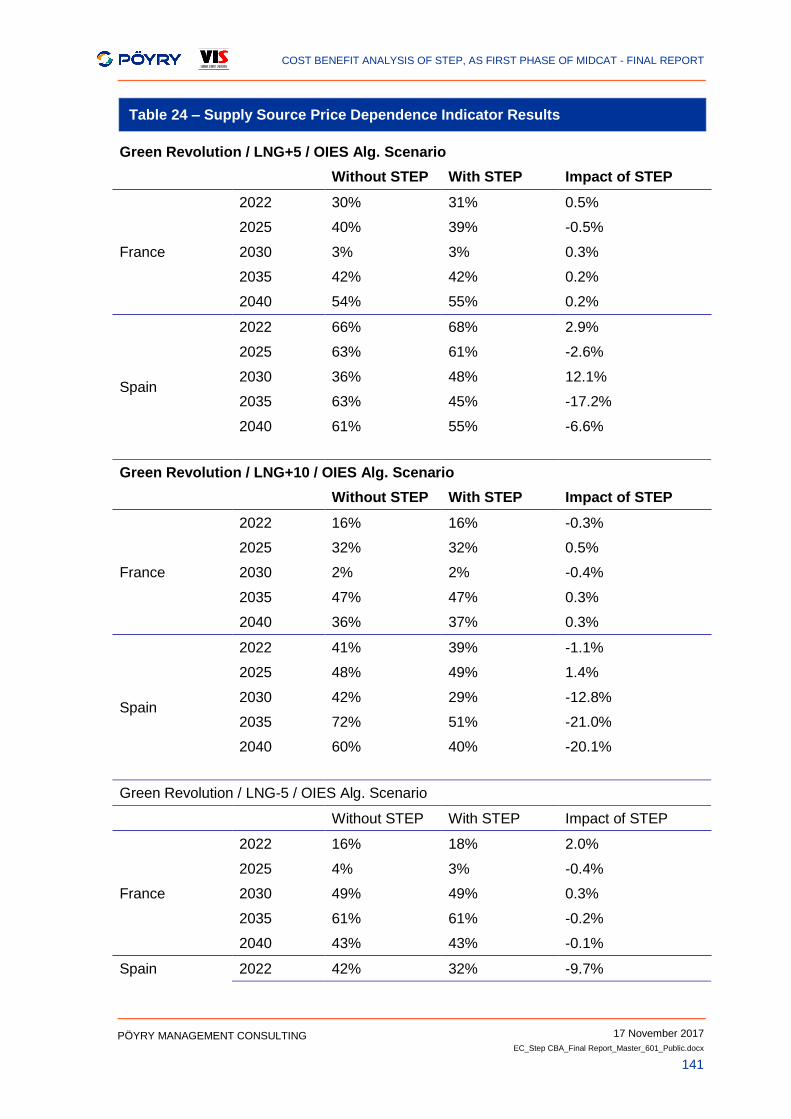
COST BENEFIT ANALYSIS OF STEP, AS FIRST PHASE OF MIDCAT - FINAL REPORT
17 November 2017
EC_Step CBA_Final Report_Master_601_Public.docx
141
PÖYRY MANAGEMENT CONSULTING
Table 24 – Supply Source Price Dependence Indicator Results
Green Revolution / LNG+5 / OIES Alg. Scenario
Without STEP With STEP Impact of STEP
France
2022 30% 31% 0.5%
2025 40% 39% -0.5%
2030 3% 3% 0.3%
2035 42% 42% 0.2%
2040 54% 55% 0.2%
Spain
2022 66% 68% 2.9%
2025 63% 61% -2.6%
2030 36% 48% 12.1%
2035 63% 45% -17.2%
2040 61% 55% -6.6%
Green Revolution / LNG+10 / OIES Alg. Scenario
Without STEP With STEP Impact of STEP
France
2022 16% 16% -0.3%
2025 32% 32% 0.5%
2030 2% 2% -0.4%
2035 47% 47% 0.3%
2040 36% 37% 0.3%
Spain
2022 41% 39% -1.1%
2025 48% 49% 1.4%
2030 42% 29% -12.8%
2035 72% 51% -21.0%
2040 60% 40% -20.1%
Green Revolution / LNG-5 / OIES Alg. Scenario
Without STEP With STEP Impact of STEP
France
2022 16% 18% 2.0%
2025 4% 3% -0.4%
2030 49% 49% 0.3%
2035 61% 61% -0.2%
2040 43% 43% -0.1%
Spain 2022 42% 32% -9.7%
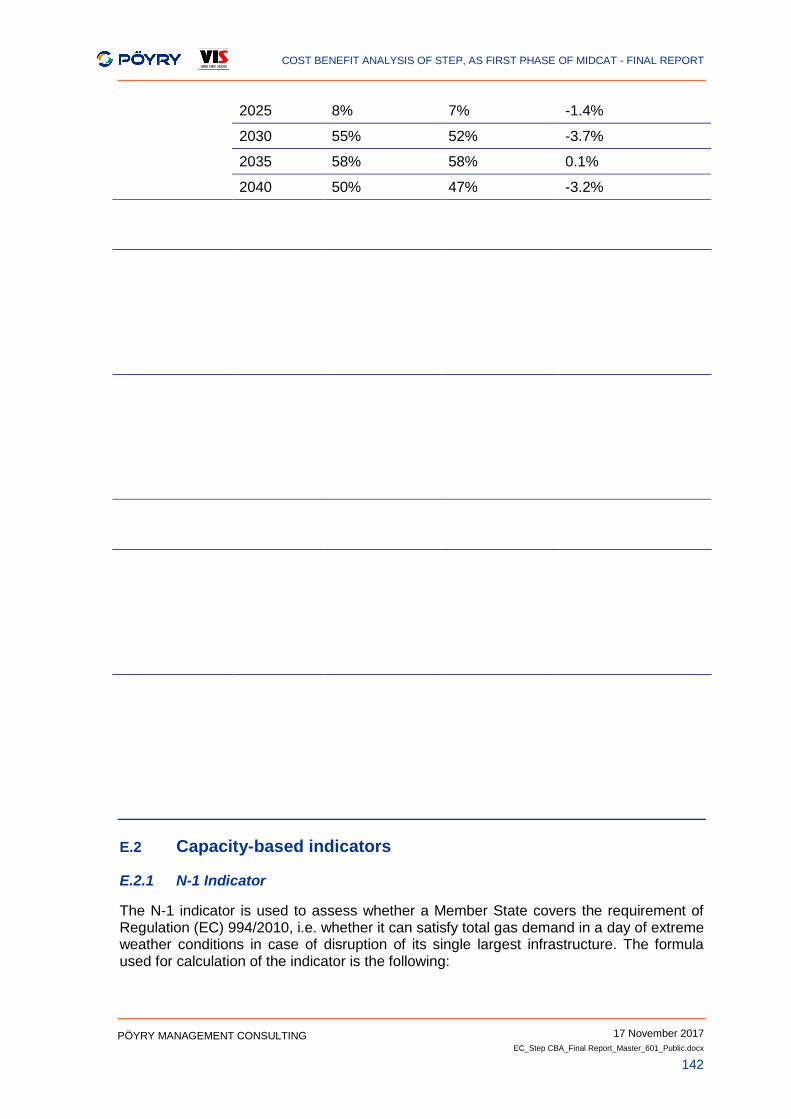
COST BENEFIT ANALYSIS OF STEP, AS FIRST PHASE OF MIDCAT - FINAL REPORT
17 November 2017
EC_Step CBA_Final Report_Master_601_Public.docx
142
PÖYRY MANAGEMENT CONSULTING
2025 8% 7% -1.4%
2030 55% 52% -3.7%
2035 58% 58% 0.1%
2040 50% 47% -3.2%
E.2 Capacity-based indicators
E.2.1 N-1 Indicator
The N-1 indicator is used to assess whether a Member State covers the requirement of Regulation (EC) 994/2010, i.e. whether it can satisfy total gas demand in a day of extreme weather conditions in case of disruption of its single largest infrastructure. The formula used for calculation of the indicator is the following:

COST BENEFIT ANALYSIS OF STEP, AS FIRST PHASE OF MIDCAT - FINAL REPORT
17 November 2017
EC_Step CBA_Final Report_Master_601_Public.docx
143
PÖYRY MANAGEMENT CONSULTING
𝑁 − 1 =𝐼𝑃 + 𝑁𝑃 + 𝑈𝐺𝑆 + 𝐿𝑁𝐺 − 𝐼𝑚
𝐷𝑚𝑎𝑥∗ 100
where:
IP: Aggregate firm technical capacity of all cross-border entry points (GWh/d);
NP: Maximum national production capability (GWh/d);
UGS: Aggregate maximum technical daily withdrawal capacity (GWh/d) of all storage facilities;
LNG: Aggregate LNG regasification capacity (GWh/d) of all LNG terminals;
Im: Firm technical capacity of the single largest infrastructure (GWh/d)
Dmax: peak daily demand (GWh/d) occurring with a statistical probability of once in 20 years
To meet the Regulation (EC) 994/2010 requirements, the N-1 indicator must exceed 100%.
The results of the N-1 indicator without and with STEP for the Blue Transition and Green Revolution scenarios (the only difference lies in the peak daily demand assumed) are presented in Table 25 below. The Dunkerque LNG terminal is considered the single largest infrastructure disrupted in France and Barcelona LNG terminal in Spain.
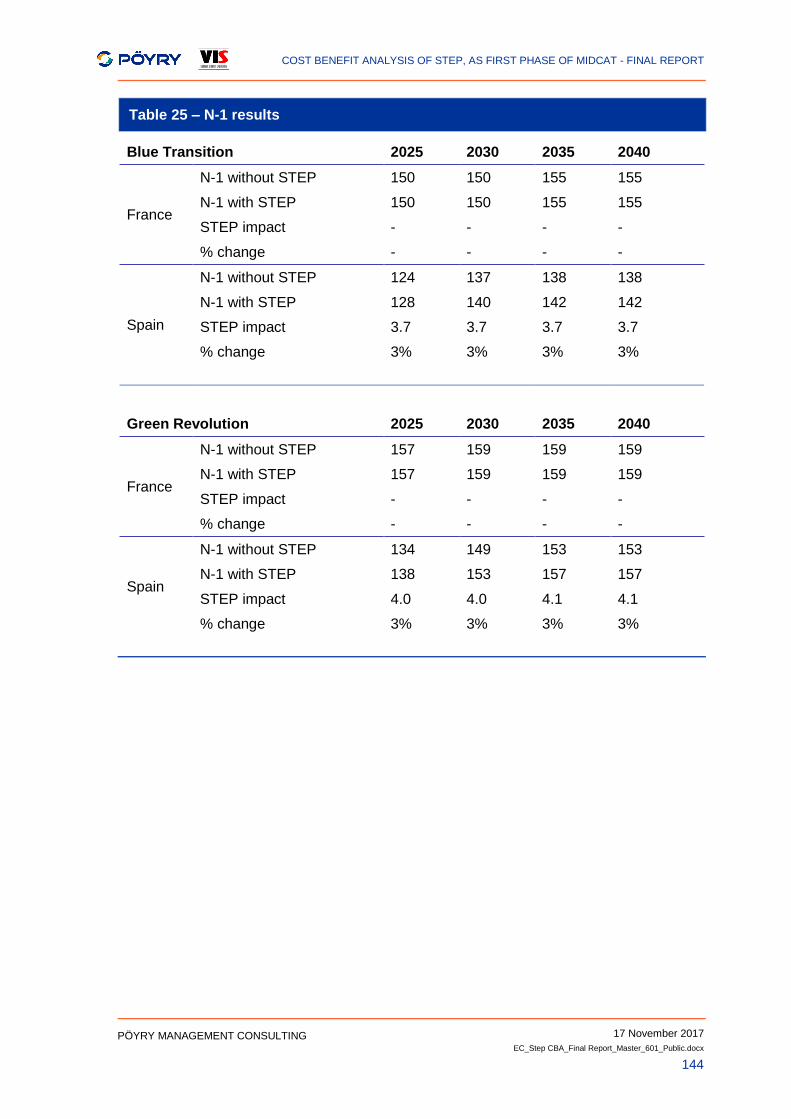
COST BENEFIT ANALYSIS OF STEP, AS FIRST PHASE OF MIDCAT - FINAL REPORT
17 November 2017
EC_Step CBA_Final Report_Master_601_Public.docx
144
PÖYRY MANAGEMENT CONSULTING
Table 25 – N-1 results
Blue Transition 2025 2030 2035 2040
France
N-1 without STEP 150 150 155 155
N-1 with STEP 150 150 155 155
STEP impact - - - -
% change - - - -
Spain
N-1 without STEP 124 137 138 138
N-1 with STEP 128 140 142 142
STEP impact 3.7 3.7 3.7 3.7
% change 3% 3% 3% 3%
Green Revolution 2025 2030 2035 2040
France
N-1 without STEP 157 159 159 159
N-1 with STEP 157 159 159 159
STEP impact - - - -
% change - - - -
Spain
N-1 without STEP 134 149 153 153
N-1 with STEP 138 153 157 157
STEP impact 4.0 4.0 4.1 4.1
% change 3% 3% 3% 3%
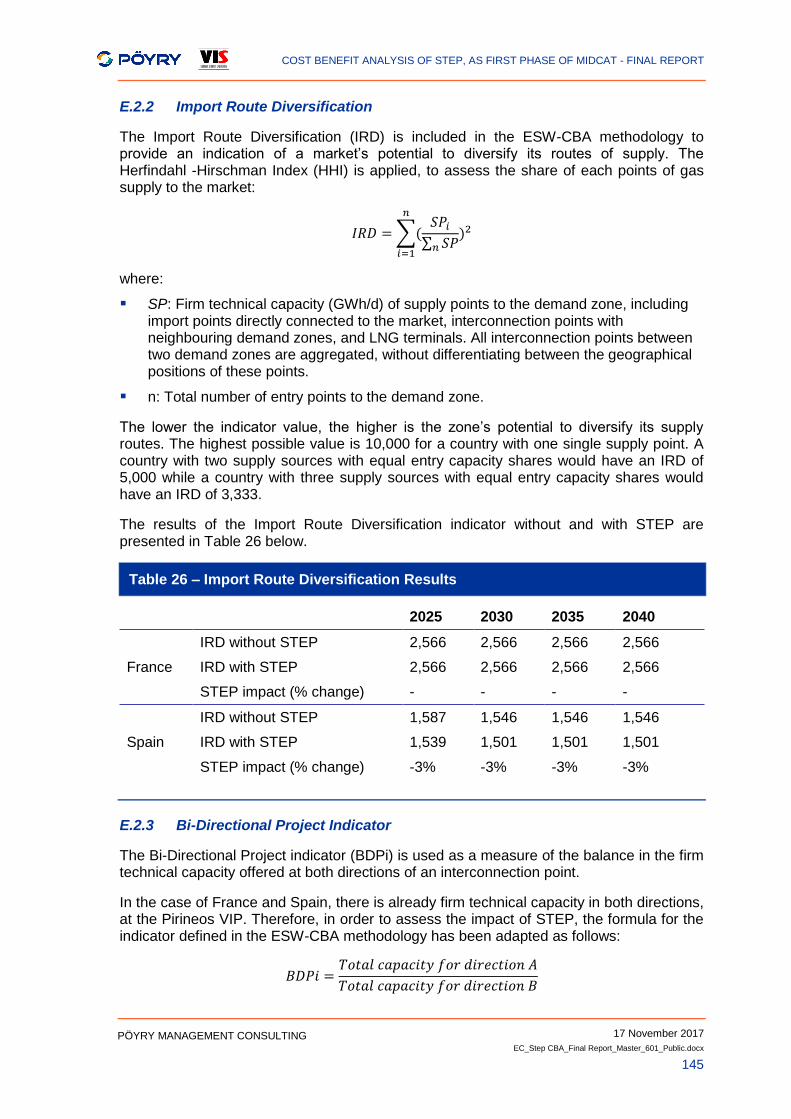
COST BENEFIT ANALYSIS OF STEP, AS FIRST PHASE OF MIDCAT - FINAL REPORT
17 November 2017
EC_Step CBA_Final Report_Master_601_Public.docx
145
PÖYRY MANAGEMENT CONSULTING
E.2.2 Import Route Diversification
The Import Route Diversification (IRD) is included in the ESW-CBA methodology to provide an indication of a market’s potential to diversify its routes of supply. The Herfindahl -Hirschman Index (HHI) is applied, to assess the share of each points of gas supply to the market:
𝐼𝑅𝐷 = ∑(𝑆𝑃𝑖
∑ 𝑆𝑃𝑛)2
𝑛
𝑖=1
where:
SP: Firm technical capacity (GWh/d) of supply points to the demand zone, including import points directly connected to the market, interconnection points with neighbouring demand zones, and LNG terminals. All interconnection points between two demand zones are aggregated, without differentiating between the geographical positions of these points.
n: Total number of entry points to the demand zone.
The lower the indicator value, the higher is the zone’s potential to diversify its supply routes. The highest possible value is 10,000 for a country with one single supply point. A country with two supply sources with equal entry capacity shares would have an IRD of 5,000 while a country with three supply sources with equal entry capacity shares would have an IRD of 3,333.
The results of the Import Route Diversification indicator without and with STEP are presented in Table 26 below.
Table 26 – Import Route Diversification Results
2025 2030 2035 2040
France
IRD without STEP 2,566 2,566 2,566 2,566
IRD with STEP 2,566 2,566 2,566 2,566
STEP impact (% change) - - - -
Spain
IRD without STEP 1,587 1,546 1,546 1,546
IRD with STEP 1,539 1,501 1,501 1,501
STEP impact (% change) -3% -3% -3% -3%
E.2.3 Bi-Directional Project Indicator
The Bi-Directional Project indicator (BDPi) is used as a measure of the balance in the firm technical capacity offered at both directions of an interconnection point.
In the case of France and Spain, there is already firm technical capacity in both directions, at the Pirineos VIP. Therefore, in order to assess the impact of STEP, the formula for the indicator defined in the ESW-CBA methodology has been adapted as follows:
𝐵𝐷𝑃𝑖 =𝑇𝑜𝑡𝑎𝑙 𝑐𝑎𝑝𝑎𝑐𝑖𝑡𝑦 𝑓𝑜𝑟 𝑑𝑖𝑟𝑒𝑐𝑡𝑖𝑜𝑛 𝐴
𝑇𝑜𝑡𝑎𝑙 𝑐𝑎𝑝𝑎𝑐𝑖𝑡𝑦 𝑓𝑜𝑟 𝑑𝑖𝑟𝑒𝑐𝑡𝑖𝑜𝑛 𝐵
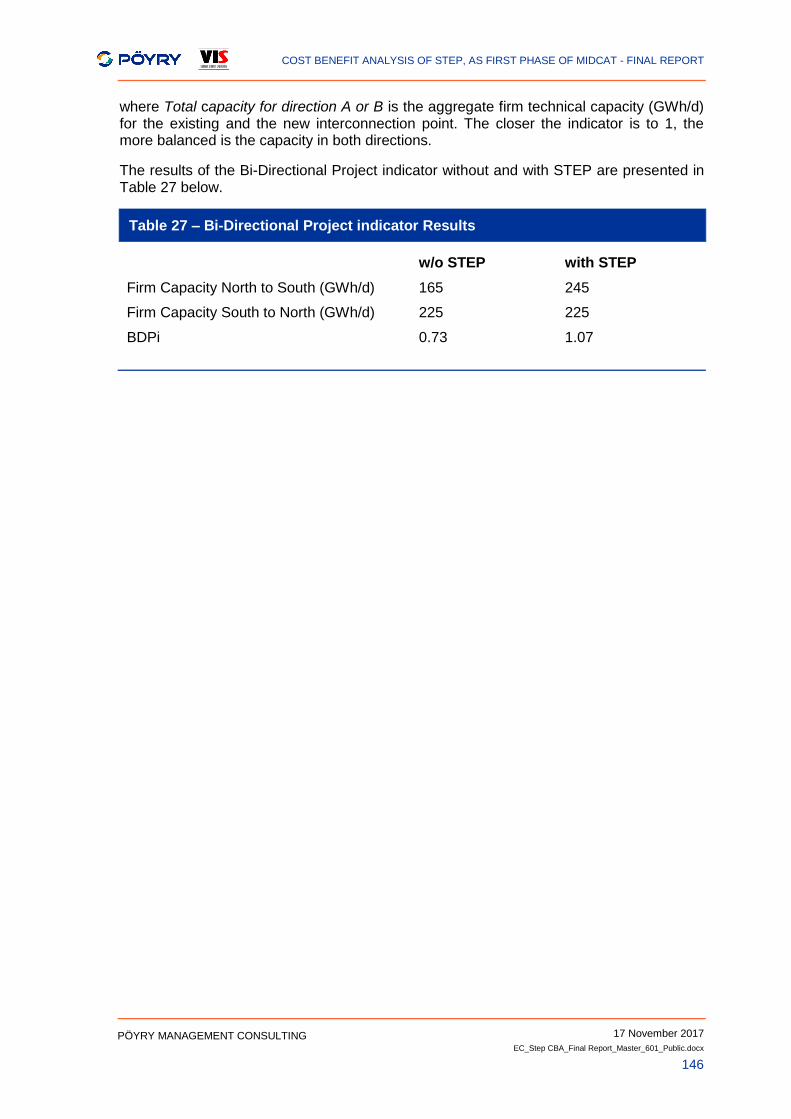
COST BENEFIT ANALYSIS OF STEP, AS FIRST PHASE OF MIDCAT - FINAL REPORT
17 November 2017
EC_Step CBA_Final Report_Master_601_Public.docx
146
PÖYRY MANAGEMENT CONSULTING
where Total capacity for direction A or B is the aggregate firm technical capacity (GWh/d) for the existing and the new interconnection point. The closer the indicator is to 1, the more balanced is the capacity in both directions.
The results of the Bi-Directional Project indicator without and with STEP are presented in Table 27 below.
Table 27 – Bi-Directional Project indicator Results
w/o STEP with STEP
Firm Capacity North to South (GWh/d) 165 245
Firm Capacity South to North (GWh/d) 225 225
BDPi 0.73 1.07
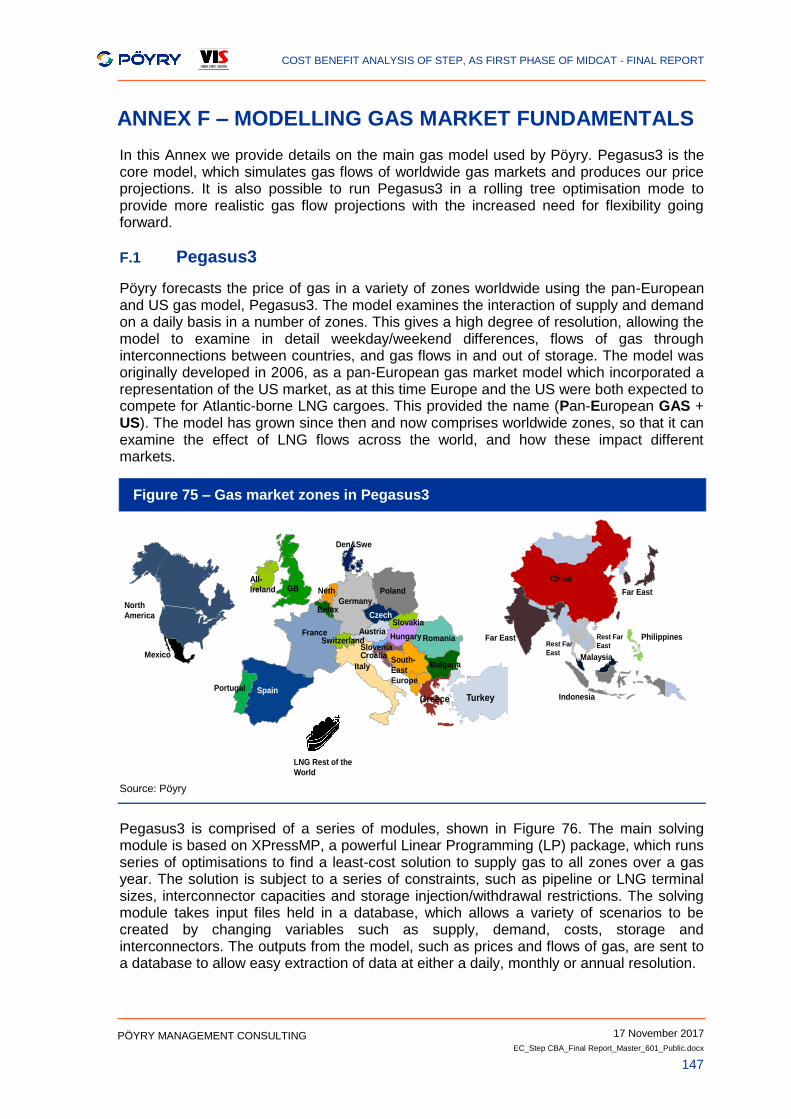
COST BENEFIT ANALYSIS OF STEP, AS FIRST PHASE OF MIDCAT - FINAL REPORT
17 November 2017
EC_Step CBA_Final Report_Master_601_Public.docx
147
PÖYRY MANAGEMENT CONSULTING
ANNEX F – MODELLING GAS MARKET FUNDAMENTALS
In this Annex we provide details on the main gas model used by Pöyry. Pegasus3 is the core model, which simulates gas flows of worldwide gas markets and produces our price projections. It is also possible to run Pegasus3 in a rolling tree optimisation mode to provide more realistic gas flow projections with the increased need for flexibility going forward.
F.1 Pegasus3
Pöyry forecasts the price of gas in a variety of zones worldwide using the pan-European and US gas model, Pegasus3. The model examines the interaction of supply and demand on a daily basis in a number of zones. This gives a high degree of resolution, allowing the model to examine in detail weekday/weekend differences, flows of gas through interconnections between countries, and gas flows in and out of storage. The model was originally developed in 2006, as a pan-European gas market model which incorporated a representation of the US market, as at this time Europe and the US were both expected to compete for Atlantic-borne LNG cargoes. This provided the name (Pan-European GAS + US). The model has grown since then and now comprises worldwide zones, so that it can examine the effect of LNG flows across the world, and how these impact different markets.
Figure 75 – Gas market zones in Pegasus3
Source: Pöyry
Pegasus3 is comprised of a series of modules, shown in Figure 76. The main solving module is based on XPressMP, a powerful Linear Programming (LP) package, which runs series of optimisations to find a least-cost solution to supply gas to all zones over a gas year. The solution is subject to a series of constraints, such as pipeline or LNG terminal sizes, interconnector capacities and storage injection/withdrawal restrictions. The solving module takes input files held in a database, which allows a variety of scenarios to be created by changing variables such as supply, demand, costs, storage and interconnectors. The outputs from the model, such as prices and flows of gas, are sent to a database to allow easy extraction of data at either a daily, monthly or annual resolution.
France
Spain
All-
Ireland
Germany
Neth
Belux
Italy
Austria
South-
East
Europe
Czech
Romania
GB
Den&Swe
Poland
Bulgaria
Greece
Hungary
Turkey
Switzerland
LNG Rest of the
World
CroatiaSlovenia
Slovakia
Far East
China
Philippines
Malaysia
Indonesia
Far East
Rest Far
EastRest Far
East
North
America
Mexico
Portugal
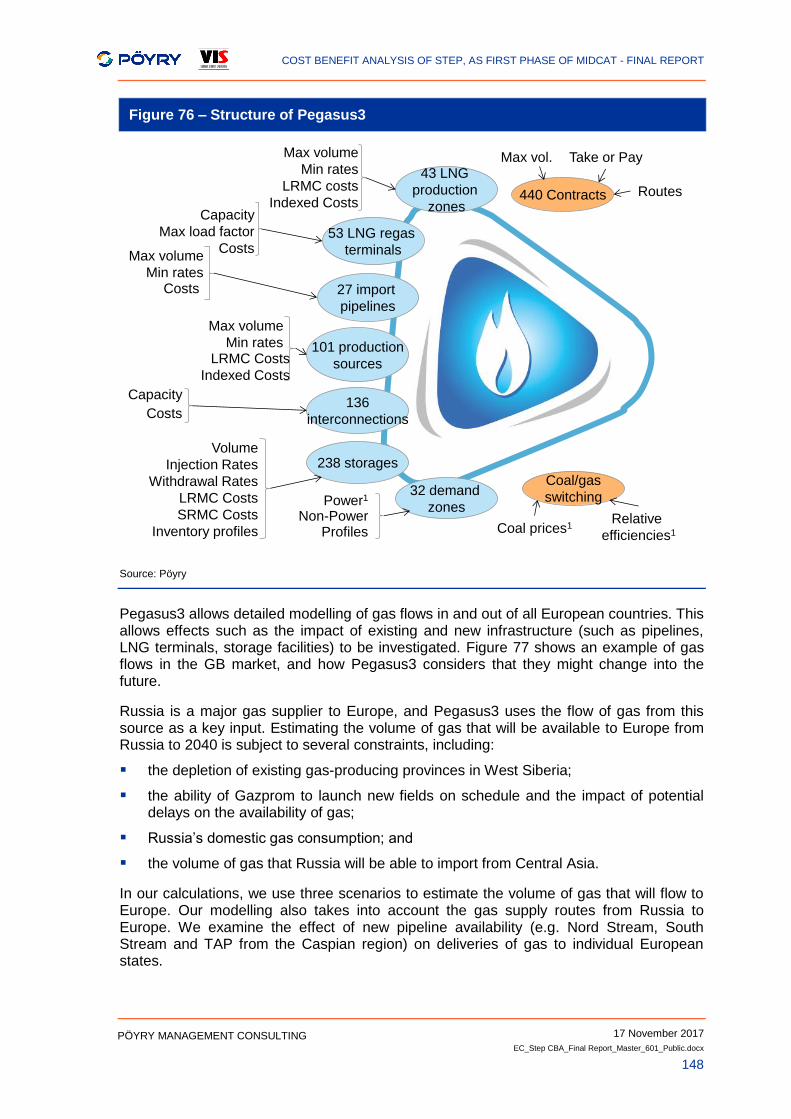
COST BENEFIT ANALYSIS OF STEP, AS FIRST PHASE OF MIDCAT - FINAL REPORT
17 November 2017
EC_Step CBA_Final Report_Master_601_Public.docx
148
PÖYRY MANAGEMENT CONSULTING
Figure 76 – Structure of Pegasus3
Source: Pöyry
Pegasus3 allows detailed modelling of gas flows in and out of all European countries. This allows effects such as the impact of existing and new infrastructure (such as pipelines, LNG terminals, storage facilities) to be investigated. Figure 77 shows an example of gas flows in the GB market, and how Pegasus3 considers that they might change into the future.
Russia is a major gas supplier to Europe, and Pegasus3 uses the flow of gas from this source as a key input. Estimating the volume of gas that will be available to Europe from Russia to 2040 is subject to several constraints, including:
the depletion of existing gas-producing provinces in West Siberia;
the ability of Gazprom to launch new fields on schedule and the impact of potential delays on the availability of gas;
Russia’s domestic gas consumption; and
the volume of gas that Russia will be able to import from Central Asia.
In our calculations, we use three scenarios to estimate the volume of gas that will flow to Europe. Our modelling also takes into account the gas supply routes from Russia to Europe. We examine the effect of new pipeline availability (e.g. Nord Stream, South Stream and TAP from the Caspian region) on deliveries of gas to individual European states.
440 Contracts
Coal/gas
switching
43 LNG
production
zones
27 import
pipelines
101 production
sources
136
interconnections
238 storages
32 demand
zones
53 LNG regas
terminals
Max vol. Take or Pay
ProfilesNon-Power
Power1
Volume
Injection Rates
Withdrawal Rates
LRMC Costs
SRMC Costs
Inventory profiles
Capacity
Costs
Max volume
Min ratesLRMC Costs
Indexed Costs
Max volume
Min ratesCosts
Capacity
Max load factor
Costs
Max volume
Min rates
LRMC costs
Indexed Costs
Coal prices1Relative
efficiencies1
Routes
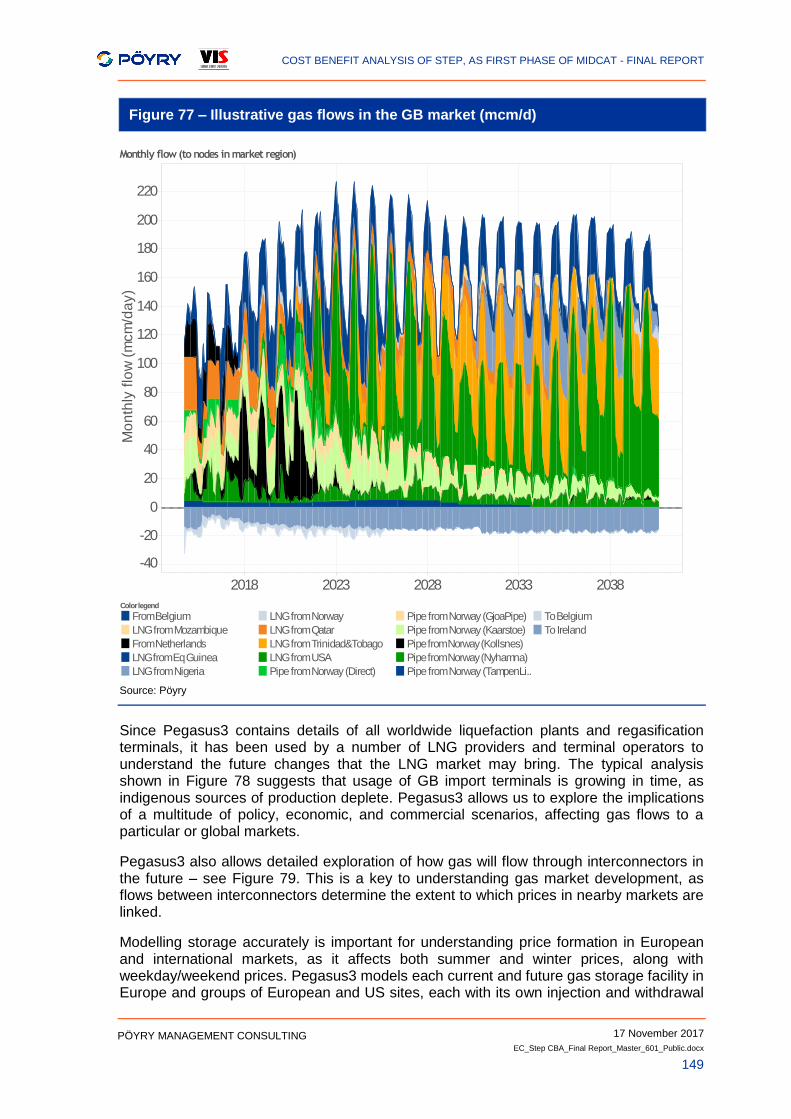
COST BENEFIT ANALYSIS OF STEP, AS FIRST PHASE OF MIDCAT - FINAL REPORT
17 November 2017
EC_Step CBA_Final Report_Master_601_Public.docx
149
PÖYRY MANAGEMENT CONSULTING
Figure 77 – Illustrative gas flows in the GB market (mcm/d)
Source: Pöyry
Since Pegasus3 contains details of all worldwide liquefaction plants and regasification terminals, it has been used by a number of LNG providers and terminal operators to understand the future changes that the LNG market may bring. The typical analysis shown in Figure 78 suggests that usage of GB import terminals is growing in time, as indigenous sources of production deplete. Pegasus3 allows us to explore the implications of a multitude of policy, economic, and commercial scenarios, affecting gas flows to a particular or global markets.
Pegasus3 also allows detailed exploration of how gas will flow through interconnectors in the future – see Figure 79. This is a key to understanding gas market development, as flows between interconnectors determine the extent to which prices in nearby markets are linked.
Modelling storage accurately is important for understanding price formation in European and international markets, as it affects both summer and winter prices, along with weekday/weekend prices. Pegasus3 models each current and future gas storage facility in Europe and groups of European and US sites, each with its own injection and withdrawal
2018 2023 2028 2033 2038
-40
-20
0
20
40
60
80
100
120
140
160
180
200
220
Mo
nth
ly f
low
(m
cm
/da
y)
Monthly flow (to nodes in market region)
Color legend
From Belgium
LNG from Mozambique
From Netherlands
LNG from Eq Guinea
LNG from Nigeria
LNG from Norway
LNG from Qatar
LNG from Trinidad&Tobago
LNG from USA
Pipe from Norway (Direct)
Pipe from Norway (GjoaPipe)
Pipe from Norway (Kaarstoe)
Pipe from Norway (Kollsnes)
Pipe from Norway (Nyhamna)
Pipe from Norway (TampenLi..
To Belgium
To Ireland
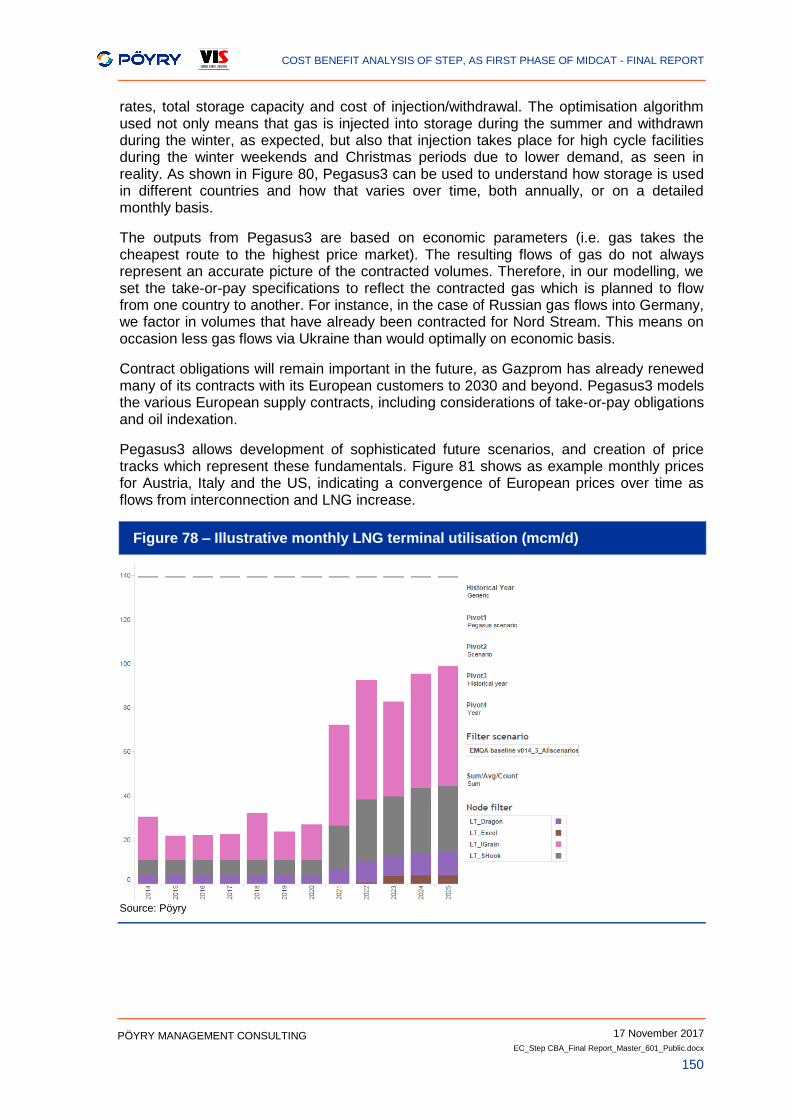
COST BENEFIT ANALYSIS OF STEP, AS FIRST PHASE OF MIDCAT - FINAL REPORT
17 November 2017
EC_Step CBA_Final Report_Master_601_Public.docx
150
PÖYRY MANAGEMENT CONSULTING
rates, total storage capacity and cost of injection/withdrawal. The optimisation algorithm used not only means that gas is injected into storage during the summer and withdrawn during the winter, as expected, but also that injection takes place for high cycle facilities during the winter weekends and Christmas periods due to lower demand, as seen in reality. As shown in Figure 80, Pegasus3 can be used to understand how storage is used in different countries and how that varies over time, both annually, or on a detailed monthly basis.
The outputs from Pegasus3 are based on economic parameters (i.e. gas takes the cheapest route to the highest price market). The resulting flows of gas do not always represent an accurate picture of the contracted volumes. Therefore, in our modelling, we set the take-or-pay specifications to reflect the contracted gas which is planned to flow from one country to another. For instance, in the case of Russian gas flows into Germany, we factor in volumes that have already been contracted for Nord Stream. This means on occasion less gas flows via Ukraine than would optimally on economic basis.
Contract obligations will remain important in the future, as Gazprom has already renewed many of its contracts with its European customers to 2030 and beyond. Pegasus3 models the various European supply contracts, including considerations of take-or-pay obligations and oil indexation.
Pegasus3 allows development of sophisticated future scenarios, and creation of price tracks which represent these fundamentals. Figure 81 shows as example monthly prices for Austria, Italy and the US, indicating a convergence of European prices over time as flows from interconnection and LNG increase.
Figure 78 – Illustrative monthly LNG terminal utilisation (mcm/d)
Source: Pöyry
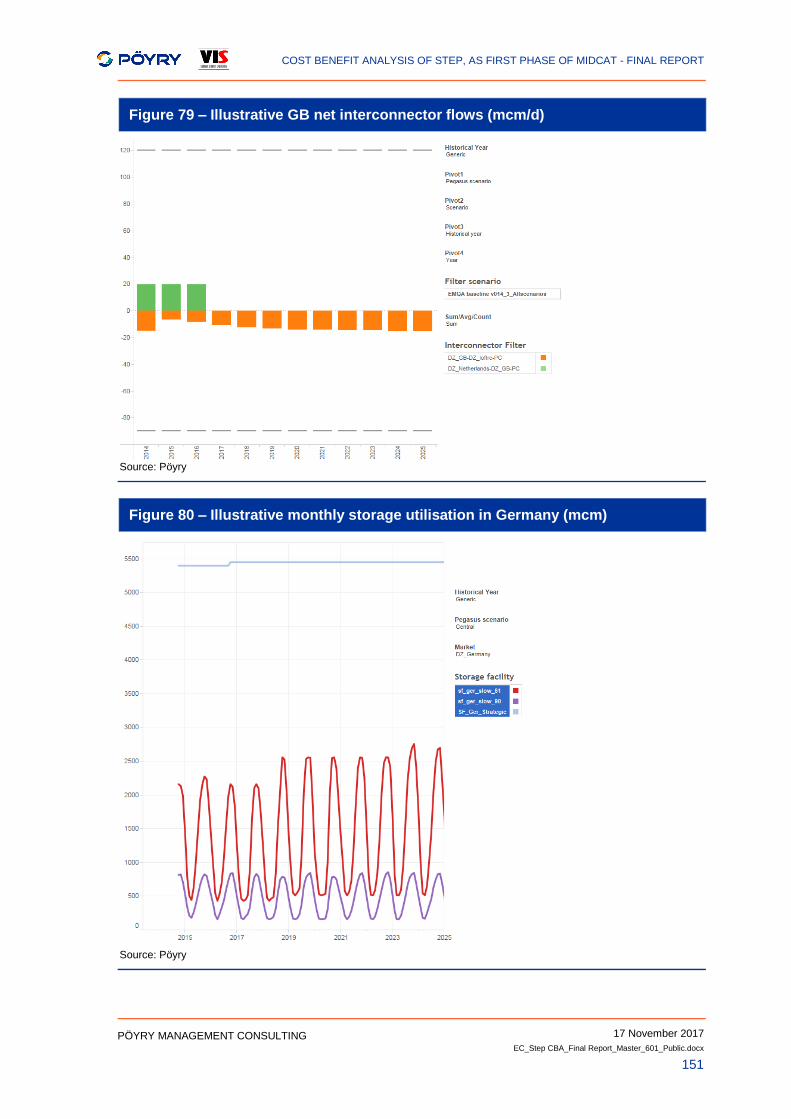
COST BENEFIT ANALYSIS OF STEP, AS FIRST PHASE OF MIDCAT - FINAL REPORT
17 November 2017
EC_Step CBA_Final Report_Master_601_Public.docx
151
PÖYRY MANAGEMENT CONSULTING
Figure 79 – Illustrative GB net interconnector flows (mcm/d)
Source: Pöyry
Figure 80 – Illustrative monthly storage utilisation in Germany (mcm)
Source: Pöyry
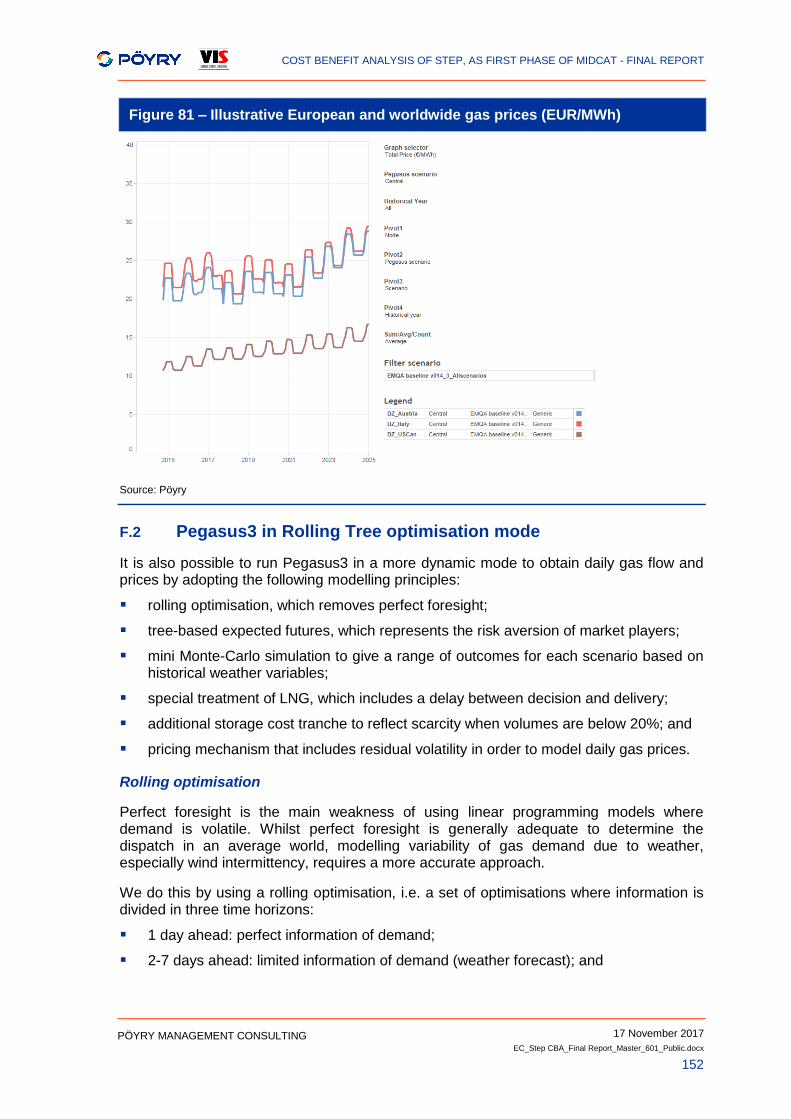
COST BENEFIT ANALYSIS OF STEP, AS FIRST PHASE OF MIDCAT - FINAL REPORT
17 November 2017
EC_Step CBA_Final Report_Master_601_Public.docx
152
PÖYRY MANAGEMENT CONSULTING
Figure 81 – Illustrative European and worldwide gas prices (EUR/MWh)
Source: Pöyry
F.2 Pegasus3 in Rolling Tree optimisation mode
It is also possible to run Pegasus3 in a more dynamic mode to obtain daily gas flow and prices by adopting the following modelling principles:
rolling optimisation, which removes perfect foresight;
tree-based expected futures, which represents the risk aversion of market players;
mini Monte-Carlo simulation to give a range of outcomes for each scenario based on historical weather variables;
special treatment of LNG, which includes a delay between decision and delivery;
additional storage cost tranche to reflect scarcity when volumes are below 20%; and
pricing mechanism that includes residual volatility in order to model daily gas prices.
Rolling optimisation
Perfect foresight is the main weakness of using linear programming models where demand is volatile. Whilst perfect foresight is generally adequate to determine the dispatch in an average world, modelling variability of gas demand due to weather, especially wind intermittency, requires a more accurate approach.
We do this by using a rolling optimisation, i.e. a set of optimisations where information is divided in three time horizons:
1 day ahead: perfect information of demand;
2-7 days ahead: limited information of demand (weather forecast); and
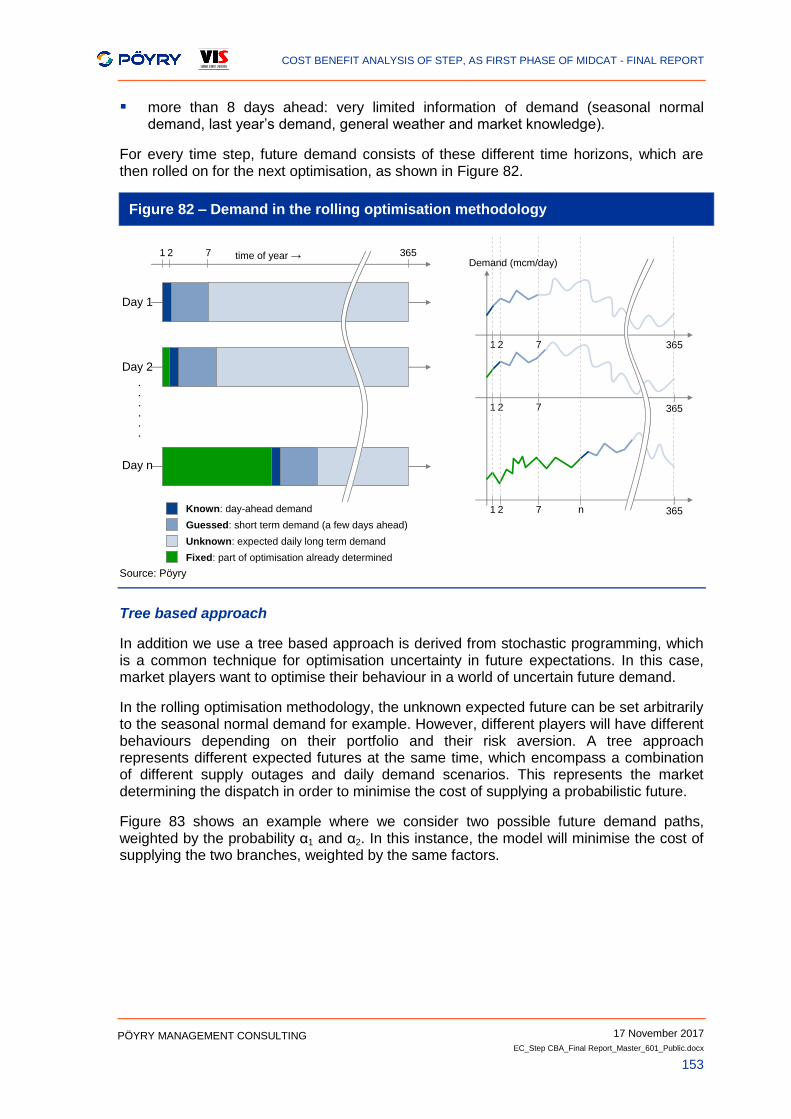
COST BENEFIT ANALYSIS OF STEP, AS FIRST PHASE OF MIDCAT - FINAL REPORT
17 November 2017
EC_Step CBA_Final Report_Master_601_Public.docx
153
PÖYRY MANAGEMENT CONSULTING
more than 8 days ahead: very limited information of demand (seasonal normal demand, last year’s demand, general weather and market knowledge).
For every time step, future demand consists of these different time horizons, which are then rolled on for the next optimisation, as shown in Figure 82.
Figure 82 – Demand in the rolling optimisation methodology
Source: Pöyry
Tree based approach
In addition we use a tree based approach is derived from stochastic programming, which is a common technique for optimisation uncertainty in future expectations. In this case, market players want to optimise their behaviour in a world of uncertain future demand.
In the rolling optimisation methodology, the unknown expected future can be set arbitrarily to the seasonal normal demand for example. However, different players will have different behaviours depending on their portfolio and their risk aversion. A tree approach represents different expected futures at the same time, which encompass a combination of different supply outages and daily demand scenarios. This represents the market determining the dispatch in order to minimise the cost of supplying a probabilistic future.
Figure 83 shows an example where we consider two possible future demand paths, weighted by the probability α1 and α2. In this instance, the model will minimise the cost of supplying the two branches, weighted by the same factors.
Day 1
Day 2
Day n
Known: day-ahead demand
Guessed: short term demand (a few days ahead)
Unknown: expected daily long term demand
Fixed: part of optimisation already determined
.
.
.
.
.
.
1 2 7 365time of year →
1 2 7
1 2 7
1 2 7 n
365
365
365
Demand (mcm/day)
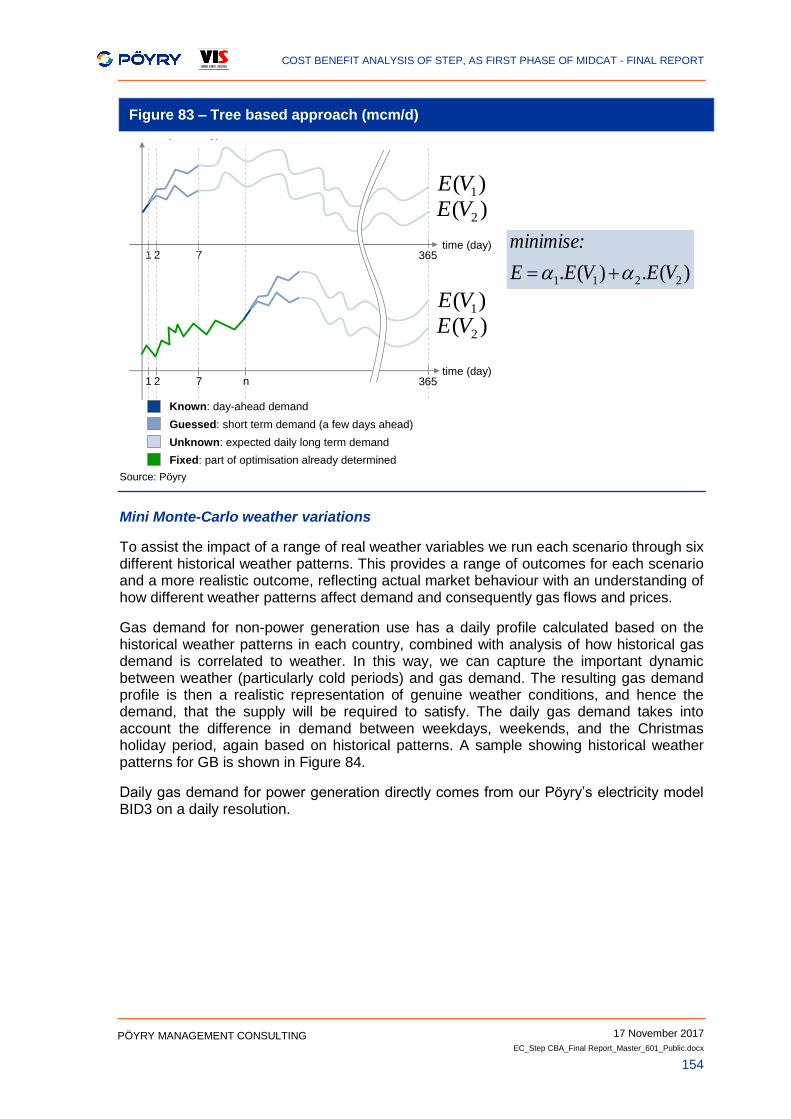
COST BENEFIT ANALYSIS OF STEP, AS FIRST PHASE OF MIDCAT - FINAL REPORT
17 November 2017
EC_Step CBA_Final Report_Master_601_Public.docx
154
PÖYRY MANAGEMENT CONSULTING
Figure 83 – Tree based approach (mcm/d)
Source: Pöyry
Mini Monte-Carlo weather variations
To assist the impact of a range of real weather variables we run each scenario through six different historical weather patterns. This provides a range of outcomes for each scenario and a more realistic outcome, reflecting actual market behaviour with an understanding of how different weather patterns affect demand and consequently gas flows and prices.
Gas demand for non-power generation use has a daily profile calculated based on the historical weather patterns in each country, combined with analysis of how historical gas demand is correlated to weather. In this way, we can capture the important dynamic between weather (particularly cold periods) and gas demand. The resulting gas demand profile is then a realistic representation of genuine weather conditions, and hence the demand, that the supply will be required to satisfy. The daily gas demand takes into account the difference in demand between weekdays, weekends, and the Christmas holiday period, again based on historical patterns. A sample showing historical weather patterns for GB is shown in Figure 84.
Daily gas demand for power generation directly comes from our Pöyry’s electricity model BID3 on a daily resolution.
)( 1VE
1 2 7 365
Demand (mcm/day)
1 2 7
time (day)
365time (day)
n
)( 2VE
)( 1VE
)( 2VE
)(.)(. 2211 VEVEE
minimise:
Known: day-ahead demand
Unknown: expected daily long term demand
Fixed: part of optimisation already determined
Guessed: short term demand (a few days ahead)
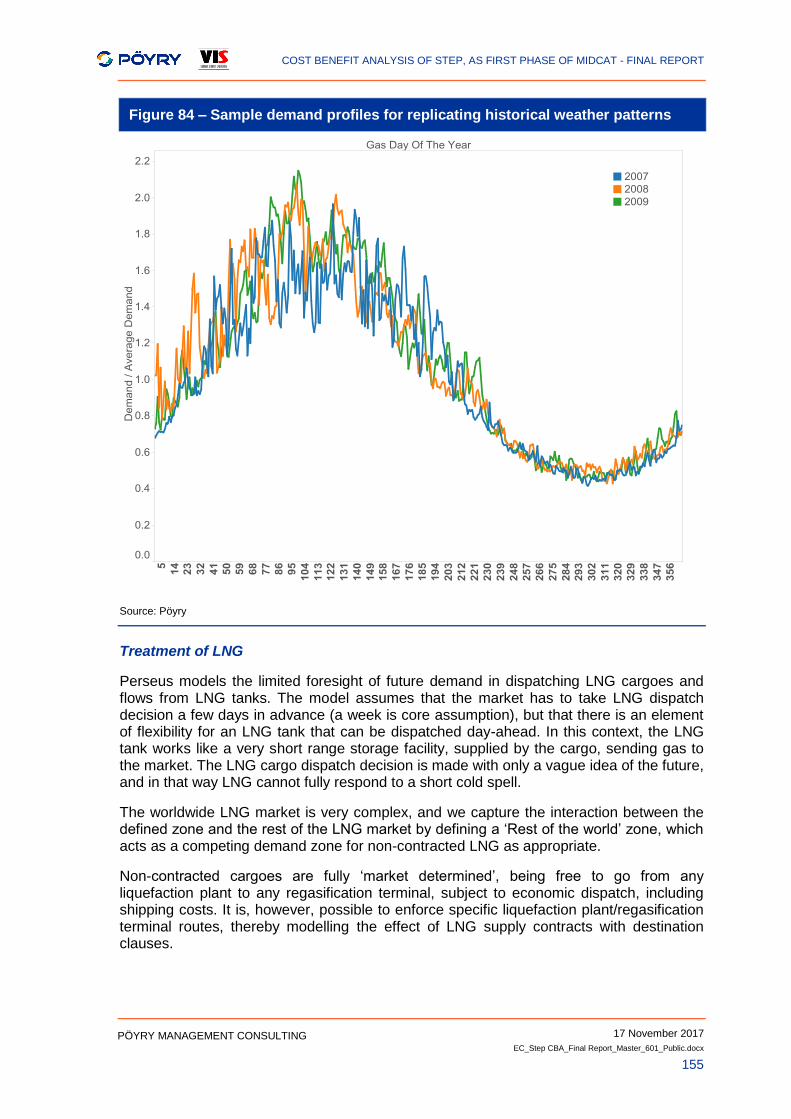
COST BENEFIT ANALYSIS OF STEP, AS FIRST PHASE OF MIDCAT - FINAL REPORT
17 November 2017
EC_Step CBA_Final Report_Master_601_Public.docx
155
PÖYRY MANAGEMENT CONSULTING
Figure 84 – Sample demand profiles for replicating historical weather patterns
Source: Pöyry
Treatment of LNG
Perseus models the limited foresight of future demand in dispatching LNG cargoes and flows from LNG tanks. The model assumes that the market has to take LNG dispatch decision a few days in advance (a week is core assumption), but that there is an element of flexibility for an LNG tank that can be dispatched day-ahead. In this context, the LNG tank works like a very short range storage facility, supplied by the cargo, sending gas to the market. The LNG cargo dispatch decision is made with only a vague idea of the future, and in that way LNG cannot fully respond to a short cold spell.
The worldwide LNG market is very complex, and we capture the interaction between the defined zone and the rest of the LNG market by defining a ‘Rest of the world’ zone, which acts as a competing demand zone for non-contracted LNG as appropriate.
Non-contracted cargoes are fully ‘market determined’, being free to go from any liquefaction plant to any regasification terminal, subject to economic dispatch, including shipping costs. It is, however, possible to enforce specific liquefaction plant/regasification terminal routes, thereby modelling the effect of LNG supply contracts with destination clauses.
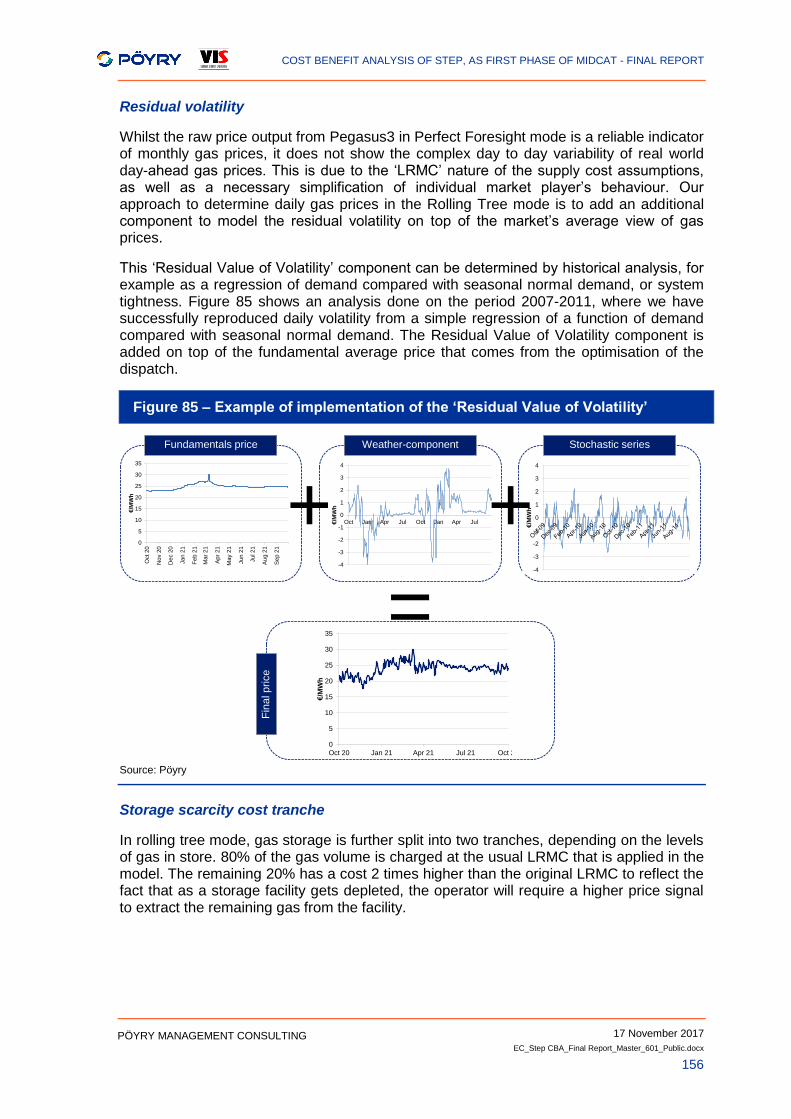
COST BENEFIT ANALYSIS OF STEP, AS FIRST PHASE OF MIDCAT - FINAL REPORT
17 November 2017
EC_Step CBA_Final Report_Master_601_Public.docx
156
PÖYRY MANAGEMENT CONSULTING
Residual volatility
Whilst the raw price output from Pegasus3 in Perfect Foresight mode is a reliable indicator of monthly gas prices, it does not show the complex day to day variability of real world day-ahead gas prices. This is due to the ‘LRMC’ nature of the supply cost assumptions, as well as a necessary simplification of individual market player’s behaviour. Our approach to determine daily gas prices in the Rolling Tree mode is to add an additional component to model the residual volatility on top of the market’s average view of gas prices.
This ‘Residual Value of Volatility’ component can be determined by historical analysis, for example as a regression of demand compared with seasonal normal demand, or system tightness. Figure 85 shows an analysis done on the period 2007-2011, where we have successfully reproduced daily volatility from a simple regression of a function of demand compared with seasonal normal demand. The Residual Value of Volatility component is added on top of the fundamental average price that comes from the optimisation of the dispatch.
Figure 85 – Example of implementation of the ‘Residual Value of Volatility’
Source: Pöyry
Storage scarcity cost tranche
In rolling tree mode, gas storage is further split into two tranches, depending on the levels of gas in store. 80% of the gas volume is charged at the usual LRMC that is applied in the model. The remaining 20% has a cost 2 times higher than the original LRMC to reflect the fact that as a storage facility gets depleted, the operator will require a higher price signal to extract the remaining gas from the facility.
0
5
10
15
20
25
30
35
Oct 20 Jan 21 Apr 21 Jul 21 Oct 21
€/M
Wh
Fundamentals price Weather-component Stochastic series
Fin
al price
+
=0
5
10
15
20
25
30
35
Oct 20
Nov 2
0
Dec 2
0
Jan 2
1
Feb 2
1
Mar
21
Apr
21
May 2
1
Jun 2
1
Jul 21
Aug 2
1
Sep 2
1
€/M
Wh
-4
-3
-2
-1
0
1
2
3
4
Oct Jan Apr Jul Oct Jan Apr Jul€/M
Wh
-4
-3
-2
-1
0
1
2
3
4
€/M
Wh+
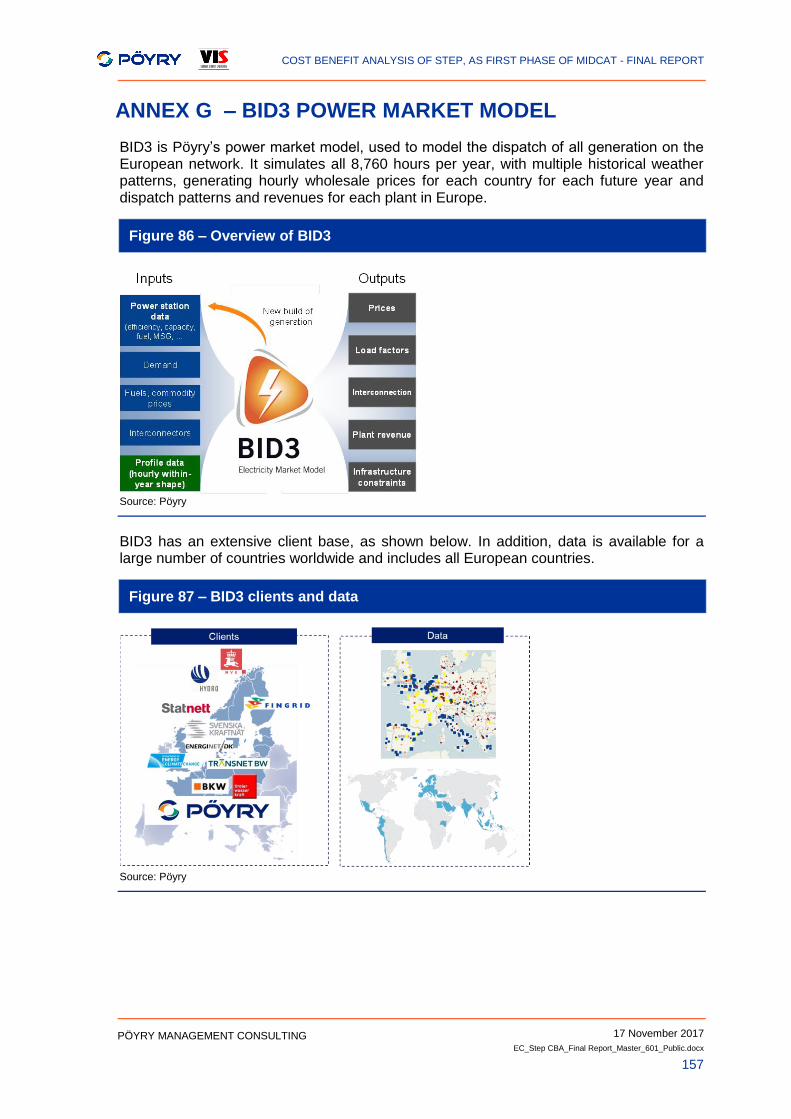
COST BENEFIT ANALYSIS OF STEP, AS FIRST PHASE OF MIDCAT - FINAL REPORT
17 November 2017
EC_Step CBA_Final Report_Master_601_Public.docx
157
PÖYRY MANAGEMENT CONSULTING
ANNEX G – BID3 POWER MARKET MODEL
BID3 is Pöyry’s power market model, used to model the dispatch of all generation on the European network. It simulates all 8,760 hours per year, with multiple historical weather patterns, generating hourly wholesale prices for each country for each future year and dispatch patterns and revenues for each plant in Europe.
Figure 86 – Overview of BID3
Source: Pöyry
BID3 has an extensive client base, as shown below. In addition, data is available for a large number of countries worldwide and includes all European countries.
Figure 87 – BID3 clients and data
Source: Pöyry
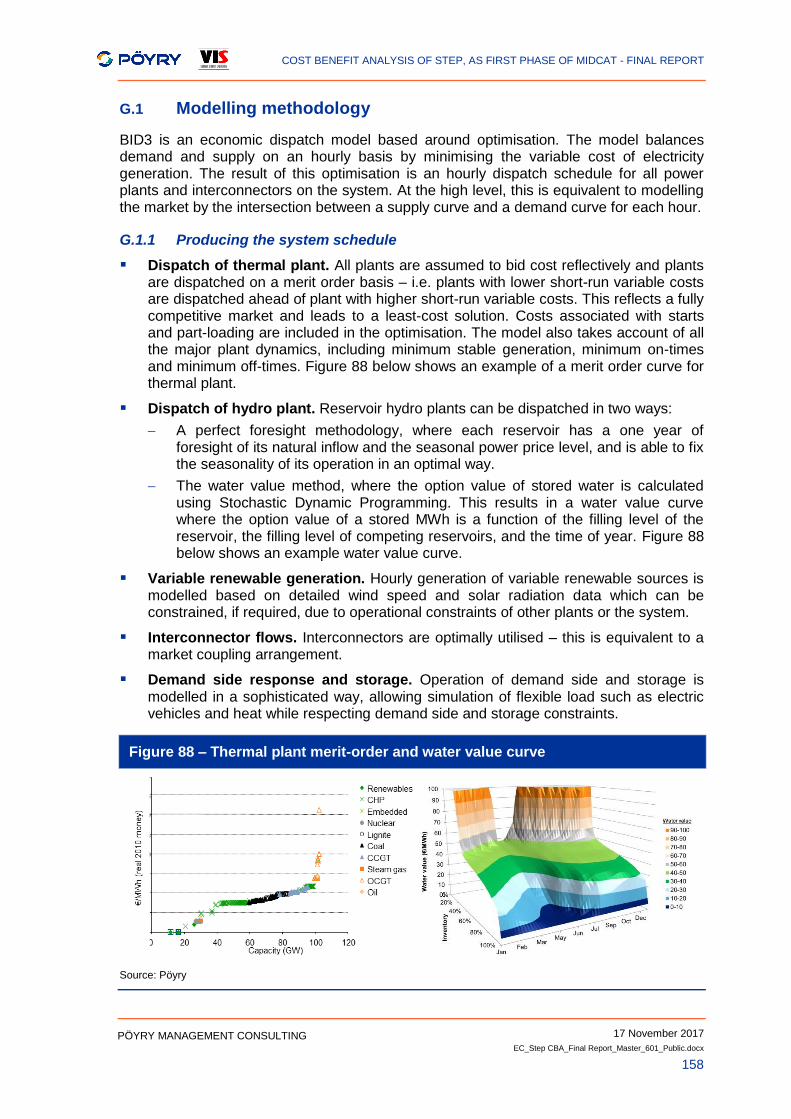
COST BENEFIT ANALYSIS OF STEP, AS FIRST PHASE OF MIDCAT - FINAL REPORT
17 November 2017
EC_Step CBA_Final Report_Master_601_Public.docx
158
PÖYRY MANAGEMENT CONSULTING
G.1 Modelling methodology
BID3 is an economic dispatch model based around optimisation. The model balances demand and supply on an hourly basis by minimising the variable cost of electricity generation. The result of this optimisation is an hourly dispatch schedule for all power plants and interconnectors on the system. At the high level, this is equivalent to modelling the market by the intersection between a supply curve and a demand curve for each hour.
G.1.1 Producing the system schedule
Dispatch of thermal plant. All plants are assumed to bid cost reflectively and plants are dispatched on a merit order basis – i.e. plants with lower short-run variable costs are dispatched ahead of plant with higher short-run variable costs. This reflects a fully competitive market and leads to a least-cost solution. Costs associated with starts and part-loading are included in the optimisation. The model also takes account of all the major plant dynamics, including minimum stable generation, minimum on-times and minimum off-times. Figure 88 below shows an example of a merit order curve for thermal plant.
Dispatch of hydro plant. Reservoir hydro plants can be dispatched in two ways:
A perfect foresight methodology, where each reservoir has a one year of foresight of its natural inflow and the seasonal power price level, and is able to fix the seasonality of its operation in an optimal way.
The water value method, where the option value of stored water is calculated using Stochastic Dynamic Programming. This results in a water value curve where the option value of a stored MWh is a function of the filling level of the reservoir, the filling level of competing reservoirs, and the time of year. Figure 88 below shows an example water value curve.
Variable renewable generation. Hourly generation of variable renewable sources is modelled based on detailed wind speed and solar radiation data which can be constrained, if required, due to operational constraints of other plants or the system.
Interconnector flows. Interconnectors are optimally utilised – this is equivalent to a market coupling arrangement.
Demand side response and storage. Operation of demand side and storage is modelled in a sophisticated way, allowing simulation of flexible load such as electric vehicles and heat while respecting demand side and storage constraints.
Figure 88 – Thermal plant merit-order and water value curve
Source: Pöyry
COST BENEFIT ANALYSIS OF STEP, AS FIRST PHASE OF MIDCAT - FINAL REPORT
17 November 2017
EC_Step CBA_Final Report_Master_601_Public.docx
159
PÖYRY MANAGEMENT CONSULTING
G.1.2 Power price
The model produces a power price for each hour and for each zone (which may be smaller than one country, for example the different price-zones within Norway). The hourly power price is composed of two components:
Short-run marginal cost (SRMC). The SRMC is the extra cost of one additional unit of power consumption. It is also the minimum price at which all operating plant are recovering their variable costs. Since the optimisation includes start-up and part-load costs all plant will fully cover their variable costs, including fuel, start-up, and part-loading costs.
Scarcity rent. A scarcity rent is included in the market price – we assume power prices are able to rise above the short-run marginal cost at times when the capacity margin is tight. In each hour the scarcity rent is determined by the capacity margin in each market. It is needed to ensure that the plants required to maintain system security are able to recover all of their fixed and capital costs from the market.
G.2 Key input data
Pöyry’s power market modelling is based on Pöyry’s plant-by-plant database of the European power market. The database is updated each quarter by Pöyry’s country experts as part of our Energy Market Quarterly Analysis. As part of the same process we review our interconnection data, fuel prices, and demand projections.
Demand. Annual demand projections are based on TSO forecasts and our own analysis. For the within year profile of demand we use historical demand profiles – for each future year that is modelled we use demand profiles from a range of historical years.
Intermittent generation. We use historical wind speed data and solar radiation data as raw inputs. We use consistent historical weather and demand profiles (i.e. both from the same historical year) which means we capture any correlations between weather and demand, and can also example a variety of conditions – for example a particularly windy year, or a cold, high demand, low wind period.
Our wind data is from Anemos and is reanalysis data from weather modelling based on satellite observations. It is hourly wind speeds at grid points on a 20km grid across Europe, at hub height. Figure 89 below shows average wind speeds based on this data. Hourly wind speed is converted to hourly wind generation based on wind capacity locations and using appropriate aggregated power curves.
The solar radiation data is from Transvalor, and is again converted to solar generation profiles based on capacity distributions across each country. Figure 89 below shows average solar radiation based on this data.
Fuel prices. Pöyry has a full suite of energy market models covering coal, gas, oil, carbon, and biomass. These are used in conjunction with BID3 to produce input fuel prices consistent with the scenarios developed.
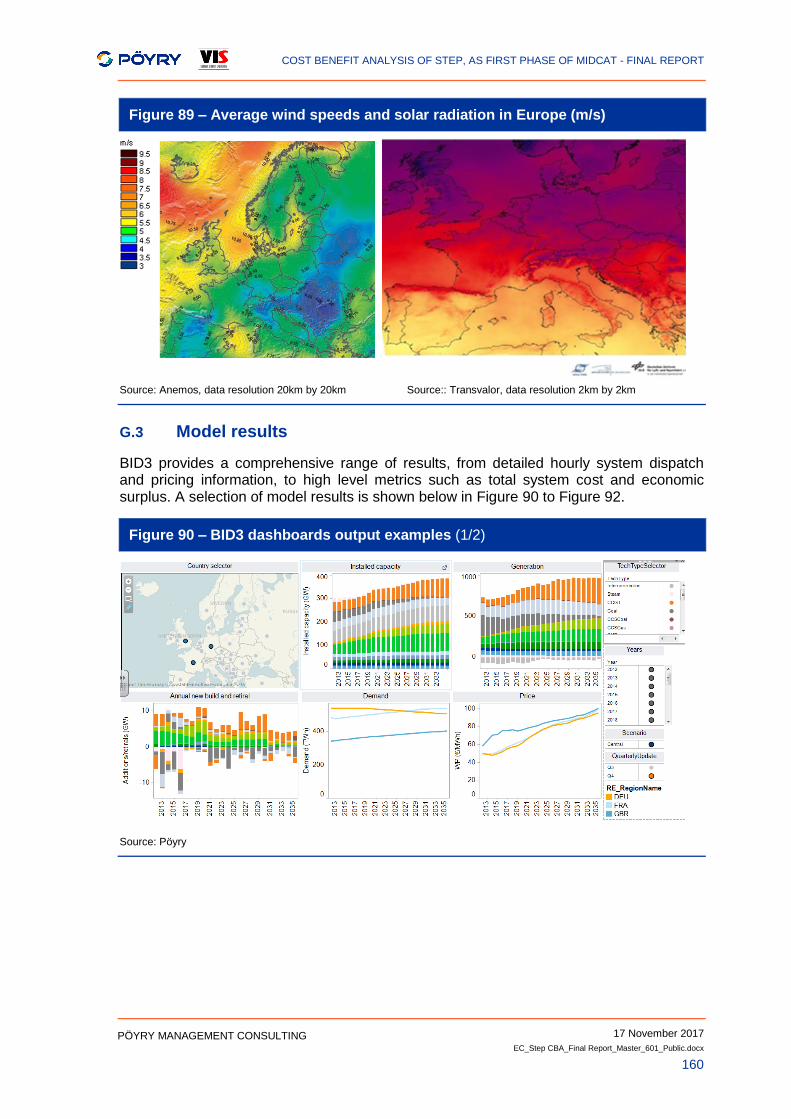
COST BENEFIT ANALYSIS OF STEP, AS FIRST PHASE OF MIDCAT - FINAL REPORT
17 November 2017
EC_Step CBA_Final Report_Master_601_Public.docx
160
PÖYRY MANAGEMENT CONSULTING
Figure 89 – Average wind speeds and solar radiation in Europe (m/s)
Source: Anemos, data resolution 20km by 20km Source:: Transvalor, data resolution 2km by 2km
G.3 Model results
BID3 provides a comprehensive range of results, from detailed hourly system dispatch and pricing information, to high level metrics such as total system cost and economic surplus. A selection of model results is shown below in Figure 90 to Figure 92.
Figure 90 – BID3 dashboards output examples (1/2)
Source: Pöyry
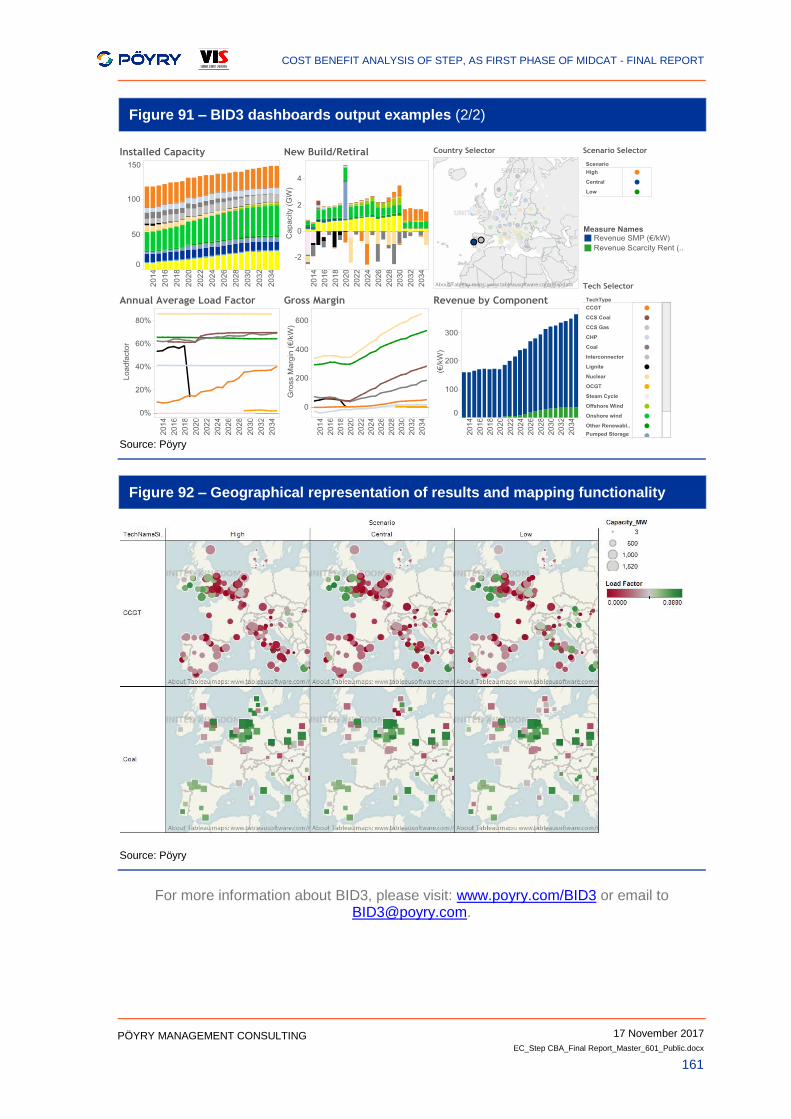
COST BENEFIT ANALYSIS OF STEP, AS FIRST PHASE OF MIDCAT - FINAL REPORT
17 November 2017
EC_Step CBA_Final Report_Master_601_Public.docx
161
PÖYRY MANAGEMENT CONSULTING
Figure 91 – BID3 dashboards output examples (2/2)
Source: Pöyry
Figure 92 – Geographical representation of results and mapping functionality
Source: Pöyry
For more information about BID3, please visit: www.poyry.com/BID3 or email to [email protected].

COST BENEFIT ANALYSIS OF STEP, AS FIRST PHASE OF MIDCAT - FINAL REPORT
17 November 2017
EC_Step CBA_Final Report_Master_601_Public.docx
162
PÖYRY MANAGEMENT CONSULTING
[This page is intentionally blank]
COST BENEFIT ANALYSIS OF STEP, AS FIRST PHASE OF MIDCAT - FINAL REPORT
17 November 2017
EC_Step CBA_Final Report_Master_601_Public.docx
163
PÖYRY MANAGEMENT CONSULTING
ANNEX H – MARKET REPORTS
Pöyry produces renowned Market Reports (including the ILEX Energy Reports). Pöyry’s Market Reports provide detailed descriptions of a country or regional energy market, coupled with market-leading price projections for wholesale electricity, gas, carbon and/or green certificates. Pöyry’s Market Reports and price projections are currently available for the following sectors, countries and regions:
electricity markets:
Austria;
Belgium;
Bosnia and Herzegovina;
Bulgaria;
California (CAISO);
Central-East Europe (including Austria, Czech Republic, Hungary, Slovakia and Slovenia);
Chile;
Croatia;
Denmark;
Finland;
France;
Germany;
Great Britain;
Greece;
Hungary;
India;
Indonesia (Java-Bali, Sumatra);
Iran;
Ireland SEM;
Italy;
Japan;
Malaysia;
Mexico;
Montenegro;
the Netherlands;
Norway;
Oman;
Panama;
Peru;
Philippines;
PJM USA (available summer 2017);
Poland;
Portugal;
Romania;
Serbia;
Singapore;
Slovakia;
Slovenia;
South-East Europe (including Albania, Bosnia and Herzegovina, Croatia, Kosovo, Macedonia, Montenegro, Serbia and Slovenia);
Spain;
Sweden;
Switzerland;
Texas (ERCOT);
Thailand;
Turkey; and
Vietnam.
gas markets in:
Spain; and
Western European & Global Gas Supply.
renewables markets in:
Italy (Solar PV and/or Wind);
Norway and Sweden (Elcert);
Poland;
Romania;

COST BENEFIT ANALYSIS OF STEP, AS FIRST PHASE OF MIDCAT - FINAL REPORT
17 November 2017
EC_Step CBA_Final Report_Master_601_Public.docx
164
PÖYRY MANAGEMENT CONSULTING
Spain (Solar and Wind); and
United Kingdom.
In addition to our energy market, Pöyry also produces a number of other reports covering, amongst others:
the Global Pellet Market;
Pulp, Paper, Packaging and Hygiene (3PH) reports; and
Land, Forest, and Wood Products (LFWP) reports.
Further information can be obtained by contacting Pöyry Management Consulting (email us at: [email protected]) or by visiting our website.
COST BENEFIT ANALYSIS OF STEP, AS FIRST PHASE OF MIDCAT - FINAL REPORT
17 November 2017
EC_Step CBA_Final Report_Master_601_Public.docx
165
PÖYRY MANAGEMENT CONSULTING
QUALITY AND DOCUMENT CONTROL
Quality control Report’s unique identifier: 2018/STEP/600
Role Name Date
Author(s): Antonio Michelon
Angus Paxton
Fotis Thomaidis
17 November 2017
Approved by: Gareth Davies 17 November 2017
QC review by: 17 November 2017
Document control
Version no. Unique id. Principal changes Date
v101 DRAFT release to client 26/05/2016
v102 Release to client 30/06/2017
Master v100 Release to client 25/07/2017
Master v300 Release to client 30/10/2017
Master v400 Release to client 31/10/2017
Master v500 FINAL release to client 01/11/2017
Master v600 2ND FINAL release to client 17/11/2017
Master v601 2ND FINAL release to client - Corrected 23/11/2017
Pöyry is an international consulting and engineering company.
We deliver smart solutions across power generation, transmission & distribution, forest industry, chemicals & biorefining, mining & metals, transportation and water.
Pöyry PLC has c.5500 experts operating in 40 countries and net sales of EUR 530 million. The company's shares are quoted on Nasdaq Helsinki (POY1V).
Pöyry Management Consulting provides leading-edge consulting and advisory services covering the whole value chain in energy, forest and bio-based industries. Our energy practice is the leading provider of strategic, commercial, regulatory and policy advice to energy markets in Europe, the Middle East and the Americas. Our energy team of 200 specialists, located across 12 offices in 11 countries, offers unparalleled expertise in the rapidly changing energy sector.
Pöyry Management Consulting (Italia) S.r.l. Viale Francesco Restelli 3/1 20124 Milano Italy
+39 02 36596900
www.poyry.com
MJ-01-18-352-EN-N