Embed Size (px)
Citation preview
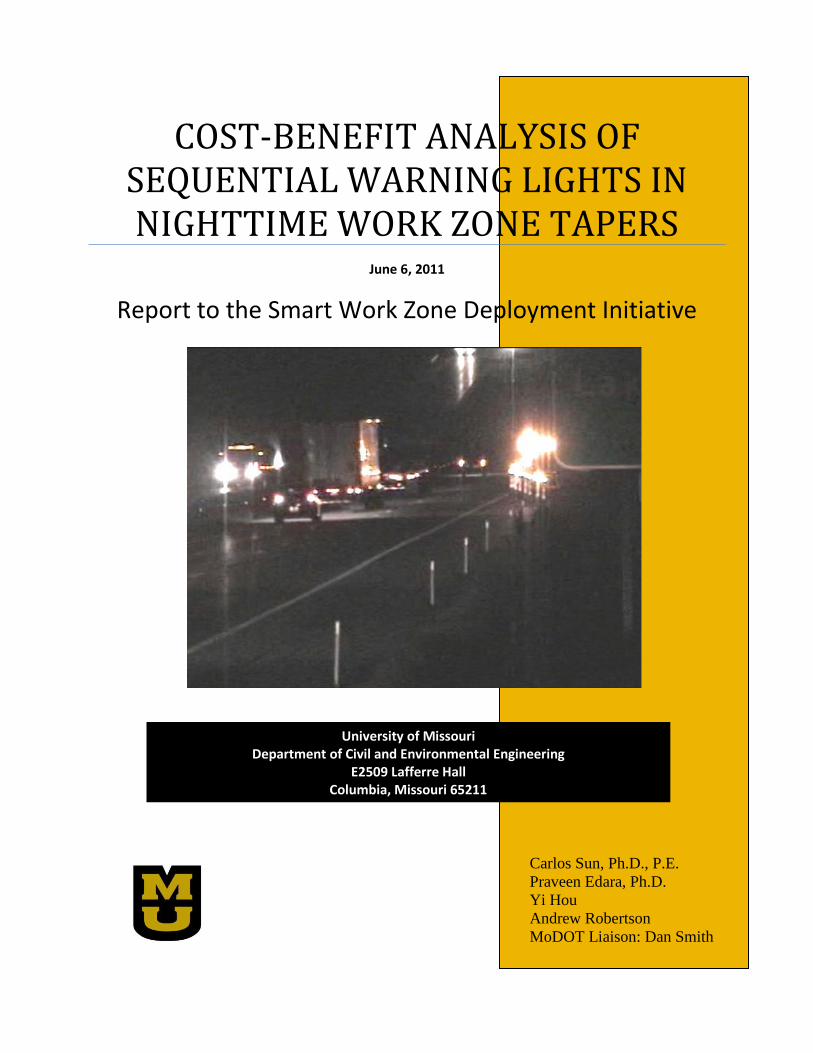
COST-BENEFIT ANALYSIS OF SEQUENTIAL WARNING LIGHTS IN NIGHTTIME WORK ZONE TAPERS
June 6, 2011
Report to the Smart Work Zone Deployment Initiative
Carlos Sun, Ph.D., P.E.
Praveen Edara, Ph.D.
Yi Hou
Andrew Robertson
MoDOT Liaison: Dan Smith
University of Missouri Department of Civil and Environmental Engineering
E2509 Lafferre Hall Columbia, Missouri 65211
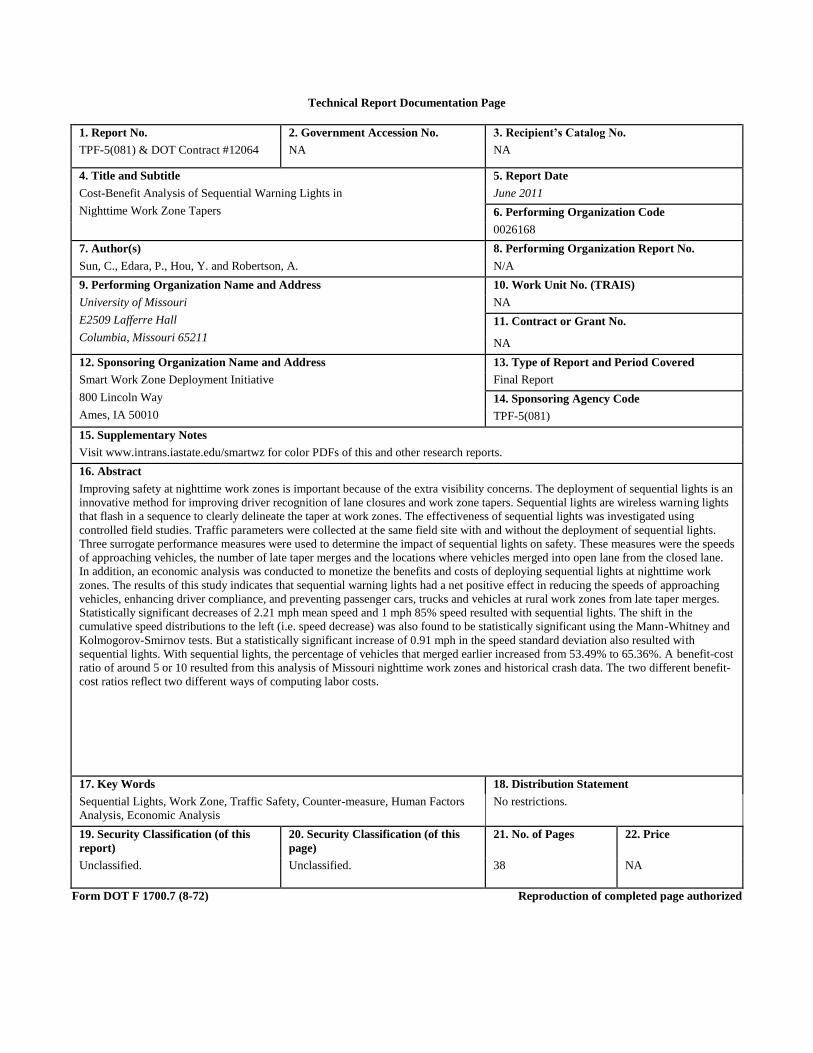
Technical Report Documentation Page
1. Report No. 2. Government Accession No. 3. Recipient’s Catalog No.
TPF-5(081) & DOT Contract #12064 NA NA
4. Title and Subtitle 5. Report Date
Cost-Benefit Analysis of Sequential Warning Lights in
Nighttime Work Zone Tapers
June 2011
6. Performing Organization Code
0026168
7. Author(s) 8. Performing Organization Report No.
Sun, C., Edara, P., Hou, Y. and Robertson, A. N/A
9. Performing Organization Name and Address 10. Work Unit No. (TRAIS)
University of Missouri
E2509 Lafferre Hall
Columbia, Missouri 65211
NA
11. Contract or Grant No.
NA
12. Sponsoring Organization Name and Address 13. Type of Report and Period Covered
Smart Work Zone Deployment Initiative
800 Lincoln Way
Ames, IA 50010
Final Report
14. Sponsoring Agency Code
TPF-5(081)
15. Supplementary Notes
Visit www.intrans.iastate.edu/smartwz for color PDFs of this and other research reports.
16. Abstract
Improving safety at nighttime work zones is important because of the extra visibility concerns. The deployment of sequential lights is an
innovative method for improving driver recognition of lane closures and work zone tapers. Sequential lights are wireless warning lights
that flash in a sequence to clearly delineate the taper at work zones. The effectiveness of sequential lights was investigated using
controlled field studies. Traffic parameters were collected at the same field site with and without the deployment of sequential lights.
Three surrogate performance measures were used to determine the impact of sequential lights on safety. These measures were the speeds
of approaching vehicles, the number of late taper merges and the locations where vehicles merged into open lane from the closed lane.
In addition, an economic analysis was conducted to monetize the benefits and costs of deploying sequential lights at nighttime work
zones. The results of this study indicates that sequential warning lights had a net positive effect in reducing the speeds of approaching
vehicles, enhancing driver compliance, and preventing passenger cars, trucks and vehicles at rural work zones from late taper merges.
Statistically significant decreases of 2.21 mph mean speed and 1 mph 85% speed resulted with sequential lights. The shift in the
cumulative speed distributions to the left (i.e. speed decrease) was also found to be statistically significant using the Mann-Whitney and
Kolmogorov-Smirnov tests. But a statistically significant increase of 0.91 mph in the speed standard deviation also resulted with
sequential lights. With sequential lights, the percentage of vehicles that merged earlier increased from 53.49% to 65.36%. A benefit-cost
ratio of around 5 or 10 resulted from this analysis of Missouri nighttime work zones and historical crash data. The two different benefit-
cost ratios reflect two different ways of computing labor costs.
17. Key Words 18. Distribution Statement
Sequential Lights, Work Zone, Traffic Safety, Counter-measure, Human Factors
Analysis, Economic Analysis
No restrictions.
19. Security Classification (of this
report)
20. Security Classification (of this
page)
21. No. of Pages 22. Price
Unclassified. Unclassified. 38 NA
Form DOT F 1700.7 (8-72) Reproduction of completed page authorized
Cost-Benefit Analysis of Sequential Warning
Lights in Nighttime Work Zone Tapers
Final Report
June 2011
Principal Investigator
Carlos Sun
Associate Professor
University of Missouri
Co-Principal Investigator
Praveen Edara
Assistant Professor
University of Missouri
Research Assistant
Yi Hou and Andrew Robertson
Authors
Carlos Sun, Praveen Edara, Yi Hou and Andrew Robertson
Sponsored by
the Smart Work Zone Deployment Initiative
FHWA Pooled Fund Study TPF-5(081)
A report from
University of Missouri
Department of Civil and Environmental Engineering
University of Missouri-Columbia
E2509 Lafferre Hall
Columbia, MO 65211
Phone: 573-884-330
www.missouri.edu

ii
Blank Page
iv
EXECUTIVE SUMMARY
Sequential warning lights were evaluated using three measures of safety performance derived from three
different video fields-of-view. The radar view yielded individual vehicle speeds and speeds of vehicles
not following in platoons. The near taper view produced transverse vehicle position at the taper. The far
taper view produced closed lane occupancy at different zones approaching the taper. The video footages
were collected from three different nighttime work zones located on I-70 in Missouri in both urban and
rural areas. Data was collected between 9:30 pm and 1:10 am at each site. The data collected
encompassed both passenger cars and trucks. The speed limit for all three sites was 60 mph.
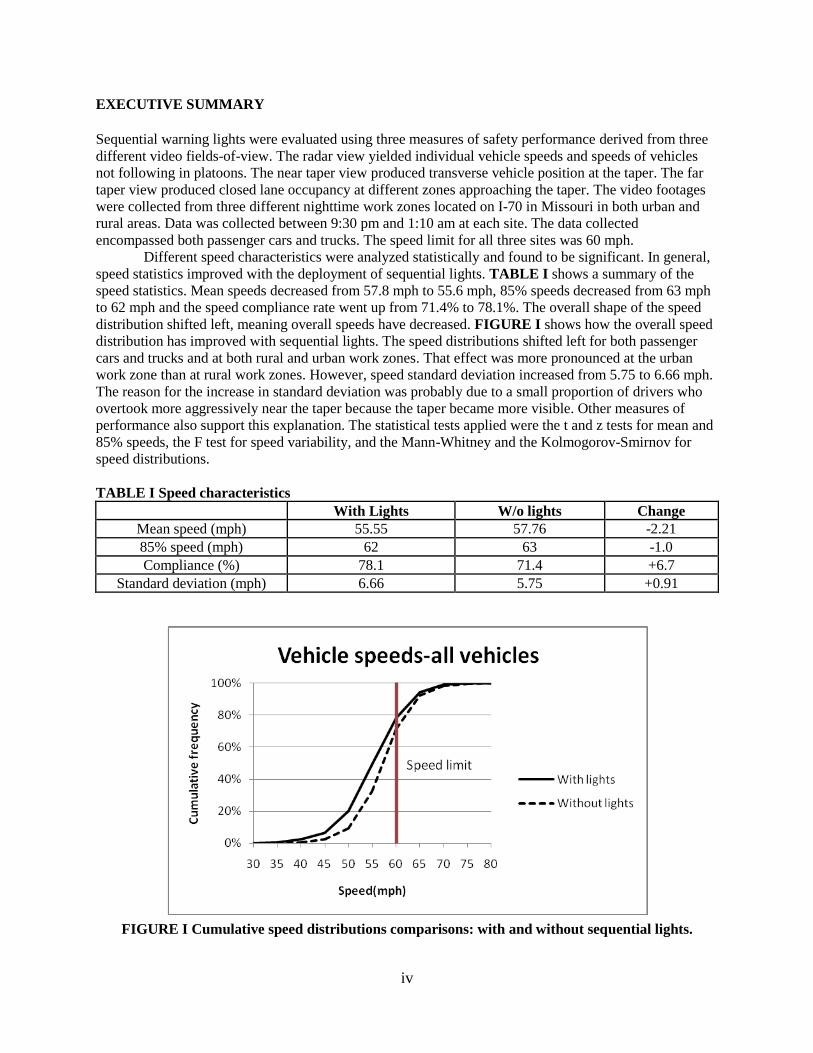
Different speed characteristics were analyzed statistically and found to be significant. In general,
speed statistics improved with the deployment of sequential lights. TABLE I shows a summary of the
speed statistics. Mean speeds decreased from 57.8 mph to 55.6 mph, 85% speeds decreased from 63 mph
to 62 mph and the speed compliance rate went up from 71.4% to 78.1%. The overall shape of the speed
distribution shifted left, meaning overall speeds have decreased. FIGURE I shows how the overall speed
distribution has improved with sequential lights. The speed distributions shifted left for both passenger
cars and trucks and at both rural and urban work zones. That effect was more pronounced at the urban
work zone than at rural work zones. However, speed standard deviation increased from 5.75 to 6.66 mph.
The reason for the increase in standard deviation was probably due to a small proportion of drivers who
overtook more aggressively near the taper because the taper became more visible. Other measures of
performance also support this explanation. The statistical tests applied were the t and z tests for mean and
85% speeds, the F test for speed variability, and the Mann-Whitney and the Kolmogorov-Smirnov for
speed distributions.
TABLE I Speed characteristics
With Lights W/o lights Change
Mean speed (mph) 55.55 57.76 -2.21
85% speed (mph) 62 63 -1.0
Compliance (%) 78.1 71.4 +6.7
Standard deviation (mph) 6.66 5.75 +0.91
FIGURE I Cumulative speed distributions comparisons: with and without sequential lights.
v
The near taper view was used to analyze potential conflicts that could result from last minute
merges at the taper. The transverse position of each vehicle was classified as open lane, middle (i.e.
between lanes) or closed lane. The rural and urban produced opposite results. In rural work zones, the
percentage of vehicles in middle and close positions decreased from 10.7% to 4.9% with sequential lights.
But in the urban work zone, the percentage of vehicles in middle and close positions increased from
15.2% to 27.9% with sequential lights. This again supports the explanation that a subset of more
aggressive drivers merged near the taper because the taper became more identifiable with sequential lights.
This late merging and last minute over-taking behavior was more common in the urban environment
because of the higher amount of traffic.
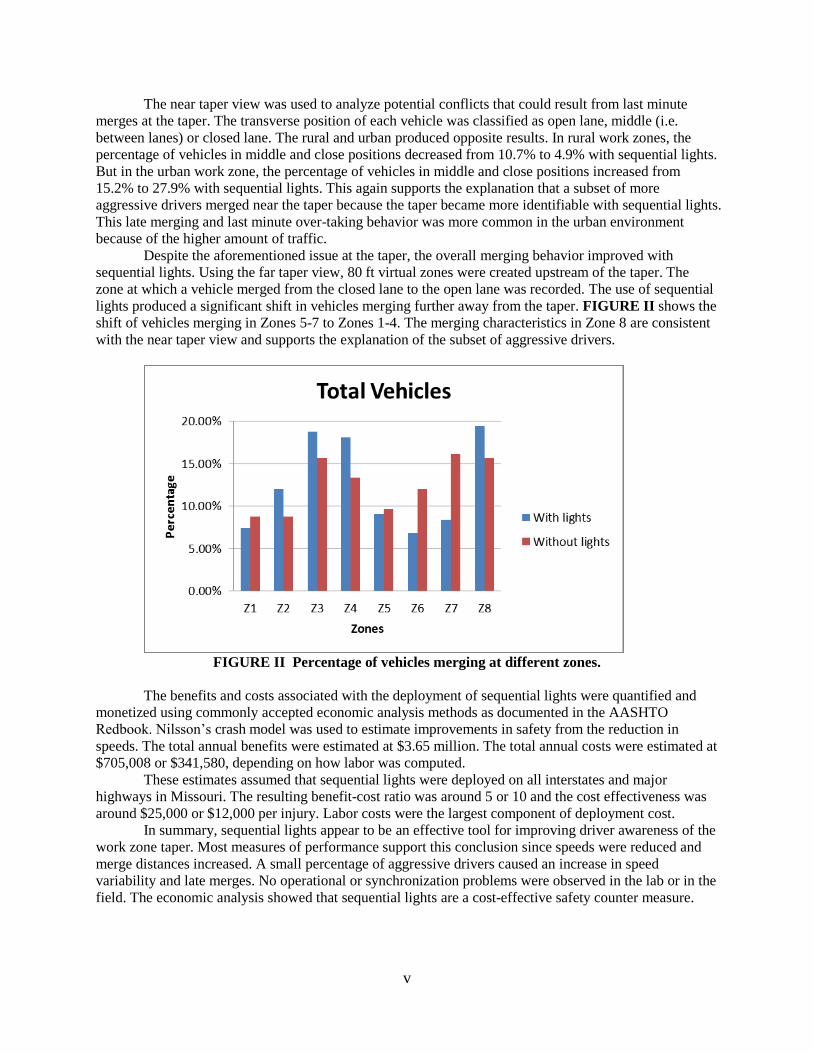
Despite the aforementioned issue at the taper, the overall merging behavior improved with
sequential lights. Using the far taper view, 80 ft virtual zones were created upstream of the taper. The
zone at which a vehicle merged from the closed lane to the open lane was recorded. The use of sequential
lights produced a significant shift in vehicles merging further away from the taper. FIGURE II shows the
shift of vehicles merging in Zones 5-7 to Zones 1-4. The merging characteristics in Zone 8 are consistent
with the near taper view and supports the explanation of the subset of aggressive drivers.
FIGURE II Percentage of vehicles merging at different zones.
The benefits and costs associated with the deployment of sequential lights were quantified and
monetized using commonly accepted economic analysis methods as documented in the AASHTO
Redbook. Nilsson’s crash model was used to estimate improvements in safety from the reduction in
speeds. The total annual benefits were estimated at $3.65 million. The total annual costs were estimated at
$705,008 or $341,580, depending on how labor was computed.
These estimates assumed that sequential lights were deployed on all interstates and major
highways in Missouri. The resulting benefit-cost ratio was around 5 or 10 and the cost effectiveness was
around $25,000 or $12,000 per injury. Labor costs were the largest component of deployment cost.
In summary, sequential lights appear to be an effective tool for improving driver awareness of the
work zone taper. Most measures of performance support this conclusion since speeds were reduced and
merge distances increased. A small percentage of aggressive drivers caused an increase in speed
variability and late merges. No operational or synchronization problems were observed in the lab or in the
field. The economic analysis showed that sequential lights are a cost-effective safety counter measure.
1
TABLE OF CONTENTS
EXECUTIVE SUMMARY ................................................................................................................................. iv
TABLE OF CONTENTS ..................................................................................................................................... 1
TABLE OF FIGURES ........................................................................................................................................ 2
TABLE OF TABLES .......................................................................................................................................... 2
INTRODUCTION ............................................................................................................................................. 3
What Are Sequential Warning Lights? ...................................................................................................... 3
The Purpose of Sequential Warning Lights ............................................................................................... 3
Technical Background ............................................................................................................................... 3
Existing Literature and Differences from Previous Studies ...................................................................... 5
DATA COLLECTION ........................................................................................................................................ 6
DATA ANALYSIS ........................................................................................................................................... 10
Radar View .............................................................................................................................................. 10
Near Taper Conflict View ........................................................................................................................ 20
Far Taper View ........................................................................................................................................ 22
ECONOMIC ANALYSIS .................................................................................................................................. 28
Total Benefits .......................................................................................................................................... 28
Total Costs ............................................................................................................................................... 31
CONCLUSION ............................................................................................................................................... 32
AKNOWLEDGEMENTS ................................................................................................................................. 34
REFERENCES ................................................................................................................................................ 34
2
TABLE OF FIGURES
FIGURE 1 Lane closure with temporary traffic barrier (TA-34) (MUTCD, 2003). .......................................... 4
FIGURE 2 Sequential warning light (HA, 2005b). .......................................................................................... 5
FIGURE 3 Snapshots from video data collection. .......................................................................................... 9
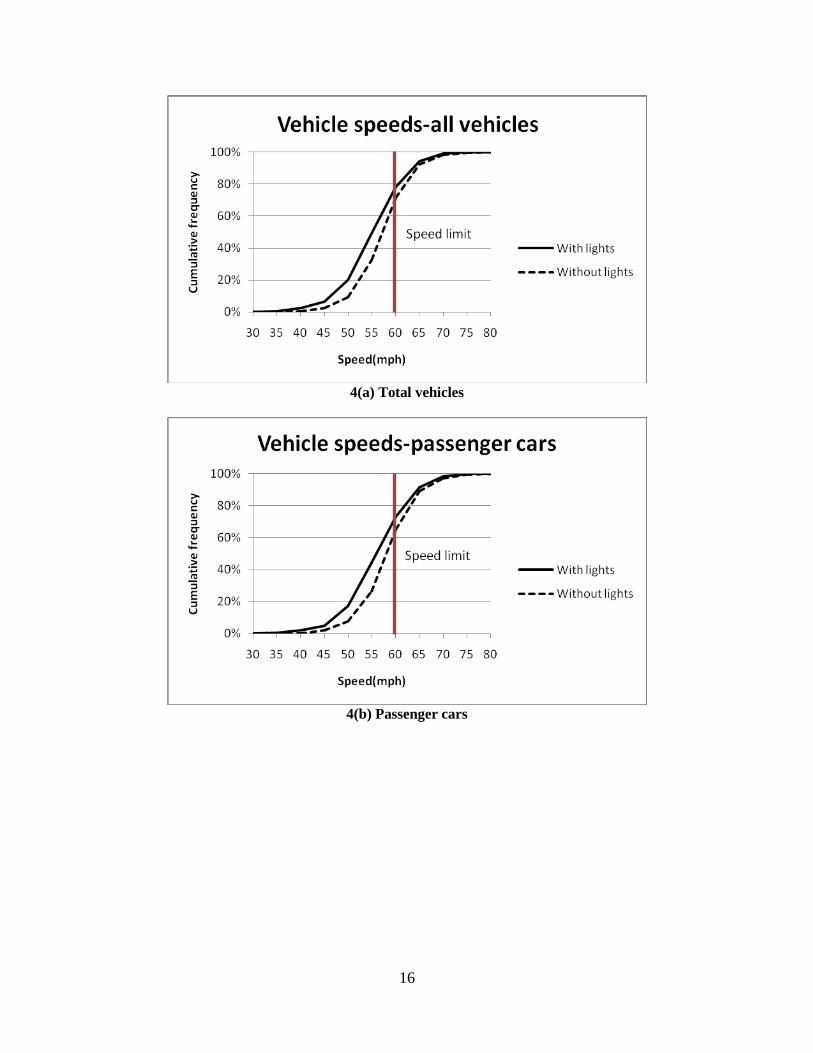
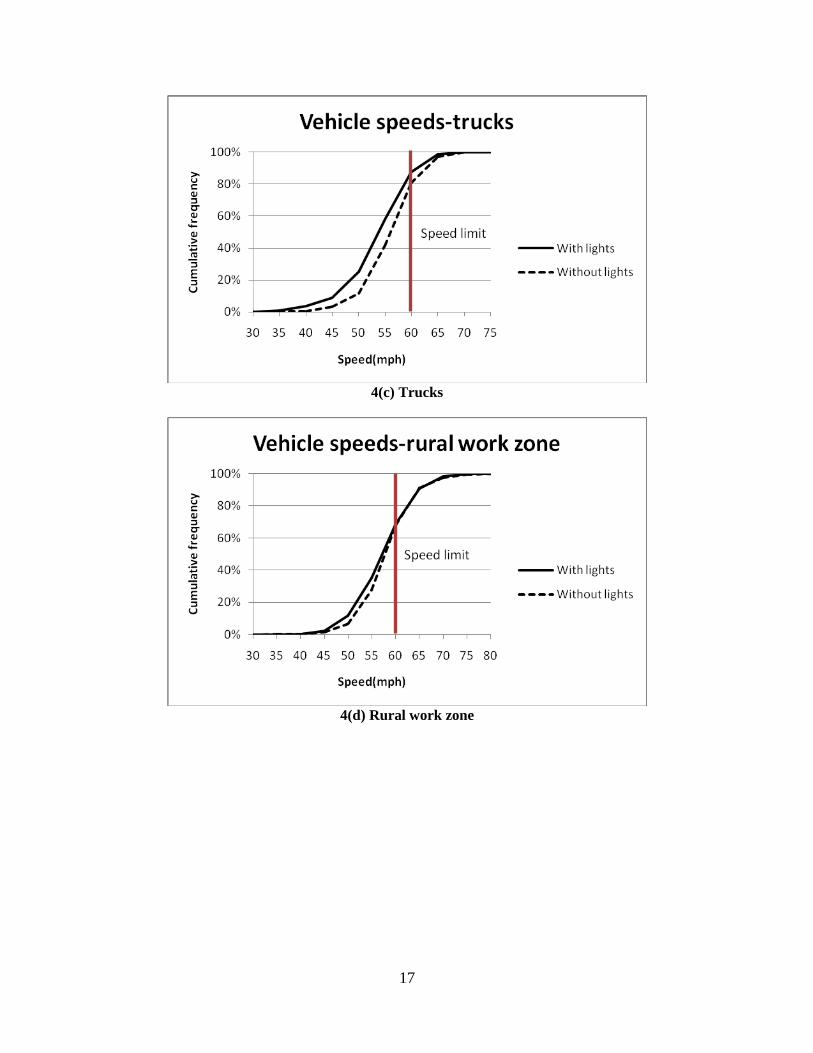
FIGURE 4 Cumulative speed distributions comparisons: with and without sequential lights. ................... 18
FIGURE 5 Frequency of vehicles in the open lane, middle, and closed lane near the taper. ..................... 22
FIGURE 6 Layout of delineator setting in the field. ..................................................................................... 23
FIGURE 7 Percentage of vehicles merging at different zones. ................................................................... 27
TABLE OF TABLES
TABLE 1 Data Collection Schedule ................................................................................................................ 7
TABLE 2 Example of Radar Data from May 17, 2010 .................................................................................. 11
TABLE 3 Speeds Statistics ............................................................................................................................ 12
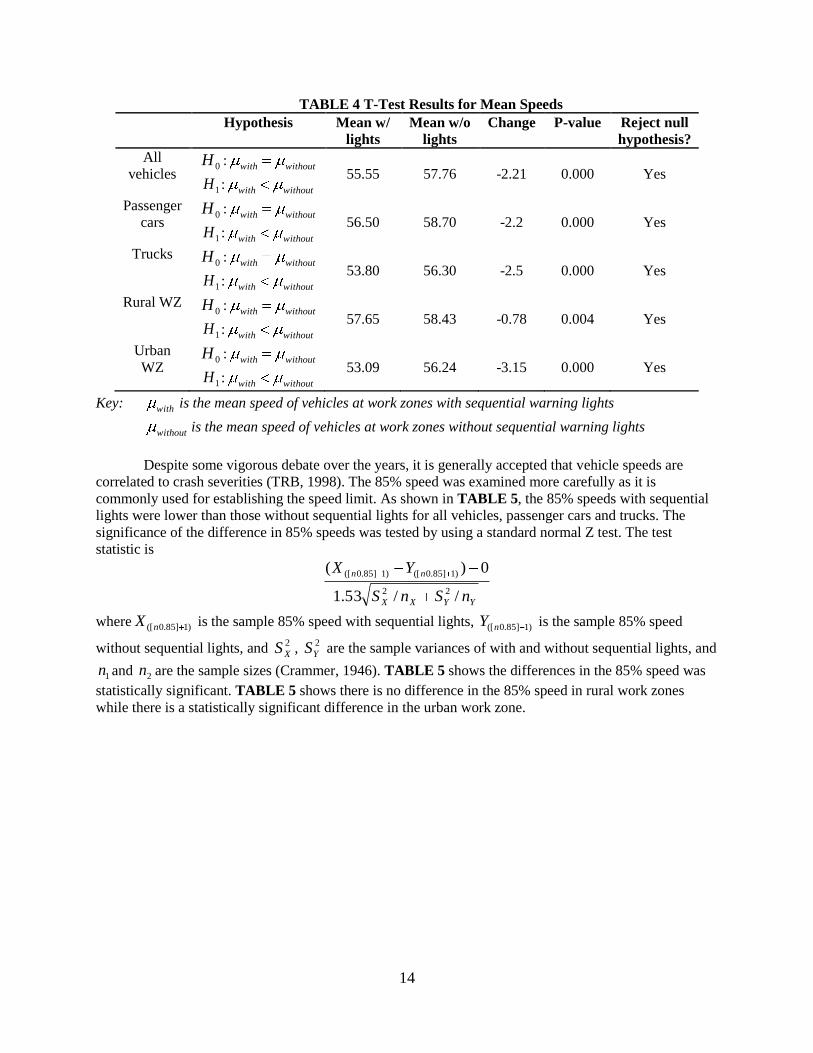
TABLE 4 T-Test Results for Mean Speeds .................................................................................................... 14
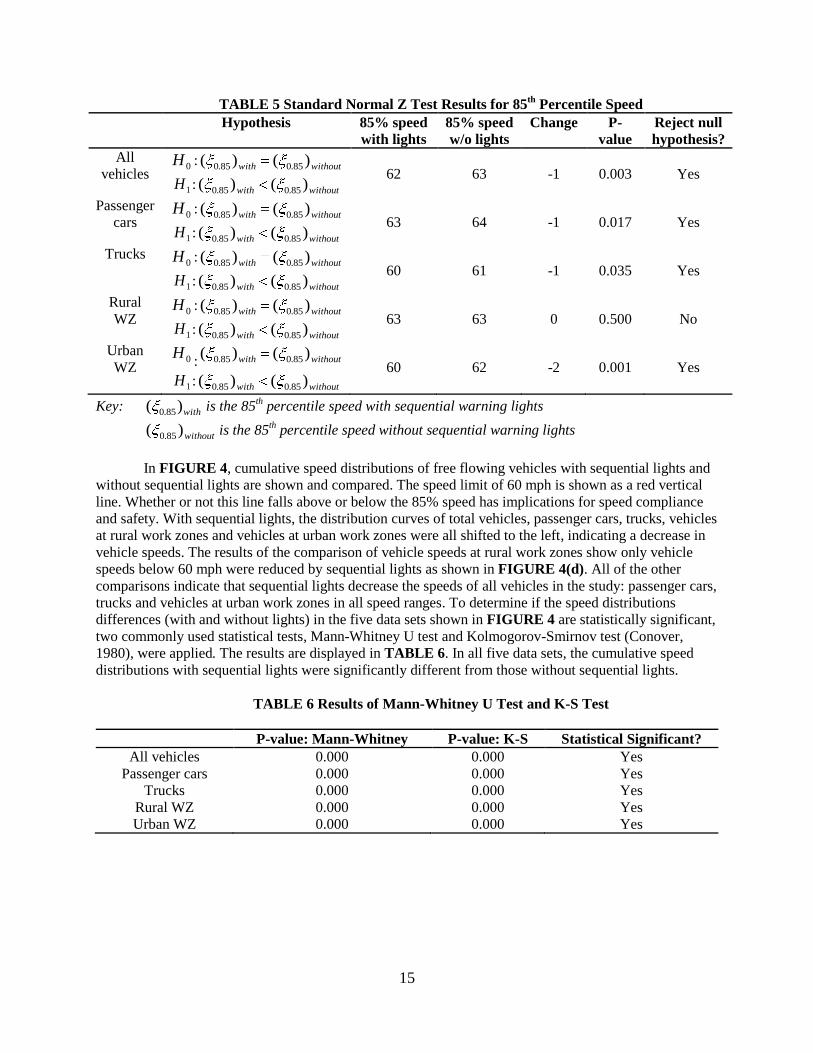
TABLE 5 Standard Normal Z Test Results for 85th Percentile Speed ........................................................... 15
TABLE 6 Results of Mann-Whitney U Test and K-S Test ............................................................................. 15
TABLE 7 F-Test Results for Speed Variances ............................................................................................... 19
TABLE 8 Standard Normal Z Test Results for Compliance Rate .................................................................. 20
TABLE 9 Example of Near Taper Data from May 17, 2010 ......................................................................... 21
TABLE 10 Vehicle Counts in Near Taper Test .............................................................................................. 21
TABLE 11 Example of Far Taper Test Data from May 17, 2010 .................................................................. 24
TABLE 12 Vehicle Counts of Far Taper Test ................................................................................................ 24
TABLE 13 The Average Merge Distances From Taper ................................................................................. 28
TABLE 14 The Result of Parameters ............................................................................................................ 30
TABLE 15 Freeway and Major Highway Nighttime Work Zone Crashes in Missouri .................................. 30
TABLE 16 User Costs of Crashes (year 2000 dollars) ................................................................................... 30
3
INTRODUCTION
What Are Sequential Warning Lights?
Sequential warning lights are lights designed to dynamically enhance the visibility of the work zone
entrance and to improve driver lane discipline by providing a directional guide. Sequential warning lights
use LED lamp and lens technology and wireless communications technology. Dorman-Dicke Safety
Products SynchroGUIDE and Empco-Lite LWCSD are examples of such lights. Only the SynchroGUIDE
was tested in this study. The flash rate of the lights is 60 flashes per minute. Each lamp uses two 6V
batteries. When the lamps are placed in line, they give the impression of a single light source traveling
along the lamps from front to back. The flash or increase in light intensity of each light is synchronized by
sensing the location of each light with respect to the other lights. Each lamp has a low output steady light
to aid direction indication.
The Purpose of Sequential Warning Lights
In order to minimize traffic impacts due to work zones, departments of transportation (DOTs) have
increased off-peak and nighttime work. For example, the Missouri Department of Transportation has a
recommendation for off-peak and/or nighttime work when the traffic volumes exceed 75 to 80 percent of
the open-lane capacity (MoDOT, 2004).
The increase in nighttime work leads to some potential safety concerns. There is some evidence
that nighttime crash characteristics differs from daytime. According to a comprehensive Canadian work
zone study (Bushman et al., 2005), crashes under dark conditions have a fatality rate of 2.6 fatalities per
100 crashes while crashes during the day have a rate of 1.8 fatalities per 100 crashes. A U.S. study found
that there were more fixed-object crashes and fewer angle and rear-end crashes during the nighttime but
no difference in severity (Garber and Zhao, 2002). In discussing the nighttime fixed-object crashes,
Garber and Zhao explained that “problems may exist in the lighting conditions at work zones or in the
illumination conditions of channelizing devices during nighttime.”
The primary motivation for using sequential warning lights is to improve safety in the work zone
by alerting drivers of the upcoming taper and work zone. The British Highway Agency (HA) mentioned
that the large number of cone strikes could be due to a driver’s failure to see the taper or to exit the closed
lane in sufficient time (HA, 2004).
There are some potential drawbacks to using sequential lights. One is the possibility of photo-
sensitive seizure with a wrong flashing rate. Another is the synchronization of driving speeds to
sequential warning lights in the tangent section. This might not be a concern for deployments in the short
taper area.
The costs associated with deploying sequential warning lights include labor in deploying the
lights, capital cost, and battery replacement cost. Even with the possible drawbacks and costs, sequential
barricade lamps were included as option in the latest MUTCD.
Technical Background
Section 6F.59 of the 2003 Manual on Uniform Traffic Control Devices (MUTCD, 2003) specifies that
cones equipped with lighting devices can be used for maximizing visibility during nighttime. In Section
6F.78, warning lights are described as portable, powered, yellow, lens-directed and enclosed, and such
lights should comply with the ITE Purchase Specifications for Flashing and Steady-Burn Warning Lights
(ITE, 2001). The Type C Steady-Burn warning lights may be used during nighttime hours to delineate the
edge of the traveled way, and the maximum spacing should be identical to the channelizing device
spacing requirements. In Section 6H, several applications are described using the optional warning lights.
For example, TA-34 (Lane Closure with Temporary Traffic Barrier) and TA-36 (Lane Shift on Freeway)
contain the option for placing Type C Steady-Burn warning lights on channelizing devices for nighttime
4
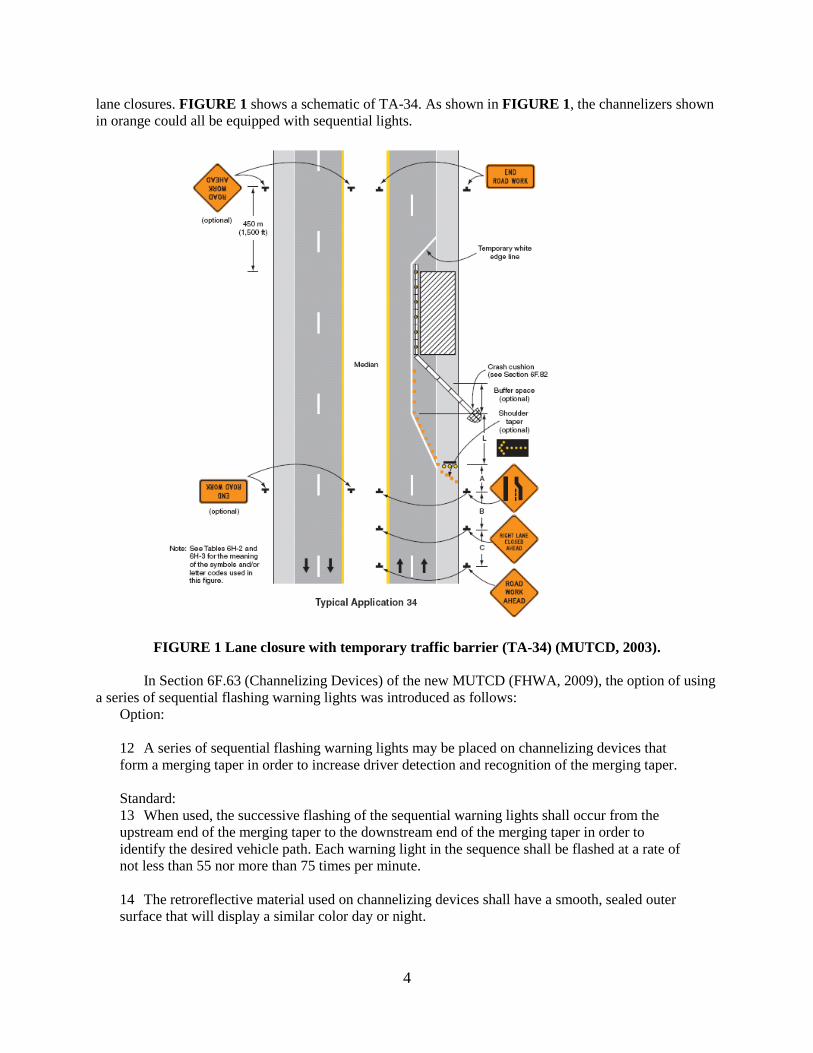
lane closures. FIGURE 1 shows a schematic of TA-34. As shown in FIGURE 1, the channelizers shown
in orange could all be equipped with sequential lights.
FIGURE 1 Lane closure with temporary traffic barrier (TA-34) (MUTCD, 2003).
In Section 6F.63 (Channelizing Devices) of the new MUTCD (FHWA, 2009), the option of using
a series of sequential flashing warning lights was introduced as follows:
Option:
12 A series of sequential flashing warning lights may be placed on channelizing devices that
form a merging taper in order to increase driver detection and recognition of the merging taper.
Standard:
13 When used, the successive flashing of the sequential warning lights shall occur from the
upstream end of the merging taper to the downstream end of the merging taper in order to
identify the desired vehicle path. Each warning light in the sequence shall be flashed at a rate of
not less than 55 nor more than 75 times per minute.
14 The retroreflective material used on channelizing devices shall have a smooth, sealed outer
surface that will display a similar color day or night.
5
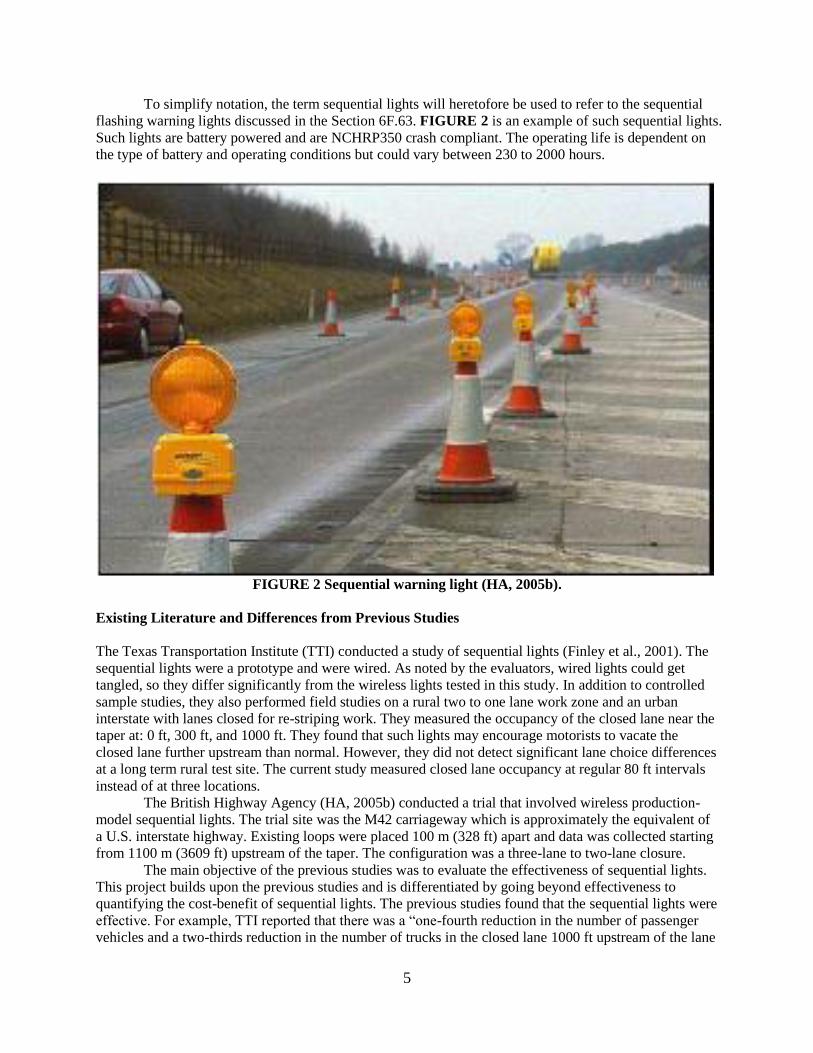
To simplify notation, the term sequential lights will heretofore be used to refer to the sequential
flashing warning lights discussed in the Section 6F.63. FIGURE 2 is an example of such sequential lights.
Such lights are battery powered and are NCHRP350 crash compliant. The operating life is dependent on
the type of battery and operating conditions but could vary between 230 to 2000 hours.
FIGURE 2 Sequential warning light (HA, 2005b).
Existing Literature and Differences from Previous Studies
The Texas Transportation Institute (TTI) conducted a study of sequential lights (Finley et al., 2001). The
sequential lights were a prototype and were wired. As noted by the evaluators, wired lights could get
tangled, so they differ significantly from the wireless lights tested in this study. In addition to controlled
sample studies, they also performed field studies on a rural two to one lane work zone and an urban
interstate with lanes closed for re-striping work. They measured the occupancy of the closed lane near the
taper at: 0 ft, 300 ft, and 1000 ft. They found that such lights may encourage motorists to vacate the
closed lane further upstream than normal. However, they did not detect significant lane choice differences
at a long term rural test site. The current study measured closed lane occupancy at regular 80 ft intervals
instead of at three locations.
The British Highway Agency (HA, 2005b) conducted a trial that involved wireless production-
model sequential lights. The trial site was the M42 carriageway which is approximately the equivalent of
a U.S. interstate highway. Existing loops were placed 100 m (328 ft) apart and data was collected starting
from 1100 m (3609 ft) upstream of the taper. The configuration was a three-lane to two-lane closure.
The main objective of the previous studies was to evaluate the effectiveness of sequential lights.
This project builds upon the previous studies and is differentiated by going beyond effectiveness to
quantifying the cost-benefit of sequential lights. The previous studies found that the sequential lights were
effective. For example, TTI reported that there was a “one-fourth reduction in the number of passenger
vehicles and a two-thirds reduction in the number of trucks in the closed lane 1000 ft upstream of the lane
6
closure.” They also reported that “flashing warning light systems used in the work zone lane closure is
perceived positively and is not confusing to the motoring public.” HA reported that the “effect of
sequential lamps is seen consistently from a point 500m before the taper, but also has an effect at a point
600m before the taper in half the cases” (HA, 2005a). Since sequential lights are optional and
supplementary, agencies need to decide when it is beneficial to deploy them. This project translated
measures of effectiveness into quantifiable benefits so that agencies can make decisions concerning the
value of deployment.
The wireless production model used for this study differed from the prototype studied in 2001.
The sequential lights used by TTI had the limitation of a wired setup and consequently a 900 ft cable
length limitation. The evaluators expressed, “the set-up of the system was found to be cumbersome and
time-consuming to implement because of the large number of components involved (particularly the use
of cables and external junction boxes to interconnect the lights)” (Finely, 2001). To follow up on the
previous study, this study included the assessment of the ease of wireless setup by quantifying the
required labor effort.
The previous wired setup also caused operational problems. The evaluators mentioned that the
system was unable to work properly because “the connections between the junction boxes and the cables
tended to lose contact, interrupting the communication signal between lights.” Another objective of this
study was to investigate wireless operational issues. Even though wireless operation appeared to be
superior, could certain drawbacks exist such as a communications failure between lights?
Another difference from previous studies was the observation of potentially dangerous maneuvers
near the beginning of the taper. Such maneuvers include braking near the taper or a sudden merge. This
study was also differentiated from the U.K. study, since the U.K. study compared static versus sequential
lights. This study involved a comparison of sequential lights on cones with cones with no static lights.
DATA COLLECTION
The field evaluation of sequential lights was performed on three short-term maintenance work
zones on Interstate 70, Missouri. The site geometrics for all the sites were similar involving a right lane
closure with the passing lane open (2 to 1 work zone). Field data was collected on two rural work zones
on May 17th and 18
th , 2010, and one urban work zone on May 23
rd. The speed limit on the rural work
zone was decreased from 70 mph to 60 mph, while the speed limit on the urban work zone was kept at the
normal 60 mph. Thus all three work zones had a speed limit of 60 mph. The details of data collection
periods are shown in the TABLE 1. TABLE 1 shows the time periods where data was collected with and
without the sequential lights. Road sections in the study sites had minimal horizontal and vertical curves
in order to control for geometric factors and to achieve an optimal field-of-view for the data collection
equipment. Video data was collected at three different locations near the work zone, and traffic
parameters were derived from the video. The locations were at the taper (Near View), just upstream from
the taper at the speed radar (Radar View) and approximately 700 feet upstream from the taper (Far View).
The video data allowed some automated post-processing of the video and preserved a visual record in
case there were anomalies with the data. In addition, the video footage was useful for presenting the
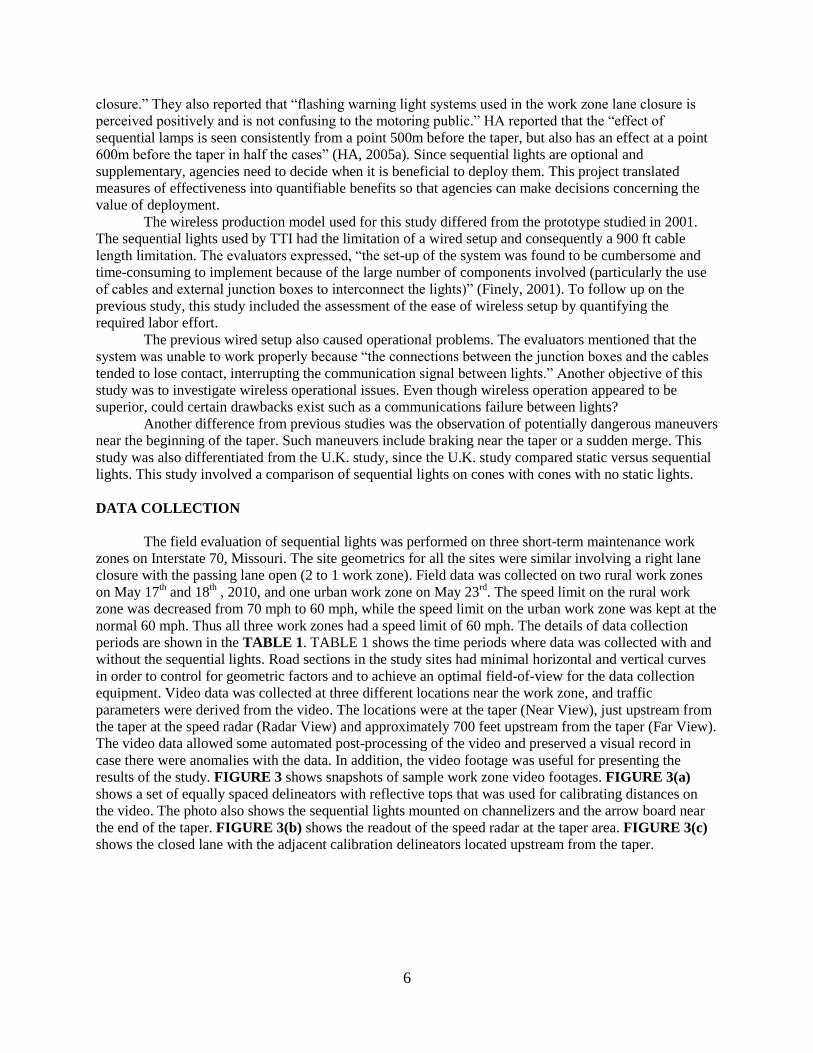
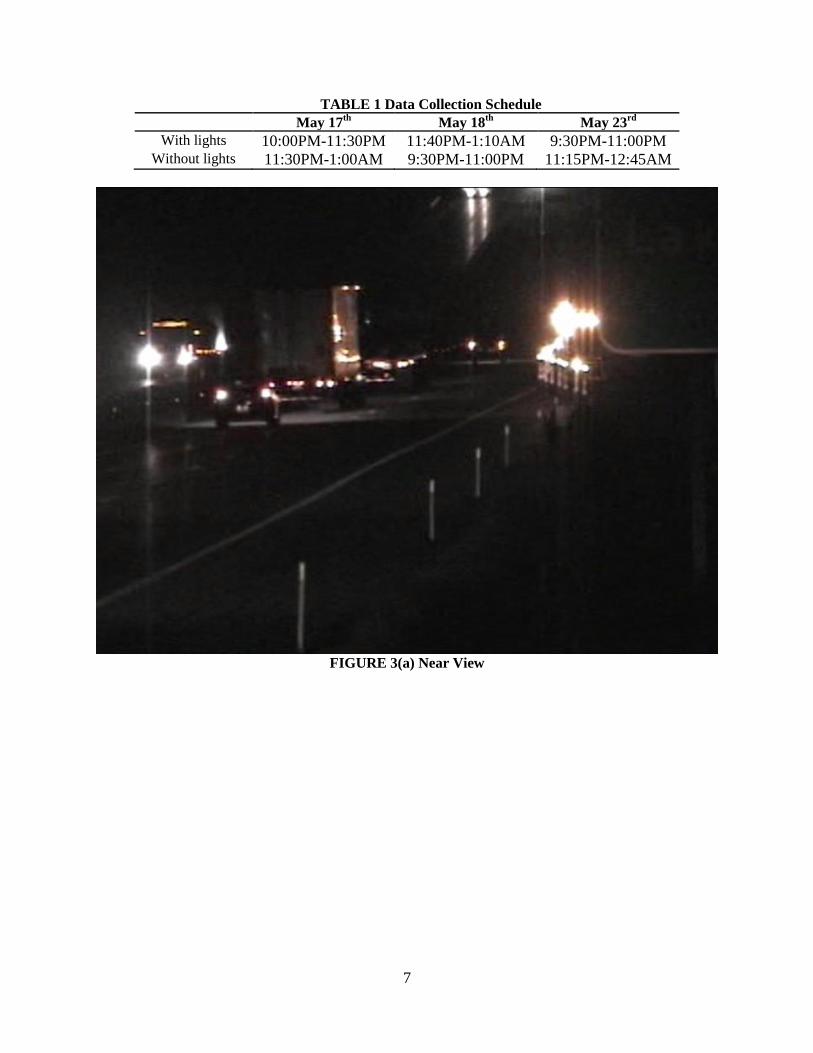
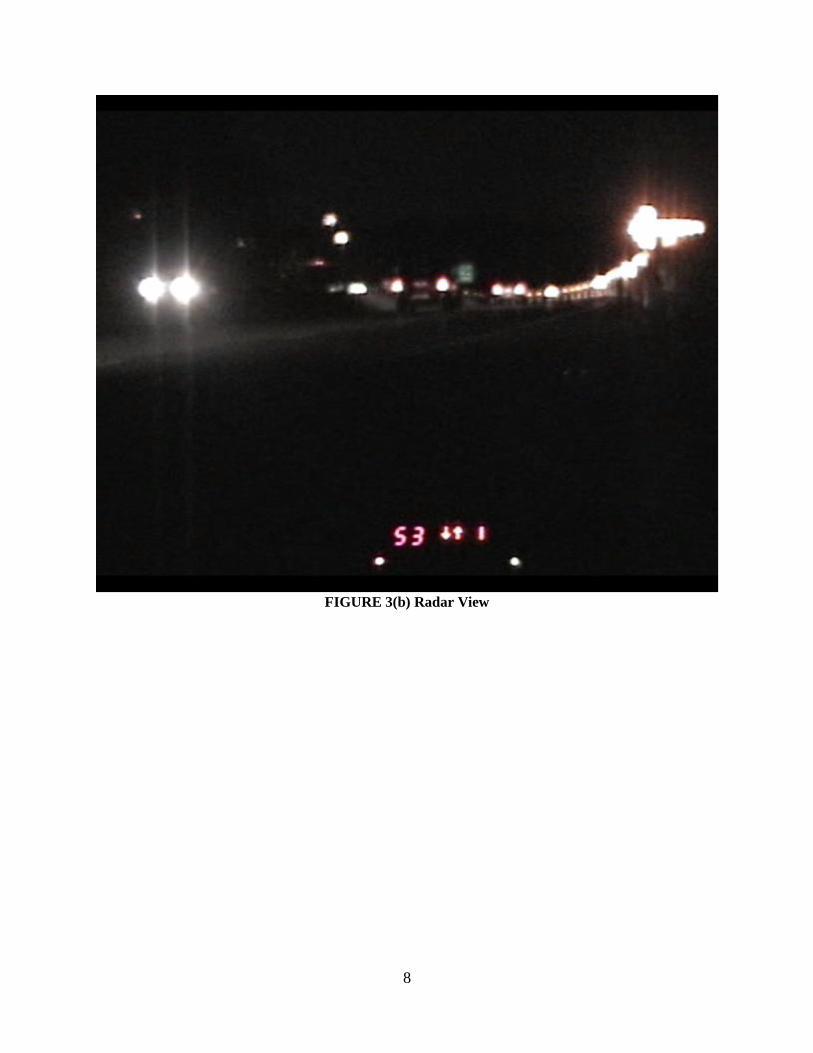
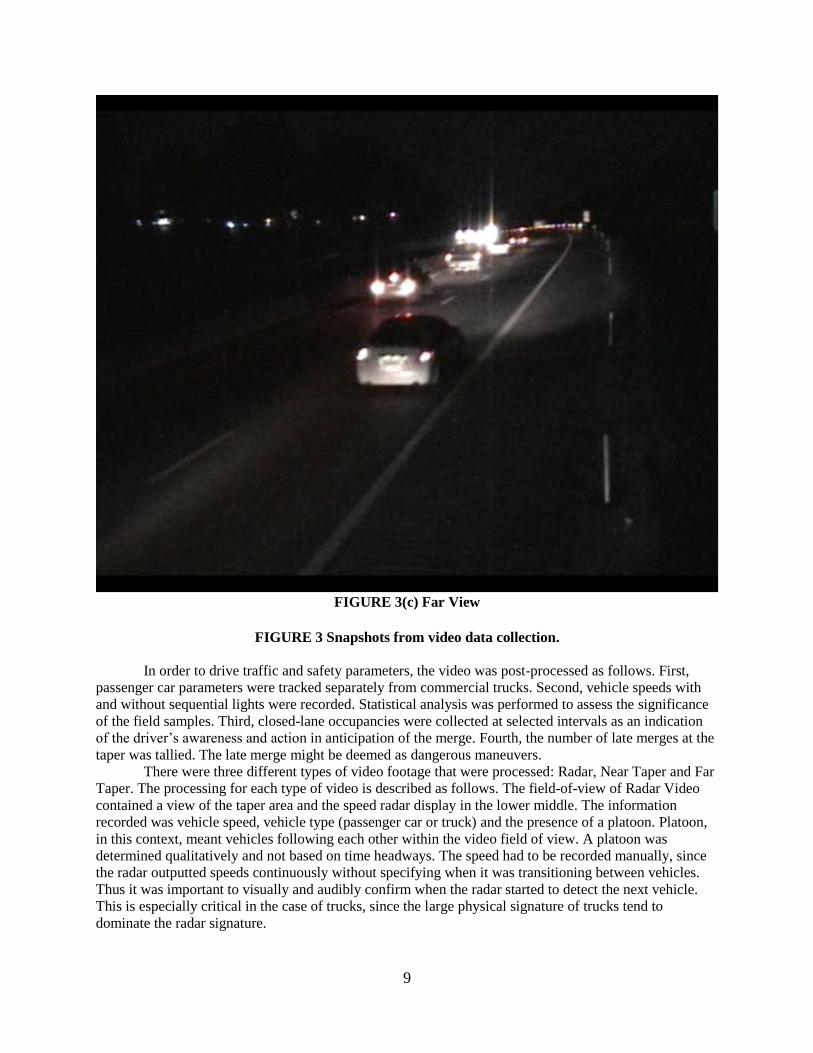
results of the study. FIGURE 3 shows snapshots of sample work zone video footages. FIGURE 3(a)
shows a set of equally spaced delineators with reflective tops that was used for calibrating distances on
the video. The photo also shows the sequential lights mounted on channelizers and the arrow board near
the end of the taper. FIGURE 3(b) shows the readout of the speed radar at the taper area. FIGURE 3(c)
shows the closed lane with the adjacent calibration delineators located upstream from the taper.
7
TABLE 1 Data Collection Schedule
May 17th
May 18th
May 23rd
With lights 10:00PM-11:30PM 11:40PM-1:10AM 9:30PM-11:00PM
Without lights 11:30PM-1:00AM 9:30PM-11:00PM 11:15PM-12:45AM
FIGURE 3(a) Near View
8
FIGURE 3(b) Radar View
9
FIGURE 3(c) Far View
FIGURE 3 Snapshots from video data collection.
In order to drive traffic and safety parameters, the video was post-processed as follows. First,
passenger car parameters were tracked separately from commercial trucks. Second, vehicle speeds with
and without sequential lights were recorded. Statistical analysis was performed to assess the significance
of the field samples. Third, closed-lane occupancies were collected at selected intervals as an indication
of the driver’s awareness and action in anticipation of the merge. Fourth, the number of late merges at the
taper was tallied. The late merge might be deemed as dangerous maneuvers.
There were three different types of video footage that were processed: Radar, Near Taper and Far
Taper. The processing for each type of video is described as follows. The field-of-view of Radar Video
contained a view of the taper area and the speed radar display in the lower middle. The information
recorded was vehicle speed, vehicle type (passenger car or truck) and the presence of a platoon. Platoon,
in this context, meant vehicles following each other within the video field of view. A platoon was
determined qualitatively and not based on time headways. The speed had to be recorded manually, since
the radar outputted speeds continuously without specifying when it was transitioning between vehicles.
Thus it was important to visually and audibly confirm when the radar started to detect the next vehicle.
This is especially critical in the case of trucks, since the large physical signature of trucks tend to
dominate the radar signature.
10
The Near Taper Video was processed for conflicts at the taper area. The location of each vehicle
was categorized into three categories with respect to the vehicle’s transverse location. The three
categories were open lane, closed lane and middle. The middle category designates a vehicle over the
center line. The number queuing and merging conflicts were noted. A queuing conflict was identified by
brake lights from the following vehicle. A merging conflict occurred when a vehicle cut in front of
another vehicle.
The Far Taper Video showed the occupancy of the closed lane. The video field-of-view was
divided into 80 ft sections that were identified as Zones 1 through 8. The zone where a vehicle moved
from the closed to the open lane was noted. The zones were identified using delineators placed upstream
from the taper. This calibration of distances in the field was important because delineators appeared to be
closer together the further they were located from the camera.
DATA ANALYSIS
Radar View
For the radar view, speed data was analyzed for three field sites. There were two different time periods of
data that were collected for each day. These periods were both approximately 90 minutes long and taken
consecutively for a combined three-hour time span. As shown in TABLE 1, these three-hour time periods
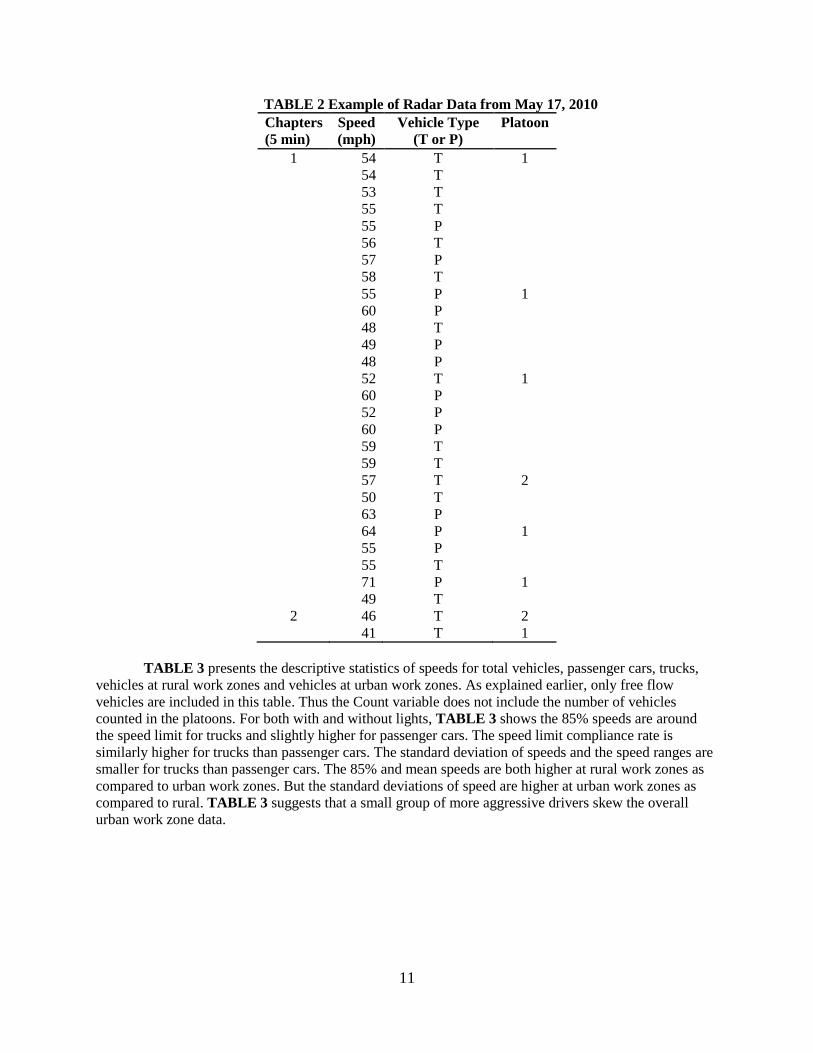
took place between approximately 9:30 PM to 1:10 AM. TABLE 2 is a snippet of the radar speed data.
Column 1 shows the five-minute chapter indices that were added for ease of reference. Column 2 shows
the speed. Column 3 shows the vehicle type where T stands for commercial trucks and P stands for
passenger vehicles. Column 4 indicates the presence and size of a platoon which is determined visually by
observing video evidence of vehicles following one another. Only unconstrained vehicle speeds were
considered for further analysis, because the speeds of platoon vehicles were constrained by the leading
vehicle. The goal was to isolate the effect of the sequential lights on vehicle speed.
11
TABLE 2 Example of Radar Data from May 17, 2010
Chapters
(5 min)
Speed
(mph)
Vehicle Type
(T or P)
Platoon
1 54 T 1
54 T
53 T
55 T
55 P
56 T
57 P
58 T
55 P 1
60 P
48 T
49 P
48 P
52 T 1
60 P
52 P
60 P
59 T
59 T
57 T 2
50 T
63 P
64 P 1
55 P
55 T
71 P 1
49 T
2 46 T 2
41 T 1
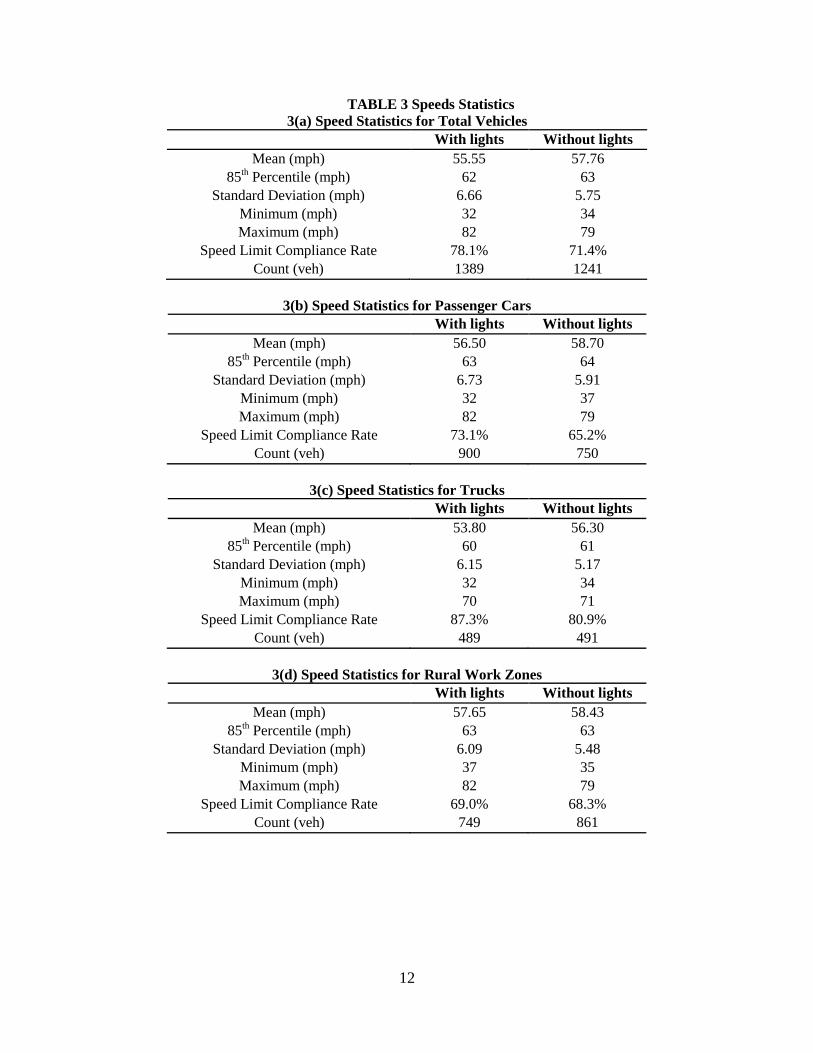
TABLE 3 presents the descriptive statistics of speeds for total vehicles, passenger cars, trucks,
vehicles at rural work zones and vehicles at urban work zones. As explained earlier, only free flow
vehicles are included in this table. Thus the Count variable does not include the number of vehicles
counted in the platoons. For both with and without lights, TABLE 3 shows the 85% speeds are around
the speed limit for trucks and slightly higher for passenger cars. The speed limit compliance rate is
similarly higher for trucks than passenger cars. The standard deviation of speeds and the speed ranges are
smaller for trucks than passenger cars. The 85% and mean speeds are both higher at rural work zones as
compared to urban work zones. But the standard deviations of speed are higher at urban work zones as
compared to rural. TABLE 3 suggests that a small group of more aggressive drivers skew the overall
urban work zone data.
12
TABLE 3 Speeds Statistics
3(a) Speed Statistics for Total Vehicles
With lights Without lights
Mean (mph) 55.55 57.76
85th Percentile (mph) 62 63
Standard Deviation (mph) 6.66 5.75
Minimum (mph) 32 34
Maximum (mph) 82 79
Speed Limit Compliance Rate 78.1% 71.4%
Count (veh) 1389 1241
3(b) Speed Statistics for Passenger Cars
With lights Without lights
Mean (mph) 56.50 58.70
85th Percentile (mph) 63 64
Standard Deviation (mph) 6.73 5.91
Minimum (mph) 32 37
Maximum (mph) 82 79
Speed Limit Compliance Rate 73.1% 65.2%
Count (veh) 900 750
3(c) Speed Statistics for Trucks
With lights Without lights
Mean (mph) 53.80 56.30
85th Percentile (mph) 60 61
Standard Deviation (mph) 6.15 5.17
Minimum (mph) 32 34
Maximum (mph) 70 71
Speed Limit Compliance Rate 87.3% 80.9%
Count (veh) 489 491
3(d) Speed Statistics for Rural Work Zones
With lights Without lights
Mean (mph) 57.65 58.43
85th Percentile (mph) 63 63
Standard Deviation (mph) 6.09 5.48
Minimum (mph) 37 35
Maximum (mph) 82 79
Speed Limit Compliance Rate 69.0% 68.3%
Count (veh) 749 861
13
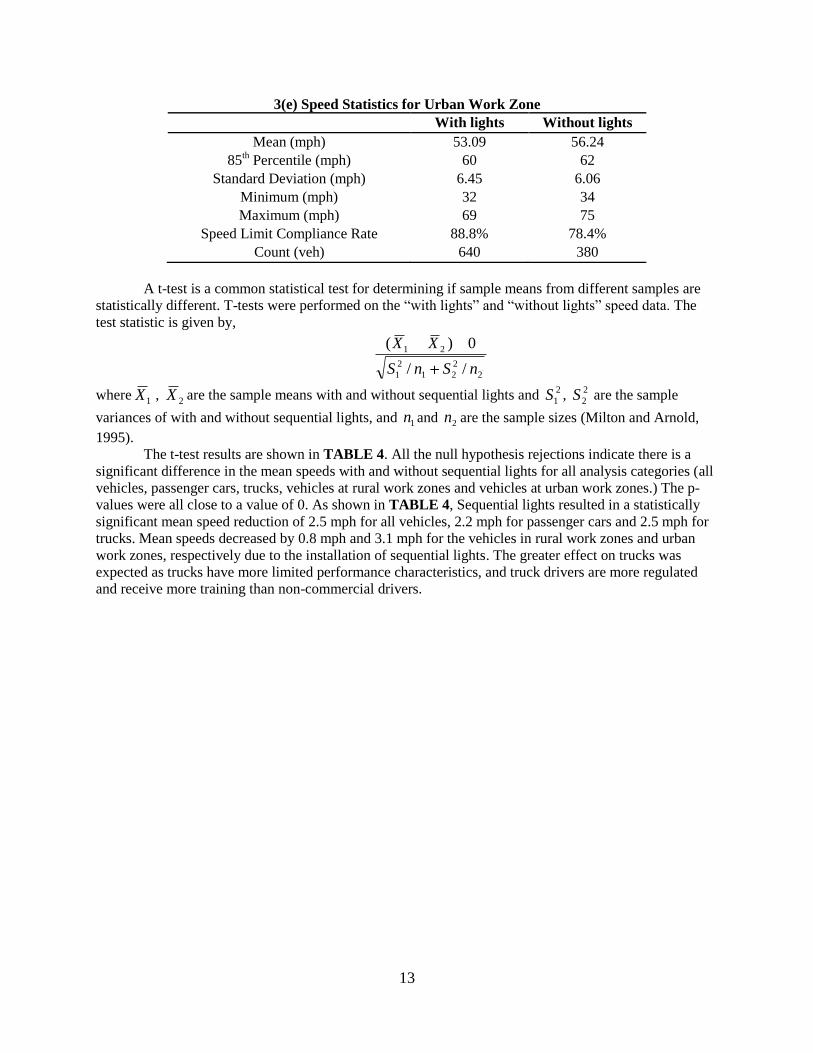
3(e) Speed Statistics for Urban Work Zone
With lights Without lights
Mean (mph) 53.09 56.24
85th Percentile (mph) 60 62
Standard Deviation (mph) 6.45 6.06
Minimum (mph) 32 34
Maximum (mph) 69 75
Speed Limit Compliance Rate 88.8% 78.4%
Count (veh) 640 380
A t-test is a common statistical test for determining if sample means from different samples are
statistically different. T-tests were performed on the “with lights” and “without lights” speed data. The
test statistic is given by,
2
2
21
2
1
21
//
0)(
nSnS
XX
where1X ,
2X are the sample means with and without sequential lights and 2
1S , 2
2S are the sample
variances of with and without sequential lights, and 1n and 2n are the sample sizes (Milton and Arnold,
1995). The t-test results are shown in TABLE 4. All the null hypothesis rejections indicate there is a
significant difference in the mean speeds with and without sequential lights for all analysis categories (all
vehicles, passenger cars, trucks, vehicles at rural work zones and vehicles at urban work zones.) The p-
values were all close to a value of 0. As shown in TABLE 4, Sequential lights resulted in a statistically
significant mean speed reduction of 2.5 mph for all vehicles, 2.2 mph for passenger cars and 2.5 mph for
trucks. Mean speeds decreased by 0.8 mph and 3.1 mph for the vehicles in rural work zones and urban
work zones, respectively due to the installation of sequential lights. The greater effect on trucks was
expected as trucks have more limited performance characteristics, and truck drivers are more regulated
and receive more training than non-commercial drivers.
14
TABLE 4 T-Test Results for Mean Speeds
Hypothesis Mean w/
lights
Mean w/o
lights
Change P-value Reject null
hypothesis?
All
vehicles 0H : withoutwith
1H : withoutwith
55.55
57.76
-2.21
0.000
Yes
Passenger
cars 0H :
withoutwith
1H :withoutwith
56.50
58.70
-2.2
0.000
Yes
Trucks 0H : withoutwith
1H : withoutwith
53.80
56.30
-2.5
0.000
Yes
Rural WZ 0H : withoutwith
1H : withoutwith
57.65
58.43
-0.78
0.004
Yes
Urban
WZ 0H : withoutwith
1H : withoutwith
53.09
56.24
-3.15
0.000
Yes
Key: with
is the mean speed of vehicles at work zones with sequential warning lights
without is the mean speed of vehicles at work zones without sequential warning lights
Despite some vigorous debate over the years, it is generally accepted that vehicle speeds are
correlated to crash severities (TRB, 1998). The 85% speed was examined more carefully as it is
commonly used for establishing the speed limit. As shown in TABLE 5, the 85% speeds with sequential
lights were lower than those without sequential lights for all vehicles, passenger cars and trucks. The
significance of the difference in 85% speeds was tested by using a standard normal Z test. The test
statistic is
YYXX
nn
nSnS
YX
//53.1
0)(
22
)1]85.0([)1]85.0([
where )1]85.0([nX is the sample 85% speed with sequential lights, )1]85.0([nY is the sample 85% speed
without sequential lights, and 2
XS , 2
YS are the sample variances of with and without sequential lights, and
1n and 2n are the sample sizes (Crammer, 1946). TABLE 5 shows the differences in the 85% speed was
statistically significant. TABLE 5 shows there is no difference in the 85% speed in rural work zones
while there is a statistically significant difference in the urban work zone.
15
TABLE 5 Standard Normal Z Test Results for 85th
Percentile Speed
Hypothesis 85% speed
with lights
85% speed
w/o lights
Change P-
value
Reject null
hypothesis?
All
vehicles 0H : withoutwith )()( 85.085.0
1H : withoutwith )()( 85.085.0
62
63
-1
0.003
Yes
Passenger
cars 0H :
withoutwith )()( 85.085.0
1H :withoutwith )()( 85.085.0
63
64
-1
0.017
Yes
Trucks 0H : withoutwith )()( 85.085.0
1H : withoutwith )()( 85.085.0
60
61
-1
0.035
Yes
Rural
WZ 0H : withoutwith )()( 85.085.0
1H : withoutwith )()( 85.085.0
63
63
0
0.500
No
Urban
WZ 0H
: withoutwith )()( 85.085.0
1H : withoutwith )()( 85.085.0
60
62
-2
0.001
Yes
Key: with)( 85.0 is the 85th percentile speed with sequential warning lights
without)( 85.0 is the 85th percentile speed without sequential warning lights
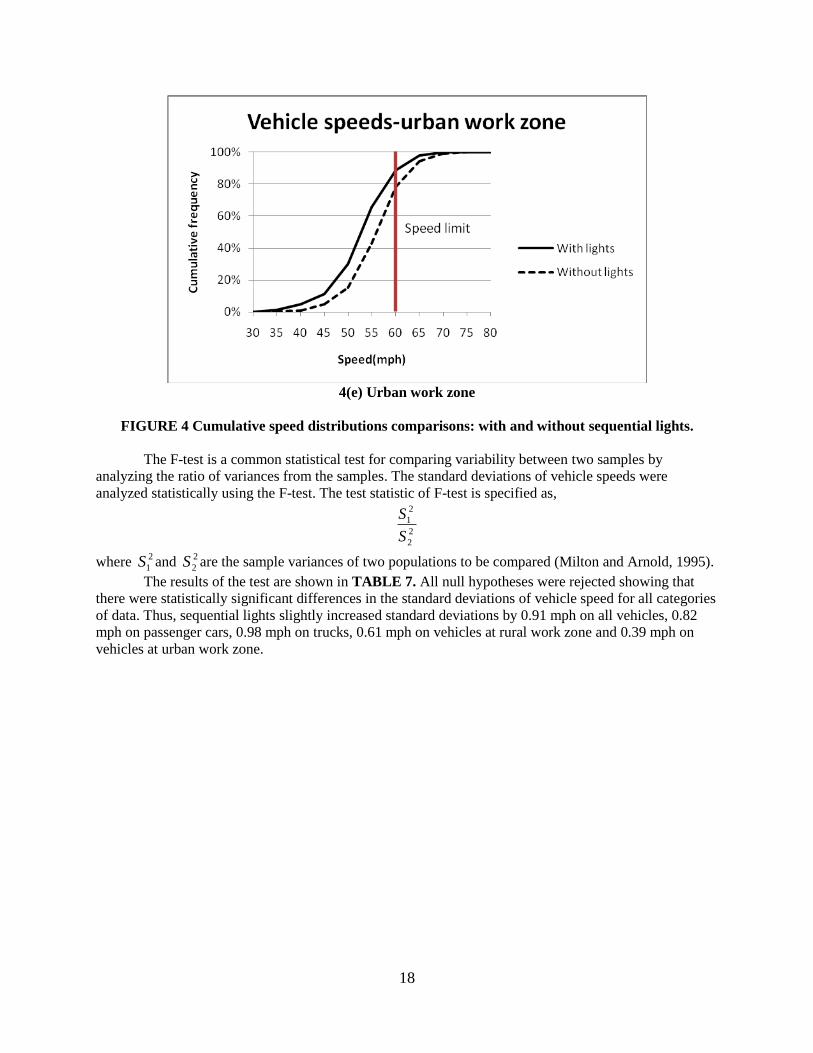
In FIGURE 4, cumulative speed distributions of free flowing vehicles with sequential lights and
without sequential lights are shown and compared. The speed limit of 60 mph is shown as a red vertical
line. Whether or not this line falls above or below the 85% speed has implications for speed compliance
and safety. With sequential lights, the distribution curves of total vehicles, passenger cars, trucks, vehicles
at rural work zones and vehicles at urban work zones were all shifted to the left, indicating a decrease in
vehicle speeds. The results of the comparison of vehicle speeds at rural work zones show only vehicle
speeds below 60 mph were reduced by sequential lights as shown in FIGURE 4(d). All of the other
comparisons indicate that sequential lights decrease the speeds of all vehicles in the study: passenger cars,
trucks and vehicles at urban work zones in all speed ranges. To determine if the speed distributions
differences (with and without lights) in the five data sets shown in FIGURE 4 are statistically significant,
two commonly used statistical tests, Mann-Whitney U test and Kolmogorov-Smirnov test (Conover,
1980), were applied. The results are displayed in TABLE 6. In all five data sets, the cumulative speed
distributions with sequential lights were significantly different from those without sequential lights.
TABLE 6 Results of Mann-Whitney U Test and K-S Test
P-value: Mann-Whitney P-value: K-S Statistical Significant?
All vehicles 0.000 0.000 Yes
Passenger cars 0.000 0.000 Yes
Trucks 0.000 0.000 Yes
Rural WZ 0.000 0.000 Yes
Urban WZ 0.000 0.000 Yes
16
4(a) Total vehicles
4(b) Passenger cars
17
4(c) Trucks
4(d) Rural work zone
18
4(e) Urban work zone
FIGURE 4 Cumulative speed distributions comparisons: with and without sequential lights.
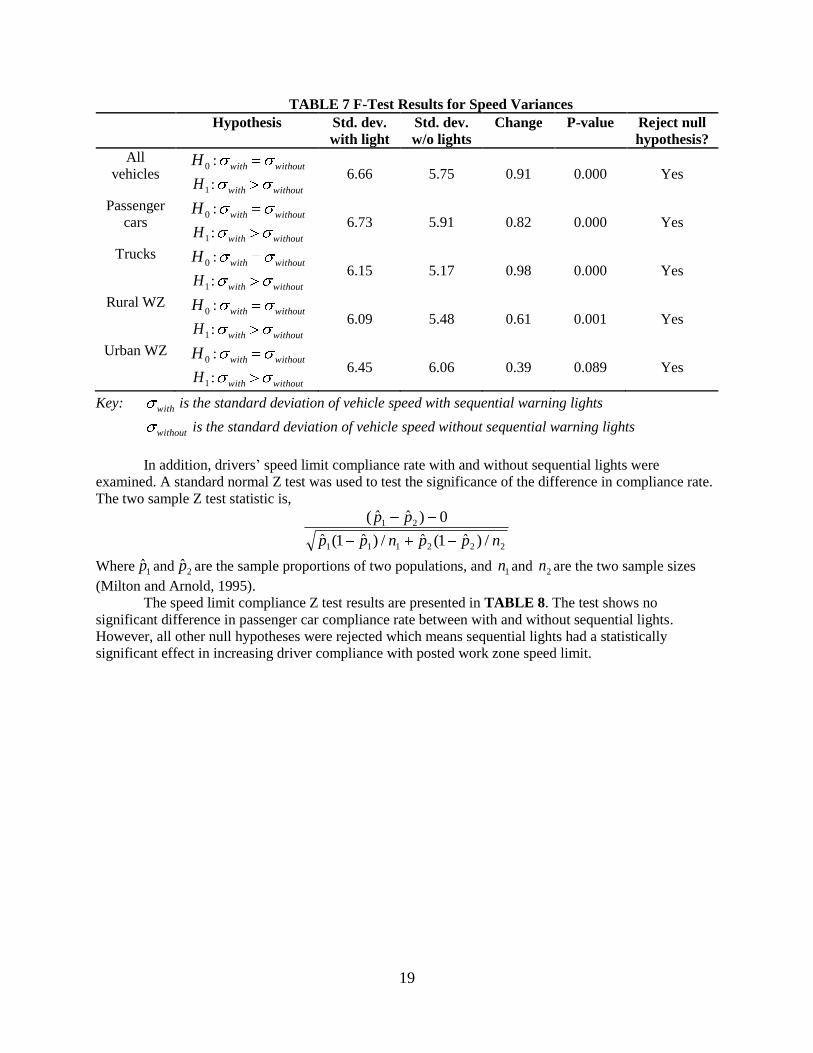
The F-test is a common statistical test for comparing variability between two samples by
analyzing the ratio of variances from the samples. The standard deviations of vehicle speeds were
analyzed statistically using the F-test. The test statistic of F-test is specified as,
2
2
2
1
S
S
where 2
1S and 2
2S are the sample variances of two populations to be compared (Milton and Arnold, 1995).
The results of the test are shown in TABLE 7. All null hypotheses were rejected showing that
there were statistically significant differences in the standard deviations of vehicle speed for all categories
of data. Thus, sequential lights slightly increased standard deviations by 0.91 mph on all vehicles, 0.82
mph on passenger cars, 0.98 mph on trucks, 0.61 mph on vehicles at rural work zone and 0.39 mph on
vehicles at urban work zone.
19
TABLE 7 F-Test Results for Speed Variances
Hypothesis Std. dev.
with light
Std. dev.
w/o lights
Change P-value Reject null
hypothesis?
All
vehicles 0H : withoutwith
1H : withoutwith
6.66
5.75
0.91
0.000
Yes
Passenger
cars 0H :
withoutwith
1H :withoutwith
6.73
5.91
0.82
0.000
Yes
Trucks 0H : withoutwith
1H : withoutwith
6.15
5.17
0.98
0.000
Yes
Rural WZ 0H : withoutwith
1H : withoutwith
6.09
5.48
0.61
0.001
Yes
Urban WZ 0H : withoutwith
1H : withoutwith
6.45
6.06
0.39
0.089
Yes
Key: with
is the standard deviation of vehicle speed with sequential warning lights
without
is the standard deviation of vehicle speed without sequential warning lights
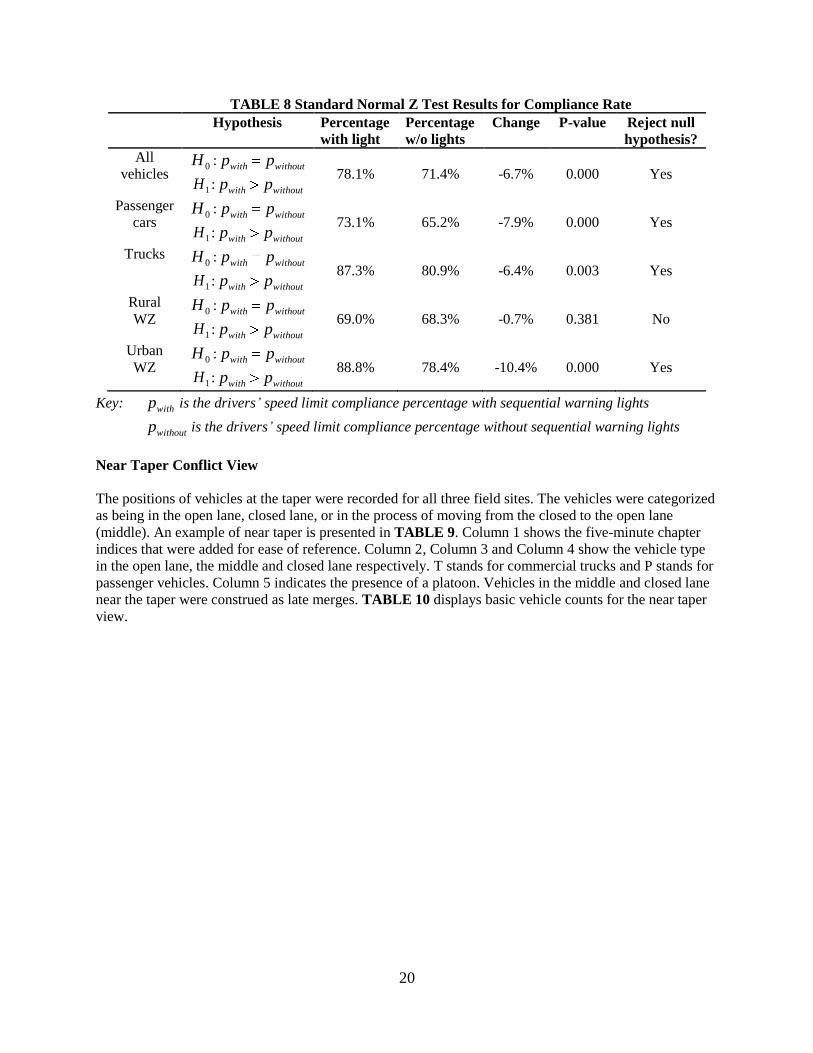
In addition, drivers’ speed limit compliance rate with and without sequential lights were
examined. A standard normal Z test was used to test the significance of the difference in compliance rate.
The two sample Z test statistic is,
222111
21
/)ˆ1(ˆ/)ˆ1(ˆ
0)ˆˆ(
nppnpp
pp
Where 1p̂ and 2p̂ are the sample proportions of two populations, and 1n and 2n are the two sample sizes
(Milton and Arnold, 1995).
The speed limit compliance Z test results are presented in TABLE 8. The test shows no
significant difference in passenger car compliance rate between with and without sequential lights.
However, all other null hypotheses were rejected which means sequential lights had a statistically
significant effect in increasing driver compliance with posted work zone speed limit.
20
TABLE 8 Standard Normal Z Test Results for Compliance Rate
Hypothesis Percentage
with light
Percentage
w/o lights
Change P-value Reject null
hypothesis?
All
vehicles 0H : withoutwith pp
1H : withoutwith pp
78.1%
71.4%
-6.7%
0.000
Yes
Passenger
cars 0H :
withoutwith pp
1H :withoutwith pp
73.1%
65.2%
-7.9%
0.000
Yes
Trucks 0H : withoutwith pp
1H : withoutwith pp
87.3%
80.9%
-6.4%
0.003
Yes
Rural
WZ 0H : withoutwith pp
1H : withoutwith pp
69.0%
68.3%
-0.7%
0.381
No
Urban
WZ 0H : withoutwith pp
1H : withoutwith pp
88.8%
78.4%
-10.4%
0.000
Yes
Key: withp is the drivers’ speed limit compliance percentage with sequential warning lights
withoutp is the drivers’ speed limit compliance percentage without sequential warning lights
Near Taper Conflict View
The positions of vehicles at the taper were recorded for all three field sites. The vehicles were categorized
as being in the open lane, closed lane, or in the process of moving from the closed to the open lane
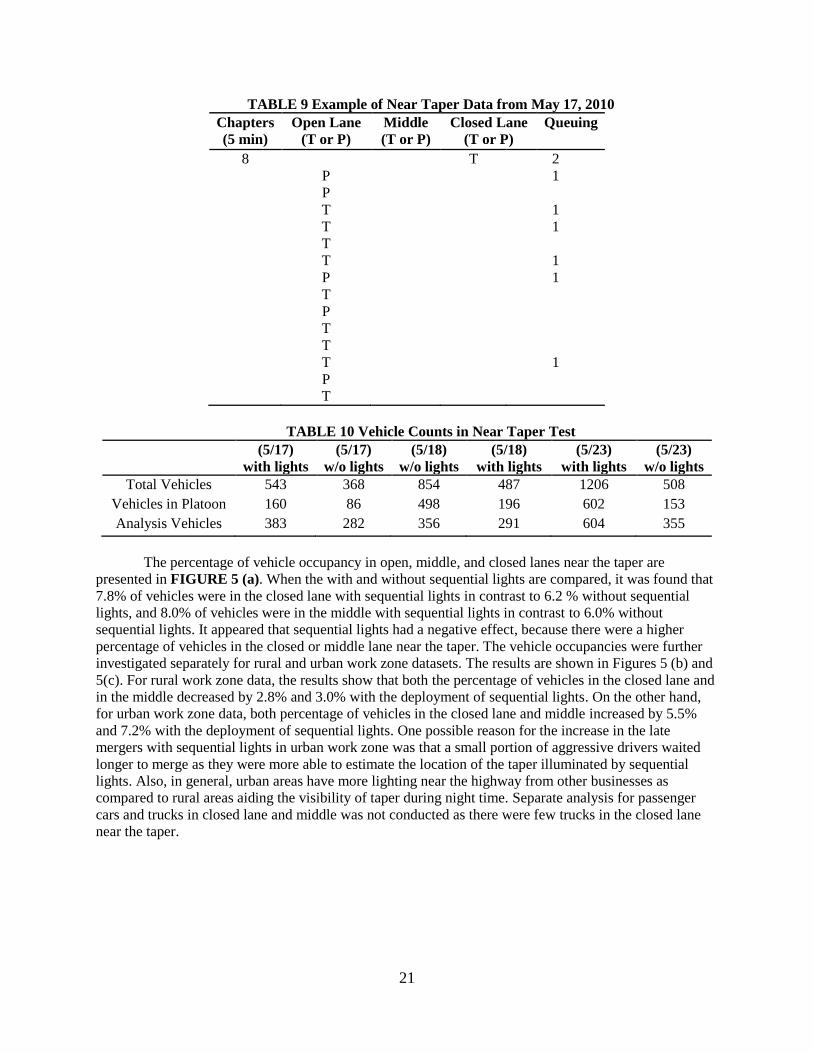
(middle). An example of near taper is presented in TABLE 9. Column 1 shows the five-minute chapter
indices that were added for ease of reference. Column 2, Column 3 and Column 4 show the vehicle type
in the open lane, the middle and closed lane respectively. T stands for commercial trucks and P stands for
passenger vehicles. Column 5 indicates the presence of a platoon. Vehicles in the middle and closed lane
near the taper were construed as late merges. TABLE 10 displays basic vehicle counts for the near taper
view.
21
TABLE 9 Example of Near Taper Data from May 17, 2010
Chapters
(5 min)
Open Lane
(T or P)
Middle
(T or P)
Closed Lane
(T or P)
Queuing
8 T 2
P 1
P
T 1
T 1
T
T 1
P 1
T
P
T
T
T 1
P
T
TABLE 10 Vehicle Counts in Near Taper Test
(5/17)
with lights
(5/17)
w/o lights
(5/18)
w/o lights
(5/18)
with lights
(5/23)
with lights
(5/23)
w/o lights
Total Vehicles 543 368 854 487 1206 508
Vehicles in Platoon 160 86 498 196 602 153
Analysis Vehicles 383 282 356 291 604 355
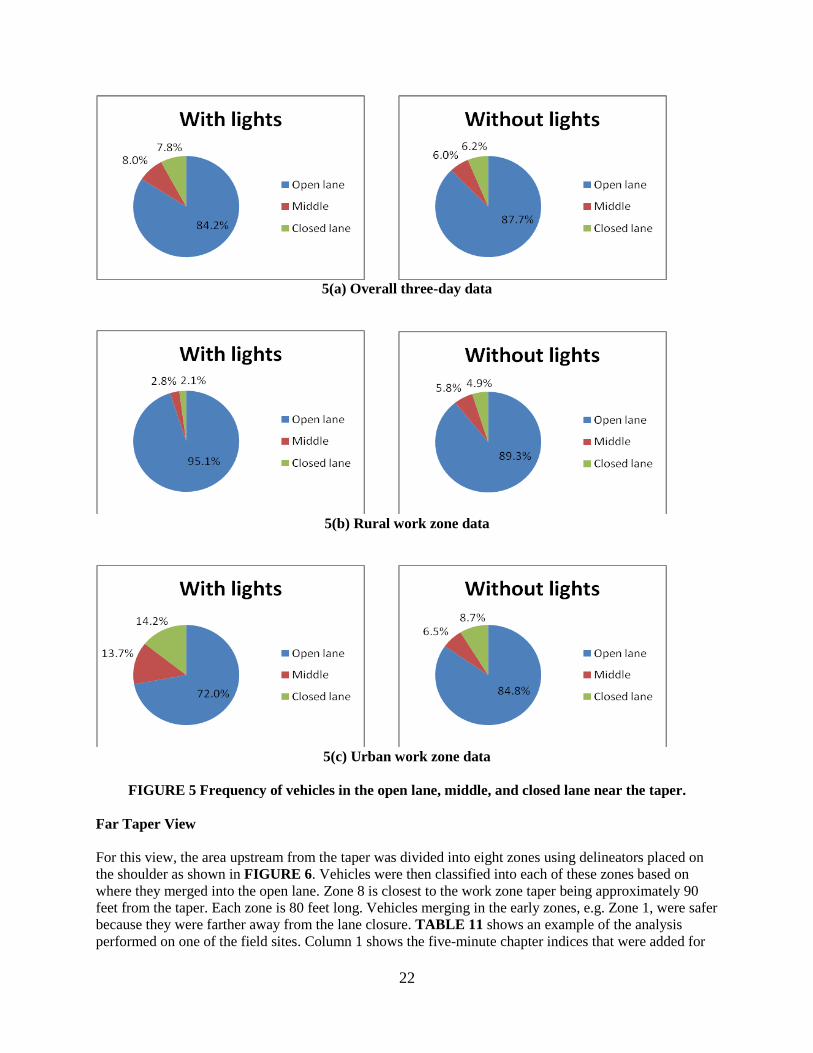
The percentage of vehicle occupancy in open, middle, and closed lanes near the taper are
presented in FIGURE 5 (a). When the with and without sequential lights are compared, it was found that
7.8% of vehicles were in the closed lane with sequential lights in contrast to 6.2 % without sequential
lights, and 8.0% of vehicles were in the middle with sequential lights in contrast to 6.0% without
sequential lights. It appeared that sequential lights had a negative effect, because there were a higher
percentage of vehicles in the closed or middle lane near the taper. The vehicle occupancies were further
investigated separately for rural and urban work zone datasets. The results are shown in Figures 5 (b) and
5(c). For rural work zone data, the results show that both the percentage of vehicles in the closed lane and
in the middle decreased by 2.8% and 3.0% with the deployment of sequential lights. On the other hand,
for urban work zone data, both percentage of vehicles in the closed lane and middle increased by 5.5%
and 7.2% with the deployment of sequential lights. One possible reason for the increase in the late
mergers with sequential lights in urban work zone was that a small portion of aggressive drivers waited
longer to merge as they were more able to estimate the location of the taper illuminated by sequential
lights. Also, in general, urban areas have more lighting near the highway from other businesses as
compared to rural areas aiding the visibility of taper during night time. Separate analysis for passenger
cars and trucks in closed lane and middle was not conducted as there were few trucks in the closed lane
near the taper.
22
5(a) Overall three-day data
5(b) Rural work zone data
5(c) Urban work zone data
FIGURE 5 Frequency of vehicles in the open lane, middle, and closed lane near the taper.
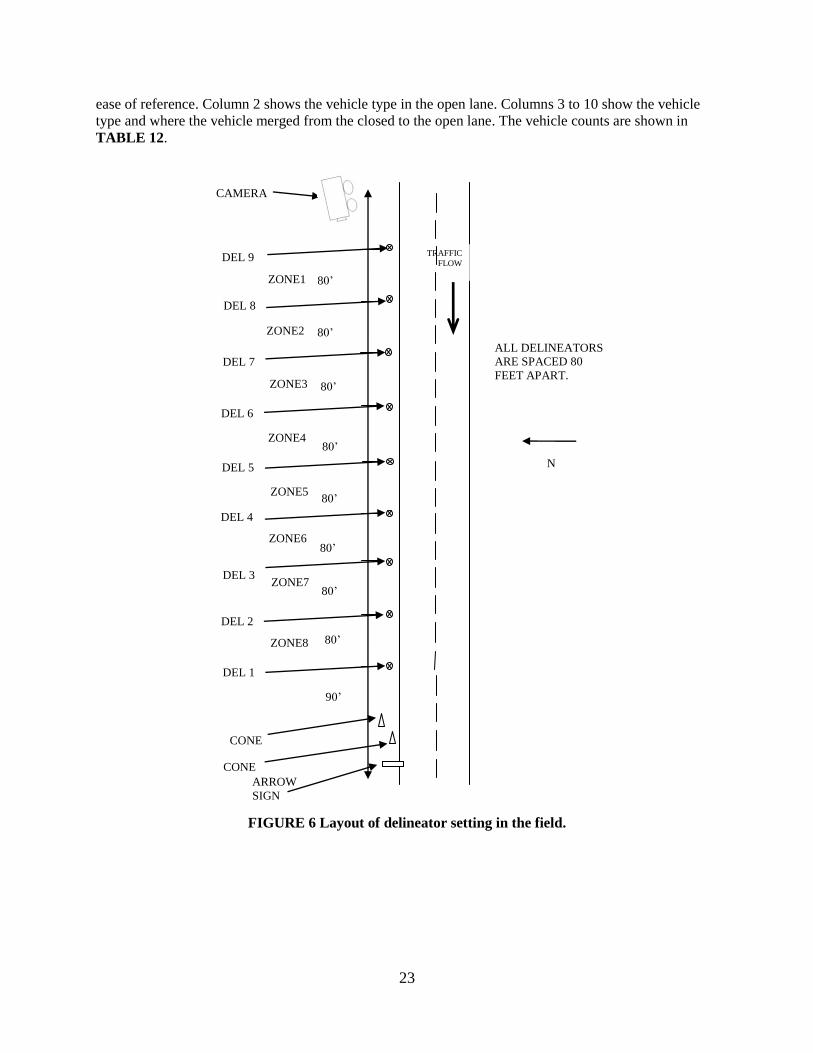
Far Taper View
For this view, the area upstream from the taper was divided into eight zones using delineators placed on
the shoulder as shown in FIGURE 6. Vehicles were then classified into each of these zones based on
where they merged into the open lane. Zone 8 is closest to the work zone taper being approximately 90
feet from the taper. Each zone is 80 feet long. Vehicles merging in the early zones, e.g. Zone 1, were safer
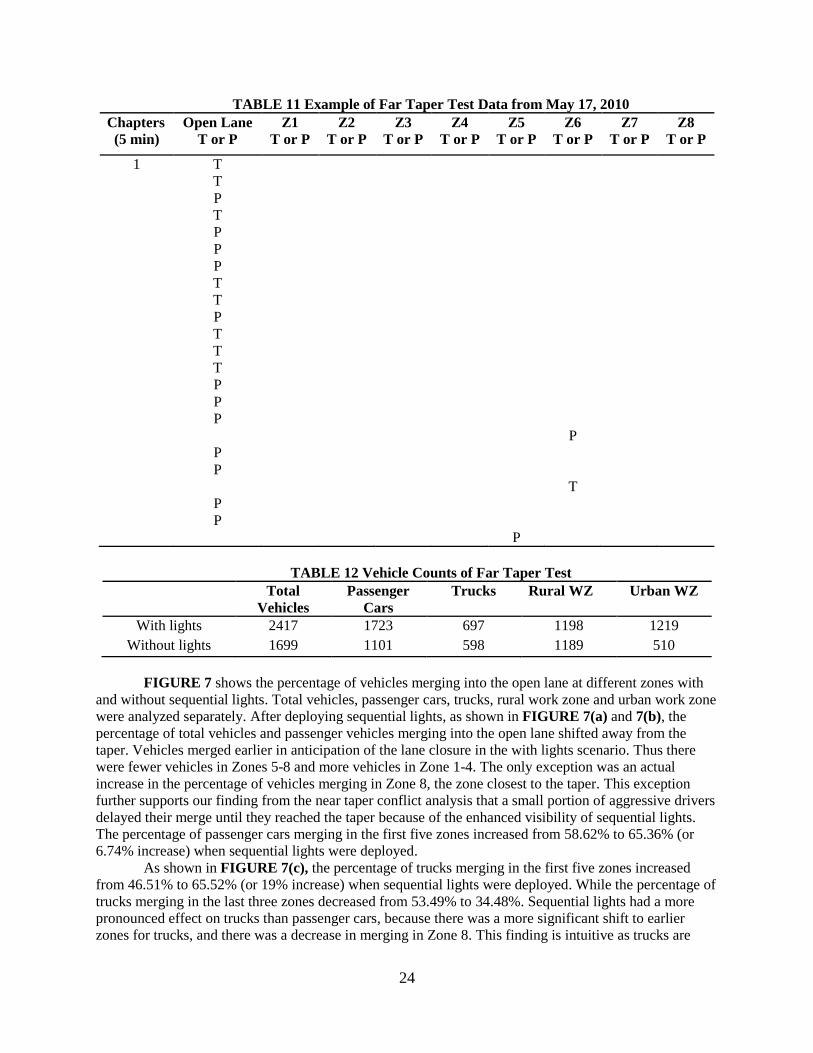
because they were farther away from the lane closure. TABLE 11 shows an example of the analysis
performed on one of the field sites. Column 1 shows the five-minute chapter indices that were added for
23
ease of reference. Column 2 shows the vehicle type in the open lane. Columns 3 to 10 show the vehicle
type and where the vehicle merged from the closed to the open lane. The vehicle counts are shown in
TABLE 12.
FIGURE 6 Layout of delineator setting in the field.
CONE
ARROW
SIGN
CONE
DEL 1
ALL DELINEATORS
ARE SPACED 80
FEET APART.
N
TRAFFIC
FLOW
CAMERA
DEL 2
DEL 3
DEL 4
DEL 5
DEL 7
DEL 6
DEL 8
80’
DEL 9
80’
80’
80’
80’
80’
80’
80’
90’
ZONE1
ZONE2
ZONE3
ZONE4
ZONE5
ZONE6
ZONE7
ZONE8
24
TABLE 11 Example of Far Taper Test Data from May 17, 2010
Chapters
(5 min)
Open Lane
T or P
Z1
T or P
Z2
T or P
Z3
T or P
Z4
T or P
Z5
T or P
Z6
T or P
Z7
T or P
Z8
T or P
1 T
T
P
T
P
P
P
T
T
P
T
T
T
P
P
P
P
P
P
T
P
P
P
TABLE 12 Vehicle Counts of Far Taper Test
Total
Vehicles
Passenger
Cars
Trucks
Rural WZ
Urban WZ
With lights 2417 1723 697 1198 1219
Without lights 1699 1101 598 1189 510
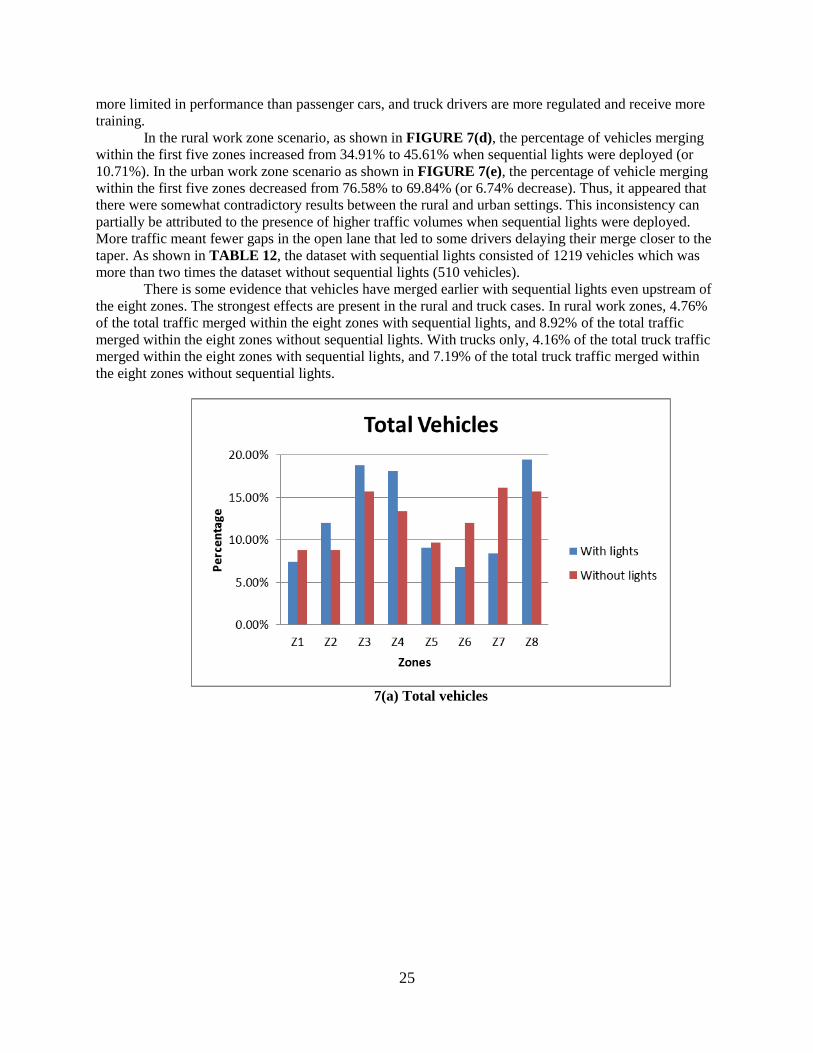
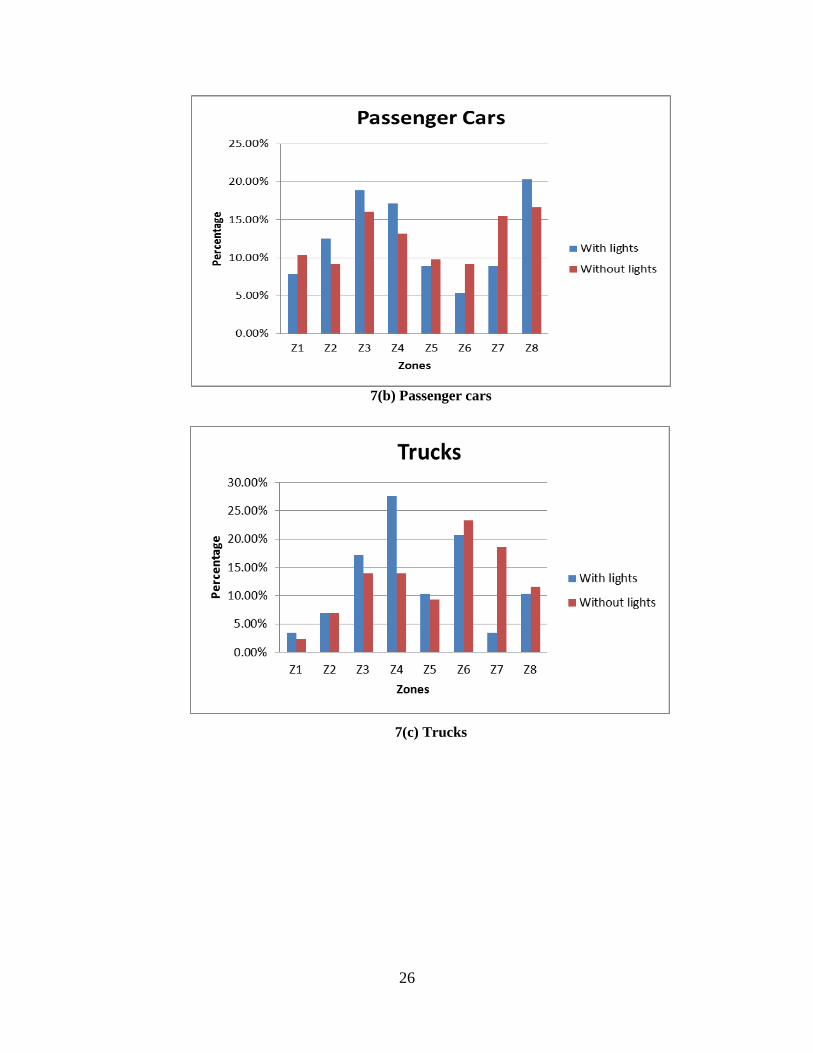
FIGURE 7 shows the percentage of vehicles merging into the open lane at different zones with
and without sequential lights. Total vehicles, passenger cars, trucks, rural work zone and urban work zone
were analyzed separately. After deploying sequential lights, as shown in FIGURE 7(a) and 7(b), the
percentage of total vehicles and passenger vehicles merging into the open lane shifted away from the
taper. Vehicles merged earlier in anticipation of the lane closure in the with lights scenario. Thus there
were fewer vehicles in Zones 5-8 and more vehicles in Zone 1-4. The only exception was an actual
increase in the percentage of vehicles merging in Zone 8, the zone closest to the taper. This exception
further supports our finding from the near taper conflict analysis that a small portion of aggressive drivers
delayed their merge until they reached the taper because of the enhanced visibility of sequential lights.
The percentage of passenger cars merging in the first five zones increased from 58.62% to 65.36% (or
6.74% increase) when sequential lights were deployed.
As shown in FIGURE 7(c), the percentage of trucks merging in the first five zones increased
from 46.51% to 65.52% (or 19% increase) when sequential lights were deployed. While the percentage of
trucks merging in the last three zones decreased from 53.49% to 34.48%. Sequential lights had a more
pronounced effect on trucks than passenger cars, because there was a more significant shift to earlier
zones for trucks, and there was a decrease in merging in Zone 8. This finding is intuitive as trucks are
25
more limited in performance than passenger cars, and truck drivers are more regulated and receive more
training.
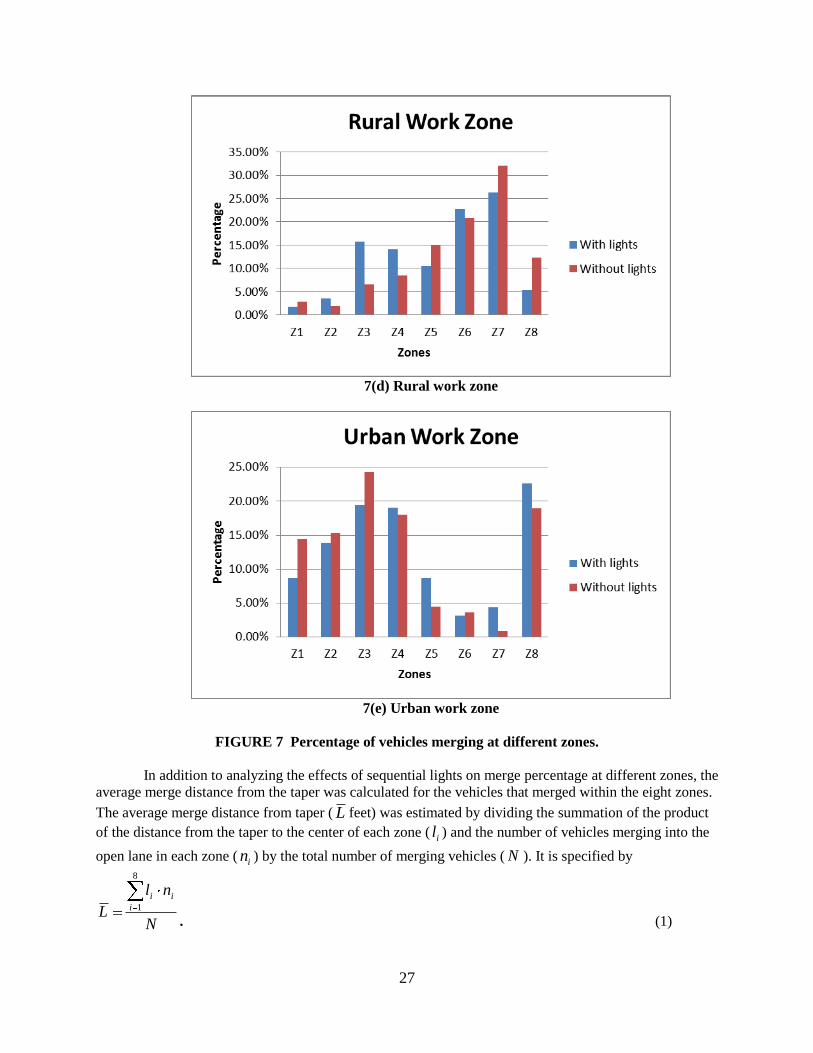
In the rural work zone scenario, as shown in FIGURE 7(d), the percentage of vehicles merging
within the first five zones increased from 34.91% to 45.61% when sequential lights were deployed (or
10.71%). In the urban work zone scenario as shown in FIGURE 7(e), the percentage of vehicle merging
within the first five zones decreased from 76.58% to 69.84% (or 6.74% decrease). Thus, it appeared that
there were somewhat contradictory results between the rural and urban settings. This inconsistency can
partially be attributed to the presence of higher traffic volumes when sequential lights were deployed.
More traffic meant fewer gaps in the open lane that led to some drivers delaying their merge closer to the
taper. As shown in TABLE 12, the dataset with sequential lights consisted of 1219 vehicles which was
more than two times the dataset without sequential lights (510 vehicles).
There is some evidence that vehicles have merged earlier with sequential lights even upstream of
the eight zones. The strongest effects are present in the rural and truck cases. In rural work zones, 4.76%
of the total traffic merged within the eight zones with sequential lights, and 8.92% of the total traffic
merged within the eight zones without sequential lights. With trucks only, 4.16% of the total truck traffic
merged within the eight zones with sequential lights, and 7.19% of the total truck traffic merged within
the eight zones without sequential lights.
7(a) Total vehicles
26
7(b) Passenger cars
7(c) Trucks
27
7(d) Rural work zone
7(e) Urban work zone
FIGURE 7 Percentage of vehicles merging at different zones.
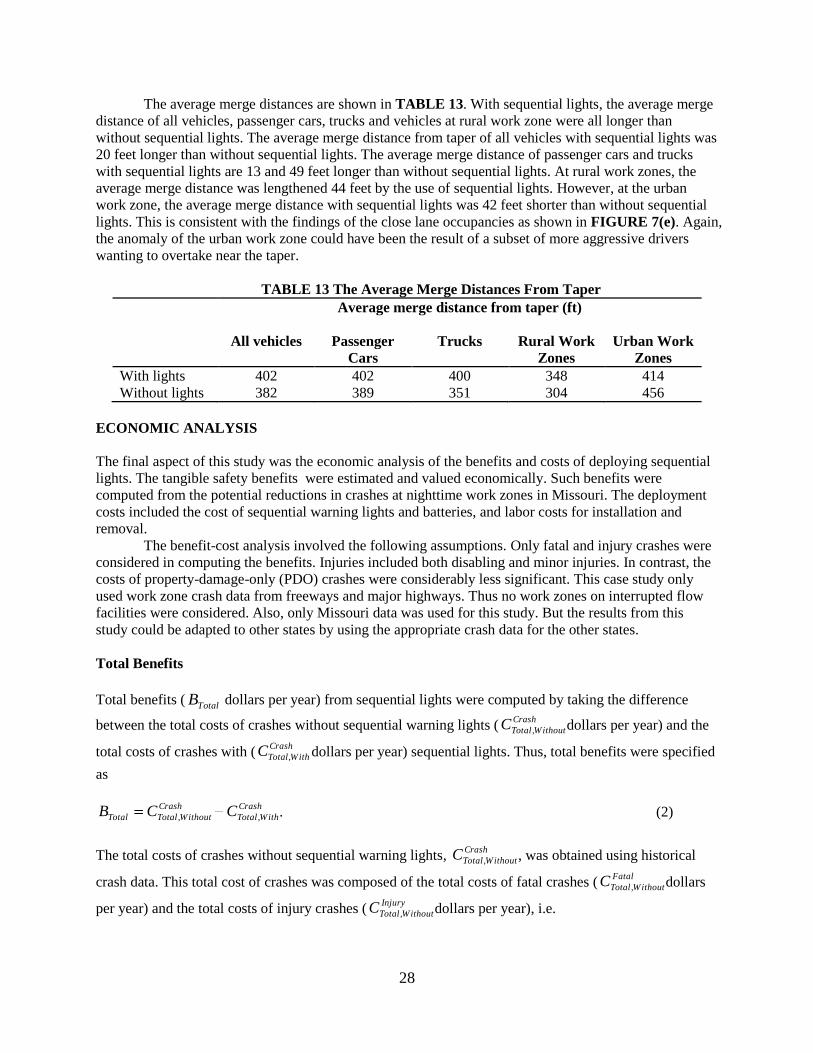
In addition to analyzing the effects of sequential lights on merge percentage at different zones, the
average merge distance from the taper was calculated for the vehicles that merged within the eight zones.
The average merge distance from taper ( L feet) was estimated by dividing the summation of the product
of the distance from the taper to the center of each zone ( il ) and the number of vehicles merging into the
open lane in each zone ( in ) by the total number of merging vehicles ( N ). It is specified by
N
nl
L i
ii
8
1
. (1)
28
The average merge distances are shown in TABLE 13. With sequential lights, the average merge
distance of all vehicles, passenger cars, trucks and vehicles at rural work zone were all longer than
without sequential lights. The average merge distance from taper of all vehicles with sequential lights was
20 feet longer than without sequential lights. The average merge distance of passenger cars and trucks
with sequential lights are 13 and 49 feet longer than without sequential lights. At rural work zones, the
average merge distance was lengthened 44 feet by the use of sequential lights. However, at the urban
work zone, the average merge distance with sequential lights was 42 feet shorter than without sequential
lights. This is consistent with the findings of the close lane occupancies as shown in FIGURE 7(e). Again,
the anomaly of the urban work zone could have been the result of a subset of more aggressive drivers
wanting to overtake near the taper.
TABLE 13 The Average Merge Distances From Taper
Average merge distance from taper (ft)
All vehicles Passenger
Cars
Trucks Rural Work
Zones
Urban Work
Zones
With lights 402 402 400 348 414
Without lights 382 389 351 304 456
ECONOMIC ANALYSIS
The final aspect of this study was the economic analysis of the benefits and costs of deploying sequential
lights. The tangible safety benefits were estimated and valued economically. Such benefits were
computed from the potential reductions in crashes at nighttime work zones in Missouri. The deployment
costs included the cost of sequential warning lights and batteries, and labor costs for installation and
removal.
The benefit-cost analysis involved the following assumptions. Only fatal and injury crashes were
considered in computing the benefits. Injuries included both disabling and minor injuries. In contrast, the
costs of property-damage-only (PDO) crashes were considerably less significant. This case study only
used work zone crash data from freeways and major highways. Thus no work zones on interrupted flow
facilities were considered. Also, only Missouri data was used for this study. But the results from this
study could be adapted to other states by using the appropriate crash data for the other states.
Total Benefits
Total benefits ( TotalB dollars per year) from sequential lights were computed by taking the difference
between the total costs of crashes without sequential warning lights (Crash
WithoutTotalC , dollars per year) and the
total costs of crashes with (Crash
WithTotalC , dollars per year) sequential lights. Thus, total benefits were specified
as
Crash
WithTotal
Crash
WithoutTotalTotal CCB ,, . (2)
The total costs of crashes without sequential warning lights, Crash
WithoutTotalC , , was obtained using historical
crash data. This total cost of crashes was composed of the total costs of fatal crashes (Fatal
WithoutTotalC , dollars
per year) and the total costs of injury crashes (Injury
WithoutTotalC , dollars per year), i.e.
29
Injury
Without
Injury
Without
Fatal
Without
Fatal
Without
Injury
WithoutTotal
Fatal
WithoutTotal
Crash
WithoutTotal CNCNCCC ,,, , (3)
where Fatal
WithoutN (Injury
WithoutN ) is number of fatal (injury) crashes per year and Fatal
WithoutC (Injury
WithoutC ) is the average
cost per fatal (injury) crash.
Since sequential lights were a relatively new technology, there was no significant crash data
associated with their deployment, thus crash regression models were used to estimate the crash benefits of
sequential lights. The use of crash regression models is an accepted method that is used in publications
such as the Redbook (AASHTO, 2003). Two regression models were considered in the study. One was
the Power Model, originally derived by Nilsson (2004). This model expressed the quantitative
relationship between crash and speed and is given by
0
1
0
1
V
V
n
n, (4)
where 1n was the number of fatal or injury crashes at mean speed 1V , 0n was the number of fatal or injury
crashes at mean speed 0V , and 4 for fatal crashes and 2 for injury crashes. Another model was
one proposed by Garber and Ehrhart (2000) that expressed the mathematical relationship between crash
rate and several factors, including mean speed, speed variance, and flow. For freeways with speed
standard deviation ranging from 8 km/h to 18 km/h, mean speed ranging from 90 km/h (55 mph) to 98
km/h (60 mph) and flow ranging from 200 veh/h/lane to 1800 veh/h/lane, the model form was
)()10875.2(
)()()10143.3()()()10725.1()(
)10509.6()()10527.8()()()10256.1()(
)10071.2()()10651.8()()10591.1()355.0(
49
22122272
541522102
84723
MEAN
MEANFPLMEANSDMEAN
FPLFPLSDFPL
SDSDCrashrate
(5)
where Crashrate was in terms of the number of crashes per hour per km per lane, SD was the standard
deviation of speed (km/h), FPL was the flow per lane (veh/h/lane) and MEAN was the mean speed
(km/h).
Both models were similar in expressing the non-linear relationship between crash rate and speed.
However, Nilsson’s Power Model treated fatal and injury crashes separately. In the Garber-Ehrhart model,
flow and standard deviation of speed were included, but the model was developed based on speed data
collected at 55 mph speed limit locations, not the 60 mph speed limit at the work zones investigated in
this study. Also, crash rate in the Garber-Ehrhart model included all type of severity crashes such as fatal,
injury, and property damage only (PDO). In this study, only fatal crash and injury crash were investigated
for the economic analysis. In addition, the Power Model was widely used and was accepted by the
European Commission (EC, 1999) as a method to express the relationship between speed and crashes.
Hence, Nilsson’ Power Model was a better fit for this study.
According to the Power Model, the predicted ratio of the number of crashes with installation of
sequential warning lights to the number of crashes without was given by
4
Without
WithFatal
V
VR and
2
Without
WithInjury
V
VR , (6)
30
where FatalR was the ratio for fatal crashes, InjuryR was the ratio for injury crashes, WithV was the mean
speed with sequential warning lights (mph), and WithoutV was the mean speed without sequential warning
lights (mph).
The total costs of crashes with the installation of sequential warning lights ( WithTotalC , ) were
expressed as
Injury
Injury
Without
Injury
WithoutFatal
Fatal
Without
Fatal
Without
Crash
WithTotal RCNRCNC , . (7)
By substituting (3) and (7) to (2), the total benefits were computed as
)1()1( Injury
Injury
Without
Injury
WithoutFatal
Fatal
Without
Fatal
WithoutTotal RCNRCNB . (8)
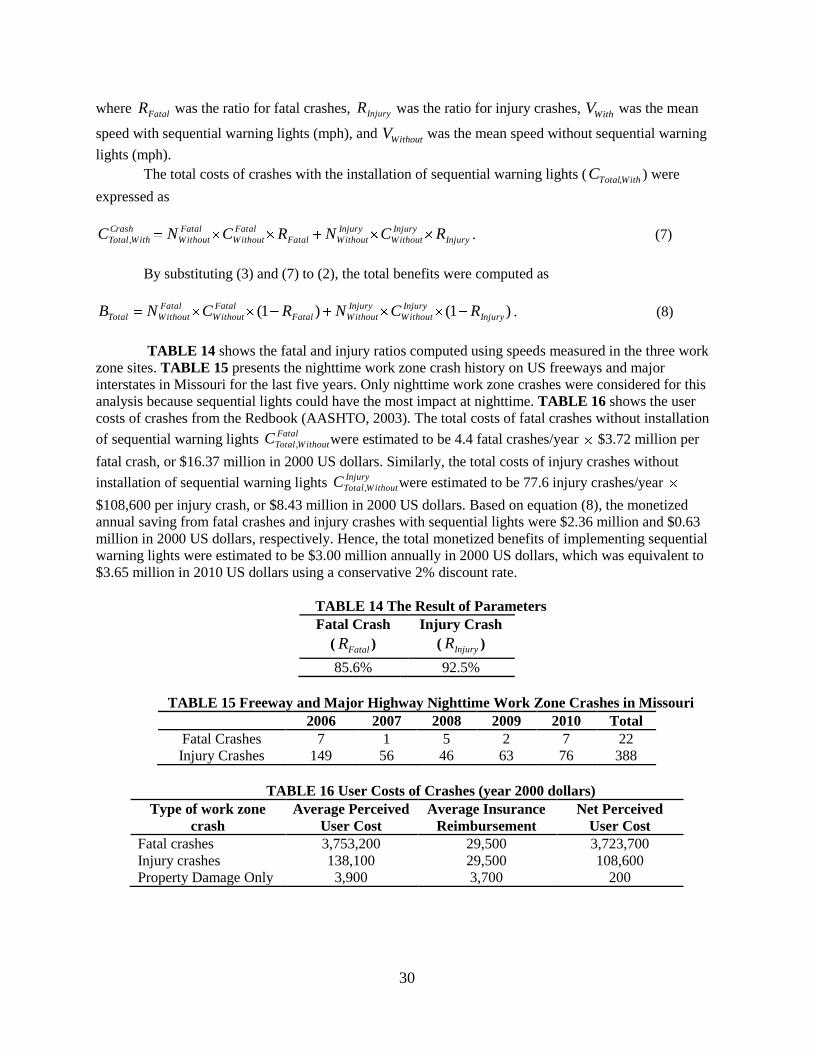
TABLE 14 shows the fatal and injury ratios computed using speeds measured in the three work
zone sites. TABLE 15 presents the nighttime work zone crash history on US freeways and major
interstates in Missouri for the last five years. Only nighttime work zone crashes were considered for this
analysis because sequential lights could have the most impact at nighttime. TABLE 16 shows the user
costs of crashes from the Redbook (AASHTO, 2003). The total costs of fatal crashes without installation
of sequential warning lights Fatal
WithoutTotalC , were estimated to be 4.4 fatal crashes/year $3.72 million per
fatal crash, or $16.37 million in 2000 US dollars. Similarly, the total costs of injury crashes without
installation of sequential warning lights Injury
WithoutTotalC , were estimated to be 77.6 injury crashes/year
$108,600 per injury crash, or $8.43 million in 2000 US dollars. Based on equation (8), the monetized
annual saving from fatal crashes and injury crashes with sequential lights were $2.36 million and $0.63
million in 2000 US dollars, respectively. Hence, the total monetized benefits of implementing sequential
warning lights were estimated to be $3.00 million annually in 2000 US dollars, which was equivalent to
$3.65 million in 2010 US dollars using a conservative 2% discount rate.
TABLE 14 The Result of Parameters
Fatal Crash
(FatalR )
Injury Crash
( InjuryR )
85.6% 92.5%
TABLE 15 Freeway and Major Highway Nighttime Work Zone Crashes in Missouri
2006 2007 2008 2009 2010 Total
Fatal Crashes 7 1 5 2 7 22
Injury Crashes 149 56 46 63 76 388
TABLE 16 User Costs of Crashes (year 2000 dollars)
Type of work zone
crash
Average Perceived
User Cost
Average Insurance
Reimbursement
Net Perceived
User Cost
Fatal crashes 3,753,200 29,500 3,723,700
Injury crashes 138,100 29,500 108,600
Property Damage Only 3,900 3,700 200
31
Total Costs
Total costs of implementing sequential warning lights ( TotalC dollars per year) were computed by adding
the total costs of sequential warning lights devices in Missouri (DeviceC dollars per year), the costs of
batteries ( BatteryC dollars per year) and the total labor costs of installing and removing the devices (LaborC
dollars per year).
LaborBatteryDeviceTotal CCCC ,
Based on the information provided by the manufacture of sequential warning lights, the current
price of each lamp was approximately $104 and each lamp consumed the equivalent of $0.2 of electricity
from two batteries every night. According to the MUTCD, each work zone could deploy approximately
20 lights at the taper area. The exact number of lights depends on site characteristics such as the speed
limit. The MoDOT work zone schedules from 2010 showed that 1968 nighttime work zones were
deployed on freeways in Missouri with an average of 7.6 nights duration per work zone. At most, 109
nighttime work zones were carried out on the same night, thus 109 was the maximum number of
sequential light sets required if deployment were desired at all nighttime work zones. Therefore, the total
costs of sequential warning lights devices DeviceC were estimated to be $104/lights 20 lights/WZ 109
WZs, or $226,760 current US dollars. The total costs of batteries BatteryC were estimated to be $0.2/lights
20 lights/WZ/night 1968 WZs 7.6 nights, or $59,716 current US dollars.
The labor costs, LaborC , was computed in two ways to reflect two different strategies of
deploying sequential lights. One strategy, used typically in temporary work zones, is to redeploy
channelizers each night thus requiring the installation and removal of sequential lights each night.
Currently, it is not possible to permanently install sequential lights on channelizers so as to eliminate the
installation and removal of lights each time it is deployed. One reason is because channelizers are stacked
when transported, and the installation of sequential lights prohibits the stacking of channelizers. Another
reason is that the handles of sequential lights are not designed to be used for picking up channelizers
which have heavy bases for stability. In the future, perhaps the sequential light function could be designed
into the channelizer itself. This will eliminate significant labor costs with deployment and enable
channelizers to be stacked. Re-locating batteries to the channelizer base could also help with stability and
crash performance. A different strategy is to keep the sequential lights installed on channelizers for the
duration of the work zone. With this strategy, channelizers would be left in place or moved to the side of
the road when not in use. Thus the sequential lights would be installed and removed only once per work
zone.
According to MU’s estimates for each work zone, it took 2 workers about 30 minutes to install
sequential lights for twenty channelizers and 30 minutes to remove them using manual tools. According
to MoDOT’s maintenance supervisor, a typical worker salary is approximately $14 per hour. For the first
strategy, the labor costs were estimated as $14/worker-hr 2 workers (0.5+0.5)hr/WZ/nights
1968WZs 7.6 nights, or $418,572 current US dollars. The total costs of implementing sequential
warning lights, TotalC , were $705,008 per year. For the second strategy, the labor costs were estimated as
$14/worker-hr 2 workers (0.5+0.5)hr/WZ/nights 1968WZs 1 night, or $55,104 current US
dollars. The total costs of implementing strategy two, TotalC , were $341,580 per year. Since labor could be
a major component of cost, an improvement in deployment strategy or an increase in worker efficiency
could significantly reduce overall deployment costs. The use of portable power wrenches could decrease
labor costs.
32
Common measures for economic evaluation include benefit-cost ratio, net benefits and cost
effectiveness. Such measures are interrelated but serve somewhat different purposes. Using the total
benefit amount of $3.65 million and the total cost amount of $705,008 or $341,580, the benefit-cost ratio
of deploying sequential lights in Missouri was estimated to be around 5.18 or 10.7. By subtracting the
total costs from the total benefits, the net annual benefits were computed to be $2.94 or $3.31 million.
Using the crash ratios from TABLE 14 and the average annual nighttime work zones crashes from
TABLE 15, the annual crash reductions were estimated to be 0.634 fatality/year and 5.84 injury/year. The
cost effectiveness of sequential lights was then estimated by dividing the total cost by the expected crash
reductions. Assuming an equivalency of 34.3 injuries to a single fatality, the cost effectiveness was
estimated to be $25,566/injury or $12,382/injury.
Some examples of benefit-cost ratios for other low-cost safety counter-measures are presented
here as background information. Centerline rumble strip benefit-cost ratios were estimated to be around
0.99 to 24.88 depending on the ADT (Carlson and Miles, 2003). The benefit-cost ratios for raised
pavement markers on two lane roads were estimated to be around 14.49 to 25.51 (Neuman et al., 2003).
And the benefit-cost ratios of edgelines on two-lane roads were estimated to be around 8.6 to 85.7
depending on traffic volumes (Miller, 1992).
CONCLUSION
The evaluation of sequential warning lights was based on three measures of safety performance: vehicle
speed and speed variability, taper conflict, and closed lane merge location (i.e. closed lane occupancy).
Although sequential lights caused a small increase in speed variance, it caused a significant decrease in
vehicle speed and an increase in driver compliance at nighttime work zones. The cumulative speed
distributions showed sequential lights reduced the speeds of both passenger cars and trucks at both rural
and urban work zones for all speed ranges. That effect was more pronounced at the urban work zone than
at rural work zones. All speed results were analyzed statistically.
Vehicle position data at the near taper view demonstrated that sequential lights prevented a
significant proportion of vehicles from late taper merges at rural work zone taper. But at the urban work
zone, the percentage of late taper merge increased with sequential lights. One possible explanation was
that there was a subset of more aggressive drivers who merged near the taper because the edge of the
taper became more identifiable with sequential lights. This late merging and last minute over-taking
behavior was more common in the urban environment because of the higher amount of traffic.
Despite the aforementioned issue at the taper, the overall merging behavior improved with
sequential lights. In general, vehicles that merge earlier are at a lower risk of a merging conflict because
there is more time to react to the closed lane. The use of sequential lights produced a significant shift in
the proportion of total vehicle merges from near the taper to farther away from the taper. In particular,
sequential lights had a larger effect on trucks than passenger cars, and on rural work zones than the urban
work zone. The effect at the urban work zone was possibly not realized because high traffic volume left
few gaps for early merges.
The second objective of this report was to evaluate the monetized benefits and costs of sequential
lights. No crash analysis was performed because there was no significant crash data associated with
sequential lights deployment. However, a crash model was used to estimate improvements in safety from
the reduction in speeds. The deployment costs were computed in two ways because the installation and
removals labor costs were so significant. Based on Nilsson’s power model and MoDOT’s work zone
crash data, the total annual benefits was estimated to be $3.65 million and total annual costs was
estimated to be $705,008 or $341,580 . These estimates assumed that sequential lights were deployed on
all nighttime interstates and major highway work zones in Missouri. The resulting benefit-cost ratio was
around 5 or 10 and the cost effectiveness was around $25,000 per injury or $12,000 per injury.
In terms of operations, there were no synchronization problems that were observed. The
sequential lights were observed in operation in in-house lab tests and in three field tests. For the in-house
33
test, lights were purposely re-arranged and their communications interrupted by inserting barriers between
lights. The lights were able to re-synchronize successfully after the removal of disruptions.
Crash testing was outside the scope of this project, thus crash testing was not performed on
channelizers with sequential lights attached. The manufacturer indicates that sequential lights are NCHRP
350 compliant.
In summary, sequential lights appear to be effectiveness for improving safety at nighttime work
zones by clearly delineating the taper area. They are more effective for trucks and at rural work zones as
compared to passenger cars and at urban work zones. A small percentage of drivers became more
aggressive with overtaking at the taper, because the taper became more visible. In general, sequential
lights caused vehicles to merge further upstream from the taper. Because labor is a major component of
sequential lights deployment, improvements in design could reduce agency deployment costs
significantly.
34
AKNOWLEDGEMENTS
The authors acknowledge the kind assistance provided by the following individuals from the Missouri
Department of Transportation. Dan Smith was the technical liaison overseeing this project. Erik Maninga
and Kenneth Strube provided coordination on work zone locations and activities. John Miller provided
crash data on nighttime work zones. Myrna Tucker and Tommy Caudle provided information on the
number and type of MoDOT nighttime work zones. In addition, Wayne Sebasty from Dicke Safety
Products supplied the equipment for testing. Amit Dhatrak, Clay Keller, Sawyer Breslow, Brian Roth-
Roffy and Alicia Palmer were research assistants who processed and analyzed field video.
REFERENCES
AASHTO. User Benefit Analysis for Highways (The Redbook). American Association of State Highway
and Transportation Officials, Washington, D.C., 2003. Bushman, R., J. Chan, and C. Berthelot.
Characteristics of Work Zone Crashes and Fatalities in Canada. Proceedings of the Canadian
Multidisciplinary Road Safety Conference XV, Fredericton, N.B., June 5-8, 2005.
Carlson, P.J. and J.D. Miles. Effectiveness of Rumble Strips on Texas Highways: First Year
Report. Report 0-4472-1. Texas Transportation Institute, College Station, Texas,
September 2003.
Crammer, H. Mathematical methods of statistics. Princeton University Press, 1946. Conover, W. J. Practical Nonparametric Statistics, 2nd edition. New York: John Wiley and Sons, 1980.
EC. MASTER: Managing Speeds of Traffic on European Roads. Final Report. European Commission,
Brussels, 1999.
FHWA. Manual on Uniform Traffic Control Devices for Streets and Highways. Federal Highway
Administration, 2003.
FHWA. Manual on Uniform Traffic Control Devices for Streets and Highways. Federal Highway
Administration, 2009.
Finley, M., G. Ullman and C. Dudek. Sequential Warning Light System for Work Zone Lane Closures.
In Transportation Research Record: Journal of the Transportation Research Board, No. 1745,
Transportation Research Board of the National Academies, Washington, D.C., 2001, pp. 39-45.
Garber, N. J. and A. A. Ehrhart. The Effect of Speed, Flow, and Geometric Characteristics on Crash
Rates for Different Type of Virginia Highways. Final Report. Publication FHWA/VTRC 00-R15.
Virginia Transportation Research Council, Charlottesville, VA, 2000.
Garber, N. J. and M. Zhao. Distribution and Characteristics of Crashes at Different Work Zone Locations
in Virginia. In Transportation Research Record: Journal of the Transportation Research Board,
No. 1794, Transportation Research Board of the National Academies, Washington, D.C., 2002,
pp. 19-25.
HA. Evaluation of Sequential Flashing Cone Lamps. Trial Team: First Annual Report. Highways Agency.
Department of Transport (DfT), London, 2005a.
HA. Flashing Cones and Escorts – Helping Drivers Safely Through Roadworks. Highways Agency Press
Office. Department of Transport (DfT), London, 2005b.
ITE. Purchase Specifications for Flashing and Steady-Burn Warning Lights. Institute of Transportation
Engineers. Washington, D.C., 2001.
Miller, T.R. Benefit-Cost Analysis of Lane Marking. In Transportation Research Record 1334,
Transportation Research Board, National Research Council, Washington, D.C., 1992, pp. 38-45.
Milton, J. S., and J. C. Arnold. Introduction to probability and statistics: principles and applications for
engineering and the computing science. McGraw-Hill, Inc., 1995.
MoDOT. MoDOT Work-Zone Guidelines. Missouri Department of Transportation. Jefferson City,
Missouri, 2004.

35
Neuman, T.R., R. Pfefer, K.L. Slack, K.K. Hardy, F. Council, H. McGee, L. Prothe, and K. Eccles.
Guidance for Implementation of the AASHTO Strategic Highway Safety Plan Volume 6: A Guide
for Addressing Run-Off-Road Collisions. NCHRP Report 500. Transportation Research Board,
Washington, D.C., 2003.
Nilsson, G. Traffic Safety Dimensions and the Power Model to Describe the Effects of Speed on Safety.
Bulletin 221. Lund Institute of Technology, Department of Technology and Society, 2004.
TRB. Special Report 254 Managing Speed: Review of Current Practice for Setting and Enforcing Speed
Limits. Transportation Research Board. National Research Council. Washington, D.C., 1998. Pg.
263.